ALTRIA GROUP, INC.
10-Ks and 10-Qs
|
|
|
|
|
|
|
|
|
|
|
|
|
|
|
|
|
|
|
|
|
|
|
|
|
|
|
|
|
|
|
|
|
|
|
|
|
|
|
|
|
|
|
|
|
|
|
|
|
|
|
|
|
|
|
|
|
|
|
UNITED STATES
SECURITIES AND EXCHANGE COMMISSION
Washington, D.C. 20549
FORM 10-K
|
x
|
ANNUAL REPORT PURSUANT TO SECTION 13 OR 15(d) OF THE SECURITIES EXCHANGE ACT OF 1934
|
For the fiscal year ended December 31, 2015
OR
|
¨
|
TRANSITION REPORT PURSUANT TO SECTION 13 OR 15(d) OF THE SECURITIES EXCHANGE ACT OF 1934
|
For the transition period from
to
Commission File Number 1-08940
ALTRIA GROUP, INC.
(Exact name of registrant as specified in its charter)
|
Virginia
|
13-3260245
|
|
(State or other jurisdiction of
incorporation or organization)
|
(I.R.S. Employer
Identification No.)
|
|
6601 West Broad Street, Richmond, Virginia
|
23230
|
|
(Address of principal executive offices)
|
(Zip Code)
|
(Registrant’s telephone number, including area code)
Securities registered pursuant to Section 12(b) of the Act:
|
Title of each class
|
Name of each exchange on which registered
|
|
Common Stock, $0.33
1
/
3
par value
|
New York Stock Exchange
|
|
Securities registered pursuant to Section 12(g) of the Act: None
|
|
Indicate by check mark if the registrant is a well-known seasoned issuer, as defined in Rule 405 of the Securities Act.
þ
Yes
¨
No
|
|
Indicate by check mark if the registrant is not required to file reports pursuant to Section 13 or Section 15(d) of the Act.
¨
Yes
þ
No
|
|
Indicate by check mark whether the registrant (1) has filed all reports required to be filed by Section 13 or 15(d) of the Securities Exchange Act of 1934 during the preceding 12 months (or for such shorter period that the registrant was required to file such reports), and (2) has been subject to such filing requirements for the past 90 days
þ
Yes
¨
No
|
|
Indicate by check mark whether the registrant has submitted electronically and posted on its corporate Website, if any, every Interactive Data File required to be submitted and posted pursuant to Rule 405 of Regulation S-T (§232.405 of this chapter) during the preceding 12 months (or for such shorter period that the registrant was required to submit and post such files)
þ
Yes
¨
No
|
|
Indicate by check mark if disclosure of delinquent filers pursuant to Item 405 of Regulation S-K (§229.405 of this chapter) is not contained herein, and will not be contained, to the best of registrant’s knowledge, in definitive proxy or information statements incorporated by reference in Part III of this Form 10-K or any amendment to this Form 10-K
þ
|
|
Indicate by check mark whether the registrant is a large accelerated filer, an accelerated filer, a non-accelerated filer or a smaller reporting company. See the definitions of “large accelerated filer”, “accelerated filer” and “smaller reporting company” in Rule 12b-2 of the Exchange Act.
|
|
Large accelerated filer
þ
Accelerated filer
¨
|
|
Non-accelerated filer
¨
(Do not check if smaller reporting company) Smaller operating company
¨
|
|
Indicate by check mark whether the registrant is a shell company (as defined in Rule 12b-2 of the Act).
¨
Yes
þ
No
|
As of June 30, 2015, the aggregate market value of the registrant’s common stock held by non-affiliates of the registrant was approximately $96 billion based on the closing sale price of the common stock as reported on the New York Stock Exchange.
|
Class
|
Outstanding at February 12, 2016
|
|
Common Stock, $0.33
1
/
3
par value
|
1,957,931,815 shares
|
|
Portions of the registrant’s definitive proxy statement for use in connection with its annual meeting of shareholders to be held on May 19, 2016, to be filed with the Securities and Exchange Commission on or about April 7, 2016, are incorporated by reference into Part III hereof.
|
|
TABLE OF CONTENTS
|
||
|
|
|
Page
|
|
PART I
|
|
|
|
Item 1.
|
||
|
Item 1A.
|
||
|
Item 1B.
|
||
|
Item 2.
|
||
|
Item 3.
|
||
|
Item 4.
|
||
|
PART II
|
|
|
|
Item 5.
|
||
|
Item 6.
|
||
|
Item 7.
|
||
|
Item 7A.
|
||
|
Item 8.
|
||
|
Item 9.
|
||
|
Item 9A.
|
||
|
Item 9B.
|
||
|
PART III
|
|
|
|
Item 10.
|
||
|
Item 11.
|
||
|
Item 12.
|
||
|
Item 13.
|
||
|
Item 14.
|
||
|
PART IV
|
|
|
|
Item 15.
|
||
|
|
||
General Development of Business
▪
General:
Altria Group, Inc. is a holding company incorporated in the Commonwealth of Virginia in 1985. At
December 31, 2015
, Altria Group, Inc.’s wholly-owned subsidiaries included Philip Morris USA Inc. (“PM USA”), which is engaged predominantly in the manufacture and sale of cigarettes in the United States; John Middleton Co. (“Middleton”), which is engaged in the manufacture and sale of machine-made large cigars and pipe tobacco, and is a wholly-owned subsidiary of PM USA; and UST LLC (“UST”), which through its wholly-owned subsidiaries, including U.S. Smokeless Tobacco Company LLC (“USSTC”) and Ste. Michelle Wine Estates Ltd. (“Ste. Michelle”), is engaged in the manufacture and sale of smokeless tobacco products and wine. Altria Group, Inc.’s other operating companies included Nu Mark LLC (“Nu Mark”), a wholly-owned subsidiary that is engaged in the manufacture and sale of innovative tobacco products, and Philip Morris Capital Corporation (“PMCC”), a wholly-owned subsidiary that maintains a portfolio of finance assets, substantially all of which are leveraged leases. Other Altria Group, Inc. wholly-owned subsidiaries included Altria Group Distribution Company, which provides sales, distribution and consumer engagement services to certain Altria Group, Inc. operating subsidiaries, and Altria Client Services LLC, which provides various support services in areas such as legal, regulatory, finance, human resources and external affairs, to Altria Group, Inc. and its subsidiaries.
At
December 31, 2015
, Altria Group, Inc. also held approximately
27%
of the economic and voting interest of SABMiller plc (“SABMiller”), which Altria Group, Inc. accounts for under the equity method of accounting. On November 11, 2015, Anheuser-Busch InBev SA/NV (“AB InBev”) announced its firm offer to effect a business combination with SABMiller in a cash and stock transaction. For further discussion, see
Note 6
.
Investment in SABMiller
to the consolidated financial statements in Item 8. Financial Statements and Supplementary Data of this Annual Report on Form 10-K (“Item 8”).
▪
Source of Funds:
Because Altria Group, Inc. is a holding company, its access to the operating cash flows of its wholly-owned subsidiaries consists of cash received from the payment of dividends and distributions, and the payment of interest on intercompany loans by its subsidiaries. At
December 31, 2015
, Altria Group, Inc.’s principal wholly-owned subsidiaries were not limited by long-term debt or other agreements in their ability to pay cash dividends or make other distributions with respect to their equity interests. In addition, Altria Group, Inc. receives cash dividends on its interest in SABMiller if and when SABMiller pays such dividends.
Financial Information About Segments
Altria Group, Inc.’s reportable segments are smokeable products, smokeless products and wine. The financial services and the innovative tobacco products businesses are included in an all
other category due to the continued reduction of the lease portfolio of PMCC and the relative financial contribution of Altria Group, Inc.’s innovative tobacco products businesses to Altria Group, Inc.’s consolidated results.
Altria Group, Inc.’s chief operating decision maker reviews operating companies income to evaluate the performance of, and allocate resources to, the segments. Operating companies income for the segments is defined as operating income before amortization of intangibles and general corporate expenses. Interest and other debt expense, net, and provision for income taxes are centrally managed at the corporate level and, accordingly, such items are not presented by segment since they are excluded from the measure of segment profitability reviewed by Altria Group, Inc.’s chief operating decision maker. Net revenues and operating companies income (together with a reconciliation to earnings before income taxes) attributable to each such segment for each of the last three years are set forth in
Note 15
.
Segment Reporting
to the consolidated financial statements in Item 8 (“
Note 15
”). Information about total assets by segment is not disclosed because such information is not reported to or used by Altria Group, Inc.’s chief operating decision maker. Segment goodwill and other intangible assets, net, are disclosed in
Note 4
.
Goodwill and Other Intangible Assets, net
to the consolidated financial statements in Item 8 (“
Note 4
”)
.
The accounting policies of the segments are the same as those described in
Note 2
.
Summary of Significant Accounting Policies
to the consolidated financial statements in Item 8 (“
Note 2
”)
.
The relative percentages of operating companies income (loss) attributable to each reportable segment and the all other category were as follows:
|
2015
|
2014
|
2013
|
||||
|
Smokeable products
|
87.4
|
%
|
87.2
|
%
|
84.5
|
%
|
|
Smokeless products
|
12.8
|
|
13.4
|
|
12.2
|
|
|
Wine
|
1.8
|
|
1.7
|
|
1.4
|
|
|
All other
|
(2.0
|
)
|
(2.3
|
)
|
1.9
|
|
|
Total
|
100.0
|
%
|
100.0
|
%
|
100.0
|
%
|
For items affecting the comparability of the relative percentages of operating companies income (loss) attributable to each reportable segment, see
Note 15
.
Narrative Description of Business
Portions of the information called for by this Item are included in Item 7. Management’s Discussion and Analysis of Financial Condition and Results of Operations -
Operating Results by Business Segment
of this Annual Report on Form 10-K.
Tobacco Space
Altria Group, Inc.’s tobacco operating companies include PM USA, USSTC and other subsidiaries of UST, Middleton and Nu Mark. Altria Group Distribution Company provides sales,
1
distribution and consumer engagement services to Altria Group, Inc.’s tobacco operating companies.
The products of Altria Group, Inc.’s tobacco subsidiaries include smokeable tobacco products comprised of cigarettes manufactured and sold by PM USA and machine-made large cigars and pipe tobacco manufactured and sold by Middleton; smokeless tobacco products, substantially all of which are manufactured and sold by USSTC; and innovative tobacco products, including e-vapor products manufactured and sold by Nu Mark.
▪
Cigarettes:
PM USA is the largest cigarette company in the United States, with total cigarette shipment volume in the United States of approximately
126.0 billion
units in
2015
, an increase of
0.5%
from
2014
.
Marlboro
, the principal cigarette brand of PM USA, has been the largest-selling cigarette brand in the United States for the past 40 years.
▪
Cigars:
Middleton is engaged in the manufacture and sale of machine-made large cigars and pipe tobacco to customers, substantially all of which are located in the United States. Middleton sources a portion of its cigars from an importer through a third-party contract manufacturing arrangement. Total shipment volume for cigars was approximately
1.3 billion
units in
2015
, an increase of
4.2%
from
2014
.
Black & Mild
is the principal cigar brand of Middleton.
▪
Smokeless tobacco products:
USSTC is the leading producer and marketer of moist smokeless tobacco (“MST”) products. The smokeless products segment includes the premium brands,
Copenhagen
and
Skoal
, value brands,
Red Seal
and
Husky,
and
Marlboro
Snus, a premium PM USA spit-free smokeless tobacco product. Substantially all of the smokeless tobacco products are manufactured and sold to customers in the United States. Total smokeless products shipment volume was
813.5 million
units in
2015
, an increase of
2.5%
from
2014
.
▪
Innovative tobacco products:
Nu Mark participates in the e-vapor category and has developed and commercialized other innovative tobacco products. In addition, Nu Mark sources the production of its e-vapor products through overseas contract manufacturing arrangements. In 2013, Nu Mark introduced
MarkTen
e-vapor products. In April 2014, Nu Mark acquired the e-vapor business of Green Smoke, Inc. and its affiliates (“Green Smoke”), which has been selling e-vapor products since 2009. For a further discussion of the acquisition of Green Smoke, see
Note 3
.
Acquisition of Green Smoke
to the consolidated financial statements in Item 8 (“
Note 3
”).
In December 2013, Altria Group, Inc.’s subsidiaries entered into a series of agreements with Philip Morris International Inc. (“PMI”) pursuant to which Altria Group, Inc.’s subsidiaries provide an exclusive license to PMI to sell Altria Group, Inc.’s subsidiaries’ e-vapor products outside the United States, and PMI’s subsidiaries provide an exclusive license to Altria Group, Inc.’s subsidiaries to sell two of PMI’s heated tobacco product technologies in the United States. Further, in July 2015, Altria Group, Inc. announced the expansion of its strategic framework with PMI to include a joint research, development and
technology-sharing agreement. Under this agreement, Altria Group, Inc. and PMI will collaborate to develop e-vapor products for commercialization in the United States by Altria Group, Inc. and in markets outside the United States by PMI. This agreement also provides for exclusive technology cross licenses, technical information sharing and cooperation on scientific assessment, regulatory engagement and approval related to e-vapor products.
▪
Distribution, Competition and Raw Materials:
Altria Group, Inc.’s tobacco subsidiaries sell their tobacco products principally to wholesalers (including distributors), large retail organizations, including chain stores, and the armed services.
The market for tobacco products is highly competitive, characterized by brand recognition and loyalty, with product quality, taste, price, product innovation, marketing, packaging and distribution constituting the significant methods of competition. Promotional activities include, in certain instances and where permitted by law, allowances, the distribution of incentive items, price promotions, product promotions, coupons and other discounts.
In June 2009, the President of the United States of America signed into law the Family Smoking Prevention and Tobacco Control Act (“FSPTCA”), which provides the United States Food and Drug Administration (“FDA”) with broad authority to regulate the design, manufacture, packaging, advertising, promotion, sale and distribution of cigarettes, cigarette tobacco and smokeless tobacco products; the authority to require disclosures of related information; and the authority to enforce the FSPTCA and related regulations. The FSPTCA imposes restrictions on the advertising, promotion, sale and distribution of tobacco products, including at retail. The law also grants the FDA authority to extend the FSPTCA application, by regulation, to all other tobacco products, including cigars, pipe tobacco and e-vapor products. In April 2014, the FDA issued proposed regulations for other tobacco products, which as proposed would include machine-made large cigars, e-vapor products, pipe tobacco and oral tobacco-derived nicotine products marketed and sold by some of Altria Group, Inc.’s tobacco subsidiaries. The proposed regulations would impose the FSPTCA regulatory framework on products manufactured, marketed and sold by Middleton and Nu Mark with potentially wide-ranging impact on their businesses. PM USA and USSTC are subject to quarterly user fees as a result of the FSPTCA. Their respective FDA user fee amounts are determined by an allocation formula administered by the FDA that is based on the respective market shares of manufacturers and importers of each kind of tobacco product. PM USA, USSTC and other U.S. tobacco manufacturers have agreed to other marketing restrictions in the United States as part of the settlements of state health care cost recovery actions.
In the United States, under a contract growing program, PM USA purchases burley and flue-cured leaf tobaccos of various grades and styles directly from tobacco growers. Under the terms of this program, PM USA agrees to purchase the amount of tobacco specified in the grower contracts. PM USA also purchases a portion of its United States tobacco requirements through leaf merchants.
2
Tobacco production in the United States was historically subject to government controls, including the production control programs administered by the United States Department of Agriculture (the “USDA”). In October 2004, the Fair and Equitable Tobacco Reform Act of 2004 (“FETRA”), which applied to PM USA, Middleton and USSTC, was signed into law. FETRA eliminated the federal tobacco quota and price support program through an industry-funded buy-out of tobacco growers and quota holders. The cost of the 10-year buy-out, which expired after the third quarter of 2014, was approximately $9.5 billion and was paid by manufacturers and importers of each kind of tobacco product subject to federal excise tax (“FET”). The cost was allocated based on the relative market shares of manufacturers and importers of each kind of tobacco product. As a result of FETRA, Altria Group, Inc.’s subsidiaries recorded charges to cost of sales of approximately $0.3 billion for the year ended December 31, 2014 and approximately $0.4 billion for the year ended December 31, 2013.
USSTC purchases burley, dark fire-cured and air-cured tobaccos of various grades and styles from domestic tobacco growers under a contract growing program as well as from leaf merchants.
Middleton purchases burley and dark air-cured tobaccos of various grades and styles through leaf merchants. Middleton does not have a contract growing program.
Altria Group, Inc.’s tobacco subsidiaries believe there is an adequate supply of tobacco in the world markets to satisfy their current and anticipated production requirements. See Item 1A. Risk Factors of this Annual Report on Form 10-K (“Item 1A”) and
Tobacco Space - Business Environment - Price, Availability and Quality of Agricultural Products
in Item 7. Management’s Discussion and Analysis of Financial Condition and Results of Operations of this Annual Report on Form 10-K for a discussion of risks associated with tobacco supply.
Wine
Ste. Michelle is a producer and supplier of premium varietal and blended table wines and of sparkling wines. Ste. Michelle is a leading producer of Washington state wines, primarily
Chateau Ste. Michelle
,
Columbia Crest
and
14 Hands
,
and owns wineries in or distributes wines from several other domestic and foreign wine
regions. Ste. Michelle’s total
2015
wine shipment volume of approximately
8.9 million
cases increased
6.2%
from
2014
.
Ste. Michelle
holds an 85% ownership interest in Michelle-Antinori, LLC, which owns
Stag’s Leap Wine Cellars
in Napa Valley. Ste. Michelle also owns
Conn Creek
in Napa Valley and
Erath
in Oregon. In addition, Ste. Michelle imports and markets
Antinori
,
Torres
and
Villa Maria Estate
wines and
Champagne Nicolas Feuillatte
in the United States.
▪
Distribution, Competition and Raw Materials:
Key elements of Ste. Michelle’s strategy are expanded domestic distribution of its wines, especially in certain account categories such as restaurants, wholesale clubs, supermarkets, wine shops and mass merchandisers, and a focus on improving product mix to higher-priced, premium products.
Ste. Michelle’s business is subject to significant competition, including competition from many larger, well-established domestic and international companies, as well as from many smaller wine producers. Wine segment competition is primarily based on quality, price, consumer and trade wine tastings, competitive wine judging, third-party acclaim and advertising. Substantially all of Ste. Michelle’s sales occur in the United States through state-licensed distributors.
Federal, state and local governmental agencies regulate the beverage alcohol industry through various means, including licensing requirements, pricing rules, labeling and advertising restrictions, and distribution and production policies. Further regulatory restrictions or additional excise or other taxes on the manufacture and sale of alcoholic beverages may have an adverse effect on Ste. Michelle’s wine business.
Ste. Michelle uses grapes harvested from its own vineyards or purchased from independent growers, as well as bulk wine purchased from other sources. Grape production can be adversely affected by weather and other forces that may limit production. At the present time, Ste. Michelle believes that there is a sufficient supply of grapes and bulk wine available in the market to satisfy its current and expected production requirements. See Item 1A for a discussion of risks associated with competition, unfavorable changes in grape supply and governmental regulations.
Financial Services Business
In 2003, PMCC ceased making new investments and began focusing exclusively on managing its portfolio of finance assets in order to maximize its operating results and cash flows from its existing lease portfolio activities and asset sales. For further information on PMCC’s finance assets, see
Note 7
.
Finance Assets, net
to the consolidated financial statements in Item 8 (“
Note 7
”).
Other Matters
▪
Customers:
The largest customer of PM USA, USSTC and Middleton, McLane Company, Inc., accounted for approximately
26%
of Altria Group, Inc.’s consolidated net revenues for the year ended
December 31, 2015
, and
27%
for each of the years ended December 31,
2014
and
2013
. In addition, Core-Mark Holding Company, Inc. accounted for approximately
10%
of Altria Group, Inc.’s consolidated net revenues for the year ended December 31, 2015. Substantially all of these net revenues were reported in the smokeable products and smokeless products segments.
Sales to
three
distributors accounted for approximately
66%
,
67%
and
66%
of net revenues for the wine segment for the years ended December 31, 2015,
2014
and
2013
, respectively.
▪
Employees:
At
December 31, 2015
, Altria Group, Inc. and its subsidiaries employed approximately 8,800 people.
▪
Executive Officers of Altria Group, Inc.:
The disclosure regarding executive officers is included in Item 10. Directors, Executive Officers and Corporate Governance -
Executive Officers as of February 12, 2016
of this Annual Report on Form 10-K.
3
▪
Research and Development:
Research and development expense for the years ended
December 31, 2015
,
2014
and
2013
is set forth in
Note 17
.
Additional Information
to the consolidated financial statements in Item 8.
▪
Intellectual Property:
Trademarks are of material importance to Altria Group, Inc. and its operating companies, and are protected by registration or otherwise. In addition, as of
December 31, 2015
, the portfolio of over 600 United States patents owned by Altria Group, Inc.’s businesses, as a whole, was material to Altria Group, Inc. and its tobacco businesses. However, no one patent or group of related patents was material to Altria Group, Inc.’s business or its tobacco businesses as of
December 31, 2015
. Altria Group, Inc.’s businesses also have proprietary secrets, technology, know-how, processes and other intellectual property rights that are protected by appropriate confidentiality measures. Certain trade secrets are material to Altria Group, Inc. and its tobacco and wine businesses.
▪
Environmental Regulation:
Altria Group, Inc. and its subsidiaries (and former subsidiaries) are subject to various federal, state and local laws and regulations concerning the discharge of materials into the environment, or otherwise related to environmental protection, including, in the United States: The Clean Air Act, the Clean Water Act, the Resource Conservation and Recovery Act and the Comprehensive Environmental Response, Compensation and Liability Act (commonly known as “Superfund”), which can impose joint and several liability on each responsible party. Subsidiaries (and former subsidiaries) of Altria Group, Inc. are involved in several matters subjecting them to potential costs of remediation and natural resource damages under Superfund or other laws and regulations. Altria Group, Inc.’s subsidiaries expect to continue to make capital and other expenditures in connection with environmental laws and regulations. As discussed in
Note 2
,
Altria Group, Inc. provides for expenses associated with environmental remediation obligations on an undiscounted basis when such amounts are probable and can be reasonably estimated. Such accruals are adjusted as new information develops or circumstances change. Other than those amounts, it is not possible to reasonably estimate the cost of any environmental remediation and compliance efforts that subsidiaries of Altria Group, Inc. may undertake in the future. In the opinion of management, however, compliance with environmental laws and regulations, including the payment of any remediation and compliance costs or damages and the making of related expenditures, has not had, and is not expected to have, a material adverse effect on Altria Group, Inc.’s consolidated results of operations, capital expenditures, financial position or cash flows.
Financial Information About Geographic Areas
Substantially all of Altria Group, Inc.’s net revenues are from sales generated in the United States for each of the last three fiscal years and substantially all of Altria Group, Inc.’s long-lived assets are located in the United States.
Available Information
Altria Group, Inc. is required to file annual, quarterly and current reports, proxy statements and other information with the Securities and Exchange Commission (“SEC”). Investors may read and copy any document that Altria Group, Inc. files, including this Annual Report on Form 10-K, at the SEC’s Public Reference Room at 100 F Street, NE, Washington, D.C. 20549. Investors may obtain information on the operation of the Public Reference Room by calling the SEC at 1-800-SEC-0330. In addition, the SEC maintains an Internet site at http://www.sec.gov that contains reports, proxy and information statements, and other information regarding issuers that file electronically with the SEC, from which investors can electronically access Altria Group, Inc.’s SEC filings.
Altria Group, Inc. makes available free of charge on or through its website (www.altria.com) its Annual Report on Form 10-K, Quarterly Reports on Form 10-Q, Current Reports on Form 8-K and amendments to those reports filed or furnished pursuant to Section 13(a) or 15(d) of the Securities Exchange Act of 1934, as amended (the “Exchange Act”), as soon as reasonably practicable after Altria Group, Inc. electronically files such material with, or furnishes it to, the SEC. Investors can access Altria Group, Inc.’s filings with the SEC by visiting www.altria.com/secfilings.
The information on the respective websites of Altria Group, Inc. and its subsidiaries is not, and shall not be deemed to be, a part of this report or incorporated into any other filings Altria Group, Inc. makes with the SEC.
The following risk factors should be read carefully in connection with evaluating our business and the forward-looking statements contained in this Annual Report on Form 10-K. Any of the following risks could materially adversely affect our business, our results of operations, our cash flows, our financial position and the actual outcome of matters as to which forward-looking statements are made in this Annual Report on Form 10-K.
We
(1)
may from time to time make written or oral forward-looking statements, including earnings guidance and other statements contained in filings with the SEC, reports to security holders, press releases and investor webcasts. You can identify these forward-looking statements by use of words such as “strategy,” “expects,” “continues,” “plans,” “anticipates,” believes,” “will,” “estimates,” “forecasts,” “intends,” “projects,” “goals,” “objectives,” “guidance,” “targets” and other words of similar meaning. You can also identify them by the fact that they do not relate strictly to historical or current facts.
We cannot guarantee that any forward-looking statement will be realized, although we believe we have been prudent in our plans and assumptions. Achievement of future results is subject to risks, uncertainties and assumptions that may prove to be ___________________________________________________
1
This section uses the terms “we,” “our” and “us” when it is not necessary to distinguish among Altria Group, Inc. and its various operating subsidiaries or when any distinction is clear from the context.
4
inaccurate. Should known or unknown risks or uncertainties materialize, or should underlying assumptions prove inaccurate, actual results could vary materially from those anticipated, estimated or projected. You should bear this in mind as you consider forward-looking statements and whether to invest in or remain invested in Altria Group, Inc.’s securities. In connection with the “safe harbor” provisions of the Private Securities Litigation Reform Act of 1995, we are identifying important factors that, individually or in the aggregate, could cause actual results and outcomes to differ materially from those contained in any forward-looking statements made by us; any such statement is qualified by reference to the following cautionary statements. We elaborate on these and other risks we face throughout this document, particularly in the “Business Environment” sections preceding our discussion of the operating results of our subsidiaries’ businesses in Item 7. Management’s Discussion and Analysis of Financial Condition and Results of Operations of this Annual Report on Form 10-K (“Item 7”). You should understand that it is not possible to predict or identify all risk factors. Consequently, you should not consider the following to be a complete discussion of all potential risks or uncertainties. We do not undertake to update any forward-looking statement that we may make from time to time except as required by applicable law.
Unfavorable litigation outcomes could materially adversely affect the consolidated results of operations, cash flows or financial position of Altria Group, Inc., or the businesses of one or more of its subsidiaries.
Legal proceedings covering a wide range of matters are pending or threatened in various United States and foreign jurisdictions against Altria Group, Inc. and its subsidiaries, including PM USA and UST and its subsidiaries, as well as their respective indemnitees. Various types of claims may be raised in these proceedings, including product liability, consumer protection, antitrust, tax, contraband-related claims, patent infringement, employment matters, claims for contribution and claims of competitors and distributors.
Litigation is subject to uncertainty and it is possible that there could be adverse developments in pending or future cases. An unfavorable outcome or settlement of pending tobacco-related or other litigation could encourage the commencement of additional litigation. Damages claimed in some tobacco-related or other litigation are significant and, in certain cases, range in the billions of dollars. The variability in pleadings in multiple jurisdictions, together with the actual experience of management in litigating claims, demonstrate that the monetary relief that may be specified in a lawsuit bears little relevance to the ultimate outcome. In certain cases, plaintiffs claim that defendants’ liability is joint and several. In such cases, Altria Group, Inc. or its subsidiaries may face the risk that one or more co-defendants decline or otherwise fail to participate in the bonding required for an appeal or to pay their proportionate or jury-allocated share of a judgment. As a result, Altria Group, Inc. or its subsidiaries under certain circumstances may have to pay more than their proportionate share of any bonding- or judgment-related amounts. Furthermore, in those cases where plaintiffs are successful, Altria Group, Inc.
or its subsidiaries may also be required to pay interest and attorneys’ fees.
Although PM USA has historically been able to obtain required bonds or relief from bonding requirements in order to prevent plaintiffs from seeking to collect judgments while adverse verdicts have been appealed, there remains a risk that such relief may not be obtainable in all cases. This risk has been substantially reduced given that 47 states and Puerto Rico now limit the dollar amount of bonds or require no bond at all. As discussed in Note 18,
Contingencies
to the consolidated financial statements in Item 8 (“Note 18”), tobacco litigation plaintiffs have challenged the constitutionality of Florida’s bond cap statute in several cases and plaintiffs may challenge state bond cap statutes in other jurisdictions as well. Such challenges may include the applicability of state bond caps in federal court. Although we cannot predict the outcome of such challenges, it is possible that the consolidated results of operations, cash flows or financial position of Altria Group, Inc., or the businesses of one or more of its subsidiaries, could be materially adversely affected in a particular fiscal quarter or fiscal year by an unfavorable outcome of one or more such challenges.
In certain litigation, PM USA faces potentially significant non-monetary remedies. For example, in the lawsuit brought by the United States Department of Justice, discussed in Note 18, the district court did not impose monetary penalties but ordered significant non-monetary remedies, including the issuance of “corrective statements” in various media.
Altria Group, Inc. and its subsidiaries have achieved substantial success in managing litigation. Nevertheless, litigation is subject to uncertainty, and significant challenges remain.
It is possible that the consolidated results of operations, cash flows or financial position of Altria Group, Inc., or the businesses of one or more of its subsidiaries, could be materially adversely affected in a particular fiscal quarter or fiscal year by an unfavorable outcome or settlement of certain pending litigation. Altria Group, Inc. and each of its subsidiaries named as a defendant believe, and each has been so advised by counsel handling the respective cases, that it has valid defenses to the litigation pending against it, as well as valid bases for appeal of adverse verdicts. Each of the companies has defended, and will continue to defend, vigorously against litigation challenges. However, Altria Group, Inc. and its subsidiaries may enter into settlement discussions in particular cases if they believe it is in the best interests of Altria Group, Inc. to do so. See Item 3. Legal Proceedings of this Annual Report on Form 10-K (“Item 3”), Note 18 and Exhibits 99.1 and 99.2 to this Annual Report on Form 10-K for a discussion of pending tobacco-related litigation.
Significant federal, state and local governmental actions, including actions by the FDA, and various private sector actions may continue to have an adverse impact on our tobacco subsidiaries’ businesses.
As described in
Tobacco Space - Business Environment
in Item 7,
PM USA faces significant governmental and private sector actions, including efforts aimed at reducing the incidence of
5
tobacco use and efforts seeking to hold PM USA responsible for the adverse health effects associated with both smoking and exposure to environmental tobacco smoke. These actions, combined with the diminishing social acceptance of smoking, have resulted in reduced cigarette industry volume, and we expect that these factors will continue to reduce cigarette consumption levels.
Actions by the FDA and other federal, state or local governments or agencies, including those specific actions described in
Tobacco Space - Business Environment
in Item 7, may impact the consumer acceptability of tobacco products, limit adult tobacco consumer choices, delay or prevent the launch of new or modified tobacco products or products with claims of reduced risk, require the recall or other removal of tobacco products from the marketplace (for example as a result of product contamination or a determination by the FDA that one or more tobacco products do not satisfy the statutory requirements for substantial equivalence), restrict communications to adult tobacco consumers, restrict the ability to differentiate tobacco products, create a competitive advantage or disadvantage for certain tobacco companies, impose additional manufacturing, labeling or packing requirements, interrupt manufacturing or otherwise significantly increase the cost of doing business, or restrict or prevent the use of specified tobacco products in certain locations or the sale of tobacco products by certain retail establishments. Any one or more of these actions may have a material adverse impact on the business, consolidated results of operations, cash flows or financial position of Altria Group, Inc. and its tobacco subsidiaries. See
Tobacco Space - Business Environment
in Item 7 for a more detailed discussion of these risks.
Tobacco products are subject to substantial taxation, which could have an adverse impact on sales of the tobacco products of Altria Group, Inc.’s tobacco subsidiaries.
Tobacco products are subject to substantial excise taxes, and significant increases in tobacco product-related taxes or fees have been proposed or enacted and are likely to continue to be proposed or enacted within the United States at the state, federal and local levels. Tax increases are expected to continue to have an adverse impact on sales of the tobacco products of our tobacco subsidiaries through lower consumption levels and the potential shift in adult consumer purchases from the premium to the non-premium or discount segments or to other low-priced or low-taxed tobacco products or to counterfeit and contraband products. Such shifts may have an adverse impact on the reported share performance of tobacco products of Altria Group, Inc.’s tobacco subsidiaries. For further discussion, see
Tobacco Space - Business Environment - Excise Taxes
in Item 7
.
Our tobacco businesses face significant competition and their failure to compete effectively could have an adverse effect on the consolidated results of operations or cash flows of Altria Group, Inc., or the business of Altria Group, Inc.’s tobacco subsidiaries.
Each of Altria Group, Inc.’s tobacco subsidiaries operates in highly competitive tobacco categories. Significant methods of
competition include product quality, taste, price, product innovation, marketing, packaging, distribution and promotional activities. A highly competitive environment could negatively impact the profitability, market share and shipment volume of our tobacco subsidiaries, which could have an adverse effect on the consolidated results of operations or cash flows of Altria Group, Inc.
PM USA also faces competition from lowest priced brands sold by certain United States and foreign manufacturers that have cost advantages because they are not parties to settlements of certain tobacco litigation in the United States. These settlements, among other factors, have resulted in substantial cigarette price increases. These manufacturers may fail to comply with related state escrow legislation or may avoid escrow deposit obligations on the majority of their sales by concentrating on certain states where escrow deposits are not required or are required on fewer than all such manufacturers’ cigarettes sold in such states. Additional competition has resulted from diversion into the United States market of cigarettes intended for sale outside the United States, the sale of counterfeit cigarettes by third parties, the sale of cigarettes by third parties over the Internet and by other means designed to avoid collection of applicable taxes, and imports of foreign lowest priced brands. USSTC faces significant competition in the smokeless tobacco category and has experienced consumer down-trading to lower-priced brands. In the cigar category, additional competition has resulted from increased imports of machine-made large cigars manufactured offshore.
Altria Group, Inc. and its subsidiaries may be unsuccessful in anticipating changes in adult consumer preferences, responding to changes in consumer purchase behavior or managing through difficult competitive and economic conditions.
Each of our tobacco and wine subsidiaries is subject to intense competition and changes in adult consumer preferences. To be successful, they must continue to:
|
▪
|
promote brand equity successfully;
|
|
▪
|
anticipate and respond to new and evolving adult consumer preferences;
|
|
▪
|
develop, manufacture, market and distribute products that appeal to adult consumers (including, where appropriate, through arrangements with, or investments in, third parties);
|
|
▪
|
improve productivity; and
|
|
▪
|
protect or enhance margins through cost savings and price increases.
|
See
Tobacco Space - Business Environment
-
Summary
in Item 7 for additional discussion concerning evolving adult tobacco consumer preferences, including increased consumer awareness of, and expenditures on, e-vapor products. Continued growth of this product category could further contribute to reductions in cigarette consumption levels and cigarette industry sales volume
6
and could adversely affect the growth rates of other tobacco products.
The willingness of adult consumers to purchase premium consumer product brands depends in part on economic conditions. In periods of economic uncertainty, adult consumers may purchase more discount brands and/or, in the case of tobacco products, consider lower-priced tobacco products, which could have a material adverse effect on the business, consolidated results of operations, cash flows or financial position of Altria Group, Inc. and its subsidiaries. Our tobacco and wine subsidiaries work to broaden their brand portfolios to compete effectively with lower-priced products.
Our financial services business (conducted through PMCC) holds investments in finance leases, principally in transportation (including aircraft), power generation and manufacturing equipment and facilities. Its lessees are also subject to intense competition and economic conditions. If parties to PMCC’s leases fail to manage through difficult economic and competitive conditions, PMCC may have to increase its allowance for losses, which would adversely affect our earnings.
Altria Group, Inc.’s tobacco subsidiaries may be unsuccessful in developing and commercializing adjacent products or processes, including innovative tobacco products that may reduce the health risks associated with current tobacco products and that appeal to adult tobacco consumers, which may have an adverse effect on their ability to grow new revenue streams.
Altria Group, Inc. and its subsidiaries have growth strategies involving moves and potential moves into adjacent products or processes, including innovative tobacco products. Some innovative tobacco products may reduce the health risks associated with current tobacco products, while continuing to offer adult tobacco consumers (within and outside the United States) products that meet their taste expectations and evolving preferences. Examples include tobacco-containing and nicotine-containing products that reduce or eliminate exposure to cigarette smoke and/or constituents identified by public health authorities as harmful. These efforts may include arrangements with, or investments in, third parties. Our tobacco subsidiaries may not succeed in these efforts, which would have an adverse effect on the ability to grow new revenue streams.
Further, we cannot predict whether regulators, including the FDA, will permit the marketing or sale of products with claims of reduced risk to consumers, the speed with which they may make such determinations or whether regulators will impose an unduly burdensome regulatory framework on such products. Nor can we predict whether adult tobacco consumers’ purchasing decisions would be affected by such claims if permitted. Adverse developments on any of these matters could negatively impact the commercial viability of such products.
If our tobacco subsidiaries do not succeed in their efforts to develop and commercialize innovative tobacco products or to obtain regulatory approval for the marketing or sale of products with claims of reduced risk, but one or more of their competitors
do succeed, our tobacco subsidiaries may be at a competitive disadvantage.
Significant changes in tobacco leaf price, availability or quality could have an adverse effect on the profitability and business of Altria Group, Inc.’s tobacco subsidiaries.
Any significant change in tobacco leaf prices, quality or availability could adversely affect our tobacco subsidiaries’ profitability and business. For further discussion, see
Tobacco Space - Business Environment - Price, Availability and Quality
of Agricultural Products
in Item 7
.
Because Altria Group, Inc.’s tobacco subsidiaries rely on a few significant facilities and a small number of significant suppliers, an extended disruption at a facility or in service by a supplier could have a material adverse effect on the business, the consolidated results of operations, cash flows or financial position of Altria Group, Inc. and its tobacco subsidiaries.
Altria Group, Inc.’s tobacco subsidiaries face risks inherent in reliance on a few significant facilities and a small number of significant suppliers. A natural or man-made disaster or other disruption that affects the manufacturing operations of any of Altria Group, Inc.’s tobacco subsidiaries or the operations of any significant suppliers of any of Altria Group, Inc.’s tobacco subsidiaries could adversely impact the operations of the affected subsidiaries. An extended disruption in operations experienced by one or more of Altria Group, Inc.’s subsidiaries or significant suppliers could have a material adverse effect on the business, the consolidated results of operations, cash flows or financial position of Altria Group, Inc. and its tobacco subsidiaries.
Altria Group, Inc. may be unable to attract and retain the best talent due to the impact of decreasing social acceptance of tobacco usage and tobacco control actions.
Our ability to implement our strategy of attracting and retaining the best talent may be impaired by the impact of decreasing social acceptance of tobacco usage and tobacco regulation and control actions. The tobacco industry competes for talent with the consumer products industry and other companies that enjoy greater societal acceptance. As a result, we may be unable to attract and retain the best talent.
Acquisitions or other events may adversely affect Altria Group, Inc.’s credit rating, and Altria Group, Inc. may not achieve its anticipated strategic or financial objectives.
Altria Group, Inc. from time to time considers acquisitions and may engage in confidential acquisition negotiations that are not publicly announced unless and until those negotiations result in a definitive agreement. Although we seek to maintain or improve our credit ratings over time, it is possible that completing a given acquisition or the occurrence of other events could impact our credit ratings or the outlook for those ratings. Any such change in ratings or outlook may negatively affect the amount of credit available to us and may also increase our costs and adversely affect our earnings or our dividend rate.
7
Furthermore, acquisition opportunities are limited, and acquisitions present risks of failing to achieve efficient and effective integration, strategic objectives and anticipated revenue improvements and cost savings. There can be no assurance that we will be able to acquire attractive businesses on favorable terms, that we will realize any of the anticipated benefits from an acquisition or that acquisitions will be quickly accretive to earnings.
Disruption and uncertainty in the debt capital markets could adversely affect Altria Group, Inc.’s access to the debt capital markets, earnings and dividend rate.
Access to the debt capital markets is important for us to satisfy our liquidity and financing needs. Disruption and uncertainty in the credit and debt capital markets and any resulting adverse impact on credit availability, pricing, credit terms or credit rating may negatively affect the amount of credit available to us and may also increase our costs and adversely affect our earnings or our dividend rate.
Altria Group, Inc.’s reported earnings from and carrying value of its equity investment in SABMiller may be adversely affected by unfavorable foreign currency exchange rates and other factors.
For purposes of financial reporting, the earnings from and carrying value of our equity investment in SABMiller are translated into U.S. dollars from various local currencies. During times of a strengthening U.S. dollar against these currencies, our reported earnings from and carrying value of our equity investment in SABMiller will be reduced because the local currencies will translate into fewer U.S. dollars. The earnings from and carrying value of our equity investment in SABMiller are also subject to the risks encountered by SABMiller in its business.
Altria Group, Inc. may be required to write down intangible assets, including goodwill, due to impairment, which would reduce earnings.
We periodically calculate the fair value of our reporting units and intangible assets to test for impairment. This calculation may be affected by several factors, including general economic conditions, regulatory developments, changes in category growth rates as a result of changing adult consumer preferences, success of planned new product introductions, competitive activity and tobacco-related taxes. If an impairment is determined to exist, we will incur impairment losses, which will reduce our earnings.
Competition, unfavorable changes in grape supply and new governmental regulations or revisions to existing governmental regulations could adversely affect Ste. Michelle’s wine business.
Ste. Michelle’s business is subject to significant competition, including from many large, well-established domestic and international companies. The adequacy of Ste. Michelle’s grape supply is influenced by consumer demand for wine in relation to industry-wide production levels as well as by weather and crop
conditions, particularly in eastern Washington. Supply shortages related to any one or more of these factors could increase production costs and wine prices, which ultimately may have a negative impact on Ste. Michelle’s sales. In addition, federal, state and local governmental agencies regulate the alcohol beverage industry through various means, including licensing requirements, pricing, labeling and advertising restrictions, and distribution and production policies. New regulations or revisions to existing regulations, resulting in further restrictions or taxes on the manufacture and sale of alcoholic beverages, may have an adverse effect on Ste. Michelle’s wine business. For further discussion, see
Wine Segment - Business Environment
in Item 7.
The failure of Altria Group, Inc.’s information systems or service providers’ information systems to function as intended, or cyberattacks or security breaches, could result in loss of revenue, assets, personal data, intellectual property, trade secrets or other sensitive data, violation of applicable privacy and data security laws, reputational harm and significant costs.
Altria Group, Inc. and its subsidiaries rely on information systems to help manage business processes, collect and interpret business data, comply with regulatory, financial reporting and tax requirements, engage in marketing and e-commerce activities, collect and store sensitive data and confidential information, and communicate internally and externally with employees, investors, suppliers, trade customers, adult consumers and others. Many of these information systems are managed by third-party service providers. We have implemented administrative, technical and physical safeguards, including testing and auditing protocols, backup systems and business continuity plans, intended to protect our systems and data. However, because the techniques used in cyberattacks and security breaches change frequently and often are not recognized until launched against a target, we may be unable to anticipate these techniques or to implement adequate preventative measures. To date, interruptions of our information systems have been infrequent and have not had a material impact on our operations. Failure of our systems or service providers’ systems to function as intended or cyberattacks or security breaches by parties intent on extracting or corrupting information or otherwise disrupting business processes could result in loss of revenue, assets, personal data, intellectual property, trade secrets or other sensitive and confidential data, violation of applicable privacy and data security laws, damage to the reputation of our companies and their brands, legal challenges and significant remediation and other costs to Altria Group, Inc. and its subsidiaries.
Unfavorable outcomes of any governmental investigations could materially affect the businesses of Altria Group, Inc. and its subsidiaries.
From time to time, Altria Group, Inc. and its subsidiaries are subject to governmental investigations on a range of matters. We cannot predict whether new investigations may be commenced or the outcome of such investigations, and it is possible that our
8
business could be materially adversely affected by an unfavorable outcome of future investigations.
Expanding international business operations subjects Altria Group, Inc. and its subsidiaries to various United States and foreign laws and regulations, and violations of such laws or regulations could result in reputational harm, legal challenges and/or significant costs.
While Altria Group, Inc. and its subsidiaries are primarily engaged in business activities in the United States, they do engage (directly or indirectly) in certain international business activities that are subject to various United States and foreign laws and regulations, such as the U.S. Foreign Corrupt Practices Act and other laws prohibiting bribery and corruption. Although we have a Code of Conduct and a compliance system designed to prevent and detect violations of applicable law, no system can provide assurance that it will always protect against improper actions by employees or third parties. Violations of these laws, or allegations of such violations, could result in reputational harm, legal challenges and/or significant costs.
AB InBev’s proposed transaction to effect a business combination with SABMiller may not be completed within the anticipated time frame or at all, which could have a negative effect on the value of our equity investment in SABMiller.
As described in more detail in Note 6,
Investment in SABMiller
to the consolidated financial statements in Item 8 (“Note 6”), on November 11, 2015, AB InBev announced its firm offer to effect a business combination with SABMiller. The proposed transaction is subject to a number of closing conditions, including shareholder approvals of both SABMiller and AB InBev, and receipt of the required regulatory approvals. These conditions may not be satisfied or may take longer than expected to be satisfied. The transaction is also subject to other risks and uncertainties over which Altria Group, Inc. has no control. We cannot provide any assurance that the proposed transaction will be completed or that there will not be a delay in the completion of the proposed transaction. If the transaction is not completed or is subject to a delay, the value of our investment in SABMiller could be adversely affected.
If AB InBev’s proposed transaction to effect a business combination with SABMiller is completed, AB InBev may not achieve the intended benefits of the transaction, which could have a negative effect on our reported earnings from and carrying value of our equity investment in the combined company.
There can be no assurance that AB InBev will be able to successfully integrate SABMiller’s business or otherwise realize the expected benefits of the proposed transaction. Any of these outcomes could result in increased costs to the combined company and dilution to its shareholders, and could adversely affect the combined company’s financial condition and Altria Group, Inc.’s reported earnings from and carrying value of our investment in the combined company.
If AB InBev’s proposed transaction to effect a business combination with SABMiller is completed, we will receive a substantial portion of our transaction consideration in the form of restricted shares. Furthermore, the number of restricted shares we expect to receive is, under certain circumstances described below, subject to proration, which if it were to occur would decrease the number of restricted shares and increase the amount of cash that we receive in connection with the transaction. Any cash we receive will be subject to taxation and to risks associated with changes in the value of the U.S. dollar versus the British pound.
Altria Group, Inc. has committed to elect the partial share alternative (“PSA”) in the transaction. Therefore, upon completion of the proposed transaction, we expect to receive a substantial portion of our transaction consideration in the form of shares that will be subject to certain limitations and restrictions, including a five-year restriction on sale or transfer, subject to limited exceptions. These transfer restrictions will require us to bear the risks associated with our investment in the combined company for a five-year period following completion of the proposed transaction. Further, while we have committed to elect the PSA in the transaction, our election is subject to proration to the extent that other SABMiller shareholders also elect this alternative and these elections exceed the maximum number of shares that AB InBev’s firm offer makes available to those SABMiller shareholders that elect the PSA. If we receive more cash and less equity consideration than we currently expect, we will be subject to additional tax liabilities, our percentage ownership of the combined company will be reduced and we may be unable to account for our investment under the equity method of accounting as we currently do for our investment in SABMiller.
In addition, the cash consideration we expect to receive will be denominated in British pounds. Based on the British pound to U.S. dollar exchange rate on November 10, 2015, the trading day prior to the announcement of the proposed transaction, we anticipate receiving approximately $2.5 billion in pre-tax cash. We entered into a derivative financial instrument in the form of a put option to hedge our exposure to foreign currency exchange rate movements. We are exposed to the risk of default by, or failure of, our counterparty financial institution to perform under the contractual obligation of the derivative financial instrument. In addition, as indicated above, we may receive more cash consideration than we anticipate because our election of the PSA is subject to proration and, therefore, we may not be successful in effectively mitigating our foreign currency exchange rate risk on any additional cash proceeds above the $2.5 billion in pre-tax cash that we may receive. As a result of either of the above risks, Altria Group, Inc. could incur a decrease in the amount of the gain recorded upon the completion of the AB InBev and SABMiller transaction.
9
If AB InBev’s proposed transaction to effect a business combination with SABMiller is completed, our tax treatment of the transaction may be challenged.
While we expect the equity consideration that we receive in the transaction to qualify for tax-deferred treatment, we cannot provide any assurance that federal and state tax authorities will not challenge the expected tax treatment and, if they do, what the outcome of any such challenge will be. It is also possible that the tax treatment of the dividends Altria Group, Inc. expects to receive from the combined company may not be as favorable as that applied to the dividends we receive from SABMiller.
None.
The property in Richmond, Virginia that serves as the headquarters facility for Altria Group, Inc., PM USA, USSTC, Middleton, Nu Mark and certain other subsidiaries is under lease.
At
December 31, 2015
, the smokeable products segment used four manufacturing and processing facilities. PM USA owns and operates two tobacco manufacturing and processing facilities located in the Richmond, Virginia area that are used in the manufacturing and processing of cigarettes. Middleton owns and operates two manufacturing and processing facilities - one in King of Prussia, Pennsylvania and one in Limerick, Pennsylvania - that are used in the manufacturing and processing of cigars and pipe tobacco. In addition, PM USA owns a research and technology center in Richmond, Virginia that is leased to an affiliate, Altria Client Services LLC.
At
December 31, 2015
, the smokeless products segment used four smokeless tobacco manufacturing and processing facilities located in Franklin Park, Illinois; Hopkinsville, Kentucky; Nashville, Tennessee; and Richmond, Virginia, all of which are owned and operated by USSTC. In 2016, USSTC expects to complete construction of a new facility located in Hopkinsville, Kentucky and expects the facility to be operational in the second half of 2016.
At
December 31, 2015
, the wine segment used 11 wine-making facilities - seven in Washington, three in California and one in Oregon. All of these facilities are owned and operated by Ste. Michelle, with the exception of a facility that is leased by Ste. Michelle in Washington. In addition, in order to support the production of its wines, the wine segment used vineyards in Washington, California and Oregon that are leased or owned by Ste. Michelle.
The plants and properties owned or leased and operated by Altria Group, Inc. and its subsidiaries are maintained in good condition and are believed to be suitable and adequate for present needs.
The information required by this Item is included in
Note 18
and Exhibits 99.1 and 99.2 to this Annual Report on Form 10-K. Altria Group, Inc.’s consolidated financial statements and
accompanying notes for the year ended December 31, 2015 were filed on Form 8-K on January 28, 2016 (such consolidated financial statements and accompanying notes are also included in Item 8). The following summarizes certain developments in Altria Group, Inc.’s litigation since the filing of such Form 8-K.
Recent Developments
Smoking and Health Litigation
▪
Non-
Engle
Progeny Litigation:
In
Pooshs
, on February 8, 2016, a California federal court jury returned a verdict in favor of PM USA.
In
Bullock
, on February 8, 2016, the district court denied plaintiff’s motion for a new trial.
In
Schwarz
, on February 10, 2016, PM USA filed a petition for
writ of certiorari
with the United States Supreme Court.
▪
Engle
Progeny Trial Results:
In
McCoy
, on January 27, 2016, plaintiff filed a notice of cross-appeal to the Florida Fourth District Court of Appeal.
In
Ewing
, on January 28, 2016, an Escambia County jury returned a verdict in favor of PM USA.
In
Pollari
, on January 28, 2016, PM USA posted a bond in the amount of $2.5 million.
On January 29, 2016, the Florida Supreme Court upheld the trial court’s decision in favor of plaintiff in
R. Cohen
. On February 1, 2016, the Florida Supreme Court upheld the trial courts’ decisions in favor of plaintiffs in
Kayton
and
Putney
. On February 3, 2016, defendants filed a motion for clarification in
Putney
. On February 8, 2016, in
Kayton
and
R. Cohen
, PM USA posted riders increasing the amount of its bonds to $15 million and $7.5 million, respectively.
In
Buchanan
, on February 2, 2016, the Florida Supreme Court declined to accept jurisdiction of PM USA’s petition for review. On February 8, 2016, PM USA posted a rider increasing the amount of its bond to $5.5 million.
In
Bowden
, on February 2, 2016, the Florida First District Court of Appeal affirmed the trial court’s decision in favor of plaintiff. In the first quarter of 2016, PM USA will record a provision of approximately $1.6 million for the judgment plus interest.
In
Barbose
, on February 17, 2016, PM USA posted a bond in the amount of $2.5 million and, on February 16, 2016, defendants filed a notice of appeal to the Florida Second District Court of Appeal.
In
Cooper
, on February 10, 2016, the trial court entered final judgment in favor of plaintiff, reducing the compensatory damages award against PM USA to approximately $300,000.
In
Ahrens
, on February 13, 2016, a Pinellas County jury returned a verdict in favor of plaintiff and against PM USA and R.J. Reynolds Tobacco Company (“R.J. Reynolds”) awarding $9 million in compensatory damages and allocating 24% of the fault to PM USA. The jury also awarded $2.5 million in punitive damages against each defendant.
In
Greene
(formerly
Rizzuto
), on February 16, 2016, PM USA paid the judgment plus interest in the amount of approximately $6.8 million.
10
In
Hess
, on February 22, 2016, PM USA paid the judgment plus interest and associated costs in the amount of approximately $10.6 million.
In
E. Smith
, on February 22, 2016, a Palm Beach County jury returned a verdict in favor of PM USA and R.J. Reynolds.
In
Ledoux
, on February 23, 2016, the trial court denied defendants’ post-trial motions.
Medical Monitoring Class Actions:
In
Donovan
, on February 10, 2016, a Massachusetts jury returned a verdict in favor of PM USA.
Health Care Cost Recovery Litigation
▪
NPM Adjustment Disputes:
On February 8, 2016, PM USA and certain other manufacturers entered into an agreement with the State of Missouri to settle the non-participating manufacturer (“NPM”) adjustment disputes under the 1998 Master Settlement Agreement (“MSA”). The settlement is contingent upon Missouri’s enactment by June 3, 2016 of certain amendments to its existing escrow statute. Similar to the settlement of these disputes with 24 other signatory states, the settlement with Missouri would resolve the disputes for the years 2003-2012 and treat 2013-2014 as “transition years.” If the settlement becomes effective, PM USA will retain approximately $36 million previously received as a result of an arbitration panel’s ruling that Missouri did not diligently enforce its escrow statue during 2003 and will receive an additional approximately $18 million in the form of a reduction to the next MSA payment following the effectiveness of the settlement. In addition, if the settlement becomes effective, the NPM Adjustment provision will be revised and streamlined as to Missouri for the years after 2014. The original participating manufacturers have agreed that the amounts they receive under the settlement for the years after 2014 will be allocated among them pursuant to a formula that modifies the MSA allocation formula in a manner favorable to PM USA, although the extent to which it remains favorable to PM USA will depend upon future developments.
On February 22, 2016, the Court of Appeals of Maryland denied PM USA’s petition for discretionary judicial review of the Maryland intermediate appellate court decision that had reversed the Maryland trial court’s ruling in PM USA’s favor on the pro rata judgment reduction method. This decision leaves in effect the intermediate court’s decision applying a judgment reduction method that is more favorable to the state. As a result of this denial of PM USA’s petition, PM USA will be required to return approximately $12 million of the 2003 NPM Adjustment and $7 million of the interest it received (plus interest on those amounts). In addition, PM USA will record a corresponding reduction to its pre-tax earnings in the first quarter of 2016.
▪
Federal Government’s Lawsuit:
On February 8, 2016, the U.S. District Court for the District of Columbia issued an order on the content of the corrective communications and ordered the parties to submit proposed changes to the
consent order on the implementation details
by April 1, 2016.
“Lights/Ultra Lights” Cases
▪
State Trial Court Class Certifications:
In
Aspinall
, on February 19, 2016, the trial court issued its “Findings of Fact and Conclusions of Law.” The court found that (1) PM USA violated Massachusetts consumer protection laws in marketing
Marlboro
“Lights” and (2) plaintiffs proved that class members were economically injured, but did not prove a specific measure of damages. As a result, the court awarded statutory damages of $25 per class member, for a total of $4.9 million, plus interest, attorneys’ fees and costs.
Certain Other Tobacco-Related Litigation
▪
Argentine Grower Cases:
In
Hupan
, on January 29, 2016, plaintiffs filed an amended complaint against defendants, including PM USA. On February 12, 2016, PM USA and Philip Morris Global Brands Inc. (a subsidiary of PMI) filed a motion to strike the amended complaint.
▪
UST Litigation:
In
Vassallo
, on February 3, 2016, the trial court denied plaintiff’s motion to amend the complaint to add fraud and conspiracy claims.
Not applicable.
11
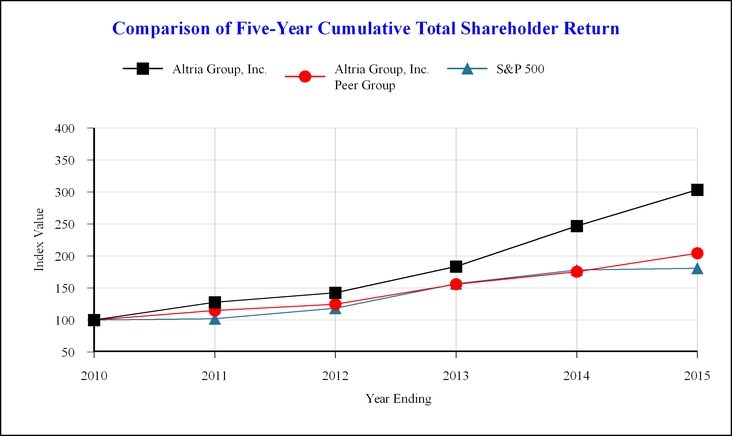
Performance Graph
The graph below compares the cumulative total shareholder return of Altria Group, Inc.’s common stock for the last five years with the cumulative total return for the same period of the S&P 500 Index and the Altria Group, Inc. Peer Group
(1)
. The graph assumes the investment of $100 in common stock and each of the indices as of the market close on December 31, 2010 and the reinvestment of all dividends on a quarterly basis.
|
Date
|
Altria Group, Inc.
|
Altria Group, Inc. Peer Group
|
S&P 500
|
|||||||||
|
December 2010
|
$
|
100.00
|
|
$
|
100.00
|
|
$
|
100.00
|
|
|||
|
December 2011
|
$
|
127.66
|
|
$
|
114.65
|
|
$
|
102.11
|
|
|||
|
December 2012
|
$
|
142.68
|
|
$
|
124.68
|
|
$
|
118.44
|
|
|||
|
December 2013
|
$
|
183.42
|
|
$
|
155.86
|
|
$
|
156.79
|
|
|||
|
December 2014
|
$
|
246.72
|
|
$
|
175.31
|
|
$
|
178.24
|
|
|||
|
December 2015
|
$
|
303.71
|
|
$
|
204.47
|
|
$
|
180.68
|
|
|||
Source: Bloomberg - “Total Return Analysis” calculated on a daily basis and assumes reinvestment of dividends as of the ex-dividend date.
(1)
In 2015, the Altria Group, Inc. Peer Group consisted of U.S.-headquartered consumer product companies that are competitors to Altria Group, Inc.’s tobacco operating companies subsidiaries or that have been selected on the basis of revenue or market capitalization: Campbell Soup Company, The Coca-Cola Company, Colgate-Palmolive Company, ConAgra Foods, Inc., General Mills, Inc., The Hershey Company, Kellogg Company, Kimberly-Clark Corporation, Kraft Foods Group, Inc., The Kraft Heinz Company, Lorillard, Inc., Mondelēz International, Inc., PepsiCo, Inc. and Reynolds American Inc.
Note - On October 1, 2012, Kraft Foods Inc. (KFT) spun off Kraft Foods Group, Inc. (KRFT) to its shareholders and then changed its name from Kraft Foods Inc. to Mondelēz International, Inc. (MDLZ). On July 2, 2015, Kraft Foods Group, Inc. merged with and into a wholly owned subsidiary of H.J. Heinz Holding Corporation, which was renamed The Kraft Heinz Company (KHC). On June 12, 2015, Reynolds American Inc. (RAI) acquired Lorillard, Inc. (LO).
12
Market and Dividend Information
The principal stock exchange on which Altria Group, Inc.’s common stock (par value $0.33 1/3 per share) is listed is the New York Stock Exchange. At February 12, 2016, there were approximately 71,000 holders of record of Altria Group, Inc.’s common stock.
The table below discloses the high and low sales prices and cash dividends declared per share for Altria Group, Inc.’s common stock as reported by the New York Stock Exchange.
|
Price Per Share
|
Cash Dividends Declared Per Share
|
||||||||||
|
High
|
Low
|
||||||||||
|
2015:
|
|||||||||||
|
Fourth Quarter
|
$
|
61.74
|
|
$
|
53.68
|
|
$
|
0.565
|
|
||
|
Third Quarter
|
$
|
56.39
|
|
$
|
47.41
|
|
$
|
0.565
|
|
||
|
Second Quarter
|
$
|
52.99
|
|
$
|
47.31
|
|
$
|
0.52
|
|
||
|
First Quarter
|
$
|
56.70
|
|
$
|
48.52
|
|
$
|
0.52
|
|
||
|
2014:
|
|||||||||||
|
Fourth Quarter
|
$
|
51.67
|
|
$
|
44.59
|
|
$
|
0.52
|
|
||
|
Third Quarter
|
$
|
46.20
|
|
$
|
40.26
|
|
$
|
0.52
|
|
||
|
Second Quarter
|
$
|
43.38
|
|
$
|
37.13
|
|
$
|
0.48
|
|
||
|
First Quarter
|
$
|
38.38
|
|
$
|
33.80
|
|
$
|
0.48
|
|
||
Issuer Purchases of Equity Securities During the Quarter Ended December 31, 2015
The Board of Directors authorized a
$1.0 billion
share repurchase program in July 2015 (the “July 2015 share repurchase program”), which Altria Group, Inc. expects to complete by the end of 2016. The timing of share repurchases under the July 2015 share repurchase program depends upon marketplace conditions and other factors, and the program remains subject to the discretion of the Board of Directors.
Altria Group, Inc.’s share repurchase activity for each of the three months in the period ended December 31,
2015
, was as follows:
|
Period
|
Total Number of Shares Purchased
(1)
|
Average Price Paid Per Share
|
Total Number of Shares Purchased as Part of Publicly Announced Plans or Programs
|
Approximate Dollar Value of Shares that May Yet be Purchased Under the Plans or Programs
|
||||||||||
|
October 1- October 31, 2015
|
1,811
|
|
$
|
61.14
|
|
—
|
|
$
|
1,000,000,000
|
|
||||
|
November 1- November 30, 2015
|
1,977
|
|
$
|
54.03
|
|
—
|
|
$
|
1,000,000,000
|
|
||||
|
December 1- December 31, 2015
|
613,973
|
|
$
|
57.65
|
|
612,000
|
|
$
|
964,710,531
|
|
||||
|
For the Quarter Ended December 31, 2015
|
617,761
|
|
$
|
57.65
|
|
|||||||||
|
(1)
|
The total number of shares purchased include (a) shares purchased under the July 2015 share repurchase program (which totaled 612,000 shares in December) and (b) shares withheld by Altria Group, Inc. in an amount equal to the statutory withholding taxes for holders who vested in restricted stock and restricted stock units, and forfeitures of restricted stock for which consideration was paid in connection with termination of employment of certain employees (which totaled 1,811 shares in October, 1,977 shares in November and 1,973 shares in December).
|
13
(in millions of dollars, except per share and employee data)
|
2015
|
2014
|
2013
|
2012
|
2011
|
|||||||||||||||
|
Summary of Operations:
|
|||||||||||||||||||
|
Net revenues
|
$
|
25,434
|
|
$
|
24,522
|
|
$
|
24,466
|
|
$
|
24,618
|
|
$
|
23,800
|
|
||||
|
Cost of sales
|
7,740
|
|
7,785
|
|
7,206
|
|
7,937
|
|
7,680
|
|
|||||||||
|
Excise taxes on products
|
6,580
|
|
6,577
|
|
6,803
|
|
7,118
|
|
7,181
|
|
|||||||||
|
Operating income
|
8,361
|
|
7,620
|
|
8,084
|
|
7,253
|
|
6,068
|
|
|||||||||
|
Interest and other debt expense, net
|
817
|
|
808
|
|
1,049
|
|
1,126
|
|
1,216
|
|
|||||||||
|
Earnings from equity investment in SABMiller
|
757
|
|
1,006
|
|
991
|
|
1,224
|
|
730
|
|
|||||||||
|
Earnings before income taxes
|
8,078
|
|
7,774
|
|
6,942
|
|
6,477
|
|
5,582
|
|
|||||||||
|
Pre-tax profit margin
|
31.8
|
%
|
31.7
|
%
|
28.4
|
%
|
26.3
|
%
|
23.5
|
%
|
|||||||||
|
Provision for income taxes
|
2,835
|
|
2,704
|
|
2,407
|
|
2,294
|
|
2,189
|
|
|||||||||
|
Net earnings
|
5,243
|
|
5,070
|
|
4,535
|
|
4,183
|
|
3,393
|
|
|||||||||
|
Net earnings attributable to Altria Group, Inc.
|
5,241
|
|
5,070
|
|
4,535
|
|
4,180
|
|
3,390
|
|
|||||||||
|
Basic and Diluted EPS — net earnings attributable to Altria Group, Inc.
|
2.67
|
|
2.56
|
|
2.26
|
|
2.06
|
|
1.64
|
|
|||||||||
|
Dividends declared per share
|
2.17
|
|
2.00
|
|
1.84
|
|
1.70
|
|
1.58
|
|
|||||||||
|
Weighted average shares (millions) — Basic and Diluted
|
1,961
|
|
1,978
|
|
1,999
|
|
2,024
|
|
2,064
|
|
|||||||||
|
Capital expenditures
|
229
|
|
163
|
|
131
|
|
124
|
|
105
|
|
|||||||||
|
Depreciation
|
204
|
|
188
|
|
192
|
|
205
|
|
233
|
|
|||||||||
|
Property, plant and equipment, net
|
1,982
|
|
1,983
|
|
2,028
|
|
2,102
|
|
2,216
|
|
|||||||||
|
Inventories
|
2,031
|
|
2,040
|
|
1,879
|
|
1,746
|
|
1,779
|
|
|||||||||
|
Total assets
|
32,535
|
|
34,475
|
|
34,859
|
|
35,329
|
|
36,751
|
|
|||||||||
|
Long-term debt
|
12,915
|
|
13,693
|
|
13,992
|
|
12,419
|
|
13,089
|
|
|||||||||
|
Total debt
|
12,919
|
|
14,693
|
|
14,517
|
|
13,878
|
|
13,689
|
|
|||||||||
|
Total stockholders’ equity
|
2,873
|
|
3,010
|
|
4,118
|
|
3,170
|
|
3,683
|
|
|||||||||
|
Common dividends declared as a % of Basic and Diluted EPS
|
81.3
|
%
|
78.1
|
%
|
81.4
|
%
|
82.5
|
%
|
96.3
|
%
|
|||||||||
|
Book value per common share outstanding
|
1.47
|
|
1.53
|
|
2.07
|
|
1.58
|
|
1.80
|
|
|||||||||
|
Market price per common share — high/low
|
61.74-47.31
|
|
51.67-33.80
|
|
38.58-31.85
|
|
36.29-28.00
|
|
30.40-23.20
|
|
|||||||||
|
Closing price per common share at year end
|
58.21
|
|
49.27
|
|
38.39
|
|
31.44
|
|
29.65
|
|
|||||||||
|
Price/earnings ratio at year end — Basic and Diluted
|
22
|
|
19
|
|
17
|
|
15
|
|
18
|
|
|||||||||
|
Number of common shares outstanding at year end (millions)
|
1,960
|
|
1,971
|
|
1,993
|
|
2,010
|
|
2,044
|
|
|||||||||
|
Approximate number of employees
|
8,800
|
|
9,000
|
|
9,000
|
|
9,100
|
|
9,900
|
|
|||||||||
The Selected Financial Data should be read in conjunction with Item 7 and Item 8.
14
The following discussion should be read in conjunction with the other sections of this Annual Report on Form 10-K, including the consolidated financial statements and related notes contained in Item 8, and the discussion of cautionary factors that may affect future results in Item 1A.
Description of the Company
At
December 31, 2015
, Altria Group, Inc.’s wholly-owned subsidiaries included PM USA, which is engaged predominantly in the manufacture and sale of cigarettes in the United States; Middleton, which is engaged in the manufacture and sale of machine-made large cigars and pipe tobacco, and is a wholly-owned subsidiary of PM USA; and UST, which through its wholly-owned subsidiaries, including USSTC and Ste. Michelle, is engaged in the manufacture and sale of smokeless tobacco products and wine. Altria Group, Inc.’s other operating companies included Nu Mark, a wholly-owned subsidiary that is engaged in the manufacture and sale of innovative tobacco products, and PMCC, a wholly-owned subsidiary that maintains a portfolio of finance assets, substantially all of which are leveraged leases. Other Altria Group, Inc. wholly-owned subsidiaries included Altria Group Distribution Company, which provides sales, distribution and consumer engagement services to certain Altria Group, Inc. operating subsidiaries, and Altria Client Services LLC, which provides various support services in areas such as legal, regulatory, finance, human resources and external affairs, to Altria Group, Inc. and its subsidiaries. In addition, Nu Mark and Middleton use third-party contract manufacturing arrangements in the manufacture of their products. Altria Group, Inc.’s access to the operating cash flows of its wholly-owned subsidiaries consists of cash received from the payment of dividends and distributions, and the payment of interest on intercompany loans by its subsidiaries. At
December 31, 2015
, Altria Group, Inc.’s principal wholly-owned subsidiaries were not limited by long-term debt or other agreements in their ability to pay cash dividends or make other distributions with respect to their equity interests.
At
December 31, 2015
, Altria Group, Inc. also held approximately
27%
of the economic and voting interest of SABMiller, which Altria Group, Inc. accounts for under the equity method of accounting. Altria Group, Inc. receives cash dividends on its interest in SABMiller if and when SABMiller pays such dividends. On November 11, 2015, AB InBev announced its firm offer to effect a business combination with SABMiller in a cash and stock transaction. For further discussion, see
Note 6
.
Altria Group, Inc.’s reportable segments are smokeable products, smokeless products and wine. The financial services and the innovative tobacco products businesses are included in an all other category due to the continued reduction of the lease portfolio of PMCC and the relative financial contribution of Altria
Group, Inc.’s innovative tobacco products businesses to Altria Group, Inc.’s consolidated results.
Executive Summary
The following executive summary is intended to provide significant highlights of the Discussion and Analysis that follows.
Consolidated Results of Operations
The changes in Altria Group, Inc.’s net earnings and diluted earnings per share (“EPS”) attributable to Altria Group, Inc. for the year ended
December 31, 2015
, from the year ended
December 31, 2014
, were due primarily to the following:
|
(in millions, except per share data)
|
Net
Earnings
|
|
Diluted
EPS
|
|
|||
|
For the year ended December 31, 2014
|
$
|
5,070
|
|
$
|
2.56
|
|
|
|
2014 NPM Adjustment Items
|
(56
|
)
|
(0.03
|
)
|
|||
|
2014 Asset impairment, exit, integration and acquisition-related costs
|
14
|
|
0.01
|
|
|||
|
2014 Tobacco and health litigation items
|
28
|
|
0.01
|
|
|||
|
2014 SABMiller special items
|
17
|
|
0.01
|
|
|||
|
2014 Loss on early extinguishment of debt
|
28
|
|
0.02
|
|
|||
|
2014 Tax items
|
(14
|
)
|
(0.01
|
)
|
|||
|
Subtotal 2014 special items
|
17
|
|
0.01
|
|
|||
|
2015 NPM Adjustment Items
|
51
|
|
0.03
|
|
|||
|
2015 Asset impairment, exit and integration costs
|
(9
|
)
|
—
|
|
|||
|
2015 Tobacco and health litigation items
|
(94
|
)
|
(0.05
|
)
|
|||
|
2015 SABMiller special items
|
(82
|
)
|
(0.04
|
)
|
|||
|
2015 Loss on early extinguishment of debt
|
(143
|
)
|
(0.07
|
)
|
|||
|
2015 Other income, net
|
3
|
|
—
|
|
|||
|
2015 Tax items
|
11
|
|
—
|
|
|||
|
Subtotal 2015 special items
|
(263
|
)
|
(0.13
|
)
|
|||
|
Fewer shares outstanding
|
—
|
|
0.02
|
|
|||
|
Change in tax rate
|
(53
|
)
|
(0.03
|
)
|
|||
|
Operations
|
470
|
|
0.24
|
|
|||
|
For the year ended December 31, 2015
|
$
|
5,241
|
|
$
|
2.67
|
|
|
See the discussion of events affecting the comparability of statement of earnings amounts in the Consolidated Operating Results section of the following Discussion and Analysis.
|
▪
|
Fewer Shares Outstanding:
Fewer shares outstanding during 2015 compared with 2014 were due primarily to shares repurchased by Altria Group, Inc. under its share repurchase programs.
|
|
▪
|
Change in Tax Rate:
The change in tax rate was due primarily to decreased recognition of foreign tax credits associated with SABMiller dividends.
|
|
▪
|
Operations:
The increase of
$470 million
in operations shown in the table above was due primarily to the following:
|
|
▪
|
higher income from the smokeable products and smokeless products segments; and
|
|
▪
|
lower interest and other debt expense, net;
|
15
partially offset by:
|
▪
|
lower earnings from Altria’s equity investment in SABMiller.
|
For further details, see the Consolidated Operating Results and Operating Results by Business Segment sections of the following Discussion and Analysis.
2016 Forecasted Results
In January 2016, Altria Group, Inc. forecasted that its 2016 full-year adjusted diluted EPS growth rate is expected to be in the range of 7% to 9% over 2015 full-year adjusted diluted EPS. This forecasted growth rate excludes the net expenses in the table below. Altria Group, Inc. expects that its 2016 full-year effective tax rate on operations will be 35.3%. This forecast does not include any impact from the anticipated AB InBev and SABMiller business combination, as the transaction remains subject to certain approvals and the closing date has not yet been determined. In addition, the factors described in Item 1A represent continuing risks to this forecast.
Expense (Income), Net Excluded from Adjusted Diluted EPS
|
2016
|
|
2015
|
|
||||
|
NPM Adjustment Items
|
$
|
—
|
|
$
|
(0.03
|
)
|
|
|
Asset impairment, exit and implementation costs
1
|
0.05
|
|
—
|
|
|||
|
Tobacco and health litigation items
|
—
|
|
0.05
|
|
|||
|
SABMiller special items
|
—
|
|
0.04
|
|
|||
|
Loss on early extinguishment of debt
|
—
|
|
0.07
|
|
|||
|
$
|
0.05
|
|
$
|
0.13
|
|
||
1
Represents restructuring charges, substantially all of which are expected to be recorded in the first quarter of 2016 in connection with the productivity initiative announced in January 2016. For further discussion of the productivity initiative, see Note 21.
Subsequent Event
to the consolidated financial statements in Item 8.
Altria Group, Inc. reports its financial results in accordance with accounting principles generally accepted in the United States of America (“U.S. GAAP”). Altria Group, Inc.’s management reviews certain financial results, including diluted EPS, on an adjusted basis, which excludes certain income and expense items that management believes are not part of underlying operations. These items may include, for example, loss on early extinguishment of debt, restructuring charges, SABMiller special items, certain tax items, charges associated with tobacco and health litigation items, and settlements of, and determinations made in connection with, disputes with certain states and territories related to the NPM adjustment provision under the MSA (such settlements and determinations are referred to collectively as “NPM Adjustment Items” and are more fully described in
Health Care Cost Recovery Litigation - NPM Adjustment Disputes
in
Note 18
). Altria Group, Inc.’s management does not view any of these special items to be part of Altria Group, Inc.’s sustainable results as they may be highly variable, are difficult to predict and can distort underlying business trends and results. Altria Group, Inc.’s management also reviews income tax rates on an adjusted basis. Altria
Group, Inc.’s effective tax rate on operations may exclude certain tax items from its reported effective tax rate. Altria Group, Inc.’s management believes that adjusted financial measures provide useful insight into underlying business trends and results and provide a more meaningful comparison of year-over-year results. Adjusted financial measures are used by management and regularly provided to Altria Group, Inc.’s chief operating decision maker for planning, forecasting and evaluating business and financial performance, including allocating resources and evaluating results relative to employee compensation targets. These adjusted financial measures are not consistent with U.S. GAAP and may not be calculated the same as similarly titled measures used by other companies. These adjusted financial measures should thus be considered as supplemental in nature and not considered in isolation or as a substitute for the related financial information prepared in accordance with U.S. GAAP.
Altria Group, Inc.’s full-year adjusted diluted EPS guidance and full-year forecast for its effective tax rate on operations exclude the impact of certain income and expense items, including those items noted in the preceding paragraph. Altria Group, Inc.’s management cannot estimate on a forward-looking basis the impact of these items on Altria Group, Inc.’s reported diluted EPS and reported effective tax rate because these items, which could be significant, are difficult to predict and may be highly variable. As a result, Altria Group, Inc. does not provide a corresponding U.S. GAAP measure for, or reconciliation to, its adjusted diluted EPS guidance or its forecast for its effective tax rate on operations.
Discussion and Analysis
Critical Accounting Policies and Estimates
Note 2
includes a summary of the significant accounting policies and methods used in the preparation of Altria Group, Inc.’s consolidated financial statements. In most instances, Altria Group, Inc. must use an accounting policy or method because it is the only policy or method permitted under U.S. GAAP.
The preparation of financial statements includes the use of estimates and assumptions that affect the reported amounts of assets and liabilities, the disclosure of contingent liabilities at the dates of the financial statements and the reported amounts of net revenues and expenses during the reporting periods. If actual amounts are ultimately different from previous estimates, the revisions are included in Altria Group, Inc.’s consolidated results of operations for the period in which the actual amounts become known. Historically, the aggregate differences, if any, between Altria Group, Inc.’s estimates and actual amounts in any year have not had a significant impact on its consolidated financial statements.
The following is a review of the more significant assumptions and estimates, as well as the accounting policies and methods, used in the preparation of Altria Group, Inc.’s consolidated financial statements:
16
▪
Consolidation:
The consolidated financial statements include Altria Group, Inc., as well as its wholly-owned and majority-owned subsidiaries. Investments in which Altria Group, Inc. has the ability to exercise significant influence are accounted for under the equity method of accounting. All intercompany transactions and balances have been eliminated.
▪
Revenue Recognition:
Altria Group, Inc.’s businesses recognize revenues, net of sales incentives and sales returns, and including shipping and handling charges billed to customers, upon shipment of goods when title and risk of loss pass to customers. Payments received in advance of revenue recognition are deferred and recorded in other accrued liabilities until revenue is recognized. Altria Group, Inc.’s businesses also include excise taxes billed to customers in net revenues. Shipping and handling costs are classified as part of cost of sales.
▪
Depreciation, Amortization, Impairment Testing and Asset Valuation:
Altria Group, Inc. depreciates property, plant and equipment and amortizes its definite-lived intangible assets using the straight-line method over the estimated useful lives of the assets. Machinery and equipment are depreciated over periods up to 25 years, and buildings and building improvements over periods up to 50 years. Definite-lived intangible assets are amortized over their estimated useful lives up to 25 years.
Altria Group, Inc. reviews long-lived assets, including definite-lived intangible assets, for impairment whenever events or changes in business circumstances indicate that the carrying value of the assets may not be fully recoverable. Altria Group, Inc. performs undiscounted operating cash flow analyses to determine if an impairment exists. These analyses are affected by general economic conditions and projected growth rates. For purposes of recognition and measurement of an impairment for assets held for use, Altria Group, Inc. groups assets and liabilities at the lowest level for which cash flows are separately identifiable. If an impairment is determined to exist, any related impairment loss is calculated based on fair value. Impairment losses on assets to be disposed of, if any, are based on the estimated proceeds to be received, less costs of disposal. Altria Group, Inc. also reviews the estimated remaining useful lives of long-lived assets whenever events or changes in business circumstances indicate the lives may have changed.
Goodwill and indefinite-lived intangible assets recorded by Altria Group, Inc. at
December 31, 2015
relate primarily to the acquisitions of Green Smoke in 2014, UST in 2009 and Middleton in 2007. Altria Group, Inc. conducts a required annual review of goodwill and indefinite-lived intangible assets for potential impairment, and more frequently if an event occurs or circumstances change that would require Altria Group, Inc. to perform an interim review. If the carrying value of goodwill exceeds its fair value, which is determined using discounted cash flows, goodwill is considered impaired. The amount of impairment loss is measured as the difference between the carrying value and the implied fair value. If the carrying value of an indefinite-lived intangible asset exceeds its fair value,
which is determined using discounted cash flows, the intangible asset is considered impaired and is reduced to fair value.
Goodwill and indefinite-lived intangible assets, by reporting unit at
December 31, 2015
were as follows:
|
(in millions)
|
Goodwill
|
|
Indefinite-Lived
Intangible Assets
|
|
|||
|
Cigarettes
|
$
|
—
|
|
$
|
2
|
|
|
|
Smokeless products
|
5,023
|
|
8,801
|
|
|||
|
Cigars
|
77
|
|
2,640
|
|
|||
|
Wine
|
74
|
|
258
|
|
|||
|
E-vapor
|
111
|
|
10
|
|
|||
|
Total
|
$
|
5,285
|
|
$
|
11,711
|
|
|
During
2015
,
2014
and
2013
, Altria Group, Inc. completed its quantitative annual impairment test of goodwill and indefinite-lived intangible assets, and no impairment charges resulted.
At December 31, 2015:
|
▪
|
the estimated fair values of all reporting units substantially exceeded their carrying values;
|
|
▪
|
the estimated fair values of the indefinite-lived intangible assets within the cigars and wine reporting units substantially exceeded their carrying values; and
|
|
▪
|
in the smokeless products reporting unit, the estimated fair value of the
Copenhagen
trademark
substantially exceeded its carrying value, while the estimated fair values of the
Skoal
trademark
and certain other smokeless products trademarks (primarily
Red Seal
and
Husky
) did not substantially exceed their carrying values.
|
At December 31, 2015, the estimated fair value of the
Skoal
trademark exceeded its carrying value of $3.9 billion by approximately 15%, and the estimated fair value of certain other smokeless products trademarks (primarily
Red Seal
and
Husky
) exceeded their collective carrying value of $921 million by approximately 10%. The 2015 results for
Skoal
continue to be impacted by a lower category growth rate and increased competitive activity. USSTC continues to implement strategies to enhance
Skoal
’s equity and to invest more efficiently in the brand. USSTC expects these strategies to improve
Skoal
’s profitability over the long term.
Red Seal
and
Husky
continue to be impacted by lower levels of promotional support on these brands, increased competitive activity in the discount category and sustained growth in popular priced products.
In 2015, Altria Group, Inc. used an income approach to estimate the fair values of substantially all of its reporting units and indefinite-lived intangible assets. The income approach reflects the discounting of expected future cash flows to their present value at a rate of return that incorporates the risk-free rate for the use of those funds, the expected rate of inflation and the risks associated with realizing expected future cash flows. The average discount rate used in performing the valuations was approximately 10%.
In performing the 2015 discounted cash flow analysis, Altria Group, Inc. made various judgments, estimates and assumptions, the most significant of which were volume,
17
income, growth rates and discount rates. The analysis incorporated assumptions used in Altria Group, Inc.’s long-term financial forecast, which is used by Altria Group, Inc.’s management to evaluate business and financial performance, including allocating resources and evaluating results relative to setting employee compensation targets. The assumptions incorporated the highest and best use of Altria Group, Inc.’s indefinite-lived intangible assets and also included perpetual growth rates for periods beyond the long-term financial forecast. The perpetual growth rate used in performing all of the valuations was 2%. Fair value calculations are sensitive to changes in these estimates and assumptions, some of which relate to broader macroeconomic conditions outside of Altria Group, Inc.’s control.
Although Altria Group, Inc.’s discounted cash flow analysis is based on assumptions that are considered reasonable and based on the best available information at the time that the discounted cash flow analysis is developed, there is significant
judgment used in determining future cash flows. The following factors have the most potential to impact expected future cash flows and, therefore, Altria Group, Inc.’s impairment conclusions: general economic conditions; federal, state and local regulatory developments; changes in category growth rates as a result of changing consumer preferences; success of planned product expansions; competitive activity; and tobacco-related taxes. For further discussion of these factors, see
Operating Results by Business Segment
-
Tobacco Space
-
Business Environment
below.
While Altria Group, Inc.’s management believes that the estimated fair values of each reporting unit and indefinite-lived intangible asset are reasonable, actual performance in the short-term or long-term could be significantly different from forecasted performance, which could result in impairment charges in future periods.
For additional information on goodwill and other intangible assets, see
Note 4
.
▪
Marketing Costs:
Altria Group, Inc.’s businesses promote their products with consumer engagement programs, consumer incentives and trade promotions. Such programs include discounts, coupons, rebates, in-store display incentives, event marketing and volume-based incentives. Consumer engagement programs are expensed as incurred. Consumer incentive and trade promotion activities are recorded as a reduction of revenues, a portion of which is based on amounts estimated as being due to wholesalers, retailers and consumers at the end of a period, based principally on historical volume, utilization and redemption rates. For interim reporting purposes, consumer engagement programs and certain consumer incentive expenses are charged to operations as a percentage of sales, based on estimated sales and related expenses for the full year.
▪
Contingencies:
As discussed in
Note 18
and Item 3, legal proceedings covering a wide range of matters are pending or threatened in various United States and foreign jurisdictions against Altria Group, Inc. and its subsidiaries, including PM
USA and UST and its subsidiaries, as well as their respective indemnitees. In 1998, PM USA and certain other U.S. tobacco product manufacturers entered into the MSA with 46 states and various other governments and jurisdictions to settle asserted and unasserted health care cost recovery and other claims. PM USA and certain other U.S. tobacco product manufacturers had previously entered into agreements to settle similar claims brought by Mississippi, Florida, Texas and Minnesota (together with the MSA, the “State Settlement Agreements”). PM USA’s portion of ongoing adjusted payments and legal fees is based on its relative share of the settling manufacturers’ domestic cigarette shipments, including roll-your-own cigarettes, in the year preceding that in which the payment is due. PM USA, USSTC and Middleton were also subject to payment obligations imposed by FETRA. The FETRA payment obligations expired after the third quarter of 2014. In addition, in June 2009, PM USA and USSTC became subject to quarterly user fees imposed by the FDA as a result of the FSPTCA. Payments under the State Settlement Agreements and the FDA user fees are based on variable factors, such as volume, operating income, market share and inflation, depending on the subject payment. Altria Group, Inc.’s subsidiaries account for the cost of the State Settlement Agreements, FETRA and FDA user fees as a component of cost of sales. As a result of the State Settlement Agreements, FETRA and FDA user fees, Altria Group, Inc.’s subsidiaries recorded approximately $4.8 billion, $4.9 billion and $4.4 billion of charges to cost of sales for the years ended December 31, 2015, 2014 and 2013, respectively. The 2015, 2014 and 2013 amounts included reductions to cost of sales of $97 million, $43 million and $664 million, respectively, related to the NPM Adjustment Items discussed further below and in
Health Care Cost Recovery Litigation - NPM Adjustment Disputes
in
Note 18
. In addition, the 2015 and 2014 amounts reflected decreases in the charge to cost of sales of approximately $300 million and $100 million, respectively, for the expiration of the obligations imposed by FETRA after the third quarter of 2014.
Altria Group, Inc. and its subsidiaries record provisions in the consolidated financial statements for pending litigation when they determine that an unfavorable outcome is probable and the amount of the loss can be reasonably estimated. At the present time, while it is reasonably possible that an unfavorable outcome in a case may occur, except to the extent discussed in
Note 18
and Item 3: (i) management has concluded that it is not probable that a loss has been incurred in any of the pending tobacco-related cases; (ii) management is unable to estimate the possible loss or range of loss that could result from an unfavorable outcome in any of the pending tobacco-related cases; and (iii) accordingly, management has not provided any amounts in the consolidated financial statements for unfavorable outcomes, if any. Litigation defense costs are expensed as incurred and included in marketing, administration and research costs on the consolidated statements of earnings.
▪
Employee Benefit Plans:
As discussed in
Note 16
.
Benefit Plans
to the consolidated financial statements in Item 8 (“
Note
18
16
”), Altria Group, Inc. provides a range of benefits to its employees and retired employees, including pension, postretirement health care and postemployment benefits. Altria Group, Inc. records annual amounts relating to these plans based on calculations specified by U.S. GAAP, which include various actuarial assumptions as to discount rates, assumed rates of return on plan assets, mortality, compensation increases, turnover rates and health care cost trend rates. Altria Group, Inc. reviews its actuarial assumptions on an annual basis and makes modifications to the assumptions based on current rates and trends when it is deemed appropriate to do so. Any effect of the modifications is generally amortized over future periods.
Altria Group, Inc. recognizes the funded status of its defined benefit pension and other postretirement plans on the consolidated balance sheet and records as a component of other comprehensive earnings (losses), net of deferred income taxes, the gains or losses and prior service costs or credits that have not been recognized as components of net periodic benefit cost. The gains or losses and prior service costs or credits recorded as components of other comprehensive earnings (losses) are subsequently amortized into net periodic benefit cost in future years.
At
December 31, 2015
, Altria Group, Inc. changed the approach used to estimate the service and interest cost components of net periodic benefit costs for Altria Group, Inc.’s pension and postretirement plans. In 2015 and prior years, Altria Group, Inc. estimated the service and interest cost components using a single weighted-average discount rate derived from the yield curve used to measure the pension and postretirement plans benefit obligations. Beginning in 2016, Altria Group, Inc. will use a spot rate approach in the estimation of these components of net periodic benefit costs by applying the specific spot rates along the yield curve to the relevant projected cash flows, as Altria Group, Inc. believes that this approach provides a more precise estimate of service and interest costs. Altria Group, Inc. is accounting for this change prospectively as a change in accounting estimate. This change will not affect the measurement of Altria Group, Inc.’s pension and postretirement benefit obligations as the change in the service and interest costs will be offset by a corresponding change in actuarial gains/losses.
At December 31, 2015, Altria Group, Inc.’s discount rate assumptions for its pension and postretirement plans obligations increased to 4.4% from 4.1% and 4.0%, respectively, at December 31, 2014. Altria Group, Inc. presently anticipates a decrease of approximately $160 million in its 2016 pre-tax pension and postretirement expense versus 2015, not including amounts in each year, if any, related to termination, settlement and curtailment. This anticipated decrease is due primarily to the impact of the change in approach used to estimate service and interest costs ($90 million) and the impact of the higher discount rate. Assuming no change to the shape of the yield curve, a 50 basis point decrease in Altria Group, Inc.’s discount rates would increase Altria Group, Inc.’s pension and postretirement expense by approximately $50 million, and a 50 basis point increase in Altria Group, Inc.’s discount rates would
decrease Altria Group, Inc.’s pension and postretirement expense by approximately $43 million. Similarly, a 50 basis point decrease (increase) in the expected return on plan assets would increase (decrease) Altria Group, Inc.’s pension expense by approximately $35 million. See
Note 16
for a sensitivity discussion of the assumed health care cost trend rates.
▪
Income Taxes:
Significant judgment is required in determining income tax provisions and in evaluating tax positions. Altria Group, Inc.’s deferred tax assets and liabilities are determined based on the difference between the financial statement and tax bases of assets and liabilities, using enacted tax rates in effect for the year in which the differences are expected to reverse. Altria Group, Inc. records a valuation allowance when it is more-likely-than-not that some portion or all of a deferred tax asset will not be realized.
Altria Group, Inc. recognizes a benefit for uncertain tax positions when a tax position taken or expected to be taken in a tax return is more-likely-than-not to be sustained upon examination by taxing authorities. The amount recognized is measured as the largest amount of benefit that is greater than 50% likely of being realized upon ultimate settlement. Altria Group, Inc. recognizes accrued interest and penalties associated with uncertain tax positions as part of the provision for income taxes on its consolidated statements of earnings.
As discussed in
Note 14
.
Income Taxes
to the consolidated financial statements in Item 8 (“
Note 14
”), Altria Group, Inc. recognized income tax benefits and charges in the consolidated statements of earnings during
2015
,
2014
and
2013
as a result of various tax events.
▪
Leasing:
Substantially all of PMCC’s net revenues in
2015
related to income on leveraged leases and related gains on asset sales. Income attributable to leveraged leases is initially recorded as unearned income, which is included in the line item finance assets, net, on Altria Group, Inc.’s consolidated balance sheets and subsequently recognized as revenue over the terms of the respective leases at constant after-tax rates of return on the positive net investment balances. As discussed in
Note 7
, PMCC lessees are affected by bankruptcy filings, credit rating changes and financial market conditions.
PMCC’s investment in leases is included in the line item finance assets, net, on the consolidated balance sheets as of
December 31, 2015
and
2014
. At
December 31, 2015
, PMCC’s
net finance receivables of approximately $1.3 billion, which are included in finance assets, net, on Altria Group, Inc.’s consolidated balance sheet, consisted of rents receivable ($2.1 billion) and the residual value of assets under lease ($0.7 billion), reduced by third-party nonrecourse debt ($1.2 billion) and unearned income ($0.3 billion). The repayment of the nonrecourse debt is collateralized by lease payments receivable and the leased property, and is nonrecourse to the general assets of PMCC. As required by U.S. GAAP, the third-party nonrecourse debt has been offset against the related rents receivable and has been presented on a net basis within finance assets, net, on Altria Group, Inc.’s consolidated balance sheets.
19
Finance assets, net, of $1.2 billion at
December 31, 2015
also included an allowance for losses.
Estimated residual values represent PMCC’s estimate at lease inception as to the fair values of assets under lease at the end of the non-cancelable lease terms. The estimated residual values are reviewed at least annually by PMCC’s management, which includes analysis of a number of factors, including activity in the relevant industry. If necessary, revisions are recorded to reduce the residual values. In 2015 and 2014, PMCC’s review of estimated residual values resulted in a decrease of $65 million and $63 million, respectively, to unguaranteed residual values. These decreases in unguaranteed residual values resulted in a reduction to PMCC’s net revenues of
$41 million
and
$26 million
in 2015 and 2014, respectively. There were no such adjustments in 2013.
PMCC considers rents receivable past due when they are beyond the grace period of their contractual due date. PMCC stops recording income (“non-accrual status”) on rents receivable when contractual payments become 90 days past due or earlier if management believes there is significant uncertainty of collectability of rent payments, and resumes recording income when collectability of rent payments is reasonably certain. Payments received on rents receivable that are on non-accrual status are used to reduce the rents receivable balance. Write-offs to the allowance for losses are recorded when amounts are deemed to be uncollectible. There were no rents receivable on non-accrual status at
December 31, 2015
.
To the extent that rents receivable due to PMCC may be uncollectible, PMCC records an allowance for losses against its finance assets. Losses on such leases are recorded when probable and estimable. PMCC regularly performs a systematic assessment of each individual lease in its portfolio to determine potential credit or collection issues that might indicate impairment. Impairment takes into consideration both the probability of default and the likelihood of recovery if default were to occur. PMCC considers both quantitative and qualitative factors of each investment when performing its assessment of the allowance for losses. For further discussion, see
Note 7
.
Consolidated Operating Results
|
|
For the Years Ended December 31,
|
||||||||||
|
(in millions)
|
2015
|
|
2014
|
|
2013
|
|
|||||
|
Net Revenues:
|
|||||||||||
|
Smokeable products
|
$
|
22,792
|
|
$
|
21,939
|
|
$
|
21,868
|
|
||
|
Smokeless products
|
1,879
|
|
1,809
|
|
1,778
|
|
|||||
|
Wine
|
692
|
|
643
|
|
609
|
|
|||||
|
All other
|
71
|
|
131
|
|
211
|
|
|||||
|
Net revenues
|
$
|
25,434
|
|
$
|
24,522
|
|
$
|
24,466
|
|
||
|
Excise Taxes on Products:
|
|||||||||||
|
Smokeable products
|
$
|
6,423
|
|
$
|
6,416
|
|
$
|
6,651
|
|
||
|
Smokeless products
|
133
|
|
138
|
|
130
|
|
|||||
|
Wine
|
24
|
|
23
|
|
22
|
|
|||||
|
Excise taxes on products
|
$
|
6,580
|
|
$
|
6,577
|
|
$
|
6,803
|
|
||
|
Operating Income:
|
|||||||||||
|
Operating companies income (loss):
|
|||||||||||
|
Smokeable products
|
$
|
7,569
|
|
$
|
6,873
|
|
$
|
7,063
|
|
||
|
Smokeless products
|
1,108
|
|
1,061
|
|
1,023
|
|
|||||
|
Wine
|
152
|
|
134
|
|
118
|
|
|||||
|
All other
|
(169
|
)
|
(185
|
)
|
157
|
|
|||||
|
Amortization of intangibles
|
(21
|
)
|
(20
|
)
|
(20
|
)
|
|||||
|
General corporate expenses
|
(237
|
)
|
(241
|
)
|
(235
|
)
|
|||||
|
Changes to Mondelēz and PMI
tax-related receivables/payables
|
(41
|
)
|
(2
|
)
|
(22
|
)
|
|||||
|
Operating income
|
$
|
8,361
|
|
$
|
7,620
|
|
$
|
8,084
|
|
||
As discussed further in
Note 15
, Altria Group, Inc.’s chief operating decision maker reviews operating companies income to evaluate the performance of, and allocate resources to, the segments. Operating companies income for the segments is defined as operating income before amortization of intangibles and general corporate expenses. Management believes it is appropriate to disclose this measure to help investors analyze the business performance and trends of the various business segments.
The following events that occurred during
2015
,
2014
and
2013
affected the comparability of statement of earnings amounts.
▪
NPM Adjustment Items:
For the years ended December 31, 2015, 2014 and 2013, pre-tax income for NPM Adjustment Items was recorded in Altria Group, Inc.’s consolidated statements of earnings as follows:
|
(in millions)
|
2015
|
|
2014
|
|
2013
|
|
|||||
|
Smokeable products segment
|
$
|
97
|
|
$
|
43
|
|
$
|
664
|
|
||
|
Interest and other debt expense, net
|
(13
|
)
|
47
|
|
—
|
|
|||||
|
Total
|
$
|
84
|
|
$
|
90
|
|
$
|
664
|
|
||
The amounts shown in the table above for the smokeable products segment were recorded by PM USA as reductions to costs of sales, which increased operating companies income in the smokeable products segment. For further discussion, see
Health
20
Care Cost Recovery Litigation - NPM Adjustment Disputes
in
Note 18
.
▪
Tobacco and Health Litigation Items:
For the years ended December 31, 2015, 2014 and 2013, pre-tax charges related to certain tobacco and health litigations items were recorded in Altria Group, Inc.’s consolidated statements of earnings as follows:
|
(in millions)
|
2015
|
|
2014
|
|
2013
|
|
|||||
|
Smokeable products segment
|
$
|
127
|
|
$
|
27
|
|
$
|
18
|
|
||
|
General corporate
|
—
|
|
15
|
|
—
|
|
|||||
|
Interest and other debt expense, net
|
23
|
|
2
|
|
4
|
|
|||||
|
Total
|
$
|
150
|
|
$
|
44
|
|
$
|
22
|
|
||
During 2015, PM USA recorded pre-tax charges in marketing, administration and research costs related to tobacco and health judgments in
seven
state
Engle
progeny lawsuits and
Schwarz
of
$59 million
and
$25 million
, respectively, as well as
$14 million
and $9 million, respectively, in interest costs related to these cases. Additionally in 2015, PM USA and certain other cigarette manufacturers reached an agreement to resolve approximately
415
pending federal
Engle
progeny cases. As a result of the agreement, PM USA recorded a pre-tax provision of approximately
$43 million
in marketing, administration and research costs. For further discussion, see
Smoking and Health Litigation
in
Note 18
.
During 2014, Altria Group, Inc. and PM USA recorded an aggregate pre-tax charge of $31 million in marketing, administration and research costs for the estimated costs of implementing the corrective communications remedy in connection with the federal government’s lawsuit against Altria Group, Inc. and PM USA. For further discussion, see
Health Care Cost Recovery Litigation - Federal Government’s Lawsuit
in
Note 18
.
▪
Asset Impairment, Exit, Integration and Acquisition-Related Costs:
Pre-tax asset impairment, exit, integration and acquisition-related costs for the years ended December 31, 2015, 2014 and 2013 were $11 million, $21 million and $11 million, respectively.
For 2014, these costs consisted primarily of integration and acquisition-related costs of $28 million related to the acquisition of Green Smoke, partially offset by a pre-tax gain of
$10 million
from the sale of PM USA’s Cabarrus, North Carolina manufacturing facility in 2014. For further discussion of the Green Smoke acquisition, see Note 3.
▪
Loss on Early Extinguishment of Debt:
During 2015 and 2013, Altria Group, Inc. completed debt tender offers to purchase for cash certain of its senior unsecured notes in aggregate principal amounts of
$0.8 billion
and
$2.1 billion
, respectively.
During 2014, UST redeemed in full its
$300 million
(aggregate principal amount)
5.75%
senior notes due 2018.
As a result of the Altria Group, Inc. debt tender offers and the UST debt redemption, pre-tax losses on early extinguishment of debt were recorded as follows:
|
(in millions)
|
2015
|
|
2014
|
|
2013
|
|
|||||
|
Premiums and fees
|
$
|
226
|
|
$
|
44
|
|
$
|
1,054
|
|
||
|
Write-off of unamortized debt discounts and debt issuance costs
|
2
|
|
—
|
|
30
|
|
|||||
|
Total
|
$
|
228
|
|
$
|
44
|
|
$
|
1,084
|
|
||
For further discussion, see Note 9.
Long-Term Debt
to the consolidated financial statements in Item 8 (“Note 9”).
▪
SABMiller Special Items:
Altria Group, Inc.’s earnings from its equity investment in SABMiller for 2015 included net pre-tax charges of $126 million, consisting primarily of Altria Group, Inc.’s share of SABMiller’s asset impairment charges.
▪
Tax Items:
Tax items for 2015 primarily included the reversal of tax reserves and associated interest due primarily to the closure in August 2015 of the Internal Revenue Service audit of Altria Group, Inc. and its consolidated subsidiaries’ 2007-2009 tax years, partially offset by a reversal of foreign tax credits primarily associated with SABMiller dividends. Tax items for 2014 included the reversal of tax accruals no longer required. Tax items for 2013 included the reversal of tax accruals no longer required and the recognition of previously unrecognized foreign tax credits primarily associated with SABMiller dividends. For further discussion, see
Note 14
.
2015 Compared with 2014
The following discussion compares consolidated operating results for the year ended
December 31, 2015
, with the year ended
December 31, 2014
.
Net revenues, which include excise taxes billed to customers, increased $912 million (3.7%), due primarily to higher net revenues in the smokeable products segment.
Cost of sales decreased $45 million (0.6%), due primarily to lower resolution expenses (due principally to the end of the federal tobacco quota buy-out payments after the third quarter of 2014) and higher NPM Adjustment Items in 2015, partially offset by higher manufacturing costs in the smokeable products and smokeless products segments.
Marketing, administration and research costs increased $169 million (6.7%), due primarily to higher costs in the smokeable products segment (which included higher tobacco and health litigation items).
Operating income increased $741 million (9.7%), due primarily to higher operating results from the smokeable products and smokeless products segments.
Interest and other debt expense, net, increased $9 million (1.1%), due primarily to interest income recorded during 2014 and the reversal of interest income recorded during 2015 as a result of the NPM Adjustment Items, and higher interest costs related to tobacco and health litigation items, mostly offset by
21
lower interest costs on debt as a result of debt refinancing activities in 2015 and 2014.
Earnings from Altria Group, Inc.’s equity investment in SABMiller, which decreased $249 million (24.8%), were negatively affected by SABMiller special items and unfavorable currency impacts from a stronger U.S. dollar.
Net earnings attributable to Altria Group, Inc. of $5,241 million increased $171 million (3.4%), due primarily to higher operating income, partially offset by lower earnings from Altria Group, Inc.’s equity investment in SABMiller and higher losses on early extinguishment of debt. Diluted and basic EPS attributable to Altria Group, Inc. of $2.67, each increased by 4.3% due to higher net earnings attributable to Altria Group, Inc. and fewer shares outstanding.
2014 Compared with 2013
The following discussion compares consolidated operating results for the year ended
December 31, 2014
, with the year ended
December 31, 2013
.
Net revenues, which include excise taxes billed to customers, were essentially unchanged, due primarily to higher net revenues in all reportable segments, offset by lower gains on asset sales in the financial services business.
Excise taxes on products decreased $226 million (3.3%), due primarily to lower smokeable products shipment volume.
Cost of sales increased $579 million (8.0%), due primarily to higher NPM Adjustment Items in 2013.
Marketing, administration and research costs increased $199 million (8.5%), due primarily to higher investment spending in the innovative tobacco products businesses, lower reductions to the allowance for losses in the financial services business and higher costs in the smokeable products segment.
Operating income decreased $464 million (5.7%), due primarily to lower operating results from the smokeable products segment (which reflected higher NPM Adjustment Items in 2013), higher investment spending in the innovative tobacco products businesses and lower income from the financial services business, partially offset by higher operating results from the smokeless products segment.
Interest and other debt expense, net, decreased $241 million (23.0%) due primarily to lower interest costs on debt as a result of debt maturities in 2013 and 2014, and debt refinancing activities during 2013, as well as interest income recorded in 2014 as a result of the NPM Adjustment Items.
Net earnings attributable to Altria Group, Inc. of $5,070 million increased $535 million (11.8%), due primarily to lower losses on early extinguishment of debt, lower interest and other debt expense, net, partially offset by lower operating income. Diluted and basic EPS attributable to Altria Group, Inc. of $2.56, each increased by 13.3% due to higher net earnings attributable to Altria Group, Inc. and fewer shares outstanding.
Operating Results by Business Segment
Tobacco Space
Business Environment
Summary
The United States tobacco industry faces a number of business and legal challenges that have adversely affected and may adversely affect the business and sales volume of our tobacco subsidiaries and our consolidated results of operations, cash flows or financial position. These challenges, some of which are discussed in more detail below, in Note 18, Item 1A and Item 3, include:
|
▪
|
pending and threatened litigation and bonding requirements;
|
|
▪
|
the requirement to issue “corrective statements” in various media in connection with the federal government’s lawsuit;
|
|
▪
|
restrictions and requirements imposed by the FSPTCA, and restrictions and requirements that have been, and in the future will be, imposed by the FDA;
|
|
▪
|
actual and proposed excise tax increases, as well as changes in tax structures and tax stamping requirements;
|
|
▪
|
bans and restrictions on tobacco use imposed by governmental entities and private establishments and employers;
|
|
▪
|
other federal, state and local government actions, including:
|
|
▪
|
increases in the minimum age to purchase tobacco products above the current federal minimum age of 18;
|
|
▪
|
restrictions on the sale of tobacco products by certain retail establishments, the sale of certain tobacco products with certain characterizing flavors and the sale of tobacco products in certain package sizes;
|
|
▪
|
additional restrictions on the advertising and promotion of tobacco products;
|
|
▪
|
other actual and proposed tobacco product legislation and regulation; and
|
|
▪
|
governmental investigations;
|
|
▪
|
the diminishing prevalence of cigarette smoking and increased efforts by tobacco control advocates and others (including employers and retail establishments) to further restrict tobacco use;
|
|
▪
|
changes in adult tobacco consumer purchase behavior, which is influenced by various factors such as economic conditions, excise taxes and price gap relationships, may result in adult tobacco consumers switching to discount products or other lower priced tobacco products;
|
22
|
▪
|
the highly competitive nature of the tobacco categories in which our tobacco subsidiaries operate, including competitive disadvantages related to cigarette price increases attributable to the settlement of certain litigation;
|
|
▪
|
illicit trade in tobacco products; and
|
|
▪
|
potential adverse changes in tobacco leaf price, availability and quality.
|
In addition to and in connection with the foregoing, evolving adult tobacco consumer preferences pose challenges for Altria Group, Inc.’s tobacco subsidiaries. Our tobacco subsidiaries believe that a significant number of adult tobacco consumers switch between tobacco categories, use multiple forms of tobacco products and try innovative tobacco products, such as e-vapor products. While the e-vapor category grew significantly in recent years, Nu Mark estimates a slowdown in growth during 2015.
Altria Group, Inc. and its tobacco subsidiaries work to meet these evolving adult tobacco consumer preferences over time by developing, manufacturing, marketing and distributing products both within and outside the United States through innovation and adjacency growth strategies (including, where appropriate, arrangements with, or investments in, third parties). For example, Nu Mark entered the e-vapor category in 2013. See the discussions regarding new product technologies, adjacency growth strategy and evolving consumer preferences in Item 1A for certain risks associated with the foregoing discussion.
We have provided additional detail on the following topics below:
|
▪
|
FSPTCA and FDA Regulation;
|
|
▪
|
Excise Taxes;
|
|
▪
|
International Treaty on Tobacco Control;
|
|
▪
|
State Settlement Agreements;
|
|
▪
|
Other Federal, State and Local Regulation and Activity;
|
|
▪
|
Illicit Trade in Tobacco Products;
|
|
▪
|
Price, Availability and Quality of Agricultural Products; and
|
|
▪
|
Timing of Sales.
|
FSPTCA and FDA Regulation
▪
The Regulatory Framework:
The FSPTCA expressly establishes certain restrictions and prohibitions on our cigarette and smokeless tobacco businesses and authorizes or requires further FDA action. Under the FSPTCA, the FDA has broad authority to (1) regulate the design, manufacture, packaging, advertising, promotion, sale and distribution of cigarettes, cigarette tobacco and smokeless tobacco products; (2) require disclosures of related information; and (3) enforce the FSPTCA and related regulations.
Among other measures, the FSPTCA:
|
▪
|
imposes restrictions on the advertising, promotion, sale and distribution of tobacco products, including at retail;
|
|
▪
|
bans descriptors such as “light,” “mild” or “low” or similar descriptors when used as descriptors of modified risk unless expressly authorized by the FDA;
|
|
▪
|
requires extensive product disclosures to the FDA and may require public disclosures;
|
|
▪
|
prohibits any express or implied claims that a tobacco product is or may be less harmful than other tobacco products without FDA authorization;
|
|
▪
|
imposes reporting obligations relating to contraband activity and grants the FDA authority to impose recordkeeping and other obligations to address illicit trade in tobacco products;
|
|
▪
|
changes the language of the cigarette and smokeless tobacco product health warnings, enlarges their size and requires the development by the FDA of graphic warnings for cigarettes, and gives the FDA the authority to require new warnings;
|
|
▪
|
authorizes the FDA to adopt product regulations and related actions, including imposing tobacco product standards that are appropriate for the protection of the public health (
e.g.
, related to the use of menthol in cigarettes, nicotine yields and other constituents or ingredients) and imposing manufacturing standards for tobacco products;
|
|
▪
|
establishes pre-market review pathways for new and modified tobacco products, including:
|
|
▪
|
authorizing the FDA to subject tobacco products that would be modified or first introduced into the market after March 22, 2011 to application and pre-market review and authorization requirements (the “New Product Application Process”) if the FDA does not find them, as a manufacturer may contend, to be “substantially equivalent” to products commercially marketed as of February 15, 2007, and possibly to deny any such new product application, thereby preventing the distribution and sale of any product affected by such denial; and
|
|
▪
|
authorizing the FDA to determine that certain existing tobacco products modified or introduced into the market for the first time between February 15, 2007 and March 22, 2011 are not “substantially equivalent” to products commercially marketed as of February 15, 2007, in which case the FDA could require the removal of such products from the marketplace or subject them to the New Product Application Process and, if any such applications are denied, prevent the continued distribution and sale of such products (see
FDA Regulatory Actions
-
Substantial Equivalence and Other New Product Processes/Pathways
below); and
|
23
|
▪
|
equips the FDA with a variety of investigatory and enforcement tools, including the authority to inspect tobacco product manufacturing and other facilities.
|
In April 2014, the FDA issued proposed regulations for other tobacco products, which as proposed would include machine-made large cigars, e-vapor products, pipe tobacco and oral tobacco-derived nicotine products marketed and sold by some of our tobacco subsidiaries. The proposed regulations would impose the FSPTCA regulatory framework on products manufactured, marketed and sold by Middleton and Nu Mark with potentially wide-ranging impact on their businesses. See
FDA Regulatory Actions - Proposed Deeming Regulations
below.
▪
Implementation Timing, Rulemaking and Guidance:
The implementation of the FSPTCA began in 2009 and will continue over time. The provisions of the FSPTCA that require the FDA to take action through rulemaking generally involve consideration of public comment and, for some issues, scientific review. From time to time, the FDA also issues guidance for public comment, which may be issued in draft or final form.
Altria Group, Inc.’s tobacco subsidiaries participate actively in processes established by the FDA to develop and implement the FSPTCA’s regulatory framework, including submission of comments to various FDA proposals and participation in public hearings and engagement sessions.
The implementation of the FSPTCA and related regulations and guidance also may have an impact on enforcement efforts by states, territories and localities of the United States of their laws and regulations as well as of the State Settlement Agreements discussed below (see
State Settlement Agreements
below). Such enforcement efforts may adversely affect our tobacco subsidiaries’ ability to market and sell regulated tobacco products in those states, territories and localities.
▪
Impact on Our Business; Compliance Costs and User Fees:
Regulations imposed and other regulatory actions taken by the FDA under the FSPTCA could have a material adverse effect on the business, consolidated results of operations, cash flows or financial position of Altria Group, Inc. and its tobacco subsidiaries in a number of different ways. For example, actions by the FDA could:
|
▪
|
impact the consumer acceptability of tobacco products;
|
|
▪
|
delay, discontinue or prevent the sale or distribution of existing, new or modified tobacco products;
|
|
▪
|
limit adult tobacco consumer choices;
|
|
▪
|
impose restrictions on communications with adult tobacco consumers;
|
|
▪
|
create a competitive advantage or disadvantage for certain tobacco companies;
|
|
▪
|
impose additional manufacturing, labeling or packaging requirements;
|
|
▪
|
impose additional restrictions at retail;
|
|
▪
|
result in increased illicit trade in tobacco products; or
|
|
▪
|
otherwise significantly increase the cost of doing business.
|
The failure to comply with FDA regulatory requirements, even inadvertently, and FDA enforcement actions could also have a material adverse effect on the business, consolidated results of operations, cash flows or financial position of Altria Group, Inc. and its tobacco subsidiaries.
The FSPTCA imposes fees on tobacco product manufacturers and importers to pay for the cost of regulation and other matters. The cost of the FDA user fee is allocated first among tobacco product categories subject to FDA regulation and then among manufacturers and importers within each respective category based on their relative market shares, all as prescribed by the statute and FDA regulations. Payments for user fees are adjusted for several factors, including inflation, market share and industry volume. For a discussion of the impact of the FDA user fee payments on Altria Group, Inc., see
Financial Review - Off-Balance Sheet Arrangements and Aggregate Contractual Obligations - Payments Under State Settlement and Other Tobacco Agreements, and FDA Regulation
below. In addition, compliance with the FSPTCA’s regulatory requirements has resulted and will continue to result in additional costs for our tobacco businesses. The amount of additional compliance and related costs has not been material in any given quarter or year to date but could become material, either individually or in the aggregate, and will depend on the nature of the requirements imposed by the FDA.
▪
Investigation and Enforcement:
The FDA has a number of investigatory and enforcement tools available to it, including document requests and other required information submissions, facility inspections, examinations and investigations, injunction proceedings, monetary penalties, product withdrawals and recalls, and product seizures. The use of any of these investigatory or enforcement tools by the FDA could result in significant costs to the tobacco businesses of Altria Group, Inc. or otherwise have a material adverse effect on the business, consolidated results of operations, cash flows or financial position of Altria Group, Inc. and its tobacco subsidiaries.
|
▪
|
TPSAC
|
|
▪
|
The
Role of the TPSAC
: As required by the FSPTCA, the FDA has established a tobacco product scientific advisory committee (the “TPSAC”), which consists of voting and non-voting members, to provide advice, reports, information and recommendations to the FDA on scientific and health issues relating to tobacco products.
|
|
▪
|
Challenge to TPSAC Membership
: In February 2011, Lorillard Tobacco Company (“Lorillard”) and R.J. Reynolds filed suit in the U.S. District Court for the District of Columbia against the United States Department of Health and Human Services and individual defendants (sued in their official capacities) asserting that the composition of the TPSAC and the composition of the Constituents Subcommittee of the TPSAC violates several federal laws, including the Federal Advisory Committee Act, because four
|
24
of the voting members of the TPSAC have financial and other conflicts (including service as paid experts for plaintiffs in tobacco litigation). In July 2014, the district court granted plaintiffs’ summary judgment motion, in part, and denied defendants’ summary judgment motion, ordering the FDA to reconstitute the TPSAC and barring defendants from relying on the TPSAC report on menthol, discussed below. The FDA appealed to the U.S. Court of Appeals for the District of Columbia Circuit in September 2014. On January 15, 2016, the U.S. Court of Appeals for the District of Columbia Circuit vacated the trial court’s ruling on procedural grounds, finding that plaintiffs lacked standing to bring suit.
|
▪
|
TPSAC Action on Menthol
: As mandated by the FSPTCA, in March 2011, the TPSAC submitted to the FDA a report on the impact of the use of menthol in cigarettes on the public health and related recommendations. The TPSAC report recommended, among other things, that the “[r]emoval of menthol cigarettes from the marketplace would benefit public health in the United States.” The TPSAC report noted the potential that any ban on menthol cigarettes could lead to an increase in contraband cigarettes and other potential unintended consequences and suggested that the FDA consult with appropriate experts on this matter.
|
In March 2011, PM USA submitted a report to the FDA outlining its position that neither science nor other evidence demonstrates that regulatory actions or restrictions related to the use of menthol cigarettes are warranted. The report noted PM USA’s belief that significant restrictions on the use of menthol cigarettes would have unintended consequences detrimental to public health and society. The FDA has stated that the TPSAC report is only a recommendation, and, in July 2013, the FDA released its preliminary scientific evaluation on menthol, which states “that menthol cigarettes pose a public health risk above that seen with non-menthol cigarettes.” At the same time, the FDA also issued an advance notice of proposed rulemaking requesting comments on the FDA’s preliminary scientific evaluation and information that may inform potential regulatory actions regarding menthol in cigarettes or other tobacco products. In November 2013, PM USA submitted comments to the FDA raising a number of concerns with the preliminary scientific evidence and about unintended consequences detrimental to public health and society. No future action can be taken by the FDA to regulate the manufacture, marketing or sale of menthol cigarettes (including a possible ban) until the completion of the rulemaking process.
▪
Final Tobacco Marketing Rule:
As required by the FSPTCA, the FDA re-promulgated in March 2010 a wide range of advertising and promotion restrictions in substantially the same form as regulations that were previously adopted in 1996 (but never imposed on tobacco manufacturers due to a United States Supreme Court ruling) (the “Final Tobacco Marketing Rule”). The Final Tobacco Marketing Rule:
|
▪
|
bans the use of color and graphics in tobacco product labeling and advertising;
|
|
▪
|
prohibits the sale of cigarettes and smokeless tobacco to underage persons;
|
|
▪
|
restricts the use of non-tobacco trade and brand names on cigarettes and smokeless tobacco products;
|
|
▪
|
requires the sale of cigarettes and smokeless tobacco in direct, face-to-face transactions;
|
|
▪
|
prohibits sampling of cigarettes and prohibits sampling of smokeless tobacco products except in qualified adult-only facilities;
|
|
▪
|
prohibits gifts or other items in exchange for buying cigarettes or smokeless tobacco products;
|
|
▪
|
prohibits the sale or distribution of items such as hats and tee shirts with tobacco brands or logos; and
|
|
▪
|
prohibits brand name sponsorship of any athletic, musical, artistic or other social or cultural event, or any entry or team in any event.
|
Subject to the limitations described below, the Final Tobacco Marketing Rule took effect in June 2010. At the time of the re-promulgation of the Final Tobacco Marketing Rule, the FDA also issued an advance notice of proposed rulemaking regarding the so-called “1000 foot rule,” which would establish restrictions on the placement of outdoor tobacco advertising in relation to schools and playgrounds. PM USA and USSTC submitted comments on this advance notice.
Since enactment, several lawsuits have been filed challenging various provisions of the FSPTCA and the Final Tobacco Marketing Rule, including their constitutionality and the scope of the FDA’s authority thereunder. Altria Group, Inc. and its tobacco subsidiaries are not parties to any of these lawsuits. As a result of one such challenge (
Commonwealth Brands
), the portion of the Final Tobacco Marketing Rule that bans the use of color and graphics in labeling and advertising is unenforceable by the FDA. For a further discussion of the Final Tobacco Marketing Rule and the status of graphic warnings for cigarette packages and advertising, see
FDA Regulatory Actions - Graphic Warnings
below.
In a separate lawsuit that challenged the constitutionality of an FDA regulation that restricts tobacco manufacturers from using the trade or brand name of a non-tobacco product on cigarettes or smokeless tobacco products, the case was dismissed without prejudice pursuant to a stipulation by which the FDA agreed not to enforce the current or any amended trade name rule against plaintiffs until at least 180 days after rulemaking on the amended rule concludes.
This relief only applies to plaintiffs in the case. However, in May 2010, the FDA issued guidance on the use of non-tobacco trade and brand names applicable to all cigarette and smokeless tobacco product manufacturers. This guidance indicated the FDA’s intention not to commence enforcement actions under the regulation while it considers how to address the concerns raised by various manufacturers. In November 2011, the FDA proposed an amended rule, but has not yet issued a final rule.
25
|
▪
|
FDA Regulatory Actions
|
|
▪
|
Graphic Warnings
: In June 2011, as required by the FSPTCA, the FDA issued its final rule to modify the required warnings that appear on cigarette packages and in cigarette advertisements. The FSPTCA requires the warnings to consist of nine new textual warning statements accompanied by color graphics depicting the negative health consequences of smoking. The graphic health warnings will (i) be located beneath the cellophane, and comprise the top 50% of the front and rear panels of cigarette packages and (ii) occupy 20% of a cigarette advertisement and be located at the top of the advertisement. After a legal challenge to the rule initiated by R.J. Reynolds, Lorillard and several other plaintiffs, in which plaintiffs prevailed both at the federal trial and appellate levels, the FDA decided not to seek further review of the U.S. Court of Appeals’ decision and announced its plans to propose a new graphic warnings rule in the future.
|
|
▪
|
Substantial Equivalence and Other New Product Processes/Pathways
: In January 2011, the FDA issued guidance concerning reports that manufacturers must submit for certain FDA-regulated tobacco products that the manufacturer modified or introduced for the first time into the market after February 15, 2007. These reports must be reviewed by the FDA to determine if such tobacco products are “substantially equivalent” to products commercially available as of February 15, 2007. In general, in order to continue marketing the products commercially available before March 22, 2011, manufacturers of FDA-regulated tobacco products were required to send to the FDA a report demonstrating substantial equivalence by March 22, 2011. PM USA and USSTC submitted timely reports. PM USA and USSTC can continue marketing these products unless the FDA makes a determination that a specific product is not substantially equivalent. If the FDA ultimately makes such a determination, it could require the removal of such products from the marketplace or subject them to the New Product Application Process and, if any such applications are denied, prevent the continued distribution and sale of such products. While PM USA and USSTC believe that all of their current products meet the statutory requirements of the FSPTCA, they cannot predict whether, when or how the FDA ultimately will apply its guidance to their various respective substantial equivalence reports or seek to enforce the law and regulations consistent with its guidance.
|
Manufacturers intending to introduce new products and certain modified products into the market after March 22, 2011 must submit a report to the FDA and obtain a “substantial equivalence order” from the FDA before introducing the products into the market. If the FDA declines to issue a so-called “substantial equivalence order” for a product or if the manufacturer itself determines that the product does not meet the substantial equivalence requirements, the product would need to undergo the New Product Application Process.
The FDA began announcing its decisions on substantial equivalence reports in the second quarter of 2013. However, there are a significant number of substantial equivalence reports for which the FDA has not announced decisions. At this time, it is not possible to predict how long reviews by the FDA of substantial equivalence reports or new product applications will take. “Not substantially equivalent” determinations could have a material adverse impact on the business results of Altria Group, Inc.’s tobacco subsidiaries.
In March 2015, the FDA issued a document entitled “Guidance for Industry: Demonstrating the Substantial Equivalence of a New Tobacco Product: Responses to Frequently Asked Questions” (“Substantial Equivalence Guidance”). In that document, the FDA announced that (i) certain label changes and (ii) changes to the quantity of tobacco product(s) in a package would each require submission of newly required substantial equivalence reports and authorization from the FDA prior to marketing tobacco products with such changes, even when the tobacco product itself is not changed. PM USA and USSTC market various products that fall within the scope of the Substantial Equivalence Guidance.
In April 2015, PM USA, USSTC and other tobacco product manufacturers filed a lawsuit in the U.S. District Court for the District of Columbia against the FDA, the United States Department of Health and Human Services, and the heads of both agencies seeking to declare these new requirements invalid and to enjoin defendants from enforcing them. In May 2015, the FDA announced that it was continuing to consider the Substantial Equivalence Guidance in light of comments received and that it would not enforce the requirements under such guidance until further notice. In light of the FDA’s announcement, the plaintiffs dismissed the pending lawsuit without prejudice in June 2015.
In September 2015, the FDA issued a second edition of the Substantial Equivalence Guidance (the “Revised SE Guidance”), which continues to require FDA pre-authorization for certain label changes and for product quantity changes. PM USA, USSTC and other tobacco product manufacturers filed a new lawsuit in the U.S. District Court for the District of Columbia against the same defendants named in the prior suit seeking to declare the requirements of the Revised SE Guidance invalid and to enjoin defendants from enforcing them. On October 30, 2015, plaintiffs filed a motion for summary judgment. Defendants opposed the motion for summary judgment and moved to dismiss the complaint on December 8, 2015.
|
▪
|
Good Manufacturing Practices
: The FSPTCA requires that the FDA promulgate good manufacturing practice regulations (referred to by the FDA as “Requirements for Tobacco Product Manufacturing Practice”) for tobacco product manufacturers, but does not specify a timeframe for such regulations.
|
|
▪
|
Proposed Deeming Regulations
: As noted above in
FSPTCA and FDA Regulation - The Regulatory Framework
, the FDA
|
26
proposed
regulations in April 2014 that would impose the FSPTCA regulatory framework on machine-made large cigars, e-vapor products, pipe tobacco and chewable tobacco-derived nicotine products. Nu Mark and Middleton submitted comments on the proposed regulations in August 2014. Nu Mark’s submission covers a number of topics, including its perspective on (1) the guiding principles that the FDA should follow to help ensure successful implementation of the deeming regulation, (2) the potential for e-vapor products and other tobacco-derived nicotine products to reduce tobacco-related harm and (3) the establishment of product approval pathways that encourage innovation of potentially reduced harm products. Middleton’s comments covered its perspective on the overall regulation of cigars and on the use of the word “mild” in the
Black & Mild
brand name. The proposed regulations suggested that the FDA may apply the descriptor prohibition to cigars and pipe tobacco, which could potentially prohibit the use of the word “Mild” in the
Black & Mild
brand name. As reflected in the comments, Middleton believes neither the FDA’s regulatory authority nor the First or Fifth Amendments to the United States Constitution allow the FDA to ban words such as “mild” regardless of the context and that the FDA can only prohibit the word “mild” when used as a descriptor of modified risk.
Excise Taxes
Tobacco products are subject to substantial excise taxes in the United States. Significant increases in tobacco-related taxes or fees have been proposed or enacted (including with respect to e-vapor products) and are likely to continue to be proposed or enacted at the federal, state and local levels within the United States.
Federal, state and local excise taxes have increased substantially over the past decade, far outpacing the rate of inflation. By way of example, in 2009, the federal excise tax (“FET”) on cigarettes increased from $0.39 per pack to approximately $1.01 per pack, in 2010, the New York state excise tax increased by $1.60 to $4.35 per pack and in October 2014, Philadelphia, Pennsylvania enacted a $2.00 per pack local cigarette excise tax. Between the end of 1998 and February 22, 2016, the weighted-average state and certain local cigarette excise taxes increased from $0.36 to $1.54 per pack. During 2015, Alabama, Nevada, Kansas, Vermont, Louisiana, Ohio, Rhode Island and Connecticut enacted legislation to increase their cigarette excise taxes. As of February 22, 2016, no state has increased its cigarette excise tax in 2016. The Federal Budget released by the President in February 2016 proposes significant increases in the FET for all tobacco products. The proposed budget would increase the FET on a pack of cigarettes by $0.94 per pack, raising the total FET to $1.95 per pack, and would also increase the tax on other tobacco products by a proportionate amount. It is not possible to predict whether this proposed FET increase will be enacted.
Tax increases are expected to continue to have an adverse impact on sales of the tobacco products of our tobacco
subsidiaries through lower consumption levels and the potential shift in adult consumer purchases from the premium to the non-premium or discount segments or to other low-priced or low-taxed tobacco products or to counterfeit and contraband products. Such shifts may have an adverse impact on the sales volume and reported share performance of tobacco products of Altria Group, Inc.’s tobacco subsidiaries.
A majority of states currently tax smokeless tobacco products using an ad valorem method, which is calculated as a percentage of the price of the product, typically the wholesale price. This ad valorem method results in more tax being paid on premium products than is paid on lower-priced products of equal weight. Altria Group, Inc.’s subsidiaries support legislation to convert ad valorem taxes on smokeless tobacco to a weight-based methodology because, unlike the ad valorem tax, a weight-based tax subjects cans of equal weight to the same tax. As of February 22, 2016, the federal government, 22 states, Puerto Rico, Philadelphia, Pennsylvania and Cook County, Illinois have adopted a weight-based tax methodology for smokeless tobacco.
International Treaty on Tobacco Control
The World Health Organization’s Framework Convention on Tobacco Control (the “FCTC”) entered into force in February 2005. As of February 22, 2016, 179 countries, as well as the European Community, have become parties to the FCTC. While the United States is a signatory of the FCTC, it is not currently a party to the agreement, as the agreement has not been submitted to, or ratified by, the United States Senate. The FCTC is the first international public health treaty and its objective is to establish a global agenda for tobacco regulation with the purpose of reducing initiation of tobacco use and encouraging cessation. The treaty recommends (and in certain instances, requires) signatory nations to enact legislation that would, among other things: establish specific actions to prevent youth tobacco product use; restrict or eliminate all tobacco product advertising, marketing, promotion and sponsorship; initiate public education campaigns to inform the public about the health consequences of tobacco consumption and exposure to tobacco smoke and the benefits of quitting; implement regulations imposing product testing, disclosure and performance standards; impose health warning requirements on packaging; adopt measures intended to combat tobacco product smuggling and counterfeit tobacco products, including tracking and tracing of tobacco products through the distribution chain; and restrict smoking in public places.
There are a number of proposals currently under consideration by the governing body of the FCTC, some of which call for substantial restrictions on the manufacture, marketing, distribution and sale of tobacco products. In addition, the Protocol to Eliminate Illicit Trade in Tobacco Products (the “Protocol”) was approved by the Conference of Parties to the FCTC in November 2012. It includes provisions related to the tracking and tracing of tobacco products through the distribution chain and numerous other provisions regarding the regulation of the manufacture, distribution and sale of tobacco products. The Protocol has not yet entered into force, but in any event will not
27
apply to the United States until the Senate ratifies the FCTC and until the President signs, and the Senate ratifies, the Protocol. It is not possible to predict the outcome of these proposals or the impact of any FCTC actions on legislation or regulation in the United States, either indirectly or as a result of the United States becoming a party to the FCTC, or whether or how these actions might indirectly influence FDA regulation and enforcement.
State Settlement Agreements
As discussed in Note 18, during 1997 and 1998, PM USA and other major domestic tobacco product manufacturers entered into the State Settlement Agreements. These settlements require participating manufacturers to make substantial annual payments, which are adjusted for several factors, including inflation, operating income, market share and industry volume. For a discussion of the impact of the State Settlement Agreements on Altria Group, Inc., see
Financial Review - Off Balance Sheet Arrangements and Aggregate Contractual Obligations - Payments Under State Settlement and Other Tobacco Agreements, and FDA Regulation
below and Note 18. The State Settlement Agreements also place numerous requirements and restrictions on participating manufacturers’ business operations, including prohibitions and restrictions on the advertising and marketing of cigarettes and smokeless tobacco products. Among these are prohibitions of outdoor and transit brand advertising, payments for product placement and free sampling (except in adult-only facilities). Restrictions are also placed on the use of brand name sponsorships and brand name non-tobacco products. The State Settlement Agreements also place prohibitions on targeting youth and the use of cartoon characters. In addition, the State Settlement Agreements require companies to affirm corporate principles directed at reducing underage use of cigarettes; impose requirements regarding lobbying activities; mandate public disclosure of certain industry documents; limit the industry’s ability to challenge certain tobacco control and underage use laws; and provide for the dissolution of certain tobacco-related organizations and place restrictions on the establishment of any replacement organizations.
In November 1998, USSTC entered into the Smokeless Tobacco Master Settlement Agreement (the “STMSA”) with the attorneys general of various states and United States territories to resolve the remaining health care cost reimbursement cases initiated against USSTC. The STMSA required USSTC to adopt various marketing and advertising restrictions. USSTC is the only smokeless tobacco manufacturer to sign the STMSA.
Other Federal, State and Local Regulation and Activity
▪
Federal, State and Local Regulation:
A number of states and localities have enacted or proposed legislation that imposes restrictions on tobacco products (including innovative tobacco products, such as e-vapor products), such as legislation that (1) prohibits the sale of certain tobacco products with certain characterizing flavors, (2) requires the disclosure of health information separate from or in addition to federally-mandated health warnings and (3) restricts commercial speech or imposes additional restrictions on the marketing or sale of tobacco
products (including proposals to ban all tobacco product sales or to increase the legal age to purchase tobacco products above the current federal minimum age requirement of 18). The legislation varies in terms of the type of tobacco products, the conditions under which such products are or would be restricted or prohibited, and exceptions to the restrictions or prohibitions. For example, a number of proposals involving characterizing flavors would prohibit smokeless tobacco products with characterizing flavors without providing an exception for mint- or wintergreen-flavored products.
Whether other states or localities will enact legislation in these areas, and the precise nature of such legislation if enacted, cannot be predicted. Altria Group, Inc.’s tobacco subsidiaries have challenged and will continue to challenge certain state and local legislation, including through litigation.
▪
Health Effects of Tobacco Consumption and Exposure to Environmental Tobacco Smoke (“ETS”):
Altria Group, Inc. and its tobacco subsidiaries believe that the public should be guided by the messages of the United States Surgeon General and public health authorities worldwide in making decisions concerning the use of tobacco products.
Reports with respect to the health effects of smoking have been publicized for many years, including in a January 2014 United States Surgeon General report titled “The Health Consequences of Smoking - 50 Years of Progress” and in a June 2006 United States Surgeon General report on ETS titled “The Health Consequences of Involuntary Exposure to Tobacco Smoke.”
Most jurisdictions within the United States have restricted smoking in public places. Some public health groups have called for, and various jurisdictions have adopted or proposed, bans on smoking in outdoor places, in private apartments and in cars transporting minors. It is not possible to predict the results of ongoing scientific research or the types of future scientific research into the health risks of tobacco exposure and the impact of such research on regulation.
▪
Other Legislation or Governmental Initiatives:
In addition to the actions discussed above, other regulatory initiatives affecting the tobacco industry have been adopted or are being considered at the federal level and in a number of state and local jurisdictions. For example, in recent years, legislation has been introduced or enacted at the state or local level to subject tobacco products to various reporting requirements and performance standards (such as reduced cigarette ignition propensity standards); establish educational campaigns relating to tobacco consumption or tobacco control programs, or provide additional funding for governmental tobacco control activities; restrict the sale of tobacco products in certain retail establishments and the sale of tobacco products in certain package sizes; require tax stamping of MST products; require the use of state tax stamps using data encryption technology; and further restrict the sale, marketing and advertising of cigarettes and other tobacco products. Such legislation may be subject to constitutional or other challenges on various grounds, which may or may not be successful.
28
It is not possible to predict what, if any, additional legislation, regulation or other governmental action will be enacted or implemented (and, if challenged, upheld) relating to the manufacturing, design, packaging, marketing, advertising, sale or use of tobacco products, or the tobacco industry generally. It is possible, however, that legislation, regulation or other governmental action could be enacted or implemented that would materially adversely affect the business and volume of our tobacco subsidiaries and our consolidated results of operations and cash flows.
▪
Governmental Investigations:
From time to time, Altria Group, Inc. and its subsidiaries are subject to governmental investigations on a range of matters. Altria Group, Inc. and its subsidiaries cannot predict whether new investigations may be commenced.
Illicit Trade in Tobacco Products
Illicit trade in tobacco products can have an adverse impact on the businesses of Altria Group, Inc. and its tobacco subsidiaries. Illicit trade can take many forms, including the sale of counterfeit tobacco products; the sale of tobacco products in the United States that are intended for sale outside the country; the sale of tobacco products over the Internet and by other means designed to avoid the collection of applicable taxes; and diversion into one taxing jurisdiction of tobacco products intended for sale in another. Counterfeit tobacco products, for example, are manufactured by unknown third parties in unregulated environments. Counterfeit versions of PM USA, USSTC or Middleton products can negatively affect adult tobacco consumer experiences with and opinions of those brands. Illicit trade in tobacco products also harms law-abiding wholesalers and retailers by depriving them of lawful sales and undermines the significant investment Altria Group, Inc.’s tobacco subsidiaries have made in legitimate distribution channels. Moreover, illicit trade in tobacco products results in federal, state and local governments losing tax revenues. Losses in tax revenues can cause such governments to take various actions, including increasing excise taxes; imposing legislative or regulatory requirements that may adversely impact Altria Group, Inc.’s consolidated results of operations and cash flows and the businesses of its tobacco subsidiaries; or asserting claims against manufacturers of tobacco products or members of the trade channels through which such tobacco products are distributed and sold.
Altria Group, Inc. and its tobacco subsidiaries devote significant resources to help prevent illicit trade in tobacco products and to protect legitimate trade channels. For example, Altria Group, Inc.’s tobacco subsidiaries are engaged in a number of initiatives to help prevent illicit trade in tobacco products, including communication with wholesale and retail trade members regarding illicit trade in tobacco products and how they can help prevent such activities; enforcement of wholesale and retail trade programs and policies that address illicit trade in tobacco products; engagement with and support of law enforcement and regulatory agencies; litigation to protect their trademarks; and support for a variety of federal and state
legislative initiatives. Legislative initiatives to address illicit trade in tobacco products are designed to protect the legitimate channels of distribution, impose more stringent penalties for the violation of illegal trade laws and provide additional tools for law enforcement. Regulatory measures and related governmental actions to prevent the illicit manufacture and trade of tobacco products continue to evolve as the nature of illicit tobacco products evolves.
Price, Availability and Quality of Agricultural Products
Shifts in crops (such as those driven by economic conditions and adverse weather patterns), government mandated prices and production control programs may increase or decrease the cost or reduce the supply or quality of tobacco and other agricultural products used to manufacture our products. As with other agriculture commodities, the price of tobacco leaf can be influenced by economic conditions and imbalances in supply and demand and crop quality and availability can be influenced by variations in weather patterns, including those caused by climate change. Tobacco production in certain countries is subject to a variety of controls, including government mandated prices and production control programs. Changes in the patterns of demand for agricultural products and the cost of tobacco production could impact tobacco leaf prices and tobacco supply. Any significant change in the price, quality or availability of tobacco leaf or other agricultural products used to manufacture our products could adversely affect our subsidiaries’ profitability and businesses.
Timing of Sales
In the ordinary course of business, our tobacco subsidiaries are subject to many influences that can impact the timing of sales to customers, including the timing of holidays and other annual or special events, the timing of promotions, customer incentive programs and customer inventory programs, as well as the actual or speculated timing of pricing actions and tax-driven price increases.
Operating Results
The following table summarizes operating results for the smokeable and smokeless products segments:
|
|
For the Years Ended December 31,
|
||||||||||||||||||||||
|
|
Net Revenues
|
Operating Companies Income
|
|||||||||||||||||||||
|
(in millions)
|
2015
|
|
2014
|
|
2013
|
|
2015
|
|
2014
|
|
2013
|
|
|||||||||||
|
Smokeable products
|
$
|
22,792
|
|
$
|
21,939
|
|
$
|
21,868
|
|
$
|
7,569
|
|
$
|
6,873
|
|
$
|
7,063
|
|
|||||
|
Smokeless products
|
1,879
|
|
1,809
|
|
1,778
|
|
1,108
|
|
1,061
|
|
1,023
|
|
|||||||||||
|
Total smokeable and smokeless products
|
$
|
24,671
|
|
$
|
23,748
|
|
$
|
23,646
|
|
$
|
8,677
|
|
$
|
7,934
|
|
$
|
8,086
|
|
|||||
Smokeable Products Segment
The smokeable products segment’s net revenues, operating companies income and operating companies income margin
29
increased during
2015
due primarily to higher pricing. PM USA grew
Marlboro
’s and its total cigarette retail share versus 2014.
The following table summarizes the smokeable products segment shipment volume performance:
|
Shipment Volume
|
||||||||
|
For the Years Ended December 31,
|
||||||||
|
(sticks in millions)
|
2015
|
|
2014
|
|
2013
|
|
||
|
Cigarettes:
|
||||||||
|
Marlboro
|
108,113
|
|
108,023
|
|
111,421
|
|
||
|
Other premium
|
6,753
|
|
7,047
|
|
7,721
|
|
||
|
Discount
|
11,152
|
|
10,320
|
|
10,170
|
|
||
|
Total cigarettes
|
126,018
|
|
125,390
|
|
129,312
|
|
||
|
Cigars:
|
||||||||
|
Black & Mild
|
1,295
|
|
1,246
|
|
1,177
|
|
||
|
Other
|
30
|
|
25
|
|
21
|
|
||
|
Total cigars
|
1,325
|
|
1,271
|
|
1,198
|
|
||
|
Total smokeable products
|
127,343
|
|
126,661
|
|
130,510
|
|
||
Cigarettes shipment volume includes
Marlboro
; Other premium brands, such as
Virginia Slims
,
Parliament
and
Benson & Hedges
; and Discount brands, which include
L&M
and
Basic.
Cigarettes volume includes units sold as well as promotional units, but excludes units sold for distribution to and in Puerto Rico, and units sold in U.S. Territories, to overseas military and by Philip Morris Duty Free Inc., none of which, individually or in the aggregate, is material to the smokeable products segment.
The following table summarizes the smokeable products segment retail share performance:
|
Retail Share
|
||||||||
|
For the Years Ended December 31,
|
||||||||
|
2015
|
|
2014
|
|
2013
|
|
|||
|
Cigarettes:
|
||||||||
|
Marlboro
|
44.0
|
%
|
43.8
|
%
|
43.7
|
%
|
||
|
Other premium
|
2.8
|
|
2.9
|
|
3.1
|
|
||
|
Discount
|
4.5
|
|
4.2
|
|
3.9
|
|
||
|
Total cigarettes
|
51.3
|
%
|
50.9
|
%
|
50.7
|
%
|
||
|
Cigars:
|
||||||||
|
Black & Mild
|
27.3
|
%
|
28.3
|
%
|
28.8
|
%
|
||
|
Other
|
0.4
|
|
0.4
|
|
0.2
|
|
||
|
Total cigars
|
27.7
|
%
|
28.7
|
%
|
29.0
|
%
|
||
Retail share results for cigarettes are based on data from IRI/Management Science Associate Inc., a tracking service that uses a sample of stores and certain wholesale shipments to project market share and depict share trends. Retail share results for cigars are based on data from IRI InfoScan, a tracking service that uses a sample of stores to project market share and depict share trends. Both services track sales in the food, drug and mass merchandisers (including Wal-Mart), convenience, military, dollar store and club trade classes. For
other trade classes selling cigarettes, retail share is based on shipments from wholesalers to retailers through the Store Tracking Analytical Reporting System (“STARS”). These services are not designed to capture sales through other channels, including the internet, direct mail and some illicitly tax-advantaged outlets. Retail share results for cigars are based on data for machine-made large cigars. Middleton defines machine-made large cigars as cigars, made by machine, that weigh greater than three pounds per thousand, except cigars sold at retail in packages of 20 cigars. Because the cigars service represents retail share performance only in key trade channels, it should not be considered a precise measurement of actual retail share. It is IRI’s standard practice to periodically refresh its services, which could restate retail share results that were previously released in these services.
PM USA and Middleton executed the following pricing and promotional allowance actions during
2015
,
2014
and
2013
:
▪
Effective November 15, 2015, PM USA increased the list price on all of its cigarette brands by $0.07 per pack.
▪
Effective May 17, 2015, PM USA increased the list price on all of its cigarette brands by $0.07 per pack.
▪
Effective November 16, 2014, PM USA reduced its wholesale promotional allowance on
L&M
by $0.07 per pack. In addition, PM USA increased the list price on all of its other cigarette brands by $0.07 per pack.
▪
Effective May 11, 2014, PM USA reduced its wholesale promotional allowance on
Marlboro
and
L&M
by $0.06 per pack. In addition, PM USA increased the list price on all of its other cigarette brands by $0.06 per pack, except for
Parliament
, which PM USA increased by $0.11 per pack.
▪
Effective December 1, 2013, PM USA reduced its wholesale promotional allowance on
Marlboro
and
L&M
by $0.07 per pack. In addition, PM USA increased the list price on all of its other cigarette brands by $0.07 per pack.
▪
Effective June 10, 2013, PM USA reduced its wholesale promotional allowance on
Marlboro
and
L&M
by $0.06 per pack. In addition, PM USA increased the list price on all of its other cigarette brands by $0.06 per pack.
The following discussion compares operating results for the smokeable products segment for the year ended
December 31, 2015
with the year ended
December 31, 2014
.
Net revenues, which include excise taxes billed to customers, increased $853 million (3.9%), due primarily to higher pricing, which includes higher promotional investments, and higher shipment volume ($133 million).
Operating companies income increased $696 million (10.1%), due primarily to higher pricing, which includes higher promotional investments, lower resolution expenses (due principally to the end of the federal tobacco quota buy-out payments after the third quarter of 2014), higher shipment volume
30
($68 million) and higher NPM Adjustment Items in
2015
($54 million). These factors were partially offset by higher costs (due primarily to higher pension and benefit costs, and marketing, administration and research costs) and higher tobacco and health litigation items ($100 million).
Marketing, administration and research costs for the smokeable products segment include PM USA’s cost of administering and litigating product liability claims. Litigation defense costs are influenced by a number of factors, including the number and types of cases filed, the number of cases tried annually, the results of trials and appeals, the development of the law controlling relevant legal issues, and litigation strategy and tactics. For further discussion on these matters, see
Note 18
and Item 3. For the years ended
December 31, 2015
,
2014
and
2013
, product liability defense costs for PM USA were $228 million, $230 million and $247 million, respectively. The factors that have influenced past product liability defense costs are expected to continue to influence future costs. PM USA does not expect future product liability defense costs to be significantly different from product liability defense costs incurred in the last few years.
For
2015
, total smokeable products reported shipment volume increased 0.5% versus 2014. PM USA’s
2015
reported domestic cigarettes shipment volume increased 0.5%, due to a moderation in the industry’s decline rate and retail share gains. When adjusted for trade inventory movements and other factors, PM USA estimates that its
2015
domestic cigarettes shipment volume increased approximately 0.5%, and that total industry cigarette volumes declined approximately 0.5%.
PM USA’s shipments of premium cigarettes accounted for 91.2% of its reported domestic cigarettes shipment volume for
2015
, versus 91.8% for 2014.
Middleton’s reported cigars shipment volume for
2015
increased 4.2%, driven primarily by
Black & Mild
in the tipped cigars segment.
Marlboro
’s retail share for
2015
increased 0.2 share points versus 2014.
PM USA grew its total retail share for
2015
by 0.4 share points versus 2014, due to gains by
Marlboro
and
L&M
in Discount, partially offset by share losses on other portfolio brands.
In the machine-made large cigars category,
while
Black & Mild
’s retail share for
2015
declined 1.0 share point,
Black & Mild
gained retail share in the more profitable tipped cigars segment.
The following discussion compares operating results for the smokeable products segment for the year ended December 31, 2014 with the year ended December 31, 2013.
Net revenues, which include excise taxes billed to customers, increased $71 million (0.3%), due primarily to higher pricing, partially offset by lower shipment volume ($724 million).
Operating companies income decreased $190 million (2.7%), due primarily to higher NPM Adjustment Items in 2013 ($621 million), lower shipment volume ($360 million) and higher
marketing, administration and research costs, partially offset by higher pricing.
For 2014, total smokeable products reported shipment volume decreased 2.9% versus 2013. PM USA’s 2014 reported domestic cigarettes shipment volume decreased 3.0%, due primarily to the industry’s decline, partially offset by retail share gains. When adjusted for trade inventory changes and other factors, PM USA estimates that its 2014 domestic cigarettes shipment volume decreased approximately 3%, and that total industry cigarette volumes declined approximately 3.5%.
PM USA’s shipments of premium cigarettes accounted for 91.8% of its reported domestic cigarettes shipment volume for 2014, versus 92.1% for 2013.
Middleton’s reported cigars shipment volume for 2014 increased 6.1%, driven by
Black & Mild
’s performance in the tipped cigars segment, including
Black & Mild
Jazz.
Marlboro
’s retail share for 2014 increased 0.1 share point versus 2013.
PM USA grew its total retail share for 2014 by 0.2 share points versus 2013, driven by
Marlboro
,
and
L&M
in Discount, partially offset by share losses on other portfolio brands. In the fourth quarter of 2014, PM USA expanded distribution of
Marlboro
Menthol Rich Blue to 28 states, primarily in the eastern U.S., to enhance
Marlboro
’s position in the menthol segment.
In the machine-made large cigars category,
Black & Mild
’s retail share for 2014 declined 0.5 share points. In December 2014, Middleton announced the national expansion of
Black & Mild
Casino, a dark tobacco blend, in the tipped segment.
Smokeless Products Segment
During
2015
, the smokeless products segment grew net revenues and operating companies income, primarily through higher pricing. USSTC increased
Copenhagen
and
Skoal
’s combined retail share versus 2014.
The following table summarizes smokeless products segment shipment volume performance:
|
|
Shipment Volume
For the Years Ended December 31,
|
|||||||
|
(cans and packs in millions)
|
2015
|
|
2014
|
|
2013
|
|
||
|
Copenhagen
|
474.7
|
|
448.6
|
|
426.1
|
|
||
|
Skoal
|
267.9
|
|
269.6
|
|
283.8
|
|
||
|
Copenhagen
and
Skoal
|
742.6
|
|
718.2
|
|
709.9
|
|
||
|
Other
|
70.9
|
|
75.1
|
|
77.6
|
|
||
|
Total smokeless products
|
813.5
|
|
793.3
|
|
787.5
|
|
||
Smokeless products shipment volume includes cans and packs sold, as well as promotional units, but excludes international volume, which is not material to the smokeless products segment. Other includes certain USSTC and PM USA smokeless products. New types of smokeless products, as well as new packaging configurations of existing smokeless products, may or may not be equivalent to existing MST products on a can-for-can basis. To calculate volumes of cans and packs shipped, one pack of snus, irrespective of the number of pouches in the pack, is assumed to be equivalent to one can of MST.
31
The following table summarizes smokeless products segment retail share performance (excluding international volume):
|
|
Retail Share
For the Years Ended December 31,
|
|||||||
|
2015
|
|
2014
|
|
2013
|
|
|||
|
Copenhagen
|
31.6
|
%
|
30.7
|
%
|
29.4
|
%
|
||
|
Skoal
|
19.7
|
|
20.3
|
|
21.3
|
|
||
|
Copenhagen
and
Skoal
|
51.3
|
|
51.0
|
|
50.7
|
|
||
|
Other
|
3.6
|
|
4.0
|
|
4.2
|
|
||
|
Total smokeless products
|
54.9
|
%
|
55.0
|
%
|
54.9
|
%
|
||
Retail share results for smokeless products are based on data from IRI InfoScan, a tracking service that uses a sample of stores to project market share and depict share trends. The service tracks sales in the food, drug and mass merchandisers (including Wal-Mart), convenience, military, dollar store and club trade classes on the number of cans and packs sold. Smokeless products is defined by IRI as moist smokeless and spit-free tobacco products. Other includes certain USSTC and PM USA smokeless products. New types of smokeless products, as well as new packaging configurations of existing smokeless products, may or may not be equivalent to existing MST products on a can-for-can basis. One pack of snus, irrespective of the number of pouches in the pack, is assumed to be equivalent to one can of MST. All other products are considered to be equivalent on a can-for-can basis. Because this service represents retail share performance only in key trade channels, it should not be considered a precise measurement of actual retail share. It is IRI’s standard practice to periodically refresh its InfoScan services, which could restate retail share results that were previously released in this service.
USSTC executed the following pricing actions during
2015
,
2014
and
2013
:
▪
Effective December 8, 2015, USSTC increased the list price on
Copenhagen
and
Skoal
popular price products by $0.12 per can. In addition, USSTC increased the list price on all its brands, except for
Copenhagen
and
Skoal
popular price products, by $0.07 per can.
▪
Effective May 5, 2015, USSTC increased the list price on all its brands by $0.07 per can.
▪
Effective November 25, 2014, USSTC increased the list price on all its brands by $0.07 per can.
▪
Effective May 11, 2014, USSTC increased the list price on all of its brands by $0.06 per can.
▪
Effective December 8, 2013, USSTC increased the list price on all of its brands by $0.06 per can.
▪
Effective May 12, 2013, USSTC increased the list price on all of its brands by $0.05 per can.
The following discussion compares operating results for the smokeless products segment for the year ended
December 31, 2015
with the year ended
December 31, 2014
.
Net revenues, which include excise taxes billed to customers, increased $70 million (3.9%), due primarily to higher pricing, which includes higher promotional investments.
Operating companies income increased $47 million (4.4%), due primarily to higher pricing, which includes higher promotional investments, partially offset by higher costs.
The smokeless products segment’s reported domestic shipment volume for
2015
increased 2.5% as volume growth in
Copenhagen
was
partially offset by declines in
Skoal
and Other portfolio brands.
Copenhagen
and
Skoal
’s combined reported domestic shipment volume increased 3.4% for
2015
.
After adjusting for trade inventory movements and other factors, USSTC estimates that its domestic smokeless products shipment volume grew approximately 2.5% for 2015. USSTC estimates that the smokeless products category volume grew approximately 2.5% over the six months ended December 31, 2015 as compared with approximately 2.0% for the six months ended December 31, 2014.
Copenhagen
and
Skoal
’s combined retail share increased 0.3 share points to 51.3% for 2015.
Copenhagen
’s retail share
increased 0.9 share points and
Skoal
’s retail share declined 0.6 share points.
Total smokeless products retail share declined 0.1 share point to 54.9%.
The following discussion compares operating results for the smokeless products segment for the year ended December 31, 2014 with the year ended December 31, 2013.
Net revenues, which include excise taxes billed to customers, increased $31 million (1.7%), due primarily to higher pricing, which includes higher promotional investments, and higher volume, partially offset by mix due to growth in popular priced products.
Operating companies income increased $38 million (3.7%), due primarily to higher pricing ($43 million), which includes higher promotional investments, and higher volume ($9 million), partially offset by product mix.
Reported domestic smokeless products shipment volume for 2014 increased 0.7% as volume growth for
Copenhagen
was
mostly offset by volume declines in
Skoal
and Other portfolio brands.
Copenhagen
and
Skoal
’s combined reported shipment volume increased 1.2% for 2014.
After adjusting for trade inventory changes and other factors, USSTC estimates that domestic smokeless products shipment volume grew approximately 2.5% for 2014. USSTC estimates that the smokeless products category volume grew approximately 2.0% over the six months ended December 31, 2014 as compared with approximately 6.0% for the six months ended December 31, 2013.
Copenhagen
and
Skoal
’s combined retail share increased 0.3 share points to 51.0% for 2014.
Copenhagen
’s retail share
increased 1.3 share points, while
Skoal
’s retail share declined 1.0 share point.
Retail share for the smokeless products segment increased 0.1 share point to 55.0%, as retail share gains for
Copenhagen
were mostly offset by share losses for
Skoal
and Other portfolio brands.
32
Wine Segment
Business Environment
Ste. Michelle is a leading producer of Washington state wines, primarily
Chateau Ste. Michelle
,
Columbia Crest
and
14 Hands
, and owns wineries in or distributes wines from several other domestic and foreign wine regions. Ste. Michelle holds an 85% ownership interest in Michelle-Antinori, LLC, which owns
Stag’s Leap Wine Cellars
in Napa Valley. Ste. Michelle also owns
Conn Creek
in Napa Valley and
Erath
in Oregon. In addition, Ste. Michelle imports and markets
Antinori
,
Torres
and
Villa Maria Estate
wines and
Champagne Nicolas Feuillatte
in the United States. Key elements of Ste. Michelle’s strategy are expanded domestic distribution of its wines, especially in certain account categories such as restaurants, wholesale clubs, supermarkets, wine shops and mass merchandisers, and a focus on improving product mix to higher-priced, premium products.
Ste. Michelle’s business is subject to significant competition, including competition from many larger, well-established domestic and international companies, as well as from many smaller wine producers. Wine segment competition is primarily based on quality, price, consumer and trade wine tastings, competitive wine judging, third-party acclaim and advertising. Substantially all of Ste. Michelle’s sales occur in the United States through state-licensed distributors. Ste. Michelle also sells to domestic consumers through retail and e-commerce channels and exports wines to international distributors.
Federal, state and local governmental agencies regulate the beverage alcohol industry through various means, including licensing requirements, pricing rules, labeling and advertising restrictions, and distribution and production policies. Further regulatory restrictions or additional excise or other taxes on the manufacture and sale of alcoholic beverages may have an adverse effect on Ste. Michelle’s wine business.
Operating Results
Ste. Michelle’s net revenues and operating companies income increased in 2015, due primarily to higher shipment volume and improved premium mix. Ste. Michelle expanded its operating companies income margin in 2015. The following table summarizes operating results for the wine segment:
|
|
For the Years Ended December 31,
|
||||||||||
|
(in millions)
|
2015
|
|
2014
|
|
2013
|
|
|||||
|
Net revenues
|
$
|
692
|
|
$
|
643
|
|
$
|
609
|
|
||
|
Operating companies income
|
$
|
152
|
|
$
|
134
|
|
$
|
118
|
|
||
The following table summarizes wine segment case shipment volume performance:
|
|
Shipment Volume
For the Years Ended December 31,
|
|||||||
|
(cases in thousands)
|
2015
|
|
2014
|
|
2013
|
|
||
|
Chateau Ste. Michelle
|
3,253
|
|
3,035
|
|
2,753
|
|
||
|
Columbia Crest
|
1,062
|
|
1,032
|
|
1,031
|
|
||
|
14 Hands
|
1,848
|
|
1,662
|
|
1,374
|
|
||
|
Other
|
2,703
|
|
2,622
|
|
2,814
|
|
||
|
Total wine
|
8,866
|
|
8,351
|
|
7,972
|
|
||
The following discussion compares operating results for the wine segment for the year ended
December 31, 2015
with the year ended
December 31, 2014
.
Net revenues, which include excise taxes billed to customers, increased $49 million (7.6%), due primarily to higher shipment volume and improved premium mix. Operating companies income increased $18 million (13.4%), due primarily to higher shipment volume and improved premium mix, partially offset by higher costs.
For
2015
, Ste. Michelle’s reported wine shipment volume increased 6.2%.
The following discussion compares operating results for the wine segment for the year ended
December 31, 2014
with the year ended
December 31, 2013
.
Net revenues, which include excise taxes billed to customers, and operating companies income increased $34 million (5.6%) and $16 million (13.6%), respectively, due primarily to higher shipment volume.
For 2014, Ste. Michelle’s reported wine shipment volume increased 4.8% driven by increased volume of
14 Hands
and
Chateau Ste. Michelle
, partially offset by declines in Other brands.
Financial Review
Net Cash Provided by Operating Activities
During
2015
, net cash provided by operating activities was
$5.8 billion
compared with
$4.7 billion
during
2014
. This increase was due primarily to the following:
|
▪
|
higher net revenues in the smokeable products segment in 2015; and
|
|
▪
|
the end of the federal tobacco quota buy-out payments after the third quarter of 2014;
|
partially offset by:
|
▪
|
higher settlement payments during 2015, driven by the impact of NPM Adjustment Items in 2014.
|
During
2014
, net cash provided by operating activities was
$4.7 billion
compared with
$4.4 billion
during
2013
. This increase was due primarily to the following:
|
▪
|
a voluntary $350 million contribution to Altria Group, Inc.’s pension plans during 2013;
|
|
▪
|
lower interest payments in 2014, resulting from debt maturities in 2013 and 2014, as well as debt refinancing activities in 2013; and
|
|
▪
|
higher earnings in 2014;
|
partially offset by:
|
▪
|
higher income tax payments in 2014, resulting primarily from the loss on early extinguishment of debt in 2013; and
|
|
▪
|
higher settlement payments during 2014, driven primarily by the impact of higher NPM Adjustment Items in 2013.
|
Altria Group, Inc. had a working capital deficit at December 31, 2015 and
2014
. Altria Group, Inc.’s management believes that it has the ability to fund these working capital deficits with cash provided by operating activities and/or short-term borrowings under its commercial paper program as discussed in the
Debt and Liquidity
section below.
Net Cash Used in/Provided by Investing Activities
During
2015
, net cash used in investing activities was
$15 million
compared with net cash provided by investing activities of
$177 million
during
2014
. This change was due primarily to the following:
|
▪
|
$132 million payment for a derivative financial instrument during 2015;
|
|
▪
|
the sale of PM USA’s Cabarrus, North Carolina manufacturing facility during 2014; and
|
|
▪
|
higher capital expenditures during 2015, due primarily to a new USSTC manufacturing facility in Hopkinsville, Kentucky that is expected to be completed in 2016;
|
partially offset by:
|
▪
|
Nu Mark’s acquisition of the e-vapor business of Green Smoke during 2014.
|
During
2014
, net cash provided by investing activities was
$177 million
compared with
$602 million
during
2013
. This decrease was due primarily to the following:
|
▪
|
lower proceeds from asset sales in the financial services business during 2014; and
|
|
▪
|
Nu Mark’s acquisition of the e-vapor business of Green Smoke during 2014.
|
Capital expenditures for
2015
increased 40.5% to
$229 million
, due primarily to the new USSTC manufacturing facility noted above. Capital expenditures for 2016 are expected to be in the range of $140 million to $180 million, and are expected to be funded from operating cash flows. The decrease in expected capital expenditures in 2016 compared with 2015 is due primarily
to higher capital expenditures during 2015 for the new USSTC manufacturing facility expected to be completed in 2016.
Net Cash Used in Financing Activities
During
2015
, net cash used in financing activities was
$6.7 billion
compared with
$4.7 billion
during 2014. This increase was due primarily to the following:
|
▪
|
debt tender offer completed during 2015, which resulted in the repurchase of $793 million of senior unsecured long-term notes and a $226 million payment of premiums and fees, as more fully described in Note 9;
|
|
▪
|
$1.0 billion repayment of Altria Group, Inc. senior unsecured notes at scheduled maturity in 2015;
|
|
▪
|
debt issuance of $1.0 billion in 2014; and
|
|
▪
|
higher dividends paid during 2015;
|
partially offset by:
|
▪
|
$525 million repayment of Altria Group, Inc. senior unsecured notes at scheduled maturity in 2014;
|
|
▪
|
lower share repurchases during 2015; and
|
|
▪
|
full redemption of UST senior notes of $300 million in 2014.
|
During
2014
, net cash used in financing activities was
$4.7 billion
, essentially unchanged compared to 2013, which primarily reflected the following:
|
▪
|
higher repayments of debt in 2013 driven primarily by the repurchase of senior unsecured notes in connection with the 2013 debt tender offer; and
|
|
▪
|
higher premiums and fees in 2013 in connection with the 2013 debt tender offer;
|
offset by:
|
▪
|
debt issuances of $3.2 billion in 2013 used to repurchase senior unsecured notes in connection with the 2013 debt tender offer;
|
▪
higher share repurchases during 2014; and
▪
higher dividends paid during 2014.
34
Debt and Liquidity
Credit Ratings
- Altria Group, Inc.’s cost and terms of financing and its access to commercial paper markets may be impacted by applicable credit ratings. Under the terms of certain of Altria Group, Inc.’s existing debt instruments, a change in a credit rating could result in an increase or a decrease of the cost of borrowings. For instance, as discussed in
Note 9
, the interest rate payable on certain of Altria Group, Inc.’s outstanding notes is subject to adjustment from time to time if the rating assigned to the notes of such series by Moody’s Investors Service, Inc. (“Moody’s”) or Standard & Poor’s Ratings Services (“Standard & Poor’s”) is downgraded (or subsequently upgraded) as and to the extent set forth in the notes. The impact of credit ratings on the cost of borrowings under Altria Group, Inc.’s credit agreement is discussed below.
At
December 31, 2015
, the credit ratings and outlook for Altria Group, Inc.’s indebtedness by major credit rating agencies were:
|
|
Short-term
Debt
|
Long-term
Debt
|
Outlook
|
||
|
Moody’s
|
P-2
|
Baa1
|
Stable
|
||
|
Standard & Poor’s
|
A-2
|
BBB+
|
Stable
|
||
|
Fitch Ratings Ltd.
|
F2
|
BBB+
|
Stable
|
||
Credit Lines
- From time to time, Altria Group, Inc. has short-term borrowing needs to meet its working capital requirements and generally uses its commercial paper program to meet those needs. At December 31, 2015,
2014
and
2013
, Altria Group, Inc. had
no
short-term borrowings.
During the third quarter of 2015, Altria Group, Inc. entered into an extension agreement (the “Extension Agreement”) to amend its
$3.0 billion
senior unsecured
5
-year revolving credit agreement, dated as of August 19, 2013 (the “Credit Agreement”). The Extension Agreement extends the expiration date of the Credit Agreement from August 19, 2019 to August 19, 2020 pursuant to the terms of the Credit Agreement. All other terms and conditions of the Credit Agreement remain in full force and effect. The Credit Agreement was previously amended in 2014 to extend the expiration date from August 19, 2018 to August 19, 2019.
Pricing for interest and fees under the Credit Agreement may be modified in the event of a change in the rating of Altria Group, Inc.’s long-term senior unsecured debt. Interest rates on borrowings under the Credit Agreement are expected to be based on the London Interbank Offered Rate (“LIBOR”) plus a percentage based on the higher of the ratings of Altria Group, Inc.’s long-term senior unsecured debt from Moody’s and Standard & Poor’s. The applicable percentage based on Altria Group, Inc.’s long-term senior unsecured debt ratings at
December 31, 2015
for borrowings under the Credit Agreement was
1.25%
. The Credit Agreement does not include any other rating triggers, nor does it contain any provisions that could require the posting of collateral. At
December 31, 2015
, credit available to Altria Group, Inc. under the Credit Agreement was $3.0 billion.
The Credit Agreement is used for general corporate purposes and to support Altria Group, Inc.’s commercial paper issuances. The Credit Agreement requires that Altria Group, Inc. maintain (i) a ratio of debt to consolidated earnings before interest, taxes, depreciation and amortization (“EBITDA”) of not more than
3.0
to 1.0 and (ii) a ratio of consolidated EBITDA to consolidated interest expense of not less than
4.0
to 1.0, each calculated as of the end of the applicable quarter on a rolling four quarters basis. At
December 31, 2015
, the ratios of debt to consolidated EBITDA and consolidated EBITDA to consolidated interest expense, calculated in accordance with the Credit Agreement, were
1.4
to 1.0 and
11.7
to 1.0, respectively. Altria Group, Inc. expects to continue to meet its covenants associated with the Credit Agreement. The terms “consolidated EBITDA,” “debt” and “consolidated interest expense,” as defined in the Credit Agreement, include certain adjustments. Exhibit 99.3 to Altria Group, Inc.’s Quarterly Report on Form 10-Q for the period ended September 30, 2013 sets forth the definitions of these terms as they appear in the Credit Agreement and is incorporated herein by reference.
Any commercial paper issued by Altria Group, Inc. and borrowings under the Credit Agreement are guaranteed by PM USA as further discussed in
Note 19
.
Condensed Consolidating Financial Information
to the consolidated financial statements in Item 8 (“
Note 19
”).
Financial Market Environment
- Altria Group, Inc. believes it has adequate liquidity and access to financial resources to meet its anticipated obligations and ongoing business needs in the foreseeable future. Altria Group, Inc. continues to monitor the credit quality of its bank group and is not aware of any potential non-performing credit provider in that group. Altria Group, Inc. believes the lenders in its bank group will be willing and able to advance funds in accordance with their legal obligations. See Item 1A for certain risk factors associated with the foregoing discussion.
Debt
- At
December 31, 2015
and
2014
, Altria Group, Inc.’s total debt was
$12.9 billion
and
$14.7 billion
, respectively.
As discussed in Note 9, during 2015, Altria Group, Inc. repaid in full at maturity senior unsecured notes in the aggregate principal amount of
$1.0 billion
. Additionally, during 2015, Altria Group, Inc. completed a debt tender offer to purchase for cash $793 million aggregate principal amount of its senior unsecured 9.700% notes due 2018.
All of Altria Group, Inc.’s debt was fixed-rate debt at
December 31, 2015
and
2014
. The weighted-average coupon
interest rate on total debt was approximately
5.5%
and
5.7% at
December 31, 2015
and
2014
, respectively. For further details on long-term debt, see
Note 9
.
In October 2014, Altria Group, Inc. filed a registration statement on Form S-3 with the SEC, under which Altria Group, Inc. may offer debt securities or warrants to purchase debt securities from time to time over a three-year period
from the date of filing.
35
Off-Balance Sheet Arrangements and Aggregate Contractual Obligations
Altria Group, Inc. has no off-balance sheet arrangements, including special purpose entities, other than guarantees and contractual obligations that are discussed below.
Guarantees and Other Similar Matters
- As discussed in
Note 18
, Altria Group, Inc. and certain of its subsidiaries had unused letters of credit obtained in the ordinary course of business, guarantees (including third-party guarantees) and a redeemable noncontrolling interest outstanding at
December 31, 2015
. From time to time, subsidiaries of Altria Group, Inc. also issue lines of credit to affiliated entities. In addition, as discussed in
Note 19
, PM USA has issued guarantees relating to Altria Group, Inc.’s obligations under its outstanding debt securities, borrowings under its Credit Agreement and amounts outstanding under its commercial paper program. These items have not had, and are not expected to have, a significant impact on Altria Group, Inc.’s liquidity.
Aggregate Contractual Obligations
- The following table summarizes Altria Group, Inc.’s contractual obligations at
December 31, 2015
:
|
Payments Due
|
|||||||||||||||||||
|
(in millions)
|
Total
|
|
2016
|
|
2017 - 2018
|
|
2019 - 2020
|
|
2021 and Thereafter
|
|
|||||||||
|
Long-term debt
(1)
|
$
|
12,965
|
|
$
|
4
|
|
$
|
871
|
|
$
|
2,148
|
|
$
|
9,942
|
|
||||
|
Interest on borrowings
(2)
|
10,031
|
|
716
|
|
1,432
|
|
1,146
|
|
6,737
|
|
|||||||||
|
Operating leases
(3)
|
309
|
|
58
|
|
97
|
|
60
|
|
94
|
|
|||||||||
|
Purchase obligations:
(4)
|
|
|
|
|
|
||||||||||||||
|
Inventory and production costs
|
3,218
|
|
989
|
|
1,336
|
|
565
|
|
328
|
|
|||||||||
|
Other
|
729
|
|
555
|
|
142
|
|
32
|
|
—
|
|
|||||||||
|
3,947
|
|
1,544
|
|
1,478
|
|
597
|
|
328
|
|
||||||||||
|
Other long-term liabilities
(5)
|
2,443
|
|
152
|
|
325
|
|
311
|
|
1,655
|
|
|||||||||
|
$
|
29,695
|
|
$
|
2,474
|
|
$
|
4,203
|
|
$
|
4,262
|
|
$
|
18,756
|
|
|||||
(1)
Amounts represent the expected cash payments of Altria Group, Inc.’s long-term debt.
(2)
Amounts represent the expected cash payments of Altria Group, Inc.’s interest expense on its long-term debt. Interest on Altria Group, Inc.’s debt, which was all fixed-rate debt at
December 31, 2015
, is presented using the stated coupon interest rate. Amounts exclude the amortization of debt discounts and premiums, the amortization of loan fees and fees for lines of credit that would be included in interest and other debt expense, net on the consolidated statements of earnings.
(3)
Amounts represent the minimum rental commitments under non-cancelable operating leases.
(4)
Purchase obligations for inventory and production costs (such as raw materials, indirect materials and supplies, packaging, storage and distribution) are commitments for projected needs to be used in the normal course of business. Other purchase obligations include commitments for marketing, capital expenditures, information technology and professional services. Arrangements are considered purchase obligations if a contract specifies all significant terms, including fixed or minimum quantities to be purchased, a pricing structure and approximate timing of the transaction. Most arrangements are cancelable without a significant penalty, and with short notice (usually 30 days). Any amounts reflected on the consolidated balance sheet as accounts payable and accrued liabilities are excluded from the table above.
(5)
Other long-term liabilities consist of accrued postretirement health care costs and certain accrued pension costs. The amounts included in the table above for accrued pension costs consist of the actuarially determined anticipated minimum funding requirements for each year from 2016 through 2020. Contributions beyond 2020 cannot be reasonably estimated and, therefore, are not included in the table above. In addition, the following long-term liabilities included on the consolidated balance sheet are excluded from the table above: accrued postemployment costs, income taxes and tax contingencies, and other accruals. Altria Group, Inc. is unable to estimate the timing of payments for these items.
The State Settlement Agreements and related legal fee payments, and payments for FDA user fees, as discussed below and in
Note 18
and Item 3, are excluded from the table above, as the payments are subject to adjustment for several factors, including inflation, operating income, market share and industry volume. Litigation escrow deposits, as discussed below and in
Note 18
, are also excluded from the table above since these deposits will be returned to PM USA should it prevail on appeal.
Payments Under State Settlement and Other Tobacco Agreements, and FDA Regulation
- As discussed previously and in
Note 18
and Item 3, PM USA has entered into State Settlement
Agreements with the states and territories of the United States that call for certain payments. PM USA, Middleton and USSTC were also subject to payment obligations imposed by FETRA. The FETRA payment obligations expired after the third quarter of 2014. In addition, in June 2009, PM USA and USSTC became subject to quarterly user fees imposed by the FDA as a result of the FSPTCA. Payments under the State Settlement Agreements and the FDA user fees are based on variable factors, such as volume, operating income, market share and inflation, depending on the subject payment. Altria Group, Inc.’s subsidiaries account for the cost of the State Settlement Agreements, FETRA and FDA
36
user fees as a component of cost of sales. As a result of the State Settlement Agreements, FETRA and FDA user fees, Altria Group, Inc.’s subsidiaries recorded approximately $4.8 billion, $4.9 billion and $4.4 billion of charges to cost of sales for the years ended
December 31, 2015
,
2014
and
2013
, respectively. The 2015, 2014 and 2013 amounts included reductions to cost of sales of $97 million, $43 million and $664 million, respectively, for the NPM Adjustment Items. In addition, the 2015 and 2014 amounts reflected decreases in the charge to cost of sales of approximately $300 million and $100 million, respectively, for the expiration of the obligations imposed by FETRA after the third quarter of 2014.
In connection with the settlement with the 24 signatory states of certain NPM Adjustment disputes under the MSA, the formula for allocating the revised NPM Adjustments applicable to the signatory states for 2013 and subsequent years among the tobacco product manufacturers that are original signatories to the MSA (“OPMs”) has been modified in a manner favorable to PM USA, although the extent to which it remains favorable to PM USA will depend upon future developments. Similarly, in connection with the settlement with New York of certain NPM Adjustment disputes under the MSA, the formula for allocating among the OPMs the revised NPM Adjustments applicable to New York for years after 2014 has been modified in a manner favorable to PM USA, although the extent to which it remains favorable to PM USA will depend upon future developments. For a detailed discussion of settlements of, and determinations made in connection with, disputes with certain states and territories related to the NPM Adjustment provision under the MSA for the years 2003-2012, see
Health Care Cost Recovery Litigation - NPM Adjustment Disputes
in Note 18.
Based on current agreements, 2015 market share and historical annual industry volume decline rates, the estimated amounts that Altria Group, Inc.’s subsidiaries may charge to cost of sales for payments related to State Settlement Agreements and FDA user fees approximate $4.9 billion in 2016 and each year thereafter. The increase in these amounts compared with approximately $4.8 billion charged to cost of sales in 2015 reflects the impact of the NPM Adjustments recorded in 2015. These amounts exclude the potential impact of the NPM Adjustment provision applicable under the MSA and the revised NPM Adjustment provisions applicable under the settlements of the NPM Adjustment disputes with the 24 signatory states and with New York, respectively, for years after 2014 discussed above.
The estimated amounts due under the State Settlement Agreements charged to cost of sales in each year would generally be paid in the following year. The amounts charged to cost of sales for FDA user fees are generally paid in the quarter in which the fees are incurred. As previously stated, the payments due under the terms of the State Settlement Agreements and FDA user fees are subject to adjustment for several factors, including volume, operating income, inflation and certain contingent events and, in general, are allocated based on each manufacturer’s market share. The future payment amounts discussed above are estimates, and actual payment amounts will differ to the extent underlying assumptions differ from actual future results.
Litigation-Related Deposits and Payments
- With respect to certain adverse verdicts currently on appeal, to obtain stays of judgments pending appeals, as of
December 31, 2015
, PM USA had posted various forms of security totaling approximately $77 million, the majority of which have been collateralized with cash deposits. These cash deposits are included in other assets on the consolidated balance sheet.
Although litigation is subject to uncertainty and an adverse outcome or settlement of litigation could have a material adverse effect on the financial position, cash flows or results of operations of PM USA, UST or Altria Group, Inc. in a particular fiscal quarter or fiscal year, as more fully disclosed in
Note 18
, Item 3 and Item 1A, management expects cash flow from operations, together with Altria Group, Inc.’s access to capital markets, to provide sufficient liquidity to meet ongoing business needs.
Equity and Dividends
As discussed in
Note 11
.
Stock Plans
to the consolidated financial statements in Item 8 (“
Note 11
”), during
2015
Altria Group, Inc. granted an aggregate of
1.2 million
shares of restricted stock units (also known as deferred stock) to eligible employees.
At
December 31, 2015
, the number of shares to be issued upon vesting of restricted stock units was not significant.
Dividends paid in
2015
and
2014
were approximately
$4.2 billion
and
$3.9 billion
, respectively, an increase of
7.4%
, reflecting a higher dividend rate, partially offset by fewer shares outstanding as a result of shares repurchased by Altria Group, Inc. under its share repurchase programs.
During the third quarter of
2015
, the Board of Directors approved an
8.7%
increase in the quarterly dividend rate to
$0.565
per common share versus the previous rate of
$0.52
per common share. Altria Group, Inc. expects to continue to maintain a dividend payout ratio target of approximately 80% of its adjusted diluted EPS. The current annualized dividend rate is
$2.26
per Altria Group, Inc. common share. Future dividend payments remain subject to the discretion of the Board of Directors.
During
2015
,
2014
and
2013
the Board of Directors authorized Altria Group, Inc. to repurchase shares of its outstanding common stock under several share repurchase programs.
At December 31,
2015
, Altria Group, Inc. had approximately
$965 million
remaining in the July 2015 share repurchase program, which it expects to complete by the end of 2016. For further discussion of Altria Group, Inc.’s share repurchase programs, see
Note 10
.
Capital Stock
to the consolidated financial statements in Item 8 and Part II, Item 5. Market for Registrant’s Common Equity, Related Stockholder Matters and Issuer Purchases of Equity Securities of this Annual Report on Form 10-K.
37
Recent Accounting Guidance Not Yet Adopted
See Note 2
for a discussion of recent accounting guidance issued but not yet adopted.
Contingencies
See
Note 18
and Item 3 for a discussion of contingencies.
At
December 31, 2015
and
2014
, the fair value of Altria Group, Inc.’s total debt was
$14.5 billion
and
$17.0 billion
, respectively. The fair value of Altria Group, Inc.’s debt is subject to fluctuations resulting from changes in market interest rates. A 1% increase in market interest rates at
December 31, 2015
and
2014
would decrease the fair value of Altria Group, Inc.’s total debt by approximately $1.1 billion and $1.3 billion, respectively. A 1% decrease in market interest rates at
December 31, 2015
and
2014
would increase the fair value of Altria Group, Inc.’s total debt by approximately $1.3 billion and $1.5 billion, respectively.
Interest rates on borrowings under the Credit Agreement are expected to be based on LIBOR plus a percentage based on the higher of the ratings of Altria Group, Inc.’s long-term senior unsecured debt from Moody’s and Standard & Poor’s. The applicable percentage based on Altria Group, Inc.’s long-term senior unsecured debt ratings at
December 31, 2015
for borrowings under the Credit Agreement was 1.25%. At
December 31, 2015
, Altria Group, Inc. had
no
borrowings under the Credit Agreement.
At December 31, 2015, the fair value of Altria Group, Inc.’s derivative financial instrument in the form of a put option (the “option”) included in other current assets was $152 million. A 10% devaluation of the United States dollar against the British pound would decrease the fair value of the option by approximately $97 million, with a corresponding decrease to Altria Group, Inc.’s pre-tax earnings. A 10% appreciation of the United States dollar against the British pound would increase the fair value of the option by approximately $172 million, with a corresponding increase to Altria Group, Inc.’s pre-tax earnings.
38
Altria Group, Inc. and Subsidiaries
(in millions of dollars)
________________________
|
at December 31,
|
2015
|
|
2014
|
|
|||
|
Assets
|
|||||||
|
Cash and cash equivalents
|
$
|
2,369
|
|
$
|
3,321
|
|
|
|
Receivables
|
124
|
|
124
|
|
|||
|
Inventories:
|
|||||||
|
Leaf tobacco
|
957
|
|
991
|
|
|||
|
Other raw materials
|
181
|
|
200
|
|
|||
|
Work in process
|
444
|
|
429
|
|
|||
|
Finished product
|
449
|
|
420
|
|
|||
|
2,031
|
|
2,040
|
|
||||
|
Deferred income taxes
|
1,175
|
|
1,143
|
|
|||
|
Other current assets
|
387
|
|
250
|
|
|||
|
Total current assets
|
6,086
|
|
6,878
|
|
|||
|
Property, plant and equipment, at cost:
|
|||||||
|
Land and land improvements
|
295
|
|
293
|
|
|||
|
Buildings and building equipment
|
1,406
|
|
1,323
|
|
|||
|
Machinery and equipment
|
2,969
|
|
2,986
|
|
|||
|
Construction in progress
|
207
|
|
153
|
|
|||
|
4,877
|
|
4,755
|
|
||||
|
Less accumulated depreciation
|
2,895
|
|
2,772
|
|
|||
|
1,982
|
|
1,983
|
|
||||
|
Goodwill
|
5,285
|
|
5,285
|
|
|||
|
Other intangible assets, net
|
12,028
|
|
12,049
|
|
|||
|
Investment in SABMiller
|
5,483
|
|
6,183
|
|
|||
|
Finance assets, net
|
1,239
|
|
1,614
|
|
|||
|
Other assets
|
432
|
|
483
|
|
|||
|
Total Assets
|
$
|
32,535
|
|
$
|
34,475
|
|
|
See notes to consolidated financial statements.
39
Altria Group, Inc. and Subsidiaries
Consolidated Balance Sheets (Continued)
(in millions of dollars, except share and per share data)
____________________________________________
|
at December 31,
|
2015
|
|
2014
|
|
|||
|
Liabilities
|
|||||||
|
Current portion of long-term debt
|
$
|
4
|
|
$
|
1,000
|
|
|
|
Accounts payable
|
400
|
|
416
|
|
|||
|
Accrued liabilities:
|
|||||||
|
Marketing
|
695
|
|
618
|
|
|||
|
Employment costs
|
198
|
|
186
|
|
|||
|
Settlement charges
|
3,590
|
|
3,500
|
|
|||
|
Other
|
1,081
|
|
925
|
|
|||
|
Dividends payable
|
1,110
|
|
1,028
|
|
|||
|
Total current liabilities
|
7,078
|
|
7,673
|
|
|||
|
Long-term debt
|
12,915
|
|
13,693
|
|
|||
|
Deferred income taxes
|
5,663
|
|
6,088
|
|
|||
|
Accrued pension costs
|
1,277
|
|
1,012
|
|
|||
|
Accrued postretirement health care costs
|
2,245
|
|
2,461
|
|
|||
|
Other liabilities
|
447
|
|
503
|
|
|||
|
Total liabilities
|
29,625
|
|
31,430
|
|
|||
|
Contingencies (Note 18)
|
|
|
|||||
|
Redeemable noncontrolling interest
|
37
|
|
35
|
|
|||
|
Stockholders’ Equity
|
|||||||
|
Common stock, par value $0.33 1/3 per share
(2,805,961,317 shares issued)
|
935
|
|
935
|
|
|||
|
Additional paid-in capital
|
5,813
|
|
5,735
|
|
|||
|
Earnings reinvested in the business
|
27,257
|
|
26,277
|
|
|||
|
Accumulated other comprehensive losses
|
(3,280
|
)
|
(2,682
|
)
|
|||
|
Cost of repurchased stock
(845,901,836 shares at December 31, 2015 and
834,486,794 shares at December 31, 2014)
|
(27,845
|
)
|
(27,251
|
)
|
|||
|
Total stockholders’ equity attributable to Altria Group, Inc.
|
2,880
|
|
3,014
|
|
|||
|
Noncontrolling interests
|
(7
|
)
|
(4
|
)
|
|||
|
Total stockholders’ equity
|
2,873
|
|
3,010
|
|
|||
|
Total Liabilities and Stockholders’ Equity
|
$
|
32,535
|
|
$
|
34,475
|
|
|
See notes to consolidated financial statements.
40
Altria Group, Inc. and Subsidiaries
(in millions of dollars, except per share data)
____________________________________
|
for the years ended December 31,
|
2015
|
|
2014
|
|
2013
|
|
|||||
|
Net revenues
|
$
|
25,434
|
|
$
|
24,522
|
|
$
|
24,466
|
|
||
|
Cost of sales
|
7,740
|
|
7,785
|
|
7,206
|
|
|||||
|
Excise taxes on products
|
6,580
|
|
6,577
|
|
6,803
|
|
|||||
|
Gross profit
|
11,114
|
|
10,160
|
|
10,457
|
|
|||||
|
Marketing, administration and research costs
|
2,708
|
|
2,539
|
|
2,340
|
|
|||||
|
Changes to Mondelēz and PMI tax-related receivables/payables
|
41
|
|
2
|
|
22
|
|
|||||
|
Asset impairment and exit costs
|
4
|
|
(1
|
)
|
11
|
|
|||||
|
Operating income
|
8,361
|
|
7,620
|
|
8,084
|
|
|||||
|
Interest and other debt expense, net
|
817
|
|
808
|
|
1,049
|
|
|||||
|
Loss on early extinguishment of debt
|
228
|
|
44
|
|
1,084
|
|
|||||
|
Earnings from equity investment in SABMiller
|
(757
|
)
|
(1,006
|
)
|
(991
|
)
|
|||||
|
Other income, net
|
(5
|
)
|
—
|
|
—
|
|
|||||
|
Earnings before income taxes
|
8,078
|
|
7,774
|
|
6,942
|
|
|||||
|
Provision for income taxes
|
2,835
|
|
2,704
|
|
2,407
|
|
|||||
|
Net earnings
|
5,243
|
|
5,070
|
|
4,535
|
|
|||||
|
Net earnings attributable to noncontrolling interests
|
(2
|
)
|
—
|
|
—
|
|
|||||
|
Net earnings attributable to Altria Group, Inc.
|
$
|
5,241
|
|
$
|
5,070
|
|
$
|
4,535
|
|
||
|
Per share data:
|
|||||||||||
|
Basic and diluted earnings per share attributable to Altria Group, Inc.
|
$
|
2.67
|
|
$
|
2.56
|
|
$
|
2.26
|
|
||
See notes to consolidated financial statements.
41
Altria Group, Inc. and Subsidiaries
Consolidated Statements of Comprehensive Earnings
(in millions of dollars)
_______________________
|
for the years ended December 31,
|
2015
|
|
2014
|
|
2013
|
|
||||||
|
Net earnings
|
$
|
5,243
|
|
$
|
5,070
|
|
$
|
4,535
|
|
|||
|
Other comprehensive earnings (losses), net of deferred income taxes:
|
||||||||||||
|
Currency translation adjustments
|
(3
|
)
|
(2
|
)
|
(2
|
)
|
||||||
|
Benefit plans
|
30
|
|
(767
|
)
|
1,141
|
|
||||||
|
SABMiller
|
(625
|
)
|
(535
|
)
|
(477
|
)
|
||||||
|
Other comprehensive (losses) earnings, net of deferred income taxes
|
(598
|
)
|
(1,304
|
)
|
662
|
|
||||||
|
Comprehensive earnings
|
4,645
|
|
3,766
|
|
5,197
|
|
||||||
|
Comprehensive earnings attributable to noncontrolling interests
|
(2
|
)
|
—
|
|
—
|
|
||||||
|
Comprehensive earnings attributable to Altria Group, Inc.
|
$
|
4,643
|
|
$
|
3,766
|
|
$
|
5,197
|
|
|||
See notes to consolidated financial statements.
42
Altria Group, Inc. and Subsidiaries
(in millions of dollars)
__________________
|
for the years ended December 31,
|
2015
|
|
2014
|
|
2013
|
|
|||||||
|
Cash Provided by (Used in) Operating Activities
|
|||||||||||||
|
Net earnings
|
$
|
5,243
|
|
$
|
5,070
|
|
$
|
4,535
|
|
||||
|
Adjustments to reconcile net earnings to operating cash flows:
|
|||||||||||||
|
Depreciation and amortization
|
225
|
|
208
|
|
212
|
|
|||||||
|
Deferred income tax benefit
|
(132
|
)
|
(129
|
)
|
(86
|
)
|
|||||||
|
Earnings from equity investment in SABMiller
|
(757
|
)
|
(1,006
|
)
|
(991
|
)
|
|||||||
|
Dividends from SABMiller
|
495
|
|
456
|
|
439
|
|
|||||||
|
Loss on early extinguishment of debt
|
228
|
|
44
|
|
1,084
|
|
|||||||
|
Cash effects of changes, net of the effects from acquisition of Green Smoke:
|
|||||||||||||
|
Receivables, net
|
3
|
|
(8
|
)
|
78
|
|
|||||||
|
Inventories
|
(33
|
)
|
(184
|
)
|
(133
|
)
|
|||||||
|
Accounts payable
|
(7
|
)
|
(5
|
)
|
(76
|
)
|
|||||||
|
Income taxes
|
(12
|
)
|
1
|
|
(95
|
)
|
|||||||
|
Accrued liabilities and other current assets
|
199
|
|
(107
|
)
|
(107
|
)
|
|||||||
|
Accrued settlement charges
|
90
|
|
109
|
|
(225
|
)
|
|||||||
|
Pension plan contributions
|
(28
|
)
|
(15
|
)
|
(393
|
)
|
|||||||
|
Pension provisions and postretirement, net
|
114
|
|
21
|
|
177
|
|
|||||||
|
Other
|
182
|
|
208
|
|
(44
|
)
|
|||||||
|
Net cash provided by operating activities
|
5,810
|
|
4,663
|
|
4,375
|
|
|||||||
|
Cash Provided by (Used in) Investing Activities
|
|||||||||||||
|
Capital expenditures
|
(229
|
)
|
(163
|
)
|
(131
|
)
|
|||||||
|
Acquisition of Green Smoke, net of acquired cash
|
—
|
|
(102
|
)
|
—
|
|
|||||||
|
Proceeds from finance assets
|
354
|
|
369
|
|
716
|
|
|||||||
|
Payment for derivative financial instrument
|
(132
|
)
|
—
|
|
—
|
|
|||||||
|
Other
|
(8
|
)
|
73
|
|
17
|
|
|||||||
|
Net cash (used in) provided by investing activities
|
(15
|
)
|
177
|
|
602
|
|
|||||||
|
Cash Provided by (Used in) Financing Activities
|
|||||||||||||
|
Long-term debt issued
|
—
|
|
999
|
|
4,179
|
|
|||||||
|
Long-term debt repaid
|
(1,793
|
)
|
(825
|
)
|
(3,559
|
)
|
|||||||
|
Repurchases of common stock
|
(554
|
)
|
(939
|
)
|
(634
|
)
|
|||||||
|
Dividends paid on common stock
|
(4,179
|
)
|
(3,892
|
)
|
(3,612
|
)
|
|||||||
|
Premiums and fees related to early extinguishment of debt
|
(226
|
)
|
(44
|
)
|
(1,054
|
)
|
|||||||
|
Other
|
5
|
|
7
|
|
(22
|
)
|
|||||||
|
Net cash used in financing activities
|
(6,747
|
)
|
(4,694
|
)
|
(4,702
|
)
|
|||||||
|
Cash and cash equivalents:
|
|||||||||||||
|
(Decrease) increase
|
(952
|
)
|
146
|
|
275
|
|
|||||||
|
Balance at beginning of year
|
3,321
|
|
3,175
|
|
2,900
|
|
|||||||
|
Balance at end of year
|
$
|
2,369
|
|
$
|
3,321
|
|
$
|
3,175
|
|
||||
|
Cash paid: Interest
|
|
$
|
776
|
|
$
|
820
|
|
$
|
1,099
|
|
|||
|
Income taxes
|
|
$
|
3,029
|
|
$
|
2,765
|
|
$
|
2,448
|
|
|||
See notes to consolidated financial statements.
43
Altria Group, Inc. and Subsidiaries
Consolidated Statements of Stockholders’ Equity
(in millions of dollars, except per share data)
____________________________________
|
|
Attributable to Altria Group, Inc.
|
|
|
||||||||||||||||||||||||
|
|
Common
Stock
|
|
Additional
Paid-in
Capital
|
|
Earnings
Reinvested in
the Business
|
|
Accumulated
Other
Comprehensive
Losses
|
|
Cost of
Repurchased
Stock
|
|
Non-
controlling
Interests
|
|
Total
Stockholders’
Equity
|
|
|||||||||||||
|
Balances, December 31, 2012
|
$
|
935
|
|
$
|
5,688
|
|
$
|
24,316
|
|
$
|
(2,040
|
)
|
$
|
(25,731
|
)
|
$
|
2
|
|
$
|
3,170
|
|
||||||
|
Net earnings (losses)
(1)
|
—
|
|
—
|
|
4,535
|
|
—
|
|
—
|
|
(3
|
)
|
4,532
|
|
|||||||||||||
|
Other comprehensive earnings, net
of deferred income taxes
|
—
|
|
—
|
|
—
|
|
662
|
|
—
|
|
—
|
|
662
|
|
|||||||||||||
|
Stock award activity
|
—
|
|
26
|
|
—
|
|
—
|
|
11
|
|
—
|
|
37
|
|
|||||||||||||
|
Cash dividends declared ($1.84 per share)
|
—
|
|
—
|
|
(3,683
|
)
|
—
|
|
—
|
|
—
|
|
(3,683
|
)
|
|||||||||||||
|
Repurchases of common stock
|
—
|
|
—
|
|
—
|
|
—
|
|
(600
|
)
|
—
|
|
(600
|
)
|
|||||||||||||
|
Balances, December 31, 2013
|
935
|
|
5,714
|
|
25,168
|
|
(1,378
|
)
|
(26,320
|
)
|
(1
|
)
|
4,118
|
|
|||||||||||||
|
Net earnings (losses)
(1)
|
—
|
|
—
|
|
5,070
|
|
—
|
|
—
|
|
(3
|
)
|
5,067
|
|
|||||||||||||
|
Other comprehensive losses, net
of deferred income taxes
|
—
|
|
—
|
|
—
|
|
(1,304
|
)
|
—
|
|
—
|
|
(1,304
|
)
|
|||||||||||||
|
Stock award activity
|
—
|
|
21
|
|
—
|
|
—
|
|
8
|
|
—
|
|
29
|
|
|||||||||||||
|
Cash dividends declared ($2.00 per share)
|
—
|
|
—
|
|
(3,961
|
)
|
—
|
|
—
|
|
—
|
|
(3,961
|
)
|
|||||||||||||
|
Repurchases of common stock
|
—
|
|
—
|
|
—
|
|
—
|
|
(939
|
)
|
—
|
|
(939
|
)
|
|||||||||||||
|
Balances, December 31, 2014
|
935
|
|
5,735
|
|
26,277
|
|
(2,682
|
)
|
(27,251
|
)
|
(4
|
)
|
3,010
|
|
|||||||||||||
|
Net earnings (losses)
(1)
|
—
|
|
—
|
|
5,241
|
|
—
|
|
—
|
|
(3
|
)
|
5,238
|
|
|||||||||||||
|
Other comprehensive losses, net
of deferred income taxes
|
—
|
|
—
|
|
—
|
|
(598
|
)
|
—
|
|
—
|
|
(598
|
)
|
|||||||||||||
|
Stock award activity
|
—
|
|
78
|
|
—
|
|
—
|
|
(40
|
)
|
—
|
|
38
|
|
|||||||||||||
|
Cash dividends declared ($2.17 per share)
|
—
|
|
—
|
|
(4,261
|
)
|
—
|
|
—
|
|
—
|
|
(4,261
|
)
|
|||||||||||||
|
Repurchases of common stock
|
—
|
|
—
|
|
—
|
|
—
|
|
(554
|
)
|
—
|
|
(554
|
)
|
|||||||||||||
|
Balances, December 31, 2015
|
$
|
935
|
|
$
|
5,813
|
|
$
|
27,257
|
|
$
|
(3,280
|
)
|
$
|
(27,845
|
)
|
$
|
(7
|
)
|
$
|
2,873
|
|
||||||
(1)
Net losses attributable to noncontrolling interests for the years ended
December 31, 2015
,
2014
and
2013
exclude net earnings of
$5 million
,
$3 million
and
$3 million
, respectively, due to the redeemable noncontrolling interest related to Stag’s Leap Wine Cellars, which is reported in the mezzanine equity section in the consolidated balance sheets at
December 31, 2015
,
2014
and
2013
, respectively. See
Note 18
.
See notes to consolidated financial statements.
44
Altria Group, Inc. and Subsidiaries
Notes to Consolidated Financial Statements
_________________________
Note 1
. Background and Basis of Presentation
▪
Background:
At
December 31, 2015
, Altria Group, Inc.’s wholly-owned subsidiaries included Philip Morris USA Inc. (“PM USA”), which is engaged predominantly in the manufacture and sale of cigarettes in the United States; John Middleton Co. (“Middleton”), which is engaged in the manufacture and sale of machine-made large cigars and pipe tobacco, and is a wholly-owned subsidiary of PM USA; and UST LLC (“UST”), which through its wholly-owned subsidiaries, including U.S. Smokeless Tobacco Company LLC (“USSTC”) and Ste. Michelle Wine Estates Ltd. (“Ste. Michelle”), is engaged in the manufacture and sale of smokeless tobacco products and wine. Altria Group, Inc.’s other operating companies included Nu Mark LLC (“Nu Mark”), a wholly-owned subsidiary that is engaged in the manufacture and sale of innovative tobacco products, and Philip Morris Capital Corporation (“PMCC”), a wholly-owned subsidiary that maintains a portfolio of finance assets, substantially all of which are leveraged leases. Other Altria Group, Inc. wholly-owned subsidiaries included Altria Group Distribution Company, which provides sales, distribution and consumer engagement services to certain Altria Group, Inc. operating subsidiaries, and Altria Client Services LLC, which provides various support services in areas such as legal, regulatory, finance, human resources and external affairs to Altria Group, Inc. and its subsidiaries. Altria Group, Inc.’s access to the operating cash flows of its wholly-owned subsidiaries consists of cash received from the payment of dividends and distributions, and the payment of interest on intercompany loans by its subsidiaries. At
December 31, 2015
, Altria Group, Inc.’s principal wholly-owned subsidiaries were not limited by long-term debt or other agreements in their ability to pay cash dividends or make other distributions with respect to their equity interests.
At
December 31, 2015
, Altria Group, Inc. also held approximately
27%
of the economic and voting interest of SABMiller plc (“SABMiller”), which Altria Group, Inc. accounts for under the equity method of accounting. Altria Group, Inc. receives cash dividends on its interest in SABMiller if and when SABMiller pays such dividends. On November 11, 2015, Anheuser-Busch InBev SA/NV (“AB InBev”) announced its firm offer to effect a business combination with SABMiller in a cash and stock transaction. For further discussion, see
Note 6
.
Investment in SABMiller
.
▪
Basis of Presentation:
The consolidated financial statements include Altria Group, Inc., as well as its wholly-owned and majority-owned subsidiaries. Investments in which Altria Group, Inc. has the ability to exercise significant influence are accounted for under the equity method of accounting. All intercompany transactions and balances have been eliminated.
The preparation of financial statements in conformity with accounting principles generally accepted in the United States of America (“U.S. GAAP”) requires management to make estimates and assumptions that affect the reported amounts of assets and liabilities, the disclosure of contingent liabilities at the dates of the financial statements and the reported amounts of net revenues
and expenses during the reporting periods. Significant estimates and assumptions include, among other things, pension and benefit plan assumptions, lives and valuation assumptions for goodwill and other intangible assets, marketing programs, income taxes, and the allowance for losses and estimated residual values of finance leases. Actual results could differ from those estimates.
Note 2
. Summary of Significant Accounting Policies
▪
Cash and Cash Equivalents:
Cash equivalents include demand deposits with banks and all highly liquid investments with original maturities of three months or less. Cash equivalents are stated at cost plus accrued interest, which approximates fair value.
▪
Depreciation, Amortization, Impairment Testing and Asset Valuation:
Property, plant and equipment are stated at historical costs and depreciated by the straight-line method over the estimated useful lives of the assets. Machinery and equipment are depreciated over periods up to
25
years, and buildings and building improvements over periods up to
50
years. Definite-lived intangible assets are amortized over their estimated useful lives up to
25
years.
Altria Group, Inc. reviews long-lived assets, including definite-lived intangible assets, for impairment whenever events or changes in business circumstances indicate that the carrying value of the assets may not be fully recoverable. Altria Group, Inc. performs undiscounted operating cash flow analyses to determine if an impairment exists. For purposes of recognition and measurement of an impairment for assets held for use, Altria Group, Inc. groups assets and liabilities at the lowest level for which cash flows are separately identifiable. If an impairment is determined to exist, any related impairment loss is calculated based on fair value. Impairment losses on assets to be disposed of, if any, are based on the estimated proceeds to be received, less costs of disposal. Altria Group, Inc. also reviews the estimated remaining useful lives of long-lived assets whenever events or changes in business circumstances indicate the lives may have changed.
Altria Group, Inc. conducts a required annual review of goodwill and indefinite-lived intangible assets for potential impairment, and more frequently if an event occurs or circumstances change that would require Altria Group, Inc. to perform an interim review. If the carrying value of goodwill exceeds its fair value, which is determined using discounted cash flows, goodwill is considered impaired. The amount of impairment loss is measured as the difference between the carrying value and the implied fair value. If the carrying value of an indefinite-lived intangible asset exceeds its fair value, which is determined using discounted cash flows, the intangible asset is considered impaired and is reduced to fair value.
▪
Derivative Financial Instruments:
Derivative financial instruments are recorded at fair value on the consolidated balance sheets as either assets or liabilities. Changes in the fair value of derivatives are recorded each period either in accumulated other comprehensive earnings (losses) or in earnings, depending on the
45
Altria Group, Inc. and Subsidiaries
Notes to Consolidated Financial Statements
_________________________
type of derivative and whether the derivative qualifies for hedge accounting treatment. Gains and losses on derivative instruments reported in accumulated other comprehensive earnings (losses) are reclassified to the consolidated statements of earnings in the periods in which operating results are affected by the respective hedged item. Cash flows from hedging instruments are classified in the same manner as the respective hedged item in the consolidated statements of cash flows. Altria Group, Inc. does not enter into or hold derivative financial instruments for trading or speculative purposes.
▪
Employee Benefit Plans:
Altria Group, Inc. provides a range of benefits to its employees and retired employees, including pension, postretirement health care and postemployment benefits. Altria Group, Inc. records annual amounts relating to these plans based on calculations specified by U.S. GAAP, which include various actuarial assumptions as to discount rates, assumed rates of return on plan assets, mortality, compensation increases, turnover rates and health care cost trend rates.
Altria Group, Inc. recognizes the funded status of its defined benefit pension and other postretirement plans on the consolidated balance sheet and records as a component of other comprehensive earnings (losses), net of deferred income taxes, the gains or losses and prior service costs or credits that have not been recognized as components of net periodic benefit cost. The gains or losses and prior service costs or credits recorded as components of other comprehensive earnings (losses) are subsequently amortized into net periodic benefit cost in future years.
▪
Environmental Costs:
Altria Group, Inc. is subject to laws and regulations relating to the protection of the environment. Altria Group, Inc. provides for expenses associated with environmental remediation obligations on an undiscounted basis when such amounts are probable and can be reasonably estimated. Such accruals are adjusted as new information develops or circumstances change.
Compliance with environmental laws and regulations, including the payment of any remediation and compliance costs or damages and the making of related expenditures, has not had, and is not expected to have, a material adverse effect on Altria Group, Inc.’s consolidated results of operations, capital expenditures, financial position or cash flows (see
Note 18
.
Contingencies
-
Environmental Regulation
).
▪
Fair Value Measurements:
Altria Group, Inc. measures certain assets and liabilities at fair value. Fair value is defined as the exchange price that would be received to sell an asset or paid to transfer a liability (an exit price) in the principal or most advantageous market for the asset or liability in an orderly transaction between market participants on the measurement date. Altria Group, Inc. uses a fair value hierarchy, which gives the highest priority to unadjusted quoted prices in active markets for identical assets and liabilities (Level 1 measurements) and the lowest priority to unobservable inputs (Level 3 measurements). The three levels of inputs used to measure fair value are:
|
Level 1
|
Unadjusted quoted prices in active markets for identical assets or liabilities.
|
|
Level 2
|
Observable inputs other than Level 1 prices, such as quoted prices for similar assets or liabilities; quoted prices in markets that are not active; or other inputs that are observable or can be corroborated by observable market data for substantially the full term of the assets or liabilities.
|
|
Level 3
|
Unobservable inputs that are supported by little or no market activity and that are significant to the fair value of the assets or liabilities.
|
▪
Finance Leases:
Income attributable to leveraged leases is initially recorded as unearned income and subsequently recognized as revenue over the terms of the respective leases at constant after-tax rates of return on the positive net investment balances. Investments in leveraged leases are stated net of related nonrecourse debt obligations.
Finance leases include unguaranteed residual values that represent PMCC’s estimates at lease inception as to the fair values of assets under lease at the end of the non-cancelable lease terms. The estimated residual values are reviewed at least annually by PMCC’s management. This review includes analysis of a number of factors, including activity in the relevant industry. If necessary, revisions are recorded to reduce the residual values.
PMCC considers rents receivable past due when they are beyond the grace period of their contractual due date. PMCC stops recording income (“non-accrual status”) on rents receivable when contractual payments become
90
days past due or earlier if management believes there is significant uncertainty of collectability of rent payments, and resumes recording income when collectability of rent payments is reasonably certain. Payments received on rents receivable that are on non-accrual status are used to reduce the rents receivable balance. Write-offs to the allowance for losses are recorded when amounts are deemed to be uncollectible.
▪
Guarantees:
Altria Group, Inc. recognizes a liability for the fair value of the obligation of qualifying guarantee activities. See
Note 18
. Contingencies
for a further discussion of guarantees.
▪
Income Taxes:
Significant judgment is required in determining income tax provisions and in evaluating tax positions.
Deferred tax assets and liabilities are determined based on the difference between the financial statement and tax bases of assets and liabilities, using enacted tax rates in effect for the year in which the differences are expected to reverse. Altria Group, Inc. records a valuation allowance when it is more-likely-than-not that some portion or all of a deferred tax asset will not be realized.
Altria Group, Inc. recognizes a benefit for uncertain tax positions when a tax position taken or expected to be taken in a tax return is more-likely-than-not to be sustained upon examination by taxing authorities. The amount recognized is measured as
the largest amount of benefit that is greater than 50% likely of being realized upon ultimate settlement.
Altria Group, Inc. recognizes accrued interest and penalties associated with uncertain tax positions as part of the provision for income taxes on its consolidated statements of earnings.
46
Altria Group, Inc. and Subsidiaries
Notes to Consolidated Financial Statements
_________________________
▪
Inventories:
Inventories are stated at the lower of cost or market. The last-in, first-out (“LIFO”) method is used to determine the cost of substantially all tobacco inventories. The cost of the remaining inventories is determined using the first-in, first-out and average cost methods. It is a generally recognized industry practice to classify leaf tobacco and wine inventories as current assets although part of such inventory, because of the duration of the curing and aging process, ordinarily would not be used within one year.
▪
Litigation Contingencies and Costs:
Altria Group, Inc. and its subsidiaries record provisions in the consolidated financial statements for pending litigation when it is determined that an unfavorable outcome is probable and the amount of the loss can be reasonably estimated. Litigation defense costs are expensed as incurred and included in marketing, administration and research costs on the consolidated statements of earnings.
▪
Marketing Costs:
Altria Group, Inc.’s businesses promote their products with consumer engagement programs, consumer incentives and trade promotions. Such programs include discounts, coupons, rebates, in-store display incentives, event marketing and volume-based incentives. Consumer engagement programs are expensed as incurred. Consumer incentive and trade promotion activities are recorded as a reduction of revenues, a portion of which is based on amounts estimated as being due to wholesalers, retailers and consumers at the end of a period, based principally on historical volume, utilization and redemption rates. For interim reporting purposes, consumer engagement programs and certain consumer incentive expenses are charged to operations as a percentage of sales, based on estimated sales and related expenses for the full year.
▪
Revenue Recognition:
Altria Group, Inc.’s businesses recognize revenues, net of sales incentives and sales returns, and including shipping and handling charges billed to customers, upon shipment of goods when title and risk of loss pass to customers. Payments received in advance of revenue recognition are deferred and recorded in other accrued liabilities until revenue is recognized. Altria Group, Inc.’s businesses also include excise taxes billed to customers in net revenues. Shipping and handling costs are classified as part of cost of sales.
▪
Stock-Based Compensation:
Altria Group, Inc. measures compensation cost for all stock-based awards at fair value on date of grant and recognizes compensation expense over the service periods for awards expected to vest. The fair value of restricted stock and restricted stock units (also known as deferred stock) is determined based on the number of shares granted and the market value at date of grant.
▪
New Accounting Standards:
In May 2014, the Financial Accounting Standards Board (“FASB”) issued authoritative guidance for recognizing revenue from contracts with customers. The objective of this guidance is to establish principles for reporting information about the nature, amount, timing and uncertainty of revenue and cash flows arising from an entity’s contracts with customers. As a result of an August 2015 FASB
update, the new guidance will be effective for Altria Group, Inc. for annual reporting periods beginning after December 15, 2017, including interim periods within that reporting period. Early adoption is permitted only as of annual reporting periods beginning after December 15, 2016, including interim reporting periods within that reporting period. Altria Group, Inc. is in the process of evaluating the impact of this guidance on its consolidated financial statements and related disclosures.
In April 2015, the FASB issued authoritative guidance to simplify the presentation of debt issuance costs by requiring that debt issuance costs related to a recognized debt liability be presented on the balance sheet as a direct deduction from the carrying amount of that debt liability, consistent with debt discounts, rather than as a deferred charge (an asset). For Altria Group, Inc., the new guidance will be effective for annual reporting periods beginning after December 15, 2015, including interim periods within that reporting period. The guidance requires all prior period balance sheets to be adjusted retrospectively and early adoption is permitted. Altria Group, Inc. will adopt the new guidance in the first quarter of 2016. At
December 31, 2015
and
2014
, Altria Group, Inc. had
$72 million
and
$83 million
, respectively, of debt issuance costs included in other assets on its consolidated balance sheets.
In November 2015, the FASB issued authoritative guidance to simplify the presentation of deferred income taxes by requiring that deferred tax liabilities and assets be classified as noncurrent in a classified statement of financial position. This guidance does not change the current requirement that deferred tax liabilities and assets for each tax-paying jurisdiction be offset and presented as a single amount. For Altria Group, Inc., the new guidance will be effective for annual reporting periods beginning after December 15, 2016, including interim periods within that reporting period. Early adoption is permitted. The guidance may be applied either prospectively to all deferred tax liabilities and assets or retrospectively to all periods presented. Altria Group, Inc. will adopt the new guidance by the first quarter of 2017. Under the new guidance, at
December 31, 2015
, current deferred income tax assets of approximately
$1.2 billion
would have been reclassified to noncurrent deferred income tax liabilities (
$1.0 billion
) and noncurrent deferred income tax assets (
$0.2 billion
).
On January 5, 2016, the FASB issued authoritative guidance to address certain aspects of recognition, measurement, presentation and disclosure of financial instruments. For Altria Group, Inc., the new guidance will be effective for annual reporting periods beginning after December 15, 2017, including interim periods within that reporting period. Early adoption of the guidance is not permitted, except for a certain provision of the guidance. Altria Group, Inc. is in the process of evaluating the impact of this guidance on its consolidated financial statements and related disclosures.
Note 3
. Acquisition of Green Smoke
In April 2014, Nu Mark acquired the e-vapor business of Green Smoke, Inc. and its affiliates (“Green Smoke”) for a total purchase price of approximately
$130 million
. The acquisition
47
Altria Group, Inc. and Subsidiaries
Notes to Consolidated Financial Statements
_________________________
complements Nu Mark’s capabilities and enhances its competitive position by adding e-vapor experience, broadening product offerings and strengthening supply chain capabilities.
Green Smoke’s financial position and results of operations have been consolidated with Altria Group, Inc. as of April 1, 2014.
Pro forma results, as well as net revenues and net earnings for Green Smoke subsequent to the acquisition, have not been presented because the acquisition of Green Smoke is not material to Altria Group, Inc.’s consolidated results of operations.
The purchase price allocation has been completed, and there were no changes subsequent to the acquisition date.
Costs incurred to effect the acquisition, as well as integration costs, were recognized as expenses in the periods in which the costs were incurred. For the years ended December 31,
2015
and
2014
, Altria Group, Inc. incurred
$7 million
and
$28 million
, respectively, of pre-tax integration and acquisition-related costs, consisting primarily of contract termination costs, transaction costs and inventory adjustments, which were included in Altria Group, Inc.’s consolidated statements of earnings.
Note 4
. Goodwill and Other Intangible Assets, net
Goodwill and other intangible assets, net, by segment were as follows:
|
|
Goodwill
|
Other Intangible Assets, net
|
|||||||||||||
|
(in millions)
|
December 31, 2015
|
|
December 31, 2014
|
|
December 31, 2015
|
|
December 31, 2014
|
|
|||||||
|
Smokeable products
|
$
|
77
|
|
$
|
77
|
|
$
|
2,919
|
|
$
|
2,937
|
|
|||
|
Smokeless products
|
5,023
|
|
5,023
|
|
8,831
|
|
8,833
|
|
|||||||
|
Wine
|
74
|
|
74
|
|
267
|
|
268
|
|
|||||||
|
Other
|
111
|
|
111
|
|
11
|
|
11
|
|
|||||||
|
Total
|
$
|
5,285
|
|
$
|
5,285
|
|
$
|
12,028
|
|
$
|
12,049
|
|
|||
Goodwill relates to Altria Group, Inc.’s 2014 acquisition of Green Smoke, 2009 acquisition of UST and 2007 acquisition of Middleton.
Other intangible assets consisted of the following:
|
December 31, 2015
|
December 31, 2014
|
||||||||||||||
|
(in millions)
|
Gross Carrying Amount
|
|
Accumulated Amortization
|
|
Gross Carrying Amount
|
|
Accumulated Amortization
|
|
|||||||
|
Indefinite-lived intangible assets
|
$
|
11,711
|
|
$
|
—
|
|
$
|
11,711
|
|
$
|
—
|
|
|||
|
Definite-lived intangible assets
|
465
|
|
148
|
|
465
|
|
127
|
|
|||||||
|
Total other intangible assets
|
$
|
12,176
|
|
$
|
148
|
|
$
|
12,176
|
|
$
|
127
|
|
|||
Indefinite-lived intangible assets consist substantially of trademarks from Altria Group, Inc.’s 2009 acquisition of UST (
$9.1 billion
) and 2007 acquisition of Middleton (
$2.6 billion
). Definite-lived intangible assets, which consist primarily of customer relationships and certain cigarette trademarks, are amortized over periods up to
25
years. Pre-tax amortization expense for definite-lived intangible assets during the years ended
December 31, 2015
,
2014
and
2013
, was
$21 million
,
$20 million
and
$20 million
, respectively. Annual amortization expense for each of the next five years is estimated to be approximately
$20 million
, assuming no additional transactions occur that require the amortization of intangible assets.
During
2015
,
2014
and
2013
, Altria Group, Inc. completed its quantitative annual impairment test of goodwill and indefinite-lived intangible assets, and
no
impairment charges resulted.
For the years ended
December 31, 2015
,
2014
and
2013
, there have been
no
changes in goodwill and the gross carrying amount of other intangible assets except for the 2014 acquisition of Green Smoke. In addition, there were
no
accumulated impairment losses related to goodwill and other intangible assets, net at
December 31, 2015
and
2014
.
Note 5
. Inventories
The cost of approximately
65%
and
66%
of inventories at
December 31, 2015
and
2014
, respectively, was determined using the LIFO method. The stated LIFO amounts of inventories were approximately
$0.7 billion
lower than the current cost of inventories at
December 31, 2015
and
2014
.
Note 6
.
Investment in SABMiller
At
December 31, 2015
, Altria Group, Inc. held approximately
27%
of the economic and voting interest of SABMiller. Altria Group, Inc. accounts for its investment in SABMiller under the equity method of accounting.
Pre-tax earnings from Altria Group, Inc.’s equity investment in SABMiller were
$757 million
,
$1,006 million
and
$991 million
for the years ended December 31,
2015
,
2014
and
2013
, respectively.
48
Altria Group, Inc. and Subsidiaries
Notes to Consolidated Financial Statements
_________________________
Summary financial data of SABMiller is as follows:
|
|
At December 31,
|
||||||
|
(in millions)
|
2015
|
|
2014
|
|
|||
|
Current assets
|
$
|
4,266
|
|
$
|
5,878
|
|
|
|
Long-term assets
|
$
|
38,425
|
|
$
|
43,812
|
|
|
|
Current liabilities
|
$
|
6,282
|
|
$
|
10,051
|
|
|
|
Long-term liabilities
|
$
|
13,960
|
|
$
|
14,731
|
|
|
|
Noncontrolling interests
|
$
|
1,235
|
|
$
|
1,241
|
|
|
|
|
For the Years Ended December 31,
|
||||||||||
|
(in millions)
|
2015
|
|
2014
|
|
2013
|
|
|||||
|
Net revenues
|
$
|
20,188
|
|
$
|
22,380
|
|
$
|
22,684
|
|
||
|
Operating profit
|
$
|
3,690
|
|
$
|
4,478
|
|
$
|
4,201
|
|
||
|
Net earnings
|
$
|
2,838
|
|
$
|
3,532
|
|
$
|
3,375
|
|
||
The fair value of Altria Group, Inc.’s equity investment in SABMiller is based on unadjusted quoted prices in active markets and is classified in Level 1 of the fair value hierarchy. The fair value of Altria Group, Inc.’s equity investment in SABMiller at
December 31, 2015
and
2014
, was
$25.8 billion
and
$22.5 billion
, respectively, as compared with its carrying value of
$5.5 billion
and
$6.2 billion
, respectively.
At
December 31, 2015
, Altria Group, Inc.’s earnings reinvested in the business on its consolidated balance sheet included approximately
$3.2 billion
of undistributed earnings from its equity investment in SABMiller.
▪
AB InBev and SABMiller Business Combination:
On November 11, 2015, AB InBev announced its firm offer to effect a business combination with SABMiller in a cash and stock transaction valued at approximately
$107 billion
. Under the terms of the transaction, SABMiller shareholders will receive
44
British pounds in cash for each SABMiller share, with a partial share alternative (“PSA”) available for approximately
41%
of the SABMiller shares.
Under the terms of the PSA, SABMiller shareholders may elect to receive for each SABMiller share held (i)
0.483969
restricted shares (the “Restricted Shares”) in a newly formed Belgian company (“NewCo”) that will own the combined SABMiller and AB InBev business plus (ii)
3.7788
British pounds (“GBP”) in cash. On November 10, 2015, the Board of Directors of Altria Group, Inc. (the “Board of Directors”) authorized Altria Group, Inc. to provide an irrevocable undertaking to vote Altria Group, Inc.’s shares of SABMiller in favor of the proposed transaction and to elect the PSA (the “Irrevocable Undertaking”). Altria Group, Inc. delivered the Irrevocable Undertaking on November 11, 2015.
If the transaction is completed, NewCo will acquire SABMiller and, following the closing of that acquisition, AB InBev will merge into NewCo. Altria Group, Inc. expects to exchange its approximate
27%
economic and voting interest in SABMiller for an interest that will be converted into Restricted Shares representing an approximate
10.5%
economic and voting interest in NewCo plus approximately
$2.5 billion
in pre-tax cash (subject to proration as further described below).
The Restricted Shares of NewCo will:
|
▪
|
be unlisted and not admitted to trading on any stock exchange;
|
|
▪
|
be subject to a
five
-year lock-up from closing (subject to limited exceptions);
|
|
▪
|
be convertible into ordinary shares of NewCo on a one-for-one basis after the end of this
five
-year lock-up period;
|
|
▪
|
rank equally with ordinary shares of NewCo with regards to dividends and voting rights; and
|
|
▪
|
have director nomination rights with respect to NewCo.
|
Altria Group, Inc. expects that its gain on the transaction will be deferred for United States corporate income tax purposes, except to the extent of cash consideration received. Altria Group, Inc. and AB InBev have entered into a tax matters agreement providing for certain covenants, representations and warranties and indemnification obligations of AB InBev and NewCo in connection with the transaction and the provision of information necessary to assist Altria Group, Inc. in connection with its United States federal income tax reporting.
Based on the anticipated structure of the transaction, Altria Group, Inc. expects to account for its investment in NewCo under the equity method of accounting. Altria Group, Inc. and AB InBev have entered into an information rights agreement pursuant to which, following completion of the transaction, NewCo will provide Altria Group, Inc. with certain financial information necessary to assist Altria Group, Inc. in connection with its financial reporting, financial controls and financial planning.
Upon closing of the transaction, Altria Group, Inc. estimates that it will record a one-time pre-tax accounting gain of approximately
$12 billion
, or
$8 billion
after-tax. This estimate is based on the AB InBev share price, GBP to United States dollar (“USD”) exchange rate and book value of Altria Group, Inc.’s investment in SABMiller at December 31, 2015. The actual gain recorded at closing may vary significantly from this estimate based on changes to these factors and any proration of Restricted Shares as discussed further below.
If the transaction is completed, Altria Group, Inc. expects to receive Restricted Shares representing an economic and voting interest in NewCo of approximately
10.5%
; however, the number of shares that Altria Group, Inc. receives and its corresponding percentage ownership of NewCo at closing are subject to proration because the PSA limits the maximum number of shares that may be issued under the offer to
326 million
NewCo Restricted Shares. To the extent that elections for the PSA exceed this maximum number and cannot be satisfied in full, the equity portion of all PSA elections will be adjusted downwards on a pro rata basis. It is possible that significant proration could (i) reduce Altria Group, Inc.’s projected percentage ownership of NewCo; (ii) increase the amount of cash that Altria Group, Inc. receives; (iii) increase the amount of the pre-tax gain recorded by Altria Group, Inc.; (iv) impose additional tax liabilities on Altria Group, Inc.; and (v) impact Altria Group, Inc.’s ability to account for its investment in NewCo under the equity method of accounting.
49
Altria Group, Inc. and Subsidiaries
Notes to Consolidated Financial Statements
_________________________
The transaction is subject to certain closing conditions, including shareholder approvals of both SABMiller and AB InBev, and receipt of the required regulatory approvals.
Derivative Financial Instrument:
On November 11, 2015, Altria Group, Inc. entered into a derivative financial instrument in the form of a put option (the “option”) to hedge Altria Group, Inc.’s exposure to foreign currency exchange rate movements for the GBP, which would impact the USD cash consideration that Altria Group, Inc. expects to receive under the PSA. Altria Group, Inc. has the ability to exercise or terminate the option up to its expiration date of May 11, 2017. The notional amount of the option is
$2,467 million
(
1,625 million
GBP). The option does not qualify for hedge accounting; therefore, changes in the fair value of the option will be recorded as a pre-tax gain or loss in Altria Group, Inc.’s consolidated statement of earnings for the periods in which the changes occur. For the year ended December 31, 2015, Altria Group, Inc. recorded a pre-tax gain of
$20 million
for the change in the fair value of the option, which was included in other income, net.
The fair value of the option is determined using a binomial option pricing model, which reflects the contractual terms of the option and other observable market-based inputs, and is classified in Level 2 of the fair value hierarchy. At December 31, 2015, the fair value of the option of
$152 million
was recorded in other current assets in Altria Group, Inc.’s consolidated balance sheet.
Note 7
. Finance Assets, net
In 2003, PMCC ceased making new investments and began focusing exclusively on managing its portfolio of finance assets in order to maximize its operating results and cash flows from its existing lease portfolio activities and asset sales. Accordingly, PMCC’s operating companies income will fluctuate over time as investments mature or are sold.
At
December 31, 2015
, finance assets, net, of
$1,239 million
were comprised of investments in finance leases of $
1,281 million
, reduced by the allowance for losses of
$42 million
. At
December 31, 2014
, finance assets, net, of
$1,614 million
were comprised of investments in finance leases of
$1,656 million
, reduced by the allowance for losses of
$42 million
.
A summary of the net investments in finance leases, substantially all of which were leveraged leases, at
December 31, 2015
and
2014
, before allowance for losses was as follows:
|
(in millions)
|
2015
|
|
2014
|
|
||||
|
Rents receivable, net
|
$
|
923
|
|
$
|
1,241
|
|
||
|
Unguaranteed residual values
|
674
|
|
827
|
|
||||
|
Unearned income
|
(316
|
)
|
(412
|
)
|
||||
|
Investments in finance leases
|
1,281
|
|
1,656
|
|
||||
|
Deferred income taxes
|
(928
|
)
|
(1,135
|
)
|
||||
|
Net investments in finance leases
|
$
|
353
|
|
$
|
521
|
|
||
Rents receivable, net, represent unpaid rents, net of principal and interest payments on third-party nonrecourse debt. PMCC’s
rights to rents receivable are subordinate to the third-party nonrecourse debtholders and the leased equipment is pledged as collateral to the debtholders. The repayment of the nonrecourse debt is collateralized by lease payments receivable and the leased property, and is nonrecourse to the general assets of PMCC. As required by U.S. GAAP, the third-party nonrecourse debt of
$1.2 billion
and
$2.1 billion
at
December 31, 2015
and
2014
, respectively, has been offset against the related rents receivable. There were
no
leases with contingent rentals in
2015
and
2014
.
In
2015
and
2014
, PMCC’s review of estimated residual values resulted in a decrease of
$65 million
and
$63 million
, respectively, to unguaranteed residual values. These decreases in unguaranteed residual values resulted in a reduction to PMCC’s net revenues of
$41 million
and
$26 million
in
2015
and
2014
, respectively. There were no such adjustments in 2013.
At
December 31, 2015
, PMCC’s investments in finance leases were principally comprised of the following investment categories: aircraft (
45%
), electric power (
24%
), railcar (
12%
), real estate (
12%
) and manufacturing (
7%
). There were
no
investments located outside the United States at
December 31, 2015
and
2014
.
Rents receivable in excess of debt service requirements on third-party nonrecourse debt at
December 31, 2015
were as follows:
|
(in millions)
|
|||
|
2016
|
$
|
42
|
|
|
2017
|
64
|
|
|
|
2018
|
155
|
|
|
|
2019
|
192
|
|
|
|
2020
|
136
|
|
|
|
Thereafter
|
334
|
|
|
|
Total
|
$
|
923
|
|
Included in net revenues for the years ended
December 31, 2015
,
2014
and
2013
were leveraged lease revenues of
$46 million
,
$80 million
and
$209 million
, respectively. Income tax expense, excluding interest on tax underpayments, on leveraged lease revenues for the years
ended
December 31, 2015
,
2014
and
2013
was
$17 million
,
$30 million
and
$80 million
, respectively.
PMCC maintains an allowance for losses that provides for estimated credit losses on its investments in finance leases. PMCC’s portfolio consists substantially of leveraged leases to a diverse base of lessees participating in a variety of industries. Losses on such leases are recorded when probable and estimable. PMCC regularly performs a systematic assessment of each individual lease in its portfolio to determine potential credit or collection issues that might indicate impairment. Impairment takes into consideration both the probability of default and the likelihood of recovery if default were to occur. PMCC considers both quantitative and qualitative factors of each investment when performing its assessment of the allowance for losses.
Quantitative factors that indicate potential default are tied most directly to public debt ratings. PMCC monitors publicly available information on its obligors, including financial
50
Altria Group, Inc. and Subsidiaries
Notes to Consolidated Financial Statements
_________________________
statements and credit rating agency reports. Qualitative factors that indicate the likelihood of recovery if default were to occur include underlying collateral value, other forms of credit support, and legal/structural considerations impacting each lease. Using available information, PMCC calculates potential losses for each lease in its portfolio based on its default and recovery rating assumptions for each lease. The aggregate of these potential losses forms a range of potential losses which is used as a guideline to determine the adequacy of PMCC’s allowance for losses.
PMCC assesses the adequacy of its allowance for losses relative to the credit risk of its leasing portfolio on an ongoing basis. During
2014
and
2013
, PMCC determined that its allowance for losses exceeded the amount required based on management’s assessment of the credit quality and size of PMCC’s leasing portfolio. As a result, PMCC reduced its allowance for losses by
$10 million
and
$47 million
for the years ended December 31,
2014
and
2013
, respectively. These decreases to the allowance for losses were recorded as a reduction to marketing, administration and research costs on Altria Group, Inc.’s consolidated statements of earnings. PMCC believes that, as of
December 31, 2015
, the allowance for losses of
$42 million
was adequate. PMCC continues to monitor economic and credit conditions, and the individual situations of its lessees and their respective industries, and may increase or decrease its allowance for losses if such conditions change in the future.
The activity in the allowance for losses on finance assets for the years ended
December 31, 2015
,
2014
and
2013
was as follows:
|
(in millions)
|
2015
|
|
2014
|
|
2013
|
|
|||||
|
Balance at beginning of year
|
$
|
42
|
|
$
|
52
|
|
$
|
99
|
|
||
|
Decrease to allowance
|
—
|
|
(10
|
)
|
(47
|
)
|
|||||
|
Balance at end of year
|
$
|
42
|
|
$
|
42
|
|
$
|
52
|
|
||
All
PMCC lessees were current on their lease payment obligations as of
December 31, 2015
.
The credit quality of PMCC’s investments in finance leases as assigned by Standard & Poor’s Ratings Services (“Standard & Poor’s”) and Moody’s Investors Service, Inc. (“Moody’s”) at
December 31, 2015
and
2014
was as follows:
|
(in millions)
|
2015
|
|
2014
|
|
|||
|
Credit Rating by Standard & Poor’s/Moody’s:
|
|||||||
|
“AAA/Aaa” to “A-/A3”
|
$
|
212
|
|
$
|
417
|
|
|
|
“BBB+/Baa1” to “BBB-/Baa3”
|
702
|
|
833
|
|
|||
|
“BB+/Ba1” and Lower
|
367
|
|
406
|
|
|||
|
Total
|
$
|
1,281
|
|
$
|
1,656
|
|
|
Note 8
. Short-Term Borrowings and Borrowing Arrangements
At
December 31, 2015
and
December 31, 2014
, Altria Group, Inc. had
no
short-term borrowings. The credit line available to Altria Group, Inc. at
December 31, 2015
under the Credit Agreement (as defined below) was
$3.0 billion
.
During the third quarter of 2015, Altria Group, Inc. entered into an extension agreement (the “Extension Agreement”) to amend its
$3.0 billion
senior unsecured
5
-year revolving credit agreement, dated as of August 19, 2013 (the “Credit Agreement”). The Extension Agreement extends the expiration date of the Credit Agreement from
August 19, 2019
to
August 19, 2020
pursuant to the terms of the Credit Agreement. All other terms and conditions of the Credit Agreement remain in full force and effect. The Credit Agreement was previously amended in 2014 to extend the expiration date from
August 19, 2018
to
August 19, 2019
.
The Credit Agreement provides for borrowings up to an aggregate principal amount of
$3.0 billion
. Pricing for interest and fees under the Credit Agreement may be modified in the event of a change in the rating of Altria Group, Inc.’s long-term senior unsecured debt. Interest rates on borrowings under the Credit Agreement are expected to be based on the London Interbank Offered Rate (“LIBOR”) plus a percentage based on the higher of the ratings of Altria Group, Inc.’s long-term senior unsecured debt from Moody’s and Standard & Poor’s. The applicable percentage based on Altria Group, Inc.’s long-term senior unsecured debt ratings at
December 31, 2015
for borrowings under the Credit Agreement was
1.25%
. The Credit Agreement does not include any other rating triggers, nor does it contain any provisions that could require the posting of collateral.
The Credit Agreement is used for general corporate purposes and to support Altria Group, Inc.’s commercial paper issuances. The Credit Agreement requires that Altria Group, Inc. maintain (i) a ratio of debt to consolidated earnings before interest, taxes, depreciation and amortization (“EBITDA”) of not more than
3.0
to 1.0 and (ii) a ratio of consolidated EBITDA to consolidated interest expense of not less than
4.0
to 1.0, each calculated as of the end of the applicable quarter on a rolling four quarters basis. At
December 31, 2015
, the ratios of debt to consolidated EBITDA and consolidated EBITDA to consolidated interest expense, calculated in accordance with the Credit Agreement, were
1.4
to 1.0 and
11.7
to 1.0, respectively. Altria Group, Inc. expects to continue to meet its covenants associated with the Credit Agreement. The terms “consolidated EBITDA,” “debt” and “consolidated interest expense,” as defined in the Credit Agreement, include certain adjustments.
Any commercial paper issued by Altria Group, Inc. and borrowings under the Credit Agreement are guaranteed by PM USA as further discussed in
Note 19
.
Condensed Consolidating Financial Information.
51
Altria Group, Inc. and Subsidiaries
Notes to Consolidated Financial Statements
_________________________
Note 9
. Long-Term Debt
At
December 31, 2015
and
2014
, Altria Group, Inc.’s long-term debt consisted of the following:
|
(in millions)
|
2015
|
|
2014
|
|
|||
|
Notes, 2.625% to 10.20%, interest payable semi-annually, due through 2044
(1)
|
$
|
12,861
|
|
$
|
14,651
|
|
|
|
Debenture, 7.75%, interest payable semi-annually, due 2027
|
42
|
|
42
|
|
|||
|
Other
|
16
|
|
—
|
|
|||
|
12,919
|
|
14,693
|
|
||||
|
Less current portion of long-term debt
|
4
|
|
1,000
|
|
|||
|
$
|
12,915
|
|
$
|
13,693
|
|
||
(1)
Weighted-average coupon interest rate of
5.5%
and
5.7%
at
December 31, 2015
and
2014
, respectively.
Aggregate maturities of long-term debt are as follows:
|
(in millions)
|
||||
|
2016
|
$
|
4
|
|
|
|
2017
|
4
|
|
||
|
2018
|
867
|
|
||
|
2019
|
1,148
|
|
||
|
2020
|
1,000
|
|
||
|
2021
|
1,500
|
|
||
|
Thereafter
|
8,442
|
|
||
|
12,965
|
|
|||
|
Less debt discounts
|
46
|
|
||
|
$
|
12,919
|
|
||
Altria Group, Inc.’s estimate of the fair value of its debt is based on observable market information derived from a third party pricing source and is classified in Level 2 of the fair value hierarchy. The aggregate fair value of Altria Group, Inc.’s total long-term debt at
December 31, 2015
and
2014
, was
$14.5 billion
and
$17.0 billion
, respectively, as compared with its carrying value of
$12.9 billion
and
$14.7 billion
, respectively.
▪
Altria Group, Inc. Senior Notes:
The notes of Altria Group, Inc. are senior unsecured obligations and rank equally in right of payment with all of Altria Group, Inc.’s existing and future senior unsecured indebtedness. Upon the occurrence of both (i) a change of control of Altria Group, Inc. and (ii) the notes ceasing to be rated investment grade by each of Moody’s, Standard & Poor’s and Fitch Ratings Ltd. within a specified time period, Altria Group, Inc. will be required to make an offer to purchase the notes at a price equal to
101%
of the aggregate principal amount of such notes, plus accrued and unpaid interest to the date of repurchase as and to the extent set forth in the terms of the notes.
With respect to
$3.4 billion
aggregate principal amount of Altria Group, Inc.’s senior unsecured long-term notes issued in 2009 and 2008, the interest rate payable on each series of notes is subject to adjustment from time to time if the rating assigned to the notes of such series by Moody’s or Standard & Poor’s is downgraded (or subsequently upgraded) as and to the extent set forth in the terms of the notes.
During 2015, Altria Group, Inc. repaid in full at maturity senior unsecured notes in the aggregate principal amount of
$1.0 billion
.
The obligations of Altria Group, Inc. under the notes are guaranteed by PM USA as further discussed in
Note 19
.
Condensed Consolidating Financial Information
.
▪
Debt Tender Offers and Redemption:
During 2015 and 2013, Altria Group, Inc. completed debt tender offers to purchase for cash certain of its senior unsecured notes in aggregate principal amounts of
$0.8 billion
and
$2.1 billion
, respectively.
Details of these debt tender offers were as follows:
|
(in millions)
|
2015
|
|
2013
|
|
|||
|
Notes Purchased
|
|||||||
|
9.95% Notes due 2038
|
$
|
—
|
|
$
|
818
|
|
|
|
10.20% Notes due 2039
|
—
|
|
782
|
|
|||
|
9.70% Notes due 2018
|
793
|
|
293
|
|
|||
|
9.25% Notes due 2019
|
—
|
|
207
|
|
|||
|
Total
|
$
|
793
|
|
$
|
2,100
|
|
|
During 2014, UST redeemed in full its
$300 million
(aggregate principal amount)
5.75%
senior notes due 2018.
As a result of the Altria Group, Inc. debt tender offers and the UST debt redemption, pre-tax losses on early extinguishment of debt were recorded as follows:
|
(in millions)
|
2015
|
|
2014
|
|
2013
|
|
|||||
|
Premiums and fees
|
$
|
226
|
|
$
|
44
|
|
$
|
1,054
|
|
||
|
Write-off of unamortized debt discounts and debt issuance costs
|
2
|
|
—
|
|
30
|
|
|||||
|
Total
|
$
|
228
|
|
$
|
44
|
|
$
|
1,084
|
|
||
52
Altria Group, Inc. and Subsidiaries
Notes to Consolidated Financial Statements
_________________________
Note 10
. Capital Stock
At
December 31, 2015
, Altria Group, Inc. had
12 billion
shares of authorized common stock; issued, repurchased and outstanding shares of common stock were as follows:
|
Shares Issued
|
|
Shares
Repurchased
|
|
Shares
Outstanding
|
|
|||
|
Balances, December 31, 2012
|
2,805,961,317
|
|
(796,221,021
|
)
|
2,009,740,296
|
|
||
|
Stock award activity
|
—
|
|
391,899
|
|
391,899
|
|
||
|
Repurchases of
common stock
|
—
|
|
(16,652,913
|
)
|
(16,652,913
|
)
|
||
|
Balances, December 31, 2013
|
2,805,961,317
|
|
(812,482,035
|
)
|
1,993,479,282
|
|
||
|
Stock award activity
|
—
|
|
447,840
|
|
447,840
|
|
||
|
Repurchases of
common stock
|
—
|
|
(22,452,599
|
)
|
(22,452,599
|
)
|
||
|
Balances, December 31, 2014
|
2,805,961,317
|
|
(834,486,794
|
)
|
1,971,474,523
|
|
||
|
Stock award activity
|
—
|
|
(732,623
|
)
|
(732,623
|
)
|
||
|
Repurchases of
common stock
|
—
|
|
(10,682,419
|
)
|
(10,682,419
|
)
|
||
|
Balances, December 31, 2015
|
2,805,961,317
|
|
(845,901,836
|
)
|
1,960,059,481
|
|
||
At
December 31, 2015
,
42,209,751
shares of common stock were reserved for stock-based awards under Altria Group, Inc.’s stock plans, and
10 million
shares of serial preferred stock, $
1.00
par value, were authorized.
No
shares of serial preferred stock have been issued.
▪
Dividends:
During the third quarter of
2015
, the Board of Directors approved an
8.7%
increase in the quarterly dividend rate to
$0.565
per common share versus the previous rate of
$0.52
per common share. The current annualized dividend rate is
$2.26
per Altria Group, Inc. common share. Future dividend payments remain subject to the discretion of the Board of Directors.
▪
Share Repurchases:
In October 2011, the Board of Directors authorized a
$1.0 billion
share repurchase program and expanded it to
$1.5 billion
in October 2012 (as expanded, the “October 2011 share repurchase program”). During the first quarter of 2013, Altria Group, Inc. completed the October 2011 share repurchase program, under which Altria Group, Inc.
repurchased a total of
48.3 million
shares of its common stock at an average price of
$31.06
per share.
In April 2013, the Board of Directors authorized a
$300 million
share repurchase program and expanded it to
$1.0 billion
in
August 2013
(as expanded, the “April 2013 share repurchase program”). During the third quarter of 2014, Altria Group, Inc. completed the April 2013 share repurchase program, under which Altria Group, Inc. repurchased a total of
27.1 million
shares of its common stock at an average price of
$36.97
per share.
In July 2014, the Board of Directors authorized a
$1.0 billion
share repurchase program (the “July 2014 share repurchase program”). During the third quarter of 2015, Altria Group, Inc. completed the July 2014 share repurchase program, under which Altria Group, Inc. repurchased a total of
20.4 million
shares of its common stock at an average price of
$48.90
per share.
In July 2015, the Board of Directors authorized a
$1.0 billion
share repurchase program (the “July 2015 share repurchase program”). During 2015, Altria Group, Inc. repurchased
0.6 million
shares of its common stock (at an aggregate cost of approximately
$35 million
, and at an average price of
$57.66
per share) under the July 2015 share repurchase program. At
December 31, 2015
, Altria Group, Inc. had approximately
$965 million
remaining in the July 2015 share repurchase program. The timing of share repurchases under this program depends upon marketplace conditions and other factors, and the program remains subject to the discretion of the Board of Directors.
For the years ended
December 31, 2015
,
2014
and
2013
, Altria Group, Inc.’s total share repurchase activity was as follows:
|
2015
|
|
2014
|
|
2013
|
|
|||||
|
(in millions, except per share data)
|
||||||||||
|
Total number of shares
repurchased
|
10.7
|
|
22.5
|
|
16.7
|
|
||||
|
Aggregate cost of shares
repurchased
|
$
|
554
|
|
$
|
939
|
|
$
|
600
|
|
|
|
Average price per share of shares repurchased
|
$
|
51.83
|
|
$
|
41.79
|
|
$
|
36.05
|
|
|
Note 11
. Stock Plans
In 2015, the Board of Directors adopted, and shareholders approved, the Altria Group, Inc. 2015 Performance Incentive Plan (the “2015 Plan”). The 2015 Plan succeeded the 2010 Performance Incentive Plan, under which no new awards were permitted after April 30, 2015. Under the 2015 Plan, Altria Group, Inc. may grant stock options, stock appreciation rights, restricted stock, restricted and deferred stock units, and other stock-based awards, as well as cash-based annual and long-term incentive awards to employees of Altria Group, Inc. or any of its subsidiaries or affiliates. Up to
40 million
shares of common stock may be issued under the 2015 Plan.
In addition, in 2015, the Board of Directors adopted, and shareholders approved, the 2015 Stock Compensation Plan for Non-Employee Directors (the “Directors Plan”). The Directors Plan succeeded the Stock Compensation Plan for Non-Employee Directors, as amended and restated effective January 29, 2014, under which no new awards were permitted after May 20, 2015. Under the Directors Plan, Altria Group, Inc. may grant up to
one million
shares of common stock to members of the Board of Directors who are not employees of Altria Group, Inc.
Shares available to be granted under the 2015 Plan and the Directors Plan at
December 31, 2015
, were
39,994,482
and
993,284
, respectively.
53
Altria Group, Inc. and Subsidiaries
Notes to Consolidated Financial Statements
_________________________
▪
Restricted Stock and Restricted Stock Units:
Altria Group, Inc. may grant shares of restricted stock and restricted stock units to employees of Altria Group, Inc. or any of its subsidiaries or affiliates. During the vesting period, these shares include nonforfeitable rights to dividends or dividend equivalents and may not be sold, assigned, pledged or otherwise encumbered. Such shares are subject to forfeiture if certain employment conditions are not met.
Shares of
restricted stock and restricted stock units generally vest three years after the grant date.
The fair value of the shares of restricted stock and restricted stock units at the date of grant is amortized to expense ratably over the restriction period, which is generally
three years
. Altria Group, Inc. recorded pre-tax compensation expense related to restricted stock and restricted stock units granted to employees for the years ended
December 31, 2015
,
2014
and
2013
of
$51 million
,
$46 million
and
$49 million
, respectively. The deferred tax benefit recorded related to this compensation expense was
$20 million
,
$18 million
and
$19 million
for the years ended
December 31, 2015
,
2014
and
2013
, respectively. The unamortized compensation expense related to Altria Group, Inc. restricted stock and restricted stock units was
$68 million
at
December 31, 2015
and is expected to be recognized over a weighted-average period of approximately
two years
.
Altria Group, Inc.’s restricted stock and restricted stock units activity was as follows for the year ended
December 31, 2015
:
|
Number of
Shares
|
|
Weighted-Average
Grant Date Fair
Value Per Share
|
|
|||
|
Balance at December 31, 2014
|
4,511,911
|
|
$
|
32.83
|
|
|
|
Granted
|
1,195,088
|
|
54.54
|
|
||
|
Vested
|
(1,567,474
|
)
|
28.61
|
|
||
|
Forfeited
|
(201,840
|
)
|
37.53
|
|
||
|
Balance at December 31, 2015
|
3,937,685
|
|
40.86
|
|
||
The weighted-average grant date fair value of Altria Group, Inc. restricted stock and restricted stock units granted during the years ended
December 31, 2015
,
2014
and
2013
was
$65 million
,
$53 million
and
$49 million
, respectively, or
$54.54
,
$36.75
and
$33.76
per restricted share or restricted stock unit, respectively. The total fair value of Altria Group, Inc. restricted stock and restricted stock units that vested during the years ended
December 31, 2015
,
2014
and
2013
was
$85 million
,
$86 million
and
$89 million
, respectively.
Note 12
. Earnings per Share
Basic and diluted earnings per share (“EPS”) were calculated using the following:
|
|
For the Years Ended December 31,
|
||||||||||
|
(in millions)
|
2015
|
|
2014
|
|
2013
|
|
|||||
|
Net earnings attributable to Altria Group, Inc.
|
$
|
5,241
|
|
$
|
5,070
|
|
$
|
4,535
|
|
||
|
Less: Distributed and undistributed earnings attributable to unvested restricted shares and restricted stock units
|
(10
|
)
|
(12
|
)
|
(12
|
)
|
|||||
|
Earnings for basic and diluted EPS
|
$
|
5,231
|
|
$
|
5,058
|
|
$
|
4,523
|
|
||
|
Weighted-average shares for basic and diluted EPS
|
1,961
|
|
1,978
|
|
1,999
|
|
|||||
54
Altria Group, Inc. and Subsidiaries
Notes to Consolidated Financial Statements
_________________________
Note 13
. Other Comprehensive Earnings/Losses
The following tables set forth the changes in each component of accumulated other comprehensive losses, net of deferred income taxes, attributable to Altria Group, Inc.:
|
(in millions)
|
Currency
Translation
Adjustments
|
|
Benefit Plans
|
|
SABMiller
|
|
Accumulated
Other
Comprehensive
Losses
|
|
||||||||
|
Balances, December 31, 2012
|
$
|
2
|
|
$
|
(2,414
|
)
|
$
|
372
|
|
$
|
(2,040
|
)
|
||||
|
Other comprehensive (losses) earnings before reclassifications
|
(2
|
)
|
1,559
|
|
(740
|
)
|
817
|
|
||||||||
|
Deferred income taxes
|
—
|
|
(609
|
)
|
259
|
|
(350
|
)
|
||||||||
|
Other comprehensive (losses) earnings before reclassifications, net of deferred income taxes
|
(2
|
)
|
950
|
|
(481
|
)
|
467
|
|
||||||||
|
Amounts reclassified to net earnings
|
—
|
|
311
|
|
6
|
|
317
|
|
||||||||
|
Deferred income taxes
|
—
|
|
(120
|
)
|
(2
|
)
|
(122
|
)
|
||||||||
|
Amounts reclassified to net earnings, net of
deferred income taxes
|
—
|
|
191
|
|
4
|
|
195
|
|
||||||||
|
Other comprehensive (losses) earnings, net of deferred income taxes
|
(2
|
)
|
1,141
|
|
(477
|
)
|
(1)
|
662
|
|
|||||||
|
Balances, December 31, 2013
|
—
|
|
(1,273
|
)
|
(105
|
)
|
(1,378
|
)
|
||||||||
|
Other comprehensive losses before reclassifications
|
(2
|
)
|
(1,411
|
)
|
(881
|
)
|
(2,294
|
)
|
||||||||
|
Deferred income taxes
|
—
|
|
550
|
|
308
|
|
858
|
|
||||||||
|
Other comprehensive losses before reclassifications, net of deferred income taxes
|
(2
|
)
|
(861
|
)
|
(573
|
)
|
(1,436
|
)
|
||||||||
|
Amounts reclassified to net earnings
|
—
|
|
154
|
|
59
|
|
213
|
|
||||||||
|
Deferred income taxes
|
—
|
|
(60
|
)
|
(21
|
)
|
(81
|
)
|
||||||||
|
Amounts reclassified to net earnings, net of
deferred income taxes
|
—
|
|
94
|
|
38
|
|
132
|
|
||||||||
|
Other comprehensive losses, net of deferred income taxes
|
(2
|
)
|
(767
|
)
|
(535
|
)
|
(1)
|
(1,304
|
)
|
|||||||
|
Balances, December 31, 2014
|
(2
|
)
|
(2,040
|
)
|
(640
|
)
|
(2,682
|
)
|
||||||||
|
Other comprehensive losses before reclassifications
|
(4
|
)
|
(223
|
)
|
(983
|
)
|
(1,210
|
)
|
||||||||
|
Deferred income taxes
|
1
|
|
86
|
|
344
|
|
431
|
|
||||||||
|
Other comprehensive losses before reclassifications, net of deferred income taxes
|
(3
|
)
|
(137
|
)
|
(639
|
)
|
(779
|
)
|
||||||||
|
Amounts reclassified to net earnings
|
—
|
|
272
|
|
21
|
|
293
|
|
||||||||
|
Deferred income taxes
|
—
|
|
(105
|
)
|
(7
|
)
|
(112
|
)
|
||||||||
|
Amounts reclassified to net earnings, net of
deferred income taxes
|
—
|
|
167
|
|
14
|
|
181
|
|
||||||||
|
Other comprehensive (losses) earnings, net of deferred income taxes
|
(3
|
)
|
30
|
|
(625
|
)
|
(1)
|
(598
|
)
|
|||||||
|
Balances, December 31, 2015
|
$
|
(5
|
)
|
$
|
(2,010
|
)
|
$
|
(1,265
|
)
|
$
|
(3,280
|
)
|
||||
(1)
For the years ended December 31,
2015
,
2014
and
2013
, Altria Group, Inc.’s proportionate share of SABMiller’s other comprehensive losses consisted primarily of currency translation adjustments.
55
Altria Group, Inc. and Subsidiaries
Notes to Consolidated Financial Statements
_________________________
The following table sets forth pre-tax amounts by component, reclassified from accumulated other comprehensive losses to net earnings:
|
For the Years Ended December 31,
|
||||||||||||
|
(in millions)
|
2015
|
|
2014
|
|
2013
|
|
||||||
|
Benefit Plans:
(1)
|
||||||||||||
|
Net loss
|
$
|
304
|
|
$
|
187
|
|
$
|
346
|
|
|||
|
Prior service cost/credit
|
(32
|
)
|
(33
|
)
|
(35
|
)
|
||||||
|
272
|
|
154
|
|
311
|
|
|||||||
|
SABMiller
(2)
|
21
|
|
59
|
|
6
|
|
||||||
|
Pre-tax amounts reclassified from accumulated other comprehensive losses to net earnings
|
$
|
293
|
|
$
|
213
|
|
$
|
317
|
|
|||
(1)
Amounts are included in net defined benefit plan costs. For further details, see
Note 16
.
Benefit Plans.
(2)
Amounts are included in earnings from equity investment in SABMiller. For further information on Altria Group, Inc.’s equity investment in SABMiller, see
Note 6
.
Investment in SABMiller.
Note 14
. Income Taxes
Earnings before income taxes and provision for income taxes consisted of the following for the years ended
December 31, 2015
,
2014
and
2013
:
|
(in millions)
|
2015
|
|
2014
|
|
2013
|
|
|||||
|
Earnings before income taxes:
|
|||||||||||
|
United States
|
$
|
8,078
|
|
$
|
7,763
|
|
$
|
6,929
|
|
||
|
Outside United States
|
—
|
|
11
|
|
13
|
|
|||||
|
Total
|
$
|
8,078
|
|
$
|
7,774
|
|
$
|
6,942
|
|
||
|
Provision for income taxes:
|
|||||||||||
|
Current:
|
|||||||||||
|
Federal
|
$
|
2,516
|
|
$
|
2,350
|
|
$
|
2,066
|
|
||
|
State and local
|
451
|
|
480
|
|
423
|
|
|||||
|
Outside United States
|
—
|
|
3
|
|
4
|
|
|||||
|
2,967
|
|
2,833
|
|
2,493
|
|
||||||
|
Deferred:
|
|||||||||||
|
Federal
|
(140
|
)
|
(124
|
)
|
(77
|
)
|
|||||
|
State and local
|
8
|
|
(5
|
)
|
(9
|
)
|
|||||
|
(132
|
)
|
(129
|
)
|
(86
|
)
|
||||||
|
Total provision for income taxes
|
$
|
2,835
|
|
$
|
2,704
|
|
$
|
2,407
|
|
||
Altria Group, Inc.’s U.S. subsidiaries join in the filing of a U.S. federal consolidated income tax return. The U.S. federal statute of limitations remains open for the year 2007 and forward, with years 2010 to 2013 currently under examination by the IRS as part of an audit conducted in the ordinary course of business. With the exception of corresponding federal audit adjustments, state statutes of limitations generally remain open for the year 2011 and forward. Certain of Altria Group, Inc.’s state tax returns are currently under examination by various states as part of routine audits conducted in the ordinary course of business.
A reconciliation of the beginning and ending amount of unrecognized tax benefits for the years ended
December 31, 2015
,
2014
and
2013
was as follows:
|
(in millions)
|
2015
|
|
2014
|
|
2013
|
|
|||||
|
Balance at beginning of year
|
$
|
258
|
|
$
|
227
|
|
$
|
262
|
|
||
|
Additions based on tax positions
related to the current year
|
15
|
|
15
|
|
15
|
|
|||||
|
Additions for tax positions of
prior years
|
57
|
|
29
|
|
35
|
|
|||||
|
Reductions for tax positions due to
lapse of statutes of limitations
|
(4
|
)
|
(2
|
)
|
(1
|
)
|
|||||
|
Reductions for tax positions of
prior years
|
(86
|
)
|
—
|
|
—
|
|
|||||
|
Settlements
|
(82
|
)
|
(11
|
)
|
(84
|
)
|
|||||
|
Balance at end of year
|
$
|
158
|
|
$
|
258
|
|
$
|
227
|
|
||
Unrecognized tax benefits and Altria Group, Inc.’s consolidated liability for tax contingencies at
December 31, 2015
and
2014
, were as follows:
|
(in millions)
|
2015
|
|
2014
|
|
|||
|
Unrecognized tax benefits — Altria Group, Inc.
|
$
|
158
|
|
$
|
228
|
|
|
|
Unrecognized tax benefits — PMI
|
—
|
|
30
|
|
|||
|
Unrecognized tax benefits
|
158
|
|
258
|
|
|||
|
Accrued interest and penalties
|
14
|
|
57
|
|
|||
|
Tax credits and other indirect benefits
|
(3
|
)
|
(17
|
)
|
|||
|
Liability for tax contingencies
|
$
|
169
|
|
$
|
298
|
|
|
56
Altria Group, Inc. and Subsidiaries
Notes to Consolidated Financial Statements
_________________________
The amount of unrecognized tax benefits that, if recognized, would impact the effective tax rate at
December 31, 2015
was
$109 million
, along with
$49 million
affecting deferred taxes. The amount of unrecognized tax benefits that, if recognized, would impact the effective tax rate at
December 31, 2014
was
$207 million
, along with
$51 million
affecting deferred taxes. However, the impact on net earnings at
December 31, 2014
would be
$177 million
, as a result of the tax-related net receivable from Altria Group, Inc.’s former subsidiary, Philip Morris International Inc. (“PMI”), of
$30 million
pursuant to the tax sharing agreements discussed below.
Under tax sharing agreements entered into in connection with the 2007 and 2008 spin-offs between Altria Group, Inc. and its former subsidiaries Kraft Foods Inc. (now known as Mondelēz International, Inc. (“Mondelēz”)) and PMI, respectively, Mondelēz and PMI are responsible for their respective pre-spin-off tax obligations. Altria Group, Inc., however, remains severally liable for Mondelēz’s and PMI’s pre-spin-off federal tax obligations pursuant to regulations governing federal consolidated income tax returns, and continued to include the pre-spin-off federal income tax reserves of Mondelēz and PMI in its liability for uncertain tax positions. As of December 31, 2015, there are
no
remaining pre-spin-off tax reserves for Mondelēz and PMI.
During
2015
,
2014
and
2013
, Altria Group, Inc. recorded net tax benefits of
$41 million
,
$2 million
and
$22 million
, respectively, for Mondelēz and PMI tax matters, primarily relating to the IRS audit of Altria Group, Inc. and its consolidated subsidiaries’ 2007-2009 tax years (“IRS 2007-2009 Audit”). These net tax benefits were offset by changes to Mondelēz and PMI tax-related receivables/payables, which were recorded as decreases to operating income on Altria Group, Inc.’s consolidated statements of earnings. Due to the respective offsets, the Mondelēz and PMI tax matters had no impact on Altria Group, Inc.’s net earnings for the years ended
December 31, 2015
,
2014
and
2013
.
Altria Group, Inc. recognizes accrued interest and penalties associated with uncertain tax positions as part of the tax provision. At
December 31, 2015
, Altria Group, Inc. had
$14 million
of accrued interest and penalties. At
December 31, 2014
, Altria Group, Inc. had
$57 million
of accrued interest and penalties, of which approximately
$7 million
related to PMI, for which PMI is responsible under its tax sharing agreement. The corresponding receivable from PMI was included in other assets on Altria Group, Inc.’s consolidated balance sheet at
December 31, 2014
.
For the years ended
December 31, 2015
,
2014
and
2013
, Altria Group, Inc. recognized in its consolidated statements of earnings
$(36) million
,
$14 million
and
$5 million
, respectively, of gross interest (income) expense associated with uncertain tax positions.
Altria Group, Inc. is subject to income taxation in many jurisdictions. Uncertain tax positions reflect the difference between tax positions taken or expected to be taken on income tax returns and the amounts recognized in the financial statements. Resolution of the related tax positions with the relevant tax authorities may take many years to complete, and such timing is
not entirely within the control of Altria Group, Inc. It is reasonably possible that within the next 12 months certain examinations will be resolved, which could result in a decrease in unrecognized tax benefits of approximately
$6 million
.
The effective income tax rate on pre-tax earnings differed from the U.S. federal statutory rate for the following reasons for the years ended
December 31, 2015
,
2014
and
2013
:
|
2015
|
|
2014
|
|
2013
|
|
|||
|
U.S. federal statutory rate
|
35.0
|
%
|
35.0
|
%
|
35.0
|
%
|
||
|
Increase (decrease) resulting from:
|
||||||||
|
State and local income taxes, net
of federal tax benefit
|
3.7
|
|
4.0
|
|
3.8
|
|
||
|
Uncertain tax positions
|
(0.8
|
)
|
0.5
|
|
0.7
|
|
||
|
SABMiller dividend benefit
|
(0.5
|
)
|
(2.3
|
)
|
(2.0
|
)
|
||
|
Domestic manufacturing deduction
|
(2.0
|
)
|
(2.4
|
)
|
(2.7
|
)
|
||
|
Other
|
(0.3
|
)
|
—
|
|
(0.1
|
)
|
||
|
Effective tax rate
|
35.1
|
%
|
34.8
|
%
|
34.7
|
%
|
||
The tax provision in 2015 included net tax benefits of (i)
$59 million
from the reversal of tax reserves and associated interest due primarily to the closure in the third quarter of 2015 of the IRS 2007-2009 Audit; and (ii)
$41 million
for Mondelēz and PMI tax matters discussed above, partially offset by the reversal of foreign tax credits primarily associated with SABMiller dividends that were recorded during the third quarter of 2015 (
$41 million
) and fourth quarter of 2015 (
$24 million
). The tax provision in 2015 also included decreased recognition of foreign tax credits associated with SABMiller dividends.
The tax provision in
2014
included net tax benefits of (i)
$14 million
from the reversal of tax accruals no longer required that was recorded during the third quarter of
2014
(
$19 million
), partially offset by additional tax provisions recorded during the fourth quarter of
2014
(
$5 million
); and (ii)
$2 million
for Mondelēz tax matters discussed above.
The tax provision in
2013
included net tax benefits of (i)
$39 million
from the reversal of tax accruals no longer required that was recorded during the third quarter of 2013 (
$25 million
) and fourth quarter of 2013 (
$14 million
); (ii)
$25 million
related to the recognition of previously unrecognized foreign tax credits primarily associated with SABMiller dividends that were recorded during the fourth quarter of 2013; and (iii)
$22 million
for Mondelēz tax matters discussed above. The tax provision in 2013 also included a reduction in certain consolidated tax benefits resulting from the 2013 debt tender offer that is discussed further in
Note 9
.
Long-Term Debt
.
57
Altria Group, Inc. and Subsidiaries
Notes to Consolidated Financial Statements
_________________________
The tax effects of temporary differences that gave rise to deferred income tax assets and liabilities consisted of the following at
December 31, 2015
and
2014
:
|
(in millions)
|
2015
|
|
2014
|
|
|||
|
Deferred income tax assets:
|
|||||||
|
Accrued postretirement and postemployment benefits
|
$
|
953
|
|
$
|
1,054
|
|
|
|
Settlement charges
|
1,393
|
|
1,379
|
|
|||
|
Accrued pension costs
|
512
|
|
410
|
|
|||
|
Net operating losses and tax credit carryforwards
|
335
|
|
357
|
|
|||
|
Total deferred income tax assets
|
3,193
|
|
3,200
|
|
|||
|
Deferred income tax liabilities:
|
|||||||
|
Property, plant and equipment
|
(441
|
)
|
(468
|
)
|
|||
|
Intangible assets
|
(3,968
|
)
|
(3,915
|
)
|
|||
|
Investment in SABMiller
|
(1,794
|
)
|
(2,039
|
)
|
|||
|
Finance assets, net
|
(909
|
)
|
(1,123
|
)
|
|||
|
Other
|
(116
|
)
|
(190
|
)
|
|||
|
Total deferred income tax liabilities
|
(7,228
|
)
|
(7,735
|
)
|
|||
|
Valuation allowances
|
(260
|
)
|
(211
|
)
|
|||
|
Net deferred income tax liabilities
|
$
|
(4,295
|
)
|
$
|
(4,746
|
)
|
|
At
December 31, 2015
, Altria Group, Inc. had estimated gross state tax net operating losses of
$610 million
that, if unused, will expire in
2016
through
2035
, state tax credit carryforwards of
$57 million
that, if unused, will expire in
2016
through
2017
, and foreign tax credit carryforwards of
$301 million
that, if unused, will expire in
2020
through
2025
. Realization of these benefits is dependent upon various factors such as generating sufficient taxable income in the applicable states and receiving sufficient amounts of lower-taxed foreign dividends from SABMiller. A valuation allowance of
$260 million
has been established for those benefits that more-likely-than-not will not be realized.
Note 15
. Segment Reporting
The products of Altria Group, Inc.’s subsidiaries include smokeable tobacco products comprised of cigarettes manufactured and sold by PM USA and machine-made large cigars and pipe tobacco manufactured and sold by Middleton; smokeless tobacco products, substantially all of which are manufactured and sold by USSTC; and wine produced and/or distributed by Ste. Michelle. The products and services of these subsidiaries constitute Altria Group, Inc.’s reportable segments of smokeable products, smokeless products and wine. The financial services and the innovative tobacco products businesses are included in all other.
Altria Group, Inc.’s chief operating decision maker reviews operating companies income to evaluate the performance of, and allocate resources to, the segments. Operating companies income for the segments is defined as operating income before amortization of intangibles and general corporate expenses. Interest and other debt expense, net, and provision for income taxes are centrally managed at the corporate level and,
accordingly, such items are not presented by segment since they are excluded from the measure of segment profitability reviewed by Altria Group, Inc.’s chief operating decision maker. Information about total assets by segment is not disclosed because such information is not reported to or used by Altria Group, Inc.’s chief operating decision maker. Segment goodwill and other intangible assets, net, are disclosed in
Note 4
.
Goodwill and Other Intangible Assets, net.
The accounting policies of the segments are the same as those described in
Note 2
.
Summary of Significant Accounting Policies.
Segment data were as follows:
|
|
For the Years Ended December 31,
|
||||||||||
|
(in millions)
|
2015
|
|
2014
|
|
2013
|
|
|||||
|
Net revenues:
|
|||||||||||
|
Smokeable products
|
$
|
22,792
|
|
$
|
21,939
|
|
$
|
21,868
|
|
||
|
Smokeless products
|
1,879
|
|
1,809
|
|
1,778
|
|
|||||
|
Wine
|
692
|
|
643
|
|
609
|
|
|||||
|
All other
|
71
|
|
131
|
|
211
|
|
|||||
|
Net revenues
|
$
|
25,434
|
|
$
|
24,522
|
|
$
|
24,466
|
|
||
|
Earnings before income taxes:
|
|||||||||||
|
Operating companies
income (loss):
|
|||||||||||
|
Smokeable products
|
$
|
7,569
|
|
$
|
6,873
|
|
$
|
7,063
|
|
||
|
Smokeless products
|
1,108
|
|
1,061
|
|
1,023
|
|
|||||
|
Wine
|
152
|
|
134
|
|
118
|
|
|||||
|
All other
|
(169
|
)
|
(185
|
)
|
157
|
|
|||||
|
Amortization of intangibles
|
(21
|
)
|
(20
|
)
|
(20
|
)
|
|||||
|
General corporate expenses
|
(237
|
)
|
(241
|
)
|
(235
|
)
|
|||||
|
Changes to Mondelēz and PMI tax-related receivables/payables
|
(41
|
)
|
(2
|
)
|
(22
|
)
|
|||||
|
Operating income
|
8,361
|
|
7,620
|
|
8,084
|
|
|||||
|
Interest and other debt expense, net
|
(817
|
)
|
(808
|
)
|
(1,049
|
)
|
|||||
|
Loss on early extinguishment of debt
|
(228
|
)
|
(44
|
)
|
(1,084
|
)
|
|||||
|
Earnings from equity investment in SABMiller
|
757
|
|
1,006
|
|
991
|
|
|||||
|
Other income, net
|
5
|
|
—
|
|
—
|
|
|||||
|
Earnings before income taxes
|
$
|
8,078
|
|
$
|
7,774
|
|
$
|
6,942
|
|
||
The smokeable products segment included net revenues of
$22,193 million
,
$21,363 million
and
$21,308 million
for the years ended
December 31, 2015
,
2014
and
2013
, respectively, related to cigarettes and net revenues of
$599 million
,
$576 million
and
$560 million
for the years ended
December 31, 2015
,
2014
and
2013
, respectively, related to cigars.
PM USA, USSTC and Middleton’s largest customer, McLane Company, Inc., accounted for approximately
26%
of Altria Group, Inc.’s consolidated net revenues for the year ended December 31, 2015 and
27%
for each of the years ended December 31,
2014
and
2013
. In addition, Core-Mark Holding Company, Inc. accounted for approximately
10%
of Altria Group, Inc.’s consolidated net revenues for the year ended December 31,
58
Altria Group, Inc. and Subsidiaries
Notes to Consolidated Financial Statements
_________________________
2015. Substantially all of these net revenues were reported in the smokeable products and smokeless products segments. Sales to
three
distributors accounted for approximately
66%
,
67%
and
66%
of net revenues for the wine segment for the years ended December 31, 2015,
2014
and
2013
, respectively.
Details of Altria Group, Inc.’s depreciation expense and capital expenditures were as follows:
|
|
For the Years Ended December 31,
|
||||||||||
|
(in millions)
|
2015
|
|
2014
|
|
2013
|
|
|||||
|
Depreciation expense:
|
|||||||||||
|
Smokeable products
|
$
|
117
|
|
$
|
112
|
|
$
|
113
|
|
||
|
Smokeless products
|
27
|
|
22
|
|
25
|
|
|||||
|
Wine
|
32
|
|
30
|
|
30
|
|
|||||
|
General corporate and other
|
28
|
|
24
|
|
24
|
|
|||||
|
Total depreciation expense
|
$
|
204
|
|
$
|
188
|
|
$
|
192
|
|
||
|
Capital expenditures:
|
|||||||||||
|
Smokeable products
|
$
|
56
|
|
$
|
49
|
|
$
|
39
|
|
||
|
Smokeless products
|
113
|
|
40
|
|
32
|
|
|||||
|
Wine
|
42
|
|
46
|
|
42
|
|
|||||
|
General corporate and other
|
18
|
|
28
|
|
18
|
|
|||||
|
Total capital expenditures
|
$
|
229
|
|
$
|
163
|
|
$
|
131
|
|
||
The comparability of operating companies income for the reportable segments was affected by the following:
▪
Non-Participating Manufacturer (“NPM”) Adjustment Items:
For the years ended
December 31, 2015
,
2014
and 2013, pre-tax income for NPM adjustment items was recorded in Altria Group, Inc.’s consolidated statements of earnings as follows:
|
(in millions)
|
2015
|
|
2014
|
|
2013
|
|
||||||
|
Smokeable products segment
|
$
|
97
|
|
|
$
|
43
|
|
|
$
|
664
|
|
|
|
Interest and other debt expense, net
|
(13
|
)
|
|
47
|
|
|
—
|
|
||||
|
Total
|
$
|
84
|
|
$
|
90
|
|
$
|
664
|
|
|||
These adjustments resulted from the settlement of, and determinations made in connection with, disputes with certain states and territories related to the NPM adjustment provision under the 1998 Master Settlement Agreement (such settlements and determinations are referred to collectively as “NPM Adjustment Items” and are more fully described in
Health Care Cost Recovery Litigation - NPM Adjustment Disputes
in
Note 18
.
Contingencies
)
.
The amounts shown in the table above for the smokeable products segment were recorded by PM USA as reductions to cost of sales, which increased operating companies income in the smokeable products segment.
▪
Tobacco and Health Litigation Items:
For the years ended December 31,
2015
,
2014
and
2013
, pre-tax charges related to certain tobacco and health litigation items were recorded in Altria Group, Inc.’s consolidated statements of earnings as follows:
|
(in millions)
|
2015
|
|
2014
|
|
2013
|
|
||||||
|
Smokeable products segment
|
$
|
127
|
|
$
|
27
|
|
$
|
18
|
|
|||
|
General corporate
|
—
|
|
15
|
|
—
|
|
||||||
|
Interest and other debt expense, net
|
23
|
|
2
|
|
4
|
|
||||||
|
Total
|
$
|
150
|
|
$
|
44
|
|
$
|
22
|
|
|||
During 2015, PM USA recorded pre-tax charges in marketing, administration and research costs related to tobacco and health judgments in
seven
state
Engle
progeny lawsuits and
Schwarz
of
$59 million
and
$25 million
, respectively, as well as
$14 million
and
$9 million
, respectively, in interest costs related to these cases. Additionally in 2015, PM USA and certain other cigarette manufacturers reached an agreement to resolve approximately
415
pending federal
Engle
progeny cases. As a result of the agreement, PM USA recorded a pre-tax provision of approximately
$43 million
in marketing, administration and research costs. For further discussion, see
Smoking and Health Litigation
in
Note 18
.
Contingencies
.
During 2014, Altria Group, Inc. and PM USA recorded an aggregate pre-tax charge of
$31 million
in marketing, administration and research costs for the estimated costs of implementing the corrective communications remedy in connection with the federal government’s lawsuit against Altria Group, Inc. and PM USA. For further discussion, see
Health Care Cost Recovery Litigation
-
Federal Government’s Lawsuit
in
Note 18
.
Contingencies
.
▪
Asset Impairment and Exit Costs:
During 2014, PM USA sold its Cabarrus, North Carolina manufacturing facility for approximately
$66 million
in connection with the previously completed manufacturing optimization program associated with PM USA’s closure of the manufacturing facility in 2009. As a result, during 2014, PM USA recorded a pre-tax gain of
$10 million
.
Note 16
. Benefit Plans
Subsidiaries of Altria Group, Inc. sponsor noncontributory defined benefit pension plans covering the majority of all employees of Altria Group, Inc. However, employees hired on or after a date specific to their employee group are not eligible to participate in these noncontributory defined benefit pension plans but are instead eligible to participate in a defined contribution plan with enhanced benefits. This transition for new hires occurred from October 1, 2006 to January 1, 2008. In addition, effective January 1, 2010, certain employees of UST and Middleton who were participants in noncontributory defined benefit pension plans ceased to earn additional benefit service under those plans and became eligible to participate in a defined contribution plan with enhanced benefits. Altria Group, Inc. and its subsidiaries also provide postretirement health care and other benefits to the majority of retired employees.
The plan assets and benefit obligations of Altria Group, Inc.’s pension plans and the benefit obligations of Altria Group, Inc.’s postretirement plans are measured at December 31 of each year. Altria Group, Inc.’s postretirement plans are not funded.
59
Altria Group, Inc. and Subsidiaries
Notes to Consolidated Financial Statements
_________________________
The discount rates for Altria Group, Inc.’s plans were based on a yield curve developed from a model portfolio of high-quality corporate bonds with durations that match the expected future cash flows of the pension and postretirement benefit obligations.
At December 31, 2015, Altria Group, Inc. changed the approach used to estimate the service and interest cost components of net periodic benefit costs for Altria Group, Inc.’s pension and postretirement plans. In 2015 and prior years, Altria Group, Inc. estimated the service and interest cost components using a single weighted-average discount rate derived from the yield curve used to measure the pension and postretirement plans
benefit obligations. Beginning in 2016, Altria Group, Inc. will use a spot rate approach in the estimation of these components of net periodic benefit costs by applying the specific spot rates along the yield curve to the relevant projected cash flows, as Altria Group, Inc. believes that this approach provides a more precise estimate of service and interest costs. Altria Group, Inc. is accounting for this change prospectively as a change in accounting estimate. This change will not affect the measurement of Altria Group, Inc.’s pension and postretirement benefit obligations as the change in the service and interest costs will be offset by a corresponding change in actuarial gains/losses.
|
▪
|
Obligations and Funded Status:
The benefit obligations, plan assets and funded status of Altria Group, Inc.’s pension and postretirement plans at
December 31, 2015
and
2014
were as follows:
|
|
Pension
|
Postretirement
|
||||||||||||||
|
(in millions)
|
2015
|
|
2014
|
|
2015
|
|
2014
|
|
|||||||
|
Change in benefit obligation:
|
|||||||||||||||
|
Benefit obligation at beginning of year
|
$
|
8,330
|
|
$
|
7,137
|
|
$
|
2,613
|
|
$
|
2,317
|
|
|||
|
Service cost
|
86
|
|
68
|
|
18
|
|
15
|
|
|||||||
|
Interest cost
|
337
|
|
345
|
|
100
|
|
107
|
|
|||||||
|
Benefits paid
|
(431
|
)
|
(410
|
)
|
(141
|
)
|
(132
|
)
|
|||||||
|
Actuarial losses (gains)
|
(317
|
)
|
1,190
|
|
(192
|
)
|
306
|
|
|||||||
|
Other
|
6
|
|
—
|
|
(6
|
)
|
—
|
|
|||||||
|
Benefit obligation at end of year
|
8,011
|
|
8,330
|
|
2,392
|
|
2,613
|
|
|||||||
|
Change in plan assets:
|
|||||||||||||||
|
Fair value of plan assets at beginning of year
|
7,297
|
|
7,077
|
|
—
|
|
—
|
|
|||||||
|
Actual return on plan assets
|
(188
|
)
|
615
|
|
—
|
|
—
|
|
|||||||
|
Employer contributions
|
28
|
|
15
|
|
—
|
|
—
|
|
|||||||
|
Benefits paid
|
(431
|
)
|
(410
|
)
|
—
|
|
—
|
|
|||||||
|
Fair value of plan assets at end of year
|
6,706
|
|
7,297
|
|
—
|
|
—
|
|
|||||||
|
Funded status at December 31
|
$
|
(1,305
|
)
|
$
|
(1,033
|
)
|
$
|
(2,392
|
)
|
$
|
(2,613
|
)
|
|||
|
Amounts recognized in Altria Group, Inc.’s consolidated balance sheets were as follows:
|
|||||||||||||||
|
Other accrued liabilities
|
$
|
(28
|
)
|
$
|
(21
|
)
|
$
|
(147
|
)
|
$
|
(152
|
)
|
|||
|
Accrued pension costs
|
(1,277
|
)
|
(1,012
|
)
|
—
|
|
—
|
|
|||||||
|
Accrued postretirement health care costs
|
—
|
|
—
|
|
(2,245
|
)
|
(2,461
|
)
|
|||||||
|
$
|
(1,305
|
)
|
$
|
(1,033
|
)
|
$
|
(2,392
|
)
|
$
|
(2,613
|
)
|
||||
The table above presents the projected benefit obligation for Altria Group, Inc.’s pension plans. The accumulated benefit obligation, which represents benefits earned to date, for the pension plans was
$7.7 billion
and
$7.9 billion
at
December 31, 2015
and
2014
, respectively.
At December 31, 2015 and
2014
, the accumulated benefit obligations were in excess of plan assets for all pension plans.
The Patient Protection and Affordable Care Act (“PPACA”), as amended by the Health Care and Education Reconciliation Act of 2010, was signed into law in March 2010. The PPACA mandates health care reforms with staggered effective dates from 2010 to 2020, including the imposition of an excise tax on high cost health care plans effective in 2020. The additional accumulated postretirement liability resulting from the PPACA,
which is not material to Altria Group, Inc., has been included in Altria Group, Inc.’s accumulated postretirement benefit obligation at
December 31, 2015
and
2014
. Given the complexity of the PPACA and the extended time period during which implementation is expected to occur, future adjustments to Altria Group, Inc.’s accumulated postretirement benefit obligation may be necessary.
The following assumptions were used to determine Altria Group, Inc.’s pension benefit obligations at December 31:
|
2015
|
|
2014
|
|
||
|
Discount rate
|
4.4
|
%
|
4.1
|
%
|
|
|
Rate of compensation increase
|
4.0
|
|
4.0
|
|
|
60
Altria Group, Inc. and Subsidiaries
Notes to Consolidated Financial Statements
_________________________
The following assumptions were used to determine Altria Group, Inc.’s postretirement benefit obligations at December 31:
|
2015
|
|
2014
|
|
||
|
Discount rate
|
4.4
|
%
|
4.0
|
%
|
|
|
Health care cost trend rate assumed for next year
|
6.5
|
|
|
7.0
|
|
|
Ultimate trend rate
|
5.0
|
|
|
5.0
|
|
|
Year that the rate reaches the ultimate trend rate
|
2019
|
|
|
2019
|
|
|
▪
|
Components of Net Periodic Benefit Cost:
Net periodic benefit cost consisted of the following for the years ended
December 31, 2015
,
2014
and
2013
:
|
|
Pension
|
Postretirement
|
||||||||||||||||||||||
|
(in millions)
|
2015
|
|
2014
|
|
2013
|
|
2015
|
|
2014
|
|
2013
|
|
|||||||||||
|
Service cost
|
$
|
86
|
|
$
|
68
|
|
$
|
86
|
|
$
|
18
|
|
$
|
15
|
|
$
|
18
|
|
|||||
|
Interest cost
|
337
|
|
345
|
|
314
|
|
100
|
|
107
|
|
99
|
|
|||||||||||
|
Expected return on plan assets
|
(539
|
)
|
(518
|
)
|
(493
|
)
|
—
|
|
—
|
|
—
|
|
|||||||||||
|
Amortization:
|
|||||||||||||||||||||||
|
Net loss
|
234
|
|
147
|
|
271
|
|
43
|
|
22
|
|
51
|
|
|||||||||||
|
Prior service cost (credit)
|
7
|
|
10
|
|
10
|
|
(39
|
)
|
(43
|
)
|
(45
|
)
|
|||||||||||
|
Termination and settlement
|
8
|
|
—
|
|
7
|
|
—
|
|
—
|
|
—
|
|
|||||||||||
|
Net periodic benefit cost
|
$
|
133
|
|
$
|
52
|
|
$
|
195
|
|
$
|
122
|
|
$
|
101
|
|
$
|
123
|
|
|||||
The amounts included in termination and settlement in the table above were comprised of the following changes:
|
(in millions)
|
2015
|
|
2013
|
|
|||
|
Benefit obligation
|
$
|
—
|
|
$
|
1
|
|
|
|
Other comprehensive earnings/losses:
|
|||||||
|
Net loss
|
8
|
|
6
|
|
|||
|
$
|
8
|
|
$
|
7
|
|
||
At December 31, 2014, Altria Group, Inc. updated its mortality assumptions to reflect longer life expectancy for its pension plan and postretirement plan participants,
resulting in an increase of approximately
$60 million
and
$10 million
to its 2015 pre-tax pension and postretirement net periodic benefit cost, respectively.
The estimated net loss and prior service cost (credit) that are expected to be amortized from accumulated other comprehensive losses into net periodic benefit cost during 2016 is as follows:
|
(in millions)
|
Pension
|
|
Postretirement
|
|
|||
|
Net loss
|
$
|
183
|
|
$
|
30
|
|
|
|
Prior service cost (credit)
|
5
|
|
(40
|
)
|
|||
The following assumptions were used to determine Altria Group, Inc.’s net periodic benefit cost for the years ended December 31:
|
Pension
|
Postretirement
|
||||||||||||||||
|
2015
|
|
2014
|
|
2013
|
|
2015
|
|
2014
|
|
2013
|
|
||||||
|
Discount rate
|
4.1
|
%
|
4.9
|
%
|
4.0
|
%
|
4.0
|
%
|
4.8
|
%
|
3.9
|
%
|
|||||
|
Expected rate of return on plan assets
|
8.0
|
|
8.0
|
|
8.0
|
|
—
|
|
—
|
|
—
|
|
|||||
|
Rate of compensation increase
|
4.0
|
|
4.0
|
|
4.0
|
|
—
|
|
—
|
|
—
|
|
|||||
|
Health care cost trend rate
|
—
|
|
—
|
|
—
|
|
7.0
|
|
7.0
|
|
7.5
|
|
|||||
Assumed health care cost trend rates have a significant effect on the amounts reported for the postretirement health care plans. A one-percentage-point change in assumed health care cost trend rates would have had the following effects as of
December 31, 2015
:
|
One-Percentage-Point Increase
|
|
One-Percentage-Point Decrease
|
|
||
|
Effect on total of postretirement service and interest cost
|
6.8
|
%
|
(5.8
|
)%
|
|
|
Effect on postretirement benefit obligation
|
7.5
|
%
|
(6.1
|
)%
|
|
▪
Defined Contribution Plans:
Altria Group, Inc. sponsors deferred profit-sharing plans covering certain salaried, non-union and union employees. Contributions and costs are determined generally as a percentage of earnings, as defined by the plans. Amounts charged to expense for these defined contribution plans totaled
$85 million
,
$82 million
and
$80 million
in
2015
,
2014
and
2013
, respectively.
▪
Pension Plan Assets:
Altria Group, Inc.’s pension plans investment strategy is based on an expectation that equity securities will outperform debt securities over the long term. Altria Group, Inc. believes that it implements the investment strategy in a prudent and risk-controlled manner, consistent with
61
Altria Group, Inc. and Subsidiaries
Notes to Consolidated Financial Statements
_________________________
the fiduciary requirements of the Employee Retirement Income Security Act of 1974, by investing retirement plan assets in a well-diversified mix of equities, fixed income and other securities that reflects the impact of the demographic mix of plan participants on the benefit obligation using a target asset allocation between equity securities and fixed income investments of
55%
/
45%
. The composition of Altria Group, Inc.’s plan assets at
December 31, 2015
was broadly characterized as an allocation between equity securities (
56%
), corporate bonds (
32%
), U.S. Treasury and foreign government securities (
8%
) and all other types of investments (
4%
). Virtually all pension assets can be used to make monthly benefit payments.
Altria Group, Inc.’s pension plans investment objective is accomplished by investing in U.S. and international equity index strategies that are intended to mirror indices such as the Standard & Poor’s 500 Index, Russell Small Cap Completeness Index, Research Affiliates Fundamental Index (“RAFI”) Low Volatility U.S. Index, and Morgan Stanley Capital International (“MSCI”) Europe, Australasia, and the Far East (“EAFE”) Index. Altria Group, Inc.’s pension plans also invest in actively managed international equity securities of large, mid and small cap
companies located in developed and emerging markets, as well as long duration fixed income securities that primarily include corporate bonds of companies from diversified industries. The allocation to below investment grade securities represented
18%
of the fixed income holdings or
8%
of total plan assets at
December 31, 2015
. The allocation to emerging markets represented
4%
of the equity holdings or
2%
of total plan assets at
December 31, 2015
. The allocation to real estate and private equity investments was immaterial at
December 31, 2015
.
Altria Group, Inc.’s pension plans risk management practices include ongoing monitoring of asset allocation, investment performance and investment managers’ compliance with their investment guidelines, periodic rebalancing between equity and debt asset classes and annual actuarial re-measurement of plan liabilities.
Altria Group, Inc.’s expected rate of return on pension plan assets is determined by the plan assets’ historical long-term investment performance, current asset allocation and estimates of future long-term returns by asset class. The forward-looking estimates are consistent with the overall long-term averages exhibited by returns on equity and fixed income securities.
The fair values of Altria Group, Inc.’s pension plan assets by asset category at
December 31, 2015
and
2014
were as follows:
|
2015
|
2014
|
||||||||||||||||||||||||||||||
|
(in millions)
|
Level 1
|
|
Level 2
|
|
Level 3
|
|
Total
|
|
Level 1
|
|
Level 2
|
|
Level 3
|
|
Total
|
|
|||||||||||||||
|
Common/collective trusts:
|
|||||||||||||||||||||||||||||||
|
U.S. large cap
|
$
|
—
|
|
$
|
1,762
|
|
$
|
—
|
|
$
|
1,762
|
|
$
|
—
|
|
$
|
1,870
|
|
$
|
—
|
|
$
|
1,870
|
|
|||||||
|
U.S. small cap
|
—
|
|
360
|
|
—
|
|
360
|
|
—
|
|
442
|
|
—
|
|
442
|
|
|||||||||||||||
|
International developed markets
|
—
|
|
78
|
|
—
|
|
78
|
|
—
|
|
79
|
|
—
|
|
79
|
|
|||||||||||||||
|
U.S. and foreign government securities or their agencies:
|
|||||||||||||||||||||||||||||||
|
U.S. government and agencies
|
—
|
|
331
|
|
—
|
|
331
|
|
—
|
|
296
|
|
—
|
|
296
|
|
|||||||||||||||
|
U.S. municipal bonds
|
—
|
|
102
|
|
—
|
|
102
|
|
—
|
|
124
|
|
—
|
|
124
|
|
|||||||||||||||
|
Foreign government and agencies
|
—
|
|
252
|
|
—
|
|
252
|
|
—
|
|
281
|
|
—
|
|
281
|
|
|||||||||||||||
|
Corporate debt instruments:
|
|||||||||||||||||||||||||||||||
|
Above investment grade
|
—
|
|
1,660
|
|
—
|
|
1,660
|
|
—
|
|
1,765
|
|
—
|
|
1,765
|
|
|||||||||||||||
|
Below investment grade and no rating
|
—
|
|
502
|
|
—
|
|
502
|
|
—
|
|
527
|
|
—
|
|
527
|
|
|||||||||||||||
|
Common stock:
|
|||||||||||||||||||||||||||||||
|
International equities
|
907
|
|
—
|
|
2
|
|
909
|
|
1,000
|
|
—
|
|
1
|
|
1,001
|
|
|||||||||||||||
|
U.S. equities
|
605
|
|
—
|
|
—
|
|
605
|
|
556
|
|
—
|
|
—
|
|
556
|
|
|||||||||||||||
|
Registered investment companies
|
58
|
|
—
|
|
—
|
|
58
|
|
63
|
|
113
|
|
—
|
|
176
|
|
|||||||||||||||
|
Other, net
|
16
|
|
58
|
|
13
|
|
87
|
|
74
|
|
91
|
|
15
|
|
180
|
|
|||||||||||||||
|
Total investments at fair value, net
|
$
|
1,586
|
|
$
|
5,105
|
|
$
|
15
|
|
$
|
6,706
|
|
$
|
1,693
|
|
$
|
5,588
|
|
$
|
16
|
|
$
|
7,297
|
|
|||||||
Level 3 holdings and transactions were immaterial to total plan assets at
December 31, 2015
and
2014
.
For a description of the fair value hierarchy and the three levels of inputs used to measure fair value, see
Note 2
.
Summary of Significant Accounting Policies
.
Following is a description of the valuation methodologies used for investments measured at fair value.
|
▪
|
Common/Collective Trusts
: Common/collective trusts consist of funds that are intended to mirror indices such as Standard & Poor’s 500 Index, Russell Small Cap Completeness Index and MSCI EAFE Index. They are valued on the basis of the relative interest of each participating investor in the fair value of the underlying assets of each of the respective common/collective trusts.
|
62
Altria Group, Inc. and Subsidiaries
Notes to Consolidated Financial Statements
_________________________
The underlying assets are valued based on the net asset value (“NAV”), which is provided by the investment account manager as a practical expedient to estimate fair value.
|
▪
|
U.S. and Foreign Government Securities
: U.S. and foreign government securities consist of investments in Treasury Nominal Bonds and Inflation Protected Securities and municipal securities. Government securities are valued at a price that is based on a compilation of primarily observable market information, such as broker quotes. Matrix pricing, yield curves and indices are used when broker quotes are not available.
|
|
▪
|
Corporate Debt Instruments
: Corporate debt instruments are valued at a price that is based on a compilation of primarily observable market information, such as broker quotes. Matrix pricing, yield curves and indices are used when broker quotes are not available.
|
|
▪
|
Common Stock
: Common stocks are valued based on the price of the security as listed on an open active exchange on last trade date.
|
|
▪
|
Registered Investment Companies
: Investments in mutual funds sponsored by a registered investment company are
|
valued based on exchange listed prices and are classified in Level 1. Registered investment company funds that are designed specifically to meet Altria Group, Inc.’s pension plans investment strategies, but are not traded on an active market, are valued based on the NAV of the underlying securities and are classified in Level 2. The NAV is provided by the investment account manager as a practical expedient to estimate fair value.
▪
Cash Flows:
Altria Group, Inc. makes contributions to the pension plans to the extent that the contributions are tax deductible and pays benefits that relate to plans for salaried employees that cannot be funded under IRS regulations. Currently, Altria Group, Inc. anticipates making employer contributions to its pension plans of approximately
$30 million
to
$75 million
in 2016 based on current tax law. However, this estimate is subject to change as a result of changes in tax and other benefit laws, as well as asset performance significantly above or below the assumed long-term rate of return on pension assets, or changes in interest rates.
Estimated future benefit payments at
December 31, 2015
were as follows:
|
(in millions)
|
Pension
|
|
Postretirement
|
|
|||
|
2016
|
$
|
436
|
|
$
|
147
|
|
|
|
2017
|
440
|
|
149
|
|
|||
|
2018
|
442
|
|
149
|
|
|||
|
2019
|
437
|
|
148
|
|
|||
|
2020
|
446
|
|
144
|
|
|||
|
2021-2025
|
2,348
|
|
686
|
|
|||
Comprehensive Earnings/Losses
The amounts recorded in accumulated other comprehensive losses at
December 31, 2015
consisted of the following:
|
(in millions)
|
Pension
|
|
Post-
retirement
|
|
Post-
employment
|
|
Total
|
|
|||||||
|
Net loss
|
$
|
(2,805
|
)
|
$
|
(588
|
)
|
$
|
(108
|
)
|
$
|
(3,501
|
)
|
|||
|
Prior service (cost) credit
|
(22
|
)
|
231
|
|
—
|
|
209
|
|
|||||||
|
Deferred income taxes
|
1,101
|
|
141
|
|
40
|
|
1,282
|
|
|||||||
|
Amounts recorded in accumulated other comprehensive losses
|
$
|
(1,726
|
)
|
$
|
(216
|
)
|
$
|
(68
|
)
|
$
|
(2,010
|
)
|
|||
The amounts recorded in accumulated other comprehensive losses at
December 31, 2014
consisted of the following:
|
(in millions)
|
Pension
|
|
Post-
retirement
|
|
Post-
employment
|
|
Total
|
|
|||||||
|
Net loss
|
$
|
(2,637
|
)
|
$
|
(823
|
)
|
$
|
(122
|
)
|
$
|
(3,582
|
)
|
|||
|
Prior service (cost) credit
|
(23
|
)
|
264
|
|
—
|
|
241
|
|
|||||||
|
Deferred income taxes
|
1,037
|
|
218
|
|
46
|
|
1,301
|
|
|||||||
|
Amounts recorded in accumulated other comprehensive losses
|
$
|
(1,623
|
)
|
$
|
(341
|
)
|
$
|
(76
|
)
|
$
|
(2,040
|
)
|
|||
63
Altria Group, Inc. and Subsidiaries
Notes to Consolidated Financial Statements
_________________________
The movements in other comprehensive earnings/losses during the year ended
December 31, 2015
were as follows:
|
(in millions)
|
Pension
|
|
Post-
retirement
|
|
Post-
employment
|
|
Total
|
|
|||||||
|
Amounts reclassified to net earnings as components of net periodic benefit cost:
|
|||||||||||||||
|
Amortization:
|
|||||||||||||||
|
Net loss
|
$
|
234
|
|
$
|
43
|
|
$
|
19
|
|
$
|
296
|
|
|||
|
Prior service cost/credit
|
7
|
|
(39
|
)
|
—
|
|
(32
|
)
|
|||||||
|
Other expense:
|
|||||||||||||||
|
Net loss
|
8
|
|
—
|
|
—
|
|
8
|
|
|||||||
|
Deferred income taxes
|
(96
|
)
|
(2
|
)
|
(7
|
)
|
(105
|
)
|
|||||||
|
153
|
|
2
|
|
12
|
|
167
|
|
||||||||
|
Other movements during the year:
|
|||||||||||||||
|
Net loss
|
(410
|
)
|
192
|
|
(5
|
)
|
(223
|
)
|
|||||||
|
Prior service cost/credit
|
(6
|
)
|
6
|
|
—
|
|
—
|
|
|||||||
|
Deferred income taxes
|
160
|
|
(75
|
)
|
1
|
|
86
|
|
|||||||
|
(256
|
)
|
123
|
|
(4
|
)
|
(137
|
)
|
||||||||
|
Total movements in other comprehensive earnings/losses
|
$
|
(103
|
)
|
$
|
125
|
|
$
|
8
|
|
$
|
30
|
|
|||
The movements in other comprehensive earnings/losses during the year ended
December 31, 2014
were as follows:
|
(in millions)
|
Pension
|
|
Post-
retirement
|
|
Post-
employment
|
|
Total
|
|
|||||||
|
Amounts reclassified to net earnings as components of net periodic benefit cost:
|
|||||||||||||||
|
Amortization:
|
|||||||||||||||
|
Net loss
|
$
|
147
|
|
$
|
22
|
|
$
|
18
|
|
$
|
187
|
|
|||
|
Prior service cost/credit
|
10
|
|
(43
|
)
|
—
|
|
(33
|
)
|
|||||||
|
Deferred income taxes
|
(61
|
)
|
8
|
|
(7
|
)
|
(60
|
)
|
|||||||
|
96
|
|
(13
|
)
|
11
|
|
94
|
|
||||||||
|
Other movements during the year:
|
|||||||||||||||
|
Net loss
|
(1,093
|
)
|
(306
|
)
|
(12
|
)
|
(1,411
|
)
|
|||||||
|
Deferred income taxes
|
425
|
|
120
|
|
5
|
|
550
|
|
|||||||
|
(668
|
)
|
(186
|
)
|
(7
|
)
|
(861
|
)
|
||||||||
|
Total movements in other comprehensive earnings/losses
|
$
|
(572
|
)
|
$
|
(199
|
)
|
$
|
4
|
|
$
|
(767
|
)
|
|||
The movements in other comprehensive earnings/losses during the year ended
December 31, 2013
were as follows:
|
(in millions)
|
Pension
|
|
Post-
retirement
|
|
Post-
employment
|
|
Total
|
|
|||||||
|
Amounts reclassified to net earnings as components of net periodic benefit cost:
|
|||||||||||||||
|
Amortization:
|
|||||||||||||||
|
Net loss
|
$
|
271
|
|
$
|
51
|
|
$
|
18
|
|
$
|
340
|
|
|||
|
Prior service cost/credit
|
10
|
|
(45
|
)
|
—
|
|
(35
|
)
|
|||||||
|
Other expense:
|
|||||||||||||||
|
Net loss
|
6
|
|
—
|
|
—
|
|
6
|
|
|||||||
|
Deferred income taxes
|
(111
|
)
|
(2
|
)
|
(7
|
)
|
(120
|
)
|
|||||||
|
176
|
|
4
|
|
11
|
|
191
|
|
||||||||
|
Other movements during the year:
|
|||||||||||||||
|
Net loss
|
1,218
|
|
327
|
|
23
|
|
1,568
|
|
|||||||
|
Prior service cost/credit
|
(7
|
)
|
(2
|
)
|
—
|
|
(9
|
)
|
|||||||
|
Deferred income taxes
|
(470
|
)
|
(129
|
)
|
(10
|
)
|
(609
|
)
|
|||||||
|
741
|
|
196
|
|
13
|
|
950
|
|
||||||||
|
Total movements in other comprehensive earnings/losses
|
$
|
917
|
|
$
|
200
|
|
$
|
24
|
|
$
|
1,141
|
|
|||
64
Altria Group, Inc. and Subsidiaries
Notes to Consolidated Financial Statements
_________________________
Note 17
. Additional Information
|
For the Years Ended December 31,
|
|||||||||||
|
(in millions)
|
2015
|
|
2014
|
|
2013
|
|
|||||
|
Research and development expense
|
$
|
186
|
|
$
|
167
|
|
$
|
153
|
|
||
|
Advertising expense
|
$
|
25
|
|
$
|
30
|
|
$
|
7
|
|
||
|
Interest and other debt expense, net:
|
|||||||||||
|
Interest expense
|
$
|
808
|
|
$
|
857
|
|
$
|
1,053
|
|
||
|
Interest income
|
(4
|
)
|
(2
|
)
|
(4
|
)
|
|||||
|
Interest related to NPM Adjustment Items
|
13
|
|
(47
|
)
|
—
|
|
|||||
|
$
|
817
|
|
$
|
808
|
|
$
|
1,049
|
|
|||
|
Rent expense
|
$
|
48
|
|
$
|
52
|
|
$
|
49
|
|
||
Minimum rental commitments and sublease income under non-cancelable operating leases in effect at
December 31, 2015
were as follows:
|
(in millions)
|
Rental Commitments
|
|
Sublease Income
|
|
|||
|
2016
|
$
|
58
|
|
$
|
6
|
|
|
|
2017
|
52
|
|
5
|
|
|||
|
2018
|
45
|
|
5
|
|
|||
|
2019
|
32
|
|
5
|
|
|||
|
2020
|
28
|
|
5
|
|
|||
|
Thereafter
|
94
|
|
23
|
|
|||
|
$
|
309
|
|
$
|
49
|
|
||
The activity in the allowance for discounts and allowance for returned goods for the years ended December 31, 2015, 2014 and 2013 was as follows:
|
(in millions)
|
2015
|
2014
|
2013
|
|||||||||||||||||||||
|
Discounts
|
|
Returned Goods
|
|
Discounts
|
|
Returned Goods
|
|
Discounts
|
|
Returned Goods
|
|
|||||||||||||
|
Balance at beginning of year
|
$
|
—
|
|
$
|
46
|
|
$
|
—
|
|
$
|
41
|
|
$
|
—
|
|
$
|
42
|
|
||||||
|
Charged to costs and expenses
|
618
|
|
217
|
|
599
|
|
179
|
|
610
|
|
150
|
|
||||||||||||
|
Deductions
(1)
|
(618
|
)
|
(195
|
)
|
(599
|
)
|
(174
|
)
|
(610
|
)
|
(151
|
)
|
||||||||||||
|
Balance at end of year
|
$
|
—
|
|
$
|
68
|
|
$
|
—
|
|
$
|
46
|
|
$
|
—
|
|
$
|
41
|
|
||||||
(1)
Represents the recording of discounts and returns for which allowances were created.
Note 18
. Contingencies
Legal proceedings covering a wide range of matters are pending or threatened in various United States and foreign jurisdictions against Altria Group, Inc. and its subsidiaries, including PM USA and UST and its subsidiaries, as well as their respective indemnitees. Various types of claims may be raised in these proceedings, including product liability, consumer protection, antitrust, tax, contraband shipments, patent infringement, employment matters, claims for contribution and claims of competitors or distributors.
Litigation is subject to uncertainty and it is possible that there could be adverse developments in pending or future cases. An unfavorable outcome or settlement of pending tobacco-related or other litigation could encourage the commencement of additional litigation. Damages claimed in some tobacco-related and other litigation are or can be significant and, in certain cases, range in the billions of dollars. The variability in pleadings in multiple jurisdictions, together with the actual experience of management
in litigating claims, demonstrate that the monetary relief that may be specified in a lawsuit bears little relevance to the ultimate outcome. In certain cases, plaintiffs claim that defendants’ liability is joint and several. In such cases, Altria Group, Inc. or its subsidiaries may face the risk that one or more co-defendants decline or otherwise fail to participate in the bonding required for an appeal or to pay their proportionate or jury-allocated share of a judgment. As a result, Altria Group, Inc. or its subsidiaries under certain circumstances may have to pay more than their proportionate share of any bonding- or judgment-related amounts. Furthermore, in those cases where plaintiffs are successful, Altria Group, Inc. or its subsidiaries may also be required to pay interest and attorneys’ fees.
Although PM USA has historically been able to obtain required bonds or relief from bonding requirements in order to prevent plaintiffs from seeking to collect judgments while adverse verdicts have been appealed, there remains a risk that such relief
65
Altria Group, Inc. and Subsidiaries
Notes to Consolidated Financial Statements
_________________________
may not be obtainable in all cases. This risk has been substantially reduced given that
47
states and Puerto Rico limit the dollar amount of bonds or require no bond at all. As discussed below, however, tobacco litigation plaintiffs have challenged the constitutionality of Florida’s bond cap statute in several cases and plaintiffs may challenge state bond cap statutes in other jurisdictions as well. Such challenges may include the applicability of state bond caps in federal court. Although Altria Group, Inc. cannot predict the outcome of such challenges, it is possible that the consolidated results of operations, cash flows or financial position of Altria Group, Inc., or one or more of its subsidiaries, could be materially affected in a particular fiscal quarter or fiscal year by an unfavorable outcome of one or more such challenges.
Altria Group, Inc. and its subsidiaries record provisions in the consolidated financial statements for pending litigation when they determine that an unfavorable outcome is probable and the amount of the loss can be reasonably estimated. At the present time, while it is reasonably possible that an unfavorable outcome in a case may occur, except to the extent discussed elsewhere in this
Note 18
.
Contingencies
: (i) management has concluded that it is not probable that a loss has been incurred in any of the pending tobacco-related cases; (ii) management is unable to estimate the possible loss or range of loss that could result from an unfavorable outcome in any of the pending tobacco-related cases; and (iii) accordingly, management has not provided any amounts in the consolidated financial statements for unfavorable outcomes, if any. Litigation defense costs are expensed as incurred.
Altria Group, Inc. and its subsidiaries have achieved substantial success in managing litigation. Nevertheless, litigation is subject to uncertainty and significant challenges remain. It is possible that the consolidated results of operations, cash flows or financial position of Altria Group, Inc., or one or more of its subsidiaries, could be materially affected in a particular fiscal quarter or fiscal year by an unfavorable outcome or settlement of certain pending litigation. Altria Group, Inc. and each of its subsidiaries named as a defendant believe, and each has been so advised by counsel handling the respective cases, that it has valid defenses to the litigation pending against it, as well as valid bases for appeal of adverse verdicts. Each of the companies has defended, and will continue to defend, vigorously against litigation challenges. However, Altria Group, Inc. and its subsidiaries may enter into settlement discussions in particular cases if they believe it is in the best interests of Altria Group, Inc. to do so.
Overview of Altria Group, Inc. and/or PM USA Tobacco-Related Litigation
▪
Types and Number of Cases:
Claims related to tobacco products generally fall within the following categories: (i) smoking and health cases alleging personal injury brought on behalf of individual plaintiffs; (ii) smoking and health cases primarily alleging personal injury or seeking court-supervised programs for ongoing medical monitoring and purporting to be brought on behalf of a class of individual plaintiffs, including cases in which the aggregated claims of a number of individual
plaintiffs are to be tried in a single proceeding; (iii) health care cost recovery cases brought by governmental (both domestic and foreign) plaintiffs seeking reimbursement for health care expenditures allegedly caused by cigarette smoking and/or disgorgement of profits; (iv) class action suits alleging that the uses of the terms “Lights” and “Ultra Lights” constitute deceptive and unfair trade practices, common law or statutory fraud, unjust enrichment, breach of warranty or violations of the Racketeer Influenced and Corrupt Organizations Act (“RICO”); and (v) other tobacco-related litigation described below. Plaintiffs’ theories of recovery and the defenses raised in pending smoking and health, health care cost recovery and “Lights/Ultra Lights” cases are discussed below.
The table below lists the number of certain tobacco-related cases pending in the United States against PM USA and, in some instances, Altria Group, Inc. as of December 31, 2015, 2014 and 2013:
|
2015
|
|
2014
|
|
2013
|
|
|
|
Individual Smoking and Health Cases
(1)
|
65
|
|
67
|
|
67
|
|
|
Smoking and Health Class Actions and Aggregated Claims Litigation
(2)
|
5
|
|
5
|
|
6
|
|
|
Health Care Cost Recovery Actions
(3)
|
1
|
|
1
|
|
1
|
|
|
“Lights/Ultra Lights” Class Actions
|
11
|
|
12
|
|
15
|
|
(1)
Does not include
2,499
cases brought by flight attendants seeking compensatory damages for personal injuries allegedly caused by exposure to environmental tobacco smoke (“ETS”). The flight attendants allege that they are members of an ETS smoking and health class action in Florida, which was settled in 1997 (
Broin
). The terms of the court-approved settlement in that case allowed class members to file individual lawsuits seeking compensatory damages, but prohibited them from seeking punitive damages. Also, does not include individual smoking and health cases brought by or on behalf of plaintiffs in Florida state and federal courts following the decertification of the
Engle
case (discussed below in
Smoking and Health Litigation - Engle Class Action
).
(2)
Includes as one case the
600
civil actions (of which
344
were actions against PM USA) that were to be tried in a single proceeding in West Virginia (
In re: Tobacco Litigation
). The West Virginia Supreme Court of Appeals has ruled that the United States Constitution did not preclude a trial in
two
phases in this case. Issues related to defendants’ conduct and whether punitive damages are permissible were tried in the first phase. Trial in the first phase of this case began in April 2013. In May 2013, the jury returned a verdict in favor of defendants on the claims for design defect, negligence, failure to warn, breach of warranty, and concealment and declined to find that the defendants’ conduct warranted punitive damages. Plaintiffs prevailed on their claim that ventilated filter cigarettes should have included use instructions for the period 1964 - 1969. The second phase will consist of trials to determine liability and compensatory damages. In November 2014, the West Virginia Supreme Court of Appeals affirmed the final judgment. In July 2015, the trial court entered an order that will result in the entry of final judgment in favor of defendants and against all but
30
plaintiffs who potentially have a claim against one or more defendants that may be pursued in a second phase of trial. The court intends to try the claims of these
30
plaintiffs in
six
consolidated trials, each with a group of
five
plaintiffs. The first trial is currently scheduled to begin May 1, 2017. Dates for the
five
remaining consolidated trials have not been scheduled.
(3)
See
Health Care Cost Recovery Litigation - Federal Government’s Lawsuit
below.
▪
International Tobacco-Related Cases:
As of January 26, 2016, PM USA is a named defendant in
ten
health care cost recovery actions in Canada,
eight
of which also name Altria Group, Inc. as a defendant. PM USA and Altria Group, Inc. are
66
Altria Group, Inc. and Subsidiaries
Notes to Consolidated Financial Statements
_________________________
also named defendants in
seven
smoking and health class actions filed in various Canadian provinces. See
Guarantees and Other Similar Matters
below for a discussion of the Distribution Agreement between Altria Group, Inc. and PMI that provides for indemnities for certain liabilities concerning tobacco products.
▪
Tobacco-Related Cases Set for Trial:
As of January 26, 2016,
five
Engle
progeny cases,
no
individual smoking and health case and
one
“Lights/Ultra Lights” class action against PM USA are set for trial through March 31, 2016.
One
medical monitoring class action against PM USA is currently in trial. Cases against other companies in the tobacco industry are also scheduled for trial during this period. Trial dates are subject to change.
▪
Trial Results:
Since January 1999, excluding the
Engle
progeny cases (separately discussed below), verdicts have been returned in
57
smoking and health, “Lights/Ultra Lights” and health care cost recovery cases in which PM USA was a defendant. Verdicts in favor of PM USA and other defendants were returned in
38
of the
57
cases. These
38
cases were tried in Alaska (
1
), California (
7
), Florida (
10
), Louisiana (
1
), Massachusetts (
1
), Mississippi (
1
), Missouri (
3
), New Hampshire (
1
), New Jersey (
1
), New York (
5
), Ohio (
2
), Pennsylvania (
1
), Rhode Island (
1
), Tennessee (
2
) and West Virginia (
2
). A motion for a new trial was granted in
one
of the cases in Florida and in the case in Alaska.
In the Alaska case (
Hunter
), the trial court withdrew its order for a new trial upon PM USA’s motion for reconsideration. On December 18, 2015, the Alaska Supreme Court reversed the trial court decision and remanded the case with directions for the trial court to reassess whether to grant a new trial. See
Types and Number of Cases
above for a discussion of the trial results in
In re: Tobacco Litigation
(West Virginia consolidated cases).
Of the
19
non-
Engle
progeny cases in which verdicts were returned in favor of plaintiffs,
15
have reached final resolution. A verdict against defendants in
one
health care cost recovery case (
Blue Cross/Blue Shield
) was reversed and all claims were dismissed with prejudice. In addition, a verdict against defendants in a purported “Lights” class action in Illinois (
Price
) was reversed and the case was dismissed with prejudice in December 2006, but plaintiffs sought to reinstate the verdict, which an intermediate appellate court ordered in April 2014. On November 4, 2015, the Illinois Supreme Court vacated the Fifth Judicial District’s decision, finding that the plaintiffs filed the wrong motion in the wrong court. On November 18, 2015, the plaintiffs filed a new motion with the Illinois Supreme Court seeking to recall its original mandate, which the court denied on January 11, 2016. See
“Lights/Ultra Lights” Cases - The Price Case
below for a discussion of developments in
Price
.
As of January 26, 2016,
92
state and federal
Engle
progeny cases involving PM USA have resulted in verdicts since the Florida Supreme Court’s
Engle
decision as follows:
51
verdicts were returned in favor of plaintiffs;
39
verdicts were returned in favor of PM USA; and
two
verdicts that were initially returned in favor of plaintiffs were reversed on appeal and remain pending. See
Smoking and Health Litigation - Engle Progeny Trial Court Results
below for a discussion of these verdicts.
▪
Judgments Paid and Provisions for Tobacco and Health Litigation Items (Including
Engle
Progeny Litigation):
After exhausting all appeals in those cases resulting in adverse verdicts associated with tobacco-related litigation, since October 2004, PM USA has paid in the aggregate judgments (and related costs and fees) totaling approximately
$323 million
and interest totaling approximately
$144 million
as of December 31, 2015. These amounts include payments for
Engle
progeny judgments (and related costs and fees) totaling approximately
$22 million
, interest totaling approximately
$3 million
and payment of approximately
$43 million
in connection with the Federal
Engle
Agreement, discussed below.
The changes in Altria Group, Inc.’s accrued liability for tobacco and health litigation items, including related interest costs, for the years ended December 31, 2015, 2014 and 2013 were as follows:
|
(in millions)
|
2015
|
|
2014
|
|
2013
|
|
|||||
|
Accrued liability for tobacco and health litigation items at beginning of year
|
$
|
39
|
|
$
|
3
|
|
$
|
—
|
|
||
|
Pre-tax charges for:
|
|||||||||||
|
Tobacco and health judgments
|
84
|
|
11
|
|
18
|
|
|||||
|
Related interest costs
|
23
|
|
2
|
|
4
|
|
|||||
|
Agreement to resolve federal
Engle
progeny cases
|
43
|
|
—
|
|
—
|
|
|||||
|
Implementation of corrective communications remedy pursuant to the federal government’s lawsuit
|
—
|
|
31
|
|
—
|
|
|||||
|
Payments
|
(57
|
)
|
(8
|
)
|
(19
|
)
|
|||||
|
Accrued liability for tobacco and health litigation items at end of year
|
$
|
132
|
|
$
|
39
|
|
$
|
3
|
|
||
The accrued liability for tobacco and health litigation items, including related interest costs, was included in liabilities on Altria Group, Inc.’s consolidated balance sheets. Pre-tax charges for tobacco and health judgments, the agreement to resolve federal
Engle
progeny cases (discussed below under “
Agreement to Resolve Federal Engle Progeny Cases
”) and corrective communications were included in marketing, administration and research costs on Altria Group, Inc.’s consolidated statements of earnings. Pre-tax charges for related interest costs were included in interest and other debt expense, net on Altria Group, Inc.’s consolidated statements of earnings.
▪
Security for Judgments:
To obtain stays of judgments pending current appeals, as of
December 31, 2015
, PM USA has posted various forms of security totaling approximately
$77 million
, the majority of which has been collateralized with cash deposits that are included in other assets on the consolidated balance sheet.
67
Altria Group, Inc. and Subsidiaries
Notes to Consolidated Financial Statements
_________________________
Smoking and Health Litigation
▪
Overview:
Plaintiffs’ allegations of liability in smoking and health cases are based on various theories of recovery, including negligence, gross negligence, strict liability, fraud, misrepresentation, design defect, failure to warn, nuisance, breach of express and implied warranties, breach of special duty, conspiracy, concert of action, violations of deceptive trade practice laws and consumer protection statutes, and claims under the federal and state anti-racketeering statutes. Plaintiffs in the smoking and health cases seek various forms of relief, including compensatory and punitive damages, treble/multiple damages and other statutory damages and penalties, creation of medical monitoring and smoking cessation funds, disgorgement of profits, and injunctive and equitable relief. Defenses raised in these cases include lack of proximate cause, assumption of the risk, comparative fault and/or contributory negligence, statutes of limitations and preemption by the Federal Cigarette Labeling and Advertising Act.
▪
Non-
Engle
Progeny Litigation:
Summarized below are the non-
Engle
progeny smoking and health cases pending during 2015 in which verdicts were returned in favor of plaintiffs and against PM USA. Charts listing the verdicts for plaintiffs in the
Engle
progeny cases can be found in
Smoking and Health Litigation - Engle Progeny Trial Results
below.
Bullock
: On December 10, 2015, a jury in the U.S. District Court for the Central District of California returned a verdict in favor of plaintiff, awarding
$900,000
in compensatory damages. On January 8, 2016, the plaintiff moved for a new trial.
Schwarz
:
In
March 2002
, an Oregon jury awarded
$168,500
in compensatory damages and
$150 million
in punitive damages against PM USA. In
May 2002
, the trial court reduced the punitive damages award to
$100 million
. In May 2006, the Oregon Court of Appeals affirmed the compensatory damages verdict, reversed the award of punitive damages and remanded the case to the trial court for a second trial to determine the amount of punitive damages, if any. In June 2010, the Oregon Supreme Court affirmed the court of appeals’ decision and remanded the case to the trial court for a new trial limited to the question of punitive damages. In
December 2010
, the Oregon Supreme Court reaffirmed its earlier ruling and awarded PM USA approximately
$500,000
in costs. Trial on the amount of punitive damages began in January 2012. In
February 2012
, the jury awarded plaintiff
$25 million
in punitive damages. In July 2015, the Oregon Court of Appeals affirmed the judgment in favor of plaintiff and in September 2015, PM USA filed a petition for review with the Oregon Supreme Court, which the court denied on November 12, 2015. In the fourth quarter of 2015, PM USA recorded a provision on its consolidated balance sheet of approximately
$34 million
for the judgment plus interest and associated costs.
▪
Federal Government’s Lawsuit:
See
Health Care Cost Recovery Litigation - Federal Government’s Lawsuit
below for a discussion of the verdict and post-trial developments in the
United States of America
health care cost recovery case.
▪
Engle
Class Action:
In July 2000, in the second phase of the
Engle
smoking and health class action in Florida, a jury returned a verdict assessing punitive damages totaling approximately
$145 billion
against various defendants, including
$74 billion
against PM USA. Following entry of judgment, PM USA appealed.
In May 2001, the trial court approved a stipulation providing that execution of the punitive damages component of the
Engle
judgment will remain stayed against PM USA and the other participating defendants through the completion of all judicial review. As a result of the stipulation, PM USA placed
$500 million
into an interest-bearing escrow account that, regardless of the outcome of the judicial review, was to be paid to the court and the court was to determine how to allocate or distribute it consistent with Florida Rules of Civil Procedure. In May 2003, the Florida Third District Court of Appeal reversed the judgment entered by the trial court and instructed the trial court to order the decertification of the class. Plaintiffs petitioned the Florida Supreme Court for further review.
In July 2006, the Florida Supreme Court ordered that the punitive damages award be vacated, that the class approved by the trial court be decertified and that members of the decertified class could file individual actions against defendants within
one year
of issuance of the mandate. The court further declared the following Phase I findings are entitled to
res judicata
effect in such individual actions brought within one year of the issuance of the mandate: (i) that smoking causes various diseases; (ii) that nicotine in cigarettes is addictive; (iii) that defendants’ cigarettes were defective and unreasonably dangerous; (iv) that defendants concealed or omitted material information not otherwise known or available knowing that the material was false or misleading or failed to disclose a material fact concerning the health effects or addictive nature of smoking; (v) that defendants agreed to misrepresent information regarding the health effects or addictive nature of cigarettes with the intention of causing the public to rely on this information to their detriment; (vi) that defendants agreed to conceal or omit information regarding the health effects of cigarettes or their addictive nature with the intention that smokers would rely on the information to their detriment; (vii) that all defendants sold or supplied cigarettes that were defective; and (viii) that defendants were negligent. The court also reinstated compensatory damages awards totaling approximately
$6.9 million
to
two
individual plaintiffs and found that a third plaintiff’s claim was barred by the statute of limitations. In
February 2008
, PM USA paid approximately
$3 million
, representing its share of compensatory damages and interest, to the two individual plaintiffs identified in the Florida Supreme Court’s order.
In August 2006, PM USA sought rehearing from the Florida Supreme Court on parts of its July 2006 opinion, including the ruling (described above) that certain jury findings have
res judicata
effect in subsequent individual trials timely brought by
Engle
class members. The rehearing motion also asked, among other things, that legal errors that were raised but not expressly ruled upon in the Florida Third District Court of Appeal or in the Florida Supreme Court now be addressed. Plaintiffs also filed a motion for rehearing in August 2006 seeking clarification of the
68
Altria Group, Inc. and Subsidiaries
Notes to Consolidated Financial Statements
_________________________
applicability of the statute of limitations to non-members of the decertified class. In December 2006, the Florida Supreme Court refused to revise its July 2006 ruling, except that it revised the set of Phase I findings entitled to
res judicata
effect by excluding finding (v) listed above (relating to agreement to misrepresent information), and added the finding that defendants sold or supplied cigarettes that, at the time of sale or supply, did not conform to the representations of fact made by defendants. In January 2007, the Florida Supreme Court issued the mandate from its revised opinion. Defendants then filed a motion with the Florida Third District Court of Appeal requesting that the court address legal errors that were previously raised by defendants but have not yet been addressed either by the Florida Third District Court of Appeal or by the Florida Supreme Court. In February 2007, the Florida Third District Court of Appeal denied defendants’ motion. In May 2007, defendants’ motion for a partial stay of the mandate pending the completion of appellate review was denied by the Florida Third District Court of Appeal. In May 2007, defendants filed a petition for
writ of certiorari
with the United States Supreme Court, which the United States Supreme Court denied later in 2007.
In February 2008, the trial court decertified the class, except for purposes of the May 2001 bond stipulation, and formally vacated the punitive damages award pursuant to the Florida Supreme Court’s mandate. In April 2008, the trial court ruled that certain defendants, including PM USA, lacked standing with respect to allocation of the funds escrowed under the May 2001 bond stipulation and would receive no credit at that time from the
$500 million
paid by PM USA against any future punitive damages awards in cases brought by former
Engle
class members.
In May 2008, the trial court, among other things, decertified the limited class maintained for purposes of the May 2001 bond stipulation and, in July 2008, severed the remaining plaintiffs’ claims except for those of Howard Engle. The only remaining plaintiff in the
Engle
case, Howard Engle, voluntarily dismissed his claims with prejudice.
▪
Engle
Progeny Cases:
The deadline for filing
Engle
progeny cases, as required by the Florida Supreme Court’s
Engle
decision, expired in January 2008. As of January 26, 2016, approximately
3,040
state court cases were pending against PM USA or Altria Group, Inc. asserting individual claims by or on behalf of approximately
4,000
state court plaintiffs. While the Federal
Engle
Agreement (discussed below) resolved nearly all
Engle
progeny cases pending in federal court, as of January 26, 2016,
23
cases were pending against PM USA in federal court representing the cases excluded from that agreement. Because of a number of factors, including, but not limited to, docketing delays, duplicated filings and overlapping dismissal orders, these numbers are estimates.
▪
Agreement to Resolve Federal
Engle
Progeny Cases:
In February 2015, PM USA, R.J. Reynolds Tobacco Company (“R.J.
Reynolds”) and Lorillard Tobacco Company (“Lorillard”) reached a tentative agreement to resolve approximately
415
pending federal
Engle
progeny cases (the “Federal
Engle
Agreement”). Under the terms of the Federal
Engle
Agreement, PM USA paid into escrow approximately
$43 million
in March 2015. PM USA recorded a pre-tax provision of approximately
$43 million
in the first quarter of 2015. Federal cases that were in trial as of February 25, 2015 and those that have previously reached final verdict were not included in the Federal
Engle
Agreement. The Federal
Engle
Agreement was conditioned on approval by all federal court plaintiffs in the cases resolved by the Federal
Engle
Agreement or as the parties otherwise agree. The parties satisfied all conditions and, in December 2015, the cases subject to the Federal
Engle
Agreement were dismissed, thereby entitling plaintiffs to the
$43 million
escrow amount.
▪
Engle
Progeny Trial Results:
As of January 26, 2016,
92
federal and state
Engle
progeny cases involving PM USA have resulted in verdicts since the Florida Supreme Court
Engle
decision.
Fifty-one
verdicts were returned in favor of plaintiffs and
two
verdicts (
Graham
and
Skolnick
) that were initially returned in favor of plaintiffs were reversed on appeal and remain pending.
Thirty-nine
verdicts were returned in favor of PM USA, of which
30
were state cases (
Gelep
,
Kalyvas
,
Gil de Rubio
,
Warrick
,
Willis
,
Russo
(formerly
Frazier
),
C. Campbell
,
Rohr
,
Espinosa
,
Oliva
,
Weingart
,
Junious
,
Szymanski
,
Hancock
,
D. Cohen
,
LaMotte
,
J. Campbell
,
Dombey
,
Haldeman
,
Blasco
,
Gonzalez
,
Banks
,
Surico
,
Baum
,
Bishop
,
Vila
,
McMannis
,
Collar
,
Suarez
and
Shulman
) and
9
were federal cases (
Gollihue
,
McCray
,
Denton
,
Wilder
,
Jacobson
,
Reider
,
Davis
,
Starbuck
and
Sowers
). In addition, there have been a number of mistrials, only some of which have resulted in new trials as of January 26, 2016. The juries in the
Reider
and
Banks
cases returned zero damages verdicts in favor of PM USA
.
The juries in the
Weingart
and
Hancock
cases returned verdicts against PM USA awarding no damages, but the trial court in each case granted an
additur
. In the
Russo
case (formerly
Frazier
), however, the Florida Third District Court of Appeal reversed the judgment in defendants’ favor in April 2012 and remanded the case for a new trial. In April 2015, the Florida Supreme Court affirmed the reversal, rejecting defendants’ argument that the statute of repose applies to fraud and conspiracy claims in
Engle
progeny cases. In the trial court, the case was retried and, in April 2015, the jury returned a verdict in favor of defendants.
The charts below list the verdicts and post-trial developments in certain
Engle
progeny cases in which verdicts were returned in favor of plaintiffs (including
Hancock
, where the verdict originally was returned in favor of PM USA). The first chart lists such cases that are pending as of January 26, 2016; the second chart lists such cases that were pending within the previous 12 months, but that are now concluded.
69
Altria Group, Inc. and Subsidiaries
Notes to Consolidated Financial Statements
_________________________
Currently-Pending Cases
_________________________________________________________________________________________________________________________________________
Plaintiff:
Ledoux
Date:
December 2015
Verdict:
A Miami-Dade County jury returned a verdict in favor of plaintiff and against PM USA and R.J. Reynolds awarding
$10 million
in compensatory damages and allocating
47%
of the fault to PM USA. The jury also awarded plaintiff
$12.5 million
in punitive damages against each defendant.
Post-Trial Developments:
On January 4, 2016, PM USA and R.J. Reynolds filed various post-trial motions, including motions to set aside the verdict and for a new trial. On January 6, 2016, the trial court entered final judgment against PM USA and R.J. Reynolds without any deduction for plaintiff’s comparative fault.
_________________________________________________________________________________________________________________________________________
Plaintiff:
Barbose
Date:
November 2015
Verdict:
A Pasco County jury returned a verdict in favor of plaintiff and against PM USA and R.J. Reynolds awarding
$10 million
in compensatory damages and allocating
42.5%
of the fault to PM USA. The jury also awarded plaintiff
$500,000
in punitive damages against each defendant.
Post-Trial Developments:
On November 23, 2015, the court entered final judgment in favor of plaintiff without any deduction for plaintiff’s comparative fault. On December 2, 2015, PM USA and R.J. Reynolds filed various post-trial motions, including motions to set aside the verdict and for a new trial, which the court denied on January 21, 2016.
_________________________________________________________________________________________________________________________________________
Plaintiff:
Tognoli
Date:
November 2015
Verdict:
A Broward County jury returned a verdict in favor of plaintiff and against PM USA awarding
$1.05 million
in compensatory damages and allocating
15%
of the fault to PM USA (an amount of
$157,500
).
Post-Trial Developments:
On December 3, 2015, PM USA filed a motion to set aside the verdict and for judgment in accordance with its motion for directed verdict. On January 14, 2016, the trial court entered final judgment against PM USA with a deduction for plaintiff’s comparative fault. On January 15, 2016, plaintiff filed an appeal to the Florida Fourth District Court of Appeal. On January 19, 2016, the trial court denied PM USA’s post-trial motions and, on January 25, 2016, PM USA cross-appealed.
_________________________________________________________________________________________________________________________________________
Plaintiff:
Danielson
Date:
November 2015
Verdict:
An Escambia County jury returned a verdict in favor of plaintiff and against PM USA awarding
$325,000
in compensatory damages and allocating
49%
of the fault to PM USA. The jury also awarded plaintiff
$325,000
in punitive damages.
Post-Trial Developments:
On November 17, 2015, plaintiff filed a motion to enforce the parties’ pretrial stipulation of
$2.3 million
in economic damages. The plaintiff also filed a motion for an
additur
or, in the alternative, for a new trial. On November 19, 2015, PM USA filed post-trial motions, including a motion concerning the proper form of judgment and for a new trial. On December 31, 2015, the trial court granted plaintiff’s motion for a new trial on damages and denied PM USA’s post-trial motions. On January 13, 2016, PM USA filed a notice of appeal to the Florida First District Court of Appeal.
_________________________________________________________________________________________________________________________________________
70
Altria Group, Inc. and Subsidiaries
Notes to Consolidated Financial Statements
_________________________
Plaintiff:
Marchese
Date:
October 2015
Verdict:
A Broward County jury returned a verdict in favor of plaintiff and against PM USA and R.J. Reynolds awarding
$1 million
in compensatory damages and allocating
22.5%
of the fault to PM USA. The jury also awarded plaintiff
$250,000
in punitive damages against each defendant.
Post-Trial Developments:
In October 2015, defendants filed various post-trial motions, including motions to set aside the verdict and for a new trial. On November 5, 2015, the court entered final judgment in favor of plaintiff. The post-trial motions remain pending.
_________________________________________________________________________________________________________________________________________
Plaintiff:
Duignan
Date:
September 2015
Verdict:
A Pinellas County jury returned a verdict in favor of plaintiff and against PM USA and R.J. Reynolds awarding
$6 million
in compensatory damages and allocating
37%
of the fault to PM USA. The jury also awarded plaintiff
$3.5 million
in punitive damages against PM USA.
Post-Trial Developments:
In September 2015, the trial court entered final judgment without any deduction for plaintiff’s comparative fault, and PM USA filed various post-trial motions, including motions to set aside the verdict and for a new trial, which the court denied in October 2015. On November 12, 2015, PM USA and R.J. Reynolds filed a notice of appeal to the Florida Second District Court of Appeal and, on November 16, 2015, PM USA posted a bond in the amount of approximately
$2.7 million
.
_________________________________________________________________________________________________________________________________________
Plaintiff:
Cooper
Date:
September 2015
Verdict:
A Broward County jury returned a verdict in favor of plaintiff and against PM USA and R.J. Reynolds awarding
$4.5 million
in compensatory damages and allocating
10%
of the fault to PM USA (an amount of
$450,000
).
Post-Trial Developments:
In September 2015, defendants filed various post-trial motions, including motions to set aside the verdict and for a directed verdict. On January 4, 2016, the trial court denied PM USA’s post-trial motions.
_________________________________________________________________________________________________________________________________________
Plaintiff:
Jordan
Date:
August 2015
Verdict:
A Duval County jury returned a verdict in favor of plaintiff and against PM USA awarding approximately
$7.8 million
in compensatory damages and allocating
60%
of the fault to PM USA. The jury also awarded approximately
$3.2 million
in punitive damages.
Post-Trial Developments:
In August 2015, the trial court entered final judgment without any deduction for plaintiff’s comparative fault, but reduced the compensatory damages to approximately
$6.4 million
. PM USA filed various post-trial motions, including motions to set aside the verdict and for a new trial, which the court denied on December 3, 2015. On December 28, 2015, PM USA filed a notice of appeal to the Florida First District Court of Appeal.
_________________________________________________________________________________________________________________________________________
Plaintiff:
Merino
Date:
July 2015
Verdict:
A Miami-Dade County jury returned a verdict in favor of plaintiff and against PM USA awarding
$8 million
in compensatory damages and allocating
70%
of the fault to PM USA. The jury also awarded
$6.5 million
in punitive damages.
71
Altria Group, Inc. and Subsidiaries
Notes to Consolidated Financial Statements
_________________________
Post-Trial Developments:
In August 2015, the trial court denied all post-trial motions, including motions to set aside the verdict and for a new trial, and entered final judgment without any deduction for plaintiff’s comparative fault. In
September 2015, PM USA filed a notice of appeal to the Florida Third District Court of Appeal and posted a bond in the amount of
$5 million
.
_________________________________________________________________________________________________________________________________________
Plaintiff:
McCoy
Date:
July 2015
Verdict:
A Broward County jury returned a verdict in favor of plaintiff and against PM USA, R.J. Reynolds and Lorillard awarding
$1.5 million
in compensatory damages and allocating
20%
of the fault to PM USA (an amount of
$300,000
). The jury also awarded
$3 million
in punitive damages against each defendant.
Post-Trial Developments:
In July 2015, defendants filed various post-trial motions, including motions to set aside the verdict and for a new trial. In August 2015, the trial court entered final judgment without any deduction for plaintiff’s comparative fault. On January 4, 2016, the trial court denied defendants’ post-trial motions and amended the final judgment to apply the comparative fault deduction. On January 20, 2016, defendants filed a notice of appeal to the Florida Fourth District Court of Appeal. On January 22, 2016, PM USA posted a bond in the amount of approximately
$1.65 million
.
_________________________________________________________________________________________________________________________________________
Plaintiff:
M. Brown
Date:
May 2015
Verdict:
In May 2015, a Duval County jury returned a verdict in favor of plaintiff and against PM USA in a partial retrial. In 2013, a jury returned a partial verdict against PM USA, but was deadlocked as to (i) the amount of compensatory damages, (ii) whether punitive damages should be awarded and, if so, (iii) the amount of punitive damages. In the partial retrial, the jury was asked to address these issues. In May 2015, the jury awarded
$6.375 million
in compensatory damages, but did not award any punitive damages.
Post-Trial Developments:
In May 2015, the trial court entered final judgment without any deduction for plaintiff’s comparative fault, and PM USA posted a bond in the amount of
$5 million
. Additionally, PM USA filed post-trial motions, including motions to set aside the verdict and for a new trial, as well as filed a notice of appeal to the Florida First District Court of Appeal. In August 2015, the trial court denied the last of PM USA’s post-trial motions and plaintiff cross-appealed.
_________________________________________________________________________________________________________________________________________
Plaintiff:
Gore
Date:
March 2015
Verdict:
An Indian River County jury returned a verdict in favor of plaintiff and against PM USA and R.J. Reynolds awarding
$2 million
in compensatory damages and allocating
23%
of the fault to PM USA (an amount of
$460,000
).
Post-Trial Developments:
In April 2015, defendants filed post-trial motions, including motions to set aside the verdict and for a new trial. In September 2015, the trial court entered final judgment with a deduction for plaintiff’s comparative fault. In October 2015, defendants filed a notice of appeal to the Florida Fourth District Court of Appeal and PM USA subsequently posted a bond in the amount of
$460,000
.
_________________________________________________________________________________________________________________________________________
Plaintiff:
Pollari
Date:
March 2015
Verdict:
A Broward County jury returned a verdict in favor of plaintiff and against PM USA and R.J. Reynolds awarding
$10 million
in compensatory damages and allocating
42.5%
of the fault to PM USA (an amount of
$4.25 million
). The jury also awarded
$1.5 million
in punitive damages against each defendant.
72
Altria Group, Inc. and Subsidiaries
Notes to Consolidated Financial Statements
_________________________
Post-Trial Developments:
In April 2015, defendants filed post-trial motions, including motions to set aside the verdict and for a new trial, and the trial court entered final judgment without any deduction for plaintiff’s comparative fault. On January 4, 2016, the trial court denied defendants’ post-trial motions and amended the final judgment to apply the comparative fault deduction. On January 27, 2016, defendants filed a notice of appeal to the Florida Fourth District Court of Appeal.
_________________________________________________________________________________________________________________________________________
Plaintiff:
Zamboni
Date:
February 2015
Verdict:
A jury in the U.S. District Court for the Middle District of Florida returned a verdict in favor of plaintiff and against PM USA and R.J. Reynolds awarding
$340,000
in compensatory damages and allocating
10%
of the fault to PM USA (an amount of
$34,000
).
Post-Trial Developments:
In April 2015, PM USA and R.J. Reynolds filed a motion for judgment in defendants’ favor in accordance with the Eleventh Circuit’s decision in
Graham.
In June 2015, the trial court stayed the case pending the Eleventh Circuit’s final disposition in the
Graham
case, discussed below.
_________________________________________________________________________________________________________________________________________
Plaintiff:
Caprio
Date:
February 2015
Verdict:
A Broward County jury returned a partial verdict in favor of plaintiff and against PM USA, R.J. Reynolds, Lorillard and Liggett Group LLC (“Liggett Group”). The jury found against defendants on class membership, allocating
25%
of the fault to PM USA. The jury also found
$559,172
in economic damages. The jury deadlocked with respect to the intentional torts, certain elements of compensatory damages and punitive damages.
Post-Trial Developments:
In March 2015, PM USA filed post-trial motions, including motions to set aside the partial verdict and for a new trial. In May 2015, the court denied all of PM USA’s post-trial motions and defendants filed a notice of appeal to the Florida Fourth District Court of Appeal.
_________________________________________________________________________________________________________________________________________
Plaintiff:
McKeever
Date:
February 2015
Verdict:
A Broward County jury returned a verdict in favor of plaintiff and against PM USA awarding approximately
$5.8 million
in compensatory damages and allocating
60%
of the fault to PM USA. The jury also awarded plaintiff approximately
$11.63 million
in punitive damages. However, the jury found in favor of PM USA on the statute of repose defense to plaintiff’s intentional tort and punitive damages claims.
Post-Trial Developments:
In March 2015, PM USA filed various post-trial motions, including motions to set aside the verdict and motions for a new trial. In April 2015, the trial court entered final judgment without any deduction for plaintiff’s comparative fault. In June 2015, the trial court denied PM USA’s post-trial motions, and PM USA posted a bond in the amount of
$5 million
. PM USA also filed a notice of appeal to the Florida Fourth District Court of Appeal in June 2015.
_________________________________________________________________________________________________________________________________________
Plaintiff:
D. Brown
Date:
January 2015
Verdict:
A jury in the U.S. District Court for the Middle District of Florida returned a verdict against PM USA awarding plaintiff approximately
$8.3 million
in compensatory damages and allocating
55%
of the fault to PM USA. The jury also awarded plaintiff
$9 million
in punitive damages.
Post-Trial Developments:
In February 2015, the trial court entered final judgment without any deduction for plaintiff’s comparative fault. In March 2015, PM
73
Altria Group, Inc. and Subsidiaries
Notes to Consolidated Financial Statements
_________________________
USA filed various post-trial motions, including motions to alter or amend the judgment and for a new trial or, in the alternative,
remittitur
of the damages awards, all of which the court denied. In July 2015, PM USA filed a notice of appeal to the U.S. Court of Appeals for the Eleventh Circuit. In August 2015, the Court of Appeals granted PM USA’s motion to stay the appeal pending disposition of
Graham
.
_________________________________________________________________________________________________________________________________________
Plaintiff:
Allen
Date:
November 2014
Verdict:
A Duval County jury returned a verdict against PM USA and R.J. Reynolds awarding plaintiff approximately
$3.1 million
in compensatory damages and allocating
6%
of the fault to PM USA. The jury also awarded approximately
$7.76 million
in punitive damages against each defendant. This was a retrial of a 2011 trial that awarded plaintiff
$6 million
in compensatory damages and
$17 million
in punitive damages against each defendant.
Post-Trial Developments:
In December 2014, defendants filed various post-trial motions, including motions to set aside the verdict and motions for a new trial, which the court denied in July 2015. In August 2015, the trial court entered final judgment without any deduction for plaintiff’s comparative fault. Defendants filed a notice of appeal to the Florida First District Court of Appeal in September 2015 and PM USA posted a bond in the amount of approximately
$2.5 million
.
_________________________________________________________________________________________________________________________________________
Plaintiff:
Perrotto
Date:
November 2014
Verdict:
A Palm Beach County jury returned a verdict against PM USA, R.J. Reynolds, Lorillard and Liggett Group awarding plaintiff approximately
$4.1 million
in compensatory damages and allocating
25%
of the fault to PM USA (an amount of approximately
$1.02 million
).
Post-Trial Developments:
In December 2014, the trial court entered final judgment with a deduction for plaintiff’s comparative fault, and plaintiff filed a motion for a new trial. In addition, in December 2014, defendants filed various post-trial motions, including motions to set aside the verdict and motions for a new trial.
_________________________________________________________________________________________________________________________________________
Plaintiff:
Boatright
Date:
November 2014
Verdict:
A Polk County jury returned a verdict against PM USA and Liggett Group awarding plaintiff
$15 million
in compensatory damages and allocating
85%
of the fault to PM USA (an amount of approximately
$12.75 million
). In addition, in November 2014, the jury awarded plaintiff approximately
$19.7 million
in punitive damages against PM USA and
$300,000
in punitive damages against Liggett Group.
Post-Trial Developments:
In November 2014, PM USA filed various post-trial motions and, in January 2015, the trial court denied PM USA’s motions for a new trial and for
remittitur
, but entered final judgment with a deduction for plaintiff’s comparative fault. In February 2015, defendants filed a notice of appeal to the Florida Second District Court of Appeal, and PM USA posted a bond in the amount of
$3.98 million
.
_________________________________________________________________________________________________________________________________________
Plaintiff:
Kerrivan
Date:
October 2014
Verdict:
A jury in the U.S. District Court for the Middle District of Florida returned a verdict against PM USA and R.J. Reynolds awarding plaintiff
$15.8 million
in compensatory damages and allocating
50%
of the fault to PM USA. The jury also awarded plaintiff
$25.3 million
in punitive damages and allocated
$15.7 million
to PM USA.
74
Altria Group, Inc. and Subsidiaries
Notes to Consolidated Financial Statements
_________________________
Post-Trial Developments:
The trial court entered final judgment without any deduction for plaintiff’s comparative fault. In December 2014, defendants filed various post-trial motions, including a renewed motion for judgment or for a new trial. Plaintiff agreed to waive the bond for the appeal. In May 2015, the trial court deferred further briefing on the post-trial motions pending the Eleventh Circuit’s final disposition in the
Graham
and
Searcy
cases, discussed below.
_________________________________________________________________________________________________________________________________________
Plaintiff:
Lourie
Date:
October 2014
Verdict:
A Hillsborough County jury returned a verdict against PM USA, R.J. Reynolds and Lorillard awarding plaintiff approximately
$1.37 million
in compensatory damages and allocating
27%
of the fault to PM USA (an amount of approximately
$370,000
).
Post-Trial Developments:
In October 2014, defendants filed a motion for judgment and a motion for a new trial. In November 2014, the trial court denied defendants’ post-trial motions and entered final judgment with a deduction for plaintiff’s comparative fault. Later in November 2014, defendants filed a notice of appeal to the Florida Second District Court of Appeal, and PM USA posted a bond in the amount of
$370,318
.
_________________________________________________________________________________________________________________________________________
Plaintiff:
Berger
Date:
September 2014
Verdict:
A jury in the U.S. District Court for the Middle District of Florida returned a verdict against PM USA awarding plaintiff
$6.25 million
in compensatory damages and allocating
60%
of the fault to PM USA. The jury also awarded
$20.76 million
in punitive damages.
Post-Trial Developments:
The trial court entered final judgment in September 2014 without any deduction for plaintiff’s comparative fault. In October 2014, plaintiff agreed to waive the bond for the appeal. Also in October 2014, PM USA filed a motion for a new trial or, in the alternative,
remittitur
of the jury’s damages awards. In April 2015, the trial court granted PM USA’s post-verdict motion in part and vacated the punitive damages award. With respect to the compensatory damages award, the court stayed the judgment pending the Eleventh Circuit’s final disposition in the
Graham
case, discussed below. In May 2015, plaintiff filed a motion for reconsideration of the order on the post-verdict motion, which the court denied and lifted the stay on November 18, 2015. On November 19, 2015, the court entered final judgment with a deduction for plaintiff’s comparative fault. On November 23, 2015, PM USA filed a motion to continue to stay the judgment pending final disposition in
Graham
, which the court denied on November 24, 2015. On December 18, 2015, PM USA filed a notice of appeal to the U.S. Court of Appeals for the Eleventh Circuit.
_________________________________________________________________________________________________________________________________________
Plaintiff:
Harris
Date:
July 2014
Verdict:
The U.S. District Court for the Middle District of Florida returned a verdict in favor of plaintiff and against PM USA, R.J. Reynolds and Lorillard awarding approximately
$1.73 million
in compensatory damages and allocating
15%
of the fault to PM USA.
Post-Trial Developments:
Defendants filed motions for a defense verdict because the jury’s findings indicated that plaintiff was not a member of the
Engle
class. In December 2014, the trial court entered final judgment without any deduction for plaintiff’s comparative fault and, in January 2015, defendants filed a renewed motion for judgment as a matter of law or, in the alternative, a motion for a new trial. Defendants also filed a motion to alter or amend the final judgment. In April 2015, the trial court stayed the post-trial proceedings pending the Eleventh Circuit’s final disposition in the
Graham
case, discussed below.
_________________________________________________________________________________________________________________________________________
75
Altria Group, Inc. and Subsidiaries
Notes to Consolidated Financial Statements
_________________________
Plaintiff:
Griffin
Date:
June 2014
Verdict:
A jury in the U.S. District Court for the Middle District of Florida returned a verdict in favor of plaintiff and against PM USA awarding approximately
$1.27 million
in compensatory damages and allocating
50%
of the fault to PM USA (an amount of approximately
$630,000
).
Post-Trial Developments:
The trial court entered final judgment against PM USA in July 2014 with a deduction for plaintiff’s comparative fault. In August 2014, PM USA filed a motion to amend the judgment to reduce plaintiff’s damages by the amount paid by collateral sources, which the court denied in September 2014. In October 2014, PM USA posted a bond in the amount of
$640,543
and filed a notice of appeal to the U.S. Court of Appeals for the Eleventh Circuit. In May 2015, the Eleventh Circuit stayed the appeal pending final disposition in the
Graham
case, discussed below.
_________________________________________________________________________________________________________________________________________
Plaintiff:
Burkhart
Date:
May 2014
Verdict:
A jury in the U.S. District Court for the Middle District of Florida returned a verdict in favor of plaintiff and against PM USA, R.J. Reynolds and Lorillard awarding
$5 million
in compensatory damages and allocating
15%
of the fault to PM USA. The jury also awarded plaintiff
$2.5 million
in punitive damages, allocating
$750,000
to PM USA.
Post-Trial Developments:
In July 2014, defendants filed post-trial motions, including a renewed motion for judgment or, alternatively, for a new trial or
remittitur
of the damages awards, which the court denied in September 2014. The trial court entered final judgment without any deduction for plaintiff’s comparative fault. In October 2014, defendants filed a notice of appeal to the U.S. Court of Appeals for the Eleventh Circuit.
_________________________________________________________________________________________________________________________________________
Plaintiff:
Bowden
Date:
March 2014
Verdict:
A Duval County jury returned a verdict in favor of plaintiff and against PM USA and R.J. Reynolds. The jury awarded plaintiff
$5 million
in compensatory damages and allocated
30%
of the fault to PM USA (an amount of
$1.5 million
).
Post-Trial Developments:
The trial court entered final judgment in March 2014 with a deduction for plaintiff’s comparative fault.
In April 2014, defendants filed post-trial motions, including motions for a new trial and to set aside the verdict. In May 2014, the court denied defendants’ post-trial motions. In June 2014, defendants filed a notice of appeal to the Florida First District Court of Appeal, and PM USA posted a bond in the amount of
$1.5 million
.
_________________________________________________________________________________________________________________________________________
Plaintiff:
Greene
(formerly
Rizzuto
)
Date:
August 2013
Verdict:
A Hernando County jury returned a verdict in favor of plaintiff and against PM USA and Liggett Group. The jury awarded plaintiff
$12.55 million
in compensatory damages and allocated
55%
of the fault to PM USA.
Post-Trial Developments:
In September 2013, defendants filed post-trial motions, including a motion to reduce damages. In September 2013, the trial court granted a
remittitur
in part on economic damages, which the court reduced from
$2.55 million
to
$1.1 million
for a total award of
$11.1 million
in compensatory damages. The trial court entered final judgment without a deduction for plaintiff’s comparative fault. The court denied all other motions except for defendants’ motion for a juror interview, which was granted. In October 2013, defendants filed a notice of appeal to the Florida Fifth District Court of Appeal, which ordered resolution of the juror issue prior to appeal. In December 2013, subsequent to the juror interview, the court entered an order that granted no relief with respect to the alleged misconduct of the juror. In July 2015, the Florida Fifth District Court of Appeal found that the trial court should have applied the comparative fault
76
Altria Group, Inc. and Subsidiaries
Notes to Consolidated Financial Statements
_________________________
deduction to the compensatory damages award. As a result, the judgment against PM USA was reduced to approximately
$6.1 million
. In September 2015, the Fifth District Court of Appeal denied PM USA’s motion for rehearing. In October 2015, PM USA posted a bond in the amount of
$6.1 million
. In the third quarter of 2015, PM USA recorded a provision on its condensed consolidated balance sheet of approximately
$6.7 million
for the judgment plus interest and associated costs.
_________________________________________________________________________________________________________________________________________
Plaintiff:
Skolnick
Date:
June 2013
Verdict:
A Palm Beach County jury returned a verdict in favor of plaintiff and against PM USA and R.J. Reynolds. The jury awarded plaintiff
$2.555 million
in compensatory damages and allocated
30%
of the fault to each defendant (an amount of
$766,500
).
Post-Trial Developments:
In June 2013, defendants and plaintiff filed post-trial motions. The trial court entered final judgment with a deduction for plaintiff’s comparative fault. In November 2013, the trial court denied plaintiff’s post-trial motion and, in December 2013, denied defendants’ post-trial motions. Defendants filed a notice of appeal to the Florida Fourth District Court of Appeal, and plaintiffs cross-appealed in December 2013. Also in December 2013, PM USA posted a bond in the amount of
$766,500
. In July 2015, the District Court of Appeal reversed the compensatory damages award and ordered judgment in favor of defendants on the strict liability and negligence claims, but remanded plaintiff’s conspiracy and concealment claims for a new trial. In August 2015, defendants filed a motion for rehearing, and plaintiff filed a motion for clarification, which the District Court of Appeal denied in September 2015.
_________________________________________________________________________________________________________________________________________
Plaintiff:
Starr-Blundell
Date:
June 2013
Verdict:
A Duval County jury returned a verdict in favor of plaintiff and against PM USA and R.J. Reynolds. The jury awarded plaintiff
$500,000
in compensatory damages and allocated
10%
of the fault to each defendant (an amount of
$50,000
).
Post-Trial Developments:
In June 2013, the defendants filed a motion to set aside the verdict and to enter judgment in accordance with their motion for directed verdict or, in the alternative, for a new trial, which was denied in October 2013. In November 2013, the trial court entered final judgment with a deduction for plaintiff’s comparative fault. In December 2013, plaintiff filed a notice of appeal to the Florida First District Court of Appeal. Plaintiff agreed to waive the bond for the appeal. In May 2015, the Florida First District Court of Appeal affirmed the final judgment. In June 2015, plaintiff filed a notice to invoke the discretionary jurisdiction of the Florida Supreme Court. In July 2015, the Florida Supreme Court stayed the case pending the outcome of
Soffer
, discussed below.
_________________________________________________________________________________________________________________________________________
Plaintiff:
Graham
Date:
May 2013
Verdict:
A jury in the U.S. District Court for the Middle District of Florida returned a verdict in favor of plaintiff and against PM USA and R.J. Reynolds. The jury awarded
$2.75 million
in compensatory damages and allocated
10%
of the fault to PM USA (an amount of
$275,000
).
Post-Trial Developments:
In June 2013, defendants filed several post-trial motions, including motions for judgment as a matter of law and for a new trial, which the trial court denied in September 2013. The trial court entered final judgment with a deduction for plaintiff’s comparative fault. In October 2013, defendants filed a notice of appeal to the U.S. Court of Appeals for the Eleventh Circuit arguing that
Engle
progeny plaintiffs’ product liability claims are impliedly preempted by federal law, and PM USA posted a bond in the amount of
$277,750
. In April 2015, the U.S. Court of Appeals for the Eleventh Circuit found in favor of defendants on the basis of federal preemption, reversed the trial court’s denial of judgment as a matter of law, and plaintiff filed a petition for rehearing
en banc
or panel rehearing. On January 21, 2016, the Eleventh Circuit granted a rehearing
en banc
.
_________________________________________________________________________________________________________________________________________
77
Altria Group, Inc. and Subsidiaries
Notes to Consolidated Financial Statements
_________________________
Plaintiff:
Searcy
Date:
April 2013
Verdict:
A jury in the U.S. District Court for the Middle District of Florida returned a verdict in favor of plaintiff and against PM USA and R.J. Reynolds. The jury awarded
$6 million
in compensatory damages (allocating
30%
of the fault to each defendant) and
$10 million
in punitive damages against each defendant.
Post-Trial Developments:
In June 2013, the trial court entered final judgment without any deduction for plaintiff’s comparative fault. In July 2013, defendants filed various post-trial motions, including motions requesting reductions in damages. In September 2013, the district court reduced the compensatory damages award to
$1 million
and the punitive damages award to
$1.67 million
against each defendant. The district court denied all other post-trial motions. Plaintiffs filed a motion to reconsider the district court’s
remittitur
and, in the alternative, to certify the issue to the U.S. Court of Appeals for the Eleventh Circuit, both of which the court denied in October 2013. In November 2013, defendants filed a notice of appeal to the U.S. Court of Appeals for the Eleventh Circuit. In December 2013, defendants filed an amended notice of appeal after the district court corrected a clerical error in the final judgment, and PM USA posted a bond in the amount of approximately
$2.2 million
.
_________________________________________________________________________________________________________________________________________
Plaintiff:
Buchanan
Date:
December 2012
Verdict:
A Leon County jury returned a verdict in favor of plaintiff and against PM USA and Liggett Group. The jury awarded
$5.5 million
in compensatory damages and allocated
37%
of the fault to each of the defendants.
Post-Trial Developments:
In December 2012, defendants filed several post-trial motions, including motions for a new trial and to set aside the verdict. In March 2013, the trial court denied all motions and entered final judgment against PM USA and Liggett Group without any deduction for plaintiff’s comparative fault. In April 2013, defendants filed a notice of appeal to the Florida First District Court of Appeal, and PM USA posted a bond in the amount of
$2.5 million
. In July 2014, the Florida First District Court of Appeal affirmed the judgment, but certified to the Florida Supreme Court the issue of the statute of repose, which was before the court in
Hess
. In August 2014, defendants filed a notice to invoke the discretionary jurisdiction of the Florida Supreme Court. In September 2014, the Florida Supreme Court stayed the case pending the outcome of
Hess
. In April 2015, the Florida Supreme Court rejected the statute of repose defense in
Hess,
and PM USA moved for a rehearing. In September 2015, the Florida Supreme Court denied PM USA’s rehearing petition in
Hess
. In the third quarter of 2015, PM USA recorded a provision on its condensed consolidated balance sheet of approximately
$4.1 million
for the judgment plus interest and associated costs.
_________________________________________________________________________________________________________________________________________
Plaintiff:
Hancock
Date:
August 2012
Verdict:
A Broward County jury returned a verdict in the amount of
zero
damages and allocated
5%
of the fault to each of the defendants (PM USA and R.J. Reynolds). The trial court granted an
additur
of approximately
$110,000
, which is subject to the jury’s comparative fault finding.
Post-Trial Developments:
In August 2012, defendants moved to set aside the verdict and to enter judgment in accordance with their motion for directed verdict. Defendants also moved to reduce damages, which motion the court granted. The trial court granted defendants’ motion to set off the damages award by the amount of economic damages paid by third parties, which will reduce further any final award. In October 2012, the trial court entered final judgment with a deduction for plaintiff’s comparative fault (PM USA’s portion of the damages was approximately
$700
) and PM USA filed a motion to amend the judgment to award PM USA attorneys’ fees of approximately
$20,000
. In November 2012, both sides filed notices of appeal to the Florida Fourth District Court of Appeal. Plaintiff agreed to waive the bond for the appeal. In April 2015, the Florida Fourth District Court of Appeal affirmed the trial court’s verdict. In May 2015, plaintiff filed a motion for rehearing and for a written opinion and rehearing
en banc
, which the Court of Appeal denied in June 2015. PM USA’s motion for a fee award remains pending.
_________________________________________________________________________________________________________________________________________
78
Altria Group, Inc. and Subsidiaries
Notes to Consolidated Financial Statements
_________________________
Plaintiff:
Calloway
Date:
May 2012
Verdict:
A Broward County jury returned a verdict in favor of plaintiff and against PM USA, R.J. Reynolds, Lorillard and Liggett Group. The jury awarded approximately
$21 million
in compensatory damages and allocated
25%
of the fault against PM USA. The jury also awarded approximately
$17 million
in punitive damages against PM USA, approximately
$17 million
in punitive damages against R.J. Reynolds, approximately
$13 million
in punitive damages against Lorillard and approximately
$8 million
in punitive damages against Liggett Group.
Post-Trial Developments:
In May and June 2012, defendants filed motions to set aside the verdict and for a new trial. In August 2012, the trial court denied the remaining post-trial motions, reduced the compensatory damages to
$16.1 million
and entered final judgment without any deduction for plaintiff’s comparative fault. In September 2012, PM USA posted a bond in an amount of
$1.5 million
and defendants filed a notice of appeal to the Florida Fourth District Court of Appeal. In August 2013, plaintiff filed a motion to determine the sufficiency of the bond in the trial court on the ground that the bond cap statute is unconstitutional, which the court denied. On January 6, 2016, the Florida Fourth District Court of Appeal vacated the punitive damages award and remanded the case for retrial on plaintiff’s claims of concealment and conspiracy, and punitive damages. The court also found that the trial court should have applied the comparative fault deduction, reducing the compensatory damages against PM USA to
$4.025 million
.
_________________________________________________________________________________________________________________________________________
Plaintiff:
Hallgren
Date:
January 2012
Verdict:
A Highland County jury returned a verdict in favor of plaintiff and against PM USA and R.J. Reynolds. The jury awarded approximately
$2 million
in compensatory damages and allocated
25%
of the fault to PM USA (an amount of approximately
$500,000
). The jury also awarded
$750,000
in punitive damages against each of the defendants.
Post-Trial Developments:
The trial court entered final judgment in March 2012 with a deduction for plaintiff’s comparative fault. In April 2012, PM USA posted a bond in an amount of approximately
$1.25 million
. In May 2012, defendants filed a notice of appeal to the Florida Second District Court of Appeal. In October 2013, the Second District Court of Appeal affirmed the judgment. In November 2013, defendants filed a notice to invoke the discretionary jurisdiction of the Florida Supreme Court. In June 2014, the Florida Supreme Court stayed the case pending the outcome of
Russo
(presenting the same statute of repose issue as
Hess
). In April 2015, the Florida Supreme Court rejected the statute of repose defense in the
Hess
and
Russo
cases, and defendants moved for a rehearing. Additionally, in April 2015, the Florida Supreme Court stayed the case pending the outcome of
Soffer
(presenting the issue of whether
Engle
progeny plaintiffs may seek punitive damages on their negligence and strict liability claims). In September 2015, the Florida Supreme Court denied PM USA’s rehearing petition in
Hess
and
Russo
. In October 2015, the Florida Supreme Court lifted its stay of the case and ordered defendants to show cause why the court should not decline to exercise jurisdiction, to which defendants responded. On January 12, 2016, the Florida Supreme Court denied defendants’ petition for discretionary review. On January 20, 2016, PM USA amended its bond to post an additional amount of approximately
$500,000
. In the first quarter of 2016, PM USA will record a provision on its condensed consolidated balance sheet of approximately
$2.2 million
for the judgment plus interest, fees and associated costs.
_________________________________________________________________________________________________________________________________________
Plaintiff:
Kayton
(formerly
Tate
)
Date:
July 2010
Verdict:
A Broward County jury returned a verdict in favor of plaintiff and against PM USA. The jury awarded
$8 million
in compensatory damages and allocated
64%
of the fault to PM USA (an amount of approximately
$5.1 million
). The jury also awarded approximately
$16.2 million
in punitive damages against PM USA.
Post-Trial Developments:
In August 2010, the trial court entered final judgment with a deduction for plaintiff’s comparative fault, and PM USA filed its notice of appeal and posted a
$5 million
bond. In November 2012, the Florida Fourth District Court of Appeal reversed the punitive damages award and remanded the case for a new trial on plaintiff’s conspiracy claim. PM USA filed a motion for rehearing, which was denied in January 2013. In January 2013, plaintiff and defendant each filed a notice to invoke the discretionary jurisdiction of the Florida
79
Altria Group, Inc. and Subsidiaries
Notes to Consolidated Financial Statements
_________________________
Supreme Court. In June 2013, the Florida Supreme Court stayed the appeal pending the outcome of
Hess
. In April 2015, the Florida Supreme Court rejected the statute of repose defense in
Hess
,
and PM USA moved for a rehearing. In September 2015, the Florida Supreme Court denied PM USA’s rehearing petition in
Hess
. In the third quarter of 2015, PM USA recorded a provision on its condensed consolidated balance sheet of approximately
$28.2 million
for the judgment plus interest and associated costs.
_________________________________________________________________________________________________________________________________________
Plaintiff:
Putney
Date:
April 2010
Verdict:
A Broward County jury returned a verdict in favor of plaintiff and against PM USA, R.J. Reynolds and Liggett Group. The jury awarded approximately
$15.1 million
in compensatory damages and allocated
15%
of the fault to PM USA (an amount of approximately
$2.3 million
). The jury also awarded
$2.5 million
in punitive damages against PM USA.
Post-Trial Developments:
In August 2010, the trial court entered final judgment with a deduction for plaintiff’s comparative fault. PM USA filed its notice of appeal to the Florida Fourth District Court of Appeal and, in November 2010, posted a
$1.6 million
bond. In June 2013, the Fourth District Court of Appeal reversed and remanded the case for further proceedings, holding that the trial court erred in (1) not reducing the compensatory damages award as excessive and (2) not instructing the jury on the statute of repose in connection with plaintiff’s conspiracy claim that resulted in the
$2.5 million
punitive damages award. In July 2013, plaintiff filed a motion for rehearing, which the Fourth District Court of Appeal denied in August 2013. In September 2013, both parties filed notices to invoke the discretionary jurisdiction of the Florida Supreme Court. In December 2013, the Florida Supreme Court stayed the appeal pending the outcome of the
Hess
case. In April 2015, the Florida Supreme Court rejected the statute of repose defense in
Hess
, and PM USA moved for a rehearing. In September 2015, the Florida Supreme Court denied PM USA’s rehearing petition in
Hess
. The case remains subject to further proceedings on compensatory damages in the trial court.
_________________________________________________________________________________________________________________________________________
Plaintiff:
R. Cohen
Date:
March 2010
Verdict:
A Broward County jury returned a verdict in favor of plaintiff and against PM USA and R.J. Reynolds. The jury awarded
$10 million
in compensatory damages and allocated 33 1/3% of the fault to PM USA (an amount of approximately
$3.3 million
). The jury also awarded a total of
$20 million
in punitive damages, assessing separate
$10 million
awards against each defendant.
Post-Trial Developments:
In July 2010, the trial court entered final judgment with a deduction for plaintiff’s comparative fault. In August 2010, PM USA filed its notice of appeal. In October 2010, PM USA posted a
$2.5 million
bond. In September 2012, the Florida Fourth District Court of Appeal affirmed the compensatory damages award but reversed and remanded the punitive damages verdict. The Fourth District returned the case to the trial court for a new jury trial on plaintiff’s fraudulent concealment claim. In January 2013, plaintiff and defendants each filed a notice to invoke the discretionary jurisdiction of the Florida Supreme Court. In February 2013, the Fourth District granted defendants’ motion to stay the mandate. In March 2013, plaintiff filed a motion for review of the stay order with the Florida Supreme Court, which was denied in April 2013. In June 2013, plaintiff moved to consolidate with
Hess
and
Kayton
, which defendants did not oppose, but in October 2013, plaintiff withdrew the motion for consolidation
.
In February 2014, the Florida Supreme Court stayed the appeal pending the outcome of the
Hess
case. In April 2015, the Florida Supreme Court rejected the statute of repose defense in
Hess
,
and PM USA moved for a rehearing. In September 2015, the Florida Supreme Court denied PM USA’s rehearing petition in
Hess
. In the third quarter of 2015, PM USA recorded a provision on its condensed consolidated balance sheet of approximately
$17.9 million
for the judgment plus interest and associated costs.
_________________________________________________________________________________________________________________________________________
Plaintiff:
Naugle
Date:
November 2009
Verdict:
A Broward County jury returned a verdict in favor of plaintiff and against PM USA. The jury awarded approximately
$56.6 million
in compensatory damages and
$244 million
in punitive damages. The jury allocated
90%
of the fault to PM USA.
Post-Trial Developments:
In March 2010, the trial court entered final judgment reflecting a reduced award of approximately
$13 million
in compensatory damages
80
Altria Group, Inc. and Subsidiaries
Notes to Consolidated Financial Statements
_________________________
and
$26 million
in punitive damages, but without any deduction for plaintiff’s comparative fault. In April 2010, PM USA filed its notice of appeal and posted a
$5 million
bond. In August 2010, upon the motion of PM USA, the trial court entered an amended final judgment of approximately
$12.3 million
in compensatory damages and approximately
$24.5 million
in punitive damages to correct a clerical error. In June 2012, the Fourth District Court of Appeal affirmed the amended final judgment. In July 2012, PM USA filed a motion for rehearing. In December 2012, the Fourth District withdrew its prior decision, reversed the verdict as to compensatory and punitive damages and returned the case to the trial court for a new trial on the question of damages. Upon retrial on the question of damages, in October 2013, the new jury awarded approximately
$3.7 million
in compensatory damages and
$7.5 million
in punitive damages. In October 2013, PM USA filed post-trial motions, which the trial court denied in April 2014. In May 2014, PM USA filed a notice of appeal to the Fourth District Court of Appeal and plaintiff cross-appealed. Also in May 2014, PM USA filed a rider with the Florida Supreme Court to make the previously-posted
Naugle
bond applicable to the retrial judgment. On January 6, 2016, the Fourth District Court of Appeal reversed the trial court’s decision and remanded the case to the trial court to conduct a juror interview.
_________________________________________________________________________________________________________________________________________
Plaintiff:
Hess
Date:
February 2009
Verdict:
A Broward County jury found in favor of plaintiff and against PM USA. The jury awarded
$3 million
in compensatory damages and allocated
42%
of the fault to PM USA (an amount of approximately
$1.2 million
). The jury also awarded
$5 million
in punitive damages.
Post-Trial Developments:
In June 2009, the trial court entered final judgment with a deduction for plaintiff’s comparative fault. PM USA filed a notice of appeal to the Florida Fourth District Court of Appeal and posted a
$7 million
bond in July 2009. In May 2012, the Fourth District reversed and vacated the punitive damages award on the basis that it was barred by the statute of repose and affirmed the judgment in all other respects, upholding the compensatory damages award of
$1.26 million
. In June 2012, both parties filed rehearing motions with the Fourth District, which were denied in September 2012. In October 2012, PM USA and plaintiff filed notices to invoke the Florida Supreme Court’s discretionary jurisdiction. In the first quarter of 2013, PM USA recorded a provision on its condensed consolidated balance sheet of approximately
$3.2 million
for the compensatory damages component of the judgment plus interest and associated costs. In June 2013, the Florida Supreme Court accepted jurisdiction of plaintiff’s petition for review, but declined to accept jurisdiction of PM USA’s petition. In April 2015, the Florida Supreme Court rejected the statute of repose defense and reinstated the punitive damages award against PM USA, and PM USA moved for a rehearing. In September 2015, the Florida Supreme Court denied PM USA’s rehearing petition. In the third quarter of 2015, PM USA recorded an additional provision on its condensed consolidated balance sheet of approximately
$6.6 million
for the punitive damages component of the judgment plus interest and associated costs.
_________________________________________________________________________________________________________________________________________
Concluded Cases
_________________________________________________________________________________________________________________________________________
Plaintiff:
Goveia
Date:
February 2014
Verdict:
An Orange County jury returned a verdict in favor of plaintiff and against PM USA and R.J. Reynolds. The jury awarded
$850,000
in compensatory damages and allocated
35%
of the fault against each defendant. The jury also awarded
$2.25 million
in punitive damages against each defendant.
Post-Trial Developments:
In February 2014, defendants filed post-trial motions, including motions to set aside the verdict and for a new trial. In April 2014, the court denied defendants’ motions without a deduction for plaintiff’s comparative fault. In April 2014, defendants filed a notice of appeal to the Florida Fifth District Court of Appeal. In May 2014, PM USA posted a bond in the amount of
$2.5 million
. In June 2015, the Fifth District Court of Appeal affirmed without opinion the trial court’s judgment in favor of plaintiff. On August 3, 2015, the Fifth
District Court of Appeal denied PM USA’s motion to issue a written opinion. In the third quarter of 2015, PM USA recorded a provision on its condensed consolidated balance sheet of approximately
$3.2 million
for the judgment plus interest and associated costs, and paid this amount in August 2015.
_________________________________________________________________________________________________________________________________________
81
Altria Group, Inc. and Subsidiaries
Notes to Consolidated Financial Statements
_________________________
Plaintiff:
Ruffo
Date:
May 2013
Verdict:
A Miami-Dade County jury returned a verdict in favor of plaintiff and against PM USA and Lorillard. The jury awarded plaintiff
$1.5 million
in compensatory damages and allocated
12%
of the fault to PM USA (an amount of
$180,000
).
Post-Trial Developments:
In May 2013, defendants filed several post-trial motions, including motions for a new trial and to set aside the verdict, which the trial court denied in October 2013 and entered final judgment in favor of plaintiff with a deduction for plaintiff’s comparative fault. In October 2013, PM USA and Lorillard appealed to the Florida Third District Court of Appeal, and PM USA posted a bond in the amount of
$180,000
. In November 2014, the Florida Third District Court of Appeal affirmed the final judgment and, in the fourth quarter of 2014, PM USA recorded a provision on its consolidated balance sheet of approximately
$193,000
for the judgment plus interest. In June 2015, PM USA paid the judgment plus interest and associated costs in the amount of
$200,212
.
_________________________________________________________________________________________________________________________________________
Plaintiff:
Cuculino
Date:
January 2014
Verdict:
A Miami-Dade County jury returned a verdict in favor of plaintiff and against PM USA. The jury awarded plaintiff
$12.5 million
in compensatory damages and allocated
40%
of the fault to PM USA (an amount of
$5 million
).
Post-Trial Developments:
In January 2014, the court entered final judgment against PM USA with a deduction for plaintiff’s comparative fault, and PM USA filed post-trial motions, including motions to set aside the verdict and for a new trial. In March 2014 and April 2014, the court denied PM USA’s post-trial motions. Also in April 2014, PM USA filed a notice of appeal to the Florida Third District Court of Appeal, plaintiff cross-appealed and PM USA posted a bond in the amount of
$5 million
. In May 2015, the Florida Third District Court of Appeal affirmed the final judgment. In the second quarter of 2015, PM USA recorded a provision on its condensed consolidated balance sheet of approximately
$5.3 million
for the judgment plus interest and associated costs and paid this amount in June 2015
.
_________________________________________________________________________________________________________________________________________
Plaintiff:
Landau
Date:
February 2015
Verdict:
A jury in the U.S. District Court for the Middle District of Florida returned a verdict in favor of plaintiff and against PM USA, R.J. Reynolds and Lorillard awarding
$100,000
in compensatory damages.
One
defendant settled the case, which resolved all claims against all defendants, including PM USA.
_________________________________________________________________________________________________________________________________________
▪
Engle
Progeny Appellate Issues:
Three
Florida federal district courts (in the
Merlob
,
B. Brown
and
Burr
cases) ruled in 2008 that the findings in the first phase of the
Engle
proceedings cannot be used to satisfy elements of plaintiffs’ claims, and
two
of those rulings (
B. Brown
and
Burr
) were certified by the trial court for interlocutory review. The certification in both cases was granted by the U.S. Court of Appeals for the Eleventh Circuit and the appeals were consolidated. The appeal in
Burr
was dismissed for lack of prosecution, and the case was ultimately dismissed on statute of limitations grounds.
In July 2010, the Eleventh Circuit ruled in
B. Brown
that, as a matter of Florida law, plaintiffs do not have an unlimited right to use the findings from the original
Engle
trial to meet their burden of establishing the elements of their claims at trial. The Eleventh Circuit did not reach the issue of whether the use of the
Engle
findings violates defendants’ due process rights. Rather, the court held that plaintiffs may only use the findings to establish those
specific facts, if any, that they demonstrate with a reasonable degree of certainty were actually decided by the original
Engle
jury. The Eleventh Circuit remanded the case to the district court to determine what specific factual findings the
Engle
jury actually made.
After the remand of
B. Brown
, several state appellate rulings superseded the Eleventh Circuit’s ruling on Florida state law. These cases include
Martin
, a case against R.J. Reynolds in Escambia County, and
J. Brown
, a case against R.J. Reynolds in Broward County. In December 2011, petitions for
writ of certiorari
were filed with the United States Supreme Court by R.J. Reynolds in
Campbell
,
Martin
,
Gray
and
Hall
and by PM USA and Liggett Group in
Campbell
. The United States Supreme Court denied defendants’
certiorari
petitions in March 2012.
In
Douglas
, in March 2012, the Florida Second District Court of Appeal issued a decision affirming the judgment of the trial court in favor of the plaintiff and upholding the use of the
Engle
82
Altria Group, Inc. and Subsidiaries
Notes to Consolidated Financial Statements
_________________________
jury findings with respect to strict liability claims but certified to the Florida Supreme Court the question of whether granting
res judicata
effect to the
Engle
jury findings violates defendants’ federal due process rights. In March 2013, the Florida Supreme Court affirmed the final judgment entered in favor of plaintiff upholding the use of the
Engle
jury findings with respect to strict liability and negligence claims. PM USA filed its petition for
writ of certiorari
with the United States Supreme Court in August 2013, which the court denied in October 2013.
Meanwhile, in the
Waggoner
case, the U.S. District Court for the Middle District of Florida ruled in December 2011 that application of the
Engle
findings to establish the wrongful conduct elements of plaintiffs’ claims consistent with
Martin
or
J. Brown
did not violate defendants’ due process rights. PM USA and the other defendants sought appellate review of the due process ruling. In February 2012, the district court denied the motion for interlocutory appeal, but did apply the ruling to all active pending federal
Engle
progeny cases. As a result, R.J. Reynolds appealed the rulings in the
Walker
and
Duke
cases to the Eleventh Circuit, which ultimately rejected the due process defense. In March 2014, R.J. Reynolds filed petitions for
writ of certiorari
to the United States Supreme Court in the
Walker
and
Duke
cases, as well as in
J. Brown
. Defendants filed petitions for
writ of certiorari
in eight other
Engle
progeny cases that were tried in Florida state courts, including
one
case,
Barbanell
, in which PM USA was the defendant. In these
eight
petitions, defendants asserted questions similar to those in
Walker
,
Duke
and
J. Brown
. In June 2014, the United States Supreme Court denied defendants’ petitions for
writ of certiorari
in all
11
cases.
In
Graham
, an
Engle
progeny case against PM USA and R.J. Reynolds on appeal to the U.S. Court of Appeals for the Eleventh Circuit, defendants argued that the
Engle
progeny plaintiffs’ product liability claims are impliedly preempted by federal law. In April 2015, the U.S. Court of Appeals for the Eleventh Circuit found in favor of defendants on the basis of federal preemption, reversing the trial court’s denial of judgment as a matter of law. Also in April 2015, plaintiff filed a petition for rehearing
en banc
, which the Eleventh Circuit granted on January 21, 2016. On January 6, 2016, in
Marotta
, a case against R.J. Reynolds on appeal to the Florida Fourth District Court of Appeal, the court rejected R.J. Reynolds’s federal preemption defense, but noted the conflict with
Graham
and certified the preemption question to the Florida Supreme Court.
In
Searcy
, an
Engle
progeny case against PM USA and R.J. Reynolds on appeal to the Eleventh Circuit, defendants argued that application of the
Engle
findings to the
Engle
progeny plaintiffs’ concealment and conspiracy claims violated defendants’ due process rights. The appeal is pending.
In
Soffer
, an
Engle
progeny case against R.J. Reynolds, the Florida First District Court of Appeal held that
Engle
progeny plaintiffs can recover punitive damages only on their intentional tort claims. In February 2014, the Florida Supreme Court accepted jurisdiction over plaintiff’s appeal from the Florida First District Court of Appeal’s holding and heard oral argument in December 2014.
In
Ciccone
, an
Engle
progeny case against R.J. Reynolds, the Florida Fourth District Court of Appeal held that
Engle
progeny plaintiffs could establish class membership by showing that they developed symptoms during the
Engle
class period that could, in hindsight, be attributed to their smoking-related disease. The court certified a conflict with
Castleman
, a Florida First District Court of Appeal decision, which held that manifestation requires
Engle
progeny plaintiffs to have been aware during the class period that they had a disease caused by smoking in order to establish class membership. The Florida Supreme Court accepted jurisdiction in the
Ciccone
case in June 2014 and heard oral argument in December 2014.
▪
Florida Bond Statute:
In June 2009, Florida amended its existing bond cap statute by adding a
$200 million
bond cap that applies to all state
Engle
progeny lawsuits in the aggregate and establishes individual bond caps for individual
Engle
progeny cases in amounts that vary depending on the number of judgments in effect at a given time. Plaintiffs in
three
state
Engle
progeny cases against R.J. Reynolds in Alachua County, Florida (
Alexander
,
Townsend
and
Hall
) and
one
case in Escambia County (
Clay
) challenged the constitutionality of the bond cap statute. The Florida Attorney General intervened in these cases in defense of the constitutionality of the statute.
Trial court rulings were rendered in
Clay
,
Alexander
,
Townsend
and
Hall
rejecting the plaintiffs’ bond cap statute challenges in those cases. The plaintiffs unsuccessfully appealed these rulings. In
Alexander
,
Clay
and
Hall
, the District Court of Appeal for the First District of Florida affirmed the trial court decisions and certified the decision in
Hall
for appeal to the Florida Supreme Court, but declined to certify the question of the constitutionality of the bond cap statute in
Clay
and
Alexander
. The Florida Supreme Court granted review of the
Hall
decision, but, in September 2012, the court dismissed the appeal as moot. In October 2012, the Florida Supreme Court denied the plaintiffs’ rehearing petition. In August 2013, in
Calloway
, discussed further above, plaintiff filed a motion in the trial court to determine the sufficiency of the bond posted by defendants on the ground that the bond cap statute is unconstitutional, which was denied.
No federal court has yet addressed the constitutionality of the bond cap statute or the applicability of the bond cap to
Engle
progeny cases tried in federal court.
Other Smoking and Health Class Actions
Since the dismissal in May 1996 of a purported nationwide class action brought on behalf of allegedly addicted smokers, plaintiffs have filed numerous putative smoking and health class action suits in various state and federal courts. In general, these cases purport to be brought on behalf of residents of a particular state or states (although a few cases purport to be nationwide in scope) and raise addiction claims and, in many cases, claims of physical injury as well.
Class certification has been denied or reversed by courts in
60
smoking and health class actions involving PM USA in Arkansas (
1
), California (
1
), the District of Columbia (
2
), Florida
83
Altria Group, Inc. and Subsidiaries
Notes to Consolidated Financial Statements
_________________________
(
2
), Illinois (
3
), Iowa (
1
), Kansas (
1
), Louisiana (
1
), Maryland (
1
), Michigan (
1
), Minnesota (
1
), Nevada (
29
), New Jersey (
6
), New York (
2
), Ohio (
1
), Oklahoma (
1
), Oregon (
1
), Pennsylvania (
1
), Puerto Rico (
1
), South Carolina (
1
), Texas (
1
) and Wisconsin (
1
).
As of January 26, 2016, PM USA and Altria Group, Inc. are named as defendants, along with other cigarette manufacturers, in
seven
class actions filed in the Canadian provinces of Alberta, Manitoba, Nova Scotia, Saskatchewan, British Columbia and Ontario. In Saskatchewan, British Columbia (two separate cases) and Ontario, plaintiffs seek class certification on behalf of individuals who suffer or have suffered from various diseases, including chronic obstructive pulmonary disease, emphysema, heart disease or cancer, after smoking defendants’ cigarettes. In the actions filed in Alberta, Manitoba and Nova Scotia, plaintiffs seek certification of classes of all individuals who smoked defendants’ cigarettes. See
Guarantees and Other Similar Matters
below for a discussion of the Distribution Agreement between Altria Group, Inc. and PMI that provides for indemnities for certain liabilities concerning tobacco products.
Medical Monitoring Class Actions
In medical monitoring actions, plaintiffs seek to recover the cost for, or otherwise the implementation of, court-supervised programs for ongoing medical monitoring purportedly on behalf of a class of individual plaintiffs. Plaintiffs in these cases seek to impose liability under various product-based causes of action and the creation of a court-supervised program providing members of the purported class Low Dose CT (“LDCT”) scanning in order to identify and diagnose lung cancer. Plaintiffs in these cases do not seek punitive damages, although plaintiffs in
Donovan
have sought permission from the court to seek to treble any damages awarded, which the court denied. The future defense of these cases may be negatively impacted by evolving medical standards and practice.
One
medical monitoring class action is currently pending against PM USA. In
Donovan
, filed in December 2006 in the U.S. District Court for the District of Massachusetts, plaintiffs purportedly brought the action on behalf of the state’s residents who are: age 50 or older; have smoked the
Marlboro
brand for 20 pack-years or more; and have neither been diagnosed with lung cancer nor are under investigation by a physician for suspected lung cancer. The Supreme Judicial Court of Massachusetts, in answering questions certified to it by the district court, held in October 2009 that under certain circumstances state law recognizes a claim by individual smokers for medical monitoring despite the absence of an actual injury. The court also ruled that whether or not the case is barred by the applicable statute of limitations is a factual issue to be determined at trial. The case was remanded to federal court for further proceedings. In June 2010, the district court granted in part the plaintiffs’ motion for class certification, certifying the class as to plaintiffs’ claims for breach of implied warranty and violation of the Massachusetts Consumer Protection Act, but denying certification as to plaintiffs’ negligence claim. In July 2010, PM USA petitioned the U.S. Court of Appeals for the First Circuit for appellate review of the class certification decision. The petition was denied in
September 2010. As a remedy, plaintiffs have proposed a 28-year medical monitoring program with a cost in excess of
$190 million
. In October 2011, PM USA filed a motion for class decertification, which motion was denied in March 2012. In February 2013, the district court amended the class definition to extend to individuals who satisfy the class membership criteria through February 26, 2013, and to exclude any individual who was not a Massachusetts resident as of February 26, 2013.
Trial began January 26, 2016 and will take place in multiple phases. Phase I will address liability. To the extent a Phase II is necessary, it would be tried to the court and address common questions of remedies and costs. In July 2015, both parties filed various motions relating to Phase I, including motions for partial summary judgment and to exclude certain evidence. In October 2015, the district court granted PM USA’s motion for partial summary judgment holding that e-vapor products may not be deemed an alternative design for ordinary cigarettes.
Health Care Cost Recovery Litigation
▪
Overview:
In the health care cost recovery litigation, governmental entities seek reimbursement of health care cost expenditures allegedly caused by tobacco products and, in some cases, of future expenditures and damages. Relief sought by some but not all plaintiffs includes punitive damages, multiple damages and other statutory damages and penalties, injunctions prohibiting alleged marketing and sales to minors, disclosure of research, disgorgement of profits, funding of anti-smoking programs, additional disclosure of nicotine yields, and payment of attorney and expert witness fees.
The claims asserted include the claim that cigarette manufacturers were “unjustly enriched” by plaintiffs’ payment of health care costs allegedly attributable to smoking, as well as claims of indemnity, negligence, strict liability, breach of express and implied warranty, violation of a voluntary undertaking or special duty, fraud, negligent misrepresentation, conspiracy, public nuisance, claims under federal and state statutes governing consumer fraud, antitrust, deceptive trade practices and false advertising, and claims under federal and state anti-racketeering statutes.
Defenses raised include lack of proximate cause, remoteness of injury, failure to state a valid claim, lack of benefit, adequate remedy at law, “unclean hands” (namely, that plaintiffs cannot obtain equitable relief because they participated in, and benefited from, the sale of cigarettes), lack of antitrust standing and injury, federal preemption, lack of statutory authority to bring suit and statutes of limitations. In addition, defendants argue that they should be entitled to “set off” any alleged damages to the extent the plaintiffs benefit economically from the sale of cigarettes through the receipt of excise taxes or otherwise. Defendants also argue that these cases are improper because plaintiffs must proceed under principles of subrogation and assignment. Under traditional theories of recovery, a payor of medical costs (such as an insurer) can seek recovery of health care costs from a third party solely by “standing in the shoes” of the injured party. Defendants argue that plaintiffs should be required to bring any actions as subrogees of individual health care recipients and
84
Altria Group, Inc. and Subsidiaries
Notes to Consolidated Financial Statements
_________________________
should be subject to all defenses available against the injured party.
Although there have been some decisions to the contrary, most judicial decisions in the United States have dismissed all or most health care cost recovery claims against cigarette manufacturers. Nine federal circuit courts of appeals and eight state appellate courts, relying primarily on grounds that plaintiffs’ claims were too remote, have ordered or affirmed dismissals of health care cost recovery actions. The United States Supreme Court has refused to consider plaintiffs’ appeals from the cases decided by five circuit courts of appeals.
Individuals and associations have also sued in purported class actions or as private attorneys general under the Medicare as Secondary Payer (“MSP”) provisions of the Social Security Act to recover from defendants Medicare expenditures allegedly incurred for the treatment of smoking-related diseases. Cases were brought in New York (
2
), Florida (
2
) and Massachusetts (
1
). All were dismissed by federal courts.
In addition to the cases brought in the United States, health care cost recovery actions have also been brought against tobacco industry participants, including PM USA and Altria Group, Inc., in Israel (dismissed), the Marshall Islands (dismissed) and Canada (
10
), and other entities have stated that they are considering filing such actions.
In September 2005, in the first of several health care cost recovery cases filed in Canada, the Canadian Supreme Court ruled that legislation passed in British Columbia permitting the lawsuit is constitutional, and, as a result, the case, which had previously been dismissed by the trial court, was permitted to proceed. PM USA’s and other defendants’ challenge to the British Columbia court’s exercise of jurisdiction was rejected by the Court of Appeals of British Columbia and, in April 2007, the Supreme Court of Canada denied review of that decision.
Since the beginning of 2008, the Canadian Provinces of British Columbia, New Brunswick, Ontario, Newfoundland and Labrador, Quebec, Alberta, Manitoba, Saskatchewan, Prince Edward Island and Nova Scotia have brought health care reimbursement claims against cigarette manufacturers. PM USA is named as a defendant in the British Columbia and Quebec cases, while both Altria Group, Inc. and PM USA are named as defendants in the New Brunswick, Ontario, Newfoundland and Labrador, Alberta, Manitoba, Saskatchewan, Prince Edward Island and Nova Scotia cases. The Nunavut Territory and Northwest Territory have passed similar legislation. See
Guarantees and Other Similar Matters
below for a discussion of the Distribution Agreement between Altria Group, Inc. and PMI that provides for indemnities for certain liabilities concerning tobacco products.
▪
Settlements of Health Care Cost Recovery Litigation:
In
November 1998
, PM USA and certain other United States tobacco product manufacturers entered into the 1998 Master Settlement Agreement (the “MSA”) with
46
states, the District of Columbia, Puerto Rico, Guam, the United States Virgin Islands, American Samoa and the Northern Marianas to settle asserted and unasserted health care cost recovery and other claims. PM USA
and certain other United States tobacco product manufacturers had previously entered into agreements to settle similar claims brought by Mississippi, Florida, Texas and Minnesota (together with the MSA, the “State Settlement Agreements”). The State Settlement Agreements require that the original participating manufacturers or “OPMs” (PM USA, R.J. Reynolds and Lorillard) make annual payments of approximately
$9.4 billion
, subject to adjustments for several factors, including inflation, market share and industry volume. R.J. Reynolds has since acquired Lorillard with the result that PM USA and R.J. Reynolds are the two remaining OPMs. In addition, the original participating manufacturers are required to pay settling plaintiffs’ attorneys’ fees, subject to an annual cap of
$500 million
. For the years ended December 31, 2015, 2014 and 2013, the aggregate amount recorded in cost of sales with respect to the State Settlement Agreements and the Fair and Equitable Tobacco Reform Act of 2004 (“FETRA”) was approximately
$4.5 billion
,
$4.6 billion
and
$4.2 billion
, respectively. The 2015 amount included a reduction to cost of sales of approximately
$126 million
related to the New York NPM Adjustment settlement discussed below partially offset by an increase to cost of sales of approximately
$29 million
as a result of the denial by the Supreme Court of Pennsylvania of PM USA’s petition for review of the intermediate appellate court ruling discussed below. The 2014 and 2013 amounts included a reduction to cost of sales of approximately
$43 million
and
$664 million
, respectively, related to the NPM Adjustment Items discussed below.
The State Settlement Agreements also include provisions relating to advertising and marketing restrictions, public disclosure of certain industry documents, limitations on challenges to certain tobacco control and underage use laws, restrictions on lobbying activities and other provisions.
▪
NPM Adjustment Disputes:
PM USA is participating in proceedings regarding potential downward adjustments (the “NPM Adjustment”) to MSA payments made by manufacturers that are signatories to the MSA (the “participating manufacturers” or “PMs”) for 2003-2014. The NPM Adjustment is a reduction in MSA payments that applies if the PMs collectively lose at least a specified level of market share to non-participating manufacturers (“NPMs”) between 1997 and the year at issue, subject to certain conditions and defenses. The independent auditor appointed under the MSA calculates the maximum amount, if any, of the NPM Adjustment for any year in respect of which such NPM Adjustment is potentially applicable.
2003-2014 NPM Adjustment Disputes - Settlement with 24 States and Territories and Settlement with New York
: PM USA has settled the NPM Adjustment disputes for the years 2003-2012 with
24
of the
52
MSA states and territories (these
24
states and territories are referred to as the “signatory states,” and the remaining MSA states and territories are referred to as the “non-signatory states”). Pursuant to the settlement with these
24
signatory states, PM USA has received a total of
$599 million
for 2003-2012 in the form of reductions to its MSA payments in 2013, 2014 and 2015.
85
Altria Group, Inc. and Subsidiaries
Notes to Consolidated Financial Statements
_________________________
PM USA recorded
$519 million
of the
$599 million
as a reduction to cost of sales that increased its reported pre-tax earnings by
$483 million
and
$36 million
in the first quarter of 2013 and second quarter of 2013, respectively. The remainder of the
$599 million
consists of
$80 million
attributable to
two
states that joined the settlement after having been found subject to the 2003 NPM Adjustment by an arbitration panel in the third quarter of 2013, as discussed below. As a result of the arbitration panel’s findings, however, PM USA had already recorded
$54 million
in pre-tax earnings in respect of those two states for the 2003 NPM Adjustment before they joined the settlement, leaving an additional
$26 million
to be recorded when they joined the settlement. The
$54 million
already recorded consisted of
$37 million
recorded as a reduction to cost of sales and
$17 million
recorded as interest income. Because the
$80 million
settlement recovery would all be recorded as a reduction to cost of sales, upon these
two
states’ joinder of the settlement in the second quarter of 2014, PM USA recorded a further
$43 million
reduction to cost of sales while also recording a
$17 million
reduction in interest income to reverse the earlier recording of interest income in that amount. The result was a net increase in reported pre-tax earnings of
$26 million
in the second quarter of 2014.
In addition, the settlement provides that the NPM Adjustment provision will be revised and streamlined as to the signatory states for the years after 2012. Under the revised provision, the 2013 and 2014 NPM Adjustments are “transition years,” for which the PMs receive specified payments. PM USA has already received
$35 million
for the 2013 transition year pursuant to this revised provision in the form of a reduction to its MSA payment in 2014, resulting in a reduction to cost of sales in the first quarter of 2014. PM USA also received an additional
$3 million
for the 2013 transition year as a result of the two additional states joining the settlement in the form of a reduction to its MSA payment in 2015. In addition, PM USA received
$41 million
for the 2014 transition year in the form of a reduction to its MSA payment in 2015. The original participating manufacturers have agreed that the amounts they receive under the settlement for the transition years and subsequent years will be allocated among them pursuant to a formula that modifies the MSA allocation formula in a manner favorable to PM USA, although the extent to which it remains favorable to PM USA will depend upon future developments.
Many of the non-signatory states objected to the settlement before the arbitration panel hearing the 2003 NPM Adjustment dispute. In March 2013, the panel issued a stipulated partial settlement and award (the “Stipulated Award”) rejecting the objections and permitting the settlement to proceed. In the Stipulated Award, the arbitration panel also ruled that the total 2003 NPM Adjustment would be reduced pro rata by the aggregate allocable share of the signatory states to determine the maximum amount of the 2003 NPM Adjustment potentially available from the non-signatory states whose diligent enforcement claims the PMs continued to contest (the “pro rata judgment reduction”).
Fourteen
of the non-signatory states filed motions in their state courts to vacate and/or modify the Stipulated Award in
whole or part. Decisions by the Pennsylvania, Missouri and Maryland courts on such motions, and the subsequent appeals of those rulings, are discussed below. One state’s motion was denied without an appeal by the state. Another state’s motions remain pending in its state trial court. As for the remaining states, rulings rejecting their motions to vacate the Stipulated Award have been affirmed on appeal, or the motions have been voluntarily dismissed or stayed pending further state action.
In October 2015, PM USA, along with the other MSA participating manufacturers, settled the 2004-2014 NPM Adjustment disputes with New York. The New York settlement is separate from the settlement with the 24 signatory states and is different from that settlement in certain respects. Pursuant to the New York settlement, PM USA expects to receive approximately
$126 million
for 2004-2014 in the form of a reduction to its MSA payment in 2016. This amount is subject to verification by the MSA independent auditor. PM USA recorded
$126 million
as a reduction to cost of sales in the third quarter of 2015 to reflect this new information in its estimate of MSA expenses related to prior years. In addition, the New York settlement provides that the NPM Adjustment provision will be revised as to New York for the years after 2014. The revised provision with respect to NPM cigarettes on which New York Excise Tax is paid is largely similar to the revised provision in the settlement with the 24 signatory states. As to other NPM cigarettes, the New York settlement provides that, in lieu of the NPM Adjustment provision for years after 2014, New York will make annual payments tied to the number of NPM cigarettes on which New York did not collect New York Excise Tax that were sold on or through Native American reservations located in New York (or otherwise met the standard in the settlement agreement) during the year at issue to New York consumers. These annual payments will be made in the form of reductions to future MSA payments by the participating manufacturers, beginning with the MSA payment in 2017. The OPMs have agreed that the amounts they receive under the New York settlement for the years after 2014 will be allocated among them pursuant to a formula that modifies the MSA allocation formula in a manner favorable to PM USA, although the extent to which it remains favorable to PM USA will depend upon future developments. Under the New York settlement, in return for the payments described above and other consideration described in the New York settlement, the MSA participating manufacturers have released New York from the NPM Adjustment provision for all years except as provided in the New York settlement.
2003-2014 NPM Adjustment Disputes - Continuing Disputes with Non-Signatory States other than New York
: PM USA has continued to pursue the NPM Adjustments for 2003 and subsequent years with respect to the non-signatory states. Under the MSA, once all conditions for the NPM Adjustment for a particular year are met (including the condition that the disadvantages of the MSA were a “significant factor” contributing to the PMs’ collective loss of market share), each state may avoid an NPM Adjustment to its share of the PMs’ MSA payments for that year by establishing that it diligently enforced a qualifying
86
Altria Group, Inc. and Subsidiaries
Notes to Consolidated Financial Statements
_________________________
escrow statute during the entirety of that year. Such a state’s share of the NPM Adjustment would then be reallocated to any states that are found not to have diligently enforced for that year. For 2003-2014, all conditions for the NPM Adjustment have been met, either by determination or agreement among the parties (although the parties’ agreement provides that the “significant factor” condition for 2013 and 2014 will become effective in February 2016 and February 2017), respectively.
2003 NPM Adjustment
. With one exception (Montana), the courts have ruled that the states’ claims of diligent enforcement are to be submitted to arbitration. PM USA and other PMs entered into an agreement with most of the MSA states and territories concerning the 2003 NPM Adjustment, under which such states and territories would receive a partial liability reduction of
20%
for the 2003 NPM Adjustment in the event the arbitration panel determined that they did not diligently enforce during 2003. The Montana state courts ruled that Montana may litigate its diligent enforcement claims in state court, rather than in arbitration. In June 2012, the PMs and Montana entered a consent decree pursuant to which Montana would not be subject to the 2003 NPM Adjustment.
In September 2013, the arbitration panel issued rulings regarding the
15
states and territories whose diligent enforcement the PMs contested that had not as of that time joined the settlement, ruling that
six
of them (Indiana, Kentucky, Maryland, Missouri, New Mexico and Pennsylvania) did not diligently enforce during 2003 and that
nine
of them did. Based on this ruling, the PMs were entitled to receive from the
six
non-diligent states the entire 2003 NPM Adjustment remaining after the pro rata judgment reduction. PM USA believed it was entitled to receive an NPM Adjustment for 2003 based on this ruling, after reflecting the
20%
partial liability reduction noted above, of approximately
$145 million
. PM USA recorded this
$145 million
as a reduction to cost of sales, which increased its reported pre-tax earnings in the third quarter of 2013. In addition, PM USA believed it would be entitled to interest on this amount of approximately
$89 million
. PM USA recorded
$64 million
of this amount as interest income, which reduced interest and other debt expense, net in the first quarter of 2014, but did not yet record the remaining
$25 million
based on its assessment of a certain dispute concerning interest discussed below.
After PM USA recorded these amounts,
two
of the
six
non-diligent states (Indiana and Kentucky) joined the settlement and became signatory states. Those
two
states account for (i)
$37 million
of the
$145 million
NPM Adjustment for 2003 that PM USA recorded and (ii)
$17 million
of the interest that PM USA recorded. PM USA has retained those amounts from the
two
states, and has received additional amounts as part of the settlement recoveries for the 2003-2012 NPM Adjustment disputes described above. The remaining
four
states account for approximately (i)
$108 million
of the
$145 million
2003 NPM Adjustment that PM USA recorded and (ii)
$66 million
of the
$89 million
of interest to which PM USA believes it would be entitled on the
$145 million
(and
$47 million
of the
$64 million
of interest that PM USA recorded). Each of these
four
states has filed a
motion in its state court to (i) vacate the panel’s ruling as to its diligence and (ii) to modify the pro rata judgment reduction and to substitute a reduction method more favorable to the state. These
four
states have also raised a dispute concerning the independent auditor’s calculation of interest. In addition, another OPM has raised a dispute concerning the allocation of the interest and disputed payments account earnings among the OPMs.
In April 2014, a Pennsylvania state trial court denied Pennsylvania’s motion to vacate the arbitration panel’s ruling that Pennsylvania had not diligently enforced, but granted Pennsylvania’s motion to modify, with respect to Pennsylvania, the pro rata judgment reduction. In April 2015, a Pennsylvania intermediate appellate court affirmed the trial court’s modification, with respect to Pennsylvania, of the pro rata judgment reduction. On December 23, 2015, the Supreme Court of Pennsylvania denied PM USA’s petition for further judicial review of the Pennsylvania intermediate appellate court decision. In May 2014, a Missouri state trial court denied Missouri’s motion to vacate the arbitration panel’s ruling that Missouri had not diligently enforced, but granted Missouri’s motion to modify, with respect to Missouri, the pro rata judgment reduction. In September 2015, however, a Missouri intermediate appellate court reversed the Missouri state trial court’s ruling that modified the pro rata judgment reduction, effectively reinstating the application of that reduction method to Missouri. The Supreme Court of Missouri granted Missouri’s request for review of the intermediate appellate court decision. In July 2014, a Maryland state trial court denied both Maryland’s motion to vacate the arbitration panel’s ruling that Maryland had not diligently enforced and Maryland’s motion to vacate or modify the pro rata judgment reduction. Maryland appealed both decisions. In October 2015, a Maryland intermediate appellate court reversed the Maryland trial court’s ruling on the pro rata judgment reduction method and applied a judgment reduction method that is more favorable to the state. PM USA is seeking further discretionary review of this decision of the Maryland intermediate appellate court. The motions filed by the fourth state, New Mexico, remain pending in its state trial court.
As a result of the Pennsylvania state trial court ruling, the total 2014 MSA payment credit PM USA received on account of the 2003 NPM Adjustment from the
four
states was reduced from
$108 million
to
$79 million
, and the interest PM USA received from the
four
states was
$48 million
rather than the
$66 million
in interest to which PM USA believed it would be entitled from those
four
states. As a result of the denial by the Supreme Court of Pennsylvania of PM USA’s petition for review of the intermediate appellate court ruling on the modification of the pro rata judgment reduction method, PM USA reversed
$29 million
of the reduction to cost of sales and
$13 million
of the interest income that had been previously recorded in respect of Pennsylvania for the 2003 NPM Adjustment, which reduced its reported pre-tax earnings by approximately
$42 million
in the fourth quarter of 2015. Because the Missouri state trial court ruling post-dated PM USA’s April 2014 MSA payment, that ruling did not reduce the credit that PM USA received against that payment. If Missouri is successful on further judicial review of
87
Altria Group, Inc. and Subsidiaries
Notes to Consolidated Financial Statements
_________________________
the Missouri intermediate appellate court’s ruling reversing the Missouri trial court ruling, PM USA will be required to return approximately
$12 million
of the 2003 NPM Adjustment and
$7 million
of the interest it received (in each case subject to confirmation by the independent auditor), plus applicable interest, and would need to make corresponding reversals to amounts previously recorded. In connection with its appeal of the Missouri state trial court’s ruling, PM USA posted a bond in the amount of
$22 million
, which will remain in place despite the reversal of the Missouri state trial court’s ruling by the intermediate appellate court until all appeals are exhausted. Because the Maryland intermediate appellate court ruling post-dated PM USA’s April 2014 MSA payment, that ruling did not reduce the credit that PM USA received against that payment. If PM USA is not successful in obtaining further discretionary review of the Maryland intermediate appellate court ruling, or if PM USA is not successful in any further discretionary review that may be granted, it will be required to return approximately
$12 million
of the 2003 NPM Adjustment and
$7 million
of the interest it received (plus interest on those amounts) and would need to make corresponding reversals to amounts previously recorded. In addition, the other litigation and disputes discussed above could further reduce PM USA’s recovery on the 2003 NPM Adjustment or recovery of interest and potentially require PM USA to return amounts previously received and/or reverse amounts previously recorded. No assurance can be given that the outcome of Missouri’s appeal to the Supreme Court of Missouri of the Missouri intermediate appellate court decision, PM USA’s request for discretionary review of the Maryland intermediate appellate decision (or the outcome of any further discretionary review that may be granted) or the other litigation and disputes discussed above will be resolved in a manner favorable to PM USA.
2004-2014 NPM Adjustments
. Proceedings regarding state diligent enforcement claims for 2004-2014 have not yet been scheduled. PM USA believes that the MSA requires these claims to be determined in a multi-state arbitration, although a number of non-signatory states have filed motions in their state courts contending that the claims are to be determined in separate arbitrations for individual states or that there is no arbitrable dispute for 2004. In September 2015, a Missouri intermediate appellate court ruled that Missouri was entitled to a single-state arbitration to determine whether Missouri diligently enforced for 2004. PM USA appealed this ruling, and the Supreme Court of Missouri granted review. No assurance can be given that the outcome of such appeal will be favorable to PM USA. On December 9, 2015, a Wisconsin trial court ruled that Wisconsin must arbitrate its claim of diligent enforcement for 2004. No assurance can be given as to when proceedings for 2004-2014 will be scheduled or the precise form those proceedings will take.
In June 2015, PM USA entered into an agreement with 17 of the non-signatory states to form an arbitration panel to conduct an arbitration regarding the 2004 NPM Adjustment. Pursuant to that agreement, in July 2015 PM USA and the
17
states each appointed its respective side’s arbitrator for that arbitration panel.
On December 29, 2015, the two appointed arbitrators selected the third arbitrator for a three-arbitrator panel required by the MSA. Other PMs declined to participate in appointing the arbitrators, and instead filed motions in courts in each of the 17 states seeking to compel these states to participate in an arbitration of the 2004 NPM Adjustment dispute between the states and the PMs that would also include disputes solely between the OPMs regarding the allocation of NPM Adjustments as between them. Several of the 17 states and PM USA have filed cross-motions objecting to the motions filed by the other PMs and seeking to confirm the arbitrators selected by them in July 2015 as properly selected pursuant to the MSA to resolve the 2004 NPM Adjustment dispute between the 17 states and the PMs. This litigation currently is ongoing. No assurance can be given as to how these motions and cross-motions ultimately will be resolved, when the full arbitration panel for 2004 will be empanelled, when that arbitration will commence or whether that arbitration will include the disputes between the OPMs regarding allocation of NPM Adjustments.
The independent auditor has calculated that PM USA’s share of the maximum potential NPM Adjustments for these years is (exclusive of interest or earnings):
$388 million
for 2004,
$181 million
for 2005,
$154 million
for 2006,
$185 million
for 2007,
$250 million
for 2008,
$211 million
for 2009,
$218 million
for 2010,
$166 million
for 2011,
$211 million
for 2012,
$219 million
for 2013 and
$247 million
for 2014. These maximum amounts will be reduced by a judgment reduction to reflect the settlement with the signatory states and the New York settlement. The judgment reduction for the 2004-2014 NPM Adjustments has not yet been determined. In addition, these maximum amounts may also be further reduced by other developments, including agreements that may be entered in the future, disputes that may arise or recalculation of the NPM Adjustment amounts by the independent auditor. Further, the maximum amount for 2004 may also be reduced due to a dispute raised by another OPM regarding the allocation of the maximum potential 2004 NPM Adjustment among the OPMs. Finally, PM USA’s recovery of these amounts, even as reduced, is dependent upon subsequent determinations of non-signatory states’ diligent enforcement claims. The availability and amount of any NPM Adjustment for 2004-2014 from the non-signatory states will not be finally determined in the near term. There is no assurance that the OPMs and other MSA-participating manufacturers will ultimately receive any adjustment from the non-signatory states as a result of these proceedings. PM USA’s receipt of amounts on account of the 2003 NPM Adjustment and interest from non-signatory states does not provide any assurance that PM USA will receive any NPM Adjustment amounts (or associated interest or earnings) for 2004 or any subsequent year. PM USA may enter into settlement discussions regarding the NPM Adjustment disputes with any non-signatory state if PM USA believes it is in its best interests to do so.
▪
Other Disputes Under the State Settlement Agreements:
The payment obligations of the tobacco product manufacturers that are parties to the State Settlement Agreements, as well as the
88
Altria Group, Inc. and Subsidiaries
Notes to Consolidated Financial Statements
_________________________
allocations of any NPM Adjustments received by them pursuant to the MSA or the settlements of NPM Adjustment disputes with certain states described above, may be affected by R.J. Reynolds’s acquisition of Lorillard and the related divestiture of certain cigarette brands by R.J. Reynolds to Imperial Tobacco. PM USA intends carefully to review all calculations reflecting such payment obligations and allocations, and to determine whether to dispute any calculation that it believes improperly increases PM USA’s payment obligations under the State Settlement Agreements or improperly decreases PM USA’s allocation of NPM Adjustments received pursuant to the MSA or any such settlement in a manner inconsistent with the respective applicable agreements. PM USA can neither predict the amount by which its payment obligations may be increased or its allocation of NPM Adjustments decreased, nor provide any assurance that it will be successful in any such dispute that it may raise.
▪
Other MSA-Related Litigation:
Since the MSA’s inception, NPMs and/or their distributors or customers have filed a number of challenges to the MSA and related legislation. They have named as defendants the states and their officials, in an effort to enjoin enforcement of important parts of the MSA and related legislation, and/or participating manufacturers, in an effort to obtain damages. To date, no such challenge has been successful, and the U.S. Courts of Appeals for the Second, Third, Fourth, Fifth, Sixth, Eighth, Ninth and Tenth Circuits have affirmed judgments in favor of defendants in
16
such cases.
▪
Federal Government’s Lawsuit:
In 1999, the United States government filed a lawsuit in the U.S. District Court for the District of Columbia against various cigarette manufacturers, including PM USA, and others, including Altria Group, Inc., asserting claims under three federal statutes, namely the Medical Care Recovery Act (“MCRA”), the MSP provisions of the Social Security Act and the civil provisions of RICO. Trial of the case ended in June 2005. The lawsuit sought to recover an unspecified amount of health care costs for tobacco-related illnesses allegedly caused by defendants’ fraudulent and tortious conduct and paid for by the government under various federal health care programs, including Medicare, military and veterans’ health benefits programs, and the Federal Employees Health Benefits Program. The complaint alleged that such costs total more than
$20 billion
annually. It also sought what it alleged to be equitable and declaratory relief, including disgorgement of profits that arose from defendants’ allegedly tortious conduct, an injunction prohibiting certain actions by defendants, and a declaration that defendants are liable for the federal government’s future costs of providing health care resulting from defendants’ alleged past tortious and wrongful conduct. The case ultimately proceeded only under the civil provisions of RICO.
The government alleged that disgorgement by defendants of approximately
$280 billion
is an appropriate remedy and the trial court agreed. In February 2005, however, a panel of the U.S. Court of Appeals for the District of Columbia Circuit held that disgorgement is not a remedy available to the government under the civil provisions of RICO. In October 2005, the United States
Supreme Court denied the government’s petition for
writ of certiorari
.
In August 2006, the federal trial court entered judgment in favor of the government. The court held that certain defendants, including Altria Group, Inc. and PM USA, violated RICO and engaged in seven of the eight “sub-schemes” to defraud that the government had alleged. Specifically, the court found that:
|
▪
|
defendants falsely denied, distorted and minimized the significant adverse health consequences of smoking;
|
|
▪
|
defendants hid from the public that cigarette smoking and nicotine are addictive;
|
|
▪
|
defendants falsely denied that they control the level of nicotine delivered to create and sustain addiction;
|
|
▪
|
defendants falsely marketed and promoted “low tar/light” cigarettes as less harmful than full-flavor cigarettes;
|
|
▪
|
defendants falsely denied that they intentionally marketed to youth;
|
|
▪
|
defendants publicly and falsely denied that ETS is hazardous to non-smokers; and
|
|
▪
|
defendants suppressed scientific research.
|
The court did not impose monetary penalties on defendants, but ordered the following relief: (i) an injunction against “committing any act of racketeering” relating to the manufacturing, marketing, promotion, health consequences or sale of cigarettes in the United States; (ii) an injunction against participating directly or indirectly in the management or control of the Council for Tobacco Research, the Tobacco Institute, or the Center for Indoor Air Research, or any successor or affiliated entities of each; (iii) an injunction against “making, or causing to be made in any way, any material false, misleading, or deceptive statement or representation or engaging in any public relations or marketing endeavor that is disseminated to the United States public and that misrepresents or suppresses information concerning cigarettes”; (iv) an injunction against conveying any express or implied health message or health descriptors on cigarette packaging or in cigarette advertising or promotional material, including “lights,” “ultra lights” and “low tar,” which the court found could cause consumers to believe one cigarette brand is less hazardous than another brand; (v) the issuance of “corrective statements” in various media regarding the adverse health effects of smoking, the addictiveness of smoking and nicotine, the lack of any significant health benefit from smoking “low tar” or “light” cigarettes, defendants’ manipulation of cigarette design to ensure optimum nicotine delivery and the adverse health effects of exposure to environmental tobacco smoke; (vi) the disclosure on defendants’ public document websites and in the Minnesota document repository of all documents produced to the government in the lawsuit or produced in any future court or administrative action concerning smoking and health until 2021, with certain additional requirements as to documents withheld from production under a claim of privilege or
89
Altria Group, Inc. and Subsidiaries
Notes to Consolidated Financial Statements
_________________________
confidentiality; (vii) the disclosure of disaggregated marketing data to the government in the same form and on the same schedule as defendants now follow in disclosing such data to the Federal Trade Commission (“FTC”) for a period of 10 years; (viii) certain restrictions on the sale or transfer by defendants of any cigarette brands, brand names, formulas or cigarette businesses within the United States; and (ix) payment of the government’s costs in bringing the action.
Defendants appealed and, in May 2009, a three judge panel of the Court of Appeals for the District of Columbia Circuit issued a
per curiam
decision largely affirming the trial court’s judgment against defendants and in favor of the government. Although the panel largely affirmed the remedial order that was issued by the trial court, it vacated the following aspects of the order:
|
▪
|
its application to defendants’ subsidiaries;
|
|
▪
|
the prohibition on the use of express or implied health messages or health descriptors, but only to the extent of extraterritorial application;
|
|
▪
|
its point-of-sale display provisions; and
|
|
▪
|
its application to Brown & Williamson Holdings.
|
The Court of Appeals panel remanded the case for the trial court to reconsider these four aspects of the injunction and to reformulate its remedial order accordingly. Furthermore, the Court of Appeals panel rejected all of the government’s and intervenors’ cross-appeal arguments and refused to broaden the remedial order entered by the trial court. The Court of Appeals panel also left undisturbed its prior holding that the government cannot obtain disgorgement as a permissible remedy under RICO.
In July 2009, defendants filed petitions for a rehearing before the panel and for a rehearing by the entire Court of Appeals. Defendants also filed a motion to vacate portions of the trial court’s judgment on the grounds of mootness because of the passage of the Family Smoking Prevention and Tobacco Control Act (“FSPTCA”), granting the U.S. Food and Drug Administration (the “FDA”) broad authority over the regulation of tobacco products. In September 2009, the Court of Appeals entered three
per curiam
rulings. Two of them denied defendants’ petitions for panel rehearing or for rehearing
en banc
.
In the third
per curiam
decision, the Court of Appeals denied defendants’ suggestion of mootness and motion for partial
vacatur
. In February 2010, PM USA and Altria Group, Inc. filed their
certiorari
petitions with the United States Supreme Court. In addition, the federal government and the intervenors filed their own
certiorari
petitions, asking the court to reverse an earlier Court of Appeals decision and hold that civil RICO allows the trial court to order disgorgement as well as other equitable relief, such as smoking cessation remedies, designed to redress continuing consequences of prior RICO violations. In June 2010, the United States Supreme Court denied all of the parties’ petitions. In July 2010, the Court of Appeals issued its mandate lifting the stay of the trial court’s judgment and remanding the case to the trial court. As a result of the mandate, except for those matters remanded to the trial court for further proceedings,
defendants are now subject to the injunction discussed above and the other elements of the trial court’s judgment.
In February 2011, the government submitted its proposed corrective statements and the trial court referred issues relating to a document repository to a special master. Defendants filed a response to the government’s proposed corrective statements and filed a motion to vacate the trial court’s injunction in light of the FSPTCA, which motion was denied in June 2011. Defendants appealed the trial court’s ruling to the U.S. Court of Appeals for the District of Columbia Circuit. In July 2012, the Court of Appeals affirmed the district court’s denial of defendants’ motion to vacate the district court’s injunction.
Remaining issues pending include: (i) the content of the court-ordered corrective communications and (ii) the requirements related to point-of-sale signage. In November 2012, the district court issued its order specifying the content of the corrective communications described above. The district court’s order required the parties to engage in negotiations with the special master regarding implementation of the corrective communications remedy for television, newspapers, cigarette pack onserts and websites. In January 2013, defendants filed a notice of appeal from the order on the content and vehicles of the corrective communications and a motion to hold the appeal in abeyance pending completion of the negotiations, which the U.S. Court of Appeals granted in February 2013. In January 2014, the parties submitted a motion for entry of a consent order in the district court, setting forth their agreement on the implementation details of the corrective communications remedy. The agreement provides that the “trigger date” for implementation is after the appeal on the content of the communications has been exhausted. Also in January 2014, the district court convened a hearing and ordered further briefing. A number of
amici
who sought modification or rejection of the agreement for a variety of reasons were given leave to appear. In April 2014, the parties filed an amended proposed consent order and accompanying submission in the district court seeking entry of a revised agreement on the implementation details of the corrective communications remedy. In June 2014, the district court approved the April 2014 proposed consent order. Also in June 2014, defendants filed a notice of appeal of the consent order solely for the purpose of perfecting the U.S. Court of Appeals’ jurisdiction over the pending appeal relating to the content and vehicles of the corrective communications and, in July 2014, defendants moved to consolidate this appeal with the appeal filed in January 2013. The U.S. Court of Appeals granted the motion to consolidate in August 2014.
In May 2015, the U.S. Court of Appeals affirmed in part and reversed in part, concluding that certain portions of the statements exceeded the district court’s jurisdiction under RICO, but upheld other portions challenged by defendants. The Court of Appeals remanded the case to the trial court for further proceedings. In July 2015, the government filed a petition for panel rehearing, which the U.S. Court of Appeals denied on August 2015. In October 2015, the district court ordered further briefing on the content of the corrective communications reversed by the U.S.
90
Altria Group, Inc. and Subsidiaries
Notes to Consolidated Financial Statements
_________________________
Court of Appeals and any implementation changes the parties propose.
In the second quarter of 2014, Altria Group, Inc. and PM USA recorded provisions on each of their respective balance sheets totaling
$31 million
for the estimated costs of implementing the corrective communications remedy. This estimate is subject to change due to several factors, including the outcome of further proceedings, though Altria Group, Inc. and PM USA do not expect any change in this estimate to be material.
The consent order approved by the district court in June 2014 did not address the requirements related to point-of-sale signage. In May 2014, the district court ordered further briefing by the parties on the issue of corrective statements on point-of-sale signage, which was completed in June 2014.
In
December 2011
, the parties to the lawsuit entered into an agreement as to the issues concerning the document repository. Pursuant to this agreement, PM USA agreed to deposit an amount of approximately
$3.1 million
into the district court in installments over a
five
-year period.
“Lights/Ultra Lights” Cases
▪
Overview:
Plaintiffs in certain pending matters seek certification of their cases as class actions and allege, among other things, that the uses of the terms “Lights” and/or “Ultra Lights” constitute deceptive and unfair trade practices, common law or statutory fraud, unjust enrichment or breach of warranty, and seek injunctive and equitable relief, including restitution and, in certain cases, punitive damages. These class actions have been brought against PM USA and, in certain instances, Altria Group, Inc. or its subsidiaries, on behalf of individuals who purchased and consumed various brands of cigarettes, including
Marlboro
Lights,
Marlboro
Ultra Lights,
Virginia Slims
Lights and Superslims,
Merit
Lights and
Cambridge
Lights. Defenses raised in these cases include lack of misrepresentation, lack of causation, injury and damages, the statute of limitations, non-liability under state statutory provisions exempting conduct that complies with federal regulatory directives, and the First Amendment. As of January 26, 2016, a total of
11
such cases are pending in various U.S. state courts.
▪
The
Good
Case:
In May 2006, a federal trial court in Maine granted PM USA’s motion for summary judgment in
Good
, a purported “Lights” class action, on the grounds that plaintiffs’ claims are preempted by the Federal Cigarette Labeling and Advertising Act (“FCLAA”) and dismissed the case. In December 2008, the United States Supreme Court ruled that plaintiffs’ claims are not barred by federal preemption. Although the Court rejected the argument that the FTC’s actions were so extensive with respect to the descriptors that the state law claims were barred as a matter of federal law, the Court’s decision was limited: it did not address the ultimate merits of plaintiffs’ claim, the viability of the action as a class action or other state law issues. The case was returned to the federal court in Maine and consolidated with other federal cases in the multidistrict litigation proceeding discussed below. In June 2011, the plaintiffs voluntarily dismissed the case without prejudice after the district
court denied plaintiffs’ motion for class certification, concluding the litigation.
▪
Federal Multidistrict Proceeding and Subsequent Developments:
Since the December 2008 United States Supreme Court decision in
Good
, and through January 26, 2016,
26
purported “Lights” class actions were served upon PM USA and, in certain cases, Altria Group, Inc. These cases were filed in
15
states, the U.S. Virgin Islands and the District of Columbia. All of these cases either were filed in federal court or were removed to federal court by PM USA and were transferred and consolidated by the Judicial Panel on Multidistrict Litigation (“JPMDL”) before the U.S. District Court for the District of Maine for pretrial proceedings (“MDL proceeding”).
In November 2010, the district court in the MDL proceeding denied plaintiffs’ motion for class certification in
four
cases, covering the jurisdictions of California, the District of Columbia, Illinois and Maine. These jurisdictions were selected by the parties as sample cases, with
two
selected by plaintiffs and
two
selected by defendants. Plaintiffs sought appellate review of this decision but, in February 2011, the U.S. Court of Appeals for the First Circuit denied plaintiffs’ petition for leave to appeal. Later that year, plaintiffs in
13
cases voluntarily dismissed their cases without prejudice. In April 2012, the JPMDL remanded the remaining
four
cases (
Phillips
,
Tang
,
Wyatt
and
Cabbat
) back to the federal district courts in which the suits originated. These cases were ultimately resolved in a manner favorable to PM USA.
▪
“Lights” Cases Dismissed, Not Certified or Ordered De-Certified:
As of January 26, 2016, in addition to the federal district court in the MDL proceeding,
19
courts in
20
“Lights” cases have refused to certify class actions, dismissed class action allegations, reversed prior class certification decisions or have entered judgment in favor of PM USA.
Trial courts in Arizona, Hawaii, Illinois, Kansas, New Jersey, New Mexico, Ohio, Oregon, Tennessee, Washington and Wisconsin have refused to grant class certification or have dismissed plaintiffs’ class action allegations. Plaintiffs voluntarily dismissed a case in Michigan after a trial court dismissed the claims plaintiffs asserted under the Michigan Unfair Trade and Consumer Protection Act. Several appellate courts have issued rulings that either affirmed rulings in favor of Altria Group, Inc. and/or PM USA or reversed rulings entered in favor of plaintiffs.
In Florida, an intermediate appellate court overturned an order by a trial court that granted class certification in
Hines.
The Florida Supreme Court denied review in January 2008. The Supreme Court of Illinois overturned a judgment that awarded damages to a certified class in the
Price
case, although plaintiffs are seeking reinstatement of the judgment. See
The Price Case
below for further discussion. In Louisiana, the U.S. Court of Appeals for the Fifth Circuit dismissed a purported “Lights” class action (
Sullivan
) on the grounds that plaintiffs’ claims were preempted by the FCLAA. In New York, the U.S. Court of Appeals for the Second Circuit overturned a trial court decision in
Schwab
that granted plaintiffs’ motion for certification of a nationwide class of all U.S. residents that purchased cigarettes in
91
Altria Group, Inc. and Subsidiaries
Notes to Consolidated Financial Statements
_________________________
the United States that were labeled “Light” or “Lights.” In July 2010, plaintiffs in
Schwab
voluntarily dismissed the case with prejudice. In Ohio, the Ohio Supreme Court overturned class certifications in the
Marrone
and
Phillips
cases. Plaintiffs voluntarily dismissed both cases without prejudice in August 2009, but refiled in federal court as the
Phillips
case discussed above. The Supreme Court of Washington denied a motion for interlocutory review filed by the plaintiffs in the
Davies
case that sought review of an order by the trial court that refused to certify a class. Plaintiffs subsequently voluntarily dismissed the
Davies
case with prejudice. In August 2011, the U.S. Court of Appeals for the Seventh Circuit affirmed the Illinois federal district court’s dismissal of “Lights” claims brought against PM USA in the
Cleary
case. In
Curtis
, a certified class action, in May 2012, the Minnesota Supreme Court affirmed the trial court’s entry of summary judgment in favor of PM USA, concluding this litigation.
In
Lawrence
, in August 2012, the New Hampshire Supreme Court reversed the trial court’s order to certify a class and subsequently denied plaintiffs’ rehearing petition. In October 2012, the case was dismissed after plaintiffs filed a motion to dismiss the case with prejudice, concluding this litigation.
▪
State Trial Court Class Certifications:
State trial courts have certified classes against PM USA in several jurisdictions. Over time, several such cases have been dismissed by the courts at the summary judgment stage, but others remain pending. Significant developments in these pending cases include:
Aspinall
: In August 2004, the Massachusetts Supreme Judicial Court affirmed the class certification order. In August 2006, the trial court denied PM USA’s motion for summary judgment and granted plaintiffs’ cross-motion for summary judgment on the defenses of federal preemption and a state law exemption to Massachusetts’ consumer protection statute. On motion of the parties, the trial court subsequently reported its decision to deny summary judgment to the appeals court for review and stayed further proceedings pending completion of the appellate review. In March 2009, the Massachusetts Supreme Judicial Court affirmed the order denying summary judgment to PM USA and granting the plaintiffs’ cross-motion. In January 2010, plaintiffs moved for partial summary judgment as to liability claiming collateral estoppel from the findings in the case brought by the Department of Justice (see
Health Care Cost Recovery Litigation - Federal Government’s Lawsuit
described above). In March 2012, the trial court denied plaintiffs’ motion. In February 2013, the trial court, upon agreement of the parties, dismissed without prejudice plaintiffs’ claims against Altria Group, Inc. PM USA is now the sole defendant in the case. In September 2013, the case was transferred to the Business Litigation Session of the Massachusetts Superior Court. Also in September 2013, plaintiffs filed a motion for partial summary judgment on the scope of remedies available in the case, which the Massachusetts Superior Court denied in February 2014, concluding that plaintiffs cannot obtain disgorgement of profits as an equitable remedy and that their recovery is limited to actual damages or
$25
per class member if they cannot prove actual damages greater than
$25
.
Plaintiffs filed a motion asking the trial court to report its February 2014 ruling to the Massachusetts Appeals Court for review, which the trial court denied. In March 2014, plaintiffs petitioned the Massachusetts Appeals Court for review of the ruling, which the appellate court denied. In August 2015, the trial court denied various pre-trial motions filed by PM USA, including a motion for summary judgment on the ground that plaintiffs have no proof of injury. Trial began in October 2015 and concluded in November 2015. On December 18, 2015, PM USA filed a motion to decertify the class.
Brown
: In June 1997, plaintiffs filed suit in California state court alleging that domestic cigarette manufacturers, including PM USA and others, violated California law regarding unfair, unlawful and fraudulent business practices. In May 2009, the California Supreme Court reversed an earlier trial court decision that decertified the class and remanded the case to the trial court. At that time, the class consisted of individuals who, at the time they were residents of California, (i) smoked in California one or more cigarettes manufactured by PM USA that were labeled and/or advertised with the terms or phrases “light,” “medium,” “mild,” “low tar,” and/or “lowered tar and nicotine,” but not including any cigarettes labeled or advertised with the terms or phrases “ultra light” or “ultra low tar,” and (ii) who were exposed to defendant’s marketing and advertising activities in California. Plaintiffs are seeking restitution of a portion of the costs of “light” cigarettes purchased during the class period and injunctive relief ordering corrective communications. In September 2012, at the plaintiffs’ request, the trial court dismissed all defendants except PM USA from the lawsuit. Trial began in April 2013. In May 2013 the plaintiffs redefined the class to include California residents who smoked in California one or more of defendant’s
Marlboro
Lights cigarettes between January 1, 1998 and April 23, 2001, and who were exposed to defendant’s marketing and advertising activities in California. In June 2013, PM USA filed a motion to decertify the class. Trial concluded in July 2013. In September 2013, the court issued a final Statement of Decision, in which the court found that PM USA violated California law, but that plaintiffs had not established a basis for relief. On this basis, the court granted judgment for PM USA. The court also denied PM USA’s motion to decertify the class. In October 2013, the court entered final judgment in favor of PM USA. In November 2013, plaintiffs moved for a new trial, which the court denied. In December 2013, plaintiffs filed a notice of appeal and PM USA filed a conditional cross-appeal. In February 2014, the trial court awarded PM USA
$764,553
in costs and plaintiffs appealed the costs award. Oral argument occurred in September 2015 and subsequently the Court of Appeal affirmed the trial court judgment and dismissed PM USA’s conditional cross-appeal as moot. The court also affirmed the cost award in favor of PM USA. On November 6, 2015, plaintiffs filed a petition for review with the California Supreme Court, which the court denied on December 9, 2015.
Larsen
: In August 2005, a Missouri Court of Appeals affirmed the class certification order. In December 2009, the trial court denied plaintiffs’ motion for reconsideration of the period during
92
Altria Group, Inc. and Subsidiaries
Notes to Consolidated Financial Statements
_________________________
which potential class members can qualify to become part of the class. The class period remains 1995-2003. In June 2010, PM USA’s motion for partial summary judgment regarding plaintiffs’ request for punitive damages was denied. In April 2010, plaintiffs moved for partial summary judgment as to an element of liability in the case, claiming collateral estoppel from the findings in the case brought by the Department of Justice (see
Health Care Cost Recovery Litigation - Federal Government’s Lawsuit
described above). The plaintiffs’ motion was denied in December 2010. In June 2011, PM USA filed various summary judgment motions challenging the plaintiffs’ claims. In August 2011, the trial court granted PM USA’s motion for partial summary judgment, ruling that plaintiffs could not present a damages claim based on allegations that
Marlboro
Lights are more dangerous than
Marlboro
Reds. The trial court denied PM USA’s remaining summary judgment motions. Trial in the case began in September 2011 and, in October 2011, the court declared a mistrial after the jury failed to reach a verdict. In January 2014, the trial court reversed its prior ruling granting partial summary judgment against plaintiffs’ “more dangerous” claim and allowed plaintiffs to pursue that claim. In October 2014, PM USA filed motions to decertify the class and for partial summary judgment on plaintiffs’ “more dangerous” claim, which the court denied in June 2015. Re-trial is scheduled to begin on March 2, 2016.
Miner
:
In June 2007, the United States Supreme Court reversed the lower court rulings in
Miner
(formerly known as
Watson
) that denied plaintiffs’ motion to have the case heard in a state, as opposed to federal, trial court. The Supreme Court rejected defendants’ contention that the case must be tried in federal court under the “federal officer” statute. Following remand, the case was removed again to federal court in Arkansas and transferred to the MDL proceeding discussed above. In November 2010, the district court in the MDL proceeding remanded the case to Arkansas state court. In December 2011, plaintiffs voluntarily dismissed their claims against Altria Group, Inc. without prejudice. In March 2013, plaintiffs filed a class certification motion. In November 2013, the trial court granted class certification. The certified class includes those individuals who, from November 1, 1971 through June 22, 2010, purchased
Marlbor
o Lights and
Marlboro
Ultra Lights for personal consumption in Arkansas. PM USA filed a notice of appeal of the class certification ruling to the Arkansas Supreme Court in December 2013. In February 2015, the Arkansas Supreme Court affirmed the trial court’s class certification order. In May 2015, PM USA filed a motion for partial summary judgment seeking to foreclose any recovery for cigarette purchases prior to 1999, when a private right of action was added to the consumer protection statute under which plaintiffs are suing. The trial court denied the motion in July 2015. Trial is currently scheduled to begin on August 2, 2016.
▪
Other Developments:
In Oregon (
Pearson
), a state court denied plaintiffs’ motion for interlocutory review of the trial court’s refusal to certify a class. In February 2007, PM USA filed a motion for summary judgment based on federal preemption and the Oregon statutory exemption. In September 2007, the district
court granted PM USA’s motion based on express preemption under the FCLAA, and plaintiffs appealed this dismissal and the class certification denial to the Oregon Court of Appeals. In June 2013, the Oregon Court of Appeals reversed the trial court’s denial of class certification and remanded to the trial court for further consideration of class certification. In July 2013, PM USA filed a petition for reconsideration with the Oregon Court of Appeals, which was denied in August 2013. PM USA filed its petition for review to the Oregon Supreme Court in October 2013, which the court accepted in January 2014. In October 2015, the Oregon Supreme Court affirmed the trial court’s order denying class certification, thereby reversing the decision of the Oregon Court of Appeals. On November 5, 2015, plaintiffs filed a motion for reconsideration with the Oregon Supreme Court, which the court denied on December 10, 2015. On December 28, 2015, the Oregon Supreme Court entered its judgment denying class certification and remanding the claims of the individual plaintiffs for further proceedings.
In December 2009, the state trial court in
Carroll
(formerly known as
Holmes
) (pending in Delaware) denied PM USA’s motion for summary judgment based on an exemption provision in the Delaware Consumer Fraud Act. In January 2011, the trial court allowed the plaintiffs to file an amended complaint substituting class representatives and naming Altria Group, Inc. and PMI as additional defendants. In February 2013, the trial court approved the parties’ stipulation to the dismissal without prejudice of Altria Group, Inc. and PMI, leaving PM USA as the sole defendant in the case. In March 2015, plaintiffs moved for class certification and, in July 2015, PM USA filed a summary judgment motion seeking to dismiss plaintiffs’ claims in their entirety on preemption grounds.
▪
The
Price
Case:
Trial in
Price
commenced in state court in Illinois in January 2003 and, in
March 2003
, the judge found in favor of the plaintiff class and awarded
$7.1 billion
in compensatory damages and
$3.0 billion
in punitive damages against PM USA. In December 2005, the Illinois Supreme Court reversed the trial court’s judgment in favor of the plaintiffs. In November 2006, the United States Supreme Court denied plaintiffs’ petition for
writ of certiorari
and, in
December 2006
, the Circuit Court of Madison County enforced the Illinois Supreme Court’s mandate and dismissed the case with prejudice.
In December 2008, plaintiffs filed with the trial court a petition for relief from the final judgment that was entered in favor of PM USA. Specifically, plaintiffs sought to vacate the judgment entered by the trial court on remand from the 2005 Illinois Supreme Court decision overturning the verdict on the ground that the United States Supreme Court’s December 2008 decision in
Good
demonstrated that the Illinois Supreme Court’s decision was “inaccurate.” PM USA filed a motion to dismiss plaintiffs’ petition and, in February 2009, the trial court granted PM USA’s motion on the basis that the petition was not timely filed. In March 2009, the
Price
plaintiffs filed a notice of appeal with the Fifth Judicial District of the Appellate Court of Illinois. In February 2011, the intermediate appellate court ruled that the petition was timely filed and reversed the trial court’s dismissal of
93
Altria Group, Inc. and Subsidiaries
Notes to Consolidated Financial Statements
_________________________
the plaintiffs’ petition and, in September 2011, the Illinois Supreme Court declined PM USA’s petition for review. As a result, the case was returned to the trial court for proceedings on whether the court should grant the plaintiffs’ petition to reopen the prior judgment. In February 2012, plaintiffs filed an amended petition, which PM USA opposed. Subsequently, in responding to PM USA’s opposition to the amended petition, plaintiffs asked the trial court to reinstate the original judgment. The trial court denied plaintiffs’ petition in December 2012. In January 2013, plaintiffs filed a notice of appeal with the Fifth Judicial District. In January 2013, PM USA filed a motion asking the Illinois Supreme Court to immediately exercise its jurisdiction over the appeal. In February 2013, the Illinois Supreme Court denied PM USA’s motion. In April 2014, the Fifth Judicial District reversed and ordered reinstatement of the original
$10.1 billion
trial court judgment against PM USA. In May 2014, PM USA filed in the Illinois Supreme Court a petition for a supervisory order and a petition for leave to appeal. The filing of the petition for leave to appeal automatically stayed the Fifth District’s mandate pending disposition by the Illinois Supreme Court. Also in May 2014, plaintiffs filed a motion seeking recusal of Justice Karmeier, one of the Illinois Supreme Court justices, which PM USA opposed. In September 2014, the Illinois Supreme Court granted PM USA’s motion for leave to appeal and took no action on PM USA’s motion for a supervisory order. Justice Karmeier denied plaintiffs’ motion seeking his recusal. In February 2015, plaintiffs filed a new motion seeking recusal or disqualification of Justice Karmeier. In March 2015, the Illinois Supreme Court denied plaintiffs’ request that it order the disqualification of Justice Karmeier and referred the recusal request to Justice Karmeier to decide. On November 4, 2015, the Illinois Supreme Court vacated the Fifth Judicial District’s decision, finding that the plaintiffs’ petition was improper, and dismissed the cause of action without prejudice to plaintiffs to file a motion to recall the mandate in the Illinois Supreme Court. On the same day, Justice Karmeier denied the recusal motion. On November 18, 2015, the plaintiffs filed motions in the Illinois Supreme Court seeking to recall the 2005 mandate issued in PM USA’s favor and for recusal of Justice Karmeier, both of which the court denied on January 11, 2016. On January 22, 2016, plaintiffs filed a petition for
writ of certiorari
with the United States Supreme Court on the question of whether Justice Karmeier should have recused himself.
In June 2009, the plaintiff in an individual smoker lawsuit (
Kelly
) brought on behalf of an alleged smoker of “Lights” cigarettes in Madison County, Illinois state court filed a motion seeking a declaration that his claims under the Illinois Consumer Fraud Act are not (i) barred by the exemption in that statute based on his assertion that the Illinois Supreme Court’s decision in
Price
is no longer good law in light of the decisions by the United States Supreme Court in
Good
and
Watson
, and (ii) preempted in light of the United States Supreme Court’s decision in
Good.
In September 2009, the court granted plaintiff’s motion as to federal preemption, but denied it with respect to the state statutory exemption.
Certain Other Tobacco-Related Litigation
▪
Ignition Propensity Cases:
PM USA and Altria Group, Inc. are currently facing litigation alleging that a fire caused by cigarettes led to individuals’ deaths. In a Kentucky case (
Walker
), the federal district court denied plaintiffs’ motion to remand the case to state court and dismissed plaintiffs’ claims in February 2009. Plaintiffs subsequently filed a notice of appeal. In October 2011, the U.S. Court of Appeals for the Sixth Circuit reversed the portion of the district court decision that denied remand of the case to Kentucky state court and remanded the case to Kentucky state court. The Sixth Circuit did not address the merits of the district court’s dismissal order. Defendants’ petition for rehearing with the Sixth Circuit was denied in December 2011. Defendants filed a renewed motion to dismiss in state court in March 2013. Based on new evidence, in June 2013, defendants removed the case for a second time to the U.S. District Court for the Western District of Kentucky and re-filed their motion to dismiss in June 2013. In July 2013, plaintiffs filed a motion to remand the case to Kentucky state court, which was granted in March 2014.
▪
False Claims Act Case:
PM USA is a defendant in a
qui tam
action filed in the U.S. District Court for the District of Columbia (
United States ex rel. Anthony Oliver
) alleging violation of the False Claims Act in connection with sales of cigarettes to the U.S. military. The relator contends that PM USA violated “most favored customer” provisions in government contracts and regulations by selling cigarettes to non-military customers in overseas markets at more favorable prices than it sold to the U.S. military exchange services for resale on overseas military bases in those same markets. The relator has dropped Altria Group, Inc. as a defendant and has dropped claims related to post-MSA price increases on cigarettes sold to the U.S. military. In July 2012, PM USA filed a motion to dismiss, which was granted on jurisdictional grounds in June 2013, and the case was dismissed with prejudice. In July 2013, the relator appealed the dismissal to the U.S. Court of Appeals for the District of Columbia Circuit. In August 2014, the Court of Appeals reversed the jurisdictional issue and remanded the case to the district court for further proceedings, including consideration of PM USA’s alternative grounds for dismissal. In October 2014, PM USA filed a second motion to dismiss in the U.S. District Court for the District of Columbia for lack of subject matter jurisdiction based on issues left unresolved by the opinion of the Court of Appeals for the District of Columbia Circuit. In April 2015, the district court granted PM USA’s second motion to dismiss for lack of subject matter jurisdiction and again dismissed the case with prejudice. The relator appealed the latest dismissal to the Court of Appeals for the District of Columbia Circuit in May 2015. Oral argument occurred on January 15, 2016 at the U.S. Court of Appeals for the District of Columbia Circuit.
▪
Argentine Grower Cases:
PM USA is a defendant in
six
cases (
Hupan
,
Chalanuk
,
Rodriguez Da Silva
,
Aranda
,
Taborda
and
Biglia
) filed in Delaware state court against multiple defendants by the parents of Argentine children born with alleged birth defects. Plaintiffs in these cases allege that they grew
94
Altria Group, Inc. and Subsidiaries
Notes to Consolidated Financial Statements
_________________________
tobacco in Argentina under contract with Tabacos Norte S.A., an alleged subsidiary of PMI, and that they and their infant children were exposed directly and
in utero
to hazardous herbicides and pesticides used in the production and cultivation of tobacco. Plaintiffs seek compensatory and punitive damages against all defendants. In December 2012, Altria Group, Inc. and certain other defendants were dismissed from the
Hupan
,
Chalanuk
and
Rodriguez Da Silva
cases. Altria Group, Inc. and certain other defendants were dismissed from
Aranda
,
Taborda
and
Biglia
in May 2013, October 2013 and February 2014, respectively. The
three
remaining defendants in the six cases are PM USA, Philip Morris Global Brands Inc. (a subsidiary of PMI) and Monsanto Company. Following discussions regarding indemnification for these cases pursuant to the Distribution Agreement between PMI and Altria Group, Inc.,
PMI and PM USA have agreed to resolve conflicting indemnity demands after final judgments are entered. See
Guarantees and Other Similar Matters
below for a discussion of the Distribution Agreement. In April 2014, all three defendants in the
Hupan
case filed motions to dismiss for failure to state a claim, and PM USA and Philip Morris Global Brands filed separate motions to dismiss based on the doctrine of
forum non conveniens
. All proceedings in the other
five
cases were stayed pending the court’s resolution of the motions to dismiss filed in
Hupan
. On December 1, 2015, the trial court granted PM USA’s motion to dismiss on
forum non conveniens
grounds. Plaintiff filed a motion for clarification or re-argument on December 7, 2015.
UST Litigation
Claims related to smokeless tobacco products generally fall within the following categories:
First, UST and/or its tobacco subsidiaries have been named in certain actions in West Virginia (See
In re: Tobacco Litigation
above) brought by or on behalf of individual plaintiffs against cigarette manufacturers, smokeless tobacco manufacturers and other organizations seeking damages and other relief in connection with injuries allegedly sustained as a result of tobacco usage, including smokeless tobacco products. Included among the plaintiffs are
five
individuals alleging use of USSTC’s smokeless tobacco products and alleging the types of injuries claimed to be associated with the use of smokeless tobacco products. USSTC, along with other non-cigarette manufacturers, has remained severed from such proceedings since December 2001.
Second, UST and/or its tobacco subsidiaries has been named in a number of other individual tobacco and health suits over time. Plaintiffs’ allegations of liability in these cases are based on various theories of recovery, such as negligence, strict liability, fraud, misrepresentation, design defect, failure to warn, breach of implied warranty, addiction and breach of consumer protection statutes. Plaintiffs seek various forms of relief, including compensatory and punitive damages, and certain equitable relief, including but not limited to disgorgement. Defenses raised in these cases include lack of causation, assumption of the risk, comparative fault and/or contributory negligence, and statutes of
limitations. USSTC is currently named in
one
such action in Florida (
Vassallo
). There is currently no trial date set in this case.
Environmental Regulation
Altria Group, Inc. and its subsidiaries (and former subsidiaries) are subject to various federal, state and local laws and regulations concerning the discharge of materials into the environment, or otherwise related to environmental protection, including, in the United States: the Clean Air Act, the Clean Water Act, the Resource Conservation and Recovery Act and the Comprehensive Environmental Response, Compensation and Liability Act (commonly known as “Superfund”), which can impose joint and several liability on each responsible party. Subsidiaries (and former subsidiaries) of Altria Group, Inc. are involved in several matters subjecting them to potential costs of remediation and natural resource damages under Superfund or other laws and regulations. Altria Group, Inc.’s subsidiaries expect to continue to make capital and other expenditures in connection with environmental laws and regulations.
Altria Group, Inc. provides for expenses associated with environmental remediation obligations on an undiscounted basis when such amounts are probable and can be reasonably estimated. Such accruals are adjusted as new information develops or circumstances change. Other than those amounts, it is not possible to reasonably estimate the cost of any environmental remediation and compliance efforts that subsidiaries of Altria Group, Inc. may undertake in the future. In the opinion of management, however, compliance with environmental laws and regulations, including the payment of any remediation costs or damages and the making of related expenditures, has not had, and is not expected to have, a material adverse effect on Altria Group, Inc.’s consolidated results of operations, capital expenditures, financial position or cash flows.
Guarantees and Other Similar Matters
In the ordinary course of business, certain subsidiaries of Altria Group, Inc. have agreed to indemnify a limited number of third parties in the event of future litigation. At
December 31, 2015
, Altria Group, Inc. and certain of its subsidiaries (i) had
$62 million
of unused letters of credit obtained in the ordinary course of business; (ii) were contingently liable for
$21 million
of guarantees, consisting primarily of surety bonds, related to their own performance; and (iii) had a redeemable noncontrolling interest of
$37 million
recorded on its consolidated balance sheet. In addition, from time to time, subsidiaries of Altria Group, Inc. issue lines of credit to affiliated entities. These items have not had, and are not expected to have, a significant impact on Altria Group, Inc.’s liquidity.
Under the terms of a distribution agreement between Altria Group, Inc. and PMI (the “Distribution Agreement”), entered into as a result of Altria Group, Inc.’s 2008 spin-off of its former subsidiary PMI, liabilities concerning tobacco products will be allocated based in substantial part on the manufacturer. PMI will indemnify Altria Group, Inc. and PM USA for liabilities related to tobacco products manufactured by PMI or contract manufactured for PMI by PM USA, and PM USA will indemnify PMI for
95
Altria Group, Inc. and Subsidiaries
Notes to Consolidated Financial Statements
_________________________
liabilities related to tobacco products manufactured by PM USA, excluding tobacco products contract manufactured for PMI. Altria Group, Inc. does not have a related liability recorded on its consolidated balance sheet at
December 31, 2015
as the fair value of this indemnification is insignificant.
As more fully discussed in
Note 19
.
Condensed Consolidating Financial Information
, PM USA has issued guarantees relating to Altria Group, Inc.’s obligations under its outstanding debt securities, borrowings under the Credit Agreement and amounts outstanding under its commercial paper program.
Redeemable Noncontrolling Interest
In September 2007, Ste. Michelle completed the acquisition of Stag’s Leap Wine Cellars through one of its consolidated subsidiaries, Michelle-Antinori, LLC (“Michelle-Antinori”), in which Ste. Michelle holds an
85%
ownership interest with a
15%
noncontrolling interest held by Antinori California (“Antinori”). In connection with the acquisition of Stag’s Leap Wine Cellars, Ste. Michelle entered into a put arrangement with Antinori. The put arrangement, as later amended, provides Antinori with the right to require Ste. Michelle to purchase its 15% ownership interest in Michelle-Antinori at a price equal to Antinori’s initial investment of
$27 million
. The put arrangement became exercisable in September 2010 and has no expiration date. As of December 31, 2015, the redemption value of the put arrangement did not exceed the noncontrolling interest balance. Therefore, no adjustment to the value of the redeemable noncontrolling interest was recognized on the consolidated balance sheet for the put arrangement.
The noncontrolling interest put arrangement is accounted for as mandatorily redeemable securities because redemption is outside of the control of Ste. Michelle. As such, the redeemable noncontrolling interest is reported in the mezzanine equity section on the consolidated balance sheets at December 31, 2015 and 2014.
Note 19
. Condensed Consolidating Financial Information
PM USA, which is a 100% owned subsidiary of Altria Group, Inc., has guaranteed Altria Group, Inc.’s obligations under its outstanding debt securities, borrowings under its Credit Agreement and amounts outstanding under its commercial paper program (the “Guarantees”). Pursuant to the Guarantees, PM USA fully and unconditionally guarantees, as primary obligor, the payment and performance of Altria Group, Inc.’s obligations under the guaranteed debt instruments (the “Obligations”), subject to release under certain customary circumstances as noted below.
The Guarantees provide that PM USA guarantees the punctual payment when due, whether at stated maturity, by acceleration or otherwise, of the Obligations. The liability of PM USA under the Guarantees is absolute and unconditional irrespective of: any lack of validity, enforceability or genuineness of any provision of any agreement or instrument relating thereto; any change in the time, manner or place of payment of, or in any other term of, all or any of the Obligations, or any other
amendment or waiver of or any consent to departure from any agreement or instrument relating thereto; any exchange, release or non-perfection of any collateral, or any release or amendment or waiver of or consent to departure from any other guarantee, for all or any of the Obligations; or any other circumstance that might otherwise constitute a defense available to, or a discharge of, Altria Group, Inc. or PM USA.
The obligations of PM USA under the Guarantees are limited to the maximum amount as will not result in PM USA’s obligations under the Guarantees constituting a fraudulent transfer or conveyance, after giving effect to such maximum amount and all other contingent and fixed liabilities of PM USA that are relevant under Bankruptcy Law, the Uniform Fraudulent Conveyance Act, the Uniform Fraudulent Transfer Act or any similar federal or state law to the extent applicable to the Guarantees. For this purpose, “Bankruptcy Law” means Title 11, U.S. Code, or any similar federal or state law for the relief of debtors.
PM USA will be unconditionally released and discharged from the Obligations upon the earliest to occur of:
▪
the date, if any, on which PM USA consolidates with or merges into Altria Group, Inc. or any successor;
▪
the date, if any, on which Altria Group, Inc. or any successor consolidates with or merges into PM USA;
▪
the payment in full of the Obligations pertaining to such Guarantees; and
▪
the rating of Altria Group, Inc.’s long-term senior unsecured debt by Standard & Poor’s of A or higher.
At
December 31, 2015
, the respective principal 100% owned subsidiaries of Altria Group, Inc. and PM USA were not limited by long-term debt or other agreements in their ability to pay cash dividends or make other distributions with respect to their equity interests.
The following sets forth the condensed consolidating balance sheets as of
December 31, 2015
and
2014
, condensed consolidating statements of earnings and comprehensive earnings for the years ended
December 31, 2015
,
2014
and
2013
, and condensed consolidating statements of cash flows for the years ended
December 31, 2015
,
2014
and
2013
for Altria Group, Inc., PM USA and, collectively, Altria Group, Inc.’s other subsidiaries that are not guarantors of Altria Group, Inc.’s debt instruments (the “Non-Guarantor Subsidiaries”). The financial information is based on Altria Group, Inc.’s understanding of the Securities and Exchange Commission (“SEC”) interpretation and application of Rule 3-10 of SEC Regulation S-X.
The financial information may not necessarily be indicative of results of operations or financial position had PM USA and the Non-Guarantor Subsidiaries operated as independent entities. Altria Group, Inc. and PM USA account for investments in their subsidiaries under the equity method of accounting.
96
Altria Group, Inc. and Subsidiaries
Notes to Consolidated Financial Statements
_________________________
Condensed Consolidating Balance Sheets
(in millions of dollars)
____________________________
|
at December 31, 2015
|
Altria
Group, Inc.
|
|
PM USA
|
|
Non-
Guarantor
Subsidiaries
|
|
Total
Consolidating
Adjustments
|
|
Consolidated
|
|
|||||||||
|
Assets
|
|||||||||||||||||||
|
Cash and cash equivalents
|
$
|
2,313
|
|
$
|
—
|
|
$
|
56
|
|
$
|
—
|
|
$
|
2,369
|
|
||||
|
Receivables
|
—
|
|
7
|
|
117
|
|
—
|
|
124
|
|
|||||||||
|
Inventories:
|
|||||||||||||||||||
|
Leaf tobacco
|
—
|
|
562
|
|
395
|
|
—
|
|
957
|
|
|||||||||
|
Other raw materials
|
—
|
|
123
|
|
58
|
|
—
|
|
181
|
|
|||||||||
|
Work in process
|
—
|
|
5
|
|
439
|
|
—
|
|
444
|
|
|||||||||
|
Finished product
|
—
|
|
121
|
|
328
|
|
—
|
|
449
|
|
|||||||||
|
—
|
|
811
|
|
1,220
|
|
—
|
|
2,031
|
|
||||||||||
|
Due from Altria Group, Inc. and subsidiaries
|
—
|
|
3,821
|
|
1,807
|
|
(5,628
|
)
|
—
|
|
|||||||||
|
Deferred income taxes
|
—
|
|
1,268
|
|
7
|
|
(100
|
)
|
1,175
|
|
|||||||||
|
Other current assets
|
284
|
|
65
|
|
112
|
|
(74
|
)
|
387
|
|
|||||||||
|
Total current assets
|
2,597
|
|
5,972
|
|
3,319
|
|
(5,802
|
)
|
6,086
|
|
|||||||||
|
Property, plant and equipment, at cost
|
—
|
|
3,102
|
|
1,775
|
|
—
|
|
4,877
|
|
|||||||||
|
Less accumulated depreciation
|
—
|
|
2,157
|
|
738
|
|
—
|
|
2,895
|
|
|||||||||
|
—
|
|
945
|
|
1,037
|
|
—
|
|
1,982
|
|
||||||||||
|
Goodwill
|
—
|
|
—
|
|
5,285
|
|
—
|
|
5,285
|
|
|||||||||
|
Other intangible assets, net
|
—
|
|
2
|
|
12,026
|
|
—
|
|
12,028
|
|
|||||||||
|
Investment in SABMiller
|
5,483
|
|
—
|
|
—
|
|
—
|
|
5,483
|
|
|||||||||
|
Investment in consolidated subsidiaries
|
11,648
|
|
2,715
|
|
—
|
|
(14,363
|
)
|
—
|
|
|||||||||
|
Finance assets, net
|
—
|
|
—
|
|
1,239
|
|
—
|
|
1,239
|
|
|||||||||
|
Due from Altria Group, Inc. and subsidiaries
|
4,790
|
|
—
|
|
—
|
|
(4,790
|
)
|
—
|
|
|||||||||
|
Other assets
|
92
|
|
536
|
|
131
|
|
(327
|
)
|
432
|
|
|||||||||
|
Total Assets
|
$
|
24,610
|
|
$
|
10,170
|
|
$
|
23,037
|
|
$
|
(25,282
|
)
|
$
|
32,535
|
|
||||
97
Altria Group, Inc. and Subsidiaries
Notes to Consolidated Financial Statements
_________________________
Condensed Consolidating Balance Sheets (Continued)
(in millions of dollars)
____________________________
|
at December 31, 2015
|
Altria
Group, Inc.
|
|
PM USA
|
|
Non-
Guarantor
Subsidiaries
|
|
Total
Consolidating
Adjustments
|
|
Consolidated
|
|
|||||||||
|
Liabilities
|
|||||||||||||||||||
|
Current portion of long-term debt
|
$
|
—
|
|
$
|
—
|
|
$
|
4
|
|
$
|
—
|
|
$
|
4
|
|
||||
|
Accounts payable
|
3
|
|
104
|
|
293
|
|
—
|
|
400
|
|
|||||||||
|
Accrued liabilities:
|
|||||||||||||||||||
|
Marketing
|
—
|
|
586
|
|
109
|
|
—
|
|
695
|
|
|||||||||
|
Employment costs
|
18
|
|
11
|
|
169
|
|
—
|
|
198
|
|
|||||||||
|
Settlement charges
|
—
|
|
3,585
|
|
5
|
|
—
|
|
3,590
|
|
|||||||||
|
Other
|
354
|
|
616
|
|
285
|
|
(174
|
)
|
1,081
|
|
|||||||||
|
Dividends payable
|
1,110
|
|
—
|
|
—
|
|
—
|
|
1,110
|
|
|||||||||
|
Due to Altria Group, Inc. and subsidiaries
|
5,427
|
|
191
|
|
10
|
|
(5,628
|
)
|
—
|
|
|||||||||
|
Total current liabilities
|
6,912
|
|
5,093
|
|
875
|
|
(5,802
|
)
|
7,078
|
|
|||||||||
|
Long-term debt
|
12,903
|
|
—
|
|
12
|
|
—
|
|
12,915
|
|
|||||||||
|
Deferred income taxes
|
1,547
|
|
—
|
|
4,443
|
|
(327
|
)
|
5,663
|
|
|||||||||
|
Accrued pension costs
|
215
|
|
—
|
|
1,062
|
|
—
|
|
1,277
|
|
|||||||||
|
Accrued postretirement health care costs
|
—
|
|
1,460
|
|
785
|
|
—
|
|
2,245
|
|
|||||||||
|
Due to Altria Group, Inc. and subsidiaries
|
—
|
|
—
|
|
4,790
|
|
(4,790
|
)
|
—
|
|
|||||||||
|
Other liabilities
|
153
|
|
126
|
|
168
|
|
—
|
|
447
|
|
|||||||||
|
Total Liabilities
|
21,730
|
|
6,679
|
|
12,135
|
|
(10,919
|
)
|
29,625
|
|
|||||||||
|
Contingencies
|
|
|
|
|
|
||||||||||||||
|
Redeemable noncontrolling interest
|
—
|
|
—
|
|
37
|
|
—
|
|
37
|
|
|||||||||
|
Stockholders’ Equity
|
|||||||||||||||||||
|
Common stock
|
935
|
|
—
|
|
9
|
|
(9
|
)
|
935
|
|
|||||||||
|
Additional paid-in capital
|
5,813
|
|
3,310
|
|
11,456
|
|
(14,766
|
)
|
5,813
|
|
|||||||||
|
Earnings reinvested in the business
|
27,257
|
|
436
|
|
1,099
|
|
(1,535
|
)
|
27,257
|
|
|||||||||
|
Accumulated other comprehensive losses
|
(3,280
|
)
|
(255
|
)
|
(1,692
|
)
|
1,947
|
|
(3,280
|
)
|
|||||||||
|
Cost of repurchased stock
|
(27,845
|
)
|
—
|
|
—
|
|
—
|
|
(27,845
|
)
|
|||||||||
|
Total stockholders’ equity attributable to Altria Group, Inc.
|
2,880
|
|
3,491
|
|
10,872
|
|
(14,363
|
)
|
2,880
|
|
|||||||||
|
Noncontrolling interests
|
—
|
|
—
|
|
(7
|
)
|
—
|
|
(7
|
)
|
|||||||||
|
Total stockholders’ equity
|
2,880
|
|
3,491
|
|
10,865
|
|
(14,363
|
)
|
2,873
|
|
|||||||||
|
Total Liabilities and Stockholders’ Equity
|
$
|
24,610
|
|
$
|
10,170
|
|
$
|
23,037
|
|
$
|
(25,282
|
)
|
$
|
32,535
|
|
||||
98
Altria Group, Inc. and Subsidiaries
Notes to Consolidated Financial Statements
_________________________
Condensed Consolidating Balance Sheets
(in millions of dollars)
____________________________
|
at December 31, 2014
|
Altria
Group, Inc.
|
|
PM USA
|
|
Non-
Guarantor
Subsidiaries
|
|
Total
Consolidating
Adjustments
|
|
Consolidated
|
|
|||||||||
|
Assets
|
|||||||||||||||||||
|
Cash and cash equivalents
|
$
|
3,281
|
|
$
|
3
|
|
$
|
37
|
|
$
|
—
|
|
$
|
3,321
|
|
||||
|
Receivables
|
—
|
|
6
|
|
118
|
|
—
|
|
124
|
|
|||||||||
|
Inventories:
|
|||||||||||||||||||
|
Leaf tobacco
|
—
|
|
616
|
|
375
|
|
—
|
|
991
|
|
|||||||||
|
Other raw materials
|
—
|
|
132
|
|
68
|
|
—
|
|
200
|
|
|||||||||
|
Work in process
|
—
|
|
4
|
|
425
|
|
—
|
|
429
|
|
|||||||||
|
Finished product
|
—
|
|
134
|
|
286
|
|
—
|
|
420
|
|
|||||||||
|
—
|
|
|
886
|
|
|
1,154
|
|
|
—
|
|
|
2,040
|
|
||||||
|
Due from Altria Group, Inc. and subsidiaries
|
568
|
|
3,535
|
|
1,279
|
|
(5,382
|
)
|
—
|
|
|||||||||
|
Deferred income taxes
|
—
|
|
1,190
|
|
9
|
|
(56
|
)
|
1,143
|
|
|||||||||
|
Other current assets
|
54
|
|
101
|
|
122
|
|
(27
|
)
|
250
|
|
|||||||||
|
Total current assets
|
3,903
|
|
5,721
|
|
2,719
|
|
(5,465
|
)
|
6,878
|
|
|||||||||
|
Property, plant and equipment, at cost
|
—
|
|
3,112
|
|
1,643
|
|
—
|
|
4,755
|
|
|||||||||
|
Less accumulated depreciation
|
—
|
|
2,091
|
|
681
|
|
—
|
|
2,772
|
|
|||||||||
|
—
|
|
1,021
|
|
962
|
|
—
|
|
1,983
|
|
||||||||||
|
Goodwill
|
—
|
|
—
|
|
5,285
|
|
—
|
|
5,285
|
|
|||||||||
|
Other intangible assets, net
|
—
|
|
2
|
|
12,047
|
|
—
|
|
12,049
|
|
|||||||||
|
Investment in SABMiller
|
6,183
|
|
—
|
|
—
|
|
—
|
|
6,183
|
|
|||||||||
|
Investment in consolidated subsidiaries
|
10,665
|
|
2,775
|
|
—
|
|
(13,440
|
)
|
—
|
|
|||||||||
|
Finance assets, net
|
—
|
|
—
|
|
1,614
|
|
—
|
|
1,614
|
|
|||||||||
|
Due from Altria Group, Inc. and subsidiaries
|
4,790
|
|
—
|
|
—
|
|
(4,790
|
)
|
—
|
|
|||||||||
|
Other assets
|
148
|
|
541
|
|
121
|
|
(327
|
)
|
483
|
|
|||||||||
|
Total Assets
|
$
|
25,689
|
|
$
|
10,060
|
|
$
|
22,748
|
|
$
|
(24,022
|
)
|
$
|
34,475
|
|
||||
99
Altria Group, Inc. and Subsidiaries
Notes to Consolidated Financial Statements
_________________________
Condensed Consolidating Balance Sheets (Continued)
(in millions of dollars)
____________________________
|
at December 31, 2014
|
Altria
Group, Inc.
|
|
PM USA
|
|
Non-
Guarantor
Subsidiaries
|
|
Total
Consolidating
Adjustments
|
|
Consolidated
|
|
|||||||||
|
Liabilities
|
|||||||||||||||||||
|
Current portion of long-term debt
|
$
|
1,000
|
|
$
|
—
|
|
$
|
—
|
|
$
|
—
|
|
$
|
1,000
|
|
||||
|
Accounts payable
|
18
|
|
118
|
|
280
|
|
—
|
|
416
|
|
|||||||||
|
Accrued liabilities:
|
|||||||||||||||||||
|
Marketing
|
—
|
|
505
|
|
113
|
|
—
|
|
618
|
|
|||||||||
|
Employment costs
|
18
|
|
10
|
|
158
|
|
—
|
|
186
|
|
|||||||||
|
Settlement charges
|
—
|
|
3,495
|
|
5
|
|
—
|
|
3,500
|
|
|||||||||
|
Other
|
321
|
|
400
|
|
287
|
|
(83
|
)
|
925
|
|
|||||||||
|
Dividends payable
|
1,028
|
|
—
|
|
—
|
|
—
|
|
1,028
|
|
|||||||||
|
Due to Altria Group, Inc. and subsidiaries
|
4,414
|
|
402
|
|
566
|
|
(5,382
|
)
|
—
|
|
|||||||||
|
Total current liabilities
|
6,799
|
|
4,930
|
|
1,409
|
|
(5,465
|
)
|
7,673
|
|
|||||||||
|
Long-term debt
|
13,693
|
|
—
|
|
—
|
|
—
|
|
13,693
|
|
|||||||||
|
Deferred income taxes
|
1,754
|
|
—
|
|
4,661
|
|
(327
|
)
|
6,088
|
|
|||||||||
|
Accrued pension costs
|
233
|
|
—
|
|
779
|
|
—
|
|
1,012
|
|
|||||||||
|
Accrued postretirement health care costs
|
—
|
|
1,608
|
|
853
|
|
—
|
|
2,461
|
|
|||||||||
|
Due to Altria Group, Inc. and subsidiaries
|
—
|
|
—
|
|
4,790
|
|
(4,790
|
)
|
—
|
|
|||||||||
|
Other liabilities
|
196
|
|
151
|
|
156
|
|
—
|
|
503
|
|
|||||||||
|
Total Liabilities
|
22,675
|
|
6,689
|
|
12,648
|
|
(10,582
|
)
|
31,430
|
|
|||||||||
|
Contingencies
|
|
|
|
|
|
||||||||||||||
|
Redeemable noncontrolling interest
|
—
|
|
—
|
|
35
|
|
—
|
|
35
|
|
|||||||||
|
Stockholders’ Equity
|
|||||||||||||||||||
|
Common stock
|
935
|
|
—
|
|
9
|
|
(9
|
)
|
935
|
|
|||||||||
|
Additional paid-in capital
|
5,735
|
|
3,310
|
|
10,688
|
|
(13,998
|
)
|
5,735
|
|
|||||||||
|
Earnings reinvested in the business
|
26,277
|
|
402
|
|
995
|
|
(1,397
|
)
|
26,277
|
|
|||||||||
|
Accumulated other comprehensive losses
|
(2,682
|
)
|
(341
|
)
|
(1,623
|
)
|
1,964
|
|
(2,682
|
)
|
|||||||||
|
Cost of repurchased stock
|
(27,251
|
)
|
—
|
|
—
|
|
—
|
|
(27,251
|
)
|
|||||||||
|
Total stockholders’ equity attributable to Altria Group, Inc.
|
3,014
|
|
3,371
|
|
10,069
|
|
(13,440
|
)
|
3,014
|
|
|||||||||
|
Noncontrolling interests
|
—
|
|
—
|
|
(4
|
)
|
—
|
|
(4
|
)
|
|||||||||
|
Total stockholders’ equity
|
3,014
|
|
3,371
|
|
10,065
|
|
(13,440
|
)
|
3,010
|
|
|||||||||
|
Total Liabilities and Stockholders’ Equity
|
$
|
25,689
|
|
$
|
10,060
|
|
$
|
22,748
|
|
$
|
(24,022
|
)
|
$
|
34,475
|
|
||||
100
Altria Group, Inc. and Subsidiaries
Notes to Consolidated Financial Statements
_________________________
Condensed Consolidating Statements of Earnings and Comprehensive Earnings
(in millions of dollars)
_____________________________
|
for the year ended December 31, 2015
|
Altria
Group, Inc.
|
|
PM USA
|
|
Non-
Guarantor
Subsidiaries
|
|
Total
Consolidating
Adjustments
|
|
Consolidated
|
|
|||||||||
|
Net revenues
|
$
|
—
|
|
$
|
22,133
|
|
$
|
3,342
|
|
$
|
(41
|
)
|
$
|
25,434
|
|
||||
|
Cost of sales
|
—
|
|
6,664
|
|
1,117
|
|
(41
|
)
|
7,740
|
|
|||||||||
|
Excise taxes on products
|
—
|
|
6,369
|
|
211
|
|
—
|
|
6,580
|
|
|||||||||
|
Gross profit
|
—
|
|
9,100
|
|
2,014
|
|
—
|
|
11,114
|
|
|||||||||
|
Marketing, administration and research costs
|
189
|
|
2,094
|
|
425
|
|
—
|
|
2,708
|
|
|||||||||
|
Changes to Mondelēz & PMI tax-related receivables/payables
|
41
|
|
—
|
|
—
|
|
—
|
|
41
|
|
|||||||||
|
Asset impairment and exit costs
|
—
|
|
—
|
|
4
|
|
—
|
|
4
|
|
|||||||||
|
Operating (expense) income
|
(230
|
)
|
7,006
|
|
1,585
|
|
—
|
|
8,361
|
|
|||||||||
|
Interest and other debt expense, net
|
560
|
|
33
|
|
224
|
|
—
|
|
817
|
|
|||||||||
|
Loss on early extinguishment of debt
|
228
|
|
—
|
|
—
|
|
—
|
|
228
|
|
|||||||||
|
Earnings from equity investment in SABMiller
|
(757
|
)
|
—
|
|
—
|
|
—
|
|
(757
|
)
|
|||||||||
|
Other income, net
|
(5
|
)
|
—
|
|
—
|
|
—
|
|
(5
|
)
|
|||||||||
|
(Loss) Earnings before income taxes and equity earnings of subsidiaries
|
(256
|
)
|
6,973
|
|
1,361
|
|
—
|
|
8,078
|
|
|||||||||
|
(Benefit) provision for income taxes
|
(184
|
)
|
2,536
|
|
483
|
|
—
|
|
2,835
|
|
|||||||||
|
Equity earnings of subsidiaries
|
5,313
|
|
268
|
|
—
|
|
(5,581
|
)
|
—
|
|
|||||||||
|
Net earnings
|
5,241
|
|
4,705
|
|
878
|
|
(5,581
|
)
|
5,243
|
|
|||||||||
|
Net earnings attributable to noncontrolling interests
|
—
|
|
—
|
|
(2
|
)
|
—
|
|
(2
|
)
|
|||||||||
|
Net earnings attributable to Altria Group, Inc.
|
$
|
5,241
|
|
$
|
4,705
|
|
$
|
876
|
|
$
|
(5,581
|
)
|
$
|
5,241
|
|
||||
|
Net earnings
|
$
|
5,241
|
|
$
|
4,705
|
|
$
|
878
|
|
$
|
(5,581
|
)
|
$
|
5,243
|
|
||||
|
Other comprehensive (losses) earnings, net of deferred income taxes
|
(598
|
)
|
86
|
|
(69
|
)
|
(17
|
)
|
(598
|
)
|
|||||||||
|
Comprehensive earnings
|
4,643
|
|
4,791
|
|
809
|
|
(5,598
|
)
|
4,645
|
|
|||||||||
|
Comprehensive earnings attributable to noncontrolling interests
|
—
|
|
—
|
|
(2
|
)
|
—
|
|
(2
|
)
|
|||||||||
|
Comprehensive earnings attributable to
Altria Group, Inc.
|
$
|
4,643
|
|
$
|
4,791
|
|
$
|
807
|
|
$
|
(5,598
|
)
|
$
|
4,643
|
|
||||
101
Altria Group, Inc. and Subsidiaries
Notes to Consolidated Financial Statements
_________________________
Condensed Consolidating Statements of Earnings and Comprehensive Earnings
(in millions of dollars)
_____________________________
|
for the year ended December 31, 2014
|
Altria
Group, Inc.
|
|
PM USA
|
|
Non-
Guarantor
Subsidiaries
|
|
Total
Consolidating
Adjustments
|
|
Consolidated
|
|
|||||||||
|
Net revenues
|
$
|
—
|
|
$
|
21,298
|
|
$
|
3,267
|
|
$
|
(43
|
)
|
$
|
24,522
|
|
||||
|
Cost of sales
|
—
|
|
6,722
|
|
1,106
|
|
(43
|
)
|
7,785
|
|
|||||||||
|
Excise taxes on products
|
—
|
|
6,358
|
|
219
|
|
—
|
|
6,577
|
|
|||||||||
|
Gross profit
|
—
|
|
8,218
|
|
1,942
|
|
—
|
|
10,160
|
|
|||||||||
|
Marketing, administration and research costs
|
231
|
|
1,889
|
|
419
|
|
—
|
|
2,539
|
|
|||||||||
|
Changes to Mondelēz and PMI tax-related receivables/payables
|
2
|
|
—
|
|
—
|
|
—
|
|
2
|
|
|||||||||
|
Asset impairment and exit costs
|
—
|
|
(6
|
)
|
5
|
|
—
|
|
(1
|
)
|
|||||||||
|
Operating (expense) income
|
(233
|
)
|
6,335
|
|
1,518
|
|
—
|
|
7,620
|
|
|||||||||
|
Interest and other debt expense (income), net
|
614
|
|
(46
|
)
|
240
|
|
—
|
|
808
|
|
|||||||||
|
Loss on early extinguishment of debt
|
—
|
|
—
|
|
44
|
|
—
|
|
44
|
|
|||||||||
|
Earnings from equity investment in SABMiller
|
(1,006
|
)
|
—
|
|
—
|
|
—
|
|
(1,006
|
)
|
|||||||||
|
Earnings before income taxes and equity earnings of subsidiaries
|
159
|
|
6,381
|
|
1,234
|
|
—
|
|
7,774
|
|
|||||||||
|
(Benefit) provision for income taxes
|
(119
|
)
|
2,381
|
|
442
|
|
—
|
|
2,704
|
|
|||||||||
|
Equity earnings of subsidiaries
|
4,792
|
|
244
|
|
—
|
|
(5,036
|
)
|
—
|
|
|||||||||
|
Net earnings
|
5,070
|
|
4,244
|
|
792
|
|
(5,036
|
)
|
5,070
|
|
|||||||||
|
Net earnings attributable to noncontrolling interests
|
—
|
|
—
|
|
—
|
|
—
|
|
—
|
|
|||||||||
|
Net earnings attributable to Altria Group, Inc.
|
$
|
5,070
|
|
$
|
4,244
|
|
$
|
792
|
|
$
|
(5,036
|
)
|
$
|
5,070
|
|
||||
|
Net earnings
|
$
|
5,070
|
|
$
|
4,244
|
|
$
|
792
|
|
$
|
(5,036
|
)
|
$
|
5,070
|
|
||||
|
Other comprehensive losses, net of deferred
income taxes
|
(1,304
|
)
|
(110
|
)
|
(642
|
)
|
752
|
|
(1,304
|
)
|
|||||||||
|
Comprehensive earnings
|
3,766
|
|
4,134
|
|
150
|
|
(4,284
|
)
|
3,766
|
|
|||||||||
|
Comprehensive earnings attributable to noncontrolling interests
|
—
|
|
—
|
|
—
|
|
—
|
|
—
|
|
|||||||||
|
Comprehensive earnings attributable to
Altria Group, Inc.
|
$
|
3,766
|
|
$
|
4,134
|
|
$
|
150
|
|
$
|
(4,284
|
)
|
$
|
3,766
|
|
||||
102
Altria Group, Inc. and Subsidiaries
Notes to Consolidated Financial Statements
_________________________
Condensed Consolidating Statements of Earnings and Comprehensive Earnings
(in millions of dollars)
_____________________________
|
for the year ended December 31, 2013
|
Altria
Group, Inc.
|
|
PM USA
|
|
Non-
Guarantor
Subsidiaries
|
|
Total
Consolidating
Adjustments
|
|
Consolidated
|
|
|||||||||
|
Net revenues
|
$
|
—
|
|
$
|
21,231
|
|
$
|
3,269
|
|
$
|
(34
|
)
|
$
|
24,466
|
|
||||
|
Cost of sales
|
—
|
|
6,281
|
|
959
|
|
(34
|
)
|
7,206
|
|
|||||||||
|
Excise taxes on products
|
—
|
|
6,553
|
|
250
|
|
—
|
|
6,803
|
|
|||||||||
|
Gross profit
|
—
|
|
8,397
|
|
2,060
|
|
—
|
|
10,457
|
|
|||||||||
|
Marketing, administration and research costs
|
223
|
|
1,837
|
|
280
|
|
—
|
|
2,340
|
|
|||||||||
|
Changes to Mondelēz and PMI tax-related receivables/payables
|
25
|
|
(3
|
)
|
—
|
|
—
|
|
22
|
|
|||||||||
|
Asset impairment and exit costs
|
—
|
|
3
|
|
8
|
|
—
|
|
11
|
|
|||||||||
|
Operating (expense) income
|
(248
|
)
|
6,560
|
|
1,772
|
|
—
|
|
8,084
|
|
|||||||||
|
Interest and other debt expense, net
|
643
|
|
2
|
|
404
|
|
—
|
|
1,049
|
|
|||||||||
|
Loss on early extinguishment of debt
|
1,084
|
|
—
|
|
—
|
|
—
|
|
1,084
|
|
|||||||||
|
Earnings from equity investment in SABMiller
|
(991
|
)
|
—
|
|
—
|
|
—
|
|
(991
|
)
|
|||||||||
|
(Loss) earnings before income taxes and equity earnings of subsidiaries
|
(984
|
)
|
6,558
|
|
1,368
|
|
—
|
|
6,942
|
|
|||||||||
|
(Benefit) provision for income taxes
|
(488
|
)
|
2,406
|
|
489
|
|
—
|
|
2,407
|
|
|||||||||
|
Equity earnings of subsidiaries
|
5,031
|
|
216
|
|
—
|
|
(5,247
|
)
|
—
|
|
|||||||||
|
Net earnings
|
4,535
|
|
4,368
|
|
879
|
|
(5,247
|
)
|
4,535
|
|
|||||||||
|
Net earnings attributable to noncontrolling interests
|
—
|
|
—
|
|
—
|
|
—
|
|
—
|
|
|||||||||
|
Net earnings attributable to Altria Group, Inc.
|
$
|
4,535
|
|
$
|
4,368
|
|
$
|
879
|
|
$
|
(5,247
|
)
|
$
|
4,535
|
|
||||
|
Net earnings
|
$
|
4,535
|
|
$
|
4,368
|
|
$
|
879
|
|
$
|
(5,247
|
)
|
$
|
4,535
|
|
||||
|
Other comprehensive earnings, net of deferred
income taxes
|
662
|
|
198
|
|
910
|
|
(1,108
|
)
|
662
|
|
|||||||||
|
Comprehensive earnings
|
5,197
|
|
4,566
|
|
1,789
|
|
(6,355
|
)
|
5,197
|
|
|||||||||
|
Comprehensive earnings attributable to noncontrolling interests
|
—
|
|
—
|
|
—
|
|
—
|
|
—
|
|
|||||||||
|
Comprehensive earnings attributable to
Altria Group, Inc.
|
$
|
5,197
|
|
$
|
4,566
|
|
$
|
1,789
|
|
$
|
(6,355
|
)
|
$
|
5,197
|
|
||||
103
Altria Group, Inc. and Subsidiaries
Notes to Consolidated Financial Statements
_________________________
Condensed Consolidating Statements of Cash Flows
(in millions of dollars)
_____________________________
|
for the year ended December 31, 2015
|
Altria
Group, Inc.
|
|
PM USA
|
|
Non-
Guarantor
Subsidiaries
|
|
Total
Consolidating
Adjustments
|
|
Consolidated
|
|
|||||||||
|
Cash Provided by Operating Activities
|
|||||||||||||||||||
|
Net cash provided by operating activities
|
$
|
5,085
|
|
$
|
5,204
|
|
$
|
961
|
|
$
|
(5,440
|
)
|
$
|
5,810
|
|
||||
|
Cash Provided by (Used in) Investing Activities
|
|||||||||||||||||||
|
Capital expenditures
|
—
|
|
(51
|
)
|
(178
|
)
|
—
|
|
(229
|
)
|
|||||||||
|
Proceeds from finance assets
|
—
|
|
—
|
|
354
|
|
—
|
|
354
|
|
|||||||||
|
Payment for derivative financial instrument
|
(132
|
)
|
—
|
|
—
|
|
—
|
|
(132
|
)
|
|||||||||
|
Other
|
—
|
|
10
|
|
(18
|
)
|
—
|
|
(8
|
)
|
|||||||||
|
Net cash (used in) provided by investing activities
|
(132
|
)
|
(41
|
)
|
158
|
|
—
|
|
(15
|
)
|
|||||||||
|
Cash Provided by (Used in) Financing Activities
|
|||||||||||||||||||
|
Long-term debt repaid
|
(1,793
|
)
|
—
|
|
—
|
|
—
|
|
(1,793
|
)
|
|||||||||
|
Repurchases of common stock
|
(554
|
)
|
—
|
|
—
|
|
—
|
|
(554
|
)
|
|||||||||
|
Dividends paid on common stock
|
(4,179
|
)
|
—
|
|
—
|
|
—
|
|
(4,179
|
)
|
|||||||||
|
Changes in amounts due to/from Altria Group, Inc.
and subsidiaries
|
814
|
|
(495
|
)
|
(319
|
)
|
—
|
|
—
|
|
|||||||||
|
Premiums and fees related to early extinguishment of debt
|
(226
|
)
|
—
|
|
—
|
|
—
|
|
(226
|
)
|
|||||||||
|
Cash dividends paid to parent
|
—
|
|
(4,671
|
)
|
(769
|
)
|
5,440
|
|
—
|
|
|||||||||
|
Other
|
17
|
|
—
|
|
(12
|
)
|
—
|
|
5
|
|
|||||||||
|
Net cash used in financing activities
|
(5,921
|
)
|
(5,166
|
)
|
(1,100
|
)
|
5,440
|
|
(6,747
|
)
|
|||||||||
|
Cash and cash equivalents:
|
|||||||||||||||||||
|
(Decrease) increase
|
(968
|
)
|
(3
|
)
|
19
|
|
—
|
|
(952
|
)
|
|||||||||
|
Balance at beginning of year
|
3,281
|
|
3
|
|
37
|
|
—
|
|
3,321
|
|
|||||||||
|
Balance at end of year
|
$
|
2,313
|
|
$
|
—
|
|
$
|
56
|
|
$
|
—
|
|
$
|
2,369
|
|
||||
104
Altria Group, Inc. and Subsidiaries
Notes to Consolidated Financial Statements
_________________________
Condensed Consolidating Statements of Cash Flows
(in millions of dollars)
_____________________________
|
for the year ended December 31, 2014
|
Altria
Group, Inc.
|
|
PM USA
|
|
Non-
Guarantor
Subsidiaries
|
|
Total
Consolidating
Adjustments
|
|
Consolidated
|
|
|||||||||
|
Cash Provided by Operating Activities
|
|||||||||||||||||||
|
Net cash provided by operating activities
|
$
|
4,924
|
|
$
|
4,451
|
|
$
|
707
|
|
$
|
(5,419
|
)
|
$
|
4,663
|
|
||||
|
Cash Provided by (Used in) Investing Activities
|
|||||||||||||||||||
|
Capital expenditures
|
—
|
|
(44
|
)
|
(119
|
)
|
—
|
|
(163
|
)
|
|||||||||
|
Acquisition of Green Smoke, net of acquired cash
|
—
|
|
—
|
|
(102
|
)
|
—
|
|
(102
|
)
|
|||||||||
|
Proceeds from finance assets
|
—
|
|
—
|
|
369
|
|
—
|
|
369
|
|
|||||||||
|
Other
|
—
|
|
70
|
|
3
|
|
—
|
|
73
|
|
|||||||||
|
Net cash provided by investing activities
|
—
|
|
26
|
|
151
|
|
—
|
|
177
|
|
|||||||||
|
Cash Provided by (Used in) Financing Activities
|
|||||||||||||||||||
|
Long-term debt issued
|
999
|
|
—
|
|
—
|
|
—
|
|
999
|
|
|||||||||
|
Long-term debt repaid
|
(525
|
)
|
—
|
|
(300
|
)
|
—
|
|
(825
|
)
|
|||||||||
|
Repurchases of common stock
|
(939
|
)
|
—
|
|
—
|
|
—
|
|
(939
|
)
|
|||||||||
|
Dividends paid on common stock
|
(3,892
|
)
|
—
|
|
—
|
|
—
|
|
(3,892
|
)
|
|||||||||
|
Changes in amounts due to/from Altria Group, Inc.
and subsidiaries
|
(411
|
)
|
(351
|
)
|
762
|
|
—
|
|
—
|
|
|||||||||
|
Premiums and fees related to early extinguishment of debt
|
—
|
|
—
|
|
(44
|
)
|
—
|
|
(44
|
)
|
|||||||||
|
Cash dividends paid to parent
|
—
|
|
(4,124
|
)
|
(1,295
|
)
|
5,419
|
|
—
|
|
|||||||||
|
Other
|
11
|
|
—
|
|
(4
|
)
|
—
|
|
7
|
|
|||||||||
|
Net cash used in financing activities
|
(4,757
|
)
|
(4,475
|
)
|
(881
|
)
|
5,419
|
|
(4,694
|
)
|
|||||||||
|
Cash and cash equivalents:
|
|||||||||||||||||||
|
Increase (decrease)
|
167
|
|
2
|
|
(23
|
)
|
—
|
|
146
|
|
|||||||||
|
Balance at beginning of year
|
3,114
|
|
1
|
|
60
|
|
—
|
|
3,175
|
|
|||||||||
|
Balance at end of year
|
$
|
3,281
|
|
$
|
3
|
|
$
|
37
|
|
$
|
—
|
|
$
|
3,321
|
|
||||
105
Altria Group, Inc. and Subsidiaries
Notes to Consolidated Financial Statements
_________________________
Condensed Consolidating Statements of Cash Flows
(in millions of dollars)
_____________________________
|
for the year ended December 31, 2013
|
Altria
Group, Inc.
|
|
PM USA
|
|
Non-
Guarantor
Subsidiaries
|
|
Total
Consolidating
Adjustments
|
|
Consolidated
|
|
|||||||||
|
Cash Provided by Operating Activities
|
|||||||||||||||||||
|
Net cash provided by operating activities
|
$
|
4,520
|
|
$
|
4,192
|
|
$
|
387
|
|
$
|
(4,724
|
)
|
$
|
4,375
|
|
||||
|
Cash Provided by (Used in) Investing Activities
|
|||||||||||||||||||
|
Capital expenditures
|
—
|
|
(31
|
)
|
(100
|
)
|
—
|
|
(131
|
)
|
|||||||||
|
Proceeds from finance assets
|
—
|
|
—
|
|
716
|
|
—
|
|
716
|
|
|||||||||
|
Other
|
—
|
|
—
|
|
17
|
|
—
|
|
17
|
|
|||||||||
|
Net cash (used in) provided by investing activities
|
—
|
|
(31
|
)
|
633
|
|
—
|
|
602
|
|
|||||||||
|
Cash Provided by (Used in) Financing Activities
|
|||||||||||||||||||
|
Long-term debt issued
|
4,179
|
|
—
|
|
—
|
|
—
|
|
4,179
|
|
|||||||||
|
Long-term debt repaid
|
(3,559
|
)
|
—
|
|
—
|
|
—
|
|
(3,559
|
)
|
|||||||||
|
Repurchases of common stock
|
(634
|
)
|
—
|
|
—
|
|
—
|
|
(634
|
)
|
|||||||||
|
Dividends paid on common stock
|
(3,612
|
)
|
—
|
|
—
|
|
—
|
|
(3,612
|
)
|
|||||||||
|
Changes in amounts due to/from Altria Group, Inc. and subsidiaries
|
432
|
|
240
|
|
(672
|
)
|
—
|
|
—
|
|
|||||||||
|
Premiums and fees related to early extinguishment of debt
|
(1,054
|
)
|
—
|
|
—
|
|
—
|
|
(1,054
|
)
|
|||||||||
|
Cash dividends paid to parent
|
—
|
|
(4,400
|
)
|
(324
|
)
|
4,724
|
|
—
|
|
|||||||||
|
Other
|
(20
|
)
|
—
|
|
(2
|
)
|
—
|
|
(22
|
)
|
|||||||||
|
Net cash used in financing activities
|
(4,268
|
)
|
(4,160
|
)
|
(998
|
)
|
4,724
|
|
(4,702
|
)
|
|||||||||
|
Cash and cash equivalents:
|
|||||||||||||||||||
|
Increase
|
252
|
|
1
|
|
22
|
|
—
|
|
275
|
|
|||||||||
|
Balance at beginning of year
|
2,862
|
|
—
|
|
38
|
|
—
|
|
2,900
|
|
|||||||||
|
Balance at end of year
|
$
|
3,114
|
|
$
|
1
|
|
$
|
60
|
|
$
|
—
|
|
$
|
3,175
|
|
||||
106
Altria Group, Inc. and Subsidiaries
Notes to Consolidated Financial Statements
_________________________
Note 20
. Quarterly Financial Data (Unaudited)
|
|
2015 Quarters
|
||||||||||||||
|
(in millions, except per share data)
|
1st
|
|
2nd
|
|
3rd
|
|
4th
|
|
|||||||
|
Net revenues
|
$
|
5,804
|
|
$
|
6,613
|
|
$
|
6,699
|
|
$
|
6,318
|
|
|||
|
Gross profit
|
$
|
2,475
|
|
$
|
2,871
|
|
$
|
3,046
|
|
$
|
2,722
|
|
|||
|
Net earnings
|
$
|
1,018
|
|
$
|
1,449
|
|
$
|
1,528
|
|
$
|
1,248
|
|
|||
|
Net earnings attributable to Altria Group, Inc.
|
$
|
1,018
|
|
$
|
1,448
|
|
$
|
1,528
|
|
$
|
1,247
|
|
|||
|
Per share data:
|
|
|
|
|
|||||||||||
|
Basic and diluted EPS attributable to Altria Group, Inc.
|
$
|
0.52
|
|
$
|
0.74
|
|
$
|
0.78
|
|
$
|
0.64
|
|
|||
|
2014 Quarters
|
|||||||||||||||
|
(in millions, except per share data)
|
1st
|
|
2nd
|
|
3rd
|
|
4th
|
|
|||||||
|
Net revenues
|
$
|
5,517
|
|
$
|
6,256
|
|
$
|
6,491
|
|
$
|
6,258
|
|
|||
|
Gross profit
|
$
|
2,256
|
|
$
|
2,603
|
|
$
|
2,674
|
|
$
|
2,627
|
|
|||
|
Net earnings
|
$
|
1,175
|
|
$
|
1,262
|
|
$
|
1,397
|
|
$
|
1,236
|
|
|||
|
Net earnings attributable to Altria Group, Inc.
|
$
|
1,175
|
|
$
|
1,262
|
|
$
|
1,397
|
|
$
|
1,236
|
|
|||
|
Per share data:
|
|
|
|
|
|||||||||||
|
Basic and diluted EPS attributable to Altria Group, Inc.
|
$
|
0.59
|
|
$
|
0.64
|
|
$
|
0.71
|
|
$
|
0.63
|
|
|||
During
2015
and
2014
, the following pre-tax charges or (gains) were included in net earnings attributable to Altria Group, Inc.:
|
|
2015 Quarters
|
||||||||||||||
|
(in millions)
|
1st
|
|
2nd
|
|
3rd
|
|
4th
|
|
|||||||
|
NPM Adjustment Items
|
$
|
—
|
|
$
|
—
|
|
$
|
(126
|
)
|
$
|
42
|
|
|||
|
Tobacco and health litigation items, including accrued interest
|
43
|
|
5
|
|
67
|
|
35
|
|
|||||||
|
Asset impairment, exit and integration costs
|
—
|
|
7
|
|
1
|
|
3
|
|
|||||||
|
Loss on early extinguishment of debt
|
228
|
|
—
|
|
—
|
|
—
|
|
|||||||
|
Other income, net
|
—
|
|
—
|
|
—
|
|
(5
|
)
|
|||||||
|
SABMiller special items
|
86
|
|
2
|
|
8
|
|
30
|
|
|||||||
|
$
|
357
|
|
$
|
14
|
|
$
|
(50
|
)
|
|
$
|
105
|
|
|||
|
2014 Quarters
|
|||||||||||||||
|
(in millions)
|
1st
|
|
2nd
|
|
3rd
|
|
4th
|
|
|||||||
|
NPM Adjustment Items
|
$
|
(64
|
)
|
$
|
(26
|
)
|
$
|
—
|
|
$
|
—
|
|
|||
|
Tobacco and health litigation items, including accrued interest
|
4
|
|
31
|
|
4
|
|
5
|
|
|||||||
|
Asset impairment, exit, integration and acquisition-related costs
|
2
|
|
(1
|
)
|
15
|
|
5
|
|
|||||||
|
Loss on early extinguishment of debt
|
—
|
|
—
|
|
—
|
|
44
|
|
|||||||
|
SABMiller special items
|
9
|
|
23
|
|
(42
|
)
|
35
|
|
|||||||
|
$
|
(49
|
)
|
$
|
27
|
|
$
|
(23
|
)
|
$
|
89
|
|
||||
As discussed in
Note 14
.
Income Taxes
, Altria Group, Inc. has recognized income tax benefits and charges in the consolidated statements of earnings during 2015 and 2014 as a result of various tax events.
Note 21
. Subsequent Event
On January 27, 2016, the Board of Directors approved a productivity initiative designed to maintain Altria Group, Inc.’s operating companies’ leadership and cost competitiveness. The initiative, which will reduce spending on certain selling, general and administrative infrastructure and implement a leaner organizational structure, is expected to deliver approximately
$300 million
in annualized productivity savings by the end of
2017. Altria Group, Inc. estimates total pre-tax restructuring charges in connection with the initiative of approximately
$140 million
, or
$0.05
per share, substantially all of which is expected to be recorded in the first quarter of 2016. The estimated charges, substantially all of which will result in cash expenditures, relate primarily to employee separation costs of approximately
$120 million
and other associated costs of approximately
$20 million
. These estimated charges do not reflect the non-cash impact that may result from pension settlement and curtailment accounting.
107
Report of Independent Registered Public Accounting Firm
To the Board of Directors and
Stockholders of Altria Group, Inc.:
In our opinion, the accompanying consolidated balance sheets and the related consolidated statements of earnings, comprehensive earnings, stockholders’ equity, and cash flows, present fairly, in all material respects, the financial position of Altria Group, Inc. and its subsidiaries at December 31,
2015
and
2014
, and the results of their operations and their cash flows for each of the three years in the period ended December 31,
2015
in conformity with accounting principles generally accepted in the United States of America. Also in our opinion, Altria Group, Inc. maintained, in all material respects, effective internal control over financial reporting as of December 31,
2015
, based on criteria established in Internal Control - Integrated Framework (2013) issued by the Committee of Sponsoring Organizations of the Treadway Commission (COSO). Altria Group, Inc.’s management is responsible for these financial statements, for maintaining effective internal control over financial reporting and for its assessment of the effectiveness of internal control over financial reporting, included in the accompanying Report of Management on Internal Control over Financial Reporting. Our responsibility is to express opinions on these financial statements and on Altria Group, Inc.’s internal control over financial reporting based on our integrated audits. We conducted our audits in accordance with the standards of the Public Company Accounting Oversight Board (United States). Those standards require that we plan and perform the audits to obtain reasonable assurance about whether the financial statements are free of material misstatement and whether effective internal control over financial reporting was maintained in all material respects. Our audits of the financial statements included examining, on a test basis, evidence supporting the amounts and disclosures in the financial statements, assessing the accounting principles used and significant estimates made by management, and evaluating the overall financial statement presentation. Our audit of internal control over financial reporting included obtaining an understanding of internal control over financial reporting, assessing the risk that a material weakness exists, and testing and evaluating the design and operating effectiveness of internal control based on the assessed risk. Our audits also included performing such other procedures as we considered necessary in the circumstances. We believe that our audits provide a reasonable basis for our opinions.
A company’s internal control over financial reporting is a process designed to provide reasonable assurance regarding the reliability of financial reporting and the preparation of financial statements for external purposes in accordance with generally accepted accounting principles. A company’s internal control over financial reporting includes those policies and procedures that (i) pertain to the maintenance of records that, in reasonable detail, accurately and fairly reflect the transactions and dispositions of the assets of the company; (ii) provide reasonable
assurance that transactions are recorded as necessary to permit preparation of financial statements in accordance with generally accepted accounting principles, and that receipts and expenditures of the company are being made only in accordance with authorizations of management and directors of the company; and (iii) provide reasonable assurance regarding prevention or timely detection of unauthorized acquisition, use, or disposition of the company’s assets that could have a material effect on the financial statements.
Because of its inherent limitations, internal control over financial reporting may not prevent or detect misstatements. Also, projections of any evaluation of effectiveness to future periods are subject to the risk that controls may become inadequate because of changes in conditions, or that the degree of compliance with the policies or procedures may deteriorate.
/s/ PricewaterhouseCoopers LLP
Richmond, Virginia
January 28, 2016
108
Report of Management On Internal Control Over Financial Reporting
Management of Altria Group, Inc. is responsible for establishing and maintaining adequate internal control over financial reporting as defined in Rules 13a-15(f) and 15d-15(f) under the Securities Exchange Act of 1934, as amended. Altria Group, Inc.’s internal control over financial reporting is a process designed to provide reasonable assurance regarding the reliability of financial reporting and the preparation of financial statements for external purposes in accordance with accounting principles generally accepted in the United States of America. Internal control over financial reporting includes those written policies and procedures that:
n
pertain to the maintenance of records that, in reasonable detail, accurately and fairly reflect the transactions and dispositions of the assets of Altria Group, Inc.;
n
provide reasonable assurance that transactions are recorded as necessary to permit preparation of financial statements in accordance with accounting principles generally accepted in the United States of America;
n
provide reasonable assurance that receipts and expenditures of Altria Group, Inc. are being made only in accordance with the authorization of management and directors of Altria Group, Inc.; and
n
provide reasonable assurance regarding prevention or timely detection of unauthorized acquisition, use or disposition of assets that could have a material effect on the consolidated financial statements.
Internal control over financial reporting includes the controls themselves, monitoring and internal auditing practices and actions taken to correct deficiencies as identified.
Because of its inherent limitations, internal control over financial reporting may not prevent or detect misstatements. Also, projections of any evaluation of effectiveness to future periods are subject to the risk that controls may become inadequate because of changes in conditions, or that the degree of compliance with the policies or procedures may deteriorate.
Management assessed the effectiveness of Altria Group, Inc.’s internal control over financial reporting as of December 31,
2015
. Management based this assessment on criteria for effective internal control over financial reporting described in Internal Control - Integrated Framework (2013) issued by the Committee of Sponsoring Organizations of the Treadway Commission (COSO). Management’s assessment included an evaluation of the design of Altria Group, Inc.’s internal control over financial reporting and testing of the operational effectiveness of its internal control over financial reporting. Management reviewed the results of its assessment with the Audit Committee of our Board of Directors.
Based on this assessment, management determined that, as of December 31,
2015
, Altria Group, Inc. maintained effective internal control over financial reporting.
PricewaterhouseCoopers LLP, an independent registered public accounting firm, who audited and reported on the consolidated financial statements of Altria Group, Inc. included in this report, has audited the effectiveness of Altria Group, Inc.’s internal control over financial reporting as of December 31,
2015
, as stated in their report herein.
January 28, 2016
109
None.
Disclosure Controls and Procedures
Altria Group, Inc. carried out an evaluation, with the participation of Altria Group, Inc.’s management, including Altria Group, Inc.’s Chief Executive Officer and Chief Financial Officer, of the effectiveness of Altria Group, Inc.’s disclosure controls and procedures (as defined in Rule 13a-15(e) under the Exchange Act, as amended) as of the end of the period covered by this Annual Report on Form 10-K. Based upon that evaluation, Altria Group, Inc.’s Chief Executive Officer and Chief Financial Officer
concluded that Altria Group, Inc.’s disclosure controls and procedures are effective.
There have been no changes in Altria Group, Inc.’s internal control over financial reporting during the most recent fiscal quarter that have materially affected, or are reasonably likely to materially affect, Altria Group, Inc.’s internal control over financial reporting.
The Report of Independent Registered Public Accounting Firm and the Report of Management on Internal Control over Financial Reporting are included in Item 8.
None.
Except for the information relating to the executive officers set forth in Item 10, the information called for by Items 10-14 is hereby incorporated by reference to Altria Group, Inc.’s definitive proxy statement for use in connection with its Annual Meeting of Shareholders to be held on May 19, 2016 that will be filed with the SEC on or about April 7, 2016 (the “proxy statement”), and, except as indicated therein, made a part hereof.
Refer to “Proposals Requiring Your Vote - Proposal 1 - Election of Directors,” “Ownership of Equity Securities of the Company - Section 16(a) Beneficial Ownership Reporting Compliance” and “Board and Governance Matters - Committees of the Board of Directors” sections of the proxy statement.
Executive Officers as of February 12, 2016:
|
Name
|
Office
|
Age
|
|
Martin J. Barrington
|
Chairman, Chief Executive Officer and President
|
62
|
|
Daniel J. Bryant
|
Vice President and Treasurer
|
46
|
|
James E. Dillard III
|
Senior Vice President, Research, Development and Regulatory Affairs
|
52
|
|
Ivan S. Feldman
|
Vice President and Controller
|
49
|
|
Clifford B. Fleet
|
President and Chief Executive Officer, Philip Morris USA Inc.
|
45
|
|
William F. Gifford, Jr.
|
Executive Vice President and Chief Financial Officer
|
45
|
|
Craig A. Johnson
|
President and Chief Executive Officer, Altria Group Distribution Company
|
63
|
|
Denise F. Keane
|
Executive Vice President and General Counsel
|
63
|
|
Salvatore Mancuso
|
Senior Vice President, Strategy, Planning and Accounting
|
50
|
|
Brian W. Quigley
|
President and Chief Executive Officer, U.S. Smokeless Tobacco Company LLC
|
42
|
|
W. Hildebrandt Surgner, Jr.
|
Corporate Secretary and Senior Assistant General Counsel
|
50
|
|
Charles N. Whitaker
|
Senior Vice President, Human Resources, Compliance & Information Services and Chief Compliance Officer
|
49
|
|
Howard A. Willard III
|
Executive Vice President and Chief Operating Officer
|
52
|
All of the above-mentioned officers have been employed by Altria Group, Inc. or its subsidiaries in various capacities during the past five years.
Effective January 1, 2016, Mr. Dillard, previously Senior Vice President, Regulatory Affairs and Chief Innovation Officer, Altria Client Services LLC, was appointed Senior Vice President,
Research, Development and Regulatory Affairs, Altria Group, Inc.
Mr. Whitaker’s wife and Mr. Surgner’s wife are first cousins.
110
Codes of Conduct and Corporate Governance
Altria Group, Inc. has adopted the Altria Code of Conduct for Compliance and Integrity, which complies with requirements set forth in Item 406 of Regulation S-K. This Code of Conduct applies to all of its employees, including its principal executive officer, principal financial officer, principal accounting officer or controller, and persons performing similar functions. Altria Group, Inc. has also adopted a code of business conduct and ethics that applies to the members of its Board of Directors. These documents are available free of charge on Altria Group, Inc.’s website at www.altria.com.
Any waiver granted by Altria Group, Inc. to its principal executive officer, principal financial officer or controller under the Code of Conduct, and certain amendments to the Code of
Conduct, will be disclosed on Altria Group, Inc.’s website at www.altria.com within the time period required by applicable rules.
In addition, Altria Group, Inc. has adopted corporate governance guidelines and charters for its Audit, Compensation and Nominating, Corporate Governance and Social Responsibility Committees and the other committees of the Board of Directors. All of these documents are available free of charge on Altria Group, Inc.’s website at www.altria.com.
The information on the respective websites of Altria Group, Inc. and its subsidiaries is not, and shall not be deemed to be, a part of this Annual Report on Form 10-K or incorporated into any other filings Altria Group, Inc. makes with the SEC.
Refer to “Executive Compensation,” “Compensation Committee Matters - Compensation Committee Interlocks and Insider Participation,” “Compensation Committee Matters - Compensation Committee Report for the Year Ended
December 31, 2015
” and “Board and Governance Matters - Directors - Director Compensation” sections of the proxy statement.
The number of shares to be issued upon exercise or vesting and the number of shares remaining available for future issuance under Altria Group, Inc.’s equity compensation plans at December 31,
2015
, were as follows:
|
|
Number of Shares
to be Issued upon
Exercise of
Outstanding
Options and Vesting of
Deferred Stock
(a)
|
Weighted Average
Exercise Price of
Outstanding
Options
(b)
|
Number of Shares
Remaining Available for
Future Issuance Under Equity
Compensation
Plans
(c)
|
|
Equity compensation plans approved by shareholders
(1)
|
1,221,985
(2)
|
$—
|
40,987,766
(3)
|
|
(1)
|
The following plans have been approved by Altria Group, Inc. shareholders and have shares referenced in column (a) or column (c): the 2010 Performance Incentive Plan, the 2015 Performance Incentive Plan and the 2015 Stock Compensation Plan for Non-Employee Directors.
|
|
(2)
|
Represents 1,221,985 shares of restricted stock units (also referred to as deferred stock).
|
|
(3)
|
Includes 39,994,482 shares available under the 2015 Performance Incentive Plan and 993,284 shares available under the 2015 Stock Compensation Plan for Non-Employee Directors, and excludes shares reflected in column (a).
|
Refer to “Ownership of Equity Securities of the Company - Directors and Executive Officers” and “Ownership of Equity Securities of the Company - Certain Other Beneficial Owners” sections of the proxy statement.
Refer to “Related Person Transactions and Code of Conduct” and “Board and Governance Matters - Directors - Director Independence Determinations” sections of the proxy statement.
Refer to “Audit Committee Matters - Independent Registered Public Accounting Firm’s Fees” and “Audit Committee Matters - Pre-Approval Policy” sections of the proxy statement.
111
(a) Index to Consolidated Financial Statements
|
Page
|
|
|
Consolidated Balance Sheets at December 31, 2015 and 2014
|
|
|
Consolidated Statements of Earnings for the years ended December 31, 2015, 2014 and 2013
|
|
|
Consolidated Statements of Comprehensive Earnings for the years ended December 31, 2015, 2014 and 2013
|
|
|
Consolidated Statements of Cash Flows for the years ended December 31, 2015, 2014 and 2013
|
|
|
Consolidated Statements of Stockholders’ Equity for the years ended December 31, 2015, 2014 and 2013
|
|
|
Notes to Consolidated Financial Statements
|
|
|
Report of Independent Registered Public Accounting Firm
|
|
|
Report of Management on Internal Control Over Financial Reporting
|
|
Schedules have been omitted either because such schedules are not required or are not applicable.
(b) The following exhibits are filed as part of this Annual Report on Form 10-K:
|
2.1
|
Distribution Agreement by and between Altria Group, Inc. and Kraft Foods Inc. (now known as Mondelēz International, Inc.), dated as of January 31, 2007. Incorporated by reference to Altria Group, Inc.’s Current Report on Form 8-K filed on January 31, 2007 (File No. 1-08940).
|
||
|
2.2
|
Distribution Agreement by and between Altria Group, Inc. and Philip Morris International Inc., dated as of January 30, 2008. Incorporated by reference to Altria Group, Inc.’s Current Report on Form 8-K filed on January 30, 2008 (File No. 1-08940).
|
||
|
2.3
|
Agreement and Plan of Merger by and among UST Inc., Altria Group, Inc., and Armchair Merger Sub, Inc., dated as of September 7, 2008. Incorporated by reference to Altria Group, Inc.’s Current Report on Form 8-K filed on September 8, 2008 (File No. 1-08940).
|
||
|
2.4
|
Amendment No. 1 to the Agreement and Plan of Merger, dated as of September 7, 2008, by and among UST Inc., Altria Group, Inc., and Armchair Merger Sub, Inc., dated as of October 2, 2008. Incorporated by reference to Altria Group, Inc.’s Current Report on Form 8-K filed on October 3, 2008 (File No. 1-08940).
|
||
|
3.1
|
Articles of Amendment to the Restated Articles of Incorporation of Altria Group, Inc. and Restated Articles of Incorporation of Altria Group, Inc. Incorporated by reference to Altria Group, Inc.’s Annual Report on Form 10-K for the year ended December 31, 2002 (File No. 1-08940).
|
||
|
3.2
|
Amended and Restated By-laws of Altria Group, Inc., effective as of October 28, 2015. Incorporated by reference to Altria Group, Inc.’s Current Report on Form 8-K filed on October 29, 2015 (File No. 1-08940).
|
||
|
4.1
|
Indenture between Altria Group, Inc. and The Bank of New York (as successor in interest to JPMorgan Chase Bank, formerly known as The Chase Manhattan Bank), as Trustee, dated as of December 2, 1996. Incorporated by reference to Altria Group, Inc.’s Registration Statement on Form S-3/A filed on January 29, 1998 (No. 333-35143).
|
||
112
|
4.2
|
First Supplemental Indenture to Indenture, dated as of December 2, 1996, between Altria Group, Inc. and The Bank of New York (as successor in interest to JPMorgan Chase Bank, formerly known as The Chase Manhattan Bank), as Trustee, dated as of February 13, 2008. Incorporated by reference to Altria Group, Inc.’s Current Report on Form 8-K filed on February 15, 2008 (File No. 1-08940).
|
||
|
4.3
|
Indenture among Altria Group, Inc., as Issuer, Philip Morris USA Inc., as Guarantor, and Deutsche Bank Trust Company Americas, as Trustee, dated as of November 4, 2008. Incorporated by reference to Altria Group, Inc.’s Registration Statement on Form S-3 filed on November 4, 2008 (No. 333-155009).
|
||
|
4.4
|
Amended and Restated 5-Year Revolving Credit Agreement, dated as of August 19, 2013, among Altria Group, Inc. and the Initial Lenders named therein and JPMorgan Chase Bank, N.A. and Citibank, N.A., as Administrative Agents. Incorporated by reference to Altria Group, Inc.’s Current Report on Form 8-K filed on August 23, 2013 (File No. 1-08940).
|
||
|
4.5
|
Extension Agreement, effective August 19, 2014, among Altria Group, Inc. and the lenders thereto and JPMorgan Chase Bank, N.A. and Citibank, N.A., as Administrative Agents. Incorporated by reference to Altria Group, Inc.’s Current Report on Form 8-K filed on August 21, 2014 (File No. 1-08940).
|
||
|
4.6
|
Extension Agreement, effective August 19, 2015, among Altria Group, Inc. and the lenders thereto and JPMorgan Chase Bank, N.A. and Citibank, N.A., as Administrative Agents. Incorporated by reference to Altria Group, Inc.’s Current Report on Form 8-K filed on August 21, 2015 (File No. 1-08940).
|
||
|
4.7
|
The Registrant agrees to furnish copies of any instruments defining the rights of holders of long-term debt of the Registrant and its consolidated subsidiaries that does not exceed 10 percent of the total assets of the Registrant and its consolidated subsidiaries to the Commission upon request.
|
||
|
10.1
|
Comprehensive Settlement Agreement and Release related to settlement of Mississippi health care cost recovery action, dated as of October 17, 1997. Incorporated by reference to Altria Group, Inc.’s Annual Report on Form 10-K for the year ended December 31, 1997 (File No. 1-08940).
|
||
|
10.2
|
Settlement Agreement related to settlement of Florida health care cost recovery action, dated August 25, 1997. Incorporated by reference to Altria Group, Inc.’s Current Report on Form 8-K filed on September 3, 1997 (File No. 1-08940).
|
||
|
10.3
|
Comprehensive Settlement Agreement and Release related to settlement of Texas health care cost recovery action, dated as of January 16, 1998. Incorporated by reference to Altria Group, Inc.’s Current Report on Form 8-K filed on January 28, 1998 (File No. 1-08940).
|
||
|
10.4
|
Settlement Agreement and Stipulation for Entry of Judgment regarding the claims of the State of Minnesota, dated as of May 8, 1998. Incorporated by reference to Altria Group, Inc.’s Quarterly Report on Form 10-Q for the period ended March 31, 1998 (File No. 1-08940).
|
||
|
10.5
|
Settlement Agreement and Release regarding the claims of Blue Cross and Blue Shield of Minnesota, dated as of May 8, 1998. Incorporated by reference to Altria Group, Inc.’s Quarterly Report on Form 10-Q for the period ended March 31, 1998 (File No. 1-08940).
|
||
|
10.6
|
Stipulation of Amendment to Settlement Agreement and For Entry of Agreed Order regarding the settlement of the Mississippi health care cost recovery action, dated as of July 2, 1998. Incorporated by reference to Altria Group, Inc.’s Quarterly Report on Form 10-Q for the period ended June 30, 1998 (File No. 1-08940).
|
||
|
10.7
|
Stipulation of Amendment to Settlement Agreement and For Entry of Consent Decree regarding the settlement of the Texas health care cost recovery action, dated as of July 24, 1998. Incorporated by reference to Altria Group, Inc.’s Quarterly Report on Form 10-Q for the period ended June 30, 1998 (File No. 1-08940).
|
||
|
10.8
|
Stipulation of Amendment to Settlement Agreement and For Entry of Consent Decree regarding the settlement of the Florida health care cost recovery action, dated as of September 11, 1998. Incorporated by reference to Altria Group, Inc.’s Quarterly Report on Form 10-Q for the period ended September 30, 1998 (File No. 1-08940).
|
||
113
|
10.9
|
Master Settlement Agreement relating to state health care cost recovery and other claims, dated as of November 23, 1998. Incorporated by reference to Altria Group, Inc.’s Current Report on Form 8-K filed on November 25, 1998, as amended by Form 8-K/A filed on December 24, 1998 (File No. 1-08940).
|
||
|
10.10
|
Stipulation and Agreed Order Regarding Stay of Execution Pending Review and Related Matters, dated as of May 7, 2001. Incorporated by reference to Altria Group, Inc.’s Current Report on Form 8-K filed on May 8, 2001 (File No. 1-08940).
|
||
|
10.11
|
Term Sheet effective December 17, 2012, between Philip Morris USA Inc., the other participating manufacturers, and various states and territories for settlement of the 2003 - 2012 Non-Participating Manufacturer Adjustment with those states. Incorporated by reference to Altria Group, Inc.’s Current Report on From 8-K filed on December 18, 2012 (File No. 1-08940).
|
||
|
10.12
|
Employee Matters Agreement by and between Altria Group, Inc. and Kraft Foods Inc. (now known as Mondelēz International, Inc.), dated as of March 30, 2007. Incorporated by reference to Altria Group, Inc.’s Current Report on Form 8-K filed on March 30, 2007 (File No. 1-08940).
|
||
|
10.13
|
Tax Sharing Agreement by and between Altria Group, Inc. and Kraft Foods Inc. (now known as Mondelēz International, Inc.), dated as of March 30, 2007. Incorporated by reference to Altria Group, Inc.’s Current Report on Form 8-K filed on March 30, 2007 (File No. 1-08940).
|
||
|
10.14
|
Intellectual Property Agreement by and between Philip Morris International Inc. and Philip Morris USA Inc., dated as of January 1, 2008. Incorporated by reference to Altria Group, Inc.’s Current Report on Form 8-K filed on March 28, 2008 (File No. 1-08940).
|
||
|
10.15
|
Employee Matters Agreement by and between Altria Group, Inc. and Philip Morris International Inc., dated as of March 28, 2008. Incorporated by reference to Altria Group, Inc.’s Current Report on Form 8-K filed on March 28, 2008 (File No. 1-08940).
|
||
|
10.16
|
Tax Sharing Agreement by and between Altria Group, Inc. and Philip Morris International Inc., dated as of March 28, 2008. Incorporated by reference to Altria Group, Inc.’s Current Report on Form 8-K filed on March 28, 2008 (File No. 1-08940).
|
||
|
10.17
|
Guarantee made by Philip Morris USA Inc., in favor of the lenders party to the 5-Year Revolving Credit Agreement, dated as of June 30, 2011, among Altria Group, Inc., the lenders named therein, and JPMorgan Chase Bank, N.A. and Citibank, N.A., as Administrative Agents, dated as of June 30, 2011. Incorporated by reference to Altria Group, Inc.’s Current Report on Form 8-K filed on June 30, 2011 (File No. 1-08940).
|
||
|
10.18
|
Financial Counseling Program. Incorporated by reference to Altria Group, Inc.’s Annual Report on Form 10-K for the year ended December 31, 2009 (File No. 1-08940).*
|
||
|
10.19
|
Benefit Equalization Plan, effective September 2, 1974, as amended. Incorporated by reference to Altria Group, Inc.'s Annual Report on Form 10-K for the year ended December 31, 2014 (File No. 1-08940).*
|
||
|
10.20
|
Form of Employee Grantor Trust Enrollment Agreement. Incorporated by reference to Altria Group, Inc.’s Annual Report on Form 10-K for the year ended December 31, 1995 (File No. 1-08940).*
|
||
|
10.21
|
Form of Supplemental Employee Grantor Trust Enrollment Agreement. Incorporated by reference to Altria Group, Inc.’s Annual Report on Form 10-K for the year ended December 31, 2005 (File No. 1-08940).*
|
||
|
10.22
|
Automobile Policy. Incorporated by reference to Altria Group, Inc.’s Annual Report on Form 10-K for the year ended December 31, 1997 (File No. 1-08940).*
|
||
|
10.23
|
Supplemental Management Employees’ Retirement Plan of Altria Group, Inc., effective as of October 1, 1987, as amended and in effect as of January 1, 2012. Incorporated by reference to Altria Group, Inc.’s Quarterly Report on Form 10-Q for the period ended March 31, 2012 (File No. 1-08940).*
|
||
|
10.24
|
Grantor Trust Agreement by and between Altria Client Services Inc. and Wells Fargo Bank, National Association, dated February 23, 2011. Incorporated by reference to Altria Group, Inc.’s Annual Report on Form 10-K for the year ended December 31, 2010 (File No. 1-08940).*
|
||
114
|
10.25
|
Long-Term Disability Benefit Equalization Plan, effective as of January 1, 1989, as amended. Incorporated by reference to Altria Group, Inc.’s Quarterly Report on Form 10-Q for the period ended June 30, 2009 (File No. 1-08940).*
|
||
|
10.26
|
Survivor Income Benefit Equalization Plan, effective as of January 1, 1985, as amended and in effect as of January 1, 2010. Incorporated by reference to Altria Group, Inc.’s Quarterly Report on Form 10-Q for the period ended June 30, 2011 (File No. 1-08940).*
|
||
|
10.27
|
Deferred Fee Plan for Non-Employee Directors, as amended and restated effective October 28, 2015.*
|
||
|
10.28
|
2015 Stock Compensation Plan for Non-Employee Directors, as amended and restated effective October 28, 2015.*
|
||
|
10.29
|
2010 Performance Incentive Plan, effective on May 20, 2010. Incorporated by reference to Altria Group, Inc.’s definitive proxy statement filed on April 9, 2010 (File No. 1-08940).*
|
||
|
10.30
|
2015 Performance Incentive Plan, effective on May 1, 2015. Incorporated by reference to Altria Group, Inc.’s definitive proxy statement on Schedule 14A filed on April 9, 2015 (File No. 1-08940).*
|
||
|
10.31
|
Kraft Foods Inc. (now known as Mondelēz International, Inc.) Supplemental Benefits Plan I (including First Amendment adding Supplement A), as amended and restated effective as of January 1, 1996. Incorporated by reference to Altria Group, Inc.’s Annual Report on Form 10-K for the year ended December 31, 2006 (File No. 1-08940).*
|
||
|
10.32
|
Form of Indemnity Agreement. Incorporated by reference to Altria Group, Inc.’s Current Report on Form 8-K filed on October 30, 2006 (File No. 1-08940).
|
||
|
10.33
|
Form of Restricted Stock Agreement, dated as of January 25, 2012. Incorporated by reference to Altria Group, Inc.’s Current Report on Form 8-K filed on January 27, 2012 (File No. 1-08940).*
|
||
|
10.34
|
Form of Restricted Stock Agreement, dated as of May 16, 2012. Incorporated by reference to Altria Group, Inc.’s Current Report on Form 8-K filed on May 17, 2012 (File No. 1-08940).*
|
||
|
10.35
|
Form of Restricted Stock Agreement, dated as of January 29, 2013. Incorporated by reference to Altria Group, Inc.’s Current Report on Form 8-K filed on January 31, 2013 (File No. 1-08940).*
|
||
|
10.36
|
Form of Deferred Stock Agreement, dated as of January 29, 2013. Incorporated by reference to Altria Group, Inc.’s Quarterly Report on Form 10-Q for the period ended March 31, 2013 (File No. 1-08940).*
|
||
|
10.37
|
Form of Restricted Stock Agreement, dated as of January 28, 2014. Incorporated by reference to Altria Group, Inc.’s Current Report on Form 8-K filed on January 30, 2014 (File No. 1-08940).*
|
||
|
10.38
|
Form of Deferred Stock Agreement, dated as of January 28, 2014. Incorporated by reference to Altria Group, Inc.’s Quarterly Report on Form 10-Q for the period ended March 31, 2014 (File No. 1-08940).*
|
||
|
10.39
|
Form of Restricted Stock Unit Agreement, dated as of January 28, 2015. Incorporated by reference to Altria Group, Inc.’s Current Report on Form 8-K filed on January 30, 2015 (File No. 1-08940).*
|
||
|
10.40
|
Form of Executive Confidentiality and Non-Competition Agreement. Incorporated by reference to Altria Group, Inc.’s Current Report on Form 8-K filed on January 27, 2011 (File No. 1-08940).*
|
||
|
10.41
|
Time Sharing Agreement between Altria Client Services LLC and Martin J. Barrington, dated as of November 19, 2015.*
|
||
|
10.42
|
Time Sharing Agreement between Altria Client Services Inc. and David R. Beran, dated as of July 25, 2012. Incorporated by reference to Altria Group, Inc.’s Quarterly Report on Form 10-Q for the period ended June 30, 2012 (File No. 1-08940).*
|
||
115
|
10.43
|
Time Sharing Termination Letter from Altria Client Services Inc. to David R. Beran, dated February 27, 2015. Incorporated by reference to Altria Group, Inc.’s Quarterly Report on Form 10-Q for the period ended March 31, 2015 (File No. 1-08940).*
|
||
|
10.44
|
Agreement and General Release between Altria Group, Inc. and David R. Beran, dated March 12, 2015. Incorporated by reference to Altria Group, Inc.’s Quarterly Report on Form 10-Q for the period ended March 31, 2015 (File No. 1-08940).*
|
||
|
12
|
Statements regarding computation of ratios of earnings to fixed charges.
|
||
|
21
|
Subsidiaries of Altria Group, Inc.
|
||
|
23
|
Consent of independent registered public accounting firm.
|
||
|
24
|
Powers of attorney.
|
||
|
31.1
|
Certification of Chief Executive Officer pursuant to Rule 13a-14(a)/15d-14(a) of the Securities Exchange Act of 1934, as amended, as adopted pursuant to Section 302 of the Sarbanes-Oxley Act of 2002.
|
||
|
31.2
|
Certification of Chief Financial Officer pursuant to Rule 13a-14(a)/15d-14(a) of the Securities Exchange Act of 1934, as amended, as adopted pursuant to Section 302 of the Sarbanes-Oxley Act of 2002.
|
||
|
32.1
|
Certification of Chief Executive Officer pursuant to 18 U.S.C. 1350, as adopted pursuant to Section 906 of the Sarbanes-Oxley Act of 2002.
|
||
|
32.2
|
Certification of Chief Financial Officer pursuant to 18 U.S.C. 1350, as adopted pursuant to Section 906 of the Sarbanes-Oxley Act of 2002.
|
||
|
99.1
|
Certain Litigation Matters.
|
||
|
99.2
|
Trial Schedule for Certain Cases.
|
||
|
99.3
|
Definitions of Terms Related to Financial Covenants Included in Altria Group, Inc.’s Amended and Restated 5-Year Revolving Credit Agreement, dated as of August 19, 2013. Incorporated by reference to Altria Group, Inc.’s Quarterly Report on Form 10-Q for the period ended September 30, 2013 (File No. 1-08940).
|
||
|
101.INS
|
XBRL Instance Document.
|
||
|
101.SCH
|
XBRL Taxonomy Extension Schema.
|
||
|
101.CAL
|
XBRL Taxonomy Extension Calculation Linkbase.
|
||
|
101.DEF
|
XBRL Taxonomy Extension Definition Linkbase.
|
||
|
101.LAB
|
XBRL Taxonomy Extension Label Linkbase.
|
||
|
101.PRE
|
XBRL Taxonomy Extension Presentation Linkbase.
|
||
* Denotes management contract or compensatory plan or arrangement in which directors or executive officers are eligible to participate.
116
SIGNATURES
Pursuant to the requirements of Section 13 or 15(d) of the Securities Exchange Act of 1934, the registrant has duly caused this report to be signed on its behalf by the undersigned, thereunto duly authorized.
|
ALTRIA GROUP, INC.
|
||
|
By:
|
/s/ MARTIN J. BARRINGTON
|
|
|
|
(Martin J. Barrington
Chairman, Chief Executive Officer and President)
|
|
Date: February 25, 2016
Pursuant to the requirements of the Securities Exchange Act of 1934, this report has been signed below by the following persons on behalf of the registrant and in the capacities and on the date indicated:
|
Signature
|
Title
|
Date
|
|||
|
/s/ MARTIN J. BARRINGTON
(Martin J. Barrington)
|
Director, Chairman, Chief Executive Officer and President
|
February 25, 2016
|
|||
|
/s/ WILLIAM F. GIFFORD, JR.
(William F. Gifford, Jr.)
|
Executive Vice President and
Chief Financial Officer
|
February 25, 2016
|
|||
|
/s/ IVAN S. FELDMAN
(Ivan S. Feldman)
|
Vice President and Controller
|
February 25, 2016
|
|||
|
* GERALD L. BALILES,
JOHN T. CASTEEN III,
DINYAR S. DEVITRE,
THOMAS F. FARRELL II,
THOMAS W. JONES,
DEBRA J. KELLY-ENNIS,
W. LEO KIELY III,
KATHRYN B. MCQUADE,
GEORGE MUÑOZ,
NABIL Y. SAKKAB
|
Directors
|
||||
|
*By:
|
/s/ MARTIN J. BARRINGTON
(MARTIN J. BARRINGTON
ATTORNEY-IN-FACT)
|
February 25, 2016
|
|||
117
TABLE OF CONTENTS
Part IItem 1. BusinessItem 1A. Risk FactorsItem 1B. Unresolved Staff CommentsItem 2. PropertiesItem 3. Legal ProceedingsItem 4. Mine Safety DisclosuresPart IIItem 5. Market For Registrant S Common Equity, Related Stockholder Matters and Issuer Purchases Of Equity SecuritiesItem 6. Selected Financial DataItem 7. Management S Discussion and Analysis Of Financial Condition and Results Of OperationsItem 7A. Quantitative and Qualitative Disclosures About Market RiskItem 8. Financial Statements and Supplementary DataNote 1 . Background and Basis Of PresentationNote 2 . Summary Of Significant Accounting PoliciesNote 3 . Acquisition Of Green SmokeNote 4 . Goodwill and Other Intangible Assets, NetNote 5 . InventoriesNote 6 . Investment in SabmillerNote 7 . Finance Assets, NetNote 8 . Short-term Borrowings and Borrowing ArrangementsNote 9 . Long-term DebtNote 10 . Capital StockNote 11 . Stock PlansNote 12 . Earnings Per ShareNote 13 . Other Comprehensive Earnings/lossesNote 14 . Income TaxesNote 15 . Segment ReportingNote 16 . Benefit PlansNote 17 . Additional InformationNote 18 . ContingenciesNote 19 . Condensed Consolidating Financial InformationNote 20 . Quarterly Financial Data (unaudited)Note 21 . Subsequent EventItem 9. Changes in and Disagreements with Accountants on Accounting and Financial DisclosureItem 9A. Controls and ProceduresItem 9B. Other InformationPart IIIItem 10. Directors, Executive Officers and Corporate GovernanceItem 11. Executive CompensationItem 12. Security Ownership Of Certain Beneficial Owners and Management and Related Stockholder MattersItem 13. Certain Relationships and Related Transactions, and Director IndependenceItem 14. Principal Accounting Fees and ServicesPart IVItem 15. Exhibits and Financial Statement Schedules