MOBIQUITY TECHNOLOGIES, INC.
10-Ks and 10-Qs
|
|
|
|
|
|
|
|
|
|
|
|
|
|
|
|
|
|
|
|
|
|
|
|
|
|
|
|
|
|
|
|
SECURITIES AND EXCHANGE COMMISSION
Washington, D.C. 20549
FORM 10-K
[X]
ANNUAL REPORT PURSUANT TO SECTION 13 OR 15(D) OF THE SECURITIES EXCHANGE ACT OF 1934
FOR THE FISCAL YEAR ENDED DECEMBER 31, 2011
COMMISSION FILE NUMBER: 000-51160
ACE MARKETING & PROMOTIONS, INC.
(Exact name of Registrant as specified in its charter)
|
New York
|
11-3427886
|
|
(State of jurisdiction of
incorporation or organization)
|
(I.R.S. Employee
Identification Number)
|
|
457 Rockaway Avenue, Valley Stream, NY
|
11581
|
|
(Address of principal executive offices)
|
(Zip Code)
|
|
Registrant's telephone number, including area code:
|
(516) 256-7766
|
|
Securities registered pursuant to Section 12 (b) of the Act:
|
None
|
|
Securities registered pursuant to Section 12 (g) of the Act:
|
Common Stock, $.0001 Par Value
|
Indicate by check mark if the registrant is a well-known seasoned issuer, as defined in Rule 405 of the Securities Act. Yes [_] No [X]
Check whether the Registrant is not required to file reports pursuant to Section 13 or 15(d) of the Exchange Act. [_]
Indicate by check mark whether the Registrant (1) has filed all reports required to be filed by Section 13 or 15(d) of the Securities Exchange Act of 1934 during the preceding 12 months (or for such shorter period that the Registrant was required to file such reports) and (2) has been subject to such filing requirements for the past 90 days. Yes [X] No [_]
Indicate by check mark whether the Registrant has submitted electronically and posted on it corporate Web site, if any, every Interactive data file required to be submitted and posted pursuant to Rule 405 of Regulation S-T (§232.405 of this chapter) during the preceding 12 months (or for such shorter period that the registrant was required to submit and post such files). Yes [X] No [_]
Indicate by check mark if disclosure of delinquent filers in response to Item 405 of Regulation S-K is not contained in this form, and no disclosure will be contained, to the best of Registrant's knowledge, in definitive proxy or information statements incorporated by reference in part III of this Form 10-K or any amendment to this Form 10-K [ ].
Indicate by check mark whether the registrant is a large accelerated filer, an accelerated filer, a non-accelerated filer, or a smaller reporting company as defined by Rule 12b-2 of the Exchange Act: smaller reporting company [X].
Indicate by check mark whether the Registrant is a shell company (as defined in Rule 12b-2 of the Exchange Act). Yes [_] No [X]
As of June 30, 2011, the number of shares held by non-affiliates was approximately 17,665,000 shares. The approximate market value based on the last sale (i.e. $.67 per share as of June 30, 2011) of the Company’s Common Stock was approximately $11,836,000.
The number of shares outstanding of the Registrant’s Common Stock, as of March 1, 2012 was 24,369,239.
FORWARD-LOOKING STATEMENTS
We believe this annual report contains "forward-looking statements" within the meaning of the Private Securities Litigation Reform Act of 1995. These statements are subject to risks and uncertainties and are based on the beliefs and assumptions of our management, based on information currently available to our management. When we use words such as "believes," "expects," "anticipates," "intends," "plans," "estimates," "should," "likely" or similar expressions, we are making forward-looking statements. Forward-looking statements include information concerning our possible or assumed future results of operations set forth under "Business" and/or "Management's Discussion and Analysis of Financial Condition and Results of Operations." Forward-looking statements are not guarantees of performance. They involve risks, uncertainties and assumptions. Our future results and stockholder values may differ materially from those expressed in the forward-looking statements. Many of the factors that will determine these results and values are beyond our ability to control or predict. Stockholders are cautioned not to put undue reliance on any forward-looking statements. For those statements, we claim the protection of the safe harbor for forward-looking statements contained in the Private Securities Litigation Reform Act of 1995. For a discussion of some of the factors that may cause actual results to differ materially from those suggested by the forward-looking statements, please read carefully the information under "Risk Factors." In addition to the Risk Factors and other important factors discussed elsewhere in this annual report, you should understand that other risks and uncertainties and our public announcements and filings under the Securities Exchange Act of 1934, as amended could affect our future results and could cause results to differ materially from those suggested by the forward-looking statements.
Item 1. Business
Overview
Ace Marketing & Promotions, Inc. (the “Company” or “Ace”), a New York corporation, is an Integrated Marketing Solutions Company that focuses on four business verticals;
Branding & Branded Merchandise, Interactive Solutions, Direct Relationship Marketing and Mobile Marketing
.
Ace Marketing has created a comprehensive suite of Integrated Marketing Solutions to Manage and Implement Branding and Marketing Strategies. Ace’s proprietary Technology Platform, “AcePlace”, is the centerpiece of our implementation strategy. AcePlace eliminates the need for companies to rely on multiple vendors to put their marketing strategies to work.
Ace’s implementation philosophy is based on a systematic and data-driven process to identify ideal clients, prospects and branding strategies. Our integrated platforms utilize the ideal delivery methods to strengthen brand awareness and drive effective marketing programs that produce results that can be easily defined and measured.
The Promotional Products Market (Branded)
Global Advertising Specialties Impressions Study
(Released at the 2010 ASI Power Summit)
During July and August of 2010, a team conducted in-person interviews with business people in New York, Chicago, Los Angeles, Philadelphia, London, Sydney, Toronto and Montreal metro areas on behalf of ASI regarding promotional products they had received. The purpose of the interviews was to understand where items are kept, frequency of use, why the promotional product was kept and estimate the number of impressions the advertiser makes with the item. In-person interviewers conducted a total of 406 completed surveys.
Further, an online panel survey was conducted among recipients of advertising specialties to augment the sample from the in-person interviews. Combined with the in-person interviews, there was a total of 3,332 completed surveys for this study. Respondents were asked if they had received any promotional products in the last 12 months.
Conclusions
|
|
•
Cost per Impression.
In the U.S., the cost per impression of a promotional product stayed virtually the same from 2008 to 2010, at .005 cents.
|
|
|
ü
|
When compared to other forms of media like television or radio, promotional products are very affordable and effective. For a modest investment, a small company can obtain the type of exposure normally reserved for large companies with significant advertising budgets.
|
|
|
•
Product Usage.
Bags have the highest number of impressions in a month, over 1,000. In fact, over one-third (36%) of those with incomes under $50,000 own bags.
|
|
|
ü
|
Current global awareness of the importance of reusing, rather than throwing away, combined with high end-user needs for cost saving, make bags a better-than-ever way for advertisers to spread their message.
|
|
|
•
Gender Preferences.
Males are more likely than females to own shirts and caps, while females are more likely to have bags, writing instruments, calendars and health and safety products than males. And as men age, they are even more likely to have received a cap in the last 12 months. As women age, they are more likely to have received writing instruments or calendars.
|
|
|
ü
|
Knowing the likely recipient of a promotional product is paramount for an advertiser. Decorating items that have special appeal to the end-user will mean the item gets used more often and held longer, extending the product’s life span and increasing the number of impressions it makes.
|
|
|
•
Positive Reinforcement.
Product preferences differ among voters. 75% of Independent voters prefer consumer-branded products – nearly 1.5 times more than Democrats or Republicans. Independents get more promotional T-shirts than either Democrats or Republicans, but are less inclined than Democrats or Republicans to take free pens.
|
|
|
ü
|
Promotional products are unique during political campaigns in that they primarily emphasize the positive qualities of a candidate, while mass media focuses more on the negative aspects of the opposing candidate. A positive message on a useful product stands above the fray of negative campaign ads.
|
|
|
•
Ability to Identify the Advertiser.
83% in the U.S. indicated they could identify the advertiser on a promotional item they owned, very similar to 2008 (84%).
|
|
|
ü
|
Not only do promotional products make impressions to everyone who sees them, but messaging is reinforced every time the item is used, as it is making a contribution to the needs of the owner. No other form of media can allow the advertiser to so closely tie a benefit to the recipient of the message or brand.
|
|
|
|
|
•
Ability to Influence User Opinions.
41% of U.S. respondents indicated their opinion of the advertiser was more favorable after receiving a promotional product. Among those who had not done business with the advertiser already in the U.S., 27% thought it likely they would
.
|
|
|
ü
|
Because the promotional products benefit is so clear to the end-user, they are more aware of the sponsor on the product and they are able to create a positive impression of the sponsor, as they find value in the item each time it is used.
|
|
|
•
Pass Along.
After receiving a promotional product they don’t plan to keep, nearly two-thirds (62%) of respondents in the U.S. indicated that they give the item to someone else. This is up 11 percentage points from two years ago.
|
|
|
ü
|
Promotional product usefulness goes beyond the person who initially receives the item. Products are frequently passed along to others who might value them more.
|
Detailed Findings
Types of items owned
The most commonly owned promotional products among U.S. respondents are writing instruments (46%), followed by shirts (38%) and calendars (24%). Calendars climbed from seventh in 2008 to third in 2010. The number of calendars given out was not necessarily higher, but the number kept and subsequently used was higher.
Types of Items Owned
|
Rank 2010
|
Rank
2008
|
|
|
Writing Instruments
|
1
|
1
|
|
Shirts
|
2
|
2
|
|
Calendars
|
3
|
7
|
|
Bags
|
4
|
4
|
|
Caps/Headwear
|
5
|
3
|
|
Desk/Office/Business Accessories
|
6
|
6
|
|
Food Items
|
7
|
n/a
|
|
Glassware/Ceramics (includes Mugs)
|
8
|
5
|
|
Health and Safety Products
|
9
|
n/a
|
|
Jackets/Hoodies/Sweatshirts/Fleece
|
10
|
n/a
|
|
Electronics/Computer
|
11
|
n/a
|
|
Recognition-Awards/Trophies/Plaques
|
12
|
10
|
|
Automotive
|
13
|
n/a
|
2
Ace Advantages
Ace has thousands of existing customer accounts ranging from Fortune 500 companies to local schools and small businesses. We have built our business around the concept of high quality innovative branded merchandise, competitive pricing, and consistently superior customer service. Our operational platform, using top-line technology, is designed for economies of scale and ensures superior relations with major industry suppliers. The platform also provides superior support to an expanding team of experienced, well-connected salespeople who are key to Ace acquiring new business.
The major advantage we hold over most companies in the promotional product industry is the ability to provide integrated business solutions to our customers as trusted advisors. The majority of companies in the promotional product industry offer only branded merchandise, whereas, we offer solutions in:
|
|
·
|
Branding & Branded Merchandise;
|
|
|
·
|
Interactive Solutions/ Website Development;
|
|
|
·
|
Direct Relationship Marketing; and
|
|
|
·
|
Mobile Marketing / Proximity Marketing.
|
Our ability to offer multiple solutions and integrate them is what separates us from the average promotional product distributor. Where nearly all of the competition continues to be viewed as commodity based “order takers”, our solutions based services deepen the relationship with our clients as Ace’s sales consultants become trusted advisors and Ace becomes a valued business partner.
BRANDING & BRANDED MERCHANDISE
Within the Branding vertical Ace has the ability to create the actual brand, in addition to providing all the branded merchandise. This has been the core of the Ace business model since its inception. The current focus within this vertical is to find innovative ways to leverage new technology platforms that drive growth beyond traditional channels.
Ace has invested in the technology
and
training
that few other distributors have accomplished. Our industry leading software allows us to quickly sort through a database of 500,000 items and compile a collection of our customers best options by price, production time, imprint, shape color and size. We’ll email our customers a focused product presentation of items that fit their criteria with all the details. If time allows, we’ll also send our customers samples. It’s how Ace helps our customers achieve the
greatest marketing impact
within our customers’ budget on projects with even the tightest turn-around.
Whether reinventing a customer’s corporate image or developing a new logo, a strong brand
is essential for making a positive first
impression
.
Ace’s experienced sales consultants will help our customers to choose products that achieve the maximum impact. While working within our customer parameters, we simultaneously maintain
brand consistency
and
corporate image
.
Ace’s in-house Art Department & Creative Teams will incorporate our customers’ logo and branding into a custom format for specific events.
Program Business
Creating Brands, Creating Merchandise, Creating Solutions. Ace’s “Program Business” Solution for branded Merchandise sourcing seeks to achieve:
|
|
·
|
Better Services;
|
|
|
·
|
Consistency in Branding to protect Quality, and
|
|
|
·
|
Incredible cost savings when implemented as an aggregated buying program.
|
Through our solution, we create an Online Company Store, purchase in bulk to achieve economies of scale, negotiate preferred domestic pricing and import directly when order size permits. Ace also provides full-service fulfillment and shipping services.
Importing
Ace utilizes established suppliers carrying the most recognizable brands in the U.S and overseas. By concentrating our orders with the top suppliers-around the world, we attempt to ensure prompt product availability, competitive pricing and failsafe results.
3
When customers use Ace as their Importing Partner, they get:
|
·
|
Established relationships with premium factories throughout the world
|
·
|
Customized product development and design service
|
|
·
|
Factory Direct Pricing
|
·
|
Detailed Import Proposals F.O.B. USA
|
|
·
|
Prototyping and Pre-Production Samples
|
·
|
Detailed correspondence and foreign translation
|
|
·
|
Overseas Inspection of finished goods
|
·
|
On-site inspections – as needed
|
|
·
|
Letter of intent provided for overseas orders
|
·
|
Fulfillment & Warehousing
At Ace, we can streamline the supply chain to take advantage of the economies of scale that result from large orders. We can fulfill orders and distribute customers items to one location or multiple locations across the country.
Ace Offers:
|
·
|
Cost Center Analysis
|
·
|
Mailing Services
|
|
·
|
Credit Card Authorization
|
·
|
Pick & Pack Services
|
|
·
|
Drop shipping Inventory World-Wide
|
·
|
Assembly
|
|
·
|
Inventory Storage
|
·
|
Product Fulfillment
|
|
·
|
Inventory Consolidation
|
·
|
Shipping Manifest
|
|
·
|
Invoice Consolidation
|
·
|
Customized Reporting
|
INTERACTIVE SOLUTIONS
Website Development
AcePlace CMS
- Ace has developed a proprietary Website Development Platform & Content Management System (CMS) that will quite simply changes the way a customer’s presence on the web is designed and managed. The recent addition of database-driven E-Mail, SMS Text & Newsletter capabilities make it a special Client Relationship Management Platform.
Mobile Websites
- Increasing numbers of web searches are originating from mobile devices as “smart phones” continue to dominate new phone sales. Most existing websites do not display properly on the much smaller mobile screens, and in many cases, cannot display at all. Search engines like Google give higher priority to WAP sites when the search originates from a mobile device. Having a Mobile Website running in parallel with a primary website solves this problem. Our solution recognizes the type of device (computer or mobile) and directs the information request to the appropriate format. AcePlace is:
|
|
·
|
Optimized to display Web content effectively;
|
|
|
·
|
Optimized for search engines used by mobile devices;
|
|
|
·
|
Optimized for easy data-field entry from mobile devices;
|
|
|
·
|
Customized High Quality and Visually pleasing design; and
|
|
|
·
|
Strategically developed to deliver vital content.
|
E-Commerce
When our customer needs a new web site built from the ground up or a complete overhaul of our customers existing design, we can expand our customers’ capabilities to include e-commerce or database management. Our solution provides:
|
|
·
|
Retail E-Commerce;
|
|
|
·
|
Online Company Stores;
|
|
|
·
|
Enable customers to sell products and services to their clients and fans; and
|
|
|
·
|
Seamless integration with customer websites.
|
4
Email Marketing
Email Marketing is one of the least expensive methods of Ace’s customers reaching out to large masses of potential clients. Ace can help our customers develop programs for building their email database, assist with the graphic design of their email templates and even provide a platform for individually personalized emails including variable data fields that can be tracked and reported in real-time. Supporting services include:
|
|
·
|
Database Building;
|
|
|
·
|
Easy-to-use Newsletter creation;
|
|
|
·
|
Effective tracking & reporting; and
|
|
|
·
|
Integration with client website.
|
Reward & Incentive Programs
After potential customers meet with one of our Incentive and Rewards Consultants,Ace will tailor a custom “solution” for our customers’ organization that will:
|
|
·
|
Fit our customers’ Price Point;
|
|
|
·
|
Engage our customers’ Target Audience; and
|
|
|
·
|
Deliver Measurable Results.
|
Ace’s custom Incentive Manager solution provides everything our customers needs to run an incentive program for their clients, channel partners, salespeople, and employees. Incentive Manager is award neutral: it can plug into almost any incentive award choices including:
|
·
|
Brand Name Merchandise;
|
|
·
|
Gift Cards;
|
|
·
|
Travel Incentives; and
|
|
·
|
Debit Cards.
|
Or, simply link our customers’ newly customized Rewards program with any product offered on Amazon! Through our exclusive technology agreement with Atrium Enterprises, we have secured the rights to offer Amazon product through seamless integration bringing award winning fulfillment and distribution along with an unparalleled array of quality product for our customer’s Incentive Program.
Interactive Message Video (IMV)
Our interactive message video solution is a great way to engage our customers’ audience and build their online database. IMV’s bring variable personalization to short, online video presentations. Through progressive tracking programming, names or messages can be variably placed inside existing video, personalizing the video for each consumer who views it. The variable message looks like it was actually live on set when the video was shot, and moves in real time. IMV’s are shot in high definition either on location or in-studio. They are a truly innovative, cutting-edge means of conveying our customers marketing message through entertainment, and to personalize the experience to each prospect with dynamic content without the time or expense of video re-shoots or re-editing. It will seem like we custom-created each video specifically for each client.
IMV’s Include:
|
|
·
|
A dynamic, personalized, online video designed to uniquely engage consumers, while gathering data to build and enhance our customers targeted consumer database.
|
|
|
·
|
An Integrated Enrollment Page allows individuals to enter personal information and participate in the personalized video experience.
|
|
|
·
|
Consumer’s personal information (name, age, sex, phone number, and favorite song) can be dynamically incorporated to personalize the video for them and their favorite store, product, celebrity, and sports team.
|
|
|
o
|
Personalized data can also be incorporated in the video or to a live action, pre-recorded phone call from their favorite celebrity, artist, athlete.
|
5
|
|
·
|
Our Customers are immersed into a new and innovative video experience.
|
|
|
·
|
Web based video with flexibility to reside anywhere on the internet
|
|
|
o
|
Websites, social media sites and blogs .
|
RELATIONSHIP MARKETING
Ace utilizes a wealth of direct marketing programs (“DRM”) that integrate flawlessly, resulting in stronger messages and superior results. By blending state-of-the-art technology with innovative, award-winning design, Ace delivers a comprehensive, interactive, and targeted direct marketing system.
Ace’s relationship marketing campaigns embrace data-driven personalization – using customer database information to target the marketing message to every recipient. These integrated programs build brand awareness, customer loyalty, and most importantly, increased response. Relationship marketing is the solution to attract new customers and keep existing ones: target the right group, use the proper combination of print, web, email and video to get a customer’s message across, and track the results.
DRM provides a dynamic, personalized turn-key marketing program for our customers business. DRM targets prospects that are most likely to buy our customers’ products/services, in addition to helping them reconnect with and reacquire their existing customers.
Relationship Marketing:
|
|
·
|
Data
- First, we’ll help our customers to analyze their customer data to develop an Ideal Customer Profile. Second, we’ll use the Ideal Customer Profile to identify “most likely prospects” within their target market.
|
|
|
·
|
Offer
- We’ll help our customers to develop offers that will get the attention of their existing and target customers.
|
|
|
·
|
Delivery
- We’ll use multiple delivery methods: Direct Mail, Email, SMS Text & Personal Websites to communicate our customer offer to their target audience.
|
The Key Benefits to Personalized Cross-Media Marketing:
Market to Truly Qualified Leads
|
|
·
|
Target consumers based on geographic, demographic, and psychographic data.
|
|
|
·
|
Pre-screen the consumers’ financial ability to purchase a customer’s product or service.
|
|
|
·
|
Target consumers who are more likely to purchase a customer’s product or service.
|
|
|
·
|
Achieve a lower per-customer acquisition cost than traditional media.
|
Impact Each & Every Target
– Send the Right Message to the Right Target at the Right time using the Right Delivery Method:
|
|
·
|
Flexible message format – change the content based on the demographic profile.
|
|
|
·
|
Grabs the attention of a customer’s potential clients with personalized, relevant information.
|
|
|
·
|
Our customer’s will have a greater understanding of their product/service because they’ll be more likely to engage with a clients message.
|
|
|
·
|
Variable graphics and offer: deliver relevancy to a customer’s target; increasing response rates by increasing the perceived value to the consumer.
|
6
The Acquisition/Reactivation Model:
Identify Our Customer’s Target
|
|
·
|
Acquisition:
Find clients that resemble our customer’s current client and targeted client base by age, income, gender or lifestyle interest, eliminating those who are unlikely to respond to messages sent by our customer’s business
|
|
|
·
|
Retention:
Create specific messages for our customer’s current client base to deliver relevant offers to increase their loyalty and referrals. Attraction Marketing can help our customer append their current data to fill in gaps in their customer list, such as most recent address, income, presence of children in household, lifestyle interest and much more.
|
Modeled Data
We can also work with our customers to improve their existing database through a cleansing (eliminating bad/outdated data) and appending (acquiring additional demographic data) process. From an enhanced database, we can model our customer’s current database to build a mailing list of prospective clients that share the closest statistical similarity to their existing customer base. This new list will have the highest propensity to become our customer’s new clients. Finally, Ace can utilize the additional data to personalize the message and delivery method to maximize response rates.
Delivery Methods for Delivering Personal, Relevant Marketing Messages
Direct Mail
Our direct mail is intended to:
|
|
·
|
Be personalized to the recipient; thereby increasing response rates by approximately 35%;
|
|
|
·
|
Contain variable message, graphics and offer, all in the same press run; and
|
|
|
·
|
Drive responders to personal VIP web site for data collection and increased response rates.
|
Broadcast E-Mail
Our Broadcast E-mail are anticipated to:
|
|
·
|
Personalize variable messaging and graphics
|
|
|
·
|
Increase response rates
|
|
|
·
|
Provide immediate Feedback; and
|
|
|
·
|
Obtain Response reporting.
|
Personalized VIP Websites
(P-URL’s)
- A personalized URL provides an additional media channel to expand on our customer’s marketing message. The web page look and feel is designed to match the branding established in the direct mail campaign. The VIP page allows our customers business to:
|
|
·
|
Build or refine their database of leads by collecting data from responders;
|
|
|
·
|
Offer unique time based incentives to drive response;
|
|
|
·
|
Drive qualified traffic to our customer’s website; and
|
|
|
·
|
Expand message outside target through viral refer-a-friend feature.
|
Call Tracking
- Toll free or local numbers are assigned to each mail campaign and list segment to track call response. Each prospect call “invisibly” routes through our system and rings to our customer’s direct dial lines. From our customer’s reporting site, they can review recordings of the phone calls for response analysis and training purposes.
|
|
·
|
All missed calls are tracked, a message is immediately sent to our customer’s designated e-mail address with the information about the caller, ensuring our customer never loses a prospect call; and
|
|
|
·
|
Valuable information about the caller is tracked (when and where the call was originated, how many times it rang before it was picked up, call outcomes, and much more).
|
7
Track Customers’ Campaign Results with Online, Real-Time Reporting
|
|
·
|
Our proprietary web-based reporting system combines all of the gathered information into one reporting engine for easy analysis.
|
|
|
·
|
We deliver analytics for our customer’s to learn what campaigns were successful, and which ones need improvement; all to ensure future success.
|
|
|
·
|
Our reporting systems can also track the effectiveness of our customer’s other media investments.
|
MOBILE MARKETING
SMS Text Platform.
SMS Messaging provides a cost-effective and highly interactive way for our customers to communicate with their clients via their mobile phones. Ace can help the customers design and implement programs that will allow our customers to cut through the clutter of traditional advertising and
reach their clients via their most-personal device
.
Mobile Websites.
With the rise of the “smart-phone”, the number of web-searches originating from mobile devices is skyrocketing. Ace can ensure that our customer’s website is capable of formatting for display on these much-smaller screens, which will dramatically improve both functionality and Search Engine Optimization.
QR Codes.
Ace brings our customer’s print media and promotional products to life with QR Codes. These unique codes can be placed on static media to create a dynamic point of interaction by engaging their consumers via their smart phones. QR Codes are an inexpensive way to automatically link our customers to their clients to a mobile website, initiate a text, app download or youtube video.
Location-Based Mobile Marketing.
Ace is one of the leading national providers of location-based Proximity Marketing services through its wholly-owned subsidiary, Mobiquity Networks. Proximity Marketing utilizes local Bluetooth & Wi-Fi networks to reach out to mobile devices that have entered “the Zone” to deliver rich digital-media content such as ringtones, wallpapers, videos, music, games, applications and coupons. Systems can be installed on a campaign-basis, or our customer can utilize Ace’s ever-expanding national network to deliver their message. Mobiquity Networks currently covers 75 of the nation’s premier mall properties and is represented in each of the top 10 DMA’s. The malls covered by this proprietary network have average monthly visits from 96 million shoppers. www.mobiquitynetworks.com
On January 5, 2011, we formed Mobiquity Networks, Inc. ("Mobiquity") for the purpose of attempting to develop a proximity marketing network and to derive revenues from same. Ace has assigned certain contracts described below (i.e. those contracts with Blue Bite LLC. and Eye Corp Pty Ltd.) pertaining to these start-up operations to Mobiquity.
The
Mobile Marketing
advertising medium continues to gain momentum in marketing spending. Technology allows advertisers to target and deliver rich media content to specific locations and times where it is most relevant. It gives advertisers the ability to reach consumers with their message as they are ready to make their purchasing decision.
Mobiquity
provides location-based mobile marketing services via Bluetooth and Wi-Fi that requires no GPS tracking and no need to download an application. Mobiquity utilizes a targeted, location-based approach to reach audiences on their mobile devices when it matters most. Mobiquity employs a combination of leading-edge mobile technologies to deliver virtually any digital media content including images, videos, audio mp3s, maps, games, applications and coupons to mobile phones within targeted geographic locations.
The Company has built an extensive location based mobile marketing mall network which currently enables access to over 96 million mobile customer visits per month while they are shopping. Our network allows brands to engage their potential customers with the right offer at the right place at the right time....when they are about to make a purchasing decision.
Mobiquity currently has over 600 zones throughout 75 malls with over 96 million monthly visits to those malls. These zones create a cloud of coverage so that visitors do not need to go directly to one of these zone access points. Some of our land mark malls include, but are not limited to:
|
|
·
|
Roosevelt Field - NY
|
|
|
·
|
The Galleria – Houston
|
|
|
·
|
Lenox Square – Atlanta
|
|
|
·
|
Northbridge – Chicago
|
|
|
·
|
Santa Monica Place – LA
|
|
|
·
|
Copley Place – Boston
|
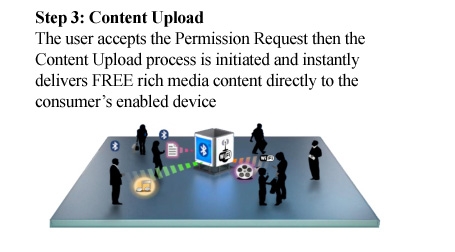
How it Works: A proximity broadcast station is set up in a location that is frequented by the target audience – a shopping mall, museum, bus stop, concert hall, etc. If an enabled device is in discoverable mode (which should be prompted by “call-to-action” signage) and comes within range, the Proximity Unit will ping the device and provide an opportunity for the user to accept or decline relevant content. This content can include text, still images, videos, audio files and more. If the user accepts, the Proximity Unit transfers the content to the device.
8
Proximity Marketing is being embraced by all kinds of organizations, including transportation services, sports arenas, financial institutions, malls and retail stores. Because the content is only limited to what can be stored on a file, virtually anything is possible, from free ringtones and travel updates to sales promotions and event information.
The advantages of Proximity Marketing include free transmission for both the sending and receiving parties; the ability to send rich content such as video, music and even Java applications; the ability to target an audience very locally; as well as the relative novelty of the application.


Because we control the network remotely, each location and campaign can be monitored whether they are down the block or across the country. With its precise statistical reporting as to how many consumers engaged in the campaign, advertisers now have an exciting new and measurable medium to communicate with consumers.
9
The Mobiquity AP Suite is a desktop software program used to manage and control all access points throughout the entire network from a remote location. The content management tool adapts multimedia content like videos, audios, images, animations, vouchers, links, text, etc. to the screen size and technical requirements of each mobile device. The integrated software tool tracks information pertaining to the success or failure of message delivery, message open rates, and conversion rates. The Suite allows a Sequential Content Schedule to program the sending of content to the same user when detected in the same place at a different time or day. Automated Creation of applications (JAVA and Windows Mobile), allows the creation and modification of text, images, WAP links, menus, etc. using templates. All of this can be done remotely and in real time. The content manager programs in advance, multiple campaigns and creates grids of content. It offers the ability to set up to 20 campaigns simultaneously per access point with 10 sequential pieces of content per campaign and provides real time statistics and charts of detected devices, content downloads, and model of mobile devices that interact with the network.
Mobiquity’s is currently in 75 malls representing over 96 million visits per month. Fifty of the malls that Mobiquity currently operates are owned by Simon Property Group (NYSE: SPG). The remaining 17 mall locations are owned by Macerich (NYSE: MAC). Simon Property Group is the largest and Macerich is the third largest mall operators in the U.S.
For the exclusive use of Bluetooth throughout the common areas of their top 50 malls until December, 2015, the Company paid Simon Property Group a one-time $250,000 rights fee and pays $1,000 per month per mall. The agreement with Simon also allows for non-exclusive use of Wi-Fi.
The Company is currently installed in 25 Macerich malls throughout the US. Macerich currently has 76 shopping malls in the US and had over 650 million shopping visits in 2010. Ace is currently discussing expanding throughout the Macerich mall portfolio.
Growth Strategy
Location-Based Mobile Marketing combined with Out-Of-Home Advertising results in strong opt-in rates due to proximity of the Network. Management believes that we have the first Location-Based Mobile Marketing Company focused on US shopping malls and we have built and control the only national proximity marketing mall network. Our exclusive contract with leading Out-Of-Home advertising company, Eye Corp. enables us to remain a leader in US malls. According to the agreement, Eye Corp. is exclusive to us for five years. Eye Corp. is a subsidiary of Ten Network Holdings, a public company with its headquarters in Australia. Eye Corp. has an exclusive agreement with Simon Malls to manage their non-digital assets in all mall properties and has a full-time sales force of 26 individuals that maintain relationships with over 800 brands. The sales team of Eye Corp. will be paid a commission on Mobiquity proximity products. Discussions have begun between Eye Corp. and Ace about expanding their exclusive relationship to global malls and airports.
Business Partners
We have partnered with Blue Bite LLC. (“Blue Bite”), a premier provider of Proximity Marketing hardware and software solutions, and Eye Corp Pty Ltd., (“EyeCorp”) an out-of-home media company which operates the largest mall advertising display network in the United States, to roll-out an expansive network which comprises of retail, dining, transportation, sporting, music, and other high traffic venues.
Agreement with Simon Property Group, L.P.
In April 2011, we signed an exclusive rights agreement with a top mall developer (the "Simon Property Group") to create a location-based mobile marketing network called
Mobiquity Networks
. The 50 mall agreement runs through December of 2015 and includes top malls in the Simon Mall portfolio. (Note: A list of these malls can be found by going to
www.mobiquitynetworks.com
website under the network tab). This new alliance will give advertisers the opportunity to reach millions of mall visitors per month with mobile digital content and offers when they are most receptive to advertising messages.
In connection with Eye Corp., Mobiquity Networks will deliver digital content and offers to shoppers on their mobile devices through Eye Corp’s extensive mall advertising network. Eye Corp and Mobiquity Networks have an exclusive agreement to build a location-based mobile marketing network throughout Eye Corp’s Mall Advertising network. New properties to be added to the Mobiquity Networks portfolio will include iconic malls in the top designated market area in the US. These prestigious malls further complement Mobiquity Networks’ portfolio of prominent malls including Queens Center Mall in New York City, Northbridge in Chicago, and Santa Monica Place in Los Angeles.
10
Our location-based mobile advertising medium is designed to reach on-the-go shoppers via their mobile devices with free rich media content delivered using Bluetooth or Wi-Fi. This advertising medium offers extremely targeted messaging engineered to engage and influence shoppers as they move about the mall environment. Eye Corp. and our company will jointly create mobile marketing programs for existing clients in conjunction with their already active in mall advertising programs. Mobiquity Networks proximity marketing units will be strategically positioned in shopping malls near entrances, anchor stores, escalators and other high-traffic, and high dwell-time areas. Mobiquity Networks proximity marketing unit placement takes advantage of the opportunity to provide a reminder to consumers and touch them just before making a purchase decision. These units generate high awareness and brand recognition at the right time and place. When combined with the impact of other visual advertising mediums (in mall assets) or as a stand-alone medium, Mobiquity Networks is a great mobile solution to promote a brand on a local or national level.
Our Distribution and Marketing Strategy
Key elements of our distribution and marketing strategy are as follows:
|
|
·
|
We have created a suite of solutions for one stop shopping.
With its newly developed suite of solutions in place, Ace now offer its clients and potential clients the ability to work smarter in addressing their marketing needs by leveraging technology platforms. The services and technology platforms assembled within each of our four business verticals allow Ace to provide its clients with an exceptional mix of solutions for reaching their customers in ways that were previously impossible. Clients have the ability to choose a single solution within a vertical or a complete package of solutions working together seamlessly. By offering the entire suite of solutions, the need for multiple vendors has been eliminated, and Ace can be a single source provider of Branding, Interactive, Direct Relationship Marketing and Mobile Marketing Solutions.
|
|
|
·
|
We have partnered with leading companies for our proximity marketing business.
We have partnered with Blue Bite LLC. (“Blue Bite”), a premier provider of Proximity Marketing hardware and software solutions, and Eye Corp Pty Ltd., (“EyeCorp”) an out-of-home media company which operates the largest mall advertising display network in the United States, to roll-out an expansive network which comprises of retail, dining, transportation, sporting, music, and other high traffic venues. As a result of these relationships, in April 2011, we were able to enter into an exclusive rights agreement with the Simon Property Group to create a location-based mobile marketing network in top malls across the United States in the Simon Mall portfolio. This new alliance will give advertisers the opportunity to reach millions of mall visitors a month with mobile digital content and offers when they are most receptive to advertising messages.
|
|
|
·
|
Creating awareness of our products, services and facilities.
We have been in business since March 1998. Our revenues are derived from existing customers and new customers through word of mouth recommendations, attendance at trade shows, our sales representatives and advertising and promotion in trade journals.
|
|
|
·
|
Our company was built as a platform that could grow easily.
Scalability is the key and we have separate departments with defined roles which will allow this to occur and for our salesperson to sell. Our sales persons receive helpful support from us. In many other distributorships, the salesperson is often responsible for everything from answering phones, doing all their own research, processing orders, billing, tracking and collections. At our company, we provide complete backup to allow our sales persons to just sell. Since our technology is currently up to date, including in house servers to allow access to our systems from off-site, we have the ability to pick up salespeople from any location in the United States.
|
|
|
·
|
Providing generous incentives to our sales people to increase performance levels.
We offer competitive commissions in addition to back office support and research assistance to allow our independent sales representatives to optimize their sales time and to provide them with adequate incentives to sell promotional products to our customers rather than for our competitors. In the future, we may offer a stock option program for additional incentives.
|
|
|
·
|
Maintain a competitive gross profit percentage on all sales orders.
For the years ended December 31, 2011 and 2010, our gross profit percentage was 25.5% and 29.4%, respectively.
|
|
|
·
|
Provide research, consulting, design and fulfillment services to our customers to increase profitability.
We design promotional products for our customers and provide consulting services in connection therewith. We utilize licensed research software technology and order entry systems that are available to anyone in the industry for license to provide the best services to our customers in the timeliest fashion
possible
.
|
11
Sales and Marketing
Our revenues for branding, interactive and direct relationship marketing are derived from existing customers and new customers through word of mouth recommendations, attendance at trade shows, our sales representatives and advertising and promotion in trade journals. Our Ace Marketing website is utilized for multiple purposes, including providing information to potential customers who want to learn about us and research our available product line. Except primarily our two executive officers, our sales representatives receive commissions and are not paid a salary. They work at their own location or at our facility and may sell products on behalf of other companies. We encourage our sales representatives to sell promotion products for us on the basis of sales incentives which include competitive commissions and appropriate sales support and research which are provided in-house by our employees. In the future, we intend to offer stock and/or stock options as part of their incentive programs. Our revenues for mobile marketing are derived through our relationship with Eye Corp. and our own sales marketing representatives. Eye Corp. has an exclusive agreement with Simon Malls to manage their non-digital assets in all mall properties and has a full-time sales force of about 25 individuals that maintain relationships with over 800 brands. The sales team of Eye Corp. will be paid a commission on Mobiquity proximity products. Discussions have begun between Eye Corp. and Ace about expanding their exclusive relationship to global malls and airports.
Proximity Marketing Business is new and unproven/Competition will likely enter the market place and we may be unable to compete
In 2008, we became an authorized distributor, provider and reseller in the United States of mobile advertising solutions, in the mobile advertising and proximity marketing industry. As of December 31, 2011, we have not generated any significant revenue from this new and unproven segment of our business. A primary business focus of Ace is to attempt to place our proximity marketing units into businesses on a local, regional and potentially on a national scale, and to then generate revenues through advertisers seeking new measurable media channels that can accurately target and engage key consumer segments and deliver compelling relevant content that can be enjoyed for what it is, shared with friends, interactively engage with or commercially acted upon instantaneously. It is our intent to enable advertisers to promote their business by sending animated images, audio files, video clips, text files, promotional or discount contents, bar codes, mobile games and java applications and business card files. We can also send live data such as news and sports updates to targeted mobile phones. The ABI Research report published in January 2008 on mobile marketing refers to the industry as still being in its “wild west” years but forecasts it will settle down and become a $24 billion slice of the worldwide marketing and advertising pie by 2013. While Management intends to market the proximity boxes as a premier mobile technology, we can provide no assurances that Ace will successfully establish a local, regional and/or national network containing its proximity marketing boxes or that sufficient advertising revenues and profits (if any) will result to justify the expenditures thereof. We also can provide no assurances that we will be able to compete with large and small competitors that are in (or may enter) the Proximity Marketing industry with substantially larger resources and management experience.
Competition
Our interactive solutions (website development) and direct relationship marketing (database management) verticals compete against thousands of small, medium and large companies throughout the United States. We can provide no assurances that our business will be able to compete in these business verticals against other companies that may have more financial resources and greater experience than the Company.
With respect to our branding and branded merchandise (promotional products vertical), while our competition in this business vertical is extensive with over 20,000 distributors, we believe that there are no companies that dominate the market in which we operate. Our company competes within the industry on the basis of service, competitive prices, personnel relationships and competitive commissions to our sales representatives to sell promotional products for us rather than our competitors. Competitors’ advantages over us may include better financing, greater experience and better service, cheaper prices and personal relationships than us.
According to the Promotional Products Association International, with no single company dominating the market, the promotional products industry is highly fragmented with 21,150 distributors in the industry with revenues of less than $2.5 million and 857 distributors with revenues of $2.5 million or more. According to The Counselor – State of the Industry 2010 Survey, the top ten distributors in our industry are believed to have 2009 North American sales of over $1.6 billion. Staples, Pro Forma Inc., Group II Communications/IMS, BDA, and 4 Imprint were the top five distributors of 2009 with estimated sales of $360 million, $234 million, $207 million, $198 million and $165 million, respectively. Nearly 80% of the distributors surveyed are reported to be privately owned family businesses. Management believes that control of sales lies predominantly with the independent sales representatives, as there is little brand recognition at this time.
We believe that in the promotional products industry, sales people typically have a large amount of autonomy and control the relationships with their customers. This works both for and against us. To avoid losing customers, we must provide the appropriate incentives to keep sales people. At the same time, while there can be no assurances, management believes our company will be able to obtain new customers by luring sales people away from competitors. The offering of stock incentives and health care benefits are ways to retain sales people, especially in an industry where these types of benefits are rare.
12
Employees
As of February 29, 2012, we had 12 full time employees, including three executive officers who provide in-house sales, our Chief Financial Officer and 6 support staff employees. We utilize 8 sales representatives of which two are employees who provide services on an exclusive basis and six additional persons who provide services to us on a non-exclusive basis as independent consultants.
Legal Proceedings
We are currently not subject to any threatened or pending legal proceedings. Nevertheless, we may from time-to-time become a party to various legal proceedings arising in the ordinary course of our business.
YOU SHOULD CAREFULLY CONSIDER THE FOLLOWING RISK FACTORS, IN ADDITION TO THE OTHER INFORMATION PRESENTED IN THIS FORM 10-K, IN EVALUATING US AND OUR BUSINESS. ANY OF THE FOLLOWING RISKS, AS WELL AS OTHER RISKS AND UNCERTAINTIES, COULD HARM OUR BUSINESS AND FINANCIAL RESULTS AND CAUSE THE VALUE OF OUR SECURITIES TO DECLINE, WHICH IN TURN COULD CAUSE YOU TO LOSE ALL OR PART OF YOUR INVESTMENT.
RISKS RELATING TO OUR BUSINESS
History of operating losses.
Since we went public in 2005, we have experienced a continued history of operating losses. For the years ended December 31, 2011, 2010, and 2009 we incurred a net loss of $2,209,508, $1,762,256 and $1,577,010, respectively. Our operating losses for the past three years are attributable to the general state of the economy. We can provide no assurances that our operations will be profitable in the future. During the fiscal years ended December 31, 2011, 2010 and 2009, we have completed financings totaling $2,222,727, $1,124,250 and $1,628,300, respectively. We can provide no assurances that we will be able to continue to raise additional financing to supplement our liquidity and capital resource needs on terms satisfactory to us if at all.
Our proximity marketing business is new, unproven and the establishment of this business may not result in sufficient revenues and profitability to justify the expenditures thereof. Also there are no assurances that we will be able to successfully compete in the proximity marketing business.
In 2008, we became an authorized distributor, provider and reseller in the United States of mobile advertising solutions, in the mobile advertising and proximity marketing industry. As of December 31, 2011, we have not generated any significant revenue from this new and unproven segment of our business. A primary business focus of Ace is to attempt to place our proximity marketing units into businesses on a local, regional and potentially on a national scale, and to then generate revenues through advertisers seeking new measurable media channels that can accurately target and engage key consumer segments and deliver compelling relevant content that can be enjoyed for what it is, shared with friends, interactively engage with or commercially acted upon instantaneously. It is our intent to enable advertisers to promote their business by sending animated images, audio files, video clips, text files, promotional or discount contents, bar codes, mobile games and java applications and business card files. We can also send live data such as news and sports updates to targeted mobile phones. The ABI Research report published in January 2008 on mobile marketing refers to the industry as still being in its “wild west” years but forecasts it will settle down and become a $24 billion slice of the worldwide marketing and advertising pie by 2013. It estimates there was about $1.8 billion spent in 2007 on all forms of mobile marketing. While Management intends to market the proximity boxes as a premier mobile technology, we can provide no assurances that Ace will successfully establish a local, regional and/or national network containing its proximity marketing boxes or that sufficient advertising revenues and profits (if any) will result to justify the expenditures thereof. We also can provide no assurances that we will be able to compete with large and small competitors that are in (or may enter) the Proximity Marketing industry with substantially larger resources and management experience.
13
Dependence upon our agreements with our business partners, Blue Bite LLC and Eye Corp. Pty Ltd. to execute on our proximity marketing plans as well as our dependence upon our agreement with Simon Property Group, L.L.P.
We have partnered with Blue Bite LLC. (“Blue Bite”), a premier provider of Proximity Marketing hardware and software solutions, and Eye Corp Pty Ltd., (“EyeCorp”) an out-of-home media company which operates the largest mall advertising display network in the United States, to roll-out an expansive network which comprises of retail, dining, transportation, sporting, music, and other high traffic venues. In April 2011, we signed an exclusive rights agreement with a Top Mall Developer (the "Simon Property Group") to create a location-based mobile marketing network called Mobiquity Networks. The 50 mall agreement runs through December of 2015. We are dependent upon our agreements with Blue Bite, Eye Corp. and Simon Property Group to execute on the development of our Proximity Marketing business and to attempt to achieve profitable operations. We can provide no assurances that our operations will be profitable.
We cannot predict our future capital needs and we may not be able to secure additional financing.
As of January 31, 2012,
w
e will need to raise additional financing to support our Proximity Marketing operations and for general business operations. We can provide no assurances that additional equity or debt financings will be available to us on mutually satisfactory terms, if at all. Such additional financings may involve substantial dilution of our stockholders or may require that we relinquish rights to certain of our technologies or products. In addition, we may experience operational difficulties and delays due to working capital restrictions. Failure to secure additional financing on favorable terms could have severe adverse consequences to us.
The promotional products distribution industry is highly competitive and we may not be able to compete successfully.
We compete with over 20,000 distributor companies. Some of our competitors have greater financial and other resources than we do which could allow them to compete more successfully. Most of our promotional products are available from several sources and our customers tend to have relationships with several distributors. Competitors could obtain exclusive rights to market particular products which we would then be unable to market and may provide business solutions related to promotional products competitive with those provided by us. Industry consolidation among promotional products distributors, the unavailability of products, whether due to our inability to gain access to products or interruptions in supply from manufacturers, or the emergence of new competitors could also increase competition. In the future, we may be unable to compete successfully and competitive pressures may reduce our revenues.
We experience fluctuations in quarterly earnings. As a result, we may fail to meet or exceed the expectations of securities analysts and investors, which could cause our stock price to decline.
Our business has been subject to seasonal and other quarterly fluctuations. Net sales and operating profits generally have been higher in the third and fourth quarters, particularly in the months of September through November, due to the timing of sales of promotional products and year-end promotions. Net sales and operating profits have been lower in the first quarter, primarily due to increased sales in the prior two quarters. Quarterly results may also be adversely affected by a variety of other factors, including:
|
·
|
costs of developing new promotions and services;
|
|
·
|
costs related to acquisitions of businesses;
|
|
·
|
the timing and amount of sales and marketing expenditures;
|
|
·
|
general economic conditions, as well as those specific to the promotional product industry; and
|
|
·
|
our success in establishing additional business relationships.
|
Any change in one or more of these or other factors could cause our annual or quarterly operating results to fluctuate. If our operating results do not meet market expectations, our stock price may decline in the event a market should develop.
Because we do not manufacture the promotional products we distribute, we are dependent upon third parties for the manufacture and supply of our promotional products. We obtain all of our promotional products from third-party suppliers, both domestically and overseas primarily in China. We submit purchase orders to our suppliers who are not committed to supply products to us. Therefore, suppliers may be unable to provide the products we need in the quantities we request. Because we lack control of the actual production of the promotional products we sell, we may be subject to delays caused by interruption in production based on conditions outside of our control. In the event that any of our third-party suppliers were to become unable or unwilling to continue to provide the products in required volumes, we would need to identify and obtain acceptable replacement sources on a timely cost effective basis. There is no guarantee that we will be able to obtain such alternative sources of supply on a timely basis, if at all. An extended interruption in the supply of our products would have an adverse effect on our results of operations, which most likely would adversely affect the value of our common stock.
We may not be able to expand through internal growth and meet changes in the industry.
Our plans for internal growth include hiring in-house sales representatives from our competitors and offering stock incentives and generous commissions to keep them. Additionally, we have room for growth by building direct relationships with advertising agencies and major corporations. Because of potential industry changes, our products and promotions must continue to evolve to meet changes in the industry. Our future expansion plans may not be successful due to competition, competitive pressures and changes in the industry.
Our limited cash resources and lack of a line of credit may restrict our expansion opportunities.
An economic issue that can limit our growth is lack of extensive cash resources and lack of a working capital line of credit. Any lack of cash resources would limit our ability to take orders from customers and to place Proximity Marketing Units in malls across the country. We can provide no assurances that we will obtain additional resources and/or an adequate line of credit in the future, if at all.
14
Our revenues depend on our relationships with capable independent sales personnel over whom we have no control as well as key customers, vendors and manufacturers of the products we distribute.
Our future operating results depend on our ability to maintain satisfactory relationships with qualified independent Sales personnel as well as key customers, vendors and manufacturers. We are dependent upon our independent sales representatives to sell our products and services and do not have any direct control over these third parties. If we fail to maintain our existing relationships with our independent sales representatives, key customers, vendors and manufacturers or fail to acquire new relationships with such key persons in the future, our business may suffer.
Our future performance is materially dependent upon our management and their ability to manage our growth.
Our future success is substantially dependent upon the efforts and abilities of members of our existing management, particularly Dean L. Julia, Chief Executive Officer, Michael Trepeta, President and Sean Trepeta, President of Mobiquity Networks. The loss of the services of these persons could have a material adverse effect on our business. We have an employment agreement with each of Messrs. Julia and M. Trepeta expiring March 1, 2015. However, we lack "key man" life insurance policies on any of our officers or employees. Competition for additional qualified management is intense, and we may be unable to attract and retain additional key personnel. The number of management personnel is currently limited and they may be unable to manage our expansion successfully and the failure to do so could have a material adverse effect on our business, results of operations and financial condition.
RISKS RELATING TO AN INVESTMENT IN OUR COMMON STOCK
We lack an established trading market for our common stock, and you may be unable to sell your common stock at attractive prices or at all.
There is currently a limited trading market for our common stock in the OTC electronic bulletin board under the symbol "AMKT." There can be no assurances given that an established public market will be obtained for our common stock or that any public market will last. The trading price of the common stock depends on many factors, including:
|
·
|
costs of developing new promotions and services;
|
|
·
|
costs related to acquisitions of businesses;
|
|
·
|
the timing and amount of sales and marketing expenditures;
|
|
·
|
general economic conditions, as well as those specific to the promotional product industry; and
|
|
·
|
our success in establishing additional business relationships.
|
As a result, we cannot assure you that you will be able to sell your common stock at attractive prices or at all.
The market price for our common stock may be highly volatile.
The market price for our common stock may be highly volatile. A variety of factors may have a significant impact on the market price of our common stock, including:
|
·
|
the publication of earnings estimates or other research reports and speculation in the press or investment community;
|
|
·
|
changes in our industry and competitors;
|
|
·
|
our financial condition, results of operations and prospects;
|
|
·
|
any future issuances of our common stock, which may include primary offerings for cash, and the grant or exercise of stock options from time to time;
|
|
·
|
general market and economic conditions; and
|
|
·
|
any outbreak or escalation of hostilities, which could cause a recession or downturn in our economy.
|
In addition, the markets in general can experience extreme price and volume fluctuations that can be unrelated or disproportionate to the operating performance of the companies listed or quoted. Broad market and industry factors may negatively affect the market price of our common stock, regardless of actual operating performance. In the past, following periods of volatility in the market price of a company's securities, securities class action litigation has often been instituted against companies. This type of litigation, if instituted, could result in substantial costs and a diversion of management's attention and resources, which would harm our business.
We do not anticipate paying cash dividends in the future.
No cash dividends have been paid by the Company on our common stock. The future payment by us of cash dividends on our common stock, if any, rests within the discretion of our board of directors and will depend, among other things, upon our earnings, our capital requirements and our financial condition as well as other relevant factors. We do not intend to pay cash dividends upon our common stock for the foreseeable future.
15
Provisions of our Articles of Incorporation and agreements could delay or prevent a change in control of our Company.
Certain provisions of our articles of incorporation may discourage, delay, or prevent a merger or acquisition that a shareholder may consider favorable. These provisions include:
|
·
|
Authority of the board of directors to issue preferred stock; and
|
|
·
|
Prohibition on cumulative voting in the election of directors.
|
Our future sales of Common Stock by management and other stockholders may have an adverse effect on the then prevailing market price of our Common Stock. In the event a public market for our common stock is sustained in the future, sales of our common stock may be made by holders of our public float or by holders of restricted securities in compliance with the provisions of Rule 144 of the Securities Act of 1933. In general, under Rule 144, a non-affiliated person who has satisfied a six-month holding period in a fully reporting company under the Securities Exchange Act of 1934, as amended, may, sell their restricted Common Stock without volume limitation, so long as the issuer is current with all reports under the Exchange Act in order for there to be adequate common public information. Affiliated persons may also sell their common shares held for at least six months, but affiliated persons will be required to meet certain other requirements, including manner of sale, notice requirements and volume limitations. Non-affiliated persons who hold their common shares for at least one year will be able to sell their common stock without the need for there to be current public information in the hands of the public. Future sales of shares of our public float or by restricted common stock made in compliance with Rule 144 may have an adverse effect on the then prevailing market price, if any, of our common stock.
Lack of Audit Committee.
The Sarbanes-Oxley Act of 2002 requires us as a public corporation to have an audit committee composed solely of independent directors. Currently, we have two independent directors but lack having an Audit Committee of the Board of Directors. See “Item 10.”
Our Common Stock may be considered “penny stock” and may be difficult to trade
. The SEC has adopted regulations that generally define “penny stock” to be an equity security that has a market or exercise price of less than $5.00 per share, subject to specific exemptions. The market price of our Common Stock may be less than $5.00 per share and, therefore, may be designated as a “penny stock” according to SEC rules. This designation requires any broker or dealer selling these securities to disclose certain information concerning the transaction, obtain a written agreement from the purchaser and determine that the purchaser is reasonably suitable to purchase the securities. These rules may restrict the ability of brokers or dealers to sell our Common Stock and may affect the ability of investors to sell their Shares. In addition, since our Common Stock is quoted on the OTCBB, investors may experience a lack of buyers to purchase such stock or a lack of market makers to support the stock price.
Not Applicable.
Our principal executive offices are located at 457 Rockaway Avenue, Valley Stream, NY 11581. We currently lease approximately 4,000 square feet of office space at this facility at an annual cost of approximately $59,000 pursuant to a month-to-month lease. We also lease approximately 2,000 square feet of space, expiring in November 2012, at an annual cost of approximately $28,000 (inclusive of taxes) at 1105 Portion Road, Farmingville, NY 11738.
In February 2012, the Company entered into a lease agreement for new executive office space of approximately 4,200 square feet located at 600 Old Country Road, Garden City, NY 11530. Not later than May 1, 2012, the Company will move its Valley Stream, NY office facilities into this space. The lease agreement is for 63 months. The annual rent under this office facility for the first year is estimated at $127,000, including electricity, subject to an annual increase of 3%. In the event of a default in which the Company is evicted from the office space, Ace would be responsible to the landlord for an additional payment of rent of $160,000 in the first year of the lease, an additional payment of $106,667 in the second year of the lease and an additional payment of rent of $53,333 in the third year of the lease. Such additional rent would be payable at the discretion of the Company in cash or in Common Stock of the Company.
We are currently not subject to any threatened or pending legal proceedings. Nevertheless, we may from time to time become a party to various legal proceedings arising in the ordinary course of our business.
16
Purchases of Equity Securities.
Since June 9, 2005, our common stock has been traded on the OTC Bulletin Board under the symbol "AMKT." Our common stock trades on a limited basis on the OTC Electronic Bulletin Board in the Over-the-Counter Market. The following table sets forth the range of high and low sales prices of our Common Stock for the last two fiscal years.
|
Quarters Ended
|
High
|
Low
|
||||||
|
March 31, 2010
|
$ .65
|
.40
|
||||||
|
June 30, 2010
|
.62
|
.25
|
||||||
|
September 30, 2010
|
.65
|
.11
|
||||||
|
December 31, 2010
|
.80
|
.23
|
||||||
|
March 31, 2011
|
.40
|
.17
|
||||||
|
June 30, 2011
|
.70
|
.16
|
||||||
|
September 30, 2011
|
1.85
|
.50
|
||||||
|
December 31, 2011
|
1.30
|
.55
|
||||||
The closing sales price on February 29, 2012 was $.61 per share. All quotations provided herein reflect inter-dealer prices, without retail mark-up, markdown or commissions.
In the event a public market for our common stock is sustained in the future, sales of our common stock may be made by holders of our public float or by holders of restricted securities in compliance with the provisions of Rule 144 of the Securities Act of 1933. In general, under Rule 144, a non-affiliated person who has satisfied a six-month holding period in a fully reporting company under the Securities Exchange Act of 1934, as amended, may, sell their restricted Common Stock without volume limitation, so long as the issuer is current with all reports under the Exchange Act in order for there to be adequate common public information. Affiliated persons may also sell their common shares held for at least six months, but affiliated persons will be required to meet certain other requirements, including manner of sale, notice requirements and volume limitations. Non-affiliated persons who hold their common shares for at least one year will be able to sell their common stock without the need for there to be current public information in the hands of the public. Future sales of shares of our public float or by restricted common stock made in compliance with Rule 144 may have an adverse effect on the then prevailing market price, if any, of our common stock. See "Risk Factors."
As of February 29, 2012, there were approximately 106 holders of record of our common stock, although we believe that there are other persons who are beneficial owners of our common stock held in street name. Our transfer agent is Continental Stock Transfer & Trust Company, 17 Battery Place, 8th Floor, New York, NY 10004.
DIVIDEND POLICY
We have never paid any cash dividends and intend, for the foreseeable future, to retain any future earnings for the development of our business. Our Board of Directors will determine our future dividend policy on the basis of various factors, including our results of operations, financial condition, capital requirements and investment opportunities.
17
RECENT SALES OF UNREGISTERED SECURITIES
For the period January 1, 2011 through February 29, 2012, there were no sales of unregistered securities, except as follows:
|
Date of Sale
|
Title of Security
|
Number Sold
|
Consideration Received
and Description of
Underwriting or Other
Discounts to Market
Price or Convertible
Security, Afforded to
Purchasers
|
Exemption from
Registration
Claimed
|
If Option, Warrant
or Convertible
Security, terms of
exercise or
conversion
|
|
January 2011
|
Common Stock
|
150,000 shares and 200,000
Class E warrants
|
Services rendered;
no commissions paid
|
Section 4(2)
|
Warrants exercisable at $.30 per share through August 31, 2013
|
|
March 2011
|
Common Stock and
Class E Warrants
|
2,516,666 shares and
2,516,666 warrants
|
$755,000; no commissions paid
|
Rule 506
|
Warrants exercisable at $.30 per share through August 31, 2013
|
|
April 2011
|
Common Stock and Class E warrants
|
100,000 shares and Class E
warrants to purchase 100,000 shares
|
Services rendered;
no commissions paid
|
Rule 506
|
Warrants exercisable at $.30 per share through August 31, 2013
|
|
May 1/ June 2011
|
Common Stock
and Class F
Warrants
|
1,025,000 shares,
Class F
Warrants to purchase 1,025,000 shares and Class G Warrants to purchase 900,000 shares, respectively.
|
$461,250; no commissions
Paid
|
Rule 506
|
Class F Warrants exercisable at $.50 per share through May 31, 2014, Class G Warrants exercisable at $.60 per share through May 31, 2014 August 31, 2013
|
|
July/August 2011
|
Common Stock and Class H
Warrants
|
1,950,000 shares, 1,980,000 Warrants (includes 30,000 Warrants issued to Placement Agent)
|
$975,000; $15,000 commission paid
|
Rule 506
|
Class H Warrants exercisable at $.60 per share through July 31, 2014
|
|
September 2011
|
Common Stock
|
159,810 shares
|
Cashless exercise of Warrants; no commissions paid
|
Section 3(a)(9)
|
Warrants exercised on cashless basis
|
|
August/
September 2011
|
Common Stock
|
325,000 shares
|
Services rendered; no commissions paid
|
Section 4(2)
|
Not applicable.
|
|
August 2011
|
Common Stock
|
65,000 shares
|
Services rendered; no
commissions paid
|
Section 4(2)
|
Not applicable.
|
|
December 2011
|
Common Stock
|
66,000
|
Services rendered; no
Commissions paid
|
Section 4(20
|
Not applicable.
|
|
January 2012
|
Common Stock and Class AAWarrants
|
958,338 shares, 191,671 Warrants (excludes 95,833 Warrants issued to Placement Agent)
|
$575,000; $51,750 commission paid;
$25,000 advisory fee
paid (exclusive of legal
and due diligence costs)
|
Rule 506
|
Class AAWarrants exercisable at $.60 per share through January 18, 2016
|
|
February 2012
|
Common Stock
|
150,000 shares
|
Services rendered; no
Commissions paid
|
Section 4(2)
|
Not applicable
|
18
____________________
(b) Rule 463 of the Securities Act is not applicable to the Company.
(c) For the year ended December 31, 2011, there were no repurchases by the Company of its Common Stock.
RECENT PURCHASES OF SECURITIES
In 2011, we have had no repurchases of our common stock.
Not Applicable.
19
The following discussion should be read in conjunction with our financial statements and the notes thereto appearing elsewhere in this Form 10-K. All statements contained herein that are not historical facts, including, but not limited to, statements regarding anticipated future capital requirements, our future plan of operations, our ability to obtain debt, equity or other financing, and our ability to generate cash from operations, are based on current expectations. These statements are forward-looking in nature and involve a number of risks and uncertainties that may cause the Company's actual results in future periods to differ materially from forecasted results.
Overview
Ace Marketing & Promotions, Inc. is a publicly traded company on the OTCBB under the ticker symbol: AMKT. The Company began as a promotional products company and has since evolved into an integrated marketing solutions company. Ace currently focuses on four business verticals; Branding, Interactive, Direct Relationship Marketing and Mobile Marketing.
The
Mobile Marketing
advertising medium continues to gain momentum in marketing spending. Technology allows advertisers to target and deliver rich media content to specific locations and times where it is most relevant. It gives advertisers the ability to reach consumers with their message as they are ready to make their purchasing decision.
Ace Marketing & Promotions’ subsidiary
Mobiquity Networks
provides location-based mobile marketing services via Bluetooth and Wi-Fi that requires no GPS tracking and no need to download an application. Mobiquity utilizes a targeted, location-based approach to reach audiences on their mobile devices when it matters most. Mobiquity employs a combination of leading-edge mobile technologies to deliver virtually any digital media content including images, videos, audio mp3s, maps, games, applications and coupons to mobile phones within targeted geographic locations.
The Company has built an extensive location based mobile marketing mall network which currently enables access to over 96 million mobile customer visits per month while they are shopping. Our network allows brands to engage their potential customers with the right offer at the right place at the right time....when they are about to make a purchasing decision.
Mobiquity currently has over 600 zones throughout 75 malls with over 96 million monthly visits to those malls. These zones create a cloud of coverage so that visitors do not need to go directly to one of these zone access points. Some of our land mark malls include, but are not limited to:
|
|
·
|
Roosevelt Field - NY
|
|
|
·
|
The Galleria – Houston
|
|
|
·
|
Lenox Square – Atlanta
|
|
|
·
|
Northbridge – Chicago
|
|
|
·
|
Santa Monica Place – LA
|
|
|
·
|
Copley Place – Boston
|
Location-Based Mobile Marketing combined with Out-Of-Home Advertising results in strong opt-in rates due to proximity of the Network. Through its subsidiary Mobiquity Networks, Management believes that Ace is the first Location-Based Mobile Marketing Company focused on US shopping malls and has built and controls the only national proximity marketing mall network. An exclusive contract with leading Out-Of-Home advertising company, Eye Corp. will enable Ace to remain a leader in US malls. According to the agreement, Eye Corp. is exclusive to Ace for five years. Eye Corp. is a subsidiary of Ten Network Holdings, a public company with its headquarters in Australia. Eye Corp. has an exclusive agreement with Simon Malls to manage their non-digital assets in all mall properties and has a full-time sales force that maintains relationships with over 800 brands. The sales team of Eye Corp. will be paid a commission and will be required to fulfill a sales quota on Mobiquity proximity products. Discussions have begun between Eye Corp. and Ace about expanding their exclusive relationship to global malls and airports.
CRITICAL ACCOUNTING POLICIES
Our discussion and analysis of our financial condition and results of operations are based upon our financial statements, which have been prepared in accordance with generally accepted accounting principles in the United States. The preparation of financial statements requires management to make estimates and disclosures on the date of the financial statements. On an on-going basis, we evaluate our estimates including, but not limited to, those related to revenue recognition. We use authoritative pronouncements, historical experience and other assumptions as the basis for making judgments. Actual results could differ from those estimates. We believe that the following critical accounting policies affect our more significant judgments and estimates in the preparation of our financial statements.
20
REVENUE RECOGNITION - Revenue is recognized when title and risk of loss transfers to the customer and the earnings process is complete. In general, title passes to our customers upon the customer's receipt of the merchandise. Revenue is recognized on a gross basis since the Company has the risks and rewards of ownership, latitude in selection of vendors and pricing, and bears all credit risk. Advance payments made by customers are included in customer deposits.
ALLOWANCE FOR DOUBTFUL ACCOUNTS. We are required to make judgments based on historical experience and future expectations, as to the realizability of our accounts receivable. We make these assessments based on the following factors: (a) historical experience, (b) customer concentrations, customer credit worthiness, (d) current economic conditions, and (e) changes in customer payment terms.
Results of Operations
2011 versus 2010
The following table sets forth certain selected condensed statement of operations data for the periods indicated in dollars. In addition, we note that the period-to-period comparison may not be indicative of future performance.
|
Years Ended December 31
|
||||||||
|
2011
|
2010
|
|||||||
|
Revenue
|
$
|
3,243,318
|
$
|
3,170,035
|
||||
|
Cost of Revenues
|
2,417,834
|
2,237,396
|
||||||
|
Gross Profit
|
825,484
|
932,639
|
||||||
|
Operating Expenses
|
3,033,448
|
2,694,826
|
||||||
|
Loss from operations
|
(2,207,964
|
)
|
(1,762,187
|
)
|
||||
|
Net Loss
|
(2,209,508
|
)
|
(1,762,256
|
)
|
||||
|
Preferred Stock Dividend
|
--
|
--
|
||||||
|
Net Loss Allocable to Common Stockholders
|
(2,209,508
|
)
|
(1,762,256
|
)
|
||||
|
Net (Loss) per common Share
|
(.11
|
)
|
(.13
|
)
|
||||
|
Weighted average common Shares outstanding
|
20,566,33
|
13,520,411
|
||||||
We generated revenues of $3,243,318 for 2011 compared to $3,170,035 in 2010. The increase in revenues of $73,283 in 2011 compared to 2010 is due to the increased efforts of our sales force.
Cost of revenues was $2,417,834 or 74.5% of revenues for 2011 compared to $2,237,396 or 70.6% of revenues for 2010. Cost of revenues includes purchases and freight costs associated with the shipping of merchandise to our customers.
Gross profit was $825,484 for 2011 or 25.5% of net revenues compared to $932,639 in the same period of 2010 or 29.4% of revenues. Gross profits will vary period-to-period depending upon a number of factors including the mix of items sold, pricing of the items and the volume of product sold. Also, it is our practice to pass freight costs on to our customers.
Selling, general, and administrative expenses were $3,033,448 for 2011 as compared to $2,694,826 for 2010. Such costs include payroll and related expenses, commissions, insurance, rents, professional, consulting and public awareness fees. The overall increase of $338,622 was primarily due to a $244,062 increase in rents for our proximity marketing vertical and $99,387 increase in payroll.
Net loss from operations was $(2,207,964) for 2011 compared to a net loss of $(1,762,187) for 2010. Our increase in net loss for 2011 as compared to the comparable period of the prior year was due to an increase in rents for our proximity marketing segment as described above. No benefit for income taxes is provided for 2011 and 2010 due to the full valuation allowance on the net deferred tax assets. Our ability to be profitable in the future is dependent upon both a turnaround in the United States economy and the successful introduction and usage of our proximity marketing services by our clients.
Liquidity and Capital Resources
The Company had cash and cash equivalents of $605,563 at December 31, 2011.
Cash used by operating activities for the year ended December 31, 2011 was $(1,786,001). This resulted primarily from a net loss of $2,209,508 and an increase in accounts payable and accrued expenses of $179,680, partially offset by stock based compensation of $474,556 and a increase in accounts receivable of $236,032. Cash was used in investing activities of $594,744, which funds were used to acquire property and equipment primarily for purchases of proximity marketing boxes. Cash provided by financing activities of $2,222,727 was the result of the sale of our company common stock.
21
Cash used by operating activities for the year ended December 31, 2010 was $(1,023,774). This resulted primarily from a net loss of $1,762,256 and a decrease in accounts payable and accrued expenses of $199,021, partially offset by stock based compensation of $706,635 and a decrease in accounts receivable of $234,663. Cash was used in investing activities of $173,056, which funds were used to acquire property and equipment primarily for purchases of proximity marketing boxes. Cash provided by financing activities of $1,364,800 was the result of the sale of our company common stock.
Our company commenced operations in 1998 and was initially funded by our three founders, each of whom has made demand loans to our Company that have been repaid. Since 1999, we have relied on equity financing and borrowings from outside investors to supplement our cash flow from operations.
We anticipate that our future liquidity requirements will arise from the need to finance our accounts receivable and inventories, hire additional sales persons and capital expenditures. The primary sources of funding for such requirements will be cash generated from operations, raising additional capital from the sale of equity or other securities and borrowings under debt facilities which currently do not exist. We believe that we can generate sufficient cash flow from these sources to fund our operations for at least the next fifteen months.
Recent Financings
In the past two fiscal years ended December 31, 2011 and the period January 1, 2012 through January 31, 2017, the Company completed the following private placement offerings with non-affiliated persons except as otherwise noted:
On December 8, 2009, Ace Marketing & Promotions, Inc. entered into an Introducing Agent Agreement with Legend Securities, Inc., a FINRA registered broker-dealer ("Legend"), to attempt to raise additional financing through the sale of its Common Stock and Warrants. Between December 8, 2009 and March 15, 2010, the Company closed on gross proceeds of $1,025,000 before commissions of $117,000. The planned use of proceeds is to primarily expand the Company's mobile and interactive divisions. The Company issued pursuant to the terms of the offering an aggregate of 2,050,000 shares of Common Stock at a per share price of $.50 per share and 1,025,000 Warrants exercisable at $1.00 per share to investors in the offering and placement agent warrants to purchase an amount equal to 10% of the number of shares and the number of warrants sold in the offering. All securities were issued pursuant to Rule 506 of Regulation D promulgated under Section 4(2) of the Securities Act of 1933, as amended.
In August 2010, the Company raised $175,000 in gross proceeds from the sale of 437,500 shares and a like number of Warrants expiring in August 2013. The investor paid $0.40 per Share and received Warrants exercisable at $0.60 per Share. In November 2010, the Company commenced a plan of financing and raised an additional $800,500 in financing from the sale of 2,934,999 Shares of its restricted Common Stock at $0.30 per Share and Common Stock Purchase Warrants to purchase a like number of Shares, exercisable at $0.30 per Share through August 31, 2013. Subsequent to the completion of the second financing, the Company agreed to adjust the terms of the August 2010 transaction and issue to the August 2010 investor Shares and Warrants on the same terms as those sold in November - December 2010. Accordingly, an additional 145,833 Shares and a like number of Warrants were issued to the August 2010 investor, with the exercise price of the Warrants being lowered from $0.60 per Share to $0.30 per Share. All securities will be issued pursuant to Section 4(2) and/or Rule 506 of Regulation D promulgated under Section 4(2) of the Securities Act of 1933, as amended.
In March 2011, the Company commenced a private placement offering. Pursuant to said offering between March 29, 2011 and April 19, 2011, the Company raised $755,000 in gross proceeds from the sale of 2,516,666 shares of common stock and a like number of warrants, exercisable at $.30 per share through August 31, 2013. Exemption is claimed for the sale of securities pursuant to Rule 506 and/or Section 4(2) of the Securities Act of 1933, as amended.
Between May 25, 2011 and June 3, 2011, the Company received gross proceeds of $461,250 from the sale of 1,025,000 shares of Common Stock at a purchase price of $.45 per share. The sale of stock was also accompanied by Warrants expiring on May 31, 2014. Exemption is claimed for the sale of securities pursuant to Rule 506 and/or Section 4(2) of the Securities Act of 1933, as amended.
In July 2011, the Company commenced a private placement offering. Pursuant to said offering between July14, 2011 and August 1, 2011, the Company raised $975,000 in gross proceeds from the sale of 1,950,000 shares of common stock and a like number of warrants, exercisable at $.60 per share through July 31, 2014. Of the $975,000, $250,000 was invested by Thomas Arnost who later became a director of the Company in December 2011. Mr. Arnost received 500,000 shares of Common Stock and Warrants to purchase 500,000 shares in the offering. Exemption is claimed for the sale of securities pursuant to Rule 506 and/or Section 4(2) of the Securities Act of 1933, as amended.
On January 30, 2012, the Company’s private placement offering was terminated. Rockwell Global Capital LLC acted as Placement Agent. The Company received gross proceeds of $575,000 from the sale of 958,338 shares of Common Stock at a purchase price of $.60 per share. The private placement offering also included the sale of Warrants to purchase 191,671 shares of Common Stock, exercisable at $.60 per share and expiring on January 18, 2016. The Placement Agent received a $25,000 advisory fee, $51,750 in commissions and warrants to purchase 95,833 shares identical to the warrants sold to investors in the offering. Exemption is claimed for the sale of securities pursuant to Rule 506 and/or Section 4(2) of the Securities Act of 1933, as amended.
The Company is required to file a Registration Statement with the Securities and Exchange Commission (“SEC”) to register the resale of the shares of Common Stock sold in the private placement offering and the resale of the shares of Common Stock issuable upon exercise of the Class AA Warrants (collectively the “Registrable Shares”). If a Registration Statement covering the Registrable Shares is not filed with the SEC on or before March 15, 2012 or is not declared effective within 120 days of January 30, 2012 (subject to a 60 day extension in the event the SEC is performing a full review of the Registration Statement), the Company shall pay to each investor as liquidated damages, a payment equal to 1.5% of the aggregate amount invested by such investor in the offering, cumulative for every 30 day period until such Registration Statement has been filed or declared effective or a portion thereof. Such liquidated damages shall not exceed 15% per annum. The Company, at its sole discretion, shall pay the liquidated damage payment in cash and/or Common Stock of the Company based upon the closing sale price of the Company’s Common Stock on the trading day preceding the date triggering the payment of the liquidated damages.
22
Market risk is the risk of loss arising from adverse changes in market rates and prices, such as interest rates, foreign currency exchange rates and commodity prices. Our primary exposure to market risk is interest rate risk associated with our short term money market investments. The Company does not have any financial instruments held for trading or other speculative purposes and does not invest in derivative financial instruments, interest rate swaps or other investments that alter interest rate exposure. The Company does not have any credit facilities with variable interest rates.
Financial Statements and Supplementary Data
The report of the Independent Registered Public Accounting Firm, Financial Statements and Schedules are set forth beginning on page F-1 of this Annual Report on Form 10-K, following this page.
23
ACE MARKETING &
PROMOTIONS, INC.
|
CONTENTS
|
|
|
YEARS ENDED DECEMBER 31, 2011 AND 2010
|
PAGES
|
|
CONSOLIDATED FINANCIAL STATEMENTS
|
|
|
Reports of Independent Registered Public Accounting Firm
|
F-1
|
|
Consolidated Balance Sheets
|
F-2
|
|
Consolidated Statements of Operations
|
F-3
|
|
Consolidated Statement of Stockholders' Equity
|
F-4
|
|
Consolidated Statements of Cash Flows
|
F-5
|
|
Notes to Consolidated Financial Statements
|
F-6
|
F-1
|
Peter Messineo
Certified Public Accountant
1982 Otter Way Palm Harbor FL 34685
peter@pm-cpa.com
T 727.421.6268 F 727.674.0511
|
Report of Independent Registered Public Accounting Firm
Board of Directors and Stockholders
Ace Marketing & Promotions, Inc.
Valley Stream, New York
I have audited the accompanying consolidated balance sheets of Ace Marketing & Promotions, Inc. (the "Company") for the years ended December 31, 2011 and 2010 and the related consolidated statements of operations, stockholders' equity and cash flows for the years then ended. These consolidated financial statements are the responsibility of the Company's management. My responsibility is to express an opinion on these consolidated financial statements based on my audits.
I conducted my audit in accordance with standards of the Public Company Accounting Oversight Board (United States). Those standards require that I plan and perform the audit to obtain reasonable assurance about whether the financial statements are free of material misstatement. The Company is not required to have, nor was I engaged to perform, an audit of its internal control over financial reporting. My audits included consideration of internal control over financial reporting as a basis for designing audit procedures that are appropriate in the circumstances, but not for the purpose of expressing an opinion on the effectiveness of the Company's internal control over financial reporting. Accordingly, I express no such opinion. An audit includes examining, on a test basis, evidence supporting the amounts and disclosures in the financial statements. An audit also includes assessing the accounting principles used and significant estimates made by management, as well as evaluating the overall financial statement presentation. I believe that my audits provide a reasonable basis for my opinion.
In my opinion, the consolidated financial statements referred to above present fairly, in all material respects, the financial position of Ace Marketing & Promotions, Inc. as of December 31, 2011 and 2010 and the results of its operations and its cash flows for the years then ended, in conformity with accounting principles generally accepted in the United States of America.
/s/ Peter Messineo, CPA
Peter Messineo, CPA
Palm Harbor, Florida
February 27, 2012
F-2
| ACE MARKETING & | ||
| PROMOTIONS, INC. | ||
|
Condensed Balance Sheets
|
||
December 31,
|
2011
|
2010
|
|||||||
|
Assets
|
||||||||
|
Current Assets:
|
||||||||
|
Cash and cash equivalents
|
$ | 605,563 | $ | 763,581 | ||||
|
Accounts receivable, net of allowance for doubtful accounts of
$20,000 at December 31, 2010 and December 31, 2011
|
534,924 | 298,892 | ||||||
|
Prepaid expenses and other current assets
|
342,641 | 218,336 | ||||||
|
Total Current Assets
|
1,483,128 | 1,280,809 | ||||||
|
Property and Equipment, net
|
714,865 | 249,726 | ||||||
|
Other Assets
|
7,745 | 7,745 | ||||||
|
Total Assets
|
$ | 2,205,738 | $ | 1,538,280 | ||||
|
Liabilities and Stockholders' Equity
|
||||||||
|
Current Liabilities:
|
||||||||
|
Accounts payable
|
$ | 399,924 | $ | 243,795 | ||||
|
Accrued expenses
|
121,821 | 98,270 | ||||||
|
Total Current Liabilities
|
521,745 | 342,065 | ||||||
|
Commitments and Contingencies
|
||||||||
|
Stockholders' Equity:
|
||||||||
|
Preferred Stock, $.0001 par value; 5,000,000 shares authorized,
none issued
|
||||||||
|
Common stock, $.0001 par value; 100,000,000 shares authorized;
23,284,236 and 16,834,260 shares issued and outstanding
at December 31, 2011 and December 31, 2010, respectively
|
2,328 | 1,683 | ||||||
|
Additional paid-in capital
|
10,997,407 | 8,300,766 | ||||||
|
Accumulated deficit
|
(9,284,241 | ) | (7,074,733 | ) | ||||
| 1,715,494 | 1,227,716 | |||||||
|
Less: Treasury Stock, at cost, 23,334 shares
|
(31,501 | ) | (31,501 | ) | ||||
|
Total Stockholders' Equity
|
1,683,993 | 1,196,215 | ||||||
|
Total Liabilities and Stockholders' Equity
|
$ | 2,205,738 | $ | 1,538,280 | ||||
|
See notes to condensed financial statements.
|
F-3
|
ACE MARKETING &
|
|||
|
PROMOTIONS, INC.
|
|||
|
Condensed Statements of Operations
|
|||
|
Years Ended December 31,
|
|||
|
2011
|
2010
|
|||||||
|
Revenues, net
|
$ | 3,243,318 | $ | 3,170,035 | ||||
|
Cost of Revenues
|
2,417,834 | 2,237,396 | ||||||
|
Gross Profit
|
825,484 | 932,639 | ||||||
|
Operating Expenses:
|
||||||||
|
Selling, general and administrative expenses
|
3,033,448 | 2,694,826 | ||||||
|
Total Operating Expenses
|
3,033,448 | 2,694,826 | ||||||
|
Loss from Operations
|
(2,207,964 | ) | (1,762,187 | ) | ||||
|
Other Income (Expense):
|
||||||||
|
Interest expense
|
(2,177 | ) | (818 | ) | ||||
|
Interest income
|
633 | 749 | ||||||
|
Total Other Income (Expense)
|
(1,544 | ) | (69 | ) | ||||
|
Net Loss
|
$ | (2,209,508 | ) | $ | (1,762,256 | ) | ||
|
Net Loss Per Common Share:
|
||||||||
|
Basic
|
$ | (0.11 | ) | $ | (0.13 | ) | ||
|
Diluted
|
$ | (0.11 | ) | $ | (0.13 | ) | ||
|
Weighted Average Common Shares Outstanding:
|
||||||||
|
Basic
|
20,566,338 | 13,520,411 | ||||||
|
Diluted
|
20,566,338 | 13,520,411 | ||||||
|
See notes to condensed financial statements.
|
F-4
| ACE MARKETING & | |||||||||
| PROMOTIONS, INC. | |||||||||
|
Statement of Stockholders' Equity
|
|||||||||
|
Years Ended December 31, 2010 and 2011
|
|||||||||
|
Total
|
Additional
|
|||||||||||||||||||||||||||
| Stockholders' | Common Stock |
Paid-in
|
Treasury Stock
|
|||||||||||||||||||||||||
|
Equity
|
Shares
|
Amount
|
Capital
|
(Deficit)
|
Shares
|
Amount
|
||||||||||||||||||||||
|
Balance, at December 31, 2009
|
$ | 887,036 | 11,615,703 | $ | 1,163 | $ | 6,229,851 | $ | (5,312,477 | ) | 23,334 | $ | (31,501 | ) | ||||||||||||||
|
Stock Purchase
|
1,364,800 | 4,672,499 | 467 | 1,364,333 | ||||||||||||||||||||||||
|
Stock Warrant
|
15,064 | 15,064 | ||||||||||||||||||||||||||
|
Stock Grant
|
155,649 | 546,058 | 53 | 155,596 | ||||||||||||||||||||||||
|
Stock Compensation
|
535,922 | 535,922 | ||||||||||||||||||||||||||
|
Net Loss
|
(1,762,256 | ) | (1,762,256 | ) | ||||||||||||||||||||||||
|
Balance, at December 31, 2010
|
$ | 1,196,215 | 16,834,260 | $ | 1,683 | $ | 8,300,766 | $ | (7,074,733 | ) | 23,334 | $ | (31,501 | ) | ||||||||||||||
|
Stock Purchase
|
2,222,727 | 5,616,666 | $ | 562 | $ | 2,222,165 | ||||||||||||||||||||||
|
Stock Warrant
|
25,522 | 134,810 | $ | 13 | $ | 25,509 | ||||||||||||||||||||||
|
Stock Grant
|
141,153 | 698,500 | 70 | 141,083 | ||||||||||||||||||||||||
|
Stock Compensation
|
307,884 | 307,884 | ||||||||||||||||||||||||||
|
Net Loss
|
(2,209,508 | ) | $ | (2,209,508 | ) | |||||||||||||||||||||||
|
Balance, at December 31, 2011
|
$ | 1,683,993 | 23,284,236 | $ | 2,328 | $ | 10,997,407 | $ | (9,284,241 | ) | 23,334 | $ | (31,501 | ) | ||||||||||||||
|
See notes to condensed financial statements.
|
F-5
| ACE MARKETING & | ||
| PROMOTIONS, INC. | ||
|
Condensed Statements of Cash Flows
|
||
Years Ended December 31,
|
2011
|
2010
|
|||||||
|
Cash Flows from Operating Activities:
|
||||||||
|
Net loss
|
$ | (2,209,508 | ) | $ | (1,762,256 | ) | ||
|
Adjustments to reconcile net loss to
net cash used in operating activities:
|
||||||||
|
Depreciation and amortization
|
129,607 | 56,961 | ||||||
|
Stock-based compensation
|
474,556 | 706,635 | ||||||
|
Changes in operating assets and liabilities:
|
||||||||
|
(Increase) decrease in operating assets:
|
||||||||
|
Accounts receivable
|
(236,032 | ) | 234,663 | |||||
|
Prepaid expenses and other assets
|
(124,304 | ) | (60,756 | ) | ||||
|
Increase (Decrease) in operating liabilities:
|
||||||||
|
Accounts payable and accrued expenses
|
179,680 | (199,021 | ) | |||||
|
Total adjustments
|
423,507 | 738,482 | ||||||
|
Net Cash Used in Operating Activities
|
(1,786,001 | ) | (1,023,774 | ) | ||||
|
Cash Flows from Investing Activities:
|
||||||||
|
Acquisition of property and equipment
|
(594,744 | ) | (173,056 | ) | ||||
|
Net Cash (Used) in Provided by Investing Activities
|
(594,744 | ) | (173,056 | ) | ||||
|
Cash Flows from Financing Activities:
|
||||||||
|
Proceeds from issuance of common stock
|
2,222,727 | 1,364,800 | ||||||
|
Net Cash Provided by Financing Activities
|
2,222,727 | 1,364,800 | ||||||
|
Net Increase (decrease) in Cash and Cash Equivalents
|
(158,018 | ) | 167,970 | |||||
|
Cash and Cash Equivalents, beginning of period
|
763,581 | 595,611 | ||||||
|
Cash and Cash Equivalents, end of period
|
$ | 605,563 | $ | 763,581 | ||||
|
See notes to condensed financial statements.
|
F-6
ACE MARKETING & PROMOTIONS, INC.
NOTES TO CONSOLIDATED FINANCIAL STATEMENTS
YEARS ENDED DECEMBER 31, 2011 AND 2010
NATURE OF OPERATIONS - Ace Marketing & Promotions, Inc. (the "Company") is a full service advertising specialties and promotional products company that distributes items typically with logos to large corporations, schools and universities, financial institutions and not-for-profit organizations. Specific categories of promotional products include advertising specialties, business gifts, incentives and awards, and premiums.
In Fiscal 2008, the Company became an authorized distributor, provider and reseller of mobile advertising solutions. To date, the Company has not generated any significant revenue from this segment.
PRINCIPLES OF CONSOLIDATION - The accompanying consolidated financial statements include the accounts of Ace Marketing & Promotions, Inc. and its wholly owned subsidiary, Mobiquity Networks, Inc. All intercompany accounts and transactions have been eliminated in consolidation.
REVENUE RECOGNITION - Revenue is recognized when title and risk of loss transfers to the customer and the earnings process is complete. In general, title passes to our customers upon the customer's receipt of the merchandise. Revenue is recognized on a gross basis since the Company has the risks and rewards of ownership, latitude in selection of vendors and pricing, and bears all credit risk. Advance payments made by customers are included in customer deposits.
The Company records all shipping and handling fees billed to customers as revenues, and related costs as cost of goods sold, when incurred.
ALLOWANCE FOR DOUBTFUL ACCOUNTS - Management must make estimates of the uncollectability of accounts receivable. Management specifically analyzes accounts receivable and analyzes historical bad debts, customer concentrations, customer credit-worthiness, current economic trends and changes in customer payment terms when evaluating the adequacy of the allowance for doubtful accounts.
PROPERTY AND EQUIPMENT - Property and equipment are stated at cost. Depreciation is provided using the straight-line method over the estimated useful lives of the related assets. Leasehold improvements are being amortized using the straight-line method over the estimated useful lives of the related assets or the remaining term of the lease. The costs of additions and improvements, which substantially extend the useful life of a particular asset, are capitalized. Repair and maintenance costs are charged to expense. When assets are sold or otherwise disposed of, the cost and related accumulated depreciation are removed from the account and the gain or loss on disposition is reflected in operating income.
F-7
ACE MARKETING & PROMOTIONS, INC.
NOTES TO CONSOLIDATED FINANCIAL STATEMENTS
YEARS ENDED DECEMBER 31, 2011 AND 2010
CONCENTRATION OF CREDIT RISK - Financial instruments, which potentially subject the Company to concentrations of credit risk, consist principally of trade receivables and cash and cash equivalents.
Concentration of credit risk with respect to trade receivables is generally diversified due to the large number of entities comprising the Company's customer base and their dispersion across geographic areas principally within the United States. The Company routinely addresses the financial strength of its customers and, as a consequence, believes that its receivable credit risk exposure is limited.
The Company places its temporary cash investments with high credit quality financial institutions. At times, the Company maintains bank account balances, which exceed FDIC limits. The Company has not experienced any losses in such accounts and believes that it is not exposed to any significant credit risk on cash. Management does not believe significant credit risk exists at December 31, 2011 and 2010.
CASH AND CASH EQUIVALENTS - The Company considers all highly liquid debt instruments with a maturity of three months or less, as well as bank money market accounts, to be cash equivalents.
ESTIMATES - The preparation of financial statements in conformity with generally accepted accounting principles requires management to make estimates and assumptions that affect the reported amounts of assets and liabilities and disclosure of contingent assets and liabilities at the date of the financial statements and the reported amounts of revenues and expenses during the reporting period. Actual results could differ from those estimates.
NET INCOME PER SHARE - Basic net income per share is computed by dividing income available to common shareholders by the weighted-average number of common shares outstanding. Diluted earnings per share reflect, in periods in which they have a dilutive effect, the impact of common shares issuable upon exercise of stock options. The number of common shares potentially issuable upon the exercise of certain options and warrants that were excluded from the diluted loss per common share calculation was approximately 16,100,000 and 9,364,000 because they are anti-dilutive, as a result of a net loss for the years ended December 31, 2011 and 2010, respectively.
F-8
ACE MARKETING & PROMOTIONS, INC.
NOTES TO CONSOLIDATED FINANCIAL STATEMENTS
YEARS ENDED DECEMBER 31, 2011 AND 2010
ADVERTISING COSTS - Advertising costs are expensed as incurred. For the year ended December 31, 2011 there were no expenses, in 2010 there were $2,850 in costs.
ACCOUNTING FOR STOCK BASED COMPENSATION. Stock based compensation cost is measured at the grant date fair value of the award and is recognized as expense over the requisite service period. The Company uses the Black-Sholes option-pricing model to determine fair value of the awards, which involves certain subjective assumptions. These assumptions include estimating the length of time employees will retain their vested stock options before excising them (“expected term”), the estimated volatility of the Company’s common stock price over the expected term (“volatility”) and the number of options for which vesting requirements will not be completed (“forefitures”). Changes in the subjective assumptions can materially affect estimates of fair value stock-based compensation, and the related amount recognized on the consolidated statements of operations. Refer to Note 8 “Stock Option Plans” in the Notes to Consolidated Financial Statements in this report for a more detailed discussion.
INCOME TAXES - Deferred income taxes are recognized for temporary differences between financial statement and income tax basis of assets and liabilities for which income tax or tax benefits are expected to be realized in future years. A valuation allowance is established to reduce deferred tax assets, if it is more likely than not, that all or some portion of such deferred tax assets will not be realized. The effect on deferred taxes of a change in tax rates is recognized in income in the period that includes the enactment date.
RECENTLY ISSUED ACCOUNTING PRONOUNCEMENTS
In June 2009, the FASB issued new accounting guidance that established the FASB Accounting Standards Codification (“Codification”), as the single source of authoritative GAAP to be applied by nongovernmental entities, except for the rules and interpretive releases of the SEC under authority of federal securities laws, which are sources of authoritative GAAP for SEC registrants. The FASB will no longer issue new standards in the form of Statements, FASB Staff Positions, or Emerging Issues Task Force Abstracts; instead the FASB will issue Accounting Standards Updates. Accounting Standards Updates will not be authoritative in their own right as they will only serve to update the Codification. These changes and the Codification itself do not change GAAP. This new guidance became effective for interim and annual periods ending after September 15, 2009. Other than the manner in which new accounting guidance is referenced, the Codification did not have an effect on the Company’s financial statements.
F-9
ACE MARKETING & PROMOTIONS, INC.
NOTES TO CONSOLIDATED FINANCIAL STATEMENTS
YEARS ENDED DECEMBER 31, 2011 AND 2010
In January 2010, the FASB issued ASU No. 2010-06 regarding fair value measurements and disclosures and improvement in the disclosure about fair value measurements. This ASU requires additional disclosures regarding significant transfers in and out of Levels 1 and 2 of fair value measurements, including a description of the reasons for the transfers. Further, this ASU requires additional disclosures for the activity in Level 3 fair value measurements, requiring presentation of information about purchases, sales, issuances, and settlements in the reconciliation for fair value measurements. This ASU is effective for fiscal years beginning after December 15, 2010, and for interim periods within those fiscal years. We are currently evaluating the impact of this ASU; however, we do not expect the adoption of this ASU to have a material impact on our financial statements.
In February 2010, the FASB issued ASU No. 2010-09 regarding subsequent events and amendments to certain recognition and disclosure requirements. Under this ASU, a public company that is a SEC filer, as defined, is not required to disclose the date through which subsequent events have been evaluated. This ASU is effective upon the issuance of this ASU. The adoption of this ASU did not have a material impact on our financial statements.
In April 2010, the FASB issued ASU No. 2010-18 regarding improving comparability by eliminating diversity in practice about the treatment of modifications of loans accounted for within pools under Subtopic 310-30 – Receivable – Loans and Debt Securities Acquired with Deteriorated Credit Quality (“Subtopic 310-30”). Furthermore, the amendments clarify guidance about maintaining the integrity of a pool as the unit of accounting for acquired loans with credit deterioration. Loans accounted for individually under Subtopic 310-30 continue to be subject to the troubled debt restructuring accounting provisions within Subtopic 310-40, Receivables—Troubled Debt Restructurings by Creditors. The amendments in this Update are effective for modifications of loans accounted for within pools under Subtopic 310-30 occurring in the first interim or annual period ending on or after July 15, 2010. The amendments are to be applied prospectively. Early adoption is permitted. We are currently evaluating the impact of this ASU; however, we do not expect the adoption of this ASU to have a material impact on our financial statements.
Except for rules and interpretive releases of the SEC under authority of federal securities laws and a limited number of grandfathered standards, the FASB Accounting Standards Codification™ (“ASC”) is the sole source of authoritative GAAP literature recognized by the FASB and applicable to the Company. Management has reviewed the aforementioned rules and releases and believes any effect will not have a material impact on the Company's present or future financial statements.
F-10
ACE MARKETING & PROMOTIONS, INC.
NOTES TO CONSOLIDATED FINANCIAL STATEMENTS
YEARS ENDED DECEMBER 31, 2011 AND 2010
Property and equipment, net, consist of the following at December 31:
|
USEFUL LIVES
|
2011
|
2010
|
|||||||
|
Furniture and Fixtures
|
5 years
|
$
|
986,785
|
$
|
392,039
|
||||
|
Leasehold Improvements
|
5 years
|
8,919
|
8,919
|
||||||
|
995,704
|
400,958
|
||||||||
|
Less Accumulated Depreciation
|
280,839
|
151,232
|
|||||||
|
$
|
714,865
|
$
|
249,726
|
||||||
Depreciation expense for the years ended December 31, 2011 and 2010 was $129,607 and $56,961, respectively.
F-11
ACE MARKETING & PROMOTIONS, INC.
NOTES TO THE CONSOLIDATED FINANCIAL STATEMENTS
DECEMBER 31, 2011 AND 2010
The provision for income taxes for the years ended December 31, 2011 and 2010 is summarized as follows:
|
2011
|
2010
|
|||||||
|
Current:
|
||||||||
|
Federal
|
$
|
-
|
-
|
|||||
|
State
|
-
|
-
|
||||||
|
-
|
-
|
|||||||
|
Deferred:
|
||||||||
|
Federal
|
-
|
-
|
||||||
|
State
|
-
|
-
|
||||||
|
$
|
-
|
$
|
-
|
|||||
The Company has federal and state net operating loss carryforwards of approximately $5,836,000, which can be used to reduce future taxable income through 2030.
The tax effects of temporary differences which give rise to deferred tax assets (liabilities) are summarized as follows:
F-12
ACE MARKETING & PROMOTIONS, INC.
NOTES TO THE CONSOLIDATED FINANCIAL STATEMENTS
DECEMBER 31, 2011 AND 2010
|
YEARS ENDED DECEMBER 31,
|
||||||||
|
2011
|
2010
|
|||||||
|
Deferred Tax Assets:
|
||||||||
|
Net operating loss carryforwards
|
$
|
2,808,000
|
$
|
1,924,000
|
||||
|
Stock based compensation
|
1,276,000
|
1,086,000
|
||||||
|
Allowance for doubtful accounts
|
8,000
|
8,000
|
||||||
|
Deferred Tax Assets
|
4,092,000
|
3,018,000
|
||||||
|
Less Valuation Allowance
|
4,092,000
|
3,018,000
|
||||||
|
Net Deferred Tax Asset
|
$
|
-
|
$
|
-
|
||||
A reconciliation of the federal statutory rate to the Company's effective tax rate is as follows:
|
YEARS ENDED DECEMBER 31,
|
||||||||
|
2011
|
2010
|
|||||||
|
Federal Statutory Tax Rate
|
34.00%
|
34.00%
|
||||||
|
State Taxes, net of Federal benefit
|
6.00%
|
6.00%
|
||||||
|
Change in Valuation Allowance
|
(40.00%
|
)
|
(40.00%
|
)
|
||||
|
Total Tax Expense
|
0.00%
|
0.00%
|
||||||
F-13
ACE MARKETING & PROMOTIONS, INC.
NOTES TO THE CONSOLIDATED FINANCIAL STATEMENTS
DECEMBER 31, 2011 AND 2010
PRIVATE PLACEMENT OF SECURITIES - During fiscal 2004, the Company sold through a private placement, 14.74 units (each consisting of 50,000 common shares and 50,000 Class A Warrants). Each Class A Warrant had an exercise price of $2.00 and was to expire on January 3, 2007. The Company extended the expiration date of the Class A Warrants to July 1, 2009. The Class A Warrants expired on September 30, 2009.
During fiscal 2005, the Company completed a private placement through the sale of 10 units (each consisting of 10,000 common shares and 10,000 Class B Warrants) at a purchase price of $10,000 per unit for net proceeds of $95,000, net of transaction cost of approximately $5,000. Each Class B Warrant had an exercise price of $2.00 and expires on January 2, 2008. Subsequent to December 31, 2007, the Company extended the expiration date of the Class B Warrants to July 1, 2009. The Class B Warrants expired on September 30, 2009.
During fiscal 2006, the Company completed a private placement (the "Offering") through the sale of 15.859 units (each consisting of 60,000 common shares and 30,000 Class C Warrants) at a purchase price of $105,000 per unit for net proceeds of $1,420,937, net of transaction costs of approximately $244,000. Each Class C Warrant has an exercise price of $1.75 per share and expires on June 30, 2009. The Class C Warrants expired on September 30, 2009
Pursuant to the Offering, the Placement Agent was issued 139,680 shares of the Company's common stock and a warrant to purchase 95,160 shares of common stock at an exercise price of $1.00 per share. The Placement Agent warrants expired on June 29, 2011.
In February 2009, we sold 500,000 shares of our Common Stock at an exercise price of $.50 per share, payable one-half immediately and the balance in March 2009 through the retirement of a $125,000 Note.
F-14
ACE MARKETING & PROMOTIONS, INC.
NOTES TO THE CONSOLIDATED FINANCIAL STATEMENTS
DECEMBER 31, 2011 AND 2010
On July 14, 2009, the Company entered into a Placement Agent Agreement with Sierra Equity Group LLC, a FINRA registered broker-dealer ("Sierra"), to attempt to raise additional financing through the sale of its Common Stock and Warrants. Between August 21, 2009 and October 15, 2009, the Company closed on gross proceeds of $499,250 and received net cash proceeds of approximately $403,000, after commissions of approximately $50,000, legal expenses of $40,000 and blue sky, escrow and printing expenses of approximately $7,000. The planned use of proceeds is to primarily expand the Company's mobile and interactive divisions. In connection with the offering, the Company entered into a Financial Advisory Agreement with Sierra pursuant to which Sierra would receive 300,000 shares of
Common Stock and an additional 10% of the number of shares sold in the offering. The Company issued pursuant to the terms of the offering and the Financial Advisory Agreement an aggregate of 717,253 shares of Common Stock at an average per share price of $.696 per share and 358,627 Warrants exercisable at $1.00 per share to investors in the offering and an aggregate of 371,725 shares and 35,863 Warrants to Sierra.
On December 8, 2009, Ace Marketing & Promotions, Inc. entered into an Introducing Agent Agreement with Legend Securities, Inc., a FINRA registered broker-dealer ("Legend"), to attempt to raise additional financing through the sale of its Common Stock and Warrants. Between December 8, 2009 and March 15, 2010, the Company closed on gross proceeds of $1,025,000 before commissions of $117,000. The planned use of proceeds is to primarily expand the Company's mobile and interactive divisions. The Company issued pursuant to the terms of the offering an aggregate of 2,050,000 shares of Common Stock at a per share price of $.50 per share and 1,025,000 Warrants exercisable at $1.00 per share to investors in the offering and placement agent warrants to purchase an amount equal to 10% of the number of shares and the number of warrants sold in the offering.
In August 2010, the Company raised $175,000 in gross proceeds from the sale of 437,500 shares and a like number of Warrants expiring in August 2013. The investor paid $0.40 per Share and received Warrants exercisable at $0.60 per Share. In November 2010, the Company commenced a plan of financing and raised an additional $800,500 in financing from the sale of 2,934,999 Shares of its restricted Common Stock at $0.30 per Share and Class E Common Stock Purchase Warrants to purchase a like number of Shares, exercisable at $0.30 per Share through August 31, 2013. Subsequent to the completion of the second financing, the Company agreed to adjust the terms of the August 2010 transaction and issue to the August 2010 investor Shares and Class E Warrants on the same terms as those sold in November - December 2010. Accordingly, an additional 145,833 Shares and a like number of Warrants were issued to the August 2010 investor, with the exercise price of the Warrants being lowered from $0.60 per Share to $0.30 per Share.
In March 2011, the Company commenced a private placement offering. Pursuant to said offering between March 29, 2011 and April 19, 2011, the Company raised $755,000 in gross proceeds from the sale of 2,516,666 shares of common stock and a like number of warrants, exercisable at $.30 per share through August 31, 2013. Exemption is claimed for the sale of securities pursuant to Rule 506 and/or Section 4(2) of the Securities Act of 1933, as amended.
Between May 25, 2011 and June 3, 2011, the Company received gross proceeds of $461,250 from the sale of 1,025,000 shares of Common Stock at a purchase price of $.45 per share. The sale of stock was also accompanied by Warrants expiring on May 31, 2014. Exemption is claimed for the sale of securities pursuant to Rule 506 and/or Section 4(2) of the Securities Act of 1933, as amended.
In July 2011, the Company commenced a private placement offering. Pursuant to said offering between July14, 2011 and August 1, 2011, the Company raised $975,000 in gross proceeds from the sale of 1,950,000 shares of common stock and a like number of warrants, exercisable at $.60 per share through July 31, 2014. Of the $975,000, $250,000 was invested by Thomas Arnost who later became a director of the Company in December 2011. Mr. Arnost received 500,000 shares of Common Stock and Warrants to purchase 500,000 shares in the offering. Exemption is claimed for the sale of securities pursuant to Rule 506 and/or Section 4(2) of the Securities Act of 1933, as amended.
F-15
ACE MARKETING & PROMOTIONS, INC.
NOTES TO THE CONSOLIDATED FINANCIAL STATEMENTS
DECEMBER 31, 2011 AND 2010
WARRANTS - On January 4, 2010, the Company issued 6,000 Warrants to purchase Common Stock to an independent consultant to manage sales relationships. The services were recorded equal to the value of the shares at the date of grant and an expense of $3,051 is included in the operating expenses for the year ended December 31, 2010.
On August 17, 2010, the Company issued 145,600 Warrants to purchase Common Stock to franchisee owners of a chain store for the purpose of placing proximity marketing units in their business locations.
On January 20, 2011, the Company issued 100,000 shares of restricted Common Stock and Warrants to purchase 200,000 shares of Common Stock for the business development agreement.
RESTRICTED STOCK GRANTS - In January 2010, the Company entered into an agreement with a consulting firm to provide services over the next twelve months. The agreement provides for the issuance of 100,000 restricted Common Stock.
In January 2010, the Company also entered into an agreement with two individuals to provide services over the next twelve months. The agreement provides for the issuance of 57,500 shares and 52,500 restricted common shares of Common Stock which vest immediately.
In December 2010, the Company entered into an agreement with a consulting firm to provide services to the Corporation. 50,000 shares of stock were granted to the consultant during the fourth quarter of 2010.
On January 20, 2011, the Company issued to an independent contractor 50,000 shares of common stock in exchange for consulting services rendered.
On May 25, 2011, the Company issued 100,000 shares of Common Stock as a consulting fee to an independent contractor assisting the Company structure a stock deal.
On August 17, 2011, the Company issued 65,000 shares of Corporation’s Common Stock to retain the services of two outside representatives for an additional three years.
On August 17, 2011, the Company issued 175,000 shares of the Corporation’s Common Stock in exchange for consulting services rendered.
On September 7, 2011, the Company issued 150,000 shares of restricted Common Stock to an independent contractor for investor relations and public relations.
On December 20, 2011, the Company approved the grant of 200,000 options to purchase Company stock options to an individual who accepted the position on the board of directors.
On December 29, 2011, the Company issued 66,000 restricted Common Stock in exchange for computer consulting services.
During the past three years, the Company has granted under our 2005 Plan certain employees and consultants restricted stock awards for services for the prior year with vesting to occur after the passage of an additional 12 months. These awards totaled 51,000 Shares for 2009, subject to continued services with the Company through December 31, 2009. These awards totaled 105,000 Shares for 2010 subject to continued services with the Company through December 31, 2010. These awards totaled 45,000 Shares for 2011 subject to continued services with the Company through December 31, 2012.
F-16
ACE MARKETING & PROMOTIONS, INC.
NOTES TO THE CONSOLIDATED FINANCIAL STATEMENTS
DECEMBER 31, 2011 AND 2010
All stock options under the Plan are granted at or above the fair market value of the common stock at the grant date. Employee and non-employee stock options generally vest over periods ranging from one to three years and generally expire either five or ten years from the grant date.
The Company's Plan is accounted for, in accordance with the recognition and measurement provisions requires compensation costs related to share-based payment transactions, including employee stock options, to be recognized in the financial statements. In addition, the Company adheres to the guidance set forth within Securities and Exchange Commission which provides the staff's views regarding the interaction between certain SEC rules and regulations and provides interpretations with respect to the valuation of share-based payments for public companies.
The fair value of options at the date of grant was estimated using the Black-Scholes option pricing model. The expected volatility is based upon historical volatility of the Company's stock and other contributing factors. The expected term is based upon observation of actual time elapsed between date of grant and exercise of options for all employees. Previously such assumptions were determined based on historical data.
The Company's results for the years ended December 31, 2011 and 2010 include employee share-based compensation expense totaling approximately $118,000 and $282,000 respectively. Such amounts have been included in the Statements of Operations within selling, general and administrative expenses. No income tax benefit has been recognized in the statement of operations for share-based compensation arrangements due to a history of operating losses.
F-17
ACE MARKETING & PROMOTIONS, INC.
NOTES TO CONSOLIDATED FINANCIAL STATEMENTS
YEARS ENDED DECEMBER 31, 2011 AND 2010
The following table summarizes stock-based compensation expense for the years ended December 31, 2011 and 2010:
|
Years Ended December 31,
|
||||||||
|
2011
|
2010
|
|||||||
|
Employee stock based compensation-option grants
|
$
|
89,963
|
$
|
267,180
|
||||
|
Employee stock based compensation-stock grants
|
28,500
|
42,514
|
||||||
|
Non-Employee stock based compensation-option grants
|
252,378
|
175,122
|
||||||
|
Non-Employee stock based compensation-stock grants
|
65,454
|
170,900
|
||||||
|
Non-Employee stock based compensation-stock warrant
|
38,264
|
50,921
|
||||||
|
$
|
474,559
|
$
|
706,635
|
|||||
Authoritative guidance requires dual presentation of basic and diluted earnings per share ("EPS") with a reconciliation of the numerator and denominator of the basis EPS computation to the numerator and denominator of the diluted EPS computation. Basic EPS excludes dilution. Diluted EPS reflects the potential dilution that could occur if securities or other contracts to issue common stock were exercised or converted into common stock or resulted in the issuance of common stock that then shared in the earnings of the entity.
During Fiscal 2005, the Company established, and the stockholders approved, an Employee Benefit and Consulting Services Compensation Plan (the "2005 Plan") for the granting of up to 2,000,000 non-statutory and incentive stock options and stock awards to directors, officers, consultants and key employees of the Company. On June 9, 2005, the Board of Directors amended the Plan to increase the number of stock options and awards to be granted under the Plan to 4,000,000. During Fiscal 2009, the Company established a plan of long-term stock-based compensation incentives for selected Eligible Participants of the Company covering 4,000,000 shares. This plan was adopted by the Board of Directors and approved by stockholders in October 2009 and shall be known as the 2009 Employee Benefit and Consulting Services Compensation Plan (the "2009 Plan"). (The 2005 and 2009 Plans are collectively referred to as the “Plans.”)
F-18
ACE MARKETING & PROMOTIONS, INC.
NOTES TO CONSOLIDATED FINANCIAL STATEMENTS
YEARS ENDED DECEMBER 31, 2011 AND 2010
All stock options under the Plans are granted at or above the fair market value of the common stock at the grant date. Employee and non-employee stock options vest over varying periods and generally expire either 5 or 10 years from the grant date. The fair value of options at the date of grant was estimated using the Black-Scholes option pricing model. For option grants, the Company will take into consideration payments subject to
the provisions of ASC 718 "Stock Compensation", previously Revised SFAS No. 123 "Share-Based Payment" ( "SFAS 123 (R)"). The fair values of these restricted stock awards are equal to the market value of the Company's stock on the date of grant, after taking into certain discounts. The expected volatility is based upon historical volatility of our stock and other contributing factors. The expected term is based upon observation of actual time elapsed between date of grant and exercise of options for all employees. Previously, such assumptions were determined based on historical data.
The weighted average assumptions made in calculating the fair values of options granted during the years ended December 31, 2011 and 2010 are as follows:
|
Years Ended December 31,
|
||||||||
|
2011
|
2010
|
|||||||
|
Expected volatility
|
203.04%
|
123.48%
|
||||||
|
Expected dividend yield
|
-
|
-
|
||||||
|
Risk-free interest rate
|
1.88%
|
3.01%
|
||||||
|
Expected term (in years)
|
6.54
|
4.00
|
||||||
F-19
ACE MARKETING & PROMOTIONS, INC.
NOTES TO CONSOLIDATED FINANCIAL STATEMENTS
YEARS ENDED DECEMBER 31, 2011 AND 2010
|
Weighted
|
||||||||||||||||
|
Weighted
|
Average
|
|||||||||||||||
|
Average
|
Remaining
|
Aggregate
|
||||||||||||||
|
Exercise
|
Contractual
|
Intrinsic
|
||||||||||||||
|
Share
|
Price
|
Term
|
Value
|
|||||||||||||
|
Outstanding, January 1, 2011
|
3,120,000
|
$
|
.97
|
5.23
|
||||||||||||
|
Granted
|
515,000
|
$
|
1.00
|
|||||||||||||
|
Exercised
|
-
|
-
|
||||||||||||||
|
Cancelled / Expired
|
(130,000
|
)
|
$
|
2.50
|
||||||||||||
|
Outstanding, December 31, 2011
|
3,505,000
|
$
|
.84
|
4.85
|
171,600
|
|||||||||||
|
Options exercisable, December 31, 2011
|
3,455,000
|
$
|
.83
|
4.51
|
-
|
|||||||||||
The weighted-average grant-date fair value of options granted during the years ended December 31, 2011 and 2010 was $0.43 and $0.51
The aggregate intrinsic value of options outstanding and options exercisable at December 31, 2011 is calculated as the difference between the exercise price of the underlying options and the market price of the Company's common stock for the shares that had exercise prices, that were lower than the $.60 closing price of the Company's common stock on December 31, 2011.
As of December 31, 2011, the fair value of unamortized compensation cost related to unvested stock option awards was approximately $31,200. Unamortized compensation cost as of December 31, 2011 is expected to be recognized over a remaining weighted-average vesting period of .25 years. As of December 31, 2010, the fair value of unamortized compensation cost related to unvested stock option awards was approximately $156,000. Unamortized compensation cost as of December 31, 2010 was expected to be recognized over a remaining weighted-average vesting period of 1.25 years.
F-20
ACE MARKETING & PROMOTIONS, INC.
NOTES TO CONSOLIDATED FINANCIAL STATEMENTS
YEARS ENDED DECEMBER 31, 2011 AND 2010
The weighted average assumptions made in calculating the fair value of warrants granted during the years ended December 31, 2011 and 2010 are as follows:
|
Years Ended
|
||||||||
|
2011
|
2010
|
|||||||
|
Expected volatility
|
56.83%
|
132.18%
|
||||||
|
Expected dividend yield
|
--
|
--
|
||||||
|
Risk-free interest rate
|
1.07%
|
2.65%
|
||||||
|
Expected term (in years)
|
3.00
|
5.00
|
||||||
|
Weighted
|
||||||||||||||||
|
Weighted
|
Average
|
|||||||||||||||
|
Average
|
Remaining
|
Aggregate
|
||||||||||||||
|
Exercise
|
Contractual
|
Intrinsic
|
||||||||||||||
|
Share
|
Price
|
Term
|
Value
|
|||||||||||||
|
Outstanding, January 1, 2011
|
6,243,965
|
$
|
.54
|
|||||||||||||
|
Granted
|
7,021,666
|
$
|
.45
|
|||||||||||||
|
Exercised
|
(395,000
|
) |
--
|
|||||||||||||
|
Cancelled/Expired
|
(299,989
|
) |
--
|
|||||||||||||
|
Outstanding, December 31, 2011
|
12,570,642
|
$
|
.48
|
1.84
|
1,943,000
|
|||||||||||
|
Warrants exercisable, December 31, 2011
|
12,570,642
|
$
|
.48
|
1.84
|
--
|
|||||||||||
F-21
ACE MARKETING & PROMOTIONS, INC.
NOTES TO CONSOLIDATED FINANCIAL STATEMENTS
YEARS ENDED DECEMBER 31, 2011 AND 2010
COMMON SHARES RESERVED
|
2005 Stock Option Plan
|
3,355,000
|
|
Non Statutory Options
|
150,000
|
|
Warrants
|
551,600
|
|
Class D Warrants
|
2,062,377
|
|
Class E Warrants
|
5,851,665
|
|
Class F Warrants
|
1,225,000
|
|
Class G Warrants
|
900,000
|
|
Class H Warrants
|
1,980,000
|
LEASE COMMITMENTS - The Company leases office space under non-cancelable operating leases, which expires in November 2012. The Company is obligated for the payment of real estate taxes under these leases. The Company is also currently leasing additional office space on a month-to-month basis. Minimum future rentals under non-cancelable lease commitments are as follows:
YEARS ENDING DECEMBER 31,
|
2012
|
$ 26,000
|
Rent and real estate tax expense was approximately $337,500 and $93,000 for the years December 31, 2011 and 2010, respectively.
EMPLOYMENT CONTRACTS - On March 1, 2005, the Company entered into employment contracts with two of its officers. The employment agreements provide for minimum annual salaries plus bonuses equal to 5% of pre-tax earnings (as defined) and other perquisites commonly found in such agreements. In addition, pursuant to the employment contracts, the Company granted the officers options to purchase up to an aggregate of 400,000 shares of common stock.
F-22
ACE MARKETING & PROMOTIONS, INC.
NOTES TO CONSOLIDATED FINANCIAL STATEMENTS
YEARS ENDED DECEMBER 31, 2011 AND 2010
On April 7, 2010, the Board of Directors approved a five-year extension of the employment contract of Dean L. Julia and Michael D. Trepeta to expire on March 1, 2015. The Board approved the continuation of each officer’s current salary and scheduled salary increases which will next occur on March 1, 2011. The Board also approved a signing bonus of stock options to purchase 200,000 shares granted to each officer which is fully vested at the date of grant and exercisable at $.50 per share through April 7, 2020; ten-year stock options to purchase 100,000 shares of Common Stock to be granted to each officer at fair market value on each anniversary date of the contract and extension thereof commencing March 1, 2011; and termination pay of one year base salary based upon the scheduled annual salary of each executive officer for the next contract year plus the amount of bonuses paid or entitled to be paid to the executive for the current fiscal year or the preceding fiscal year, whichever is higher. In the event of termination, the executives will continue to receive all benefits included in the employment agreement through the scheduled expiration date of said employment agreement prior to the acceleration of the termination date thereof.
On August 22, 2007, the Company approved a three year extension of the employment contracts with two of its officers expiring on February 28, 2011. The employment agreements provide for minimum annual salaries with scheduled increases per annum to occur on every anniversary date of the contract and extension commencing on March 1, 2008. A signing bonus of options to purchase 150,000 shares granted to each executive were fully vested at the date of the grant and exercisable at $1.20 per share through August 22, 2017. Ten year options to purchase 50,000 shares of common stock are to be granted at fair market value on each anniversary date of the contract and extension commencing March 1, 2008. Termination pay of one year base salary based upon the scheduled annual salary of each executive officer for the next contract year, plus the amount of bonuses paid (or entitle to be paid) to the executive for the current fiscal year of the preceding fiscal year, whichever is higher. On April 7, 2010, the Board of Directors approved a five-year extension of the employment contracts of Dean L. Julia and Michael D. Trepeta to expire on March 1, 2015. The Board approved the continuation of each officer's current annual salary and scheduled salary increases. The Board also approved a signing bonus of stock options to purchase 200,000 shares granted to each officer which is fully vested at the date of grant and exercisable at $.50 per share through April 7, 2020; ten-year stock options to purchase 100,000 shares of Common Stock to be granted to each officer at fair market value on each anniversary date of the contract and extension thereof commencing March 1, 2011; In the event of termination, the executives will continue to receive all benefits included in the employment agreement through the scheduled expiration date of said employment agreement prior to the acceleration of the termination date thereof.
TRANSACTIONS WITH MAJOR CUSTOMERS - The Company sells its products to a geographically diverse group of customers, performs ongoing credit evaluations of its customers and generally does not require collateral. During the year ended December 31, 2011 a customer accounted for approximately 7 % of net revenues and for the year ended December 31, 2010 a customer accounted for approximately 10 % of net revenues. The Company holds on hand certain items that are ordered on a regular basis.
Cash paid during the years for:
|
YEARS ENDED DECEMBER 31,
|
||||||||
|
2011
|
2010
|
|||||||
|
Interest
|
$
|
2,177
|
$
|
818
|
||||
|
Income Taxes
|
$
|
-
|
$
|
-
|
||||
F-23
ACE MARKETING & PROMOTIONS, INC.
NOTES TO CONSOLIDATED FINANCIAL STATEMENTS
YEARS ENDED DECEMBER 31, 2011 AND 2010
Reportable operating segment is determined based on Ace Marketing & Promotion Inc.’s management approach. The management approach, as defined by accounting standards which have been codified into FASB ASC 280, “Segment Reporting,” is based on the way that the chief operating decision-maker organizes the segments within an enterprise for making decisions about resources to be allocated and assessing their performance. Our chief operating decision-maker is our Chief Executive Officer and Chief Financial Officer.
While our results of operations are primarily reviewed on a consolidated basis, the chief operating decision-maker also manages the enterprise in two operating segments: (i) Branding & Branded Merchandise (ii) Mobil Marketing
Corporate management defines and reviews segment profitability based on the same allocation methodology as presented in the segment data tables below:
|
Ace Marketing
& Promotions, Inc.
|
Mobiquity
Networks
Inc.
|
Total | ||||||||||
| Net sales | $ |
3,239,951
|
4,000
|
$ |
3,243,951
|
|||||||
|
Operating (loss)
|
(1,040,190)
|
(1,038,168)
|
(2,078,358)
|
|||||||||
|
Interest income
|
633 | - | 633 | |||||||||
|
Interest (expense)
|
(2,177)
|
-
|
(2,177)
|
|||||||||
|
Depreciation and amortization
|
(6,442)
|
(123,164)
|
(129,606)
|
|||||||||
|
Exp Net Loss
|
(1,048,176)
|
(1,161,332)
|
(2,209,508)
|
|||||||||
|
Total assets at December 31, 2011
|
1,452,276
|
753,462
|
2,205,738
|
|||||||||
|
All intersegment sales and expenses have been eliminated from the table above.
|
In January 2012, the Company approved the agreement with employees to issue 45,000 restricted shares of its Common Stock for services rendered over the last 12 months.
On January 30, 2012, the Company’s private placement offering was terminated. Rockwell Global Capital LLC acted as Placement Agent. The Company received gross proceeds of $575,000 from the sale of 958,338 shares of Common Stock at a purchase price of $.60 per share. The private placement offering also included the sale of Warrants to purchase 191,671 shares of Common Stock, exercisable at $.60 per share and expiring on January 18, 2016. The Placement Agent received a $25,000 advisory fee, $51,750 in commissions and warrants to purchase 95,833 shares identical to the warrants sold to investors in the offering. Exemption is claimed for the sale of securities pursuant to Rule 506 and/or Section 4(2) of the Securities Act of 1933, as amended.
On January 30, 2012, the Company’s private placement offering was terminated. Rockwell Global Capital LLC acted as Placement Agent. The Company received gross proceeds of $575,000 from the sale of 958,338 shares of Common Stock at a purchase price of $.60 per share. The private placement offering also included the sale of Warrants to purchase 191,671 shares of
F-24
ACE MARKETING & PROMOTIONS, INC.
NOTES TO CONSOLIDATED FINANCIAL STATEMENTS
YEARS ENDED DECEMBER 31, 2011 AND 2010
Common Stock, exercisable at $.60 per share and expiring on January 18, 2016. The Placement Agent received a $25,000 advisory fee, $51,750 in commissions and warrants to purchase 95,833 shares identical to the warrants sold to investors in the offering. Exemption is claimed for the sale of securities pursuant to Rule 506 and/or Section 4(2) of the Securities Act of 1933, as amended.
In February 2012, the Company entered into a lease agreement for new executive office space of approximately 4,200 square feet located at 600 Old Country Road, Garden City, NY 11530. Not later than May 1, 2012, the Company will move its Valley Stream, NY office facilities into this space. The lease agreement is for 63 months. The annual rent under this office facility for the first year is estimated at $127,000, including electricity, subject to an annual increase of 3%. In the event of a default in which the Company is evicted from the office space, Ace would be responsible to the landlord for an additional payment of rent of $160,000 in the first year of the lease, an additional payment of $106,667 in the second year of the lease and an additional payment of rent of $53,333 in the third year of the lease. Such additional rent would be payable at the discretion of the Company in cash or in Common Stock of the Company.
The Company has evaluated all subsequent events through the filing date of this form 10-K for appropriate accounting and disclosures.
F-25
Not Applicable.
Under the supervision and with the participation of our management, including the Chief Executive Officer and Chief Financial Officer, we have evaluated the effectiveness of our disclosure controls and procedures as required by Exchange Act Rule 13a-15(b) as of the end of the period covered by this report. Based on that evaluation, the Chief Executive Officer and Chief Financial Officer have concluded that these disclosure controls and procedures are effective.
Report of Management on Internal Control over Financial Reporting
Our management is responsible for establishing and maintaining adequate internal control over financial reporting for the Company. Internal control over financial reporting is a process to provide reasonable assurance regarding the reliability of our financial reporting for external purposes in accordance with accounting principles generally accepted in the United States of America. Internal control over financial reporting includes maintaining records that in reasonable detail accurately and fairly reflect our transactions; providing reasonable assurance that transactions are recorded as necessary for preparation of our financial statements; providing reasonable assurance that receipts and expenditures of company assets are made in accordance with management authorization; and providing reasonable assurance that unauthorized acquisition, use or disposition of company assets that could have a material effect on our financial statements would be prevented or detected on a timely basis. Because of its inherent limitations, internal control over financial reporting is not intended to provide absolute assurance that a misstatement of our financial statements would be prevented or detected.
Management conducted an evaluation of the effectiveness of our internal control over financial reporting based on the framework in
Internal Control – Integrated Framework
issued by the Committee of Sponsoring Organizations of the Treadway Commission. Based on this evaluation, management concluded that the company’s internal control over financial reporting was effective as of December 31, 2011. There were no significant changes in our internal control over financial reporting during the year ended December 31, 2011 that have materially affected, or are reasonably likely to materially affect, our internal control over financial reporting. Our independent auditors have not audited and are not required to audit this assessment of our internal control over financial reporting for the fiscal year ended December 31, 2011.
MANAGEMENT'S PLAN OF REMEDIATION
INFORMATION TECHNOLOGY
|
|
a)
|
Management documented their policies and procedures as they related to the managing of operations for application and technology platforms. These policies were documented in 2010.
|
FINANCIAL REPORTING
|
|
a)
|
Managements addressed the lack of review or evidence of review in the financial reporting process by instituting a checklist process where the CEO or an outside consultant reviews transactions created by the CFO.
|
|
|
b)
|
The database link was created in mid 2009 and will continue to be monitored and tested. Management believes the process has improved considerably and believes any outstanding issues were fully resolved in 2010.
|
None.
24
The names, ages and principal occupations of the Company's present officers and directors are listed below.
|
FIRST BECAME DIRECTOR
|
||||||
|
NAME (1)
|
AGE
|
AND/OR OFFICER
|
POSITION
|
|||
|
Dean Julia (2)
|
44
|
1998
|
Chief Executive Officer/Secretary/Treasurer/Director/Co-Founder
|
|||
|
Michael Trepeta (2)
|
40
|
1998
|
President/Director/Co-Founder
|
|||
|
Sean McDonnell
|
51
|
2005
|
Chief Financial Officer
|
|||
|
Domenico Iannucci
|
56
|
2009
|
Director
|
|||
|
Thomas Arnost
|
65
|
2011
|
Director
|
|||
|
Sean Trepeta
|
44
|
2011
|
President of Mobiquity Networks
|
______________
|
(1)
|
Directors are elected at the annual meeting of stockholders and hold office until the following annual meeting.
|
|
(2)
|
Michael Trepeta and Dean Julia will serve as Co-Chief Executive Officers of the Company effective on the day after filing of this Form 10-K.
|
The terms of all officers expire at the annual meeting of directors following the annual stockholders meeting. Officers serve at the pleasure of the Board and may be removed, either with or without cause, by the Board of Directors, and a successor elected by a majority vote of the Board of Directors, at any time.
MANAGEMENT TEAM
Our officers, directors and founders each have experience in the development of early stage companies including business strategies, products and services and financing.
DEAN L. JULIA
Mr. Julia holds a Bachelor of Business Administration from Hofstra University received in 1990. From 1991-1996, Mr. Julia worked at various Investment Banks where he was involved in the funding of numerous IPO's in the Bio Technology and Communications sectors. From September 1996 through February 1998, Mr. Julia served as President and Chief Executive Officer of DLJ Consulting, a financial intermediary consultant for public and private companies. In 1998, Mr. Julia co-founded Ace Marketing and became an officer, director and principal stockholder of the company. He continues to serve as CEO of Ace Marketing & Promotions where he sets overall strategy and continually fosters key relationships with technology partners and developers. Mr. Julia also serves as COO of Mobiquity (a wholly-owned subsidiary of Ace), where he is responsible for the integration of the sales and IT departments of Mobiquity with the creative, IT and database departments of Ace Marketing. He continues to set all operational strategies for scaling each department to meet the demands of managing and maintaining the aggressive expansion of the national proximity marketing network. Mr. Julia is a founder of the Company, has demonstrated his management ability at senior levels, he has served on the board since its inception and he is expected to continue to serve on the Board.
MICHAEL D. TREPETA
Mr. Trepeta received a Bachelor of Science Degree in Applied Economics and Business Management with a minor in Communications from Cornell University in 1993. From 1993-1996, Mr. Trepeta worked as a stockbroker and was involved in the funding of numerous development-stage and growth companies. From September of 1996 through February 1998, he served as President of MDT Consulting Group, Inc., a corporation contracted by various companies to serve as a financial intermediary to investment bankers and to assist in developing products, services, and business strategies. In 1998, Mr. Trepeta co-founded Ace Marketing & Promotions as an officer, director and principal owner of the company. He continues to set the strategy for all integrated marketing efforts at Ace Marketing through the development of models and solutions that leverage the attributes of cutting edge marketing technologies. As CEO of Mobiquity (a wholly-owned subsidiary of Ace), Mr. Trepeta is responsible for setting strategy for the continued roll-out of Mobiquity's national proximity marketing network by securing long term strategic partnerships with key property owners and management companies while simultaneously forming key partnerships with out of home agencies who control the media assets within those properties. Mr. Trepeta , a founder of the Company, has demonstrated his management ability at senior levels and he is expected to continue to serve on the board..
25
SEAN MCDONNELL
Sean J. McDonnell, Certified Public Accountant, has been self employed and in private accounting practice since January 1990 handling many different types of business entities and associations. Mr. McDonnell has spent much of his time helping his customers grow their companies and acquire financing for the purchase of buildings and equipment. Prior to starting his own practice, he was employed from 1985 - 1990 as a senior staff member in the accounting firm of Breiner & Bodian CPA's. After graduating from Dowling College in 1984, he was employed by Kenneth Silver C.P.A. from 1984 - 1985. He is currently serving on the boards of the Police Athletic League, North East Youth Sports Association and Sound Beach Soccer Club, Inc. Mr. McDonnell has served as our Chief Financial Officer since January 3, 2005 and currently as an employee, he devotes such time to our affairs as is necessary for the performance of his duties.
DOMINICO IANNUCCI
Mr. Iannucci has owned and managed a residential and commercial construction company for over 24 years. Mr. Iannucci is serving as an independent director of the Company. Mr. Iannucci brings to the Board experience in other industries that the two other board members do not process.
TOM ARNOST
Mr. Thomas Arnost previously served as the Co-President of Univision Communications, Inc. Station Group, where he joined the company in 1994. He served as the Co-President of Univision Television Group, from 1997 to 2006, and prior to that as Executive Vice President of Univision ... Television Group from 1994 to 1996. In 2002, Mr. Arnost helped in successful launch of the Telefutura Station Group, which has since, significantly contributed to Univision's overall revenue growth and market value. During his tenure with Univision, total station group revenue grew from under $120 million in 1993 to approximately $700 million in 2006. Also during his tenure, the Company’s market value grew from roughly $500 million to over $14 billion. Mr. Arnost’s extensive business, financial, management and leadership experience in the telecommunications industry particularly qualifies him for serving on the Company’s board as an independent director.
SEAN TREPETA
Prior to joining the Mobiquity Networks team in May of 2011, Mr. Trepeta was President of Varsity Networks, a leading online portal dedicated to serving the High School sports market. While at Varsity Networks, Mr. Trepeta grew the network to include over 10,000 high school team websites and was responsible for growing web traffic to include millions of monthly visitors and registered users across the country allowing for additional revenue streams through the placement of online advertising by major national brands. Prior to this, Mr. Trepeta was the President & Co-Founder of OPEX Communications, Inc., a leading telecommunication service provider which was located in Chicago, specializing in traditional long-distance, wireless, and dedicated services. Mr. Trepeta increased sales and was able to grow the company through agents and the Internet to $48 million in annual sales before selling OPEX in 2006. Before working for OPEX, Mr. Trepeta was the vice president of sales and marketing for the US Buying Group, Inc. responsible for developing a small business-buying program, which included value added services such as overnight shipping, office supplies, and computer software products, as well as a full line of telecommunications services. Mr. Trepeta also developed and implemented the agent and carrier divisions of USBG. Prior to joining USBG, he was with MCI Telecommunications and NYNEX in New York City. As President of Mobiquity Networks, Mr. Trepeta is responsible for once again setting all sales and marketing strategies internally as well as handling the relationship and training of the national sales force of Mobiquity's key out of home Mall Media partner, EYE Corp. He continues to foster strategic relationships with agencies and national brands. Mr. Trepeta holds a Bachelor of Science degree from the State University of New York at Cortland. Mr. Trepeta’s extensive sales and marketing experience and management experience in the telecommunications industry qualifies him for serving on the Company’s board of directors.
Corporate Governance
Our business, property and affairs are managed by, or under the direction of, our Board, in accordance with the General Corporation Law of the State of New York and our By-Laws. Members of the Board are kept informed of our business through discussions with the Chief Executive Officer and other key members of management, by reviewing materials provided to them by management.
26
We continue to review our corporate governance policies and practices by comparing our policies and practices with those suggested by various groups or authorities active in evaluating or setting best practices for corporate governance of public companies. Based on this review, we have adopted, and will continue to adopt, changes that the Board believes are the appropriate corporate governance policies and practices for our Company. We have adopted changes and will continue to adopt changes, as appropriate, to comply with the Sarbanes-Oxley Act of 2002 and subsequent rule changes made by the SEC and any applicable securities exchange.
Director
Qualifications
and Diversity
The board seeks independent directors who represent a diversity of backgrounds and experiences that will enhance the quality of the board’s deliberations and decisions. Candidates shall have substantial experience with one or more publicly traded companies or shall have achieved a high level of distinction in their chosen fields. The board is particularly interested in maintaining a mix that includes individuals who are active or retired executive officers and senior executives, particularly those with experience in the finance and capital market industries.
In evaluating nominations to the Board of Directors, our Board also looks for certain personal attributes, such as integrity, ability and willingness to apply sound and independent business judgment, comprehensive understanding of a director’s role in corporate governance, availability for meetings and consultation on Company matters, and the willingness to assume and carry out fiduciary responsibilities. Qualified candidates for membership on the Board will be considered without regard to race, color, religion, sex, ancestry, national origin or disability.
Risk Oversight
Enterprise risks are identified and prioritized by management and each prioritized risk is assigned to the full board for oversight. These risks include, without limitation, the following:
Risks and exposures associated with strategic, financial and execution risks and other current matters that may present material risk to our operations, plans, prospects or reputation.
Risks and exposures associated with financial matters, particularly financial reporting, tax, accounting, disclosure, internal control over financial reporting, financial policies, investment guidelines and credit and liquidity matters.
Risks and exposures relating to corporate governance; and management and director succession planning.
Risks and exposures associated with leadership assessment, and compensation programs and arrangements, including incentive plans.
Board Leadership Structure
In accordance with the Company's By-Laws, the Chairman of the Board presides at all meetings of the Board. Since the Company does not have a Chairman of the Board, the By-Laws of the Corporation require the President, Michael Trepeta, to serve as the Chairman of the Board and to preside at all meetings. Currently, the offices of President (who serves as Chairman of the Board and Chief Executive Officer) are separated. The Company has no fixed policy with respect to the separation of the offices of the Chairman of the Board and Chief Executive Officer. The Board believes that the separation of the offices of the Chairman of the Board and Chief Executive Officer is likely is in the best interests of the Company.
Indemnification
The New York Business Corporation Law contains provisions permitting and, in some situations, requiring New York corporations to provide indemnification to their officers and directors for losses and litigation expense incurred in connection with their service to the corporation. Our articles and bylaws contain provisions requiring our indemnification of our directors and officers and other persons acting in their corporate capacities.
In addition, we may enter into agreements with our directors providing contractually for indemnification consistent with the articles and bylaws. Currently, we have no such agreements. The New York Business Corporation Law also authorizes us to purchase insurance for our directors and officers insuring them against risks as to which we may be unable lawfully to indemnify them. We intend to obtain limited insurance coverage for our officers and directors as well as insurance coverage to reimburse us for potential costs of our corporate indemnification of officers and directors.
As far as exculpation or indemnification for liabilities arising under the Securities Act of 1933 may be permitted for directors and officers and controlling persons, we have been advised that in the opinion of the Securities and Exchange Commission such exculpation or indemnification is against public policy as expressed in the Act and is, therefore, unenforceable.
27
LACK OF COMMITTEES
Our Company has no audit, compensation or nominating committees of our board of directors or committees performing similar functions. Domenico Iannucci and Thomas Arnost are the Company’s “independent directors.” Mr. Arnost is a “financial expert”, but Mr. Iannucci is not deemed a “financial expert.”
Under the National Association of Securities Dealers Automated Quotations definition, an “independent director” means a person other than an officer or employee of the Company or its subsidiaries or any other individuals having a relationship that, in the opinion of the Company’s board of directors, would interfere with the exercise of independent judgment in carrying out the responsibilities of the director. The board’s discretion in determining director independence is not completely unfettered. Further, under the NASDAQ definition, an independent director is a person who (1) is not currently (or whose immediate family members are not currently), and has not been over the past three years (or whose immediate family members have not been over the past three years), employed by the company; (2) has not (or whose immediate family members have not) been paid more than $60,000 during the current or past three fiscal years; (3) has not (or whose immediately family has not) been a partner in or controlling shareholder or executive officer of an organization which the company made, or from which the company received, payments in excess of the greater of $200,000 or 5% of that organizations consolidated gross revenues, in any of the most recent three fiscal years; (4) has not (or whose immediate family members have not), over the past three years been employed as an executive officer of a company in which an executive officer of Ace has served on that company’s compensation committee; or (5) is not currently (or whose immediate family members are not currently), and has not been over the past three years (or whose immediate family members have not been over the past three years) a partner of Ace’s outside auditor.
The term “Financial Expert” is defined under the Sarbanes-Oxley Act of 2002, as amended, as a person who has the following attributes: an understanding of generally accepted accounting principles and financial statements; has the ability to assess the general application of such principles in connection with the accounting for estimates, accruals and reserves; experience preparing, auditing, analyzing or evaluating financial statements that present a breadth and level of complexity of accounting issues that are generally comparable to the breadth and complexity of issues that can reasonably be expected to be raised by the company’s financial statements, or experience actively supervising one or more persons engaged in such activities; an understanding of internal controls and procedures for financial reporting; and an understanding of audit committee functions.
In 2012, the Company intends to form an audit committee to consist of one or more independent directors. In the event an audit committee is established, of which there can be no assurances given, its first responsibility would be to adopt a written charter. Such charter would be expected to include, among other things:
|
|
·
|
being directly responsible for the appointment, compensation and oversight of our independent auditor, which shall report directly to the audit committee, including resolution of disagreements between management and the auditors regarding financial reporting for the purpose of preparing or issuing an audit report or related work;
|
|
|
·
|
annually reviewing and reassessing the adequacy of the committee’s formal charter;
|
|
|
·
|
reviewing the annual audited financial statements with our management and the independent auditors and the adequacy of our internal accounting controls;
|
|
|
·
|
reviewing analyses prepared by our management and independent auditors concerning significant financial reporting issues and judgments made in connection with the preparation of our financial statements;
|
|
|
·
|
reviewing the independence of the independent auditors;
|
|
|
·
|
reviewing our auditing and accounting principles and practices with the independent auditors and reviewing major changes to our auditing and accounting principles and practices as suggested by the independent auditor or its management;
|
|
|
·
|
reviewing all related party transactions on an ongoing basis for potential conflict of interest situations; and
|
|
|
·
|
all responsibilities given to the audit committee by virtue of the Sarbanes-Oxley Act of 2002, which was signed into law by President George W. Bush on July 30, 2002.
|
28
CODE OF ETHICS
The Company has a code of ethics that applies to the Company's Chief Executive Officer and Chief Financial Officer which has been designed to deter wrongdoing and to promote:
|
|
·
|
Honest and ethical conduct, including the ethical handling of actual or apparent conflicts of interest between personal and professional relationships;
|
|
|
·
|
Full, fair, accurate, timely and understandable disclosure in reports and documents that the Company files with, or submits to, the SEC and in other public communications made by the Company;
|
|
|
·
|
Compliance with applicable governmental law, rules and regulations;
|
|
|
·
|
The prompt internal reporting of violations of the code of ethics to an appropriate pre-identified person; and
|
|
|
·
|
Accountability for adherence to the code of ethics.
|
COMPLIANCE WITH SECTION 16(A) OF THE EXCHANGE ACT
Section 16(a) of the Securities Exchange Act of 1934, as amended, requires our officers and directors, and persons who own more than ten percent of a registered class of our equity securities, to file reports of ownership and changes in ownership with the Securities and Exchange Commission (the "Commission"). Officers, directors and greater than ten percent stockholders are required by the Commission's regulations to furnish us with copies of all Section 16(a) forms they file. During fiscal 2011, none of our officers, directors or 10% or greater stockholders failed to file or filed any forms late to the best of our knowledge, except that Mr. Arnost’s Form 4 was filed contemporaneously with the timely filing of his Form 3.
The following table sets forth the overall compensation earned over the fiscal year ended December 31, 2011 and 2010 by (1) each person who served as the principal executive officer of the Company during fiscal year 2011; (2) the Company’s most highly compensated (up to a maximum of two) executive officers as of December 31, 2011 with compensation during fiscal year 2011 of $100,000 or more; and (3) those two individuals, if any, who would have otherwise been in included in section (2) above but for the fact that they were not serving as an executive of the Company as of December 31, 2011. (Note: Sean Trepeta has been included in the table below as it is expected that he will earn more than $100,000 in cash compensation for 2012.)
| Salary Compensation | ||||||||||||||||||||||||||||||
|
Name and
Principal
Position
|
Fiscal
Year
|
Salary ($)
|
Bonus
($)
|
Stock
Awards
|
Options
Awards
($)(1)
|
Non-Equity
Incentive Plan
Compensation
($)
|
Nonqualified
Deferred
Compensation
Earnings ($)
|
All Other
Compensation
($) (2)(3)
|
Total ($)
|
|||||||||||||||||||||
|
Dean L. Julia
|
2010
|
$
|
256,000
|
$ |
5,500
|
--
|
$
|
135,941
|
--
|
--
|
$
|
9,900
|
$
|
407,341
|
||||||||||||||||
|
Chief Executive Officer of the
Company
|
2011
|
$
|
282,986
|
$ |
6,000
|
--
|
$
|
21,383
|
--
|
--
|
$
|
24,993
|
$
|
335,362
|
||||||||||||||||
|
Michael D. Trepeta
|
2010
|
$
|
256,000
|
$ |
5,500
|
--
|
$
|
135,941
|
--
|
--
|
$
|
10,792
|
$
|
408,233
|
||||||||||||||||
|
President of
The Company
|
2011
|
$
|
282,986
|
$ |
6,000
|
--
|
$
|
21,383
|
--
|
--
|
$
|
21,728
|
$
|
332,097
|
||||||||||||||||
| Sean Trepeta | 2010 | $ | -- | $ | -- | -- | $ | -- | -- | -- | $ | -- | $ | -- | ||||||||||||||||
| President of Mobiquity Networks | 2011 | $ | 30,000 | $ | 5,300 | -- | $ | 14,789 | -- | -- | $ | 13,170 | $ | 63,259 | ||||||||||||||||
________________
|
(1)
|
The options and restricted stock awards presented in this table for 2011 and 2010 reflects the full grant date fair value, as if the total dollar amount were earned in the year of grant. The stock awards are valued based on the fair market value of such Shares on the date of grant and are charged to compensation expense over the related vesting period. The options are valued at the date of grant based upon the Black-Scholes method of valuation, which is expensed over the service period over which the options become vested. As a general rule, for time-in-service-based options, the Company will immediately expense any option or portion thereof which is vested upon grant, while expensing the balance on a pro rata basis over the remaining vesting term of the option.
|
|
|
(2)
|
Includes all other compensation not reported in the preceding columns, including (i) perquisites and other personal benefits, or property, unless the aggregate amount of such compensation is less than $10,000; (ii) any “gross-ups” or other amounts reimbursed during the fiscal year for the payment of taxes; (iii) discounts from market price with respect to securities purchased from the company except to the extent available generally to all security holders or to all salaried employees; (iv) any amounts paid or accrued in connection with any termination (including without limitation through retirement, resignation, severance or constructive termination, including change of responsibilities) or change in control; (v) contributions to vested and unvested defined contribution plans; (vi) any insurance premiums paid by, or on behalf of, the company relating to life insurance for the benefit of the named executive officer; and (vii) any dividends or other earnings paid on stock or option awards that are not factored into the grant date fair value required to be reported in a preceding column.
|
|
|
(3)
|
Includes compensation for service as a director described under Director Compensation, below.
|
|
29
For a description of the material terms of each named executive officers’ employment agreement, including the terms of the terms of any common share purchase option grants, see that section of this Form 10-K captioned “Employment Agreements.”
No outstanding common share purchase option or other equity-based award granted to or held by any named executive officer in 2011 were repriced or otherwise materially modified, including extension of exercise periods, the change of vesting or forfeiture conditions, the change or elimination of applicable performance criteria, or the change of the bases upon which returns are determined, nor was there any waiver or modification of any specified performance target, goal or condition to payout.
For a description of the material terms of any contract, agreement, plan or other arrangement that provides for any payment to a named executive officer in connection with his or her resignation, retirement or other termination, or a change in control of the company see “Employment Agreements”.
Executive Officer Outstanding Equity Awards at Fiscal Year-End
The following table provides certain information concerning any common share purchase options, stock awards or equity incentive plan awards held by each of our named executive officers that were outstanding as of December 31, 2011.
|
Option Awards
|
Stock Awards
|
|||||||||||||||||||||||||||||||||||||
|
Name
|
Number of
Securities
Underlying
Unexercised
Options(#)
Exercisable
|
Number of
Securities
Underlying
Unexercised
Options(#)
Unexercisable
|
Equity
Incentive Plan
Awards:
Number of
Securities
Underlying
Unexercised
Unearned
Options (#)
|
Option
Exercise
Price ($)
|
Option
Expiration
Date
|
Number of
Shares or
Units of
Stock That
Have Not
Vested (#)
|
Market
Value of
Shares or
Units of
Stock That
Have Not
Vested
|
Equity
Incentive
Plan
Awards:
Number
of
Unearned
Shares,
Units or
Other
Rights
That Have
Not
Vested
|
Equity
Incentive Plan
Awards:
Market or
Payout Value of
Unearned
Shares, Units or
Other Rights
That Have Not
Vested
|
|||||||||||||||||||||||||||||
|
Dean L. Julia
|
250,000 | — | — | $ | 1.00 |
01/03/15
|
— | — | — | — | ||||||||||||||||||||||||||||
| (1) | 200,000 | — |
—
|
$ | 1.20 |
12/28/15
|
—
|
—
|
—
|
—
|
||||||||||||||||||||||||||||
| 150,000 | — | — | $ | 1.20 |
08/22/17
|
—
|
—
|
—
|
—
|
|||||||||||||||||||||||||||||
| 50,000 |
—
|
—
|
$ | 1.20 |
03/01/13
|
—
|
—
|
—
|
—
|
|||||||||||||||||||||||||||||
| 50,000 |
—
|
—
|
$ | .65 |
03/02/19
|
—
|
—
|
—
|
—
|
|||||||||||||||||||||||||||||
| 50,000 |
—
|
—
|
$ | .54 |
03/25/20
|
—
|
—
|
—
|
—
|
|||||||||||||||||||||||||||||
| 200,000 |
—
|
—
|
$ | .50 | 04/07/20 |
—
|
—
|
—
|
—
|
|||||||||||||||||||||||||||||
| 100,000 |
—
|
—
|
$ | .26 |
02/28/21
|
—
|
—
|
—
|
—
|
|||||||||||||||||||||||||||||
| 100,000 |
—
|
—
|
$ | .61 | 02/28/22 |
—
|
—
|
—
|
—
|
|||||||||||||||||||||||||||||
|
Michael D.
|
||||||||||||||||||||||||||||||||||||||
|
Trepeta
|
250,000 | — | — | $ | 1.00 |
01/03/15
|
— | — | — | — | ||||||||||||||||||||||||||||
| (1) | 200,000 | — | — | $ | 1.20 |
12/28/15
|
— | — | — |
—
|
||||||||||||||||||||||||||||
| 150,000 | — | — | $ | 1.20 |
08/22/17
|
— | — | — | — | |||||||||||||||||||||||||||||
| 50,000 |
—
|
—
|
$ | 1.20 |
03/01/13
|
—
|
—
|
—
|
—
|
|||||||||||||||||||||||||||||
| 50,000 |
—
|
—
|
$ | .65 |
03/02/19
|
—
|
—
|
—
|
—
|
|||||||||||||||||||||||||||||
| 50,000 |
—
|
—
|
$ | .54 |
03/25/20
|
—
|
—
|
—
|
—
|
|||||||||||||||||||||||||||||
| 200,000 |
—
|
—
|
$ | .50 | 04.07/20 |
—
|
—
|
—
|
—
|
|||||||||||||||||||||||||||||
| 100,000 |
—
|
—
|
$ | .26 |
02/28/21
|
—
|
—
|
—
|
—
|
|||||||||||||||||||||||||||||
| 100,000 |
—
|
—
|
$ | .61 | 02/28/21 | |||||||||||||||||||||||||||||||||
| Sean | ||||||||||||||||||||||||||||||||||||||
| Trepeta (2) | 100,000 |
—
|
|
$ | .30 | 08/13/12 |
—
|
—
|
—
|
—
|
||||||||||||||||||||||||||||
30
|
|
(1)
|
All options contain cashless exercise provisions and are currently fully vested.
|
|
|
(2)
|
Sean Trepeta owns warrants issued on April 21, 2011 which are not granted under a compensation plan.
|
Employment Agreements
Each of the following executive officers is a party to an employment agreement with the Company.
|
Name
|
Position
|
Monthly Salary (1)
|
Bonus (2)
|
||||
|
Dean L. Julia
|
Chief Executive Officer
|
$ 24,000
|
Annual bonus of at least 5% of pre-tax earnings
|
||||
|
Michael Trepeta
|
President
|
$ 24,000
|
Annual bonus of at least 5% of pre-tax earnings
|
|
(
1
)
|
Compensation of each executive officer named in the table above has his monthly base salary increased by $2,000 each subsequent March 1
st
during the term of the agreement and any extensions thereof. The next scheduled salary increase to $26,000 per month is March 1, 2012.
|
|
(2)
|
Annual bonuses are paid by us by the last business day of March for the preceding calendar (fiscal) year, except in the event of termination prior to the end of any fiscal year (other than termination for cause), a pro rata portion of the annual bonus shall be paid within 30 days of termination.
|
A summary of each Executive’s employment agreement, as amended, is as follows:
Each employment agreement, as amended, expires on March 1, 2015. The Agreement shall be automatically renewed for a period of two years thereafter unless the Executive gives 60 days prior written notice of his intention not to renew this Agreement prior to the end of the initial Term. Each employment agreement may not be terminated without cause. However, it may be terminated at any time by the Executive upon written three-month notice. In such event, the Company shall be relieved of all of its obligations under the Agreement, except for payment of the Executive’s Base Salary and Annual Bonus earned and unpaid through the effective date of termination, those obligations with respect to indemnification and director and officer insurance and severance pay as described below.
We may terminate the Executive’s employment for cause (“Cause”) as defined in the Agreement. In the event this Agreement is terminated for cause, the Executive’s Base Salary and any unearned Annual Bonus, severance pay and all benefits shall terminate immediately upon such discharge, and we shall have no further obligations to the Executive except for payment and reimbursement for any monies due which right to payment or reimbursement accrued prior to such termination.
We may terminate this Agreement upon the disability as defined in the Agreement or death of the Executive by giving written notice to the Executive. In the case of disability, such termination will become effective immediately upon the giving of such notice unless otherwise specified by us. Upon any such termination, we shall be relieved of all our obligations under the Executive’s employment, except for payment of the Executive’s Base Salary and Annual Bonus earned and unpaid through the effective date of termination and severance pay.
We have agreed to defend and indemnify each Executive in his capacity as an officer against all claims, judgments, damages, liabilities, costs and expenses (including reasonable attorney’s fees) arising out of, based upon, or related to his performance of services to us, to the maximum extent permitted under law. We will also use our reasonable best efforts to include each Executive as an insured under all applicable directors’ and officers’ liability insurance policies maintained by us.
Each Executive is currently entitled to the following additional benefits:
|
|
—
|
$2,000 per month pay raise on each March 1 during the term of the Agreement and any extension thereof;
|
|
|
—
|
The annual grant on March 1 of each year of ten-year stock options to purchase 100,000 shares at an exercise price equal to the then fair market value of our common stock as determined by the Board. ;
|
|
|
—
|
Election to the Board of Directors and during the term of employment, the Board’s nomination for re-election to the Board;
|
|
|
—
|
Paid disability insurance and term life insurance for the benefit of each Executive’s family in an amount fixed by the Board at a cost not to exceed $10,000 per annum;
|
|
|
—
|
Use of company automobile with all related costs paid for by us;
|
|
|
—
|
Health insurance;
|
|
|
—
|
Right to participate in any pensions of our company;
|
|
|
—
|
Termination pay of one-year base salary based upon the scheduled annual salary of each executive officer for the next contract year, plus the amount of bonuses paid or entitled to be paid to the executive for the current fiscal year or the preceding fiscal year, whichever is higher. In the event of termination, the executives will continue to receive all benefits included in the employment agreement through the scheduled expiration date of said employment agreement prior to the acceleration of the termination date thereof;
|
|
|
—
|
Health insurance; and
|
|
|
—
|
Right to participate in any pensions of our company.
|
31
Additional Compensation
In the event Mobiquity Networks, Inc. is successful in raising financing for its operations, Michael Trepeta agrees to serve as Chief Executive Officer of Mobiquity and Dean L. Julia agrees to serve as Chief Operating Officer of Mobiquity. As partial consideration for their services, each person shall receive ten year options to purchase 1,500,000 Shares of Mobiquity's Common Stock owned by Ace at an exercise price of $.01 per Share.
Employment Arrangements
Sean Trepeta became President of Mobiquity Networks in 2011. Mr. S. Trepeta is currently earning $10,000 per month plus commissions as an employee of the Company. Mr. S. Trepeta received in April 2011 warrants to purchase 100,000 shares of the Company’s Common Stock exercisable at $.30 per share through August 13, 2013, plus 100,000 restricted shares of Common Stock.
DIRECTOR COMPENSATION
Stock Options
Stock options and equity compensation awards to our non-employee / non-executive director are at the discretion of the Board. As of December 31, 2011, no options or equity awards have been made to our non-employee / non-executive directors.
Cash Compensation
Our non-employee / non-executive director is eligible to receive a fee of $500 to be paid for attending each Board meeting; however, no fees were paid in 2011.
Travel Expenses
All directors shall be reimbursed for their reasonable out of pocket expenses associated with attending the meeting.
The following table shows the overall compensation earned for the 2011 fiscal year with respect to each non-employee and non-executive director as of December 31, 2011.
|
DIRECTOR COMPENSATION
|
||||||||||||||||||||||||||||
|
Name and Principal Position
|
Fees Earned or Paid in Cash ($)
|
Stock Awards ($)
|
Option Awards
($) (1)
|
Non-Equity Incentive Plan Compensation
($) (2)
|
Nonqualified Deferred Compensation Earnings ($)
|
All Other Compensation
($) (3)
|
Total ($)
|
|||||||||||||||||||||
|
Thomas Arnost, Director (4)
|
—
|
—
|
—
|
—
|
—
|
|||||||||||||||||||||||
|
Domenico Iannucci, Director (4)
|
—
|
$ 10,692
|
—
|
—
|
—
|
|
$ 10,692
|
|||||||||||||||||||||
(1) The restricted stock awards and options presented in this table for 2011 reflect the full grant date fair value as if the total dollar amount were earned in the year of grant. As a general rule, for time-in-service-based options, the Company will immediately expense any restricted stock awards and option or portion thereof which is vested upon grant, while expensing the balance on a pro rata basis over the remaining vesting term of the restricted stock awards and options.
(2) Excludes awards or earnings reported in preceding columns.
(3) Includes all other compensation not reported in the preceding columns, including (i) perquisites and other personal benefits, or property, unless the aggregate amount of such compensation is less than $10,000; (ii) any “gross-ups” or other amounts reimbursed during the fiscal year for the payment of taxes; (iii) discounts from market price with respect to securities purchased from the company except to the extent available generally to all security holders or to all salaried employees; (iv) any amounts paid or accrued in connection with any termination (including without limitation through retirement, resignation, severance or constructive termination, including change of responsibilities) or change in control; (v) contributions to vested and unvested defined contribution plans; (vi) any insurance premiums paid by, or on behalf of, the company relating to life insurance for the benefit of the director; (vii) any consulting fees earned, or paid or payable; (viii) any annual costs of payments and promises of payments pursuant to a director legacy program and similar charitable awards program; and (ix) any dividends or other earnings paid on stock or option awards that are not factored into the grant date fair value required to be reported in a preceding column.
32
(4) Mr. Arnost received options to purchase 200,000 shares of the Company’s Common Stock exercisable at $.60 per share from the date of issuance through December 20, 2016. Mr. Iannucci received options to purchase 50,000 shares of the Company’s Common Stock, exercisable at any time from the date of issuance through February 28, 2021 at an exercise price of $.26 per share.
2005 Employee Benefit and Consulting Services Compensation Plan
On January 3, 2005, our company established an Employee Benefit and Consulting Services Compensation Plan (the “2005 Plan”) covering 2,000,000 shares, which 2005 Plan was ratified by our stockholders on February 9, 2005. On August 12, 2005, the company’s stockholders approved a 2,000,000 share increase in the 2005 Plan to 4,000,000 shares.
Administration
Our board of directors administers the 2005 Plan, has the authority to determine and designate officers, employees, directors and consultants to whom awards shall be made and the terms, conditions and restrictions applicable to each award (including, but not limited to, the option price, any restriction or limitation, any vesting schedule or acceleration thereof, and any forfeiture restrictions). The board may, in its sole discretion, accelerate the vesting of awards.
Types of Awards
The 2005 Plan is designed to enable us to offer certain officers, employees, directors and consultants of us and our subsidiaries equity interests in us and other incentive awards in order to attract, retain and reward such individuals and to strengthen the mutuality of interests between such individuals and our stockholders. In furtherance of this purpose, the 2005 Plan contains provisions for granting non-statutory stock options and incentive stock options and common stock awards.
Stock Options
. A “stock option” is a contractual right to purchase a number of shares of common stock at a price determined on the date the option is granted. An incentive stock option is an option granted under the Internal Revenue Code of 1986 to our employees with certain tax advantages to the grantee over non-statutory stock options. The option price per share of common stock purchasable upon exercise of a stock option and the time or times at which such options shall be exercisable shall be determined by the Board at the time of grant. Such option price in the case of incentive stock options shall not be less than 100% of the fair market value of the common stock on the date of grant and may be granted below fair market value in the case of non-statutory stock options. Incentive stock options granted to owners of 10% or more of our common stock must be granted at an exercise price of at least 110% of the fair market value of our common stock and may not have a term greater than five years. Also, the value of incentive options vesting to any employee cannot exceed $100,000 in any calendar year. The option price of our options must be paid in cash, money order, check or common stock of the company. The non-statutory stock options may also contain at the time of grant, at the discretion of the board, certain other cashless exercise provisions. These cashless exercise provisions are included in the currently outstanding non-statutory stock options granted by the board.
Options shall be exercisable at the times and subject to the conditions determined by the Board at the date of grant, but no option may be exercisable more than ten years after the date it is granted. If the optionee ceases to be an employee of our company for any reason other than death, any incentive stock option exercisable on the date of the termination of employment may be exercised for a period of thirty days or until the expiration of the stated term of the option, whichever period is shorter. In the event of the optionee’s death, any incentive stock option exercisable at the date of death may be exercised by the legal heirs of the optionee from the date of death until the expiration of the stated term of the option or six months from the date of death, whichever event first occurs. In the event of disability of the optionee, any incentive stock options shall expire on the stated date that the Option would otherwise have expired or 12 months from the date of disability, whichever event first occurs. The termination and other provisions of a non-statutory stock option shall be fixed by the board of directors at the date of grant of each respective option.
Common Stock Award
. Common stock awards are shares of common stock that will be issued to a recipient at the end of a restriction period, if any, specified by the board if he or she continues to be an employee, director or consultant of us. If the recipient remains an employee, director or consultant at the end of the restriction period, the applicable restrictions will lapse and we will issue a stock certificate representing such shares of common stock to the participant. If the recipient ceases to be an employee, director or consultant of us for any reason (including death, disability or retirement) before the end of the restriction period unless otherwise determined by the board, the restricted stock award will be terminated.
33
Awards
As of December 31, 2011, the Company has granted options to purchase 3,505,000 shares of the Company’s Common Stock with a weighted average exercise price of $.84 per share. The board has granted options with varying terms
.
It is not possible to predict the individuals who will receive future awards under the Plan or the number of shares of Common Stock covered by any future award because such awards are wholly within the discretion of the Board. The table below contains information as of December 31, 2011 on the known benefits provided to certain persons and group of persons under the Plan.
|
Number of Shares
Subject to Options
|
Range of Exercise Price ($) per Share
|
Value of
Unexercised
Options at
Dec. 31, 2010 (1)
|
||||||||||
|
Dean L. Julia,
Chief
Executive Officer (2)
|
1,050,000 | $ | .26 - $1.20 | $ | 57,000 | |||||||
|
Michael D. Trepeta,
President (2)
|
1,050,000 | $ | .26 - $1.20 | $ | -0- | |||||||
|
Sean McDonnell,
Chief
Financial officer
|
50,000 | $ | 1.00 | $ | -0- | |||||||
|
Sean Trepeta (2)
President, Mobiquity Networks
|
-0- | N/A | N/A | |||||||||
|
Three Executive Officers
as a group
|
2,150,000 | $ | .26 - $1.20 | $ | 14,000 | |||||||
| Thomas Arnost | 200,000 | $ | .60 | -0- | ||||||||
| Domenico Iannucci | 200,000 | $ | .26 - $.50 | $ | 27,000 | |||||||
|
Non-Executive Officer,
Employees and
Consultants
|
955,000 | $ | .30-$ 2.5 | $ | -0- | |||||||
____________________
|
N/A
|
- Not applicable.
|
|
(1)
|
Value is normally calculated by multiplying (a) the difference between the market value per share at period end (i.e. $.60 based upon a last sale on (or the last trade date before) December 31, 2011) and the option exercise price by (b) the number of shares of Common Stock underlying the option.
|
|
(2)
|
Does not include warrants to purchase 100,000 shares granted outside of any compensation plan.
|
During the past three years, the Company has granted certain employees and consultants restricted stock awards for services for the prior year with vesting to occur after the passage of an additional 12 months. These awards totaled 45,000 Shares for 2008, subject to continued services with the Company through December 31, 2009. These awards totaled 51,000 Shares for 2009 subject to continued services with the Company through December 31, 2010. These awards totaled 105,000 Shares for 2010 subject to continued services with the Company through December 31, 2011. These awards totaled 45,000 shares for 2011, subject to continued services with the Company through December 31, 2012.
Eligibility
Our officers, employees, directors and consultants of Ace and our subsidiaries are eligible to be granted stock options, and common stock awards.
Termination or Amendment of the 2005 Plan
The board may at any time amend, discontinue, or terminate all or any part of the 2005 Plan, provided, however, that unless otherwise required by law, the rights of a participant may not be impaired without his or her consent, and provided that we will seek the approval of our stockholders for any amendment if such approval is necessary to comply with any applicable federal or state securities laws or rules or regulations.
34
2009 Employee Benefit and Consulting Compensation Plan
On August 28, 2009, the Board established and on October 7, 2009, the stockholders approved an Employee Benefit and Consulting Compensation Plan (the “2009 Plan”) covering 4,000,000 shares with an effective date of October 7, 2009.
Administration
Our Board of Directors, Compensation Committee or both, in the sole discretion of our Board, will administer the 2009 Plan. The Board, subject to the provisions of the 2009 Plan, has the authority to determine and designate employees and consultants to whom awards shall be made and the terms, conditions and restrictions applicable to each award (including, but not limited to, the option price, any restriction or limitation, any vesting schedule or acceleration thereof, and any forfeiture restrictions). The Board or Compensation Committee may, in its sole discretion, accelerate the vesting of awards. Our Compensation Committee must approve all grants of Options and Stock Awards issued to our executive officers or directors.
Types of Awards
The 2009 Plan is designed to enable us to offer certain officers, employees, directors and consultants of us and our subsidiaries equity interests in us and other incentive awards in order to attract, retain and reward such individuals and to strengthen the mutuality of interests between such individuals and our stockholders. In furtherance of this purpose, the 2009 Plan contained provisions for granting incentive and non-statutory stock options and Common Stock Awards.
Stock Options
. A "stock option" is a contractual right to purchase a number of shares of Common Stock at a price determined on the date the option is granted. The option price per share of Common Stock purchasable upon exercise of a stock option and the time or times at which such options shall be exercisable shall be determined by the Board at the time of grant. Such option price shall not be less than 100% of the fair market value of the Common Stock on the date of grant. The option price must be paid in cash, money order, check or Common Stock of the Company. The Options (excluding Incentive Stock Options) may also contain at the time of grant, at the discretion of the Board, certain cashless exercise provisions.
Options shall be exercisable at the times and subject to the conditions determined by the Board at the date of grant, but no option may be exercisable more than ten years after the date it is granted. If the Optionee ceases to be an employee of our company for any reason other than death, any option originally granted as an Incentive Stock Option exercisable on the date of the termination of employment may be exercised for a period of thirty days or until the expiration of the stated term of the option, whichever period is shorter. In the event of the Optionee’s death, any originally granted Incentive Stock Option exercisable at the date of death may be exercised by the legal heirs of the Optionee from the date of death until the expiration of the stated term of the option or six months from the date of death, whichever event first occurs. In the event of disability of the Optionee, any originally granted Incentive Stock Options shall expire on the stated date that the Option would otherwise have expired or 12 months from the date of disability, whichever event first occurs. The termination and other provisions of a non-statutory stock option shall be fixed by the Board of Directors at the date of grant of each respective option.
Common Stock Award
. “Common Stock Awards” are shares of Common Stock that will be issued to a recipient at the end of a restriction period, if any, specified by the Board if he or she continues to be an employee, director or consultant of us. If the recipient remains an employee, director or consultant at the end of the restriction period, the applicable restrictions will lapse and we will issue a stock certificate representing such shares of Common Stock to the participant. If the recipient ceases to be an employee, director or consultant of us for any reason (including death, disability or retirement) before the end of the restriction period unless otherwise determined by the Board, the restricted stock award will be terminated.
Eligibility
The Company’s officers, employees, directors and consultants of Ace and its subsidiaries are eligible to be granted stock options, and Common Stock Awards. Eligibility shall be determined by the Board or our Compensation Committee; however, all Options and Stock Awards granted to officers and directors must be approved by our Compensation Committee.
Termination or Amendment of the 2009 Plan
The Board may at any time amend, discontinue, or terminate all or any part of the 2009 Plan, provided, however, that unless otherwise required by law, the rights of a participant may not be impaired without his or her consent, and provided that we will seek the approval of our stockholders for any amendment if such approval is necessary to comply with any applicable federal or state securities laws or rules or regulations.
35
Awards
It is not possible to predict the individuals who will receive future awards under the 2009 Plan or the number of shares of Common Stock covered by any future award because such awards are wholly within the discretion of the Board or our Compensation Committee. Currently, there have been no awards granted under the 2009 Plan.
The 2009 Plan will terminate and no awards may be granted after October 6, 2019.
Shares Subject to the Plan
The maximum number of shares of Common Stock that may be issued pursuant to awards granted under the Plan is 4,000,000. Such shares may be either authorized and unissued shares or issued shares reacquired by the Company and held in treasury. The Plan does not limit the number of shares of Common Stock with respect to which options or Stock Awards may be granted to any individual during any calendar year, except there are limits in the case of Incentive stock Options to those established by the Internal Revenue Code of 1986, as amended. The aggregate number of shares issuable under the 2009 Plan and the number of shares subject to options and awards to be granted under the Plan are subject to adjustment in the event of certain mergers, reorganizations, consolidations, recapitalizations, dividends (other than a regular cash dividend), stock split or other change in corporate structure affecting the Common Stock. Shares subject to options that expire, terminate or are canceled unexercised, shares of stock that have been forfeited to the Company and shares that are not issued as a result of forfeiture or termination of an award may be reissued under the Plan.
As of March 1, 2012, the Company had outstanding 24,369,239
shares of Common Stock. The only persons of record who presently hold or are known to own (or believed by the Company to own) beneficially more than 5% of the outstanding shares of such class of stock is listed below. The following table also sets forth certain information as to holdings of the Company's Common Stock of all officers and directors individually, and all officers and directors as a group.
|
Name and Address of Beneficial Owner (1)
|
Number of Common
Shares
|
Percentage
|
|
Officers and Directors:
|
||
|
Michael D. Trepeta
457 Rockaway Avenue
Valley Stream, NY 11583(2)
|
2,166,402
|
8.5%
|
|
Dean L. Julia
457 Rockaway Avenue
Valley Stream, NY 11583 (2)
|
2,136,901
|
8.4%
|
|
Sean McDonnell
457 Rockaway Avenue
Valley Stream, NY 11583 (3)
|
50,000
|
0.2%
|
|
Domenico Iannucci
One Windsor Drive
Muttontown, NY 11753 (4)
|
739,650
|
3.0%
|
|
Sean Trepeta (5)
457 Rockaway Avenue
Valley Stream, NY 11583
|
700,000
|
2.9%
|
|
Thomas Arnost (6)
457 Rockaway Avenue
Valley Stream, NY 11583
|
1,200,000
|
4.8%
|
|
All Directors and Officers as a
Group (six persons) (7)
|
6,992,953
|
25.2%
|
___________________
|
(1)
|
Beneficial ownership is determined in accordance with Rule 13d-3 under the Securities Exchange Act of 1934, as amended, and is generally determined by voting powers and/or investment powers with respect to securities. Unless otherwise noted, all of such shares of common stock listed above are owned of record by each individual named as beneficial owner and such individual has sole voting and dispositive power with respect to the shares of common stock owned by each of them. Such person or entity’s percentage of ownership is determined by assuming that any options or convertible securities held by such person or entity, which are exercisable within sixty (60) days from the date hereof, have been exercised or converted as the case may be, but not for the purposes of determining the number of outstanding shares held by any other named beneficial owner.
|
|
(2)
|
Includes options to purchase 1,150,000 shares.
|
|
(3)
|
Includes options to purchase 50,000 shares.
|
|
(4)
|
Consists of 539,660 shares of Common Stock and options to purchase 200,000 shares.
|
|
(5)
|
Includes options to purchase 100,000 shares.
|
|
(6)
|
Includes options to purchase 200,000 shares and warrants to purchase 500,000 shares.
|
|
(7)
|
Includes options to purchase 2,850,000 shares and warrants to purchase 500,000 shares.
|
36
Securities Authorized for Issuance under Equity Compensation Plans.
The following summary information is as of December 31, 2011 and relates to our 2005 Plan and 2009 Plan described elsewhere herein pursuant to which we have granted options to purchase our common stock:
|
(a)
|
(b)
|
(c)
|
||||||||||||||||
|
Plan category
|
Number of shares of common stock to be issued upon exercise of outstanding options
|
Weighted average exercise price of outstanding options
|
Number of securities remaining available for future issuance under equity compensation plans (excluding shares reflected in column (a)
|
|||||||||||||||
|
2005 Equity
Compensation Plans (1)
|
3,505,000
|
$.8
|
4
|
268,000
|
||||||||||||||
|
2009 Equity
Compensation Plan
|
-0-
|
N/A
|
4,000,000
|
|||||||||||||||
_____________________
|
(1)
|
Options are exercisable at a price range of $.10 to $2.50 per share. The foregoing table does not reflect 227,000 shares of Common Stock issued pursuant to the 2005 Plan as restricted stock awards.
|
Recent Securities Transactions
In the past two fiscal years ended December 31, 2011 and the period January 1, 2012 through January 31, 2017, the Company completed the following private placement offerings with non-affiliated persons except as otherwise noted:
On December 8, 2009, Ace Marketing & Promotions, Inc. entered into an Introducing Agent Agreement with Legend Securities, Inc., a FINRA registered broker-dealer ("Legend"), to attempt to raise additional financing through the sale of its Common Stock and Warrants. Between December 8, 2009 and March 15, 2010, the Company closed on gross proceeds of $1,025,000 before commissions of $117,000. The planned use of proceeds is to primarily expand the Company's mobile and interactive divisions. The Company issued pursuant to the terms of the offering an aggregate of 2,050,000 shares of Common Stock at a per share price of $.50 per share and 1,025,000 Warrants exercisable at $1.00 per share to investors in the offering and placement agent warrants to purchase an amount equal to 10% of the number of shares and the number of warrants sold in the offering. All securities were issued pursuant to Rule 506 of Regulation D promulgated under Section 4(2) of the Securities Act of 1933, as amended.
In August 2010, the Company raised $175,000 in gross proceeds from the sale of 437,500 shares and a like number of Warrants expiring in August 2013. The investor paid $0.40 per Share and received Warrants exercisable at $0.60 per Share. In November 2010, the Company commenced a plan of financing and raised an additional $800,500 in financing from the sale of 2,934,999 Shares of its restricted Common Stock at $0.30 per Share and Common Stock Purchase Warrants to purchase a like number of Shares, exercisable at $0.30 per Share through August 31, 2013. Subsequent to the completion of the second financing, the Company agreed to adjust the terms of the August 2010 transaction and issue to the August 2010 investor Shares and Warrants on the same terms as those sold in November - December 2010. Accordingly, an additional 145,833 Shares and a like number of Warrants were issued to the August 2010 investor, with the exercise price of the Warrants being lowered from $0.60 per Share to $0.30 per Share. All securities will be issued pursuant to Section 4(2) and/or Rule 506 of Regulation D promulgated under Section 4(2) of the Securities Act of 1933, as amended.
In March 2011, the Company commenced a private placement offering. Pursuant to said offering between March 29, 2011 and April 19, 2011, the Company raised $755,000 in gross proceeds from the sale of 2,516,666 shares of common stock and a like number of warrants, exercisable at $.30 per share through August 31, 2013. Exemption is claimed for the sale of securities pursuant to Rule 506 and/or Section 4(2) of the Securities Act of 1933, as amended.
Between May 25, 2011 and June 3, 2011, the Company received gross proceeds of $461,250 from the sale of 1,025,000 shares of Common Stock at a purchase price of $.45 per share. The sale of stock was also accompanied by Warrants expiring on May 31, 2014. Exemption is claimed for the sale of securities pursuant to Rule 506 and/or Section 4(2) of the Securities Act of 1933, as amended.
37
In July 2011, the Company commenced a private placement offering. Pursuant to said offering between July14, 2011 and August 1, 2011, the Company raised $975,000 in gross proceeds from the sale of 1,950,000 shares of common stock and a like number of warrants, exercisable at $.60 per share through July 31, 2014. Of the $975,000, $250,000 was invested by Thomas Arnost who later became a director of the Company in December 2011. Mr. Arnost received 500,000 shares of Common Stock and Warrants to purchase 500,000 shares in the offering. Exemption is claimed for the sale of securities pursuant to Rule 506 and/or Section 4(2) of the Securities Act of 1933, as amended.
On January 30, 2012, the Company’s private placement offering was terminated. Rockwell Global Capital LLC acted as Placement Agent. The Company received gross proceeds of $575,000 from the sale of 958,338 shares of Common Stock at a purchase price of $.60 per share. The private placement offering also included the sale of Warrants to purchase 191,671 shares of Common Stock, exercisable at $.60 per share and expiring on January 18, 2016. The Placement Agent received a $25,000 advisory fee, $51,750 in commissions and warrants to purchase 95,833 shares identical to the warrants sold to investors in the offering. Exemption is claimed for the sale of securities pursuant to Rule 506 and/or Section 4(2) of the Securities Act of 1933, as amended. See “Item 7.”
Transactions with Officers and Directors
The following describes transactions between the Company and its officers and directors for the past two fiscal years ended December 31, 2011(except as noted above).
Reference is made to Item 11 of this Form 10-K for a description of compensation and employment agreements or arrangements paid to Dean Julia, Chief Executive Officer of the Company, Michael Trepeta, President of the Company, and Sean Trepeta, President of Mobiquity Networks. Sean McDonnell, Chief Executive Officer of the Company, also receives a salary below the amount required of disclosure under Item 11.
In March 2011, the Company granted to each of Dean Julia and Michael Trepeta options to purchase 100,000 shares of Common Stock, exercisable at $.26 per share through February 28, 2021. On the same date, Domenico Iannucci received options to purchase 50,000 shares on the same terms as those granted to Messrs. Julia and Trepeta.
In April 2011, the Company issued to Sean Trepeta, 100,000 shares of Common Stock and Warrants to purchase 200,000 shares of Common Stock, exercisable at $.30 per share through August 13, 2013 in exchange for services rendered in connection with a recently completed private placement offering.
In December 2011, the Company granted Thomas Arnost options to purchase 200,000 shares of Common Stock at an exercise price of $.60 per share through December 20, 2016.
Director Independence
Domenico Iannucci and Thomas Arnost are the Company’s “independent directors.” Mr. Arnost is a “financial expert”, but Mr. Iannucci is not deemed a “financial expert.”
Under the National Association of Securities Dealers Automated Quotations definition, an “independent director” means a person other than an officer or employee of the Company or its subsidiaries or any other individuals having a relationship that, in the opinion of the Company’s board of directors, would interfere with the exercise of independent judgment in carrying out the responsibilities of the director. The board’s discretion in determining director independence is not completely unfettered. Further, under the NASDAQ definition, an independent director is a person who (1) is not currently (or whose immediate family members are not currently), and has not been over the past three years (or whose immediate family members have not been over the past three years), employed by the company; (2) has not (or whose immediate family members have not) been paid more than $60,000 during the current or past three fiscal years; (3) has not (or whose immediately family has not) been a partner in or controlling shareholder or executive officer of an organization which the company made, or from which the company received, payments in excess of the greater of $200,000 or 5% of that organizations consolidated gross revenues, in any of the most recent three fiscal years; (4) has not (or whose immediate family members have not), over the past three years been employed as an executive officer of a company in which an executive officer of Ace has served on that company’s compensation committee; or (5) is not currently (or whose immediate family members are not currently), and has not been over the past three years (or whose immediate family members have not been over the past three years) a partner of Ace’s outside auditor.
38
Peter Messineo has served as our independent auditors for the past two fiscal years.
The following table presents aggregate fees for professional services rendered by our independent registered public accounting firm, Peter Messineo for the audit of our annual consolidated financial statements for the years ended December 31, 2011 and 2010.
|
Year Ended December 31,
|
||||||
|
2011
|
|
2010
|
||||
|
Audit fees
|
$ |
18,000
|
|
$
|
18,000
|
|
|
Audit- related fees
|
6,000
|
|
-
|
|
||
|
Tax fees
|
-
|
|
-
|
|
||
|
All other fees
|
-
|
|
-
|
|||
|
|
||||||
|
Total fees
|
$ |
24,000
|
|
$
|
18,000
|
|
Policy on Board Pre-Approval of Services of Independent Registered Public Accounting Firm
Our Board has responsibility for appointing, setting compensation and overseeing the work of the independent registered public accounting firm. In recognition of this responsibility, the Board has established a policy to pre-approve all audit and permissible non-audit services provided by the independent registered public accounting firm. Prior to engagement of the independent registered public accounting firm for the following year’s audit, management will submit to the Board for approval a description of services expected to be rendered during that year for each of following categories of services:
Audit services
include audit work performed in the preparation and audit of the annual financial statements, review of quarterly financial statements, reading of annual, quarterly and current reports, as well as work that generally only the independent auditor can reasonably be expected to provide, such as the provision of consents and comfort letters in connection with the filing of registration statements.
Audit-related services
are for assurance and related services that are traditionally performed by the independent auditor, including due diligence related to mergers and acquisitions and special procedures required to meet certain regulatory requirements.
Tax services
consist principally of assistance with tax compliance and reporting, as well as certain tax planning consultations.
Other services
are those associated with services not captured in the other categories. We generally do not request such services from our independent auditor.
Prior to the engagement, the Board pre-approves these services by category of service. The fees are budgeted, and the Board requires the independent registered public accounting firm and management to report actual fees versus the budget periodically throughout the year by category of service. During the year, circumstances may arise when it may become necessary to engage the independent registered public accounting firm for additional services not contemplated in the original pre-approval. In those instances, the Board requires specific pre-approval before engaging the independent registered public accounting firm.
The Board may delegate pre-approval authority to one or more of its members. The member to whom such authority is delegated must report, for informational purposes only, any pre-approval decisions to the audit Board at its next scheduled meeting.
None of the services described above for 2011 or 2010 provided by Peter Messineo CPA were approved by the Board pursuant to paragraph (c)(7)(i)(C) of Rule 2-01 of Regulation S-X.
39
|
(a)
|
FINANCIAL STATEMENTS
|
The following documents are filed under "ITEM 7. FINANCIAL STATEMENTS AND SUPPLEMENTARY DATA," beginning on page F-1 and are included as part of this Form 10-K as the financial statements of the Company for the years ended December 31, 2011 and 2010:
Reports of Independent Registered Public Accounting Firms
Balance Sheets
Statements of Operations
Statement of Stockholders' Equity
Notes to Financial Statements
|
(b)
|
EXHIBITS
|
|
Exhibit No.
|
Description
|
|
|
3.1
|
Articles of Incorporation filed March 26, 1998 (1)
|
|
|
3.2
|
Amendment to Articles of Incorporation filed June 10, 1999 (1)
|
|
|
3.3
|
Amendment to Articles of Incorporation approved by stockholders on February 9, 2005(1)
|
|
|
3.4
|
Amended By-Laws (1)
|
|
|
10.1
|
Employment Agreement - Michael Trepeta (2)
|
|
|
10.2
|
Employment Agreement - Dean Julia (2)
|
|
|
10.3
|
Amendments to Employment Agreement - Michael Trepeta (5)(7)
|
|
|
10.4
|
Amendments to Employment Agreement - Dean L. Julia (5)(7)
|
|
|
10.5
|
Joint Venture Agreement with Atrium Enterprises Ltd. (6)
|
|
|
10.6
|
Agreement with Aon Consulting (6)
|
|
|
10.7
|
Amendment to Exhibits 10.3 and 10.4 dated April 7, 2010 (10)
|
|
|
10.8
|
Office Lease for Garden City, NY (11)
|
|
|
11.1
|
Statement re: Computation of per share earnings. See Statement of Operations and Notes to Financial Statements
|
|
|
14.1
|
Code of Ethics/Code of Conduct (5)
|
|
|
21.1
|
Subsidiaries of the Issuer (11)
|
|
|
31.1
|
Principal Executive Officer Rule 13a-14(a)/15d-14(a) Certification (11)
|
|
|
31.2
|
Principal Financial Officer Rule 13a-14(a)/15d-14(a) Certification (11)
|
|
|
32.1
|
Principal Executive Officer Section 1350 Certification (11)
|
|
|
32.2
|
Principal Financial Officer Section 1350 Certification (11)
|
|
|
99.1
|
2005 Employee Benefit and Consulting Services Compensation Plan(2)
|
|
|
99.2
|
Form of Class A Warrant (2)
|
|
|
99.3
|
Form of Class B Warrant (2)
|
|
|
99.4
|
Amendment to 2005 Plan (4)
|
|
|
99.5
|
Form of Class C Warrant (8)
|
|
|
99.6
|
2009 Employee Benefit and Consulting Services Compensation Plan (3)
|
|
|
99.7
|
Form of Class D Warrant (3)
|
|
|
99.8
|
Form or Class E Warrant(9)
|
|
|
99.9
|
Form of Class F Warrant (9)
|
|
|
99.10
|
Form of Class G Warrant (9)
|
|
|
99.11
|
Form of Class H Warrant (9)
|
|
|
99.12
|
Form of Class AA Warrant (11)
|
|
| 99.13 | Press Release dated February 21, 2012 (11) | |
|
101.SCH
|
Document, XBRL Taxonomy Extension (11)
|
|
|
101.CAL
|
Calculation Linkbase, XBRL Taxonomy Extension Definition (11)
|
|
|
101.DEF
|
Linkbase, XBRL Taxonomy Extension Labels (11)
|
|
|
101.LAB
|
Linkbase, XBRL Taxonomy Extension (11)
|
|
|
101.PRE
|
Presentation Linkbase (11)
|
|
______________
| (1) | Incorporated by reference to Registrant's Registration Statement on Form 10-SB as filed with the Commission on February 10, 2005. | ||
|
(2)
|
Incorporated by reference to Registrant’s Registration Statement on Form 10-SB/A filed with the Commission March 18, 2005.
|
||
|
(3)
|
Incorporated by reference to Form 10-K filed for the fiscal year ended December 31, 2009.
|
||
|
(4)
|
Incorporated by reference to the Registrant's Form 10-QSB/A filed with the Commission on August 18, 2005.
|
||
|
(5)
|
Incorporated by reference to the Registrant's Form 10-KSB for its fiscal year ended December 31, 2005.
|
||
|
(6)
|
Incorporated by reference to the Registrant's Form 10-KSB for its fiscal year ended December 31, 2006.
|
||
|
(7)
|
Incorporated by reference to the Registrant's Form 8-K dated September 21, 2007.
|
||
|
(8)
|
Incorporated by reference to the Registrant's Form 10-QSB for its quarter ended September 30, 2006.
|
||
|
(9)
|
Incorporated by reference to the Registrant's Form 10-K for its fiscal year ended December 31, 2010.
|
||
|
(10)
|
Incorporated by reference to the Registrant’s Form 10-Q for the quarter ended March 31, 2011. | ||
|
(11)
|
Filed herewith.
|
||
|
(c)
|
FINANCIAL STATEMENT SCHEDULES
|
We are not filing any financial statement schedules as part of this Form 10-K because such schedules are either not applicable or the required information is included in the financial statements or notes thereto.
40
SIGNATURES
Pursuant to the requirements Section 13 or 15(d) of the Securities Exchange Act of 1934, the Registrant has caused this Report to be signed on its behalf by the undersigned, thereunto duly authorized.
|
ACE MARKETING & PROMOTIONS, INC.
|
|||
|
By:
|
/s/ Dean L. Julia
|
||
|
Dean L. Julia, Chairman of the
|
|||
|
Board and Principal Executive Officer
|
|||
Dated: Valley Stream, New York
March 5, 2012
Pursuant to the requirements of the Securities Exchange Act of 1934, this Report has been signed below by the following persons on behalf of the Registrant and in the capacities and on the dates indicated:
|
Signatures
|
Title
|
Date
|
|||
|
/s/ Dean L. Julia
|
Chairman of the Board
|
March 5, 2012
|
|||
|
Dean L. Julia
|
Principal Executive Officer
|
||||
|
/s/ Sean McDonnell
|
Principal Financial Officer
|
March 5, 2012
|
|||
|
Sean McDonnell
|
|||||
|
/s/ Michael D. Trepeta
|
President, Director
|
March 5, 2012
|
|||
|
Michael D. Trepeta
|
|||||
| /s/ Sean Trepeta | Director | March 5, 2012 | |||
| Sean Trepeta | |||||
|
Director
|
March 5, 2012
|
||||
|
Domenico Iannucci
|
|
Director
|
March 5, 2012
|
||||
|
Thomas Arnost
|
Dean L. Julia, Michael D. Trepeta, Sean Trepeta, Domenico Iannucci and Thomas Arnost represent all the current members of the Board of Directors.
41
TABLE OF CONTENTS
Part IItem 1. A. Risk FactorsItem 1. B. Unresolved Staff CommentsItem 2. PropertiesItem 3. Legal ProceedingsItem 4. ReservedPart IIItem 5. Market For Common Equity, Related Stockholder Matters, and IssuerItem 6. Selected Financial DataItem 7. Management's Discussion and Analysis Of Financial Condition and Results Of OperationsItem 7. A Qualitative and Qualitative Disclosures About Market RiskItem 8. Financial StatementsNote 1: Summary Of Significant Accounting PoliciesNote 2: Property and Equipment, NetNote 3: Income TaxesNote 4: Stockholders EquityNote 5: Share-based CompensationNote 6: Stock CompensationNote 7: Loss Per ShareNote 8: Stock Option PlansNote 9: Commitments and ContingenciesNote 10: Supplementary Information - Statement Of Cash FlowsNote 11: Segment InformationNote 12: Subsequent EventsItem 9. Changes in and Disagreements with Accountants on Accounting and Financial DisclosureItem 9. A Controls and ProceduresItem 9. B. Other InformationPart IIIItem 10. Directors, Executive Officers and Corporate GovernanceItem 11. Executive CompensationItem 12. Security Ownership Of Certain Beneficial Owners and Management and Related Stockholder MattersItem 13. Certain Relationships and Related Transactions and Director IndependenceItem 14. Principal Accountant Fees and ServicesItem 15. Exhibits and Financial Statement Schedules