MODINE MANUFACTURING CO
10-Ks and 10-Qs
|
|
|
|
|
|
|
|
|
|
|
|
|
|
|
|
|
|
|
|
|
|
|
|
|
|
|
|
|
|
|
|
|
|
|
|
|
|
|
|
|
|
|
|
|
|
|
|
|
|
|
|
|
|
|
|
|
|
|
|
|
|
UNITED STATES
SECURITIES AND EXCHANGE COMMISSION
Washington, D. C. 20549
FORM 10-K
|
þ
|
ANNUAL REPORT PURSUANT TO SECTION 13 or 15(d) OF THE SECURITIES EXCHANGE ACT OF 1934
|
For the fiscal year ended
March 31, 2013
or
|
o
|
TRANSITION REPORT PURSUANT TO SECTION 13 or 15(d) OF THE SECURITIES EXCHANGE ACT OF 1934
|
For the transition period from ____________ to ____________
Commission file number
1-1373
MODINE MANUFACTURING COMPANY
(Exact name of registrant as specified in its charter)
| WISCONSIN |
39-0482000
|
|
| (State or other jurisdiction of incorporation or organization) | (I.R.S. Employer Identification No.) | |
|
1500 DeKoven Avenue, Racine, Wisconsin
|
53403
|
|
| (Address of principal executive offices) | (Zip Code) |
Registrant's telephone number, including area code
(262) 636-1200
Securities registered pursuant to Section 12(b) of the Act:
|
Title of each class
|
Name of each exchange on which registered
|
|
| Common Stock, $0.625 par value | New York Stock Exchange |
Securities Registered pursuant to Section 12(g) of the Act: None
Indicate by check mark if the registrant is a well-known seasoned issuer, as defined in Rule 405 of the Securities Act.
Yes
o
No
þ
Indicate by check mark if the registrant is not required to file reports pursuant to Section 13 or Section 15(d) of the Act.
Yes
o
No
þ
Indicate by check mark whether the registrant (1) has filed all reports required to be filed by Section 13 or 15(d) of the Securities Exchange Act of 1934 during the preceding 12 months (or such shorter period that the registrant was required to file such reports), and (2) has been subject to such filing requirements for the past 90 days.
Yes
þ
No
o
Indicate by check mark whether the registrant has submitted electronically and posted on its corporate Web site, if any, every Interactive Data File required to be submitted and posted pursuant to Rule 405 of Regulation S-T during the preceding 12 months (or for such shorter period that the registrant was required to submit and post such files).
Yes
þ
No
o
Indicate by check mark if disclosure of delinquent filers pursuant to Item 405 of Regulation S-K is not contained herein, and will not be contained, to the best of registrant's knowledge, in definitive proxy or information statements incorporated by reference in Part III of this Form 10-K or any amendment to this Form 10-K.
þ
Indicate by check mark whether the registrant is a large accelerated filer, an accelerated filer, a non-accelerated filer, or a smaller reporting company. See definitions of “large accelerated filer,” “accelerated filer” and “smaller reporting company” in Rule 12b-2 of the Exchange Act. (Check one):
|
Large Accelerated Filer
o
|
Accelerated Filer
þ
|
|
Non-accelerated Filer
o
(Do not check if a smaller reporting company)
|
Smaller reporting company
o
|
Indicate by check mark whether the registrant is a shell company (as defined in Rule 12b-2 of the Act). Yes
o
No
þ
Approximately 98 percent of the outstanding shares are held by non-affiliates. The aggregate market value of these shares was approximately $344 million based on the market price of $7.38 per share on September 30, 2012, the last day of our most recently completed second fiscal quarter. Shares of common stock held by each executive officer and director and by each person known to beneficially own more than 5 percent of the outstanding common stock have been excluded in that such persons may be deemed to be affiliates. The determination of affiliate status is not necessarily a conclusive determination for other purposes.
The number of shares outstanding of the registrant's common stock, $0.625 par value, was 47,216,322 at May 23, 2013.
An Exhibit Index appears at pages 78-81 herein.
DOCUMENTS INCORPORATED BY REFERENCE
Portions of the following documents are incorporated by reference into the parts of this Form 10-K designated to the right of the document listed.
| Incorporated Document | Location in Form 10-K | |
|
Proxy Statement for the 2013 Annual
|
Part III of Form 10-K
|
|
|
Meeting of Shareholders
|
(Items 10, 11, 12, 13, 14)
|
MODINE MANUFACTURING COMPANY
(This page intentionally left blank.)
Modine Manufacturing Company (“Modine” or “the Company”) specializes in thermal management systems and components, bringing heating and cooling technology and solutions to diversified global markets. We are a leading global developer, manufacturer and marketer of heat exchangers and systems for use in on-highway and off-highway original equipment manufacturer (“OEM”) vehicular applications, and to a wide array of building, industrial and refrigeration markets. Product lines include radiators and radiator cores, condensers, oil coolers, charge air coolers, heat-transfer packages and modules, building heating, ventilating and air conditioning (“HVAC”) equipment and exhaust gas recirculation (“EGR”) coolers. Our primary customers across the globe are:
- Truck, automobile, bus, and specialty vehicle OEMs;
- Agricultural, industrial and construction equipment OEMs;
- Heating and cooling OEMs;
- Construction contractors; and
- Wholesalers of plumbing and heating equipment.
We focus our development efforts on solutions that meet the pressing heat transfer needs of OEMs and other customers within the commercial vehicle, construction, agricultural, industrial and commercial HVAC industries. Our products and systems typically are aimed at solving complex heat transfer challenges requiring effective thermal management. Typical customer and market demands include products and systems that are lighter weight, more compact, more efficient and more durable to meet ever increasing customer standards as they work to ensure compliance with increasingly stringent global emissions, fuel economy and energy efficiency requirements. Our Company’s heritage provides a depth and breadth of expertise in thermal management, which, when combined with our global manufacturing presence, standardized processes, and state-of-the-art technical centers and wind tunnels, enables us to rapidly bring customized solutions to customers at the best value.
History
Modine was incorporated under the laws of the State of Wisconsin on June 23, 1916 by its founder, Arthur B. Modine. Mr. Modine’s “Turbotube” radiators became standard equipment on the famous Ford Motor Company Model T. When he died at the age of 95, A.B. Modine had been granted a total of 120 U.S. patents for heat transfer innovations. The standard of innovation exemplified by A.B. Modine remains the cornerstone of Modine today.
Terms; Year References
When we use the terms “Modine,” “we,” “us,” the “Company,” or “our” in this report, unless the context otherwise requires, we are referring to Modine Manufacturing Company. Our fiscal year ends on March 31 and, accordingly, all references to a particular year mean the fiscal year ended March 31 of that year, unless indicated otherwise.
Business Strategy and Results
Modine focuses on thermal management leadership and highly engineered product and service innovations for diversified, global markets and customers. We are committed to enhancing our presence around the world and serving our customers where they are located. We create value by focusing on customer partnerships and providing innovative solutions for our customers' thermal problems.
Modine’s strategy for improved profitability is grounded in diversifying our markets and customer base, differentiating our products and services, technically and commercially, and partnering with customers to deliver the right products in the right markets. Modine’s top five customers are in three different markets – automotive, truck and off-highway – and our ten largest customers accounted for 59 percent of the Company’s fiscal 2013 sales, compared to 61 percent in fiscal 2012. In fiscal 2013, 61 percent of total sales were generated from customers outside of the U.S., 54 percent of which were generated by Modine’s foreign operations and 7 percent of which were generated by exports from the U.S. In fiscal 2012, 64 percent of total sales were generated from customers outside of the U.S., with 58 percent generated by foreign operations and 6 percent generated by exports from the U.S.
During fiscal 2013, the Company reported total sales of $1.38 billion, a 13 percent decrease from $1.58 billion in fiscal 2012.
Sales were negatively affected by weak end market demand as the global economy slowed over the past fiscal year. This decline was seen across most of Modine’s end markets, including, in particular, the commercial vehicle and off-highway markets.
Gross profit declined $48.0 million from $256.6 million in fiscal 2012 to $208.6 million in fiscal 2013, primarily as a result of lower sales volume. As sales volume and gross profit declined, the Company proactively managed its selling, general and administrative (“SG&A”) expenses, resulting in a $20.3 million decrease from fiscal 2012 to fiscal 2013. Over the last several years, the Company has implemented a number of cost and operational efficiency measures designed to improve our longer-term competitiveness, including the realignment of our manufacturing facilities, portfolio rationalization, capital allocation and SG&A cost containment. These measures have positioned the Company to better absorb any future volume declines caused by the overall global economy.
During fiscal 2013, the Company also initiated its Europe restructuring program, which is designed to align the cost structure of the segment with our strategic focus on the commercial vehicle, off-highway and engine product markets, while improving gross margin and return on average capital employed (“ROACE”). The Company recorded $25.9 million of asset impairment charges and $17.0 million of restructuring expenses, primarily related to the Europe restructuring program, in fiscal 2013. The Company reported an operating loss of $0.6 million in fiscal 2013, compared to operating income of $67.5 million in fiscal 2012.
The lower sales volume and costs associated with the Europe restructuring program were the primary factors causing the loss from continuing operations of $22.8 million or $0.52 per fully diluted share during fiscal 2013. These results compare to earnings from continuing operations of $38.0 million or $0.80 per fully diluted share during fiscal 2012.
The Company measures its performance based on a ROACE metric. ROACE is defined as operating income, less impairment charges, restructuring expenses, a 30 percent income tax rate, and minority interest; divided by the average of debt plus Modine shareholders’ equity. The Company has established a goal of achieving ROACE of 11 to 12 percent in the next few years with a longer term goal of 15 percent. ROACE is not a measure derived under generally accepted accounting principles (“GAAP”) and should not be considered as a substitute for any measure derived in accordance with GAAP. Management believes that ROACE provides investors with helpful information about the Company’s performance, its ability to provide an acceptable return on capital, and its ability to fund future growth. This measure may be inconsistent with similar measures presented by other companies. The following schedule provides a reconciliation of ROACE to the most directly comparable financial measures calculated and presented in accordance with GAAP:
|
Fiscal 2013
|
Fiscal 2012
|
|||||||
|
Operating (loss) income
|
$ | (0.6 | ) | $ | 67.5 | |||
|
Impairment charges
|
25.9 | 2.5 | ||||||
|
Restructuring expenses
|
17.0 | - | ||||||
|
Subtotal
|
42.3 | 70.0 | ||||||
|
Tax applied at 30% rate
|
(12.7 | ) | (21.0 | ) | ||||
|
Minority interest
|
(1.4 | ) | (0.3 | ) | ||||
|
Operating income - adjusted
|
$ | 28.2 | $ | 48.7 | ||||
|
Divided by:
Average capital (debt + Modine shareholders' equity for the last two year-ends / divided by 2)
|
$ | 459.3 | $ | 494.6 | ||||
|
ROACE
|
6.1 | % | 9.8 | % | ||||
ROACE declined from 9.8 percent in fiscal 2012 to 6.1 percent in fiscal 2013. This decline was primarily due to lower gross profit on lower sales volume as a result of relatively weak economic conditions during fiscal 2013.
Products
The Company offers a broad line of products that are categorized as a percentage of net sales as follows:
|
Fiscal 2013
|
Fiscal 2012
|
|||||||
|
Modules/Packages*
|
26 | % | 26 | % | ||||
|
Oil Coolers
|
14 | % | 16 | % | ||||
|
Charge-Air Coolers
|
12 | % | 11 | % | ||||
|
Building HVAC
|
11 | % | 10 | % | ||||
|
Radiators
|
10 | % | 12 | % | ||||
|
Exhaust Gas Recirculation ("EGR") Coolers
|
10 | % | 10 | % | ||||
|
Condensers
|
9 | % | 6 | % | ||||
|
Miscellaneous
|
8 | % | 9 | % | ||||
*Typically include components such as radiators, oil coolers, charge air coolers, condensers and other purchased components.
Competitive Position
We compete with many manufacturers of heat transfer and HVAC products, some of which are divisions of larger companies. The markets for the Company's products are increasingly competitive and have changed significantly in the past few years. The Company's traditional OEM customers in the U.S. and Europe are faced with dramatically increased international competition and have expanded their worldwide sourcing of parts to compete more effectively with lower cost imports and have expanded their global footprint to compete in local markets. Some of these market changes have caused the Company to experience competition from suppliers in other parts of the world that enjoy economic advantages such as lower labor costs, lower healthcare costs, and lower tax rates. As a result, the Company has expanded its own geographic footprint, in part to allow us to more flexibly serve our original equipment customers across the globe. Our customers also continue to ask the Company, as well as their other primary suppliers, to participate in research and development (“R&D”), design, and validation responsibilities. This combined work effort often results in stronger customer relationships and more partnership opportunities for the Company.
Business Segments
The Company has assigned specific businesses to a segment based principally on defined markets and geographic locations. Each operating segment is managed by a vice president or managing director and has separate financial results reviewed by the Company’s chief operating decision makers. These results are used by management in evaluating the performance of each business segment and in making decisions on the allocation of resources among our various businesses. Financial information related to the Company’s operating segments is included in Note 21 of the Notes to Consolidated Financial Statements.
North America, Europe, South America and Asia Segments
The continued globalization of the Company's OEM customer base has led to the necessity of viewing Modine’s strategic approach, product offerings and competitors on a global basis. This trend offers significant opportunities for Modine with its market positioning, including presence in key global markets (U.S., Europe, Brazil, China, India, South Korea and Mexico) and a global product-based organization with expertise to solve technical challenges. Modine is recognized as having strong technical support, product breadth and the ability to support global standard designs for its customers.
The Company's main competitors, AKG (Autokühler Gmbh & Co. KG), Behr GmbH & Co. K.G., Dana Corporation, Dayco Ensa SA (Borg Warner), Visteon Corporation, Denso Corporation, Delphi Corporation, T.Rad Co. Ltd., Honeywell Thermal Div., Valeo SA and TitanX, have a multi-regional or worldwide presence. Increasingly, the Company faces heightened competition as these competitors expand their product offerings and manufacturing footprints through expansion into low cost countries and low cost country sourcing initiatives. In addition, competitors from some of the low cost regions are expanding their presence in OEM markets in their home countries and abroad.
The North America, Europe, South America and Asia segments represent the Company’s original equipment segments and serve the following markets:
Commercial Vehicle
Products
– Powertrain cooling (engine cooling modules, radiators, charge-air-coolers, condensers, oil coolers, fan shrouds, and surge tanks); on-engine cooling (EGR coolers, engine oil coolers, fuel coolers, charge-air-coolers and intake air coolers); oil coolers (transmission and retarder oil coolers and power steering coolers); and fuel coolers
Customers
– Commercial, medium- and heavy-duty truck and engine manufacturers; bus and specialty vehicle manufacturers
Market Overview
– In fiscal 2013, the commercial vehicle market proved disappointing. During the first half of fiscal 2013, North America experienced a drop in heavy-truck order backlog. Recent order activity has provided more optimism with consistent, yet tepid gains. In addition, recent U.S. housing market improvements should spur both heavy- and medium-duty truck demands going forward. In Europe truck makers reduced demand due to the Eurozone economic uncertainty.
Other trends influencing the market include the continued consolidation of major customers into global entities that emphasize the development of global vehicle platforms in order to leverage and reduce development costs and distribution methods. In the U.S. and Canada, truck quality improvements coupled with lower economic expectations have muted the robust truck demand experienced in the mid-2000’s. Fundamental trucking productivity changes (reduced length of haul, lighter freight, better routing, and fewer empty trucks) is also causing a structural downshift in new truck demand.
OEMs expect greater supplier support at lower prices and seek high technology/low cost solutions for their thermal management needs. In general, this drives a deflationary price environment.
Fuel economy and emissions regulations are driving the advancement of product development worldwide and creating demand for incremental thermal transfer products, such as those relating to waste heat recovery.
Primary Competitors
– Behr GmbH & Co. K.G.; TitanX, T.Rad Co. Ltd.; Honeywell Thermal Div.; Dayco Ensa SA
Off-Highway
Products
– Powertrain cooling (engine cooling modules, radiators, condensers, charge-air-coolers, fuel coolers, oil coolers); auxiliary coolers (power steering coolers and transmission oil coolers); and on-engine cooling (EGR coolers, engine oil coolers, fuel coolers, charge-air-coolers and intake air coolers)
Customers
– Construction and agricultural equipment, engine manufacturers and industrial manufacturers of material handling equipment, generator sets and compressors
Market Overview
– The agricultural market is currently at relatively high levels and facing structural changes in crop prices, especially corn. Mining equipment markets remain lower due to reduced commodity demand, especially coal, global economic uncertainty and a subdued China economic recovery. Construction markets showed modest improvement in fiscal 2013. However, fiscal 2013 demand was muted due to challenging global economic conditions which caused high inventory levels at the dealers of our OEM customers.
Overall market trends include a migration toward global machine platforms, driving the multi-region assembly of a common design platform with low cost country sourcing for certain components. Additionally, fixed emissions regulations and timelines are driving the advancement of product development, including the current adoption of Tier IV emissions requirements in the mature region construction markets. OEMs are continuing their expansion into Asia and prefer global suppliers with local production capabilities. Modine is recognized as having strong technical support, product breadth, and the ability to support global standard designs of its customers.
Primary Competitors
– Adams Thermal Systems Inc.; AKG; Delphi Corporation; Denso Corporation; Honeywell Inc.; Zhejiang Yinlun Machinery Co., Ltd.; ThermaSys Corp.; Doowon; Valeo SA; Donghwan; TRad Co. Ltd.; and RAAL.
Automotive
Products
– Powertrain cooling (engine cooling modules, radiators, condensers, charge-air-coolers, auxiliary cooling (power steering coolers and transmission oil coolers), component assemblies, radiators for special applications), on-engine cooling (EGR coolers, engine oil coolers, fuel coolers, charge-air-coolers and intake air coolers); and battery cooling (layered core battery chillers)
Customers
– Automobile, light truck and engine manufacturers
Market Overview
– Modine supports the automotive marketplace with components where complementary Modine technology can be applied to an automotive environment at reasonable returns. Modine has continued the process of deemphasizing our focus on automotive modules due to the cost and risk of large capital outlays to maintain a scale cost position, the inherent over-capacity in this market segment, and the anticipation of better returns in other markets.
Primary Competitors
– Behr GmbH & Co. K.G.; Dana Corporation; Delphi Corporation; Denso Corporation; Visteon Corporation, Showa, and Dayco Ensa SA.
Commercial Products
Products
– Unit heaters (gas-fired, hydronic, electric and oil-fired); duct furnaces (indoor and outdoor); infrared units (high intensity and low intensity); hydronic products (commercial fin-tube radiation, cabinet unit heaters, and convectors); roof mounted direct- and indirect-fired makeup air units; commercial packaged rooftop ventilation units; unit ventilators; single packaged vertical units; geothermal and water-source heat pumps; precision air conditioning units for data center applications; chillers; ceiling cassettes; condensing units
Customers
– Mechanical contractors; HVAC wholesalers; installers; and end users in a variety of commercial and industrial applications, including banking and finance, data center management, education, hospitality, telecommunications, entertainment arenas, pharmaceuticals, hospitals, warehousing, manufacturing, and food and beverage processing
Market Overview
– Commercial Products has strong sales in gas unit heaters, data center air conditioning products, and room heating and cooling units. Efficiency legislation, indoor air quality, lower noise requirements, growth in data centers, and higher energy costs are driving opportunities in these market areas.
Primary Competitors
– Lennox International Inc. (ADP); ABB (Reznor); Mestek Inc. (Sterling); Emerson Electric Company (Liebert); Stulz; Schneider Electric (APC / Uniflair); United Technologies Corporation (Carrier); Johnson Controls, Inc. (York); Daikin (McQuay International); and Bard Manufacturing
Geographical Areas
We maintain administrative organizations in four regions - North America, Europe, South America and Asia - to facilitate customer support, development and testing, and other administrative functions. We operate in the following countries:
|
North America
|
Europe
|
South America
|
Asia/Pacific
|
Africa
|
||||
|
Canada
|
Austria
|
Brazil
|
China
|
South Africa
|
||||
|
Mexico
|
Germany
|
India
|
||||||
|
United States
|
Hungary
|
Japan
|
||||||
|
Italy
|
South Korea
|
|||||||
|
The Netherlands
|
||||||||
|
Russia
|
||||||||
|
United Kingdom
|
Our non-U.S. subsidiaries and affiliates manufacture and sell a number of vehicular and industrial products similar to those produced in the U.S. In addition to normal business risks, operations outside the U.S. are subject to other risks such as changing political, economic and social environments, changing governmental laws, taxes and regulations, foreign currency volatility, and market fluctuations.
Exports
The Company exports product from North America to foreign countries and also receives royalties from foreign licensees. Export sales from the U.S. as a percentage of net sales were 7 percent for fiscal 2013, 6 percent for fiscal 2012 and 5 percent for fiscal 2011. Royalties from foreign licenses were $1.0 million, $1.2 million and $1.6 million for fiscal 2013, 2012 and 2011, respectively.
Modine believes its international presence has positioned the Company to share profitably in the anticipated long-term growth of the global vehicular, commercial and industrial markets. Modine is committed to increasing its involvement and investment in international markets in the years ahead.
Foreign and Domestic Operations
Financial information relating to the Company's foreign and domestic operations is included in Note 21 of the Notes to Consolidated Financial Statements.
Customer Dependence
The Company’s ten largest customers accounted for 59 percent of the Company's sales in fiscal 2013. These customers, listed alphabetically, were: BMW; Caterpillar Inc.; Daimler AG; Deere & Company; Denso Corporation; Ford Motor Co.; Navistar; PACCAR; Volkswagen AG and Volvo Group. In fiscal 2013, Daimler AG was the only customer that accounted for ten percent or more of total Company sales. In fiscal 2012, no one customer accounted for ten percent or more of total Company sales, while in fiscal 2011 BMW was the only customer that accounted for ten percent or more of total Company sales. Generally, products are supplied to these customers on the basis of individual purchase orders received from them. When it is in the customer's and the Company's best interests, the Company utilizes long-term sales agreements with customers to minimize investment risks and to provide the customer with a proven source of competitively priced products. These contracts are, on average, three years in duration and may include built-in pricing adjustments.
Backlog of Orders
The Company's operating units maintain their own inventories and production schedules. We believe that our current production capacity is capable of handling the sales volume expected in fiscal 2014.
Raw Materials
Aluminum, nickel and steel are purchased from several domestic and foreign producers. In general, the Company does not rely on any one supplier for these materials which are, for the most part, available from numerous sources in quantities required by the Company. The supply of copper and brass material is highly concentrated between two global suppliers. The Company normally does not experience material shortages and believes that our suppliers’ production of these metals will be adequate throughout the next fiscal year. Metals pricing with the Company’s raw material and major fabricated component suppliers are typically adjusted on a quarterly basis. When possible, Modine has made material pass-through arrangements with its key customers, which allows the Company to pass material cost increases and decreases to its customers. However, where these pass-through arrangements are utilized, there can be a time lag between the time of the material increase or decrease and the time of price adjustment. This time lag can range from three months to one year.
Patents
The Company owns outright or has a number of licenses to produce products under patents. These patents and licenses have been obtained over a period of years and expire at various times. Because the Company has many product lines, it believes that its business as a whole is not materially dependent upon any particular patent or license, or any particular group of patents or licenses. Modine considers each of its patents, trademarks and licenses to be of value and aggressively defends its rights throughout the world against infringement. Modine has been granted and/or acquired more than 2,000 patents worldwide over the life of the Company.
Research and Development
The Company remains committed to its vision of creating value through technology. We focus our R&D efforts on solutions that meet the most current and pressing heat transfer needs, as well as the anticipated future heat transfer needs, of OEMs and other customers within the commercial vehicle, automotive, construction, agricultural, industrial and commercial HVAC industries and, more selectively, within the automotive industry. Our products and systems typically are aimed at solving difficult and complex heat transfer challenges requiring advanced thermal management. Typical market demands are for products and systems that are lighter weight, more compact, more efficient and more durable to meet ever increasing customer standards as customers work to ensure compliance with increasingly stringent global emissions and energy efficiency requirements. Our Company’s heritage includes depth and breadth of expertise in thermal management that, combined with our global manufacturing presence, standardized processes, and state-of-the-art technical centers and wind tunnels, enables us to rapidly bring customized solutions to customers at the best value.
R&D expenditures were $68.4 million, $70.2 million and $67.0 million in fiscal 2013, 2012 and 2011, respectively. Over the last three years, R&D expenditures have been between 4 and 5 percent of sales. This level of investment reflects our continued commitment to R&D in an ever-changing market. To achieve efficiencies and lower development costs, Modine’s R&D groups work closely with our customers on special projects and system designs. Recent R&D projects have included development of waste heat recovery systems for major U.S.-based engine and truck manufacturers in conjunction with the U.S. Department of Energy to help these manufacturers meet ever increasing demands for emissions reduction, while simultaneously improving powertrain efficiency and, thus, fuel economy; next generation aluminum radiators for the commercial vehicle, agricultural and constructions markets; and EGR technology, which enables our customers to efficiently meet tighter regulatory emissions standards. Our current R&D activities are focused primarily on company-sponsored development in the areas of powertrain cooling, engine products and commercial HVAC products. The Company is also involved with several industry-, university- and government-sponsored research organizations that conduct research and provide data on technical topics which are of interest to the Company for practical applications in the markets we serve. The research developed as a result is generally shared among the member organizations. In addition, we are participating in several U.S. government-funded projects, including dual purpose programs in which the Company retains commercial intellectual property rights in technology it develops for the government, such as the design and demonstration of waste heat recovery systems and research and testing directed at the enhancement of EGR cooler performance. Government reimbursements totaled approximately $2 million in fiscal 2013.
Through our proactive R&D, we are developing new technologies designed to keep our customers within federal and international guidelines and regulations well into the future. We continue to identify, evaluate and engage in external research projects that complement strategic internal research initiatives in order to further leverage the Company’s significant thermal technology expertise and capability.
Quality Improvement
Through Modine’s global Quality Management System (“QMS”), the manufacturing facilities in our North America, Europe, South America and Asia segments are registered to ISO 9001:2008 or ISO/TS 16949:2009 standards, helping to ensure that our customers receive high quality products and services from every Modine facility. While customer expectations for performance, quality and service have risen continuously over the past years, our QMS has allowed Modine to drive improvements in quality performance and enabled the ongoing delivery of products and services that meet or exceed customer expectations.
The global QMS operates in the context of the Modine Operating System (“MOS”), which focuses on leadership behaviors and rapid continuous improvement. Sustainable and systematic continuous improvement is driven throughout all functional areas and operating regions of the organization by the principles, processes and behaviors that are core to these systems.
Environmental, Health and Safety Matters
Modine is committed to preventing pollution, eliminating waste and reducing environmental risks. The Company’s facilities maintain Environmental Management System (“EMS”) certification to the international ISO14001 standard through independent third-party audits. All Modine locations have established specific environmental improvement targets and objectives for the coming fiscal year.
In fiscal 2013, Modine’s carbon emissions resulting from its on-site use of natural gas and propane, and from its use of electricity generated by off-site sources, were relatively flat compared to the prior year. We will continue to identify and implement carbon reduction opportunities when feasible over the coming fiscal year.
Modine’s generation of air emissions, hazardous wastes, and solid wastes decreased 3.6 percent in fiscal 2013. Water consumption decreased significantly, with reductions in all business segments accounting for a 21 percent global reduction, equivalent to saving greater than 28 million gallons of water. This past year’s result is a continuation of a sustained effort over the past five years which has realized a 32 percent decrease in the Company’s water use. As in previous years, Modine continues to systematically identify opportunities and implement measures to reduce waste and conserve natural resources within the structure of its EMS.
Modine's commitment to environmental stewardship is reflected in its reporting of chemical releases as monitored by the United States Environmental Protection Agency's Toxic Chemical Release Inventory program. The Company's U.S. locations decreased their reported chemical releases by 98 percent over the 10-year period 2001 to 2011. This long-term improvement is the result of Modine’s transition to more environmentally friendly manufacturing technologies and raw materials.
Modine’s product portfolio reflects its sense of environmental responsibility. The Company continues its development and refinement of environmentally friendly product lines including oil, fuel, and EGR coolers for diesel applications, light weight and high performance powertrain cooling heat exchangers, and its Advanced Cooling System technology introduced in fiscal 2013. These products provide increased fuel economies and enable combustion technologies that reduce harmful gas emissions. Modine’s Commercial Products segment offerings, including the Airedale Schoolmate geo-thermal heat pump, the Effinity93, the most efficient gas-fired unit heater in North America, and the Atherion
TM
Commercial Packaged Ventilation System, are helping commercial, industrial and residential users achieve high energy efficiencies and reduce utility costs. Modine’s acquisition in fiscal 2013 of Geofinity Manufacturing Company further strengthens our product line with innovative geothermal heat pump technologies providing energy savings and reduced carbon emissions in both the heating and cooling seasons.
An obligation for remedial activities may arise at our facilities due to past practices or as a result of a property purchase or sale. These expenditures most often relate to sites where past operations followed practices that were considered acceptable under then-existing regulations, but now require investigative and/or remedial work to ensure appropriate environmental protection or where the Company is a successor to the obligations of prior owners and current laws and regulations require investigative and/or remedial work to ensure sufficient environmental compliance. Three of the Company's currently owned manufacturing facilities and one formerly owned property have been identified as requiring soil and/or groundwater remediation. Environmental liabilities for investigative work and remediation at sites in the United States, Brazil, and The Netherlands totaled approximately $5 million at March 31, 2013.
Modine recorded a fiscal 2013 global Recordable Incident Rate (“RIR”) of 1.75, representing an 11 percent year over year increase. Although this result did not meet Modine’s global objective for the fiscal year, Modine’s long-term safety performance as indicated by RIR improved 24 percent over the past five years, with 43 percent fewer injuries in fiscal 2013 when compared to fiscal 2008. Modine has consistently out-performed the private-industry RIR average which, by comparison, was 3.50 in 2011.
Modine continues its global introduction and implementation of a behavior-based safety program first introduced in fiscal 2012. The program is a proactive effort which not only seeks to correct at-risk behaviors, but also to positively reinforce safe behaviors. Modine’s behavior-based safety program is a long-term commitment to improve Modine’s safety culture. It complements numerous preexisting safety policies and practices, and is expected to be a significant factor in driving continuous improvement in this area.
Employees
The Company employed approximately 6,500 persons as of March 31, 2013.
Seasonal Nature of Business
The Company’s overall operating performance generally is not subject to a significant degree of seasonality as sales to OEM customers are dependent upon market demand for new vehicles. Our Commercial Products segment does experience a degree of seasonality since the demand for HVAC products can be affected by heating and cooling seasons, weather patterns, construction, and other factors. Generally, sales volume within the Commercial Products segment is stronger in our second and third fiscal quarters, corresponding with demand for heating products.
Working Capital Items
The Company manufactures products in the original equipment markets on an as-ordered basis, which makes large inventories of such products unnecessary. In the Commercial Products segment, the Company maintains varying levels of finished goods inventory due to seasonal demand and certain sales programs. In these areas, the Company makes use of extended payment terms, not to exceed 90 days, for customers on a limited basis. The Company does not experience a significant amount of returned products within any of its operating segments.
Available Information
We make available free of charge through our website, www.modine.com (Investor Relations link), our annual reports on Form 10-K, quarterly reports on Form 10-Q, current reports on Form 8-K, proxy statements, other Securities Exchange Act reports and all amendments to those reports as soon as reasonably practicable after such material is electronically filed with, or furnished to, the Securities and Exchange Commission (“SEC”). Our reports are also available free of charge on the SEC’s website, www.sec.gov. Also available free of charge on our website are the following corporate governance documents:
|
-
|
Code of Ethics and Business Conduct, which is applicable to all Modine employees, including the principal executive officer, the principal financial officer, the principal accounting officer and directors;
|
|
-
|
Corporate Governance Guidelines;
|
|
-
|
Audit Committee Charter;
|
|
-
|
Officer Nomination and Compensation Committee Charter;
|
|
-
|
Corporate Governance and Nominating Committee Charter; and
|
|
-
|
Technology Committee Charter.
|
All of the reports and corporate governance documents referred to above and other materials relating to corporate governance may also be obtained without charge by contacting Corporate Secretary, Modine Manufacturing Company, 1500 DeKoven Avenue, Racine, Wisconsin 53403-2552. We do not intend to incorporate our internet website and the information contained therein or incorporated therein into this annual report on Form 10-K.
|
ITEM 1A
.
|
Our business involves risks. The following information about these risks should be considered carefully together with the other information contained in this report. The risks described below are not the only risks we face. Additional risks not currently known or deemed immaterial as of the date of this report may also adversely impact our business results.
|
A.
|
OPERATIONAL RISKS
|
Complexities of Global Presence
We are subject to risks related to our international operations.
We operate on five continents, in 16 countries. In fiscal 2013, 54 percent of our sales were from non-U.S. operations. Numerous risks and uncertainties affect our international operations. These risks and uncertainties include political and economic instability, compliance with existing and future laws, regulations and policies, including those related to investments, taxation, trade, employment, anti-corruption and repatriation of earnings. Compliance with multiple and potentially conflicting laws and regulations of various countries is burdensome and expensive.
Challenges of Product Launches
We are in the midst of launching a significant number of new programs at our facilities across the world and the success of these launches is critical to our business.
We design technologically advanced products, and the processes required to produce these products can be difficult and complex. The Company commits significant time and financial resources to ensure the successful launch of new products and programs. Managing the product launch process is highly difficult because we are launching many new products and programs in each segment of the Company. Due to this launch activity, we need to appropriately deploy our operational and administrative resources to take advantage of this increase in our business. If we do not successfully launch the products and programs, we may lose market share and damage relationships with our customers, which could negatively affect our business. In addition, any failure in our manufacturing strategy for these new products or programs could result in long-lived asset impairment charges.
Environmental, Health and Safety Regulations
We could be adversely impacted by the costs of environmental, health and safety regulations.
Our operations are subject to various federal, state, local and foreign laws and regulations governing, among other things, emissions to air, discharge to waters and the generation, handling, storage, transportation, treatment and disposal of waste and other materials. The operation of our manufacturing facilities entails risks in these areas, however, and there can be no assurance that we will not incur material costs or liabilities relating to such matters. Our financial responsibility to clean up contaminated property may extend to previously owned or used property, properties owned by unrelated companies, as well as properties that we currently own and use, regardless of whether the contamination is attributable to prior owners. In addition, potentially significant expenditures could be required in order to comply with evolving environmental, health and safety laws, regulations or other pertinent requirements that may be adopted or imposed in the future.
We are currently working with environmental consultants to remediate groundwater contamination at our facility in Brazil that has, over a period of years, migrated to neighboring properties, and subsurface contamination at our former manufacturing facility in The Netherlands. Remediation of these contaminations could result in potentially significant expenditures. See Note 18 of the Notes to Consolidated Financial Statements for further discussion.
Restructuring
We may be unable to complete and successfully implement our European restructuring plans.
We are implementing a restructuring program within our Europe segment. Successful implementation of these initiatives is critical to our future competitiveness and our ability to improve our profitability within that segment and across Modine as a whole.
Reliance Upon Technology Advantage
If we cannot differentiate ourselves from our competitors with our technology, our products may become commodities and our sales and earnings may be adversely affected.
Price, quality, delivery, technological innovation and application engineering development are the primary elements of competition in our markets. If we fail to keep pace with technological changes or to provide high quality products and services, we may experience price erosion, lower revenues and lower margins. If we cannot differentiate ourselves from our competitors with our technology or cannot keep pace with technological changes, our products may become commodities, which could result in price erosion, lower sales and lower margins.
Developments or assertions by or against the Company relating to intellectual property rights could adversely affect our business.
The Company owns significant intellectual property, including a large number of patents, trademarks, copyrights and trade secrets, and is involved in numerous licensing arrangements. The Company’s intellectual property plays an important role in maintaining our competitive position in a number of the markets we serve. Developments or assertions by or against the Company relating to intellectual property rights could adversely affect the business. Significant technological developments by others also could adversely affect our business and results of operations.
We may incur material losses and costs as a result of product liability and warranty claims and litigation.
We are exposed to warranty and product liability claims in the event that our products fail to perform as expected, and we may be required to participate in a recall or other field campaign of such products. Many of our OEM customers have extended warranty protection fortheir vehicles, putting pressure on the supply base to extend warranty coverage as well. Historically, we have experienced relatively low warranty charges from our customers due to our contractual arrangements and the quality, reliability and durability of our products. If our customers demand higher warranty-related cost recoveries, or if our products fail to perform as expected, it could have a material adverse impact on our results of operations and/or financial condition. We are also involved in various legal proceedings from time to time incidental to our business. If any such proceeding has a negative result, it could adversely affect our business and/or results of operations.
Information Technology Systems
We may be adversely affected by any disruption in our information technology systems.
Our operations are dependent upon our information technology systems, which encompass all of our major business functions. A substantial disruption in our information technology systems for a prolonged time period could result in delays in receiving inventory and supplies or filling customer orders and adversely affect our customer service and relationships. Our systems might be damaged or interrupted by natural or man-made events (caused by us, by our service providers or others) or by computer viruses, physical or electronic break-ins and similar disruptions affecting the internet. Such delays, problems or costs could have a material effect on our business, financial condition and results of operations.
Internal Control over Financial Reporting
Inherent limitations of internal controls impacting financial statements.
Our internal control over financial reporting and our operating internal controls may not prevent or detect misstatements because of inherent limitations, including the possibility of human error, the circumvention or overriding of controls, or fraud. Effective internal controls can provide only reasonable assurance with respect to financial statement accuracy.
|
B.
|
MARKET RISKS
|
Customer and Supplier Matters
Our OEM business, which accounts for approximately 85 percent of our business currently, is dependent upon the health of the customers and markets we serve.
We are highly susceptible to downward trends in the markets we serve because our customers’ sales and production levels are affected by general economic conditions, including access to credit, the price of fuel, employment levels and trends, interest rates, labor relations issues, regulatory requirements, trade agreements and other factors as well as by customer specific issues. Any significant decline in production levels for current and future customers could result in long-lived asset impairment charges and would reduce our sales and adversely impact our results of operations and financial condition.
If we were to lose business with a major OEM customer, our revenue and profitability could be adversely affected.
Deterioration of a business relationship with a major OEM customer could cause the Company’s revenue and profitability to suffer. We principally compete for new business both at the beginning of the development of new models and upon the redesign of models by our major customers. New model development generally begins two to five years prior to the marketing of such models to the public. The failure to obtain new business on new models or to retain or increase business on redesigned existing models could adversely affect our business and financial results. In addition, as a result of the relatively long lead times required for many of our complex components, it may be difficult in the short-term for us to obtain new sales to replace any unexpected decline in the sales of existing products. We may incur significant expense in preparing to meet anticipated customer requirements that may not be recovered. The loss of a major OEM customer, the loss of business with respect to one or more of the vehicle models that use our products, or a significant decline in the production levels of such vehicles could have an adverse effect on our business, results of operations and financial condition.
Our OEM customers continually seek price reductions from us. These price reductions adversely affect our results of operations and financial condition.
A challenge that we and other suppliers to vehicular OEMs face is continued price reduction pressure from our customers. Downward pricing pressure has been a characteristic of the automotive industry and is migrating to all of our vehicular OEM markets. Virtually all such OEMs impose aggressive price reduction initiatives upon their suppliers, and we expect such actions to continue in the future. In the face of lower prices to customers, the Company must reduce its operating costs in order to maintain profitability. The Company has taken and continues to take steps to reduce its operating costs to offset customer price reductions; however, price reductions are adversely affecting our profit margins and are expected to do so in the future. If the Company is unable to offset customer price reductions through improved operating efficiencies, new manufacturing processes, sourcing alternatives, technology enhancements and other cost reduction initiatives, or if we are unable to avoid price reductions from our customers, our results of operations and financial condition could be adversely affected.
Fluctuations in costs of materials (including steel, copper, aluminum, nickel, other raw materials and energy) put significant pressure on our results of operations.
The rising cost of materials has a significant effect on our results of operations, and on those of others in our industry. We have sought to alleviate the impact of increasing costs by including material pass-through provisions in our contracts with our customers. Under these arrangements, the Company can pass material cost increases and decreases to its customers. However, where these pass-through arrangements are utilized, there can be a time lag between the time of the material increase or decrease and the time of the pass-through. This time lag can range between three months and one year. To further mitigate the Company’s exposure to fluctuating material prices, we have entered into forward contracts from time to time to hedge a portion of our forecasted aluminum and copper purchases. However, the hedges may only partially offset increases in material costs, and significant increases could have an adverse effect on our results of operations.
The continual pressure to absorb costs adversely affects our profitability.
We continue to be pressured to absorb costs related to product design, engineering and tooling, as well as other items previously paid for directly by OEMs. OEM customers request that we pay for design, engineering and tooling costs that are incurred prior to the start of production and recover these costs through amortization in the piece price of the applicable component. Some of these costs cannot be capitalized, which adversely affects our profitability until the programs for which they have been incurred are launched. If a given program is not launched or is launched with significantly lower volumes than planned, we may not be able to recover the design, engineering and tooling costs from our customers, further adversely affecting our profitability.
The Company could be adversely affected if we experience shortages of components or materials from our suppliers.
In an effort to manage and reduce the cost of purchased goods and services, the Company, like many suppliers and customers, has been consolidating its supply base. As a result, the Company is dependent upon limited sources of supply for certain components used in the manufacture of our products. The Company selects its suppliers based on total value (including price, delivery and quality), taking into consideration their production capacities, financial condition and ability to meet demand. In some cases, it can take several months or longer to find a supplier due to qualification requirements. However, there can be no assurance that strong demand, capacity limitations or other problems experienced by the Company’s suppliers will not result in occasional shortages or delays in their supply of product to us. If we were to experience a significant or prolonged shortage of critical components or materials from any of our suppliers and could not procure the components or materials from other sources, the Company would be unable to meet its production schedules for some of its key products and would miss product delivery dates, which would adversely affect our sales, margins and customer relations.
Exposure to Foreign Currencies
As a global company, we are subject to currency fluctuations, and any significant movement between the U.S. dollar and the euro and Brazilian real, in particular, could have an adverse effect on our profitability.
Although our financial results are reported in U.S. dollars, a significant portion of our sales and operating costs are realized in euros, the Brazilian real and other currencies. Our profitability is affected by movements of the U.S. dollar against the euro, the real and other currencies in which we generate revenues and incur expenses. To the extent that we are unable to match revenues received in foreign currencies with costs paid in the same currency, exchange rate fluctuations in any such currency could have an adverse effect on our financial results. During times of a strengthening U.S. dollar, our reported sales and earnings from our international operations will be reduced because the applicable local currency will be translated into fewer U.S. dollars. Significant long-term fluctuations in relative currency values, in particular a significant change in the relative values of the U.S. dollar, euro or real, could have an adverse effect on our profitability and financial condition.
|
C.
|
FINANCIAL RISKS
|
Liquidity and Access to Cash
Recent market trends and regulatory requirements may require additional funding for our pension plans.
The Company has several defined benefit pension plans that cover most of its domestic employees hired on or before December 31, 2003. The funding policy for these plans is to contribute annually, at a minimum, the amount necessary on an actuarial basis to provide for benefits in accordance with applicable laws and regulations. The domestic plans have an unfunded balance of $84 million. During fiscal 2014, we anticipate making a funding contribution of approximately $8 million related to these domestic plans. If significant additional funding contributions are necessary, this could have an adverse impact on our liquidity position.
|
ITEM 1B
.
|
None.
|
ITEM 2
.
|
We operate manufacturing facilities in the United States and certain foreign countries. The Company's world headquarters, including general offices, and laboratory, experimental and tooling facilities are maintained in Racine, Wisconsin. Additional technical support functions are located in Bonlanden, Germany, Sao Paulo, Brazil, Leeds, United Kingdom and Changzhou, China.
The following table sets forth information regarding our principal properties as of March 31, 2013. Properties with less than 20,000 square feet of building space have been omitted from this table.
|
Location of Facility
|
Building Space and Primary Use
|
Owned or
Leased
|
|
North America Segment
|
||
|
Lawrenceburg, TN
|
353,800 sq. ft./manufacturing
|
143,800 Owned;
|
|
210,000 Leased
|
||
|
Nuevo Laredo, Mexico
|
288,500 sq. ft./manufacturing
|
Owned
|
|
Harrodsburg, KY
|
253,000 sq. ft./manufacturing
|
Owned
|
|
Jefferson City, MO
|
220,000 sq. ft./manufacturing
|
162,000 Owned;
|
|
58,000 Leased
|
||
|
Washington, IA
|
165,400 sq. ft./manufacturing
|
148,800 Owned;
|
|
16,600 Leased
|
||
|
McHenry, IL
|
164,700 sq. ft./manufacturing
|
Owned
|
|
Trenton, MO
|
159,900 sq. ft./manufacturing
|
Owned
|
|
Logansport, IN
|
141,600 sq. ft./manufacturing
|
Owned
|
|
Joplin, MO
|
139,500 sq. ft./manufacturing
|
Owned
|
|
Laredo, TX
|
45,000 sq. ft./warehouse
|
Leased
|
|
Europe Segment
|
||
|
Bonlanden, Germany
|
262,200 sq. ft./administrative & technology center
|
Owned
|
|
Kottingbrunn, Austria
|
220,600 sq. ft./manufacturing
|
Owned
|
|
Pontevico, Italy
|
150,700 sq. ft./manufacturing
|
Owned
|
|
Mezökövesd, Hungary
|
146,500 sq. ft./manufacturing
|
Owned
|
|
Pliezhausen, Germany
|
125,900 sq. ft./manufacturing
|
48,400 Owned;
|
| 77,500 Leased | ||
|
Wackersdorf, Germany
|
109,800 sq. ft./assembly
|
Owned
|
|
Kirchentellinsfurt, Germany
|
107,600 sq. ft./manufacturing
|
Owned
|
|
Uden, Netherlands
|
93,300 sq. ft./manufacturing
|
61,900 Owned;
|
| 31,400 Leased | ||
|
Neuenkirchen, Germany
|
76,400 sq. ft./manufacturing
|
Owned
|
|
Gyöngyös, Hungary
|
58,300 sq. ft./ manufacturing
|
Leased
|
|
South America Segment
|
||
|
Sao Paulo, Brazil
|
342,900 sq. ft./manufacturing
|
Owned
|
|
Asia Segment
|
||
|
Chennai, India
|
118,100 sq. ft./manufacturing
|
Owned
|
|
Changzhou, China
|
107,600 sq. ft./manufacturing
|
Owned
|
|
Shanghai, China
|
80,298 sq. ft./manufacturing
|
Leased
|
|
Cheonam, South Korea
|
46,284 sq. ft./manufacturing (Joint Venture)
|
Leased
|
|
Commercial Products Segment
|
||
|
Leeds, United Kingdom
|
269,100 sq. ft./administrative & manufacturing
|
Leased
|
|
Buena Vista, VA
|
197,000 sq. ft./manufacturing
|
Owned
|
|
Lexington, VA
|
104,000 sq. ft./warehouse
|
Owned
|
|
West Kingston, RI
|
92,800 sq. ft./manufacturing
|
Owned
|
|
Corporate Headquarters
|
||
|
Racine, WI
|
458,000 sq. ft./headquarters & technology center
|
Owned
|
We consider our plants and equipment to be well maintained and suitable for their purposes. We review our manufacturing capacity periodically and make the determination as to our need to expand or, conversely, rationalize our facilities as necessary to meet changing market conditions and the Company needs.
|
ITEM 3
.
|
The information required hereunder is incorporated by reference from Note 18 of the Notes to Consolidated Financial Statements.
|
ITEM 4
.
|
Not applicable.
The following sets forth the name, age, recent business experience and certain other information relative to each executive officer of the Company.
|
Name
|
Age as of
March 31,
2013
|
Position
|
||
|
Scott L. Bowser
|
48
|
Regional Vice President – Asia (July 2012 – Present); Regional Vice President – Americas (March 2009 – July 2012); Managing Director – Modine Brazil (April 2006 – March 2009); General Sales Manager – Truck Division (January 2002 – March 2006); Plant Manager at the Company’s Pemberville, OH plant (1998 – 2001). Prior to joining Modine, Mr. Bowser held positions at The Pierce Company.
|
||
|
Thomas A. Burke
|
55
|
President and Chief Executive Officer (April 2008 – Present); Executive Vice President and Chief Operating Officer (July 2006 – March 2008); and Executive Vice President (May 2005 – July 2006). Prior to joining Modine in May 2005, Mr. Burke held positions at Visteon Corporation and Ford Motor Company.
|
||
|
Margaret C. Kelsey
|
48
|
Vice President, General Counsel and Secretary (November 2008 – Present); Vice President Corporate Strategy and Business Development (May 2008 – October 2008); Vice President - Finance, Corporate Treasury and Business Development (January 2007 – April 2008); Corporate Treasurer & Assistant Secretary (January 2006 – December 2006); Senior Counsel & Assistant Secretary (April 2002 - December 2005); Senior Counsel (April 2001 – March 2002). Prior to joining the Company in 2001, Ms. Kelsey was a partner with the law firm of Quarles & Brady LLP.
|
||
|
Michael B. Lucareli
|
44
|
Vice President, Finance and Chief Financial Officer (October 2011 – present); Vice President, Finance, Chief Financial Officer and Treasurer (July 2010 – October 2011); Vice President, Finance and Corporate Treasurer (May 2008 – July 2010); Managing Director Financial Operations (November 2006 – May 2008); Director, Financial Operations and Analysis (May 2004 – October 2006); Director, Business Development and Strategic Planning (November 2002 – May 2004); and Business Development and Investor Relations Manager (1999 – October 2002). Prior to joining Modine, Mr. Lucareli held positions at Associated Bank, Alpha Investment Group and SEI Corporation.
|
||
|
Thomas F. Marry
|
52
|
Executive Vice President and Chief Operating Officer (February 2012 – Present); Executive Vice President – Europe, Asia and Commercial Products Group (May 2011 – February 2012); Regional Vice President – Asia and Commercial Products Group (November 2007 – May 2011); Managing Director – Powertrain Cooling Products (October 2006 - October 2007); General Manager – Truck Division (2003 – 2006); Director – Engine Products Group (2001 – 2003); Manager – Sales, Marketing and Product Development (1999 – 2001); Marketing Manager (1998 – 1999). Prior to joining Modine, Mr. Marry held positions at General Motors, Robert Bosch and Milwaukee Electric Tool.
|
||
|
Holger Schwab
|
45
|
Regional Vice President – Europe (July 2012 – Present). Prior to joining Modine, Mr. Schwab held various leadership positions at Valeo in North America and Europe and at Thermal Werke.
|
||
|
Scott D. Wollenberg
|
44
|
Regional Vice President – North America (July 2012 – Present); Chief Technology Officer (July 2011 – May 2013); Vice President – Global Research and Engineering (May 2010 – June 2011). In addition, from 1992 through 2010, Mr. Wollenberg held various engineering and product management positions at the Company. Prior to joining the Company in 1992, Mr. Wollenberg was in the co-operative engineering program at Harrison Radiator, a division of General Motors.
|
Executive Officer positions are designated in Modine's Bylaws and the persons holding these positions are elected annually by the Board generally at its first meeting after the annual meeting of shareholders in July of each year. In addition, the Officer Nomination and Compensation Committee of the Board may recommend and the Board of Directors approve promotions and other actions with regard to executive officers at any time during the fiscal year.
There are no family relationships among the executive officers and directors. All of the executive officers of Modine have been employed by Modine in various capacities during the last five years with the exception of Mr. Schwab, who joined Modine in July 2012.
There are no arrangements or understandings between any of the executive officers and any other person pursuant to which he or she was elected an officer of Modine.
The Company's common stock is listed on the New York Stock Exchange. The Company's trading symbol is MOD. The table below shows the range of high and low closing sales prices for the Company's common stock for fiscal 2013 and 2012. As of March 31, 2013, shareholders of record numbered 2,910.
|
2013
|
2012
|
|||||||||||||||
|
Quarter
|
High
|
Low
|
High
|
Low
|
||||||||||||
|
First
|
$ | 9.10 | $ | 5.50 | $ | 17.94 | $ | 13.90 | ||||||||
|
Second
|
8.23 | 5.80 | 16.02 | 8.85 | ||||||||||||
|
Third
|
8.31 | 6.14 | 11.65 | 8.09 | ||||||||||||
|
Fourth
|
9.63 | 8.02 | 11.36 | 8.25 | ||||||||||||
The Company did not pay dividends in fiscal 2013 or 2012. The Company is permitted under its debt agreements to pay dividends on its common stock subject to an aggregate amount based on the calculation of debt covenants, as further described under “Liquidity and Capital Resources” under Item 7 Management’s Discussion and Analysis of Financial Condition and Results of Operations. The Company currently does not intend to pay dividends in fiscal 2014.
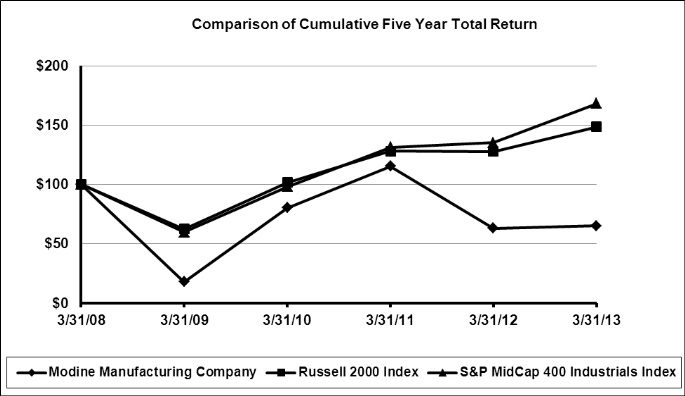
PERFORMANCE GRAPH
The following graph compares the cumulative five-year total return on the Company’s common stock with similar returns on the Russell 2000 Index and the Standard & Poor’s (S&P) MidCap 400 Industrials Index. The graph assumes a $100 investment and reinvestment of dividends.
|
March 31,
|
Initial Investment
|
Indexed Returns
|
||||||||||||||||||||||
|
2008
|
2009
|
2010
|
2011
|
2012
|
2013
|
|||||||||||||||||||
|
Company / Index
|
||||||||||||||||||||||||
|
Modine Manufacturing Company
|
$ | 100 | $ | 17.87 | $ | 80.33 | $ | 115.35 | $ | 63.10 | $ | 65.03 | ||||||||||||
|
Russell 2000 Index
|
100 | 62.50 | 101.72 | 127.96 | 127.73 | 148.55 | ||||||||||||||||||
|
S&P MidCap 400 Industrials Index
|
100 | 59.59 | 98.00 | 131.44 | 135.08 | 168.15 | ||||||||||||||||||
|
ITEM 6
.
|
The following data should be read in conjunction with the consolidated financial statements and accompanying notes included elsewhere in this report.
|
(in millions, except per share amounts)
|
Fiscal Year ended March 31
|
|||||||||||||||||||
|
2013
|
2012
|
2011
|
2010
|
2009
|
||||||||||||||||
|
Net sales
|
$ | 1,376.0 | $ | 1,577.2 | $ | 1,448.2 | $ | 1,162.6 | $ | 1,406.9 | ||||||||||
|
(Loss) earnings from continuing operations
|
(22.8 | ) | 38.0 | 8.3 | (22.8 | ) | (107.3 | ) | ||||||||||||
|
Total assets
|
818.8 | 893.5 | 917.7 | 841.6 | 852.8 | |||||||||||||||
|
Long-term debt - excluding current portion
|
132.5 | 141.9 | 138.6 | 136.0 | 244.0 | |||||||||||||||
|
Dividends per share
|
- | - | - | - | 0.30 | |||||||||||||||
|
(Loss) earnings per share from continuing
operations - basic:
|
(0.52 | ) | 0.81 | 0.18 | (0.58 | ) | (3.35 | ) | ||||||||||||
|
(Loss) earnings per share from continuing
operations - diluted:
|
(0.52 | ) | 0.80 | 0.18 | (0.58 | ) | (3.35 | ) | ||||||||||||
The following factors impact the comparability of the selected financial data presented above:
|
·
|
During fiscal 2013, 2012, 2011, 2010 and 2009, the Company recorded long-lived asset impairment charges of $25.9 million, $2.5 million, $3.5 million, $6.5 million and $26.8 million, respectively. Refer to Note 5 of the Notes to Consolidated Financial Statements for additional discussion.
|
|
·
|
During fiscal 2013, 2010 and 2009, the Company incurred $17.0 million, $6.0 million and $39.5 million, respectively, of restructuring and other repositioning costs. Refer to Note 5 of the Notes to Consolidated Financial Statements for additional discussion.
|
|
·
|
During fiscal 2011, the Company recognized total costs of $19.9 million for the early extinguishment of debt and the write-off of unamortized debt issuance costs. During fiscal 2010, the Company recognized a prepayment penalty of $3.5 million related to a partial pay down of debt.
|
|
·
|
During fiscal 2009, the Company recorded impairment charges of $9.0 million related to goodwill in the Europe segment and $7.6 million related to an equity investment.
|
|
·
|
Selected financial data has been presented on a continuing operations basis, and excludes the discontinued operating results of the South Korean HVAC business, which the Company sold during fiscal 2010, and the Electronics Cooling business, which the Company sold during fiscal 2009.
|
Overview and Strategic Plan
Founded in 1916, Modine Manufacturing Company is a worldwide leader in thermal management systems and components, bringing heating and cooling technology and solutions to diversified global markets. We operate on five continents, in 16 countries, and with approximately 6,500 employees worldwide.
Our products are in light-, medium- and heavy-duty vehicles, commercial heating, ventilation and air conditioning (“HVAC”) equipment, refrigeration systems and off-highway and industrial equipment. Our broad product offerings include heat transfer modules and packages, radiators, oil coolers, charge air coolers, condensers, building HVAC equipment, and EGR coolers.
Company Strategy
Our goal is to grow profitably as a leading global provider of thermal management technology to a broad range of on-highway, off-highway, industrial and building HVAC end markets. We expect to achieve this goal over the long-term through both organic growth and selective acquisitions. We focus on:
|
●
|
Development of new products and technologies for diverse geographic and end markets;
|
|
●
|
A rigorous strategic planning and corporate development process; and
|
|
●
|
Operational and financial discipline to ensure improved profitability and long-term stability.
|
Development of New Products and Technology
Our ability to develop new products and technologies for current and potential customers and for new and emerging markets is one of our competitive strengths. We own two global, state-of-the-art technology centers, dedicated to the development and testing of products and technologies. The centers are located in Racine, Wisconsin and Bonlanden, Germany. Our reputation for providing high quality products and technologies has been a Company strength valued by customers, and has led to a history with relatively few product warranty issues. In fiscal 2013, we spent $68 million (representing 41 percent of SG&A expenses) on product and technology research and development efforts.
We continue to benefit from relationships with customers that recognize the value of having us participate directly in product design, development and validation. This has resulted, and should continue to result, in strong, long-term customer relationships with companies that value partnerships with their suppliers. In the past several years, our product lines have experienced customer pricing pressure attributable to increased global competition, primarily from Asia and other low cost regions. At the same time, many of our products containing improved technology have helped us better manage demands from customers for lower prices. Many of our technologies are proprietary, difficult to replicate and patent protected. We have been granted and/or acquired more than 2,000 patents on our technologies over the life of the Company, and we work diligently to protect our intellectual property.
Strategic Planning and Corporate Development
We employ both short-term (one year) and longer-term (five-to-seven year) strategic planning processes, enabling us to continually assess our opportunities, competitive threats, and economic market challenges.
We focus on strengthening our competitive position through strategic, global business development activities. We continuously look for and take advantage of opportunities to advance our position as a global leader, by expanding our geographic footprint and by expanding into new end markets and product areas – all with a focus on thermal management technologies. This process allows us to identify product and market gaps, develop new products and make additional investments to fill those gaps. A recent example of this process is our acquisition of Geofinity Manufacturing Company (“Geofinity”), which provides Modine with a product line of innovative geothermal heat pumps in both water-to-water and water-to-air models, within our Commercial Products segment.
Operational and Financial Discipline
We operate in an increasingly competitive global marketplace; therefore, we manage our business with a disciplined focus on increasing productivity and reducing waste. The competitiveness of the global marketplace requires us to move toward a greater manufacturing scale in order to create a more competitive cost base. As costs for materials and purchased parts rise from time to time due to global increases in commodity markets, we seek low-cost country sourcing, when appropriate, and enter into contracts with some of our customers that provide for these rising costs to be passed through to them on a lag basis.
We follow a rigorous financial process for investment and returns, intended to enable increased profitability and cash flows over the long-term. Particular emphasis is given to working capital improvement and prioritization of capital for investment and disposals.
Our executive management incentive compensation (annual cash incentive) plan for fiscal 2013 was based on ROACE, driving our singular focus on alignment of management interests with shareholders’ interests in our capital allocation and asset management decisions. In addition, we provide a long-term incentive compensation plan for officers and certain key employees
to attract, retain and motivate key employees who directly impact the long-term performance of the Company. The plan initiated in fiscal 2013 is comprised of stock options, restricted stock awards and performance stock awards. The performance stock awards are based on three year average ROACE, cumulative revenue and Europe ROACE at the end of fiscal 2015.
Consolidated Market Conditions and Trends
During fiscal 2013, total Company net sales were $1,376 million, a 13 percent decrease from $1,577 million in fiscal 2012. Sales were negatively impacted by weak demand in each of our end markets, along with the planned wind-down of certain non-strategic automotive module programs.
The OEM marketplace is extremely competitive and our customers demand that we continue to provide high quality products as well as frequent price decreases. From time to time, we also experience volatility in foreign currency exchange rates and in the costs of our purchased parts and raw materials – particularly aluminum, copper, steel, and stainless steel (nickel). The combination of these factors impacts our profitability.
Our Response to Recent Market Conditions
In response to the challenging business and market conditions facing us in Europe, we initiated our Europe restructuring program in fiscal 2013 with the following objectives:
|
·
|
Manufacturing realignment.
We are focused on exiting certain products based on our global product strategy, transferring product lines and reducing headcount, with the goal of reducing manufacturing costs and improving gross margin.
|
|
·
|
SG&A expense reduction.
Our Europe segment is committed to controlling their overall SG&A expenses and has implemented headcount reductions at the segment headquarters. Through this process we are targeting annual expense savings of $7 million to $9 million over the next couple of years.
|
|
·
|
Improve segment earnings and lower assets employed.
During fiscal 2013, our Europe segment decided to exit several facilities. We are currently marketing these facilities for sale.
|
In addition to the actions described above, the Company is also focused on global strategic growth opportunities. During fiscal 2013, the Commercial Products segment acquired
Geofinity, a manufacturer of geothermal heat pumps of both water-to-water and water-to-air models. This acquisition extends Modine’s current geothermal heat pump product range beyond Airedale-branded school applications to a wider market.
Segment Information – Strategy, Market Conditions and Trends
Each of our operating segments is managed by a vice president or managing director and has separate financial results reviewed by our chief operating decision makers. These results are used by management to evaluate the performance of each segment and to make decisions on the allocation of resources.
North America (40 percent of fiscal 2013 revenues)
Our North America segment includes products and technologies that we provide to the on-highway, commercial vehicle and automotive markets, including Class 3-8 trucks, school buses, transit buses, motor homes, motor coaches and light trucks. This segment also serves the off-highway equipment markets, including agricultural, construction and industrial products (e.g. lift trucks, compressors and power generation).
The recent weakness in the commercial vehicle, agriculture and construction markets resulted in a reduction in revenue for our North America segment in fiscal 2013. Despite the revenue shortfall, our restructuring program that we completed in fiscal 2012 and favorable metals pricing allowed for positive operating results. Our manufacturing footprint consolidation and fixed-cost reduction efforts over the past several years continued to provide operating leverage even with lower sales volume. Our North America business will continue to focus on growing in the markets where its products and manufacturing footprint create a competitive advantage.
The overall strategy for the North America segment includes the following:
|
·
|
Reducing lead times to bring new or updated products to market and offering a wider product breadth, while at the same time evolving or rationalizing the existing product lines to meet targeted financial metrics that fit within our overall strategy.
|
|
·
|
Balancing our customer and program portfolio and pursuing new business opportunities that meet our minimum targeted rates of return, thus enabling profitable growth for the Company. This includes a focus on both organic and inorganic growth opportunities.
|
|
·
|
Growing revenue with an adjacent market focus in order to leverage the competitive cost structure and to improve asset utilization.
|
Europe (36 percent of fiscal 2013 revenues)
Our Europe segment is primarily engaged in providing powertrain and engine cooling systems, as well as vehicular climate control components to OEM end markets, including automotive, heavy duty and industrial, commercial vehicle, bus and off-highway. These systems include cooling modules, radiators, charge air coolers, oil cooling products, EGR products, retarder and transmission cooling components and HVAC condensers.
Economic conditions in Europe remain weak with stagnant growth and Euro 6 truck program volumes continue to be low as a result. We maintain our focus on continuous improvement by the deployment of the Modine Operating System, low-cost country sourcing and cost containment. Our goal for the Europe restructuring program is to improve return on assets by implementing actions similar to those that were previously completed during restructuring in the North America segment. In addition, we expect our Europe segment to benefit from various technology initiatives that allow us to distinguish ourselves from competitors in the eyes of our customers. We also anticipate that this segment will continue to gain market share in the commercial vehicle and off-highway segments as we focus on these strategically important markets.
The Europe segment has recently been positively impacted by softening material prices, and has been successful in winning additional program awards, particularly in the commercial vehicle market. These awards have helped to offset the planned wind-down of a large automotive cooling module program. In the future, we expect to continue to see price reduction demands from our customers, along with continuous and ongoing, increased customer service expectations and competition from low-cost country competitors.
After the completion of the Europe restructuring program, we believe this segment will be well positioned for improved long-term financial results with a solid customer reputation for technology, service and program management.
South America
(10 percent of fiscal 2013 revenues)
Our South America segment provides heat exchange products to a variety of markets in the domestic Brazilian market as well as for export to North America and Europe. This segment provides products to the on-highway commercial vehicle markets, off-highway markets, including for use in construction and agricultural applications, automotive OEMs, and industrial application OEMs, primarily for power generation systems. The South America segment also provides products to the Brazilian, North American and European aftermarkets for both automotive and commercial applications. This segment manufactures radiators, charge-air-coolers, oil coolers, auxiliary coolers (transmission, hydraulic and power steering), engine cooling modules and HVAC system modules.
The South America segment experienced a softening in sales after December 2011 due to the pre-buy of commercial vehicles ahead of the January 1, 2012 change in government required emissions standards in Brazil. In recent years, there has been a continuing trend in Brazil with customers moving away from copper-based products and shifting to aluminum. We are transitioning our manufacturing facility to ensure we have the necessary capability to supply our current and future customers as they transition to aluminum-based products. In the future, growth drivers in this segment include expected agricultural land and infrastructure improvements in Brazil as well as the increasing regulatory focus on energy efficiency and environmental emission standards.
Asia (4 percent of fiscal 2013 revenues)
Our Asia segment is primarily engaged in providing powertrain cooling systems and engine products to customers in the commercial vehicle, off-highway and automotive markets. Modine technology, performance, quality and reputation have enabled us to win new engine products business in Asia. Emissions standards in China and India lag behind Europe and North America. As a result, some local on- and off-highway powertrain cooling customers focus on price versus technology. However, in the future, we expect to see a shift in these markets towards higher performing, more durable products, which may provide us additional powertrain cooling opportunities at that time. In addition, many components we supply in the region become part of a module, which increases the amount of our content on an engine.
Our strategy in this segment is to control and reduce costs, secure new business, further diversify our product offering and customer base, and continue to focus on increasing our asset utilization and building manufacturing capabilities in China and India to serve the region in a cost competitive manner. Our manufacturing facility in Chennai, India is currently producing at low volumes. However, we expect continued increases in production levels for fiscal 2014. Our manufacturing facility in Changzhou, China is continuing to ramp up production. In fiscal 2013, we completed the transformation of our light assembly facility in Shanghai, China into an engine products-focused manufacturing facility. We are scheduled to begin production of several new products from these three facilities during fiscal 2014.
Our objectives for this segment are to accelerate growth and achieve profitability. We are well positioned to take on new programs and are looking to increase the utilization of our manufacturing facilities in China and India and increase revenue opportunities at our joint ventures in Korea and Japan.
Commercial Products
(10 percent of fiscal 2013 revenues)
Our Commercial Products segment manufactures and distributes a variety
of HVAC products, primarily for commercial building and related applications in North America, Europe, Asia and South Africa. We sell our heating and cooling products through various channels to consulting engineers, contractors, and building owners for applications such as warehouses, repair garages, greenhouses, residential garages, schools, data centers, manufacturing facilities, banks, pharmaceutical companies, stadiums and retail stores.
Our heating products include gas, electric, oil and hydronic unit heaters, low intensity infrared, and large roof-mounted direct and indirect fired makeup air units. Our cooling products include single packaged vertical units and unit ventilators used in school room applications, precision air conditioning units, air- and water-cooled chillers, ceiling cassettes, and roof top packaged ventilation units used in a variety of commercial building applications. Economic conditions, such as demand for new commercial construction, growth in data centers, and school renovations, as well as higher efficiency requirements are growth drivers for our heating and cooling products.
The Commercial Products segment has higher margins than our other operating segments, and we intend to continue to invest in this business in order to capitalize on its higher returns. In fiscal 2013, we acquired Geofinity, a manufacturer of geothermal heat pumps for both water-to-water and water-to-air models. Geofinity extends Modine’s current geothermal heat pump product range beyond Airedale-branded school applications to a wider market. We have integrated the production of Geofinity products into our West Kingston, RI facility in order to leverage our existing capabilities to serve this growing market, both in the residential and commercial markets.
Outlook
For fiscal 2014, we expect growth in South America and stabilization in the China off-highway market. In addition, we anticipate sequential improvement in the North American commercial vehicle market with the majority of this improvement in the second half of fiscal 2014. In Europe, we expect further declines in the commercial vehicle and automotive markets and slight growth in the off-highway market. We anticipate consolidated year over year sales to be flat to an increase of 5 percent. We expect diluted earnings per share to be in the range of $0.45 to $0.55, excluding the impact of cash and non-cash restructuring costs.
Consolidated Results of Operations - Continuing Operations
Fiscal 2013 sales volume declined 13 percent due to an overall reduction across all of our business segments, primarily due to market weakness. The Company recorded impairment charges of $26 million and restructuring expenses totaling $17 million primarily related to our Europe restructuring program. As we continue our Europe restructuring program, we expect to record additional restructuring expenses in fiscal 2014. In fiscal 2012, sales increased 9 percent as our end markets partially recovered from the economic recession.
The following table presents consolidated financial results on a comparative basis for the years ended March 31, 2013, 2012
and 2011.
|
Years ended March 31
|
2013
|
2012
|
2011
|
|||||||||||||||||||||
|
(dollars in millions)
|
$'s
|
% of sales
|
$'s
|
% of sales
|
$'s
|
% of sales
|
||||||||||||||||||
|
Net sales
|
$ | 1,376 | 100.0 | % | $ | 1,577 | 100.0 | % | $ | 1,448 | 100.0 | % | ||||||||||||
|
Cost of sales
|
1,167 | 84.8 | % | 1,321 | 83.7 | % | 1,216 | 84.0 | % | |||||||||||||||
|
Gross profit
|
209 | 15.2 | % | 257 | 16.3 | % | 232 | 16.0 | % | |||||||||||||||
|
Selling, general and administrative expenses
|
166 | 12.1 | % | 187 | 11.8 | % | 186 | 12.8 | % | |||||||||||||||
|
Impairment charges
|
26 | 1.9 | % | 2 | 0.1 | % | 3 | 0.2 | % | |||||||||||||||
|
Restructuring expenses
|
17 | 1.2 | % | - | - | - | - | |||||||||||||||||
|
Operating (loss) income
|
(1 | ) | 0.0 | % | 68 | 4.3 | % | 43 | 2.9 | % | ||||||||||||||
|
Interest expense
|
(13 | ) | -0.9 | % | (12 | ) | -0.8 | % | (34 | ) | -2.3 | % | ||||||||||||
|
Other income (expense) – net
|
- | - | (7 | ) | -0.5 | % | 4 | 0.3 | % | |||||||||||||||
|
(Loss) earnings from continuing operations
before income taxes
|
(13 | ) | -0.9 | % | 48 | 3.1 | % | 13 | 0.9 | % | ||||||||||||||
|
Provision for income taxes
|
(10 | ) | -0.7 | % | (10 | ) | -0.6 | % | (5 | ) | -0.3 | % | ||||||||||||
|
(Loss) earnings from continuing operations
|
$ | (23 | ) | -1.7 | % | $ | 38 | 2.4 | % | $ | 8 | 0.6 | % | |||||||||||
Year Ended March 31, 2013 Compared to Year Ended March 31, 2012:
Fiscal 2013 net sales of $1,376 million were $201 million, or 13 percent, lower than $1,577 million in fiscal 2012, due to decreased overall sales volume and a $61 million unfavorable impact of foreign currency exchange rate changes. Automotive and commercial vehicle net sales decreased 21 percent and 14 percent, respectively, from fiscal 2012 to fiscal 2013.
Fiscal 2013 gross profit of $209 million decreased $48 million, or 19 percent, from $257 million in fiscal 2012. The gross profit decrease was driven by reduced sales volume and an $8 million unfavorable impact of foreign currency exchange rate changes. Gross margin decreased 110 basis points from 16.3 percent in fiscal 2012 to 15.2 percent in fiscal 2013. The gross margin decline was primarily attributable to lower fixed-cost absorption on the reduced sales volume.
Fiscal 2013 SG&A expenses decreased $21 million to $166 million from $187 million in fiscal 2012 primarily due to lower compensation-related expense and a $7 million favorable impact of foreign currency exchange rate changes. During fiscal 2013 SG&A expenses as a percentage of net sales increased 30 basis points from fiscal 2012 as sales declined at a faster rate than SG&A expenses. SG&A expenses as a percentage of net sales was relatively in line with our stated goal of SG&A cost containment and a long-term target of 11 to 12 percent.
Fiscal 2013 impairment charges of $26 million were recorded primarily to reduce the carrying values of facilities held for sale to their estimated fair value less cost to sell within the Europe and North America segments.
Restructuring expenses of $17 million during fiscal 2013 relate to our Europe restructuring program, primarily due to headcount reductions at the segment headquarters and a manufacturing facility, along with equipment transfer costs.
Fiscal 2013 operating loss of $1 million represents a $69 million decline from operating income of $68 million during fiscal 2012. This decrease was primarily due to lower sales volume, $26 million of impairment charges and $17 million of restructuring expenses during fiscal 2013.
The $7 million improvement in other expense from fiscal 2012 to fiscal 2013 was primarily due to a reduction of foreign currency exchange losses on inter-company loans and other obligations denominated in foreign currencies.
Despite the loss from continuing operations in fiscal 2013, the provision for income taxes remained flat at $10 million for fiscal 2013 and 2012. This was primarily due to the income tax valuation allowances recorded in the U.S., Germany and China.
Year Ended March 31, 2012 Compared to Year Ended March 31, 2011:
Fiscal 2012 net sales of $1,577 million were $129 million, or 9 percent, higher than $1,448 million in fiscal 2011 driven by a 19 percent increase in commercial vehicle sales and a 13 percent increase in off-highway sales, along with a $33 million favorable impact of foreign currency exchange rate changes.
Fiscal 2012 gross profit of $257 million increased $25 million, or 11 percent, from $232 million in fiscal 2011. The gross profit increase was primarily due to improved sales volume and a $5 million favorable impact of foreign currency exchange rate changes. Gross margin improved 30 basis points from 16.0 percent in fiscal 2011 to 16.3 percent in fiscal 2012. The gross margin improvement was primarily attributable to better fixed-cost absorption on improved sales volume.
Fiscal 2012 SG&A expenses were comparable to fiscal 2011, yet decreased 100 basis points to 11.8 percent as a percentage of net sales.
Fiscal 2012 operating income of $68 million improved $25 million from $43 million in fiscal 2011 primarily due to higher gross profit on increased sales volume.
Fiscal 2012 interest expense decreased $22 million from fiscal 2011 primarily due to $20 million of costs related to the debt refinancing completed during the second quarter of fiscal 2011, including $17 million of prepayment penalties and $3 million of write-offs of unamortized financing costs.
Other expense of $7 million for fiscal 2012 represents an $11 million decline from other income of $4 million in fiscal 2011 due to $8 million of foreign currency exchange losses on inter-company loans and other obligations denominated in a foreign currency.
Fiscal 2012 provision for income taxes increased to $10 million from $5 million in fiscal 2011. The increase in the provision for income taxes was primarily due to a $4 million versus $8 million Hungarian development tax incentive credit in fiscal 2012 and fiscal 2011, respectively.
Segment Results of Operations
|
North America
|
||||||||||||||||||||||||
|
Years ended March 31
|
2013
|
2012
|
2011
|
|||||||||||||||||||||
|
(dollars in millions)
|
$'s
|
% of sales
|
$'s
|
% of sales
|
$'s
|
% of sales
|
||||||||||||||||||
|
Net sales
|
$ | 565 | 100.0 | % | $ | 602 | 100.0 | % | $ | 573 | 100.0 | % | ||||||||||||
|
Cost of sales
|
484 | 85.6 | % | 512 | 85.1 | % | 494 | 86.2 | % | |||||||||||||||
|
Gross profit
|
81 | 14.4 | % | 90 | 14.9 | % | 79 | 13.8 | % | |||||||||||||||
|
Selling, general and administrative expenses
|
40 | 7.2 | % | 42 | 6.9 | % | 46 | 8.0 | % | |||||||||||||||
|
Impairment charges
|
2 | 0.3 | % | - | - | 1 | 0.2 | % | ||||||||||||||||
|
Operating income
|
$ | 39 | 6.9 | % | $ | 48 | 8.0 | % | $ | 32 | 5.6 | % | ||||||||||||
North America net sales increased $29 million, or 5 percent, from fiscal 2011 to fiscal 2012, and decreased $37 million, or 6 percent, from fiscal 2012 to fiscal 2013. The fiscal 2012 increase in sales was primarily due to improvement in the North American commercial vehicle market, while the decrease in fiscal 2013 was primarily driven by overall weakness in our end markets and the wind-down of certain automotive and military programs.
Gross margin improved from 13.8 percent in fiscal 2011 to 14.9 percent in fiscal 2012, but declined to 14.4 percent in fiscal 2013. The gross margin improvement from fiscal 2011 to fiscal 2012 was a result of improved operating leverage on higher sales volume and plant performance efficiencies. The gross margin decline from fiscal 2012 to fiscal 2013 was primarily due to lower sales volume, partially offset by lower material costs.
SG&A expenses decreased $4 million from fiscal 2011 to fiscal 2012, and decreased $2 million in fiscal 2013. Fiscal 2012 SG&A expenses were favorably impacted by a $2 million reversal of a trade compliance liability that was no longer required, a reduction in pension costs and lower management compensation expenses. The decrease in SG&A expenses in fiscal 2013 was primarily due to the favorable impact of cost reduction initiatives and lower pension expenses, partially offset by the $2 million reduction of a trade compliance liability in fiscal 2012.
Impairment charges totaling $2 million in fiscal 2013 and $1 million in fiscal 2011 were recorded for idle facilities to reduce the carrying values to their estimated fair value less cost to sell. These charges were each due to weakness in the commercial real estate market.
Fiscal 2012 operating income of $48 million improved $16 million from $32 million in fiscal 2011 primarily due to gross margin improvements from higher sales volume and plant performance efficiencies, along with reduced SG&A expenses. Fiscal 2013 operating income declined $9 million to $39 million primarily due to lower gross profit from lower sales volume.
|
Europe
|
||||||||||||||||||||||||
|
Years ended March 31
|
2013
|
2012
|
2011
|
|||||||||||||||||||||
|
(dollars in millions)
|
$'s
|
% of sales
|
$'s
|
% of sales
|
$'s
|
% of sales
|
||||||||||||||||||
|
Net sales
|
$ | 498 | 100.0 | % | $ | 603 | 100.0 | % | $ | 547 | 100.0 | % | ||||||||||||
|
Cost of sales
|
437 | 87.7 | % | 518 | 85.8 | % | 471 | 86.2 | % | |||||||||||||||
|
Gross profit
|
61 | 12.3 | % | 85 | 14.1 | % | 76 | 13.8 | % | |||||||||||||||
|
Selling, general and administrative expenses
|
36 | 7.2 | % | 46 | 7.6 | % | 46 | 8.4 | % | |||||||||||||||
|
Impairment charges
|
24 | 4.8 | % | 2 | 0.4 | % | 2 | 0.4 | % | |||||||||||||||
|
Restructuring expenses
|
17 | 3.4 | % | - | - | - | - | |||||||||||||||||
|
Operating (loss) income
|
$ | (16 | ) | -3.2 | % | $ | 37 | 6.1 | % | $ | 28 | 5.1 | % | |||||||||||
Europe net sales increased $56 million or 10 percent from fiscal 2011 to fiscal 2012 primarily due to increased sales to the commercial vehicle and off-highway markets along with a $24 million favorable impact of foreign currency exchange rate changes. The $105 million, or 17 percent, decrease in net sales from fiscal 2012 to fiscal 2013 was driven by the planned wind-down of the automotive module business, a slowdown in demand in the commercial vehicle and off-highway markets and a $34 million unfavorable impact of foreign currency exchange rate changes.
Gross margin improved 30 basis points to 14.1 percent from fiscal 2011 to fiscal 2012 primarily due to the leverage impact of higher sales volume, partially offset by program launch inefficiencies and higher material costs. Gross margin declined 180 basis points to 12.3 percent from fiscal 2012 to fiscal 2013. This decrease was primarily due to lower sales volume and costs associated with new program launches, partially offset by lower material costs.
SG&A expenses remained flat from fiscal 2011 to fiscal 2012, but decreased as a percentage of net sales. SG&A expenses decreased $10 million from fiscal 2012 to fiscal 2013, primarily due to a $5 million favorable impact of foreign currency exchange rate changes, lower compensation expenses from headcount reductions as part of the Europe restructuring program and a change in estimated unpaid value added tax (“VAT”) obligations.
As part of our Europe restructuring program, we recorded asset impairment charges totaling $24 million during fiscal 2013, primarily related to several facilities held for sale to reduce the carrying values to their estimated fair value less cost to sell.
We recorded $17 million of restructuring expenses related to our Europe restructuring program during fiscal 2013. These charges were primarily for severance and termination costs related to headcount reductions at our segment headquarters and at a manufacturing facility.
Operating income of $37 million in fiscal 2012 was an improvement of $9 million from fiscal 2011, primarily due to increased sales volume driving higher gross profit. The operating loss of $16 million in fiscal 2013 represents a $53 million decrease from operating income for fiscal 2012, primarily due to $24 million of asset impairment charges, $17 million of restructuring expenses and lower gross profit on lower sales volume.
|
South America
|
||||||||||||||||||||||||
|
Years ended March 31
|
2013
|
2012
|
2011
|
|||||||||||||||||||||
|
(dollars in millions)
|
$'s
|
% of sales
|
$'s
|
% of sales
|
$'s
|
% of sales
|
||||||||||||||||||
|
Net sales
|
$ | 134 | 100.0 | % | $ | 176 | 100.0 | % | $ | 159 | 100.0 | % | ||||||||||||
|
Cost of sales
|
111 | 83.2 | % | 145 | 82.4 | % | 128 | 80.3 | % | |||||||||||||||
|
Gross profit
|
23 | 16.8 | % | 31 | 17.6 | % | 31 | 19.7 | % | |||||||||||||||
|
Selling, general and administrative expenses
|
12 | 8.4 | % | 21 | 11.7 | % | 18 | 11.5 | % | |||||||||||||||
|
Operating income
|
$ | 11 | 8.4 | % | $ | 10 | 5.9 | % | $ | 13 | 8.2 | % | ||||||||||||
South America net sales increased $17 million in fiscal 2012 primarily due to increased sales volume within the commercial vehicle market, as a result of the January 1, 2012 change in emissions standards. In addition, sales were positively impacted by volume increases in the off-highway market and aftermarket business, as well as a $4 million favorable impact of foreign currency exchange rate changes. Net sales decreased $42 million to $134 million in fiscal 2013 primarily due to weakness in the commercial vehicle market following the pre-buy ahead of the January 1, 2012 change in emissions standards and an unfavorable impact of foreign currency exchange rate changes of $25 million.
Gross margin decreased from 19.7 percent in fiscal 2011 to 17.6 percent in fiscal 2012 primarily due to higher commodity costs, additional costs associated with the transition from copper- to aluminum-based products and the negative foreign currency impact on export and aftermarket sales sold in U.S. dollars. Gross margin decreased further in fiscal 2013 to 16.8 percent primarily due to sales volume decreases. Gross profit decreased $8 million from fiscal 2012 to fiscal 2013, which includes a $4 million unfavorable impact of foreign currency exchange rate changes.
Fiscal 2012 SG&A expenses increased $3 million from fiscal 2011 as a result of personnel costs, a $1 million environmental remediation charge and higher freight costs. SG&A expenses decreased $9 million from fiscal 2012 to fiscal 2013, primarily due to the reversal of a $2 million acquisition related liability, lower freight costs and a $2 million favorable impact of foreign currency exchange rate changes.
Operating income decreased $3 million from fiscal 2011 to fiscal 2012 due to lower gross margin and increased SG&A expenses. Operating income was comparable from fiscal 2012 to fiscal 2013 as lower SG&A expenses were partially offset by the reduction in gross profit from lower sales volume.
|
Asia
|
||||||||||||||||||||||||
|
Years ended March 31
|
2013
|
2012
|
2011
|
|||||||||||||||||||||
|
(dollars in millions)
|
$'s
|
% of sales
|
$'s
|
% of sales
|
$'s
|
% of sales
|
||||||||||||||||||
|
Net sales
|
$ | 60 | 100.0 | % | $ | 84 | 100.0 | % | $ | 64 | 100.0 | % | ||||||||||||
|
Cost of sales
|
58 | 97.2 | % | 76 | 90.6 | % | 59 | 91.8 | % | |||||||||||||||
|
Gross profit
|
2 | 2.8 | % | 8 | 9.4 | % | 5 | 8.2 | % | |||||||||||||||
|
Selling, general and administrative expenses
|
11 | 17.6 | % | 10 | 12.3 | % | 8 | 13.0 | % | |||||||||||||||
|
Operating loss
|
$ | (9 | ) | -14.8 | % | $ | (2 | ) | -2.9 | % | $ | (3 | ) | -4.8 | % | |||||||||
Asia net sales increased $20 million from fiscal 2011 to fiscal 2012 primarily due to new program launch activities and the ramp-up of production in this segment. Net sales decreased $24 million to $60 million in fiscal 2013 primarily due to a decrease in automotive module sales as we continue the strategic exit of this business and a decline in the off-highway vehicular market, including lower excavator sales, due to the weakened economic conditions in China.
Fiscal 2012 gross margin improved to 9.4 percent from sales volume increases resulting in better fixed cost absorption. Gross margin declined to 2.8 percent in fiscal 2013 primarily due to lower sales volume and costs associated with converting our Shanghai manufacturing facility to a high volume oil cooler production facility.
SG&A expenses increased $2 million in fiscal 2012 and $1 million in fiscal 2013 as we are investing for growth in this segment.
The operating loss improved slightly to $2 million in fiscal 2012, but increased to $9 million in fiscal 2013. The increase in the segment operating loss during fiscal 2013 was primarily due to lower gross profit on lower sales volume.
|
Commercial Products
|
||||||||||||||||||||||||
|
Years ended March 31
|
2013
|
2012
|
2011
|
|||||||||||||||||||||
|
(dollars in millions)
|
$'s
|
% of sales
|
$'s
|
% of sales
|
$'s
|
% of sales
|
||||||||||||||||||
|
Net sales
|
$ | 139 | 100.0 | % | $ | 142 | 100.0 | % | $ | 126 | 100.0 | % | ||||||||||||
|
Cost of sales
|
98 | 70.7 | % | 100 | 70.1 | % | 87 | 68.9 | % | |||||||||||||||
|
Gross profit
|
41 | 29.3 | % | 42 | 29.9 | % | 39 | 31.1 | % | |||||||||||||||
|
Selling, general and administrative expenses
|
31 | 22.1 | % | 28 | 19.9 | % | 26 | 21.0 | % | |||||||||||||||
|
Operating income
|
$ | 10 | 7.2 | % | $ | 14 | 10.0 | % | $ | 13 | 10.1 | % | ||||||||||||
Commercial Products net sales increased $16 million, or 13 percent, from fiscal 2011 to fiscal 2012, and decreased $3 million, or 2 percent in fiscal 2013. The fiscal 2012 improvement was primarily due to increased sales volume of North America cooling and heating products and a $2 million favorable impact of foreign currency exchange rate changes. The fiscal 2013 decline was primarily due to decreased sales volume in the United Kingdom as a result of weak economic conditions in the first half of fiscal 2013, partially offset by increased sales volume of heating products in the U.S.
Gross margin decreased from 31.1 percent in fiscal 2011 to 29.9 percent in fiscal 2012 and to 29.3 percent in fiscal 2013. The decreases in gross margin were primarily due to unfavorable changes in product mix and, in fiscal 2012, due to higher material costs.
SG&A expenses increased $2 million from fiscal 2011 to $28 million in fiscal 2012 and increased $3 million from fiscal 2012 to fiscal 2013. The increase in fiscal 2012 was the result of planned spending increases for new product development and expanded marketing efforts. The increase in fiscal 2013 includes expenses associated with the acquisition of Geofinity. This acquisition provides Modine with a full line of innovative geothermal heat pumps in both water-to-water and water-to-air models.
Operating income increased slightly from fiscal 2011 to fiscal 2012 primarily due to increased sales volume, partially offset by higher material and SG&A costs. Operating income decreased $4 million from fiscal 2012 to fiscal 2013 primarily due to increased SG&A expenses.
Liquidity and Capital Resources
Our primary sources of liquidity are cash flows from operating activities, our cash and cash equivalents at March 31, 2013 of $24 million and available borrowings of $191 million under lines of credit provided by banks in the United States and abroad. We believe these sources of liquidity will be sufficient to satisfy future operating costs and capital expenditures.
Net Cash Provided by Operating Activities
Net cash provided by operating activities in fiscal 2013 was $49 million, an increase of $3 million from the prior year of $46 million. In fiscal 2013, cash flows from operating activities were negatively impacted by a decline in gross profit, partially offset by lower SG&A expenses, and positively impacted by working capital changes, including trade accounts receivable and accounts payable, during fiscal 2013 as compared to fiscal 2012.
Net cash provided by operating activities in fiscal 2012 of $46 million, increased $25 million from fiscal 2011, driven by the absence of a pre-payment penalty on senior notes in fiscal 2012 and a $6 million reduction in contributions to our U.S. pension plan versus the prior year.
Capital Expenditures
Capital expenditures were $50 million for fiscal 2013, which was $14 million lower than fiscal 2012 and $5 million lower than fiscal 2011. In fiscal 2013, our capital spending primarily occurred in the North America segment, which totaled $19 million, the Europe segment, which totaled $17 million and the Asia segment, which totaled $8 million. Capital projects in fiscal 2013 primarily included tooling and equipment purchases in conjunction with program launches with customers in North America, Europe and Asia.
At March 31, 2013, we had capital expenditure commitments of $12 million. Significant commitments include tooling and equipment expenditures for new and renewal platforms with customers in Europe and North America along with new program launches in Asia.
Dividends
The Company did not pay dividends in fiscal 2013, 2012 or 2011. Our credit agreements allow for an aggregate amount of restricted payments, including cash dividends, based on our leverage ratio being less than 3.0 to 1.0. Based on the leverage ratio for the period ended March 31, 2013, we would be allowed to make restricted payments of up to $35 million. If the leverage ratio remains less than 3.0 to 1.0 for fiscal 2014, we would be allowed to make restricted payments of up to $40 million under our current credit agreements. The maximum amount of restricted payments we would be allowed to make over the remaining term of our current credit agreements is $40 million annually.
Total Debt
Our total debt outstanding decreased less than $1 million to $164 million at March 31, 2013 compared to March 31, 2012. The composition of our outstanding debt changed due to a $10 million decrease in long-term debt, the absence of any outstanding borrowings on our revolving credit facility as of March 31, 2013, and a $9 million increase in short-term debt primarily within Asia to fund future growth initiatives within the segment. Our cash balance of $24 million at March 31, 2013 is $8 million lower than March 31, 2012.
See Note 15 of the Notes to Consolidated Financial Statements for further information regarding our debt agreements.
Our current debt agreements require us to maintain compliance with various covenants. Under our primary debt agreements in the U.S., we are subject to an adjusted earnings before interest, taxes, depreciation and amortization (“EBITDA”) to interest expense (interest expense coverage ratio) covenant and a debt to adjusted EBITDA (leverage ratio) covenant. Adjusted EBITDA is defined as earnings from continuing operations before interest expense and income taxes, adjusted to exclude unusual, non-recurring or extraordinary non-cash charges and up to $40 million of cash restructuring and repositioning charges, not to exceed $20 million in any fiscal year, and further adjusted to add back depreciation and amortization. Adjusted EBITDA is a non-GAAP metric that is not defined by generally accepted accounting principles (“GAAP”) and should not be considered an alternative to earnings from continuing operations. Our calculation of adjusted EBITDA may not be comparable to similarly titled measures reported by other companies.
We are required to maintain the interest expense coverage ratio and leverage ratio covenants based on the following:
|
Interest Expense Coverage
|
Leverage Ratio
|
||
|
Ratio Covenant (Not
|
Covenant (Not Permitted
|
||
|
Permitted to Be Less Than)
|
to Be Greater Than)
|
||
|
Fiscal quarter ending on or before August 12, 2014
|
3.00 to 1.0
|
3.25 to 1.0
|
|
|
All fiscal quarters ending thereafter
|
3.00 to 1.0
|
3.00 to 1.0
|
Our adjusted EBITDA for the four consecutive quarters ended March 31, 2013 was $98 million. The following table presents a calculation of adjusted EBITDA:
(dollars in millions)
|
Quarter Ended June 30, 2012
|
Quarter Ended
September 30, 2012
|
Quarter Ended
December 31, 2012
|
Quarter Ended
March 31, 2013
|
Total
|
||||||||||||||||
|
Loss from continuing operations
|
$ | (1.0 | ) | $ | (11.8 | ) | $ | (8.4 | ) | $ | (1.6 | ) | $ | (22.8 | ) | |||||
|
Net earnings attributable to noncontrolling interest
|
(0.3 | ) | (0.3 | ) | (0.3 | ) | (0.5 | ) | (1.4 | ) | ||||||||||
|
Consolidated interest expense
|
3.0 | 3.4 | 2.8 | 3.4 | 12.6 | |||||||||||||||
|
Provision for income taxes
|
2.0 | 1.8 | 1.5 | 4.5 | 9.8 | |||||||||||||||
|
Depreciation and amortization expense
|
14.1 | 14.1 | 13.6 | 14.0 | 55.8 | |||||||||||||||
|
Non-cash items
|
0.3 | 16.8 | 8.3 | 1.8 | 27.2 | |||||||||||||||
|
Restructuring expenses
|
4.8 | 1.5 | 1.4 | 9.3 | 17.0 | |||||||||||||||
|
Adjusted EBITDA
|
$ | 22.9 | $ | 25.5 | $ | 18.9 | $ | 30.9 | $ | 98.2 | ||||||||||
Our interest expense coverage ratio for the four fiscal quarters ended March 31, 2013 was 7.55, which exceeded the minimum requirement of 3.00. The following table presents a calculation of our interest expense coverage ratio:
|
Four Quarters Ended
March 31, 2013
|
||||
|
Consolidated interest expense
|
$ | 12.6 | ||
|
Plus: Costs to sell receivables
|
0.4 | |||
|
Total consolidated interest expense
|
$ | 13.0 | ||
|
Adjusted EBITDA
|
$ | 98.2 | ||
|
Interest expense coverage ratio
|
7.55 | |||
Our leverage ratio for the four fiscal quarters ended March 31, 2013 was 1.85, which was below the maximum permitted ratio of 3.25. The following table presents a calculation of our leverage ratio:
|
Four Quarters Ended
March 31, 2013
|
||||
|
Debt per balance sheet
|
$ | 163.6 | ||
|
Plus: Derivative financial instruments
|
1.4 | |||
|
Letters of credit as defined by the debt agreement
|
1.4 | |||
|
Indebtedness attributed to sales of receivables
|
15.5 | |||
|
Total debt
|
$ | 181.9 | ||
|
Adjusted EBITDA
|
$ | 98.2 | ||
|
Leverage ratio
|
1.85 | |||
We expect to remain in compliance with our debt covenants during fiscal 2014 and beyond.
Off-Balance Sheet Arrangements
None.
Contractual Obligations
|
(in millions) March 31, 2013
|
||||||||||||||||||||
|
Total
|
Less than 1 year
|
1 - 3 years
|
4 - 5 years
|
More than 5 years
|
||||||||||||||||
|
Long-term debt
|
$ | 126.9 | $ | 0.3 | $ | 1.6 | $ | 24.0 | $ | 101.0 | ||||||||||
|
Interest associated with long-term debt
|
56.0 | 8.6 | 17.1 | 16.1 | 14.2 | |||||||||||||||
|
Capital lease obligations
|
6.1 | 0.2 | 0.6 | 0.6 | 4.7 | |||||||||||||||
|
Operating lease obligations
|
22.3 | 6.5 | 7.5 | 4.0 | 4.3 | |||||||||||||||
|
Capital expenditure commitments
|
11.9 | 7.8 | 4.1 | - | - | |||||||||||||||
|
Other long-term obligations
|
12.7 | 2.4 | 3.1 | 2.3 | 4.9 | |||||||||||||||
|
Total contractual obligations
|
$ | 235.9 | $ | 25.8 | $ | 34.0 | $ | 47.0 | $ | 129.1 | ||||||||||
Our gross liabilities for pensions, postretirement benefits, and uncertain tax positions total $126 million as of March 31, 2013. We are unable to determine the ultimate timing of these liabilities and have therefore excluded these amounts from the contractual obligations table above.
Critical Accounting Policies
The following critical accounting policies reflect the more significant judgments and estimates used in preparing our consolidated financial statements. Application of these policies results in accounting estimates that have the greatest potential for a significant impact on our financial statements. The following discussion of these judgments and estimates is intended to supplement the Significant Accounting Policies presented in Note 1 of the Notes to Consolidated Financial Statements. In addition, recently issued accounting pronouncements that impact our financial statements are included in Note 1 of the Notes to Consolidated Financial Statements.
Revenue Recognition
We recognize revenue, including agreed upon commodity price increases, as products are shipped to customers and the risks and rewards of ownership are transferred to our customers. Revenue is recorded net of applicable provisions for sales rebates, volume incentives, and returns and allowances. At the time of revenue recognition, we also record estimates for bad debt expense and warranty expense. We base these estimates on historical experience, current business trends and current economic conditions. Contractual commodity price increases may also be included in revenue. Price increases agreed upon in advance are recognized as revenue when the products are shipped to our customers. We recognize revenue from various licensing agreements when earned except in those cases where collection is uncertain, or the amount cannot reasonably be estimated until formal accounting reports are received from the licensee.
Impairment of Long-Lived Assets
We perform impairment evaluations of long-lived assets, including property, plant and equipment, intangible assets and equity investments, whenever business conditions or events indicate that those assets may be impaired. We consider factors such as operating losses, declining outlooks and market capitalization when evaluating the necessity for an impairment analysis. When the estimated future undiscounted cash flows to be generated by the assets are less than the carrying value of the long-lived assets, or the decline in value is considered to be “other than temporary”, the assets are written down to fair market value and a charge is recorded to current operations. Fair market value is estimated in various ways depending on the nature of the assets under review. Fair value can be based on appraised value, estimated salvage value, sales price under negotiation or estimated cancellation charges, as applicable.
The most significant long-lived assets that we have evaluated for impairment are property, plant and equipment, which totaled $356 million at March 31, 2013. Within property, plant and equipment, the most significant assets evaluated are buildings and improvements, and machinery and equipment. We evaluate impairment at the lowest level of separately identifiable cash flows, which is generally at the manufacturing plant level. We monitor manufacturing plant financial performance to determine whether indicators exist that would require an impairment evaluation for the facility. This includes significant adverse changes in plant profitability metrics; substantial changes in the mix of customer programs manufactured in the plant; changes in manufacturing strategy; and shifting of programs to other facilities under a manufacturing realignment strategy. When such indicators are present, we perform an impairment evaluation by comparing the estimated future undiscounted cash flows expected to be generated in the manufacturing facility to the net book value of the long-lived assets within that facility. The undiscounted cash flows are estimated based on the expected future cash flows to be generated by the manufacturing facility over its remaining useful life. When the estimated future undiscounted cash flows are less than the net book value of the long-lived assets, such assets are written down to fair value, which is generally estimated based on appraisals or estimated salvage value.
The majority of the long-lived asset impairment charges during fiscal 2013, 2012 and 2011 have been recorded within our Europe and North America segments for facilities held for sale to reduce their carrying value to estimated fair value less costs to sell. The Europe segment initiated a restructuring program in fiscal 2013, including the decision to sell certain assets, which resulted in long-lived asset impairment charges totaling $24 million. Further unanticipated adverse changes in any of our segments could result in the need to perform additional impairment evaluations in the future.
Impairment of Goodwill
We perform goodwill impairment tests annually, as of March 31, unless business events or other conditions exist that require a more frequent evaluation. We consider factors such as operating losses, declining outlooks and market capitalization when evaluating the necessity for an impairment analysis. Goodwill is tested for impairment at a reporting unit level, determined to be at an operating segment level. The first step in this test is to compare the fair value of the reporting unit to its carrying value. We determine the fair value of a reporting unit based on the present value of estimated future cash flows. If the fair value of the reporting unit exceeds the carrying value of the unit’s net assets, goodwill of that reporting unit is not impaired and further testing is not required. If the carrying value of the reporting unit’s net assets exceeds the fair value of the unit, then we perform the second step of the impairment test to determine the implied fair value of the reporting unit’s goodwill and any impairment charge. Determining the fair value of a reporting unit involves judgment and the use of significant estimates and assumptions, which include assumptions regarding the revenue growth rates and operating margins used to calculate estimated future cash flows, risk-adjusted discount rate, business trends and market conditions. The discount rate used in determining discounted cash flows is a rate corresponding to our cost of capital, adjusted for risk where appropriate. To the extent that the carrying value of the unit’s net assets exceeds the fair value, an impairment charge is recognized.
At March 31, 2013, our goodwill totaled $29 million, which was primarily comprised of $12 million in our South America segment and $16 million in our Commercial Products segment. The South America segment had operating income of $11 million and $10 million in fiscal 2013 and 2012, respectively. The Commercial Products segment had operating income of $10 million and $14 million for fiscal 2013 and 2012, respectively. The future discounted cash flows of these segments continue to exceed their carrying value, indicating that the goodwill recorded in these segments is not impaired at March 31, 2013.
Warranty
Estimated costs related to product warranties are accrued at the time of the sale and recorded in cost of sales. Estimated costs are based on the best information available, which includes using statistical and analytical analysis of both historical and current claim data. Original estimates are adjusted when it becomes probable that expected claims will differ significantly from these initial estimates.
Tooling
Costs
Production tooling costs incurred by us in manufacturing products for customer programs are capitalized as a component of property, plant and equipment, net of any customer reimbursements, when we retain title to the tooling. These capitalized costs are depreciated in cost of sales over the estimated life of the asset, which is generally three years. For customer-owned tooling costs incurred, a receivable is recorded when the customer has guaranteed reimbursement to us. Reimbursement typically occurs prior to the start of production, but this varies for some programs and customers. We do not have any significant customer arrangements under which customer-owned tooling costs were not accompanied by guaranteed reimbursements.
Assets Held for Sale
Assets are considered to be held for sale when management approves and commits to a formal plan to actively market the assets for sale at a sales price reasonable in relation to its fair value, the asset is available for immediate sale in its present condition, the sale of the asset is probable and expected to be completed within one year, and it is unlikely that significant changes will be made to the plan. Upon designation as held for sale, the carrying value of the asset is recorded at the lower of its carrying value or estimated fair value, less cost to sell. We cease to record depreciation expense at the time of designation as held for sale. We are currently marketing for sale several held for sale facilities with carrying values totaling $11 million at March 31, 2013.
Pensions and Postretirement Benefits
The calculation of the expense and liabilities of our pension and postretirement plans is dependent upon various assumptions. The most significant assumptions include the discount rate, long-term expected return on plan assets and future trends in healthcare costs. The selection of assumptions is based on historical trends and economic and market conditions at the time of valuation. In accordance with GAAP, actual results that differ from these assumptions are accumulated and amortized over future periods. These differences impact future pension or postretirement benefit expenses. We replaced the existing domestic defined benefit pension plan with a defined contribution plan for salaried-paid employees hired on or after January 1, 2004. We believe the current defined contribution plan for domestic employees will, in general, allow us a greater degree of flexibility in managing retirement benefit costs on a long-term basis. Currently, none of our domestic pension plans include increases in annual earnings or future service in calculating the average annual earnings and years of credited service under the pension plan formula.
For the following discussion regarding sensitivity of assumptions, all amounts presented are in reference to the domestic pension plans since our domestic plans comprise all of the benefit plan assets and the large majority of our pension plan expense.
To determine the expected rate of return on pension plan assets, we consider such factors as (a) the actual return earned on plan assets, (b) historical rates of return on the various asset classes in the plan portfolio, (c) projections of returns on those asset classes, (d) the amount of active management of the assets, (e) capital market conditions and economic forecasts, and (f) administrative expenses paid with the plan assets. The long-term rate of return utilized in fiscal 2013 and 2012 was 8.0 percent. For fiscal 2014, the Company has also assumed a rate of 8.0 percent. The impact of a 25 basis point decrease in the expected rate of return on assets would result in a $0.5 million increase in fiscal 2014 pension expense.
The discount rate reflects rates available on long-term, high quality fixed-income corporate bonds, reset annually on the measurement date of March 31. For fiscal 2013, we used a discount rate of 4.4 percent, compared to 4.9 percent in fiscal 2012. The Company determined these rates based on a yield curve that was created following an analysis of the projected cash flows from the affected plans. See Note 16 of the Notes to Consolidated Financial Statements for additional information. Changing the assumed discount rate by 25 basis points would impact our fiscal 2014 pension expense by $0.1 million.
A key assumption in our postretirement benefit liability and expense is the healthcare cost trend rate. Our assumed healthcare trend rate for fiscal year 2013 was 7.5 percent, and we expect this rate to remain at 7.5 percent for fiscal 2014. This rate is projected to decline gradually to 5.0 percent in fiscal year 2019 and remain at that level thereafter. An annual "cap" that was established for most retiree healthcare and life insurance plans between fiscal 1994 and 1996 limits our postretirement liability. Beginning in February 2002, the Company discontinued providing postretirement benefits for salaried and non-union employees hired on or after that date. Furthermore, effective January 1, 2009, the plan was modified to eliminate coverage for retired participants that are Medicare eligible. A one percent increase in the healthcare trend rate would have an insignificant impact on our postretirement liability and expense.
Other Loss Reserves
We maintain liabilities and reserves for a number of other loss exposures, such as environmental remediation costs, product liability claims, regulatory compliance, litigation, self-insurance reserves, recoverability of deferred income taxes, and uncollectible accounts receivable. Establishing loss reserves for these exposures requires the use of estimates and judgment to determine the risk exposure and ultimate potential liability. The Company estimates these reserve requirements by using consistent and suitable methodologies for the particular type of loss reserve being calculated. See Note 18 of the Notes to Consolidated Financial Statements for additional details regarding contingencies and litigation.
Forward-Looking Statements
This report, including, but not limited to, the discussion under “Outlook” under Item 7. Management’s Discussion and Analysis of Financial Condition and Results of Operations, contains statements, including information about future financial performance, accompanied by phrases such as “believes,” “estimates,” “expects,” “plans,” “anticipates,” “intends,” and other similar “forward-looking” statements, as defined in the Private Securities Litigation Reform Act of 1995. Modine’s actual results, performance or achievements may differ materially from those expressed or implied in these statements, because of certain risks and uncertainties, including, but not limited to, those described under “Risk Factors” in Item 1A. in Part I. of this report. Other risks and uncertainties include, but are not limited to, the following:
|
Operational Risks:
|
|
·
|
Our ability to successfully implement our Europe restructuring plans and drive cost reductions and increased profitability and return on assets as a result;
|
|
·
|
The overall health of our customers in light of broad economic and specific market challenges and the potential impact on us from any deterioration in the stability or performance of any of our customers;
|
|
·
|
The impact of operational inefficiencies as a result of program launches and product transfers;
|
|
·
|
Our ability to maintain current programs and compete effectively for new business, including our ability to offset or otherwise address increasing pricing pressures from competitors and price reduction pressures from customers;
|
|
·
|
Costs and other effects of the remediation of environmental contamination;
|
|
·
|
Our ability to obtain and retain profitable business at facilities in our Asia segment, and in particular, in China;
|
|
·
|
Unanticipated delays or modifications initiated by major customers with respect to product launches, product applications or requirements;
|
|
·
|
Unanticipated product or manufacturing difficulties, including unanticipated launch challenges and warranty claims;
|
|
·
|
Increasingly complex and restrictive laws and regulations in various jurisdictions in which we operate and the costs associated with compliance therewith;
|
|
·
|
Unanticipated problems with suppliers meeting our time, quantity, quality and price demands;
|
|
·
|
Work stoppages or interference at our facilities or those of our major customers and/or suppliers; and
|
|
·
|
Costs and other effects of unanticipated litigation or claims, and the increasing pressures associated with rising healthcare and insurance costs.
|
Market Risks:
|
·
|
Economic, social and political conditions, changes and challenges in the markets where we and our customers operate and compete, including foreign currency exchange rate fluctuations (particularly the value of the euro and Brazilian real relative to the U.S. dollar), tariffs, inflation, changes in interest rates, recession, restrictions associated with importing and exporting and foreign ownership, and, in particular, the continuing slow recovery of certain markets in China and Brazil and the economic uncertainties in the European Union;
|
|
·
|
The impact of increases in commodity prices, particularly our exposure to the changing prices of aluminum, copper, steel and stainless steel (nickel);
|
|
·
|
Our ability or inability to successfully hedge commodity risk and/or pass increasing commodity prices on to customers as well as the inherent lag in timing of such pass-through pricing; and
|
|
·
|
The impact of environmental laws and regulations on our business and the business of our customers, including our ability to take advantage of opportunities to supply alternative new technologies to meet environmental emissions standards.
|
|
Financial Risks:
|
|
·
|
Our ability to fund our liquidity requirements and meet our long-term commitments in the event of any renewed disruption in the credit markets or extended recessionary conditions in the global economy; and
|
|
·
|
Our ability to realize future tax benefits.
|
|
Strategic Risks:
|
|
·
|
Our ability to identify and implement appropriate growth and diversification strategies that position us for long-term success.
|
In addition to the risks set forth above, we are subject to other risks and uncertainties identified in our public filings with the U.S. Securities and Exchange Commission. We do not assume any obligation to update any forward-looking statements.
In the normal course of business, Modine is subject to market exposure from changes in foreign exchange rates, interest rates, commodity prices, credit risk and economic conditions.
Foreign Currency Risk
We are subject to the risk of changes in foreign currency exchange rates due to our operations in foreign countries. We have manufacturing facilities in Brazil, China, India, Mexico, South Africa, and throughout Europe. We also have an equity investment in a Japanese company and a joint venture in South Korea. We sell and distribute products throughout the world. As a result, our financial results are affected by factors such as changes in foreign currency exchange rates or economic conditions in the foreign markets in which we manufacture, distribute and sell products. We attempt to mitigate foreign currency risks on transactions with customers and suppliers in foreign countries by entering into contracts that are denominated in the functional currency of the subsidiary engaging in the transaction. Our financial results are principally exposed to changes in exchange rates between the U.S. dollar and the European currencies, primarily the euro, and changes between the U.S. dollar and the Brazilian real. In fiscal 2013, 2012 and 2011, more than 50 percent of our sales were generated in countries outside the U.S. A change in foreign exchange rates will positively or negatively affect our sales; however, this impact will be offset to a large degree with an offsetting effect on our expenses. In fiscal 2013, changes in foreign currencies negatively impacted our sales by $61 million; however the impact on our fiscal 2013 operating loss was less than $1 million. Foreign exchange risk can be estimated by measuring the impact of a near-term adverse movement of 10 percent in foreign currency exchange rates. If these rates were 10% higher or lower at March 31, 2013, there would not have been a material impact on our fiscal 2013 loss from continuing operations.
We maintain, from time to time, foreign-denominated, long-term debt obligations and long-term inter-company loans that are subject to foreign currency exchange risk. As of March 31, 2013, there were no third-party foreign-denominated, long-term debt obligations or inter-company loans for which changes in foreign currency exchange rates would impact our net earnings. We have, from time to time, entered into currency rate derivatives to manage the fluctuation in foreign exchange rate exposure on these types of loans. These derivative instruments have typically not been treated as hedges, and accordingly, gains or losses on the derivatives are recorded in other income and expense in the consolidated statements of operations and act to offset any currency movement on the outstanding loans receivable or payable.
Interest Rate Risk
Our interest rate risk policies are designed to reduce the potential volatility of earnings that could arise from changes in interest rates. We generally utilize a mixture of debt maturities and both fixed-rate and floating-rate debt to manage exposure to changes in interest rates. Our domestic revolving credit facility is based on a variable interest rate of London Interbank Offered Rate (“LIBOR”) plus 150 to 250 basis points depending upon our leverage ratio. As of March 31, 2013, our variable interest rate was LIBOR plus 200 basis points, or 2.2 percent. We are subject to risk of fluctuations in LIBOR and changes in our leverage ratio, which would affect the variable interest rate on the revolving credit facility and create variability in interest expense. There were no borrowings outstanding under the revolving credit facility as of March 31, 2013. A 100 basis point increase in LIBOR would increase interest expense by $0.1 million based on an assumed revolving credit facility balance of $10 million. Based on our outstanding debt with variable interest rates at March 31, 2013, a 100 basis point increase in interest rates would increase our annual interest expense in fiscal 2014 by less than $1 million.
Commodity Price Risk
We are dependent upon the supply of raw materials and supplies in the production process and have, from time to time, entered into firm purchase commitments for copper, aluminum, nickel, and natural gas. We have utilized aluminum and copper hedging strategies, from time to time, by entering into fixed price contracts to help offset changing commodity prices. The Company maintains agreements with certain customers to pass through certain material price fluctuations in order to mitigate the commodity price risk. The majority of these agreements contain provisions in which the pass-through of the price fluctuations can lag behind the actual fluctuations by a three months or longer.
Credit Risk
Credit risk is the possibility of loss from a customer's failure to make payment according to contract terms. Our principal credit risk consists of outstanding trade accounts receivable. At March 31, 2013, 51 percent of our trade accounts receivables balance was concentrated with our top ten customers. These customers operate primarily in the automotive, truck and heavy equipment markets and are influenced by similar market and general economic factors. In the past, credit losses from our customers have not been significant.
We manage credit risk through a focus on the following:
|
|
·
|
Cash and investments – Cash deposits and short-term investments are reviewed to ensure banks have acceptable credit ratings and that short-term investments are maintained in secured or guaranteed instruments. Our holdings in cash and investments were considered stable and secure at March 31, 2013;
|
|
|
·
|
Trade accounts receivable – Prior to granting credit, we evaluate each customer, taking into consideration the customer's financial condition, payment experience and credit information. After credit is granted, we actively monitor the customer's financial condition and applicable business news;
|
|
|
·
|
Pension assets – We have retained outside advisors to assist in the management of the assets in the defined benefit plans. In making investment decisions, we have been guided by an established risk management protocol that focuses on protection of the plan assets against downside risk. We ensure that investments within these plans provide appropriate diversification, are subject to monitoring by investment teams and ensure that portfolio managers adhere to the established investment policies. We believe the plan assets are subject to appropriate investment policies and controls; and
|
|
|
·
|
Insurance – We monitor our insurance providers to ensure that they have acceptable financial ratings. We have not identified any concerns in this regard based on our reviews.
|
Economic Risk
Economic risk is the possibility of loss resulting from economic instability in certain areas of the world or significant downturns in markets that we operate. We sell a broad range of products that provide thermal solutions to customers operating primarily in the commercial vehicle, heavy equipment, automotive and commercial heating and air conditioning markets. We operate in diversified markets as a strategy for offsetting the risk associated with a downturn in any of the markets we serve. However, risk associated with market downturns, such as the global downturn experienced in fiscal 2009 and fiscal 2010, is still present.
We monitor economic conditions in the U.S., in our foreign markets and elsewhere. As we expand our global presence, we also encounter risks imposed by potential trade restrictions, including tariffs, embargoes and the like. We continue to pursue non-speculative opportunities to mitigate these economic risks, and capitalize, when possible, on changing market conditions.
We pursue new market opportunities after careful consideration of the potential associated risks and benefits. Successes in new markets are dependent upon our ability to commercialize our investments. Current examples of new and emerging markets for Modine include those related to waste heat recovery and expansion into the Chinese and Indian markets. Our investment in these areas is subject to the risks associated with business integration, technological success, customer and market acceptance, and our ability to meet the demands of our customers as these markets grow.
We anticipate that continued recovery from the global recession and economic growth in China may put production pressure on certain suppliers of our raw materials. In particular, there are a limited number of suppliers of copper, steel and aluminum material. We are exposed to the risk of suppliers of certain raw materials not being able to meet customer demand as they may not increase their output capacity as quickly as customers increase their orders and of increased prices being charged by raw material suppliers.
In addition, we purchase parts from suppliers that use Modine tooling to create the part. In most instances, and for financial reasons, we do not have duplicate tooling for the manufacture of the purchased parts. As a result, we are exposed to the risk of a supplier being unable to provide the quantity or quality of parts that we require. Even in situations where suppliers are manufacturing parts without the use of Modine tooling, we face the challenge of obtaining consistently high-quality parts from suppliers. We have implemented a supplier risk management program that utilizes inside and third-party tools to identify and mitigate high risk supplier situations.
In addition to the above risks on the supply side, we are also exposed to risks associated with demands by our customers for decreases in the price of our products. We attempt to offset this risk with firm agreements with our customers whenever possible, but these agreements often contain provisions for future price reductions.
Hedging and Foreign Currency Forward Contracts
We use derivative financial instruments as a tool to manage certain financial risks. Leveraged derivatives are prohibited by company policy.
Commodity Derivatives:
We have entered into futures contracts, from time to time, related to certain forecasted purchases of aluminum and copper. Our strategy in entering into these contracts was to reduce our exposure to changing market prices for future purchases of these commodities. In fiscal 2013, fiscal 2012 and fiscal 2011, expenses related to commodity derivative contracts totaled $5 million, $3 million and zero, respectively. We did not enter into any futures contracts during the second, third or fourth quarter of fiscal 2013.
Foreign currency forward contracts: Our foreign exchange risk management strategy uses derivative financial instruments in a limited way to mitigate foreign currency exchange risk. We periodically enter into foreign currency exchange contracts to hedge specific foreign currency-denominated assets and liabilities. We have not designated these forward contracts as hedges. Accordingly, unrealized gains and losses related to the change in the fair value of the contracts are recorded in other income and expense. Gains and losses on these foreign currency forward contracts are offset by foreign currency gains and losses associated with the related assets and liabilities.
We have a number of investments in foreign subsidiaries and a non-consolidated foreign joint venture. The net assets of these subsidiaries are exposed to currency exchange rate volatility. From time to time, we use financial instruments to hedge, or offset, this exposure.
Counterparty risks:
We manage counterparty risks by ensuring that counterparties to derivative instruments have credit ratings acceptable to us. At March 31, 2013, all counterparties had a sufficient long-term credit rating.
MODINE MANUFACTURING COMPANY
CONSOLIDATED STATEMENTS OF OPERATIONS
For the years ended March 31, 2013, 2012 and 2011
(In millions, except per share amounts)
|
2013
|
2012
|
2011
|
||||||||||
|
Net sales
|
$ | 1,376.0 | $ | 1,577.2 | $ | 1,448.2 | ||||||
|
Cost of sales
|
1,167.4 | 1,320.6 | 1,215.9 | |||||||||
|
Gross profit
|
208.6 | 256.6 | 232.3 | |||||||||
|
Selling, general and administrative expenses
|
166.3 | 186.6 | 185.9 | |||||||||
|
Impairment charges
|
25.9 | 2.5 | 3.5 | |||||||||
|
Restructuring expenses
|
17.0 | - | - | |||||||||
|
Operating (loss) income
|
(0.6 | ) | 67.5 | 42.9 | ||||||||
|
Interest expense
|
(12.6 | ) | (12.5 | ) | (33.7 | ) | ||||||
|
Other income (expense) – net
|
0.2 | (7.1 | ) | 3.6 | ||||||||
|
(Loss) earnings from continuing operations before income taxes
|
(13.0 | ) | 47.9 | 12.8 | ||||||||
|
Provision for income taxes
|
(9.8 | ) | (9.9 | ) | (4.5 | ) | ||||||
|
(Loss) earnings from continuing operations
|
(22.8 | ) | 38.0 | 8.3 | ||||||||
|
Earnings (loss) from discontinued operations, net of income taxes
|
- | 0.8 | (3.1 | ) | ||||||||
|
Net (loss) earnings
|
(22.8 | ) | 38.8 | 5.2 | ||||||||
|
Net earnings attributable to noncontrolling interest
|
(1.4 | ) | (0.3 | ) | - | |||||||
|
Net (loss) earnings attributable to Modine
|
$ | (24.2 | ) | $ | 38.5 | $ | 5.2 | |||||
|
(Loss) earnings per share from continuing operations attributable to Modine shareholders:
|
||||||||||||
|
Basic
|
$ | (0.52 | ) | $ | 0.81 | $ | 0.18 | |||||
|
Diluted
|
$ | (0.52 | ) | $ | 0.80 | $ | 0.18 | |||||
|
Net (loss) earnings per share attributable to Modine shareholders:
|
||||||||||||
|
Basic
|
$ | (0.52 | ) | $ | 0.83 | $ | 0.11 | |||||
|
Diluted
|
$ | (0.52 | ) | $ | 0.82 | $ | 0.11 | |||||
|
Weighted average shares outstanding:
|
||||||||||||
|
Basic
|
46.6 | 46.5 | 46.2 | |||||||||
|
Diluted
|
46.6 | 46.9 | 46.7 | |||||||||
The notes to consolidated financial statements are an integral part of these statements.
MODINE MANUFACTURING COMPANY
CONSOLIDATED STATEMENTS OF COMPREHENSIVE INCOME
For the years ended March 31, 2013, 2012 and 2011
(In millions)
|
2013
|
2012
|
2011
|
||||||||||
|
Net (loss) earnings
|
$ | (22.8 | ) | $ | 38.8 | $ | 5.2 | |||||
|
Other comprehensive (loss) income:
|
||||||||||||
|
Foreign currency translation
|
(17.1 | ) | (22.6 | ) | 16.5 | |||||||
|
Cash flow hedges, net of income taxes of $0, $0.1 million and $1.0
million
|
2.6 | (3.4 | ) | 2.3 | ||||||||
|
Defined benefit plans, net of income taxes of $0, $0 and $2.8 million
|
(23.6 | ) | (41.4 | ) | 8.6 | |||||||
|
Total other comprehensive (loss) income
|
(38.1 | ) | (67.4 | ) | 27.4 | |||||||
|
Comprehensive (loss) income
|
(60.9 | ) | (28.6 | ) | 32.6 | |||||||
|
Comprehensive income attributable to noncontrolling interest
|
(1.4 | ) | (0.3 | ) | - | |||||||
|
Comprehensive (loss) income attributable to Modine
|
$ | (62.3 | ) | $ | (28.9 | ) | $ | 32.6 | ||||
The notes to consolidated financial statements are an integral part of these statements.
MODINE MANUFACTURING COMPANY
CONSOLIDATED BALANCE SHEETS
March 31, 2013 and 2012
(In millions, except per share amounts)
|
2013
|
2012
|
|||||||
|
ASSETS
|
||||||||
|
Cash and cash equivalents
|
$ | 23.8 | $ | 31.4 | ||||
|
Trade accounts receivable – net
|
194.5 | 216.1 | ||||||
|
Inventories
|
118.8 | 120.8 | ||||||
|
Other current assets
|
61.9 | 59.2 | ||||||
|
Total current assets
|
399.0 | 427.5 | ||||||
|
Property, plant and equipment – net
|
355.9 | 412.1 | ||||||
|
Investment in affiliate
|
3.3 | 3.7 | ||||||
|
Intangible assets – net
|
8.3 | 5.8 | ||||||
|
Goodwill
|
28.7 | 29.9 | ||||||
|
Other noncurrent assets
|
23.6 | 14.5 | ||||||
|
Total assets
|
$ | 818.8 | $ | 893.5 | ||||
|
LIABILITIES AND SHAREHOLDERS' EQUITY
|
||||||||
|
Short-term debt
|
$ | 30.6 | $ | 21.3 | ||||
|
Long-term debt – current portion
|
0.5 | 1.1 | ||||||
|
Accounts payable
|
150.7 | 156.9 | ||||||
|
Accrued compensation and employee benefits
|
51.2 | 50.6 | ||||||
|
Other current liabilities
|
47.1 | 67.7 | ||||||
|
Total current liabilities
|
280.1 | 297.6 | ||||||
|
Long-term debt
|
132.5 | 141.9 | ||||||
|
Deferred income taxes
|
8.6 | 12.3 | ||||||
|
Pensions
|
108.0 | 94.1 | ||||||
|
Postretirement benefits
|
6.7 | 6.4 | ||||||
|
Other noncurrent liabilities
|
14.6 | 15.1 | ||||||
|
Total liabilities
|
550.5 | 567.4 | ||||||
|
Commitments and contingencies (see Note 18)
|
||||||||
|
Shareholders' equity:
|
||||||||
|
Preferred stock, $0.025 par value, authorized 16.0 million shares, issued - none
|
- | - | ||||||
|
Common stock, $0.625 par value, authorized 80.0 million shares, issued 47.8 million and 47.4 million shares
|
29.9 | 29.6 | ||||||
|
Additional paid-in capital
|
171.2 | 168.3 | ||||||
|
Retained earnings
|
207.6 | 231.8 | ||||||
|
Accumulated other comprehensive loss
|
(128.4 | ) | (90.3 | ) | ||||
|
Treasury stock at cost: 0.6 million shares
|
(14.6 | ) | (14.5 | ) | ||||
|
Total Modine shareholders' equity
|
265.7 | 324.9 | ||||||
|
Noncontrolling interest
|
2.6 | 1.2 | ||||||
|
Total equity
|
268.3 | 326.1 | ||||||
|
Total liabilities and equity
|
$ | 818.8 | $ | 893.5 | ||||
The notes to consolidated financial statements are an integral part of these statements.
MODINE MANUFACTURING COMPANY
CONSOLIDATED STATEMENTS OF CASH FLOWS
For the years ended March 31, 2013, 2012 and 2011
(In millions)
|
2013
|
2012
|
2011
|
||||||||||
|
Cash flows from operating activities:
|
||||||||||||
|
Net (loss) earnings
|
$ | (22.8 | ) | $ | 38.8 | $ | 5.2 | |||||
|
Adjustments to reconcile net (loss) earnings with net cash provided
by operating activities:
|
||||||||||||
|
Depreciation and amortization
|
55.8 | 57.7 | 56.5 | |||||||||
|
Pension and postretirement expense
|
1.9 | 5.0 | 6.5 | |||||||||
|
Loss (gain) from disposition of property, plant and equipment
|
2.5 | 0.6 | (3.4 | ) | ||||||||
|
Impairment charges
|
25.9 | 2.5 | 3.5 | |||||||||
|
Deferred income taxes
|
0.6 | 1.9 | (7.0 | ) | ||||||||
|
Stock-based compensation expense
|
3.1 | 1.6 | 4.0 | |||||||||
|
Other – net
|
4.1 | 2.7 | 2.2 | |||||||||
|
Changes in operating assets and liabilities, excluding acquisitions and dispositions:
|
||||||||||||
|
Trade accounts receivable
|
15.1 | (7.5 | ) | (43.0 | ) | |||||||
|
Inventories
|
(0.8 | ) | (3.1 | ) | (19.4 | ) | ||||||
|
Other current assets
|
(6.8 | ) | (10.5 | ) | (2.6 | ) | ||||||
|
Accounts payable
|
(3.2 | ) | (14.6 | ) | 30.0 | |||||||
|
Accrued compensation and employee benefits
|
1.9 | (10.5 | ) | 7.3 | ||||||||
|
Income taxes
|
(1.3 | ) | 0.5 | (2.6 | ) | |||||||
|
Other current liabilities
|
(16.7 | ) | (6.5 | ) | 7.4 | |||||||
|
Other noncurrent assets and liabilities
|
(10.5 | ) | (12.8 | ) | (23.8 | ) | ||||||
|
Net cash provided by operating activities
|
48.8 | 45.8 | 20.8 | |||||||||
|
Cash flows from investing activities:
|
||||||||||||
|
Expenditures for property, plant and equipment
|
(49.8 | ) | (64.4 | ) | (55.1 | ) | ||||||
|
Acquisition – net of cash acquired
|
(4.9 | ) | - | - | ||||||||
|
Proceeds from dispositions of assets
|
0.4 | 1.3 | 12.5 | |||||||||
|
Other – net
|
(1.6 | ) | (1.9 | ) | 1.4 | |||||||
|
Net cash used for investing activities
|
(55.9 | ) | (65.0 | ) | (41.2 | ) | ||||||
|
Cash flows from financing activities:
|
||||||||||||
|
Borrowings of debt
|
166.7 | 134.4 | 260.2 | |||||||||
|
Repayments of debt
|
(167.1 | ) | (116.2 | ) | (252.4 | ) | ||||||
|
Other – net
|
0.7 | 0.6 | 0.8 | |||||||||
|
Net cash provided by financing activities
|
0.3 | 18.8 | 8.6 | |||||||||
|
Effect of exchange rate changes on cash
|
(0.8 | ) | (1.1 | ) | 1.0 | |||||||
|
Net decrease in cash and cash equivalents
|
(7.6 | ) | (1.5 | ) | (10.8 | ) | ||||||
|
Cash and cash equivalents at beginning of year
|
31.4 | 32.9 | 43.7 | |||||||||
|
Cash and cash equivalents at end of year
|
$ | 23.8 | $ | 31.4 | $ | 32.9 | ||||||
|
Cash paid during the year for:
|
||||||||||||
|
Interest
|
$ | 11.6 | $ | 12.8 | $ | 28.1 | ||||||
|
Income taxes
|
$ | 12.4 | $ | 13.0 | $ | 15.6 | ||||||
The notes to consolidated financial statements are an integral part of these statements.
MODINE MANUFACTURING COMPANY
CONSOLIDATED STATEMENTS OF SHAREHOLDERS' EQUITY
For the years ended March 31, 2013, 2012 and 2011
(In millions)
|
Common stock
|
Additional paid-in capital
|
Retained earnings
|
Accumulated other comprehensive loss
|
Treasury stock
|
Non-controlling interest
|
Deferred compensation trust
|
Total
|
|||||||||||||||||||||||||
|
Balance, March 31, 2010
|
$ | 29.2 | $ | 159.9 | $ | 188.1 | $ | (50.3 | ) | $ | (13.9 | ) | $ | - | $ | (0.3 | ) | $ | 312.7 | |||||||||||||
|
Net earnings
|
- | - | 5.2 | - | - | - | - | 5.2 | ||||||||||||||||||||||||
|
Other comprehensive income
|
- | - | - | 27.4 | - | - | - | 27.4 | ||||||||||||||||||||||||
|
Stock options and awards including related tax benefits
|
0.2 | 1.3 | - | - | - | - | - | 1.5 | ||||||||||||||||||||||||
|
Purchase of treasury stock
|
- | - | - | - | (0.1 | ) | - | - | (0.1 | ) | ||||||||||||||||||||||
|
Stock-based compensation expense
|
- | 4.0 | - | - | - | - | - | 4.0 | ||||||||||||||||||||||||
|
Investment in deferred compensation trust
|
- | 1.2 | - | - | - | - | 0.3 | 1.5 | ||||||||||||||||||||||||
|
Balance, March 31, 2011
|
29.4 | 166.4 | 193.3 | (22.9 | ) | (14.0 | ) | - | - | 352.2 | ||||||||||||||||||||||
|
Net earnings attributable to Modine
|
- | - | 38.5 | - | - | - | - | 38.5 | ||||||||||||||||||||||||
|
Other comprehensive loss
|
- | - | - | (67.4 | ) | - | - | - | (67.4 | ) | ||||||||||||||||||||||
|
Stock options and awards including related tax benefits
|
0.2 | 0.3 | - | - | - | - | - | 0.5 | ||||||||||||||||||||||||
|
Purchase of treasury stock
|
- | - | - | - | (0.5 | ) | - | - | (0.5 | ) | ||||||||||||||||||||||
|
Stock-based compensation expense
|
- | 1.6 | - | - | - | - | - | 1.6 | ||||||||||||||||||||||||
|
Contribution by noncontrolling interest
|
- | - | - | - | - | 0.9 | - | 0.9 | ||||||||||||||||||||||||
|
Net earnings attributable to noncontrolling interest
|
- | - | - | - | - | 0.3 | - | 0.3 | ||||||||||||||||||||||||
|
Balance, March 31, 2012
|
29.6 | 168.3 | 231.8 | (90.3 | ) | (14.5 | ) | 1.2 | - | 326.1 | ||||||||||||||||||||||
|
Net loss attributable to Modine
|
- | - | (24.2 | ) | - | - | - | - | (24.2 | ) | ||||||||||||||||||||||
|
Other comprehensive loss
|
- | - | - | (38.1 | ) | - | - | - | (38.1 | ) | ||||||||||||||||||||||
|
Stock options and awards including related tax benefits
|
0.3 | (0.2 | ) | - | - | - | - | - | 0.1 | |||||||||||||||||||||||
|
Purchase of treasury stock
|
- | - | - | - | (0.1 | ) | - | - | (0.1 | ) | ||||||||||||||||||||||
|
Stock-based compensation expense
|
- | 3.1 | - | - | - | - | - | 3.1 | ||||||||||||||||||||||||
|
Net earnings attributable to noncontrolling interest
|
- | - | - | - | - | 1.4 | - | 1.4 | ||||||||||||||||||||||||
|
Balance, March 31, 2013
|
$ | 29.9 | $ | 171.2 | $ | 207.6 | $ | (128.4 | ) | $ | (14.6 | ) | $ | 2.6 | $ | - | $ | 268.3 | ||||||||||||||
The notes to consolidated financial statements are an integral part of these statements.
MODINE MANUFACTURING COMPANY
NOTES TO CONSOLIDATED FINANCIAL STATEMENTS
(In millions, except per share amounts)
|
Note 1:
|
Significant Accounting Policies
|
Nature of operations:
Modine Manufacturing Company (“Modine” or “the Company”) specializes in thermal management systems and components, bringing heating and cooling technology and solutions to diversified global markets. The Company is a leading global developer, manufacturer and marketer of heat exchangers and systems for use in on-highway and off-highway original equipment manufacturer (“OEM”) vehicular applications, and a wide array of building, industrial and refrigeration markets. Product lines include radiators and radiator cores, condensers, oil coolers, charge air coolers, heat-transfer packages and modules, building heating, ventilating and air conditioning (“HVAC”) equipment and exhaust gas recirculation (“EGR”) coolers.
Basis of presentation:
The consolidated financial statements are prepared in conformity with generally accepted accounting principles (“GAAP”) in the United States. These principles require management to make certain estimates and assumptions in determining assets, liabilities, revenue, expenses and related disclosures. Actual amounts could differ from those estimates.
Consolidation principles:
The consolidated financial statements include the accounts of Modine Manufacturing Company and its majority-owned or Modine-controlled subsidiaries. Inter-company transactions and balances are eliminated in consolidation.
During fiscal 2012, the Company completed the formation of a joint venture with OneGene, Inc. to form Modine OneGene Corporation in South Korea. The Company and OneGene, Inc. each made initial capital contributions of 1,000 million Korean won ($0.9 million U.S. equivalent) during fiscal 2012. Modine is considered the primary beneficiary of the joint venture in accordance with applicable consolidation guidance. Accordingly, the results of Modine OneGene Corporation are consolidated by the Company within the Asia segment.
Investments in non-consolidated affiliated companies in which ownership is 20 percent or more are accounted for under the equity method. The investments are stated at cost plus or minus a proportionate share of the undistributed net income (loss). Modine’s share of the affiliates’ net income (loss) is reflected in other income and expense. See Note 11 for further discussion.
Discontinued Operations:
Discontinued operations primarily consist of environmental remediation activities at a former manufacturing facility in The Netherlands. See Note 18 for further discussion.
Assets held for sale:
The Company considers assets to be held for sale when management approves and commits to a formal plan to actively market the assets for sale at a price reasonable in relation to its fair value, the asset is available for immediate sale in its present condition, an active program to locate a buyer and other actions required to complete the sale have been initiated, the sale of the asset is probable and expected to be completed within one year and it is unlikely that significant changes will be made to the plan. Upon designation as held for sale, the carrying value of the assets is recorded at the lower of its carrying value or its estimated fair value, less cost to sell. The Company ceases to record depreciation expense at the time of designation as held for sale.
Revenue recognition:
Sales revenue, including agreed upon commodity price increases, is recognized at the time of product shipment to customers when title and risk of loss pass to customers, selling prices are fixed or determinable and collectability from the customer is reasonably assured. Appropriate provisions are made for uncollectible accounts based on historical data or specific customer economic data. Sales discounts, which are offered for prompt payment by certain customers, are recorded as a reduction to net sales.
Tooling costs:
Modine accounts for production tooling costs as a component of property, plant and equipment when the Company owns title to the tooling and amortizes the capitalized cost to cost of sales over the estimated life of the asset, which is generally three years. At March 31, 2013 and 2012, Company-owned tooling totaled $30.5 million and $27.4 million, respectively. In certain instances, the Company makes upfront payments for customer-owned tooling costs, and subsequently receives reimbursement from customers for the upfront payments. The Company accounts for unbilled customer-owned tooling costs as a receivable within other current assets when the customer has guaranteed reimbursement to the Company. No significant arrangements exist where customer-owned tooling costs were not accompanied by guaranteed reimbursement. At March 31, 2013 and 2012, cost reimbursement receivables related to customer-owned tooling totaled $20.9 million and $14.2 million, respectively.
Warranty:
Modine provides product warranties for specific product lines and accrues for estimated future warranty costs in the period in which the sale is recorded. Warranty expense is generally provided based upon historical and current claim data. Accrual balances, which are recorded within other current liabilities, are monitored and adjusted when it becomes probable that expected claims will differ from existing estimates. See Note 14 for further discussion.
MODINE MANUFACTURING COMPANY
NOTES TO CONSOLIDATED FINANCIAL STATEMENTS
(In millions, except per share amounts)
Shipping and handling costs: Shipping and handling costs incurred upon the shipment of products to our OEM customers are recorded in cost of sales, and related amounts billed to these customers are recorded in net sales. Shipping and handling costs incurred upon the shipment of products to our HVAC customers are recorded in selling, general and administrative (“SG&A”) expenses. For the years ended March 31, 2013, 2012 and 2011, these shipping and handling costs recorded in SG&A expenses were $4.3 million, $5.4 million and $4.8 million, respectively.
Revenue recognition under licensing arrangements (royalty payments):
Revenues under licensing agreements are recognized when earned except in those cases where collection is uncertain, or the amount cannot be reasonably estimated until formal accounting reports are received from the licensee as provided for under the provisions of the licensing agreement. For the years ended March 31, 2013, 2012 and 2011, licensing revenue totaled $1.0 million, $1.2 million and $1.6 million, respectively, and are recorded in net sales.
Research and development:
Research and development costs are expensed as incurred as a component of SG&A. For the years ended March 31, 2013, 2012 and 2011, research and development costs charged to operations totaled $68.4 million, $70.2 million and $67.0 million, respectively.
Translation of foreign currencies:
Assets and liabilities of foreign subsidiaries and equity investments are translated into U.S. dollars at the period-end exchange rates, and income and expense items are translated at the monthly average exchange rate for the period in which the items occur. Resulting translation adjustments are reported as a component of accumulated other comprehensive (loss) income included in shareholders' equity. Foreign currency transaction gains or losses are included in the statement of operations within other income and expense.
Derivative instruments:
The Company enters into derivative financial instruments from time to time to manage certain financial risks. Futures contracts are entered into by the Company to reduce exposure to changing future purchase prices for aluminum and copper. These instruments are used to protect cash flows and are not speculative. The Company can designate these derivative instruments as cash flow hedges. Accordingly, unrealized gains and losses on these contracts are deferred as a component of accumulated other comprehensive (loss) income and recognized as a component of earnings at the same time that the underlying transactions impact earnings. See Note 17 for further discussion.
Income taxes:
Deferred tax assets and liabilities are determined based on the difference between the amounts reported in the financial statements and the tax bases of assets and liabilities, using enacted tax rates in effect in the years in which the differences are expected to reverse. A valuation allowance is established if it is more likely than not that some portion or all of a deferred tax asset will not be realized. See Note 7 for further discussion.
Earnings per share:
Basic earnings per share is calculated based on the weighted average number of common shares outstanding during the period, while the calculation of diluted earnings per share includes the dilutive effect of potential common shares outstanding during the period. The calculation of diluted earnings per share excludes all potential common shares in which their inclusion would have an anti-dilutive effect. Recipients of the Company’s restricted stock awards have non-forfeitable rights to receive any dividends declared by the Company. Therefore, these restricted stock awards are included in computing earnings per share pursuant to the two-class method. See Note 8 for further discussion.
Cash and cash equivalents:
Modine considers all highly liquid investments with original maturities of three months or less to be cash equivalent. Under Modine’s cash management system, cash balances at certain banks are funded when checks are presented for payment. To the extent that checks issued, but not yet presented for payment, exceed the balance on hand at the specific bank against which they were written, the amount of those un-presented checks is included in accounts payable.
Deferred compensation trust:
The Company maintains a deferred compensation trust to fund future obligations under its non-qualified deferred compensation plan. The trust’s investments in third-party debt and equity securities are reflected as long-term investments in the consolidated balance sheet.
Trade accounts receivable and allowance for doubtful accounts:
Trade receivables are recorded at the invoiced amount and do not bear interest if paid according to the original terms. The allowance for doubtful accounts, $0.8 million at March 31, 2013 and 2012, is Modine’s best estimate of the uncollectible amount contained in the existing trade receivables balance. The allowance is based on historical write-off experience and specific customer economic data. The allowance for doubtful accounts is reviewed periodically and adjusted as necessary. Utilizing age- and size-based criteria, certain individual accounts are reviewed for collectability, while all other accounts are reviewed on a pooled basis. Receivables are charged off against the allowance when it is probable that funds will not be collected. The Company enters into supply chain financing programs from time to time to sell or otherwise negotiate accounts receivables without recourse to third-party financial institutions. Sales of accounts receivable are reflected as a reduction of accounts receivable on the consolidated balance sheets and the proceeds are included in the cash flows from operating activities in the consolidated statements of cash flows. During the years ended March 31, 2013, 2012 and 2011, the Company sold, without recourse, $99.1 million, $113.5 million and $47.8 million of accounts receivable to accelerate cash receipts. During the years ended March 31, 2013, 2012 and 2011 a loss on the sale of accounts receivables of $0.3 million, $0.5 million and $0.2 million was recorded in the consolidated statements of operations. This loss represented implicit interest on the transactions and is included in interest expense.
MODINE MANUFACTURING COMPANY
NOTES TO CONSOLIDATED FINANCIAL STATEMENTS
(In millions, except per share amounts)
Inventories: Inventories are valued at the lower of cost, on a first-in, first-out basis or weighted average basis, or market value.
Property, plant and equipment
: Property, plant and equipment are stated at cost. For financial reporting purposes, depreciation is principally computed using the straight-line method over the expected useful life of the asset. Maintenance and repair costs are charged to operations as incurred. Costs of improvements are capitalized. Upon the sale or other disposition of an asset, the cost and related accumulated depreciation are removed from the accounts and the gain or loss is included in the statement of operations.
Goodwill:
Goodwill is not amortized; rather it is tested for impairment annually unless conditions exist that would require a more frequent evaluation. An assessment of the fair value of the Company’s reporting units for its goodwill valuation is required and is based upon, among other things, the present value of expected future cash flows. An impairment loss is recognized when the book value of goodwill exceeds the fair value. The Company performed impairment tests as of March 31, 2013, which resulted in no impairment charge. See Note 13 for further discussion.
Impairment of long-lived assets:
Long-lived assets, including property, plant and equipment and intangible assets are reviewed for impairment and written down to fair value when facts and circumstances indicate that the carrying value of long-lived assets may not be recoverable through estimated future undiscounted cash flows. If an impairment has occurred, a write-down to estimated fair value is made and the impairment loss is recognized as a charge against current operations. Fair value is estimated using a variety of valuation techniques including discounted cash flows, market values and comparison values for similar assets. Investments are reviewed for impairment and written down to fair value when facts and circumstances indicate that a decline in value is other than temporary. See Note 5 for further discussion.
Environmental expenditures:
The Company capitalizes environmental expenditures related to current operations that qualify as property, plant and equipment or substantially increase the economic value or extend the useful life of an asset. All other expenditures are expensed as incurred. Environmental expenditures that relate to an existing condition caused by past operations are expensed. If a loss arising from environmental matters is probable and can be reasonably estimated, the Company records an accrual for the amount of the estimated loss. See Note 18 for further discussion.
Self-insurance reserves:
The Company retains some of the financial risk for various insurance coverage including property, general liability, workers compensation and employee healthcare and therefore maintains reserves that estimate the impact of unreported and under-reported claims that fall below various stop-loss limits and deductibles under its insurance policies. The insurance reserves include settlement cost estimates for known claims, as well as estimates of incurred but not reported claims. Costs of claims, including the impact of changes in reserves due to claim experience and severity, are charged to operations based on claim incurrence. The evaluation of insurance claims and the reasonableness of the related liability accruals are reviewed and updated on a quarterly basis.
Stock-based compensation:
The Company recognizes stock-based compensation using the fair-value method. Accordingly, compensation cost for stock options, stock awards and restricted stock is calculated based on the fair value of the instrument at the time of grant, and is recognized as expense over the vesting period of the stock-based instrument. See Note 4 for further discussion.
Out of period adjustment:
During the first quarter of fiscal 2013, the Company identified an error related to certain commodity hedges that should have been deemed ineffective in the fourth quarter of fiscal 2012, which understated pre-tax earnings by $0.5 million in the fourth quarter of fiscal 2012, and overstated pre-tax earnings by this same amount in the first quarter of fiscal 2013. This amount was not considered material to the financial statements of either fiscal 2012 or fiscal 2013.
New accounting pronouncements:
In June 2011, the Financial Accounting Standards Board (“FASB”) issued an amendment to the accounting guidance for the presentation of comprehensive income. This amendment removes one of the three presentation options for presenting the components of other comprehensive income as part of the statement of shareholders’ equity and requires either a single continuous statement of net income and other comprehensive income or a two consecutive statement approach. The Company adopted this guidance beginning in the first quarter of fiscal 2013 with the two consecutive statement approach.
In September 2011, the FASB issued an amendment to the accounting guidance for testing goodwill for impairment. The amendment provides an option for companies to first use a qualitative approach to test goodwill for impairment if certain conditions are met. If it is determined to be more likely than not that the fair value of the reporting unit is less than its carrying amount, entities must perform the quantitative analysis of the goodwill impairment test. The amendment was effective for the Company’s fiscal 2013 goodwill impairment test. The Company adopted this new accounting guidance during fiscal 2013. See Note 13 for further discussion of the Company’s fiscal 2013 goodwill impairment test.
In February 2013, the FASB issued an accounting standards update that requires entities to present reclassifications by component when reporting changes in accumulated other comprehensive income. In addition, the Company is required to present, either on the face of the statement where net income is presented or in the notes, certain significant amounts reclassified out of accumulated other comprehensive income within the respective line items of the consolidated statement of operations. This guidance is effective prospectively for fiscal years, and interim periods within those years, beginning after December 15, 2012. The Company will adopt this new guidance, which only impacts the Company’s presentation of the components of comprehensive income, for the first quarter of fiscal 2014.
MODINE MANUFACTURING COMPANY
NOTES TO CONSOLIDATED FINANCIAL STATEMENTS
(In millions, except per share amounts)
|
Note 2
|
Acquisitions
|
On July 25, 2012, the Company completed the acquisition of Geofinity Manufacturing of Surrey, British Columbia for cash consideration of $4.9 million, net of cash acquired. This acquisition, which is included in the Commercial Products segment, provides Modine with a product line of innovative geothermal heat pumps in both water-to-water and water-to-air models. Acquired assets and liabilities assumed were recorded at their respective fair values. The purchase price allocation resulted in acquired technology of $3.5 million, working capital net assets of $0.6 million and goodwill of $0.8 million. Acquired technology consists of a fully developed product line, technical processes and intellectual property and is being amortized over ten years.
During fiscal 2007, the Company acquired the remaining 50 percent of Radiadores Visconde Ltda. The purchase agreement included a $2.0 million note, which was payable subject to the resolution of certain obligations of the sellers. During the second quarter of fiscal 2013, the Company and the sellers reached a final resolution under which the Company is not obligated to pay the note to the sellers. As a result, the Company recorded a $2.0 million reduction to selling, general and administrative expenses in the South America segment during the second quarter of fiscal 2013.
|
Note 3:
|
Fair Value Measurements
|
Fair value is defined as the exchange price that would be received for an asset or paid to transfer a liability (an exit price) in the principal or most advantageous market for the asset or liability in an orderly transaction between market participants. Fair value measurements are classified under the following hierarchy:
|
·
|
Level 1 – Quoted prices for identical instruments in active markets.
|
|
·
|
Level 2 – Quoted prices for similar instruments in active markets; quoted prices for identical or similar instruments in markets that are not active; and model-derived valuations in which all significant inputs or significant value-drivers are observable in active markets.
|
|
·
|
Level 3 – Model-derived valuations in which one or more significant inputs or significant value-drivers are unobservable.
|
When available, the Company uses quoted market prices to determine fair value and classifies such measurements within Level 1. In some cases, where market prices are not available, the Company uses observable market-based inputs to calculate fair value, in which case the measurements are classified within Level 2. If quoted or observable market prices are not available, fair value is based upon valuation models that use, where possible, market-based parameters such as interest rates, yield curves or currency rates. These measurements are classified within Level 3.
Trading securities:
Trading securities held by the Company, which are included within other noncurrent assets on the balance sheet, are investments maintained in a deferred compensation trust to fund future obligations under Modine’s non-qualified deferred compensation plan. The securities’ fair values are determined based on quoted prices from active markets and are classified within Level 1 of the valuation hierarchy.
Derivative financial instruments:
As part of the Company’s risk management strategy, Modine enters into derivative transactions to mitigate certain identified exposures. The derivative instruments include foreign currency exchange contracts and commodity derivatives. These are not exchange traded and are customized over-the-counter derivative transactions. These derivative exposures are with counterparties that have long-term credit ratings of BBB – or better. The Company measures fair value assuming that the unit of account is an individual derivative transaction and those derivatives are sold or transferred on a stand-alone basis. The Company estimates the fair value of these derivative instruments based on dealer quotes. These derivative instruments are classified within Level 2 of the valuation hierarchy.
Deferred compensation obligations:
The fair value of the Company’s deferred compensation obligations are recorded at the fair value of the investments held by the deferred compensation trust. As described above, the fair values of the related trading securities are determined based on quoted prices from active markets and are classified within Level 1 of the valuation hierarchy.
The carrying values of cash and cash equivalents, trade accounts receivable and accounts payable approximate fair value due to the short-term nature of these instruments. The fair value of the Company’s debt is disclosed in Note 15.
MODINE MANUFACTURING COMPANY
NOTES TO CONSOLIDATED FINANCIAL STATEMENTS
(In millions, except per share amounts)
At March 31, 2013, assets and liabilities recorded at fair value on a recurring basis were as follows:
|
Level 1
|
Level 2
|
Level 3
|
Total
|
|||||||||||||
|
Assets:
|
||||||||||||||||
|
Trading securities
|
$ | 2.3 | $ | - | $ | - | $ | 2.3 | ||||||||
|
Total assets
|
$ | 2.3 | $ | - | $ | - | $ | 2.3 | ||||||||
|
Liabilities:
|
||||||||||||||||
|
Derivative financial instruments
|
$ | - | $ | 1.4 | $ | - | $ | 1.4 | ||||||||
|
Deferred compensation obligations
|
2.3 | - | - | 2.3 | ||||||||||||
|
Total liabilities
|
$ | 2.3 | $ | 1.4 | $ | - | $ | 3.7 | ||||||||
At March 31, 2012, assets and liabilities recorded at fair value on a recurring basis were as follows:
|
Level 1
|
Level 2
|
Level 3
|
Total
|
|||||||||||||
|
Assets:
|
||||||||||||||||
|
Trading securities
|
$ | 1.8 | $ | - | $ | - | $ | 1.8 | ||||||||
|
Derivative financial instruments
|
- | 0.4 | - | 0.4 | ||||||||||||
|
Total assets
|
$ | 1.8 | $ | 0.4 | $ | - | $ | 2.2 | ||||||||
|
Liabilities:
|
||||||||||||||||
|
Derivative financial instruments
|
$ | - | $ | 3.5 | $ | - | $ | 3.5 | ||||||||
|
Deferred compensation obligations
|
1.8 | - | - | 1.8 | ||||||||||||
|
Total liabilities
|
$ | 1.8 | $ | 3.5 | $ | - | $ | 5.3 | ||||||||
At March 31, 2013, the U.S. pension plan assets were classified as follows:
|
Level 1
|
Level 2
|
Level 3
|
Total
|
|||||||||||||
|
Money market investments
|
$ | - | $ | 7.3 | $ | - | $ | 7.3 | ||||||||
|
Common stocks
|
35.9 | 0.1 | - | 36.0 | ||||||||||||
|
Corporate bonds
|
- | 19.1 | - | 19.1 | ||||||||||||
|
Pooled equity funds
|
68.8 | 14.1 | - | 82.9 | ||||||||||||
|
Pooled fixed income funds
|
17.6 | - | - | 17.6 | ||||||||||||
|
U.S. government and agency securities
|
- | 32.1 | - | 32.1 | ||||||||||||
|
Other
|
1.0 | 4.6 | - | 5.6 | ||||||||||||
|
Total
|
$ | 123.3 | $ | 77.3 | $ | - | $ | 200.6 | ||||||||
At March 31, 2012, the U.S. pension plan assets were classified as follows:
|
Level 1
|
Level 2
|
Level 3
|
Total
|
|||||||||||||
|
Money market investments
|
$ | - | $ | 11.7 | $ | - | $ | 11.7 | ||||||||
|
Common stocks
|
26.7 | 0.1 | - | 26.8 | ||||||||||||
|
Corporate bonds
|
- | 18.2 | - | 18.2 | ||||||||||||
|
Pooled equity funds
|
67.5 | 12.1 | - | 79.6 | ||||||||||||
|
Pooled fixed income funds
|
16.2 | - | - | 16.2 | ||||||||||||
|
U.S. government and agency securities
|
- | 29.3 | - | 29.3 | ||||||||||||
|
Other
|
1.2 | 3.6 | - | 4.8 | ||||||||||||
|
Total
|
$ | 111.6 | $ | 75.0 | $ | - | $ | 186.6 | ||||||||
MODINE MANUFACTURING COMPANY
NOTES TO CONSOLIDATED FINANCIAL STATEMENTS
(In millions, except per share amounts)
The fair value of money market investments have been determined to approximate their net asset values, with no discounts for credit quality or liquidity restrictions and are classified within Level 2 of the valuation hierarchy. The fair value of common stocks, pooled equity funds and pooled fixed-income funds are determined based on quoted prices from active markets and are classified within Level 1 of the valuation hierarchy. The fair value of certain common stocks, corporate bonds, pooled equity funds and U.S. government and agency securities are valued based upon recent bid prices or the average of recent bid and asking prices when available and, if not available, they are valued through matrix pricing models developed by sources considered by management to be reliable. These are classified within Level 2 of the valuation hierarchy.
Assets held for sale:
In addition to items that are recorded at fair value on a recurring basis, assets held for sale and certain other long-lived assets may be measured at fair value on a nonrecurring basis. These assets have been written down to fair value based on Level 3 market-based valuation inputs. Asset impairment charges of $25.9 million were recorded in fiscal 2013 based on fair values determined from estimated market values of similar commercial real estate properties and estimated salvage values. Asset impairment charges of $2.5 million were recorded in fiscal 2012 based on fair values determined from estimated salvage values. Asset impairment charges of $3.5 million were recorded in fiscal 2011 based on fair values determined from estimated salvage values and estimated market values of similar commercial real estate properties. The carrying value of assets held for sale totaled $11.4 million and $2.5 million at March 31, 2013 and March 31, 2012, respectively. See Note 5 for further discussion.
|
Note 4:
|
Stock-Based Compensation
|
The Company’s stock-based incentive plans for employees consist of the following: (1) a discretionary equity program for management and other key employees, and (2) a long-term incentive compensation program for officers and key executives that consists of a stock option component and restricted stock components granted for retention and performance.
In addition to the stock-based incentive plans for employees, stock options and stock awards may be granted to non-employee directors. The Company’s Board of Director’s and the Officer Nomination and Compensation Committee, as applicable, have discretionary authority to set the terms of the awards of stock under the Company’s 2008 Incentive Compensation Plan.
Stock Options:
Compensation expense recorded in fiscal 2013, 2012 and 2011 related to stock options was $1.1 million, $1.3 million and $1.6 million, respectively. The total fair value of stock options vesting during the year ended March 31, 2013 was $1.3 million. As of March 31, 2013, the total compensation expense not yet recognized related to non-vested stock options was $1.0 million and the weighted average period in which the remaining expense is expected to be recognized is 1.7 years.
The fair value of the option awards is estimated on the date of grant using the Black-Scholes option valuation model with the following assumptions for stock options granted in fiscal 2013, 2012 and 2011:
|
2013
|
2012
|
2011
|
||||||||||
|
Weighted average fair value of options
|
$ | 4.26 | $ | 10.45 | $ | 6.43 | ||||||
|
Expected life of awards in years
|
6.3 | 6.3 | 6.3 | |||||||||
|
Risk-free interest rate
|
0.9 | % | 1.9 | % | 2.4 | % | ||||||
|
Expected volatility of the Company's stock
|
87.4 | % | 79.6 | % | 78.0 | % | ||||||
|
Expected dividend yield on the Company's stock
|
0.0 | % | 0.0 | % | 0.0 | % | ||||||
Stock options expire no later than 10 years after the grant date and have an exercise price equal to the fair market value of the common stock on the date of the grant. The risk-free interest rate was based on yields of U.S. zero-coupon issues with a term equal to the expected life of the option for the week the options were granted. The expected volatility assumption was derived by referring to changes in the Company’s historical common stock prices over the same time frame as the expected life of the awards. The expected dividend yield is zero as the Company currently does not anticipate paying dividends over the expected life of the options. The expected lives of the awards are based on historical patterns and the terms of the options. All outstanding options granted vest 25 percent at grant date and 25 percent annually thereafter for the next three years. A pre-vesting forfeiture rate of 2.5 percent was used for these periods as an estimate of expected forfeitures prior to completing the required service period.
MODINE MANUFACTURING COMPANY
NOTES TO CONSOLIDATED FINANCIAL STATEMENTS
(In millions, except per share amounts)
A summary of stock option activity for fiscal 2013 was as follows:
|
Weighted average
|
||||||||||||||||
|
Weighted average
|
remaining contractual
|
Aggregate
|
||||||||||||||
|
Shares
|
exercise price
|
term (years)
|
intrinsic value
|
|||||||||||||
|
Outstanding, April 1, 2012
|
1.8 | $ | 16.37 | |||||||||||||
|
Granted
|
0.2 | 5.79 | ||||||||||||||
|
Exercised
|
- | 5.01 | ||||||||||||||
|
Forfeited or expired
|
(0.3 | ) | 21.78 | |||||||||||||
|
Outstanding, March 31, 2013
|
1.7 | $ | 14.03 | 5.6 | $ | 2.6 | ||||||||||
|
Exercisable, March 31, 2013
|
1.5 | $ | 15.15 | 5.0 | $ | 2.0 | ||||||||||
The aggregate intrinsic value represents the difference between the closing price of Modine common shares on the last trading day of fiscal 2013 over the exercise price of the stock options, multiplied by the number of options outstanding or exercisable. The aggregate intrinsic value shown is not recorded for financial statement purposes and the value will change based upon daily changes in the fair value of Modine’s common shares.
Additional information related to stock options exercised during fiscal 2013, 2012 and 2011 were as follows:
|
2013
|
2012
|
2011
|
||||||||||
|
Intrinsic value of stock options exercised
|
$ | 0.1 | $ | 0.2 | $ | 0.7 | ||||||
|
Proceeds from stock options exercised
|
$ | 0.1 | $ | 0.5 | $ | 1.5 | ||||||
Restricted Stock:
A summary of restricted stock activity for fiscal 2013 was as follows:
|
Weighted
|
||||||||
|
average
|
||||||||
|
Shares
|
price
|
|||||||
|
Non-vested balance, April 1, 2012
|
0.2 | $ | 8.49 | |||||
|
Granted
|
0.5 | 6.07 | ||||||
|
Vested
|
(0.2 | ) | 6.77 | |||||
|
Non-vested balance, March 31, 2013
|
0.5 | $ | 6.91 | |||||
Compensation expense related to restricted stock, using straight-line amortization, in fiscal 2013, 2012 and 2011 was $1.8 million, $1.1 million, and $1.0 million, respectively. At March 31, 2013, Modine had approximately $2.8 million of total unrecognized compensation cost related to non-vested restricted stock, which is expected to be recognized over a weighted average period of 2.8 years.
Restricted Stock – Performance-Based Shares:
Shares are earned under the performance portion of the restricted stock award program based on the attainment of corporate financial goals over a three year period and are awarded at the end of that three year performance period if the performance targets have been achieved. A new performance period may begin each fiscal year so multiple performance periods, with separate goals, operate simultaneously.
The performance component of the long-term incentive compensation program in fiscal 2011 was based on a target compound annual growth rate in adjusted earnings before interest, taxes, depreciation and amortization (“EBITDA”) over a three year period and a target consolidated return on average capital employed (“ROACE”) at the end of the three year period. These performance targets were not achieved as of March 31, 2013. For the program initiated in fiscal 2012, the performance award was based on a target three year average consolidated ROACE and a target improvement in economic profit at the end of the three year performance period. The Company currently does not consider the attainment of these performance targets to be probable. For the program initiated in fiscal 2013, the performance award was based on a target three year average consolidated ROACE, cumulative revenue over the three year performance period and Europe ROACE at the end of the three year performance period. The Company currently considers the attainment of two of these performance targets to be probable.
MODINE MANUFACTURING COMPANY
NOTES TO CONSOLIDATED FINANCIAL STATEMENTS
(In millions, except per share amounts)
For fiscal 2013, 2012, and 2011, Modine recorded compensation expense of $0.2 million, compensation income of $0.8 million and compensation expense $1.4 million, respectively, related to performance awards. At March 31, 2013, Modine had approximately $1.0 million of total unrecognized compensation cost related to unvested performance-based restricted stock, which is expected to be recognized over a weighted average period of 2.0 years.
The fulfillment of equity-based grants is currently being accomplished through the issuance of new common shares. Under the Company’s 2008 Incentive Compensation Plan, 2.5 million shares are available for the granting of additional options and awards at March 31, 2013.
|
Note 5:
|
Impairment and Restructuring Charges
|
During fiscal 2013, the Company announced its intention to restructure its Europe segment. The Company’s actions included exiting certain non-core product lines based on its global product strategy, reducing manufacturing costs, implementing headcount reductions, and disposing of or selling certain assets. The Company is continuing to evaluate additional restructuring actions. The restructuring is designed to align the cost structure of the segment with the segment’s strategic focus on the commercial vehicle, off-highway and engine products markets, while improving gross margin and return on average capital employed.
Since the commencement of the Europe segment restructuring, the Company recorded $24.1 million of asset impairment charges, $14.9 million of employee severance costs, primarily related to headcount reductions at the segment headquarters and a manufacturing facility, and $2.1 million of repositioning expenses, primarily related to equipment transfer costs.
The Company accrues severance in accordance with its written plans, procedures and relevant statutory requirements. Changes in accrued severance were as follows:
|
Year ended March 31
|
2013
|
|||
|
Beginning balance
|
$ | - | ||
|
Additions
|
14.9 | |||
|
Payments
|
(3.3 | ) | ||
|
Balance, March 31, 2013
|
$ | 11.6 | ||
During the year ended March 31, 2013, asset impairment charges for the total Company were $25.9 million. The impairment charges primarily relate to facilities held for sale in the Europe and North America segments to reduce their carrying value to estimated fair value, less cost to sell. During the year ended March 31, 2012, the Company recorded a loss on disposal of assets and asset impairment charges of $2.5 million within the Europe segment. During the year ended March 31, 2011 the Company recorded asset impairment charges of $3.5 million, which included $2.2 million of assets in the Europe segment related to a program cancellation and assets no longer in use, $1.0 million within the North America segment for facilities held for sale to reduce their carrying value to the estimated fair value less cost to sell and $0.3 million within the Asia segment related to a program cancellation.
At March 31, 2013 and 2012, assets held for sale of $11.4 million and $2.5 million, respectively, were included in other noncurrent assets. These consist of facilities that the Company is marketing for sale. Upon designation as held for sale, the carrying value of the asset was measured at the lower of its carrying value or its estimated fair value, less cost to sell. During fiscal 2011, the Company sold three held for sale facilities in the North America and Europe segments for net proceeds of $8.8 million and recognized a gain on these sales of $3.3 million.
MODINE MANUFACTURING COMPANY
NOTES TO CONSOLIDATED FINANCIAL STATEMENTS
(In millions, except per share amounts)
|
Note 6:
|
Other Income and Expense
|
Other income and expense consisted of the following:
|
Years ended March 31
|
2013
|
2012
|
2011
|
|||||||||
|
Equity in earnings (loss) of non-consolidated affiliates
|
$ | 0.3 | $ | (0.1 | ) | $ | 0.5 | |||||
|
Interest income
|
0.9 | 0.8 | 0.7 | |||||||||
|
Foreign currency transactions
|
(1.1 | ) | (7.8 | ) | 2.3 | |||||||
|
Other non-operating income
|
0.1 | - | 0.1 | |||||||||
|
Total other income (expense) - net
|
$ | 0.2 | $ | (7.1 | ) | $ | 3.6 | |||||
Foreign currency transactions primarily consist of foreign currency transaction gains and losses on the re-measurement or settlement of foreign currency denominated assets and liabilities, including inter-company loans and transactions denominated in a foreign currency, along with unrealized gains and losses on foreign currency exchange contracts.
|
Note 7:
|
Income Taxes
|
The U.S. and foreign components of (loss) earnings from continuing operations before income taxes and the provision for income taxes consisted of the following:
|
Years ended March 31
|
2013
|
2012
|
2011
|
|||||||||
|
Components of (loss) earnings from continuing operations
before income taxes:
|
||||||||||||
|
United States
|
$ | 10.2 | $ | 17.2 | $ | (27.5 | ) | |||||
|
Foreign
|
(23.2 | ) | 30.7 | 40.3 | ||||||||
|
Total (loss) earnings from continuing operations before income taxes
|
$ | (13.0 | ) | $ | 47.9 | $ | 12.8 | |||||
|
Income tax expense (benefit):
|
||||||||||||
|
Federal:
|
||||||||||||
|
Current
|
$ | 2.6 | $ | - | $ | (3.7 | ) | |||||
|
Deferred
|
(2.6 | ) | 0.3 | 2.7 | ||||||||
|
State:
|
||||||||||||
|
Current
|
0.2 | 0.3 | 0.2 | |||||||||
|
Deferred
|
(0.2 | ) | (0.2 | ) | (2.6 | ) | ||||||
|
Foreign:
|
||||||||||||
|
Current
|
6.4 | 8.3 | 12.2 | |||||||||
|
Deferred
|
3.4 | 1.2 | (4.3 | ) | ||||||||
|
Total income tax expense
|
$ | 9.8 | $ | 9.9 | $ | 4.5 | ||||||
The Company allocates income tax expense among continuing operations, discontinued operations, and other comprehensive income. Accounting for income taxes is applied by tax jurisdiction, and in periods in which there is loss from continuing operations before income taxes and pre-tax income in other categories (e.g., discontinued operations or other comprehensive income), income tax expense is first allocated to the other sources of income, with a related tax benefit recorded in continuing operations.
Income tax expense attributable to (loss) earnings from continuing operations before income taxes differed from the amounts computed by applying the statutory U.S. federal income tax rate as a result of the following:
MODINE MANUFACTURING COMPANY
NOTES TO CONSOLIDATED FINANCIAL STATEMENTS
(In millions, except per share amounts)
|
Years ended March 31
|
2013
|
2012
|
2011
|
|||||||||
|
Statutory federal tax
|
35.0 | % | 35.0 | % | 35.0 | % | ||||||
|
State taxes, net of federal benefit
|
(1.3 | ) | (0.1 | ) | (19.0 | ) | ||||||
|
Taxes on non-U.S. earnings and losses
|
(23.8 | ) | (5.7 | ) | (5.7 | ) | ||||||
|
Valuation allowance
|
(59.3 | ) | 2.1 | 84.6 | ||||||||
|
Tax credits
|
37.0 | (19.2 | ) | (84.3 | ) | |||||||
|
Compensation
|
(13.0 | ) | 3.4 | 11.1 | ||||||||
|
Foreign tax rate changes
|
0.9 | 0.6 | (4.5 | ) | ||||||||
|
Reserves for uncertain tax positions
|
(41.9 | ) | 1.9 | 4.2 | ||||||||
|
Brazilian interest on equity
|
3.2 | (1.0 | ) | (7.4 | ) | |||||||
|
Dividend repatriation
|
(11.4 | ) | 4.4 | 23.0 | ||||||||
|
Other
|
(0.8 | ) | (0.7 | ) | (1.8 | ) | ||||||
|
Effective tax rate
|
(75.4 | %) | 20.7 | % | 35.2 | % | ||||||
The Other category for the years ended March 31, 2013, 2012 and 2011 includes such items as foreign withholding taxes, state tax refunds and foreign currency.
During fiscal 2013, the Company recorded a valuation allowance of $7.7
million against net deferred tax assets as a result of a $15.6 million increase to the valuation allowance in certain foreign jurisdictions offset by a $7.9 million reduction to the valuation allowance in the U.S. The increase in the valuation allowance in foreign jurisdictions was largely related to losses in Germany and China based on the determination that it was more likely than not that the net deferred tax assets in these jurisdictions will not be realized. The Company will continue to provide a valuation allowance against its net deferred tax assets in each of the applicable jurisdictions going forward until the need for a valuation allowance is eliminated. The need for the valuation allowance is eliminated when the Company determines it is more likely than not that the deferred tax assets will be realized. It is possible that in late fiscal 2014 or early fiscal 2015, the U.S. taxing jurisdiction will no longer be in a cumulative three year loss position, thereby removing significant negative evidence concerning the valuation allowance.
During fiscal 2012, the Company satisfied requirements under Hungarian regulations necessary to obtain an additional development tax credit in Hungary and, as a result, recorded a $4.4 million tax benefit, which significantly impacted its effective tax rate for the year.
During fiscal 2011, the Company satisfied the labor requirement under Hungarian regulations necessary to obtain a development tax credit in Hungary and, as a result, recorded a $7.8 million tax benefit, which significantly benefited the effective tax rate in fiscal 2011.
The tax effects of temporary differences that give rise to deferred tax assets and deferred tax liabilities were as follows:
MODINE MANUFACTURING COMPANY
NOTES TO CONSOLIDATED FINANCIAL STATEMENTS
(In millions, except per share amounts)
|
March 31
|
2013
|
2012
|
||||||
|
Deferred tax assets:
|
||||||||
|
Accounts receivable
|
$ | 0.6 | $ | 0.5 | ||||
|
Inventories
|
4.1 | 4.9 | ||||||
|
Plant and equipment
|
13.3 | 19.0 | ||||||
|
Pension and employee benefits
|
85.7 | 77.4 | ||||||
|
Net operating loss, capital loss and credit carry forwards
|
114.6 | 96.9 | ||||||
|
Other, principally accrued liabilities
|
14.2 | 15.3 | ||||||
|
Total gross deferred tax assets
|
232.5 | 214.0 | ||||||
|
Less: valuation allowance
|
(172.8 | ) | (146.8 | ) | ||||
|
Net deferred tax assets
|
59.7 | 67.2 | ||||||
|
Deferred tax liabilities:
|
||||||||
|
Pension
|
34.3 | 31.2 | ||||||
|
Goodwill
|
5.0 | 5.4 | ||||||
|
Plant and equipment
|
11.7 | 24.2 | ||||||
|
Other
|
10.5 | 7.4 | ||||||
|
Total gross deferred tax liabilities
|
61.5 | 68.2 | ||||||
|
Net deferred tax liability
|
$ | (1.8 | ) | $ | (1.0 | ) | ||
The increase in the valuation allowance during fiscal 2013 primarily related to increases in the valuation allowance against the net deferred tax assets in Germany, China and Austria, offset by a reduction in the valuation allowance against the net U.S. deferred tax assets.
A reconciliation of unrecognized tax benefits is as follows:
|
2013
|
2012
|
|||||||
|
Balance, April 1
|
$ | 3.3 | $ | 5.3 | ||||
|
Gross increases - tax positions in prior period
|
5.6 | 3.6 | ||||||
|
Gross decreases - tax positions in prior period
|
(0.1 | ) | (3.8 | ) | ||||
|
Gross increases - tax positions in current period
|
0.6 | 0.5 | ||||||
|
Gross decreases - tax positions in current period
|
(0.4 | ) | (0.4 | ) | ||||
|
Settlements
|
- | (1.7 | ) | |||||
|
Foreign currency impact
|
- | (0.2 | ) | |||||
|
Balance, March 31
|
$ | 9.0 | $ | 3.3 | ||||
The Company’s total gross liability for unrecognized tax benefits as of March 31, 2013 is $9.0 million, and if recognized, $0.2 million would have an effective tax rate impact.
During fiscal 2005, a German lower court ruling disallowed certain deductions for trade tax purposes. Based on this ruling the Company established an uncertain tax position contingency for additional trade tax liability and interest. During fiscal 2012, German Supreme Court affirmed the lower court finding and as a result the uncertain tax position contingency was reversed. The Company filed amended tax returns for the fiscal years 2005 through 2010 resulting in an additional trade tax liability and interest owed of $2.0 million.
In accordance with its accounting policy, the Company recognizes accrued interest and penalties related to unrecognized tax benefits as a component of income tax expense. During fiscal 2013, no interest and penalties were included as a component of income tax expense in the consolidated statement of operations. At March 31, 2013 and 2012, $0.2
million of accrued interest and penalties were included in the consolidated balance sheets.
MODINE MANUFACTURING COMPANY
NOTES TO CONSOLIDATED FINANCIAL STATEMENTS
(In millions, except per share amounts)
The Company files income tax returns in multiple jurisdictions and is subject to examination by taxing authorities throughout the world. At March 31, 2013, the Company was engaged in an income tax examination by the German taxing authority covering fiscal years 2006 through 2010 and was notified of a tax audit in Austria commencing in fiscal 2014 covering fiscal years 2008 through 2011. During the next twelve months, the Company believes it is reasonably possible that the amount of unrecognized tax benefits could be reduced by up to $6.8
million as a result of the resolution of worldwide tax matters and the lapses of statutes of limitations.
The following tax years remain subject to examination for the Company’s major tax jurisdictions:
|
Austria
|
Fiscal 2008 - 2012
|
|
Brazil
|
Fiscal 2007 - 2012
|
|
Germany
|
Fiscal 2006 - 2012
|
|
United States
|
Fiscal 2010 - 2012
|
At March 31, 2013, the Company has foreign tax credit carry forwards of $5.0 million that, if not utilized against domestic taxes, will expire between 2015 and 2017. The Company also has federal and state research and development tax credits of $17.4 million that, if not utilized against domestic taxes, will expire between 2018 and 2033. The Company also has various state and local tax loss carry forwards of $200.5 million that, if not utilized against state apportioned taxable income, will expire at various times during 2014 through 2033. In addition, the Company has tax loss carry forwards of $304.1 million in various tax jurisdictions throughout the world. Certain of these carry forwards, primarily in the U.S. and Germany, are offset by a valuation allowance. If not utilized against taxable income, $199.2 million
of these tax losses will expire at various times during 2014 through 2033, and $104.9 million will not expire due to an unlimited carry-forward period.
At March 31, 2013, the Company had provided $0.2 million of U.S. tax and $0.8 million of foreign tax on undistributed earnings of certain joint equity investment companies and certain European subsidiaries considered not permanently reinvested.
Undistributed earnings totaling $453.1 million are considered permanently reinvested in the remaining foreign operations, and no provision has been made for any taxes that would be payable upon the distribution of such earnings. It is not practicable to estimate the amount of unrecognized withholding taxes and deferred tax liability on such earnings.
MODINE MANUFACTURING COMPANY
NOTES TO CONSOLIDATED FINANCIAL STATEMENTS
(In millions, except per share amounts)
|
Note 8:
|
Earnings Per Share
|
The components of basic and diluted earnings per share are as follows:
|
Years Ended March 31
|
2013
|
2012
|
2011
|
|||||||||
|
(Loss) earnings from continuing operations
|
$ | (22.8 | ) | $ | 38.0 | $ | 8.3 | |||||
|
Less: Net earnings attributable to noncontrolling interest
|
(1.4 | ) | (0.3 | ) | - | |||||||
|
(Loss) earnings from continuing operations attributable to
Modine
|
(24.2 | ) | 37.7 | 8.3 | ||||||||
|
Less: Undistributed earnings attributable to unvested shares
|
- | (0.2 | ) | - | ||||||||
|
(Loss) earnings from continuing operations available to
Modine shareholders
|
(24.2 | ) | 37.5 | 8.3 | ||||||||
|
Earnings (loss) from discontinued operations
|
- | 0.8 | (3.1 | ) | ||||||||
|
Net (loss) earnings available to Modine shareholders
|
$ | (24.2 | ) | $ | 38.3 | $ | 5.2 | |||||
|
Weighted average shares outstanding - basic
|
46.6 | 46.5 | 46.2 | |||||||||
|
Effect of dilutive securities
|
- | 0.4 | 0.5 | |||||||||
|
Weighted average shares outstanding - diluted
|
46.6 | 46.9 | 46.7 | |||||||||
|
Basic Earnings Per Share:
|
||||||||||||
|
(Loss) earnings per share - continuing operations
|
$ | (0.52 | ) | $ | 0.81 | $ | 0.18 | |||||
|
Earnings (loss) per share - discontinued operations
|
- | 0.02 | (0.07 | ) | ||||||||
|
Net (loss) earnings per share - basic
|
$ | (0.52 | ) | $ | 0.83 | $ | 0.11 | |||||
|
Diluted Earnings Per Share:
|
||||||||||||
|
(Loss) earnings per share - continuing operations
|
$ | (0.52 | ) | $ | 0.80 | $ | 0.18 | |||||
|
Earnings (loss) per share - discontinued operations
|
- | 0.02 | (0.07 | ) | ||||||||
|
Net (loss) earnings per share - diluted
|
$ | (0.52 | ) | $ | 0.82 | $ | 0.11 | |||||
For the year ended March 31, 2013, the total number of potential dilutive securities was 0.3 million. However, these securities were not included in the computation of diluted net loss per share since to do so would decrease the loss per share. For the years ended March 31, 2013, 2012 and 2011, the calculation of diluted earnings per share excludes 1.1 million, 1.1 million and 1.5 million stock options, respectively, and 0.1 million, 0.4 million and 0.2 million restricted stock awards, respectively, because they were anti-dilutive.
|
Note 9:
|
Inventories
|
Inventories consisted of the following:
|
March 31
|
2013
|
2012
|
||||||
|
Raw materials and work in process
|
$ | 88.1 | $ | 88.6 | ||||
|
Finished goods
|
30.7 | 32.2 | ||||||
|
Total inventories
|
$ | 118.8 | $ | 120.8 | ||||
MODINE MANUFACTURING COMPANY
NOTES TO CONSOLIDATED FINANCIAL STATEMENTS
(In millions, except per share amounts)
|
Note 10:
|
Property, Plant and Equipment
|
Property, plant and equipment, including depreciable lives, consisted of the following:
|
March 31
|
2013
|
2012
|
||||||
|
Land
|
$ | 10.0 | $ | 11.8 | ||||
|
Buildings and improvements (10-40 years)
|
216.7 | 249.7 | ||||||
|
Machinery and equipment (3-12 years)
|
679.1 | 686.1 | ||||||
|
Office equipment (3-10 years)
|
95.7 | 96.0 | ||||||
|
Construction in progress
|
31.6 | 49.1 | ||||||
| 1,033.1 | 1,092.7 | |||||||
|
Less: accumulated depreciation
|
(677.2 | ) | (680.6 | ) | ||||
|
Net property, plant and equipment
|
$ | 355.9 | $ | 412.1 | ||||
Depreciation expense totaled $55.1 million, $57.1 million and $55.8 million for the years ended March 31, 2013, 2012 and 2011, respectively. Gains and losses related to the disposal of property, plant and equipment are recorded in SG&A expenses. Total (losses) gains related to the disposal of property, plant and equipment were ($2.5) million, ($0.6) million and $3.4 million for the years ended March 31, 2013, 2012 and 2011, respectively.
|
Note 11:
|
Investment in Affiliate
|
The Company’s investment in its non-consolidated affiliate is accounted for under the equity method. The Company has a 50 percent ownership of Nikkei Heat Exchanger Company, Ltd. (“NEX”). At March 31, 2013 and 2012, the Company had $3.3 million and $3.7 million, respectively, recorded as an asset related to this investment. At March 31, 2013, the investment in NEX is equal to the Company's investment in the underlying assets.
The results of operations for NEX are reported in the consolidated financial statements using a one-month reporting delay. Equity in earnings from non-consolidated affiliates is reported within other income and expense in the consolidated statements of operations. The Company’s share of NEX’s earnings (loss) for the years ended March 31, 2013, 2012 and 2011 were $0.3 million, ($0.1) million and $0.5 million, respectively.
|
Note 12:
|
Intangible Assets
|
Intangible assets consisted of the following:
|
March 31, 2013
|
March 31, 2012
|
|||||||||||||||||||||||
|
Gross
|
Net
|
Gross
|
Net
|
|||||||||||||||||||||
|
Carrying
|
Accumulated
|
Intangible
|
Carrying
|
Accumulated
|
Intangible
|
|||||||||||||||||||
|
Value
|
Amortization
|
Assets
|
Value
|
Amortization
|
Assets
|
|||||||||||||||||||
|
Tradenames
|
$ | 9.6 | $ | (4.7 | ) | $ | 4.9 | $ | 10.4 | $ | (4.6 | ) | $ | 5.8 | ||||||||||
|
Acquired technology
|
3.5 | (0.1 | ) | 3.4 | - | - | - | |||||||||||||||||
|
Total intangible assets
|
$ | 13.1 | $ | (4.8 | ) | $ | 8.3 | $ | 10.4 | $ | (4.6 | ) | $ | 5.8 | ||||||||||
MODINE MANUFACTURING COMPANY
NOTES TO CONSOLIDATED FINANCIAL STATEMENTS
(In millions, except per share amounts)
Amortization expense for the years ended March 31, 2013, 2012 and 2011 was $0.7 million, $0.6 million and $0.7 million, respectively. Estimated future amortization expense is as follows:
|
Estimated
|
||||
|
Fiscal
|
Amortization
|
|||
|
Year
|
Expense
|
|||
|
2014
|
$ | 0.8 | ||
|
2015
|
1.1 | |||
|
2016
|
1.2 | |||
|
2017
|
1.2 | |||
|
2018
|
1.2 | |||
|
2019 & Beyond
|
2.8 | |||
|
Note 13:
|
Goodwill
|
Changes in the carrying amount of goodwill, by segment and in the aggregate, were as follows:
|
March 31, 2011
|
Fluctuations in
foreign currency
|
March 31, 2012
|
Acquisition
|
Fluctuations in
foreign currency
|
March 31, 2013
|
|||||||||||||||||||
|
Asia
|
||||||||||||||||||||||||
|
Gross goodwill
|
$ | 0.5 | $ | - | $ | 0.5 | $ | - | $ | - | $ | 0.5 | ||||||||||||
|
Accumulated impairments
|
- | - | - | - | - | - | ||||||||||||||||||
|
Net goodwill balance
|
0.5 | - | 0.5 | - | - | 0.5 | ||||||||||||||||||
|
Europe
|
||||||||||||||||||||||||
|
Gross goodwill
|
9.6 | (0.6 | ) | 9.0 | - | (0.3 | ) | 8.7 | ||||||||||||||||
|
Accumulated impairments
|
(9.6 | ) | 0.6 | (9.0 | ) | - | 0.3 | (8.7 | ) | |||||||||||||||
|
Net goodwill balance
|
- | - | - | - | - | - | ||||||||||||||||||
|
North America
|
||||||||||||||||||||||||
|
Gross goodwill
|
23.8 | - | 23.8 | - | - | 23.8 | ||||||||||||||||||
|
Accumulated impairments
|
(23.8 | ) | - | (23.8 | ) | - | - | (23.8 | ) | |||||||||||||||
|
Net goodwill balance
|
- | - | - | - | - | - | ||||||||||||||||||
|
South America
|
||||||||||||||||||||||||
|
Gross goodwill
|
15.1 | (1.6 | ) | 13.5 | - | (1.3 | ) | 12.2 | ||||||||||||||||
|
Accumulated impairments
|
- | - | - | - | - | - | ||||||||||||||||||
|
Net goodwill balance
|
15.1 | (1.6 | ) | 13.5 | - | (1.3 | ) | 12.2 | ||||||||||||||||
|
Commercial Products
|
||||||||||||||||||||||||
|
Gross goodwill
|
15.9 | - | 15.9 | 0.8 | (0.7 | ) | 16.0 | |||||||||||||||||
|
Accumulated impairments
|
- | - | - | - | - | - | ||||||||||||||||||
|
Net goodwill balance
|
15.9 | - | 15.9 | 0.8 | (0.7 | ) | 16.0 | |||||||||||||||||
|
Total Company
|
||||||||||||||||||||||||
|
Gross goodwill
|
64.9 | (2.2 | ) | 62.7 | 0.8 | (2.3 | ) | 61.2 | ||||||||||||||||
|
Accumulated impairments
|
(33.4 | ) | 0.6 | (32.8 | ) | - | 0.3 | (32.5 | ) | |||||||||||||||
|
Net goodwill balance
|
$ | 31.5 | $ | (1.6 | ) | $ | 29.9 | $ | 0.8 | $ | (2.0 | ) | $ | 28.7 | ||||||||||
Goodwill is assessed for impairment by the Company annually or more frequently if events or circumstances change that would, more likely than not, reduce the fair value of a reporting unit below its carrying value. The Company conducted its annual assessment for goodwill impairment in the fourth quarter of fiscal 2013 by applying a fair value-based test and determined that the fair value of the Company’s reporting units exceeded their respective book values. In fiscal 2012 and 2011, the fair value of the Company’s reporting units also exceeded their respective book values.
|
Note 14:
|
Product Warranties, Operating Leases and Other Commitments
|
Product warranties
: Modine provides product warranties for various product lines, with warranty periods generally ranging from one to five years. The Company accrues for estimated future warranty costs in the period in which the sale is recorded, and warranty expense estimates are based on the best information available using analytical and statistical analysis of both historical and current claim data. These expenses are adjusted when it becomes probable that expected claims will differ from initial estimates recorded at the time of the sale.
MODINE MANUFACTURING COMPANY
NOTES TO CONSOLIDATED FINANCIAL STATEMENTS
(In millions, except per share amounts)
Changes in accrued warranty costs were as follows:
|
Years ended March 31
|
2013
|
2012
|
||||||
|
Balance, April 1
|
$ | 11.4 | $ | 14.7 | ||||
|
Accruals for warranties issued
|
4.9 | 6.6 | ||||||
|
Accruals (reversals) related to pre-existing warranties
|
2.7 | (1.1 | ) | |||||
|
Settlements
|
(6.1 | ) | (8.4 | ) | ||||
|
Effect of exchange rate changes
|
(0.3 | ) | (0.4 | ) | ||||
|
Balance, March 31
|
$ | 12.6 | $ | 11.4 | ||||
Operating leases:
Modine leases various facilities and equipment under operating leases. Rental expense for these leases totaled $11.3 million in fiscal 2013, $9.0 million in fiscal 2012 and $8.8 million in fiscal 2011.
Future minimum rental commitments at March 31, 2013 under non-cancelable operating leases are as follows:
|
Years ending March 31
|
||||
|
2014
|
$ | 6.5 | ||
|
2015
|
4.5 | |||
|
2016
|
3.0 | |||
|
2017
|
2.2 | |||
|
2018
|
1.8 | |||
|
2019 and beyond
|
4.3 | |||
|
Total future minimum rental commitments
|
$ | 22.3 | ||
Indemnification agreements:
From time to time, the Company provides indemnification agreements related to the sale or purchase of an entity or facility. These indemnification agreements cover customary representations and warranties typically provided in conjunction with such transactions, including income, sales, excise or other tax matters, environmental matters and other third-party claims. The indemnification periods provided generally range from less than one year to fifteen years. In addition, standard indemnification provisions reside in many commercial agreements to which the Company is a party and relate to responsibility in the event of potential third-party claims. The fair value of the Company’s outstanding indemnification obligations at March 31, 2013 is not material.
Commitments:
At March 31, 2013, the Company had capital expenditure commitments of $11.9 million. Significant commitments include tooling and equipment expenditures for new and renewal platforms with customers in Europe and North America along with new program launches in Asia. The Company utilizes inventory arrangements with certain vendors in the normal course of business under which the vendors maintain inventory stock at the Company’s facilities or at outside facilities. Title passes to the Company at the time goods are withdrawn for use in production. The Company has agreements with the vendors to use the material within a specific period of time. In some cases, the Company bears the risk of loss for the inventory because Modine is required to insure the inventory against damage and/or theft. This inventory is included within the Company’s consolidated balance sheets as raw materials inventory.
MODINE MANUFACTURING COMPANY
NOTES TO CONSOLIDATED FINANCIAL STATEMENTS
(In millions, except per share amounts)
|
Note 15:
|
Indebtedness
|
Long-term debt was comprised of the following:
|
Interest rate at
March 31, 2013
|
Fiscal
year of
maturity
|
March 31, 2013
|
March 31, 2012
|
|||||||||||||
|
Various foreign denominated borrowings
|
3.8 | % | 2016 | $ | 1.9 | $ | 2.3 | |||||||||
|
Denominated in U.S. dollars:
|
||||||||||||||||
|
Fixed rate -
|
||||||||||||||||
|
2020 Notes
|
6.8 | % | 2021 | 125.0 | 125.0 | |||||||||||
|
Variable rate -
|
||||||||||||||||
|
Revolving credit facility
|
2.2 | % | 2015 | - | 9.0 | |||||||||||
| 126.9 | 136.3 | |||||||||||||||
|
Capital lease obligations
|
2014-2029 | 6.1 | 6.7 | |||||||||||||
| 133.0 | 143.0 | |||||||||||||||
|
Less: current portion
|
(0.5 | ) | (1.1 | ) | ||||||||||||
|
Total long-term debt
|
$ | 132.5 | $ | 141.9 | ||||||||||||
During fiscal 2013, the Company entered into the Second Amendment to Amended and Restated Credit Agreement and the Third Amendment to Amended and Restated Credit Agreement with six financial institutions led by JPMorgan Chase Bank, N.A. The agreements amended the Company’s existing $145.0 million revolving credit facility, which is due to expire in August 2014. Modine entered into these agreements for purposes of modifying certain provisions of the then-existing credit agreement. Interest is based on a variable interest rate of London Interbank Offered Rate (“LIBOR”) plus 150 to 250 basis points depending upon the Company’s debt to adjusted EBITDA ratio (leverage ratio) for the then four preceding fiscal quarters. As of March 31, 2013, the Company’s variable interest rate was LIBOR plus 200 basis points, or 2.2 percent. At March 31, 2013, no borrowings were outstanding under the revolving credit facility.
During fiscal 2011, the Company entered into the $125.0 million Senior Notes, the proceeds of which were used to repay the Company’s then existing Senior Notes. The Company recognized a loss of $17.9 million on early extinguishment of debt as a component of interest expense in fiscal 2011.
Provisions in the Company’s Amended and Restated Credit Agreement and Note Purchase Agreement include restrictive covenants. The Company is subject to an adjusted EBITDA to interest expense (interest expense coverage ratio) covenant and a debt to adjusted EBITDA (leverage ratio) covenant. Adjusted EBITDA is defined as earnings from continuing operations before interest expense and provision for income taxes, adjusted to exclude unusual, non-recurring or extraordinary non-cash charges and up to $40.0 million of cash restructuring and repositioning charges, not to exceed $20.0 million in any fiscal year, and further adjusted to add back depreciation and amortization. The Company is required to maintain the interest expense coverage ratio and leverage ratio covenants based on the following:
|
Interest Expense Coverage
|
Leverage Ratio
|
||
|
Ratio Covenant (Not
|
Covenant (Not Permitted
|
||
|
Permitted to Be Less Than)
|
to Be Greater Than)
|
||
|
Fiscal quarter ending on or before August 12, 2014
|
3.00 to 1.0
|
3.25 to 1.0
|
|
|
All fiscal quarters ending thereafter
|
3.00 to 1.0
|
3.00 to 1.0
|
Provisions contained in the Company’s revolving credit facility, Senior Note agreements and various foreign credit agreements require the Company to maintain compliance with various covenants and include certain cross-default clauses. The Company was in compliance with its covenants as of March 31, 2013.
MODINE MANUFACTURING COMPANY
NOTES TO CONSOLIDATED FINANCIAL STATEMENTS
(In millions, except per share amounts)
Long-term debt matures as follows:
|
Years ending March 31
|
||||
|
2014
|
$ | 0.5 | ||
|
2015
|
1.7 | |||
|
2016
|
0.5 | |||
|
2017
|
8.3 | |||
|
2018
|
16.3 | |||
|
2019 & beyond
|
105.7 | |||
|
Total
|
$ | 133.0 | ||
The Company also maintains credit agreements for its foreign subsidiaries with outstanding short-term borrowings at March 31, 2013 and March 31, 2012 of $30.6 million and $21.3 million, respectively. The Company’s foreign unused lines of credit in Europe, Brazil, China and India at March 31, 2013 total $52.0 million. At March 31, 2013, domestic letters of credit totaled $6.0 million and available borrowings under the Company’s domestic revolving credit facility were $139.0 million. In aggregate, the Company had total available lines of credit of $191.0 million at March 31, 2013.
The fair value of long-term debt is estimated using discounted future cash flows at rates offered to the Company for similar debt instruments of comparable maturities. At March 31, 2013 and March 31, 2012, the carrying value of Modine’s long-term debt approximated fair value, with the exception of the Senior Notes, which had a fair value of approximately $139.0 million at each date. The fair value of the Senior Notes is categorized as Level 2 within the fair value hierarchy. Refer to Note 3 for the definition of a Level 2 fair value measurement.
|
Note 16:
|
Pension and Employee Benefit Plans
|
Defined Contribution Employee Benefit Plans:
401(k) plans
: The Company maintains domestic 401(k) plans that allow employees to choose among various investment alternatives, including (subject to restrictions) Modine stock. The Company’s matching contribution is discretionary. The Company matched 50 percent of employee contributions, up to 5 percent of employee contributions, during fiscal 2013, 2012 and 2011.
Defined contribution plan
: The Company maintains a domestic defined contribution plan that covers all eligible salaried employees and non-union hourly employees. Modine makes annual discretionary contributions based on a percentage of compensation, which is determined by management. Employees can choose among various investment alternatives, including Modine stock.
Deferred compensation plan
: The Company maintains a non-qualified deferred compensation plan for eligible employees. The plan allows qualified employees to choose among various investment alternatives.
Modine’s expense for defined contribution employee benefit plans during fiscal 2013, 2012 and 2011 was $4.1 million, $4.4 million, and $4.3 million, respectively.
In addition, various Modine foreign subsidiaries have in place government-required defined contribution plans under which Modine contributes a percentage of employee earnings into accounts, consistent with local laws.
Statutory Termination Plans:
Certain of Modine’s foreign subsidiaries have statutory termination indemnity plans covering eligible employees. The benefits under these plans are based upon years of service and final average compensation levels or a monthly retirement benefit amount. These programs are all substantially unfunded in accordance with local laws, but are often covered by national obligatory umbrella insurance programs that protect employees from losses in the event that an employer defaults on its obligations.
MODINE MANUFACTURING COMPANY
NOTES TO CONSOLIDATED FINANCIAL STATEMENTS
(In millions, except per share amounts)
Defined Benefit Employee Benefit Plans:
Pension plans:
Modine has a non-contributory defined benefit pension plan that covers most of its domestic employees hired on or before December 31, 2003. The benefits provided are based primarily on years of service and average compensation for salaried and some hourly employees. Benefits for other hourly employees are based on a monthly retirement benefit amount. Domestic salaried employees hired after December 31, 2003 are not covered under any defined benefit plan. Currently no domestic pension plans include increases in annual earnings or future service to be performed in calculating the average annual earnings and years of credited service under the pension plan formula. Certain of Modine’s foreign subsidiaries also have legacy defined benefit plans covering a small number of active employees.
Company contributions of $9.2 million, $11.5 million and $17.9 million to its U.S. pension plans during fiscal 2013, 2012 and 2011, respectively, are included in the change in other noncurrent assets and liabilities in the consolidated statements of cash flows.
In March 2011, the Company announced that effective January 1, 2012, the Non-Union Hourly Factory component of the Modine Manufacturing Company Pension Plan for Non-Union Hourly Factory and Salaried Employees was modified so that no increases in annual earnings and no service performed after December 31, 2011 will be included in the pension plan formula. Modine recorded a pension curtailment charge of $1.6 million in fiscal 2011 to reflect these modifications.
Postretirement plans
: Modine and certain of its domestic subsidiaries provide selected healthcare and life-insurance benefits for retired employees. Designated employees may become eligible for benefits when they retire. These plans are unfunded. Modine periodically amends the plans, changing the contribution rate of retirees and the amounts and forms of coverage. An annual limit on Modine’s liability was established for most plans between fiscal 1994 and fiscal 1996 after original recognition of the liability in fiscal 1993. It caps future costs at 200 percent of Modine’s then-current cost. These changes reduced the accrued obligation, and the reduction is being amortized as a component of the benefit cost.
During fiscal 2012, the Company recorded a postretirement curtailment gain of $0.3 million related to the closure of the Camdenton, Missouri manufacturing facility. During fiscal 2011, the Company recorded a postretirement curtailment gain of $2.1 million related to the closure of the Harrodsburg, Kentucky manufacturing facility.
Measurement Date:
Modine uses March 31 as the measurement date for its pension and postretirement plans.
MODINE MANUFACTURING COMPANY
NOTES TO CONSOLIDATED FINANCIAL STATEMENTS
(In millions, except per share amounts)
The change in benefit obligations and plan assets as well as the funded status of Modine's pension and postretirement plans were as follows:
|
Pensions Plans
|
Postretirement Plans
|
|||||||||||||||
|
Years ended March 31
|
2013
|
2012
|
2013
|
2012
|
||||||||||||
|
Change in benefit obligation:
|
||||||||||||||||
|
Benefit obligation at beginning of year
|
$ | 281.8 | $ | 246.0 | $ | 7.2 | $ | 6.6 | ||||||||
|
Service cost
|
0.6 | 1.4 | 0.1 | - | ||||||||||||
|
Interest cost
|
13.5 | 13.9 | 0.3 | 0.4 | ||||||||||||
|
Actuarial loss
|
27.1 | 35.6 | 0.1 | 0.5 | ||||||||||||
|
Benefits paid
|
(12.6 | ) | (13.8 | ) | (0.2 | ) | (0.5 | ) | ||||||||
|
Settlement/curtailment adjustment
|
- | - | - | 0.2 | ||||||||||||
|
Currency translation adjustment
|
(0.8 | ) | (1.3 | ) | - | - | ||||||||||
|
Benefit obligation at end of year
|
$ | 309.6 | $ | 281.8 | $ | 7.5 | $ | 7.2 | ||||||||
|
Change in plan assets:
|
||||||||||||||||
|
Fair value of plan assets at beginning of year
|
$ | 186.6 | $ | 182.1 | $ | - | $ | - | ||||||||
|
Actual return on plan assets
|
16.2 | 5.5 | - | - | ||||||||||||
|
Benefits paid
|
(12.6 | ) | (13.8 | ) | (0.2 | ) | (0.5 | ) | ||||||||
|
Employer contributions
|
10.4 | 12.8 | 0.2 | 0.5 | ||||||||||||
|
Fair value of plan assets at end of year
|
$ | 200.6 | $ | 186.6 | $ | - | $ | - | ||||||||
|
Funded status at end of year
|
$ | (109.0 | ) | $ | (95.2 | ) | $ | (7.5 | ) | $ | (7.2 | ) | ||||
|
Amounts recognized in the consolidated balance sheets
consist of:
|
||||||||||||||||
|
Current liability
|
$ | (1.0 | ) | $ | (1.1 | ) | $ | (0.8 | ) | $ | (0.8 | ) | ||||
|
Noncurrent liability
|
(108.0 | ) | (94.1 | ) | (6.7 | ) | (6.4 | ) | ||||||||
| $ | (109.0 | ) | $ | (95.2 | ) | $ | (7.5 | ) | $ | (7.2 | ) | |||||
|
Amounts recognized in accumulated other comprehensive loss consist of:
|
||||||||||||||||
|
Net actuarial loss (gain)
|
$ | 176.4 | $ | 154.4 | $ | (0.3 | ) | $ | (0.4 | ) | ||||||
|
Prior service credit
|
- | - | (1.5 | ) | (3.0 | ) | ||||||||||
| $ | 176.4 | $ | 154.4 | $ | (1.8 | ) | $ | (3.4 | ) | |||||||
The accumulated benefit obligation for all defined benefit pension plans was $307.2 million and $280.3 million as of March 31, 2013 and 2012, respectively.
Pension plans with accumulated benefit obligations in excess of plan assets consist of the following:
|
March 31
|
2013
|
2012
|
||||||
|
Projected benefit obligation
|
$ | 309.6 | $ | 281.8 | ||||
|
Accumulated benefit obligation
|
307.2 | 280.3 | ||||||
|
Fair value of the plan assets
|
200.6 | 186.6 | ||||||
Costs for Modine’s pension and postretirement benefit plans include the following components:
MODINE MANUFACTURING COMPANY
NOTES TO CONSOLIDATED FINANCIAL STATEMENTS
(In millions, except per share amounts)
|
Pension Plans
|
Postretirement Plans
|
|||||||||||||||||||||||
|
Years ended March 31
|
2013
|
2012
|
2011
|
2013
|
2012
|
2011
|
||||||||||||||||||
|
Components of net periodic benefit costs:
|
||||||||||||||||||||||||
|
Service cost
|
$ | 0.6 | $ | 1.4 | $ | 1.9 | $ | 0.1 | $ | - | $ | - | ||||||||||||
|
Interest cost
|
13.5 | 13.9 | 13.7 | 0.3 | 0.4 | 0.4 | ||||||||||||||||||
|
Expected return on plan assets
|
(16.1 | ) | (15.7 | ) | (15.2 | ) | - | - | - | |||||||||||||||
|
Amortization of:
|
||||||||||||||||||||||||
|
Unrecognized net loss (gain)
|
5.0 | 7.0 | 7.7 | - | - | (0.1 | ) | |||||||||||||||||
|
Unrecognized prior service cost (credit)
|
- | - | 0.4 | (1.5 | ) | (1.7 | ) | (1.8 | ) | |||||||||||||||
|
Adjustment for settlement/curtailment
|
- | - | 1.6 | - | (0.3 | ) | (2.1 | ) | ||||||||||||||||
|
Net periodic benefit cost (income)
|
$ | 3.0 | $ | 6.6 | $ | 10.1 | $ | (1.1 | ) | $ | (1.6 | ) | $ | (3.6 | ) | |||||||||
|
Other changes in plan assets and benefit obligation
recognized in other comprehensive loss (income):
|
||||||||||||||||||||||||
|
Net actuarial loss (gain)
|
$ | 27.0 | $ | 45.7 | $ | (3.7 | ) | $ | - | $ | 0.7 | $ | (2.2 | ) | ||||||||||
|
Prior service (credits) costs
|
- | - | (1.6 | ) | - | 0.3 | 2.3 | |||||||||||||||||
|
Reversal of amortization items:
|
||||||||||||||||||||||||
|
Net actuarial (gain) loss
|
(5.0 | ) | (7.0 | ) | (7.7 | ) | 0.1 | - | 0.1 | |||||||||||||||
|
Prior service (credit) costs
|
- | - | (0.4 | ) | 1.5 | 1.7 | 1.8 | |||||||||||||||||
|
Total recognized in other comprehensive loss (income)
|
$ | 22.0 | $ | 38.7 | $ | (13.4 | ) | $ | 1.6 | $ | 2.7 | $ | 2.0 | |||||||||||
|
Total recognized in net periodic benefit costs and
other comprehensive income
|
$ | 25.0 | $ | 45.3 | $ | (3.3 | ) | $ | 0.5 | $ | 1.1 | $ | (1.6 | ) | ||||||||||
The estimated net actuarial loss for the pension plans that is expected to be amortized from accumulated other comprehensive loss into net periodic benefit cost during fiscal 2014 is $6.3 million. The estimated prior service credit for the postretirement plans that is expected to be amortized from accumulated other comprehensive loss into net periodic benefit income during fiscal 2014 is $1.2 million.
The weighted average assumptions used to determine Modine’s benefit obligation under the plans were as follows:
|
Years ended March 31
|
2013
|
2012
|
||||||||||||||
|
U.S. Plans
|
Foreign Plans
|
U.S. Plans
|
Foreign Plans
|
|||||||||||||
|
Pension plans:
|
||||||||||||||||
|
Discount rate
|
4.4 | % | 3.5 | % | 4.9 | % | 5.0 | % | ||||||||
|
Postretirement plans:
|
||||||||||||||||
|
Discount rate
|
3.7 | % | N/A | 4.4 | % | N/A | ||||||||||
The weighted average assumptions used to determine Modine's costs under the plans were as follows:
|
Years ended March 31
|
2013
|
2012
|
2011
|
|||||||||||||||||||||
|
U.S. Plans
|
Foreign Plans
|
U.S. Plans
|
Foreign Plans
|
U.S. Plans
|
Foreign Plans
|
|||||||||||||||||||
|
Pension plans:
|
||||||||||||||||||||||||
|
Discount rate
|
4.9 | % | 5.0 | % | 5.8 | % | 5.8 | % | 5.9 | % | 5.0 | % | ||||||||||||
|
Expected return on plan assets
|
8.0 | % | N/A | 8.0 | % | N/A | 8.1 | % | N/A | |||||||||||||||
|
Postretirement plans:
|
||||||||||||||||||||||||
|
Discount rate
|
4.4 | % | N/A | 5.4 | % | N/A | 5.4 | % | N/A | |||||||||||||||
The discount rates used to determine the present value of the Company’s future U.S. pension obligations as of the measurement date use a methodology that equates the plans’ projected benefit obligations to a present value, calculated using a yield curve. The yield curve was constructed from a portfolio of high quality, non-callable corporate debt securities with maturities ranging from six months to thirty years. The discount rate was determined by matching the pension plans’ expected cash flows with spot rates developed from the yield curve. The discount rate used to determine the present value of the Company’s future foreign pension obligations as of the measurement date is based upon the yield for zero coupon bonds plus a yield margin measured as the difference between euro denominated corporate bonds (AA or higher) in Europe and government bonds.
Plan assets in the U.S. defined benefit plans comprise 100 percent of the Company’s world-wide benefit plan assets. Modine's U.S. pension plan weighted average asset allocations at the measurement dates of March 31, 2013 and 2012 by category, and the target allocations are summarized below:
|
Target allocation
|
Plan assets
|
|||||||||||||||
|
2013
|
2012
|
2013
|
2012
|
|||||||||||||
|
Equity securities
|
55 | % | 55 | % | 57 | % | 56 | % | ||||||||
|
Debt securities
|
38 | % | 38 | % | 37 | % | 37 | % | ||||||||
|
Alternative assets
|
5 | % | 5 | % | 5 | % | 5 | % | ||||||||
|
Cash
|
2 | % | 2 | % | 1 | % | 2 | % | ||||||||
| 100 | % | 100 | % | 100 | % | 100 | % | |||||||||
Due to market conditions and other factors including timing of benefit payments, actual asset allocation may vary from the target allocation outlined above. The assets are periodically rebalanced to the target allocations. There were no shares of Modine common stock included in the plan assets at the end of fiscal 2013 and 2012.
Modine employs a total return investment approach, whereby a mix of equities and fixed-income investments are used to maximize the long-term return of plan assets while avoiding excessive risk. Pension plan guidelines have been established based upon an evaluation of market conditions, tolerance for risk and cash requirements for benefit payments. Investment risk is measured and monitored on an ongoing basis through quarterly investment portfolio reviews, annual liability measurements and periodic asset/liability studies.
The expected rate of return on U.S. plan assets is based upon historical return experience and forward-looking return expectations for major asset class categories. For fiscal 2013, Modine assumed a rate of return of 8.0 percent for purposes of determining the U.S. pension plan expense. For fiscal year 2014 U.S. pension plan expense, Modine has assumed a rate of 8.0 percent, net of administrative expenses.
MODINE MANUFACTURING COMPANY
NOTES TO CONSOLIDATED FINANCIAL STATEMENTS
(In millions, except per share amounts)
With respect to the postretirement plans, for measurement purposes, the assumed healthcare cost trend rates were as follows:
|
Years ended March 31
|
2013
|
2012
|
||||||
|
Healthcare costs trend rate assumed for next year (pre-65)
|
7.5 | % | 7.5 | % | ||||
|
Healthcare costs trend rate assumed for next year (post-65)
|
7.5 | % | 7.5 | % | ||||
|
Ultimate trend rate
|
5.0 | % | 5.0 | % | ||||
|
Year the rate reaches the ultimate trend rate
|
2019 | 2017 | ||||||
Assumed healthcare cost trend rates affect the amounts reported for the postretirement plans. One percentage point change would have a less than $0.1 million effect on the total service and interest cost. While one percentage point increase or decrease would have a $0.2 million and ($0.2) million effect, respectively, on the postretirement benefit obligation.
The Company’s funding policy for domestic qualified pension plans is to contribute annually, at a minimum, the amount necessary on an actuarial basis to provide for benefits in accordance with applicable laws and regulations. Modine anticipates that it will make contributions of $8.0 million to these plans during fiscal 2014.
Estimated pension benefit payments for the next ten fiscal years are as follows:
|
Years ended March 31
|
||||
|
Pension
|
||||
|
2014
|
$ | 14.5 | ||
|
2015
|
15.1 | |||
|
2016
|
15.5 | |||
|
2017
|
16.2 | |||
|
2018
|
17.5 | |||
|
2019-2023
|
92.5 | |||
|
Note 17:
|
Derivative Instruments
|
Modine uses derivative financial instruments from time to time as a tool to manage certain financial risks. Leveraged derivatives are prohibited by Company policy. Accounting for derivatives and hedging activities requires derivative financial instruments to be measured at fair value and recognized as assets or liabilities in the consolidated balance sheets. Accounting for the gain or loss resulting from the change in the fair value of the derivative financial instruments depends on whether it has been designated, and is effective, as a hedge and, if so, on the nature of the hedging activity.
Commodity Derivatives:
The Company has, from time to time, entered into futures contracts related to certain forecasted purchases of aluminum and copper. The Company’s strategy in entering into these contracts was to reduce its exposure to changing market prices for future purchases of these commodities. Until the fourth quarter of fiscal 2012, these contracts were designated as cash flow hedges by the Company. Accordingly, unrealized gains and losses on these contracts were deferred as a component of accumulated other comprehensive (loss) income (“AOCI”), and recognized as a component of earnings at the same time that the underlying purchases of aluminum and copper impacted earnings. During the fourth quarter of fiscal 2012, the contracts used for aluminum and copper hedging became ineffective and the Company began recording the unrealized gains and losses within cost of sales. The amounts recorded in AOCI will remain there until the underlying purchases of aluminum and copper impact earnings. The Company did not enter into any futures contracts during the second, third, or fourth quarter of fiscal 2013.
Foreign exchange contracts:
The Company’s foreign exchange risk management strategy uses derivative financial instruments in a limited way to mitigate foreign currency exchange risk. The Company periodically enters into foreign currency exchange contracts to hedge specific foreign currency-denominated assets and liabilities. The Company has not designated these contracts for hedge accounting. Accordingly, unrealized gains and losses related to the change in fair value are recorded in other income and expense. Gains and losses on these foreign currency contracts are offset by foreign currency gains and losses associated with the related assets and liabilities.
Interest rate derivative:
In fiscal 2007, the Company entered into forward starting swaps related to a private placement debt offering. When the fixed interest rate of the private placement borrowing was locked, the Company terminated and settled the forward starting swaps at a loss. These interest rate derivatives were treated as cash flow hedges of forecasted transactions. Accordingly, the loss was reflected as a component of AOCI and was being amortized to interest expense over the life of the borrowings. In conjunction with the repayment of the then existing senior notes in fiscal 2011, the remaining unamortized balance for these interest rate derivatives of $1.6 million was reflected as a component of interest expense.
MODINE MANUFACTURING COMPANY
NOTES TO CONSOLIDATED FINANCIAL STATEMENTS
(In millions, except per share amounts)
The fair values of the Company’s derivative financial instruments recorded in the consolidated balance sheets were as follows:
|
Balance Sheet Location
|
March 31, 2013
|
March 31, 2012
|
|||||||
|
Derivative instruments designated
as cash flow hedges:
|
|||||||||
|
Commodity derivatives
|
Other current assets
|
$ | - | $ | 0.2 | ||||
|
Commodity derivatives
|
Other current liabilities
|
- | 0.9 | ||||||
|
Derivative instruments not designated
as hedges:
|
|||||||||
|
Foreign exchange contracts
|
Other current assets
|
$ | - | $ | 0.2 | ||||
|
Foreign exchange contracts
|
Other current liabilities
|
0.1 | - | ||||||
|
Commodity derivatives
|
Other current liabilities
|
1.2 | 2.6 | ||||||
|
Commodity derivatives
|
Other noncurrent liabilities
|
0.1 | - | ||||||
The amounts recorded in AOCI and in the consolidated statements of operations for all of the Company’s derivative financial instruments were as follows:
|
March 31, 2013
|
|||||||||||||
|
Amount of Loss Recognized in AOCI
|
Statement of Operations Location
|
Loss Reclassified from AOCI into Continuing Operations
|
Total Loss (Gain) Recognized in Continuing Operations
|
||||||||||
|
Commodity derivatives
|
$ | 0.5 |
Cost of sales
|
$ | 2.6 | $ | 4.6 | ||||||
|
Foreign exchange contracts
|
- |
Other expense - net
|
- | (0.3 | ) | ||||||||
|
Total
|
$ | 0.5 | $ | 2.6 | $ | 4.3 | |||||||
|
March 31, 2012
|
|||||||||||||
|
Amount of Loss Recognized in AOCI
|
Statement of Operations Location
|
Loss Reclassified from AOCI into Continuing Operations
|
Total Loss Recognized in Continuing Operations
|
||||||||||
|
Commodity derivatives
|
$ | 3.1 |
Cost of sales
|
$ | 3.1 | $ | 3.0 | ||||||
|
Foreign exchange contracts
|
- |
Other expense - net
|
- | 0.4 | |||||||||
|
Total
|
$ | 3.1 | $ | 3.1 | $ | 3.4 | |||||||
|
March 31, 2011
|
|||||||||||||
|
Amount of Gain Recognized in AOCI
|
Statement of Operations Location
|
Loss Reclassified from AOCI into Continuing Operations
|
Total Loss Recognized in Continuing Operations
|
||||||||||
|
Commodity derivatives
|
$ | (0.3 | ) |
Cost of sales
|
$ | - | $ | - | |||||
|
Interest rate derivative
|
- |
Interest expense
|
1.8 | 1.8 | |||||||||
|
Total
|
$ | (0.3 | ) | $ | 1.8 | $ | 1.8 | ||||||
Approximately $0.4 million of loss recognized in AOCI is expected to be reclassified from AOCI to cost of sales during fiscal 2014.
|
Note 18:
|
Contingencies and Litigation
|
Market risk:
The Company sells a broad range of products that provide thermal solutions to customers operating primarily in the commercial vehicle, off-highway, automotive and commercial heating and air conditioning markets. The Company operates in diversified markets as a strategy for offsetting the risk associated with a downturn in any one or more of the markets it serves. The Company pursues new market opportunities after careful consideration of the potential associated risks and benefits. However, the risk associated with market downturns, such as the downturn experienced in fiscal 2009 and 2010, is still present.
MODINE MANUFACTURING COMPANY
NOTES TO CONSOLIDATED FINANCIAL STATEMENTS
(In millions, except per share amounts)
Credit risk:
The Company invests excess cash primarily in investment quality, short-term liquid debt instruments. Financial instruments that potentially subject the Company to significant concentrations of credit risk consist principally of accounts receivable. The Company sells a broad range of products that provide thermal solutions to customers operating throughout the world. In fiscal 2013 and 2011, one customer accounted for ten percent or more of the total Company sales, while in fiscal 2012, no customer accounted for ten percent or more of total Company sales. Sales to the Company’s top ten customers were 59 percent, 61 percent and 58 percent of total sales in fiscal 2013, 2012 and 2011, respectively. At March 31, 2013 and 2012, 51 percent and 54 percent, respectively, of the Company's trade accounts receivable were from the Company's top ten individual customers. These customers operate primarily in the automotive, truck and heavy equipment markets and are influenced by similar market and general economic factors. Collateral or advanced payments are generally not required, but they may be used in those cases where a substantial credit risk is identified. Credit losses to customers operating in the markets served by the Company have not been significant.
The Company manages credit risk through its focus on the following:
|
|
·
|
Cash and investments – reviewing cash deposits and short-term investments to ensure banks have credit ratings acceptable to the Company and that short-term investments are maintained in secured or guaranteed instruments;
|
|
|
·
|
Accounts receivable – performing periodic customer credit evaluations and actively monitoring their financial condition and applicable business news;
|
|
|
·
|
Pension assets – ensuring that investments within these plans provide appropriate diversification, monitoring of investment teams, ensuring that portfolio managers are adhering to the Company’s investment policies and directives, and ensuring that exposure to high risk investments is limited; and
|
|
|
·
|
Insurance – ensuring that insurance providers maintain financial ratings that are acceptable to the Company.
|
Counterparty risks:
The Company manages counterparty risks through its focus on the following:
|
|
·
|
Customers – performing thorough reviews of customer credit reports and accounts receivable aging reports by internal credit committees;
|
|
|
·
|
Suppliers – maintaining a supplier risk management program and utilizing industry sources to identify and mitigate high risk situations; and
|
|
|
·
|
Derivatives – ensuring that counterparties to derivative instruments maintain credit ratings that are acceptable to the Company.
|
Europe value added tax:
During fiscal 2012, the Company determined that it was not properly applying value added tax (“VAT”) to various cross border transactions within the Europe segment. During the fourth quarter of fiscal 2012, the Company recorded a charge within SG&A expenses to establish a liability of $10.7 million for estimated unpaid VAT, including interest and penalties, which may be levied against the Company by taxing authorities. During fiscal 2013, the Company completed the registration and filing process with several taxing authorities and began making payments to the applicable jurisdictions. In addition, SG&A expenses in fiscal 2013 included a $1.6 million reduction as a result of changes to the estimated VAT obligation. The Company’s accrual for estimated VAT exposures, including interest and penalties, was $4.4 million at March 31, 2013.
Trade Compliance:
During fiscal 2011, the Company determined that it was not in compliance with certain trade regulations related to import and export activity between its warehouse in Laredo, Texas and its plant in Nuevo Laredo, Mexico. As part of the investigation process, the Company disclosed these trade compliance issues to certain government agencies and has fully cooperated with these agencies. At March 31, 2011, the Company had an estimated liability for the trade regulation issues of $4.5 million, which consisted of an estimate for unpaid duties, potential interest and penalties. During fiscal 2012, the Company made a voluntary payment of $2.1 million to one government agency and a second government agency closed the matter with no payment required, resulting in the Company’s reduction of the liability by $2.3 million within SG&A expenses.
Environmental:
The United States Environmental Protection Agency (“USEPA”) has designated the Company as a potentially responsible party (“PRP”) for remediation of three sites where the Company had involvement. These sites include: Auburn Incinerator, Inc./Lake Calumet Cluster (Illinois), Cam-Or (Indiana) and a scrap metal site known as Chemetco (Illinois). In addition, Modine is voluntarily participating in the care of an inactive landfill owned by the City of Trenton (Missouri). These sites are not Company-owned and allegedly contain materials attributable to Modine from past operations. The percentage of material allegedly attributable to Modine is relatively low. Remediation of these sites is in various stages of administrative or judicial proceedings and includes recovery of past governmental costs and the costs of future investigations and remedial actions. The Company accrues for costs anticipated for the remedial settlement of the sites listed above if they are probable and can be reasonably determined. Costs anticipated for the remedial settlement of the sites listed above that are not probable or cannot be reasonably determined at this time have not been accrued; however, the Company does not believe any potential costs would be material to the Company’s financial position due to Modine’s relatively small portion of contributed materials.
MODINE MANUFACTURING COMPANY
NOTES TO CONSOLIDATED FINANCIAL STATEMENTS
(In millions, except per share amounts)
The Company has recorded environmental investigation and remediation accruals for groundwater contamination at its manufacturing facility in Brazil and subsurface contamination at its former manufacturing facility in The Netherlands, along with other lesser environmental issues at certain facilities located in the United States. These accruals generally relate to facilities where past operations followed practices and procedures that were considered acceptable under then-existing regulations, or where the Company is a successor to the obligations of prior owners and current laws and regulations require investigative and/or remedial work to ensure sufficient environmental compliance. The accruals for these environmental matters totaled $5.2 million and $6.9 million at March 31, 2013 and 2012, respectively. During fiscal 2012, additional reserves of $1.0 million were recorded as a component of continuing operations and reductions to the reserves of $0.5 million were recorded as a component of discontinued operations. During fiscal 2011, the Company recorded charges of $4.9 million of which $2.9 million were recorded as a component of loss from discontinued operations. As additional information becomes available, any potential liability related to these matters will be assessed and the estimated accrual will be revised, if necessary. Based on currently available information, Modine believes that the ultimate outcome of these matters, individually and in the aggregate, will not have a material adverse effect on its financial position or overall trends in results of operations. However, these matters are subject to inherent uncertainties, and unfavorable outcomes could occur, including significant monetary damages. During fiscal 2011, one of the adjacent businesses to the Company’s operation in Brazil filed suit against Modine’s Brazilian subsidiary seeking remediation and certain other damages as a result of the contamination. The Company is defending this suit and believes that the ultimate outcome of this matter will not be material.
Other litigation:
In the normal course of business, the Company and its subsidiaries are named as defendants in various other lawsuits and enforcement proceedings by private parties, governmental agencies and/or others in which claims are asserted against Modine. In the opinion of management, the liabilities, if any, which may ultimately result from such lawsuits are not expected to have a material adverse effect on the Company’s consolidated financial statements.
|
Note 19:
|
Common and Treasury Stock
|
Following is a summary of common and treasury stock activity:
|
Common stock
|
Treasury stock at cost
|
|||||||||||||||
|
Shares
|
Amount
|
Shares
|
Amount
|
|||||||||||||
|
Balance, March 31, 2010
|
46.8 | $ | 29.2 | (0.6 | ) | $ | (13.9 | ) | ||||||||
|
Purchase of treasury stock
|
- | - | - | (0.1 | ) | |||||||||||
|
Stock options and awards
|
0.3 | 0.2 | - | - | ||||||||||||
|
Balance, March 31, 2011
|
47.1 | 29.4 | (0.6 | ) | (14.0 | ) | ||||||||||
|
Purchase of treasury stock
|
- | - | - | (0.5 | ) | |||||||||||
|
Stock options and awards
|
0.3 | 0.2 | - | - | ||||||||||||
|
Balance, March 31, 2012
|
47.4 | 29.6 | (0.6 | ) | (14.5 | ) | ||||||||||
|
Purchase of treasury stock
|
- | - | - | (0.1 | ) | |||||||||||
|
Stock options and awards
|
0.4 | 0.3 | - | - | ||||||||||||
|
Balance, March 31, 2013
|
47.8 | $ | 29.9 | (0.6 | ) | $ | (14.6 | ) | ||||||||
During fiscal 2013, 2012 and 2011, the Company repurchased shares of stock for a cost of $0.1 million, $0.5 million and $0.1 million, respectively. Pursuant to its equity compensation plans, the Company gave participants the opportunity to deliver back to the Company the number of shares from the vesting of stock awards sufficient to satisfy the individual’s minimum tax withholding obligations. These shares are held as treasury shares.
MODINE MANUFACTURING COMPANY
NOTES TO CONSOLIDATED FINANCIAL STATEMENTS
(In millions, except per share amounts)
|
Note 20:
|
Accumulated Other Comprehensive Loss
|
The components of accumulated other comprehensive loss were as follows:
|
March 31
|
2013
|
2012
|
||||||
|
Foreign currency translation adjustments
|
$ | 17.8 | $ | 34.9 | ||||
|
Net loss on derivative instruments designated as cash flow
hedges, net of income taxes
|
(1.1 | ) | (3.7 | ) | ||||
|
Defined benefit plans, net of income taxes
|
(145.1 | ) | (121.5 | ) | ||||
|
Accumulated other comprehensive loss
|
$ | (128.4 | ) | $ | (90.3 | ) | ||
|
Note 21:
|
Segment and Geographic Information
|
Modine’s product lines consist of heat-transfer components and systems. Modine serves the vehicular, industrial, and building heating, ventilating and air conditioning original equipment markets. The Company has five operating segments as follows:
North America:
Comprised of vehicular and industrial original equipment products in North America.
Europe:
Comprised of vehicular and industrial original equipment products in Europe.
South America:
Comprised of vehicular and industrial original equipment products and aftermarket products in South America.
Asia:
Comprised of vehicular and industrial original equipment products in Asia.
Commercial Products:
Comprised of building heating, ventilating and air conditioning products throughout the world.
Each operating segment is managed by a vice president or managing director and has separate financial results reviewed by the Company’s chief operating decision makers. These results are used by management in evaluating the performance of each segment and in making decisions on the allocation of resources among the Company’s various businesses.
The following is a summary of net sales, gross profit and operating (loss) income by segment:
|
Years ended March 31
|
2013
|
2012
|
2011
|
|||||||||
|
Net sales:
|
||||||||||||
|
North America
|
$ | 564.5 | $ | 602.0 | $ | 573.2 | ||||||
|
Europe
|
498.0 | 602.8 | 546.7 | |||||||||
|
South America
|
133.8 | 175.6 | 158.9 | |||||||||
|
Asia
|
59.5 | 84.1 | 63.9 | |||||||||
|
Commercial Products
|
139.3 | 142.2 | 126.3 | |||||||||
|
Segment total
|
1,395.1 | 1,606.7 | 1,469.0 | |||||||||
|
Corporate and eliminations
|
(19.1 | ) | (29.5 | ) | (20.8 | ) | ||||||
|
Net sales
|
$ | 1,376.0 | $ | 1,577.2 | $ | 1,448.2 | ||||||
MODINE MANUFACTURING COMPANY
NOTES TO CONSOLIDATED FINANCIAL STATEMENTS
(In millions, except per share amounts)
|
Years ended March 31
|
2013
|
2012
|
2011
|
|||||||||||||||||||||
|
Gross profit:
|
% of sales
|
% of sales
|
% of sales
|
|||||||||||||||||||||
|
North America
|
$ | 81.4 | 14.4 | % | $ | 89.7 | 14.9 | % | $ | 79.3 | 13.8 | % | ||||||||||||
|
Europe
|
61.0 | 12.3 | % | 85.1 | 14.1 | % | 75.7 | 13.8 | % | |||||||||||||||
|
South America
|
22.5 | 16.8 | % | 30.9 | 17.6 | % | 31.2 | 19.7 | % | |||||||||||||||
|
Asia
|
1.7 | 2.8 | % | 7.9 | 9.4 | % | 5.2 | 8.2 | % | |||||||||||||||
|
Commercial Products
|
40.8 | 29.3 | % | 42.5 | 29.9 | % | 39.3 | 31.1 | % | |||||||||||||||
|
Segment total
|
207.4 | 14.9 | % | 256.1 | 15.9 | % | 230.7 | 15.7 | % | |||||||||||||||
|
Corporate and eliminations
|
1.2 | - | 0.5 | - | 1.6 | - | ||||||||||||||||||
|
Gross profit
|
$ | 208.6 | 15.2 | % | $ | 256.6 | 16.3 | % | $ | 232.3 | 16.0 | % | ||||||||||||
|
Years ended March 31
|
2013
|
2012
|
2011
|
|||||||||
|
Operating (loss) income:
|
||||||||||||
|
North America
|
$ | 39.2 | $ | 47.9 | $ | 31.8 | ||||||
|
Europe
|
(16.1 | ) | 37.3 | 28.3 | ||||||||
|
South America
|
11.2 | 10.4 | 13.0 | |||||||||
|
Asia
|
(8.8 | ) | (2.5 | ) | (3.1 | ) | ||||||
|
Commercial Products
|
10.0 | 14.3 | 12.8 | |||||||||
|
Segment total
|
35.5 | 107.4 | 82.8 | |||||||||
|
Corporate and eliminations
|
(36.1 | ) | (39.9 | ) | (39.9 | ) | ||||||
|
Operating (loss) income
|
$ | (0.6 | ) | $ | 67.5 | $ | 42.9 | |||||
Inter-segment sales are accounted for based on an established markup over production costs. Net sales for corporate and eliminations primarily represent the elimination of inter-segment sales. Operating loss for corporate includes certain research and development costs, legal, finance and other general corporate expenses, and also includes a percentage of central services costs not directly attributable to an operating segment.
Following is a summary of assets by segment:
|
March 31
|
2013
|
2012
|
||||||
|
Total assets:
|
||||||||
|
North America
|
$ | 218.3 | $ | 232.9 | ||||
|
Europe
|
332.2 | 370.8 | ||||||
|
South America
|
91.8 | 96.6 | ||||||
|
Asia
|
91.3 | 102.6 | ||||||
|
Commercial Products
|
73.7 | 68.9 | ||||||
|
Corporate and eliminations
|
11.5 | 21.7 | ||||||
|
Total assets
|
$ | 818.8 | $ | 893.5 | ||||
MODINE MANUFACTURING COMPANY
NOTES TO CONSOLIDATED FINANCIAL STATEMENTS
(In millions, except per share amounts)
Following is a summary of capital expenditures and depreciation and amortization expense by segment:
|
Years ended March 31
|
2013
|
2012
|
2011
|
|||||||||
|
Capital expenditures:
|
||||||||||||
|
North America
|
$ | 19.0 | $ | 15.4 | $ | 12.9 | ||||||
|
Europe
|
16.5 | 29.8 | 25.0 | |||||||||
|
South America
|
3.4 | 5.2 | 4.1 | |||||||||
|
Asia
|
7.8 | 12.5 | 10.8 | |||||||||
|
Commercial Products
|
3.1 | 1.7 | 2.3 | |||||||||
|
Corporate and eliminations
|
- | (0.2 | ) | - | ||||||||
|
Total capital expenditures
|
$ | 49.8 | $ | 64.4 | $ | 55.1 | ||||||
|
Years ended March 31
|
2013
|
2012
|
2011
|
|||||||||
|
Depreciation and amortization expense:
|
||||||||||||
|
North America
|
$ | 20.1 | $ | 20.0 | $ | 21.7 | ||||||
|
Europe
|
23.4 | 26.5 | 25.5 | |||||||||
|
South America
|
3.7 | 4.1 | 4.0 | |||||||||
|
Asia
|
6.4 | 5.0 | 3.1 | |||||||||
|
Commercial Products
|
2.2 | 2.1 | 2.2 | |||||||||
|
Total depreciation and amortization expense
|
$ | 55.8 | $ | 57.7 | $ | 56.5 | ||||||
Following is a summary of net sales by geographical area, based on the location of the selling unit:
|
Years ended March 31
|
2013
|
2012
|
2011
|
|||||||||
|
Net sales by country:
|
||||||||||||
|
United States
|
$ | 637.4 | $ | 666.2 | $ | 632.3 | ||||||
|
Germany
|
214.8 | 285.9 | 280.3 | |||||||||
|
Brazil
|
128.8 | 169.1 | 156.6 | |||||||||
|
Other
|
395.0 | 456.0 | 379.0 | |||||||||
|
Net sales
|
$ | 1,376.0 | $ | 1,577.2 | $ | 1,448.2 | ||||||
Following is a summary of long-lived assets, excluding goodwill and intangible assets, by geographical area:
|
March 31
|
2013
|
2012
|
||||||
|
Long-lived assets:
|
||||||||
|
United States
|
$ | 115.1 | $ | 114.7 | ||||
|
Germany
|
94.3 | 127.4 | ||||||
|
Other
|
173.4 | 188.2 | ||||||
|
Long-lived assets
|
$ | 382.8 | $ | 430.3 | ||||
MODINE MANUFACTURING COMPANY
NOTES TO CONSOLIDATED FINANCIAL STATEMENTS
(In millions, except per share amounts)
Following is a summary of net sales by product type:
|
Years ended March 31
|
2013
|
2012
|
2011
|
|||||||||
|
Modules/packages
|
$ | 358.5 | $ | 410.4 | $ | 406.9 | ||||||
|
Oil coolers
|
194.1 | 249.4 | 232.4 | |||||||||
|
Charge-air coolers
|
161.8 | 173.9 | 140.2 | |||||||||
|
Building HVAC
|
151.8 | 153.3 | 143.1 | |||||||||
|
EGR coolers
|
136.1 | 152.7 | 130.9 | |||||||||
|
Radiators
|
134.4 | 191.4 | 187.9 | |||||||||
|
Condensers
|
128.8 | 101.5 | 63.0 | |||||||||
|
Other
|
110.5 | 144.6 | 143.8 | |||||||||
|
Net sales
|
$ | 1,376.0 | $ | 1,577.2 | $ | 1,448.2 | ||||||
|
Note 22:
|
Quarterly Financial Data (Unaudited)
|
Quarterly financial data is summarized below for the years ended March 31, 2013 and 2012:
|
Fiscal 2013 quarters ended
|
June
|
Sept.
|
Dec.
|
March
|
||||||||||||
|
Net sales
|
$ | 350.4 | $ | 339.9 | $ | 326.1 | $ | 359.6 | ||||||||
|
Gross profit
|
51.7 | 52.6 | 48.2 | 56.1 | ||||||||||||
|
Loss from continuing operations
|
(1.0 | ) | (11.8 | ) | (8.4 | ) | (1.6 | ) | ||||||||
|
Net loss attributable to Modine
|
(1.2 | ) | (12.2 | ) | (8.7 | ) | (2.1 | ) | ||||||||
|
Loss per share from continuing operations:
|
||||||||||||||||
|
Basic
|
$ | (0.03 | ) | $ | (0.26 | ) | $ | (0.19 | ) | $ | (0.04 | ) | ||||
|
Diluted
|
(0.03 | ) | (0.26 | ) | (0.19 | ) | (0.04 | ) | ||||||||
|
Net loss per share attributable to Modine shareholders:
|
||||||||||||||||
|
Basic
|
$ | (0.03 | ) | $ | (0.26 | ) | $ | (0.19 | ) | $ | (0.04 | ) | ||||
|
Diluted
|
(0.03 | ) | (0.26 | ) | (0.19 | ) | (0.04 | ) | ||||||||
|
Fiscal 2012 quarters ended
|
June
|
Sept.
|
Dec.
|
March
|
||||||||||||
|
Net sales
|
$ | 417.9 | $ | 397.2 | $ | 373.3 | $ | 388.8 | ||||||||
|
Gross profit
|
69.8 | 62.4 | 60.1 | 64.3 | ||||||||||||
|
Earnings from continuing operations
|
12.6 | 0.9 | 8.8 | 15.7 | ||||||||||||
|
Net earnings attributable to Modine
|
12.6 | 1.3 | 9.0 | 15.6 | ||||||||||||
|
Earnings per share from continuing operations:
|
||||||||||||||||
|
Basic
|
$ | 0.27 | $ | 0.02 | $ | 0.18 | $ | 0.33 | ||||||||
|
Diluted
|
0.27 | 0.02 | 0.18 | 0.33 | ||||||||||||
|
Net earnings per share attributable to Modine shareholders:
|
||||||||||||||||
|
Basic
|
$ | 0.27 | $ | 0.03 | $ | 0.19 | $ | 0.33 | ||||||||
|
Diluted
|
0.27 | 0.03 | 0.19 | 0.33 | ||||||||||||
Report of Independent Registered Public Accounting Firm
To the Shareholders and Board of Directors of Modine Manufacturing Company:
In our opinion, the accompanying consolidated financial statements listed in the index appearing under Item 15(a)(1), present fairly, in all material respects, the financial position of Modine Manufacturing Company and its subsidiaries at March 31, 2013 and 2012, and the results of their operations and their cash flows for each of the three years in the period ended March 31, 2013 in conformity with accounting principles generally accepted in the United States of America. In addition, in our opinion, the financial statement schedule listed in the index appearing under Item 15(a)(2) presents fairly, in all material respects, the information set forth therein when read in conjunction with the related consolidated financial statements. Also, in our opinion, the Company maintained, in all material respects, effective internal control over financial reporting as of March 31, 2013, based on criteria established in
Internal Control - Integrated Framework
issued by the Committee of Sponsoring Organizations of the Treadway Commission (COSO). The Company's management is responsible for these financial statements and financial statement schedule, for maintaining effective internal control over financial reporting and for its assessment of the effectiveness of internal control over financial reporting, included in Management’s Report on Internal Control over Financial Reporting appearing under Item 9A. Our responsibility is to express opinions on these financial statements, on the financial statement schedule, and on the Company's internal control over financial reporting based on our integrated audits. We conducted our audits in accordance with the standards of the Public Company Accounting Oversight Board (United States). Those standards require that we plan and perform the audits to obtain reasonable assurance about whether the financial statements are free of material misstatement and whether effective internal control over financial reporting was maintained in all material respects. Our audits of the financial statements included examining, on a test basis, evidence supporting the amounts and disclosures in the financial statements, assessing the accounting principles used and significant estimates made by management, and evaluating the overall financial statement presentation. Our audit of internal control over financial reporting included obtaining an understanding of internal control over financial reporting, assessing the risk that a material weakness exists, and testing and evaluating the design and operating effectiveness of internal control based on the assessed risk. Our audits also included performing such other procedures as we considered necessary in the circumstances. We believe that our audits provide a reasonable basis for our opinions.
A company’s internal control over financial reporting is a process designed to provide reasonable assurance regarding the reliability of financial reporting and the preparation of financial statements for external purposes in accordance with generally accepted accounting principles. A company’s internal control over financial reporting includes those policies and procedures that (i)pertain to the maintenance of records that, in reasonable detail, accurately and fairly reflect the transactions and dispositions of the assets of the company; (ii)provide reasonable assurance that transactions are recorded as necessary to permit preparation of financial statements in accordance with generally accepted accounting principles, and that receipts and expenditures of the company are being made only in accordance with authorizations of management and directors of the company; and (iii)provide reasonable assurance regarding prevention or timely detection of unauthorized acquisition, use, or disposition of the company’s assets that could have a material effect on the financial statements.
Because of its inherent limitations, internal control over financial reporting may not prevent or detect misstatements. Also, projections of any evaluation of effectiveness to future periods are subject to the risk that controls may become inadequate because of changes in conditions, or that the degree of compliance with the policies or procedures may deteriorate.
|
/s/ PricewaterhouseCoopers LLP
|
|
PricewaterhouseCoopers LLP
|
|
Milwaukee, Wisconsin
|
|
May 31, 2013
|
Not applicable.
|
ITEM 9A
.
|
Conclusion Regarding Disclosure Controls and Procedures
As of the end of the period covered by this Annual Report on Form 10-K, management of the Company, at the direction of the General Counsel and under the supervision, and with the participation, of the Company's President and Chief Executive Officer and Vice President, Finance and Chief Financial Officer, evaluated the effectiveness of the Company's disclosure controls and procedures as defined in the Securities Exchange Act Rules 13a-15(e) and 15d-15(e). Based upon that evaluation, the President and Chief Executive Officer and Vice President, Finance and Chief Financial Officer have concluded that the design and operation of the Company's disclosure controls and procedures were effective as of March 31, 2013.
Management’s Report on Internal Control Over Financial Reporting
The management of the Company is responsible for establishing and maintaining adequate internal control over financial reporting, as such term is defined in Rules 13a-15(f) and 15d-15(f) under the Securities Exchange Act of 1934, as amended. The Company’s internal control over financial reporting is a process designed by, or under the supervision of, the Company’s President and Chief Executive Officer and Vice President, Finance and Chief Financial Officer, and effected by the Company's board of directors, management and other personnel to provide reasonable assurance regarding the reliability of its financial reporting and the preparation of financial statements for external purposes in accordance with generally accepted accounting principles. The Company’s internal control over financial reporting includes those policies and procedures that (i) pertain to the maintenance of records that in reasonable detail accurately and fairly reflect the transactions and dispositions of the assets of the Company; (ii) provide reasonable assurance that transactions are recorded as necessary to permit preparation of financial statements in accordance with generally accepted accounting principles, and that receipts and expenditures of the Company are being made only in accordance with authorizations of management and directors of the Company; and (iii) provide reasonable assurance regarding prevention or timely detection of unauthorized acquisition, use or disposition of the Company’s assets that could have a material effect on the financial statements. Because of its inherent limitations, internal control over financial reporting may not prevent or detect misstatements. Also, projections of any evaluation of effectiveness to future periods are subject to the risk that controls may become inadequate because of changes in conditions, or that the degree of compliance with the policies or procedures may deteriorate.
Management, with the participation of the Company’s President and Chief Executive Officer and Vice President, Finance and Chief Financial Officer, has assessed the effectiveness of the Company’s internal control over financial reporting as of March 31, 2013. In making its assessment of internal control over financial reporting, management used the criteria set forth by the Committee of Sponsoring Organizations of the Treadway Commission in “Internal Control—Integrated Framework.” Based on this assessment, management concluded that, as of March 31, 2013, the Company’s internal control over financial reporting was effective.
The effectiveness of the Company’s internal control over financial reporting as of March 31, 2013 has been audited by PricewaterhouseCoopers LLP, an independent registered public accounting firm, as stated in their report which appears herein.
Remediation of Previously Identified Material Weakness
As previously reported, the Company determined that as of March 31, 2012, it did not maintain effective controls over the accuracy of value added tax (“VAT”) applied to various cross border transactions, primarily related to tooling sales and fixed asset transfers, which impacted multiple jurisdictions within the Europe segment. Specifically, the control was not designed to operate at the appropriate level of precision to adequately monitor and account for VAT applied to these types of transactions in order to assess the exposure, and if necessary record a liability. The Company implemented remediation plans to enhance controls and procedures to address the material weakness as follows:
|
·
|
Appointed a global process owner who is responsible for overseeing the Company’s compliance with VAT regulations, including oversight of the Company’s VAT policies and procedures, and also appointed a regional VAT process owner in Europe;
|
|
·
|
Developed policies and procedures necessary to properly comply with VAT regulations, with specific focus on cross-border transactions that could impact multiple taxing jurisdictions;
|
|
·
|
Improved existing internal controls and implemented new internal controls in Europe, at the transaction level and for monitoring and supervisory review, over VAT transactions to include specific consideration of tooling sales and fixed asset transfers prior to invoice issuance in accordance with applicable VAT regulations; and
|
|
·
|
Implemented monitoring controls to evaluate compliance with the Company’s internal policies and also with applicable VAT regulations.
|
Based on the actions summarized above, the Company’s management has concluded that the material weakness related to the accuracy of VAT applied to cross border transactions has been remediated as of March 31, 2013.
Changes in Internal Control Over Financial Reporting
Other than the corrective measures noted above related to the remediation of the material weakness, there have been no changes in internal control over financial reporting during the fourth quarter of fiscal 2013 that have materially affected, or are reasonably likely to materially affect, the Company’s internal control over financial reporting.
|
ITEM 9B
.
|
None.
Directors
. The Company incorporates by reference the information appearing in the Company's Proxy Statement for the 2013 Annual Meeting of Shareholders to be held on July 18, 2013 (the “2013 Annual Meeting Proxy Statement”) under the caption “Election of Directors.”
Executive Officers
. The information in response to this Item appears under the caption "Executive Officers of the Registrant" in this Form 10-K.
Compliance with Section 16(a) of the Exchange Act
. The Company incorporates by reference the information appearing in the 2013 Annual Meeting Proxy Statement under the caption “Section 16(a) Beneficial Ownership Reporting Compliance.”
Code of Ethics
. The Company incorporates by reference the information appearing in the 2013 Annual Meeting Proxy Statement under the caption “Corporate Governance – Code of Ethics.” The Company's Code of Ethics (labeled as the Code of Ethics and Business Conduct) is included on its website, www.modine.com (About Modine link).
Board Committee Charters.
The Board of Directors has approved charters for its Audit Committee, Officer Nomination and Compensation Committee, Corporate Governance and Nominating Committee and Technology Committee. These charters are included on the Company’s website, www.modine.com (Investor Relations link).
Audit Committee Financial Expert
. The Company incorporates by reference the information appearing in the 2013 Annual Meeting Proxy Statement under the caption “Committees of the Board of Directors – Audit Committee.”
Audit Committee Disclosure
. The Company incorporates by reference the information appearing in the 2013 Annual Meeting Proxy Statement under the captions “Committees of the Board of Directors – Audit Committee” and “Board Meetings and Committees.”
Guidelines on Corporate Governance
. The Board of Directors has adopted Guidelines on Corporate Governance. The Company’s Guidelines on Corporate Governance are included on its website, www.modine.com (Investor Relations link).
Security Holder Recommendation of Board Nominees
. The Company incorporates by reference the information appearing in the 2013 Annual Meeting Proxy Statement under the caption “Shareholder Nominations and Recommendations of Director Candidates.”
|
ITEM 11
.
|
The information appearing in the 2013 Annual Meeting Proxy Statement under the captions “Executive Compensation”; “Compensation of Directors”, “Committees of the Board of Directors – Officer Nomination and Compensation Committee: Compensation Committee Interlocks and Insider Participation”; and “Compensation Committee Report” is incorporated herein by reference.
|
ITEM 12
.
|
The Company incorporates by reference the information relating to stock ownership under the caption “Security Ownership of Certain Beneficial Owners and Management,” and under the caption “Equity Compensation Plan Information,” in the 2013 Annual Meeting Proxy Statement.
The Company incorporates by reference the information contained in the 2013 Annual Meeting Proxy Statement under the captions “Certain Relationships and Related Transactions” and “Director Independence.”
|
ITEM 14
.
|
The Company incorporates by reference the information contained in the 2013 Annual Meeting Proxy Statement under the caption “Independent Auditors’ Fees for Fiscal 2013 and 2012.”
|
(a)
|
Documents Filed
. The following documents are filed as part of this Report:
|
|
Page in Form 10-K
|
|
|
1. The consolidated financial statements of Modine Manufacturing Company and its subsidiaries filed under Item 8:
|
|
|
Consolidated Statements of Operations for the years ended March 31, 2013, 2012 and 2011
|
37
|
|
Consolidated Statements of Comprehensive Income for the years ended March 31, 2013, 2012, and 2011
|
38
|
|
Consolidated Balance Sheets at March 31, 2013 and 2012
|
39
|
|
Consolidated Statements of Cash Flows for the years ended March 31, 2013, 2012 and 2011
|
40
|
|
Consolidated Statements of Shareholders' Equity for the years ended March 31, 2013, 2012 and 2011
|
41
|
|
Notes to Consolidated Financial Statements
|
42-71
|
|
Report of Independent Registered Public Accounting Firm
|
72
|
|
2. Financial Statement Schedules.
|
|
|
The following financial statement schedule should be read in conjunction with the consolidated financial statements set forth in Item 8:
|
|
|
Schedule II -- Valuation and Qualifying Accounts
|
77
|
|
Schedules other than those listed above are omitted because they are not applicable, not required, or because the required information is included in the consolidated financial statements and the notes thereto.
|
|
|
3. Exhibits and Exhibit Index.
|
78-81
|
|
See the Exhibit Index included as the last part of this report, which is incorporated herein by reference. Each management contract and compensatory plan or arrangement required to be filed as an exhibit to this report is identified in the Exhibit Index by an asterisk following its exhibit number.
|
Pursuant to the requirements of Section 13 or 15(d) of the Securities Exchange Act of 1934, the registrant has duly caused this report to be signed on its behalf by the undersigned, thereunto duly authorized.
| Date: May 31, 2013 |
Modine Manufacturing Company
|
||
|
By:
|
/s/ Thomas A. Burke | ||
|
Thomas A. Burke, President
|
|||
|
and Chief Executive Officer
|
|||
|
(Principal Executive Officer)
|
|||
Pursuant to the requirements of the Securities Exchange Act of 1934, this report has been signed below by the following persons on behalf of the registrant and in the capacities indicated.
|
/s/ Thomas A. Burke
|
|
|
Thomas A. Burke
|
May 31, 2013
|
|
President, Chief Executive Officer and Director
|
|
|
(Principal Executive Officer)
|
|
|
/s/ Michael B. Lucareli
|
|
|
Michael B. Lucareli
|
May 31, 2013
|
|
Vice President, Finance and Chief Financial Officer
|
|
|
(Principal Financial Officer)
|
|
|
/s/ Gary L. Neale
|
|
|
Gary L. Neale
|
May 31, 2013
|
|
Director
|
|
|
/s/ David J. Anderson
|
|
|
David J. Anderson
|
May 31, 2013
|
|
Director
|
|
|
/s/ Charles P. Cooley
|
|
|
Charles P. Cooley
|
May 31, 2013
|
|
Director
|
|
|
/s/ Suresh V. Garimella
|
|
|
Suresh V. Garimella
|
May 31, 2013
|
|
Director
|
|
|
/s/ Larry O. Moore
|
|
|
Larry O. Moore
|
May 31, 2013
|
|
Director
|
|
|
/s/ Christopher W. Patterson
|
|
|
Christopher W. Patterson
|
May 31, 2013
|
|
Director
|
|
|
/s/ Mary L. Petrovich
|
|
|
Mary L. Petrovich
|
May 31, 2013
|
|
Director
|
|
|
/s/ Marsha C. Williams
|
|
|
Marsha C. Williams
|
May 31, 2013
|
|
Director
|
MODINE MANUFACTURING COMPANY AND SUBSIDIARIES
(A Wisconsin Corporation)
For the years ended March 31, 2013, 2012 and 2011
($ In Millions)
|
Column A
|
Column B
|
Column C
|
Column D
|
Column E
|
||||||||||||||||||
|
Additions
|
||||||||||||||||||||||
| (1) | (2) | |||||||||||||||||||||
|
Description
|
Balance at Beginning of Period
|
Charged (Benefit) to Costs and Expenses
|
Charged to Other Accounts
|
Deductions
|
Balance at
End of Period
|
|||||||||||||||||
|
2013: Allowance for Doubtful Accounts
|
$ | 0.8 | $ | 0.5 | $ | (0.1 | ) |
(B)
|
$ | 0.4 |
(A)
|
$ | 0.8 | |||||||||
|
Valuation Allowance for Deferred Tax Assets
|
$ | 146.8 | $ | 7.7 | $ | 18.3 |
(B)
|
$ | - | $ | 172.8 | |||||||||||
|
2012: Allowance for Doubtful Accounts
|
$ | 0.8 | $ | 0.1 | $ | - |
(B)
|
$ | 0.1 |
(A)
|
$ | 0.8 | ||||||||||
|
Valuation Allowance for Deferred Tax Assets
|
$ | 129.6 | $ | 1.0 | $ | 16.2 |
(B)
|
$ | - | $ | 146.8 | |||||||||||
|
2011: Allowance for Doubtful Accounts
|
$ | 2.4 | $ | (0.3 | ) | $ | 0.1 |
(B)
|
$ | 1.4 |
(A)
|
$ | 0.8 | |||||||||
|
Valuation Allowance for Deferred Tax Assets
|
$ | 121.3 | $ | 13.9 | $ | (5.6 | ) |
(B)
|
$ | - | $ | 129.6 | ||||||||||
Notes:
(A) Bad debts charged off during the year
(B) Translation and other adjustments
MODINE MANUFACTURING COMPANY
(THE “REGISTRANT”)
(COMMISSION FILE NO. 1-1373)
TO
2013 ANNUAL REPORT ON FORM 10-K
|
Exhibit No.
|
Description
|
Incorporated Herein By
Referenced To
|
Filed
Herewith
|
|||
|
3.1
|
Amended and Restated Articles of Incorporation, as amended.
|
Exhibit 4.2 to Registrant’s Registration Statement on Form S-3 (333-161030) dated August 4, 2009.
|
||||
|
3.2
|
Bylaws, as amended.
|
Exhibit 3.1 to Registrant’s Current Report on Form 8-K dated July 19, 2012
|
||||
|
4.1
|
Form of Stock Certificate of the Registrant.
|
Exhibit 4(a) to Form 10-K for the fiscal year ended March 31, 2003 ("2003 10-K").
|
||||
|
4.2
|
Amended and Restated Articles of Incorporation, as amended.
|
See Exhibit 3.1 hereto.
|
||||
|
4.3**
|
Amended and Restated Credit Agreement dated as of August 12, 2010 among the Registrant, the Foreign Subsidiary Borrowers, JPMorgan Chase Bank, N.A. as Administrative Agent, as Swing Line Lender, as LC Issuer, and as a Lender, U.S. Bank, N.A and Wells Fargo Bank, N.A., each as Syndication Agent and as a Lender, M&I Marshall & Ilsley Bank, as Documentation Agent and as a Lender, Associated Bank, N.A., and Comerica Bank.
|
Exhibit 4.1 to Registrant’s Current Report on Form 8-K dated August 12, 2010 (“August 12, 2010 8-K”).
|
||||
|
4.4**
|
Note Purchase and Private Shelf Agreement dated as of August 12, 2010 among the Registrant and the Series A Purchasers named therein of $125,000,000 6.83% Secured Senior Notes, Series A, due August 12, 2020 and $25,000,000 Private Shelf Facility and each Prudential Affiliate (as defined therein) that may become bound by certain provisions thereof.
|
Exhibit 4.2 to August 12, 2010 8-K.
|
||||
|
4.5
|
Amended and Restated Collateral Agency Intercreditor Agreement dated as of August 12, 2010 among the Lenders (as defined therein), the Noteholders (as defined therein) and JPMorgan Chase Bank, N.A. as Collateral Agent.
|
Exhibit 4.3 to August 12, 2010 8-K
|
||||
|
4.6**
|
First Amendment to Amended and Restated Credit Agreement and Waiver (the “Credit Amendment”) dated as of March 15, 2012, with JPMorgan Chase Bank, N.A. (“JPMorgan”), as Administrative Agent, LC Issuer, Swing Line Lender and as a Lender, and U.S. Bank, N.A. and Wells Fargo Bank, N.A. as Syndication Agents and as Lenders, BMO Harris Bank N.A., formerly known as M&I Marshall & Ilsley Bank, as Documentation Agent and as Lender and Associated Bank, N.A. and Comerica Bank (collectively, the “Lenders”). The Credit Amendment amends Modine’s existing four-year, $145 million multi-currency revolving credit facility dated as of August 12, 2010 (the “Original Credit Agreement”).
|
Exhibit 4.1 to Registrant’s Current Report on Form 8-K dated March 15, 2012 (“March 15, 2012 8-K”).
|
|
4.7**
|
First Amendment to Note Purchase and Private Shelf Agreement and Waiver (the “Note Purchase Amendment”) dated as of March 15, 2012, with Prudential Investment Management, Inc., The Prudential Insurance Company of America and Prudential Retirement Insurance and Annuity Company (collectively the “Noteholders”) pursuant to which the Company and the Note Holders amended their Note Purchase and Private Shelf Agreement dated August 12, 2010 (the “Original Note Purchase Agreement”).
|
Exhibit 4.2 to March 15, 2012 8-K.
|
||||
|
4.8**
|
Second Amendment to Amended and Restated Credit Agreement (the “Second Credit Amendment”) dated as of April 20, 2012, with JPMorgan Chase Bank, N.A. (“JPMorgan”), as Administrative Agent, LC Issuer, Swing Line Lender and as a Lender, and U.S. Bank, N.A. and Wells Fargo Bank, N.A. as Syndication Agents and as Lenders, BMO Harris Bank N.A., formerly known as M&I Marshall & Ilsley Bank, as Documentation Agent and as Lender and Associated Bank, N.A. and Comerica Bank (collectively, the “Lenders”). The Second Credit Amendment amends the “Original Credit Agreement”.
|
Exhibit 4.1 to Registrant’s Current Report on Form 8-K dated April 20, 2012 (“April 20, 2012 8-K”).
|
||||
|
4.9**
|
Second Amendment to Note Purchase and Private Shelf Agreement (the “Second Note Purchase Amendment”) dated as of April 20, 2012, with Prudential Investment Management, Inc., The Prudential Insurance Company of America and Prudential Retirement Insurance and Annuity Company (collectively the “Noteholders”) pursuant to which the Company and the Note Holders amended the “Original Note Purchase Agreement”.
|
Exhibit 4.2 to April 20, 2012 8-K.
|
||||
|
4.10**
|
Third Amendment to Amended and Restated Credit Agreement (the “Third Credit Amendment”) dated as of August 6, 2012, with JPMorgan Chase Bank, N.A. (“JPMorgan”), as Administrative Agent, LC Issuer, Swing Line Lender and as a Lender, and U.S. Bank, N.A. and Wells Fargo Bank, N.A. as Syndication Agents and as Lenders, BMO Harris Bank N.A., formerly known as M&I Marshall & Ilsley Bank, as Documentation Agent and as Lender and Associated Bank, N.A. and Comerica Bank (collectively, the “Lenders”). The Third Credit Amendment amends the “Original Credit Agreement”.
|
Exhibit 4.1 to Registrant’s Current Report on Form 8-K dated August 6, 2012 (“August 6, 2012 8-K”)
|
||||
|
4.11**
|
Third Amendment to Note Purchase and Private Shelf Agreement (the “Third Note Purchase Amendment”) dated as of August 6, 2012, with Prudential Investment Management, Inc., The Prudential Insurance Company of America and Prudential Retirement Insurance and Annuity Company (collectively the “Noteholders”) pursuant to which the Company and the Note Holders amended the “Original Note Purchase Agreement”.
|
Exhibit 4.2 to August 6, 2012 8-K
|
||||
|
4.12
|
Credit Facility Agreement among Modine Holding GmbH, Modine Europe GmbH and Deutsche Bank AG dated as of April 27, 2012.
|
Exhibit 4.10 to Registrant’s Form 10-K for the fiscal year ended March 31, 2012.
|
|
10.1*
|
Director Emeritus Retirement Plan effective April 1, 1992 (and frozen as of July 1, 2000).
|
Exhibit 10(a) to Registrant’s Form 10-K for the fiscal year ended March 31, 2002 (“2002 10-K”).
|
||||
|
10.2*
|
Employment Agreement between the Registrant and Thomas A. Burke dated as of June 15, 2007.
|
Exhibit 10.3 to Registrant’s Current Report on Form 8-K dated June 15, 2007 8-K.
|
||||
|
10.3*
|
Form of Amendment No. 1 to Employment Agreement entered into as of July 1, 2008 with Thomas A. Burke.
|
Exhibit 10.1 to Registrant’s Current Report on Form 8-K dated July 1, 2008.
|
||||
|
10.4*
|
Form of Change in Control and Termination Agreement (amended and restated) between the Registrant and officers other than Thomas A. Burke.
|
Exhibit 10(f) to Registrant’s Form 10-K for the year ended March 31, 2004.
|
||||
|
10.5*
|
Employment Agreement, dated December 19, 2011, between Modine Holding GmbH and Holger Schwab, effective as of July 1, 2012.
|
Exhibit 10.1 to Fiscal 2013 First Quarter 10-Q.
|
||||
|
10.6*
|
2000 Stock Incentive Plan for Non-Employee Directors (Amended and Restated as of March 16, 2005).
|
Appendix A to Registrant’s Proxy Statement for the 2005 Annual Meeting dated June 15, 2005.
|
||||
|
10.7*
|
Executive Supplemental Retirement Plan (as amended).
|
Exhibit 10(f) to Registrant's Form 10-K for the fiscal year ended March 31, 2000.
|
||||
|
10.8*
|
Deferred Compensation Plan (as amended).
|
Exhibit 10(y) to 2003 10-K.
|
||||
|
10.9*
|
2000 Stock Option Plan for Non-Employee Directors.
|
Exhibit 10(ac) to Registrant’s Form 10-K for the fiscal year ended March 31, 2001 (“2001 10-K”).
|
||||
|
10.10*
|
Form of Director's Stock Option Agreement (for 2000 Stock Option Plan for Non-Employee Directors).
|
Exhibit 10(ad) to 2001 10-K.
|
||||
|
10.11*
|
2007 Incentive Compensation Plan.
|
Appendix A to the Registrant's Proxy Statement dated June 18, 2007.
|
||||
|
10.12*
|
2008 Incentive Compensation Plan
(Amended and Restated effective May 18, 2011).
|
Appendix A to the Registrant's Proxy Statement dated June 28, 2011.
|
||||
|
10.13*
|
Amendment No. 1 to Form of Change in Control and Termination Agreement (amended and restated) between the Registrant and Officers other than Thomas A. Burke.
|
Exhibit 10.17 to Registrant's Form 10-K for the fiscal year ended March 31, 2011.
|
||||
|
10.14*
|
Supplemental Severance Policy.
|
Exhibit 10.1 to Registrant’s Current Report on Form 8-K dated October 17, 2011.
|
||||
|
Form of Fiscal 2014 Modine Performance Stock Award Agreement (Executive Council members).
|
X
|
|||||
|
Form of Fiscal 2014 Modine Incentive Stock Options Award Agreement (Executive Council members).
|
X
|
|||||
|
Form of Fiscal 2014 Modine Restricted Stock Award Agreement (Executive Council members).
|
X
|
|
Form of Fiscal 2014 Modine Non-Qualified Stock Option Award Agreement.
|
X
|
|||||
|
List of subsidiaries of the Registrant.
|
X
|
|||||
|
Consent of independent registered public accounting firm.
|
X
|
|||||
|
Rule 13a-14(a)/15d-14(a) Certification of Thomas A. Burke, President and Chief Executive Officer.
|
X
|
|||||
|
Rule 13a-14(a)/15d-14(a) Certification of Michael B. Lucareli, Vice President, Finance and Chief Financial Officer.
|
X
|
|||||
|
Section 1350 Certification of Thomas A. Burke, President and Chief Executive Officer.
|
X
|
|||||
|
Section 1350 Certification of Michael B. Lucareli, Vice President, Finance and Chief Financial Officer.
|
X
|
|||||
|
101.INS
|
Instance Document
|
X
|
||||
|
101.SCH
|
XBRL Taxonomy Extension Schema
|
X
|
||||
|
101.CAL
|
XBRL Taxonomy Extension Calculation Linkbase Document
|
X
|
||||
|
101.DEF
|
XBRL Taxonomy Extension Definition Linkbase Document
|
X
|
||||
|
101.LAB
|
XBRL Taxonomy Extension Label Linkbase Document
|
X
|
||||
|
101.PRE
|
XBRL Taxonomy Extension Presentation Linkbase Document
|
X
|
* Denotes management contract or executive compensation plan or arrangement required to be filed as an exhibit pursuant to Item 15 of Form 10-K.
** Pursuant to Item 601(b)(4)(iii)(A) of Regulation S-K, the Registrant has omitted certain agreements with respect to long-term debt not exceeding 10% of consolidated total assets. The Registrant agrees to furnish a copy of any such agreements to the Securities and Exchange Commission upon request.
81
TABLE OF CONTENTS
Part IItem 1. BusinessItem 1A. Risk FactorsItem 1B. Unresolved Staff CommentsItem 2. PropertiesItem 3. Legal ProceedingsItem 4. Mine Safety DisclosuresPart IIItem 5. Market For Registrant's Common Equity, Related Stockholder Matters and Issuer Purchases Of Equity SecuritiesItem 6. Selected Financial DataItem 7. Management's Discussion and Analysis Of Financial Condition and Results Of OperationsItem 7A. Quantitative and Qualitative Disclosures About Market RiskItem 8. Financial Statements and Supplementary DataNote 1: Significant Accounting PoliciesNote 2 AcquisitionsNote 3: Fair Value MeasurementsNote 4: Stock-based CompensationNote 5: Impairment and Restructuring ChargesNote 6: Other Income and Expense Other Income and Expense Consisted Of The Following:Note 6: Other Income and ExpenseNote 7: Income TaxesNote 8: Earnings Per Share The Components Of Basic and Diluted Earnings Per Share Are As Follows:Note 8: Earnings Per ShareNote 9: InventoriesNote 10: Property, Plant and Equipment Property, Plant and Equipment, Including Depreciable Lives, Consisted Of The Following:Note 10: Property, Plant and EquipmentNote 11: Investment in AffiliateNote 12: Intangible AssetsNote 13: GoodwillNote 14: Product Warranties, Operating Leases and Other CommitmentsNote 15: Indebtedness Long-term Debt Was Comprised Of The Following:Note 15: IndebtednessNote 16: Pension and Employee Benefit PlansNote 17: Derivative InstrumentsNote 18: Contingencies and LitigationNote 19: Common and Treasury StockNote 20: Accumulated Other Comprehensive Loss The Components Of Accumulated Other Comprehensive Loss Were As Follows:Note 20: Accumulated Other Comprehensive LossNote 21: Segment and Geographic InformationNote 22: Quarterly Financial Data (unaudited)Item 9. Changes in and Disagreements with Accountants on Accounting and Financial DisclosureItem 9A. Controls and ProceduresItem 9B. Other InformationPart IIIItem 10. Directors, Executive Officers and Corporate GovernanceItem 11. Executive CompensationItem 12. Security Ownership Of Certain Beneficial Owners and Management and Related Stockholder MattersItem 13. Certain Relationships and Related Transactions, and Director IndependenceItem 14. Principal Accountant Fees and ServicesPart IVItem 15. Exhibits and Financial Statement Schedules