MIDWESTONE FINANCIAL GROUP, INC.
10-Ks and 10-Qs
|
|
|
|
|
|
|
|
|
|
|
|
|
|
|
|
|
|
|
|
|
|
|
|
|
|
|
|
|
|
|
|
|
|
|
|
|
|
|
|
|
|
|
|
|
|
|
|
|
|
|
|
|
|
|
|
SECURITIES AND EXCHANGE COMMISSION
WASHINGTON, D.C. 20549
|
FORM 10-K
|
||
|
x
|
ANNUAL REPORT PURSUANT TO SECTION 13 OR 15(d) OF THE SECURITIES EXCHANGE ACT OF 1934
|
For the fiscal year ended
December 31, 2014
|
o
|
TRANSITION REPORT PURSUANT TO SECTION 13 OR 15(d) OF THE SECURITIES EXCHANGE ACT OF 1934
|
For the transition period from to
|
Commission file number 001-35968
|
||
MIDWEST
ONE
FINANCIAL GROUP, INC.
(Exact name of Registrant as specified in its charter)
|
Iowa
|
42-1206172
|
|
(State or Other Jurisdiction of
|
(I.R.S. Employer
|
|
Incorporation or Organization)
|
Identification Number)
|
102 South Clinton Street, Iowa City, IA 52240
(Address of principal executive offices, including zip code)
(319) 356-5800
(Registrant’s telephone number, including area code)
Securities registered pursuant to Section 12(b) of the Act:
|
Title of Class
|
Name of each exchange on which registered
|
|
Common Stock, $1.00 par value
|
The NASDAQ Stock Market LLC
|
Securities registered pursuant to Section 12(g) of the Act:
None
(Title of class)
Indicate by check mark if registrant is a well-known seasoned issuer, as defined in Rule 405 of the Securities Act.
o
Yes
x
No
Indicate by check mark if the registrant is not required to file reports pursuant to Section 13 or Section 15(d) of the Act.
o
Yes
x
No
Indicate by check mark whether the registrant (1) has filed all reports required to be filed by Section 13 or 15(d) of the Securities Exchange Act of 1934 during the preceding 12 months (or for such shorter period that the registrant was required to file such reports), and (2) has been subject to such filing requirements for the past 90 days.
x
Yes
o
No
Indicate by check mark whether the registrant has submitted electronically and posted on its corporate web site, if any, every Interactive Data File required to be submitted and posted pursuant to Rule 405 of Regulation S-T during the preceding 12 months (or for such shorter period that the registrant was required to submit and post such files).
x
Yes
o
No
Indicate by check mark if disclosure of delinquent filers pursuant to Item 405 of Regulation S-K is not contained herein, and will not be contained, to the best of registrant’s knowledge, in definitive proxy or information statements incorporated by reference in Part III of this Form 10-K or any amendment to this Form 10-K.
x
Indicate by check mark whether the registrant is a large accelerated filer, an accelerated filer, a non-accelerated filer, or a smaller reporting company. See the definition of “large accelerated filer,” “accelerated filer” and “smaller reporting company” in Rule 12b-2 of the Exchange Act. (Check one):
|
Large accelerated filer
|
o
|
|
Accelerated filer
|
x
|
|
Non-accelerated filer
|
o
(Do not check if a smaller reporting company)
|
|
Smaller reporting company
|
o
|
Indicate by check mark whether the registrant is a shell company (as defined in Rule 12b-2 of the Act).
o
Yes
x
No
The aggregate market value of the voting and non-voting common equity held by non-affiliates of the registrant, based on the last sales price quoted on the NASDAQ Global Select Market on the last business day of the registrant’s most recently completed second fiscal quarter, was approximately
$165.4 million
.
The number of shares outstanding of the registrant’s common stock, par value $1.00 per share, as of
March 3, 2015
, was
8,370,309
.
MIDWEST
ONE
FINANCIAL GROUP, INC.
Annual Report on Form 10-K
Table of Contents
|
Page No.
|
||||
|
PART I
|
||||
|
Item 1.
|
||||
|
Item 1A.
|
||||
|
Item 1B.
|
||||
|
Item 2.
|
||||
|
Item 3.
|
||||
|
Item 4.
|
||||
|
PART II
|
||||
|
Item 5.
|
||||
|
Item 6.
|
||||
|
Item 7.
|
||||
|
Item 7A.
|
||||
|
Item 8.
|
||||
|
Item 9.
|
||||
|
Item 9A.
|
||||
|
Item 9B.
|
||||
|
PART III
|
||||
|
Item 10.
|
||||
|
Item 11.
|
||||
|
Item 12.
|
||||
|
Item 13.
|
||||
|
Item 14.
|
||||
|
PART IV
|
||||
|
Item 15.
|
||||
|
I
TEM
1.
|
B
USINESS
.
|
General
MidWest
One
Financial Group, Inc. (“MidWest
One
” or the “Company,” which is also referred to herein as “we,” “our” or “us”) is an Iowa corporation incorporated in 1983, a bank holding company under the Bank Holding Company Act of 1956 and a financial holding company under the Gramm-Leach-Bliley Act of 1999. Our principal executive offices are located at 102 South Clinton Street, Iowa City, Iowa 52240.
We currently operate primarily through our bank subsidiary, MidWest
One
Bank, an Iowa state non-member bank chartered in 1934 with its main office in Iowa City, Iowa, and MidWest
One
Insurance Services, Inc., our wholly-owned subsidiary that operates through three agencies located in central and east-central Iowa.
On March 14, 2008, we consummated a merger-of-equals transaction with the former MidWest
One
Financial Group, Inc., in Oskaloosa, Iowa (“Former MidWest
One
”). Prior to the merger, we operated under the name “ISB Financial Corp.” We were the surviving entity in the merger and, upon completion of the merger, changed our name from ISB Financial Corp. to MidWest
One
Financial Group, Inc. and our common stock began trading on the NASDAQ Global Select Market under the symbol “MOFG.” All references herein to the “Company” and “MidWest
One
” refer to the surviving organization in the merger. Following the merger, we consolidated our three bank subsidiaries, Iowa State Bank & Trust Company, First State Bank and MidWest
One
Bank, into a single bank charter and renamed the surviving bank MidWest
One
Bank.
On November 20, 2014, we entered into a merger agreement with Central Bancshares, Inc. (“Central”), a Minnesota corporation, pursuant to which Central will merge with and into MidWest
One
. In connection with the merger, Central Bank, a Minnesota-chartered commercial bank and wholly-owned subsidiary of Central, will become a wholly-owned subsidiary of MidWest
One
. The merger is contingent upon the approval of our shareholders, our regulators and certain customary closing conditions. The corporate headquarters of the combined company will be in Iowa City, Iowa. Subject to our receipt of the required approvals, the merger is expected to be completed in the second quarter of 2015. For additional information on this proposed merger, see
Note 20. “Proposed Merger” to our consolidated financial statements.
As of
December 31, 2014
, we had total consolidated assets of
$1.8 billion
, total deposits of
$1.4 billion
and total shareholders’ equity of
$192.7 million
, all of which is common shareholders’ equity. For the year ended
December 31, 2014
, we generated net income available to common shareholders of
$18.5 million
, which was a decrease from the net income available to common shareholders of
$18.6 million
and and increase from
$16.5 million
for the years ended
December 31, 2013
and
2012
, respectively. For our complete financial information as of
December 31, 2014
and
2013
and for each of the years in the three-year period ended
December 31, 2014
, see Item 8. Financial Statements and Supplementary Data.
MidWest
One
Bank operates a total of
25
branch locations, plus its specialized Home Mortgage Center, in 15 counties throughout central and east-central Iowa. MidWest
One
Bank provides full-service retail banking in the communities in which its branch offices are located. Deposit products offered include checking and other demand deposit accounts, NOW accounts, savings accounts, money market accounts, certificates of deposit, individual retirement accounts and other time deposits. MidWest
One
Bank offers commercial and industrial, agricultural, real estate mortgage and consumer loans. Other products and services include debit cards, automated teller machines, on-line banking, mobile banking, and safe deposit boxes. The principal service consists of making loans to and accepting deposits from individuals, businesses, governmental units and institutional customers. MidWest
One
Bank also has a trust and investment department through which it offers a variety of trust and investment services, including administering estates, personal trusts, conservatorships, pension and profit-sharing funds and providing property management, farm management, custodial, financial planning, investment management and retail brokerage services (the latter of which is provided through an agreement with a third-party registered broker-dealer).
Operating Strategy
Our operating strategy is based upon a sophisticated community banking model delivering a complete line of financial products and services while following five guiding principles: (1) hire and retain excellent employees; (2) take care of our customers; (3) conduct business with the utmost integrity; (4) work as one team; and (5) learn constantly so we can continually improve.
Management believes the personal and professional service offered to customers provides an appealing alternative to the “megabanks” that have resulted from large out-of-state national banks acquiring Iowa-based community banks. While we employ a community banking philosophy, we believe that our size, combined with our complete line of financial products and services, is sufficient to effectively compete in our relevant market areas. To remain price competitive, management also believes that we
1
must grow organically as well as through strategic transactions, manage expenses and our efficiency ratio, and remain disciplined in our asset/liability management practices.
Market Areas
Our principal offices are located in Iowa City, Iowa. The city of Iowa City is located in east-central Iowa, approximately 220 miles west of Chicago, Illinois, and approximately 115 miles east of Des Moines, Iowa. It is strategically situated approximately 60 miles west of the Mississippi River on Interstate 80 and is the home of the University of Iowa, a public university with approximately 22,400 undergraduate students and 9,000 graduate and professional students. Iowa City is the home of the University of Iowa Hospitals and Clinics, a 730-bed comprehensive academic medical center and regional referral center with 1,617 staff physicians, residents, and fellows and 1,904 professional nurses. The city of Iowa City has a total population of approximately 72,000 and the Iowa City MSA has a total population of approximately 161,000. Iowa City is the fifth largest city in the state of Iowa. Based on deposit information collected by the FDIC as of June 30, 2014, the most recent date for which data is available, MidWest
One
Bank had the second highest deposit market share in the Iowa City MSA at approximately 17.2%.
MidWest
One
Bank operates branch offices and a loan production office in 15 counties in central and east-central Iowa.
Based on deposit information collected by the FDIC as of June 30, 2014, in seven of those 15 counties, MidWest
One
Bank held between 8% and 27% of the deposit market share. In another county, MidWest
One
Bank held 44% of the deposit market share.
Lending Activities
General
We provide a range of commercial and retail lending services to businesses, individuals and government agencies. These credit activities include commercial, industrial and agricultural loans; real estate construction loans; commercial and residential real estate loans; and consumer loans.
We market our services to qualified lending customers. Lending officers actively solicit the business of new companies entering their market areas as well as long-standing members of the business communities in which we operate. Through professional service, competitive pricing and innovative structure, we have been successful in attracting new lending customers. We also actively pursue consumer lending opportunities. With convenient locations, advertising and customer communications, we believe that we have been successful in capitalizing on the credit needs of our market areas.
Our management emphasizes credit quality and seeks to avoid undue concentrations of loans to a single industry or based on a single class of collateral. We have established lending policies that include a number of underwriting factors to be considered in making a loan, including location, loan-to-value ratio, cash flow, interest rate and credit history of the borrower.
Real Estate Loans
Construction and Development Loans
. We offer loans both to individuals who are constructing personal residences and to real estate developers and building contractors for the acquisition of land for development and the construction of homes and commercial properties. These loans are generally in-market to known and established borrowers. Construction loans generally have a short term, such as one to two years. As of
December 31, 2014
, construction and development loans constituted approximately
5.2%
of our total loan portfolio.
Mortgage Loans
. We offer residential, commercial and agricultural mortgage loans. As of
December 31, 2014
, we had
$699.1 million
in combined residential, commercial and agricultural mortgage loans outstanding, which represented approximately
61.7%
of our total loan portfolio.
Residential mortgage lending is a focal point for us, as residential real estate loans constituted approximately
24.1%
of our total loan portfolio at
December 31, 2014
. Included in this category are home equity loans made to individuals. As long-term interest rates have remained at relatively low levels since 2008, many customers opted for mortgage loans that have a fixed rate with 15- or 30-year maturities. We generally retain short-term residential mortgage loans that we originate for our own portfolio, but sell most long-term loans to other parties while retaining servicing rights on the majority of such loans. We also perform loan servicing activity for third parties on participations sold. At
December 31, 2014
, we serviced approximately
$370.0 million
in mortgage loans for others. We do not offer subprime mortgage loans and do not operate a wholesale mortgage business.
2
We also offer mortgage loans to our commercial and agricultural customers for the acquisition of real estate used in their business, such as offices, farmland, warehouses and production facilities, and to real estate investors for the acquisition of apartment buildings, retail centers, office buildings and other commercial buildings. As of
December 31, 2014
, commercial and agricultural real estate mortgage loans constituted approximately
37.6%
of our total loan portfolio.
Commercial and Industrial Loans
We have a strong commercial loan base. We focus on, and tailor our commercial loan programs to, small- to mid-sized businesses in our market areas. Our loan portfolio includes loans to wholesalers, manufacturers, contractors, business services companies and retailers. We provide a wide range of business loans, including lines of credit for working capital and operational purposes and term loans for the acquisition of equipment. Although most loans are made on a secured basis, loans may be made on an unsecured basis where warranted by the overall financial condition of the borrower. Terms of commercial business loans generally range from one to five years.
Our commercial and industrial loans are primarily made based on the reported cash flow of the borrower and secondarily on the underlying collateral provided by the borrower. The collateral support provided by the borrower for most of these loans and the probability of repayment is based on the liquidation of the pledged collateral and enforcement of a personal guarantee, if any exists. The primary repayment risks of commercial loans are that the cash flows of the borrower may be unpredictable, and the collateral securing these loans may fluctuate in value. As of
December 31, 2014
, commercial and industrial loans comprised approximately
26.9%
of our total loan portfolio.
Agricultural Loans
Due to the rural market areas in and around which we operate, agricultural loans are an important part of our business. Agricultural loans include loans made to finance agricultural production and other loans to farmers and farming operations. Agricultural loans comprised approximately
9.3%
of our total loan portfolio at
December 31, 2014
.
Agricultural loans, most of which are secured by crops, livestock and machinery, are generally provided to finance capital improvements and farm operations as well as acquisitions of livestock and machinery. The ability of the borrower to repay may be affected by many factors outside of the borrower’s control, including adverse weather conditions, loss of livestock due to disease or other factors, declines in market prices for agricultural products and the impact of government regulations. The ultimate repayment of agricultural loans is dependent upon the profitable operation or management of the agricultural entity.
Our agricultural lenders work closely with our customers, including companies and individual farmers, and review the preparation of budgets and cash flow projections for the ensuing crop year. These budgets and cash flow projections are monitored closely during the year and reviewed with the customers at least once annually. We also work closely with governmental agencies to help agricultural customers obtain credit enhancement products such as loan guarantees or interest rate assistance.
Consumer Lending
Our consumer lending department provides all types of consumer loans, including personal loans (secured or unsecured) and automobile loans. Consumer loans typically have shorter terms, lower balances, higher yields and higher risks of default than one- to four-family residential real estate mortgage loans. Consumer loan collections are dependent on the borrower’s continuing financial stability and are therefore more likely to be affected by adverse personal circumstances. As of
December 31, 2014
, consumer loans comprised only
2.1%
of our total loan portfolio.
Loan Pool Participations
We hold in our portfolio participation interests in pools of loans that are owned and serviced by States Resources Corporation, a third-party loan servicing organization located in Omaha, Nebraska (the “Servicer”). We do not have any ownership interest in or control over the Servicer. The loans in those pools were purchased at varying discounts to their outstanding principal amount. Former MidWest
One
began the program of acquiring participation interests from the Servicer in 1988 and we continued with this program following the Merger (although these loan participations have constituted a smaller percentage of our total loan portfolio than they did of Former MidWest
One
’s total loan portfolio). In 2010, after extensive discussion and analysis of our current loan pool portfolio, we decided to exit this line of business as current balances pay down. This decision was based primarily on our desire to focus on our core business of providing community banking products and services. Additionally, recent loan pool yields have not provided a return reflective of the inherent risk of this investment, a situation we do not expect to change in the near future, making further investment in this class of assets unattractive. At December 31, 2010 the balance of our loan pool participations, net, was $65.9 million. Their balance at
December 31, 2014
was
$19.3 million
.
3
The following discussion summarizes the accounting treatment of our loan pool participations.
A cost “basis” was assigned to each individual loan acquired on a cents per dollar basis (discounted price), which was based on the Servicer’s assessment of the recovery potential of each such loan in relation to the total discounted price paid to acquire the pool. This methodology assigned a higher basis to performing loans with greater potential collectibility and a lower basis to those loans identified as having little or no potential for collection.
Loan pool participations are shown on our balance sheet as a separate asset category; they are not included within the loan balance on our balance sheet. The original carrying value of loan pool participation interests represents the discounted price paid by us to acquire our participation interests in various loan pools purchased by the Servicer. Our investment balance with respect to the participation interest is reduced as the Servicer collects principal payments on the loans and remits the proportionate share of such payments to us.
Loan pool participations are accounted for in accordance with the provisions of ASC Topic 310 (guidance formerly contained in
Statement of Position 03-3, “Accounting for Certain Loans or Debt Securities Acquired in a Transfer”
). According to ASC Topic 310, in order to apply the interest method of recognition to these types of loans, there must be sufficient information to reasonably estimate the amount and timing of the cash flows expected to be collected. When that is not the case, the loan is accounted for on nonaccrual status applying cash basis income recognition to the loan.
In each case, where circumstances change or new information leads the Servicer to believe that collection of the loan or recovery of the basis through collateral would be less than originally determined, the cost basis assigned to the loan is written down or written off through a charge against discount income. The Servicer and MidWest
One
representatives evaluate at least quarterly the collectibility of the loans and the recovery of the underlying basis. On a quarterly basis, those loans that are determined to have a possible recovery of less than the assigned basis amount are placed on a “watch list.” The amount of basis exceeding the estimated recovery amount on the “watch list” loans is written off by a charge against discount income.
Interest income and discount on loan pool participations that we record is net of collection expenses incurred by the Servicer and net of the servicing fee and share of recovery profit paid to the Servicer. Collection expenses include salary and benefits paid by the Servicer to its employees, legal fees, costs to maintain and insure real estate owned, and other operating expenses. Under the terms of our agreement with the Servicer, the Servicer receives a servicing fee based on one percent of the gross monthly collections of principal and interest, net of collection costs. Additionally, the Servicer receives a tiered percentage share of the recovery profit in excess of our required return on investment on each individual loan pool. The Servicer’s percentage share of recovery profit is linked to a ten-tier index and ranges from zero to 27 percent depending upon the return on investment achieved. MidWest
One
’s minimum required return on investment is based on the two-year treasury rate at the time a loan pool was purchased plus four percent. For every one percent increase obtained over our minimum required return, the Servicer percentage moves up one tier level. In the event that the return on a particular pool does not exceed the required return on investment, the Servicer does not receive a percentage share of the recovery profit. Discount income is added to interest income and reflected as one amount on our consolidated statements of operations.
The Servicer provides us
with monthly reports detailing collections of principal and interest, face value of loans collected and those written off, actual operating expenses incurred, remaining asset balances (both in terms of cost basis and principal amount of loans), a comparison of actual collections and expenses with target collections and budgeted expenses, and summaries of remaining collection targets. The Servicer also provides aging reports and “watch lists” for the loan pool participations. Monthly meetings are held between our representatives and representatives of the Servicer to review collection efforts and results and to discuss future plans of action. Our representatives visit the Servicer’s operation on a regular basis, and our loan review officers perform asset reviews on a regular basis.
Our overall cost basis in the loan pool participations represents a discount from the aggregate outstanding principal amount of the loans underlying the pools. For example, as of
December 31, 2014
, such cost basis was
$21.5 million
, while the contractual outstanding principal amount of the underlying loans as of such date was approximately
$68.4 million
. The discounted cost basis inherently reflects the assessed collectibility of the underlying loans. We do not include any amounts related to the loan pool participations in our totals of nonperforming loans.
As part of the ongoing collection process, the Servicer may, from time to time, foreclose on real estate mortgages and acquire title to property in satisfaction of such debts. This real estate may be held by the Servicer as “real estate owned” for a period of time until it can be sold. Because our investments in loan pool participations are classified separately from our loan portfolio, we do not include the real estate owned that is held by the Servicer with the amount of any other real estate that we may hold directly as a result of our own foreclosure activities.
4
The underlying loans in the loan pool participations include both fixed-rate and variable-rate instruments. No amounts for interest due are reflected in the carrying value of the loan pool participations. Based on historical experience, the average period of collectibility for loans underlying our loan pool participations, many of which have exceeded contractual maturity dates, is approximately three to five years. Our management has reviewed the recoverability of the underlying loans and believes that the carrying value does not exceed the net realizable value of its investment in loan pool participations.
Other Products and Services
Deposit Products
We believe that we offer competitive deposit products and programs that address the needs of customers in each of the local markets that we serve. The deposit products are offered to individuals, nonprofit organizations, partnerships, small businesses, corporations and public entities. These products include non-interest-bearing and interest-bearing demand deposits, savings accounts, money market accounts and certificates of deposit.
Trust and Investment Services
We offer trust and investment services in our market areas to help our business and individual clients in meeting their financial goals and preserving wealth. Our services include administering estates, personal trusts, conservatorships, pension and profit-sharing funds and providing property management, farm management, investment advisory, retail securities brokerage, financial planning and custodial services. Licensed brokers (who are registered representatives of a third-party registered broker-dealer) serve selected branches and provide investment-related services including securities trading, financial planning, mutual funds sales, fixed and variable annuities and tax-exempt and conventional unit trusts.
Insurance Services
Through our insurance subsidiary, MidWest
One
Insurance Services, Inc., we offer property and casualty insurance products to individuals and small businesses in the markets that we service.
Liquidity and Funding
A discussion of our liquidity and funding programs has been included in Item 7. Management’s Discussion and Analysis of Financial Condition and Results of Operations under “Liquidity,” and Item 7A. Quantitative and Qualitative Disclosures About Market Risk under “Liquidity Risk.”
Competition
We encounter competition in all areas of our business pursuits. To compete effectively, grow our market share, maintain flexibility and keep pace with changing economic and social conditions, we continuously refine and develop our products and services. The principal methods of competing in the financial services industry are through service, convenience and price.
The banking industry is highly competitive, and we face strong direct competition for deposits, loans, and other finance-related services. Our offices in central and east-central Iowa compete with other commercial banks, thrifts, credit unions, stockbrokers, finance divisions of auto and farm equipment companies, agricultural suppliers, and other agriculture-related lenders. Some of these competitors are local, while others are statewide, regional or nationwide. We compete for deposits principally by offering depositors a wide variety of deposit programs, convenient office locations, hours and other services, and for loan originations primarily through the interest rates and loan fees we charge, the variety of our loan products and the efficiency and quality of services we provide to borrowers, with an emphasis on building long-lasting relationships. Some of the financial institutions and financial service organizations with which we compete are not subject to the same degree of regulation as that imposed on federally insured Iowa-chartered banks. As a result, such competitors have advantages over us in providing certain services. As of
June 30, 2014
, there were approximately
92
other banks having
296
offices or branches operating within the 15 counties in which we have locations. Based on deposit information collected by the FDIC, as of June 30, 2013, we maintained approximately 8.8% of the bank deposits within the 15 counties in which we operate. New competitors may develop that are substantially larger and have significantly greater resources than us.
Employees
As of
December 31, 2014
, we had
374
full-time equivalent employees. We provide our employees with a comprehensive program of benefits, some of which are on a contributory basis, including comprehensive medical and dental plans, life insurance,
5
long-term and short-term disability coverage, a 401(k) plan, and an employee stock ownership plan. None of our employees are represented by unions. Our management considers its relationship with our employees to be good.
Company Website
We maintain an Internet website for MidWest
One
Bank at www.midwestone.com. We make available, free of charge, on this website our Annual Report on Form 10-K, Quarterly Reports on Form 10-Q, Current Reports on Form 8-K and amendments to those reports filed or furnished pursuant to Section 13(a) or 15(d) of the Securities Exchange Act of 1934, as amended (the “Exchange Act”) as soon as reasonably practicable after we electronically file such material with, or furnish it to, the Securities and Exchange Commission (the “SEC”). Information on, or accessible through, our website is not part of, or incorporated by reference in, this Annual Report on Form 10-K.
Supervision and Regulation
General
Financial institutions, their holding companies and their affiliates are extensively regulated under federal and state law. As a result, our growth and earnings performance may be affected not only by management decisions and general economic conditions, but also by the requirements of federal and state statutes and by the regulations and policies of various bank regulatory agencies, including the Iowa Superintendent of Banking (the “Iowa Superintendent”), the Board of Governors of the Federal Reserve System (the “Federal Reserve”), the Federal Deposit Insurance Corporation (the “FDIC”) and the Bureau of Consumer Financial Protection (the “CFPB”). Furthermore, taxation laws administered by the Internal Revenue Service and state taxing authorities, accounting rules developed by the Financial Accounting Standards Board, securities laws administered by the Securities and Exchange Commission (the “SEC”) and state securities authorities, and anti-money laundering laws enforced by the U.S. Department of the Treasury (the “Treasury”) have an impact on our business. The effect of these statutes, regulations, regulatory policies and accounting rules are significant to our operations and results, and the nature and extent of future legislative, regulatory or other changes affecting financial institutions are impossible to predict with any certainty.
Federal and state banking laws impose a comprehensive system of supervision, regulation and enforcement on the operations of financial institutions, their holding companies and affiliates that is intended primarily for the protection of the FDIC-insured deposits and depositors of banks, rather than shareholders. These federal and state laws, and the regulations of the bank regulatory agencies issued under them, affect, among other things, the scope of business, the kinds and amounts of investments banks may make, reserve requirements, capital levels relative to operations, the nature and amount of collateral for loans, the establishment of branches, the ability to merge, consolidate and acquire, dealings with insiders and affiliates and the payment of dividends.
This supervisory and regulatory framework subjects banks and bank holding companies to regular examination by their respective regulatory agencies, which results in examination reports and ratings that are not publicly available and that can impact the conduct and growth of their businesses. These examinations consider not only compliance with applicable laws and regulations, but also capital levels, asset quality and risk, management ability and performance, earnings, liquidity, and various other factors. The regulatory agencies generally have broad discretion to impose restrictions and limitations on the operations of a regulated entity where the agencies determine, among other things, that such operations are unsafe or unsound, fail to comply with applicable law or are otherwise inconsistent with laws and regulations or with the supervisory policies of these agencies.
The following is a summary of the material elements of the supervisory and regulatory framework applicable to the Company and our subsidiaries. It does not describe all of the statutes, regulations and regulatory policies that apply, nor does it restate all of the requirements of those that are described. The descriptions are qualified in their entirety by reference to the particular statutory and regulatory provision.
Financial Regulatory Reform
On July 21, 2010, President Obama signed the Dodd-Frank Wall Street Reform and Consumer Protection Act (the “Dodd-Frank Act”) into law. The Dodd-Frank Act represented a sweeping reform of the U.S. supervisory and regulatory framework applicable to financial institutions and capital markets in the wake of the global financial crisis, certain aspects of which are described below in more detail. In particular, and among other things, the Dodd-Frank Act: (i) created a Financial Stability Oversight Council as part of a regulatory structure for identifying emerging systemic risks and improving interagency cooperation; (ii) created the CFPB, which is authorized to regulate providers of consumer credit, savings, payment and other consumer financial products and services; (iii) narrowed the scope of federal preemption of state consumer laws enjoyed by national banks and federal savings associations and expanded the authority of state attorneys general to bring actions to enforce federal consumer protection legislation;
6
(iv) imposed more stringent capital requirements on bank holding companies and subjected certain activities, including interstate mergers and acquisitions, to heightened capital conditions; (v) with respect to mortgage lending, (a) significantly expanded requirements applicable to loans secured by 1-4 family residential real property, (b) imposed strict rules on mortgage servicing, and (c) required the originator of a securitized loan, or the sponsor of a securitization, to retain at least 5% of the credit risk of securitized exposures unless the underlying exposures are qualified residential mortgages or meet certain underwriting standards; (vi) repealed the prohibition on the payment of interest on business checking accounts; (vii) restricted the interchange fees payable on debit card transactions for issuers with $10 billion in assets or greater; (viii) in the so-called “Volcker Rule,” subject to numerous exceptions, prohibited depository institutions and affiliates from certain investments in, and sponsorship of, hedge funds and private equity funds and from engaging in proprietary trading; (ix) provided for enhanced regulation of advisers to private funds and of the derivatives markets; (x) enhanced oversight of credit rating agencies; and (xi) prohibited banking agency requirements tied to credit ratings. These statutory changes shifted the regulatory framework for financial institutions, impacted the way in which they do business and have the potential to constrain revenues.
Numerous provisions of the Dodd-Frank Act were required to be implemented through rulemaking by the appropriate federal regulatory agencies. Many of the required regulations have been issued and others have been released for public comment, but are not yet final. Furthermore, while the reforms primarily targeted systemically important financial service providers, their influence is expected to filter down in varying degrees to smaller institutions over time. Management of the Company and the Bank will continue to evaluate the effect of the Dodd-Frank Act; however, in many respects, the ultimate impact of the Dodd-Frank Act will not be fully known for years, and no current assurance may be given that the Dodd-Frank Act, or any other new legislative changes, will not have a negative impact on the results of operations and financial condition of the Company and our subsidiaries.
The Increasing Regulatory Emphasis on Capital
Regulatory capital represents the net assets of a financial institution available to absorb losses. Because of the risks attendant to their businesses, depository institutions are generally required to hold more capital than other businesses, which directly affects earnings capabilities. While capital has historically been one of the key measures of the financial health of both bank holding companies and banks, its role became fundamentally more important in the wake of the global financial crisis, as the banking regulators recognized that the amount and quality of capital held by banks prior to the crisis was insufficient to absorb losses during periods of severe stress. Certain provisions of the Dodd-Frank Act and Basel III, discussed below, establish strengthened capital standards for banks and bank holding companies, require more capital to be held in the form of common stock and disallow certain funds from being included in capital determinations. Once fully implemented, these standards will represent regulatory capital requirements that are meaningfully more stringent than those in place previously.
The Company and Bank Required Capital Levels
. Bank holding companies have historically had to comply with less stringent capital standards than their bank subsidiaries and have been able to raise capital with hybrid instruments such as trust preferred securities. The Dodd-Frank Act mandated the Federal Reserve to establish minimum capital levels for bank holding companies on a consolidated basis as stringent as those required for insured depository institutions. As a consequence, the components of holding company permanent capital known as “Tier 1 Capital” were restricted to those capital instruments that are considered to be Tier 1 Capital for insured depository institutions. A result of this change is that the proceeds of hybrid instruments, such as trust preferred securities, are being excluded from Tier 1 Capital over a phase-out period. However, if such securities were issued prior to May 19, 2010 by bank holding companies with less than $15 billion of assets as of December 31, 2009, they may be retained as Tier I Capital subject to certain restrictions. Because the Company had assets of less than $15 billion, it was able to meet the requirements and maintain its trust preferred proceeds as Tier 1 Capital but will have to comply with the revised capital mandates in other respects and will not be able to raise Tier 1 Capital in the future through the issuance of trust preferred securities.
The minimum capital standards effective for the year ended December 31, 2014 were:
|
•
|
A leverage requirement, consisting of a minimum ratio of Tier 1 Capital to total adjusted book assets of 3% for the most highly-rated banks with a minimum requirement of at least 4% for all others, and
|
|
•
|
A risk-based capital requirement, consisting of a minimum ratio of Total Capital to total risk-weighted assets of 8% and a minimum ratio of Tier 1 Capital to total risk-weighted assets of 4%.
|
For these purposes, “Tier 1 Capital” consisted primarily of common stock, noncumulative perpetual preferred stock and related surplus less intangible assets (other than certain loan servicing rights and purchased credit card relationships). “Total Capital” consisted primarily of Tier 1 Capital plus “Tier 2 Capital,” which included other non-permanent capital items, such as certain other debt and equity instruments that do not qualify as Tier 1 Capital, and a portion of the Bank’s allowance for loan and lease losses. Further, risk-weighted assets for the purpose of the risk-weighted ratio calculations were balance sheet assets and off-balance sheet exposures to which required risk weightings of 0% to 100% were applied.
7
The capital standards described above are
minimum
requirements and were increased beginning January 1, 2015 under Basel III, as discussed below. Bank regulatory agencies uniformly encourage banks and bank holding companies to be “well-capitalized” and, to that end, federal law and regulations provide various incentives for banking organizations to maintain regulatory capital at levels in excess of minimum regulatory requirements. For example, a banking organization that is “well-capitalized” may: (i) qualify for exemptions from prior notice or application requirements otherwise applicable to certain types of activities; (ii) qualify for expedited processing of other required notices or applications; and (iii) accept, roll-over or renew brokered deposits. Under the capital regulations of the FDIC and Federal Reserve, in order to be “well‑capitalized,” a banking organization, for the year ended December 31, 2014, must have maintained:
|
•
|
A leverage ratio of Tier 1 Capital to total assets of 5% or greater,
|
|
•
|
A ratio of Tier 1 Capital to total risk-weighted assets of 6% or greater, and
|
|
•
|
A ratio of Total Capital to total risk-weighted assets of 10% or greater.
|
The FDIC and Federal Reserve guidelines also provide that banks and bank holding companies experiencing internal growth or making acquisitions would be expected to maintain capital positions substantially above the minimum supervisory levels without significant reliance on intangible assets. Furthermore, the guidelines indicate that the agencies will continue to consider a “tangible Tier 1 leverage ratio” (deducting all intangibles) in evaluating proposals for expansion or to engage in new activities.
Higher capital levels could also be required if warranted by the particular circumstances or risk profile of individual banking organizations. For example, the Federal Reserve’s capital guidelines contemplate that additional capital may be required to take adequate account of, among other things, interest rate risk, or the risks posed by concentrations of credit, nontraditional activities or securities trading activities. Further, any banking organization experiencing or anticipating significant growth would be expected to maintain capital ratios, including tangible capital positions (
i.e.
, Tier 1 Capital less all intangible assets), well above the minimum levels.
Prompt Corrective Action.
A banking organization’s capital plays an important role in connection with regulatory enforcement as well. Federal law provides the federal banking regulators with broad power to take prompt corrective action to resolve the problems of undercapitalized institutions. The extent of the regulators’ powers depends on whether the institution in question is “adequately capitalized,” “undercapitalized,” “significantly undercapitalized” or “critically undercapitalized,” in each case as defined by regulation. Depending upon the capital category to which an institution is assigned, the regulators’ corrective powers include: (i) requiring the institution to submit a capital restoration plan; (ii) limiting the institution’s asset growth and restricting its activities; (iii) requiring the institution to issue additional capital stock (including additional voting stock) or to sell itself; (iv) restricting transactions between the institution and its affiliates; (v) restricting the interest rate that the institution may pay on deposits; (vi) ordering a new election of directors of the institution; (vii) requiring that senior executive officers or directors be dismissed; (viii) prohibiting the institution from accepting deposits from correspondent banks; (ix) requiring the institution to divest certain subsidiaries; (x) prohibiting the payment of principal or interest on subordinated debt; and (xi) ultimately, appointing a receiver for the institution.
As of
December 31, 2014
: (i) the Bank was not subject to a directive from its regulatory agencies to increase its capital and (ii) the Bank was “well-capitalized,” as defined by FDIC regulations As of
December 31, 2014
, the Company had regulatory capital in excess of the Federal Reserve’s requirements and met the Dodd-Frank Act capital requirements.
The Basel International Capital Accords
. The risk-based capital guidelines described above are based upon the 1988 capital accord known as “Basel I” adopted by the international Basel Committee on Banking Supervision, a committee of central banks and bank supervisors, as implemented by the U.S. federal banking regulators on an interagency basis. In 2008, the banking agencies collaboratively began to phase-in capital standards based on a second capital accord, referred to as “Basel II,” for large or “core” international banks (generally defined for U.S. purposes as having total assets of $250 billion or more, or consolidated foreign exposures of $10 billion or more). Basel II emphasized internal assessment of credit, market and operational risk, as well as supervisory assessment and market discipline in determining minimum capital requirements.
On September 12, 2010, the Group of Governors and Heads of Supervision, the oversight body of the Basel Committee on Banking Supervision, announced agreement on a strengthened set of capital requirements for banking organizations around the world, known as Basel III, to address deficiencies recognized in connection with the global financial crisis. Basel III was intended to be effective globally on January 1, 2013, with phase-in of certain elements continuing until January 1, 2019, and it is currently effective in many countries.
U.S. Implementation of Basel III.
In July of 2013, the U.S. federal banking agencies approved the implementation of the Basel III regulatory capital reforms in pertinent part, and, at the same time, promulgated rules effecting certain changes required
8
by the Dodd-Frank Act (the “Basel III Rule”). In contrast to capital requirements previously, which were in the form of guidelines, Basel III was released in the form of regulations by each of the federal regulatory agencies. The Basel III Rule is applicable to all financial institutions that are subject to minimum capital requirements, including federal and state banks and savings and loan associations, as well as to bank and savings and loan holding companies other than “small bank holding companies” (generally bank holding companies with consolidated assets of less than $1 billion).
The Basel III Rule not only increased most of the required minimum capital ratios as of January 1, 2015, but it introduced the concept of “Common Equity Tier 1 Capital,” which consists primarily of common stock, related surplus (net of Treasury stock), retained earnings, and Common Equity Tier 1 minority interests, subject to certain regulatory adjustments. The Basel III Rule also established more stringent criteria for instruments to be considered “Additional Tier 1 Capital” (Tier 1 Capital in addition to Common Equity) and Tier 2 Capital. A number of instruments that qualified as Tier 1 Capital will not qualify, or their qualifications will change. For example, cumulative preferred stock and certain hybrid capital instruments, including trust preferred securities, will no longer qualify as Tier 1 Capital of any kind, with the exception, subject to certain restrictions, of such instruments issued before May 10, 2010, by bank holding companies with total consolidated assets of less than $15 billion as of December 31, 2009. For those institutions, trust preferred securities and other nonqualifying capital instruments currently included in consolidated Tier 1 Capital were permanently grandfathered under the Basel III Rule, subject to certain restrictions. Noncumulative perpetual preferred stock, which formerly qualified as simple Tier 1 Capital, will not qualify as Common Equity Tier 1 Capital, but will instead qualify as Additional Tier 1 Capital. The Basel III Rule also constrained the inclusion of minority interests, mortgage-servicing assets, and deferred tax assets in capital and requires deductions from Common Equity Tier 1 Capital in the event that such assets exceed a certain percentage of a banking institution’s Common Equity Tier 1 Capital.
As of January 1, 2015, the Basel III Rule requires:
|
•
|
A new minimum ratio of Common Equity Tier 1 to risk-weighted assets of 4.5%;
|
|
•
|
An increase in the minimum required amount of Tier 1 Capital to 6% of risk-weighted assets;
|
|
•
|
A continuation of the current minimum required amount of Total Capital (Tier 1 plus Tier 2) at 8% of risk-weighted assets; and
|
|
•
|
A minimum leverage ratio of Tier 1Capital to total assets equal to 4% in all circumstances.
|
Basel III Rule maintained the general structure of the prompt corrective action framework, while incorporating the increased requirements and adding the Common Equity Tier 1 Capital ratio. In order to be “well-capitalized” under the new regime, a depository institution must maintain a Common Equity Tier 1 Capital ratio of 6.5% or more; a Tier 1 Capital ratio of 8% or more; a Total Capital ratio of 10% or more; and a leverage ratio of 5% or more
In addition, institutions that seek the freedom to make capital distributions (including for dividends and repurchases of stock) and pay discretionary bonuses to executive officers without restriction must also maintain 2.5% of risk-weighted assets in Common Equity Tier 1 attributable to a capital conservation buffer to be phased in over three years beginning in 2016. The purpose of the conservation buffer is to ensure that banking institutions maintain a buffer of capital that can be used to absorb losses during periods of financial and economic stress. Factoring in the fully phased-in conservation buffer increases the minimum ratios depicted above to 7% for Common Equity Tier 1, 8.5% for Tier 1 Capital and 10.5% for Total Capital. The leverage ratio is not impacted by the conservation buffer, and a banking institution may be considered well-capitalized while remaining out of compliance with the capital conservation buffer.
As discussed above, most of the capital requirements are based on a ratio of specific types of capital to “risk-weighted assets.” Not only did Basel III change the components and requirements of capital, but, for nearly every class of financial assets, the Basel III Rule requires a more complex, detailed and calibrated assessment of credit risk and calculation of risk weightings. While Basel III would have changed the risk weighting for residential mortgage loans based on loan-to-value ratios and certain product and underwriting characteristics, there was concern in the United States that the proposed methodology for risk weighting residential mortgage exposures and the higher risk weightings for certain types of mortgage products would increase costs to consumers and reduce their access to mortgage credit. As a result, the Basel III Rule did not effect this change, and banking institutions will continue to apply a risk weight of 50% or 100% to their exposure from residential mortgages.
Furthermore, there was significant concern noted by the financial industry in connection with the Basel III rulemaking as to the proposed treatment of accumulated other comprehensive income (“AOCI”). Basel III requires unrealized gains and losses on available-for-sale securities to flow through to regulatory capital as opposed to the previous treatment, which neutralized such effects. Recognizing the problem for community banks, the U.S. bank regulatory agencies adopted the Basel III Rule with a one-time election for smaller institutions like the Company and the Bank to opt out of including most elements of AOCI in regulatory capital. This opt-out, which must be made in the first quarter of 2015, would exclude from regulatory capital both unrealized gains and losses on available-for-sale debt securities and accumulated net gains and losses on cash-flow hedges and amounts attributable
9
to defined benefit post-retirement plans. We expect to make this election to avoid variations in the level of our capital depending on fluctuations in the fair value of our securities portfolio.
Banking institutions (except for large, internationally active financial institutions) became subject to the Basel III Rule on January 1, 2015, and both the Company and the Bank are currently in compliance with the new required ratios.
There are separate phase-in/phase-out periods for: (i) the capital conservation buffer; (ii) regulatory capital adjustments and deductions; (iii) nonqualifying capital instruments; and (iv) changes to the prompt corrective action rules. The phase-in periods commence on January 1, 2016 and extend until 2019.
The Company
General.
As the sole shareholder of the Bank, we are a bank holding company. As a bank holding company, we are registered with, and are subject to regulation by, the Federal Reserve under the Bank Holding Company Act of 1956, as amended (the “BHCA”). In accordance with Federal Reserve policy, and as now codified by the Dodd-Frank Act, we are legally obligated to act as a source of financial strength to the Bank and to commit resources to support the Bank in circumstances where we might not otherwise do so. Under the BHCA, we are subject to periodic examination by the Federal Reserve. We are required to file with the Federal Reserve periodic reports of our operations and such additional information regarding us and our subsidiaries as the Federal Reserve may require.
Acquisitions, Activities and Change in Control.
The primary purpose of a bank holding company is to control and manage banks. The BHCA generally requires the prior approval of the Federal Reserve for any merger involving a bank holding company or any acquisition by a bank holding company of another bank or bank holding company. Subject to certain conditions (including deposit concentration limits established by the BHCA and the Dodd-Frank Act), the Federal Reserve may allow a bank holding company to acquire banks located in any state of the United States. In approving interstate acquisitions, the Federal Reserve is required to give effect to applicable state law limitations on the aggregate amount of deposits that may be held by the acquiring bank holding company and its insured depository institution affiliates in the state in which the target bank is located (provided that those limits do not discriminate against out-of-state depository institutions or their holding companies) and state laws that require that the target bank have been in existence for a minimum period of time (not to exceed five years) before being acquired by an out-of-state bank holding company. Furthermore, in accordance with the Dodd-Frank Act, bank holding companies must be well-capitalized and well-managed in order to effect interstate mergers or acquisitions. For a discussion of the capital requirements, see “The Increasing Regulatory Emphasis on Capital” above.
The BHCA generally prohibits us from acquiring direct or indirect ownership or control of more than 5% of the voting shares of any company that is not a bank and from engaging in any business other than that of banking, managing and controlling banks or furnishing services to
banks
and their subsidiaries. This general prohibition is subject to a number of exceptions. The principal exception allows bank holding companies to engage in, and to own shares of companies engaged in, certain businesses found by the Federal Reserve prior to November 11, 1999 to be “so closely related to banking ... as to be a proper incident thereto.” This authority would permit us to engage in a variety of banking-related businesses, including the ownership and operation of a savings association, or any entity engaged in consumer finance, equipment leasing, the operation of a computer service bureau (including software development) and mortgage banking and brokerage. The BHCA generally does not place territorial restrictions on the domestic activities of nonbank subsidiaries of bank holding companies.
Additionally, bank holding companies that meet certain eligibility requirements prescribed by the BHCA and elect to operate as financial holding companies may engage in, or own shares in companies engaged in, a wider range of nonbanking activities, including securities and insurance underwriting and
sales
, merchant banking and any other activity that the Federal Reserve, in consultation with the Secretary of the Treasury, determines by regulation or order is financial in nature or incidental to any such financial activity or that the Federal Reserve determines by order to be complementary to any such financial activity and does not pose a substantial risk to the safety or soundness of depository institutions or the financial system generally. We have elected to operate as a financial holding company.
In order to become and maintain our status as a financial holding company, the Company and the Bank must be well-capitalized, well-managed, and
the
Bank must have a least a satisfactory Community Reinvestment Act (“CRA”) rating. If the Federal Reserve determines that a financial holding company is not well-capitalized or well-managed, the company has a period of time in which to achieve compliance, but during the period of noncompliance, the Federal Reserve may place any limitations on the company it believes to be appropriate. Furthermore, if the Federal Reserve determines that a financial holding company’s subsidiary bank has not received a satisfactory CRA rating, the company will not be able to commence any new financial activities or acquire a company that engages in such activities.
10
Federal law also prohibits any person
or
company from acquiring “control” of an FDIC-insured depository institution or its holding company without prior notice to the appropriate federal bank regulator. “Control” is conclusively presumed to exist upon the acquisition of 25% or more of the outstanding voting securities of a bank or bank holding company, but may arise under certain circumstances between 10% and 24.99% ownership
Capital Requirements.
Bank holding companies are required to maintain capital in accordance with Federal Reserve capital adequacy guidelines, as affected by the Dodd-Frank Act and Basel III. For a discussion of capital requirements, see “-The Increasing Regulatory Emphasis on Capital” above.
Dividend Payments.
Our ability to pay dividends to our shareholders may be affected by both general corporate law considerations and the policies of the Federal Reserve applicable to bank holding companies
.
As an Iowa corporation, we are subject to the limitations of Iowa law, which allows us to pay dividends unless, after such dividend, (i) we would not be able to pay our debts as they become due in the usual course of business or (ii) our total assets would be less than the sum of our total liabilities plus any amount that would be needed if we were to be dissolved at the time of the dividend payment, to satisfy the preferential rights upon dissolution of shareholders whose rights are superior to the rights of the shareholders receiving the distribution. In addition, under the Basel III Rule, institutions that seek the freedom to pay dividends will have to maintain 2.5% in Common Equity Tier 1 attributable to the capital conservation buffer to be phased in over three years beginning in 2016. See “-The Increasing Regulatory Emphasis on Capital” above.
As a general matter, the Federal Reserve has indicated that the board of directors of a bank holding company should eliminate, defer or significantly reduce dividends to shareholders if: (i) the company’s net income available to shareholders for the past four quarters, net of dividends previously paid during that period, is not sufficient to fully fund the dividends; (ii) the prospective rate of earnings retention is inconsistent with the company’s capital needs and overall current and prospective financial condition; or (iii) the company will not meet, or is in danger of not meeting, its minimum regulatory capital adequacy ratios. The Federal Reserve also possesses enforcement powers over bank holding companies and their nonbank subsidiaries to prevent or remedy actions that represent unsafe or unsound practices or violations of applicable statutes and regulations. Among these powers is the ability to proscribe the payment of dividends by banks and bank holding companies.
Federal Securities Regulation.
Our common stock is registered with the SEC under the Exchange Act. Consequently, we are subject to the information, proxy solicitation, insider trading and other restrictions and requirements of the SEC under the Exchange Act.
Corporate Governance.
The Dodd-Frank Act addresses many investor protection, corporate governance and executive compensation matters that will affect most U.S. publicly traded companies. The Dodd-Frank Act will increase stockholder influence over boards of directors by requiring companies to give stockholders a nonbinding vote on executive compensation and so-called “golden parachute” payments, and authorizing the SEC to promulgate rules that would allow stockholders to nominate and solicit voters for their own candidates using a company’s proxy materials. The legislation also directs the Federal Reserve to promulgate rules prohibiting excessive compensation paid to executives of bank holding companies, regardless of whether such companies are publicly traded.
The Bank
General
. The Bank is an Iowa-chartered bank, the deposit accounts of which are insured by the FDIC’s Deposit Insurance Fund (the “DIF”) to the maximum extent provided under federal law and FDIC regulations. As an Iowa-chartered bank, the Bank is subject to the examination, supervision, reporting and enforcement requirements of the Iowa Superintendent, the chartering authority for Iowa banks, and the FDIC, designated by federal law as the primary federal regulator of state-chartered, FDIC-insured banks that, like the Bank, are not members of the Federal Reserve System (“nonmember banks”).
Deposit Insurance.
As an FDIC-insured institution, the Bank is required to pay deposit insurance premium assessments to the FDIC. The FDIC has adopted a risk-based assessment system whereby FDIC-insured depository institutions pay insurance premiums at rates based on their risk classification. An institution’s risk classification is assigned based on its capital levels and the level of supervisory concern the institution poses to the regulators. For deposit insurance assessment purposes, an insured depository institution is placed in one of four risk categories each quarter. An institution’s assessment is determined by multiplying its assessment rate by its assessment base. The total base assessment rates range from 2.5 basis points to 45 basis points. While in the past an insured depository institution’s assessment base was determined by its deposit base, amendments to the Federal Deposit Insurance Act revised the assessment base so that it is calculated using average consolidated total assets minus average tangible equity. This change shifted the burden of deposit insurance premiums toward those large depository institutions that rely on funding sources other than U.S. deposits.
11
The FDIC has authority to raise or lower assessment rates on insured deposits in order to achieve statutorily required reserve ratios in the DIF and to impose special additional assessments. In light of the significant increase in depository institution failures in 2008-2010 and the increase of deposit insurance limits, the DIF incurred substantial losses during recent years. To bolster reserves in the DIF, the Dodd-Frank Act increased the minimum reserve ratio of the DIF to 1.35% of insured deposits and deleted the statutory cap for the reserve ratio. In December 2010, the FDIC set the designated reserve ratio at 2%, 65 basis points above the statutory minimum. At least semi-annually, the FDIC will update its loss and income projections for the DIF and, if needed, will increase or decrease the assessment rates, following notice and comment on proposed rulemaking. As a result, the Bank’s FDIC deposit insurance premiums could increase.
FICO Assessments.
In addition to paying basic deposit insurance assessments, insured depository institutions must pay Financing Corporation (“FICO”) assessments. FICO is a mixed-ownership governmental corporation chartered by the former Federal Home Loan Bank Board pursuant to the Competitive Equality Banking Act of 1987 to function as a financing vehicle for the recapitalization of the former Federal Savings and Loan Insurance Corporation. FICO issued 30-year noncallable bonds of approximately $8.1 billion that mature in 2017 through 2019. FICO’s authority to issue bonds ended on December 12, 1991. Since 1996, federal legislation has required that all FDIC-insured depository institutions pay assessments to cover interest payments on FICO’s outstanding obligations. The FICO assessment rate is adjusted quarterly and for the fourth quarter of 2014 was approximately 0.620 basis points (62 cents per $100 of assessable deposits).
Supervisory Assessments.
All Iowa banks are required to pay supervisory assessments to the Iowa Superintendent to fund the operations of that agency. The amount of the assessment is calculated on the basis of the Bank's total assets. During the year ended
December 31, 2014
, the Bank paid supervisory assessments to the Iowa Superintendent totaling
$122,000
.
Capital Requirements.
Banks are generally required to maintain capital levels in excess of other businesses. For a discussion of capital requirements, see “The Increasing Regulatory Emphasis on Capital” above.
Liquidity Requirements.
Liquidity is a measure of the ability and ease with which bank assets may be converted to cash. Liquid assets are those that can be converted to cash quickly if needed to meet financial obligations. To remain viable, financial institutions must have enough liquid assets to meet their near-term obligations, such as withdrawals by depositors. Because the global financial crisis was in part a liquidity crisis, Basel III also included a liquidity framework that requires financial institutions to measure their liquidity against specific liquidity tests. One test, referred to as
the Liquidity Coverage Ratio (“LCR”), is designed to ensure that the banking entity has an adequate stock of unencumbered high-quality liquid assets that can be converted easily and immediately in private markets into cash to meet liquidity needs for a 30-calendar day liquidity stress scenario. The other test, known as the Net Stable Funding Ratio (“NSFR”), is designed to promote more medium- and long-term funding of the assets and activities of financial institutions over a one-year horizon. These tests provide an incentive for banks and holding companies to increase their holdings in Treasury securities and other sovereign debt as a component of assets, increase the use of long-term debt as a funding source and rely on stable funding like core deposits (in lieu of brokered deposits).
In addition to liquidity guidelines already in place, the U.S. bank regulatory agencies
implemented
the LCR in September 2014, which requires large financial firms to hold levels of liquid assets sufficient to protect against constraints on their funding during times of financial turmoil. While the LCR only applies to the largest banking organizations in the country, certain elements are expected to filter down to all insured depository institutions. We are reviewing our liquidity risk management policies in light of the LCR and NSFR.
Dividend Payments.
T
he primary source of funds for the Company is dividends from the Bank. Under the Iowa Banking Act, Iowa-chartered banks generally may pay dividends only out of undivided profits. In addition, the Iowa Superintendent may restrict the declaration or payment of a dividend by an Iowa-chartered bank, such as the Bank.
The payment of dividends by any financial institution is affected by the requirement to maintain adequate capital pursuant to applicable capital adequacy guidelines and regulations, and a financial institution generally is prohibited from paying any dividends if, following payment thereof, the institution would be undercapitalized. As described above, the Bank exceeded its minimum capital requirements under applicable guidelines as of
December 31, 2014
. As of
December 31, 2014
, approximately
$39.8 million
was available to be paid as dividends by the Bank. Notwithstanding the availability of funds for dividends, however, the FDIC and Iowa Superintendent may prohibit the payment of dividends by the Bank if they determine such payment would constitute an unsafe or unsound practice. In addition, under the Basel III Rule, institutions that seek the freedom to pay dividends will have to maintain 2.5% in Common Equity Tier 1 attributable to the capital conservation buffer to be phased in over three years beginning in 2016. See “-The Increasing Regulatory Emphasis on Capital” above.
12
Insider Transactions.
The Bank is subject to certain restrictions imposed by federal law on “covered transactions” between the Bank and its “affiliates.” We are an affiliate of the Bank for purposes of these restrictions, and covered transactions subject to the restrictions include extensions of credit to us, investments in our stock or other securities and the acceptance of our stock or other securities as collateral for loans made by the Bank. The Dodd-Frank Act enhances the requirements for certain transactions with affiliates as of July 21, 2011, including an expansion of the definition of “covered transactions” and an increase in the amount of time for which collateral requirements regarding covered transactions must be maintained.
Certain limitations and reporting requirements are also placed on extensions of credit by the Bank to its directors and officers, to directors and officers of the Company and its subsidiaries, to principal shareholders of the Company and to “related interests” of such directors, officers and principal shareholders. In addition, federal law and regulations may affect the terms upon which any person who is a director or officer of the Company or the Bank, or a principal shareholder of the Company, may obtain credit from banks with which the Bank maintains a correspondent relationship.
Safety and Soundness Standards/Risk Management.
The federal banking agencies have adopted guidelines that establish operational and managerial standards to promote the safety and soundness of federally insured depository institutions. The guidelines set forth standards for internal controls, information systems, internal audit systems, loan documentation, credit underwriting, interest rate exposure, asset growth, compensation, fees and benefits, asset quality and earnings.
In general, the safety and soundness guidelines prescribe the goals to be achieved in each area, and each financial institution is responsible for establishing its own procedures to achieve those goals. If an financial institution fails to comply with any of the standards set forth in the guidelines, the financial institution’s primary federal regulator may require the financial institution to submit a plan for achieving and maintaining compliance. If a financial institution fails to submit an acceptable compliance plan, or fails in any material respect to implement a compliance plan that has been accepted by its primary federal regulator, the regulator is required to issue an order directing the financial institution to cure the deficiency. Until the deficiency cited in the regulator’s order is cured, the regulator may restrict the financial institution’s rate of growth, require the financial institution to increase its capital, restrict the rates the financial institution pays on deposits or require the financial institution to take any action the regulator deems appropriate under the circumstances. Noncompliance with the standards established by the safety and soundness guidelines may also constitute grounds for other enforcement action by the federal bank regulatory agencies, including cease and desist orders and civil money penalty assessments.
During the past decade, the bank regulatory agencies have increasingly emphasized the importance of sound risk management processes and strong internal controls when evaluating the activities of the financial institutions they supervise. Properly managing risks has been identified as critical to the conduct of safe and sound banking activities and has become even more important as new technologies, product innovation, and the size and speed of financial transactions have changed the nature of banking markets. The agencies have identified a spectrum of risks facing a banking institution including, but not limited to, credit, market, liquidity, operational, legal, and reputational risk. In particular, recent regulatory pronouncements have focused on operational risk, which arises from the potential that inadequate information systems, operational problems, breaches in internal controls, fraud, or unforeseen catastrophes will result in unexpected losses. New products and services, third-party risk management and cybersecurity are critical sources of operational risk that financial institutions are expected to address in the current environment. The Bank is expected to have active board and senior management oversight; adequate policies, procedures, and limits; adequate risk measurement, monitoring, and management information systems; and comprehensive internal controls.
Branching Authority.
Iowa banks, such as the Bank, have the authority under Iowa law to establish branches anywhere in the State of Iowa, subject to receipt of all required regulatory approvals.
Federal law permits state and national banks to merge with banks in other states subject to: (i) regulatory approval; (ii) federal and state deposit concentration limits; and (iii) state law limitations requiring the merging bank to have been in existence for a minimum period of time (not to exceed five years) prior to the merger. The establishment of new interstate branches or the acquisition of individual branches of a bank in another state (rather than the acquisition of an out-of-state bank in its entirety) has historically been permitted only in those states the laws of which expressly authorize such expansion. However, the Dodd-Frank Act permits well-capitalized and well-managed banks to establish new branches across state lines without these impediments.
State Bank Investments and Activities.
The Bank is permitted to make investments and engage in activities directly or through subsidiaries as authorized by Iowa law. However, under federal law, FDIC-insured state banks are prohibited, subject to certain exceptions, from making or retaining equity investments of a type, or in an amount, that are not permissible for a national bank. Federal law also prohibits FDIC-insured state banks and their subsidiaries, subject to certain exceptions, from engaging as principal in any activity that is not permitted for a national bank unless the bank meets, and continues to meet, its minimum regulatory capital requirements and the FDIC determines that the activity would not pose a significant risk to the DIF. These restrictions have not had, and are not currently expected to have, a material impact on the operations of the Bank.
13
Transaction Account Reserves.
Federal Reserve regulations require insured depository institutions to maintain reserves against their transaction accounts (primarily NOW and regular checking accounts). For 2015: the first $14.5 million of otherwise reservable balances are exempt from the reserve requirements; for transaction accounts aggregating more than $14.5 million to $103.6 million, the reserve requirement is 3% of total transaction accounts; and for net transaction accounts in excess of $103.6 million, the reserve requirement is $2,673,000 plus 10% of the aggregate amount of total transaction accounts in excess of $103.6 million. These reserve requirements are subject to annual adjustment by the Federal Reserve.
Federal Home Loan Bank System.
The Bank is a member of the Federal Home Loan Bank of Des Moines (the “FHLB”), which serves as a central credit facility for its members. The FHLB is funded primarily from proceeds from the sale of obligations of the FHLB system. It makes loans to member banks in the form of FHLB advances. All advances from the FHLB are required to be fully collateralized as determined by the FHLB.
Community Reinvestment Act Requirements.
The Community Reinvestment Act requires the Bank to have a continuing and affirmative obligation in a safe and sound manner to help meet the credit needs of its entire community, including low- and moderate-income neighborhoods. Federal regulators regularly assess the Bank’s record of meeting the credit needs of its communities. Applications for additional acquisitions would be affected by the evaluation of the Bank’s effectiveness in meeting its Community Reinvestment Act requirements.
Anti-Money Laundering.
The Uniting and Strengthening America by Providing Appropriate Tools Required to Intercept and Obstruct Terrorism Act of 2001 (the “Patriot Act”) is designed to deny terrorists and criminals the ability to obtain access to the U.S. financial system and has significant implications for depository institutions, brokers, dealers and other businesses involved in the transfer of money. The Patriot Act mandates financial services companies to have policies and procedures with respect to measures designed to address any or all of the following matters: (i) customer identification programs; (ii) money laundering; (iii) terrorist financing; (iv) identifying and reporting suspicious activities and currency transactions; (v) currency crimes; and (vi) cooperation between financial institutions and law enforcement authorities.
Concentrations in Commercial Real Estate.
Concentration risk exists when financial institutions deploy too many assets to any one industry or segment. Concentration stemming from commercial real estate is one area of regulatory concern. The interagency Concentrations in Commercial Real Estate Lending, Sound Risk Management Practices guidance (“CRE Guidance”) provides supervisory criteria, including the following numerical indicators, to assist bank examiners in identifying banks with potentially significant commercial real estate loan concentrations that may warrant greater supervisory scrutiny: (i) commercial real estate loans exceeding 300% of capital and increasing 50% or more in the preceding three years; or (ii) construction and land development loans exceeding 100% of capital. The CRE Guidance does not limit banks’ levels of commercial real estate lending activities, but rather guides institutions in developing risk management practices and levels of capital that are commensurate with the level and nature of their commercial real estate concentrations. Based on its existing loan portfolio, the Bank does not exceed these guidelines.
Consumer Financial Services.
The historical structure of federal consumer protection regulation applicable to all providers of consumer financial products and services changed significantly on July 21, 2011, when the CFPB commenced operations to supervise and enforce consumer protection laws. The CFPB has broad rulemaking authority for a wide range of consumer protection laws that apply to all providers of consumer products and services, including the Bank, as well as the authority to prohibit “unfair, deceptive or abusive” acts and practices. The CFPB has examination and enforcement authority over providers with more than $10 billion in assets. Banks and savings institutions with $10 billion or less in assets, like the Bank, will continue to be examined by their applicable bank regulators.
Because abuses in connection with residential mortgages were a significant factor contributing to the financial crisis, many new rules issued by the CFPB and required by the Dodd-Frank Act address mortgage and mortgage-related products, their underwriting, origination, servicing and sales. The Dodd-Frank Act significantly expanded underwriting requirements applicable to loans secured by 1-4 family residential real property and augmented federal law combating predatory lending practices. In addition to numerous disclosure requirements, the Dodd‑Frank Act imposed new standards for mortgage loan originations on all lenders, including banks and savings associations, in an effort to strongly encourage lenders to verify a borrower’s ability to repay, while also establishing a presumption of compliance for certain “qualified mortgages.” In addition, the Dodd-Frank Act generally required lenders or securitizers to retain an economic interest in the credit risk relating to loans that the lender sells, and other asset‑backed securities that the securitizer issues, if the loans do not comply with the ability-to-repay standards described below. The risk retention requirement generally is 5%, but could be increased or decreased by regulation. We do not currently expect the CFPB’s rules to have a significant impact on the Bank’s operations, except for higher compliance costs.
14
Ability-to-Repay Requirement and Qualified Mortgage Rule.
On January 10, 2013, the CFPB issued a final rule implementing the Dodd-Frank Act’s ability-to-repay requirements. Under the final rule, lenders, in assessing a borrower’s ability to repay a mortgage-related obligation, must consider eight underwriting factors: (i) current or reasonably expected income or assets; (ii) current employment status; (iii) monthly payment on the subject transaction; (iv) monthly payment on any simultaneous loan; (v) monthly payment for all mortgage-related obligations; (vi) current debt obligations, alimony, and child support; (vii) monthly debt-to-income ratio or residual income; and (viii) credit history. The final rule also includes guidance regarding the application of, and methodology for evaluating, these factors.
Further, the final rule clarified that qualified mortgages do not include “no-doc” loans and loans with negative amortization, interest-only payments, balloon payments, terms in excess of 30 years, or points and fees paid by the borrower that exceed 3% of the loan amount, subject to certain exceptions. In addition, for qualified mortgages, the rule mandated that the monthly payment be calculated on the highest payment that will occur in the first five years of the loan, and required that the borrower’s total debt-to-income ratio generally may not be more than 43%. The final rule also provided that certain mortgages that satisfy the general product feature requirements for qualified mortgages and that also satisfy the underwriting requirements of Fannie Mae and Freddie Mac (while they operate under federal conservatorship or receivership), or the U.S. Department of Housing and Urban Development, Department of Veterans Affairs, or Department of Agriculture or Rural Housing Service, are also considered to be qualified mortgages. This second category of qualified mortgages will phase out as the aforementioned federal agencies issue their own rules regarding qualified mortgages, the conservatorship of Fannie Mae and Freddie Mac ends, and, in any event, after seven years.
As set forth in the Dodd-Frank Act, subprime (or higher-priced) mortgage loans are subject to the ability-to-repay requirement, and the final rule provided for a rebuttable presumption of lender compliance for those loans. The final rule also applied the ability-to-repay requirement to prime loans, while also providing a conclusive presumption of compliance (
i.e.
, a safe harbor) for prime loans that are also qualified mortgages. Additionally, the final rule generally prohibited prepayment penalties (subject to certain exceptions) and set forth a 3-year record retention period with respect to documenting and demonstrating the ability-to-repay requirement and other provisions.
Mortgage Loan Originator Compensation.
As a part of the overhaul of mortgage origination practices, mortgage loan originators’ compensation was limited such that they may no longer receive compensation based on a mortgage transaction’s terms or conditions other than the amount of credit extended under the mortgage loan. Further, the total points and fees that a bank and/or a broker may charge on conforming and jumbo loans was limited to 3.0% of the total loan amount. Mortgage loan originators may receive compensation from a consumer or from a lender, but not both. These rules contain requirements designed to prohibit mortgage loan originators from “steering” consumers to loans that provide mortgage loan originators with greater compensation. In addition, the rules contain other requirements concerning recordkeeping
.
Servicing.
The CFPB was also required to implement certain provisions of the Dodd-Frank Act relating to mortgage servicing through rulemaking. The servicing rules require servicers to meet certain benchmarks for loan servicing and customer service in general. Servicers must provide periodic billing statements and certain required notices and acknowledgments, promptly credit borrowers’ accounts for payments received and promptly investigate complaints by borrowers and are required to take additional steps before purchasing insurance to protect the lender’s interest in the property. The servicing rules also called for additional notice, review and timing requirements with respect to delinquent borrowers, including early intervention, ongoing access to servicer personnel and specific loss mitigation and foreclosure procedures. The rules provided for an exemption from most of these requirements for “small servicers.” A small servicer is defined as a loan servicer that services 5,000 or fewer mortgage loans and services only mortgage loans that they or an affiliate originated or own.
Additional Constraints on the Company and Bank
Monetary Policy.
The monetary policy of the Federal Reserve has a significant effect on the operating results of financial or bank holding companies and their subsidiaries. Among the tools available to the Federal Reserve to affect the money supply are open market transactions in U.S. government securities, changes in the discount rate on member bank borrowings and changes in reserve requirements against member bank deposits. These means are used in varying combinations to influence overall growth and distribution of bank loans, investments and deposits, and their use may affect interest rates charged on loans or paid on deposits.
The Volcker Rule.
In addition to other implications of the Dodd-Frank Act discussed above, the Act amended the BHCA to require the federal regulatory agencies to adopt rules that prohibit banking entities and their affiliates from engaging in proprietary trading and investing in and sponsoring certain unregistered investment companies (defined as hedge funds and private equity funds). This statutory provision is commonly called the “Volcker Rule.” On December 10, 2013, the federal regulatory agencies issued final rules to implement the prohibitions required by the Volcker Rule. Thereafter, in reaction to industry concern over the adverse impact to community banks of the treatment of certain collateralized debt instruments in the final rule, the federal regulatory
15
agencies approved an interim final rule to permit financial institutions to retain interests in collateralized debt obligations backed primarily by trust preferred securities (“TruPS CDOs”) from the investment prohibitions contained in the final rule. Under the interim final rule, the regulatory agencies permitted the retention of an interest in or sponsorship of covered funds by banking entities if the following qualifications were met: (i) the TruPS CDO was established, and the interest was issued, before May 19, 2010; (ii) the banking entity reasonably believes that the offering proceeds received by the TruPS CDO were invested primarily in qualifying TruPS collateral; and (iii) the banking entity's interest in the TruPS CDO was acquired on or before December 10, 2013. This amendment impacted us favorably as an issuer of TruPS CDOs.
Although the Volcker Rule has significant implications for many large financial institutions, the Company does not currently anticipate that it will have a material effect on our operations or those of the Bank. We may incur costs if we are required to adopt additional policies and systems to ensure compliance with certain provisions of the Volcker Rule, but any such costs are not expected to be material.
Special Cautionary Note Regarding Forward-Looking Statements
This report contains certain “forward-looking statements” within the meaning of such term in the Private Securities Litigation Reform Act of 1995. We and our representatives may, from time to time, make written or oral statements that are “forward-looking” and provide information other than historical information. These statements involve known and unknown risks, uncertainties and other factors that may cause actual results to be materially different from any results, levels of activity, performance or achievements expressed or implied by any forward-looking statement. These factors include, among other things, the factors listed below.
Forward-looking statements, which may be based upon beliefs, expectations and assumptions of our management and on information currently available to management, are generally identifiable by the use of words such as “believe”, “expect”, “anticipate”, “should”, “could”, “would”, “plans”, “intend”, “project”, “estimate”, “forecast”, “may” or similar expressions. These forward-looking statements are subject to certain risks and uncertainties that could cause actual results to differ materially from those expressed in, or implied by, these statements. Readers are cautioned not to place undue reliance on any such forward-looking statements, which speak only as of the date made. Additionally, we undertake no obligation to update any statement in light of new information or future events, except as required under federal securities law.
Our ability to predict results or the actual effect of future plans or strategies is inherently uncertain. Factors that could have an impact on our ability to achieve operating results, growth plan goals and future prospects include, but are not limited to, the following:
|
•
|
credit quality deterioration or pronounced and sustained reduction in real estate market values could cause an increase in our allowance for credit losses and a reduction in net earnings;
|
|
•
|
the risks of mergers, including with Central Bancshares, including, without limitation, the related time and costs of implementing such transactions, integrating operations as part of these transactions and possible failures to achieve expected gains, revenue growth and/or expense savings from such transactions;
|
|
•
|
our management’s ability to reduce and effectively manage interest rate risk and the impact of interest rates in general on the volatility of our net interest income;
|
|
•
|
changes in the economic environment, competition, or other factors that may affect our ability to acquire loans or influence the anticipated growth rate of loans and deposits and the quality of the loan portfolio and loan and deposit pricing;
|
|
•
|
fluctuations in the value of our investment securities;
|
|
•
|
governmental monetary and fiscal policies;
|
|
•
|
legislative and regulatory changes, including changes in banking, securities and tax laws and regulations and their application by our regulators (particularly with respect to the Dodd-Frank Act and the extensive regulations promulgated and to be promulgated thereunder, as well as the Basel III Rules, which became effective January 1, 2015), and changes in the scope and cost of FDIC insurance and other coverages;
|
|
•
|
the ability to attract and retain key executives and employees experienced in banking and financial services;
|
|
•
|
the sufficiency of the allowance for loan losses to absorb the amount of actual losses inherent in our existing loan portfolio;
|
|
•
|
our ability to adapt successfully to technological changes to compete effectively in the marketplace;
|
|
•
|
credit risks and risks from concentrations (by geographic area and by industry) within our loan portfolio;
|
|
•
|
the effects of competition from other commercial banks, thrifts, mortgage banking firms, consumer finance companies, credit unions, securities brokerage firms, insurance companies, money market and other mutual funds, and other financial institutions operating in our markets or elsewhere or providing similar services;
|
16
|
•
|
the failure of assumptions underlying the establishment of allowances for loan losses and estimation of values of collateral and various financial assets and liabilities;
|
|
•
|
volatility of rate-sensitive deposits;
|
|
•
|
operational risks, including data processing system failures or fraud;
|
|
•
|
asset/liability matching risks and liquidity risks;
|
|
•
|
the costs, effects and outcomes of existing or future litigation;
|
|
•
|
changes in general economic or industry conditions, nationally or in the communities in which we conduct business;
|
|
•
|
changes in accounting policies and practices, as may be adopted by state and federal regulatory agencies and the Financial Accounting Standards Board; and
|
|
•
|
other factors and risks described under “Risk Factors” herein.
|
We qualify all of our forward-looking statements by the foregoing cautionary statements. Because of these risks and other uncertainties, our actual future results, performance or achievement, or industry results, may be materially different from the results indicated by these forward-looking statements. In addition, our past results of operations are not necessarily indicative of our future results.
|
I
TEM
1A.
|
R
ISK
F
ACTORS
.
|
An investment in our securities is subject to risks inherent in our business. Before making an investment decision, you should carefully consider the risks and uncertainties described below together with all of the other information included in this report. In addition to the risks and uncertainties described below, other risks and uncertainties not currently known to us or that we currently deem to be immaterial also may materially and adversely affect our business, financial condition and results of operations. The value or market price of our securities could decline due to any of these identified or other risks, and you could lose all or part of your investment.
Risks Related to Our Business
Interest rates and other conditions impact our results of operations.
Our profitability is in large part a function of the spread between the interest rates earned on investments and loans and the interest rates paid on deposits and other interest-bearing liabilities. Like most banking institutions, our net interest spread and margin is affected by general economic conditions and other factors, including fiscal and monetary policies of the federal government, that influence market interest rates and our ability to respond to changes in such rates. At any given time, our assets and liabilities will be such that they are affected differently by a given change in interest rates. As a result, an increase or decrease in rates, the length of loan terms or the mix of adjustable and fixed rate loans in our portfolio could have a positive or negative effect on our net income, capital and liquidity. The competition for loans in the marketplace and the overall interest rate environment has kept interest rates on loans low. Interest rates paid on deposit products have declined steadily in recent years, but further significant decline is unlikely as interest rates on deposits have approached zero. We expect to continue battling net interest margin compression in
2015
, with interest rates at generational lows.
We measure interest rate risk under various rate scenarios and using specific criteria and assumptions. A summary of this process, along with the results of our net interest income simulations, is presented at “Quantitative and Qualitative Disclosures about Market Risk” included under Item 7A of Part II of this Annual Report on Form 10-K. Although we believe our current level of interest rate sensitivity is reasonable and effectively managed, significant fluctuations in interest rates may have an adverse effect on our business, financial condition and results of operations.
Changes in interest rates also can affect the value of loans, securities and other assets. An increase in interest rates that adversely affects the ability of borrowers to pay the principal or interest on loans may lead to an increase in nonperforming assets and a reduction of income recognized, which could have a material adverse effect on our results of operations and cash flows. Further, when we place a loan on nonaccrual status, we reverse any accrued but unpaid interest receivable, which decreases interest income. Subsequently, we continue to have a cost to fund the loan, which is reflected as interest expense, without any interest income to offset the associated funding expense. Thus, an increase in the amount of nonperforming assets would have an adverse impact on net interest income.
Rising interest rates will likely result in a decline in value of our fixed-rate debt securities. The unrealized losses resulting from holding these securities would be recognized in other comprehensive income (or net income, if the decline is other-than-temporary), and reduce total shareholders’ equity. Unrealized losses do not negatively impact our regulatory capital ratios; however, tangible common equity and the associated ratios used by many investors would be reduced. If debt securities in an unrealized loss position are sold, such losses become realized and will reduce our regulatory capital ratios.
17
Our business is concentrated in and largely dependent upon the continued growth and welfare of the Iowa City and Oskaloosa markets and other markets in eastern and central Iowa.
Although our markets will expand into parts of Minnesota, Wisconsin and Florida if the merger with Central is completed, we operate primarily in the Iowa City and Oskaloosa, Iowa, markets and their surrounding communities in eastern and central Iowa. As a result, our financial condition, results of operations and cash flows are significantly impacted by changes in the economic conditions in those areas. Our success depends to a significant extent upon the business activity, population, income levels, deposits and real estate activity in these markets. Although our customers’ business and financial interests may extend well beyond these market areas, adverse economic conditions that affect these market areas could reduce our growth rate, affect the ability of our customers to repay their loans to us, affect the value of collateral underlying loans and generally affect our financial condition and results of operations. Because of our geographic concentration, we are less able than other regional or national financial institutions to diversify our credit risks across multiple markets. Although, in general, the Iowa economy and real estate market were not affected as severely as some other areas of the United States in recent years, they are not immune to challenging economic conditions that affect the United States and world economies.
Adverse weather affecting the markets we serve could hurt our business and prospects for growth.
Substantially all of our business is conducted in the State of Iowa, and a significant portion is conducted in rural communities. The Iowa economy, in general, is heavily dependent on agriculture and therefore the overall Iowa economy, and particularly the economies of the rural communities that we serve, can be greatly affected by severe weather conditions, including droughts, storms, tornadoes and flooding. Unfavorable weather conditions may decrease agricultural productivity or could result in damage to our branch locations or the property of our customers, all of which could adversely affect the local economy. An adverse affect on the economy of Iowa would negatively affect our profitability.
We must manage our credit risk effectively.
There are risks inherent in making any loan, including risks inherent in dealing with individual borrowers, risks of nonpayment, risks resulting from uncertainties as to the future value of collateral and risks resulting from changes in economic and industry conditions. We attempt to minimize our credit risk through prudent loan application approval procedures, careful monitoring of the concentration of our loans within specific industries and periodic independent reviews of outstanding loans by our credit review department. However, we cannot assure you that such approval and monitoring procedures will reduce these credit risks.
If the overall economic climate in the United States, generally, or our market areas, specifically, fails to continue to improve, or even if it does, our borrowers may experience difficulties in repaying their loans, and the level of nonperforming loans, charge-offs and delinquencies could rise and require increases in the provision for loan losses, which would cause our net income and return on equity to decrease.
A significant portion of the Bank’s loan portfolio consists of commercial loans, and we focus on lending to small to medium-sized businesses. The size of the loans we can offer to commercial customers is less than the size of the loans that our competitors with larger lending limits can offer. This may limit our ability to establish relationships with the area’s largest businesses. As a result, we may assume greater lending risks than financial institutions that have a lesser concentration of such loans and tend to make loans to larger businesses. Collateral for these loans generally includes accounts receivable, inventory, equipment and real estate. However, depending on the overall financial condition of the borrower, some loans are made on an unsecured basis. In addition to commercial loans and commercial real estate loans, MidWest
One
Bank is also active in residential mortgage and consumer lending. Should the economic climate worsen, or even if it does not, our borrowers may experience financial difficulties, and the level of nonperforming loans, charge-offs and delinquencies could rise, which could negatively impact our business.
Commercial, industrial and agricultural loans make up a significant portion of our loan portfolio.
Commercial, industrial and agricultural loans (including credit cards and commercially related overdrafts), were
$409.7 million
, or approximately
36.2%
of our total loan portfolio, as of
December 31, 2014
. Our commercial loans are primarily made based on the identified cash flow of the borrower and secondarily on the underlying collateral provided by the borrower. Most often, this collateral is accounts receivable, inventory and equipment. Credit support provided by the borrower for most of these loans and the probability of repayment is based on the liquidation value of the pledged collateral and enforcement of a personal guarantee, if any exists. As a result, in the case of loans secured by accounts receivable, the availability of funds for the repayment of these loans may be substantially dependent on the ability of the borrower to collect amounts due from its customers. The collateral securing these loans may depreciate over time, may be difficult to appraise and may fluctuate in value based on the
18
success of the business. In addition, if the U.S. economy fails to continue to improve, this could harm the businesses of our commercial and industrial customers and reduce the value of the collateral securing these loans.
Payments on agricultural loans are dependent on the successful operation or management of the farm property. The success of the farm may be affected by many factors outside the control of the borrower, including adverse weather conditions that prevent the planting of a crop or limit crop yields (such as hail, drought and floods), loss of livestock due to disease or other factors, declines in market prices for agricultural products (both domestically and internationally) and the impact of government regulations (including changes in price supports, subsidies and environmental regulations). In addition, many farms are dependent on a limited number of key individuals whose injury or death may significantly affect the successful operation of the farm. If the cash flow from a farming operation is diminished, the borrower’s ability to repay the loan may be impaired. The primary crops in our market areas are corn and soybeans. Accordingly, adverse circumstances affecting these crops could have an adverse effect on our agricultural real estate loan portfolio. Likewise, agricultural operating loans involve a greater degree of risk than lending on residential properties, particularly in the case of loans that are unsecured or secured by rapidly depreciating assets such as farm equipment or assets such as livestock or crops. In these cases, any repossessed collateral for a defaulted loan may not provide an adequate source of repayment of the outstanding loan balance as a result of the greater likelihood of damage, loss or depreciation.
Our loan portfolio has a significant concentration of commercial real estate loans, which involve risks specific to real estate value.
Commercial real estate lending comprises a significant portion of our lending business. Specifically, commercial real estate loans were
$426.5 million
, or approximately
37.6%
of our total loan portfolio, as of
December 31, 2014
. Of this amount,
$115.0 million
, or approximately
10.2%
of our total loan portfolio, are loans secured by owner-occupied property. The market value of real estate securing our commercial real estate loans can fluctuate significantly in a short period of time as a result of market conditions in the geographic area in which the real estate is located. Although a significant portion of such loans is secured by real estate as a secondary form of repayment, adverse developments affecting real estate values in one or more of our markets could increase the credit risk associated with our loan portfolio. Additionally, real estate lending typically involves higher loan principal amounts and the repayment of the loans generally is dependent, in large part, on sufficient income from the properties securing the loans to cover operating expenses and debt service. Economic events or governmental regulations outside of the control of the borrower or lender could negatively impact the future cash flow and market values of the affected properties.
If problems develop in the commercial real estate market, particularly within one or more of our markets, the value of collateral securing our commercial real estate loans could decline. In such case, we may not be able to realize the amount of security that we anticipated at the time of originating the loan, which could cause us to increase our provision for loan losses and adversely affect our operating results, financial condition and/or capital. We generally have not experienced a downturn in credit performance by our commercial real estate loan customers in recent years, but, in light of the continued general uncertainty that exists in the economy and credit markets nationally, there can be no guarantee that we will not experience any deterioration in such performance.
Our allowance for loan losses may prove to be insufficient to absorb losses in our loan portfolio.
We established our allowance for loan losses in consultation with the credit officers of MidWest
One
Bank and maintain it at a level considered appropriate by management to absorb probable loan losses that are inherent in the portfolio. The amount of future loan losses is susceptible to changes in economic, operating and other conditions, including changes in interest rates and the value of the underlying collateral, which are beyond our control, and such losses may exceed current estimates. At
December 31, 2014
, our allowance for loan losses as a percentage of total gross loans was
1.44%
and as a percentage of total nonperforming loans was approximately
125.7%
. Although management believes that the allowance for loan losses is appropriate to absorb probable loan losses on any existing loans that may become uncollectible, we cannot predict loan losses with certainty, and we cannot assure you that our allowance for loan losses will prove sufficient to cover actual loan losses in the future. Loan losses in excess of our reserves may adversely affect our business, financial condition and results of operations.
Nonperforming assets take significant time to resolve and adversely affect our results of operations and financial condition, and could result in further losses in the future.
As of
December 31, 2014
, our nonperforming loans (which consist of nonaccrual loans, loans past due 90 days or more and still accruing interest and loans modified under troubled debt restructurings) totaled
$13.0 million
, or
1.15%
of our loan portfolio, and our nonperforming assets (which include nonperforming loans plus other real estate owned) totaled
$14.9 million
, or
1.32%
of loans. In addition, we had
$4.7 million
in accruing loans that were 31-89 days delinquent as of
December 31, 2014
.
19
Our nonperforming assets adversely affect our net income in various ways. We do not record interest income on nonaccrual loans or other real estate owned, thereby adversely affecting our net income and returns on assets and equity, increasing our loan administration costs and adversely affecting our efficiency ratio. When we take collateral in foreclosure and similar proceedings, we are required to mark the collateral to its then-fair market value, which may result in a loss. These nonperforming loans and other real estate owned also increase our risk profile and the capital our regulators believe is appropriate in light of such risks. The resolution of nonperforming assets requires significant time commitments from management and can be detrimental to the performance of their other responsibilities. If we experience increases in nonperforming loans and nonperforming assets, our net interest income may be negatively impacted and our loan administration costs could increase, each of which could have an adverse effect on our net income and related ratios, such as return on assets and equity.
We may desire or be required to raise additional capital in the future, but that capital may not be available.
We are required by federal and state regulatory authorities to maintain adequate levels of capital to support our operations. We intend to grow our business organically and to explore opportunities to grow our business by taking advantage of attractive acquisition opportunities, and such growth plans may require us to raise additional capital to ensure that we have adequate levels of capital to support such growth on top of our current operations. We may at some point need to raise additional capital to support our growth plans and in this regard, in early 2013, we renewed our universal shelf-registration statement registering for future sale up to $25 million of securities that places us in a position to raise capital if the need were to arise or if an attractive opportunity were presented. Our ability to raise additional capital will depend on conditions in the capital markets, economic conditions and a number of other factors, including investor perceptions regarding the banking industry, market conditions and governmental activities, and on our financial condition and performance. Accordingly, we cannot assure you of our ability to raise additional capital, if needed or desired, on terms acceptable to us. If we cannot raise additional capital when needed or desired, our ability to further expand our operations through internal growth or acquisitions could be materially impaired.
Liquidity risks could affect operations and jeopardize our business, financial condition and results of operations.
Liquidity is essential to our business. An inability to raise funds through deposits, borrowings, the sale of loans and other sources could have a substantial negative effect on our liquidity. Our primary sources of funds consist of cash from operations, investment maturities and sales, deposits and funds from sales of capital securities. Additional liquidity is provided by brokered deposits, bank lines of credit, repurchase agreements and the ability to borrow from the Federal Reserve Bank and the Federal Home Loan Bank. Our access to funding sources in amounts adequate to finance or capitalize our activities or on terms that are acceptable to us could be impaired by factors that affect us directly or the financial services industry or economy in general, such as disruptions in the financial markets or negative views and expectations about the prospects for the financial services industry.
During periods of economic turmoil, the financial services industry and the credit markets generally may be materially and adversely affected by significant declines in asset values and by historically depressed levels of liquidity. As demonstrated by the recent financial crisis, under such circumstances, the liquidity issues are often particularly acute for regional and community banks, as larger financial institutions may curtail their lending to regional and community banks to reduce their exposure to the risks of other banks. Correspondent lenders may also reduce or even eliminate federal funds lines for their correspondent customers in difficult economic times. Furthermore, regional and community banks generally have less access to the capital markets than do the national and super-regional banks because of their smaller size and limited analyst coverage.
As a result, we rely more on our ability to generate deposits and effectively manage the repayment and maturity schedules of our loans and investment securities, respectively, to ensure that we have adequate liquidity to fund our operations. Any decline in available funding could adversely impact our ability to originate loans, invest in securities, meet our expenses, pay dividends to our stockholders, or to fulfill obligations such as repaying our borrowings or meeting deposit withdrawal demands, any of which could have a material adverse impact on our liquidity, business, financial condition and results of operations.
We operate in a highly regulated industry and the laws and regulations to which we are subject, or changes in them, or our failure to comply with them, may adversely affect us.
The Company and MidWest
One
Bank are subject to extensive regulation by multiple regulatory agencies. These regulations may affect the manner and terms of delivery of our services. If we do not comply with governmental regulations, we may be subject to fines, penalties, lawsuits or material restrictions on our businesses in the jurisdiction where the violation occurred, which may adversely affect our business operations. Changes in these regulations can significantly affect the services that we provide, as well as our costs of compliance with such regulations. In addition, adverse publicity and damage to our reputation arising from the failure or perceived failure to comply with legal, regulatory or contractual requirements could affect our ability to attract and retain customers.
20
Economic conditions since 2008, particularly in the financial markets, have resulted in government regulatory agencies and political bodies placing increased focus and scrutiny on the financial services industry. This environment has subjected financial institutions to additional restrictions, oversight and costs. In addition, new legislative and regulatory proposals, and modifications of existing regulations, continue to be introduced that could further increase the oversight of the financial services industry, impose restrictions on the operations and general ability of firms within the industry to conduct business consistent with historical practices, including in the areas of compensation, interest rates, financial product offerings and disclosures. If these regulatory trends continue, they could adversely affect our business and, in turn, our consolidated results of operations.
Monetary policies and regulations of the Federal Reserve could adversely affect our business, financial condition and results of operations.
In addition to being affected by general economic conditions, our earnings and growth are affected by the policies of the Federal Reserve. An important function of the Federal Reserve is to regulate the money supply and credit conditions. Among the instruments used by the Federal Reserve to implement these objectives are open market operations in U.S. government securities, adjustments of the discount rate and changes in reserve requirements against bank deposits. These instruments are used in varying combinations to influence overall economic growth and the distribution of credit, bank loans, investments and deposits. Their use also affects interest rates charged on loans or paid on deposits.
The monetary policies and regulations of the Federal Reserve have had a significant effect on the operating results of commercial banks in the past and are expected to continue to do so in the future. The effects of such policies upon our business, financial condition and results of operations cannot be predicted.
The repeal of federal prohibitions on payment of interest on business demand deposits could increase our interest expense.
All federal prohibitions on the ability of financial institutions to pay interest on business demand deposit accounts were repealed as part of the Dodd-Frank Act. As a result, some financial institutions have commenced offering interest on these demand deposits to compete for customers. Although this development has not meaningfully impacted our interest expense in the current low-rate, high-liquidity environment in which competition among financial institutions for deposits is generally low, competitive pressures in the future require us to pay interest on these demand deposits to attract and retain business customers, in which case our interest expense would increase and our net interest margin would decrease. This could have a material adverse effect on our business, financial condition and results of operations.
We could recognize losses on securities held in our securities portfolio, particularly if interest rates increase or economic and market conditions deteriorate.
As of
December 31, 2014
, the fair value of our securities portfolio was approximately
$526.2 million
. Factors beyond our control can significantly influence the fair value of securities in our portfolio and can cause potential adverse changes to the fair value of these securities. For example, fixed-rate securities acquired by us are generally subject to decreases in market value when interest rates rise. Additional factors include, but are not limited to, rating agency downgrades of the securities, defaults by the issuer or individual mortgagors with respect to the underlying securities, and instability in the credit markets. Any of the foregoing factors could cause an other-than-temporary impairment in future periods and result in realized losses. The process for determining whether impairment is other-than-temporary usually requires difficult, subjective judgments about the future financial performance of the issuer and any collateral underlying the security in order to assess the probability of receiving all contractual principal and interest payments on the security. Because of changing economic and market conditions affecting interest rates, the financial condition of issuers of the securities and the performance of the underlying collateral, we may recognize realized and/or unrealized losses in future periods, which could have an adverse effect on our financial condition and results of operations.
Our business has been and may continue to be adversely affected by conditions in the financial markets and economic conditions generally.
Although it has shown signs of improvement over the last two years, since late 2007, the U.S. economy has generally experienced challenging economic conditions. Business activity across a range of industries and regions remains reduced from historical levels under more favorable economic conditions. Likewise, many local governments have been experiencing certain difficulties, including lower tax revenues, which have impacted their ability to cover costs. Unemployment also generally remains at elevated levels. Under such conditions, the financial services industry has historically been affected by declines in the values of various significant asset classes, reduced levels of liquidity and the lack of opportunities to originate new loans. While these challenges are generally less severe today than during certain periods in the recent past, we continue to feel their impact, particularly with respect to loan originations.
21
As a result of these economic conditions, in recent years many lending institutions, including the Bank, have experienced declines in the performance of their loans, including commercial loans, commercial and residential real estate loans and consumer loans, from pre-2007 norms. Moreover, competition among depository institutions, particularly for quality loans, has increased significantly. There have been significant new laws and regulations regarding lending and funding practices and liquidity standards, with a potential for further regulation in the future, and bank regulatory agencies in general have been very aggressive in responding to concerns and trends identified in examinations, including through formal or informal enforcement actions or orders. The impact of new legislation in response to these developments may negatively impact our operations by restricting our business operations, including our ability to originate or sell loans, and adversely impact our financial performance or our stock price.
In addition, if the overall economic climate in the United States, generally, or our market areas, specifically, fails to continue to improve, this may affect consumer confidence levels and may cause adverse changes in payment patterns, causing increases in delinquencies and default rates, which may impact our charge-offs and provisions for credit losses. A worsening of these conditions likely would exacerbate the adverse effects on us and others in the financial services industry noted above.
We have investments in pools of performing and nonperforming loans that generate interest income with yields that may fluctuate considerably.
Although we decided to exit our loan pool participation line of business in 2010, we continue to hold investments in certain loan pools until their balances pay down. As of
December 31, 2014
, approximately
1%
of our earning assets were invested in loan pool participations, and approximately
2%
of our gross total revenue for the year ended
December 31, 2014
was derived from the loan pool participations. These loan pool participations represent a mixture of performing, subperforming and nonperforming loans and other real estate owned. As of
December 31, 2014
, our loan pool investment of
$21.5 million
consisted of loans secured by commercial real estate (
66.4%
), commercial operating (
4.4%
), single-family residential real estate (
15.6%
), and other loans (
13.6%
). The loan pool investment is a “nontraditional” activity that has, historically, provided us and our predecessor entities with a higher return than typical loans and investment securities, albeit with a higher level of risk as well. The return on investment in loan pool participations and the effect on profitability can be unpredictable due to fluctuations in the balance of loan pool participations and collections from borrowers by the loan pool servicer. Loan pool balances can be affected by the payment and refinancing activities of the borrowers resulting in pay-offs of the underlying loans and reduction in the balances. Collections from the individual borrowers are managed by the loan pool servicer and are affected by the borrower’s financial ability and willingness to pay, foreclosure and legal action, collateral value, and the economy in general. Any of these identified factors, and others not identified, could affect our return on loan pool investments.
Although we did not seek to purchase consumer or consumer real estate loans characterized as subprime or Alt-A credits, because the purchases of these assets were on a pool basis, we have acquired some subprime loans which have borrowers or guarantors having FICO scores below 640. Consumer-based paper makes up approximately
9.8%
of our loan pool investment and, as of
December 31, 2014
, approximately
1.1%
of the basis amount of our loan pool investment represented subprime credit. Because we do not originate the consumer-based loans that may be characterized as Alt-A, and because of the nature of the information provided to us with respect to any Alt-A loans in the loan pool participations, we are not able to verify the basis amount of our loan pool investment that represents Alt-A credit. Loans that are characterized as subprime and, to a lesser extent, Alt-A carry a higher risk of default by the underlying borrowers than other types of loans, which could affect the value of the overall loan pool investment.
Downgrades in the credit rating of one or more insurers that provide credit enhancement for our state and municipal securities portfolio may have an adverse impact on the market for, and valuation of, these types of securities.
We invest in tax-exempt and taxable state and local municipal securities, some of which are insured by monoline insurers. As of
December 31, 2014
, we had
$234.9 million
of municipal securities, which represented
44.6%
of our total securities portfolio. Following the onset of the financial crisis in recent years, several of these insurers came under scrutiny by rating agencies. Even though management generally purchases municipal securities on the overall credit strength of the issuer, the reduction in the credit rating of an insurer may negatively impact the market for and valuation of our investment securities. Such a downgrade could adversely affect our liquidity, financial condition and results of operations.
Recent legislative and regulatory reforms applicable to the financial services industry may have a significant impact on our business, financial condition and results of operations.
The laws, regulations, rules, policies and regulatory interpretations governing us are constantly evolving and may change significantly over time as Congress and various regulatory agencies react to adverse economic conditions or other matters. The global financial crisis of 2008-09 served as a catalyst for a number of significant changes in the financial services industry, including
22
the Dodd-Frank Act, which reformed the regulation of financial institutions in a comprehensive manner, and the Basel III regulatory capital reforms, which will increase both the amount and quality of capital that financial institutions must hold.
The Dodd-Frank Act, together with the regulations developed and to be developed thereunder, affects large and small financial institutions alike, including several provisions that impact how community banks, thrifts and small bank and thrift holding companies will operate in the future. Among other things, the Dodd-Frank Act changes the base for FDIC insurance assessments to a bank’s average consolidated total assets minus average tangible equity, rather than its deposit base, permanently raises the current standard deposit insurance limit to $250,000, and expands the FDIC’s authority to raise the premiums we pay for deposit insurance. The legislation allows financial institutions to pay interest on business checking accounts, contains provisions on mortgage-related matters (such as steering incentives, determinations as to a borrower’s ability to repay and prepayment penalties) and establishes the CFPB as an independent entity within the Federal Reserve. This entity has broad rulemaking, supervisory and enforcement authority over consumer financial products and services, including deposit products, residential mortgages, home-equity loans and credit cards. Moreover, the Dodd-Frank Act includes provisions that affect corporate governance and executive compensation at all publicly traded companies.
In addition, in July 2013, the U.S. federal banking authorities approved the implementation of the Basel III Rule. The Basel III Rule is applicable to all U.S. banks that are subject to minimum capital requirements as well as to bank and saving and loan holding companies, other than “small bank holding companies” (generally bank holding companies with consolidated assets of less than $1 billion). The Basel III Rules became effective on January 1, 2015 with a phase-in period through 2019 for many of the new rules.
The Basel III Rule not only increases most of the required minimum regulatory capital ratios, it introduces a new Common Equity Tier 1 Capital ratio and the concept of a capital conservation buffer. The Basel III Rule also expands the current definition of capital by establishing additional criteria that capital instruments must meet to be considered Additional Tier 1 Capital (i.e., Tier 1 Capital in addition to Common Equity) and Tier 2 Capital. A number of instruments that now generally qualify as Tier 1 Capital will not qualify or their qualifications will change when the Basel III Rule is fully implemented. However, the Basel III Rule permits banking organizations with less than $15 billion in assets to retain, through a one-time election, the existing treatment for accumulated other comprehensive income, which currently does not affect regulatory capital. The Basel III Rule has maintained the general structure of the current prompt corrective action thresholds while incorporating the increased requirements, including the Common Equity Tier 1 Capital ratio. In order to be a “well-capitalized” depository institution under the new regime, an institution must maintain a Common Equity Tier 1 Capital ratio of 6.5% or more, a Tier 1 Capital ratio of 8% or more, a Total Capital ratio of 10% or more, and a leverage ratio of 5% or more. Institutions must also maintain a capital conservation buffer consisting of Common Equity Tier 1 Capital.
These provisions, as well as any other aspects of current or proposed regulatory or legislative changes to laws applicable to the financial industry, will impact the profitability of our business activities and may change certain of our business practices, including the ability to offer new products, obtain financing, attract deposits, make loans, and achieve satisfactory interest spreads, and could expose us to additional costs, including increased compliance costs. These changes also may require us to invest significant management attention and resources to make any necessary changes to operations in order to comply, and could therefore also materially and adversely affect our business, financial condition and results of operations. Our management has reviewed the provisions of the Dodd-Frank Act and the Basel III Rule, and has determined that our institution is in compliance with the new rules. However, the ultimate effect of these changes on the financial services industry in general, and us in particular, will not be know for some time.
Our ability to pay dividends is subject to certain limitations and restrictions, and there is no guarantee that we will be able to continue paying the same level of dividends in the future that we have paid in the past or that we will be able to pay future dividends at all.
Our ability to pay dividends is limited by regulatory restrictions and the need to maintain sufficient consolidated capital. The ability of MidWest
One
Bank to pay dividends to us is limited by its obligations to maintain sufficient capital and liquidity and by other general restrictions on dividends that are applicable to MidWest
One
Bank, including the requirement under the Iowa Banking Act that it may not pay dividends in excess of its accumulated net profits. If these regulatory requirements are not met, MidWest
One
Bank will not be able to pay dividends to us, and we may be unable to pay dividends on our common stock.
In addition, as a bank holding company, our ability to declare and pay dividends is subject to the guidelines of the Federal Reserve regarding capital adequacy and dividends. The Federal Reserve guidelines generally require us to review the effects of the cash payment of dividends on common stock and other Tier 1 capital instruments (i.e., perpetual preferred stock and trust preferred debt) in light of our earnings, capital adequacy and financial condition. As a general matter, the Federal Reserve indicates
23
that the board of directors of a bank holding company (including a financial holding company) should eliminate, defer or significantly reduce the Company’s dividends if:
|
•
|
the company’s net income available to shareholders for the past four quarters, net of dividends previously paid during that period, is not sufficient to fully fund the dividends;
|
|
•
|
the prospective rate of earnings retention is inconsistent with the company’s capital needs and overall current and prospective financial condition; or
|
|
•
|
the company will not meet, or is in danger of not meeting, its minimum regulatory capital adequacy ratios.
|
As of
December 31, 2014
, we had
$15.5 million
of junior subordinated debentures held by a statutory business trust that we control. Interest payments on the debentures, which totaled
$0.3 million
for the year ended
December 31, 2014
, must be paid before we pay dividends on our capital stock, including our common stock. We have the right to defer interest payments on the debentures for up to 20 consecutive quarters. However, if we elect to defer interest payments, all deferred interest must be paid before we may pay dividends on our capital stock.
Our ability to attract and retain management and key personnel may affect future growth and earnings.
Much of our success and growth has been influenced by our ability to attract and retain management experienced in banking and financial services and familiar with the communities in our market areas. Our ability to retain our executive officers, current management teams, branch managers and loan officers will continue to be important to the successful implementation of our strategy. It is also critical, as we grow, to be able to attract and retain qualified additional management and loan officers with the appropriate level of experience and knowledge about our market areas to implement our community‑based operating strategy. The Dodd-Frank Act also directs the Federal Reserve to promulgate rules prohibiting excessive compensation paid to bank holding company executives. These rules, when adopted, may make it more difficult to attract and retain the people we need to operate our businesses and limit our ability to promote our objectives through our compensation and incentive programs. The unexpected loss of services of any key management personnel, or the inability to recruit and retain qualified personnel in the future, could have an adverse effect on our business, results of operations and financial condition.
We face intense competition in all phases of our business from banks and other financial institutions.
The banking and financial services businesses in our markets are highly competitive. Our competitors include large regional banks, local community banks, savings and loan associations, securities and brokerage companies, mortgage companies, insurance companies, finance companies, money market mutual funds, small local credit unions as well as large aggressive and expansion-minded credit unions, and other nonbank financial services providers. Many of these competitors are not subject to the same regulatory restrictions as we are. Many of our unregulated competitors compete across geographic boundaries and are able to provide customers with a competitive alternative to traditional banking services.
Increased competition in our markets may result in a decrease in the amounts of our loans and deposits, reduced spreads between loan rates and deposit rates or loan terms that are more favorable to the borrower. Any of these results could have a material adverse effect on our ability to grow and remain profitable. If increased competition causes us to significantly discount the interest rates we offer on loans or increase the amount we pay on deposits, our net interest income could be adversely impacted. If increased competition causes us to modify our underwriting standards, we could be exposed to higher losses from lending activities. Additionally, many of our competitors are much larger in total assets and capitalization, have greater access to capital markets, have larger lending limits and offer a broader range of financial services than we can offer.
We have a continuing need for technological change, and we may not have the resources to effectively implement new technology.
The financial services industry continues to undergo rapid technological changes with frequent introductions of new technology-driven products and services. In addition to enabling us to better serve our customers, the effective use of technology increases efficiency and the potential for cost reduction. Our future success will depend in part upon our ability to address the needs of our customers by using technology to provide products and services that will satisfy customer demands for convenience as well as to create additional efficiencies in our operations as we continue to grow our market share. Many of our larger competitors have substantially greater resources to invest in technological improvements. As a result, they may be able to offer additional or superior products to those that we will be able to offer, which could put us at a competitive disadvantage. Accordingly, we cannot provide you with assurance that we will be able to effectively implement new technology-driven products and services or be successful in marketing such products and services to our customers.
24
The Company’s information systems may experience an interruption or breach in security and cyber-attacks, all if which could have a material adverse effect on the Company’s business.
The Company relies heavily on internal and outsourced technologies, communications, and information systems to conduct its business. Additionally, in the normal course of business, the Company collects, processes and retains sensitive and confidential information regarding our customers. As the Company’s reliance on technology has increased, so have the potential risks of a technology-related operation interruption (such as disruptions in the Company’s customer relationship management, general ledger, deposit, loan, or other systems) or the occurrence of a cyber-attacks (such as unauthorized access to the Company’s systems). These risks have increased for all financial institutions as new technologies, the use of the Internet and telecommunications technologies (including mobile devices) to conduct financial and other business transactions and the increased sophistication and activities of organized crime, perpetrators of fraud, hackers, terrorists and others. In addition to cyber-attacks or other security breaches involving the theft of sensitive and confidential information, hackers recently have engaged in attacks against large financial institutions, particularly denial of service attacks, that are designed to disrupt key business services, such as customer-facing web sites. The Company is not able to anticipate or implement effective preventive measures against all security breaches of these types, especially because the techniques used change frequently and because attacks can originate from a wide variety of sources. However, applying guidance from FFIEC, the Company has analyzed and will continue to analyze security related to device specific considerations, user access topics, transaction-processing and network integrity.
The Company also faces risks related to cyber-attacks and other security breaches in connection with credit card and debit card transactions that typically involve the transmission of sensitive information regarding the Company’s customers through various third parties, including merchant acquiring banks, payment processors, payment card networks and its processors. Some of these parties have in the past been the target of security breaches and cyber-attacks, and because the transactions involve third parties and environments such as the point of sale that the Company does not control or secure, future security breaches or cyber-attacks affecting any of these third parties could impact the Company through no fault of its own, and in some cases it may have exposure and suffer losses for breaches or attacks relating to them. Further cyber-attacks or other breaches in the future, whether affecting the Company or others, could intensify consumer concern and regulatory focus and result in reduced use of payment cards and increased costs, all of which could have a material adverse effect on the Company’s business. To the extent we are involved in any future cyber-attacks or other breaches, the Company’s reputation could be affected, would could also have a material adverse effect on the Company’s business, financial condition or results of operations.
We are subject to certain operational risks, including, but not limited to, customer or employee fraud and data processing system failures and errors.
Employee errors and employee and customer misconduct could subject us to financial losses or regulatory sanctions and seriously harm our reputation. Misconduct by our employees could include hiding unauthorized activities from us, improper or unauthorized activities on behalf of our customers or improper use of confidential information. It is not always possible to prevent employee errors and misconduct, and the precautions we take to prevent and detect this activity may not be effective in all cases. Employee errors could also subject us to financial claims for negligence.
We maintain a system of internal controls and insurance coverage to mitigate against operational risks, including data processing system failures and errors and customer or employee fraud. Should our internal controls fail to prevent or detect an occurrence, and if any resulting loss is not insured or exceeds applicable insurance limits, such failure could have a material adverse effect on our business, financial condition and results of operations.
We are subject to changes in accounting principles, policies or guidelines.
Our financial performance is impacted by accounting principles, policies and guidelines. Some of these policies require the use of estimates and assumptions that may affect the value of our assets or liabilities and financial results. Some of our accounting policies are critical because they require management to make difficult, subjective and complex judgments about matters that are inherently uncertain and because it is likely that materially different amounts would be reported under different conditions or using different assumptions. If such estimates or assumptions underlying our financial statements are incorrect, we may experience material losses.
From time to time, the Financial Accounting Standards Board and the SEC change the financial accounting and reporting standards or the interpretation of those standards that govern the preparation of our financial statements. These changes are beyond our control, can be difficult to predict and could materially impact how we report our financial condition and results of operations. Changes in these standards are continuously occurring, and given recent economic conditions, more drastic changes may occur. The implementation of such changes could have a material adverse effect on our financial condition and results of operations.
25
Our framework for managing risks may not be effective in mitigating risk and loss to us.
Our risk management framework seeks to mitigate risk and loss to us. We have established processes and procedures intended to identify, measure, monitor, report and analyze the types of risk to which we are subject, including liquidity risk, credit risk, market risk, interest rate risk, operational risk, compensation risk, legal and compliance risk, and reputational risk, among others. However, as with any risk management framework, there are inherent limitations to our risk management strategies as there may exist, or develop in the future, risks that we have not appropriately anticipated or identified. Our ability to successfully identify and manage risks facing us is an important factor that can significantly impact our results. If our risk management framework proves ineffective, we could suffer unexpected losses and could be materially adversely affected.
Our reputation could be damaged by negative publicity.
Reputational risk, or the risk to our business, financial condition or results of operations from negative publicity, is inherent in our business. Negative publicity can result from actual or alleged conduct in a number of areas, including legal and regulatory compliance, lending practices, corporate governance, litigation, inadequate protection of customer data, ethical behavior of our employees, and from actions taken by regulators, ratings agencies and others as a result of that conduct. Damage to our reputation could impact our ability to attract new or maintain existing loan and deposit customers, employees and business relationships.
We have counterparty risk and therefore we may be adversely affected by the soundness of other financial institutions.
Our ability to engage in routine funding and other transactions could be negatively affected by the actions and the soundness of other financial institutions. Financial services institutions are generally interrelated as a result of trading, clearing, counterparty, credit or other relationships. We have exposure to many different industries and counterparties and regularly engage in transactions with counterparties in the financial services industry, including commercial banks, brokers and dealers, investment banks and other institutional customers. Many of these transactions may expose us to credit or other risks if another financial institution experiences adverse circumstances. In certain circumstances, the collateral that we hold may be insufficient to fully cover the risk that a counterparty defaults on its obligations, which may cause us to experience losses that could have a material adverse effect on our business, financial condition and results of operations.
There is a limited trading market for our common shares, and you may not be able to resell your shares at or above the price you paid for them.
Although our common shares are listed for quotation on the NASDAQ Global Select Market, the trading in our common shares has substantially less liquidity than many other companies listed on NASDAQ. A public trading market having the desired characteristics of depth, liquidity and orderliness depends on the presence in the market of willing buyers and sellers of our common shares at any given time. This presence depends on the individual decisions of investors and general economic and market conditions over which we have no control. We cannot assure you that the volume of trading in our common shares will increase in the future.
Certain shareholders own a significant interest in the company and may exercise their control in a manner detrimental to your interests.
Certain MidWest
One
shareholders who are descendants of our founder collectively control approximately
33.6%
of our outstanding common stock and may have the opportunity to exert influence on the outcome of matters required to be submitted to shareholders for approval. In addition, this significant level of ownership by members of the founding family may contribute to the rather limited liquidity of our common stock on the NASDAQ Global Select Market. As discussed below, if the merger with Central is consummated, additional shares will be issued to Central’s shareholders. However, the ownership of our common stock will still be concentrated among a small group of shareholders who continue to exert a significant influence over the Company.
Risks Related to Our Pending Merger With Central
If the merger with Central is completed, difficulties in combining the operations of Central and the Company may prevent the Company from achieving the expected benefits from the merger.
The Company may not be able to achieve fully the strategic objectives and operating efficiencies it hopes to achieve in the merger. The success of the merger will depend on a number of factors, including the Company’s ability to:
|
•
|
integrate the operations of Central and the Company, including successfully integrating and combining the technology, financial, credit, security and legal reporting systems and controls of the Company and Central;
|
|
•
|
maintain existing relationships with depositors so as to minimize withdrawals of deposits after the merger;
|
26
|
•
|
maintain and enhance existing relationships with borrowers so as to limit unanticipated losses from loans of Central’s banking subsidiary and the Bank;
|
|
•
|
control the incremental non-interest expense so as to maintain overall operating efficiencies; and
|
|
•
|
compete effectively in the communities served by Central and the Company.
|
If the merger is not completed, the Company will have incurred substantial expenses without realizing the expected benefits of the merger.
The Company has incurred and will incur substantial expenses in connection with the negotiation and completion of the transactions contemplated by the merger agreement with Central, as well as the costs and expenses of filing certain required documents with the SEC in connection with the merger. If the merger is not completed, the Company would have to recognize these expenses without realizing the expected benefits of the merger.
|
I
TEM
1B.
|
U
NRESOLVED
S
TAFF
C
OMMENTS
.
|
None.
27
|
I
TEM
2.
|
P
ROPERTIES
.
|
Our headquarters and MidWest
One
Bank’s main office are located at 102 South Clinton Street, Iowa City, Iowa, and consist of approximately 63,800 square feet. We currently operate 24 additional branches throughout central and east-central Iowa totaling approximately 120,000 square feet. The table below sets forth the locations of the Bank’s branch offices:
|
802 13th St.
|
3225 Division St.
|
|||
|
Belle Plaine, Iowa
|
Burlington, Iowa
|
|||
|
4510 Prairie Pkwy.
|
120 W. Center St.
|
|||
|
Cedar Falls, Iowa
|
Conrad, Iowa
|
|||
|
110 1st Ave.
|
101 W. Second St., Suite 100 †
|
|||
|
Coralville, Iowa
|
Davenport, Iowa
|
|||
|
2408 W. Burlington
|
58 East Burlington
|
|||
|
Fairfield, Iowa
|
Fairfield, Iowa
|
|||
|
926 Ave. G
|
509 S. Dubuque St. *†
|
|||
|
Ft. Madison, Iowa
|
Iowa City, Iowa
|
|||
|
1906 Keokuk St.
|
2233 Rochester Ave.
|
|||
|
Iowa City, Iowa
|
Iowa City, Iowa
|
|||
|
202 Main St.
|
10030 Hwy. 149
|
|||
|
Melbourne, Iowa
|
North English, Iowa
|
|||
|
465 Hwy. 965 NE, Suite A †
|
124 South First St.
|
|||
|
North Liberty, Iowa
|
Oskaloosa, Iowa
|
|||
|
222 First Ave. East *
|
116 W. Main St.
|
|||
|
Oskaloosa, Iowa
|
Ottumwa, Iowa
|
|||
|
1001 Hwy. 57
|
700 Main St. †
|
|||
|
Parkersburg, Iowa
|
Pella, Iowa
|
|||
|
500 Oskaloosa St.*
|
112 North Main St.
|
|||
|
Pella, Iowa
|
Sigourney, Iowa
|
|||
|
3110 Kimball Ave. †
|
305 W. Rainbow Dr.
|
|||
|
Waterloo, Iowa
|
West Liberty, Iowa
|
|||
|
* Drive up location only.
|
||||
|
† Leased office.
|
||||
In the second quarter of 2012 we completed the sale of our former Home Mortgage Center (“HMC”) office to the University of Iowa for its future building plans. Our HMC operation then relocated to approximately 6,000 square feet of leased space at 509 South Dubuque Street in Iowa City, approximately one block away from our former building. In December 2013 we entered into a contract for the construction of a new HMC next to the current leased space. The estimated cost of design and construction of the building is $16.0 million, with expected completion in 2015. The Bank owns 40 ATMs that are located within the communities served by branch offices. We believe each of our facilities is suitable and adequate to meet our current operational needs.
In August 2013 we entered into a contract for the restoration and remodeling of the building which serves as the main office of the Bank and headquarters of the Company. The estimated cost of the restoration and remodeling is $13.8 million, and it is anticipated that construction will be completed in April 2016.
|
I
TEM
3.
|
L
EGAL
P
ROCEEDINGS
.
|
We and our subsidiaries are from time to time parties to various legal actions arising in the normal course of business. We believe that there is no threatened or pending proceeding, other than ordinary routine litigation incidental to the Company’s
28
business, against us or our subsidiaries, which, if determined adversely, would have a material adverse effect on our consolidated business or financial condition.
|
I
TEM
4.
|
M
INE
S
AFETY
D
ISCLOSURES
.
|
Not applicable.
|
I
TEM
5.
|
M
ARKET FOR
R
EGISTRANT’S
C
OMMON
E
QUITY
, R
ELATED
S
TOCKHOLDER
M
ATTERS AND
I
SSUER
P
URCHASES OF
E
QUITY
S
ECURITIES
.
|
Our common stock is listed on the NASDAQ Global Select Market under the symbol “MOFG.” The following table presents for the periods indicated the high and low sale price for our common stock as reported on the NASDAQ Global Select Market:
|
Cash
|
|||||||||||||
|
Dividend
|
|||||||||||||
|
High
|
Low
|
Declared
|
|||||||||||
|
2013
|
|||||||||||||
|
First Quarter
|
$
|
24.25
|
|
$
|
20.80
|
|
$
|
0.125
|
|
||||
|
Second Quarter
|
24.25
|
|
23.14
|
|
0.125
|
|
|||||||
|
Third Quarter
|
28.48
|
|
23.40
|
|
0.125
|
|
|||||||
|
Fourth Quarter
|
29.30
|
|
23.50
|
|
0.125
|
|
|||||||
|
2014
|
|||||||||||||
|
First Quarter
|
$
|
27.67
|
|
$
|
23.53
|
|
$
|
0.145
|
|
||||
|
Second Quarter
|
26.18
|
|
22.50
|
|
0.145
|
|
|||||||
|
Third Quarter
|
24.95
|
|
23.00
|
|
0.145
|
|
|||||||
|
Fourth Quarter
|
29.10
|
|
22.73
|
|
0.145
|
|
|||||||
As of
March 3, 2015
, there were
8,370,309
shares of common stock outstanding held by approximately
480
holders of record. Additionally, there are an estimated
1,938
beneficial holders whose stock was held in street name by brokerage houses and other nominees as of that date.
Dividends
We may pay dividends on our common stock as and when declared by our Board of Directors out of any funds legally available for the payment of such dividends, subject to any and all preferences and rights of any preferred stock or a series thereof. The amount of dividend payable will depend upon our earnings and financial condition and other factors, including applicable governmental regulations and policies. See “
Supervision and Regulation - The Company - Dividend Payments
”
Repurchases of Company Equity Securities
On
July 17, 2014
, the board of directors of the Company approved a new share repurchase program, allowing for the repurchase of up to
$5.0 million
of stock through
December 31, 2016
. The new repurchase program replaced the Company's prior repurchase program, pursuant to which the Company had repurchased approximately
$3.7 million
of common stock since January 15, 2013. Pursuant to the new program, the Company may continue to repurchase shares from time to time in the open market, and the method, timing and amounts of repurchase will be solely in the discretion of the Company's management. The repurchase program does not require the Company to acquire a specific number of shares. Therefore, the amount of shares repurchased pursuant to the program will depend on several factors, including market conditions, capital and liquidity requirements, and alternative uses for cash available. During 2014 under the July 17, 2014 repurchase program the Company repurchased
$1.2 million
of common stock. Of the
$5.0 million
of stock authorized under the repurchase plan,
$3.8 million
remained available for possible future repurchases as of
December 31, 2014
. There were no repurchases of stock in the 4th quarter of
2014
.
29
Performance Graph
The following table compares MidWest
One
’s performance, as measured by the change in price of its common stock plus reinvested dividends, with the NASDAQ Composite Index and the SNL-Midwestern Banks Index for the five years ended
December 31, 2014
.
MidWest
One
Financial Group, Inc.
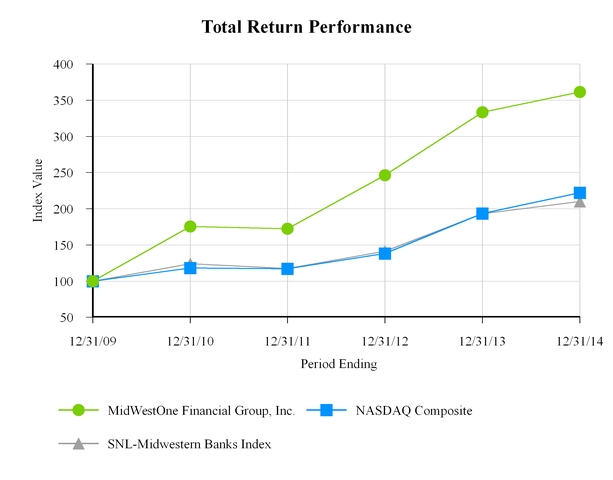
|
At
|
|||||||||||||||||||||||
|
Index
|
12/31/2009
|
12/31/2010
|
12/31/2011
|
12/31/2012
|
12/31/2013
|
12/31/2014
|
|||||||||||||||||
|
MidWest
One
Financial Group, Inc.
|
$
|
100.00
|
|
$
|
175.45
|
|
$
|
172.37
|
|
$
|
246.30
|
|
$
|
333.43
|
|
$
|
361.37
|
|
|||||
|
NASDAQ Composite
|
100.00
|
|
118.15
|
|
117.22
|
|
138.02
|
|
193.47
|
|
222.16
|
|
|||||||||||
|
SNL-Midwestern Banks Index
|
100.00
|
|
124.18
|
|
117.30
|
|
141.18
|
|
193.28
|
|
210.12
|
|
|||||||||||
The banks in the custom peer group - SNL-Midwestern Banks Index - represent all publicly traded banks, thrifts or financial service companies located in Iowa, Illinois, Indiana, Kansas, Kentucky, Michigan, Minnesota, Missouri, North Dakota, Nebraska, Ohio, South Dakota and Wisconsin.
30
|
I
TEM
6.
|
S
ELECTED
F
INANCIAL
D
ATA
.
|
The following selected financial data for each of the five years in the period ended
December 31, 2014
, have been derived from our audited consolidated financial statements and the results of operations for each of the five years in the period ended
December 31, 2014
. This financial data should be read in conjunction with the financial statements and the related notes thereto.
|
Year Ended December 31,
|
||||||||||||||||||||
|
(In thousands, except per share data)
|
2014
|
2013
|
2012
|
2011
|
2010
|
|||||||||||||||
|
Summary of Income Data:
|
||||||||||||||||||||
|
Total interest income excluding loan pool participations
|
$
|
62,888
|
|
$
|
64,048
|
|
$
|
67,324
|
|
$
|
67,473
|
|
$
|
68,350
|
|
|||||
|
Total interest and discount on loan pool participations
|
1,516
|
|
2,046
|
|
1,978
|
|
1,108
|
|
2,631
|
|
||||||||||
|
Total interest income including loan pool participations
|
64,404
|
|
66,094
|
|
69,302
|
|
68,581
|
|
70,981
|
|
||||||||||
|
Total interest expense
|
9,551
|
|
12,132
|
|
15,952
|
|
19,783
|
|
23,116
|
|
||||||||||
|
Net interest income
|
54,853
|
|
53,962
|
|
53,350
|
|
48,798
|
|
47,865
|
|
||||||||||
|
Provision for loan losses
|
1,200
|
|
1,350
|
|
2,379
|
|
3,350
|
|
5,950
|
|
||||||||||
|
Noninterest income
|
15,313
|
|
14,728
|
|
19,737
|
|
14,707
|
|
14,388
|
|
||||||||||
|
Noninterest expense
|
43,413
|
|
42,087
|
|
48,960
|
|
42,235
|
|
43,289
|
|
||||||||||
|
Income before income tax
|
25,553
|
|
25,253
|
|
21,748
|
|
17,920
|
|
13,014
|
|
||||||||||
|
Income tax expense (benefit)
|
7,031
|
|
6,646
|
|
5,214
|
|
4,609
|
|
3,209
|
|
||||||||||
|
Net income
|
$
|
18,522
|
|
$
|
18,607
|
|
$
|
16,534
|
|
$
|
13,311
|
|
$
|
9,805
|
|
|||||
|
Less: Preferred stock dividends and discount accretion
|
—
|
|
—
|
|
—
|
|
645
|
|
868
|
|
||||||||||
|
Net income available to common shareholders
|
$
|
18,522
|
|
$
|
18,607
|
|
$
|
16,534
|
|
$
|
12,666
|
|
$
|
8,937
|
|
|||||
|
Per share data:
|
||||||||||||||||||||
|
Net income - basic
|
$
|
2.20
|
|
$
|
2.19
|
|
$
|
1.95
|
|
$
|
1.47
|
|
$
|
1.04
|
|
|||||
|
Net income - diluted
|
2.19
|
|
2.18
|
|
1.94
|
|
1.47
|
|
1.03
|
|
||||||||||
|
Net income, exclusive of loss on termination of pension and gain on sale of Home Mortgage Center - diluted
|
2.19
|
|
2.18
|
|
2.10
|
|
1.47
|
|
1.03
|
|
||||||||||
|
Net income, exclusive of merger-related expenses - diluted
|
2.31
|
|
2.18
|
|
1.94
|
|
1.47
|
|
1.03
|
|
||||||||||
|
Cash dividends declared
|
0.58
|
|
0.50
|
|
0.36
|
|
0.22
|
|
0.20
|
|
||||||||||
|
Book value
|
23.07
|
|
20.99
|
|
20.51
|
|
18.35
|
|
18.39
|
|
||||||||||
|
Net tangible book value
|
22.08
|
|
19.95
|
|
19.39
|
|
17.15
|
|
15.27
|
|
||||||||||
|
Selected financial ratios:
|
||||||||||||||||||||
|
Return on average assets
|
1.05
|
%
|
1.06
|
%
|
0.96
|
%
|
0.82
|
%
|
0.63
|
%
|
||||||||||
|
Return on average assets, exclusive of loss on termination of pension and gain on sale of Home Mortgage Center
|
1.05
|
|
1.06
|
|
1.03
|
|
0.82
|
|
0.63
|
|
||||||||||
|
Return on average shareholders’ total equity
|
9.94
|
|
10.59
|
|
9.99
|
|
8.42
|
|
6.24
|
|
||||||||||
|
Return on average shareholders’ total equity, exclusive of loss on termination of pension and gain on sale of Home Mortgage Center
|
9.94
|
|
10.59
|
|
10.77
|
|
8.42
|
|
6.24
|
|
||||||||||
|
Return on average common equity
|
9.94
|
|
10.59
|
|
10.13
|
|
8.87
|
|
6.93
|
|
||||||||||
|
Return on average tangible common equity
|
10.61
|
|
11.43
|
|
10.95
|
|
9.50
|
|
7.41
|
|
||||||||||
|
Return on average tangible common equity, exclusive of loss on termination of pension and gain on sale of Home Mortgage Center
|
10.61
|
|
11.43
|
|
11.78
|
|
9.50
|
|
7.41
|
|
||||||||||
|
Dividend payout ratio
|
26.36
|
|
22.83
|
|
18.46
|
|
14.97
|
|
19.23
|
|
||||||||||
|
Total shareholders’ equity to total assets
|
10.71
|
|
10.14
|
|
9.70
|
|
9.23
|
|
10.02
|
|
||||||||||
|
Tangible common equity to tangible assets
|
10.29
|
|
9.69
|
|
9.22
|
|
8.68
|
|
8.37
|
|
||||||||||
|
Tier 1 capital to average assets
|
10.85
|
|
10.55
|
|
9.65
|
|
9.44
|
|
10.28
|
|
||||||||||
|
Tier 1 capital to risk-weighted assets
|
13.47
|
|
13.36
|
|
12.56
|
|
12.19
|
|
13.15
|
|
||||||||||
|
Net interest margin
|
3.53
|
|
3.46
|
|
3.46
|
|
3.34
|
|
3.43
|
|
||||||||||
|
Efficiency ratio
|
58.74
|
|
57.23
|
|
67.32
|
|
62.94
|
|
64.44
|
|
||||||||||
|
Efficiency ratio, exclusive of loss on termination of pension
|
58.74
|
|
57.23
|
|
58.82
|
|
62.94
|
|
64.44
|
|
||||||||||
|
Gross revenue of loan pools to total gross revenue
|
2.16
|
|
2.98
|
|
2.71
|
|
1.74
|
|
4.23
|
|
||||||||||
|
Allowance for bank loan losses to total bank loans
|
1.44
|
|
1.49
|
|
1.54
|
|
1.59
|
|
1.62
|
|
||||||||||
|
Allowance for loan pool losses to total loan pools
|
9.94
|
|
7.71
|
|
5.65
|
|
4.09
|
|
3.14
|
|
||||||||||
|
Non-performing loans to total loans
|
1.15
|
|
1.27
|
|
1.03
|
|
1.84
|
|
2.11
|
|
||||||||||
|
Net loans charged off to average loans
|
0.09
|
|
0.11
|
|
0.21
|
|
0.30
|
|
0.50
|
|
||||||||||
31
|
Year Ended December 31,
|
||||||||||||||||||||
|
(In thousands)
|
2014
|
2013
|
2012
|
2011
|
2010
|
|||||||||||||||
|
Selected balance sheet data:
|
||||||||||||||||||||
|
Total assets
|
$
|
1,800,302
|
|
$
|
1,755,218
|
|
$
|
1,792,819
|
|
$
|
1,695,244
|
|
$
|
1,581,259
|
|
|||||
|
Total loans net of unearned discount
|
1,132,519
|
|
1,088,412
|
|
1,035,284
|
|
986,173
|
|
938,035
|
|
||||||||||
|
Allowance for loan losses
|
16,363
|
|
16,179
|
|
15,957
|
|
15,676
|
|
15,167
|
|
||||||||||
|
Loan pool participations, net
|
19,332
|
|
25,533
|
|
35,650
|
|
50,052
|
|
65,871
|
|
||||||||||
|
Total deposits
|
1,408,542
|
|
1,374,942
|
|
1,399,733
|
|
1,306,642
|
|
1,219,328
|
|
||||||||||
|
Federal funds purchased and repurchase agreements
|
78,229
|
|
66,665
|
|
68,823
|
|
57,207
|
|
50,194
|
|
||||||||||
|
Federal Home Loan Bank advances
|
93,000
|
|
106,900
|
|
120,120
|
|
140,014
|
|
127,200
|
|
||||||||||
|
Long-term debt
|
15,464
|
|
15,464
|
|
15,464
|
|
15,464
|
|
15,464
|
|
||||||||||
|
Total shareholders’ equity
|
192,731
|
|
178,016
|
|
173,932
|
|
156,494
|
|
158,466
|
|
||||||||||
Non-GAAP Presentations:
Certain non-GAAP ratios and amounts are provided to evaluate and measure the Company’s operating performance and financial condition, including return on average tangible common equity,
tangible common equity to tangible assets, Tier 1 capital to average assets, Tier 1 capital to risk-weighted assets, and efficiency ratio, as well as certain of these and other financial metrics excluding the effects of a loss on termination of pension and gain on sale of Home Mortgage Center, and earnings per diluted share - excluding merger-related expenses, as further discussed under
Item 7. Management’s Discussion and Analysis of Financial Condition and Results of Operations
. Management believes these ratios and amounts provide investors with information regarding the Company’s balance sheet, profitability, financial condition and capital adequacy and how management evaluates such metrics internally. The following tables provide a reconciliation of each non-GAAP measure to the most comparable GAAP equivalent.
|
For the Year Ended December 31,
|
|||||||||||||||||||||
|
(dollars in thousands)
|
2014
|
2013
|
2012
|
2011
|
2010
|
||||||||||||||||
|
Average Tangible Common Equity
|
|||||||||||||||||||||
|
Average total shareholders’ equity
|
$
|
186,375
|
|
$
|
175,666
|
|
$
|
165,429
|
|
$
|
158,146
|
|
$
|
157,190
|
|
||||||
|
Less:
|
Average preferred stock
|
—
|
|
—
|
|
—
|
|
(8,032
|
)
|
(15,734
|
)
|
||||||||||
|
Average goodwill and intangibles
|
(8,477
|
)
|
(9,073
|
)
|
(9,785
|
)
|
(10,613
|
)
|
(11,760
|
)
|
|||||||||||
|
Average tangible common equity
|
$
|
177,898
|
|
$
|
166,593
|
|
$
|
155,644
|
|
$
|
139,501
|
|
$
|
129,696
|
|
||||||
|
Net Income
|
|||||||||||||||||||||
|
Net income available to common shareholders
|
$
|
18,522
|
|
$
|
18,607
|
|
$
|
16,534
|
|
$
|
12,666
|
|
$
|
8,937
|
|
||||||
|
Plus:
|
Intangible amortization, net of tax
(1)
|
356
|
|
431
|
|
513
|
|
591
|
|
679
|
|
||||||||||
|
Adjusted net income available to common shareholders
|
$
|
18,878
|
|
$
|
19,038
|
|
$
|
17,047
|
|
$
|
13,257
|
|
$
|
9,616
|
|
||||||
|
Plus:
|
Loss on termination of pension
|
—
|
|
—
|
|
6,088
|
|
—
|
|
—
|
|
||||||||||
|
Less:
|
Gain on sale of Home Mortgage Center
|
—
|
|
—
|
|
(4,047
|
)
|
—
|
|
—
|
|
||||||||||
|
Net tax effect of above items
(2)
|
—
|
|
—
|
|
(755
|
)
|
—
|
|
—
|
|
|||||||||||
|
Adjusted net income available to common shareholders, exclusive of loss on termination of pension and gain on sale of Home Mortgage Center
|
$
|
18,878
|
|
$
|
19,038
|
|
$
|
18,333
|
|
$
|
13,257
|
|
$
|
9,616
|
|
||||||
|
Return on Average Tangible Common Equity
|
10.61
|
%
|
11.43
|
%
|
10.95
|
%
|
9.50
|
%
|
7.41
|
%
|
|||||||||||
|
Return on Average Tangible Common Equity, Exclusive of Loss on Termination of Pension and Gain on Sale of Home Mortgage Center
|
10.61
|
%
|
11.43
|
%
|
11.78
|
%
|
9.50
|
%
|
7.41
|
%
|
|||||||||||
|
(1) Computed on a tax-equivalent basis, assuming a federal income tax rate of 34% for 2010, 2011, and 2012, and 35% for 2013 and 2014
|
|||||||||||||||||||||
|
(2) Computed assuming a combined state and federal tax rate of 37% for 2012.
|
|||||||||||||||||||||
32
|
As of or for the Year Ended December 31,
|
|||||||||||||||||||||
|
(dollars in thousands, except per share data)
|
2014
|
2013
|
2012
|
2011
|
2010
|
||||||||||||||||
|
Tangible Common Equity
|
|||||||||||||||||||||
|
Total shareholders’ equity
|
$
|
192,731
|
|
$
|
178,016
|
|
$
|
173,932
|
|
$
|
156,494
|
|
$
|
158,466
|
|
||||||
|
Less:
|
Preferred stock
|
—
|
|
—
|
|
—
|
|
—
|
|
(15,767
|
)
|
||||||||||
|
Goodwill and intangibles
|
(8,259
|
)
|
(8,806
|
)
|
(9,469
|
)
|
(10,247
|
)
|
(11,243
|
)
|
|||||||||||
|
Tangible common equity
|
$
|
184,472
|
|
$
|
169,210
|
|
$
|
164,463
|
|
$
|
146,247
|
|
$
|
131,456
|
|
||||||
|
Tangible Assets
|
|||||||||||||||||||||
|
Total assets
|
$
|
1,800,302
|
|
$
|
1,755,218
|
|
$
|
1,792,819
|
|
$
|
1,695,244
|
|
$
|
1,581,259
|
|
||||||
|
Less:
|
Goodwill and intangibles
|
(8,259
|
)
|
(8,806
|
)
|
(9,469
|
)
|
(10,247
|
)
|
(11,243
|
)
|
||||||||||
|
Tangible Assets
|
$
|
1,792,043
|
|
$
|
1,746,412
|
|
$
|
1,783,350
|
|
$
|
1,684,997
|
|
$
|
1,570,016
|
|
||||||
|
Common shares outstanding
|
8,355,666
|
|
8,481,799
|
|
8,480,488
|
|
8,529,530
|
|
8,614,790
|
|
|||||||||||
|
Tangible Book Value Per Share
|
$
|
22.08
|
|
$
|
19.95
|
|
$
|
19.39
|
|
$
|
17.15
|
|
$
|
15.27
|
|
||||||
|
Tangible Common Equity to Tangible Assets
|
10.29
|
%
|
9.69
|
%
|
9.22
|
%
|
8.68
|
%
|
8.37
|
%
|
|||||||||||
|
Tier 1 Capital
|
|||||||||||||||||||||
|
Total shareholders’ equity
|
$
|
192,731
|
|
$
|
178,016
|
|
$
|
173,932
|
|
$
|
156,494
|
|
$
|
158,466
|
|
||||||
|
Plus:
|
Long term debt (qualifying restricted core capital)
|
15,464
|
|
15,464
|
|
15,464
|
|
15,464
|
|
15,464
|
|
||||||||||
|
Less:
|
Net unrealized gains on securities available for sale, net of tax
|
(5,322
|
)
|
(1,049
|
)
|
(11,050
|
)
|
(5,982
|
)
|
(822
|
)
|
||||||||||
|
Disallowed goodwill and intangibles
|
(8,511
|
)
|
(9,036
|
)
|
(9,617
|
)
|
(10,374
|
)
|
(11,327
|
)
|
|||||||||||
|
Tier 1 capital
|
$
|
194,362
|
|
$
|
183,395
|
|
$
|
168,729
|
|
$
|
155,602
|
|
$
|
161,781
|
|
||||||
|
Average Assets
|
|||||||||||||||||||||
|
Quarterly average assets
|
$
|
1,799,666
|
|
$
|
1,746,313
|
|
$
|
1,757,910
|
|
$
|
1,658,738
|
|
$
|
1,584,616
|
|
||||||
|
Less:
|
Disallowed goodwill and intangibles
|
(8,511
|
)
|
(9,036
|
)
|
(9,617
|
)
|
(10,374
|
)
|
(11,327
|
)
|
||||||||||
|
Average assets
|
$
|
1,791,155
|
|
$
|
1,737,277
|
|
$
|
1,748,293
|
|
$
|
1,648,364
|
|
$
|
1,573,289
|
|
||||||
|
Tier 1 Capital to Average Assets
|
10.85
|
%
|
10.56
|
%
|
9.65
|
%
|
9.44
|
%
|
10.28
|
%
|
|||||||||||
|
Risk-weighted assets
|
$
|
1,442,585
|
|
$
|
1,372,648
|
|
$
|
1,343,194
|
|
$
|
1,276,512
|
|
$
|
1,230,264
|
|
||||||
|
Tier 1 Capital to Risk-Weighted Assets
|
13.47
|
%
|
13.36
|
%
|
12.56
|
%
|
12.19
|
%
|
13.15
|
%
|
|||||||||||
|
Operating Expense
|
|||||||||||||||||||||
|
Total noninterest expense
|
$
|
43,413
|
|
$
|
42,087
|
|
$
|
48,960
|
|
$
|
42,235
|
|
$
|
43,289
|
|
||||||
|
Less:
|
Amortization of intangibles and goodwill impairment
|
(547
|
)
|
(663
|
)
|
(778
|
)
|
(896
|
)
|
(1,029
|
)
|
||||||||||
|
Operating expense
|
$
|
42,866
|
|
$
|
41,424
|
|
$
|
48,182
|
|
$
|
41,339
|
|
$
|
42,260
|
|
||||||
|
Less:
|
Loss on termination of pension
|
—
|
|
—
|
|
(6,088
|
)
|
—
|
|
—
|
|
||||||||||
|
Operating expense, exclusive of loss on termination of pension
|
$
|
42,866
|
|
$
|
41,424
|
|
$
|
42,094
|
|
$
|
41,339
|
|
$
|
42,260
|
|
||||||
|
Operating Revenue
|
|||||||||||||||||||||
|
Tax-equivalent net interest income
(1)
|
$
|
58,890
|
|
$
|
57,720
|
|
$
|
56,481
|
|
$
|
51,261
|
|
$
|
50,227
|
|
||||||
|
Plus:
|
Noninterest income
|
15,313
|
|
14,728
|
|
19,737
|
|
14,707
|
|
14,388
|
|
||||||||||
|
Impairment losses on investment securities
|
—
|
|
—
|
|
345
|
|
9
|
|
708
|
|
|||||||||||
|
Less:
|
Gain on sale or call of available for sale securities
|
1,227
|
|
65
|
|
805
|
|
490
|
|
453
|
|
||||||||||
|
Gain (loss) on sale of premises and equipment
|
(1
|
)
|
(3
|
)
|
4,188
|
|
(195
|
)
|
(709
|
)
|
|||||||||||
|
Operating Revenue
|
$
|
72,977
|
|
$
|
72,386
|
|
$
|
71,570
|
|
$
|
65,682
|
|
$
|
65,579
|
|
||||||
|
Efficiency Ratio
|
58.74
|
%
|
57.23
|
%
|
67.32
|
%
|
62.94
|
%
|
64.44
|
%
|
|||||||||||
|
Efficiency Ratio, Exclusive of Loss on Termination of Pension
|
58.74
|
%
|
57.23
|
%
|
58.82
|
%
|
62.94
|
%
|
64.44
|
%
|
|||||||||||
|
(1) Computed on a tax-equivalent basis, assuming a federal income tax rate of 34% for 2010, 2011, and 2012, and 35% for 2013 and 2014
|
|||||||||||||||||||||
33
|
For the Year Ended December 31,
|
|||||||||||||||||||||
|
(dollars in thousands, except per share data)
|
2014
|
2013
|
2012
|
2011
|
2010
|
||||||||||||||||
|
Net Interest Margin Tax Equivalent Adjustment
|
|||||||||||||||||||||
|
Net interest income
|
$
|
54,853
|
|
$
|
53,962
|
|
$
|
53,350
|
|
$
|
48,798
|
|
$
|
47,865
|
|
||||||
|
Plus tax equivalent adjustment:
(1)
|
|||||||||||||||||||||
|
Loans
|
1,157
|
|
963
|
|
827
|
|
473
|
|
324
|
|
|||||||||||
|
Securities
|
2,880
|
|
2,795
|
|
2,304
|
|
1,990
|
|
2,038
|
|
|||||||||||
|
Tax equivalent net interest income
(1)
|
$
|
58,890
|
|
$
|
57,720
|
|
$
|
56,481
|
|
$
|
51,261
|
|
$
|
50,227
|
|
||||||
|
Average interest-earning assets
|
$
|
1,669,130
|
|
$
|
1,667,251
|
|
$
|
1,630,835
|
|
$
|
1,536,596
|
|
$
|
1,466,265
|
|
||||||
|
Net Interest Margin
|
3.53
|
%
|
3.46
|
%
|
3.46
|
%
|
3.34
|
%
|
3.43
|
%
|
|||||||||||
|
Net Income
|
$
|
18,522
|
|
$
|
18,607
|
|
$
|
16,534
|
|
$
|
13,311
|
|
$
|
9,805
|
|
||||||
|
Net Income Available to Common Shareholders
|
$
|
18,522
|
|
$
|
18,607
|
|
$
|
16,534
|
|
$
|
12,666
|
|
$
|
8,937
|
|
||||||
|
Plus:
|
Loss on termination of pension
|
—
|
|
—
|
|
6,088
|
|
—
|
|
—
|
|
||||||||||
|
Merger-related expenses
|
1,061
|
|
—
|
|
—
|
|
—
|
|
—
|
|
|||||||||||
|
Less:
|
Gain on sale of Home Mortgage Center
|
—
|
|
—
|
|
(4,047
|
)
|
—
|
|
—
|
|
||||||||||
|
Net tax effect of above items
(2)
|
(111
|
)
|
—
|
|
(755
|
)
|
—
|
|
—
|
|
|||||||||||
|
Net income, exclusive of loss on termination of pension and gain on sale of Home Mortgage Center, and merger-related expenses
|
$
|
19,472
|
|
$
|
18,607
|
|
$
|
17,820
|
|
$
|
13,311
|
|
$
|
9,805
|
|
||||||
|
Net income available to common shareholders, exclusive of loss on termination of pension and gain on sale of Home Mortgage Center, and merger-related expenses
|
$
|
19,472
|
|
$
|
18,607
|
|
$
|
17,820
|
|
$
|
12,666
|
|
$
|
8,937
|
|
||||||
|
Average Assets
|
$
|
1,760,776
|
|
$
|
1,756,344
|
|
$
|
1,721,792
|
|
$
|
1,628,253
|
|
$
|
1,559,035
|
|
||||||
|
Average Equity
|
$
|
186,375
|
|
$
|
175,666
|
|
$
|
165,429
|
|
$
|
158,146
|
|
$
|
157,190
|
|
||||||
|
Diluted average number of shares
|
8,433,296
|
|
8,525,119
|
|
8,527,544
|
|
8,632,856
|
|
8,637,713
|
|
|||||||||||
|
Return on Average Assets
|
1.05
|
%
|
1.06
|
%
|
0.96
|
%
|
0.82
|
%
|
0.63
|
%
|
|||||||||||
|
Return on Average Assets, Exclusive of Loss on Termination of Pension and Gain on Sale of Home Mortgage Center
|
1.11
|
%
|
1.06
|
%
|
1.03
|
%
|
0.82
|
%
|
0.63
|
%
|
|||||||||||
|
Return on Average Equity
|
9.94
|
%
|
10.59
|
%
|
9.99
|
%
|
8.42
|
%
|
6.24
|
%
|
|||||||||||
|
Return on Average Equity, Exclusive of Loss on Termination of Pension and Gain on Sale of Home Mortgage Center
|
10.45
|
%
|
10.59
|
%
|
10.77
|
%
|
8.42
|
%
|
6.24
|
%
|
|||||||||||
|
Earnings Per Common Share-Diluted
|
$
|
2.19
|
|
$
|
2.18
|
|
$
|
1.94
|
|
$
|
1.47
|
|
$
|
1.03
|
|
||||||
|
Earnings Per Common Share-Diluted, Exclusive of Loss on Termination of Pension and Gain on Sale of Home Mortgage Center
|
$
|
2.19
|
|
$
|
2.18
|
|
$
|
2.10
|
|
$
|
1.47
|
|
$
|
1.03
|
|
||||||
|
Earnings Per Common Share-Diluted, Exclusive of Merger-related Expenses
|
$
|
2.31
|
|
$
|
2.18
|
|
$
|
1.94
|
|
$
|
1.47
|
|
$
|
1.03
|
|
||||||
|
(1) Computed on a tax-equivalent basis, assuming a federal income tax rate of 34% for 2010, 2011, and 2012, and 35% for 2013 and 2014
|
|||||||||||||||||||||
|
(2) Computed assuming a combined state and federal tax rate of 37% for 2012, and 38% on eligible tax-deductible expenses for 2014..
|
|||||||||||||||||||||
|
I
TEM
7.
|
M
ANAGEMENT’S
D
ISCUSSION AND
A
NALYSIS OF
F
INANCIAL
C
ONDITION AND
R
ESULTS OF
O
PERATIONS
.
|
Overview
We are the holding company for MidWest
One
Bank, an Iowa state non-member bank with its main office in Iowa City, Iowa. We are headquartered in Iowa City, Iowa, and are a bank holding company under the Bank Holding Company Act of 1956 that has elected to be a financial holding company. We also are the holding company for MidWest
One
Insurance Services, Inc., which operates an insurance business through three agencies located in central and east-central Iowa.
34
MidWest
One
Bank operates a total of
25
branch locations, plus its specialized Home Mortgage Center, in 15 counties throughout central and east-central Iowa. It provides full service retail banking in the communities in which its branch offices are located and also offers trust and investment management services.
On November 21, 2014, the Company announced its plans to merge with Central Bancshares, a Golden Valley, Minnesota based bank holding company. The merger with Central is contingent upon the approval of our shareholders, our regulators and certain customary closing conditions. Central Bank, its subsidiary bank, has 22 offices, primarily in the Twin Cities metro area with offices in Minnesota and Western Wisconsin. Additionally, Central Bank operates two Florida offices in Naples and Fort Myers. We believe that this transaction, when completed, will be transformational for the Company. Central Bank has operated, since 1988, as a community bank and has strong roots in the communities it serves.
Net income for the year ended December 31, 2014 was $18.5 million, a decrease of $0.1 million, or 0.5%, compared to $18.6 million in net income for the same period in 2013, with diluted earnings per share of $2.19 and $2.18 for the comparative year periods, respectively. The decrease in net income was due primarily to increased noninterest expense, partially offset by higher net interest income, a lower loan loss provision and increased noninterest income. After excluding the effects of $1.1 million of expenses related to the previously announced merger with Central Bancshares, Inc., adjusted diluted earning per share for the year ended December 31, 2014 were $2.31. Return on assets (“ROA”) and return on tangible common equity (“ROTCE”) for the full year of 2014, including merger expenses, of 1.05 and 10.61%, respectively, decreased from 1.06% and 11.43%, respectively, for 2013.
In looking at the year-over-year trends, assets increased slightly during 2014 from $1.76 billion at December 31, 2013 to $1.80 billion at December 31, 2014. Deposits increased by 2.4% during this period to $1.41 billion. Total bank loans registered an increase of $44.1 million, or 4.1%, in the year-over-year comparisons. This loan growth, combined with the Company’s ability to improve the net interest margin by 7 basis points to 3.53% in 2014 resulted in a modest increase in net interest income during the year of $891,000. Deposit competition in our geographic footprint continues, with a number of aggressive credit unions offering well above market deposit rates.
Building non-interest income as a percentage of total revenues continues to be a key goal of our company. There are several highlights from this segment of our income statement worth sharing. Trust, investment and insurance fees increased to $5.8 million, some 8.0% ahead of last year’s total. After several years of declining service charges and fees on deposit accounts, this category rebounded to $3.3 million for 2014, up from $3.0 million a year ago. We continue to be challenged, however, in mortgage lending, with results significantly below year-ago levels. As such, we are reviewing our operations to assure that we are providing our customers with efficient and profitable options for their real estate loans.
While noninterest expense in 2014 increased $1.3 million, or 3.2%, as compared to 2013, the increase was mainly due to $1.1 million ($1.0 million after tax) of expenses related to the Central Bancshares, Inc. merger. These expenses are reflected mainly in increased professional fees expense of $1.0 million during the year ended December 31, 2014. Absent the merger expenses, which were one-time and non-recurring, our expense management continues to be disciplined.
Asset quality continues to be strong, with nonperforming assets declining from $13.8 million, or 1.27% of total bank loans, at December 31, 2013 to $13.0 million, or 1.15% at December 31, 2014. the decline was due primarily to a reduction in troubled debt restructures. As of December 31, 2014, the allowance for bank loan losses was $16.4 million, or 1.44% of total bank loans, compared with $16.2 million, or 1.49% of total bank loans, at December 31, 2013. The allowance for loan losses represented 125.67% of nonperforming bank loans at December 31, 2014, compared with 117.44% of nonperforming bank loans at December 31, 2013. The Company had net bank loan charge-offs of $1.0 million in full-year 2014, or an annualized 0.09% of average bank loans outstanding, compared to net charge-offs of $1.1 million, or an annualized 0.11% of average bank loans outstanding, for 2013. The Company continues to exhibit strong asset quality metrics.
We have been in the loan pool participations business since 1988, although we decided to exit this business line in 2010. Loan pool participations are participation interests in performing, subperforming and nonperforming loans that were purchased from various non-affiliated banking organizations and are serviced by a third party. The pools showed steady performance in 2014 with an “all-in” yield of 6.23% versus 6.27% in 2013. We continue to exit this line of business and the balance of the loan pools, net, was $19.3 million at year-end 2014, which represented 1.07% of the Company’s total assets.
The Company’s capital position remains solid. Tangible common equity of 10.29% continues to compare favorably within our peer group of similar-sized companies. Reflecting our confidence in the future prospects for the Company, on January 21, 2015, our Board of Directors declared a dividend of $0.15, payable March 16, 2015 to shareholders of record as of February 27, 2015, representing a 3% increase from dividends declared in recent quarters.
35
Critical Accounting Policies
We have identified the following critical accounting policies and practices relative to the reporting of our results of operations and financial condition. These accounting policies relate to the allowance for loan losses, participation interests in loan pools, intangible assets, and fair value of available for sale investment securities.
Allowance for Loan Losses
The allowance for loan losses is based on our estimate of probable incurred credit losses in our loan portfolio. In evaluating our loan portfolio, we take into consideration numerous factors, including current economic conditions, prior loan loss experience, the composition of the loan portfolio, and management’s estimate of probable credit losses. The allowance for loan losses is established through a provision for loss based on our evaluation of the risk inherent in the loan portfolio, the composition of the portfolio, specific impaired loans, and current economic conditions. Such evaluation, which includes a review of all loans on which full collectability may not be reasonably assured, considers, among other matters, the estimated net realizable value or the fair value of the underlying collateral, economic conditions, historical loss experience, and other factors that warrant recognition in providing for an appropriate allowance for loan losses. In the event that our evaluation of the level of the allowance for loan losses indicates that it is inadequate, we would need to increase our provision for loan losses. We believe the allowance for loan losses as of
December 31, 2014
, was adequate to absorb probable losses in the existing portfolio.
Participation Interests in Loan Pools
The loan pool accounting practice relates to our estimate that the investment amount reflected on our financial statements does not exceed the estimated net realizable value or the fair value of the underlying collateral securing the purchased loans. In evaluating the purchased loan pool, we take into consideration many factors, including the borrowers’ current financial situation, the underlying collateral, current economic conditions, historical collection experience, and other factors relative to the collection process. If the estimated net realizable value of the loan pool participations were to decline below their carrying amount, our yield on the loan pools would be reduced.
Intangible Assets
Intangible assets arise from purchase business combinations. As a general matter, intangible assets generated from purchase business combinations and deemed to have indefinite lives are not subject to amortization and are instead tested for impairment at least annually. The intangible assets reflected on our financial statements are deposit premium, insurance agency, trade name, and customer list intangibles. The establishment and subsequent amortization, when required by the accounting standards, of these intangible assets involves the use of significant estimates and assumptions. These estimates and assumptions include, among other things, the estimated cost to service deposits acquired, discount rates, estimated attrition rates and useful lives, future economic and market conditions, comparison of our market value to book value and determination of appropriate market comparables. Actual future results may differ from those estimates. We assess these intangible assets for impairment annually or more often if conditions indicate a possible impairment. Periodically we evaluate the estimated useful lives of intangible assets and whether events or changes in circumstances warrant a revision to the remaining periods of amortization. Recoverability of these assets is measured by comparison of the carrying amount of the asset to the future undiscounted cash flows the asset is expected to generate. If the asset is considered to be impaired, the amount of any impairment is measured as the difference between the carrying value and the fair value of the impaired asset.
Fair Value of Available for Sale Securities
Securities available for sale are reported at fair value, with unrealized gains and losses reported as a separate component of accumulated other comprehensive income, net of deferred income taxes. Declines in fair value of individual securities, below their amortized cost, are evaluated by management to determine whether the decline is temporary or “other-than-temporary.’’ Declines in the fair value of available for sale securities below their cost that are deemed “other-than-temporary” are reflected in earnings as impairment losses. In determining whether other-than-temporary impairment exists, management considers whether: (1) we have the intent to sell the security, (2) it is more likely than not that we will be required to sell the security before recovery of the amortized cost basis, and (3) we do not expect to recover the entire amortized cost basis of the security. When we determine that other-than-temporary-impairment (“OTTI”) has occurred, the amount of the OTTI recognized in earnings depends on whether we intend to sell the security or whether it is more likely than not we will be required to sell the security before recovery of its amortized cost basis. If we intend to sell, or it is more likely than not we will be required to sell, the security before recovery of its amortized cost basis, the OTTI recognized in earnings is equal to the entire difference between the investment’s amortized cost basis and its fair value at the balance sheet date. If we do not intend to sell the security, and it is not more likely than not that we will be required to sell before recovery of its amortized cost basis, the OTTI is separated into the amount representing the credit
36
loss and the amount related to all other factors. The amount of the total OTTI related to the credit loss is determined based on the present value of cash flows expected to be collected, using the original yield as the discount rate, and is recognized in earnings. The amount of the total OTTI related to other factors is recognized in accumulated other comprehensive income (loss), net of applicable taxes. The previous amortized cost basis less the OTTI recognized in earnings becomes the new amortized cost basis of the investment. The assessment of whether an OTTI exists involves a high degree of subjectivity and judgment and is based on the information available to management at the time.
Results of Operations - Three-Year Period Ended
December 31, 2014
Summary
Our consolidated net income for the year ended
December 31, 2014
was
$18.5 million
, or
$2.19
per fully-diluted share, compared to net income of
$18.6 million
, or
$2.18
per fully-diluted share, for the year ended
December 31, 2013
. The decrease in consolidated net income was due primarily to a
$1.3 million
, or
3.2%
, increase in noninterest expense, primarily due to a
37.5%
increase in professional fees, mainly related to the previously announced merger with Central Bancshares of
$1.0 million
(
$0.9 million
after tax). This increase in expense was partially offset by a
$1.0 million
, or
2.0%
, increase in net interest income after provision for loan losses. After excluding the effects of
$1.1 million
of expenses related to the previously announced merger with Central Bancshares, Inc., adjusted diluted earning per share for the
year
ended
December 31, 2014
were
$2.31
. We also experienced an increase in noninterest income to
$15.3 million
for the
year
ended
December 31, 2014
from
$14.7 million
for
2013
, which was primarily due to a
$1.1 million
increase in gain on sale of available for sale securities to
$1.2 million
, compared with
$0.1 million
in
2013
.
Our consolidated net income for the year ended December 31, 2013 was $18.6 million, or $2.18 per fully-diluted share, compared to net income of $16.5 million, or $1.94 per fully-diluted share, for the year ended December 31, 2012. The increase in consolidated net income was due primarily to an increase in net interest income, after provision for loan losses, of $1.6 million. We also experienced a decrease in noninterest expense to $42.1 million for the year ended December 31, 2013 from $49.0 million for 2012, mainly due to the $6.1 million loss related to the termination and liquidation of the Company's defined benefit pension plan in the second quarter of 2012, recorded in salaries and employee benefits expense. Absent that event, noninterest expense for the period decreased $0.8 million, or 1.83%. Finally, noninterest income decreased $5.0 million, mainly due to the $4.0 million gain on the sale of the Home Mortgage Center location realized during the second quarter of 2012. Absent this gain, the decrease in noninterest income for the period was $1.0 million, which was primarily due to a $0.7 million decrease in gain on sale of available for sale securities to $0.1 million, compared with $0.8 million in 2012.
We ended
2014
with an allowance for loan losses of
$16.4 million
, which represented
125.7%
coverage of our nonperforming bank loans (excluding loan pool participations) at
December 31, 2014
as compared to
117.4%
coverage of our nonperforming bank loans at
December 31, 2013
and
149.8%
at
December 31, 2012
. Nonperforming loans totaled
$13.0 million
as of
December 31, 2014
compared with
$13.8 million
and
$10.7 million
at
December 31, 2013
and
December 31, 2012
, respectively. For the year ended
December 31, 2014
, the provision for loan losses decreased to
$1.2 million
from
$1.4 million
for
2013
, which had decreased from
$2.4 million
for
2012
.
37
Various operating and equity ratios for the Company are presented in the table below for the years indicated. The dividend payout ratio represents the percentage of our prior year’s net income that is paid to shareholders in the form of cash dividends. Average equity to average assets is a measure of capital adequacy that presents the percentage of average total shareholders’ equity compared to our average assets. The equity to assets ratio is expressed using the period-end amounts instead of an average amount. As of
December 31, 2014
, under regulatory standards, MidWest
One
Bank had capital levels in excess of the minimums necessary to be considered “well capitalized,” which is the highest regulatory designation.
|
As of the Years Ended December 31,
|
|||||||||
|
12/31/2014
|
12/31/2013
|
12/31/2012
|
|||||||
|
Return on average assets
|
1.05
|
%
|
1.06
|
%
|
0.96
|
%
|
|||
|
Return on average assets, exclusive of loss on termination of pension and gain on sale of Home Mortgage Center
|
1.05
|
|
1.06
|
|
1.03
|
|
|||
|
Return on average shareholders' total equity
|
9.94
|
|
10.59
|
|
9.99
|
|
|||
|
Return on average shareholders’ total equity, exclusive of loss on termination of pension and gain on sale of Home Mortgage Center
|
9.94
|
|
10.59
|
|
10.77
|
|
|||
|
Return on average common equity
|
9.94
|
|
10.59
|
|
10.13
|
|
|||
|
Return on average tangible common equity
|
10.61
|
|
11.43
|
|
10.95
|
|
|||
|
Return on average tangible common equity, exclusive of loss on termination of pension and gain on sale of Home Mortgage Center
|
10.61
|
|
11.43
|
|
11.78
|
|
|||
|
Dividend payout ratio
|
26.36
|
|
22.83
|
|
18.46
|
|
|||
|
Average equity to average assets
|
10.58
|
|
10.00
|
|
9.75
|
|
|||
|
Equity to assets ratio (at period end)
|
10.71
|
|
10.14
|
|
9.70
|
|
|||
For information on the calculation of certain non-GAAP measures please see pages 32 to 34.
Net Interest Income
Net interest income is the difference between interest income and fees earned on earning assets, less interest expense incurred on interest-bearing liabilities. Interest rate levels and volume fluctuations within earning assets and interest-bearing liabilities impact net interest income. Net interest margin is tax-equivalent net interest income as a percent of average earning assets.
Certain assets with tax favorable treatment are evaluated on a tax-equivalent basis. Tax-equivalent basis assumes a federal income tax rate of 34% for 2012 and 35% for 2013 and 2014. Tax favorable assets generally have lower contractual pre-tax yields than fully taxable assets. A tax-equivalent analysis is performed by adding the tax savings to the earnings on tax favorable assets. After factoring in the tax favorable effects of these assets, the yields may be more appropriately evaluated against alternative earning assets. In addition to yield, various other risks are factored into the evaluation process.
38
The following table shows the consolidated average balance sheets, detailing the major categories of assets and liabilities, the interest income earned on interest-earning assets, the interest expense paid for interest-bearing liabilities, and the related interest rates/yields for the periods, or as of the dates, shown. Average information is provided on a daily average basis.
|
Year ended December 31,
|
||||||||||||||||||||||||||||||||
|
2014
|
2013
|
2012
|
||||||||||||||||||||||||||||||
|
Average Balance
|
Interest Income/ Expense
|
Average Rate/Yield
|
Average Balance
|
Interest Income/ Expense
|
Average Rate/Yield
|
Average Balance
|
Interest Income/ Expense
|
Average Rate/Yield
|
||||||||||||||||||||||||
|
(dollars in thousands)
|
||||||||||||||||||||||||||||||||
|
Average earning assets:
|
||||||||||||||||||||||||||||||||
|
Loans
(1)(2)(3)
|
$
|
1,092,280
|
|
$
|
49,623
|
|
4.54
|
%
|
$
|
1,059,356
|
|
$
|
49,791
|
|
4.70
|
%
|
$
|
1,001,259
|
|
$
|
52,182
|
|
5.21
|
%
|
||||||||
|
Loan pool participations
(4)
|
24,321
|
|
1,516
|
|
6.23
|
|
32,648
|
|
2,046
|
|
6.27
|
|
44,507
|
|
1,978
|
|
4.44
|
|
||||||||||||||
|
Investment securities:
|
||||||||||||||||||||||||||||||||
|
Taxable investments
|
364,153
|
|
8,921
|
|
2.45
|
|
407,739
|
|
9,905
|
|
2.43
|
|
408,600
|
|
10,836
|
|
2.65
|
|
||||||||||||||
|
Tax exempt investments
(2)
|
170,218
|
|
8,335
|
|
4.90
|
|
160,779
|
|
8,093
|
|
5.03
|
|
154,289
|
|
7,382
|
|
4.78
|
|
||||||||||||||
|
Total investment securities
|
534,371
|
|
17,256
|
|
3.23
|
|
568,518
|
|
17,998
|
|
3.17
|
|
562,889
|
|
18,218
|
|
3.24
|
|
||||||||||||||
|
Federal funds sold and interest-bearing balances
|
18,158
|
|
46
|
|
0.25
|
|
6,729
|
|
17
|
|
0.25
|
|
22,180
|
|
55
|
|
0.25
|
|
||||||||||||||
|
Total earning assets
|
$
|
1,669,130
|
|
$
|
68,441
|
|
4.10
|
%
|
$
|
1,667,251
|
|
$
|
69,852
|
|
4.19
|
%
|
$
|
1,630,835
|
|
$
|
72,433
|
|
4.44
|
%
|
||||||||
|
Noninterest-earning assets:
|
||||||||||||||||||||||||||||||||
|
Cash and due from banks
|
19,295
|
|
20,790
|
|
21,854
|
|
||||||||||||||||||||||||||
|
Premises and equipment
|
32,336
|
|
26,226
|
|
25,544
|
|
||||||||||||||||||||||||||
|
Allowance for loan losses
|
(18,575
|
)
|
(18,598
|
)
|
(18,078
|
)
|
||||||||||||||||||||||||||
|
Other assets
|
58,590
|
|
60,675
|
|
61,637
|
|
||||||||||||||||||||||||||
|
Total assets
|
$
|
1,760,776
|
|
$
|
1,756,344
|
|
$
|
1,721,792
|
|
|||||||||||||||||||||||
|
Average interest-bearing liabilities:
|
||||||||||||||||||||||||||||||||
|
Savings and interest-bearing demand deposits
|
$
|
706,662
|
|
$
|
2,313
|
|
0.33
|
%
|
$
|
677,757
|
|
$
|
2,502
|
|
0.37
|
%
|
$
|
604,788
|
|
$
|
3,150
|
|
0.52
|
%
|
||||||||
|
Certificates of deposit
|
469,351
|
|
4,714
|
|
1.00
|
|
477,537
|
|
6,453
|
|
1.35
|
|
559,847
|
|
8,814
|
|
1.57
|
|
||||||||||||||
|
Total deposits
|
1,176,013
|
|
7,027
|
|
0.60
|
|
1,155,294
|
|
8,955
|
|
0.78
|
|
1,164,635
|
|
11,964
|
|
1.03
|
|
||||||||||||||
|
Federal funds purchased and repurchase agreements
|
59,012
|
|
127
|
|
0.22
|
|
63,604
|
|
166
|
|
0.26
|
|
56,716
|
|
204
|
|
0.36
|
|
||||||||||||||
|
Federal Home Loan Bank borrowings
|
103,515
|
|
2,092
|
|
2.02
|
|
128,567
|
|
2,686
|
|
2.09
|
|
132,786
|
|
3,094
|
|
2.33
|
|
||||||||||||||
|
Long-term debt and other
|
15,904
|
|
305
|
|
1.92
|
|
16,002
|
|
325
|
|
2.03
|
|
16,095
|
|
690
|
|
4.29
|
|
||||||||||||||
|
Total borrowed funds
|
178,431
|
|
2,524
|
|
1.41
|
|
208,173
|
|
3,177
|
|
1.53
|
|
205,597
|
|
3,988
|
|
1.94
|
|
||||||||||||||
|
Total interest-bearing liabilities
|
$
|
1,354,444
|
|
$
|
9,551
|
|
0.71
|
%
|
$
|
1,363,467
|
|
$
|
12,132
|
|
0.89
|
%
|
$
|
1,370,232
|
|
$
|
15,952
|
|
1.16
|
%
|
||||||||
|
Net interest spread
(2)
|
3.39
|
%
|
3.30
|
%
|
3.28
|
%
|
||||||||||||||||||||||||||
|
Noninterest-bearing liabilities
|
||||||||||||||||||||||||||||||||
|
Demand deposits
|
$
|
208,071
|
|
$
|
204,185
|
|
$
|
170,841
|
|
|||||||||||||||||||||||
|
Other liabilities
|
11,886
|
|
13,026
|
|
15,290
|
|
||||||||||||||||||||||||||
|
Shareholders’ equity
|
186,375
|
|
175,666
|
|
165,429
|
|
||||||||||||||||||||||||||
|
Total liabilities and shareholders’ equity
|
$
|
1,760,776
|
|
$
|
1,756,344
|
|
$
|
1,721,792
|
|
|||||||||||||||||||||||
|
Interest income/earning assets
(2)
|
$
|
1,669,130
|
|
$
|
68,441
|
|
4.10
|
%
|
$
|
1,667,251
|
|
$
|
69,852
|
|
4.19
|
%
|
$
|
1,630,835
|
|
$
|
72,433
|
|
4.44
|
%
|
||||||||
|
Interest expense/earning assets
|
$
|
1,669,130
|
|
$
|
9,551
|
|
0.57
|
%
|
$
|
1,667,251
|
|
$
|
12,132
|
|
0.73
|
%
|
$
|
1,630,835
|
|
$
|
15,952
|
|
0.98
|
%
|
||||||||
|
Net interest income/margin
(2)(5)
|
$
|
58,890
|
|
3.53
|
%
|
$
|
57,720
|
|
3.46
|
%
|
$
|
56,481
|
|
3.46
|
%
|
|||||||||||||||||
|
Non-GAAP to GAAP Reconciliation:
|
||||||||||||||||||||||||||||||||
|
Tax Equivalent Adjustment:
|
||||||||||||||||||||||||||||||||
|
Loans
|
$
|
1,157
|
|
$
|
963
|
|
$
|
827
|
|
|||||||||||||||||||||||
|
Securities
|
2,880
|
|
2,795
|
|
2,304
|
|
||||||||||||||||||||||||||
|
Total tax equivalent adjustment
|
4,037
|
|
3,758
|
|
3,131
|
|
||||||||||||||||||||||||||
|
Net Interest Income
|
$
|
54,853
|
|
$
|
53,962
|
|
$
|
53,350
|
|
|||||||||||||||||||||||
|
(1)
|
Loan fees included in interest income are not material.
|
|
|
(2)
|
Computed on a tax-equivalent basis, assuming a federal income tax rate of 34% for 2012, and 35% for 2013 and 2014.
|
|
|
(3)
|
Non-accrual loans have been included in average loans, net of unearned discount.
|
|
|
(4)
|
Includes interest income and discount realized on loan pool participations.
|
|
|
(5)
|
Net interest margin is tax-equivalent net interest income as a percentage of average earning assets.
|
|
39
The following schedule presents the dollar amount of changes in interest income and interest expense for major components of interest-earning assets and interest-bearing liabilities. It distinguishes between the difference related to changes in average outstanding balances and the increase or decrease due to the levels and volatility of interest rates. For each category of interest-earning assets and interest-bearing liabilities information is provided on changes attributable to (i) changes in volume (i.e. changes in volume multiplied by old rate) and (ii) changes in rate (i.e. changes in rate multiplied by old volume). For purposes of this table, changes attributable to both rate and volume that cannot be segregated have been allocated proportionately to the change due to volume and the change due to rate.
|
Years Ended December 31, 2014, 2013, and 2012
|
|||||||||||||||||||||||
|
Year 2014 to 2013 Change due to
|
Year 2013 to 2012 Change due to
|
||||||||||||||||||||||
|
Volume
|
Rate/Yield
|
Net
|
Volume
|
Rate/Yield
|
Net
|
||||||||||||||||||
|
(dollars in thousands)
|
|||||||||||||||||||||||
|
Increase (decrease) in interest income
|
|||||||||||||||||||||||
|
Loans (tax equivalent)
|
$
|
1,523
|
|
$
|
(1,691
|
)
|
$
|
(168
|
)
|
$
|
2,917
|
|
$
|
(5,308
|
)
|
$
|
(2,391
|
)
|
|||||
|
Loan pool participations
|
(519
|
)
|
(11
|
)
|
(530
|
)
|
(612
|
)
|
680
|
|
68
|
|
|||||||||||
|
Investment securities:
|
|||||||||||||||||||||||
|
Taxable investments
|
(1,067
|
)
|
83
|
|
(984
|
)
|
(23
|
)
|
(908
|
)
|
(931
|
)
|
|||||||||||
|
Tax exempt investments (tax equivalent)
|
466
|
|
(224
|
)
|
242
|
|
318
|
|
393
|
|
711
|
|
|||||||||||
|
Total investment securities
|
(601
|
)
|
(141
|
)
|
(742
|
)
|
295
|
|
(515
|
)
|
(220
|
)
|
|||||||||||
|
Federal funds sold and interest-bearing balances
|
29
|
|
—
|
|
29
|
|
(39
|
)
|
1
|
|
(38
|
)
|
|||||||||||
|
Change in interest income
|
432
|
|
(1,843
|
)
|
(1,411
|
)
|
2,561
|
|
(5,142
|
)
|
(2,581
|
)
|
|||||||||||
|
Increase (decrease) in interest expense
|
|||||||||||||||||||||||
|
Savings and interest-bearing demand deposits
|
103
|
|
(292
|
)
|
(189
|
)
|
348
|
|
(996
|
)
|
(648
|
)
|
|||||||||||
|
Certificates of deposit
|
(109
|
)
|
(1,630
|
)
|
(1,739
|
)
|
(1,202
|
)
|
(1,159
|
)
|
(2,361
|
)
|
|||||||||||
|
Total deposits
|
(6
|
)
|
(1,922
|
)
|
(1,928
|
)
|
(854
|
)
|
(2,155
|
)
|
(3,009
|
)
|
|||||||||||
|
Federal funds purchased and repurchase agreements
|
(11
|
)
|
(28
|
)
|
(39
|
)
|
23
|
|
(61
|
)
|
(38
|
)
|
|||||||||||
|
Federal Home Loan Bank borrowings
|
(509
|
)
|
(85
|
)
|
(594
|
)
|
(96
|
)
|
(312
|
)
|
(408
|
)
|
|||||||||||
|
Other long-term debt
|
(2
|
)
|
(18
|
)
|
(20
|
)
|
(4
|
)
|
(361
|
)
|
(365
|
)
|
|||||||||||
|
Total borrowed funds
|
(522
|
)
|
(131
|
)
|
(653
|
)
|
(77
|
)
|
(734
|
)
|
(811
|
)
|
|||||||||||
|
Change in interest expense
|
(528
|
)
|
(2,053
|
)
|
(2,581
|
)
|
(931
|
)
|
(2,889
|
)
|
(3,820
|
)
|
|||||||||||
|
Increase (decrease) in net interest income
|
$
|
960
|
|
$
|
210
|
|
$
|
1,170
|
|
$
|
3,492
|
|
$
|
(2,253
|
)
|
$
|
1,239
|
|
|||||
|
Percentage increase in net interest income over prior period
|
2.0
|
%
|
2.2
|
%
|
|||||||||||||||||||
Earning Assets, Sources of Funds, and Net Interest Margin
Average earning assets were effectively unchanged at
$1.7 billion
in
2014
, the same as
2013
. Average earning assets in
2013
increased by
$36.4 million
, or
2.2%
, from
2012
. The slight growth in the average balance of earning assets in
2014
was due primarily to an increase in average loans outstanding of
$32.9 million
, or
3.1%
, and an increase in federal funds sold and interest-bearing balances of
$11.4 million
, or
169.8%
, mostly offset by a decrease in our portfolio of investment securities of
$34.1 million
, or
6.0%
, and loan pool participation balances. Growth in the average balance of earning assets in 2013 was due primarily to an increase in average loans outstanding of $58.1 million, or 5.8%, and an increase in our portfolio of investment securities of $5.6 million, or 1.0%, somewhat offset by decreases in federal funds sold and interest-bearing balances and loan pool participation balances. Interest-bearing liabilities averaged
$1.4 billion
for the year ended
December 31, 2014
, a decrease of
$9.0 million
, or
0.7%
, from the average balance for the year ended
December 31, 2013
. A decrease in borrowed funds of
$29.7 million
during
2014
, partially offset by an increase in deposits of
$20.7 million
during
2014
accounted for the decrease in average interest-bearing liabilities. Interest-bearing liabilities averaged $1.4 billion for the year ended December 31, 2013, a decrease of $6.8 million, or 0.5%, from the average balance for the year ended December 31, 2012. A decrease in deposits of $9.3 million, partially offset by an increase in borrowed funds of $2.6 million during 2013 accounted for the decrease in average interest-bearing liabilities.
Interest income, on a tax-equivalent basis, decreased
$1.4 million
, or
2.0%
, to
$68.5 million
in
2014
from
$69.9 million
in
2013
. Tax equivalent interest income in
2013
decreased $2.6 million, or 3.6%, to $69.9 million from $72.4 million in 2012. Interest income declined in 2014 due primarily to lower yields in loans, despite higher volumes, and lower volume of investment securities. In 2013, interest income decreased due primarily to lower yields in loans and investment securities, and despite higher volumes. Our yield on average earning assets was
4.10%
in
2014
compared to
4.19%
in
2013
and
4.44%
in
2012
. These declines were due to the historically lower rate environment resulting from the interest rate policy being pursued by the Federal Reserve in response to current economic conditions.
40
Interest expense decreased during
2014
by
$2.6 million
, or
21.3%
, to
$9.5 million
from
$12.1 million
in
2013
. Interest expense in
2013
decreased by
$3.8 million
, or
23.9%
, from
2012
. The decrease in interest expense during 2014 compared to 2013 was due to the continued low interest rate environment coupled with lower volumes of interest-bearing liabilities. Likewise, the decline experienced during 2013 compared to 2012 was due to the continued low interest rate environment, and its effect on new liabilities and those repricing during the year. The average rate paid on interest-bearing liabilities was
0.71%
in
2014
compared to
0.89%
in
2013
and
1.16%
in
2012
.
Net interest income, on a tax-equivalent basis, increased
2.0%
in
2014
to
$58.9 million
from
$57.7 million
in
2013
. The lower rates paid on all categories of interest-bearing liabilities combined with their lower volumes, more than offset the lower yields on earning assets during 2014. Tax-equivalent net interest income in
2013
increased by
$1.2 million
, or
2.2%
, from
2012
. Net interest margin, which is our net interest income expressed as a percentage of average earning assets stated on a tax-equivalent basis, was higher at
3.53%
during
2014
compared to
3.46%
in
2013
, and was
3.46%
in
2012
. The net interest spread, also on a tax-equivalent basis, was
3.39%
in
2014
compared to
3.30%
in
2013
and
3.28%
in
2012
.
Net interest income increased in 2014 as compared to 2013 due primarily to the decrease in interest paid on interest-bearing liabilities which more than offset the decrease in interest received on interest-earning assets. Likewise, the increased net interest income for 2013 as compared to 2012 was due primarily to the decrease in interest paid on interest-bearing liabilities which more than offset the decrease in interest received on interest-earning assets. This is partially due to the presence of interest rate floors in portions of our loan portfolio, and the higher volume of loans. The average balance sheets reflect a competitive marketplace on both the interest-earning assets and interest-bearing deposits. The competition for loans in the marketplace and the overall interest rate environment has kept interest rates on loans low. Interest rates paid on deposit products have declined steadily since 2008, but further significant decline is unlikely as interest rates on deposits have approached zero. We expect to continue battling net interest margin compression in 2015, with interest rates at generational lows.
Provision for Loan Losses
The provision for loan losses is a current charge against income and represents an amount which management believes is sufficient to maintain an adequate allowance for known and probable losses. In assessing the adequacy of the allowance for loan losses, management considers the size, composition, and quality of the loan portfolio measured against prevailing economic conditions, regulatory guidelines, historical loan loss experience and credit quality of the portfolio. When a determination is made by management to write-off a loan balance, such write-off is charged against the allowance for loan losses.
Our provision for loan losses was
$1.2 million
during
2014
compared to
$1.4 million
in
2013
and
$2.4 million
in
2012
. The decrease in provision expense during
2014
was reflective of management’s belief that the allowance for loan losses was adequate based on the inherent risk in the portfolio as of
December 31, 2014
. During
2014
, we added to the allowance for loan losses by maintaining a provision for loan losses that was somewhat greater than our net charge-off activity. The higher level of provision expense during 2012 and 2013 than in 2014, was reflective of management’s assessment of the then-current risk in the loan portfolio as compared to the allowance for loan losses. During 2012 and 2013, our additions to the allowance for loan losses were also greater than our net charge-off activity. The reduction since 2012 in the level of provision expense is indicative of our belief that weak credits have been identified and adequately provided for. See further discussion of the nonperforming loans, under the
Nonperforming Assets
section.
41
Noninterest Income
|
For the Year Ended December 31,
|
|||||||||||||||||||||||||||||
|
2014
|
2013
|
$ Change
|
% Change
|
2013
|
2012
|
$ Change
|
% Change
|
||||||||||||||||||||||
|
(dollars in thousands)
|
|||||||||||||||||||||||||||||
|
Trust, investment, and insurance fees
|
$
|
5,771
|
|
$
|
5,345
|
|
$
|
426
|
|
8.0
|
%
|
$
|
5,345
|
|
$
|
4,995
|
|
$
|
350
|
|
7.0
|
%
|
|||||||
|
Service charges and fees on deposit accounts
|
3,279
|
|
2,980
|
|
299
|
|
10.0
|
|
2,980
|
|
3,247
|
|
(267
|
)
|
(8.2
|
)
|
|||||||||||||
|
Mortgage origination and loan servicing fees
|
1,554
|
|
3,209
|
|
(1,655
|
)
|
(51.6
|
)
|
3,209
|
|
3,578
|
|
(369
|
)
|
(10.3
|
)
|
|||||||||||||
|
Other service charges, commissions and fees
|
2,381
|
|
2,210
|
|
171
|
|
7.7
|
|
2,210
|
|
2,316
|
|
(106
|
)
|
(4.6
|
)
|
|||||||||||||
|
Bank-owned life insurance income
|
1,102
|
|
922
|
|
180
|
|
19.5
|
|
922
|
|
953
|
|
(31
|
)
|
(3.3
|
)
|
|||||||||||||
|
Impairment losses on investment securities
|
—
|
|
—
|
|
—
|
|
NM
|
|
—
|
|
(345
|
)
|
345
|
|
NM
|
|
|||||||||||||
|
Gain on sale of available for sale securities
|
1,227
|
|
65
|
|
1,162
|
|
NM
|
|
65
|
|
805
|
|
(740
|
)
|
(91.9
|
)
|
|||||||||||||
|
Gain (loss) on sale of premises and equipment
|
(1
|
)
|
(3
|
)
|
2
|
|
(66.7
|
)
|
(3
|
)
|
4,188
|
|
(4,191
|
)
|
NM
|
|
|||||||||||||
|
Total noninterest income
|
$
|
15,313
|
|
$
|
14,728
|
|
$
|
585
|
|
4.0
|
%
|
$
|
14,728
|
|
$
|
19,737
|
|
$
|
(5,009
|
)
|
(25.4
|
)%
|
|||||||
|
Noninterest income as a % of total revenue*
|
20.4
|
%
|
21.4
|
%
|
21.4
|
%
|
22.0
|
%
|
|||||||||||||||||||||
|
NM - Percentage change not considered meaningful.
|
|||||||||||||||||||||||||||||
|
* Total revenue is net interest income plus noninterest income excluding gain/loss on sales of securities and premises and equipment and impairment of investment securities.
|
|||||||||||||||||||||||||||||
Total noninterest income for the
year
ended
December 31, 2014
was
$15.3 million
, an increase of
$0.6 million
, or
4.0%
, from
$14.7 million
in
2013
. The primary reason for this increase was gains on the sale of available for sale securities for the
year
ended
December 31, 2014
of
$1.2 million
, an increase of
$1.1 million
from
$0.1 million
for the same period of
2013
. Another significant contributor to the overall increase in noninterest income was improvement in trust, investment, and insurance fees, which increased to
$5.8 million
for the
year
ended
December 31, 2014
, an improvement of
$0.4 million
, or
8.0%
, from
$5.4 million
for the same period in
2013
. This increase was primarily attributable to increased trust department and investment center fee income. We also experienced an increase in service charges and fees on deposit accounts of
$0.3 million
, primarily due to greater demand deposit service charge income as the result of a review and adjustment of deposit account service charges during the year ended
December 31, 2014
.
These increases were partially offset by a decrease in mortgage origination and loan servicing fees which declined to
$1.6 million
from
$3.2 million
in the
year
ended
December 31, 2013
, mainly due to a lower level of origination of loans sold on the secondary market, as refinancing activity slowed. Management has adjusted the strategic goal for the percentage that noninterest income represents of total revenues (net interest income plus noninterest income before gains or losses on sales of securities available for sale and premises and equipment) from 30% to 25%, over time. This change was made in recognition that total revenues have grown at a faster rate than noninterest income in recent periods. In
2014
, noninterest income comprised
20.4%
of total revenues, compared with
21.4%
for
2013
and
22.0%
for
2012
. We expect that continued management focus on growing our insurance agency revenues and increasing the rate of growth in our Trust and Investment Services revenues will gradually reverse this decline going forward, even as mortgage origination and loan servicing fees decrease.
The decrease in noninterest income for 2013 compared to 2012 was primarily due to the $4.0 million gain on the sale of the Home Mortgage Center location realized during the second quarter of 2012. Absent this gain, the decrease in noninterest income for the period was $1.0 million, or 6.1%. Net gains on the sale of available for sale securities for the year ended December 31, 2013 decreased $0.7 million to $0.1 million, from $0.8 million for 2012. Mortgage origination and loan servicing fees declined to $3.2 million from $3.6 million in the year ended December 31, 2012, mainly due to a lower level of origination of loans sold on the secondary market, as refinancing activity slowed. These decreases were partially offset by an increase in trust, investment, and insurance fees to $5.3 million for the year ended December 31, 2013, an improvement of $0.3 million, or 7.0%, from $5.0 million for the same period of 2012. This increase was primarily attributable to increased trust department and investment center fee income. The absence of impairment losses on investment securities in 2013 had a comparative beneficial impact of $0.3 million.
42
Noninterest Expense
|
For the Year Ended December 31,
|
|||||||||||||||||||||||||||||
|
2014
|
2013
|
$ Change
|
% Change
|
2013
|
2012
|
$ Change
|
% Change
|
||||||||||||||||||||||
|
(dollars in thousands)
|
|||||||||||||||||||||||||||||
|
Salaries and employee benefits
|
$
|
24,918
|
|
$
|
24,596
|
|
$
|
322
|
|
1.3
|
%
|
$
|
24,596
|
|
$
|
30,684
|
|
$
|
(6,088
|
)
|
(19.8
|
)%
|
|||||||
|
Net occupancy and equipment expense
|
6,293
|
|
6,356
|
|
(63
|
)
|
(1.0
|
)
|
6,356
|
|
6,246
|
|
110
|
|
1.8
|
|
|||||||||||||
|
Professional fees
|
3,606
|
|
2,622
|
|
984
|
|
37.5
|
|
2,622
|
|
2,758
|
|
(136
|
)
|
(4.9
|
)
|
|||||||||||||
|
Data processing expense
|
1,565
|
|
1,452
|
|
113
|
|
7.8
|
|
1,452
|
|
1,679
|
|
(227
|
)
|
(13.5
|
)
|
|||||||||||||
|
FDIC insurance expense
|
964
|
|
1,066
|
|
(102
|
)
|
(9.6
|
)
|
1,066
|
|
1,224
|
|
(158
|
)
|
(12.9
|
)
|
|||||||||||||
|
Amortization of intangible assets
|
547
|
|
663
|
|
(116
|
)
|
(17.5
|
)
|
663
|
|
778
|
|
(115
|
)
|
(14.8
|
)
|
|||||||||||||
|
Other operating expense
|
5,520
|
|
5,332
|
|
188
|
|
3.5
|
|
5,332
|
|
5,591
|
|
(259
|
)
|
(4.6
|
)
|
|||||||||||||
|
Total noninterest expense
|
$
|
43,413
|
|
$
|
42,087
|
|
$
|
1,326
|
|
3.2
|
%
|
$
|
42,087
|
|
$
|
48,960
|
|
$
|
(6,873
|
)
|
(14.0
|
)%
|
|||||||
In
2014
noninterest expense increased to
$43.4 million
for the
year
ended
December 31, 2014
compared with
$42.1 million
for the
year
ended
December 31, 2013
, an increase of
$1.3 million
, or
3.2%
. The increase was mainly due to
$1.1 million
(
$1.0 million
after tax) of expenses related to the Central Bancshares, Inc. merger. These expenses are reflected mainly in increased professional fees expense of
$1.0 million
during the
year
ended
December 31, 2014
. Salaries and employee benefits increased to
$24.9 million
for the
year
of
2014
, compared with
$24.6 million
for the same period of
2013
, an increase of
$0.3 million
, or
1.3%
. Other operating expenses increased
$0.2 million
, or
3.5%
, due primarily to increased loan and collection expenses. These increases were partially offset by decreases in both amortization expense and FDIC insurance expense for the
year
of
2014
, compared with the
year
of
2013
.
In 2013 noninterest expense decreased $6.9 million, or 14.0%, primarily due to the $6.1 million loss related to the termination and liquidation of the Company's defined benefit pension plan in the second quarter of 2012, recorded in salaries and employee benefits expense. Absent that event, noninterest expense for the year ended December 31, 2013 decreased $0.8 million, or 1.8%. Excluding the pension loss, salaries and employee benefits were flat compared to 2012. With the exception of a small increase in net occupancy and equipment expense, all other noninterest expense categories experienced a decline for the year ended December 31, 2013, compared with 2012, largely as a result of management’s expense control measures.
Full-time equivalent employee levels were
374
,
376
and
390
at
December 31, 2014
,
2013
and
2012
, respectively .
Income Tax Expense
Our effective tax rate, or income taxes divided by income before taxes, was
27.5%
for
2014
compared with
26.3%
for
2013
. The higher effective rate in
2014
was primarily due to changes in the levels of taxable income and the non-deductibility of a significant amount of expenses paid during 2014 related to the merger with Central Bancshares, Inc. Income tax expense increased by
$0.4 million
to
$7.0 million
in
2014
compared to tax expense of
$6.6 million
for
2013
due primarily to increased taxable income.
Income taxes increased by
$1.4 million
for
2013
compared with
2012
due to increased taxable income and realization of a $0.2 million tax benefit from the partial release of a valuation allowance on capital losses during the second quarter of 2012, and an increase in our applicable federal tax rate from 34% in 2012 to 35% in 2013. The effective income tax rate as a percentage of income before tax was
26.3%
for
2013
, compared with
24.0%
for
2012
.
Financial Condition -
December 31, 2014
and
2013
Summary
Our total assets increased
$45.1 million
, or
2.6%
, to
$1.80 billion
as of
December 31, 2014
from
$1.76 billion
as of
December 31, 2013
. This growth resulted primarily from increased loan balances of
$44.1 million
, a rise of
$18.9 million
in investment securities held to maturity, and a
$10.1 million
increase in premises and equipment, net. These increases were somewhat offset by decreases in the balance of investment securities available for sale of
$23.6 million
, and a decline in loan pool participations, net, of
$6.2 million
, or
24.3%
, due to loan charge-offs and normal loan repayments. As previously discussed, we are exiting this line of business as current balances pay down and concentrate on our core community banking business. Deferred income taxes also decreased reflecting the market value change of our portfolio of investment securities available for sale. Our loan-to-deposit ratio, including loan pool participations, increased to
81.9%
at year-end
2014
compared to
81.2%
at year-end
2013
, with our target range being between 80% and 90%. The rise in this ratio is reflective of our success in obtaining quality loan growth in our local markets.
43
Total liabilities increased by
$30.4 million
from
December 31, 2013
to
December 31, 2014
. Our deposits increased
$33.6 million
, or
2.4%
, to
$1.41 billion
as of
December 31, 2014
from
$1.37 billion
at
December 31, 2013
. The increase in deposits was concentrated in interest-bearing checking accounts, jumbo certificates of deposit accounts (accounts $100,000 and over), and savings accounts, partially offset by a decrease in certificates of deposit with a balance below $100,000 and non-interest bearing demand deposits. Brokered CDs obtained through participation in the Certificate of Deposit Account Registry Service (“CDARS”) program decreased by
$6.8 million
in
2014
to
$6.1 million
, while brokered business money market accounts obtained through participation in the Insured Cash Sweeps (“ICS”) program decreased by
$8.3 million
to
$27.6 million
. We have an internal policy limit on brokered deposits of not more than 10% of our total assets. At
December 31, 2014
brokered deposits were
1.9%
of our total assets. FHLB borrowings were
$93.0 million
at
December 31, 2014
compared to
$106.9 million
at
December 31, 2013
, a decrease of
$13.9 million
, or
13.0%
.
Shareholders’ equity increased by
$14.7 million
, primarily due to
2014
net income of
$18.5 million
, and an increase in accumulated other comprehensive income of
$4.3 million
, reflecting the market value change of our portfolio of investment securities available for sale, partially offset by the payment of
$4.9 million
in cash dividends to common shareholders, and a net increase of
$3.2 million
in treasury stock.
|
December 31,
|
December 31,
|
|||||||||||||
|
2014
|
2013
|
$ Change
|
% Change
|
|||||||||||
|
(dollars in thousands)
|
||||||||||||||
|
Assets
|
||||||||||||||
|
Investment securities available for sale
|
$
|
474,942
|
|
$
|
498,561
|
|
$
|
(23,619
|
)
|
(4.7
|
)%
|
|||
|
Investment securities held to maturity
|
51,524
|
|
32,625
|
|
18,899
|
|
57.9
|
|
||||||
|
Net loans
|
1,116,156
|
|
1,072,233
|
|
43,923
|
|
4.1
|
|
||||||
|
Loan pool participations, net
|
19,332
|
|
25,533
|
|
(6,201
|
)
|
(24.3
|
)
|
||||||
|
Total Assets
|
$
|
1,800,302
|
|
$
|
1,755,218
|
|
$
|
45,084
|
|
2.6
|
%
|
|||
|
Liabilities
|
||||||||||||||
|
Deposits:
|
||||||||||||||
|
Noninterest bearing
|
$
|
214,461
|
|
$
|
222,359
|
|
$
|
(7,898
|
)
|
(3.6
|
)%
|
|||
|
Interest bearing
|
1,194,081
|
|
1,152,583
|
|
41,498
|
|
3.6
|
|
||||||
|
Total deposits
|
1,408,542
|
|
1,374,942
|
|
33,600
|
|
2.4
|
|
||||||
|
Federal Home Loan Bank borrowings
|
93,000
|
|
106,900
|
|
(13,900
|
)
|
(13.0
|
)
|
||||||
|
Total liabilities
|
$
|
1,607,571
|
|
$
|
1,577,202
|
|
$
|
30,369
|
|
1.9
|
%
|
|||
|
Shareholders’ equity
|
$
|
192,731
|
|
$
|
178,016
|
|
$
|
14,715
|
|
8.3
|
%
|
|||
Investment Securities
Our investment securities portfolio is managed
to provide both a source of liquidity and earnings.
Investment securities serve as a source of liquidity, and the size of the portfolio varies along with fluctuations in levels of deposits and loans.
Our investment securities portfolio
totaled
$526.5 million
at
December 31, 2014
compared to
$531.2 million
at
December 31, 2013
. The decrease was due primarily to our sale of investment securities to increase liquidity as loan balances increased during
2014
. Our loan activity is discussed more fully in the
Loans
section and loan pool participation activity is discussed in the
Loan Pool Participations
section.
Securities available for sale are carried at fair value. As of
December 31, 2014
, the fair value of our securities available for sale was
$474.9 million
and the amortized cost was
$466.4 million
. There were
$11.2 million
of gross unrealized gains and
$2.7 million
of gross unrealized losses in our investment securities available for sale portfolio for a net unrealized gain of
$8.5 million
. The after-tax effect of this unrealized gain has been included in shareholders’ equity. The ratio of the fair value as a percentage of amortized cost increased compared to
December 31, 2013
, due to a decline in interest rates, particularly in the market for long-term municipal securities, during
2014
.
U.S. government and agency securities as a percentage of total securities increased to
9.4%
at
December 31, 2014
, from
8.5%
at
December 31, 2013
, while obligations of state and political subdivisions (primarily tax-exempt obligations) as a percentage of total securities increased to
44.6%
at
December 31, 2014
, from
43.6%
at
December 31, 2013
. Investments in mortgage-backed securities and collateralized mortgage obligations decreased to
35.6%
of total securities at
December 31, 2014
, as compared to
41.2%
of total securities at
December 31, 2013
. As of
December 31, 2014
and
2013
, the Company’s mortgage-backed and collateralized mortgage obligations portfolios consisted of securities predominantly backed by one- to four- family mortgage loans and underwritten to the standards of and guaranteed by the following government-sponsored agencies: Federal Home Loan Mortgage Corporation (FHLMC), the Federal National Mortgage Association (FNMA), and the Government National Mortgage
44
Association (GNMA). The receipt of principal, at par, and interest on these securities is guaranteed by the respective government-sponsored agency guarantor, such that the Company believes that its mortgage-backed securities and collateralized mortgage obligations do not expose the Company to significant credit-related losses.
We consider many factors in determining the composition of our investment portfolio including tax-equivalent yield, credit quality, duration, expected cash flows and prepayment risk, as well as the liquidity position and the interest rate risk profile of the Bank.
As of December 31, 2013, our investment portfolio included an investment in collateralized debt obligations that were backed by trust preferred securities issued by banks, thrifts and insurance companies. These six securities had an original cost of $9.8 million, but, due to several impairment charges recognized between 2008 and 2012, the book value of these securities at December 31, 2013, had been reduced to
$2.1 million
. Two of the securities were written down to a value of zero, and a third was being liquidated by the investment’s trustee as of December 31, 2013, and we had established a receivable which reflected our expected cash payment. The remaining three had an average book value of 42.2% of their original face value. The market for these securities at December 31, 2013 was considered to be inactive and markets for similar securities were also not active. The valuation of these securities involved an assessment of the financial strength of the individual institutions that comprise the collateral for the bonds. Future default probabilities were assigned based on these measurements of financial strength. Other factors in the valuation included contractual terms of the cash flow waterfall (for both interest and principal), collateralization testing and events of default/liquidation. Based on our cash flow analysis, we had determined that not all contractual cash flows would be received; however, no additional other-than-temporary impairment charges were recorded during 2013. On January 27, 2014, we sold our remaining
five
collateralized debt obligation investment securities for a net gain on sale of
$0.8 million
.
The composition of securities available for sale was as follows:
|
December 31,
|
|||||||||||
|
2014
|
2013
|
2012
|
|||||||||
|
(dollars in thousands)
|
|||||||||||
|
Securities available for sale
|
|||||||||||
|
U.S. Government agency securities and corporations
|
$
|
49,375
|
|
$
|
44,939
|
|
$
|
69,783
|
|
||
|
States and political subdivisions
|
195,199
|
|
210,796
|
|
218,019
|
|
|||||
|
Mortgage-backed securities
|
32,463
|
|
39,285
|
|
59,259
|
|
|||||
|
Collateralized mortgage obligations
|
146,132
|
|
169,223
|
|
183,859
|
|
|||||
|
Collateralized debt obligations
|
—
|
|
1,317
|
|
755
|
|
|||||
|
Corporate debt securities
|
48,741
|
|
29,944
|
|
24,185
|
|
|||||
|
Other securities
|
3,032
|
|
3,057
|
|
1,681
|
|
|||||
|
Fair value of securities available for sale
|
$
|
474,942
|
|
$
|
498,561
|
|
$
|
557,541
|
|
||
|
Amortized cost
|
$
|
466,387
|
|
$
|
496,892
|
|
$
|
539,887
|
|
||
|
Fair value as a percentage of amortized cost
|
101.83
|
%
|
100.34
|
%
|
103.27
|
%
|
|||||
Securities held to maturity are carried at amortized cost. As of
December 31, 2014
, the amortized cost of these securities was
$51.5 million
and the fair value was
$51.3 million
.
The composition of securities held to maturity was as follows:
|
December 31,
|
|||||||||||
|
2014
|
2013
|
2012
|
|||||||||
|
(dollars in thousands)
|
|||||||||||
|
Securities held to maturity
|
|||||||||||
|
States and political subdivisions
|
$
|
39,704
|
|
$
|
19,888
|
|
$
|
19,278
|
|
||
|
Mortgage-backed securities
|
22
|
|
28
|
|
43
|
|
|||||
|
Collateralized mortgage obligations
|
8,531
|
|
9,447
|
|
10,090
|
|
|||||
|
Corporate debt securities
|
3,267
|
|
3,262
|
|
3,258
|
|
|||||
|
Amortized cost
|
$
|
51,524
|
|
$
|
32,625
|
|
$
|
32,669
|
|
||
|
Fair value of securities held to maturity
|
$
|
51,253
|
|
$
|
30,191
|
|
$
|
32,920
|
|
||
|
Fair value as a percentage of amortized cost
|
99.47
|
%
|
92.54
|
%
|
100.77
|
%
|
|||||
45
See Note 2. “Investment Securities,’’ and Note 18. “Estimated Fair Value of Financial Instruments and Fair Value Measurements” to our consolidated financial statements for additional information related to the investment portfolio.
The maturities, carrying values and weighted average yields of debt securities as of
December 31, 2014
were:
|
Maturity
|
|||||||||||||||||||||||||||
|
After One but
|
After Five but
|
||||||||||||||||||||||||||
|
Within One Year
|
Within Five Years
|
Within Ten Years
|
After Ten Years
|
||||||||||||||||||||||||
|
Amount
|
Yield
|
Amount
|
Yield
|
Amount
|
Yield
|
Amount
|
Yield
|
||||||||||||||||||||
|
(dollars in thousands)
|
|||||||||||||||||||||||||||
|
Securities available for sale:
(1)
|
|||||||||||||||||||||||||||
|
U.S. Government agency securities and corporations
|
$
|
7,057
|
|
2.23
|
%
|
$
|
40,704
|
|
1.30
|
%
|
$
|
1,614
|
|
2.01
|
%
|
$
|
—
|
|
—
|
%
|
|||||||
|
States and political subdivisions
(2)
|
8,545
|
|
5.45
|
|
48,401
|
|
4.80
|
|
99,733
|
|
5.00
|
|
38,520
|
|
4.79
|
|
|||||||||||
|
Mortgage-backed securities
|
1
|
|
7.00
|
|
1,884
|
|
4.45
|
|
18,797
|
|
3.09
|
|
11,781
|
|
3.34
|
|
|||||||||||
|
Collateralized mortgage obligations
|
—
|
|
—
|
|
6,266
|
|
1.60
|
|
11,076
|
|
2.55
|
|
128,790
|
|
2.07
|
|
|||||||||||
|
Corporate debt securities
|
7,035
|
|
2.89
|
|
35,280
|
|
1.78
|
|
6,426
|
|
1.68
|
|
—
|
|
—
|
|
|||||||||||
|
Total debt securities available for sale
|
$
|
22,638
|
|
3.65
|
%
|
$
|
132,535
|
|
2.76
|
%
|
$
|
137,646
|
|
4.35
|
%
|
$
|
179,091
|
|
2.74
|
%
|
|||||||
|
Securities held to maturity:
(1)
|
|||||||||||||||||||||||||||
|
U.S. Government agency securities and corporations
|
$
|
—
|
|
—
|
%
|
$
|
—
|
|
—
|
%
|
$
|
—
|
|
—
|
%
|
$
|
—
|
|
—
|
%
|
|||||||
|
States and political subdivisions
(2)
|
190
|
|
4.41
|
|
366
|
|
5.40
|
|
17,829
|
|
4.48
|
|
21,319
|
|
5.43
|
|
|||||||||||
|
Mortgage-backed securities
|
—
|
|
—
|
|
—
|
|
—
|
|
22
|
|
6.00
|
|
—
|
|
—
|
|
|||||||||||
|
Collateralized mortgage obligations
|
—
|
|
—
|
|
—
|
|
—
|
|
—
|
|
—
|
|
8,531
|
|
1.81
|
|
|||||||||||
|
Corporate debt securities
|
—
|
|
—
|
|
2,384
|
|
1.26
|
|
—
|
|
—
|
|
883
|
|
2.37
|
|
|||||||||||
|
Total debt securities held to maturity
|
$
|
190
|
|
4.41
|
%
|
$
|
2,750
|
|
1.81
|
%
|
$
|
17,851
|
|
4.48
|
%
|
$
|
30,733
|
|
4.34
|
%
|
|||||||
|
Total debt investment securities
|
$
|
22,828
|
|
3.66
|
%
|
$
|
135,285
|
|
2.74
|
%
|
$
|
155,497
|
|
4.36
|
%
|
$
|
209,824
|
|
2.97
|
%
|
|||||||
|
(1)
Excludes equity securities.
|
|||||||||||||||||||||||||||
|
(2)
Yield is on a tax-equivalent basis, assuming a federal income tax rate of 35% (the applicable federal income tax rate as of December 31, 2014)
|
|||||||||||||||||||||||||||
As of
December 31, 2014
, no non-agency issuer’s securities exceeded 10% of the Company’s total shareholders’ equity.
46
Loans (Excluding Loan Pool Participations)
The composition of bank loans (before deducting the allowance for loan losses), was as follows:
|
As of December 31,
|
||||||||||||||||||||||||||||||||||
|
2014
|
2013
|
2012
|
2011
|
2010
|
||||||||||||||||||||||||||||||
|
% of
|
% of
|
% of
|
% of
|
% of
|
||||||||||||||||||||||||||||||
|
Amount
|
Total
|
Amount
|
Total
|
Amount
|
Total
|
Amount
|
Total
|
Amount
|
Total
|
|||||||||||||||||||||||||
|
(dollars in thousands)
|
||||||||||||||||||||||||||||||||||
|
Agricultural
|
$
|
104,809
|
|
9.3
|
%
|
$
|
97,167
|
|
8.9
|
%
|
$
|
84,726
|
|
8.2
|
%
|
$
|
89,298
|
|
9.1
|
%
|
$
|
84,590
|
|
9.0
|
%
|
|||||||||
|
Commercial and industrial
|
303,108
|
|
26.7
|
|
262,368
|
|
24.1
|
|
237,193
|
|
22.9
|
|
239,990
|
|
24.3
|
|
211,334
|
|
22.5
|
|
||||||||||||||
|
Credit cards
|
1,246
|
|
0.1
|
|
1,028
|
|
0.1
|
|
1,001
|
|
0.1
|
|
934
|
|
0.1
|
|
655
|
|
0.1
|
|
||||||||||||||
|
Overdrafts
|
744
|
|
0.1
|
|
537
|
|
0.1
|
|
759
|
|
0.1
|
|
885
|
|
0.1
|
|
491
|
|
0.1
|
|
||||||||||||||
|
Commercial real estate:
|
||||||||||||||||||||||||||||||||||
|
Construction & development
|
59,383
|
|
5.2
|
|
72,589
|
|
6.6
|
|
86,794
|
|
8.4
|
|
73,258
|
|
7.4
|
|
73,315
|
|
7.8
|
|
||||||||||||||
|
Farmland
|
83,700
|
|
7.4
|
|
85,475
|
|
7.9
|
|
81,063
|
|
7.8
|
|
74,454
|
|
7.6
|
|
76,345
|
|
8.1
|
|
||||||||||||||
|
Multifamily
|
54,886
|
|
4.8
|
|
55,443
|
|
5.1
|
|
47,758
|
|
4.6
|
|
34,719
|
|
3.5
|
|
33,451
|
|
3.6
|
|
||||||||||||||
|
Commercial real estate-other
|
228,552
|
|
20.2
|
|
220,917
|
|
20.3
|
|
224,369
|
|
21.7
|
|
213,608
|
|
21.7
|
|
210,131
|
|
22.4
|
|
||||||||||||||
|
Total commercial real estate
|
426,521
|
|
37.6
|
|
434,424
|
|
39.9
|
|
439,984
|
|
42.5
|
|
396,039
|
|
40.2
|
|
393,242
|
|
41.9
|
|
||||||||||||||
|
Residential real estate:
|
||||||||||||||||||||||||||||||||||
|
One- to four- family first liens
|
219,314
|
|
19.4
|
|
220,668
|
|
20.3
|
|
197,742
|
|
19.1
|
|
175,429
|
|
17.8
|
|
156,882
|
|
16.7
|
|
||||||||||||||
|
One- to four- family junior liens
|
53,297
|
|
4.7
|
|
53,458
|
|
4.9
|
|
55,134
|
|
5.3
|
|
63,419
|
|
6.4
|
|
69,112
|
|
7.4
|
|
||||||||||||||
|
Total residential real estate
|
272,611
|
|
24.1
|
|
274,126
|
|
25.2
|
|
252,876
|
|
24.4
|
|
238,848
|
|
24.2
|
|
225,994
|
|
24.1
|
|
||||||||||||||
|
Consumer
|
23,480
|
|
2.1
|
|
18,762
|
|
1.7
|
|
18,745
|
|
1.8
|
|
20,179
|
|
2.0
|
|
21,729
|
|
2.3
|
|
||||||||||||||
|
Total loans
|
$
|
1,132,519
|
|
100.0
|
%
|
$
|
1,088,412
|
|
100.0
|
%
|
$
|
1,035,284
|
|
100.0
|
%
|
$
|
986,173
|
|
100.0
|
%
|
$
|
938,035
|
|
100.0
|
%
|
|||||||||
|
Total assets
|
$
|
1,800,302
|
|
$
|
1,755,218
|
|
$
|
1,792,819
|
|
$
|
1,695,244
|
|
$
|
1,581,259
|
|
|||||||||||||||||||
|
Loans to total assets
|
62.9
|
%
|
62.0
|
%
|
57.7
|
%
|
58.2
|
%
|
59.3
|
%
|
||||||||||||||||||||||||
Our loan portfolio, before allowance for loan losses, increased
4.1%
to
$1.13 billion
as of
December 31, 2014
from
$1.09 billion
at
December 31, 2013
. A significant portion of the overall loan increase occurred in commercial and industrial loans, which increased
$40.7 million
, or
15.5%
, to
$303.1 million
as of
December 31, 2014
, from
$262.4 million
as of
December 31, 2013
. This growth was primarily due to increased activity with new and existing business customers and participations with other community banks. Agricultural loans increased
$7.6 million
, or
7.9%
, to
$104.8 million
as of
December 31, 2014
, from
$97.2 million
at
December 31, 2013
. This increase was mainly due to the extension of additional credit to existing customers. Other commercial real estate loans also increased
$7.6 million
, or
3.5%
, due to the establishment of new lending relationships within our market area. Construction and development loans decreased
$13.2 million
, or
18.2%
, to
$59.4 million
as of
December 31, 2014
, compared to
$72.6 million
at
December 31, 2013
. This decrease was primarily the result of credit pay downs by existing customers. Commitments under standby letters of credit, unused lines of credit and other conditionally approved credit lines, totaled approximately
$271.0 million
and
$268.7 million
as of
December 31, 2014
and
2013
, respectively.
Our loan to deposit ratio increased to
81.9%
at year end
2014
from
81.2%
at the end of
2013
, with our target range for this ratio being “in the 80’s.” The increase in this ratio is reflective of the increased demand for loans in our market area.
The loan portfolio includes a concentration of loans for commercial real estate, which are included in the table above, amounting to approximately
$426.5 million
and
$434.4 million
as of
December 31, 2014
and
2013
, respectively. Of this amount,
$83.7 million
, or
7.4%
, of total loans was secured by farmland at
December 31, 2014
, compared to
$85.5 million
, or
7.9%
, at
December 31, 2013
. Generally, these loans are collateralized by assets of the borrowers and are expected to be repaid from operational cash flows or from proceeds from the sale of selected assets of the borrowers.
47
The following table sets forth remaining maturities and rate types of selected loans at
December 31, 2014
:
|
Total for Loans
|
Total for Loans
|
||||||||||||||||||||||||||||||
|
Due Within
|
Due After
|
||||||||||||||||||||||||||||||
|
Due In
|
One Year Having
|
One Year Having
|
|||||||||||||||||||||||||||||
|
Due Within
|
One to
|
Due After
|
Fixed
|
Variable
|
Fixed
|
Variable
|
|||||||||||||||||||||||||
|
One Year
|
Five Years
|
Five Years
|
Total
|
Rates
|
Rates
|
Rates
|
Rates
|
||||||||||||||||||||||||
|
(in thousands)
|
|||||||||||||||||||||||||||||||
|
Agricultural
|
$
|
83,551
|
|
$
|
16,080
|
|
$
|
5,178
|
|
$
|
104,809
|
|
$
|
8,403
|
|
$
|
75,148
|
|
$
|
16,250
|
|
$
|
5,008
|
|
|||||||
|
Commercial and industrial
|
123,179
|
|
102,977
|
|
76,952
|
|
303,108
|
|
42,448
|
|
80,731
|
|
121,471
|
|
58,458
|
|
|||||||||||||||
|
Credit cards
|
1,246
|
|
—
|
|
—
|
|
1,246
|
|
—
|
|
1,246
|
|
—
|
|
—
|
|
|||||||||||||||
|
Overdrafts
|
744
|
|
—
|
|
—
|
|
744
|
|
744
|
|
—
|
|
—
|
|
—
|
|
|||||||||||||||
|
Commercial real estate:
|
|||||||||||||||||||||||||||||||
|
Construction & development
|
43,756
|
|
13,653
|
|
1,974
|
|
59,383
|
|
17,198
|
|
26,558
|
|
7,305
|
|
8,322
|
|
|||||||||||||||
|
Farmland
|
8,132
|
|
41,163
|
|
34,405
|
|
83,700
|
|
8,070
|
|
62
|
|
53,084
|
|
22,484
|
|
|||||||||||||||
|
Multifamily
|
5,553
|
|
31,438
|
|
17,895
|
|
54,886
|
|
5,389
|
|
164
|
|
45,869
|
|
3,464
|
|
|||||||||||||||
|
Commercial real estate-other
|
46,568
|
|
146,762
|
|
35,222
|
|
228,552
|
|
42,987
|
|
3,581
|
|
151,853
|
|
30,131
|
|
|||||||||||||||
|
Total commercial real estate
|
104,009
|
|
233,016
|
|
89,496
|
|
426,521
|
|
73,644
|
|
30,365
|
|
258,111
|
|
64,401
|
|
|||||||||||||||
|
Residential real estate:
|
|||||||||||||||||||||||||||||||
|
One- to four- family first liens
|
11,761
|
|
52,107
|
|
155,446
|
|
219,314
|
|
11,502
|
|
259
|
|
116,005
|
|
91,548
|
|
|||||||||||||||
|
One- to four- family junior liens
|
1,538
|
|
15,481
|
|
36,278
|
|
53,297
|
|
879
|
|
659
|
|
24,465
|
|
27,294
|
|
|||||||||||||||
|
Total residential real estate
|
13,299
|
|
67,588
|
|
191,724
|
|
272,611
|
|
12,381
|
|
918
|
|
140,470
|
|
118,842
|
|
|||||||||||||||
|
Consumer
|
7,662
|
|
14,603
|
|
1,215
|
|
23,480
|
|
7,056
|
|
606
|
|
15,747
|
|
71
|
|
|||||||||||||||
|
Total loans
|
$
|
333,690
|
|
$
|
434,264
|
|
$
|
364,565
|
|
$
|
1,132,519
|
|
$
|
144,676
|
|
$
|
189,014
|
|
$
|
552,049
|
|
$
|
246,780
|
|
|||||||
Of the
$435.8 million
of variable rate loans, approximately
$273.7 million
, or
62.8%
, are subject to interest rate floors, with a weighted average floor rate of
4.45%
.
Nonperforming Assets
It is management’s policy to place loans on nonaccrual status when interest or principal is 90 days or more past due. Such loans may continue on accrual status only if they are both well-secured with marketable collateral and in the process of collection.
The following table sets forth information concerning nonperforming assets at December 31 for each of the years indicated:
|
December 31,
|
|||||||||||||||||||
|
2014
|
2013
|
2012
|
2011
|
2010
|
|||||||||||||||
|
(dollars in thousands)
|
|||||||||||||||||||
|
90 days or more past due and still accruing interest
|
$
|
848
|
|
$
|
1,385
|
|
$
|
572
|
|
$
|
1,054
|
|
$
|
1,579
|
|
||||
|
Troubled debt restructure
|
8,918
|
|
9,151
|
|
7,144
|
|
6,135
|
|
5,797
|
|
|||||||||
|
Nonaccrual
|
3,255
|
|
3,240
|
|
2,938
|
|
10,917
|
|
12,405
|
|
|||||||||
|
Total nonperforming loans
|
13,021
|
|
13,776
|
|
10,654
|
|
18,106
|
|
19,781
|
|
|||||||||
|
Other real estate owned
|
1,916
|
|
1,770
|
|
3,278
|
|
4,033
|
|
3,850
|
|
|||||||||
|
Total nonperforming loans and nonperforming other assets
|
$
|
14,937
|
|
$
|
15,546
|
|
$
|
13,932
|
|
$
|
22,139
|
|
$
|
23,631
|
|
||||
|
Nonperforming loans to loans, before allowance for loan losses
|
1.15
|
%
|
1.27
|
%
|
1.03
|
%
|
1.84
|
%
|
2.11
|
%
|
|||||||||
|
Nonperforming loans and nonperforming other assets to loans, before allowance for loan losses
|
1.32
|
%
|
1.43
|
%
|
1.35
|
%
|
2.24
|
%
|
2.52
|
%
|
|||||||||
We experienced a decrease in total nonperforming assets during
2014
as compared to
2013
. Total nonperforming assets were
$14.9 million
at
December 31, 2014
, compared to
$15.5 million
at
December 31, 2013
, a
$0.6 million
, or
3.9%
, decrease. Nonperforming loans decreased
$0.7 million
during
2014
, with a
$0.1 million
increase in nonperforming other assets (other real estate owned). The largest category of nonperforming loans was commercial real estate loans, with a balance of
$3.8 million
at
December 31, 2014
. The remaining nonperforming loans consisted of
$3.4 million
in residential real estate,
$3.0 million
in agricultural, and
$2.8 million
in commercial and industrial. The slight increase in other real estate owned (“OREO”) was primarily attributable to normal variances in OREO activity. All of the OREO property was acquired through foreclosures and we are actively working to sell all properties held as of
December 31, 2014
. Other real estate is carried at the lower of cost or fair
48
value less estimated costs of disposal. Additional discounts could be required to market and sell the properties, resulting in a write down through expense.
The following table sets forth information concerning nonperforming loans by portfolio class at
December 31, 2014
and
December 31, 2013
:
|
90 Days or More Past Due and Still Accruing Interest
|
Troubled Debt Restructure
|
Nonaccrual
|
Total
|
||||||||||||
|
(in thousands)
|
|||||||||||||||
|
2014
|
|||||||||||||||
|
Agricultural
|
$
|
—
|
|
$
|
3,027
|
|
$
|
—
|
|
$
|
3,027
|
|
|||
|
Commercial and industrial
|
66
|
|
2,217
|
|
479
|
|
2,762
|
|
|||||||
|
Credit cards
|
—
|
|
—
|
|
—
|
|
—
|
|
|||||||
|
Overdrafts
|
—
|
|
—
|
|
—
|
|
—
|
|
|||||||
|
Commercial real estate:
|
|||||||||||||||
|
Construction & development
|
—
|
|
—
|
|
83
|
|
83
|
|
|||||||
|
Farmland
|
—
|
|
2,268
|
|
24
|
|
2,292
|
|
|||||||
|
Multifamily
|
—
|
|
—
|
|
—
|
|
—
|
|
|||||||
|
Commercial real estate-other
|
—
|
|
255
|
|
1,200
|
|
1,455
|
|
|||||||
|
Total commercial real estate
|
—
|
|
2,523
|
|
1,307
|
|
3,830
|
|
|||||||
|
Residential real estate:
|
|||||||||||||||
|
One- to four- family first liens
|
780
|
|
1,119
|
|
1,261
|
|
3,160
|
|
|||||||
|
One- to four- family junior liens
|
—
|
|
14
|
|
192
|
|
206
|
|
|||||||
|
Total residential real estate
|
780
|
|
1,133
|
|
1,453
|
|
3,366
|
|
|||||||
|
Consumer
|
2
|
|
18
|
|
16
|
|
36
|
|
|||||||
|
Total
|
$
|
848
|
|
$
|
8,918
|
|
$
|
3,255
|
|
$
|
13,021
|
|
|||
|
2013
|
|||||||||||||||
|
Agricultural
|
$
|
—
|
|
$
|
3,093
|
|
$
|
52
|
|
$
|
3,145
|
|
|||
|
Commercial and industrial
|
213
|
|
2,350
|
|
746
|
|
3,309
|
|
|||||||
|
Credit cards
|
17
|
|
—
|
|
—
|
|
17
|
|
|||||||
|
Overdrafts
|
—
|
|
—
|
|
—
|
|
—
|
|
|||||||
|
Commercial real estate:
|
|||||||||||||||
|
Construction & development
|
—
|
|
—
|
|
139
|
|
139
|
|
|||||||
|
Farmland
|
—
|
|
2,311
|
|
29
|
|
2,340
|
|
|||||||
|
Multifamily
|
395
|
|
—
|
|
—
|
|
395
|
|
|||||||
|
Commercial real estate-other
|
164
|
|
381
|
|
1,576
|
|
2,121
|
|
|||||||
|
Total commercial real estate
|
559
|
|
2,692
|
|
1,744
|
|
4,995
|
|
|||||||
|
Residential real estate:
|
|||||||||||||||
|
One- to four- family first liens
|
540
|
|
982
|
|
543
|
|
2,065
|
|
|||||||
|
One- to four- family junior liens
|
49
|
|
13
|
|
126
|
|
188
|
|
|||||||
|
Total residential real estate
|
589
|
|
995
|
|
669
|
|
2,253
|
|
|||||||
|
Consumer
|
7
|
|
21
|
|
29
|
|
57
|
|
|||||||
|
Total
|
$
|
1,385
|
|
$
|
9,151
|
|
$
|
3,240
|
|
$
|
13,776
|
|
|||
Nonperforming loans decreased from
$13.8 million
, or
1.27%
of total bank loans, at
December 31, 2013
, to
$13.0 million
, or
1.15%
of total bank loans, at
December 31, 2014
. At
December 31, 2014
, nonperforming loans consisted of
$3.3 million
in nonaccrual loans,
$8.9 million
in troubled debt restructures (“TDRs”) and
$0.8 million
in loans past due 90 days or more and still accruing. This compares to nonaccrual loans of
$3.2 million
, TDRs of
$9.2 million
, and loans past due 90 days or more and still accruing of
$1.4 million
at
December 31, 2013
. The decrease in overall nonperforming loans was primarily due to payments and payoffs collected from TDR-status borrowers, as well as the net reduction of TDR-status borrowers by two. Loans 90 days past due and still accruing interest declined $0.5 million, while nonaccrual loans were virtually unchanged. Bank loans past due 30 to 89 days and still accruing interest (not included in the nonperforming loan totals) were
$3.9 million
at
December 31, 2014
, compared with
$4.9 million
at
December 31, 2013
. At
December 31, 2014
, OREO (not included in nonperforming loans) was
$1.9 million
, up from
$1.8 million
at
December 31, 2013
. During
2014
the Company added fourteen properties to OREO, while at the same time selling nine properties, excluding lot sales from existing development properties. The allowance for loan losses
49
represented
125.67%
of nonperforming loans at
December 31, 2014
, compared with
117.44%
of nonperforming loans at
December 31, 2013
.
A loan is considered to be impaired when, based on current information and events, it is probable that we will not be able to collect all amounts due. The accrual of interest income on impaired loans is discontinued when there is reasonable doubt as to the borrower’s ability to meet contractual payments of interest or principal. Interest income on these loans is recognized to the extent interest payments are received and the principal is considered fully collectible.
The gross interest income that would have been recorded in the years ended
December 31, 2014
,
2013
and
2012
if the nonaccrual and TDRs had been current in accordance with their original terms was
$0.9 million
,
$0.6 million
, and
$2.2 million
, respectively. The amount of interest collected on those loans that was included in interest income was
$0.5 million
,
$0.4 million
, and
$0.8 million
for the years ended
December 31, 2014
,
2013
and
2012
, respectively.
In addition to the non-performing and past due loans mentioned above, the Company also has identified loans for which management has concerns about the ability of the borrowers to meet existing repayment terms. The loans are generally secured by either real estate or other borrower assets, reducing the potential for loss should they become non-performing. Although these loans are generally identified as potential problem loans, it is possible that they never become non-performing.
Loan Review and Classification Process for Agricultural Loans, Commercial and Industrial Loans, and Commercial Real Estate Loans
The Company maintains a loan review and classification process which involves multiple officers of the Company and is designed to assess the general quality of credit underwriting and to promote early identification of potential problem loans. All commercial and agricultural loan officers are charged with the responsibility of risk rating all loans in their portfolios and updating the ratings, positively or negatively, on an ongoing basis as conditions warrant. A monthly loan officer validation worksheet documents this process. Risk ratings are selected from an 8-point scale with ratings as follows: ratings 1- 4 Satisfactory (pass), rating 5 Watch (potential weakness), rating 6 Substandard (well-defined weakness), rating 7 Doubtful, and rating 8 Loss.
When a loan officer originates a new loan, based upon proper loan authorization, he or she documents the credit file with an offering sheet summary, supplemental underwriting analysis, relevant financial information and collateral evaluations. All of this information is used in the determination of the initial loan risk rating. The Company's loan review department undertakes independent credit reviews of relationships based on either criteria established by loan policy, risk-focused sampling, or random sampling. Loan policy requires the top 50 lending relationships by total exposure as well as all classified and Watch rated credits over $250,000 be reviewed no less than annually. The individual loan reviews consider such items as: loan type; nature, type and estimated value of collateral; borrower and/or guarantor estimated financial strength; most recently available financial information; related loans and total borrower exposure; and current/anticipated performance of the loan. The results of such reviews are presented to executive management.
Through the review of delinquency reports, updated financial statements or other relevant information, the lending officer and/or loan review personnel may determine that a loan relationship has weakened to the point that a criticized (loan grade 5) or classified (loan grades 6 through 8) status is warranted. When a loan relationship with total related exposure of $1.0 million or greater is adversely graded (5 or above), or is classified as a TDR (regardless of size), the lending officer is then charged with preparing a loan strategy summary worksheet that outlines the background of the credit problem, current repayment status of the loans, current collateral evaluation and a workout plan of action. This plan may include goals to improve the credit rating, assist the borrower in moving the loans to another institution and/or collateral liquidation. All such reports are first presented to regional management and then to the board of directors by the Executive Vice President, Chief Credit Officer (or a designee).
Depending upon the individual facts and circumstances and the result of the Classified/Watch review process, loan officers and/or loan review personnel may categorize the loan relationship as impaired. Once that determination has occurred, the loan officer, in conjunction with regional management, will complete an evaluation of the collateral (for collateral-dependent loans) based upon the estimated collateral value, adjusting for current market conditions and other local factors that may affect collateral value. Loan review personnel may also complete an independent impairment analysis when deemed necessary. These judgmental evaluations may produce an initial specific allowance for placement in the Company's allowance for loan & lease losses calculation. As soon as practical, an updated value estimate of the collateral backing that impaired loan relationship is completed. When the updated value is determined, regional management, with assistance from the loan review department, reviews the valuation and updates the specific allowance analysis for each loan relationship accordingly. The board of directors on a quarterly basis reviews the Classified/Watch reports including changes in credit grades of 5 or higher as well as all impaired loans, the related allowances and OREO.
50
In general, once the specific allowance has been finalized, regional and executive management will consider a charge-off prior to the calendar quarter-end in which that reserve calculation is finalized.
The review process also provides for the upgrade of loans that show improvement since the last review.
Restructured Loans
We restructure loans for our customers who appear to be able to meet the terms of their loan over the long term, but who may be unable to meet the terms of the loan in the near term due to individual circumstances. We consider the customer's past performance, previous and current credit history, the individual circumstances surrounding the current difficulties and their plan to meet the terms of the loan in the future prior to restructuring the terms of the loan. All of the following factors are indicators that the Bank has granted a concession (one or multiple items may be present):
|
•
|
The borrower receives a reduction of the stated interest rate for the remaining original life of the debt.
|
|
•
|
The borrower receives an extension of the maturity date or dates at a stated interest rate lower than the current market interest rate for new debt with similar risk characteristics.
|
|
•
|
The borrower receives a reduction of the face amount or maturity amount of the debt as stated in the instrument or other agreement.
|
|
•
|
The borrower receives a deferral of required payments (principal and/or interest).
|
|
•
|
The borrower receives a reduction of the accrued interest.
|
Generally, loans are restructured through short-term interest rate relief, short-term principal payment relief or short-term principal and interest payment relief. Once a restructured loan has gone 90 days or more past due or is placed on nonaccrual status, it is included in the 90 days and over past due or nonaccrual totals in the previous table.
During the year ended December 31, 2014 one loan was added to reported TDRs, and three were removed due to payoff. The new addition is a residential real estate loan that was granted a rate concession due to financial difficulties being experienced by the borrower. Of the three that were paid off, one was a home equity loan that had received a rate concession, and the other two were commercial real estate-other credits which had both been granted extensions to their maturity dates.
During the year ended December 31, 2013 sixteen loans were added to reported TDRs. Ten commercial and industrial loans were added, with nine to the same borrower being newly reported due to their adjustment to interest-only payments. The other commercial and industrial loan is to a different borrower and had previously been considered a performing TDR until being given a six month payment deferral in 2013. Two commercial real estate-other credits were both granted extensions to their maturity dates, and were added as new TDRs. A total of three one- to four- family first lien loans were added to reported TDRs during 2013. Two new TDRs were granted interest rate reductions, with the other one being given an extension of its maturity date. One one- to four- family junior lien was granted a rate concession due to borrower financial difficulties during 2013.
We consider all TDRs, regardless of whether they are performing in accordance with their modified terms, to be impaired loans when determining our allowance for loan losses. A summary of restructured loans as of
December 31, 2014
and
December 31, 2013
is as follows:
|
December 31,
|
|||||||
|
2014
|
2013
|
||||||
|
(in thousands)
|
|||||||
|
Restructured Loans (TDRs):
|
|||||||
|
In compliance with modified terms
|
$
|
8,918
|
|
$
|
9,151
|
|
|
|
Not in compliance with modified terms - on nonaccrual status
|
522
|
|
550
|
|
|||
|
Total restructured loans
|
$
|
9,440
|
|
$
|
9,701
|
|
|
51
Allowance for Loan Losses
The following table shows activity affecting the allowance for loan losses:
|
|
Year ended December 31,
|
||||||||||||||||||
|
|
2014
|
2013
|
2012
|
2011
|
2010
|
||||||||||||||
|
(dollars in thousands)
|
|||||||||||||||||||
|
Amount of loans outstanding at end of period (net of unearned interest)
(1)
|
$
|
1,132,519
|
|
$
|
1,088,412
|
|
$
|
1,035,284
|
|
$
|
986,173
|
|
$
|
938,035
|
|
||||
|
Average amount of loans outstanding for the period (net of unearned interest)
|
$
|
1,092,280
|
|
$
|
1,059,356
|
|
$
|
1,001,259
|
|
$
|
953,392
|
|
$
|
955,562
|
|
||||
|
Allowance for loan losses at beginning of period
(1)
|
$
|
16,179
|
|
$
|
15,957
|
|
$
|
15,676
|
|
$
|
15,167
|
|
$
|
13,957
|
|
||||
|
Charge-offs:
|
|||||||||||||||||||
|
Agricultural
|
$
|
26
|
|
$
|
39
|
|
$
|
—
|
|
$
|
425
|
|
$
|
1,347
|
|
||||
|
Commercial and industrial
|
673
|
|
695
|
|
2,323
|
|
1,434
|
|
1,483
|
|
|||||||||
|
Credit cards
|
12
|
|
95
|
|
22
|
|
6
|
|
17
|
|
|||||||||
|
Overdrafts
|
37
|
|
64
|
|
41
|
|
78
|
|
59
|
|
|||||||||
|
Commercial real estate:
|
|||||||||||||||||||
|
Construction & development
|
86
|
|
342
|
|
23
|
|
488
|
|
611
|
|
|||||||||
|
Farmland
|
—
|
|
—
|
|
—
|
|
—
|
|
—
|
|
|||||||||
|
Multifamily
|
—
|
|
—
|
|
—
|
|
58
|
|
—
|
|
|||||||||
|
Commercial real estate-other
|
79
|
|
203
|
|
106
|
|
734
|
|
870
|
|
|||||||||
|
Total commercial real estate
|
165
|
|
545
|
|
129
|
|
1,280
|
|
1,481
|
|
|||||||||
|
Residential real estate:
|
|||||||||||||||||||
|
One- to four- family first liens
|
349
|
|
170
|
|
438
|
|
447
|
|
338
|
|
|||||||||
|
One- to four- family junior liens
|
60
|
|
116
|
|
99
|
|
56
|
|
103
|
|
|||||||||
|
Total residential real estate
|
409
|
|
286
|
|
537
|
|
503
|
|
441
|
|
|||||||||
|
Consumer
|
39
|
|
83
|
|
49
|
|
75
|
|
261
|
|
|||||||||
|
Total charge-offs
|
$
|
1,361
|
|
$
|
1,807
|
|
$
|
3,101
|
|
$
|
3,801
|
|
$
|
5,089
|
|
||||
|
Recoveries:
|
|||||||||||||||||||
|
Agricultural
|
$
|
10
|
|
$
|
36
|
|
$
|
507
|
|
$
|
67
|
|
$
|
5
|
|
||||
|
Commercial and industrial
|
215
|
|
68
|
|
423
|
|
571
|
|
93
|
|
|||||||||
|
Credit cards
|
2
|
|
2
|
|
—
|
|
2
|
|
3
|
|
|||||||||
|
Overdrafts
|
13
|
|
6
|
|
8
|
|
19
|
|
15
|
|
|||||||||
|
Commercial real estate:
|
|||||||||||||||||||
|
Construction & development
|
38
|
|
—
|
|
10
|
|
113
|
|
8
|
|
|||||||||
|
Farmland
|
—
|
|
1
|
|
1
|
|
2
|
|
1
|
|
|||||||||
|
Multifamily
|
—
|
|
4
|
|
—
|
|
—
|
|
—
|
|
|||||||||
|
Commercial real estate-other
|
23
|
|
474
|
|
13
|
|
29
|
|
141
|
|
|||||||||
|
Total commercial real estate
|
61
|
|
479
|
|
24
|
|
144
|
|
150
|
|
|||||||||
|
Residential real estate:
|
|||||||||||||||||||
|
One- to four- family first liens
|
18
|
|
24
|
|
29
|
|
22
|
|
2
|
|
|||||||||
|
One- to four- family junior liens
|
4
|
|
43
|
|
2
|
|
11
|
|
56
|
|
|||||||||
|
Total residential real estate
|
22
|
|
67
|
|
31
|
|
33
|
|
58
|
|
|||||||||
|
Consumer
|
22
|
|
21
|
|
10
|
|
124
|
|
25
|
|
|||||||||
|
Total recoveries
|
$
|
345
|
|
$
|
679
|
|
$
|
1,003
|
|
$
|
960
|
|
$
|
349
|
|
||||
|
Net loans charged off
|
$
|
1,016
|
|
$
|
1,128
|
|
$
|
2,098
|
|
$
|
2,841
|
|
$
|
4,740
|
|
||||
|
Provision for loan losses
|
1,200
|
|
1,350
|
|
2,379
|
|
3,350
|
|
5,950
|
|
|||||||||
|
Allowance for loan losses at end of period
|
$
|
16,363
|
|
$
|
16,179
|
|
$
|
15,957
|
|
$
|
15,676
|
|
$
|
15,167
|
|
||||
|
Net loans charged off to average loans
|
0.09
|
%
|
0.11
|
%
|
0.21
|
%
|
0.30
|
%
|
0.50
|
%
|
|||||||||
|
Allowance for loan losses to total loans at end of period
|
1.44
|
%
|
1.49
|
%
|
1.54
|
%
|
1.59
|
%
|
1.62
|
%
|
|||||||||
|
(1) Loans do not include, and the allowance for loan losses does not include, loan pool participations.
|
|||||||||||||||||||
52
The following table sets forth the allowance for loan losses by loan portfolio segments as of December 31 for each of the years indicated:
|
December 31,
|
||||||||||||||||||||||||||||||||||
|
2014
|
2013
|
2012
|
2011
|
2010
|
||||||||||||||||||||||||||||||
|
Allowance Amount
|
Percent of Loans to Total Loans
|
Allowance Amount
|
Percent of Loans to Total Loans
|
Allowance Amount
|
Percent of Loans to Total Loans
|
Allowance Amount
|
Percent of Loans to Total Loans
|
Allowance Amount
|
Percent of Loans to Total Loans
|
|||||||||||||||||||||||||
|
(dollars in thousands)
|
||||||||||||||||||||||||||||||||||
|
Agricultural
|
$
|
1,506
|
|
9.2
|
%
|
$
|
1,358
|
|
8.4
|
%
|
$
|
1,026
|
|
6.4
|
%
|
$
|
1,209
|
|
7.7
|
%
|
$
|
827
|
|
5.5
|
%
|
|||||||||
|
Commercial and industrial
|
5,780
|
|
35.3
|
|
4,980
|
|
30.8
|
|
4,599
|
|
28.8
|
|
5,380
|
|
34.3
|
|
4,540
|
|
29.9
|
|
||||||||||||||
|
Commercial real estate
|
4,399
|
|
26.9
|
|
5,294
|
|
32.7
|
|
5,767
|
|
36.2
|
|
5,171
|
|
33.0
|
|
5,255
|
|
34.7
|
|
||||||||||||||
|
Residential real estate
|
3,167
|
|
19.4
|
|
3,185
|
|
19.7
|
|
3,007
|
|
18.9
|
|
3,501
|
|
22.3
|
|
2,776
|
|
18.3
|
|
||||||||||||||
|
Consumer
|
323
|
|
2.0
|
|
275
|
|
1.7
|
|
356
|
|
2.2
|
|
167
|
|
1.1
|
|
323
|
|
2.1
|
|
||||||||||||||
|
Unallocated
|
1,188
|
|
7.2
|
|
1,087
|
|
6.7
|
|
1,202
|
|
7.5
|
|
248
|
|
1.6
|
|
1,446
|
|
9.5
|
|
||||||||||||||
|
Total
|
$
|
16,363
|
|
100.0
|
%
|
$
|
16,179
|
|
100.0
|
%
|
$
|
15,957
|
|
100.0
|
%
|
$
|
15,676
|
|
100.0
|
%
|
$
|
15,167
|
|
100.0
|
%
|
|||||||||
This table indicates marginal growth in the allowance for loan losses as of
December 31, 2014
, as compared to
December 31, 2013
.
There were no changes to our methodology for determining the allowance for loan losses during the year of
2014
. Classified and impaired loans are reviewed per the requirements of FASB ASC Topic 310.
We currently track the loan to value (“LTV”) ratio of loans in our portfolio, and those loans in excess of internal and supervisory guidelines are presented to the Bank’s board of directors on a quarterly basis. At
December 31, 2014
, there were four owner-occupied 1-4 family loans with a LTV ratio of 100% or greater. In addition, there were 30 home equity loans without credit enhancement that had a LTV ratio of 100% or greater. We have the first lien on 10 of these equity loans and other financial institutions have the first lien on the remaining 20.
We review all impaired and nonperforming loans individually on a quarterly basis to determine their level of impairment due to collateral deficiency or insufficient cash-flow based on a discounted cash-flow analysis. We review loans 90 days and over past due that are still accruing interest no less than quarterly to determine if there is a strong reason that the credit should not be placed on non-accrual.
Loan Pool Participations
As of
December 31, 2014
, we had loan pool participations of
$19.3 million
compared to
$25.5 million
at
December 31, 2013
, both net of an allowance for loan losses of
$2.1 million
. Loan pool participations are participation interests in performing, subperforming and nonperforming loans that have been purchased from various nonaffiliated banking organizations. Former MidWest
One
had engaged in this activity since 1988. The loan pool investment balance shown as an asset on our consolidated balance sheets represents the discounted purchase cost of the loan pool participations, net of the related allowance for loan losses. After extensive discussion and analysis of our current loan pool portfolio during 2010, we decided to exit this line of business as current balances pay down. As such, we did not acquire any new loan pool participations during
2014
, and have not since 2010. As of
December 31, 2014
, the categories of loans by collateral type in the loan pool participations were commercial real estate -
66.4%
, commercial and industrial loans -
4.4%
, single-family residential real estate -
15.6%
and other loans -
13.6%
. We have minimal exposure in loan pool participations to consumer real estate, subprime credit or to construction and real estate development loans.
The net “all-in” yield (excluding purchase accounting adjustments and after all expenses) on loan pool participations was
6.23%
and
6.27%
for the years ended
December 31, 2014
and
2013
, respectively. The net yield was slightly lower in
2014
than for
2013
primarily due to income being accounted for on a cash basis when actual payments are received, which can cause income related to this item to vary widely from period to period. We expect overall rates of return on the loan pool participations to trend steady to downward in the future, as the percentage of performing credits in the portfolio continues to decrease.
The loans in the pools provide some geographic diversification to our balance sheet. As of
December 31, 2014
, loans in the southeast region of the United States represented approximately
44%
of the total. The northeast region was the next largest area with
32%
, and the central region represented
23%
. The southwest and the northwest regions represented a minimal amount
53
of the portfolio at less than 1% combined. The highest concentration of assets in any one state is
Florida
at approximately
19.0%
of the basis total, with the next highest state level being
Ohio
at
13.2%
, followed by
New Jersey
at
8.0%
. As of
December 31, 2014
, approximately
68.9%
of the loans were contractually current or less than 90 days past due, while
31.1%
were contractually past due 90 days or more. It should be noted that many of the loans were acquired in a contractually past due status, which is reflected in the discounted purchase price of the loans. Performance status is monitored on a monthly basis. The
31.1%
contractually past due total includes loans in litigation and foreclosed property. As of
December 31, 2014
and
2013
, loans in litigation totaled approximately
$1.1 million
and
$2.3 million
respectively, while foreclosed property was approximately
$2.8 million
and
$3.4 million
, respectively. As of
December 31, 2014
, our investment basis in loan pool participations was approximately
31.4%
of the face amount of the underlying loans, compared to approximately
34.2%
at
December 31, 2013
.
Premises and Equipment
As of
December 31, 2014
, premises and equipment totaled
$37.8 million
, an increase of
$10.1 million
, or
36.4%
, from
$27.7 million
at
December 31, 2013
. This increase was primarily due to two ongoing major construction projects, both in our Iowa City market. In August 2013, we entered into a contract for the restoration and remodeling of the building which serves as the main office of the Bank and headquarters of the Company. The estimated cost of the restoration and remodeling is $13.8 million, and it is anticipated that the project will be completed in April 2016. In December 2013, we entered into a contract for the construction of a new Home Mortgage Center with an estimated cost of design and construction of $16.0 million, and with completion anticipated in the second quarter of 2015. We expect the balance of premises and equipment to continue rising in the future as these projects progress towards completion.
Intangible Assets
Intangible assets totaled
$8.3 million
and
$8.8 million
at
December 31, 2014
and
2013
, respectively. Intangible assets declined by
$0.5 million
during the year ended
December 31, 2014
, primarily related to core deposit amortization during the year. There were no impairment charges during
2014
or
2013
related to our intangible assets.
Deposits
As indicated in the following table, the average balances of the interest-bearing demand deposit category as a percentage of average total deposits has shown steady growth for the five years ended
December 31, 2014
.
The average balance of non-interest-bearing accounts increased
$3.9 million
from
December 31, 2013
to
December 31, 2014
, of which $7.3 million was in public funds while commercial accounts declined $6.2 million. Interest-bearing demand deposits increased
$22.1 million
. Of that increase, $12.7 million was in business accounts, $6.2 million was in individual account deposits, and $3.2 million was in public fund accounts. Personal savings accounts increased by $5.9 million. The aggregate balance of time deposits increased by
$8.2 million
from
2013
to
2014
, primarily in deposits of $100,000 and over.
|
Year Ended December 31,
|
|||||||||||||||||||||||||||||||||||||||||||||||||
|
2014
|
2013
|
2012
|
2011
|
2010
|
|||||||||||||||||||||||||||||||||||||||||||||
|
Average
|
%
|
Average
|
Average
|
%
|
Average
|
Average
|
%
|
Average
|
Average
|
%
|
Average
|
Average
|
%
|
Average
|
|||||||||||||||||||||||||||||||||||
|
Balance
|
Total
|
Rate
|
Balance
|
Total
|
Rate
|
Balance
|
Total
|
Rate
|
Balance
|
Total
|
Rate
|
Balance
|
Total
|
Rate
|
|||||||||||||||||||||||||||||||||||
|
(dollars in thousands)
|
|||||||||||||||||||||||||||||||||||||||||||||||||
|
Non-interest-bearing demand deposits
|
$
|
208,071
|
|
15.0
|
%
|
NA
|
|
$
|
204,185
|
|
15.0
|
%
|
NA
|
|
$
|
170,841
|
|
12.8
|
%
|
NA
|
|
$
|
149,033
|
|
11.8
|
%
|
NA
|
|
$
|
138,682
|
|
11.6
|
%
|
NA
|
|
||||||||||||||
|
Interest-bearing demand (NOW and money market)
|
603,812
|
|
43.7
|
|
0.36
|
%
|
581,723
|
|
42.8
|
|
0.41
|
%
|
521,757
|
|
39.1
|
|
0.58
|
%
|
470,792
|
|
37.3
|
|
0.83
|
%
|
420,557
|
|
35.3
|
|
1.01
|
%
|
|||||||||||||||||||
|
Savings
|
102,850
|
|
7.4
|
|
0.14
|
|
96,034
|
|
7.1
|
|
0.15
|
|
83,030
|
|
6.2
|
|
0.17
|
|
73,813
|
|
5.8
|
|
0.27
|
|
67,316
|
|
5.6
|
|
0.27
|
|
|||||||||||||||||||
|
Time deposits
|
469,351
|
|
33.9
|
|
1.00
|
|
477,537
|
|
35.1
|
|
1.35
|
|
559,847
|
|
41.9
|
|
1.57
|
|
569,067
|
|
45.1
|
|
1.97
|
|
566,196
|
|
47.5
|
|
2.32
|
|
|||||||||||||||||||
|
Total deposits
|
$
|
1,384,084
|
|
100.0
|
%
|
0.51
|
%
|
$
|
1,359,479
|
|
100.0
|
%
|
0.66
|
%
|
$
|
1,335,475
|
|
100.0
|
%
|
0.90
|
%
|
$
|
1,262,705
|
|
100.0
|
%
|
1.21
|
%
|
$
|
1,192,751
|
|
100.0
|
%
|
1.47
|
%
|
||||||||||||||
Certificates of deposit and other time deposits of $100,000 and over at
December 31, 2014
had the following maturities:
|
(in thousands)
|
|||
|
Three months or less
|
$
|
36,529
|
|
|
Over three through six months
|
55,757
|
|
|
|
Over six months through one year
|
73,950
|
|
|
|
Over one year
|
71,383
|
|
|
|
Total
|
$
|
237,619
|
|
54
Federal Home Loan Bank Advances, Long-term Debt, and Other Borrowings
We utilize FHLB advances as an alternate source of funds to supplement deposits. Long-term debt is in the form of junior subordinated debentures that have been issued to a statutory trust that issued trust preferred securities.These junior subordinated debentures were assumed by us from Former MidWest
One
in the merger. Former MidWest
One
had issued these junior subordinated debentures on September 20, 2007, to MidWest
One
Capital Trust II. The junior subordinated debentures supporting the trust preferred securities have a maturity date of
December 15, 2037
, and do not require any principal amortization. They became callable on December 15, 2012 at par, and are callable, in whole or in part, on any interest payment date thereafter, at our option. The interest rate on the debt is variable and based on the three month LIBOR rate plus 1.59% with interest payable quarterly. Federal funds purchased and securities sold under agreements to repurchase generally represent overnight borrowing transactions.
The following table sets forth the distribution of borrowed funds and weighted average interest rates thereon at the end of each of the last three years.
|
December 31,
|
||||||||||||||||||||
|
2014
|
2013
|
2012
|
||||||||||||||||||
|
Average
|
Average
|
Average
|
||||||||||||||||||
|
Balance
|
Rate
|
Balance
|
Rate
|
Balance
|
Rate
|
|||||||||||||||
|
(dollars in thousands)
|
||||||||||||||||||||
|
FHLB borrowings
|
$
|
93,000
|
|
1.88
|
%
|
$
|
106,900
|
|
2.10
|
%
|
$
|
120,120
|
|
2.24
|
%
|
|||||
|
Long-term debt
|
15,464
|
|
1.82
|
|
15,464
|
|
1.84
|
|
15,464
|
|
1.90
|
|
||||||||
|
Federal funds purchased and repurchase agreements
|
78,229
|
|
0.21
|
|
66,665
|
|
0.21
|
|
68,823
|
|
0.30
|
|
||||||||
|
Total
|
$
|
186,693
|
|
1.18
|
%
|
$
|
189,029
|
|
1.41
|
%
|
$
|
204,407
|
|
1.56
|
%
|
|||||
The following table sets forth the maximum amount of borrowed funds outstanding at any month-end for the years ended
December 31, 2014
,
2013
and
2012
.
|
Year Ended December 31,
|
|||||||||||
|
2014
|
2013
|
2012
|
|||||||||
|
(in thousands)
|
|||||||||||
|
FHLB borrowings
|
$
|
110,900
|
|
$
|
152,156
|
|
$
|
145,085
|
|
||
|
Long-term debt
|
15,464
|
|
15,464
|
|
15,464
|
|
|||||
|
Federal funds purchased and repurchase agreements
|
78,229
|
|
74,573
|
|
73,387
|
|
|||||
|
Total
|
$
|
204,593
|
|
$
|
242,193
|
|
$
|
233,936
|
|
||
The following table sets forth the average amount of and the average rate paid on borrowed funds for the years ended
December 31, 2014
,
2013
and
2012
:
|
Year Ended December 31,
|
||||||||||||||||||||
|
2014
|
2013
|
2012
|
||||||||||||||||||
|
Average
|
Average
|
Average
|
Average
|
Average
|
Average
|
|||||||||||||||
|
Balance
|
Rate
|
Balance
|
Rate
|
Balance
|
Rate
|
|||||||||||||||
|
(dollars in thousands)
|
||||||||||||||||||||
|
FHLB borrowings
|
$
|
103,515
|
|
2.02
|
%
|
$
|
128,567
|
|
2.09
|
%
|
$
|
132,786
|
|
2.33
|
%
|
|||||
|
Long-term debt
|
15,464
|
|
1.82
|
|
15,464
|
|
1.84
|
|
15,464
|
|
4.24
|
|
||||||||
|
Federal funds purchased and repurchase agreements
|
59,012
|
|
0.22
|
|
63,604
|
|
0.26
|
|
56,716
|
|
0.36
|
|
||||||||
|
Total
|
$
|
177,991
|
|
1.41
|
%
|
$
|
207,635
|
|
1.51
|
%
|
$
|
204,966
|
|
1.93
|
%
|
|||||
55
Contractual Obligations
The following table summarizes contractual obligations payments due by period, as of
December 31, 2014
:
|
Less than
|
1 to 3
|
3 to 5
|
More than
|
||||||||||||||||
|
Total
|
1 year
|
years
|
years
|
5 years
|
|||||||||||||||
|
Contractual obligations
|
|||||||||||||||||||
|
(in thousands)
|
|||||||||||||||||||
|
Time certificates of deposit
|
$
|
473,014
|
|
$
|
267,510
|
|
$
|
187,323
|
|
$
|
18,181
|
|
$
|
—
|
|
||||
|
Federal funds purchased and repurchase agreements
|
78,229
|
|
78,229
|
|
—
|
|
—
|
|
—
|
|
|||||||||
|
FHLB borrowings
|
93,000
|
|
20,000
|
|
27,000
|
|
34,000
|
|
12,000
|
|
|||||||||
|
Long-term debt
|
15,464
|
|
—
|
|
—
|
|
—
|
|
15,464
|
|
|||||||||
|
Noncancelable operating leases and capital lease obligations
|
392
|
|
175
|
|
165
|
|
52
|
|
—
|
|
|||||||||
|
Total
|
$
|
660,099
|
|
$
|
365,914
|
|
$
|
214,488
|
|
$
|
52,233
|
|
$
|
27,464
|
|
||||
Off-Balance Sheet Transactions
During the normal course of business, we become a party to financial instruments with off-balance-sheet risk in order to meet the financing needs of our customers. These financial instruments include commitments to make loans and open-ended revolving lines of credit. We follow the same credit policy (including requiring collateral, if deemed appropriate) to make such commitments as is followed for those loans that are recorded in our financial statements.
Our exposure to credit losses in the event of nonperformance is represented by the contractual amount of the commitments. Management does not expect any significant losses as a result of these commitments. Off-balance-sheet transactions are more fully discussed in Note 16 to our consolidated financial statements.
The following table summarizes our off-balance-sheet commitments by expiration period, as of
December 31, 2014
:
|
Less than
|
1 to 3
|
3 to 5
|
More than
|
||||||||||||||||
|
Total
|
1 year
|
years
|
years
|
5 years
|
|||||||||||||||
|
Contractual obligations
|
|||||||||||||||||||
|
(in thousands)
|
|||||||||||||||||||
|
Commitments to extend credit
|
$
|
267,036
|
|
$
|
148,652
|
|
$
|
118,384
|
|
$
|
—
|
|
$
|
—
|
|
||||
|
Commitments to sell loans
|
801
|
|
801
|
|
—
|
|
—
|
|
—
|
|
|||||||||
|
Standby letters of credit
|
3,204
|
|
2,577
|
|
36
|
|
591
|
|
—
|
|
|||||||||
|
Total
|
$
|
271,041
|
|
$
|
152,030
|
|
$
|
118,420
|
|
$
|
591
|
|
$
|
—
|
|
||||
Capital Resources
The Federal Reserve uses capital adequacy guidelines in its examination and regulation of bank holding companies and their subsidiary banks. Risk-based capital ratios are established by allocating assets and certain off-balance-sheet commitments into four risk-weighted categories. These balances are then multiplied by the factor appropriate for that risk-weighted category. The guidelines were changed by the Basel III Rules, which became effective on January 1, 2015. Based on the Company’s assessment of these new regulations, as of December 31, 2014, the Company and the Bank met the requirements necessary to be classified as well-capitalized under the new regulations. The guidelines in effect on December 31, 2014 required bank holding companies and their subsidiary banks to maintain a total capital to total risk-weighted asset ratio of not less than 8.00%, of which at least one half must be Tier 1 capital, and a Tier 1 leverage ratio of not less than 4.00%. As of
December 31, 2014
, MidWest
One
Financial Group, Inc. had a total capital to total risk-weighted asset ratio of
14.73%
, a Tier 1 capital to risk-weighted asset ratio of
13.47%
and a Tier 1 leverage ratio of
10.85%
; MidWest
One
Bank had ratios of
13.75%
,
12.50%
, and
10.05%
, respectively. These ratios were all calculated using the guidelines in effect on December 31, 2014, and under those guidelines MidWest
One
Bank exceeded the regulatory capital guidelines necessary to be considered well-capitalized.
On January 15, 2013, our board of directors announced the renewal of the Company's share repurchase program, extending the expiration of the program to December 31, 2014 and increasing the remaining amount of authorized repurchases under the program to $5.0 million from the approximately $2.4 million of authorized repurchases that had previously remained.
56
On
July 17, 2014
, our board of directors approved a new share repurchase program, allowing for the repurchase of up to
$5.0 million
of stock through
December 31, 2016
. The new repurchase program replaced the prior repurchase program, pursuant to which we had repurchased approximately
$3.7 million
of common stock since January 15, 2013. Pursuant to the new program, we may continue to repurchase shares from time to time in the open market, and the method, timing and amounts of repurchase will be solely in the discretion of our management. The repurchase program does not require us to acquire a specific number of shares. Therefore, the amount of shares repurchased pursuant to the program will depend on several factors, including market conditions, capital and liquidity requirements, and alternative uses for cash available. During 2014 under the July 17, 2014 repurchase program we repurchased
$1.2 million
of common stock. Of the
$5.0 million
of stock authorized under the repurchase plan,
$3.8 million
remained available for possible future repurchases as of
December 31, 2014
.
In
2014
we repurchased a total of
165,766
shares of common stock at a cost of
$4.0 million
under both of the plans, at an average cost of
$24.05
per share. There were no repurchases of stock in the 4th quarter of
2014
.
During
2014
,
15,419
shares were issued in connection with the exercise of previously issued stock options, and
1,235
shares were surrendered in connection with the exercise of such options. On
January 21, 2014
,
26,100
restricted stock units were granted to certain directors and officers. During
2014
,
27,491
shares were issued in connection with the vesting of previously awarded grants of restricted stock units, of which
2,042
shares were surrendered by grantees to satisfy tax requirements.
Also during 2014, we entered into an agreement with Central Bancshares, Inc. providing for the merger of Central Bancshares with the Company. As part of that agreement, we agreed to issue
2,723,083
shares of our common stock to Central Bancshares shareholders. We expect to issue these shares in the second quarter of 2015.
Liquidity
Liquidity management involves the ability to meet the cash flow requirements of depositors and borrowers. We conduct liquidity management on both a daily and long-term basis. We adjust our investments in liquid assets based upon management’s assessment of expected loan demand, projected loan sales, expected deposit flows, yields available on interest-bearing deposits, and the objectives of our asset/liability management program. Excess liquidity is invested generally in short-term U.S. government and agency securities, short and medium-term state and political subdivision securities, and other investment securities.
Our most liquid assets are cash and due from banks, interest-bearing bank deposits, and federal funds sold. The balances of these assets are dependent on our operating, investing, lending, and financing activities during any given period.
Liquid assets on hand are summarized in the table below:
|
Year Ended December 31,
|
|||||||||||
|
2014
|
2013
|
2012
|
|||||||||
|
(dollars in thousands)
|
|||||||||||
|
Cash and due from banks
|
$
|
23,028
|
|
$
|
24,516
|
|
$
|
30,197
|
|
||
|
Interest-bearing deposits
|
381
|
|
374
|
|
16,242
|
|
|||||
|
Federal funds sold
|
—
|
|
—
|
|
752
|
|
|||||
|
Total
|
$
|
23,409
|
|
$
|
24,890
|
|
$
|
47,191
|
|
||
|
Percentage of average total assets
|
1.3
|
%
|
1.4
|
%
|
2.7
|
%
|
|||||
Generally, our principal sources of funds are deposits, advances from the FHLB, principal repayments on loans, proceeds from the sale of loans, proceeds from the maturity and sale of investment securities, our Federal Funds lines of credit, and funds provided by operations. While scheduled loan amortization and maturing interest-bearing deposits are relatively predictable sources of funds, deposit flows and loan prepayments are greatly influenced by economic conditions, the general level of interest rates, and competition. We utilized particular sources of funds based on comparative costs and availability. This included fixed-rate advances from the FHLB that were obtained at a more favorable cost than deposits of comparable maturity. We generally managed the pricing of our deposits to maintain a steady deposit base but from time to time decided not to pay rates on deposits as high as our competition.
As of
December 31, 2014
, we had
$15.5 million
of long-term debt outstanding. This amount represents indebtedness payable under junior subordinated debentures issued to a subsidiary trust that issued trust preferred securities in a pooled offering. The junior subordinated debentures were issued with a 30-year term. The entire balance accrues interest at a variable rate, tied to the three-month LIBOR plus 1.59%. At
December 31, 2014
the interest rate was
1.83%
.
57
Net cash provided by operations was another major source of liquidity. The net cash provided by operating activities was
$23.3 million
for the year ended
December 31, 2014
and
$28.3 million
for the year ended
December 31, 2013
.
As of
December 31, 2014
, we had outstanding commitments to extend credit to borrowers of
$267.0 million
, standby letters of credit of
$3.2 million
, and commitments to sell loans of
$0.8 million
. Certificates of deposit maturing in one year or less totaled
$267.5 million
as of
December 31, 2014
. We believe that a significant portion of these deposits will remain with us upon maturity.
Inflation
The effects of price changes and inflation can vary substantially for most financial institutions. While management believes that inflation affects the growth of total assets, it is difficult to assess the overall impact. The price of one or more of the components of the CPI may fluctuate considerably and thereby influence the overall CPI without having a corresponding effect on interest rates or upon the cost of those goods and services normally purchased by us. In years of high inflation and high interest rates, intermediate and long-term interest rates tend to increase, thereby adversely impacting the market values of investment securities, mortgage loans and other long-term fixed rate loans held by financial institutions. In addition, higher short-term interest rates caused by inflation tend to increase financial institutions’ cost of funds. In other years, the reverse situation may occur.
|
I
TEM
7A.
|
Q
UANTITATIVE AND
Q
UALITATIVE
D
ISCLOSURES
A
BOUT
M
ARKET
R
ISK
.
|
In general, market risk is the risk of change in asset values due to movements in underlying market rates and prices. Interest rate risk is the risk to earnings and capital arising from movements in interest rates. Interest rate risk is the most significant market risk affecting us as other types of market risk, such as foreign currency exchange rate risk and commodity price risk, do not arise in the normal course of our business activities.
In addition to interest rate risk, economic conditions in recent years have made liquidity risk (namely, funding liquidity risk) a more prevalent concern among financial institutions. In general, liquidity risk is the risk of being unable to fund an entity’s obligations to creditors (including, in the case of banks, obligations to depositors) as such obligations become due and/or fund its acquisition of assets.
Liquidity Risk
Liquidity refers to our ability to fund operations, to meet depositor withdrawals, to provide for our customers’ credit needs, and to meet maturing obligations and existing commitments. Our liquidity principally depends on cash flows from operating activities, investment in and maturity of assets, changes in balances of deposits and borrowings, and our ability to borrow funds.
Net cash provided by operating activities was
$23.3 million
during
2014
, compared with
$28.3 million
in
2013
and
$22.5 million
in
2012
. Proceeds from loans held for sale, net of funds used to originate loans held for sale, represented a
$0.4 million
outflow for
2014
, compared to an inflow of
$0.8 million
for
2013
and a
$0.8 million
net outflow for
2012
.
Net cash used in investing activities was
$47.4 million
during
2014
, compared with
$5.4 million
in
2013
and
$88.4 million
in
2012
. During
2014
and
2013
, securities transactions accounted for a net inflow of
$11.3 million
and
$41.1 million
, respectively, while in
2012
, securities transactions accounted for a net outflow of
$53.9 million
. Net origination of loans and principal received from loan pools resulted in
$39.7 million
in cash outflow for
2014
, compared to a
$44.4 million
outflow for
2013
and a
$39.2 million
outflow in
2012
.
Net cash provided by financing activities was
$22.7 million
during
2014
, compared with net cash used of
$45.2 million
in
2013
, and net cash provided of
$80.4 million
in
2012
. Sources of cash for
2014
included a
$33.6 million
increase in net deposits, and a net increase of
$11.9 million
in federal funds purchased, partially offset by a net decrease in FHLB borrowings of
$13.9 million
. Decreases in deposits of
$24.8 million
, a net decrease in FHLB borrowings of
$13.3 million
, and a net decrease of
$7.6 million
in securities sold under agreement to repurchase, was partially offset by a net increase in federal funds purchased of
$5.5 million
, in
2013
. In
2012
, main sources of cash were an increase in deposits of
$93.1 million
and a net increase of
$20.5 million
in securities sold under agreement to repurchase, somewhat offset by a
$20.0 million
decrease in FHLB borrowings and the decrease in federal funds purchased of
$8.9 million
.
To further mitigate liquidity risk, the Bank has several sources of liquidity in place to maximize funding availability and increase the diversification of funding sources. The criteria for evaluating the use of these sources include volume concentration (percentage of liabilities), cost, volatility, and the fit with the current asset/liability management plan. These acceptable sources of liquidity include:
58
|
•
|
Federal Funds lines;
|
|
•
|
FHLB borrowings;
|
|
•
|
Brokered deposits;
|
|
•
|
Brokered repurchase agreements; and
|
|
•
|
Federal Reserve Bank Discount Window.
|
Federal Funds Lines
: Routine liquidity requirements are met by fluctuations in the Bank’s federal funds position. The principal function of these funds is to maintain short-term liquidity. Unsecured federal funds purchased lines are viewed as a volatile liability and are not used as a long-term funding solution, especially when used to fund long-term assets. Multiple correspondent relationships are preferable and federal funds sold exposure to any one customer is continuously monitored. The current federal funds purchased limit is
10%
of total assets, or the amount of established federal funds lines, whichever is smaller. Currently, the Bank has unsecured federal funds lines totaling
$55.0 million
, which lines are tested annually to ensure availability.
FHLB Borrowings
: FHLB borrowings provide both a source of liquidity and long-term funding for the Bank. Use of this type of funding is coordinated with both the strategic balance sheet growth projections and the interest rate risk profile of the Bank. Factors that are taken into account when contemplating use of FHLB borrowings are the effective interest rate, the collateral requirements, community investment program credits, and the implications and cost of having to purchase incremental FHLB stock. The current FHLB borrowing limit is
25%
of total assets. Currently, the Bank has a
$256.9 million
borrowing limit with
$93.0 million
in outstanding advances as of
December 31, 2014
, leaving
$163.9 million
available for liquidity needs as of year-end
2014
. These borrowings are secured by various real estate loans (residential, commercial and agricultural).
Brokered Deposits
: The Bank has brokered certificate of deposit lines/deposit relationships available to help diversify its various funding sources. Brokered deposits offer several benefits relative to other funding sources, such as: maturity structures which cannot be duplicated in the current deposit market, deposit gathering which does not cannibalize the existing deposit base, the unsecured nature of these liabilities, and the ability to quickly generate funds. However, brokered deposits are often viewed as a volatile liability by banking regulators and market participants. This viewpoint, and the desire to not develop a large funding concentration in any one area outside the Bank’s core market area, is reflected in an internal policy stating that the Bank limit the use of brokered deposits as a funding source to no more than 10% of total assets. Board approval is required to exceed this limit. The Bank will also have to maintain a “well capitalized” standing to access brokered deposits, as an “adequately capitalized” rating would require an FDIC waiver to do so, and an “undercapitalized” rating would prohibit the Bank from using brokered deposits altogether. The Bank had
$6.1 million
in brokered deposits through the CDARS program, and
$27.6 million
through the ICS program as of
December 31, 2014
. Both the CDARS and ICS programs coordinate, on a reciprocal basis, a network of banks to spread deposits exceeding the FDIC insurance coverage limits out to numerous institutions in order to provide insurance coverage for all participating deposits. The Bank currently expects that it will maintain its “well capitalized” standing under the Basel III Rules, which went into effect on January 1, 2015.
Brokered Repurchase Agreements
: Brokered repurchase agreements may be established with approved brokerage firms and banks. Repurchase agreements create rollover risk (the risk that a broker will discontinue the relationship due to market factors) and are not used as a long-term funding solution, especially when used to fund long-term assets. Collateral requirements and availability are evaluated and monitored. The current policy limit for brokered repurchase agreements is
10%
of total assets. There were no outstanding brokered repurchase agreements at
December 31, 2014
.
Federal Reserve Bank Discount Window
: The Federal Reserve Bank Discount Window is another source of liquidity, particularly during difficult economic times. The Bank has a borrowing capacity with the Federal Reserve Bank of Chicago limited by the amount of municipal securities pledged against the line. As of
December 31, 2014
, the Bank had municipal securities with an approximate market value of
$13.1 million
pledged, for liquidity purposes.
Interest Rate Risk
The nature of the banking business, which involves paying interest on deposits at varying rates and terms and charging interest on loans at other rates and terms, creates interest rate risk. As a result, net interest margin and earnings and the market value of assets and liabilities are subject to fluctuations arising from the movement of interest rates. We manage several forms of interest rate risk, including asset/liability mismatch, basis risk and prepayment risk. A key management objective is to maintain a risk profile in which variations in net interest income stay within the limits and guidelines of the Bank's Asset/Liability Management Policy.
Like most financial institutions, our net income can be significantly influenced by a variety of external factors, including: overall economic conditions, policies and actions of regulatory authorities, the amounts of and rates at which assets and liabilities reprice, variances in prepayment of loans and securities other than those that are assumed, early withdrawal of deposits, exercise
59
of call options on borrowings or securities, competition, a general rise or decline in interest rates, changes in the slope of the yield-curve, changes in historical relationships between indices (such as LIBOR and prime), and balance sheet growth or contraction. Our asset and liability committee seeks to manage interest rate risk under a variety of rate environments by structuring our balance sheet and off-balance-sheet positions in such a way that changes in interest rates do not have a large negative impact. The risk is monitored and managed within approved policy limits.
The Bank utilizes a third party to perform interest rate risk analysis, which utilizes a modeling program to measure the Bank’s exposure to potential interest rate changes. Measuring and managing interest rate risk is a dynamic process that management performs continually with the objective of maintaining a stable net interest margin. This process relies chiefly on the simulation of net interest income over multiple interest rate scenarios or “shocks.” Management considers net interest income simulation as the best method to evaluate short-term interest rate risk (one-year time frame). The modeled scenarios begin with a base case in which rates are unchanged and include parallel and nonparallel rate shocks. The results of these shocks are measured in two forms: first, the impact on the net interest margin and earnings over one and two year timeframes; and second, the impact on the market value of equity. In addition to measuring the basis risks and prepayment risks noted above, simulations also quantify the earnings impact of rate changes and the cost/benefit of hedging strategies.
The following table shows the anticipated effect on net interest income from parallel shocks (up and down) in interest rates over the subsequent twelve month period. As of
December 31, 2014
, the effect of an immediate and sustained 200 basis point increase in interest rates would be
a decline
in net interest income of approximately
$0.5 million
, or
0.9%
. Although unlikely in the current low interest rate environment, a 200 basis point decrease in rates would
decrease
net interest income by approximately
$0.3 million
, or
0.6%
. As part of a strategy to mitigate margin compression in a low interest rate environment, management has incorporated interest rate floors on most newly originated floating rate loans. While incorporating interest rate floors on loans has been successful in maintaining the margin in the current low rate environment, the coupon rates on these loans will lag when interest rates rise. These loans have floor rates that are between zero and 2.0% above the fully indexed rate. Therefore, interest rates must rise up to 2.0% before some of these loans would experience an increase in the coupon rate.
|
Immediate Change in Rates
|
|||||||||||||||
|
-200
|
-100
|
+100
|
+200
|
||||||||||||
|
(dollars in thousands)
|
|||||||||||||||
|
December 31, 2014
|
|||||||||||||||
|
Dollar change
|
$
|
(315
|
)
|
$
|
171
|
|
$
|
(369
|
)
|
$
|
(491
|
)
|
|||
|
Percent change
|
(0.6
|
)%
|
0.3
|
%
|
(0.7
|
)%
|
(0.9
|
)%
|
|||||||
|
December 31, 2013
|
|||||||||||||||
|
Dollar change
|
$
|
(1,060
|
)
|
$
|
(59
|
)
|
$
|
(616
|
)
|
$
|
(914
|
)
|
|||
|
Percent change
|
(1.8
|
)%
|
(0.1
|
)%
|
(1.1
|
)%
|
(1.6
|
)%
|
|||||||
60
The table below shows a
negative
(
liability sensitive
) rate-sensitivity gap of
$15.1 million
in the one- to three-month repricing category as more
liabilities
were subject to repricing during that time period than
assets
. On a cumulative basis, the gap is asset-sensitive, as our assets subject to repricing exceed our liabilities subject to repricing in every period except three months or less. This static analysis does not capture the effect that rising interest rates are expected to have on loan prepayments. As rates rise, borrowers have little incentive to pay off fixed rate loans prior to maturity. This causes asset classes such as mortgage loans, commercial real estate and portions of the investment portfolio to experience a slow-down in principal pay offs when rates rise. This explains the difference between gap analysis showing asset sensitivity and the net interest income simulation which indicates a decrease in income as rates rise.
|
Three
|
Over Three
|
One to
|
Three
|
||||||||||||||||
|
Months
|
Months to
|
Three
|
Years
|
||||||||||||||||
|
or Less
|
One Year
|
Years
|
or More
|
Total
|
|||||||||||||||
|
(dollars in thousands)
|
|||||||||||||||||||
|
Interest earning assets:
|
|||||||||||||||||||
|
Loans and loan pool participations, net
|
$
|
326,001
|
|
$
|
199,808
|
|
$
|
396,684
|
|
$
|
212,995
|
|
$
|
1,135,488
|
|
||||
|
Investment securities:
|
|||||||||||||||||||
|
Taxable investments
|
22,138
|
|
39,448
|
|
122,362
|
|
164,167
|
|
348,115
|
|
|||||||||
|
Tax exempt investments
|
704
|
|
13,228
|
|
25,302
|
|
139,117
|
|
178,351
|
|
|||||||||
|
Total investment securities
|
22,842
|
|
52,676
|
|
147,664
|
|
303,284
|
|
526,466
|
|
|||||||||
|
Federal funds and interest-bearing balances
|
381
|
|
—
|
|
—
|
|
—
|
|
381
|
|
|||||||||
|
Total interest earning assets
|
$
|
349,224
|
|
$
|
252,484
|
|
$
|
544,348
|
|
$
|
516,279
|
|
$
|
1,662,335
|
|
||||
|
Interest-bearing liabilities:
|
|||||||||||||||||||
|
Savings and interest-bearing demand deposits
|
$
|
188,922
|
|
$
|
—
|
|
$
|
123,334
|
|
$
|
408,811
|
|
$
|
721,067
|
|
||||
|
Time certificates of deposit
|
72,753
|
|
194,769
|
|
187,286
|
|
18,206
|
|
473,014
|
|
|||||||||
|
Total deposits
|
261,675
|
|
194,769
|
|
310,620
|
|
427,017
|
|
1,194,081
|
|
|||||||||
|
Federal funds purchased and repurchase agreements
|
77,215
|
|
1,014
|
|
—
|
|
—
|
|
78,229
|
|
|||||||||
|
Federal Home Loan Bank borrowings
|
10,000
|
|
10,000
|
|
27,000
|
|
46,000
|
|
93,000
|
|
|||||||||
|
Other long-term debt
|
15,464
|
|
—
|
|
—
|
|
—
|
|
15,464
|
|
|||||||||
|
Total interest-bearing liabilities
|
$
|
364,354
|
|
$
|
205,783
|
|
$
|
337,620
|
|
$
|
473,017
|
|
$
|
1,380,774
|
|
||||
|
Interest sensitivity gap per period
|
$
|
(15,130
|
)
|
$
|
46,701
|
|
$
|
206,728
|
|
$
|
43,262
|
|
|||||||
|
Cumulative interest sensitivity gap
|
$
|
(15,130
|
)
|
$
|
31,571
|
|
$
|
238,299
|
|
$
|
281,561
|
|
|||||||
|
Interest sensitivity gap ratio
|
0.96
|
|
1.23
|
|
1.61
|
|
1.09
|
|
|||||||||||
|
Cumulative interest sensitivity gap ratio
|
0.96
|
|
1.06
|
|
1.26
|
|
1.20
|
|
|||||||||||
In the table above, interest-bearing demand accounts and savings deposits are allocated across the repricing buckets based on deposit studies of account behavior.
The Company’s funds management policy requires the subsidiary bank to maintain a cumulative rate-sensitivity ratio of
0.75 to 1.25
in the one-year timeframe. As of
December 31, 2014
, the Bank was within all of its interest rate risk guidelines.
Computations of the prospective effects of hypothetical interest rate changes were based on numerous assumptions. Actual values may differ from those projections set forth above. Further, the computations do not contemplate any actions we could have undertaken in response to changes in interest rates.
61
|
I
TEM
8.
|
F
INANCIAL
S
TATEMENTS AND
S
UPPLEMENTARY
D
ATA
.
|
Report of Independent Registered Public Accounting Firm
The Board of Directors and Shareholders
MidWest
One
Financial Group, Inc.
We have audited the accompanying consolidated balance sheet of MidWest
One
Financial Group, Inc. and subsidiaries as of
December 31, 2014
, and the related consolidated statements of operations, comprehensive income, shareholders’ equity, and cash flows for the year ended
December 31, 2014
. These consolidated financial statements are the responsibility of the Company’s management. Our responsibility is to express an opinion on these consolidated
financial statements based on our audit.
We conducted our audit in accordance with the standards of the Public Company Accounting Oversight Board (United States). Those standards require that we plan and perform the audit to obtain reasonable assurance about whether the financial statements are free of material misstatement. An audit includes examining, on a test basis, evidence supporting the amounts and disclosures in the financial statements. An audit also includes assessing the accounting principles used and significant estimates made by management, as well as evaluating the overall financial statement presentation. We believe that our audit provides a reasonable basis for our opinion.
In our opinion, the consolidated financial statements referred to above present fairly, in all material respects, the financial position of MidWest
One
Financial Group, Inc. and subsidiaries as of
December 31, 2014
, and the results of their operations and their cash flows for the year ended
December 31, 2014
, in conformity with U.S. generally accepted accounting principles.
We have also audited, in accordance with the standards of the Public Company Accounting Oversight Board (United States), MidWest
One
Financial Group, Inc. and subsidiaries’ internal control over financial reporting as of
December 31, 2014
, based on criteria established in
Internal Control - Integrated Framework
issued by the Committee of Sponsoring Organizations of the Treadway Commission in 2013, and our report dated
March 5, 2015
expressed an unqualified opinion on the effectiveness of MidWest
One
Financial Group, Inc. and subsidiaries’ internal control over financial reporting.
/s/ McGladrey LLP
Cedar Rapids, Iowa
March 5, 2015
62

|
||
Report of Independent Registered Public Accounting Firm
The Board of Directors and Shareholders
MidWest
One
Financial Group, Inc.:
We have audited the accompanying consolidated balance sheet of MidWest
One
Financial Group, Inc. and subsidiaries (the Company) as of December 31, 2013, and the related consolidated statements of operations, comprehensive income, shareholders’ equity, and cash flows for each of the years in the two‑year period ended December 31, 2013. These consolidated financial statements are the responsibility of the Company’s management. Our responsibility is to express an opinion on these consolidated financial statements based on our audits.
We conducted our audits in accordance with the standards of the Public Company Accounting Oversight Board (United States). Those standards require that we plan and perform the audit to obtain reasonable assurance about whether the financial statements are free of material misstatement. An audit includes examining, on a test basis, evidence supporting the amounts and disclosures in the financial statements. An audit also includes assessing the accounting principles used and significant estimates made by management, as well as evaluating the overall financial statement presentation. We believe that our audits provide a reasonable basis for our opinion.
In our opinion, the consolidated financial statements referred to above present fairly, in all material respects, the financial position of MidWest
One
Financial Group, Inc. and subsidiaries as of December 31, 2013, and the results of their operations and their cash flows for each of the years in the two‑year period ended December 31, 2013, in conformity with U.S. generally accepted accounting principles.
/s/ KPMG LLP
Des Moines, Iowa
March 6, 2014
63
MIDWEST
ONE
FINANCIAL GROUP, INC. AND SUBSIDIARIES
December 31, 2014
and
2013
(dollars in thousands)
|
|
|
||||||
|
2014
|
|
2013
|
|||||
|
ASSETS
|
|||||||
|
Cash and due from banks
|
$
|
23,028
|
|
$
|
24,516
|
|
|
|
Interest-bearing deposits in banks
|
381
|
|
374
|
|
|||
|
Cash and cash equivalents
|
23,409
|
|
|
24,890
|
|
||
|
Investment securities:
|
|
||||||
|
Available for sale
|
474,942
|
|
498,561
|
|
|||
|
Held to maturity (fair value of $51,253 as of December 31, 2014 and $30,191 as of December 31, 2013)
|
51,524
|
|
32,625
|
|
|||
|
Loans held for sale
|
801
|
|
357
|
|
|||
|
Loans
|
1,132,519
|
|
1,088,412
|
|
|||
|
Allowance for loan losses
|
(16,363
|
)
|
(16,179
|
)
|
|||
|
Net loans
|
1,116,156
|
|
|
1,072,233
|
|
||
|
Loan pool participations, net
|
19,332
|
|
25,533
|
|
|||
|
Premises and equipment, net
|
37,770
|
|
27,682
|
|
|||
|
Accrued interest receivable
|
10,898
|
|
10,409
|
|
|||
|
Intangible assets, net
|
8,259
|
|
8,806
|
|
|||
|
Bank-owned life insurance
|
38,142
|
|
29,598
|
|
|||
|
Other real estate owned
|
1,916
|
|
1,770
|
|
|||
|
Deferred income taxes
|
3,078
|
|
8,194
|
|
|||
|
Other assets
|
14,075
|
|
14,560
|
|
|||
|
Total assets
|
$
|
1,800,302
|
|
|
$
|
1,755,218
|
|
|
LIABILITIES AND SHAREHOLDERS' EQUITY
|
|
||||||
|
Deposits:
|
|
||||||
|
Non-interest-bearing demand
|
$
|
214,461
|
|
$
|
222,359
|
|
|
|
Interest-bearing checking
|
618,540
|
|
592,673
|
|
|||
|
Savings
|
102,527
|
|
94,559
|
|
|||
|
Certificates of deposit under $100,000
|
235,395
|
|
256,283
|
|
|||
|
Certificates of deposit $100,000 and over
|
237,619
|
|
209,068
|
|
|||
|
Total deposits
|
1,408,542
|
|
|
1,374,942
|
|
||
|
Federal funds purchased
|
17,408
|
|
5,482
|
|
|||
|
Securities sold under agreements to repurchase
|
60,821
|
|
61,183
|
|
|||
|
Federal Home Loan Bank borrowings
|
93,000
|
|
106,900
|
|
|||
|
Deferred compensation liability
|
3,393
|
|
3,469
|
|
|||
|
Long-term debt
|
15,464
|
|
15,464
|
|
|||
|
Accrued interest payable
|
863
|
|
765
|
|
|||
|
Other liabilities
|
8,080
|
|
8,997
|
|
|||
|
Total liabilities
|
1,607,571
|
|
|
1,577,202
|
|
||
|
Commitments and contingencies (Note 16)
|
|
|
|||||
|
Shareholders' equity:
|
|
||||||
|
Preferred stock, no par value; authorized 500,000 shares; no shares issued and outstanding at December 31, 2014 and December 31, 2013
|
—
|
|
|
—
|
|
||
|
Common stock, $1.00 par value; authorized 15,000,000 shares at December 31, 2014 and December 31, 2013; issued 8,690,398 shares at December 31, 2014 and December 31, 2013; outstanding 8,355,666 shares at December 31, 2014 and 8,481,799 shares at December 31, 2013
|
8,690
|
|
8,690
|
|
|||
|
Additional paid-in capital
|
80,537
|
|
80,506
|
|
|||
|
Treasury stock at cost, 334,732 shares as of December 31, 2014 and 208,599 shares at December 31, 2013
|
(6,945
|
)
|
(3,702
|
)
|
|||
|
Retained earnings
|
105,127
|
|
91,473
|
|
|||
|
Accumulated other comprehensive income
|
5,322
|
|
1,049
|
|
|||
|
Total shareholders' equity
|
192,731
|
|
|
178,016
|
|
||
|
Total liabilities and shareholders' equity
|
$
|
1,800,302
|
|
|
$
|
1,755,218
|
|
See accompanying notes to consolidated financial statements.
64
MIDWEST
ONE
FINANCIAL GROUP, INC. AND SUBSIDIARIES
Years Ended
December 31, 2014
,
2013
, and
2012
(in thousands, except per share amounts)
|
|
2014
|
2013
|
2012
|
|||||||||
|
Interest income:
|
||||||||||||
|
Interest and fees on loans
|
$
|
48,466
|
|
$
|
48,828
|
|
$
|
51,355
|
|
|||
|
Interest and discount on loan pool participations
|
1,516
|
|
2,046
|
|
1,978
|
|
||||||
|
Interest on bank deposits
|
38
|
|
16
|
|
54
|
|
||||||
|
Interest on federal funds sold
|
8
|
|
1
|
|
1
|
|
||||||
|
Interest on investment securities:
|
||||||||||||
|
Taxable securities
|
8,921
|
|
9,905
|
|
10,836
|
|
||||||
|
Tax-exempt securities
|
5,455
|
|
5,298
|
|
5,078
|
|
||||||
|
Total interest income
|
64,404
|
|
66,094
|
|
69,302
|
|
||||||
|
Interest expense:
|
||||||||||||
|
Interest on deposits:
|
||||||||||||
|
Interest-bearing checking
|
2,168
|
|
2,362
|
|
3,007
|
|
||||||
|
Savings
|
145
|
|
140
|
|
143
|
|
||||||
|
Certificates of deposit under $100,000
|
2,701
|
|
4,239
|
|
5,885
|
|
||||||
|
Certificates of deposit $100,000 and over
|
2,013
|
|
2,214
|
|
2,929
|
|
||||||
|
Total interest expense on deposits
|
7,027
|
|
8,955
|
|
11,964
|
|
||||||
|
Interest on federal funds purchased
|
8
|
|
38
|
|
12
|
|
||||||
|
Interest on securities sold under agreements to repurchase
|
119
|
|
128
|
|
192
|
|
||||||
|
Interest on Federal Home Loan Bank borrowings
|
2,092
|
|
2,686
|
|
3,094
|
|
||||||
|
Interest on other borrowings
|
24
|
|
29
|
|
34
|
|
||||||
|
Interest on long-term debt
|
281
|
|
296
|
|
656
|
|
||||||
|
Total interest expense
|
9,551
|
|
12,132
|
|
15,952
|
|
||||||
|
Net interest income
|
54,853
|
|
53,962
|
|
53,350
|
|
||||||
|
Provision for loan losses
|
1,200
|
|
1,350
|
|
2,379
|
|
||||||
|
Net interest income after provision for loan losses
|
53,653
|
|
52,612
|
|
50,971
|
|
||||||
|
Noninterest income:
|
||||||||||||
|
Trust, investment, and insurance fees
|
5,771
|
|
5,345
|
|
4,995
|
|
||||||
|
Service charges and fees on deposit accounts
|
3,279
|
|
2,980
|
|
3,247
|
|
||||||
|
Mortgage origination and loan servicing fees
|
1,554
|
|
3,209
|
|
3,578
|
|
||||||
|
Other service charges, commissions and fees
|
2,381
|
|
2,210
|
|
2,316
|
|
||||||
|
Bank-owned life insurance income
|
1,102
|
|
922
|
|
953
|
|
||||||
|
Impairment losses on investment securities
|
—
|
|
—
|
|
(345
|
)
|
||||||
|
Gain (loss) on sale or call of available for sale securities (Includes $1,227 and $65 reclassified from accumulated other comprehensive income for net gains on available for sale securities for the year ended December 31, 2014 and 2013, respectively)
|
1,227
|
|
65
|
|
805
|
|
||||||
|
Gain (loss) on sale of premises and equipment
|
(1
|
)
|
(3
|
)
|
4,188
|
|
||||||
|
Total noninterest income
|
15,313
|
|
14,728
|
|
19,737
|
|
||||||
|
Noninterest expense:
|
||||||||||||
|
Salaries and employee benefits
|
24,918
|
|
24,596
|
|
30,684
|
|
||||||
|
Net occupancy and equipment expense
|
6,293
|
|
6,356
|
|
6,246
|
|
||||||
|
Professional fees
|
3,606
|
|
2,622
|
|
2,758
|
|
||||||
|
Data processing expense
|
1,565
|
|
1,452
|
|
1,679
|
|
||||||
|
FDIC insurance expense
|
964
|
|
1,066
|
|
1,224
|
|
||||||
|
Amortization of intangible assets
|
547
|
|
663
|
|
778
|
|
||||||
|
Other operating expense
|
5,520
|
|
5,332
|
|
5,591
|
|
||||||
|
Total noninterest expense
|
43,413
|
|
42,087
|
|
48,960
|
|
||||||
|
Income before income tax expense
|
25,553
|
|
25,253
|
|
21,748
|
|
||||||
|
Income tax expense (Includes $478 and $25 income tax expense reclassified from accumulated other comprehensive income for the year ended December 31, 2014 and 2013, respectively)
|
7,031
|
|
6,646
|
|
5,214
|
|
||||||
|
Net income
|
$
|
18,522
|
|
$
|
18,607
|
|
$
|
16,534
|
|
|||
|
Earnings per share:
|
||||||||||||
|
Basic
|
$
|
2.20
|
|
$
|
2.19
|
|
$
|
1.95
|
|
|||
|
Diluted
|
$
|
2.19
|
|
$
|
2.18
|
|
$
|
1.94
|
|
|||
See accompanying notes to consolidated financial statements.
65
MIDWEST
ONE
FINANCIAL GROUP, INC. AND SUBSIDIARIES
CONSOLIDATED STATEMENTS OF COMPREHENSIVE INCOME
Years Ended
December 31, 2014
,
2013
, and
2012
(in thousands)
|
|
2014
|
|
2013
|
2012
|
||||||||
|
Net income
|
$
|
18,522
|
|
$
|
18,607
|
|
$
|
16,534
|
|
|||
|
Other comprehensive income (loss), net of tax:
|
||||||||||||
|
Investment securities available for sale:
|
||||||||||||
|
Unrealized holding gains (losses) arising during period
|
8,114
|
|
(15,920
|
)
|
2,681
|
|
||||||
|
Reclassification adjustment for gains included in net income
|
(1,227
|
)
|
(65
|
)
|
(805
|
)
|
||||||
|
Income tax (expense) benefit
|
(2,614
|
)
|
5,984
|
|
(706
|
)
|
||||||
|
Other comprehensive income (loss) on available for sale securities
|
4,273
|
|
(10,001
|
)
|
1,170
|
|
||||||
|
Defined benefit pension:
|
||||||||||||
|
Reclassification of pension plan expense due to plan settlement
|
—
|
|
—
|
|
5,968
|
|
||||||
|
Net loss arising during period
|
—
|
|
—
|
|
—
|
|
||||||
|
Amortization of net actuarial gains included in net periodic pension cost
|
—
|
|
—
|
|
—
|
|
||||||
|
Amortization of transition obligation included in net periodic pension cost
|
—
|
|
—
|
|
—
|
|
||||||
|
Income tax (expense) benefit
|
—
|
|
—
|
|
(2,226
|
)
|
||||||
|
Other comprehensive income (loss) on defined benefit pension plan
|
—
|
|
—
|
|
3,742
|
|
||||||
|
Total other comprehensive income (loss)
|
$
|
4,273
|
|
$
|
(10,001
|
)
|
$
|
4,912
|
|
|||
|
Comprehensive income
|
$
|
22,795
|
|
$
|
8,606
|
|
$
|
21,446
|
|
|||
See accompanying notes to consolidated financial statements.
66
MIDWEST
ONE
FINANCIAL GROUP, INC. AND SUBSIDIARIES
CONSOLIDATED STATEMENTS OF SHAREHOLDERS’ EQUITY
Years Ended
December 31, 2014
,
2013
, and
2012
(in thousands, except share and per share amounts)
|
Preferred
Stock
|
Common
Stock
|
Additional
Paid-in
Capital
|
Treasury
Stock
|
Retained
Earnings
|
Accumulated
Other
Comprehensive
Income (Loss)
|
Total
|
||||||||||||||||||||||
|
Balance at December 31, 2011
|
$
|
—
|
|
$
|
8,690
|
|
$
|
80,333
|
|
$
|
(2,312
|
)
|
$
|
63,645
|
|
$
|
6,138
|
|
|
$
|
156,494
|
|
||||||
|
Net income
|
—
|
|
—
|
|
—
|
|
—
|
|
16,534
|
|
—
|
|
16,534
|
|
||||||||||||||
|
Dividends paid on common stock ($0.36 per share)
|
—
|
|
—
|
|
—
|
|
—
|
|
(3,054
|
)
|
—
|
|
(3,054
|
)
|
||||||||||||||
|
Stock options exercised (55,986 shares)
|
—
|
|
—
|
|
(16
|
)
|
593
|
|
—
|
|
—
|
|
577
|
|
||||||||||||||
|
Release/lapse of restriction on RSUs (15,810 shares)
|
—
|
|
—
|
|
(200
|
)
|
213
|
|
—
|
|
—
|
|
13
|
|
||||||||||||||
|
Repurchase of common stock (104,518 shares)
|
—
|
|
—
|
|
—
|
|
(1,810
|
)
|
—
|
|
—
|
|
(1,810
|
)
|
||||||||||||||
|
Stock compensation
|
—
|
|
—
|
|
266
|
|
—
|
|
—
|
|
—
|
|
266
|
|
||||||||||||||
|
Other comprehensive income, net of tax
|
—
|
|
—
|
|
—
|
|
—
|
|
—
|
|
4,912
|
|
4,912
|
|
||||||||||||||
|
Balance at December 31, 2012
|
|
$
|
—
|
|
$
|
8,690
|
|
$
|
80,383
|
|
$
|
(3,316
|
)
|
$
|
77,125
|
|
$
|
11,050
|
|
|
$
|
173,932
|
|
|||||
|
Net income
|
—
|
|
—
|
|
—
|
|
—
|
|
18,607
|
|
—
|
|
|
18,607
|
|
|||||||||||||
|
Dividends paid on common stock ($0.50 per share)
|
—
|
|
—
|
|
—
|
|
—
|
|
(4,259
|
)
|
—
|
|
|
(4,259
|
)
|
|||||||||||||
|
Stock options exercised (56,314 shares)
|
—
|
|
—
|
|
9
|
|
296
|
|
—
|
|
—
|
|
|
305
|
|
|||||||||||||
|
Release/lapse of restriction on RSUs (19,585 shares)
|
—
|
|
—
|
|
(270
|
)
|
285
|
|
—
|
|
—
|
|
|
15
|
|
|||||||||||||
|
Repurchase of common stock (40,713 shares)
|
—
|
|
—
|
|
—
|
|
(967
|
)
|
—
|
|
—
|
|
(967
|
)
|
||||||||||||||
|
Stock compensation
|
—
|
|
—
|
|
384
|
|
—
|
|
—
|
|
—
|
|
|
384
|
|
|||||||||||||
|
Other comprehensive loss, net of tax
|
—
|
|
—
|
|
—
|
|
—
|
|
—
|
|
(10,001
|
)
|
(10,001
|
)
|
||||||||||||||
|
Balance at December 31, 2013
|
|
$
|
—
|
|
|
$
|
8,690
|
|
|
$
|
80,506
|
|
|
$
|
(3,702
|
)
|
|
$
|
91,473
|
|
|
$
|
1,049
|
|
|
$
|
178,016
|
|
|
Net income
|
—
|
|
—
|
|
—
|
|
—
|
|
18,522
|
|
—
|
|
18,522
|
|
||||||||||||||
|
Dividends paid on common stock ($0.58 per share)
|
—
|
|
—
|
|
—
|
|
—
|
|
(4,868
|
)
|
—
|
|
(4,868
|
)
|
||||||||||||||
|
Stock options exercised (15,419 shares)
|
—
|
|
—
|
|
(26
|
)
|
285
|
|
—
|
|
—
|
|
259
|
|
||||||||||||||
|
Release/lapse of restriction on RSUs (27,491 shares)
|
—
|
|
—
|
|
(436
|
)
|
459
|
|
—
|
|
—
|
|
23
|
|
||||||||||||||
|
Repurchase of common stock (165,766 shares)
|
—
|
|
—
|
|
—
|
|
(3,987
|
)
|
—
|
|
—
|
|
(3,987
|
)
|
||||||||||||||
|
Stock compensation
|
—
|
|
—
|
|
493
|
|
—
|
|
—
|
|
—
|
|
493
|
|
||||||||||||||
|
Other comprehensive income, net of tax
|
—
|
|
—
|
|
—
|
|
—
|
|
—
|
|
4,273
|
|
4,273
|
|
||||||||||||||
|
Balance at December 31, 2014
|
$
|
—
|
|
|
$
|
8,690
|
|
|
$
|
80,537
|
|
|
$
|
(6,945
|
)
|
|
$
|
105,127
|
|
|
$
|
5,322
|
|
|
$
|
192,731
|
|
|
See accompanying notes to consolidated financial statements.
67
MIDWEST
ONE
FINANCIAL GROUP, INC. AND SUBSIDIARIES
Years Ended December 31,
2014
,
2013
, and
2012
(in thousands)
|
|
2014
|
2013
|
|
2012
|
|||||||
|
Cash flows from operating activities:
|
|
||||||||||
|
Net income
|
$
|
18,522
|
|
$
|
18,607
|
|
$
|
16,534
|
|
||
|
Adjustments to reconcile net income to net cash provided by operating activities:
|
|||||||||||
|
Provision for loan losses
|
1,200
|
|
1,350
|
|
2,379
|
|
|||||
|
Depreciation, amortization and accretion
|
4,226
|
|
5,162
|
|
5,422
|
|
|||||
|
(Gain) loss on sale of premises and equipment
|
1
|
|
3
|
|
(4,188
|
)
|
|||||
|
Deferred income taxes
|
2,502
|
|
(1,454
|
)
|
(54
|
)
|
|||||
|
Stock-based compensation
|
493
|
|
384
|
|
266
|
|
|||||
|
Net gain on sale or call of available for sale securities
|
(1,227
|
)
|
(65
|
)
|
(805
|
)
|
|||||
|
Net (gain) loss on sale of other real estate owned
|
(74
|
)
|
115
|
|
(196
|
)
|
|||||
|
Net gain on sale of loans held for sale
|
(507
|
)
|
(1,237
|
)
|
(2,157
|
)
|
|||||
|
Writedown of other real estate owned
|
66
|
|
33
|
|
326
|
|
|||||
|
Other-than-temporary impairment of investment securities
|
—
|
|
—
|
|
345
|
|
|||||
|
Origination of loans held for sale
|
(42,410
|
)
|
(82,282
|
)
|
(152,389
|
)
|
|||||
|
Proceeds from sales of loans held for sale
|
42,473
|
|
84,357
|
|
155,306
|
|
|||||
|
Recognition of previously deferred expense related to pension plan settlement
|
—
|
|
—
|
|
3,002
|
|
|||||
|
Pension plan contribution
|
—
|
|
—
|
|
(3,031
|
)
|
|||||
|
(Increase) decrease in accrued interest receivable
|
(489
|
)
|
(117
|
)
|
130
|
|
|||||
|
Increase in cash value of bank-owned life insurance
|
(1,102
|
)
|
(922
|
)
|
(953
|
)
|
|||||
|
Decrease in other assets
|
485
|
|
5,822
|
|
1,280
|
|
|||||
|
Decrease in deferred compensation liability
|
(76
|
)
|
(86
|
)
|
(88
|
)
|
|||||
|
(Decrease) increase in accounts payable, accrued expenses, and other liabilities
|
(819
|
)
|
(1,410
|
)
|
1,409
|
|
|||||
|
Net cash provided by operating activities
|
$
|
23,264
|
|
$
|
28,260
|
|
|
$
|
22,538
|
|
|
|
Cash flows from investing activities:
|
|
||||||||||
|
Proceeds from sales of available for sale securities
|
$
|
33,457
|
|
$
|
12,447
|
|
$
|
18,307
|
|
||
|
Proceeds from maturities and calls of available for sale securities
|
64,669
|
|
103,200
|
|
130,432
|
|
|||||
|
Purchases of available for sale securities
|
(67,892
|
)
|
(74,582
|
)
|
(172,060
|
)
|
|||||
|
Proceeds from maturities and calls of held to maturity securities
|
1,147
|
|
1,232
|
|
722
|
|
|||||
|
Purchases of held to maturity securities
|
(20,052
|
)
|
(1,185
|
)
|
(31,348
|
)
|
|||||
|
Increase in loans
|
(45,911
|
)
|
(54,477
|
)
|
(53,560
|
)
|
|||||
|
Decrease in loan pool participations, net
|
6,201
|
|
10,117
|
|
14,402
|
|
|||||
|
Purchases of premises and equipment
|
(12,320
|
)
|
(4,521
|
)
|
(3,518
|
)
|
|||||
|
Proceeds from sale of other real estate owned
|
650
|
|
1,581
|
|
2,976
|
|
|||||
|
Proceeds from sale of premises and equipment
|
57
|
|
18
|
|
5,244
|
|
|||||
|
Proceeds from sale of assets held for sale
|
—
|
|
764
|
|
—
|
|
|||||
|
Proceeds of principal and earnings from bank-owned life insurance
|
488
|
|
—
|
|
—
|
|
|||||
|
Purchases of bank-owned life insurance
|
(7,930
|
)
|
—
|
|
—
|
|
|||||
|
Net cash used in investing activities
|
$
|
(47,436
|
)
|
$
|
(5,406
|
)
|
|
$
|
(88,403
|
)
|
|
|
Cash flows from financing activities:
|
|||||||||||
|
Net increase (decrease) in deposits
|
$
|
33,600
|
|
$
|
(24,791
|
)
|
$
|
93,091
|
|
||
|
Net increase (decrease) in federal funds purchased
|
11,926
|
|
5,482
|
|
(8,920
|
)
|
|||||
|
Net (decrease) increase in securities sold under agreements to repurchase
|
(362
|
)
|
(7,640
|
)
|
20,536
|
|
|||||
|
Proceeds from Federal Home Loan Bank borrowings
|
26,000
|
|
166,000
|
|
20,000
|
|
|||||
|
Repayment of Federal Home Loan Bank borrowings
|
(39,900
|
)
|
(179,300
|
)
|
(40,000
|
)
|
|||||
|
Stock options exercised
|
282
|
|
320
|
|
590
|
|
|||||
|
Dividends paid
|
(4,868
|
)
|
(4,259
|
)
|
(3,054
|
)
|
|||||
|
Repurchase of common stock
|
(3,987
|
)
|
(967
|
)
|
(1,810
|
)
|
|||||
|
Net cash (used in) provided by financing activities
|
$
|
22,691
|
|
$
|
(45,155
|
)
|
$
|
80,433
|
|
||
|
Net (decrease) increase in cash and cash equivalents
|
$
|
(1,481
|
)
|
$
|
(22,301
|
)
|
$
|
14,568
|
|
||
|
Cash and cash equivalents:
|
|||||||||||
|
Beginning of period
|
24,890
|
|
$
|
47,191
|
|
$
|
32,623
|
|
|||
|
Ending balance
|
$
|
23,409
|
|
$
|
24,890
|
|
$
|
47,191
|
|
||
|
Supplemental disclosures of cash flow information:
|
|||||||||||
|
Cash payments for:
|
|||||||||||
|
Interest paid on deposits and borrowings
|
$
|
9,453
|
|
$
|
12,842
|
|
$
|
16,007
|
|
||
|
Income taxes
|
4,144
|
|
7,961
|
|
5,169
|
|
|||||
|
Supplemental schedule of non-cash investing activities:
|
|||||||||||
|
Transfer of loans to other real estate owned
|
$
|
788
|
|
$
|
221
|
|
$
|
2,351
|
|
||
|
Transfer of property to assets held for sale
|
—
|
|
—
|
|
764
|
|
|||||
See accompanying notes to consolidated financial statements.
68
|
Note 1.
|
Nature of Business and Significant Accounting Policies
|
Nature of business
: The Company is a bank holding company registered under the Bank Holding Company Act of 1956 that has elected to be a financial holding company. It is headquartered in Iowa City, Iowa and owns 100% of the outstanding common stock of MidWest
One
Bank, Iowa City, and 100% of the common stock of MidWest
One
Insurance Services, Inc., Oskaloosa, Iowa. MidWest
One
Bank (“MidWest
One
Bank” or the “Bank”) is also headquartered in Iowa City, Iowa, and provides services to individuals, businesses, governmental units and institutional customers in central and east-central Iowa. The Bank has office locations in Belle Plaine, Burlington, Cedar Falls, Conrad, Coralville, Davenport, Fairfield, Fort Madison, Melbourne, North English, North Liberty, Oskaloosa, Ottumwa, Parkersburg, Pella, Sigourney, Waterloo and West Liberty, Iowa. MidWest
One
Insurance Services, Inc. provides personal and business insurance services in Cedar Falls, Conrad, Melbourne, Oskaloosa, Parkersburg, and Pella, Iowa. The Bank is actively engaged in many areas of commercial banking, including: acceptance of demand, savings and time deposits; making commercial, real estate, agricultural and consumer loans, and other banking services tailored for its individual customers. The Wealth Management area of the Bank administers estates, personal trusts, conservatorships, and pension and profit-sharing accounts along with providing other management services to customers.
On November 20, 2014, the Company entered into merger agreement with Central Bancshares, Inc. ("Central"), a Minnesota corporation, pursuant to which Central will merge with and into the Company. In connection with the merger, Central Bank, a Minnesota-chartered commercial bank and wholly-owned subsidiary of Central, will become a wholly-owned subsidiary of the Company. The merger agreement also provides that each of the outstanding shares of Central common stock will be converted into the right for each Central shareholder to receive its pro rata share of
2,723,083
shares of Company common stock and
$64.0 million
in cash. The corporate headquarters of the combined company will be Iowa City, Iowa. The merger is anticipated to be completed in the second quarter of 2015. (See Note 20. “Proposed Merger” for additional information.)
Accounting estimates
: The preparation of financial statements in conformity with U.S. Generally Accepted Accounting Principles (“GAAP”) requires management to make estimates and assumptions that affect the reported amount of assets and liabilities and disclosure of contingent assets and liabilities at the date of the financial statements and the reported amounts of revenues and expenses during the reporting period. Actual results could differ from those estimates. The U.S. economic environment in recent years has increased the degree of uncertainty inherent in these estimates.
Certain significant estimates
: The allowance for loan losses and the fair values of investment securities and other financial instruments involve certain significant estimates made by management. These estimates are reviewed by management routinely and it is reasonably possible that circumstances that exist may change in the near-term future and that the effect could be material to the consolidated financial statements.
Principles of consolidation
: The consolidated financial statements include the accounts of MidWest
One
Financial Group, Inc., a bank holding company, and its wholly-owned subsidiaries which include MidWest
One
Bank, a state chartered bank whose primary federal regulator is the Federal Deposit Insurance Corporation, and MidWest
One
Insurance Services, Inc. All significant inter-company accounts and transactions have been eliminated in consolidation.
Trust assets, other than cash deposits held by the Bank in a fiduciary or agency capacity for its customers, are not included in the accompanying consolidated financial statements because such accounts are not assets of the Bank.
In the normal course of business, the Company may enter into a transaction with a variable interest entity (“VIE”). VIEs are legal entities whose investors lack the ability to make decisions about the entity’s activities, or whose equity investors do not have the right to receive the residual returns of the entity. The applicable accounting guidance requires the Company to perform ongoing quantitative and qualitative analysis to determine whether it must consolidate any VIE. The Company does not have any ownership interest in or exert any control over any VIE, and thus no VIEs are included in the consolidated financial statements. Investments in non-marketable loan participation certificates for which the Company does not have the ability to exert significant influence are accounted for using the cost method.
Presentation of cash flows
: For purposes of reporting cash flows, cash and due from banks includes cash on hand, amounts due from banks, and federal funds sold. Cash flows from portfolio loans originated by the Bank, deposits, federal funds purchased, and securities sold under agreements to repurchase are reported net.
69
Cash receipts and cash payments resulting from acquisitions and sales of loans originated for sale are classified as operating cash flows on a gross basis in the consolidated statements of cash flows.
Investment securities
: Certain debt securities that the Company has the positive intent and ability to hold to maturity are classified as held to maturity and recorded at amortized cost. Securities not classified as held to maturity, including equity securities with readily determinable fair values, are classified as available for sale and recorded at fair value, with unrealized gains and losses excluded from earnings and reported in other comprehensive income.
The Company carries its investment securities at fair value, and the Company employs valuation techniques which utilize observable inputs when those inputs are available. These observable inputs reflect assumptions market participants would use in pricing the security, developed based on market data obtained from sources independent of the Company. When such information is not available, the Company employs valuation techniques which utilize unobservable inputs, or those which reflect the Company’s own assumptions about assumptions that market participants would use, based on the best information available in the circumstances. These valuation methods typically involve cash flow and other financial modeling techniques. Changes in underlying factors, assumptions, estimates, or other inputs to the valuation techniques could have a material impact on the Company’s future financial condition and results of operations. Fair value measurements are required to be classified as Level 1 (quoted prices), Level 2 (based on observable inputs) or Level 3 (based on unobservable inputs) discussed in more detail in Note 18 to the consolidated financial statements. Available for sale securities are recorded at fair value with unrealized gains and losses excluded from earnings and reported as a separate component of shareholders’ equity until realized.
Purchase premiums and discounts are recognized in interest income using the interest method over the terms of the securities. Declines in the fair value of held to maturity and available for sale securities below their cost that are deemed to be other than temporary are reflected in earnings as realized losses. In determining whether other than temporary impairment exists, management considers whether: (1) we have the intent to sell the security; (2) it is more likely than not that we will be required to sell the security before recovery of the amortized cost basis; and (3) we do not expect to recover the entire amortized cost basis of the security. Gains and losses on the sale of securities are recorded on the trade date and are determined using the specific identification method.
Loans
: Loans are stated at the principal amount outstanding, net of deferred loan fees and costs and allowance for loan losses. Interest on loans is credited to income as earned based on the principal amount outstanding. Deferred loan fees and costs are amortized using the level yield method over the remaining maturities on the loans.
The accrual of interest on mortgage and commercial loans is discontinued at the time the loan is 90 days past due, unless the credit is well secured and in process of collection. Credit card loans and other personal loans are typically charged off no later than 180 days past due. Past due status is based on contractual terms of the loan. In all cases, loans are placed on nonaccrual or charged off at an earlier date, if collection of principal or interest is considered doubtful.
All interest accrued but not collected for loans that are placed on nonaccrual or charged off is reversed against interest income. The interest on these loans is accounted for on the cash-basis or cost-recovery method, until qualifying for return to accrual. Loans are returned to accrual status when all the principal and interest amounts contractually due are brought current and future payments are reasonably assured.
Loan Pool Participations:
The Company acquired its loan pool participations from the Former Midwest
One
during the merger and continued in this business following the merger. However, in 2010, the Company made the decision to exit this line of business and is thus not purchasing new loan pool participations as existing pools pay down. The pools consist of loans to borrowers located throughout the United States.
The Company carries its investment in the loan pools as a separate earning asset on the consolidated balance sheets. Principal or interest restructures, write-downs, or write-offs within the pools are not included in the Company’s disclosures for its loan portfolio, and foreclosed property from loans associated with the pools is not included in other real estate owned on the consolidated balance sheets. The loan pool participations are managed by a non-affiliate servicer operating in Omaha, Nebraska.
Each pool has a different composition and different characteristics. The composition of a loan pool is generally determined by the seller based on its desire to maximize the price it receives for all loans among the various pools. Many of the pools consist of loans primarily secured by single-family, multi-family, and small commercial real estate. Some pools may consist of a large number of
70
small consumer loans that are secured by other assets such as automobiles or mobile homes, while other pools may consist of small- to medium-balance commercial loans. Some may contain a mixture of such loans and other types of loans.
The Company invested in pools consisting of both performing loans and past-due nonperforming loans. The price bid and paid for such a loan pool was determined based on the composition of the particular pool, the amounts the servicer believed could be collected on such a pool, and the risks associated with the collection of such amounts.
Upon the acquisition of a participation interest in a loan pool, the Company assumed the risk of loss on a pro-rata basis. The extent of such risk is dependent on a number of factors, including the servicer’s ability to locate the debtors, the debtors’ financial condition, the possibility that a debtor may file for protection under applicable bankruptcy laws, the servicer’s ability to locate the collateral, if any, for the loan and to obtain possession of such collateral, the value of such collateral, and the length of time it takes to realize the ultimate recovery either through collection procedures or through a resale of the loans following a restructure.
A cost “basis” was assigned to each individual loan acquired on a cents-per-dollar (discounted price) basis based on the servicer’s assessment of the recovery potential of each such loan. This methodology assigns a higher basis to performing loans with greater potential collectability and a lower basis to those loans identified as having little or no potential for collection.
Loan pool participations are shown on the Company’s consolidated balance sheets as a separate asset category. The original carrying value of loan pool participations represents the discounted price paid by the Company to acquire its participation interests in various loan pools purchased by the servicer. The Company’s investment balance is reduced as the servicer collects principal payments on the loans and remits the proportionate share of such payments to the Company, as well as for charge-offs of amounts determined to be uncollectible.
The loan pool participations acquired are accounted for in accordance with the provisions of ASC Topic 310.
ASC Topic 310 provides guidance on the accounting for purchased loans that show evidence of deterioration of credit quality since origination and for which it is probable, at acquisition, that the purchaser will be unable to collect all contractually required payments receivable. ASC Topic 310 generally requires that the excess of the estimated cash flows expected to be collected on the loan over the initial investment be accreted over the estimated remaining life of the loan.
According to ASC Topic 310, in order to apply the interest method of recognition to these types of loans, there must be sufficient information to reasonably estimate the amount and timing of the cash flows expected to be collected. When that is not the case, the loan should be accounted for as a nonaccrual status applying the cash basis income recognition to the loan.
The Company developed and implemented procedures to determine if accretion of the discount (“accretable yield”) on the purchased loans in a pool is required under ASC Topic 310. Given the impaired nature of the loan pools typically purchased, the individual loans were evaluated for ASC Topic 310 purposes by the end of a six-month window from the date of purchase. This provided time to assess the quality of the loans and assign basis to each loan within the pool. Purchased loans were evaluated individually with a determination made utilizing various criteria including: past-due status, late payments, legal status of the loan (not in foreclosure, judgment against the borrower, or referred to legal counsel), frequency of payments made, collateral adequacy and the borrower’s financial condition. If all the criteria were met, the Company utilized the accounting treatment for that individual loan required by ASC Topic 310 with the accretable yield difference between the expected cash flows and the purchased basis accreted into income on the level yield basis over the anticipated life of the loan. If any of the six criteria were not met, the loan is accounted for on the cash-basis of accounting.
In the event that a prepayment is received on a loan accounted for under ASC Topic 310, the accretable yield is recomputed and the revised amount accreted over the estimated remaining life of the loan on the level yield basis. If a loan subject to accretable yield under ASC Topic 310 fails to make timely payments, it is subject to classification and an allowance for loss would be established.
Collection expenses incurred by the servicer are netted against discount income. Discount income is added to interest income and reflected as one amount on the Company’s consolidated statements of operations.
Interest income is only recognized when collected and actually remitted to the Company by the servicer for those loans subject to nonaccrual status in accordance with ASC Topic 310. Many of the pools that have been purchased by the servicer do not include purchased interest in the cost basis; thus, interest collected does not have a cost basis and represents profit. Interest income collected
71
by the servicer is reflected in the Company’s consolidated financial statements as interest income and is included as part of interest and discount on loan pool participations.
Loans held for sale
: Loans originated and intended for sale in the secondary market are carried at the lower of aggregate cost or estimated fair value, as determined by aggregate outstanding commitments from investors or current investor yield requirements. Net unrealized losses, if any, are recognized through a valuation allowance by charges to income.
Mortgage loans held for sale are generally sold with the mortgage servicing rights retained. Gains or losses on sales of mortgage loans are recognized based on the difference between the selling price plus the value of servicing rights, less the carrying value of the related mortgage loans sold.
Allowance for loan losses
: The allowance for loan losses is established as losses estimated to have been incurred through a provision for loan losses charged to earnings. Loan losses are charged against the allowance when management believes the uncollectibility of a loan balance is confirmed. Subsequent recoveries, if any, are credited to the allowance.
The allowance for loan losses is evaluated on a quarterly basis by management and is based upon management’s periodic review of the collectiblity of the loans in light of historical experience, the nature and volume of the loan portfolio, adverse situations that may affect the borrower’s ability to repay, estimated value of any underlying collateral and prevailing economic conditions. This evaluation is inherently subjective, as it requires estimates that are susceptible to significant revision as more information becomes available.
The allowance consists of specific, general and unallocated components. The specific component relates to loans that are classified as doubtful, substandard or special mention. For such loans that are also classified as impaired as well as any loan (regardless of classification) meeting the definition of a troubled debt restructuring, an allowance is established when the discounted cash flows (or collateral value or observable market price) of the impaired loan are lower than the carrying value of that loan. The general component covers loans not classified as impaired and is based on historical loss experience adjusted for qualitative factors. An unallocated component is maintained to cover uncertainties that could affect management’s estimate of probable losses. The unallocated component of the allowance reflects that margin of imprecision inherent in the underlying assumptions used in the methodologies for estimating specific and general losses in the portfolio.
A loan is considered impaired when, based on current information and events, it is probable that the Bank will be unable to collect the scheduled payments of principal or interest when due according to the contractual terms of the loan agreement. Factors considered by management in determining impairment include: payment status, collateral value and the probability of collecting scheduled principal and interest payments when due. Loans that experience insignificant payment delays and payment shortfalls generally are not classified as impaired. Management determines the significance of payment delays and payment shortfalls on a case-by-case basis, taking into consideration all of the circumstances surrounding the loan and the borrower, including the length of the delay, the reasons for the delay, the borrower’s prior payment record and the amount of the shortfall in relation to the principal and interest owed. Impairment is measured on a loan-by-loan basis by either the present value of expected future cash flows discounted at the loan’s effective interest rate, the loan’s observable market price or the fair value of the collateral, if the loan is collateral dependent.
Large groups of smaller-balance, homogeneous loans are collectively evaluated for impairment. Accordingly, the Bank generally does not separately identify individual consumer and residential loans for impairment unless they meet the definition of a troubled debt restructure.
Transfers of financial assets
: Revenue from the origination and sale of loans in the secondary market is recognized upon the transfer of financial assets and accounted for as sales when control over the assets has been surrendered. The Bank also sells participation interests in some large loans originated, to non-affiliated entities. Control over transferred assets is deemed to be surrendered when: (1) the assets have been isolated from the Bank and its affiliates; (2) the transferee has the right to pledge or exchange the assets it received and no condition both constrains the transferee from taking advantage of its right to pledge or exchange and provides more than a trivial benefit to the transferor; and (3) the Bank and its affiliates do not maintain effective control over the transferred assets through an agreement to repurchase them before their maturity or the ability to unilaterally cause the holder to return specific assets.
Revenue recognition
: Trust fees, deposit account service charges and other fees are recognized when payment is received for the services (cash basis), which generally occurs at the time the services are provided.
72
Credit-related financial instruments
: In the ordinary course of business, the Bank has entered into commitments to extend credit, including commitments under credit card arrangements, commercial letters of credit and standby letters of credit. Such financial instruments are recorded when they are funded. The Bank records a liability to the extent losses on its commitments to lend are probable.
Premises and equipment
: Land is carried at cost. Premises and equipment are stated at cost less accumulated depreciation. The estimated useful lives and primary method of depreciation for the principal items are as follows:
|
Years
|
|||||
|
Type of Assets
|
Minimum
|
Maximum
|
Depreciation Method
|
||
|
Buildings and leasehold improvements
|
10
|
-
|
30
|
Straight-line
|
|
|
Furniture and equipment
|
3
|
-
|
10
|
Straight-line
|
|
Charges for maintenance and repairs are expensed as incurred. When assets are retired or disposed of the related cost and accumulated depreciation are removed from the respective accounts and the resulting gain or loss is recorded.
Other real estate owned
: Real estate properties acquired through or in lieu of foreclosure are initially recorded at fair value less estimated selling cost at the date of foreclosure, establishing a new cost basis. Fair value is determined by management by obtaining appraisals or other market value information at least annually. Any write-downs in value at the date of acquisition are charged to the allowance for loan losses. After foreclosure, valuations are periodically performed by management by obtaining updated appraisals or other market value information. Any subsequent write-downs are recorded as a charge to operations, if necessary, to reduce the carrying value of a property to the updated fair value less estimated selling cost. Net costs related to the holding of properties are included in noninterest expense.
Mortgage servicing rights
: Mortgage servicing rights are recorded at fair value based on assumptions through a third-party valuation service. The valuation model incorporates assumptions that market participants would use in estimating future net servicing income, such as the servicing cost per loan, the discount rate, the escrow float rate, an inflation rate, ancillary income, prepayment speeds and default rates and losses.
Bank-owned life insurance
: Bank-owned life insurance is carried at cash surrender value, net of surrender and other charges, with increases/decreases reflected as income/expense in the consolidated statements of operations.
Employee benefit plans:
Deferred benefits under a salary continuation plan are charged to expense during the period in which the participating employees attain full eligibility.
Stock-based compensation
: Compensation expense for share based awards is recorded over the vesting period at the fair value of the award at the time of grant. The exercise price of options or fair value of nonvested shares granted under the Company’s incentive plans is equal to the fair market value of the underlying stock at the grant date. The Company assumes no projected forfeitures on its stock based compensation, since actual historical forfeiture rates on its stock-based incentive awards has been negligible.
Income taxes
: The Company files a consolidated federal income tax return. Income tax expense is generally allocated as if the Company and its subsidiaries file separate income tax returns. For state purposes, the Bank files a franchise tax return and the remaining entities file a consolidated income tax return. Deferred tax assets and liabilities are recognized for the future tax consequences attributable to temporary differences between the financial statement carrying amount of existing assets and liabilities and their respective tax bases. Deferred tax assets and liabilities are measured using enacted tax rates expected to apply to taxable income in the years in which those temporary differences are expected to be recovered or settled. The effect of a change in tax rates on deferred tax assets and liabilities is recognized in income in the period that includes the enactment date. Deferred tax assets are reduced by a valuation allowance when, in the opinion of management, it is more likely than not that some portion or all of the deferred tax assets will not be realized.
In accordance with ASC 740,
Income Taxes
, the Company recognizes a tax position as a benefit only if it is more likely than not that the tax position would be sustained in a tax examination, with a tax examination being presumed to occur. The amount recognized is the largest amount of tax benefit that is greater than 50% likely of being realized upon examination. For tax positions not meeting the more likely than not test, no tax benefit is recorded. The Company recognizes interest and/or penalties related to income tax matters in income tax expense.
73
There were no material unrecognized tax benefits or any interest or penalties on any unrecognized tax benefits as of
December 31, 2014
and
2013
.
Common stock
: On October 18, 2011, our Board of Directors amended the Company’s then existing share repurchase program by increasing the remaining amount of authorized repurchases to
$5.0 million
, and extending the expiration of the program to December 31, 2012. We repurchased 57,151 shares of common stock during the fourth quarter of 2011 for an aggregate cost of $840,000. In 2012, we repurchased a total of
104,518
shares of common stock at a cost of
$1.8 million
.
On
January 15, 2013
, the Company's board of directors announced the renewal of the Company's share repurchase program, extending the expiration of the program to
December 31, 2014
and increasing the remaining amount of authorized repurchases under the program to
$5.0 million
from the approximately
$2.4 million
of authorized repurchases that had previously remained. Pursuant to the program, the Company may continue to repurchase shares from time to time in the open market, and the method, timing and amounts of repurchase will be solely in the discretion of the Company's management. The repurchase program does not require the Company to acquire a specific number of shares. Therefore, the amount of shares repurchased pursuant to the program will depend on several factors, including market conditions, capital and liquidity requirements, and alternative uses for cash available. In 2013, we repurchased
40,713
shares of common stock at a cost of
$1.0 million
.
On
July 17, 2014
, the board of directors of the Company approved a new share repurchase program, allowing for the repurchase of up to
$5.0 million
of stock through
December 31, 2016
. The new repurchase program replaced the Company's prior repurchase program, pursuant to which the Company had repurchased approximately
$3.7 million
of common stock since January 1, 2013. Pursuant to the new program, the Company may continue to repurchase shares from time to time in the open market, and the method, timing and amounts of repurchase will be solely in the discretion of the Company's management. The repurchase program does not require the Company to acquire a specific number of shares. Therefore, the amount of shares repurchased pursuant to the program will depend on several factors, including market conditions, capital and liquidity requirements, and alternative uses for cash available. Of the
$5.0 million
of stock authorized under the repurchase plan,
$3.8 million
remained available for possible future repurchases as of
December 31, 2014
. In 2014, we repurchased
165,766
shares of common stock at a cost of
$4.0 million
.
In addition, as part of the agreement with Central, the Company will issue
2,723,083
shares of Company common stock to Central’s shareholders upon consummation of the transaction, which is expected to occur in the second quarter of 2015.
Comprehensive income
: Accounting principles generally require that recognized revenue, expenses, gains and losses be included in net income. Certain changes in assets and liabilities, such as unrealized gains and losses on available-for-sale securities, are reported as a separate component of shareholders’ equity on the consolidated balance sheets, and are disclosed in the consolidated statements of comprehensive income.
The components of accumulated other comprehensive income, included in shareholders’ equity, net of tax, are as follows:
|
Year Ended December 31,
|
||||||||||||
|
2014
|
|
2013
|
2012
|
|||||||||
|
(in thousands)
|
||||||||||||
|
Unrealized gains on securities available for sale, net of tax
|
$
|
5,322
|
|
$
|
1,049
|
|
$
|
11,050
|
|
|||
|
Accumulated other comprehensive income, net of tax
|
$
|
5,322
|
|
$
|
1,049
|
|
$
|
11,050
|
|
|||
Recent Accounting Pronouncements
In July 2013, the FASB issued Accounting Standards Update No. 2013-11,
Income Taxes (Topic 740): Presentation of an Unrecognized Tax Benefit When a Net Operating Loss Carryforward, a Similar Tax Loss, or a Tax Credit Carryforward Exists.
The objective of this update is to eliminate the diversity in practice on the financial statement presentation of an unrecognized tax benefit when a net operating loss carryforward, a similar tax loss, or a tax credit carryforward exists. For public entities, the amendments became effective for fiscal years, and interim periods within those years, beginning after December 15, 2013, with early adoption permitted. The adoption of this amendment did not have a material effect on the Company’s consolidated financial statements.
In January 2014, the FASB issued Accounting Standards Update No. 2014-01,
Investments—Equity Method and Joint Ventures (Topic 323): Accounting for Investments in Qualified Affordable Housing Projects.
The objective of this update is to provide guidance on accounting for investments by a reporting entity in flow-through limited liability entities that manage or invest in
74
affordable housing projects that qualify for the low-income housing tax credit. The low-income housing tax credit program is designed to encourage private capital investment in the construction and rehabilitation of low-income housing. This program is an indirect tax subsidy that allows investors in a flow-through limited liability entity, such as limited partnerships or limited liability companies that manage or invest in qualified affordable housing projects, to receive the benefits of the tax credits allocated to the entity that owns the qualified affordable housing project. The tax credits are allowable on the tax return each year over a 10-year period as a result of a sufficient number of units being rented to qualifying tenants and are subject to restrictions on gross rentals paid by those tenants. Those credits are subject to recapture over a 15-year period starting with the first year tax credits are earned. The amendments in this update permit reporting entities to make an accounting policy election to account for their investments in qualified affordable housing projects using the proportional amortization method if certain conditions are met. For public entities, the amendments are to be applied retrospectively to all annual periods and interim reporting periods presented within those annual periods, beginning after December 15, 2014. The adoption of this amendment is not expected to have a material effect on the Company’s consolidated financial statements.
In January 2014, the FASB issued Accounting Standards Update No. 2014-04,
Receivables—Troubled Debt Restructurings by Creditors (Subtopic 310-40): Reclassification of Residential Real Estate Collateralized Consumer Mortgage Loans upon Foreclosure.
The objective of this update is to reduce diversity by clarifying when an in-substance repossession or foreclosure occurs, that is, when a creditor should be considered to have received physical possession of residential real estate property collateralizing a consumer mortgage loan such that the loan receivable should be derecognized and the real estate property recognized. For public entities, the amendments are effective for reporting periods beginning after December 31, 2014, with early adoption permitted. The adoption of this amendment is not expected to have a material effect on the Company’s consolidated financial statements.
In May 2014, the FASB issued Accounting Standards Update No. 2014-09,
Revenue from Contract with Customers (Topic 606).
The guidance in this update affects any entity that either enters into contracts with customers to transfer goods or services or enters into contracts for the transfer of nonfinancial assets unless those contracts are within the scope of other standards (for example, insurance contracts or lease contracts). The core principle of the guidance is that an entity should recognize revenue to depict the transfer of promised goods or services to customers in an amount that reflects the consideration to which the entity expects to be entitled in exchange for those goods or services. To achieve that core principle, an entity should apply the following five steps: 1) identify the contracts(s) with the customer; 2) identify the performance obligations in the contract; 3) determine the transaction price; 4) allocate the transaction price to the performance obligations in the contract; and 5) recognize revenue when (or as) the entity satisfies a performance obligation. The guidance also specifies the accounting for some costs to obtain or fulfill a contract with a customer. For a public entity, the amendments in this update are effective for annual reporting periods beginning after December 15, 2016, including interim periods within that reporting period. Early application is not permitted. The Company is still evaluating the effect of this amendment on the Company’s consolidated financial statements.
In June 2014, the FASB issued Accounting Standards Update No. 2014-11,
Transfers and Servicing (Topic 860): Repurchase-to-Maturity Transactions, Repurchase Financings, and Disclosures.
The guidance in this update changes the accounting for repurchase-to-maturity transactions and repurchase financing arrangements. It also requires enhanced disclosures about repurchase agreements and other similar transactions. The accounting changes in this update are effective for public companies for the first interim or annual period beginning after December 15, 2014. In addition, for public companies, the disclosure for certain transactions accounted for as a sale is effective for the first interim or annual period beginning on or after December 15, 2014, and the disclosure for transactions accounted for as secured borrowings is required to be presented for annual periods beginning after December 15, 2014, and interim periods beginning after March 15, 2015. Early application is not permitted. The adoption of this amendment is not expected to have a material effect on the Company’s consolidated financial statements.
In August 2014, the FASB issued Accounting Standards Update No. 2014-14,
Receivables - Troubled Debt Restructurings by Creditors (Subtopic 310-40): Classification of Certain Government-Guaranteed Mortgage Loans upon Foreclosure.
This update provides guidance on how to classify and measure certain government-guaranteed mortgage loans upon foreclosure, most commonly those offered by the Federal Housing Administration (FHA) of the U.S. Department of Housing and Urban Development (HUD), and the U.S. Department of Veterans Affairs (VA). The ASU requires that a mortgage loan be derecognized and that a separate other receivable be recognized upon foreclosure if the following conditions are met: 1) the loan has a government guarantee that is not separable from the loan before foreclosure; 2) at the time of foreclosure, the creditor has the intent to convey the real estate property to the guarantor and make a claim on the guarantee, and the creditor has the ability to recover under the claim; and 3) at the time of foreclosure, an amount of the claim that is determined on the basis of the fair value of the real estate is fixed. Upon foreclosure, the separate other receivable should be measured based on the amount of the loan balance (principal and interest) expected to be recovered from the guarantor. The accounting changes in this update are effective for public companies for annual
75
periods, and the interim periods within those annual periods, beginning after December 15, 2014. Early application is permitted under certain circumstances. The adoption of this amendment is not expected to have a material effect on the Company’s consolidated financial statements.
In August 2014, the FASB issued Accounting Standards Update No. 2014-15,
Presentation of Financial Statements - Going Concern (Subtopic 205-40): Disclosure of Uncertainties about an Entity's Ability to Continue as a Going Concern.
The amendments in this update provide guidance in GAAP about management's responsibility to evaluate whether there is substantial doubt about an entity's ability to continue as a going concern and to provide related footnote disclosures. In doing so, the amendment should reduce diversity in the timing and content of footnote disclosures. Disclosures are required if it is probable an entity will be unable to meet its obligations within the look-forward period of twelve months after the financial statements are made available. Incremental substantial doubt disclosure is required if the probability is not mitigated by management's plans. The new standard applies to all entities for the first annual period ending after December 15, 2016, and interim periods thereafter. The adoption of this standard is not expected to have a material effect on the Company’s consolidated financial statements.
In November 2014, the FASB issued Accounting Standards Update No. 2014-17, Business Combinations
(Topic 805): Pushdown Accounting.
The amendments in this update provide an acquired entity with an option to apply pushdown accounting in its separate financial statements upon occurrence of an event in which an acquirer obtains control of the acquired entity. An acquired entity may elect the option to apply pushdown accounting in the reporting period in which the change-in-control event occurs. If pushdown accounting is not applied in the reporting period in which the change-in-control event occurs, an acquired entity will have the option to elect to apply pushdown accounting in a subsequent reporting period to the acquired entity’s most recent change-in-control event. If pushdown accounting is applied to an individual change-in-control event, that election is irrevocable. The amendments in this Update are effective on November 18, 2014. After the effective date, an acquired entity can make an election to apply the guidance to future change-in-control events or to its most recent change-in-control event. The adoption of this standard did not have a material effect on the Company’s consolidated financial statements.
|
Note 2.
|
Investment Securities
|
The amortized cost and fair value of investment securities available for sale, with gross unrealized gains and losses, are as follows:
|
Gross
|
Gross
|
||||||||||||||
|
Amortized
|
Unrealized
|
Unrealized
|
Estimated
|
||||||||||||
|
Cost
|
Gains
|
Losses
|
Fair Value
|
||||||||||||
|
(in thousands)
|
|||||||||||||||
|
December 31, 2014
|
|||||||||||||||
|
U.S. Government agencies and corporations
|
$
|
49,392
|
|
$
|
248
|
|
$
|
265
|
|
$
|
49,375
|
|
|||
|
State and political subdivisions
|
187,276
|
|
8,113
|
|
190
|
|
195,199
|
|
|||||||
|
Mortgage-backed securities
|
30,965
|
|
1,498
|
|
—
|
|
32,463
|
|
|||||||
|
Collateralized mortgage obligations
|
147,412
|
|
813
|
|
2,093
|
|
146,132
|
|
|||||||
|
Collateralized debt obligations
|
—
|
|
—
|
|
—
|
|
—
|
|
|||||||
|
Corporate debt securities
|
48,656
|
|
188
|
|
103
|
|
48,741
|
|
|||||||
|
Total debt securities
|
463,701
|
|
10,860
|
|
2,651
|
|
471,910
|
|
|||||||
|
Other equity securities
|
2,686
|
|
380
|
|
34
|
|
3,032
|
|
|||||||
|
Total investment securities
|
$
|
466,387
|
|
$
|
11,240
|
|
$
|
2,685
|
|
$
|
474,942
|
|
|||
|
December 31, 2013
|
|||||||||||||||
|
U.S. Government agencies and corporations
|
$
|
45,279
|
|
$
|
527
|
|
$
|
867
|
|
$
|
44,939
|
|
|||
|
State and political subdivisions
|
207,734
|
|
5,625
|
|
2,563
|
|
210,796
|
|
|||||||
|
Mortgage-backed securities
|
37,593
|
|
1,692
|
|
—
|
|
39,285
|
|
|||||||
|
Collateralized mortgage obligations
|
171,714
|
|
1,003
|
|
3,494
|
|
169,223
|
|
|||||||
|
Collateralized debt obligations
|
2,111
|
|
190
|
|
984
|
|
1,317
|
|
|||||||
|
Corporate debt securities
|
29,802
|
|
284
|
|
142
|
|
29,944
|
|
|||||||
|
Total debt securities
|
494,233
|
|
9,321
|
|
8,050
|
|
495,504
|
|
|||||||
|
Other equity securities
|
2,659
|
|
453
|
|
55
|
|
3,057
|
|
|||||||
|
Total investment securities
|
$
|
496,892
|
|
$
|
9,774
|
|
$
|
8,105
|
|
$
|
498,561
|
|
|||
76
The amortized cost and fair value of investment securities held to maturity, with gross unrealized gains and losses, are as follows:
|
Gross
|
Gross
|
||||||||||||||
|
Amortized
|
Unrealized
|
Unrealized
|
Estimated
|
||||||||||||
|
Cost
|
Gains
|
Losses
|
Fair Value
|
||||||||||||
|
(in thousands)
|
|||||||||||||||
|
December 31, 2014
|
|||||||||||||||
|
State and political subdivisions
|
$
|
39,704
|
|
$
|
370
|
|
$
|
252
|
|
$
|
39,822
|
|
|||
|
Mortgage-backed securities
|
22
|
|
3
|
|
—
|
|
25
|
|
|||||||
|
Collateralized mortgage obligations
|
8,531
|
|
—
|
|
233
|
|
8,298
|
|
|||||||
|
Corporate debt securities
|
3,267
|
|
—
|
|
159
|
|
3,108
|
|
|||||||
|
Total
|
$
|
51,524
|
|
$
|
373
|
|
$
|
644
|
|
$
|
51,253
|
|
|||
|
December 31, 2013
|
|||||||||||||||
|
State and political subdivisions
|
$
|
19,888
|
|
$
|
—
|
|
$
|
1,326
|
|
$
|
18,562
|
|
|||
|
Mortgage-backed securities
|
28
|
|
3
|
|
—
|
|
31
|
|
|||||||
|
Collateralized mortgage obligations
|
9,447
|
|
—
|
|
834
|
|
8,613
|
|
|||||||
|
Corporate debt securities
|
3,262
|
|
—
|
|
277
|
|
2,985
|
|
|||||||
|
Total
|
$
|
32,625
|
|
$
|
3
|
|
$
|
2,437
|
|
$
|
30,191
|
|
|||
Investment securities with a market value of
$200.7 million
and
$202.8 million
at
December 31, 2014
and
2013
, respectively, were pledged on public deposits, securities sold under agreements to repurchase and for other purposes, as required or permitted by law.
The summary of investment securities shows that some of the securities in the available for sale and held to maturity investment portfolios had unrealized losses, or were temporarily impaired, as of
December 31, 2014
and
December 31, 2013
. This temporary impairment represents the estimated amount of loss that would be realized if the securities were sold on the valuation date.
77
The following presents information pertaining to securities with gross unrealized losses as of
December 31, 2014
and
2013
, aggregated by investment category and length of time that individual securities have been in a continuous loss position:
|
|
|
As of December 31, 2014
|
||||||||||||||||||||||||
|
Number
of
Securities
|
Less than 12 Months
|
12 Months or More
|
Total
|
|||||||||||||||||||||||
|
Available for Sale
|
Estimated
Fair
Value
|
Unrealized
Losses
|
Estimated
Fair
Value
|
Unrealized
Losses
|
Estimated
Fair
Value
|
Unrealized
Losses
|
||||||||||||||||||||
|
(in thousands, except number of securities)
|
|
|||||||||||||||||||||||||
|
U.S. Government agencies and corporations
|
4
|
|
$
|
9,946
|
|
$
|
11
|
|
$
|
15,018
|
|
$
|
254
|
|
$
|
24,964
|
|
$
|
265
|
|
||||||
|
State and political subdivisions
|
46
|
|
3,024
|
|
18
|
|
10,728
|
|
172
|
|
13,752
|
|
190
|
|
||||||||||||
|
Collateralized mortgage obligations
|
14
|
|
14,971
|
|
123
|
|
68,370
|
|
1,970
|
|
83,341
|
|
2,093
|
|
||||||||||||
|
Corporate debt securities
|
7
|
|
23,024
|
|
50
|
|
3,400
|
|
53
|
|
26,424
|
|
103
|
|
||||||||||||
|
Other equity securities
|
1
|
|
—
|
|
—
|
|
966
|
|
34
|
|
966
|
|
34
|
|
||||||||||||
|
Total
|
72
|
|
$
|
50,965
|
|
$
|
202
|
|
$
|
98,482
|
|
$
|
2,483
|
|
$
|
149,447
|
|
$
|
2,685
|
|
||||||
|
|
|
As of December 31, 2013
|
||||||||||||||||||||||||
|
|
Number
of
Securities
|
Less than 12 Months
|
12 Months or More
|
Total
|
||||||||||||||||||||||
|
|
Estimated
Fair
Value
|
Unrealized
Losses
|
Estimated
Fair
Value
|
Unrealized
Losses
|
Estimated
Fair
Value
|
Unrealized
Losses
|
||||||||||||||||||||
|
(in thousands, except number of securities)
|
|
|||||||||||||||||||||||||
|
U.S. Government agencies and corporations
|
3
|
|
$
|
21,977
|
|
$
|
867
|
|
$
|
—
|
|
$
|
—
|
|
$
|
21,977
|
|
$
|
867
|
|
||||||
|
State and political subdivisions
|
171
|
|
54,153
|
|
2,331
|
|
1,799
|
|
232
|
|
55,952
|
|
2,563
|
|
||||||||||||
|
Collateralized mortgage obligations
|
18
|
|
110,142
|
|
3,164
|
|
5,047
|
|
330
|
|
115,189
|
|
|
3,494
|
|
|||||||||||
|
Collateralized debt obligations
|
3
|
|
—
|
|
—
|
|
934
|
|
984
|
|
934
|
|
|
984
|
|
|||||||||||
|
Corporate debt securities
|
3
|
|
7,430
|
|
93
|
|
1,561
|
|
49
|
|
8,991
|
|
142
|
|
||||||||||||
|
Other equity securities
|
1
|
|
945
|
|
55
|
|
—
|
|
—
|
|
945
|
|
55
|
|
||||||||||||
|
Total
|
199
|
|
$
|
194,647
|
|
$
|
6,510
|
|
$
|
9,341
|
|
$
|
1,595
|
|
$
|
203,988
|
|
$
|
8,105
|
|
||||||
|
|
|
As of December 31, 2014
|
||||||||||||||||||||||||
|
Number
of
Securities
|
Less than 12 Months
|
12 Months or More
|
Total
|
|||||||||||||||||||||||
|
Held to Maturity
|
Estimated
Fair
Value
|
Unrealized
Losses
|
Estimated
Fair
Value
|
Unrealized
Losses
|
Estimated
Fair
Value
|
Unrealized
Losses
|
||||||||||||||||||||
|
(in thousands, except number of securities)
|
|
|||||||||||||||||||||||||
|
State and political subdivisions
|
29
|
|
$
|
5,322
|
|
$
|
190
|
|
$
|
9,144
|
|
$
|
62
|
|
$
|
14,466
|
|
|
$
|
252
|
|
|||||
|
Collateralized mortgage obligations
|
1
|
|
—
|
|
—
|
|
8,298
|
|
233
|
|
8,298
|
|
|
233
|
|
|||||||||||
|
Corporate debt securities
|
2
|
|
2,358
|
|
27
|
|
750
|
|
132
|
|
3,108
|
|
159
|
|
||||||||||||
|
Total
|
32
|
|
$
|
7,680
|
|
$
|
217
|
|
$
|
18,192
|
|
$
|
427
|
|
$
|
25,872
|
|
$
|
644
|
|
||||||
|
|
|
As of December 31, 2013
|
||||||||||||||||||||||||
|
|
Number
of
Securities
|
Less than 12 Months
|
12 Months or More
|
Total
|
||||||||||||||||||||||
|
|
Estimated
Fair
Value
|
Unrealized
Losses
|
Estimated
Fair
Value
|
Unrealized
Losses
|
Estimated
Fair
Value
|
Unrealized
Losses
|
||||||||||||||||||||
|
(in thousands, except number of securities)
|
|
|||||||||||||||||||||||||
|
State and political subdivisions
|
30
|
|
$
|
17,420
|
|
$
|
1,195
|
|
$
|
1,142
|
|
$
|
131
|
|
$
|
18,562
|
|
$
|
1,326
|
|
||||||
|
Collateralized mortgage obligations
|
1
|
|
8,613
|
|
834
|
|
—
|
|
—
|
|
8,613
|
|
|
834
|
|
|||||||||||
|
Corporate debt securities
|
2
|
|
2,984
|
|
277
|
|
—
|
|
—
|
|
2,984
|
|
277
|
|
||||||||||||
|
Total
|
33
|
|
$
|
29,017
|
|
$
|
2,306
|
|
$
|
1,142
|
|
$
|
131
|
|
$
|
30,159
|
|
$
|
2,437
|
|
||||||
The Company's assessment of other-than-temporary impairment ("OTTI") is based on its reasonable judgment of the specific facts and circumstances impacting each individual security at the time such assessments are made. The Company reviews and considers
78
factual information, including expected cash flows, the structure of the security, the creditworthiness of the issuer, the type of underlying assets and the current and anticipated market conditions.
As of
December 31, 2014
and
2013
, the Company’s mortgage-backed securities and collateralized mortgage obligations portfolios consisted of securities predominantly backed by one- to four-family mortgage loans and underwritten to the standards of and guaranteed by the following government-sponsored agencies: the Federal Home Loan Mortgage Corporation (FHLMC), the Federal National Mortgage Association (FNMA), and the Government National Mortgage Association (GNMA). The receipt of principal, at par, and interest on mortgage-backed securities is guaranteed by the respective government-sponsored agency guarantor, such that the Company believes that its mortgage-backed securities do not expose the Company to credit-related losses.
At
December 31, 2014
, approximately
60%
of the municipal obligations held by the Company were Iowa-based. The Company does not intend to sell these municipal obligations, and it is more likely than not that the Company will not be required to sell them until the recovery of its cost. Due to the issuers’ continued satisfaction of their obligations under the securities in accordance with their contractual terms and the expectation that they will continue to do so, management’s intent and ability to hold these securities for a period of time sufficient to allow for any anticipated recovery in fair value, as well as the evaluation of the fundamentals of the issuers’ financial conditions and other objective evidence, the Company believes that the municipal obligations identified in the tables above were temporarily depressed as of
December 31, 2014
and
2013
.
At December 31, 2013, the Company owned
five
collateralized debt obligations (“CDOs”) backed by pools of trust preferred securities with an original cost basis of
$8.8 million
. The amortized cost of these securities as of that date totaled
$2.1 million
after OTTI charges have been recognized. During the quarter ended March 31, 2014, the Company sold these investment securities at a net gain of
$0.8 million
.
As of
December 31, 2014
, the Company owned
$2.1 million
of equity securities in banks and financial service-related companies, and
$1.0 million
of mutual funds invested in debt securities and other debt instruments that will cause units of the fund to be deemed to be qualified under the Community Reinvestment Act. Equity securities are considered to have OTTI whenever they have been in a loss position, compared to current book value, for twelve consecutive months, and the Company does not expect them to recover to their original cost basis. For the years ended
December 31, 2014
and
2013
,
no
impairment charges were recorded, as the affected equity securities were not deemed impaired due to market prices that are above the Company's original purchase price.
The following table provides a roll forward of credit losses on fixed maturity securities recognized in net income:
|
Year Ended December 31,
|
|||||||
|
2014
|
2013
|
||||||
|
(in thousands)
|
|||||||
|
Beginning balance
|
$
|
6,639
|
|
$
|
7,379
|
|
|
|
Additional credit losses:
|
|||||||
|
Securities with no previous other than temporary impairment
|
—
|
|
—
|
|
|||
|
Securities with previous other than temporary impairments
|
—
|
|
—
|
|
|||
|
Reductions to credit losses:
|
|||||||
|
Securities with previous other than temporary impairments, due to liquidation
|
—
|
|
(740
|
)
|
|||
|
Securities with previous other than temporary impairments, due to sale
|
(6,639
|
)
|
—
|
|
|||
|
Ending balance
|
$
|
—
|
|
$
|
6,639
|
|
|
It is reasonably possible that the fair values of the Company's investment securities could decline in the future if the overall economy or the financial conditions of the issuers deteriorate or the liquidity of certain securities remains depressed. As a result, there is a risk that additional OTTI may be recognized in the future and any such amounts could be material to the Company's consolidated statements of operations.
79
The contractual maturity distribution of investment debt securities at
December 31, 2014
, is summarized as follows:
|
|
Available For Sale
|
Held to Maturity
|
|||||||||||||
|
|
Amortized
Cost
|
Fair Value
|
Amortized
Cost
|
Fair Value
|
|||||||||||
|
(in thousands)
|
|||||||||||||||
|
Due in one year or less
|
$
|
22,476
|
|
$
|
22,637
|
|
$
|
190
|
|
$
|
189
|
|
|||
|
Due after one year through five years
|
122,371
|
|
124,385
|
|
2,750
|
|
2,723
|
|
|||||||
|
Due after five years through ten years
|
102,908
|
|
107,773
|
|
17,829
|
|
17,905
|
|
|||||||
|
Due after ten years
|
37,569
|
|
38,520
|
|
22,202
|
|
22,113
|
|
|||||||
|
Debt securities without a single maturity date
|
178,377
|
|
178,595
|
|
8,553
|
|
8,323
|
|
|||||||
|
Total
|
$
|
463,701
|
|
$
|
471,910
|
|
$
|
51,524
|
|
$
|
51,253
|
|
|||
Mortgage-backed securities and collateralized mortgage obligations are collateralized by mortgage loans, and guaranteed by U.S. government agencies. Experience has indicated that principal payments will be collected sooner than scheduled because of prepayments. Therefore, these securities are not scheduled in the maturity categories indicated above. Other equity securities available for sale with an amortized cost of
$2.7 million
and a fair value of
$3.0 million
are also excluded from this table.
Proceeds from the sales of investment securities available for sale during
2014
were
$33.5 million
. During
2013
there were
$12.4 million
sales of investment securities available for sale, while in
2012
there were
$18.3 million
sales of investment securities available for sale.
Other investment securities include investments in Federal Home Loan Bank (“FHLB”) stock. The carrying value of the FHLB stock at
December 31, 2014
and
December 31, 2013
was
$8.6 million
and
$9.2 million
, respectively, which is included in the Other Assets line of the consolidated balance sheets. This security is not readily marketable and ownership of FHLB stock is a requirement for membership in the FHLB-Des Moines. The amount of FHLB stock the Bank is required to hold is directly related to the amount of FHLB advances borrowed. Because there are no available market values for this security, it is carried at cost and evaluated for potential impairment each quarter.
No
impairment charges have been recognized on these securities. Redemption of this investment is at the option of the FHLB.
Realized gains and losses on sales are determined on the basis of specific identification of investments based on the trade date. Realized gains (losses) on investments, including impairment losses for the years ended
December 31, 2014
,
2013
and
2012
, were as follows:
|
|
Year Ended December 31,
|
||||||||||
|
|
2014
|
2013
|
2012
|
||||||||
|
(in thousands)
|
|
||||||||||
|
Available for sale fixed maturity securities:
|
|
||||||||||
|
Gross realized gains
|
$
|
1,463
|
|
$
|
144
|
|
$
|
424
|
|
||
|
Gross realized losses
|
(236
|
)
|
(79
|
)
|
—
|
|
|||||
|
Other-than-temporary impairment
|
—
|
|
—
|
|
(345
|
)
|
|||||
|
1,227
|
|
|
65
|
|
79
|
|
|||||
|
Equity securities:
|
|
||||||||||
|
Gross realized gains
|
—
|
|
—
|
|
381
|
|
|||||
|
Gross realized losses
|
—
|
|
—
|
|
—
|
|
|||||
|
Other-than-temporary impairment
|
—
|
|
—
|
|
—
|
|
|||||
|
—
|
|
|
—
|
|
381
|
|
|||||
|
Total net realized gains and losses
|
$
|
1,227
|
|
|
$
|
65
|
|
$
|
460
|
|
|
80
|
Note 3.
|
Loans Receivable and the Allowance for Loan Losses
|
The composition of allowance for loan losses, loans, and loan pool participations by portfolio segment, as of and for the years ended
December 31, 2014
and
2013
, were as follows:
|
Allowance for Loan Losses and Recorded Investment in Loan Receivables
|
|||||||||||||||||||||||||||
|
For the Years Ended December 31, 2014 and 2013
|
|||||||||||||||||||||||||||
|
(in thousands)
|
Agricultural
|
Commercial and Industrial
|
Commercial Real Estate
|
Residential Real Estate
|
Consumer
|
Unallocated
|
Total
|
||||||||||||||||||||
|
2014
|
|||||||||||||||||||||||||||
|
Allowance for loan losses:
|
|||||||||||||||||||||||||||
|
Individually evaluated for impairment
|
$
|
88
|
|
$
|
206
|
|
$
|
226
|
|
$
|
623
|
|
$
|
2
|
|
$
|
—
|
|
$
|
1,145
|
|
||||||
|
Collectively evaluated for impairment
|
1,418
|
|
5,574
|
|
4,173
|
|
2,544
|
|
321
|
|
1,188
|
|
15,218
|
|
|||||||||||||
|
Total
|
$
|
1,506
|
|
$
|
5,780
|
|
$
|
4,399
|
|
$
|
3,167
|
|
$
|
323
|
|
$
|
1,188
|
|
$
|
16,363
|
|
||||||
|
Loans acquired with deteriorated credit quality (loan pool participations)
|
$
|
—
|
|
$
|
70
|
|
$
|
669
|
|
$
|
82
|
|
$
|
9
|
|
$
|
1,304
|
|
$
|
2,134
|
|
||||||
|
Loans receivable
|
|||||||||||||||||||||||||||
|
Individually evaluated for impairment
|
$
|
3,027
|
|
$
|
3,168
|
|
$
|
3,916
|
|
$
|
3,341
|
|
$
|
34
|
|
$
|
—
|
|
$
|
13,486
|
|
||||||
|
Collectively evaluated for impairment
|
101,782
|
|
301,732
|
|
422,605
|
|
269,270
|
|
23,644
|
|
—
|
|
1,119,033
|
|
|||||||||||||
|
Total
|
$
|
104,809
|
|
$
|
304,900
|
|
$
|
426,521
|
|
$
|
272,611
|
|
$
|
23,678
|
|
$
|
—
|
|
$
|
1,132,519
|
|
||||||
|
Loans acquired with deteriorated credit quality (loan pool participations)*
|
$
|
4
|
|
$
|
935
|
|
$
|
14,246
|
|
$
|
3,340
|
|
$
|
12
|
|
$
|
2,929
|
|
$
|
21,466
|
|
||||||
|
(in thousands)
|
Agricultural
|
Commercial and Industrial
|
Commercial Real Estate
|
Residential Real Estate
|
Consumer
|
Unallocated
|
Total
|
||||||||||||||||||||
|
2013
|
|||||||||||||||||||||||||||
|
Allowance for loan losses:
|
|||||||||||||||||||||||||||
|
Individually evaluated for impairment
|
$
|
125
|
|
$
|
559
|
|
$
|
513
|
|
$
|
220
|
|
$
|
6
|
|
$
|
—
|
|
$
|
1,423
|
|
||||||
|
Collectively evaluated for impairment
|
1,233
|
|
4,421
|
|
4,781
|
|
2,965
|
|
269
|
|
1,087
|
|
14,756
|
|
|||||||||||||
|
Total
|
$
|
1,358
|
|
$
|
4,980
|
|
$
|
5,294
|
|
$
|
3,185
|
|
$
|
275
|
|
$
|
1,087
|
|
$
|
16,179
|
|
||||||
|
Loans acquired with deteriorated credit quality (loan pool participations)
|
$
|
3
|
|
$
|
64
|
|
$
|
627
|
|
$
|
88
|
|
$
|
6
|
|
$
|
1,346
|
|
$
|
2,134
|
|
||||||
|
Loans receivable
|
|||||||||||||||||||||||||||
|
Individually evaluated for impairment
|
$
|
3,146
|
|
$
|
3,521
|
|
$
|
5,079
|
|
$
|
1,664
|
|
$
|
50
|
|
$
|
—
|
|
$
|
13,460
|
|
||||||
|
Collectively evaluated for impairment
|
94,021
|
|
260,130
|
|
429,345
|
|
272,462
|
|
18,994
|
|
—
|
|
1,074,952
|
|
|||||||||||||
|
Total
|
$
|
97,167
|
|
$
|
263,651
|
|
$
|
434,424
|
|
$
|
274,126
|
|
$
|
19,044
|
|
$
|
—
|
|
$
|
1,088,412
|
|
||||||
|
Loans acquired with deteriorated credit quality (loan pool participations)*
|
$
|
49
|
|
$
|
1,302
|
|
$
|
18,168
|
|
$
|
3,823
|
|
$
|
18
|
|
$
|
4,307
|
|
$
|
27,667
|
|
||||||
* The amount shown as “Unallocated” represents the carrying value of other real estate owned within the loan pool participation portfolio total.
Loans with unpaid principal in the amount of
$404.4 million
at
December 31, 2014
were pledged to the FHLB as collateral for borrowings.
81
The changes in the allowance for loan losses by portfolio segment, as of and for the years ended
December 31, 2014
,
2013
, and
2012
were as follows:
|
Allowance for Loan Loss Activity
|
|||||||||||||||||||||||||||
|
For the Years Ended December 31, 2014, 2013, and 2012
|
|||||||||||||||||||||||||||
|
(in thousands)
|
Agricultural
|
Commercial and Industrial
|
Commercial Real Estate
|
Residential Real Estate
|
Consumer
|
Unallocated
|
Total
|
||||||||||||||||||||
|
2014
|
|||||||||||||||||||||||||||
|
Beginning balance
|
$
|
1,358
|
|
$
|
4,980
|
|
$
|
5,294
|
|
$
|
3,185
|
|
$
|
275
|
|
$
|
1,087
|
|
$
|
16,179
|
|
||||||
|
Charge-offs
|
(26
|
)
|
(685
|
)
|
(165
|
)
|
(409
|
)
|
(76
|
)
|
—
|
|
(1,361
|
)
|
|||||||||||||
|
Recoveries
|
10
|
|
217
|
|
61
|
|
22
|
|
35
|
|
—
|
|
345
|
|
|||||||||||||
|
Provision
|
164
|
|
1,268
|
|
(791
|
)
|
369
|
|
89
|
|
101
|
|
1,200
|
|
|||||||||||||
|
Ending balance
|
$
|
1,506
|
|
$
|
5,780
|
|
$
|
4,399
|
|
$
|
3,167
|
|
$
|
323
|
|
$
|
1,188
|
|
$
|
16,363
|
|
||||||
|
2013
|
|||||||||||||||||||||||||||
|
Beginning balance
|
$
|
1,026
|
|
$
|
4,599
|
|
$
|
5,767
|
|
$
|
3,007
|
|
$
|
356
|
|
$
|
1,202
|
|
$
|
15,957
|
|
||||||
|
Charge-offs
|
(39
|
)
|
(790
|
)
|
(545
|
)
|
(286
|
)
|
(147
|
)
|
—
|
|
(1,807
|
)
|
|||||||||||||
|
Recoveries
|
36
|
|
70
|
|
479
|
|
67
|
|
27
|
|
—
|
|
679
|
|
|||||||||||||
|
Provision
|
335
|
|
1,101
|
|
(407
|
)
|
397
|
|
39
|
|
(115
|
)
|
1,350
|
|
|||||||||||||
|
Ending balance
|
$
|
1,358
|
|
$
|
4,980
|
|
$
|
5,294
|
|
$
|
3,185
|
|
$
|
275
|
|
$
|
1,087
|
|
$
|
16,179
|
|
||||||
|
2012
|
|||||||||||||||||||||||||||
|
Beginning balance
|
$
|
1,209
|
|
$
|
5,380
|
|
$
|
5,171
|
|
$
|
3,501
|
|
$
|
167
|
|
$
|
248
|
|
$
|
15,676
|
|
||||||
|
Charge-offs
|
—
|
|
(2,345
|
)
|
(129
|
)
|
(537
|
)
|
(90
|
)
|
—
|
|
(3,101
|
)
|
|||||||||||||
|
Recoveries
|
507
|
|
423
|
|
24
|
|
31
|
|
18
|
|
—
|
|
1,003
|
|
|||||||||||||
|
Provision
|
(690
|
)
|
1,141
|
|
701
|
|
12
|
|
261
|
|
954
|
|
2,379
|
|
|||||||||||||
|
Ending balance
|
$
|
1,026
|
|
$
|
4,599
|
|
$
|
5,767
|
|
$
|
3,007
|
|
$
|
356
|
|
$
|
1,202
|
|
$
|
15,957
|
|
||||||
Loan Portfolio Segment Risk Characteristics
Agricultural
- Agricultural loans, most of which are secured by crops, livestock, and machinery, are provided to finance capital improvements and farm operations as well as acquisitions of livestock and machinery. The ability of the borrower to repay may be affected by many factors outside of the borrower's control including adverse weather conditions, loss of livestock due to disease or other factors, declines in market prices for agricultural products and the impact of government regulations. The ultimate repayment of agricultural loans is dependent upon the profitable operation or management of the agricultural entity. Collateral for these loans generally includes accounts receivable, inventory, equipment and real estate. However, depending on the overall financial condition of the borrower, some loans are made on an unsecured basis. The collateral securing these loans may depreciate over time, may be difficult to appraise and may fluctuate in value based on the success of the business.
Commercial and Industrial
- Commercial and industrial loans are primarily made based on the reported cash flow of the borrower and secondarily on the underlying collateral provided by the borrower. The collateral support provided by the borrower for most of these loans and the probability of repayment are based on the liquidation of the pledged collateral and enforcement of a personal guarantee, if any exists. The primary repayment risks of commercial and industrial loans are that the cash flows of the borrower may be unpredictable, and the collateral securing these loans may fluctuate in value. The size of the loans the Company can offer to commercial customers is less than the size of the loans that competitors with larger lending limits can offer. This may limit the Company's ability to establish relationships with the largest businesses in the areas in which the Company operates. As a result, the Company may assume greater lending risks than financial institutions that have a lesser concentration of such loans and tend to make loans to larger businesses. Collateral for these loans generally includes accounts receivable, inventory, equipment and real estate. However, depending on the overall financial condition of the borrower, some loans are made on an unsecured basis. The collateral securing these loans may depreciate over time, may be difficult to appraise and may fluctuate in value based on the success of the business. In addition, if the U.S. economy does not continue to improve, this could harm or continue to harm the businesses of the Company’s commercial and industrial customers and reduce the value of the collateral securing these loans.
Commercial Real Estate
- The Company offers mortgage loans to commercial and agricultural customers for the acquisition of real estate used in their businesses, such as offices, warehouses and production facilities, and to real estate investors for the acquisition of apartment buildings, retail centers, office buildings and other commercial buildings. The market value of real estate securing commercial real estate loans can fluctuate significantly in a short period of time as a result of market conditions in the geographic area in which the real estate is located. Adverse developments affecting real estate values in one or more of the Company's markets could increase the credit risk associated with its loan portfolio. Additionally, real estate lending typically involves higher loan principal amounts than other loans, and the repayment of the loans generally is dependent, in large part, on sufficient income from the properties securing the loans to cover operating expenses and debt service. Economic events or
82
governmental regulations outside of the Company’s control or that of the borrower could negatively impact the future cash flow and market values of the affected properties.
Residential Real Estate
- The Company generally retains short-term residential mortgage loans that are originated for its own portfolio but sells most long-term loans to other parties while retaining servicing rights on the majority of those loans. The market value of real estate securing residential real estate loans can fluctuate as a result of market conditions in the geographic area in which the real estate is located. Adverse developments affecting real estate values in one or more of the Company's markets could increase the credit risk associated with its loan portfolio. Additionally, real estate lending typically involves higher loan principal amounts than other loans, and the repayment of the loans generally is dependent, in large part, on the borrower's continuing financial stability, and is therefore more likely to be affected by adverse personal circumstances.
Consumer
- Consumer loans typically have shorter terms, lower balances, higher yields and higher risks of default than real estate related loans. Consumer loan collections are dependent on the borrower's continuing financial stability, and are therefore more likely to be affected by adverse personal circumstances. Collateral for these loans generally includes automobiles, boats, recreational vehicles, mobile homes, and real estate. However, depending on the overall financial condition of the borrower, some loans are made on an unsecured basis. The collateral securing these loans may depreciate over time, may be difficult to recover and may fluctuate in value based on condition. In addition, a decline in the United States economy could result in reduced employment, impacting the ability of customers to repay their obligations.
Loans acquired with deteriorated credit quality (loan pool participations)
- The underlying loans in the loan pool participations include both fixed-rate and variable-rate instruments. No amounts for interest due are reflected in the carrying value of the loan pool participations. Based on historical experience, the average period of collectibility for loans underlying loan pool participations, many of which have exceeded contractual maturity dates, is approximately three to five years. Loan pool balances are affected by the payment and refinancing activities of the borrowers resulting in pay-offs of the underlying loans and reduction in the balances. Collections from the individual borrowers are managed by the loan pool servicer and are affected by the borrower's financial ability and willingness to pay, foreclosure and legal action, collateral value, and the economy in general.
Charge-off Policy
The Company requires a loan to be charged-off as soon as it becomes apparent that some loss will be incurred, or when its collectability is sufficiently questionable that it no longer is considered a bankable asset. The primary considerations when determining if and how much of a loan should be charged-off are as follows: (1) the potential for future cash flows; (2) the value of any collateral; and (3) the strength of any co-makers or guarantors.
When it is determined that a loan requires a partial or full charge-off, a request for approval of a charge-off is submitted to the Bank's President, Executive Vice President and Chief Credit Officer, and the Senior Regional Loan officer. The Bank's board of directors formally approves all loan charge-offs. Once a loan is charged-off, it cannot be restructured and returned to the Bank's books.
The Allowance for Loan and Lease Losses - Bank Loans
The Company requires the maintenance of an adequate allowance for loan and lease losses (“ALLL”) in order to cover estimated probable losses without eroding the Company's capital base. Calculations are done at each quarter end, or more frequently if warranted, to analyze the collectability of loans and to ensure the adequacy of the allowance. In line with FDIC directives, the ALLL calculation does not include consideration of loans held for sale or off-balance-sheet credit exposures (such as unfunded letters of credit). Determining the appropriate level for the ALLL relies on the informed judgment of management, and as such, is subject to inaccuracy. Given the inherently imprecise nature of calculating the necessary ALLL, the Company's policy permits an "unallocated" allowance between
15%
above and
5%
below the “indicated reserve.” These unallocated amounts are due to those overall factors impacting the ALLL that are not captured in detailed loan category calculations.
Loans Reviewed Individually for Impairment
The Company identifies loans to be reviewed and evaluated individually for impairment based on current information and events and the probability that the borrower will be unable to repay all amounts due according to the contractual terms of the loan agreement. Specific areas of consideration include: size of credit exposure, risk rating, delinquency, nonaccrual status, and loan classification.
The level of individual impairment is measured using one of the following methods: (1) the fair value of the collateral less costs to sell; (2) the present value of expected future cash flows, discounted at the loan's effective interest rate; or (3) the loan's observable
83
market price. Loans that are deemed fully collateralized or have been charged down to a level corresponding with any of the three measurements require no assignment of reserves from the ALLL.
All loans deemed troubled debt restructure or “TDR” are considered impaired. A loan is considered a TDR when the Bank, for economic or legal reasons related to a borrower's financial difficulties, grants a concession to the borrower that the Bank would not otherwise consider. All of the following factors are potential indicators that the Bank has granted a concession (one or multiple items may be present):
|
•
|
The borrower receives a reduction of the stated interest rate for the remaining original life of the debt.
|
|
•
|
The borrower receives an extension of the maturity date or dates at a stated interest rate lower that the current market interest rate for new debt with similar risk characteristics.
|
|
•
|
The borrower receives a reduction of the face amount or maturity amount of the debt as stated in the instrument or other agreement.
|
|
•
|
The borrower receives a deferral of required payments (principal and/or interest).
|
|
•
|
The borrower receives a reduction of the accrued interest.
|
The following tables set forth information on the Company's TDRs by class of financing receivable occurring during the stated periods:
|
For the Year Ended December 31,
|
|||||||||||||||||||||||||||||
|
2014
|
2013
|
2012
|
|||||||||||||||||||||||||||
|
Number of Contracts
|
Pre-Modification Outstanding Recorded Investment
|
Post-Modification Outstanding Recorded Investment
|
Number of Contracts
|
Pre-Modification Outstanding Recorded Investment
|
Post-Modification Outstanding Recorded Investment
|
Number of Contracts
|
Pre-Modification Outstanding Recorded Investment
|
Post-Modification Outstanding Recorded Investment
|
|||||||||||||||||||||
|
(dollars in thousands)
|
|||||||||||||||||||||||||||||
|
Troubled Debt Restructurings
(1)
:
|
|||||||||||||||||||||||||||||
|
Commercial and industrial
|
|||||||||||||||||||||||||||||
|
Amortization or maturity date change
|
1
|
1,405
|
|
1,405
|
|
10
|
1,546
|
|
1,546
|
|
1
|
551
|
|
551
|
|
||||||||||||||
|
Commercial real estate:
|
|||||||||||||||||||||||||||||
|
Farmland
|
|||||||||||||||||||||||||||||
|
Interest rate reduction
|
0
|
—
|
|
—
|
|
0
|
—
|
|
—
|
|
2
|
2,475
|
|
2,388
|
|
||||||||||||||
|
Commercial real estate-other
|
|||||||||||||||||||||||||||||
|
Amortization or maturity date change
|
0
|
—
|
|
—
|
|
2
|
165
|
|
136
|
|
0
|
—
|
|
—
|
|
||||||||||||||
|
Residential real estate:
|
|||||||||||||||||||||||||||||
|
One- to four- family first liens
|
|||||||||||||||||||||||||||||
|
Interest rate reduction
|
1
|
285
|
|
292
|
|
2
|
164
|
|
169
|
|
0
|
—
|
|
—
|
|
||||||||||||||
|
Amortization or maturity date change
|
0
|
—
|
|
—
|
|
1
|
66
|
|
69
|
|
0
|
—
|
|
—
|
|
||||||||||||||
|
One- to four- family junior liens
|
|||||||||||||||||||||||||||||
|
Interest rate reduction
|
0
|
—
|
|
—
|
|
1
|
8
|
|
13
|
|
1
|
135
|
|
138
|
|
||||||||||||||
|
Total
|
2
|
$
|
1,690
|
|
$
|
1,697
|
|
16
|
$
|
1,949
|
|
$
|
1,933
|
|
4
|
$
|
3,161
|
|
$
|
3,077
|
|
||||||||
(1) TDRs may include multiple concessions and the disclosure classifications are based on the primary concession provided to the borrower.
84
Loans by class of financing receivable modified as TDRs within the previous 12 months and for which there was a payment default during the stated periods were:
|
For the Year Ended December 31,
|
|||||||||||||||||
|
2014
|
2013
|
2012
|
|||||||||||||||
|
Number of Contracts
|
Recorded Investment
|
Number of Contracts
|
Recorded Investment
|
Number of Contracts
|
Recorded Investment
|
||||||||||||
|
(dollars in thousands)
|
|||||||||||||||||
|
Troubled Debt Restructurings
(1)
That Subsequently Defaulted:
|
|||||||||||||||||
|
Commercial and industrial
|
|||||||||||||||||
|
Amortization or maturity date change
|
0
|
—
|
|
0
|
—
|
|
1
|
$
|
547
|
|
|||||||
|
Commercial real estate:
|
|||||||||||||||||
|
Commercial real estate-other
|
|||||||||||||||||
|
Amortization or maturity date change
|
0
|
—
|
|
1
|
69
|
|
0
|
—
|
|
||||||||
|
Residential real estate:
|
|||||||||||||||||
|
One- to four- family first liens
|
|||||||||||||||||
|
Interest rate reduction
|
0
|
—
|
|
1
|
111
|
|
0
|
—
|
|
||||||||
|
Total
|
0
|
$
|
—
|
|
2
|
$
|
180
|
|
1
|
$
|
547
|
|
|||||
(1) TDRs may include multiple concessions and the disclosure classifications are based on the primary concession provided to the borrower.
Loans Reviewed Collectively for Impairment
All loans not evaluated individually for impairment are grouped together by type (i.e. commercial, agricultural, consumer, etc.) and further segmented within each subset by risk classification (i.e. pass, special mention, and substandard). Homogeneous loans past due 60-89 days and 90 days and over are classified special mention and substandard, respectively, for allocation purposes.
The Company's historical loss experience for each loan type is calculated using the fiscal quarter-end data for the most recent
20
quarters as a starting point for estimating losses. In addition, other prevailing qualitative or environmental factors likely to cause probable losses to vary from historical data are incorporated in the form of adjustments to increase or decrease the loss rate applied to each group. These adjustments are documented and fully explain how the current information, events, circumstances, and conditions impact the historical loss measurement assumptions.
Although not a comprehensive list, the following are considered key factors and are evaluated with each calculation of the ALLL to determine if adjustments to historical loss rates are warranted:
|
•
|
Changes in lending policies and procedures, including changes in underwriting standards and collection, charge-off, and recovery practices not considered elsewhere in estimating credit losses.
|
|
•
|
Changes in international, national, regional, and local economic and business conditions and developments that affect the collectability of the portfolio, including the condition of various market segments.
|
|
•
|
Changes in the nature and volume of the portfolio and in the terms of loans.
|
|
•
|
Changes in the experience, ability and depth of lending management and other relevant staff.
|
|
•
|
Changes in the volume and severity of past due loans, the volume of nonaccrual loans, and the volume and severity of adversely classified or graded loans.
|
|
•
|
Changes in the quality of our loan review system.
|
|
•
|
Changes in the value of underlying collateral for collateral-dependent loans.
|
|
•
|
The existence and effect of any concentrations of credit, and changes in the level of such concentrations.
|
|
•
|
The effect of other external factors, such as competition and legal and regulatory requirements, on the level of estimated credit losses in the Bank’s existing portfolio.
|
The items listed above are used to determine the pass percentage for loans evaluated collectively and, as such, are applied to the loans risk rated pass. Due to the inherent risks associated with special mention risk rated loans (i.e. early stages of financial deterioration, technical exceptions, etc.), this subset is reserved at
two
times the pass allocation factor to reflect this increased risk exposure. In addition, non-impaired loans classified as substandard loans carry greater risk than special mention loans, and as such, this subset is reserved at
six
times the pass allocation. Further, non-impaired loans less than
$0.2 million
that are past due 60 - 89 days or 90 days and over, are respectively classified as special mention or substandard. They are given an increased loan loss allocation of
25%
or
50%
, respectively, above the five-year historical loss rate of the specific loan type.
85
The Allowance for Loan and Lease Losses - Loan Pool Participations
The Company requires the maintenance of an adequate allowance for loan pool participation losses (“ALLL”) in order to cover estimated probable losses. Currently, charge-offs are netted against the income the Company receives, thus the balance in the loan pool reserve is not affected and remains stable. In essence, a provision for loan losses is made that is equal to the quarterly charge-offs, which is deducted from income received from the loan pools. By maintaining a sufficient reserve to cover the next quarter’s charge-offs, the Company will have sufficient reserves in place should no income be collected from the loan pools during the quarter. In the event the estimated charge-offs provided by the servicer are greater than the loan pool ALLL, an additional provision is made to cover the difference between the current ALLL and the estimated charge-offs provided by the servicer.
Loans Reviewed Individually for Impairment
The loan servicer reviews the portfolio quarterly on a loan-by-loan basis, and loans that are deemed to be impaired are charged-down to their estimated value during the next calendar quarter. All loans that are to be charged-down are reserved against in the ALLL adequacy calculation. Loans that continue to have an investment basis that have been charged-down are monitored, and, if additional impairment is noted, the reserve requirement is increased on the individual loan.
Loans Reviewed Collectively for Impairment
The Company utilizes the annualized average of portfolio loan (not loan pool participation) historical loss per risk category over a two year period of time. Supporting documentation for the technique used to develop the historical loss rate for each group of loans is required to be maintained. It is management’s assessment that the two year rate is most reflective of the estimated credit losses in the current loan pool portfolio.
86
The following table sets forth the composition of the Company’s loans and loan pool participations by internally assigned credit quality indicators at
December 31, 2014
and
2013
:
|
Pass
|
Special Mention/Watch
|
Substandard
|
Doubtful
|
Loss
|
Total
|
||||||||||||||||||
|
(in thousands)
|
|||||||||||||||||||||||
|
2014
|
|||||||||||||||||||||||
|
Agricultural
|
$
|
98,096
|
|
$
|
5,032
|
|
$
|
1,681
|
|
$
|
—
|
|
$
|
—
|
|
$
|
104,809
|
|
|||||
|
Commercial and industrial
|
273,290
|
|
7,468
|
|
22,350
|
|
—
|
|
—
|
|
303,108
|
|
|||||||||||
|
Credit cards
|
1,240
|
|
6
|
|
—
|
|
—
|
|
—
|
|
1,246
|
|
|||||||||||
|
Overdrafts
|
373
|
|
262
|
|
109
|
|
—
|
|
—
|
|
744
|
|
|||||||||||
|
Commercial real estate:
|
|||||||||||||||||||||||
|
Construction & development
|
56,963
|
|
1,151
|
|
1,269
|
|
—
|
|
—
|
|
59,383
|
|
|||||||||||
|
Farmland
|
79,629
|
|
1,778
|
|
2,293
|
|
—
|
|
—
|
|
83,700
|
|
|||||||||||
|
Multifamily
|
54,708
|
|
178
|
|
—
|
|
—
|
|
—
|
|
54,886
|
|
|||||||||||
|
Commercial real estate-other
|
215,268
|
|
11,216
|
|
2,068
|
|
—
|
|
—
|
|
228,552
|
|
|||||||||||
|
Total commercial real estate
|
406,568
|
|
14,323
|
|
5,630
|
|
—
|
|
—
|
|
426,521
|
|
|||||||||||
|
Residential real estate:
|
|||||||||||||||||||||||
|
One- to four- family first liens
|
211,390
|
|
3,933
|
|
3,991
|
|
—
|
|
—
|
|
219,314
|
|
|||||||||||
|
One- to four- family junior liens
|
53,039
|
|
48
|
|
210
|
|
—
|
|
—
|
|
53,297
|
|
|||||||||||
|
Total residential real estate
|
264,429
|
|
3,981
|
|
4,201
|
|
—
|
|
—
|
|
272,611
|
|
|||||||||||
|
Consumer
|
23,431
|
|
8
|
|
41
|
|
—
|
|
—
|
|
23,480
|
|
|||||||||||
|
Total
|
$
|
1,067,427
|
|
$
|
31,080
|
|
$
|
34,012
|
|
$
|
—
|
|
$
|
—
|
|
$
|
1,132,519
|
|
|||||
|
Loans acquired with deteriorated credit quality (loan pool participations)
|
$
|
10,256
|
|
$
|
—
|
|
$
|
11,202
|
|
$
|
—
|
|
$
|
8
|
|
$
|
21,466
|
|
|||||
|
2013
|
|||||||||||||||||||||||
|
Agricultural
|
$
|
93,187
|
|
$
|
460
|
|
$
|
3,520
|
|
$
|
—
|
|
$
|
—
|
|
$
|
97,167
|
|
|||||
|
Commercial and industrial
|
239,485
|
|
11,097
|
|
11,786
|
|
—
|
|
—
|
|
262,368
|
|
|||||||||||
|
Credit cards
|
1,010
|
|
1
|
|
17
|
|
—
|
|
—
|
|
1,028
|
|
|||||||||||
|
Overdrafts
|
326
|
|
123
|
|
88
|
|
—
|
|
—
|
|
537
|
|
|||||||||||
|
Commercial real estate:
|
|||||||||||||||||||||||
|
Construction & development
|
56,112
|
|
14,984
|
|
1,493
|
|
—
|
|
—
|
|
72,589
|
|
|||||||||||
|
Farmland
|
80,044
|
|
3,091
|
|
2,340
|
|
—
|
|
—
|
|
85,475
|
|
|||||||||||
|
Multifamily
|
53,315
|
|
1,732
|
|
396
|
|
—
|
|
—
|
|
55,443
|
|
|||||||||||
|
Commercial real estate-other
|
205,914
|
|
12,994
|
|
2,009
|
|
—
|
|
—
|
|
220,917
|
|
|||||||||||
|
Total commercial real estate
|
395,385
|
|
32,801
|
|
6,238
|
|
—
|
|
—
|
|
434,424
|
|
|||||||||||
|
Residential real estate:
|
|||||||||||||||||||||||
|
One- to four- family first liens
|
213,815
|
|
3,994
|
|
2,859
|
|
—
|
|
—
|
|
220,668
|
|
|||||||||||
|
One- to four- family junior liens
|
53,225
|
|
38
|
|
195
|
|
—
|
|
—
|
|
53,458
|
|
|||||||||||
|
Total residential real estate
|
267,040
|
|
4,032
|
|
3,054
|
|
—
|
|
—
|
|
274,126
|
|
|||||||||||
|
Consumer
|
18,643
|
|
57
|
|
62
|
|
—
|
|
—
|
|
18,762
|
|
|||||||||||
|
Total
|
$
|
1,015,076
|
|
$
|
48,571
|
|
$
|
24,765
|
|
$
|
—
|
|
$
|
—
|
|
$
|
1,088,412
|
|
|||||
|
Loans acquired with deteriorated credit quality (loan pool participations)
|
$
|
13,569
|
|
$
|
—
|
|
$
|
14,093
|
|
$
|
—
|
|
$
|
5
|
|
$
|
27,667
|
|
|||||
Special Mention/Watch
- A special mention/watch asset has potential weaknesses that deserve management's close attention. If left uncorrected, these potential weaknesses may result in deterioration of the repayment prospects for the asset or in the Company's credit position at some future date. Special mention/watch assets are not adversely classified and do not expose the Company to sufficient risk to warrant adverse classification.
Substandard
- Substandard loans are inadequately protected by the current net worth and paying capacity of the obligor or of the collateral pledged, if any. Loans so classified must have a well defined weakness or weaknesses that jeopardize the liquidation of the debt. They are characterized by the distinct possibility that the Bank will sustain some loss if the deficiencies are not corrected.
87
Doubtful
- Loans classified doubtful have all the weaknesses inherent in those classified substandard with the added characteristic that the weaknesses make collection or liquidation in full, on the basis of currently known facts, conditions and values, highly questionable and improbable.
Loss
- Loans classified loss are generally considered uncollectible and of such little value that their continuance as bankable assets is not warranted. This classification does not mean that the loan has absolutely no recovery or salvage value but rather it is not practical or desirable to defer writing off this basically worthless asset even though partial recovery may be effected in the future.
88
The following tables set forth the amounts and categories of the Company’s impaired loans as of
December 31, 2014
and
2013
:
|
As of December 31,
|
|||||||||||||||||||||||
|
2014
|
2013
|
||||||||||||||||||||||
|
Recorded Investment
|
Unpaid Principal Balance
|
Related Allowance
|
Recorded Investment
|
Unpaid Principal Balance
|
Related Allowance
|
||||||||||||||||||
|
(in thousands)
|
|||||||||||||||||||||||
|
With no related allowance recorded:
|
|||||||||||||||||||||||
|
Agricultural
|
$
|
1,410
|
|
$
|
1,910
|
|
$
|
—
|
|
$
|
1,475
|
|
$
|
1,975
|
|
$
|
—
|
|
|||||
|
Commercial and industrial
|
2,169
|
|
2,270
|
|
—
|
|
1,919
|
|
2,020
|
|
—
|
|
|||||||||||
|
Credit cards
|
—
|
|
—
|
|
—
|
|
—
|
|
—
|
|
—
|
|
|||||||||||
|
Overdrafts
|
—
|
|
—
|
|
—
|
|
—
|
|
—
|
|
—
|
|
|||||||||||
|
Commercial real estate:
|
|||||||||||||||||||||||
|
Construction & development
|
49
|
|
176
|
|
—
|
|
132
|
|
601
|
|
—
|
|
|||||||||||
|
Farmland
|
2,270
|
|
2,433
|
|
—
|
|
93
|
|
107
|
|
—
|
|
|||||||||||
|
Multifamily
|
—
|
|
—
|
|
—
|
|
—
|
|
—
|
|
—
|
|
|||||||||||
|
Commercial real estate-other
|
939
|
|
1,064
|
|
—
|
|
587
|
|
612
|
|
—
|
|
|||||||||||
|
Total commercial real estate
|
3,258
|
|
3,673
|
|
—
|
|
812
|
|
1,320
|
|
—
|
|
|||||||||||
|
Residential real estate:
|
|||||||||||||||||||||||
|
One- to four- family first liens
|
535
|
|
773
|
|
—
|
|
622
|
|
741
|
|
—
|
|
|||||||||||
|
One- to four- family junior liens
|
134
|
|
157
|
|
—
|
|
50
|
|
50
|
|
—
|
|
|||||||||||
|
Total residential real estate
|
669
|
|
930
|
|
—
|
|
672
|
|
791
|
|
—
|
|
|||||||||||
|
Consumer
|
6
|
|
22
|
|
—
|
|
10
|
|
26
|
|
—
|
|
|||||||||||
|
Total
|
$
|
7,512
|
|
$
|
8,805
|
|
$
|
—
|
|
$
|
4,888
|
|
$
|
6,132
|
|
$
|
—
|
|
|||||
|
With an allowance recorded:
|
|||||||||||||||||||||||
|
Agricultural
|
$
|
1,617
|
|
$
|
1,617
|
|
$
|
88
|
|
$
|
1,671
|
|
$
|
1,671
|
|
$
|
125
|
|
|||||
|
Commercial and industrial
|
999
|
|
999
|
|
206
|
|
1,602
|
|
1,657
|
|
559
|
|
|||||||||||
|
Credit cards
|
—
|
|
—
|
|
—
|
|
—
|
|
—
|
|
—
|
|
|||||||||||
|
Overdrafts
|
—
|
|
—
|
|
—
|
|
—
|
|
—
|
|
—
|
|
|||||||||||
|
Commercial real estate:
|
|||||||||||||||||||||||
|
Construction & development
|
34
|
|
34
|
|
34
|
|
7
|
|
7
|
|
3
|
|
|||||||||||
|
Farmland
|
74
|
|
74
|
|
4
|
|
2,311
|
|
2,461
|
|
219
|
|
|||||||||||
|
Multifamily
|
—
|
|
—
|
|
—
|
|
—
|
|
—
|
|
—
|
|
|||||||||||
|
Commercial real estate-other
|
550
|
|
550
|
|
188
|
|
1,949
|
|
2,164
|
|
291
|
|
|||||||||||
|
Total commercial real estate
|
658
|
|
658
|
|
226
|
|
4,267
|
|
4,632
|
|
513
|
|
|||||||||||
|
Residential real estate:
|
|||||||||||||||||||||||
|
One- to four- family first liens
|
2,600
|
|
2,600
|
|
594
|
|
902
|
|
902
|
|
170
|
|
|||||||||||
|
One- to four- family junior liens
|
72
|
|
72
|
|
29
|
|
90
|
|
90
|
|
50
|
|
|||||||||||
|
Total residential real estate
|
2,672
|
|
2,672
|
|
623
|
|
992
|
|
992
|
|
220
|
|
|||||||||||
|
Consumer
|
28
|
|
28
|
|
2
|
|
40
|
|
40
|
|
6
|
|
|||||||||||
|
Total
|
$
|
5,974
|
|
$
|
5,974
|
|
$
|
1,145
|
|
$
|
8,572
|
|
$
|
8,992
|
|
$
|
1,423
|
|
|||||
|
Total:
|
|||||||||||||||||||||||
|
Agricultural
|
$
|
3,027
|
|
$
|
3,527
|
|
$
|
88
|
|
$
|
3,146
|
|
$
|
3,646
|
|
$
|
125
|
|
|||||
|
Commercial and industrial
|
3,168
|
|
3,269
|
|
206
|
|
3,521
|
|
3,677
|
|
559
|
|
|||||||||||
|
Credit cards
|
—
|
|
—
|
|
—
|
|
—
|
|
—
|
|
—
|
|
|||||||||||
|
Overdrafts
|
—
|
|
—
|
|
—
|
|
—
|
|
—
|
|
—
|
|
|||||||||||
|
Commercial real estate:
|
|||||||||||||||||||||||
|
Construction & development
|
83
|
|
210
|
|
34
|
|
139
|
|
608
|
|
3
|
|
|||||||||||
|
Farmland
|
2,344
|
|
2,507
|
|
4
|
|
2,404
|
|
2,568
|
|
219
|
|
|||||||||||
|
Multifamily
|
—
|
|
—
|
|
—
|
|
—
|
|
—
|
|
—
|
|
|||||||||||
|
Commercial real estate-other
|
1,489
|
|
1,614
|
|
188
|
|
2,536
|
|
2,776
|
|
291
|
|
|||||||||||
|
Total commercial real estate
|
3,916
|
|
4,331
|
|
226
|
|
5,079
|
|
5,952
|
|
513
|
|
|||||||||||
|
Residential real estate:
|
|||||||||||||||||||||||
|
One- to four- family first liens
|
3,135
|
|
3,373
|
|
594
|
|
1,524
|
|
1,643
|
|
170
|
|
|||||||||||
|
One- to four- family junior liens
|
206
|
|
229
|
|
29
|
|
140
|
|
140
|
|
50
|
|
|||||||||||
|
Total residential real estate
|
3,341
|
|
3,602
|
|
623
|
|
1,664
|
|
1,783
|
|
220
|
|
|||||||||||
|
Consumer
|
34
|
|
50
|
|
2
|
|
50
|
|
66
|
|
6
|
|
|||||||||||
|
Total
|
$
|
13,486
|
|
$
|
14,779
|
|
$
|
1,145
|
|
$
|
13,460
|
|
$
|
15,124
|
|
$
|
1,423
|
|
|||||
89
The following table sets forth the average recorded investment and interest income recognized for each category of the Company’s impaired loans during the stated periods:
|
For the Year Ended December 31,
|
|||||||||||||||||||||||
|
2014
|
2013
|
2012
|
|||||||||||||||||||||
|
Average Recorded Investment
|
Interest Income Recognized
|
Average Recorded Investment
|
Interest Income Recognized
|
Average Recorded Investment
|
Interest Income Recognized
|
||||||||||||||||||
|
(in thousands)
|
|||||||||||||||||||||||
|
With no related allowance recorded:
|
|||||||||||||||||||||||
|
Agricultural
|
$
|
1,413
|
|
$
|
211
|
|
$
|
1,128
|
|
$
|
114
|
|
$
|
1,600
|
|
$
|
60
|
|
|||||
|
Commercial and industrial
|
2,234
|
|
160
|
|
2,025
|
|
76
|
|
965
|
|
52
|
|
|||||||||||
|
Credit cards
|
—
|
|
—
|
|
—
|
|
—
|
|
—
|
|
—
|
|
|||||||||||
|
Overdrafts
|
—
|
|
—
|
|
—
|
|
—
|
|
—
|
|
—
|
|
|||||||||||
|
Commercial real estate:
|
|||||||||||||||||||||||
|
Construction & development
|
49
|
|
—
|
|
149
|
|
21
|
|
316
|
|
—
|
|
|||||||||||
|
Farmland
|
2,288
|
|
456
|
|
101
|
|
8
|
|
83
|
|
8
|
|
|||||||||||
|
Multifamily
|
—
|
|
—
|
|
—
|
|
—
|
|
—
|
|
—
|
|
|||||||||||
|
Commercial real estate-other
|
975
|
|
(3
|
)
|
593
|
|
25
|
|
1,770
|
|
72
|
|
|||||||||||
|
Total commercial real estate
|
3,312
|
|
453
|
|
843
|
|
54
|
|
2,169
|
|
80
|
|
|||||||||||
|
Residential real estate:
|
|||||||||||||||||||||||
|
One- to four- family first liens
|
547
|
|
32
|
|
669
|
|
14
|
|
143
|
|
4
|
|
|||||||||||
|
One- to four- family junior liens
|
134
|
|
6
|
|
50
|
|
1
|
|
43
|
|
3
|
|
|||||||||||
|
Total residential real estate
|
681
|
|
38
|
|
719
|
|
15
|
|
186
|
|
7
|
|
|||||||||||
|
Consumer
|
8
|
|
—
|
|
12
|
|
—
|
|
16
|
|
—
|
|
|||||||||||
|
Total
|
$
|
7,648
|
|
$
|
862
|
|
$
|
4,727
|
|
$
|
259
|
|
$
|
4,936
|
|
$
|
199
|
|
|||||
|
With an allowance recorded:
|
|||||||||||||||||||||||
|
Agricultural
|
$
|
1,627
|
|
$
|
203
|
|
$
|
1,681
|
|
$
|
51
|
|
$
|
1,723
|
|
$
|
50
|
|
|||||
|
Commercial and industrial
|
1,044
|
|
104
|
|
1,697
|
|
75
|
|
1,044
|
|
36
|
|
|||||||||||
|
Credit cards
|
—
|
|
—
|
|
—
|
|
—
|
|
—
|
|
—
|
|
|||||||||||
|
Overdrafts
|
—
|
|
—
|
|
—
|
|
—
|
|
—
|
|
—
|
|
|||||||||||
|
Commercial real estate:
|
|||||||||||||||||||||||
|
Construction & development
|
35
|
|
3
|
|
7
|
|
—
|
|
526
|
|
30
|
|
|||||||||||
|
Farmland
|
74
|
|
3
|
|
2,315
|
|
110
|
|
2,504
|
|
114
|
|
|||||||||||
|
Multifamily
|
—
|
|
—
|
|
—
|
|
—
|
|
—
|
|
—
|
|
|||||||||||
|
Commercial real estate-other
|
551
|
|
43
|
|
1,921
|
|
55
|
|
559
|
|
18
|
|
|||||||||||
|
Total commercial real estate
|
660
|
|
49
|
|
4,243
|
|
165
|
|
3,589
|
|
162
|
|
|||||||||||
|
Residential real estate:
|
|||||||||||||||||||||||
|
One- to four- family first liens
|
2,612
|
|
203
|
|
909
|
|
38
|
|
645
|
|
33
|
|
|||||||||||
|
One- to four- family junior liens
|
74
|
|
—
|
|
92
|
|
1
|
|
68
|
|
2
|
|
|||||||||||
|
Total residential real estate
|
2,686
|
|
203
|
|
1,001
|
|
39
|
|
713
|
|
35
|
|
|||||||||||
|
Consumer
|
31
|
|
5
|
|
41
|
|
2
|
|
24
|
|
2
|
|
|||||||||||
|
Total
|
$
|
6,048
|
|
$
|
564
|
|
$
|
8,663
|
|
$
|
332
|
|
$
|
7,093
|
|
$
|
285
|
|
|||||
|
Total:
|
|||||||||||||||||||||||
|
Agricultural
|
$
|
3,040
|
|
$
|
414
|
|
$
|
2,809
|
|
$
|
165
|
|
$
|
3,323
|
|
$
|
110
|
|
|||||
|
Commercial and industrial
|
3,278
|
|
264
|
|
3,722
|
|
151
|
|
2,009
|
|
88
|
|
|||||||||||
|
Credit cards
|
—
|
|
—
|
|
—
|
|
—
|
|
—
|
|
—
|
|
|||||||||||
|
Overdrafts
|
—
|
|
—
|
|
—
|
|
—
|
|
—
|
|
—
|
|
|||||||||||
|
Commercial real estate:
|
|||||||||||||||||||||||
|
Construction & development
|
84
|
|
3
|
|
156
|
|
21
|
|
842
|
|
30
|
|
|||||||||||
|
Farmland
|
2,362
|
|
459
|
|
2,416
|
|
118
|
|
2,587
|
|
122
|
|
|||||||||||
|
Multifamily
|
—
|
|
—
|
|
—
|
|
—
|
|
—
|
|
—
|
|
|||||||||||
|
Commercial real estate-other
|
1,526
|
|
40
|
|
2,514
|
|
80
|
|
2,329
|
|
90
|
|
|||||||||||
|
Total commercial real estate
|
3,972
|
|
502
|
|
5,086
|
|
219
|
|
5,758
|
|
242
|
|
|||||||||||
|
Residential real estate:
|
|||||||||||||||||||||||
|
One- to four- family first liens
|
3,159
|
|
235
|
|
1,578
|
|
52
|
|
788
|
|
37
|
|
|||||||||||
|
One- to four- family junior liens
|
208
|
|
6
|
|
142
|
|
2
|
|
111
|
|
5
|
|
|||||||||||
|
Total residential real estate
|
3,367
|
|
241
|
|
1,720
|
|
54
|
|
899
|
|
42
|
|
|||||||||||
|
Consumer
|
39
|
|
5
|
|
53
|
|
2
|
|
40
|
|
2
|
|
|||||||||||
|
Total
|
$
|
13,696
|
|
$
|
1,426
|
|
$
|
13,390
|
|
$
|
591
|
|
$
|
12,029
|
|
$
|
484
|
|
|||||
90
The following table sets forth the composition and past due status of the Company’s loans at
December 31, 2014
and
2013
:
|
30 - 59 Days Past Due
|
60 - 89 Days Past Due
|
90 Days or More Past Due
|
Total Past Due
|
Current
|
Total Loans Receivable
|
Recorded Investment > 90 Days Past Due and Accruing
|
|||||||||||||||||||||
|
(in thousands)
|
|||||||||||||||||||||||||||
|
2014
|
|||||||||||||||||||||||||||
|
Agricultural
|
$
|
58
|
|
$
|
30
|
|
$
|
—
|
|
$
|
88
|
|
$
|
104,721
|
|
$
|
104,809
|
|
$
|
—
|
|
||||||
|
Commercial and industrial
|
897
|
|
603
|
|
515
|
|
2,015
|
|
301,093
|
|
303,108
|
|
66
|
|
|||||||||||||
|
Credit cards
|
3
|
|
3
|
|
—
|
|
6
|
|
1,240
|
|
1,246
|
|
—
|
|
|||||||||||||
|
Overdrafts
|
104
|
|
2
|
|
4
|
|
110
|
|
634
|
|
744
|
|
—
|
|
|||||||||||||
|
Commercial real estate:
|
|||||||||||||||||||||||||||
|
Construction & development
|
—
|
|
—
|
|
83
|
|
83
|
|
59,300
|
|
59,383
|
|
—
|
|
|||||||||||||
|
Farmland
|
503
|
|
—
|
|
—
|
|
503
|
|
83,197
|
|
83,700
|
|
—
|
|
|||||||||||||
|
Multifamily
|
—
|
|
—
|
|
—
|
|
—
|
|
54,886
|
|
54,886
|
|
—
|
|
|||||||||||||
|
Commercial real estate-other
|
168
|
|
57
|
|
1,200
|
|
1,425
|
|
227,127
|
|
228,552
|
|
—
|
|
|||||||||||||
|
Total commercial real estate
|
671
|
|
57
|
|
1,283
|
|
2,011
|
|
424,510
|
|
426,521
|
|
—
|
|
|||||||||||||
|
Residential real estate:
|
|||||||||||||||||||||||||||
|
One- to four- family first liens
|
1,481
|
|
581
|
|
2,023
|
|
4,085
|
|
215,229
|
|
219,314
|
|
780
|
|
|||||||||||||
|
One- to four- family junior liens
|
105
|
|
48
|
|
192
|
|
345
|
|
52,952
|
|
53,297
|
|
—
|
|
|||||||||||||
|
Total residential real estate
|
1,586
|
|
629
|
|
2,215
|
|
4,430
|
|
268,181
|
|
272,611
|
|
780
|
|
|||||||||||||
|
Consumer
|
35
|
|
8
|
|
23
|
|
66
|
|
23,414
|
|
23,480
|
|
2
|
|
|||||||||||||
|
Total
|
$
|
3,354
|
|
$
|
1,332
|
|
$
|
4,040
|
|
$
|
8,726
|
|
$
|
1,123,793
|
|
$
|
1,132,519
|
|
$
|
848
|
|
||||||
|
2013
|
|||||||||||||||||||||||||||
|
Agricultural
|
$
|
65
|
|
$
|
23
|
|
$
|
52
|
|
$
|
140
|
|
$
|
97,027
|
|
$
|
97,167
|
|
$
|
—
|
|
||||||
|
Commercial and industrial
|
610
|
|
876
|
|
960
|
|
2,446
|
|
259,922
|
|
262,368
|
|
213
|
|
|||||||||||||
|
Credit cards
|
—
|
|
1
|
|
17
|
|
18
|
|
1,010
|
|
1,028
|
|
17
|
|
|||||||||||||
|
Overdrafts
|
40
|
|
1
|
|
48
|
|
89
|
|
448
|
|
537
|
|
—
|
|
|||||||||||||
|
Commercial real estate:
|
|||||||||||||||||||||||||||
|
Construction & development
|
84
|
|
—
|
|
56
|
|
140
|
|
72,449
|
|
72,589
|
|
—
|
|
|||||||||||||
|
Farmland
|
—
|
|
—
|
|
—
|
|
—
|
|
85,475
|
|
85,475
|
|
—
|
|
|||||||||||||
|
Multifamily
|
—
|
|
—
|
|
395
|
|
395
|
|
55,048
|
|
55,443
|
|
395
|
|
|||||||||||||
|
Commercial real estate-other
|
604
|
|
190
|
|
1,740
|
|
2,534
|
|
218,383
|
|
220,917
|
|
164
|
|
|||||||||||||
|
Total commercial real estate
|
688
|
|
190
|
|
2,191
|
|
3,069
|
|
431,355
|
|
434,424
|
|
559
|
|
|||||||||||||
|
Residential real estate:
|
|||||||||||||||||||||||||||
|
One- to four- family first liens
|
1,891
|
|
869
|
|
984
|
|
3,744
|
|
216,924
|
|
220,668
|
|
540
|
|
|||||||||||||
|
One- to four- family junior liens
|
316
|
|
38
|
|
175
|
|
529
|
|
52,929
|
|
53,458
|
|
49
|
|
|||||||||||||
|
Total residential real estate
|
2,207
|
|
907
|
|
1,159
|
|
4,273
|
|
269,853
|
|
274,126
|
|
589
|
|
|||||||||||||
|
Consumer
|
17
|
|
62
|
|
36
|
|
115
|
|
18,647
|
|
18,762
|
|
7
|
|
|||||||||||||
|
Total
|
$
|
3,627
|
|
$
|
2,060
|
|
$
|
4,463
|
|
$
|
10,150
|
|
$
|
1,078,262
|
|
$
|
1,088,412
|
|
$
|
1,385
|
|
||||||
Non-accrual and Delinquent Loans
Loans are placed on non-accrual when (1) payment in full of principal and interest is no longer expected or (2) principal or interest has been in default for 90 days or more (unless the loan is both well secured with marketable collateral and in the process of collection). All loans rated doubtful or worse, and certain loans rated substandard, are placed on non-accrual.
A non-accrual asset may be restored to an accrual status when (1) all past due principal and interest has been paid (excluding renewals and modifications that involve the capitalizing of interest) or (2) the loan becomes well secured with marketable collateral and is in the process of collection. An established track record of performance is also considered when determining accrual status.
Delinquency status of a loan is determined by the number of days that have elapsed past the loan's payment due date, using the following classification groupings: 30-59 days, 60-89 days and 90 days or more. Loans shown in the 30-59 days and 60-89 days columns in the table above reflect contractual delinquency status of loans not considered nonperforming due to classification as a TDR or being placed on non-accrual.
91
The following table sets forth the composition of the Company’s recorded investment in loans on nonaccrual status as of
December 31, 2014
and
2013
:
|
As of December 31,
|
|||||||
|
2014
|
2013
|
||||||
|
(in thousands)
|
|||||||
|
Agricultural
|
$
|
—
|
|
$
|
52
|
|
|
|
Commercial and industrial
|
479
|
|
746
|
|
|||
|
Credit cards
|
—
|
|
—
|
|
|||
|
Overdrafts
|
—
|
|
—
|
|
|||
|
Commercial real estate:
|
|||||||
|
Construction & development
|
83
|
|
139
|
|
|||
|
Farmland
|
24
|
|
29
|
|
|||
|
Multifamily
|
—
|
|
—
|
|
|||
|
Commercial real estate-other
|
1,200
|
|
1,576
|
|
|||
|
Total commercial real estate
|
1,307
|
|
1,744
|
|
|||
|
Residential real estate:
|
|||||||
|
One- to four- family first liens
|
1,261
|
|
543
|
|
|||
|
One- to four- family junior liens
|
192
|
|
126
|
|
|||
|
Total residential real estate
|
1,453
|
|
669
|
|
|||
|
Consumer
|
16
|
|
29
|
|
|||
|
Total
|
$
|
3,255
|
|
$
|
3,240
|
|
|
As of
December 31, 2014
, the Company had
no
commitments to lend additional funds to borrowers who have had a TDR.
A summary of the changes in the carrying value of loan pool participations for the years ended
December 31, 2014
and
2013
, is as follows:
|
For the Year Ended December 31,
|
|||||||
|
2014
|
2013
|
||||||
|
(in thousands)
|
|||||||
|
Balance at beginning of year
|
$
|
25,533
|
|
$
|
35,650
|
|
|
|
Principal payments
|
(4,724
|
)
|
(8,687
|
)
|
|||
|
Net charge-offs
|
(1,477
|
)
|
(1,430
|
)
|
|||
|
Balance at end of year
|
$
|
19,332
|
|
$
|
25,533
|
|
|
|
Total face value at end of year
|
$
|
68,376
|
|
$
|
80,902
|
|
|
Loan Pool Participations
ASC Topic 310 addresses accounting for differences between contractual cash flows and cash flows expected to be collected from an investor’s initial investment in loans or debt securities acquired in a transfer if those differences are attributable, at least in part, to credit quality. The loans underlying the loan pool participations were evaluated individually when purchased for application of ASC Topic 310, utilizing various criteria including: past-due status, late payments, legal status of the loan (not in foreclosure, judgment against the borrower, or referred to legal counsel), frequency of payments made, collateral adequacy and the borrower’s financial condition. If all the criteria were met, the individual loan utilized the accounting treatment required by ASC Topic 310 with the accretable yield difference between the expected cash flows and the purchased basis accreted into income on the level yield basis over the anticipated life of the loan. If any of the
six
criteria were not met at the time of purchase, the loan was accounted for on the cash basis of accounting.
The loan servicer reviews the portfolio quarterly on a loan-by-loan basis, and loans that are deemed to be impaired are charged-down to their estimated value. As of
December 31, 2014
, approximately
70%
of the loans were contractually current or less than 90 days past due, while
30%
were contractually past due 90 days or more. Many of the loans were acquired in a contractually past due status, which is reflected in the discounted purchase price of the loans. Performance status is monitored on a monthly basis. The
30%
of loans contractually past due includes loans in litigation and foreclosed property.
92
The Company evaluated all loans under the ASC Topic 310 criteria as of
December 31, 2014
and
2013
and determined that certain loans did not meet the criteria for level-yield income recognition required by ASC Topic 310. The outstanding balance of those loans was
$65.0 million
with a carrying value of
$18.9 million
as of
December 31, 2014
, and
$76.9 million
and
$24.6 million
, respectively, as of
December 31, 2013
. Income from these loans is realized on a cash basis, or when payments are actually received from the borrower.
The outstanding balances and carrying values as of
December 31, 2014
and
2013
, of the loans purchased that met the level-yield income recognition criteria under ASC Topic 310 are as follows:
|
As of December 31,
|
|||||||
|
2014
|
2013
|
||||||
|
(in thousands)
|
|||||||
|
Commercial
|
477
|
|
502
|
|
|||
|
Real Estate:
|
|||||||
|
1-4 family residences
|
201
|
|
229
|
|
|||
|
Commercial
|
1,930
|
|
2,320
|
|
|||
|
Total real estate
|
2,131
|
|
2,549
|
|
|||
|
Total
|
$
|
2,608
|
|
$
|
3,051
|
|
|
|
Allowance
|
(56
|
)
|
(48
|
)
|
|||
|
Carrying amount, net of allowance
|
$
|
2,552
|
|
$
|
3,003
|
|
|
Changes in accretable yield on the loans that met the level-yield income recognition criteria under ASC Topic 310 were as follows:
|
Accretable Yield December 31,
|
|||||||
|
2014
|
2013
|
||||||
|
(in thousands)
|
|||||||
|
Balance at beginning of year
|
$
|
2,244
|
|
$
|
2,627
|
|
|
|
Additions
|
—
|
|
—
|
|
|||
|
Accretions
|
(665
|
)
|
(383
|
)
|
|||
|
Reclassifications to nonaccretable differences
|
—
|
|
—
|
|
|||
|
Balance at end of year
|
$
|
1,579
|
|
$
|
2,244
|
|
|
|
Cash flows expected to be collected at acquisition
|
$
|
7,913
|
|
$
|
8,128
|
|
|
|
Basis in acquired loans at acquisition
|
$
|
4,482
|
|
$
|
4,638
|
|
|
|
Note 4.
|
Premises and Equipment
|
Premises and equipment as of
December 31, 2014
and
2013
were as follows:
|
As of December 31,
|
|||||||
|
2014
|
2013
|
||||||
|
(in thousands)
|
|||||||
|
Land
|
$
|
4,836
|
|
$
|
4,836
|
|
|
|
Buildings and leasehold improvements
|
29,942
|
|
30,278
|
|
|||
|
Furniture and equipment
|
13,206
|
|
13,741
|
|
|||
|
Construction in process
|
14,705
|
|
3,774
|
|
|||
|
Premises and equipment
|
62,689
|
|
52,629
|
|
|||
|
Accumulated depreciation and amortization
|
24,919
|
|
24,947
|
|
|||
|
Premises and equipment, net
|
$
|
37,770
|
|
$
|
27,682
|
|
|
Premises and equipment depreciation and amortization expense for the years ended
December 31, 2014
,
2013
and
2012
was
$2.2 million
,
$2.4 million
and
$2.3 million
, respectively.
93
|
Note 5.
|
Intangible Assets
|
Amortization of intangible assets is recorded using an accelerated method based on the estimated useful life of the core deposit intangible, customer list intangible and insurance agency intangible. Projections of amortization expense are based on existing asset balances and the remaining useful lives.
The trade name intangible is not amortized but is evaluated for impairment annually or whenever events or changes in circumstances indicate that the carrying value may not be recoverable.
No
impairment was recorded on this asset in
2014
,
2013
, or
2012
.
The following table summarizes the amounts and carrying values of intangible assets as of
December 31, 2014
and
2013
:
|
Weighted
|
Gross
|
Unamortized
|
||||||||||||
|
Average
|
Carrying
|
Accumulated
|
Intangible
|
|||||||||||
|
Useful Life
|
Amount
|
Amortization
|
Assets
|
|||||||||||
|
(dollars in thousands)
|
(years)
|
|||||||||||||
|
December 31, 2014
|
||||||||||||||
|
Other intangible assets:
|
||||||||||||||
|
Insurance agency intangible
|
7
|
|
$
|
1,320
|
|
$
|
956
|
|
$
|
364
|
|
|||
|
Core deposit premium
|
4
|
|
5,433
|
|
4,742
|
|
691
|
|
||||||
|
Trade name intangible
|
—
|
|
7,040
|
|
—
|
|
7,040
|
|
||||||
|
Customer list intangible
|
9
|
|
330
|
|
166
|
|
164
|
|
||||||
|
Total
|
$
|
14,123
|
|
$
|
5,864
|
|
$
|
8,259
|
|
|||||
|
December 31, 2013
|
||||||||||||||
|
Other intangible assets:
|
||||||||||||||
|
Insurance agency intangible
|
8
|
|
$
|
1,320
|
|
$
|
850
|
|
$
|
470
|
|
|||
|
Core deposit premium
|
5
|
|
5,433
|
|
4,322
|
|
1,111
|
|
||||||
|
Trade name intangible
|
—
|
|
7,040
|
|
—
|
|
7,040
|
|
||||||
|
Customer list intangible
|
10
|
|
330
|
|
145
|
|
185
|
|
||||||
|
Total
|
$
|
14,123
|
|
$
|
5,317
|
|
$
|
8,806
|
|
|||||
The following table summarizes future amortization expense of intangible assets:
|
Insurance
|
Core
|
Customer
|
|||||||||||||
|
Agency
|
Deposit
|
List
|
|||||||||||||
|
Intangible
|
Premium
|
Intangible
|
Totals
|
||||||||||||
|
(in thousands)
|
|||||||||||||||
|
Year ending December 31,
|
|||||||||||||||
|
2015
|
$
|
89
|
|
$
|
321
|
|
$
|
21
|
|
$
|
431
|
|
|||
|
2016
|
72
|
|
222
|
|
20
|
|
314
|
|
|||||||
|
2017
|
55
|
|
123
|
|
19
|
|
197
|
|
|||||||
|
2018
|
38
|
|
25
|
|
18
|
|
81
|
|
|||||||
|
2019
|
21
|
|
—
|
|
17
|
|
38
|
|
|||||||
|
Thereafter
|
89
|
|
—
|
|
69
|
|
158
|
|
|||||||
|
Total
|
$
|
364
|
|
$
|
691
|
|
$
|
164
|
|
$
|
1,219
|
|
|||
94
|
Note 6.
|
Other Assets
|
The components of the Company’s other assets as of
December 31, 2014
and
2013
were as follows:
|
As of December 31,
|
|||||||
|
2014
|
2013
|
||||||
|
(in thousands)
|
|||||||
|
Federal Home Loan Bank Stock
|
$
|
8,582
|
|
$
|
9,226
|
|
|
|
Prepaid expenses
|
1,350
|
|
1,030
|
|
|||
|
Mortgage servicing rights
|
2,308
|
|
2,298
|
|
|||
|
Accounts receivable & other miscellaneous assets
|
1,835
|
|
2,006
|
|
|||
|
$
|
14,075
|
|
$
|
14,560
|
|
||
The Bank is a member of The Federal Home Loan Bank of Des Moines, and ownership of FHLB stock is a requirement for membership in the FHLB Des Moines. The amount of FHLB stock the Bank is required to hold is directly related to the amount of FHLB advances borrowed. Because this security is not readily marketable and there are no available market values, this security is carried at cost and evaluated for potential impairment each quarter. Redemption of this investment is at the option of the FHLB.
Mortgage servicing rights are recorded at fair value based on assumptions provided by a third-party valuation service. The valuation model incorporates assumptions that market participants would use in estimating future net servicing income, such as the servicing cost per loan, the discount rate, the escrow float rate, an inflation rate, ancillary income, prepayment speeds and default rates and losses.
|
Note 7.
|
Loans Serviced for Others
|
Loans serviced for others are not included in the accompanying consolidated balance sheets. The unpaid principal balances of mortgage and other loans serviced for others were
$370.0 million
and
$362.9 million
at
December 31, 2014
and
2013
, respectively. Servicing loans for others generally consists of collecting mortgage payments, maintaining escrow accounts, disbursing payments to investors and collection and foreclosure processing. Loan servicing income is recorded on the accrual basis and includes servicing fees from investors and certain charges collected from borrowers, such as late payment fees, and is net of fair value adjustments to capitalized mortgage servicing rights.
|
Note 8.
|
Time Deposits
|
Time deposits that meet or exceed the FDIC Insurance limit of $250,000 at
December 31, 2014
was
$150.2 million
.
At
December 31, 2014
, the scheduled maturities of certificates of deposits were as follows:
|
(in thousands)
|
|||
|
2015
|
$
|
267,510
|
|
|
2016
|
127,149
|
|
|
|
2017
|
60,174
|
|
|
|
2018
|
9,004
|
|
|
|
2019
|
9,177
|
|
|
|
Total
|
$
|
473,014
|
|
The Company had
$6.1 million
and
$12.9 million
in brokered time deposits through the CDARS program as of
December 31, 2014
and
December 31, 2013
, respectively. The CDARS program coordinates, on a reciprocal basis, a network of banks to spread deposits exceeding the FDIC insurance coverage limits out to numerous institutions in order to provide insurance coverage for all participating deposits.
|
Note 9.
|
Short-Term Borrowings
|
At
December 31, 2014
and
2013
, the Company had
no
borrowings through the Federal Reserve Discount Window, while the borrowing capacity was
$11.8 million
and
$11.4 million
, respectively. As of
December 31, 2014
, the Bank had
$13.1 million
of municipal securities pledged to the Federal Reserve to secure potential borrowings. The Company also has various other unsecured Federal Funds agreements with correspondent banks. As of
December 31, 2014
and
2013
there were
$17.4 million
and
$5.5 million
borrowings through these correspondent bank federal funds agreements, respectively.
95
Securities sold under repurchase agreements are used by the Company to acquire funds from customers where the customer is required or desires to have its funds supported by collateral consisting of U.S. Treasury securities, U.S. Government agencies or other types of securities. The repurchase agreement is a promise to sell these securities to a customer at a certain price and repurchase them within one to four days after the transaction date at that same price plus interest accrued at an agreed upon rate. As of
December 31, 2014
and
December 31, 2013
, the Company’s balance of securities sold under repurchase agreements was
$60.8 million
and
$61.2 million
, respectively. The weighted average interest rate on these agreements was
0.21%
at
December 31, 2014
and
2013
.
|
Note 10.
|
Federal Home Loan Bank Borrowings and Long-Term Debt
|
As a member of The Federal Home Loan Bank of Des Moines, the Bank may borrow funds from the FHLB in amounts up to
35%
of the Bank’s total assets, provided the Bank is able to pledge an adequate amount of qualified assets to secure the borrowings. Advances from the FHLB are collateralized primarily by 1-4 unit residential, commercial and agricultural real estate first mortgages equal to various percentages of the total outstanding notes. As of
December 31, 2014
, the Bank had
$263.4 million
of collateral pledged to the FHLB. As of
December 31, 2014
and
2013
, Federal Home Loan Bank borrowings were as follows:
|
Rates
|
Amount
|
||||||||||||
|
Minimum
|
Maximum
|
2014
|
2013
|
||||||||||
|
(in thousands)
|
|||||||||||||
|
Due in 2014
|
1.25
|
%
|
to
|
3.40
|
%
|
$
|
—
|
|
$
|
39,900
|
|
||
|
Due in 2015
|
2.06
|
%
|
to
|
3.00
|
%
|
20,000
|
|
20,000
|
|
||||
|
Due in 2016
|
1.13
|
%
|
to
|
2.46
|
%
|
17,000
|
|
17,000
|
|
||||
|
Due in 2017
|
1.09
|
%
|
to
|
2.78
|
%
|
10,000
|
|
10,000
|
|
||||
|
Due in 2018
|
1.30
|
%
|
to
|
1.83
|
%
|
17,000
|
|
5,000
|
|
||||
|
Due in 2019
|
1.42
|
%
|
to
|
1.85
|
%
|
17,000
|
|
10,000
|
|
||||
|
Thereafter
|
1.52
|
%
|
to
|
2.25
|
%
|
12,000
|
|
5,000
|
|
||||
|
Total
|
$
|
93,000
|
|
$
|
106,900
|
|
|||||||
In connection with the Company’s merger with the Former MidWest
One
in March 2008, the Company acquired
$15.5 million
in long-term subordinated debt from the Former Midwest
One
’s issuance of a pooled trust preferred security. The junior subordinated debentures supporting the trust preferred securities have a maturity date of
December 15, 2037
, do not require any principal amortization and became callable on
December 15, 2012
at par, and are callable in whole or in part, on any interest payment date thereafter, at the Company’s option. The interest rate on the trust preferred securities is variable based on the
three-month LIBOR
rate plus
1.59%
with interest payable quarterly. At
December 31, 2014
, the interest rate on the debt was
1.83%
. During
2014
the interest rate ranged from
1.83%
to
1.82%
. Interest expense recorded during
2014
and
2013
was
$0.3 million
.
|
Note 11.
|
Income Taxes
|
Income taxes for the years ended
December 31, 2014
,
2013
and
2012
are summarized as follows:
|
December 31,
|
|||||||||||
|
2014
|
2013
|
2012
|
|||||||||
|
(in thousands)
|
|||||||||||
|
Current:
|
|||||||||||
|
Federal
|
$
|
3,573
|
|
$
|
6,841
|
|
$
|
4,165
|
|
||
|
State
|
956
|
|
1,259
|
|
1,103
|
|
|||||
|
Deferred
|
2,502
|
|
(1,454
|
)
|
(54
|
)
|
|||||
|
Total income tax provision
|
$
|
7,031
|
|
$
|
6,646
|
|
$
|
5,214
|
|
||
96
The income tax provisions for the years ended
December 31, 2014
,
2013
and
2012
were less than the amounts computed by applying the maximum effective federal income tax rate of
35%
for the years ended
December 31, 2014
and
2013
, and
34%
for the year of
2012
, to the income before income taxes because of the following items:
|
2014
|
2013
|
2012
|
|||||||||
|
(in thousands)
|
|||||||||||
|
Expected provision
|
$
|
8,943
|
|
$
|
8,839
|
|
$
|
7,394
|
|
||
|
Tax-exempt interest
|
(2,520
|
)
|
(2,345
|
)
|
(2,213
|
)
|
|||||
|
Bank-owned life insurance
|
(385
|
)
|
(322
|
)
|
(323
|
)
|
|||||
|
State income taxes, net of federal income tax benefit
|
798
|
|
776
|
|
723
|
|
|||||
|
Non-deductible acquisition expenses
|
261
|
|
—
|
|
—
|
|
|||||
|
Other
|
(66
|
)
|
(302
|
)
|
(367
|
)
|
|||||
|
Total income tax provision
|
$
|
7,031
|
|
$
|
6,646
|
|
$
|
5,214
|
|
||
Net deferred tax assets as of
December 31, 2014
and
2013
consisted of the following components:
|
December 31,
|
|||||||
|
2014
|
2013
|
||||||
|
(in thousands)
|
|||||||
|
Deferred income tax assets:
|
|||||||
|
Allowance for loan losses
|
$
|
7,981
|
|
$
|
7,753
|
|
|
|
Deferred compensation
|
1,022
|
|
1,076
|
|
|||
|
Net operating losses
|
3,266
|
|
3,089
|
|
|||
|
Impairment losses on securities
|
53
|
|
2,613
|
|
|||
|
Other real estate owned
|
568
|
|
767
|
|
|||
|
Nonaccrual interest
|
206
|
|
434
|
|
|||
|
Other
|
1,072
|
|
931
|
|
|||
|
Gross deferred tax assets
|
14,168
|
|
16,663
|
|
|||
|
Deferred income tax liabilities:
|
|||||||
|
Premises and equipment depreciation and amortization
|
1,992
|
|
2,012
|
|
|||
|
Federal Home Loan Bank stock
|
132
|
|
132
|
|
|||
|
Purchase accounting adjustments
|
684
|
|
895
|
|
|||
|
Mortgage servicing rights
|
875
|
|
871
|
|
|||
|
Prepaid expenses
|
213
|
|
105
|
|
|||
|
Unrealized gains on investment securities
|
3,234
|
|
620
|
|
|||
|
Deferred loan fees
|
249
|
|
238
|
|
|||
|
Other
|
253
|
|
315
|
|
|||
|
Gross deferred tax liabilities
|
7,632
|
|
5,188
|
|
|||
|
Net deferred income tax asset
|
6,536
|
|
11,475
|
|
|||
|
Valuation allowance
|
3,458
|
|
3,281
|
|
|||
|
Net deferred tax asset
|
$
|
3,078
|
|
$
|
8,194
|
|
|
The Company has recorded a deferred tax asset for the future tax benefits of Iowa net operating loss carry forwards and certain impairment losses on investment securities. The Iowa net operating loss carry forwards amounting to approximately
$38.2 million
will expire in various amounts from
2018
to
2035
. As of
December 31, 2014
and
2013
, the Company believed it was more likely than not that all temporary differences associated with the Iowa corporate tax return, as well as certain impairment and capital losses on securities at the federal and state level, would not be fully realized. Accordingly, the Company has recorded a valuation allowance to reduce the net operating loss carry forwards and certain impairment losses on securities. A valuation allowance related to the remaining deferred tax assets has not been provided because management believes it is more likely than not that the results of future operations will generate sufficient taxable income to realize the deferred tax assets.
The Company had
no
material unrecognized tax benefits as of
December 31, 2014
and
2013
.
97
|
Note 12.
|
Employee Benefit Plans
|
Prior to the Company’s merger with the Former MidWest
One
, the Bank sponsored a noncontributory defined benefit pension plan for substantially all its employees. Effective December 31, 2007, the Bank elected to curtail the plan by limiting this employee benefit to those employees vested as of December 31, 2007. During the second quarter of 2012, the Company completed the liquidation of plan assets and full termination of the plan, including full benefit payout to plan participants. The total amount of the Company’s required contribution to fully fund the plan for liquidation was
$6.1 million
, pre-tax, which is included in Salaries and Employee Benefits expense on the 2012 consolidated statements of operations.
The Company has a salary reduction profit-sharing 401(k) plan covering all employees fulfilling minimum age and service requirements. Employee contributions to the plan are optional. Employer contributions are discretionary and may be made to the plan in an amount equal to a percentage of each participating employee’s salary. The 401(k) contribution expense for this plan totaled
$676,000
,
$647,000
and
$667,000
for the years ended
December 31, 2014
,
2013
and
2012
, respectively.
The Company has an employee stock ownership plan (ESOP) covering all employees fulfilling minimum age and service requirements. Employer contributions are discretionary and may be made to the plan in an amount equal to a percentage of each participating employee’s salary. The ESOP contribution expense for this plan totaled
$538,000
,
$609,000
and
$635,000
for the years ended
December 31, 2014
,
2013
and
2012
, respectively.
The Company has a salary continuation plan for several officers and directors. These plans provide annual payments of various amounts upon retirement or death. The Company accrues the expense for these benefits by charges to operating expense during the period the respective officer or director attains full eligibility. The amount charged to operating expense during the years ended
December 31, 2014
,
2013
and
2012
totaled
$294,000
,
$350,000
and
$359,000
, respectively. To provide the retirement benefits, the Company carries life insurance policies which had cash values totaling
$14.3 million
,
$13.9 million
and
$13.5 million
at
December 31, 2014
,
2013
and
2012
, respectively.
|
Note 13.
|
Stock Compensation Plans
|
The Company maintains the MidWest
One
Financial Group, Inc. 2008 Equity Incentive Plan (the “Plan”) as a means to attract, retain and reward certain designated employees and directors of, and service providers to, the Company and its subsidiaries. Under the terms of the Plan, the Company may grant a total of
750,000
total shares of the Company’s common stock as stock options, stock appreciation rights or stock awards (including restricted stock units) and may also grant cash incentive awards to eligible individuals. As of
December 31, 2014
and
2013
,
492,878
and
514,191
shares, respectively, of the Company’s common stock remained available for future awards under the Plan.
During
2014
, the Company recognized
$493,000
of stock based compensation expense, which consisted of
$493,000
of expense related to restricted stock unit grants and
no
expense related to stock option grants. In comparison, during
2013
, the Company recognized
$384,000
of stock-based compensation expense, which consisted of
$380,000
for restricted stock unit grants and
$4,000
for stock option grants, while total stock-based compensation expense in
2012
was
$266,000
which consisted of
$234,000
for restricted stock unit grants and
$32,000
for stock option grants.
Incentive Stock Options:
The Company is required to estimate the fair value of share-based payment awards on the date of grant using an option-pricing model. The value of the portion of the award that is ultimately expected to vest is recognized as compensation expense in the Company’s consolidated statements of operations over the requisite service periods using a straight-line method. The Company assumes no projected forfeitures on its stock-based compensation, since actual historical forfeiture rates on its stock-based incentive awards have been negligible.
The stock options have a maximum term of ten years, an exercise price equal to the fair market value of a share of stock on the date of grant and vest 25% per year
over
four years
, with the first vesting date being the one-year anniversary of the grant date.
98
The following is a summary of stock option activity for the year ended
December 31, 2014
:
|
Weighted-
|
||||||||||||
|
Average
|
||||||||||||
|
Weighted-
|
Remaining
|
Aggregate
|
||||||||||
|
Average
|
Contractual
|
Intrinsic
|
||||||||||
|
Exercise
|
Term in
|
Value
|
||||||||||
|
Shares
|
Price
|
Years
|
($000)
|
|||||||||
|
Outstanding at December 31, 2013
|
47,590
|
|
$
|
15.66
|
|
|||||||
|
Granted
|
—
|
|
—
|
|
||||||||
|
Exercised
|
(15,419
|
)
|
18.50
|
|
||||||||
|
Forfeited
|
—
|
|
—
|
|
||||||||
|
Expired
|
(1,310
|
)
|
19.50
|
|
||||||||
|
Outstanding at December 31, 2014
|
30,861
|
|
$
|
14.08
|
|
3.10
|
$
|
455
|
|
|||
|
Exercisable at December 31, 2014
|
30,861
|
|
$
|
14.08
|
|
3.10
|
$
|
455
|
|
|||
During
2014
, the Company received
$282,000
of cash from the exercise of stock option awards and recorded a
$8,000
tax benefit from these exercises. Plan participants realized an intrinsic value of
$109,000
from the exercise of these stock options during
2014
. In comparison, Plan participants realized an intrinsic value of
$362,000
and
$278,000
from the exercise of stock options during
2013
and
2012
, respectively. As of
December 31, 2014
, there were
no
remaining compensation costs related to nonvested stock options that have not yet been recognized.
There were
no
stock option awards granted in
2014
,
2013
, or
2012
.
Restricted Stock Units:
Under the Plan, the Company may grant restricted stock unit awards that vest upon the completion of future service requirements or specified performance criteria. The fair value of these awards is equal to the market price of the common stock at the date of the grant. The Company recognizes stock-based compensation expense for these awards over the vesting period, using the straight-line method, based upon the number of awards ultimately expected to vest.
Each restricted stock unit entitles the recipient to receive one share of stock on the vesting date. Generally, for employee awards, the restricted stock units vest 25% per year
over
four years
, with the first vesting date being the one-year anniversary of the grant date, or
100%
upon the death or disability of the recipient, or upon change of control (as defined in the Plan) of the Company. Beginning with the awards granted with an effective date of May 15, 2013, the restricted stock units awarded to directors vest 100%
one year
from the date of the award. Director awards made prior to May 15, 2013 generally vest 25% per year over
four years
. If a participant terminates employment or service prior to the end of the continuous service period, the unearned portion of the stock unit award may be forfeited, at the discretion of the Company’s Compensation Committee. The Company may also issue awards that vest upon satisfaction of specified performance criteria. For these types of awards, the final measure of compensation cost is based upon the number of shares that ultimately vest considering the performance criteria.
The following is a summary of nonvested restricted stock unit activity for the year ended
December 31, 2014
:
|
Weighted-
|
||||||
|
Average
|
||||||
|
Grant-Date
|
||||||
|
Shares
|
Fair Value
|
|||||
|
Nonvested at December 31, 2013
|
52,397
|
|
$
|
18.24
|
|
|
|
Granted
|
26,100
|
|
24.61
|
|
||
|
Vested
|
(27,491
|
)
|
17.02
|
|
||
|
Forfeited
|
(200
|
)
|
19.10
|
|
||
|
Nonvested at December 31, 2014
|
50,806
|
|
$
|
22.17
|
|
|
The fair value of restricted stock unit awards that vested during
2014
was
$792,000
, compared to
$533,000
and
$324,000
during the years ended
December 31, 2013
and
2012
, respectively. As of
December 31, 2014
, the total compensation costs related to nonvested restricted stock units that have not yet been recognized totaled
$740,000
, and the weighted average period over which these costs are expected to be recognized is approximately
2.4 years
.
99
Value Information:
The risk-free interest rate assumption is based upon observed interest rates for the expected term of the Company’s stock options. The expected volatility input into the model takes into account the historical volatility of the Company’s stock over the period that it has been publicly traded or the expected term of the option. The expected dividend yield assumption is based upon the Company’s historical dividend payout determined at the date of grant, if any.
|
Note 14.
|
Earnings per Common Share
|
Basic per-share amounts are computed by dividing net income (the numerator) by the weighted-average number of common shares outstanding (the denominator). Diluted per share amounts assume issuance of all common stock issuable upon conversion or exercise of other securities, unless the effect is to reduce the loss or increase the income per common share from continuing operations.
Following are the calculations for basic and diluted earnings per common share:
|
Year Ended December 31,
|
|||||||||||
|
2014
|
2013
|
2012
|
|||||||||
|
(dollars in thousands, except per share amounts)
|
|||||||||||
|
Basic earnings per common share computation
|
|||||||||||
|
Numerator:
|
|||||||||||
|
Net income
|
$
|
18,522
|
|
$
|
18,607
|
|
$
|
16,534
|
|
||
|
Denominator:
|
|||||||||||
|
Weighted average shares outstanding
|
8,405,284
|
|
8,477,904
|
|
8,485,008
|
|
|||||
|
Basic earnings per common share
|
$
|
2.20
|
|
$
|
2.19
|
|
$
|
1.95
|
|
||
|
Diluted earnings per common share computation
|
|||||||||||
|
Numerator:
|
|||||||||||
|
Net income
|
$
|
18,522
|
|
$
|
18,607
|
|
$
|
16,534
|
|
||
|
Denominator:
|
|||||||||||
|
Weighted average shares outstanding, included all dilutive potential shares
|
8,433,296
|
|
8,525,119
|
|
8,527,544
|
|
|||||
|
Diluted earnings per common share
|
$
|
2.19
|
|
$
|
2.18
|
|
$
|
1.94
|
|
||
|
Note 15.
|
Regulatory Capital Requirements and Restrictions on Subsidiary Cash
|
The Company (on a consolidated basis) and the Bank are subject to various regulatory capital requirements administered by the federal banking agencies. Failure to meet minimum capital requirements can initiate certain mandatory and possibly additional discretionary actions by regulators that, if undertaken, could have a direct material effect on the Company’s and the Bank’s financial statements. Under capital adequacy guidelines and the regulatory framework for prompt corrective action, the Company and the Bank must meet specific capital guidelines that involve quantitative measures of their assets, liabilities and certain off-balance-sheet items as calculated under regulatory accounting practices. The capital amounts and classifications are also subject to qualitative judgments by the regulators about components, risk weightings and other factors. Prompt corrective action provisions are not applicable to bank holding companies. With the implementation of the Basel III Rules, which became effective on January 1, 2015, these capital requirements and the related prompt corrective action provisions, have increased. Based on the Company’s assessment of these new regulations, as of December 31, 2014, the Company and the Bank met the requirements necessary to be classified as well-capitalized under the new regulations.
Quantitative measures established by the regulations in effect on December 31, 2014, to ensure capital adequacy require the Company and the Bank to maintain minimum amounts and ratios (set forth in the table below) of total and Tier 1 capital (as defined in the regulations) to risk-weighted assets (as defined) and of Tier 1 capital (as defined) to average assets (as defined). Management believes, as of
December 31, 2014
and
2013
, that the Company and the Bank met all capital adequacy requirements to which they were subject.
100
As of
December 31, 2014
, the most recent notification from the Federal Deposit Insurance Corporation categorized the Bank as well capitalized under the regulatory framework for prompt corrective action then in effect. To be categorized as well capitalized under those requirements, an institution had to maintain minimum total risk-based, Tier 1 risk-based and Tier 1 leverage ratios as set forth in the table below. There are no conditions or events since the notification that management believes have changed the Bank’s category, and management believes that the Bank will still be well capitalized under the revised requirements of Basel III. Notwithstanding its compliance with the specified regulatory thresholds, however, the Bank’s board of directors, subsequent to December 31, 2008, adopted a capital policy pursuant to which it will maintain a ratio of Tier 1 capital to total assets of 8% or greater, which ratio is greater than the ratio required to be well capitalized under the regulatory framework for prompt corrective action. This capital policy also provides that the Bank will maintain a ratio of total capital to total risk-weighted assets of at least 10%, which is equal to the threshold for being well capitalized under the regulatory framework for prompt corrective action.
A comparison of the Company’s and the Bank’s capital with the corresponding minimum regulatory requirements in effect as of December 31, 2014, is presented below:
|
Actual
|
For Capital Adequacy Purposes
|
To Be Well Capitalized Under Prompt Corrective Action Provisions
|
||||||||||||||||||
|
Amount
|
Ratio
|
Amount
|
Ratio
|
Amount
|
Ratio
|
|||||||||||||||
|
(dollars in thousands)
|
||||||||||||||||||||
|
At December 31, 2014:
|
||||||||||||||||||||
|
Consolidated:
|
||||||||||||||||||||
|
Total capital/risk based
|
$
|
212,559
|
|
14.73
|
%
|
$
|
115,407
|
|
8.00
|
%
|
N/A
|
|
N/A
|
|
||||||
|
Tier 1 capital/risk based
|
194,362
|
|
13.47
|
|
57,703
|
|
4.00
|
|
N/A
|
|
N/A
|
|
||||||||
|
Tier 1 capital/adjusted average
|
194,362
|
|
10.85
|
|
71,647
|
|
4.00
|
|
N/A
|
|
N/A
|
|
||||||||
|
MidWest
One
Bank:
|
||||||||||||||||||||
|
Total capital/risk based
|
$
|
197,018
|
|
13.75
|
%
|
$
|
114,624
|
|
8.00
|
%
|
$
|
143,280
|
|
10.00
|
%
|
|||||
|
Tier 1 capital/risk based
|
179,098
|
|
12.50
|
|
57,312
|
|
4.00
|
|
85,968
|
|
6.00
|
|
||||||||
|
Tier 1 capital/adjusted average
|
179,098
|
|
10.05
|
|
71,249
|
|
4.00
|
|
89,061
|
|
5.00
|
|
||||||||
|
At December 31, 2013:
|
||||||||||||||||||||
|
Consolidated:
|
||||||||||||||||||||
|
Total capital/risk based
|
$
|
200,714
|
|
14.62
|
%
|
$
|
109,812
|
|
8.00
|
%
|
N/A
|
|
N/A
|
|
||||||
|
Tier 1 capital/risk based
|
183,361
|
|
13.36
|
|
54,906
|
|
4.00
|
|
N/A
|
|
N/A
|
|
||||||||
|
Tier 1 capital/adjusted average
|
183,361
|
|
10.55
|
|
69,491
|
|
4.00
|
|
N/A
|
|
N/A
|
|
||||||||
|
MidWest
One
Bank:
|
||||||||||||||||||||
|
Total capital/risk based
|
$
|
183,646
|
|
13.49
|
%
|
$
|
108,903
|
|
8.00
|
%
|
$
|
136,128
|
|
10.00
|
%
|
|||||
|
Tier 1 capital/risk based
|
166,612
|
|
12.24
|
|
54,451
|
|
4.00
|
|
81,677
|
|
6.00
|
|
||||||||
|
Tier 1 capital/adjusted average
|
166,612
|
|
9.65
|
|
69,063
|
|
4.00
|
|
86,329
|
|
5.00
|
|
||||||||
The ability of the Company to pay dividends to its shareholders is dependent upon dividends paid by the Bank to the Company. The Bank is subject to certain statutory and regulatory restrictions on the amount of dividends it may pay. In addition, as previously noted, subsequent to December 31, 2008, the Bank’s board of directors adopted a capital policy requiring it to maintain a ratio of Tier 1 capital to total assets of at least 8% and a ratio of total capital to risk-based capital of at least 10%. Maintenance of these ratios also could limit the ability of the Bank to pay dividends to the Company.
The Bank is required to maintain reserve balances in cash on hand or on deposit with Federal Reserve Banks. Reserve balances totaled
$1.8 million
and
$1.6 million
as of
December 31, 2014
and
2013
, respectively.
|
Note 16.
|
Commitments and Contingencies
|
Financial instruments with off-balance sheet risk
: The Bank is a party to financial instruments with off-balance sheet risk in the normal course of business to meet the financing needs of its customers. These financial instruments include commitments to extend credit and standby letters of credit. These instruments involve, to varying degrees, elements of credit risk in excess of the amount recognized in the balance sheets.
101
The Bank uses the same credit policies in making commitments and conditional obligations as it does for on-balance-sheet instruments. A summary of the Bank’s commitments at
December 31, 2014
and
2013
, is as follows:
|
December 31,
|
|||||||
|
2014
|
2013
|
||||||
|
(in thousands)
|
|||||||
|
Commitments to extend credit
|
$
|
267,036
|
|
$
|
263,887
|
|
|
|
Commitments to sell loans
|
801
|
|
357
|
|
|||
|
Standby letters of credit
|
3,204
|
|
4,491
|
|
|||
|
Total
|
$
|
271,041
|
|
$
|
268,735
|
|
|
The Bank’s exposure to credit loss in the event of nonperformance by the counterparty to the financial instrument for commitments to extend credit is represented by the contractual amount of those instruments. Commitments to extend credit are agreements to lend to a customer as long as there is no violation of any condition established in the contract. Since many of the commitments are expected to expire without being drawn upon, the total commitment amounts do not necessarily represent future cash requirements. The Bank evaluates each customer’s creditworthiness on a case-by-case basis. The amount of collateral obtained, if deemed necessary by the Bank upon extension of credit, is based on management’s credit evaluation of the party. Collateral held varies, but may include accounts receivable, crops, livestock, inventory, property and equipment, residential real estate and income-producing commercial properties.
Commitments to sell loans are agreements to sell loans held for sale to third parties at an agreed upon price.
Standby letters of credit are conditional commitments issued by the Bank to guarantee the performance of a customer to a third party. Those guarantees are primarily issued to support public and private borrowing arrangements and, generally, have terms of one year or less. The credit risk involved in issuing letters of credit is essentially the same as that involved in extending loan facilities to customers. The Bank holds collateral, which may include accounts receivable, inventory, property, equipment and income-producing properties, that support those commitments, if deemed necessary. In the event the customer does not perform in accordance with the terms of the agreement with the third party, the Bank would be required to fund the commitment. The maximum potential amount of future payments the Bank could be required to make is represented by the contractual amount shown in the summary above. If the commitment is funded, the Bank would be entitled to seek recovery from the customer. At both
December 31, 2014
and
2013
, the amount recorded as liabilities for the Bank’s potential obligations under these guarantees was
$0.2 million
.
Building commitments
: The Bank is party to contractual agreements related to certain major building projects entered into in 2013, with a total original estimated cost of
$29.8 million
. As of
December 31, 2014
, an estimated
$15.5 million
remained to be paid on these contracts. The projects are scheduled for completion in 2016.
Contingencies
: In the normal course of business, the Bank is involved in various legal proceedings. In the opinion of management, any liability resulting from such proceedings would not have a material adverse effect on the accompanying consolidated financial statements.
Concentrations of credit risk
: Substantially all of the Bank’s loans, commitments to extend credit and standby letters of credit have been granted to customers in the Bank’s market areas. Although the loan portfolio of the Bank is diversified, approximately
62%
of the loans are real estate loans and approximately
17%
are agriculturally related. The concentrations of credit by type of loan are set forth in Note 3. Commitments to extend credit are primarily related to commercial loans and home equity loans. Standby letters of credit were granted primarily to commercial borrowers. Investments in securities issued by state and political subdivisions involve certain governmental entities within Iowa. The carrying value of investment securities of
Iowa
political subdivisions totaled
$135.3 million
as of
December 31, 2014
. No individual municipality exceeded
$5.0 million
.
|
Note 17.
|
Related Party Transactions
|
Certain directors of the Company and certain principal officers are customers of, and have banking transactions with, the Bank in the ordinary course of business. Such indebtedness has been incurred on substantially the same terms, including interest rates and collateral, as those prevailing at the time for comparable transactions with unrelated persons.
102
The following is an analysis of the changes in the loans to related parties during the years ended
December 31, 2014
and
2013
:
|
Year Ended December 31,
|
|||||||
|
2014
|
2013
|
||||||
|
(in thousands)
|
|||||||
|
Balance, beginning
|
$
|
22,392
|
|
$
|
21,935
|
|
|
|
Net decrease due to change in related parties
|
(10,275
|
)
|
(150
|
)
|
|||
|
Advances
|
2,420
|
|
2,310
|
|
|||
|
Collections
|
(2,882
|
)
|
(1,703
|
)
|
|||
|
Balance, ending
|
$
|
11,655
|
|
$
|
22,392
|
|
|
None of these loans are past due, nonaccrual or restructured to provide a reduction or deferral of interest or principal because of deterioration in the financial position of the borrower. Deposits from these related parties totaled
$6.5 million
and
$7.3 million
as of
December 31, 2014
and
2013
, respectively. Deposits from related parties are accepted subject to the same interest rates and terms as those from nonrelated parties.
The Company has from time to time engaged Neumann Monson, P.C. (“Neumann Monson”), an architectural services firm headquartered in Iowa City for which Kevin Monson, Chairman of the Company, is President, Managing Partner and majority owner, to perform architectural and design services with respect to the Company's offices.
During
2014
and
2013
, the Company paid Neumann Monson
$315,000
and
$2,289,000
, respectively, for such services. The engagement of Neumann Monson to provide the services described was reviewed by our Audit Committee, which also monitors the level of services by Neumann Monson on a periodic basis. Apart from the approval and monitoring process involving the Audit Committee, Neumann Monson was retained in the ordinary course of business and the Company believes that such services are provided to the Company on terms no less favorable than those that would have been realized in transactions with unaffiliated parties.
|
Note 18.
|
Estimated Fair Value of Financial Instruments and Fair Value Measurements
|
Fair value is the price that would be received in selling an asset or paid in transferring a liability in an orderly transaction between market participants. A fair value measurement assumes that the transaction to sell the asset or transfer the liability occurs in the principal market for the asset or liability or, in the absence of a principal market, the most advantageous market for the asset or liability. The price in the principal (or most advantageous) market used to measure the fair value of the asset or liability is not adjusted for transaction costs. An orderly transaction is a transaction that assumes exposure to the market for a period prior to the measurement date to allow for marketing activities that are usual and customary for transactions involving such assets and liabilities; it is not a forced transaction. Market participants are buyers and sellers in the principal market that are (i) independent, (ii) knowledgeable, (iii) able to transact and (iv) willing to transact.
GAAP requires the use of valuation techniques that are consistent with the market approach, the income approach and/or the cost approach. The market approach uses prices and other relevant information generated by market transactions involving identical or comparable assets and liabilities. The income approach uses valuation techniques to convert future amounts, such as cash flows or earnings, to a single present amount on a discounted basis. The cost approach is based on the amount that currently would be required to replace the service capacity of an asset (replacement cost). Valuation techniques should be consistently applied. Inputs to valuation techniques refer to the assumptions that market participants would use in pricing the asset or liability. Inputs may be observable, meaning those that reflect the assumptions market participants would use in pricing the asset or liability developed based on market data obtained from independent sources, or unobservable, meaning those that reflect the reporting entity’s own assumptions about the assumptions market participants would use in pricing the asset or liability developed based on the best information available in the circumstances. In that regard, GAAP establishes a fair value hierarchy for valuation inputs that gives the highest priority to quoted prices in active markets for identical assets or liabilities and the lowest priority to unobservable inputs. The fair value hierarchy is as follows:
|
•
|
Level 1 Inputs
– Unadjusted quoted prices in active markets for identical assets or liabilities that the reporting entity has the ability to access at the measurement date.
|
|
•
|
Level 2 Inputs
– Inputs other than quoted prices included in Level 1 that are observable for the asset or liability, either directly or indirectly. These might include quoted prices for similar assets or liabilities in active markets, quoted prices for identical or similar assets or liabilities in markets that are not active, inputs other than quoted prices that are observable for the asset (such as interest rates, volatilities, prepayment speeds, credit risks, etc.) or inputs that are derived principally from or corroborated by market data by correlation or other means.
|
103
|
•
|
Level 3 Inputs
– Unobservable inputs for determining the fair values of assets or liabilities that reflect an entity’s own assumptions about the assumptions that market participants would use in pricing the assets or liabilities.
|
It is the Company’s policy to maximize the use of observable inputs and minimize the use of unobservable inputs when developing fair value measurements. The Company is required to use observable inputs, to the extent available, in the fair value estimation process unless that data results from forced liquidations or distressed sales. A description of the valuation methodologies used for instruments measured at fair value, as well as the general classification of such instruments pursuant to the valuation hierarchy, is set forth below.
V
aluation methods for instruments measured at fair value on a recurring basis
Securities Available for Sale
- The Company’s investment securities classified as available for sale include: debt securities issued by the U.S. Treasury and other U.S. Government agencies and corporations, debt securities issued by state and political subdivisions, mortgage-backed securities, collateralized mortgage obligations, corporate debt securities, and equity securities. Quoted exchange prices are available for equity securities, which are classified as Level 1. The Company utilizes an independent pricing service to obtain the fair value of debt securities. On a quarterly basis, the Company selects a sample of 30 securities from its primary pricing service and compares them to a secondary independent pricing service to validate value. In addition, the Company periodically reviews the pricing methodology utilized by the primary independent service for reasonableness. Debt securities issued by the U.S. Treasury and other U.S. Government agencies and corporations and mortgage-backed obligations are priced utilizing industry-standard models that consider various assumptions, including time value, yield curves, volatility factors, prepayment speeds, default rates, loss severity, current market and contractual prices for the underlying financial instruments, as well as other relevant economic measures. Substantially all of these assumptions are observable in the marketplace, can be derived from observable data, or are supported by observable levels at which transactions are executed in the marketplace and are classified as Level 2. Municipal securities are valued using a type of matrix, or grid, pricing in which securities are benchmarked against the treasury rate based on credit rating. These model and matrix measurements are classified as Level 2 in the fair value hierarchy. On an annual basis, a group of selected municipal securities are priced by a securities dealer and that price is used to verify the primary independent service’s valuation.
The Company classified its pooled trust preferred CDOs as Level 3 until such securities were sold in the first quarter of 2014. The portfolio consisted of
five
investments in CDOs backed by pools of trust preferred securities issued by financial institutions and insurance companies. The Company had determined that the observable market data associated with these assets did not represent orderly transactions and reflected forced liquidations or distressed sales. Based on the lack of observable market data, the Company estimated fair value based on the observable data available and reasonable unobservable market data. The Company estimated fair value based on a discounted cash flow model which used appropriately adjusted discount rates reflecting credit and liquidity risks.
Mortgage Servicing Rights
- The Company recognizes the rights to service mortgage loans for others on residential real estate loans internally originated and then sold. Mortgage servicing rights are recorded at fair value based on assumptions through a third-party valuation service. The valuation model incorporates assumptions that market participants would use in estimating future net servicing income, such as the servicing cost per loan, the discount rate, the escrow float rate, an inflation rate, ancillary income, prepayment speeds and default rates and losses. Because many of these inputs are unobservable, the valuations are classified as Level 3.
104
The following table summarizes assets measured at fair value on a recurring basis as of
December 31, 2014
and
2013
. There were no liabilities subject to fair value measurement on a recurring basis as of these dates. The assets are segregated by the level of valuation inputs within the fair value hierarchy utilized to measure fair value:
|
|
Fair Value Measurement at December 31, 2014 Using
|
||||||||||||||
|
(in thousands)
|
Total
|
|
Quoted Prices in
Active Markets for
Identical Assets
(Level 1)
|
|
Significant Other
Observable Inputs (Level 2) |
|
Significant
Unobservable
Inputs
(Level 3)
|
||||||||
|
Assets:
|
|
|
|
||||||||||||
|
Available for sale debt securities:
|
|
|
|
||||||||||||
|
U.S. Government agencies and corporations
|
$
|
49,375
|
|
|
$
|
—
|
|
|
$
|
49,375
|
|
|
$
|
—
|
|
|
State and political subdivisions
|
195,199
|
|
|
—
|
|
|
195,199
|
|
|
—
|
|
||||
|
Mortgage-backed securities
|
32,463
|
|
|
—
|
|
|
32,463
|
|
|
—
|
|
||||
|
Collateralized mortgage obligations
|
146,132
|
|
—
|
|
146,132
|
|
—
|
|
|||||||
|
Corporate debt securities
|
48,741
|
|
|
—
|
|
|
48,741
|
|
|
—
|
|
||||
|
Total available for sale debt securities
|
471,910
|
|
|
—
|
|
|
471,910
|
|
|
—
|
|
||||
|
Other equity securities
|
3,032
|
|
|
3,032
|
|
|
—
|
|
|
—
|
|
||||
|
Total securities available for sale
|
$
|
474,942
|
|
|
$
|
3,032
|
|
|
$
|
471,910
|
|
|
$
|
—
|
|
|
Mortgage servicing rights
|
$
|
2,308
|
|
$
|
—
|
|
$
|
—
|
|
$
|
2,308
|
|
|||
|
|
Fair Value Measurement at December 31, 2013 Using
|
||||||||||||||
|
(in thousands)
|
Total
|
|
Quoted Prices in
Active Markets for
Identical Assets
(Level 1)
|
|
Significant
Other
Observable
Inputs
(Level 2)
|
|
Significant
Unobservable
Inputs
(Level 3)
|
||||||||
|
Assets:
|
|
|
|
||||||||||||
|
Available for sale debt securities:
|
|
|
|
||||||||||||
|
U.S. Government agencies and corporations
|
$
|
44,939
|
|
|
$
|
—
|
|
$
|
44,939
|
|
$
|
—
|
|
||
|
State and political subdivisions
|
210,796
|
|
|
—
|
|
210,796
|
|
—
|
|
||||||
|
Mortgage-backed securities
|
39,285
|
|
|
—
|
|
39,285
|
|
—
|
|
||||||
|
Collateralized mortgage obligations
|
169,223
|
|
—
|
|
169,223
|
|
—
|
|
|||||||
|
Corporate debt securities
|
29,944
|
|
|
—
|
|
29,944
|
|
—
|
|
||||||
|
Collateralized debt obligations
|
1,317
|
|
|
—
|
|
—
|
|
1,317
|
|
||||||
|
Total available for sale debt securities
|
495,504
|
|
|
—
|
|
|
494,187
|
|
|
1,317
|
|
||||
|
Other equity securities
|
3,057
|
|
|
3,057
|
|
|
—
|
|
—
|
|
|||||
|
Total securities available for sale
|
$
|
498,561
|
|
|
$
|
3,057
|
|
|
$
|
494,187
|
|
|
$
|
1,317
|
|
|
Mortgage servicing rights
|
$
|
2,298
|
|
$
|
—
|
|
$
|
—
|
|
$
|
2,298
|
|
|||
There were no transfers of assets between levels of the fair value hierarchy during the years ended
December 31, 2014
and
2013
.
There have been no changes in valuation techniques used for any assets measured at fair value during the year ended
December 31, 2014
.
105
The following table presents additional information about assets measured at fair market value on a recurring basis for which the Company has utilized Level 3 inputs to determine fair value for the years ended
December 31, 2014
and
2013
:
|
For the Years Ended December 31,
|
||||||||||||||||
|
2014
|
2013
|
|||||||||||||||
|
|
Collateralized
Debt
Obligations
|
Mortgage
Servicing
Rights
|
Collateralized
Debt
Obligations
|
Mortgage
Servicing
Rights
|
||||||||||||
|
(in thousands)
|
||||||||||||||||
|
Beginning balance
|
$
|
1,317
|
|
$
|
2,298
|
|
$
|
755
|
|
$
|
1,484
|
|
||||
|
Transfers into Level 3
|
—
|
|
—
|
|
—
|
|
—
|
|
||||||||
|
Transfers out of Level 3
|
—
|
|
—
|
|
—
|
|
—
|
|
||||||||
|
Total gains (losses):
|
||||||||||||||||
|
Included in earnings
|
782
|
|
(243
|
)
|
(18
|
)
|
293
|
|
||||||||
|
Included in other comprehensive income
|
794
|
|
—
|
|
822
|
|
—
|
|
||||||||
|
Purchases, issuances, sales, and settlements:
|
||||||||||||||||
|
Purchases
|
—
|
|
—
|
|
—
|
|
—
|
|
||||||||
|
Issuances
|
—
|
|
253
|
|
—
|
|
521
|
|
||||||||
|
Sales
|
(2,893
|
)
|
—
|
|
—
|
|
—
|
|
||||||||
|
Settlements
|
—
|
|
—
|
|
(242
|
)
|
—
|
|
||||||||
|
Ending Balance
|
$
|
—
|
|
$
|
2,308
|
|
$
|
1,317
|
|
$
|
2,298
|
|
||||
In December 2013 the Company was notified by the trustee of one of the collateralized debt obligations it owns that the security was in the process of being liquidated. The Company recorded a receivable for the expected amount of the liquidation payment and wrote-off the book value of the security. The remaining
five
CDOs were sold in the first quarter of 2014 at a net gain of
$0.8 million
.
The following table presents the amount of gains and losses on Level 3 assets noted above which were included in earnings and other comprehensive income for the years ended
December 31, 2014
and
2013
that are attributable to the change in unrealized gains and losses relating to those assets still held, and the line item in the consolidated financial statements in which they are included:
|
For the Years Ended December 31,
|
||||||||||||||||
|
2014
|
2013
|
|||||||||||||||
|
|
Collateralized
Debt
Obligations
|
Mortgage
Servicing
Rights
|
Collateralized
Debt
Obligations
|
Mortgage
Servicing
Rights
|
||||||||||||
|
(in thousands)
|
||||||||||||||||
|
Total gains (losses) for the period in earnings*
|
$
|
—
|
|
$
|
10
|
|
$
|
(18
|
)
|
$
|
814
|
|
||||
|
Change in unrealized losses for the period included in other comprehensive income
|
—
|
|
—
|
|
822
|
|
—
|
|
||||||||
* Losses on collateralized debt obligations are included in gain on sale or call of available for sale securities, while gains on mortgage servicing rights are included in mortgage origination and loan servicing fees, both in the consolidated statements of operations.
Changes in the fair value of available-for-sale securities are included in other comprehensive income to the extent the changes are not considered OTTI. OTTI tests are performed on a quarterly basis and any decline in the fair value of an individual security below its cost that is deemed to be other than temporary results in a write-down that is reflected directly in the Company’s consolidated statements of operations.
Valuation methods for instruments measured at fair value on a nonrecurring basis
Collateral Dependent Impaired Loans
- From time to time, a loan is considered impaired and an allowance for credit losses is established. The specific reserves for collateral dependent impaired loans are based on the fair value of the collateral less estimated costs to sell. The fair value of collateral is determined based on appraisals. In some cases, adjustments are made to the appraised
106
values due to various factors, including age of the appraisal, age of comparables included in the appraisal, and known changes in the market and in the collateral. Because many of these inputs are unobservable, the valuations are classified as Level 3.
Other Real Estate Owned (“OREO”)
- OREO represents property acquired through foreclosures and settlements of loans. Property acquired through or in lieu of foreclosure are initially recorded at fair value less estimated selling cost at the date of foreclosure, establishing a new cost basis. The Company considers third party appraisals as well as independent fair value assessments from real estate brokers or persons involved in selling OREO in determining the fair value of particular properties. Accordingly, the valuation of OREO is subject to significant external and internal judgment. The Company also periodically reviews OREO to determine whether the property continues to be carried at the lower of its recorded book value or fair value of the property, less disposal costs. Because many of these inputs are unobservable, the valuations are classified as Level 3.
107
The following table discloses the Company’s estimated fair value amounts of its financial instruments recorded at fair value on a nonrecurring basis. It is management’s belief that the fair values presented below are reasonable based on the valuation techniques and data available to the Company as of
December 31, 2014
and
2013
, as more fully described above.
|
|
Fair Value Measurement at December 31, 2014 Using
|
||||||||||
|
(in thousands)
|
Total
|
Quoted Prices in
Active Markets for Identical Assets (Level 1) |
Significant Other
Observable Inputs (Level 2) |
Significant
Unobservable
Inputs
(Level 3)
|
|||||||
|
Assets:
|
|||||||||||
|
Collateral dependent impaired loans:
|
|||||||||||
|
Commercial and industrial
|
793
|
|
—
|
|
—
|
|
793
|
|
|||
|
Commercial real estate:
|
|||||||||||
|
Construction and development
|
49
|
|
—
|
|
—
|
|
49
|
|
|||
|
Farmland
|
52
|
|
—
|
|
—
|
|
52
|
|
|||
|
Commercial real estate-other
|
1,012
|
|
—
|
|
—
|
|
1,012
|
|
|||
|
Total commercial real estate
|
1,113
|
|
—
|
|
—
|
|
1,113
|
|
|||
|
Residential real estate:
|
|||||||||||
|
One- to four- family first liens
|
1,427
|
|
—
|
|
—
|
|
1,427
|
|
|||
|
One- to four- family junior liens
|
47
|
|
—
|
|
—
|
|
47
|
|
|||
|
Total residential real estate
|
1,474
|
|
—
|
|
—
|
|
1,474
|
|
|||
|
Consumer
|
32
|
|
—
|
|
—
|
|
32
|
|
|||
|
Collateral dependent impaired loans
|
3,412
|
|
—
|
|
—
|
|
3,412
|
|
|||
|
Other real estate owned
|
1,916
|
|
—
|
|
—
|
|
1,916
|
|
|||
|
Fair Value Measurement at December 31, 2013 Using
|
|||||||||||
|
(in thousands)
|
Total
|
|
Quoted Prices in
Active Markets for Identical Assets (Level 1) |
|
Significant Other
Observable Inputs (Level 2) |
|
Significant
Unobservable Inputs (Level 3) |
||||
|
Assets:
|
|
|
|
||||||||
|
Collateral dependent impaired loans:
|
|||||||||||
|
Commercial and industrial
|
1,043
|
|
—
|
|
—
|
|
1,043
|
|
|||
|
Commercial real estate:
|
|||||||||||
|
Construction and development
|
136
|
|
—
|
|
—
|
|
136
|
|
|||
|
Farmland
|
65
|
|
—
|
|
—
|
|
65
|
|
|||
|
Commercial real estate-other
|
1,786
|
|
—
|
|
—
|
|
1,786
|
|
|||
|
Total commercial real estate
|
1,987
|
|
—
|
|
—
|
|
1,987
|
|
|||
|
Residential real estate:
|
|||||||||||
|
One- to four- family first liens
|
186
|
|
—
|
|
—
|
|
186
|
|
|||
|
One- to four- family junior liens
|
30
|
|
—
|
|
—
|
|
30
|
|
|||
|
Total residential real estate
|
216
|
|
—
|
|
—
|
|
216
|
|
|||
|
Consumer
|
44
|
|
—
|
|
—
|
|
44
|
|
|||
|
Collateral dependent impaired loans
|
3,290
|
|
—
|
|
—
|
|
3,290
|
|
|||
|
Other real estate owned
|
1,770
|
|
|
—
|
|
|
—
|
|
|
1,770
|
|
108
The following presents the carrying amount and estimated fair value of the financial instruments held by the Company at
December 31, 2014
and
2013
. The information presented is subject to change over time based on a variety of factors. The operations of the Company are managed on a going concern basis and not a liquidation basis. As a result, the ultimate value realized from the financial instruments presented could be substantially different when actually recognized over time through the normal course of operations. Additionally, a substantial portion of the Company’s inherent value is the Bank’s capitalization and franchise value. Neither of these components has been given consideration in the presentation of fair values below.
|
|
December 31, 2014
|
||||||||||||||||||
|
|
Carrying
Amount
|
Estimated
Fair Value
|
Quoted Prices in Active Markets for Identical Assets (Level 1)
|
Significant Other Observable Inputs (Level 2)
|
Significant Unobservable Inputs
(Level 3)
|
||||||||||||||
|
(in thousands)
|
|||||||||||||||||||
|
Financial assets:
|
|||||||||||||||||||
|
Cash and cash equivalents
|
$
|
23,409
|
|
$
|
23,409
|
|
$
|
23,409
|
|
$
|
—
|
|
$
|
—
|
|
||||
|
Investment securities:
|
|||||||||||||||||||
|
Available for sale
|
474,942
|
|
474,942
|
|
3,032
|
|
471,910
|
|
—
|
|
|||||||||
|
Held to maturity
|
51,524
|
|
51,253
|
|
—
|
|
51,253
|
|
—
|
|
|||||||||
|
Total investment securities
|
526,466
|
|
526,195
|
|
3,032
|
|
523,163
|
|
—
|
|
|||||||||
|
Loans held for sale
|
801
|
|
812
|
|
—
|
|
—
|
|
812
|
|
|||||||||
|
Loans, net:
|
|||||||||||||||||||
|
Agricultural
|
103,193
|
|
102,927
|
|
—
|
|
—
|
|
102,927
|
|
|||||||||
|
Commercial and industrial
|
297,048
|
|
295,886
|
|
—
|
|
—
|
|
295,886
|
|
|||||||||
|
Credit cards
|
1,206
|
|
1,206
|
|
—
|
|
—
|
|
1,206
|
|
|||||||||
|
Overdrafts
|
610
|
|
610
|
|
—
|
|
—
|
|
610
|
|
|||||||||
|
Commercial real estate:
|
|||||||||||||||||||
|
Construction and development
|
58,665
|
|
58,764
|
|
—
|
|
—
|
|
58,764
|
|
|||||||||
|
Farmland
|
82,888
|
|
83,285
|
|
—
|
|
—
|
|
83,285
|
|
|||||||||
|
Multifamily
|
54,516
|
|
54,356
|
|
—
|
|
—
|
|
54,356
|
|
|||||||||
|
Commercial real estate-other
|
225,605
|
|
225,899
|
|
—
|
|
—
|
|
225,899
|
|
|||||||||
|
Total commercial real estate
|
421,674
|
|
422,304
|
|
—
|
|
—
|
|
422,304
|
|
|||||||||
|
Residential real estate:
|
|||||||||||||||||||
|
One- to four- family first liens
|
216,338
|
|
216,326
|
|
—
|
|
—
|
|
216,326
|
|
|||||||||
|
One- to four- family junior liens
|
52,821
|
|
53,664
|
|
—
|
|
—
|
|
53,664
|
|
|||||||||
|
Total residential real estate
|
269,159
|
|
269,990
|
|
—
|
|
—
|
|
269,990
|
|
|||||||||
|
Consumer
|
23,266
|
|
23,362
|
|
—
|
|
—
|
|
23,362
|
|
|||||||||
|
Total loans, net
|
1,116,156
|
|
1,116,285
|
|
—
|
|
—
|
|
1,116,285
|
|
|||||||||
|
Loan pool participations, net
|
19,332
|
|
19,332
|
|
—
|
|
—
|
|
19,332
|
|
|||||||||
|
Accrued interest receivable
|
10,898
|
|
10,898
|
|
10,898
|
|
—
|
|
—
|
|
|||||||||
|
Federal Home Loan Bank stock
|
8,582
|
|
8,582
|
|
—
|
|
8,582
|
|
—
|
|
|||||||||
|
Mortgage servicing rights
|
2,308
|
|
2,308
|
|
—
|
|
—
|
|
2,308
|
|
|||||||||
|
Financial liabilities:
|
|||||||||||||||||||
|
Deposits:
|
|||||||||||||||||||
|
Non-interest-bearing demand
|
214,461
|
|
214,461
|
|
214,461
|
|
—
|
|
—
|
|
|||||||||
|
Interest-bearing checking
|
618,540
|
|
618,540
|
|
618,540
|
|
—
|
|
—
|
|
|||||||||
|
Savings
|
102,527
|
|
102,527
|
|
102,527
|
|
—
|
|
—
|
|
|||||||||
|
Certificates of deposit under $100,000
|
235,395
|
|
235,401
|
|
—
|
|
235,401
|
|
—
|
|
|||||||||
|
Certificates of deposit $100,000 and over
|
237,619
|
|
238,480
|
|
—
|
|
238,480
|
|
—
|
|
|||||||||
|
Total deposits
|
1,408,542
|
|
1,409,409
|
|
935,528
|
|
473,881
|
|
—
|
|
|||||||||
|
Federal funds purchased and securities sold under agreements to repurchase
|
78,229
|
|
78,229
|
|
78,229
|
|
—
|
|
—
|
|
|||||||||
|
Federal Home Loan Bank borrowings
|
93,000
|
|
93,051
|
|
—
|
|
—
|
|
93,051
|
|
|||||||||
|
Long-term debt
|
15,464
|
|
10,021
|
|
—
|
|
—
|
|
10,021
|
|
|||||||||
|
Accrued interest payable
|
863
|
|
863
|
|
863
|
|
—
|
|
—
|
|
|||||||||
109
|
|
December 31, 2013
|
||||||||||||||||||
|
|
Carrying
Amount
|
Estimated
Fair Value
|
Quoted Prices in Active Markets for Identical Assets (Level 1)
|
Significant Other Observable Inputs (Level 2)
|
Significant Unobservable Inputs
(Level 3)
|
||||||||||||||
|
(in thousands)
|
|||||||||||||||||||
|
Financial assets:
|
|||||||||||||||||||
|
Cash and cash equivalents
|
$
|
24,890
|
|
$
|
24,890
|
|
$
|
24,890
|
|
$
|
—
|
|
$
|
—
|
|
||||
|
Investment securities:
|
|||||||||||||||||||
|
Available for sale
|
498,561
|
|
498,561
|
|
3,057
|
|
494,187
|
|
1,317
|
|
|||||||||
|
Held to maturity
|
32,625
|
|
30,191
|
|
—
|
|
30,191
|
|
—
|
|
|||||||||
|
Total investment securities
|
531,186
|
|
528,752
|
|
3,057
|
|
524,378
|
|
1,317
|
|
|||||||||
|
Loans held for sale
|
357
|
|
367
|
|
—
|
|
—
|
|
367
|
|
|||||||||
|
Loans, net:
|
|||||||||||||||||||
|
Agricultural
|
95,712
|
|
95,609
|
|
—
|
|
—
|
|
95,609
|
|
|||||||||
|
Commercial and industrial
|
257,153
|
|
256,257
|
|
—
|
|
—
|
|
256,257
|
|
|||||||||
|
Credit cards
|
998
|
|
998
|
|
—
|
|
—
|
|
998
|
|
|||||||||
|
Overdrafts
|
415
|
|
415
|
|
—
|
|
—
|
|
415
|
|
|||||||||
|
Commercial real estate:
|
|||||||||||||||||||
|
Construction and development
|
71,433
|
|
71,569
|
|
—
|
|
—
|
|
71,569
|
|
|||||||||
|
Farmland
|
84,387
|
|
85,058
|
|
—
|
|
—
|
|
85,058
|
|
|||||||||
|
Multifamily
|
54,883
|
|
54,953
|
|
—
|
|
—
|
|
54,953
|
|
|||||||||
|
Commercial real estate-other
|
217,993
|
|
219,213
|
|
—
|
|
—
|
|
219,213
|
|
|||||||||
|
Total commercial real estate
|
428,696
|
|
430,793
|
|
—
|
|
—
|
|
430,793
|
|
|||||||||
|
Residential real estate:
|
|||||||||||||||||||
|
One- to four- family first liens
|
217,765
|
|
218,257
|
|
—
|
|
—
|
|
218,257
|
|
|||||||||
|
One- to four- family junior liens
|
52,903
|
|
53,798
|
|
—
|
|
—
|
|
53,798
|
|
|||||||||
|
Total residential real estate
|
270,668
|
|
272,055
|
|
—
|
|
—
|
|
272,055
|
|
|||||||||
|
Consumer
|
18,591
|
|
18,638
|
|
—
|
|
—
|
|
18,638
|
|
|||||||||
|
Total loans, net
|
1,072,233
|
|
1,074,765
|
|
—
|
|
—
|
|
1,074,765
|
|
|||||||||
|
Loan pool participations, net
|
25,533
|
|
25,533
|
|
—
|
|
—
|
|
25,533
|
|
|||||||||
|
Accrued interest receivable
|
10,409
|
|
10,409
|
|
10,409
|
|
—
|
|
—
|
|
|||||||||
|
Federal Home Loan Bank stock
|
9,226
|
|
9,226
|
|
—
|
|
9,226
|
|
—
|
|
|||||||||
|
Financial liabilities:
|
|||||||||||||||||||
|
Deposits:
|
|||||||||||||||||||
|
Non-interest bearing demand
|
222,359
|
|
222,359
|
|
222,359
|
|
—
|
|
—
|
|
|||||||||
|
Interest-bearing checking
|
592,673
|
|
592,673
|
|
592,673
|
|
—
|
|
—
|
|
|||||||||
|
Savings
|
94,559
|
|
94,559
|
|
94,559
|
|
—
|
|
—
|
|
|||||||||
|
Certificates of deposit under $100,000
|
256,283
|
|
256,549
|
|
—
|
|
256,549
|
|
—
|
|
|||||||||
|
Certificates of deposit $100,000 and over
|
209,068
|
|
209,543
|
|
—
|
|
209,543
|
|
—
|
|
|||||||||
|
Total deposits
|
1,374,942
|
|
1,375,683
|
|
909,591
|
|
466,092
|
|
—
|
|
|||||||||
|
Federal funds purchased and securities sold under agreements to repurchase
|
66,665
|
|
66,665
|
|
66,665
|
|
—
|
|
—
|
|
|||||||||
|
Federal Home Loan Bank borrowings
|
106,900
|
|
107,356
|
|
—
|
|
—
|
|
107,356
|
|
|||||||||
|
Long-term debt
|
15,464
|
|
9,872
|
|
—
|
|
—
|
|
9,872
|
|
|||||||||
|
Accrued interest payable
|
765
|
|
765
|
|
765
|
|
—
|
|
—
|
|
|||||||||
|
•
|
Cash and cash equivalents, federal funds purchased, securities sold under repurchase agreements, and accrued interest are instruments with carrying values that approximate fair value.
|
|
•
|
Investment securities available for sale are measured at fair value on a recurring basis. Held to maturity securities are carried at amortized cost. Fair value is based upon quoted prices, if available. If a quoted price is not available, the fair value is obtained from benchmarking the security against similar securities by using a third-party pricing service.
|
110
|
•
|
Loans held for sale are carried at the lower of cost or fair value, with fair value being based on recent observable loan sales. The portfolio has historically consisted primarily of residential real estate loans.
|
|
•
|
For variable-rate loans that reprice frequently and with no significant change in credit risk, fair values are based on carrying values. The fair values for other loans are determined using estimated future cash flows, discounted at the interest rates currently being offered for loans with similar terms to borrowers with similar credit quality. The Company does record nonrecurring fair value adjustments to loans to reflect (1) partial write-downs and allowances that are based on the observable market price or appraised value of the collateral or (2) the full charge-off of the loan carrying value.
|
|
•
|
Loan pool participation carrying values represent the discounted price paid by us to acquire our participation interests in the various loan pool participations purchased, which approximates fair value.
|
|
•
|
The fair value of FHLB stock is estimated at its carrying value and redemption price of
$100
per share.
|
|
•
|
Deposit liabilities are carried at historical cost. The fair value of demand deposits, savings accounts and certain money market account deposits is the amount payable on demand at the reporting date. The fair value of fixed maturity certificates of deposit is estimated using the rates currently offered for deposits of similar remaining maturities. If the fair value of the fixed maturity certificates of deposit is calculated at less than the carrying amount, the carrying value of these deposits is reported as the fair value.
|
|
•
|
FHLB borrowings and long-term debt are recorded at historical cost. The fair value of these items is estimated using discounted cash flow analysis, based on the Company's current incremental borrowing rates for similar types of borrowing arrangements.
|
The following presents the valuation technique(s), observable inputs, and quantitative information about the unobservable inputs used for fair value measurements of the financial instruments held by the Company at
December 31, 2014
, categorized within Level 3 of the fair value hierarchy:
|
|
Quantitative Information About Level 3 Fair Value Measurements
|
||||||||||||||
|
(dollars in thousands)
|
Fair Value at December 31, 2014
|
Valuation Techniques(s)
|
Unobservable Input
|
Range of Inputs
|
Weighted Average
|
||||||||||
|
Collateral dependent impaired loans:
|
|||||||||||||||
|
Commercial and industrial
|
793
|
|
Modified appraised value
|
Third party appraisal
|
NM *
|
|
NM *
|
|
NM *
|
|
|||||
|
Appraisal discount
|
NM *
|
|
NM *
|
|
NM *
|
|
|||||||||
|
Construction & development
|
49
|
|
Modified appraised value
|
Third party appraisal
|
NM *
|
|
NM *
|
|
NM *
|
|
|||||
|
Appraisal discount
|
NM *
|
|
NM *
|
|
NM *
|
|
|||||||||
|
Farmland
|
52
|
|
Modified appraised value
|
Third party appraisal
|
NM *
|
|
NM *
|
|
NM *
|
|
|||||
|
Appraisal discount
|
NM *
|
|
NM *
|
|
NM *
|
|
|||||||||
|
Commercial real estate-other
|
1,012
|
|
Modified appraised value
|
Third party appraisal
|
NM *
|
|
NM *
|
|
NM *
|
|
|||||
|
Appraisal discount
|
NM *
|
|
NM *
|
|
NM *
|
|
|||||||||
|
Residential real estate one- to four-
|
1,427
|
|
Modified appraised value
|
Third party appraisal
|
NM *
|
|
NM *
|
|
NM *
|
|
|||||
|
family first liens
|
Appraisal discount
|
NM *
|
|
NM *
|
|
NM *
|
|
||||||||
|
Residential real estate one- to four-
|
47
|
|
Modified appraised value
|
Third party appraisal
|
NM *
|
|
NM *
|
|
NM *
|
|
|||||
|
family junior liens
|
Appraisal discount
|
NM *
|
|
NM *
|
|
NM *
|
|
||||||||
|
Consumer
|
32
|
|
Modified appraised value
|
Third party appraisal
|
NM *
|
|
NM *
|
|
NM *
|
|
|||||
|
Appraisal discount
|
NM *
|
|
NM *
|
|
NM *
|
|
|||||||||
|
Mortgage servicing rights
|
2,308
|
|
Discounted cash flows
|
Constant prepayment rate
|
7.49
|
%
|
15.24
|
%
|
8.64
|
%
|
|||||
|
Pretax discount rate
|
10.00
|
%
|
13.00
|
%
|
10.16
|
%
|
|||||||||
|
Other real estate owned
|
1,916
|
|
Modified appraised value
|
Third party appraisal
|
NM *
|
|
NM *
|
|
NM *
|
|
|||||
|
Appraisal discount
|
NM *
|
|
NM *
|
|
NM *
|
|
|||||||||
* Not Meaningful. Third party appraisals are obtained as to the value of the underlying asset, but disclosure of this information would not provide meaningful information, as the range will vary widely from loan to loan. Types of discounts considered include age of the appraisal, local market conditions, current condition of the property, and estimated sales costs. These discounts will also vary from loan to loan, thus providing a range would not be meaningful.
Changes in assumptions or estimation methodologies may have a material effect on these estimated fair values.
|
Note 19.
|
Variable Interest Entities
|
The Company has invested in certain participation certificates of loan pools which are purchased, held and serviced by the third-party independent servicing corporation. The Company’s portfolio holds approximately
95%
of participation interests in the pools
111
of loans owned and serviced by States Resources Corporation (“SRC”), a third-party loan servicing organization in Omaha, Nebraska, in which the Company participates. SRC’s owner holds the remaining interest. The Company does not have any ownership interest in or exert any control over SRC, and thus it is not included in the consolidated financial statements.
These pools of loans were purchased from large nonaffiliated banking organizations and from the FDIC acting as receiver of failed banks and savings associations. As loan pools were put out for bid (generally in a sealed bid auction), SRC’s due diligence teams evaluated the loans and determined their interest in bidding on the pool. After the due diligence, the Company’s management reviewed this information and decided if it wished to continue in the process. If the decision to consider a bid was made, SRC conducted additional analysis to determine the appropriate bid price. This analysis involved discounting loan cash flows with adjustments made for expected losses and changes in collateral values as well as targeted rates of return. A cost or investment basis was assigned to each individual loan on a cents-per-dollar (discounted price) basis based on SRC’s assessment of the recovery potential of each loan.
Once a bid was awarded to SRC, the Company assumed the risk of profit or loss but on a non-recourse basis so the risk is limited to its initial investment. The extent of the risk is also dependent upon: the debtor or guarantor’s financial condition, the possibility that a debtor or guarantor may file for bankruptcy protection, SRC’s ability to locate any collateral and obtain possession, the value of such collateral, and the length of time it takes to realize the recovery either through collection procedures, legal process, or resale of the loans after a restructure.
Loan pool participations are shown on the Company’s consolidated balance sheets as a separate asset category. The original carrying value or investment basis of loan pool participations is the discounted price paid by the Company to acquire its interests, which, as noted, is less than the face amount of the underlying loans. The Company’s investment basis is reduced as SRC recovers principal on the loans and remits its share to the Company or as loan balances are written off as uncollectible.
|
Note 20.
|
Proposed Merger
|
On November 20, 2014, the Company entered into merger agreement with
Central Bancshares, Inc.
("Central"), a Minnesota corporation, pursuant to which Central will merge with and into the Company. In connection with the merger, Central Bank, a Minnesota-chartered commercial bank and wholly-owned subsidiary of Central, will become a wholly-owned subsidiary of the Company. The merger is contingent upon the approval of the Company’s shareholders, regulators and certain customary closing conditions. The corporate headquarters of the combined company will be in Iowa City, Iowa.
Simultaneously with the execution of the merger agreement, the Company entered into a Shareholder Agreement with the John M. Morrison Revocable Trust #4, the holder of all of the outstanding shares of Central common stock, CBS LLC , the holder of all outstanding preferred securities of CBI Capital Trust III, Riverbank Insurance Center, Inc., the holder of all outstanding Class A units of Central Insurance Agency, LLC and John M. Morrison, an individual with common control over the above named entities. The merger is anticipated to be completed in the second quarter of 2015.
Subject to the terms and conditions of the merger agreement, each share of common stock of Central will automatically be converted into the right to receive a pro rata portion of (i)
2,723,083
shares of common stock of the Company and (ii)
$64.0 million
in cash, subject to certain adjustments as described in the merger agreement.
For further information, please refer to the Current Report on Form 8-K filed by the Company with the SEC on November 21, 2014.
112
|
Note 21.
|
Parent Company Only Financial Information
|
The following is condensed financial information of MidWest
One
Financial Group, Inc. as of
December 31, 2014
and
2013
(parent company only):
|
As of December 31,
|
|||||||
|
2014
|
2013
|
||||||
|
(in thousands)
|
|||||||
|
Balance Sheets
|
|||||||
|
Assets:
|
|||||||
|
Cash
|
$
|
5,942
|
|
$
|
5,781
|
|
|
|
Investment in subsidiaries
|
193,600
|
|
177,190
|
|
|||
|
Marketable equity securities, available for sale
|
2,066
|
|
2,111
|
|
|||
|
Loan pool participations, net
|
1,964
|
|
3,409
|
|
|||
|
Income tax receivable
|
—
|
|
75
|
|
|||
|
Deferred income taxes
|
425
|
|
729
|
|
|||
|
Other assets
|
5,010
|
|
4,447
|
|
|||
|
Total assets
|
$
|
209,007
|
|
$
|
193,742
|
|
|
|
Liabilities and Shareholders’ Equity
|
|||||||
|
Liabilities:
|
|||||||
|
Long-term debt
|
$
|
15,464
|
|
$
|
15,464
|
|
|
|
Other liabilities
|
812
|
|
262
|
|
|||
|
Total liabilities
|
16,276
|
|
15,726
|
|
|||
|
Shareholders’ equity:
|
|||||||
|
Capital stock, preferred
|
—
|
|
—
|
|
|||
|
Capital stock, common
|
8,690
|
|
8,690
|
|
|||
|
Additional paid-in capital
|
80,537
|
|
80,506
|
|
|||
|
Treasury stock
|
(6,945
|
)
|
(3,702
|
)
|
|||
|
Retained earnings
|
105,127
|
|
91,473
|
|
|||
|
Accumulated other comprehensive income
|
5,322
|
|
1,049
|
|
|||
|
Total shareholders’ equity
|
192,731
|
|
178,016
|
|
|||
|
Total liabilities and shareholders’ equity
|
$
|
209,007
|
|
$
|
193,742
|
|
|
The following is condensed financial information of MidWest
One
Financial Group, Inc. as of
December 31, 2014
,
2013
, and
2012
(parent company only):
|
Year Ended December 31,
|
|||||||||||
|
2014
|
2013
|
2012
|
|||||||||
|
(in thousands)
|
|||||||||||
|
Statements of Income
|
|||||||||||
|
Dividends received from subsidiaries
|
$
|
8,500
|
|
$
|
4,006
|
|
$
|
5,520
|
|
||
|
Interest income and dividends on marketable equity securities
|
49
|
|
33
|
|
168
|
|
|||||
|
Interest and discount on loan pool participations
|
(293
|
)
|
(940
|
)
|
(2,149
|
)
|
|||||
|
Investment securities gains
|
—
|
|
—
|
|
381
|
|
|||||
|
Interest on long-term debt
|
(281
|
)
|
(296
|
)
|
(656
|
)
|
|||||
|
Operating expenses
|
(2,351
|
)
|
(1,034
|
)
|
(1,064
|
)
|
|||||
|
Income before income taxes and equity in subsidiaries’ undistributed income
|
5,624
|
|
1,769
|
|
2,200
|
|
|||||
|
Income tax benefit
|
(807
|
)
|
(890
|
)
|
(1,355
|
)
|
|||||
|
Income before equity in subsidiaries’ undistributed income
|
6,431
|
|
2,659
|
|
3,555
|
|
|||||
|
Equity in subsidiaries’ undistributed income
|
12,091
|
|
15,948
|
|
12,979
|
|
|||||
|
Net income
|
$
|
18,522
|
|
$
|
18,607
|
|
$
|
16,534
|
|
||
113
The following is condensed financial information of MidWest
One
Financial Group, Inc. as of
December 31, 2014
,
2013
, and
2012
(parent company only):
|
Year Ended December 31,
|
|||||||||||
|
2014
|
2013
|
2012
|
|||||||||
|
(in thousands)
|
|||||||||||
|
Statements of Cash Flows
|
|||||||||||
|
Cash flows from operating activities:
|
|||||||||||
|
Net income
|
$
|
18,522
|
|
$
|
18,607
|
|
$
|
16,534
|
|
||
|
Adjustments to reconcile net income to net cash provided by operating activities:
|
|||||||||||
|
Undistributed (earnings) loss of subsidiaries, net of dividends and distributions
|
(12,091
|
)
|
(15,948
|
)
|
(12,979
|
)
|
|||||
|
Deferred income taxes
|
330
|
|
(583
|
)
|
(106
|
)
|
|||||
|
Investment securities gain
|
—
|
|
—
|
|
(381
|
)
|
|||||
|
Stock based compensation
|
493
|
|
384
|
|
266
|
|
|||||
|
Increase in other assets
|
(488
|
)
|
(232
|
)
|
(158
|
)
|
|||||
|
Increase (decrease) in other liabilities
|
550
|
|
(15
|
)
|
4
|
|
|||||
|
Net cash provided by operating activities
|
7,316
|
|
2,213
|
|
3,180
|
|
|||||
|
Cash flows from investing activities
|
|||||||||||
|
Proceeds from sales of investment securities
|
2
|
|
2
|
|
1,131
|
|
|||||
|
Purchase of investment securities
|
(29
|
)
|
(24
|
)
|
(1,192
|
)
|
|||||
|
Loan participation pools, net
|
1,445
|
|
2,719
|
|
5,834
|
|
|||||
|
Net cash provided by investing activities
|
1,418
|
|
2,697
|
|
5,773
|
|
|||||
|
Cash flows from financing activities:
|
|||||||||||
|
Stock options exercised
|
282
|
|
320
|
|
590
|
|
|||||
|
Repurchase of common stock
|
(3,987
|
)
|
(967
|
)
|
(1,810
|
)
|
|||||
|
Dividends paid
|
(4,868
|
)
|
(4,259
|
)
|
(3,054
|
)
|
|||||
|
Net cash used in financing activities
|
(8,573
|
)
|
(4,906
|
)
|
(4,274
|
)
|
|||||
|
Increase in cash
|
161
|
|
4
|
|
4,679
|
|
|||||
|
Cash Balance:
|
|||||||||||
|
Beginning
|
5,781
|
|
5,777
|
|
1,098
|
|
|||||
|
Ending
|
$
|
5,942
|
|
$
|
5,781
|
|
$
|
5,777
|
|
||
|
Note 22.
|
Segment Reporting
|
The Company’s activities are considered to be a single industry segment for financial reporting purposes. The Company is engaged in the business of commercial and retail banking, investment management and insurance services with operations throughout central and eastern Iowa. Substantially all income is derived from a diverse base of commercial, mortgage and retail lending activities, loan pools and investments.
|
Note 23.
|
Subsequent Events
|
Management evaluated subsequent events through the date the consolidated financial statements were issued. Events or transactions occurring after
December 31, 2014
, but prior to the date the consolidated financial statements were issued, that provided additional evidence about conditions that existed at
December 31, 2014
have been recognized in the consolidated financial statements for the period ended
December 31, 2014
. Events or transactions that provided evidence about conditions that did not exist at
December 31, 2014
, but arose before the consolidated financial statements were issued, have not been recognized in the consolidated financial statements for the period ended
December 31, 2014
. Because the merger with Central is not projected to close until the second quarter of 2015, none of the financial statements reflect any information relating to that transaction.
On
January 21, 2015
, the board of directors of the Company declared a cash dividend of
$0.15
per share payable on
March 16, 2015
to shareholders of record as of the close of business on
February 27, 2015
.
114
|
Note 24.
|
Quarterly Results of Operations (unaudited)
|
|
Three Months Ended
|
|||||||||||||||
|
December 31
|
September 30
|
June 30
|
March 31
|
||||||||||||
|
(in thousands, except per share amounts)
|
|||||||||||||||
|
2014
|
|||||||||||||||
|
Interest income
|
$
|
16,311
|
|
$
|
15,996
|
|
$
|
16,176
|
|
$
|
15,921
|
|
|||
|
Interest expense
|
2,407
|
|
2,429
|
|
2,321
|
|
2,394
|
|
|||||||
|
Net interest income
|
13,904
|
|
13,567
|
|
13,855
|
|
13,527
|
|
|||||||
|
Provision for loan losses
|
300
|
|
150
|
|
300
|
|
450
|
|
|||||||
|
Noninterest income
|
3,534
|
|
4,006
|
|
3,556
|
|
4,217
|
|
|||||||
|
Noninterest expense
|
11,563
|
|
10,819
|
|
10,639
|
|
10,392
|
|
|||||||
|
Income before income taxes
|
5,575
|
|
6,604
|
|
6,472
|
|
6,902
|
|
|||||||
|
Income tax expense
|
1,668
|
|
1,715
|
|
1,719
|
|
1,929
|
|
|||||||
|
Net income
|
$
|
3,907
|
|
$
|
4,889
|
|
$
|
4,753
|
|
$
|
4,973
|
|
|||
|
Net income per common share - basic
|
$
|
0.46
|
|
$
|
0.59
|
|
$
|
0.56
|
|
$
|
0.59
|
|
|||
|
Net income per common share - diluted
|
$
|
0.46
|
|
$
|
0.59
|
|
$
|
0.56
|
|
$
|
0.58
|
|
|||
|
2013
|
|||||||||||||||
|
Interest income
|
$
|
16,020
|
|
$
|
16,116
|
|
$
|
16,768
|
|
$
|
17,190
|
|
|||
|
Interest expense
|
2,723
|
|
2,851
|
|
3,159
|
|
3,399
|
|
|||||||
|
Net interest income
|
13,297
|
|
13,265
|
|
13,609
|
|
13,791
|
|
|||||||
|
Provision for loan losses
|
300
|
|
250
|
|
600
|
|
200
|
|
|||||||
|
Noninterest income
|
3,234
|
|
3,800
|
|
3,713
|
|
3,981
|
|
|||||||
|
Noninterest expense
|
10,225
|
|
10,283
|
|
10,585
|
|
10,994
|
|
|||||||
|
Income before income taxes
|
6,006
|
|
6,532
|
|
6,137
|
|
6,578
|
|
|||||||
|
Income tax expense
|
1,584
|
|
1,668
|
|
1,606
|
|
1,788
|
|
|||||||
|
Net income
|
$
|
4,422
|
|
$
|
4,864
|
|
$
|
4,531
|
|
$
|
4,790
|
|
|||
|
Net income per common share - basic
|
$
|
0.52
|
|
$
|
0.57
|
|
$
|
0.54
|
|
$
|
0.56
|
|
|||
|
Net income per common share - diluted
|
$
|
0.52
|
|
$
|
0.57
|
|
$
|
0.53
|
|
$
|
0.56
|
|
|||
|
I
TEM
9.
|
C
HANGES IN AND
D
ISAGREEMENTS WITH
A
CCOUNTANTS ON
A
CCOUNTING AND
F
INANCIAL
D
ISCLOSURE
.
|
None.
|
I
TEM
9A.
|
C
ONTROLS AND
P
ROCEDURES
.
|
Disclosure Controls and Procedures
The Company’s management, including the Chief Executive Officer and Chief Financial Officer, evaluated the Company’s disclosure controls and procedures (as defined in Rule 13a-15(e) or Rule 15d-15(e) under the Exchange Act) that are designed to ensure that information required to be disclosed by the Company in the reports that it files or submits under the Exchange Act is recorded, processed, summarized and reported within the time periods specified in the SEC’s rules and forms, and that such information is accumulated and communicated to the Company’s management, including the Company’s Chief Executive Officer and Chief Financial Officer, to evaluate the effectiveness of the Company’s disclosure controls and procedures as of
December 31, 2014
. Based on this evaluation, the Chief Executive Officer and Chief Financial Officer have concluded that the Company’s disclosure controls and procedures are effective.
115
Changes in Internal Control over Financial Reporting
There were no changes in the Company’s internal controls over financial reporting (as defined in Rule 13a-15(f) and Rule 15d-15(f) under the Exchange Act) that occurred during the quarter ended
December 31, 2014
that have materially affected or are reasonably likely to materially affect the Company’s internal control over financial reporting.
Management’s Annual Report on Internal Control over Financial Reporting
Management of the Company is responsible for establishing and maintaining effective internal control over financial reporting. Internal control is designed to provide reasonable assurance to the Company’s management and board of directors regarding the preparation of reliable published financial statements. Internal control over financial reporting includes self-monitoring mechanisms, and actions are taken to correct deficiencies as they are identified.
Because of inherent limitations in any system of internal control, no matter how well designed, misstatements due to error or fraud may occur and not be detected, including the possibility of the circumvention or overriding of controls. Accordingly, even effective internal control over financial reporting can provide only reasonable assurance with respect to financial statement preparation. Further, because of changes in conditions, internal control effectiveness may vary over time.
Management assessed the Company’s internal control over financial reporting as of
December 31, 2014
. This assessment was based on criteria for effective internal control over financial reporting described in
Internal Control-Integrated Framework (2013)
issued by the Committee of Sponsoring Organizations of the Treadway Commission. Based on this assessment, the Chief Executive Officer and Chief Financial Officer assert that the Company maintained effective internal control over financial reporting as of
December 31, 2014
based on the specified criteria.
The effectiveness of the Company’s internal control over financial reporting as of
December 31, 2014
, has been audited by McGladrey LLP, the independent registered public accounting firm who also has audited the Company’s consolidated financial statements included in this Annual Report on Form 10-K. McGladrey LLP’s report on the Company’s internal control over financial reporting appears on the following page.
116
Report of Independent Registered Public Accounting Firm
The Board of Directors and Shareholders
MidWest
One
Financial Group, Inc.
We have audited MidWest
One
Financial Group, Inc. and subsidiaries’ internal control over financial reporting as of
December 31, 2014
, based on criteria established in
Internal Control - Integrated Framework
issued by the Committee of Sponsoring Organizations of the Treadway Commission in 2013. MidWest
One
Financial Group, Inc. and subsidiaries’ management is responsible for maintaining effective internal control over financial reporting included in the accompanying Management’s Annual Report on Internal Control over Financial Reporting. Our responsibility is to express an opinion on the company’s internal control over financial reporting based on our audit.
We conducted our audit in accordance with the standards of the Public Company Accounting Oversight Board (United States). Those standards require that we plan and perform the audit to obtain reasonable assurance about whether effective internal control over financial reporting was maintained in all material respects. Our audit included obtaining an understanding of internal control over financial reporting, assessing the risk that a material weakness exists, and testing and evaluating the design and operating effectiveness of internal control based on the assessed risk. Our audit also included performing such other procedures as we considered necessary in the circumstances. We believe that our audit provides a reasonable basis for our opinion.
A company’s internal control over financial reporting is a process designed to provide reasonable assurance regarding the reliability of financial reporting and the preparation of financial statements for external purposes in accordance with generally accepted accounting principles. A company’s internal control over financial reporting includes those policies and procedures that (a) pertain to the maintenance of records that, in reasonable detail, accurately and fairly reflect the transactions and dispositions of the assets of the company; (b) provide reasonable assurance that transactions are recorded as necessary to permit preparation of financial statements in accordance with generally accepted accounting principles, and that receipts and expenditures of the company are being made only in accordance with authorizations of management and directors of the company; and (c) provide reasonable assurance regarding prevention or timely detection of unauthorized acquisition, use, or disposition of the company’s assets that could have a material effect on the financial statements.
Because of its inherent limitations, internal control over financial reporting may not prevent or detect misstatements. Also, projections of any evaluation of effectiveness to future periods are subject to the risk that controls may become inadequate because of changes in conditions, or that the degree of compliance with the policies or procedures may deteriorate.
In our opinion, MidWest
One
Financial Group, Inc. and subsidiaries maintained, in all material respects, effective internal control over financial reporting as of
December 31, 2014
, based on criteria established in
Internal Control - Integrated Framework
issued by the Committee of Sponsoring Organizations of the Treadway Commission in 2013.
We also have audited, in accordance with the standards of the Public Company Accounting Oversight Board (United States), the consolidated balance sheet of MidWest
One
Financial Group, Inc. and subsidiaries as of
December 31, 2014
, and the related consolidated statement of operations, comprehensive income, shareholders’ equity, and cash flows for the year ended
December 31, 2014
, and our report dated
March 5, 2015
expressed an unqualified opinion.
/s/ McGladrey LLP
Cedar Rapids, Iowa
March 5, 2015
117
|
I
TEM
9B.
|
O
THER
I
NFORMATION
.
|
None.
|
I
TEM
10.
|
D
IRECTORS
, E
XECUTIVE
O
FFICERS AND
C
ORPORATE
G
OVERNANCE
.
|
Except as described below, all directors will hold office for the terms indicated, or until their earlier death, resignation, removal or disqualification, and until their respective successors are duly elected and qualified. Except as described with respect to Mr. Funk under “EXECUTIVE COMPENSATION-Potential Payments Upon Termination or Change in Control-Employment Agreements and Change of Control Agreements,” there are no arrangements or understandings between any of the directors or executive officers and any other person pursuant to which any of our directors or executive officers have been selected for their respective positions. No member of the board of directors or executive officer is related to any other nominee, appointee, member of the board of directors or executive officer. No director has been a director of another “public corporation” (i.e., subject to the reporting requirements of the Securities Exchange Act of 1934, as amended, or the “Exchange Act”) or of any investment company within the past five years.
|
Term Expiring 2015
|
|||||||
|
Director
|
|||||||
|
Name of Individual
|
Since
|
Position with MidWest
One
Financial
|
|||||
|
Richard R. Donohue
|
2008
(1)
|
Director of MidWest
One
Financial & the Bank
|
|||||
|
Patricia A. Heiden
|
2014
|
Director of MidWestOne Financial & the Bank
|
|||||
|
Richard J. Schwab
|
2013
|
Director of MidWest
One
Financial & the Bank
|
|||||
|
Stephen L. West
|
1991
|
Director of MidWest
One
Financial & the Bank
|
|||||
|
(1)
|
Mr. Donohue became a director of the Company upon completion of the merger with the former MidWest
One
Financial Group, Inc. on March 14, 2008. He had been a director of the former MidWest
One
Financial since 1999.
|
||||||
|
Term Expiring 2016
|
||||||
|
Director
|
||||||
|
Name of Individual
|
Since
|
Position with MidWest
One
Financial
|
||||
|
Robert J. Latham
|
2011
|
Director of MidWest
One
Financial & the Bank
|
||||
|
Tracy S. McCormick
|
2011
|
Director of MidWest
One
Financial
|
||||
|
Kevin W. Monson
|
2005
|
Chairman of MidWest
One
Financial & the Bank
|
||||
|
John P. Pothoven
|
2009
|
Director of MidWest
One
Financial & the Bank
|
||||
|
Term Expiring 2017
|
|||||||
|
Director
|
|||||||
|
Name of Individual
|
Since
|
Position with MidWest
One
Financial
|
|||||
|
Charles N. Funk
|
2000
|
Director, President and Chief Executive Officer of MidWest
One
Financial and the Bank
|
|||||
|
Barbara J. Kniff-McCulla
|
2010
|
Director of MidWest
One
Financial & the Bank
|
|||||
|
William N. Ruud
|
2013
|
Director of MidWest
One
Financial
|
|||||
|
R. Scott Zaiser
|
2008
(1)
|
Director of MidWest
One
Financial & the Bank
|
|||||
|
(1)
|
Mr. Zaiser became a director of the Company upon completion of the merger with the former MidWest
One
Financial Group, Inc. on March 14, 2008. He had been a director of the former MidWest
One
Financial since 2006.
|
||||||
Richard R. Donohue.
Mr. Donohue, 65, is the former Managing Partner of TD&T CPAs and Advisors, P.C. in Cedar Rapids, Iowa, a certified public accounting firm in which he was involved in all phases of the practice. Mr. Donohue joined the board of directors of the former MidWest
One
Financial in 1999. He became a director of the Company upon completion of our merger with the former MidWest
One
Financial in March 2008. Mr. Donohue was appointed to the board of directors of the Bank in 2009. We consider Mr. Donohue to be a qualified candidate for service on the board, the Audit Committee, and the Nominating
118
and Corporate Governance Committee due to his business and financial accounting expertise acquired as the managing partner of a certified public accounting firm, as well as his knowledge of and prominence in our market area.
Charles N. Funk
. Mr. Funk, 60, is the President and Chief Executive Officer of MidWest
One
Financial and the Bank. He joined the Bank in these same roles in November 2000. Prior to that, he held positions as President and Central Region Manager and Chief Investment Officer for Brenton Bank-Des Moines. Mr. Funk currently serves on the faculty of the Colorado Graduate School of Banking in Boulder, Colorado, and the Iowa School of Banking. Previously, he taught for the Stonier Graduate School of Banking at Georgetown University. He also serves on the board of directors of Iowa SourceMedia Group and of the American Bankers Association, and was the Chairman of the Iowa Bankers Association in 2010 - 2011. Mr. Funk graduated with a B.A. from William Jewell College. We consider Mr. Funk to be a qualified candidate for service on the board due to his extensive expertise in the financial services industry, particularly in the state of Iowa, and intimate knowledge of MidWest
One
Financial’s business and operations and because of his role as the President and Chief Executive Officer of MidWest
One
Financial and the Bank.
Patricia A. Heiden.
Ms. Heiden, 61, is the Executive Director of Oaknoll Retirement Residence, an independent living, assisted living, and nursing home facility located in Iowa City, Iowa. Ms. Heiden became a director of the Company and the Bank in April 2014. We consider Ms. Heiden to be a qualified candidate for service on the board and the Nominating and Corporate Governance Committee due to her skills and expertise acquired as the executive director of a retirement community in the Iowa City market.
Barbara J. Kniff-McCulla.
Ms. Kniff-McCulla, 58, is the owner and Chief Executive Officer of KLK Construction of Pella, Iowa, which is a contractor in the telecommunications industry. Ms. Kniff-McCulla became a director of the former MidWest
One
Bank in 2005, of the Bank in August 2008 and of the Company in December 2010. We consider Ms. Kniff-McCulla to be a qualified candidate for service on the board and the Compensation Committee due to her skills and expertise acquired in founding and running a successful small business.
Robert J. Latham.
Mr. Latham, 72, is the Chairman and President of Latham & Associates, Inc. in Cedar Rapids, Iowa, a utility analysis and consulting company, and is an economic and strategic analyst for the utility industry, with over 30 years of experience. Mr. Latham became a director of MidWest
One
Financial and the Bank in 2011. He previously served on the board of directors of First National Bank in Iowa City, Iowa. He currently serves as Chairman of the Board of Peoples Trust and Savings Bank in Clive, Iowa. We consider Mr. Latham to be a qualified candidate for service on the board and the Compensation Committee due to his skills and expertise developed as a successful utility industry analyst, and his knowledge of and experience in the banking industry.
Tracy S. McCormick.
Ms. McCormick, 54, is a retired Vice President in investment banking for J.P. Morgan & Co., Incorporated. Ms. McCormick is the daughter of our former Chairman and current Director Emeritus, W. Richard Summerwill, and became a director of MidWest
One
Financial in 2011 following his retirement from the board. Ms. McCormick was educated at the University of Michigan and the London School of Economics and Political Science. We consider Ms. McCormick to be a qualified candidate for service on the board and the Audit Committee due to her skills and expertise developed in investment banking.
Kevin W. Monson
. Mr. Monson, 63, is the Chairman of the Company and the Bank. He is the President, Managing Partner and largest shareholder of Neumann Monson, Inc., an architectural services firm headquartered in Iowa City. He became a director of the Company and the Bank in 2005. Mr. Monson is also the majority partner in Tower Partners, a real estate investment partnership. We consider Mr. Monson to be a qualified candidate for service on the board due to his skills and expertise developed as the head of a successful architectural firm, and his knowledge of and prominence in the Iowa City market.
John P. Pothoven.
Mr. Pothoven, 72, is a retired executive of the Company and the Bank and their predecessors. Mr. Pothoven joined our board of directors in January 2009. He was a director of the former MidWest
One
Financial from 1994 to 2008 and a director of the former MidWest
One
Bank from 1976 until its merger with the Bank in August 2008. He also served as President and Chief Executive Officer of the former MidWest
One
Bank from 1984 until its merger with the Bank in August 2008 and as Chairman of the former MidWest
One
Bank from 1998 to 2005. We consider Mr. Pothoven to be a qualified candidate for service on the board due to his expertise in the financial services industry and intimate knowledge of MidWest
One
Financial’s business, operations, and market areas resulting from his long tenure as an executive of the former MidWest
One
Bank.
William N. Ruud.
Dr. Ruud, 62, is the president of the University of Northern Iowa, located in Cedar Falls, Iowa. Dr. Ruud became a director of the Company in September 2013. We consider Dr. Ruud to be a qualified candidate for service on the board and the Compensation Committee due to his skills and expertise acquired as the president of a large public educational
119
institution, as well as his past service on the board of directors of First Interstate Bank Corporation, Southern Idaho (now Wells Fargo) from 1994-1997.
Richard J. Schwab.
Mr. Schwab, 63, is a self-employed entrepreneur, angel fund investor, real estate investor and business owner, and is also a certified public accountant. He became a director of the Company in July 2013. Mr. Schwab was a director of the Company from 2004 to 2008, and has been a director of the Bank since 20
04.
We consider Mr. Schwab to be a qualified candidate for service on the board and the Audit Committee and Nominating and Corporate Governance Committee due to his skills and expertise developed as an entrepreneur, and his knowledge of and prominence in the Iowa City market.
Stephen L. West
. Mr. West, 69, is the majority owner and Chairman of West Music Company Inc., a musical instrument and supply store headquartered in Coralville, Iowa. He has been a director of the Company and the Bank since 1991. Mr. West is also the Treasurer of Accent LLC, a private-label musical instruments company, and the President of WestInvest, L.C., a family investment vehicle. We consider Mr. West to be a qualified candidate for service on the board, the Compensation Committee, and the Nominating and Corporate Governance Committee due to his skills and expertise acquired in positions of leadership at several institutions in MidWest
One
Financial’s market areas.
R. Scott Zaiser
. Mr. Zaiser, 54, is the President of Zaiser’s Landscaping, Inc. in Burlington, Iowa, which is a landscaping company specializing in the design and installation of landscaping for residential and commercial properties in southeastern Iowa and west central Illinois. Mr. Zaiser became a director of the former MidWest
One
Bank in 2000 and became a director of the former MidWest
One
Financial in 2006. He became a director of the Company upon completion of our merger with the former MidWest
One
Financial in March 2008, and a director of the Bank in 2011. We consider Mr. Zaiser to be a qualified candidate for service on the board and the Audit Committee due to his skills and expertise acquired as the president of a successful small business, as well as his knowledge of the Burlington market.
In addition, Mr. W. Richard Summerwill, who had served on our board of directors since our formation in 1983 and served as our long-time Chief Executive Officer prior to our merger with the former MidWest
One
Financial in March 2008, and Mr. John S. Koza, who also had served on our board of directors since our formation in 1983 and retired from the board in 2014, both currently serve as a non-voting Directors Emeriti.
Finally, in addition to the executive officers discussed above, the following individuals serve as executive officers of MidWest
One
Financial:
Susan R. Evans.
Ms. Evans, 57, is the Chief Operating Officer of the Company and the Bank. Ms. Evans joined MidWest
One
Financial in 2001 as Vice President-Retail Banking of the Bank, and was appointed to her current role as Chief Operating Officer in August 2009. She has more than thirty years of banking experience, previously serving as Indianola Market President of Brenton Bank, Des Moines, as well as Retail Market and Sales Manager for U.S. Bank, Des Moines.
Kent L. Jehle
. Mr. Jehle, 55, is the Executive Vice President and Chief Credit Officer of the Company and the Bank. He became the Company’s Executive Vice President and Chief Credit Officer upon consummation of our merger with the former MidWest
One
Financial in March 2008. Prior to the merger, Mr. Jehle had been serving as the Bank’s Executive Vice President-Commercial Banking since 2004. He has been with the Company and the Bank since 1986.
Gary J. Ortale
. Mr. Ortale, 64, is our Executive Vice President and Chief Financial Officer. He was appointed to such position in May 2009, after serving as our Interim Chief Financial Officer since January 2009. Prior to that time, he was the Senior Vice President and Chief Risk Officer of the Bank, a position he assumed upon consummation of our merger with the former MidWest
One
Financial in March 2008. Prior to the merger, Mr. Ortale had been serving as the Treasurer of the Company and the Senior Vice President-Chief Financial Officer of the Bank since 2002. He began with the Company and the Bank as its Vice President and Controller in 1987. Mr. Ortale has a B.S. in accounting from Drake University.
James M. Cantrell.
Mr. Cantrell, 55, is Vice President and Chief Risk Officer of the Company and Senior Vice President and Chief Risk Officer of the Bank. He joined the Company in July 2009, and was appointed to his current position. Prior to joining the Bank, he had been with Provident Bank in Baltimore, Maryland, since 2008, where he served as Senior Vice President and Director of Treasury Operations. In that capacity, he was responsible for management of asset/liability activities, investment portfolio accounting, and derivative activity and compliance. Prior to that, he was employed as the Senior Vice President and Treasurer of Mercantile-Safe Deposit and Trust Company in Baltimore, Maryland, where he had been employed since 2001. Mr. Cantrell has a B.A. in business and economics from Wittenberg University.
120
Audit Committee
In
2014
, the Audit Committee was comprised of Messrs. Donohue (Chairman), Schwab, and Zaiser and Ms. McCormick, each of whom is considered to be “independent” under Nasdaq listing rules and the regulations of the SEC. It is anticipated that the composition of the Audit Committee will remain the same throughout
2015
.The board of directors has determined that Mr. Donohue qualifies as an “audit committee financial expert” under the regulations of the SEC. The board has based this determination on Mr. Donohue’s education and his professional experience as the former managing partner of a certified public accounting firm.
The functions performed by the Audit Committee include, among other things, the following:
|
•
|
overseeing our accounting and financial reporting;
|
|
•
|
selecting, appointing and overseeing our independent registered public accounting firm;
|
|
•
|
reviewing actions by management on recommendations of the independent registered public accounting firm and internal auditors;
|
|
•
|
meeting with management, the internal auditors and the independent registered public accounting firm to review the effectiveness of our system of internal controls and internal audit procedures; and
|
|
•
|
reviewing reports of bank regulatory agencies and monitoring management’s compliance with recommendations contained in those reports.
|
To promote independence of the audit function, the Audit Committee consults separately and jointly with our independent registered public accounting firm, the internal auditors and management. We have adopted a written charter for the committee, which sets forth its duties and responsibilities. The current charter is available on our website at
www.midwestone.com
. In
2014
, the committee met
fourteen
times.
Compensation Committee
During the early part of 2014, through the time of our annual shareholder meeting, the Compensation Committee of MidWest
One
Financial Group Inc. (“MidWest
One
Financial”) was comprised of Messrs. West (Chairman), Latham, Wersen and Ms. Kniff-McCulla. Upon Mr. Wersen’s retirement from the board of directors in April 2014, Director William Ruud was appointed to MidWest
One
’s Compensation Committee and has served on the Committee since that time. Each individual served as an “independent” director as defined by Nasdaq listing requirements, an “outside” director pursuant to Section 162(m) of the Internal Revenue Code and a “non-employee” director under Section 16 of the Securities Exchange Act of 1934. In this section, the term “Committee” refers to the Compensation Committee of our Board of Directors.
The Committee reviews the performance of our Chief Executive Officer, Charles N. Funk, and determines the salary and bonus paid to him. It also reviews and determines the salaries and bonuses paid to our other Named Executive Officers (“NEOs”). The Committee relies upon Mr. Funk’s assessment of each NEO’s individual performance, which considers, as applicable, the executive’s efforts in achieving his or her individual goals each year, the executive’s success in managing and developing employees, and the executive’s role in fostering and enhancing mutually beneficial relationships with customers. Individual goals for NEOs are established by Mr. Funk in consultation with each executive officer. The goals consider, and are intended to focus the executive’s efforts on, the strategic and financial objectives of the Company. Other members of senior management also provide the Committee with evaluations as to employee performance, guidance on establishing performance targets and objectives, and recommends salary and bonus levels and various equity incentive awards. The Committee also consults with management on matters relative to executive compensation and benefit plans where board or shareholder action is expected, including the adoption of new plans or the amendment of existing plans, and also works with management with respect to new or amended compensation-related policies. No executive officer participates in any recommendation, discussion, or decision with respect to his or her own compensation or benefits. Further, the Committee administers our equity incentive plans, our long-term incentive plans and our executive incentive bonus plans and, as a result, has ultimate responsibility for interpretation and oversight of those plans.
The Committee’s duties, responsibilities, and functions are further described in its charter. The Committee reviews its charter at least annually. It then recommends approval of the charter to the Company’s Board of Directors. The Committee’s charter is available on our website,
www.midwestone.com
. You may also request a copy of the charter in writing, addressed to the Compensation Committee Secretary at MidWest
One
Bank, 102 South Clinton Street, PO Box 1700, Iowa City, IA 52244-1700.
The charter gives the Committee the authority to hire outside consultants and independent advisors to further its objectives and responsibilities. For the last several years and again in 2015, the Committee has retained the independent compensation
121
consultant services of F.W. Cook & Co., Chicago, Illinois, to provide expertise and serve as a resource with respect to current market activities involving executive compensation practices and procedures, and also to help analyze our executive compensation practices and procedures. F.W. Cook & Co. provides no other services to the company and the Committee believes F.W. Cook & Co. is independent as determined under applicable Nasdaq guidance.
The Committee met
four
times during 2014. Mr. West also met as needed with internal staff members and members of management to assimilate compensation information.
Nominating and Corporate Governance Committee
We also have a Nominating and Corporate Governance Committee. In 2014, the members of the committee were Messrs.Schwab (Chairman), Donohue, and West and Ms. Heiden, each of whom is considered “independent” under Nasdaq listing rules. It is anticipated that the composition of the Nominating and Corporate Governance Committee will remain the same throughout 2015. The primary purposes of the committee are to identify and recommend individuals to serve on our board of directors and to review and monitor our policies, procedures and structure as they relate to corporate governance. We have adopted a written charter for the committee, which sets forth its duties and responsibilities. The current charter is available on our website at
www.midwestone.com
. In 2014, the committee met
two
times.
Code of Ethics
We have a code of conduct in place that applies to all of our directors, officers and employees. The code sets forth the standard of ethics that we expect all of our directors, officers and employees to follow, including our Chief Executive Officer and Chief Financial Officer. The Code of Business Conduct and Ethics is posted on our website at www.midwestonefinancial.com. We intend to satisfy the disclosure requirements under Item 5.05(c) of Form 8-K regarding any amendment to or waiver of the code with respect to our Chief Executive Officer and Chief Financial Officer, and persons performing similar functions, by posting such information on our website.
SECTION 16(a) BENEFICIAL OWNERSHIP REPORTING COMPLIANCE
Section 16(a) of the Exchange Act requires that our executive officers, directors and persons who own more than 10% of our common stock file reports of ownership and changes in ownership with the SEC. They are also required to furnish us with copies of all Section 16(a) forms they file. Based solely on our review of the copies of such forms and, if appropriate, representations made to us by any reporting person concerning whether a Form 5 was required to be filed for
2014
, we are not aware that any of our directors, executive officers or 10% shareholders failed to comply with the filing requirements of Section 16(a) during
2014
, except as follows:
|
Name
|
Position Held
|
Late or Unfiled Report
|
||
|
Charles N. Funk
|
Director, President and Chief Executive Officer
|
Form 4 filed late
|
||
|
John P. Pothoven
|
Director
|
Form 4 filed late
|
||
SHAREHOLDER COMMUNICATIONS WITH THE BOARD AND
NOMINATION AND PROPOSAL PROCEDURES
General Communications with the Board
Shareholders may contact MidWest
One
Financial’s board of directors by contacting the Corporate Secretary at MidWest
One
Financial Group, Inc., 102 South Clinton Street, P.O. Box 1700, Iowa City, Iowa 52244-1700 or (319) 356-5800. All communications will be forwarded directly to either the Chairman of the Board, the chairman of the Audit Committee or the Chief Executive Officer, as appropriate, unless they are primarily commercial in nature or related to an improper or irrelevant topic.
Nominations for Director
Our procedures by which shareholders can nominate directors to our board did not change during the year ended
December 31, 2014
.
122
|
I
TEM
11.
|
E
XECUTIVE
C
OMPENSATION
.
|
COMPENSATION DISCUSSION AND ANALYSIS
Introduction
This Compensation Discussion & Analysis (“CD&A”) describes MidWest
One
Financial’s compensation philosophy and policies as applicable to the NEOs listed in the Summary Compensation Table on page
131
. This CD&A is intended to explain the structure and rationale associated with each material element of the executives’ total compensation, and it provides important context for the more detailed disclosure tables and specific compensation amounts provided following this CD&A.
It is important to understand that MidWest
One
Financial and MidWest
One
Bank share an executive management team. The members of the executive management team, including the NEOs, are compensated by the Bank, not by MidWest
One
Financial. The compensation packages of the NEOs are determined and approved by the Compensation Committee based on the executives’ performance and roles for both MidWest
One
Financial and MidWest
One
Bank.
The Compensation Committee engaged the services of F.W. Cook & Co., an independent compensation consultant, to provide expertise and serve as a resource as the committee continually evaluates and analyzes our executive compensation program. In connection with its work for the committee during
2014
, F.W. Cook assisted the committee with identifying an effective peer group of financial institutions in the Midwestern United States. The peer group companies were identified based on asset size, economic factors, and geographical area. Following a customary annual review of peer group companies, a change in early 2014 was made by replacing CFS Bancorp, which was acquired by First Merchants Corporation, with Isabella Bank Corp. The peer group included the following organizations in
2014
:
|
• Bank Mutual Corporation, Milwaukee, WI
|
• Horizon Bancorp, Michigan City, IN
|
||
|
• BankFinancial Corporation, Burr Ridge, IL
|
• Isabella Bank Corp., Mt. Pleasant, MI
|
||
|
• Baylake Corp., Sturgeon Bay, WI
|
• Lakeland Financial Corporation, Warsaw, IN
|
||
|
• Enterprise Financial Services Corp., Clayton, MO
|
• MainSource Financial Group, Inc., Greensburg, IN
|
||
|
• First Financial Corporation, Terra Haute, IN
|
• MutualFirst Financial, Inc., Muncie, IN
|
||
|
• First Mid-Illinois Bancshares, Inc., Mattoon, IL
|
• QCR Holdings, Inc., Moline, IL
|
||
|
• German American Bancorp, Inc., Jasper, IN
|
• Waterstone Financial, Inc., Wauwatosa, WI
|
||
|
• Hawthorn Bancshares, Inc., Lees Summit, MO
|
• West Bancorporation, West Des Moines, IA
|
||
|
• Hills Bancorporation, Hills, IA
|
|||
Named Executive Officers
Throughout this CD&A, and in the Summary Compensation Table that follows, we refer to our NEOs. With respect to
2014
, the NEOs of MidWest
One
Financial are Charles N. Funk, our President and Chief Executive Officer, Susan R. Evans, our Chief Operating Officer, Kent L. Jehle, our Executive Vice President and Chief Credit Officer, Gary J. Ortale, our Executive Vice President and Chief Financial Officer, and James M. Cantrell, our Vice President and Chief Risk Officer.
Our
2014
Performance
MidWest
One
Financial achieved considerable success during 2014 by recording net income of $18.5 million or diluted earnings per share of $2.19. After adjusting for merger-related expenses, earnings for the year totaled $19.5 million, which was a fourth consecutive year of record earnings. The adjusted diluted earnings per share was $2.31. Financial trends were very positive for the Company with a return on assets of 1.05% and a return on average tangible common equity of 10.61%. The Company’s management has continued to target the efficiency ratio as a key component of measuring operating performance and the efficiency ratio has held relatively stable at 58.74% at MidWest
One
Financial and, more importantly, at 54.59% for MidWest
One
Bank. Asset quality improved slightly during the year with non-performing loans in the bank loan portfolio falling to 1.15% of total bank loans. Net charged-off loans were an exceptional 0.09% of total loans. Capital levels remain very strong with tangible common equity to total assets rising to 10.29% at year-end. The profitability and asset quality metrics rank in the top eight and top seven, respectively, of the bank’s peer group.
123
2014 Say-On-Pay
We received approximately 97% of votes cast in support of our executive compensation program during the 2014 annual shareholders meeting. MidWest
One
Financial, the Board and the Committee pay careful attention to communications received from shareholders, including the results of these nonbinding, advisory say-on-pay votes. The Compensation Committee considered the results of the advisory vote, but not for specific 2014 compensation decisions. The Committee believes that the vote reflects our shareholders’ support of our compensation philosophy and the manner in which we compensate our NEOs. As such, the Committee did not alter our compensation philosophy as a result of the 2014 vote.
Regulatory Impact on Compensation
As a publicly-traded financial institution, MidWest
One
Financial must contend with several often overlapping layers of regulations when considering and implementing compensation-related decisions. Although these regulations do not set specific parameters within which compensation decisions must be made, MidWest
One
Financial and the Committee continue to be mindful of the risks that correlate with compensation programs designed to incentivize the achievement of targeted performance. As the regulatory focus on risk assessment has been heightened over the last several years, the incorporation of ongoing concepts of risk assessment into compensation decisions continues to be a key focus of the Committee in its decision making.
The Committee, with the assistance of its advisors and company management, continues to monitor the status of compensation-related rules and regulations expected to be finalized or issued under the Dodd-Frank Act. The Committee expects such regulatory activity to continue and remains attentive to its obligations with respect to our compensation programs. The Committee intends to maintain its readiness to adopt any future compensation programs which fully comply with such additional rules and regulations when finalized or issued.
In addition to the foregoing, as a publicly-traded corporation, MidWest
One
Financial is also subject to the SEC's rules regarding risk assessment. These rules require a publicly-traded company to determine whether the structure and terms of its existing incentive compensation programs pose risks which are reasonably likely to have a material adverse effect on the Company. We do not believe that our programs pose risks that are reasonably likely to have a material adverse effect on MidWest
One
Financial.
The Committee continues to take a prudent approach to the design and administration of its compensation practices by attempting to balance risk and reward when setting goals and objectives for MidWest
One
executives. With this in mind, the Committee has regularly scheduled discussions to review various components of each named executive officer’s compensation while considering the regulatory framework applicable to MidWest
One
Financial. The Committee continues to maintain policies and incentive compensation methods which effectively consider and manage risk-taking by those eligible to earn incentive compensation within the Company’s compensation plans. The Committee also believes that the framework of such policies and procedures limits the risk that any one employee could potentially undertake with respect to the manipulation of reporting of earnings in an effort to better his or her compensation.
Compensation Philosophy and Objectives
The Committee believes that, at their core, our executive compensation plans, programs and arrangements must clearly align with MidWest
One
Financial’s achievement of sustained, long-term financial success and also with the overall goal of increasing shareholder value. All of MidWest
One
Financial’s compensation programs are designed to attract and retain key employees, motivate them to achieve desired performance, and to reward them for excellent performance. The programs are not designed or intended to reward substandard, or even mediocre, performance results. Our executive compensation programs are intended to align the interests of management with those of our shareholders without creating undue risk to the Company. Compensation programs provide elements of both short and long-term performance with the goal of increasing shareholder value over the long term, but we place a greater focus on long-term performance as we believe that our shareholders more often take a long-term view with respect to their ownership in the Company. We believe that executive compensation should not be tied too closely to the short-term performance of our stock, whether favorable or unfavorable, because short-term changes to the price of our stock may be more closely related to general market issues, not necessarily our performance. Rather, we strive to design balanced goals that incorporate multiple levels of financial metrics including company or division performance results as such measures will more accurately reflect our performance. We continue to believe that executive compensation programs should reflect an environment of setting goals and expectations, and rewarding results, thus influencing the general compensation of all employees throughout the Company.
We also believe that the compensation programs of our named executives should reflect, in large part, success as a management team rather than as individuals, with focus on attaining key operating objectives with respect to loan, deposit, and total asset growth, asset quality, the growth and consistency of earnings, providing support to the many communities in which we
124
do business, and ultimately an increased market price for our stock. Executive compensation programs are not designed or intended to provide our executives with incentives to engage in business activities or other conduct which would threaten the value of MidWest
One
Financial or the investments of our shareholders. We believe that the performance of the executives, in consideration of the general economic, and specific company, industry, and competitive conditions, should be the basis for determining their overall compensation.
MidWest
One
Financial’s executive compensation program is designed and structured to be consistent with the guiding philosophies, and to achieve the strategic objectives, as follows:
|
•
|
encourage a relatively consistent and competitive return to our shareholders;
|
|
•
|
maintain an environment which encourages and promotes stability and a long-term perspective for both the Company and our management team;
|
|
•
|
maintain a currently competitive compensation program, which is motivating for officers and staff members, giving us the flexibility to:
|
|
◦
|
ensure the performance and success of each individual in support of our current goals and strategic plan;
|
|
◦
|
allow the hiring and retention of key personnel who are critical to our long-term success;
|
|
◦
|
emphasize goal-based performance objectives, including various incentive compensation programs which are aligned with management’s strategic plan and focused efforts; and
|
|
◦
|
minimize, and eliminate when possible, any undue risk to the Company with respect to all compensation practices and programs;
|
|
•
|
provide consistent management practices which:
|
|
◦
|
fulfill appropriate and necessary oversight responsibility to the constituents of MidWest
One
Financial (shareholders, customers, employees, regulators, and communities);
|
|
◦
|
maintain the highest level of ethical standards and conduct according to our overall corporate policies; and
|
|
◦
|
avoid any implied or real conflict between management’s responsibilities to the Company and each person’s personal interests.
|
Compensation Components
General
. There are four major components to executive officer compensation: base salary, bonus, equity awards and additional benefits. The Committee’s decisions regarding each of these components for the NEOs are based in part on its subjective judgment and take into account qualitative and quantitative factors, as set forth in the following discussion. In reviewing an executive officer’s compensation, the Committee considers and evaluates all components of the officer’s total compensation package, including base salary, bonus, incentive stock awards, perquisites, participation in our non-qualified executive plans, participation in our 401(k) and ESOP plans, and any other payments, awards, or benefits that an officer earns. The Committee makes a concerted effort to give consideration to the research and analysis conducted by its compensation consultant, F.W. Cook, to ensure that MidWest
One
’s executive officer total compensation is in line with its peers and that it remains competitive. Further, the Committee considers any amounts an officer is entitled to receive upon retirement, termination or a change-in-control event. The Committee strives to provide each executive officer with a competitive total compensation package.
MidWest
One
Financial is a party to employment agreements with Mr. Funk, Ms. Evans and Messrs. Ortale and Jehle. In early 2015, MidWest
One
Financial and Mr. Cantrell entered into an employment agreement in place of his change of control agreement. The Committee believes these agreements serve to attract and retain key executives to MidWest
One
and that their terms allow each executive to focus on his or her significant individual contributions with the best interests of the Company in mind.
Base Salary.
The Committee believes that competitive base salary received by an executive officer serves as a form of financial security to each individual, and enables the Company to maintain a stable management team, which in turn leads to a more stable corporate environment. The Committee believes that a consistent and motivated management team, made up of highly qualified executives, is key to the success of MidWest
One
Financial. Therefore, base salary makes up the largest portion of the total compensation package
The Committee continues to evaluate the total compensation programs of our NEOs with consideration given to the importance of providing competitive pay and benefits in order to attract and retain key Officers. The Committee’s approach to
125
this review considers the relative performance and compensation trends of our peer group companies, as well as individual performance of each executive officer and how his or her level of responsibility and respective key contributions are valued. As discussed above, the Committee, with the assistance of F.W. Cook , performs a customary review of base salary levels, on at least an annual basis, by comparing MidWest
One
Financial’s compensation levels to those of its 17 regional peer companies. The Committee also acknowledges that the roles and responsibilities of our NEOs are substantial to the success of the Company and, therefore, the performance and respective compensation of our NEOs is critical to ongoing positive financial performance. The Committee generally strives to maintain a base salary position which is competitive and fair with respect to our regional peers, and, more specifically, aligns our NEOs’ compensation with our financial performance relative to our peer group, with a goal of ranking within the top one-third of this group when supported by performance.
Each NEO’s performance is evaluated by reviewing performance appraisal information and recommendations made available by management. This review considers each NEO’s achievement of individual goals and how his or her performance has contributed to the overall financial performance of MidWest
One
Financial. Mr. Funk presents the performance evaluations and his recommendations for each NEO, other than himself, to the Committee. Mr. West, the Committee’s Chairperson, presents the same for Mr. Funk. Mr. Monson, the Chair of MidWest
One
Financial’s Board of Directors also provides feedback to the Committee about Mr. Funk’s performance.
Generally, the Committee determines the annual base salaries for the coming year at the end of the prior calendar year. In determining these base salaries, we consider the same general factors discussed above including the evolving landscape of the banking environment regionally and nationally, the impact of the economy and increased regulation of our industry on our earnings, the return on average assets, and overall assets. The Committee also considers certain economic factors in the financial industry that are beyond the NEOs’ control. The Committee believes that MidWest
One
Financial’s performance continues to compare favorably in several areas with other financial institutions, including those in our peer group.
Cash Incentive Awards-Bonus.
The Committee also determines annual cash incentive awards for our NEOs with consideration to the performance results outlined in each executive’s bonus plan. In addition to the CEO and other NEOs, the remaining members of MidWest
One
Bank’s senior management team are generally eligible for a bonus. Each bonus plan is designed to provide an incentive to achieve individual and corporate financial goals while considering the mitigation of any risks which may affect MidWest
One
Financial’s overall financial performance. Generally speaking, thresholds and targets are set within each bonus plan so that improvement in each goal category is necessary in order to receive any or all of the bonus payout. In addition, the bonus plans of the NEOs include a “knock out” provision that requires the attainment of a minimum Company-wide performance goal in order to be able to receive any portion of the annual bonus. The Committee does, however, retain the discretion to increase or decrease the amount of a bonus if it determines that special circumstances existed during the year which warranted adjustment of any bonus amount.
The bonus and corresponding goal setting process occurs annually. Mr. Funk provides recommendations with respect to members of management other than himself, to Mr. West and Mr. Monson for initial review. Mr. West and Mr. Monson discuss Mr. Funk’s recommendations with members of the Compensation Committee and also consider factors applicable to Mr. Funk’s annual bonus. Mr. West then presents bonus recommendations to the Committee for approval.
In
2014
, pursuant to our bonus plan, Mr. Funk was potentially eligible for an annual bonus equal to one-third of his salary, or $125,665. Based on his and the Company’s performance during
2014
, Mr. Funk earned 91.5% of his bonus.
The components designated by the Committee, and the percentage of salary that the NEOs were eligible to earn for
2014
performance, were as follows:
|
Name
|
Profitability
Net Operating Income/EPS |
Peer Group Standing
|
Efficiency Ratio
|
Additional Individual Goals - Subjective
|
2014 Eligible Bonus (as % of Base Salary)
|
|||||
|
Charles N. Funk
|
40%
|
45%
|
10%
|
5%
|
33.3%
|
|||||
|
Susan R. Evans
|
40%
|
20%
|
20%
|
20%
|
25%
|
|||||
|
Kent L. Jehle
|
40%
|
50%
|
10%
|
—
|
25%
|
|||||
|
Gary J. Ortale
|
50%
|
25%
|
25%
|
—
|
25%
|
|||||
|
James M. Cantrell
|
50%
|
—
|
20%
|
30%
|
25%
|
|||||
Profitability, Net Operating Income and Earnings Per Share Component.
The Committee believes that a profitability metric using net operating income and earnings per share are appropriate measures because each focuses on the financial performance of the Company, which in turn reflects shareholder value. Each NEO has a portion of his or her bonus tied to this metric. The Committee elected to use net operating income of $18.3 million and Earnings per Share of $2.16 as the 2014 targets.
126
As a “knock out” provision, if net operating income was not at least $16.5 million, no bonus was to be paid to the NEOs unless the Committee found special circumstances to warrant the payment of a bonus. Assuming the “knock out” threshold was exceeded, the NEOs would be eligible to receive 100% of the net operating income component of their bonuses if 2014 net operating income was at least $18.3 million and earnings per share was at least $2.16. Our 2014 net operating income was $18.5 million and our 2014 earnings per share was $2.19. Therefore, the NEOs earned 100% of this component.
Peer Group Standing Component.
The Committee believes it is appropriate to incentivize our management team to ensure that the Company’s overall financial performance ranks in the top one-third of our 18 company peer group. The Committee is committed to paying our NEOs in a competitive compensation range as we work toward the achievement of this goal. The overall financial performance of MidWest
One
with respect to its position within its peer group was a factor in determining the bonuses for Messrs. Funk, Jehle, and Ortale, and Ms. Evans, but was not a factor in determining Mr. Cantrell’s bonus. If the Company’s 2014 overall financial performance (as measured by its relative position within its peer group) was within the top one-third of those respective peer institutions, our NEOs would be deemed to have achieved this component of the bonus plan. The Committee determined that we met 80% of this goal for 2014 and, as such, the respective NEOs were awarded a percentage of their bonus for this component of the annual formula.
Efficiency Ratio.
The Committee believes that expense control and efficiency of operations is a goal we must continually strive for in order to provide the best financial return for our shareholders. As such, the Committee deemed a bonus component in 2014 tied to continued improvement of our efficiency ratio to be merited. The Committee believes the efficiency ratio is a reliable metric on which to base a portion of the bonus because it reflects our relative cost of doing business. For 2014, Mr. Funk, Ms. Evans and Messrs. Ortale, Jehle, and Cantrell were asked to maintain MidWest
One
Bank’s efficiency ratio at 56%. No payout would occur if MidWest
One
Bank’s efficiency ratio, excluding costs associated with the pending transaction, was higher than 58%. As previously stated, the 2014 efficiency ratio for MidWest
One
Bank was 54.59%. Also, MidWest
One
Financial’s efficiency ratio, prior to adjustment for costs associated with the pending transaction was 58.74% and after such adjustment was 57.29%. As such, the Committee determined that our NEOs earned 100% of this component.
Additional Individual Performance Component.
For 2014, additional individual goals were assigned to Messers. Funk and Cantrell and Ms. Evans and generally reflect additional corporate measures that are affected by that executive’s performance. The Committee generally assesses overall progress toward each goal while retaining the discretion to reward other aspects of a NEO’s performance during the year if it is merited. As such, if unforeseen circumstances should warrant a bonus being paid to an executive, the Committee is authorized to consider the treatment of how the bonus payment is made.
In determining whether each of the respective NEOs met his or her individual goals during 2014, and was therefore eligible for this additional component of his or her bonus plan, the Committee considered the following:
|
•
|
With respect to Mr. Funk, the committee considered his leadership in showing an increase to MidWest
One
’s deposit growth above the state of Iowa average resulting in an increase in statewide market share.
|
|
•
|
With respect to Ms. Evans, the Committee considered her leadership in attaining commercial and agricultural loan growth, deposit growth above the state of Iowa average resulting in an increase in statewide market share, as well as her oversight of revenue enhancement initiatives resulting in a decrease in non-interest expense and the efficiency improvements of operations.
|
|
•
|
With respect to Mr. Cantrell, the Committee considered his leadership with ALCO, improvements to internal audit and loan review functional areas of the Bank, and continued tangible progress towards MidWest
One
Bank’s enterprise risk management program.
|
In early 2015, the same bonus plan process was put in place with Mr. Funk and Mr. West presenting the executive bonus plans to the Committee. Bonus plans for each of the NEOs contained an established target percentage amount that each officer could potentially earn upon meeting the established corporate and where applicable, additional individual goals for the executive. A recommendation for 2015 bonus plans for the NEOs was presented to the Committee by Mr. West and Mr. Funk at its January 2015 meeting which included changes to target percentages more appropriately aligned with peer group compensation levels. The Compensation Committee approved the bonus plans unanimously.
Long-Term Incentive Awards-Equity Awards.
The Board of Directors and the Committee believe in management ownership of our common stock as an effective means to align the interests of management with those of the shareholders. Our current long-term incentive plan (“the 2008 Equity Incentive Plan”), which was approved by our shareholders in March 2008, is intended to promote equity ownership in MidWest
One
Financial by the directors and selected officers, to focus the management team on increasing value to the shareholders, to increase the plan participants’ proprietary interest in the success of MidWest
One
Financial, and to encourage the retention of key employees for an extended period of time. The current Equity Incentive Plan
127
authorizes the issuance of MidWest
One
Financial’s common stock, including the granting of stock options and restricted stock units.
All equity awards are at the discretion of the Committee and are generally subjective in nature. The Committee considers the position of the NEO, the officer’s level of influence and the corresponding ability to contribute toward the success of MidWest
One
Financial, individual and corporate performance and whether the respective goals were obtained, as well as the level of equity awards granted to individuals with similar positions at our peer companies.
The Committee typically approves equity awards in January of each year. The timing of the equity grants coincides with the completion of annual performance evaluations and development of current-year bonus plans. The Committee reserves the right to grant additional equity awards at other times of the year in connection with the appointment of any new directors or officers or to compensate key employees for other significant or notable achievements. Although the 2008 Equity Incentive Plan allows for the granting of various types of equity awards, for 2014 and 2015, the Committee chose to grant only restricted stock units to NEOs.
All Other Compensation.
We provide general and customary benefit programs to executive officers and other employees. Benefits offered to executives are intended to serve a different purpose than base salary, bonus and equity awards. While the benefits offered are competitive with the marketplace and help to attract and retain executives and employees, the benefit programs also provide financial security for employees for retirement as well as unforeseen life events such as illness, disability, or death. The benefits offered to executive officers are generally those offered to other employees. There are some additional perquisites that may only be offered to executive officers. Due to the nature of benefits offered, the Committee does not adjust the level of benefits offered on a year-to-year basis. MidWest
One
Financial will continue to offer benefits, the amount of which shall be determined from time-to-time at the sole discretion of the Committee, provided that such benefits are not determined by regulatory rules to be limited or prohibitive as outlined in their respective restrictions.
The following table illustrates benefits and perquisites we provide to employees, including our NEOs:
|
Executive
Officers
|
Other Officers /
Managers
|
Full-Time
Employees
|
|||
|
Health Plans:
|
|||||
|
Life & Disability Insurance
|
X
|
X
|
X
|
||
|
Medical/Dental/Vision Plans
|
X
|
X
|
X
|
||
|
Retirement Plans:
|
|||||
|
401(k) Plan/Profit-Sharing
|
X
|
X
|
X
|
||
|
ESOP
|
X
|
X
|
X
|
||
|
SERP/Deferred Compensation Plan
|
X
|
X
|
Not Offered
|
||
|
Perquisites:
|
|||||
|
Automobile Allowance
|
As Duties Require
|
As Duties Require
|
Not Offered
|
||
|
Social Club Membership
|
As Duties Require
|
As Duties Require
|
Not Offered
|
||
401(k) Plan.
MidWest
One
Financial sponsors a tax-qualified, tax-exempt 401(k) retirement plan. The 401(k) plan is considered a defined contribution plan. American Trust & Savings Bank of Dubuque, Iowa administers the plan. American Trust’s services include general compliance advice, required testing, plan design, enrollment and distributions, and overall management of plan assets.
All employees are eligible to participate in this plan after meeting eligibility requirements pertaining to age and service. Eligible employees are permitted to contribute a portion of their own compensation up to a maximum dollar amount permitted by law. Participants may choose their own investments for their assets or they may elect a managed plan whereby a plan manager makes investment decisions on behalf of the participant according to the investment risk level the participant has chosen.
Pursuant to the plan, we provide a safe harbor matching contribution of a participant’s elective deferrals. The safe harbor match formula is calculated at 100% of the first 3% of eligible compensation and 50% of the next 2% of eligible compensation.
There is also a profit-sharing contribution component to the 401(k) plan which provides for an additional non-elective employer contribution to the retirement account of each participant. This contribution is discretionary and, if paid, is based on the
128
Company’s profitability in a given year, and is allocated to participants per plan terms based on their annual compensation. No profit-sharing contribution was made to the plan for 2014.
Employee Stock Ownership Plan.
MidWest
One
Financial sponsors a tax-qualified employee stock ownership plan, also known as the ESOP, designed primarily to reward eligible employees for their service to the Company in the form of a retirement benefit. As with the 401(k) plan, American Trust & Savings Bank of Dubuque, Iowa serves as the plan recordkeeper.
Any benefits payable under the ESOP are based solely upon the statutorily limited amounts contributed for the benefit of the participants, along with any changes in the value of those contributions while they are held in the ESOP. The ESOP does not permit or require any contributions by participating employees. Subject to certain exceptions under the law, contributions to the ESOP are fully vested after six years of service with the Company. MidWest
One
Financial, the sponsor of the ESOP, makes an annual contribution which is allocated among all eligible employees of the Company, including executive officers. The ESOP contribution is calculated as a designated percentage of annual compensation each year. This contribution is discretionary in nature and is set and approved by the MidWest
One
Financial Board of Directors each January. The Company’s ESOP contribution approved for 2014 was 3.75% of salary for all eligible participants.
Supplemental Executive Retirement Agreements (the “SERPs”).
MidWest
One
Financial provides certain of our executive officers with supplemental retirement benefits as an added incentive to remain with and focus on the long-term success of the Company. The supplemental retirement benefits are nonqualified deferred compensation arrangements. They are unfunded and unsecured promises of the Company to pay a benefit to each executive in the future. In the case of insolvency of the Company, the executives participating in such arrangements would be treated as general unsecured creditors of the Company. As such, we believe that these supplemental retirement agreements encourage our executive officers to think about, and work toward, the long-term health and success of MidWest
One
Financial.
Mr. Funk, Ms. Evans and Messrs. Ortale and Jehle each participate in the supplemental retirement benefits. Pursuant to their individual agreements, they will each receive a set dollar amount upon a retirement from employment after attaining 65 years of age. Upon such a retirement, the executive’s benefit will be paid in a series of 180 monthly installments. At age 65, Mr. Funk will receive a monthly benefit equal to $2,083, Ms. Evans will receive a monthly benefit equal to $1,250, Mr. Ortale will receive a monthly benefit equal to $2,083, and Mr. Jehle will receive a monthly benefit equal to $1,250.
If the executive retires after attaining age 60, but before attaining age 65, he or she will receive a reduced benefit. If the executive retires before attaining age 60, he or she shall forfeit any right to a benefit under the supplemental retirement agreement. The agreements provide for a full death benefit in the case of the executive’s death while still employed by the Company.
In addition, Mr. Jehle participates in one other supplemental retirement benefit. Pursuant to this agreement, he will receive a set dollar amount upon a retirement from employment after attaining 60 years of age. Upon such a retirement, Mr. Jehle’s benefit will be paid in a series of 120 monthly installments. At age 60, Mr. Jehle will receive a monthly benefit equal to $833. The agreement provides for a full death benefit in the case of Mr. Jehle’s death while still employed by the Company.
As a condition to receiving the continued stream of monthly installments, the executives will be subject to restrictive covenants for a period of 60 months following any retirement which results in payment to him or her of a supplemental retirement benefit.
Other Perquisites.
We believe that perquisites for executive officers should be very limited and conservative in nature, both in scope and value. Consistent with this philosophy, MidWest
One
Financial has generally provided nominal benefits to executives that are not available to other full time Officers and employees. This approach to perquisites is anticipated to continue in the future. We provide country club memberships for all market presidents and certain commercial banking officers in each market up to a maximum amount of $2,500.00 annually. The country club benefit is for single memberships only and intended to extend the officer’s external visibility and resulting business opportunities in their home community. An additional perquisite for certain officers includes a company automobile based on the needs of business travel. Mr. Funk, Ms. Evans and Messrs. Ortale and Jehle have company cars assigned to them. We have disclosed the value of all perquisites to NEOs in the Summary Compensation Table even if these fall below the disclosure thresholds under the SEC rules. MidWest
One
Financial will continue to offer limited perquisites, the amount of which shall be determined from time-to-time in the sole discretion of the Committee, provided that such perquisites are not considered to be restricted or prohibited by any compensation regulations.
Compensation Decisions
This section describes the decisions made by the Compensation Committee with respect to the compensation for NEOs for
2014
as well as certain decisions with respect to
2015
compensation.
129
Base Salary.
We review the base salaries of the NEOs annually to determine whether or not they will be adjusted, as described above. The salaries for
2014
, determined by the Compensation Committee at the end of
2013
, are set forth in the Summary Compensation Table on page
131
.
At the end of
2014
, the Compensation Committee met to set base salaries for
2015
. In determining those base salaries, the committee considered many of the same factors identified above. The total increase in base salaries for the NEOs for
2015
represented an increase of approximately 7.6% over
2014
.
This table reflects base salaries of our NEOs which were earned in
2014
and those base salaries set for
2015
:
|
Named Executive Officer
|
2014
|
2015
|
||
|
Charles N. Funk
|
$377,000
|
$410,000
|
||
|
Susan R. Evans
|
$240,000
|
$265,000
|
||
|
Kent L. Jehle
|
$236,000
|
$250,000
|
||
|
Gary J. Ortale
|
$215,000
|
$225,000
|
||
|
James M. Cantrell
|
$191,000
|
$205,000
|
||
Bonus.
Our NEOs achieved the goals for earning a cash bonus established by the Compensation Committee and, therefore, were awarded cash bonuses as set forth below:
|
Name
|
Bonus Compensation Earned in 2014
|
|
|
Charles N. Funk
|
$114,983
|
|
|
Susan R. Evans
|
$54,300
|
|
|
Kent L. Jehle
|
$57,120
|
|
|
Gary J. Ortale
|
$51,063
|
|
|
James M. Cantrell
|
$46,318
|
|
In early
2015
, the Compensation Committee agreed on the terms of our
2015
bonus plan. Pursuant to that plan, Mr. Funk is eligible to receive a bonus up to a maximum of 50% of his base salary, Ms. Evans up to 40% of her base salary, and Messrs. Cantrell, Ortale, and Jehle, eligible to receive a bonus up to a maximum of 33.33% of their base salary.
Equity Awards.
We typically grant equity incentives to our eligible employees, including the NEOs, in January of each year. The incentive stock options and/or restricted stock units granted to the NEOs vest in equal installments over four years and are subject to forfeiture until vested. There are no additional restricted stock units awarded equal in value to the amount of dividends paid with respect to the underlying shares of common stock.
In January
2014
, the Compensation Committee approved equity grants for its NEOs comprised solely of restricted stock units. The committee made the following awards:
|
•
|
Mr. Funk was awarded 5,000 restricted stock units.
|
|
•
|
Ms. Evans and Messrs. Ortale and Jehle each received 2,500 restricted stock units.
|
|
•
|
Mr. Cantrell was awarded 500 restricted stock units.
|
In January
2015
, the Compensation Committee approved equity grants for its NEOs comprised solely of restricted stock units. The committee made the following awards:
|
•
|
Mr. Funk was awarded 5,000 restricted stock units.
|
|
•
|
Ms. Evans received 2,500 restricted stock units.
|
|
•
|
Messrs. Ortale, Jehle and Cantrell each received 1,500 stock units.
|
The restricted stock units granted to our NEOs will vest 25% on the first anniversary of the date of grant, 25% on the second anniversary, 25% on the third anniversary, and 25% on the fourth anniversary. There will be no dividend equivalents issued with respect to restricted stock units.
All Other Compensation.
While the Compensation Committee reviews and monitors the level of other compensation offered to the NEOs, the committee typically does not adjust the level of benefits offered on an annual basis. The committee does
130
consider the benefits and perquisites offered to the NEOs in its evaluation of the total compensation received by each. The perquisites received by the NEOs in
2014
are reported in the Summary Compensation Table on page
131
. The benefits offered in
2014
to the NEOs are expected to continue for
2015
, unless otherwise limited or prohibited by any regulatory rules.
COMPENSATION COMMITTEE REPORT
The Compensation Committee of the MidWest
One
Financial board of directors has submitted the following report for inclusion in this 10-K:
The Compensation Committee has reviewed and approved the CD&A contained in this 10-K with management. Based on the committee’s discussion with management, the committee recommended that the board of directors approve and include the CD&A in this 10-K.
Submitted by:
The MidWest
One
Financial Group, Inc. Compensation Committee
Stephen L. West, Chairman
Barbara J. Kniff-McCulla
Robert J. Latham
William N. Ruud
EXECUTIVE COMPENSATION
Summary Compensation Table
The following table sets forth information concerning the compensation of our NEOs, which consist of our Chief Executive Officer, Chief Financial Officer, and our three most highly compensated executive officers in
2014
. Except as otherwise required pursuant to SEC rules, the table sets forth the following information for the years ended
December 31, 2014
,
2013
, and
2012
: (i) the dollar value of base salary and bonus earned; (ii) the aggregate grant date fair value of stock and option awards granted at any time computed in accordance with FASB ASC Topic 718; (iii) all other compensation; and (iv) the dollar value of total compensation.
|
Name and Principal Position
|
Year
|
Salary
|
Bonus
|
Stock
Awards
(1)
|
Option
Awards
(1)
|
Non-Equity Incentive Plan Compen-sation
|
Change in Pension Value and Nonqual-ified Deferred Compen-sation Earnings
(2)
|
All Other Compen-sation
(4)
|
Total Compen-sation
|
|||||||||||||||||||||||
|
(a)
|
(b)
|
(c)
|
(d)
|
(e)
|
(f)
|
(g)
|
(h)
|
(i)
|
(j)
|
|||||||||||||||||||||||
|
Charles N. Funk
|
2014
|
$
|
377,000
|
|
—
|
|
$
|
125,150
|
|
—
|
|
$
|
114,983
|
|
$
|
1,104
|
|
$
|
28,060
|
|
$
|
646,297
|
|
|||||||||
|
President and Chief
|
2013
|
$
|
363,000
|
|
—
|
|
$
|
68,550
|
|
—
|
|
$
|
111,783
|
|
$
|
977
|
|
$
|
25,108
|
|
$
|
569,418
|
|
|||||||||
|
Executive Officer
|
2012
|
$
|
355,000
|
|
—
|
|
$
|
94,899
|
|
—
|
|
$
|
106,490
|
|
$
|
858
|
|
$
|
28,309
|
|
$
|
585,556
|
|
|||||||||
|
Susan R. Evans
|
2014
|
$
|
240,000
|
|
—
|
|
$
|
62,575
|
|
—
|
|
$
|
54,300
|
|
$
|
932
|
|
$
|
25,507
|
|
$
|
383,314
|
|
|||||||||
|
Chief Operating Officer
|
2013
|
$
|
229,000
|
|
—
|
|
$
|
34,275
|
|
—
|
|
$
|
53,376
|
|
$
|
809
|
|
$
|
25,748
|
|
$
|
343,208
|
|
|||||||||
|
2012
|
$
|
223,000
|
|
—
|
|
$
|
16,850
|
|
—
|
|
$
|
50,733
|
|
$
|
694
|
|
$
|
26,616
|
|
$
|
317,893
|
|
||||||||||
|
Kent L. Jehle
|
2014
|
$
|
236,000
|
|
—
|
|
$
|
62,575
|
|
—
|
|
$
|
57,120
|
|
$
|
622
|
|
$
|
25,796
|
|
$
|
382,113
|
|
|||||||||
|
Executive Vice President and
|
2013
(3)
|
$
|
227,500
|
|
—
|
|
$
|
34,275
|
|
—
|
|
$
|
52,609
|
|
$
|
556
|
|
$
|
24,164
|
|
$
|
339,104
|
|
|||||||||
|
Chief Credit Officer
|
2012
|
$
|
222,000
|
|
—
|
|
$
|
16,850
|
|
—
|
|
$
|
50,505
|
|
$
|
495
|
|
$
|
25,229
|
|
$
|
315,079
|
|
|||||||||
|
Gary J. Ortale
|
2014
|
$
|
215,000
|
|
—
|
|
$
|
62,575
|
|
—
|
|
$
|
51,063
|
|
$
|
—
|
|
$
|
28,469
|
|
$
|
357,107
|
|
|||||||||
|
Executive Vice President and
|
2013
|
$
|
207,500
|
|
—
|
|
$
|
34,275
|
|
—
|
|
$
|
49,930
|
|
$
|
—
|
|
$
|
28,482
|
|
$
|
320,187
|
|
|||||||||
|
Chief Financial Officer
|
2012
|
$
|
202,000
|
|
—
|
|
$
|
16,850
|
|
—
|
|
$
|
45,325
|
|
$
|
8,411
|
|
$
|
26,724
|
|
$
|
299,310
|
|
|||||||||
|
James M. Cantrell
|
2014
|
$
|
191,000
|
|
—
|
|
$
|
12,515
|
|
—
|
|
$
|
46,318
|
|
$
|
—
|
|
$
|
18,894
|
|
$
|
268,727
|
|
|||||||||
|
Vice President and Chief Risk
|
2013
|
$
|
186,200
|
|
—
|
|
$
|
11,425
|
|
—
|
|
$
|
27,092
|
|
$
|
—
|
|
$
|
16,059
|
|
$
|
240,776
|
|
|||||||||
|
Officer
|
2012
|
$
|
179,000
|
|
—
|
|
$
|
8,425
|
|
—
|
|
$
|
22,366
|
|
$
|
—
|
|
$
|
15,630
|
|
$
|
225,421
|
|
|||||||||
|
(1)
|
The amounts set forth in the “Stock Awards” column and the “Option Awards” column reflect the grant date fair value of awards granted during the years ended
December 31, 2014
,
2013
and
2012
, in accordance with FASB ASC Topic 718. The assumptions used in calculating these amounts are set
|
131
forth in Note 13 to our consolidated financial statements for the year ended
December 31, 2014
, which is located on pages
98 through 100
of our Annual Report on Form 10-K.
|
(2)
|
The amounts set forth in the "Change in Pension Value and Nonqualified Deferred Compensation Earnings" column includes the change in the value of accrued benefits under the MidWest
One
Bank Retirement Plan and above-market interest, as determined for proxy disclosure purposes only, accrued under the SERP during the year. The MidWest
One
Bank Retirement Plan was liquidated in June 2012.
|
The
2014
amounts attributable to each are as follows:
|
Name
|
Change in Pension Value
|
Above-Market Interest
|
Change in Pension Value and Nonqualified Deferred Compensation Earnings
|
|||||||||||
|
Charles N. Funk
|
$
|
—
|
|
$
|
1,104
|
|
$
|
1,104
|
|
|||||
|
Susan R. Evans
|
$
|
—
|
|
$
|
932
|
|
$
|
932
|
|
|||||
|
Kent L. Jehle
|
$
|
—
|
|
$
|
622
|
|
$
|
622
|
|
|||||
|
Gary J. Ortale
|
$
|
—
|
|
$
|
—
|
|
$
|
—
|
|
|||||
|
James M. Cantrell
|
$
|
—
|
|
$
|
—
|
|
$
|
—
|
|
|||||
The
2013
amounts attributable to each are as follows:
|
Name
|
Change in Pension Value
|
Above-Market Interest
|
Change in Pension Value and Nonqualified Deferred Compensation Earnings
|
|||||||||||
|
Charles N. Funk
|
$
|
—
|
|
$
|
977
|
|
$
|
977
|
|
|||||
|
Susan R. Evans
|
$
|
—
|
|
$
|
809
|
|
$
|
809
|
|
|||||
|
Kent L. Jehle
|
$
|
—
|
|
$
|
556
|
|
$
|
556
|
|
|||||
|
Gary J. Ortale
|
$
|
—
|
|
$
|
—
|
|
$
|
—
|
|
|||||
|
James M. Cantrell
|
$
|
—
|
|
$
|
—
|
|
$
|
—
|
|
|||||
The
2012
amounts attributable to each are as follows:
|
Name
|
Change in Pension Value
|
Above-Market Interest
|
Change in Pension Value and Nonqualified Deferred Compensation Earnings
|
|||||||||||
|
Charles N. Funk
|
$
|
—
|
|
$
|
858
|
|
$
|
858
|
|
|||||
|
Susan R. Evans
|
$
|
—
|
|
$
|
694
|
|
$
|
694
|
|
|||||
|
Kent L. Jehle
|
$
|
—
|
|
$
|
495
|
|
$
|
495
|
|
|||||
|
Gary J. Ortale
|
$
|
8,411
|
|
$
|
—
|
|
$
|
8,411
|
|
|||||
|
James M. Cantrell
|
$
|
—
|
|
$
|
—
|
|
$
|
—
|
|
|||||
|
(3)
|
The amounts reflected in the “Non-Equity Incentive Plan Compensation” and “Total” columns for 2013 were incorrectly calculated and have been adjusted by $10,000 when compared to our prior disclosure of these amounts.
|
|
(4)
|
All other compensation for the NEOs attributable to fiscal
2014
is summarized below.
|
|
Name
|
Perquisites
(i)
|
401(k)
Match
|
Supplemental Retirement Contribution
|
ESOP Contribution
|
Total
“All Other
Compensation”
|
|||||||||||||||||
|
Charles N. Funk
|
$
|
1,183
|
|
$
|
10,400
|
|
$
|
6,727
|
|
$
|
9,750
|
|
$
|
28,060
|
|
|||||||
|
Susan R. Evans
|
$
|
2,139
|
|
$
|
9,927
|
|
$
|
3,691
|
|
$
|
9,750
|
|
$
|
25,507
|
|
|||||||
|
Kent L. Jehle
|
$
|
1,895
|
|
$
|
10,234
|
|
$
|
3,917
|
|
$
|
9,750
|
|
$
|
25,796
|
|
|||||||
|
Gary J. Ortale
|
$
|
582
|
|
$
|
8,808
|
|
$
|
9,329
|
|
$
|
9,750
|
|
$
|
28,469
|
|
|||||||
|
James M. Cantrell
|
$
|
497
|
|
$
|
10,219
|
|
$
|
—
|
|
$
|
8,178
|
|
$
|
18,894
|
|
|||||||
|
(i)
|
Includes the incremental cost related to the use of a Company-owned automobile for Messrs. Funk, Jehle, and Ortale and Ms. Evans, and the Company-paid dinner club membership dues for Mr. Funk.
|
132
Grants of Plan Based Awards
The following table provides information on equity grants awarded to our NEOs during
2014
. All such grants were made under our 2008 Equity Incentive Plan, which is described in more detail in the CD&A.
|
Name
|
Grant Date
|
Estimated Future Payouts Under Non-Equity Incentive Plan Awards
(1)
|
All Other Stock Awards: # of Shares of Stock or Units
|
All Other Option Awards: # of Securities Underlying Options
|
Exercise or Base Price of Option Awards
($/sh)
|
Grant Date Fair Value of Stock Unit Awards
|
|||||||||||||||||||
|
Threshold
|
Target
|
Maximum
|
|||||||||||||||||||||||
|
(a)
|
(b)
|
(c)
|
(d)
|
(e)
|
(f)
|
(g)
|
(h)
|
(i)
|
|||||||||||||||||
|
Charles N. Funk
|
2/15/2014
|
—
|
|
—
|
|
—
|
|
5,000
|
|
—
|
|
—
|
|
$
|
125,150
|
|
|||||||||
|
|
—
|
|
$
|
125,665
|
|
—
|
|
—
|
|
—
|
|
—
|
|
—
|
|
||||||||||
|
Susan R. Evans
|
2/15/2014
|
—
|
|
—
|
|
—
|
|
2,500
|
|
—
|
|
—
|
|
$
|
62,575
|
|
|||||||||
|
|
—
|
|
$
|
60,000
|
|
—
|
|
—
|
|
—
|
|
—
|
|
—
|
|
||||||||||
|
Kent L. Jehle
|
2/15/2014
|
—
|
|
—
|
|
—
|
|
2,500
|
|
—
|
|
—
|
|
$
|
62,575
|
|
|||||||||
|
—
|
|
$
|
59,000
|
|
—
|
|
—
|
|
—
|
|
—
|
|
—
|
|
|||||||||||
|
Gary J. Ortale
|
2/15/2014
|
—
|
|
—
|
|
—
|
|
2,500
|
|
—
|
|
—
|
|
$
|
62,575
|
|
|||||||||
|
|
—
|
|
$
|
53,750
|
|
—
|
|
—
|
|
—
|
|
—
|
|
—
|
|
||||||||||
|
James M. Cantrell
|
2/15/2014
|
—
|
|
—
|
|
—
|
|
500
|
|
—
|
|
—
|
|
$
|
12,515
|
|
|||||||||
|
|
—
|
|
$
|
47,750
|
|
—
|
|
—
|
|
—
|
|
—
|
|
—
|
|
||||||||||
|
(1)
|
The amounts set forth in the "Estimated Future Payouts Under Non-Equity Incentive Plan Awards" columns reflect the threshold and target payouts for performance under the bonus plan as described in the section titled “Cash Incentive Awards-Bonuses” in the CD&A above. The amount earned by each NEO for
2014
performance is included in the Summary Compensation Table in the column titled “Non-Equity Incentive Plan Compensation.”
|
Outstanding Equity Awards at Fiscal Year End
The following table sets forth information concerning the exercisable and unexercisable stock options and restricted stock units at
December 31, 2014
, held by each NEO:
|
Option Awards
|
Stock Awards
|
|||||||||||||||||||
|
Number of Securities
Underlying Unexercised Options
|
Option Exercise Price ($)
|
Option
Expiration
Date
|
# of Shares or Units of Stock that Have Not Vested
(1)
|
Market Value of Shares or Units of Stock that Have Not Vested ($)
(2)
|
||||||||||||||||
|
Name
|
Exercisable
|
Unexercisable
|
||||||||||||||||||
|
(a)
|
(b)
|
(c)
|
(d)
|
(e)
|
(f)
|
(g)
|
||||||||||||||
|
Charles N. Funk
|
6,000
|
|
—
|
|
$
|
16.69
|
|
4/1/2018
|
|
—
|
|
—
|
|
|||||||
|
1,500
|
|
—
|
|
$
|
9.34
|
|
1/22/2019
|
|
—
|
|
—
|
|
||||||||
|
—
|
|
—
|
|
—
|
|
—
|
|
11,366
|
|
$
|
327,454
|
|
||||||||
|
Susan R. Evans
|
500
|
|
—
|
|
$
|
16.69
|
|
4/1/2018
|
|
—
|
|
—
|
|
|||||||
|
500
|
|
—
|
|
$
|
9.34
|
|
1/22/2019
|
|
—
|
|
—
|
|
||||||||
|
1,200
|
|
—
|
|
$
|
7.02
|
|
7/16/2019
|
|
—
|
|
—
|
|
||||||||
|
—
|
|
—
|
|
—
|
|
—
|
|
4,300
|
|
$
|
123,883
|
|
||||||||
|
Kent L. Jehle
|
3,000
|
|
—
|
|
$
|
16.69
|
|
4/1/2018
|
|
—
|
|
—
|
|
|||||||
|
1,500
|
|
—
|
|
$
|
9.34
|
|
1/22/2019
|
|
—
|
|
—
|
|
||||||||
|
—
|
|
—
|
|
—
|
|
—
|
|
4,300
|
|
$
|
123,883
|
|
||||||||
|
Gary J. Ortale
|
500
|
|
—
|
|
$
|
16.69
|
|
4/1/2018
|
|
—
|
|
—
|
|
|||||||
|
500
|
|
—
|
|
$
|
9.34
|
|
1/22/2019
|
|
—
|
|
—
|
|
||||||||
|
4,800
|
|
—
|
|
$
|
7.02
|
|
7/16/2019
|
|
—
|
|
—
|
|
||||||||
|
—
|
|
—
|
|
—
|
|
—
|
|
4,300
|
|
$
|
123,883
|
|
||||||||
|
James M. Cantrell
|
—
|
|
—
|
|
—
|
|
—
|
|
1,215
|
|
$
|
35,004
|
|
|||||||
133
|
(1)
|
The table below shows the remaining vesting schedule for unvested restricted stock units granted on January 18, 2011.
|
|
Name
|
1/18/2015
|
||||||
|
Charles N. Funk
|
1,300
|
|
|||||
|
Susan R. Evans
|
175
|
|
|||||
|
Kent L. Jehle
|
175
|
|
|||||
|
Gary J. Ortale
|
175
|
|
|||||
|
James M. Cantrell
|
90
|
|
|||||
The table below shows the remaining vesting schedule for unvested restricted stock units granted on February 15, 2012.
|
Name
|
2/15/2015
|
2/15/2016
|
||||||||
|
Charles N. Funk
|
1,408
|
|
1,408
|
|
||||||
|
Susan R. Evans
|
250
|
|
250
|
|
||||||
|
Kent L. Jehle
|
250
|
|
250
|
|
||||||
|
Gary J. Ortale
|
250
|
|
250
|
|
||||||
|
James M. Cantrell
|
125
|
|
125
|
|
||||||
The table below shows the remaining vesting schedule for unvested restricted stock units granted on February 15, 2013.
|
Name
|
2/15/2015
|
2/15/2016
|
2/15/2017
|
||||||||||
|
Charles N. Funk
|
750
|
|
750
|
|
750
|
|
|||||||
|
Susan R. Evans
|
375
|
|
375
|
|
375
|
|
|||||||
|
Kent L. Jehle
|
375
|
|
375
|
|
375
|
|
|||||||
|
Gary J. Ortale
|
375
|
|
375
|
|
375
|
|
|||||||
|
James M. Cantrell
|
125
|
|
125
|
|
125
|
|
|||||||
The table below shows the remaining vesting schedule for unvested restricted stock units granted on February 15, 2014.
|
Name
|
2/15/2015
|
2/15/2016
|
2/15/2017
|
2/15/2018
|
||||||||||
|
Charles N. Funk
|
1,250
|
|
1,250
|
|
1,250
|
|
1,250
|
|
||||||
|
Susan R. Evans
|
625
|
|
625
|
|
625
|
|
625
|
|
||||||
|
Kent L. Jehle
|
625
|
|
625
|
|
625
|
|
625
|
|
||||||
|
Gary J. Ortale
|
625
|
|
625
|
|
625
|
|
625
|
|
||||||
|
James M. Cantrell
|
125
|
|
125
|
|
125
|
|
125
|
|
||||||
|
(2)
|
The market value of shares is based on a closing stock price of
$28.81
on
December 31, 2014
.
|
Option Exercises and Stock Vested in
2014
The following table sets forth information concerning the exercise of options in
2014
by each NEO:
|
Option Awards
|
Stock Awards
|
|||||||||||||
|
Name
|
# of Shares Acquired on Exercise
|
Value Realized Upon Exercise ($)
(1)
|
# of Shares Acquired on Vesting
|
Value Realized on Vesting ($)
(2)
|
||||||||||
|
(a)
|
(b)
|
(c)
|
(d)
|
(e)
|
||||||||||
|
Charles N. Funk
|
2,000
|
|
$
|
29,580
|
|
6,116
|
|
$
|
154,923
|
|
||||
|
Susan R. Evans
|
—
|
|
$
|
—
|
|
1,425
|
|
$
|
36,139
|
|
||||
|
Kent L. Jehle
|
—
|
|
$
|
—
|
|
1,425
|
|
$
|
36,139
|
|
||||
|
Gary J. Ortale
|
—
|
|
$
|
—
|
|
1,425
|
|
$
|
36,139
|
|
||||
|
James M. Cantrell
|
—
|
|
$
|
—
|
|
590
|
|
$
|
14,967
|
|
||||
|
(1)
|
Reflects amounts realized on April 29, 2014 and October 10,2014.
|
|
(2)
|
Reflects amounts realized on January 18, 2014, January 21, 2014, and February 15, 2014.
|
134
Nonqualified Deferred Compensation Table
The following table sets forth information concerning the benefits under the Company’s supplemental retirement agreements at
December 31, 2014
, to which each NEO is entitled.
|
Name
|
Executive Contributions in Last FY ($)
|
Registrant Contributions in Last FY ($)
|
Aggregate Earnings in Last FY
(1)
($)
|
Aggregate Withdrawals / Distributions ($)
|
Aggregate Balance at Last FYE
(2)
($)
|
|||||||||||||
|
(a)
|
(b)
|
(c)
|
(d)
|
(e)
|
(f)
|
|||||||||||||
|
Charles N. Funk
|
—
|
|
$
|
6,727
|
|
$
|
9,513
|
|
—
|
|
$
|
144,793
|
|
|||||
|
Susan R. Evans
|
—
|
|
$
|
3,691
|
|
$
|
3,837
|
|
—
|
|
$
|
58,937
|
|
|||||
|
Kent L. Jehle
|
—
|
|
$
|
3,917
|
|
$
|
6,827
|
|
—
|
|
$
|
103,414
|
|
|||||
|
Gary J. Ortale
|
—
|
|
$
|
9,329
|
|
$
|
14,163
|
|
—
|
|
$
|
215,186
|
|
|||||
|
James M. Cantrell
|
—
|
|
$
|
—
|
|
$
|
—
|
|
—
|
|
$
|
—
|
|
|||||
|
(1)
|
The “Aggregate Earnings in Last FY” column includes above-market interest also reported in the “Change in Pension Value and Nonqualified Deferred Compensation Earnings” column of the Summary Compensation Table for fiscal
2014
. The above-market interest amounts are as follows: $1,104 for Mr. Funk; $932 for Ms. Evans; and $622 for Mr. Jehle.
|
|
(2)
|
The “Aggregate Balance at Last FYE” column includes above-market interest also reported in the “Change in Pension Value and Nonqualified Deferred Compensation Earnings” column of the Summary Compensation Table for fiscal years
2013
and
2012
. The above-market interest amounts were as follows: $977 for Mr. Funk, $809 for Ms. Evans, and $556 for Mr. Jehle in fiscal
2013
; and $858 for Mr. Funk, $694 for Ms. Evans, and $495 for Mr. Jehle in fiscal
2012
.
|
135
Potential Payments Upon Termination or Change in Control
The following table sets forth information concerning potential payments and benefits under our compensation programs and benefit plans to which the NEOs would be entitled upon a termination of employment as of
December 31, 2014
. Ms. Evans and Messrs. Funk, Jehle, and Ortale would be eligible for termination-related benefits under their respective employment agreements and Mr. Cantrell would be eligible for termination-related benefits under his change of control agreement.
Except for payments and benefits provided by the employment agreements and change of control agreement, all other payments and benefits provided to any NEO upon termination of his or her employment are the same as the payments and benefits provided to other eligible employees of MidWest
One
Financial. For purposes of estimating the value of certain equity awards we have assumed a price per share of our common stock of
$28.81
, which was the closing price of our stock on
December 31, 2014
, the last trading day of the year.
|
Cash Severance Payments
|
Equity Incentive Plan
(2)
|
SERP
(3)
|
||||||||||
|
Charles N. Funk
|
||||||||||||
|
Involuntary Termination
(1)
|
$
|
471,250
|
|
$
|
—
|
|
$
|
—
|
|
|||
|
Voluntary Retirement after age 60
|
—
|
|
—
|
|
1,560
|
|
||||||
|
Death or Disability
|
—
|
|
327,454
|
|
2,083
|
|
||||||
|
Involuntary Termination in Connection with Change in Control
|
1,221,957
|
|
327,454
|
|
—
|
|
||||||
|
Susan R. Evans
|
||||||||||||
|
Involuntary Termination
(1)
|
$
|
240,000
|
|
$
|
—
|
|
$
|
—
|
|
|||
|
Death or Disability
|
—
|
|
123,883
|
|
1,250
|
|
||||||
|
Involuntary Termination in Connection with Change in Control
|
586,752
|
|
123,883
|
|
—
|
|
||||||
|
Kent L. Jehle
|
||||||||||||
|
Involuntary Termination
(1)
|
$
|
236,000
|
|
$
|
—
|
|
$
|
—
|
|
|||
|
Death or Disability
|
—
|
|
123,883
|
|
2,083
|
|
||||||
|
Involuntary Termination in Connection with Change in Control
|
577,218
|
|
123,883
|
|
—
|
|
||||||
|
Gary J. Ortale
|
||||||||||||
|
Involuntary Termination
(1)
|
$
|
215,000
|
|
$
|
—
|
|
$
|
—
|
|
|||
|
Voluntary Retirement after age 60
|
—
|
|
—
|
|
2,005
|
|
||||||
|
Death or Disability
|
—
|
|
123,883
|
|
2,083
|
|
||||||
|
Involuntary Termination in Connection with Change in Control
|
529,860
|
|
123,883
|
|
—
|
|
||||||
|
James M. Cantrell
|
||||||||||||
|
Involuntary Termination
(1)
|
$
|
—
|
|
$
|
—
|
|
$
|
—
|
|
|||
|
Death or Disability
|
—
|
|
35,004
|
|
—
|
|
||||||
|
Involuntary Termination in Connection with Change in Control
|
272,615
|
|
35,004
|
|
—
|
|
||||||
|
(1)
|
“Involuntary Termination” refers to a voluntary resignation by the executive for “good reason” or an involuntary termination by MidWest
One
Financial other than for “cause” either of which occurs other than in connection with a change in control.
|
|
(2)
|
This column reflects the value of unvested restricted stock unit awards that would vest upon the executive's death or disability or the occurrence of a change in control, as well as the difference between exercise price and the closing price of our stock on
December 31, 2014
with respect to any unvested stock options that would vest upon the occurrence of a change in control. None of these executives has yet attained “retirement” age, 65 years old, for purposes of accelerated vesting of his or her unvested stock options.
|
|
(3)
|
This column reflects the monthly benefit that would be paid if the executive had a termination of employment for the stated reasons as of
December 31, 2014
. The monthly amount would be paid to the executive in a series of 180 installments following a termination of employment. None of the executives has yet attained “retirement” age, 65 years old, for purposes of the SERP. However, because each is at least 60 years of age, Messrs. Funk and Ortale are eligible for the reduced “early retirement” benefit. If the executive’s estate elected to receive an early distribution, the monthly installments would be based on an accrued benefit for each of the executives equal to: Mr. Funk - $144,793; Ms. Evans - $58,937; Mr. Jehle - $103,414; and Mr. Ortale - $215,186.
|
136
Continued Health, Dental, and Vision Insurance.
Pursuant to each applicable agreement, if an NEO terminated employment on
December 31, 2014
, he or she would be eligible to participate in our COBRA coverage program at the same monthly cost as would be charged to a continuing employee for comparable coverage. As of
December 31, 2014
, the incremental monthly cost of the continuing health, dental, and vision coverage on each executive’s current health, dental, and vision coverage elections was $190.22 for Mr. Funk, $406.57 for Ms. Evans, $404.08 for Mr. Jehle, and $425.66 for Messrs. Ortale and Cantrell.
Supplemental Retirement Agreements
. As described above, Ms. Evans and Messrs. Funk, Ortale and Jehle each are party to a SERP. The “early” retirement benefit for each under such agreements is available for a termination of employment, other than for cause, on or after the executive attains age 60. As of
December 31, 2014
, only Mr. Ortale would have been eligible for the early retirement benefit, which is calculated based on the amount then accrued for accounting purposes, rather than the full monthly benefit described in the CD&A section above. Each of the NEOs, or his or her estate, would be eligible to receive a benefit upon the executive’s disability or death.
Accrued Pay and Regular Retirement Benefits.
The NEOs would be eligible to receive payments and benefits to the extent they are provided on a non-discriminatory basis to salaried employees generally upon termination of employment. These include:
|
•
|
Accrued salary and PTO pay.
|
|
•
|
Distributions of plan balances under our 401(k) plan and the executive deferred compensation plan. See “Nonqualified Deferred Compensation” on page
135
for information on current account balances and an overview of the deferred compensation plan.
|
Retirement, Death and Disability.
Generally speaking, and except as described with respect to the supplemental retirement benefits, a termination of employment due to retirement, death or disability does not entitle the NEOs to any payments or benefits that are not available to other employees. Following a termination due to death or disability, an employee (or his or her estate) shall be entitled to the following:
|
•
|
All unvested stock options shall become immediately 100% vested and an employee shall have a period of one (1) year following such termination during which to exercise his or her vested stock options.
|
|
•
|
Any unvested restricted stock units outstanding at the time of an employee’s termination due to death or disability shall become immediately 100% vested upon such termination.
|
As of the time of a termination of employment due to retirement at or after attaining age 65, all unvested stock options shall become immediately 100% vested.
Acceleration of Vesting Upon a Change in Control.
All officers, including the NEOs, who receive stock options or restricted stock units under the 2008 Equity Incentive Plan will immediately vest in any unvested stock options and restricted stock units held by such an officer upon the occurrence of a change in control of MidWest
One
Financial.
Employment Agreements and Change of Control Agreements.
As is noted in the Compensation Discussion & Analysis above, MidWest
One
Financial maintains employment and change of control agreements with our NEOs which were effective January 1, 2014. The rational for having employment and change of control agreements in place is to retain the employment of named executive officers, and the talent, skills, experience and expertise they provide to MidWest
One
Financial. Retention of the current leadership team is a critical goal of the Committee and our Board as it protects MidWest
One
Financial and the shareholders, provides stability and the type of skilled leadership needed in the current environment.
It should be noted that each of the five agreements described in this section includes a “cut back” provision that will limit, in the case of a payment due in connection with a change of control, any benefit paid thereunder to one dollar less than the amount that would result in an excise tax being imposed under the rules of Code Section 280G and 4999.
Employment Agreements - Ms. Evans and Messrs. Funk, Ortale and Jehle.
The employment agreements have initial terms from January 1, 2013 through December 31, 2015. The term of each agreement will be automatically extended for an additional year beginning on January 1, 2015, and each January 1 thereafter, unless either party gives at least 90 days prior notice of non-renewal. Upon the occurrence of a change in control, the agreements will automatically remain in effect for two years following the change in control and will then terminate.
The employment agreements provided for 2014 annual base salaries of $377,000, $240,000, $215,000 and $236,000 for Mr. Funk, Ms. Evans, Mr. Ortale and Mr. Jehle, respectively. The base salaries will be reviewed annually and may be adjusted at
137
the discretion of the Board. The agreements provide that the executives will be eligible to receive performance-based annual incentive bonuses, in accordance with MidWest
One
Financial’s annual incentive plan, and also to receive employee benefits on as favorable a basis as other similarly situated senior executives of MidWest
One
Financial. The executives are also permitted to use a company-provided automobile.
The employment agreements provide for severance benefits in the event the executive is terminated by MidWest
One
Financial other than for cause or by the executive for good reason (“Termination”). For a Termination during the employment period that does not occur in connection with a change in control of MidWest
One
Financial, Mr. Funk would be entitled to receive an amount equal to 125% of his base salary and Ms. Evans, Mr. Ortale and Mr. Jehle would be entitled to receive an amount equal to 100% of her or his base salary. For a Termination that occurs within six months before or within 24 months after a change in control of MidWest
One
Financial (“Covered Period”), Mr. Funk would be entitled to receive an amount equal to 250% of his base salary plus bonus (“Base Compensation”) and Ms. Evans, Mr. Ortale and Mr. Jehle would be entitled to receive an amount equal to 200% of her or his Base Compensation. Any severance paid in connection with a Termination during a Covered Period would be paid in a single lump sum.
Following any Termination, whether or not occurring during a Covered Period, the executives and their eligible dependents would also be entitled to continued coverage under the medical and dental plans of MidWest
One
Financial for so long as each was eligible to and did elect COBRA continuation coverage. Each executive would be required to pay an amount for such coverage that is the same as what an active employee pays for such coverage.
All severance benefits under the employment agreements are contingent upon the executive’s execution and non-revocation of a general release and waiver of claims against MidWest
One
Financial. Further, all of the employment agreements contain restrictive covenants prohibiting the unauthorized disclosure of confidential information of MidWest
One
Financial by the executives during and after their employment with MidWest
One
Financial, and prohibiting the executives from competing with MidWest
One
Financial and from soliciting its employees or customers during employment and after termination of employment for any reason. The non-competition and non-solicitation provisions apply for a period of 15 months following any termination of employment.
Change of Control Agreement - Mr. Cantrell.
MidWest
One
Financial maintains a change of control agreement effective January 1, 2013 with Mr. Cantrell. The initial term of the agreement begins on January 1, 2013 and continues through December 31, 2013. The agreement will automatically extend for additional 12-month periods unless terminated by either party at least three months prior to the end of the then-current term. If a change of control occurs during the term of the agreement (or within six months following the end of the term), the agreement will remain in effect for the 12-month period immediately following the change of control and will then terminate.
The agreement provides for severance benefits upon Mr. Cantrell’s Termination that occurs within six months before or within 12 months after a change of control of MidWest
One
Financial. The amount of the severance benefit to which Mr. Cantrell would be entitled is equal to 125% of his Base Compensation. Mr. Cantrell and his eligible dependents would also be entitled to continued coverage under the medical and dental plans of MidWest
One
Financial for so long as they were eligible to and did elect COBRA continuation coverage. Mr. Cantrell would be required to pay an amount for such coverage that is the same as what an active employee pays for such coverage.
All severance benefits under the change of control agreement are contingent upon Mr. Cantrell’s execution and non-revocation of a general release and waiver of claims against MidWest
One
Financial. Further, the agreement contains restrictive covenants prohibiting the unauthorized disclosure of confidential information of MidWest
One
Financial by Mr. Cantrell during and after his employment with MidWest
One
Financial, and prohibiting Mr. Cantrell from competing with MidWest
One
Financial and from soliciting its employees or customers during employment and after termination of employment for any reason. The non-competition and non-solicitation provisions apply for a period of 12 months following any termination of employment.
Employment Agreement - Mr. Cantrell.
In early 2015, the Company and Mr. Cantrell entered into a new employment agreement which takes the place of Mr. Cantrell’s change of control agreement. The employment agreement has an initial term from January 1, 2015 through December 31, 2016. The term of the agreement will be automatically extended for an additional year beginning on January 1, 2017, and each 12 months thereafter, unless either party gives at least 90 days prior notice of non-renewal. Upon the occurrence of a change in control, the agreement will automatically remain in effect for two years and will then terminate. The terms of Mr. Cantrell’s agreement are similar in all material respects to the agreements of Ms. Evans, and Messrs. Ortale and Jehle.
138
DIRECTOR COMPENSATION
In
2014
, each director, with the exception of Mr. Funk (who was our only employee-director), was paid an annual retainer of $6,500 and received a fee of $2,000 for each regular board meeting attended. Mr. Monson, as the chairman, received an annual retainer fee of $8,000. In addition, when committee meetings were held on a day in which there was no full board meeting, directors received $500 for each Audit Committee and Compensation Committee meeting attended, and $250 for each meeting of the Nominating and Corporate Governance Committee. The chairman of each of those committees also received an additional $250 for each such meeting. If a committee meeting was on the same day as a scheduled board meeting, the directors received $150 for each committee meeting attended and the chairman received $200 for each such meeting.
In
2014
, we also awarded each director of MidWest
One
Financial, other than Mr. Funk, 500 restricted stock units. Additionally, in January of
2015
, we awarded 500 restricted stock units to each non-employee director, with an estimated effective date of
May 15, 2015
. All of these awards vest after one year.
The following table shows compensation information for MidWest
One
Financial’s directors who received director fees in
2014
.
|
Name
(1)
|
Fees Earned or Paid in Cash ($)
(2)
|
Stock Awards ($)
(3)
|
Option Awards ($)
|
Change in Pension Value and Nonqualified Deferred Compensation Earnings
(4)
|
All Other Compensation ($)
|
Total ($)
|
|||||||||||||||||
|
(a)
|
(b)
|
(c)
|
(d)
|
(e)
|
(f)
|
(g)
|
|||||||||||||||||
|
Richard R. Donohue
|
$
|
26,175
|
|
$
|
11,525
|
|
—
|
|
$
|
2,418
|
|
$
|
10,550
|
|
$
|
50,668
|
|
||||||
|
Patricia A. Heiden
(5)
|
$
|
11,425
|
|
$
|
11,525
|
|
—
|
|
—
|
|
$
|
6,900
|
|
$
|
29,850
|
|
|||||||
|
Barbara J. Kniff-McCulla
|
$
|
17,675
|
|
$
|
11,525
|
|
—
|
|
—
|
|
$
|
9,900
|
|
$
|
39,100
|
|
|||||||
|
John S. Koza
(6)
|
$
|
6,842
|
|
$
|
—
|
|
—
|
|
—
|
|
$
|
2,366
|
|
$
|
9,208
|
|
|||||||
|
Robert J. Latham
|
$
|
17,675
|
|
$
|
11,525
|
|
—
|
|
—
|
|
$
|
12,525
|
|
$
|
41,725
|
|
|||||||
|
Tracy S. McCormick
|
$
|
23,225
|
|
$
|
11,525
|
|
—
|
|
—
|
|
$
|
950
|
|
$
|
35,700
|
|
|||||||
|
Kevin W. Monson
|
$
|
17,500
|
|
$
|
11,525
|
|
—
|
|
—
|
|
$
|
12,350
|
|
$
|
41,375
|
|
|||||||
|
John P. Pothoven
|
$
|
15,625
|
|
$
|
11,525
|
|
—
|
|
—
|
|
$
|
11,925
|
|
$
|
39,075
|
|
|||||||
|
William N. Ruud
|
$
|
17,375
|
|
$
|
11,525
|
|
—
|
|
—
|
|
$
|
—
|
|
$
|
28,900
|
|
|||||||
|
Richard J. Schwab
|
$
|
21,375
|
|
$
|
11,525
|
|
—
|
|
—
|
|
$
|
13,875
|
|
$
|
46,775
|
|
|||||||
|
Robert D. Wersen
(6)
|
$
|
6,842
|
|
$
|
—
|
|
—
|
|
—
|
|
$
|
2,950
|
|
$
|
9,792
|
|
|||||||
|
Stephen L. West
|
$
|
19,175
|
|
$
|
11,525
|
|
—
|
|
—
|
|
$
|
9,600
|
|
$
|
40,300
|
|
|||||||
|
R. Scott Zaiser
|
$
|
21,975
|
|
$
|
11,525
|
|
—
|
|
$
|
599
|
|
$
|
11,975
|
|
$
|
46,074
|
|
||||||
|
(1)
|
As our President and Chief Executive Officer, Mr. Funk receives no additional compensation for service on our board of directors. His compensation is included in the Executive Compensation section of this 10-K found on pages
131 to 138
.
|
|
(2)
|
W. Richard Summerwill serves as Director Emeritus. In his role as Director Emeritus, Mr. Summerwill is entitled to receive $250 per Bank board meeting attended and $500 per Company board meeting attended. During 2014, Mr. Summerwill received $2,250 for attending Bank board meetings and $1,000 for attending Company board meetings.
|
|
(3)
|
The amounts set forth in the “Stock Awards” column reflect the grant date fair value of restricted stock units awarded on May 15, 2014 valued in accordance with FASB ASC Topic 718.
|
|
(4)
|
Amounts reported include above-market interest, as determined for purposes of proxy disclosure rules only, accrued under the Director Deferred Fee Plan during the year.
|
|
(5)
|
Ms. Heiden joined the Board in April 2014.
|
|
(6)
|
Messrs. Koza and Wersen resigned from the Board in April 2014.
|
139
The table below summarizes each non-employee director’s outstanding equity awards as of
December 31, 2014
.
|
Option Awards
|
|||||||||
|
Name
|
Stock Awards
|
Exercisable
|
Unexercisable
|
||||||
|
Richard R. Donohue
|
815
|
|
—
|
|
—
|
|
|||
|
Patricia A. Heiden
|
500
|
|
—
|
|
—
|
|
|||
|
Barbara J. Kniff-McCulla
|
815
|
|
2,669
|
|
—
|
|
|||
|
John S. Koza
|
—
|
|
—
|
|
—
|
|
|||
|
Robert J. Latham
|
815
|
|
—
|
|
—
|
|
|||
|
Tracy S. McCormick
|
815
|
|
—
|
|
—
|
|
|||
|
Kevin W. Monson
|
815
|
|
—
|
|
—
|
|
|||
|
John P. Pothoven
|
815
|
|
—
|
|
—
|
|
|||
|
William N. Ruud
|
500
|
|
—
|
|
—
|
|
|||
|
Richard J. Schwab
|
500
|
|
—
|
|
—
|
|
|||
|
Robert D. Wersen
|
—
|
|
—
|
|
—
|
|
|||
|
Stephen L. West
|
815
|
|
—
|
|
—
|
|
|||
|
R. Scott Zaiser
|
815
|
|
3,047
|
|
—
|
|
|||
Compensation Committee Interlocks and Insider Participation
As discussed earlier, during the early part of 2014, the Compensation Committee of MidWest
One
Financial Group Inc. (“MidWest
One
Financial”) through the time of our annual shareholder meeting, was comprised of Messrs. West (Chairman), Latham, Wersen and Ms. Kniff-McCulla. Upon Mr. Wersen’s retirement from the board of directors in April 2014, Director William Ruud was appointed to MidWest
One
’s Compensation Committee and has served on the Committee since that time. None of these individuals were an officer or employee of MidWest
One
Financial or its subsidiaries in 2014, and none of these individuals is a former officer or employee of the organization. In addition, no executive officer served on the board of directors or compensation committee of any other corporation with respect to which any member of our Compensation Committee was engaged as an executive officer.
140
|
I
TEM
12.
|
S
ECURITY
O
WNERSHIP OF
C
ERTAIN
B
ENEFICIAL
O
WNERS AND
M
ANAGEMENT AND
R
ELATED
S
TOCKHOLDER
M
ATTERS
.
|
The following table sets forth certain information with respect to the beneficial ownership of our common stock at
February 27, 2015
, by each person known by us to be the beneficial owner of more than 5% of the outstanding common stock, by each director as of
February 27, 2015
, by each NEO, and by all directors and executive officers of MidWest
One
Financial as a group. Beneficial ownership has been determined for this purpose in accordance with Rule 13d-3 under the Exchange Act, under which a person is deemed to be the beneficial owner of securities if he or she has or shares voting power or investment power in respect of such securities or has the right to acquire beneficial ownership of securities within 60 days of
February 27, 2015
.
|
Name of Individual or
Number of Individuals in Group
|
Amount and Nature of
Beneficial Ownership
(1,2)
|
Percent
of Class
|
||||
|
Directors:
|
||||||
|
Charles N. Funk
|
80,790
|
|
(3)
|
1.0
|
%
|
|
|
Richard R. Donohue
|
31,330
|
|
(4)
|
*
|
|
|
|
Patricia A. Heiden
|
110
|
|
*
|
|
||
|
Barbara J. Kniff-McCulla
|
6,577
|
|
(5)
|
*
|
|
|
|
Robert J. Latham
|
126,048
|
|
(6)
|
1.5
|
%
|
|
|
Tracy S. McCormick
|
81,504
|
|
1.0
|
%
|
||
|
Kevin W. Monson
|
74,500
|
|
*
|
|
||
|
John P. Pothoven
|
83,087
|
|
(7)
|
1.0
|
%
|
|
|
William N. Ruud
|
—
|
|
*
|
|
||
|
Richard J. Schwab
|
3,059
|
|
(8)
|
*
|
|
|
|
Stephen L. West
|
27,750
|
|
*
|
|
||
|
R. Scott Zaiser
|
10,887
|
|
(9)
|
*
|
|
|
|
Other Named Executive Officers
|
||||||
|
Susan R. Evans
|
14,561
|
|
(10)
|
*
|
|
|
|
Kent L. Jehle
|
27,858
|
|
(11)
|
*
|
|
|
|
Gary J. Ortale
|
23,409
|
|
(12)
|
*
|
|
|
|
James M. Cantrell
|
4,944
|
|
(13)
|
*
|
|
|
|
All directors and executive officers as a group (16 persons)
|
596,414
|
|
7.1
|
%
|
||
*
Indicates that the individual or entity owns less than one percent of MidWest
One
Financial’s common stock.
|
(1)
|
The total number of shares of common stock issued and outstanding on
February 27, 2015
, was
8,370,309
.
|
|
(2)
|
The information contained in this column is based upon information furnished to us by the persons named above and as shown on our transfer records. The nature of beneficial ownership for shares shown in this column, unless otherwise noted, represents sole voting and investment power.
|
|
(3)
|
Includes 2,897 shares allocated to his ESOP account. Also includes options to purchase 7,500 shares of common stock exercisable within 60 days of
February 27, 2015
.
|
|
(4)
|
Includes 19,375 shares owned by Mr. Donohue’s spouse.
|
|
(5)
|
Includes 3,843 shares held in a revocable grantor trust. Also includes options to purchase 2,669 shares of common stock exercisable within 60 days of
February 27, 2015
.
|
|
(6)
|
Includes 8,077 shares owned by Mr. Latham’s spouse in an IRA account, 4,725 shares held in a trust by Mr. Latham’s spouse, and 19,405 shares held in an IRA for Mr. Latham. 54,181 shares are pledged in respect to a lending arrangement.
|
|
(7)
|
Includes 300 shares owned as custodian for a grandchild and 50,005 shares held in an IRA. Also includes 3,790 shares owned by Mr. Pothoven’s spouse, and 1,488 shares in his spouse’s ESOP account.
|
|
(8)
|
Includes 2,559 shares held in an IRA for Mr. Schwab.
|
|
(9)
|
Includes 121 shares owned by a corporation over which Mr. Zaiser has control. Also includes options to purchase 3,047 shares of common stock exercisable within 60 days of
February 27, 2015
.
|
|
(10)
|
Includes 2,323 shares allocated to her ESOP account. Also includes options to purchase 2,200 shares of common stock exercisable within 60 days of
February 27, 2015
.
|
|
(11)
|
Includes 2,623 shares allocated to his ESOP account, 2,300 shares held in an IRA, 1,000 shares held by his spouse, and 7,400 shares owned by a family limited liability corporation for which Mr. Jehle has voting and investment power. Also includes options to purchase
|
141
4,500 shares of common stock exercisable within 60 days of
February 27, 2015
. Includes 11,460 shares pledged in respect to a lending arrangement.
|
(12)
|
Includes 1,500 shares held in his spouse’s IRA, over which he has shared voting and investment power, 10,000 shares held in his IRA, and 2,222 shares allocated to his ESOP account. Also includes options to purchase 5,800 shares of common stock exercisable within 60 days of
February 27, 2015
.
|
|
(13)
|
Includes 1,031 shares allocated to his ESOP account and 500 shares held in his IRA.
|
Other Beneficial Owners
The following table sets forth certain information on each person known to the Company to be the beneficial owner of more than 5% of the Company's common stock. The ownership information is as of
February 27, 2015
.
|
Name and Address
|
Amount and Nature of
Beneficial Ownership
(1)
|
Percent
of Class
|
||||
|
John S. Koza
209 Lexington Avenue
Iowa City, Iowa 52246
|
883,466
|
|
(2)
|
10.6
|
%
|
|
|
(1)
|
The total number of shares of common stock issued and outstanding on
February 27, 2015
, was
8,370,309
.
|
|
(2)
|
Includes 60,325 shares owned by Mr. Koza’s spouse and 619,560 shares held in trusts over which Mr. Koza serves as the trustee. Mr. Koza retired from the Board in April 2014 and now serves as Director Emeritus.
|
EQUITY COMPENSATION PLAN INFORMATION
The table below sets forth the following information as of
December 31, 2014
for: (i) all equity compensation plans previously approved by our shareholders; and (ii) all equity compensation plans not previously approved by our shareholders:
|
(a)
|
the number of securities to be issued upon the exercise of outstanding options, warrants and rights;
|
|
(b)
|
the weighted-average exercise price of such outstanding options, warrants and rights; and
|
|
(c)
|
other than securities to be issued upon the exercise of such outstanding options, warrants and rights, the number of securities remaining available for future issuance under the plans.
|
Additional information regarding stock option plans is presented in Note 13 - Stock Compensation Plans in the notes to our consolidated financial statements.
|
Number of securities to be issued upon exercise of outstanding options, warrants and rights
(1)
|
Weighted-average exercise price of outstanding options, warrants and rights
(1)
|
Number of securities remaining available for future issuance under equity compensation plans (excluding securities reflected in column (a))
|
||||||||
|
(a)
|
(b)
|
(c)
|
||||||||
|
Equity compensation plans approved by securityholders
|
99,987
|
|
$
|
15.66
|
|
514,191
|
|
|||
|
Equity compensation plans not approved by securityholders
|
—
|
|
—
|
|
—
|
|
||||
|
Total
|
99,987
|
|
$
|
15.66
|
|
514,191
|
|
|||
|
(1)
|
The number of securities to be issued as shown in column (a) represents
47,590
outstanding options and
52,397
nonvested restricted stock units. The weighted-average exercise price shown in column (b) reflects only the weighted-average exercise price of the outstanding options and does not take into account the grant date fair value of the outstanding nonvested restricted stock units.
|
|
I
TEM
13.
|
C
ERTAIN
R
ELATIONSHIPS AND
R
ELATED
T
RANSACTIONS
,
AND
D
IRECTOR
I
NDEPENDENCE
.
|
Our directors and executive officers and their associates were customers of, and had transactions with, MidWest
One
Financial and our subsidiaries in the ordinary course of business during
2014
. Additional transactions may be expected to take place in the future. All outstanding loans, commitments to loan, transactions in repurchase agreements, certificates of deposit and depository relationships were in the ordinary course of business and were made on substantially the same terms, including interest rates, collateral and repayment terms on the extension of credit, as those prevailing at the time for comparable transactions with
142
other persons not related to MidWest
One
Financial or MidWest
One
Bank, and did not involve more than the normal risk of collectibility or present other unfavorable features. All such loans are approved by MidWest
One
Bank’s board of directors in accordance with bank regulatory requirements. Additionally, the Audit Committee considers other non-lending transactions between a director and MidWest
One
Financial, including its subsidiaries, to ensure that such transactions do not affect a director’s independence.
Additionally, pursuant to the Audit Committee’s written charter, the committee evaluates and pre-approves any non-lending, material transaction between MidWest
One
Financial and any director or officer. The charter does not provide any thresholds as to when a proposed transaction needs to be pre-approved, but the committee evaluates those proposed transactions that may affect a director’s independence or create a perception that the transaction was not fair to MidWest
One
Financial or not done at arm’s length. Generally, transactions which would not require disclosure in our proxy statement under SEC rules and regulations (without regard to the amount involved) do not require the committee’s pre-approval. A director may not participate in any discussion or approval by the committee of any related-party transaction with respect to which he or she is a related party, but must provide to the committee all material information reasonably requested concerning the transaction.
MidWest
One
Financial has from time to time engaged Neumann Monson, P.C. (“Neumann Monson”), an architectural services firm headquartered in Iowa City for which Mr. Monson, chairman of MidWest
One
Financial and MidWest
One
Bank, is President, Managing Partner and majority owner, to perform architectural and design services with respect to MidWest
One
Financial’s offices. During 2014, MidWestOne Financial paid Neumann Monson $315,000 for such services. The engagement of Neumann Monson to provide the services described was reviewed by our Audit Committee, which also monitors the level of services by Neumann Monson on a periodic basis. Apart from the approval and monitoring process involving the Audit Committee, Neumann Monson was retained in the ordinary course of business and MidWest
One
Financial believes that such services are provided to MidWest
One
Financial on terms no less favorable than those that would have been realized in transactions with unaffiliated parties.
|
I
TEM
14.
|
P
RINCIPAL
A
CCOUNTANT
F
EES AND
S
ERVICES
.
|
Accountant Fees
During the period covering the fiscal year ended
December 31, 2014
, McGladrey LLP performed performed the following professional services for the Company for which we paid the following amounts.
|
2014
|
||||||||
|
Audit Fees
(1)
|
$
|
258,000
|
|
|||||
|
Audit-Related Fees
(2)
|
—
|
|
||||||
|
Tax Fees
(3)
|
37,730
|
|
||||||
|
All Other Fees
(4)
|
41,454
|
|
||||||
|
Total Fees
|
$
|
337,184
|
|
|||||
|
(1)
|
Audit fees consist of fees for professional services provided for the audit of the Company’s annual financial statements and review of financial statements included in the Company’s Quarterly Reports on Form 10-Q, Annual Report on Form 10-K and related proxy statement and services normally provided by the independent auditor in connection with statutory and regulatory filings or engagements.
|
|||||||
|
(2)
|
Audit-related fees represent assurance and related services that are reasonably related to the performance of the audit or review of the Company’s financial statements.
|
|||||||
|
(3)
|
Tax fees represent fees for professional services related to tax compliance, preparation of original federal and state tax returns, claims for refunds, tax advice, and tax planning services.
|
|||||||
|
(4)
|
All other fees represent fees billed by the principal accountant for any other services performed in the year noted.
|
|||||||
143
During the period covering the fiscal year ended December 31, 2013, KPMG LLP performed performed the following professional services for the Company for which we paid the following amounts.
|
2013
|
||||||||
|
Audit Fees
(1)
|
$
|
362,083
|
|
|||||
|
Audit-Related Fees
(2)
|
—
|
|
||||||
|
Tax Fees
(3)
|
60,000
|
|
||||||
|
All Other Fees
(4)
|
—
|
|
||||||
|
Total Fees
|
$
|
422,083
|
|
|||||
|
(1)
|
Audit fees consist of fees for professional services provided for the audit of the Company’s annual financial statements and review of financial statements included in the Company’s Quarterly Reports on Form 10-Q, Annual Report on Form 10-K and related proxy statement and services normally provided by the independent auditor in connection with statutory and regulatory filings or engagements.
|
|||||||
|
(2)
|
Audit-related fees represent assurance and related services that are reasonably related to the performance of the audit or review of the Company’s financial statements.
|
|||||||
|
(3)
|
Tax fees represent fees for professional services related to tax compliance, preparation of original federal and state tax returns, claims for refunds, tax advice, and tax planning services.
|
|||||||
|
(4)
|
All other fees represent fees billed by the principal accountant for any other services performed in the year noted.
|
|||||||
Audit Committee Pre-Approval Policy
Among other things, the Audit Committee is responsible for appointing, setting compensation for and overseeing the work of the independent registered public accounting firm. The Audit Committee’s policy is to pre-approve all audit and permissible non-audit services provided by its independent auditors and all such services provided in
2013
and
2014
were approved. These services include audit and audit-related services, tax services, and other services. The Audit Committee may also pre-approve particular services on a case-by-case basis that the committee had not already specifically approved.
|
I
TEM
15.
|
E
XHIBITS AND
F
INANCIAL
S
TATEMENT
S
CHEDULES
.
|
Financial Statements and Schedules
The Consolidated Financial Statements of MidWest
One
Financial Group, Inc. and Subsidiaries are included in
Item 8
of this report.
Exhibits
The exhibits required by Item 601 of Regulation S-K are included with this Form 10-K and are listed on the “
Index to Exhibits
” immediately following the signature page.
144
SIGNATURES
Pursuant to the requirements of Section 13 or 15(d) of the Securities Exchange Act of 1934, the Registrant has duly caused this report to be signed on its behalf by the undersigned, thereunto duly authorized.
|
M
ID
W
EST
O
NE
F
INANCIAL
G
ROUP
, I
NC
.
|
|||||
|
Dated:
|
March 5, 2015
|
By:
|
|
/s/ C
HARLES
N. F
UNK
|
|
|
|
Charles N. Funk
|
||||
|
|
President and Chief Executive Officer
|
||||
|
By:
|
|
/s/ G
ARY
J. O
RTALE
|
|||
|
|
Gary J. Ortale
|
||||
|
|
Executive Vice President and Chief Financial Officer
|
||||
Pursuant to the requirements of the Securities Exchange Act of 1934, this report has been signed below by the following persons on behalf of the Registrant and in the capacities and on the dates indicated.
|
Signature
|
Title
|
Date
|
||
|
/s/ C
HARLES
N. F
UNK
|
President and Chief Executive Officer;
|
March 5, 2015
|
||
|
Charles N. Funk
|
Director (principal executive officer)
|
|||
|
Executive Vice President
|
||||
|
/s/ G
ARY
J. O
RTALE
|
and Chief Financial Officer
|
March 5, 2015
|
||
|
Gary J. Ortale
|
(principal financial officer and
|
|||
|
principal accounting officer)
|
||||
|
/s/ K
EVIN
W. M
ONSON
|
Chairman of the Board
|
March 5, 2015
|
||
|
Kevin W. Monson
|
||||
|
/s/ R
ICHARD
R. D
ONOHUE
|
Director
|
March 5, 2015
|
||
|
Richard R. Donohue
|
||||
|
/s/ P
ATRICIA
A. H
EIDEN
|
Director
|
March 5, 2015
|
||
|
Patricia A. Heiden
|
||||
|
/s/ R
OBERT
J. L
ATHAM
|
Director
|
March 5, 2015
|
||
|
Robert J. Latham
|
||||
|
/s/ T
RACY
S. M
C
C
ORMICK
|
Director
|
March 5, 2015
|
||
|
Tracy S. McCormick
|
||||
|
/s/ B
ARBARA
J. K
NIFF
-
M
C
C
ULLA
|
Director
|
March 5, 2015
|
||
|
Barbara J. Kniff - McCulla
|
||||
|
/s/ J
OHN
P. P
OTHOVEN
|
Director
|
March 5, 2015
|
||
|
John P. Pothoven
|
||||
145
|
/s/ W
ILLIAM
N. R
UUD
|
Director
|
March 5, 2015
|
||
|
William N. Ruud
|
||||
|
/s/ R
ICHARD
J. S
CHWAB
|
Director
|
March 5, 2015
|
||
|
Richard J. Schwab
|
||||
|
/s/ S
TEPHEN
L. W
EST
|
Director
|
March 5, 2015
|
||
|
Stephen L. West
|
||||
|
/s/ R. S
COTT
Z
AISER
|
Director
|
March 5, 2015
|
||
|
R. Scott Zaiser
|
||||
146
INDEX TO EXHIBITS
|
Exhibit
|
||||
|
Number
|
Description
|
Incorporated by Reference to:
|
||
|
2.1
|
Agreement and Plan of Merger, dated
|
Exhibit 2.1 to the Company’s Current Report on Form 8-K
|
||
|
November 20, 2014, between MidWestOne Financial
|
filed with the SEC on November 21, 2014
|
|||
|
Group, Inc. and Central Bancshares, Inc.
|
||||
|
3.1
|
Amended and Restated Articles of Incorporation of
|
Exhibit 3.3 to the Company’s Amendment No. 1 to
|
||
|
MidWestOne Financial Group, Inc. filed with the
|
Registration Statement on Form S-4 (File No. 333-147628)
|
|||
|
Secretary of State of the State of Iowa on March 14, 2008
|
filed with the SEC on January 14, 2008
|
|||
|
3.2
|
Articles of Amendment (First Amendment) to the
|
Exhibit 3.1 to the Company’s Current Report on Form 8-K
|
||
|
Amended and Restated Articles of Incorporation of
|
filed with the SEC on January 23, 2009
|
|||
|
MidWestOne Financial Group, Inc. filed with the
|
||||
|
Secretary of State of the State of Iowa on
|
||||
|
January 23, 2009
|
||||
|
3.3
|
Articles of Amendment (Second Amendment) to the
|
Exhibit 3.1 to the Company’s Current Report on Form 8-K
|
||
|
Amended and Restated Articles of Incorporation of
|
filed with the SEC on February 6, 2009
|
|||
|
MidWestOne Financial Group, Inc. filed with the
|
||||
|
Secretary of State of the State of Iowa on
|
||||
|
February 4, 2009 (containing the Certificate of
|
||||
|
Designations for the Company’s Fixed Rate
|
||||
|
Cumulative Perpetual Preferred Stock, Series A)
|
||||
|
3.4
|
Second Amended and Restated Bylaws of MidWestOne
|
Exhibit 3.1 to the Company’s Current Report on Form 8-K
|
||
|
Financial Group, Inc.
|
filed with the SEC on July 17, 2013
|
|||
|
4.1
|
Reference is made to Exhibits 3.1 through 3.4 hereof.
|
N/A
|
||
|
4.2
|
Shareholders Agreement, by and among MidWest
One
|
Exhibit 99.1 to the Company’s Current Report on Form 8-K
|
||
|
Financial Group, Inc., Riverbank Insurance Center, Inc.,
|
filed with the SEC on November 21, 2014
|
|||
|
CBS LLC, John M. Morrison Revocable Trust #4 and
|
||||
|
John M. Morrison dated November 20, 2014.
|
||||
|
10.1
|
States Resources Corp. Loan Participation and Servicing
|
Exhibit 10.3.4 of former MidWest
One
Financial Group, Inc.’s
|
||
|
Agreement, dated February 5, 1999 between States
|
Form 10-K for the year ended December 31, 1999
|
|||
|
Resources Corp. and MidWest
One
Financial Group, Inc.
|
||||
|
(as successor in interest to Mahaska Investment
|
||||
|
Company)
|
||||
|
10.2
|
MidWest
One
Financial Group, Inc. Employee Stock
|
Exhibit 10.1 of former MidWest
One
Financial Group, Inc.’s
|
||
|
Ownership Plan & Trust, as amended and restated
|
Form 10-K for the year ended December 31, 2006
|
|||
|
10.3
|
Mahaska Investment Company 1998 Stock Incentive Plan
|
Exhibit 10.2.3 of former MidWest
One
Financial Group, Inc.’s
|
||
|
Form 10-K for the year ended December 31, 1997
|
||||
|
10.4
|
MidWest
One
Financial Group, Inc. 2006 Stock
|
Appendix A of Former MidWest
One
Financial Group, Inc.’s
|
||
|
Incentive Plan
|
Definitive Proxy Statement on Schedule 14A filed with the
|
|||
|
SEC on March 21, 2006
|
||||
147
|
Exhibit
|
||||
|
Number
|
Description
|
Incorporated by Reference to:
|
||
|
10.5
|
ISB Financial Corp. (now known as MidWest
One
|
Appendix F of the Joint Proxy Statement-Prospectus
|
||
|
Financial Group, Inc.) 2008 Equity Incentive Plan
|
constituting part of the Company’s Amendment No. 2 to
|
|||
|
Registration Statement on Form S-4 (File No. 333-147628)
|
||||
|
filed with the SEC on January 22, 2008
|
||||
|
10.6
|
Employment Agreement between MidWest
One
Financial
|
Exhibit 10.1 to the Company’s Current Report on
|
||
|
Group, Inc. and Charles N. Funk, dated January 1, 2013
|
Form 8-K/A filed with the SEC on March 12, 2013
|
|||
|
10.7
|
Employment Agreement between MidWest
One
Financial
|
Exhibit 10.2 to the Company’s Current Report on
|
||
|
Group, Inc. and Kent L. Jehle, dated January 1, 2013
|
Form 8-K/A filed with the SEC on March 12, 2013
|
|||
|
10.8
|
Supplemental Retirement Agreement between Iowa State
|
Exhibit 10.11 of the Company’s Registration Statement on
|
||
|
Bank & Trust Company (now known as MidWest
One
|
Form S-4 (File No. 333-147628) filed with the SEC on
|
|||
|
Bank) and W. Richard Summerwill, dated January 1,
|
November 27, 2007
|
|||
|
1,998
|
||||
|
10.9
|
Supplemental Retirement Agreement between Iowa State
|
Exhibit 10.13 of the Company’s Registration Statement on
|
||
|
Bank & Trust Company (now known as MidWest
One
|
Form S-4 (File No. 333-147628) filed with the SEC on
|
|||
|
Bank) and Charles N. Funk, dated November 1, 2001
|
November 27, 2007
|
|||
|
10.10
|
First Amended and Restated Supplemental Retirement
|
Exhibit 10.10 to the Company’s Form 10-K for the year
|
||
|
Agreement between Iowa State Bank & Trust Company
|
ended December 31, 2012
|
|||
|
(now known as MidWest
One
Bank) and Gary J. Ortale,
|
||||
|
dated April 1, 2004
|
||||
|
10.11
|
Amended and Restated Supplemental Retirement
|
Exhibit 10.15 of the Company’s Amendment No. 1 to
|
||
|
Agreement between Iowa State Bank & Trust Company
|
Registration Statement on Form S-4 (File No. 333-147628)
|
|||
|
(now known as MidWest
One
Bank) and John S. Koza,
|
filed with the SEC on January 14, 2008
|
|||
|
dated January 1, 1998
|
||||
|
10.12
|
Supplemental Retirement Agreement between Iowa State
|
Exhibit 10.16 of the Company’s Amendment No. 1 to
|
||
|
Bank & Trust Company (now known as MidWest
One
|
Registration Statement on Form S-4 (File No. 333-147628)
|
|||
|
Bank) and Kent L. Jehle, dated January 1, 1998, as
|
filed with the SEC on January 14, 2008
|
|||
|
amended by the First Amendment to the Supplemental
|
||||
|
Retirement Agreement, dated January 1, 2003
|
||||
|
10.13
|
Second Supplemental Retirement Agreement between
|
Exhibit 10.17 of the Company’s Amendment No. 1 to
|
||
|
Iowa State Bank & Trust Company (now known as
|
Registration Statement on Form S-4 (File No. 333-147628)
|
|||
|
MidWest
One
Bank) and Kent L. Jehle, dated January 1,
|
filed with the SEC on January 14, 2008
|
|||
|
2002
|
||||
|
10.14
|
Supplemental Retirement Agreement between Iowa State
|
Exhibit 10.14 to the Company’s Form 10-K for the year
|
||
|
Bank & Trust Company (now known as MidWest
One
|
ended December 31, 2012
|
|||
|
Bank) and Susan R. Evans, dated April 1, 2004
|
||||
|
10.15
|
Employment Agreement between MidWest
One
Financial
|
Exhibit 10.3 to the Company’s Current Report on
|
||
|
Group, Inc. and Gary J. Ortale, dated January 1, 2013
|
Form 8-K/A filed with the SEC on March 12, 2013
|
|||
|
10.16
|
Employment Agreement between MidWest
One
Financial
|
Exhibit 10.4 to the Company’s Current Report on
|
||
|
Group, Inc. and Susan R. Evans, dated January 1, 2013
|
Form 8-K/A filed with the SEC on March 12, 2013
|
|||
148
|
Exhibit
|
||||
|
Number
|
Description
|
Incorporated by Reference to:
|
||
|
10.17
|
Employment Agreement between MidWestOne Financial
|
Exhibit 10.1 to the Company’s Current Report on
|
||
|
Group, Inc. and James M. Cantrell, dated January 1, 2015
|
Form 8-K filed with the SEC on February 9, 2015
|
|||
|
10.18
|
Construction Agreement between MidWest
One
Bank and
|
Exhibit 10.1 to the Company’s Current Report on Form 8-K
|
||
|
Knutson Construction Services Midwest, dated
|
filed with the SEC on August 2, 2013
|
|||
|
July 17, 2013
|
||||
|
10.19
|
Construction Agreement between MidWest
One
Bank and
|
Exhibit 10.1 to the Company’s Current Report on Form 8-K
|
||
|
McComas Lacina Construction, dated December 20, 2013
|
filed with the SEC on December 26, 2013
|
|||
|
21.1
|
Subsidiaries of MidWest
One
Financial Group, Inc.
|
Filed herewith
|
||
|
23.1
|
Consent of McGladrey LLP
|
Filed herewith
|
||
|
23.2
|
Consent of KPMG LLP
|
Filed herewith
|
||
|
31.1
|
Certification of Chief Executive Officer pursuant to
|
Filed herewith
|
||
|
Rule 13a-14(a) and Rule 15d-14(a)
|
||||
|
31.2
|
Certification of Chief Financial Officer pursuant to
|
Filed herewith
|
||
|
Rule 13a-14(a) and Rule 15d-14(a)
|
||||
|
32.1
|
Certification of Chief Executive Officer pursuant to
|
Filed herewith
|
||
|
18 U.S.C. Section 1350, as adopted pursuant to
|
||||
|
Section 906 of the Sarbanes-Oxley Act of 2002
|
||||
|
32.2
|
Certification of Chief Financial Officer pursuant to
|
Filed herewith
|
||
|
18 U.S.C. Section 1350, as adopted pursuant to
|
||||
|
Section 906 of the Sarbanes-Oxley Act of 2002
|
||||
|
101.INS
|
XBRL Instance Document
|
Filed herewith
|
||
|
101.SCH
|
XBRL Taxonomy Extension Schema Document
|
Filed herewith
|
||
|
101.CAL
|
XBRL Taxonomy Extension Calculation Linkbase
|
Filed herewith
|
||
|
Document
|
||||
|
101.DEF
|
XBRL Taxonomy Extension Definition Linkbase
|
Filed herewith
|
||
|
Document
|
||||
|
101.LAB
|
XBRL Taxonomy Extension Label Linkbase Document
|
Filed herewith
|
||
|
101.PRE
|
XBRL Taxonomy Extension Presentation Linkbase
|
Filed herewith
|
||
|
Document
|
||||
149
TABLE OF CONTENTS
Part IItem 1. BusinessNote 20. Proposed Merger To Our Consolidated Financial StatementsItem 1A. Risk FactorsItem 1B. Unresolved Staff CommentsItem 2. PropertiesItem 3. Legal ProceedingsItem 4. Mine Safety DisclosuresPart IIItem 5. Market For Registrant S Common Equity, Related Stockholder Matters and Issuer Purchases Of Equity SecuritiesItem 6. Selected Financial DataItem 7. Management S Discussion and Analysis Of Financial Condition and Results Of OperationsItem 7. Management S Discussion and Analysis Of Financial Condition and Results Of OperationsItem 7A. Quantitative and Qualitative Disclosures About Market RiskItem 8. Financial Statements and Supplementary DataNote 1. Nature Of Business and Significant Accounting PoliciesNote 2. Investment SecuritiesNote 3. Loans Receivable and The Allowance For Loan LossesNote 4. Premises and EquipmentNote 5. Intangible AssetsNote 6. Other AssetsNote 7. Loans Serviced For OthersNote 8. Time DepositsNote 9. Short-term BorrowingsNote 10. Federal Home Loan Bank Borrowings and Long-term DebtNote 11. Income TaxesNote 12. Employee Benefit PlansNote 13. Stock Compensation PlansNote 14. Earnings Per Common ShareNote 15. Regulatory Capital Requirements and Restrictions on Subsidiary CashNote 16. Commitments and ContingenciesNote 17. Related Party TransactionsNote 18. Estimated Fair Value Of Financial Instruments and Fair Value MeasurementsNote 19. Variable Interest EntitiesNote 20. Proposed MergerNote 21. Parent Company Only Financial InformationNote 22. Segment ReportingNote 23. Subsequent EventsNote 24. Quarterly Results Of Operations (unaudited)Item 9. Changes in and Disagreements with Accountants on Accounting and Financial DisclosureItem 9A. Controls and ProceduresItem 9B. Other InformationPart IIIItem 10. Directors, Executive Officers and Corporate GovernanceItem 11. Executive CompensationItem 12. Security Ownership Of Certain Beneficial Owners and Management and Related Stockholder MattersItem 13. Certain Relationships and Related Transactions, and Director IndependenceItem 14. Principal Accountant Fees and ServicesPart IVItem 15. Exhibits and Financial Statement Schedules