MOLINA HEALTHCARE, INC.
10-Ks and 10-Qs
|
|
|
|
|
|
|
|
|
|
|
|
|
|
|
|
|
|
|
|
|
|
|
|
|
|
|
|
|
|
|
|
|
|
|
|
|
|
|
|
|
|
|
|
|
|
|
|
|
|
UNITED STATES
SECURITIES AND EXCHANGE COMMISSION
Washington, D.C. 20549
Form 10-K
(Mark One)
|
x
|
ANNUAL REPORT PURSUANT TO SECTION 13 OR 15(d) OF THE SECURITIES EXCHANGE ACT OF 1934
|
FOR THE FISCAL YEAR ENDED DECEMBER 31, 2016
or
|
¨
|
TRANSITION REPORT PURSUANT TO SECTION 13 OR 15(d) OF THE SECURITIES EXCHANGE ACT OF 1934
|
Commission File Number 1-31719

MOLINA HEALTHCARE, INC.
(Exact name of registrant as specified in its charter)
|
Delaware
|
13-4204626
|
|
|
(State or other jurisdiction of
|
(I.R.S. Employer
|
|
|
incorporation or organization)
|
Identification No.)
|
|
200 Oceangate, Suite 100, Long Beach, California 90802
(Address of principal executive offices)
(562) 435-3666
(Registrant’s telephone number, including area code)
Securities registered pursuant to Section 12(b) of the Act:
|
Title of Class
|
Name of Each Exchange on Which Registered
|
|
|
Common Stock, $0.001 Par Value
|
New York Stock Exchange
|
|
Securities registered pursuant to Section 12(g) of the Act:
None
Indicate by check mark if the registrant is a well-known seasoned issuer, as defined in Rule 405 of the Securities Act.
ý
Yes
¨
No
Indicate by check mark if the registrant is not required to file reports pursuant to Section 13 or Section 15(d) of the Act.
¨
Yes
ý
No
Indicate by check mark whether the registrant (1) has filed all reports required to be filed by Section 13 or 15(d) of the Securities Exchange Act of 1934 during the preceding 12 months (or for such shorter period that the registrant was required to file such reports), and (2) has been subject to such filing requirements for the past 90 days.
ý
Yes
¨
No
Indicate by check mark whether the registrant has submitted electronically and posted on its corporate Web site, if any, every Interactive Data File required to be submitted and posted pursuant to Rule 405 of Regulation S-T during the preceding 12 months (or for such shorter period that the registrant was required to submit and post such files).
ý
Yes
¨
No
Indicate by check mark if disclosure of delinquent filers pursuant to Item 405 of Regulation S-K is not contained herein, and will not be contained, to the best of registrant’s knowledge, in definitive proxy or information statements incorporated by reference in Part III of this Form 10-K or any amendment to this Form 10-K.
ý
Indicate by check mark whether the registrant is a large accelerated filer, an accelerated filer, a non-accelerated filer, or a smaller reporting company. See the definitions of “large accelerated filer,” “accelerated filer” and “smaller reporting company” in Rule 12b-2 of the Exchange Act. (Check one):
|
Large accelerated filer
|
ý
|
Accelerated filer
|
¨
|
|
|
Non-accelerated filer
|
¨
|
(Do not check if a smaller reporting company)
|
Smaller reporting company
|
¨
|
Indicate by check mark whether the registrant is a shell company (as defined in Rule 12b-2 of the Exchange Act).
¨
Yes
ý
No
The aggregate market value of Common Stock held by non-affiliates of the registrant as of June 30,
2016
, the last business day of our most recently completed second fiscal quarter, was approximately $2,077.8 million (based upon the closing price for shares of the registrant’s Common Stock as reported by the New York Stock Exchange, Inc. on June 30,
2016
).
As of
February 24, 2017
, approximately
56,750,000
shares of the registrant’s Common Stock, $0.001 par value per share, were outstanding.
DOCUMENTS INCORPORATED BY REFERENCE
Portions of the registrant’s Proxy Statement for the
2017
Annual Meeting of Stockholders to be held on May 3,
2017
, are incorporated by reference into Part III of this Form 10-K, to the extent described therein.
MOLINA HEALTHCARE, INC. 2016 FORM 10-K
CROSS-REFERENCE INDEX
|
ITEM NUMBER
|
Page
|
||
|
PART I
|
|||
|
1.
|
Business
|
3-6, 9-14, 19-20, 36-37
|
|
|
1A.
|
1-2, 37-58
|
|
|
|
1B.
|
Not Applicable.
|
|
|
|
2.
|
|
||
|
3.
|
|
||
|
4.
|
Not Applicable.
|
|
|
|
5.
|
34-36
|
|
|
|
6.
|
33-34
|
|
|
|
7.
|
6-32
|
|
|
|
7A.
|
23
|
|
|
|
8.
|
62-119
|
|
|
|
9.
|
Not Applicable.
|
|
|
|
9A.
|
|
||
|
9B.
|
Not Applicable.
|
|
|
|
10.
|
|
||
|
11.
|
(a)
|
|
|
|
12.
|
(b)
|
|
|
|
13.
|
(c), Note 17, Note 18
|
|
|
|
14.
|
(d)
|
|
|
|
15.
|
120-126
|
|
|
|
(a)
|
Incorporated by reference to “Executive Compensation” in the 2017 Proxy Statement.
|
|
(b)
|
Incorporated by reference to “Security Ownership of Certain Beneficial Owners and Management” in the 2017 Proxy Statement.
|
|
(c)
|
Incorporated by reference to “Related Party Transactions” and “Corporate Governance and Board of Directors Matters — Director Independence” in the 2017 Proxy Statement.
|
|
(d)
|
Incorporated by reference to “Fees Paid to Independent Registered Public Accounting Firm” in the 2017 Proxy Statement.
|
MOLINA HEALTHCARE, INC. 2016 FORM 10-K
TABLE OF CONTENTS
|
Page
|
|||
FORWARD LOOKING STATEMENTS
This Annual Report on Form 10-K (“Form 10-K”) contains forward-looking statements within the meaning of the Private Securities Litigation Reform Act of 1995 that involve risks and uncertainties. Many of the forward-looking statements are located under the heading “Management’s Discussion and Analysis of Financial Condition and Results of Operations.” Forward-looking statements provide current expectations of future events based on certain assumptions and include any statement that does not directly relate to any historical or current fact. Forward-looking statements can also be identified by words such as “future,” “anticipates,” “believes,” “estimates,” “expects,” “intends,” “plans,” “predicts,” “will,” “would,” “could,” “can,” “may,” and similar terms. Forward-looking statements are not guarantees of future performance and the Company’s actual results may differ significantly due to numerous known and unknown risks and uncertainties. Those known risks and uncertainties include, but are not limited to, the risk factors identified in the section of this report titled “Risk Factors,” as well as the following:
|
•
|
the success of our profit improvement and cost-cutting initiatives;
|
|
•
|
the numerous political and market-based uncertainties associated with the Affordable Care Act (the “ACA”) or “Obamacare,” including any potential repeal and replacement of the law, amendment of the law, or move to state block grants for Medicaid;
|
|
•
|
the market dynamics surrounding the ACA Marketplaces, including but not limited to uncertainties associated with risk transfer requirements, the potential for disproportionate enrollment of higher acuity members, the withdrawal of cost sharing subsidies and/or premium tax credits, the adequacy of agreed rates, and potential disruption associated with market withdrawal;
|
|
•
|
subsequent adjustments to reported premium revenue based upon subsequent developments or new information, including changes to estimated amounts payable or receivable related to Marketplace risk adjustment/risk transfer, risk corridors, and reinsurance;
|
|
•
|
management of our medical costs, including our ability to reduce over time the high medical costs commonly associated with new patient populations;
|
|
•
|
our ability to predict with a reasonable degree of accuracy utilization rates, including utilization rates in new plans, geographies, and programs where we have less experience with patient and provider populations, and also including utilization rates associated with seasonal flu patterns or other newly emergent diseases;
|
|
•
|
significant budget pressures on state governments and their potential inability to maintain current rates, to implement expected rate increases, or to maintain existing benefit packages or membership eligibility thresholds or criteria, including the resolution of the Illinois budget impasse and continued payment of all amounts due to our Illinois health plan;
|
|
•
|
the success of our efforts to retain existing government contracts, including those in Illinois, Washington, Florida, Texas, and New Mexico, and to obtain new government contracts in connection with state requests for proposals (RFPs) in both existing and new states;
|
|
•
|
our ability to manage growth, including maintaining and creating adequate internal systems and controls relating to authorizations, approvals, provider payments, and the overall success of our care management initiatives;
|
|
•
|
our ability to consummate and realize benefits from acquisitions, and to integrate acquisitions;
|
|
•
|
our receipt of adequate premium rates to support increasing pharmacy costs, including costs associated with specialty drugs and costs resulting from formulary changes that allow the option of higher-priced non-generic drugs;
|
|
•
|
our ability to operate profitably in an environment where the trend in premium rate increases lags behind the trend in increasing medical costs;
|
|
•
|
the interpretation and implementation of federal or state medical cost expenditure floors, administrative cost and profit ceilings, premium stabilization programs, profit sharing arrangements, and risk adjustment provisions;
|
|
•
|
our estimates of amounts owed for such cost expenditure floors, administrative cost and profit ceilings, premium stabilization programs, profit-sharing arrangements, and risk adjustment provisions;
|
|
•
|
the Medicaid expansion cost corridors in New Mexico and Washington, and any other retroactive adjustment to revenue where methodologies and procedures are subject to interpretation or dependent upon information about the health status of participants other than Molina members;
|
|
•
|
the interpretation and implementation of at-risk premium rules and state contract performance requirements regarding the achievement of certain quality measures, and our ability to recognize revenue amounts associated therewith;
|
|
•
|
cyber-attacks or other privacy or data security incidents resulting in an inadvertent unauthorized disclosure of protected health information;
|
Molina Healthcare, Inc. 2016 Form 10-K | 1
|
•
|
the success of our health plan in Puerto Rico, including the resolution of the Puerto Rico debt crisis, payment of all amounts due under our Medicaid contract, the effect of the PROMESA law, and our efforts to better manage the health care costs of our Puerto Rico health plan;
|
|
•
|
the success and renewal of our duals demonstration programs in California, Illinois, Michigan, Ohio, South Carolina, and Texas;
|
|
•
|
the accurate estimation of incurred but not reported or paid medical costs across our health plans;
|
|
•
|
efforts by states to recoup previously paid and recognized premium amounts;
|
|
•
|
the continuation and renewal of the government contracts of our health plans, Molina Medicaid Solutions, and Pathways, and the terms under which such contracts are renewed;
|
|
•
|
complications, member confusion, or enrollment backlogs related to the annual renewal of Medicaid coverage;
|
|
•
|
government audits and reviews, or potential investigations, and any fine, sanction, enrollment freeze, monitoring program, or premium recovery that may result therefrom;
|
|
•
|
changes with respect to our provider contracts and the loss of providers;
|
|
•
|
approval by state regulators of dividends and distributions by our health plan subsidiaries;
|
|
•
|
changes in funding under our contracts as a result of regulatory changes, programmatic adjustments, or other reforms;
|
|
•
|
high dollar claims related to catastrophic illness;
|
|
•
|
the favorable resolution of litigation, arbitration, or administrative proceedings;
|
|
•
|
the relatively small number of states in which we operate health plans;
|
|
•
|
the availability of adequate financing on acceptable terms to fund and capitalize our expansion and growth, repay our outstanding indebtedness at maturity and meet our liquidity needs, including the interest expense and other costs associated with such financing;
|
|
•
|
our failure to comply with the financial or other covenants in our credit agreement or the indentures governing our outstanding notes;
|
|
•
|
the sufficiency of our funds on hand to pay the amounts due upon conversion of our outstanding notes;
|
|
•
|
the failure of a state in which we operate to renew its federal Medicaid waiver;
|
|
•
|
changes generally affecting the managed care or Medicaid management information systems industries;
|
|
•
|
increases in government surcharges, taxes, and assessments, including but not limited to the deductibility of certain compensation costs;
|
|
•
|
newly emergent viruses or widespread epidemics, public catastrophes or terrorist attacks, and associated public alarm;
and
|
|
•
|
increasing competition and consolidation in the Medicaid industry
.
|
Each of the terms “Company,” “Molina Healthcare,” “we,” “our,” and “us,” as used herein refers collectively to Molina Healthcare, Inc. and its wholly owned subsidiaries, unless otherwise stated. The Company assumes no obligation to revise or update any forward-looking statements for any reason, except as required by law.
Molina Healthcare, Inc. 2016 Form 10-K | 2
ABOUT MOLINA HEALTHCARE
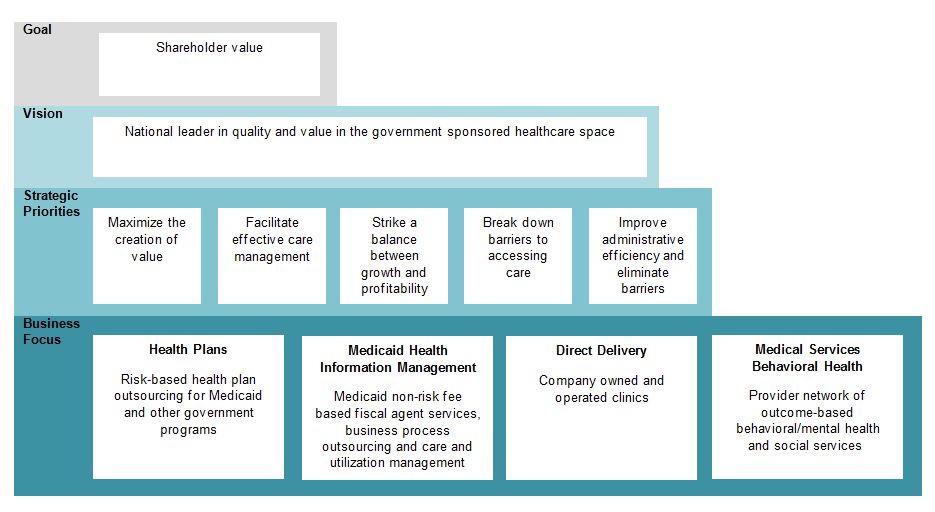
OUR VISION, MISSION, AND STRATEGY
We envision a future where everyone receives quality healthcare.
Our mission is to provide quality healthcare to people receiving government assistance.
We offer healthcare services for persons served by Medicaid, Medicare, the Children’s Health Insurance Program (CHIP) and the Marketplace, and products to assist government agencies in their administration of the Medicaid program.
OUR GOAL IS TO ACHIEVE OUR MISSION WHILE IMPROVING THE FINANCIAL STRENGTH OF OUR ORGANIZATION
|
2016
|
||||||
|
(Dollars in millions, except per-share amounts)
|
||||||
|
Total Revenue
|
Net Income per Diluted Share
|
Adjusted Net Income Per Share*
|
||||
|
$17,782
|
$0.92
|
$1.28
|
||||
|
Net Profit Margin
|
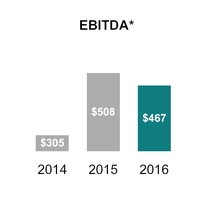
EBITDA*
|
Ending Membership
|
||||
|
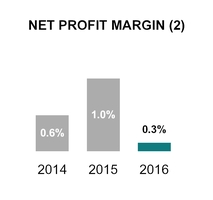
0.3
|
%
|
$467
|
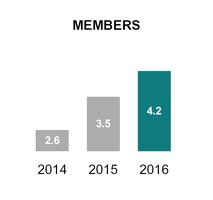
4,227,000
|
|
||
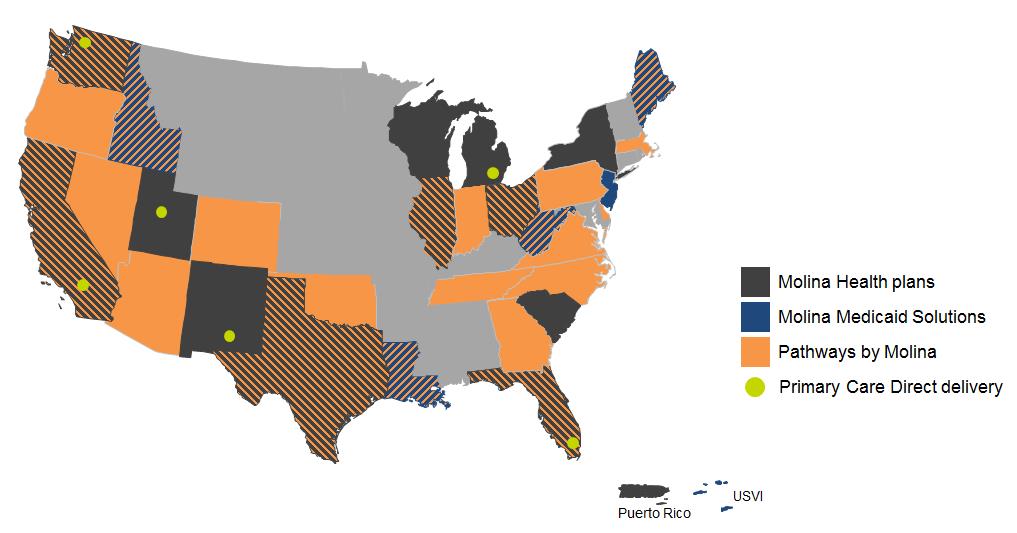
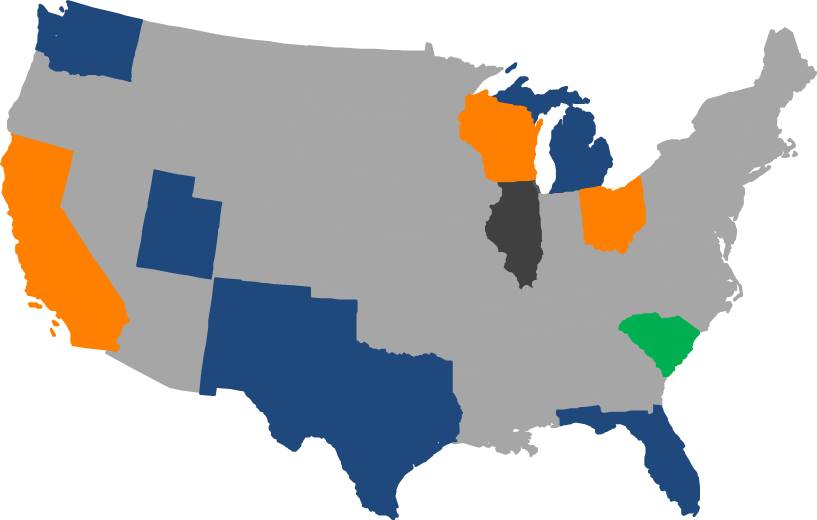
OUR FOOTPRINT TODAY
Our health plan footprint includes the five largest Medicaid markets.
Molina Healthcare, Inc. 2016 Form 10-K | 3
OUR BUSINESS STRATEGY
Significant accomplishments in support of our strategic growth initiatives during
2016
included:
|
•
|
Medicaid contract acquisitions at our existing health plans in Illinois, Michigan and Washington that added approximately 221,000 Medicaid members in the first quarter of 2016.
|
|
•
|
Acquisition of the outstanding equity interests of Molina Healthcare of New York, Inc., formerly known as Today’s Options of New York, Inc., that added approximately
35,000
Medicaid members in the third quarter of 2016.
|
We believe that our strategy positions us well to respond to the following trends in Medicaid and Medicare:
|
•
|
The transition of long-term care services for fee-for-service to managed care
|
|
•
|
States’ continued reliance on Medicaid
|
|
•
|
Growth in Medicare driven by an aging population
|
|
•
|
Increasing spend on home and community based services
|
|
•
|
Further integration of medical and behavioral health services
|
|
•
|
A growing focus on addressing the social determinants of health—social determinants are the conditions in the places where people live, learn, work, and play which affect a wide range of health risks and outcomes
|
We believe the key to our successful, sustained growth is to maintain our focus on our mission and adhere to the core competencies that give us an advantage over our competitors, including the ability to understand the needs of our members and the social and economic factors influencing their health.
For example, attracting elderly and disabled Medicaid and Medicare beneficiaries to our health plans is a key part of our growth strategy, because these beneficiaries can especially benefit from our expertise in connecting our members to the right resources to help them maintain and improve their health.
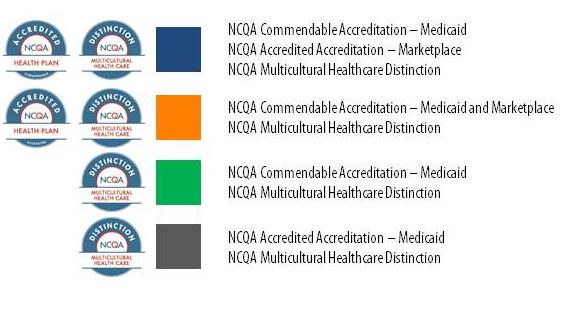
Our long-term success also depends on the quality of the services we provide and the value that we create. We are a recognized quality leader, with 11 of our 13 Medicaid health plans currently accredited by the National Committee for Quality Assurance (NCQA). Nine of our health plans have been accredited for Marketplace as well. In addition, 11 of our 13 health plans have earned the Multicultural Health Care Distinction from NCQA, awarded to organizations that meet or exceed its rigorous requirements for multicultural health care.
Molina Healthcare, Inc. 2016 Form 10-K | 4
In addition, in late 2016, we announced that all of our eligible health plans increased or maintained their scores as part of the Centers for Medicare & Medicaid Services’ (CMS) 2017 Star Ratings, which measures the quality of Medicare plans across the country on a 5-star rating system.
We believe that these objective measures of quality are increasingly important to state Medicaid agencies as a growing number of states link reimbursement and patient assignment to quality scores. Additionally, Medicare pays quality bonuses to health plans that achieve high quality.
Based on the published results, Molina Healthcare of New Mexico was named the highest-rated Medicare plan in the state with a 4-star rating, while Molina Healthcare of Florida increased from 3 to 3.5 stars. Furthermore, Molina Healthcare of Michigan was rated the highest Medicare Dual-eligible Special Needs Plan (D-SNP) in the state with 3.5 stars. Other Molina health plans that retained their 3.5 Medicare star rating include Texas, Utah and Washington.
|
|
OUR SEGMENTS
We manage our operations through
three
reportable segments. These segments consist of our Health Plans segment, which comprises the vast majority of our operations; our Molina Medicaid Solutions segment; and our Other segment, which includes our behavioral health and social services subsidiary, Pathways.
We regularly evaluate the appropriateness of our reportable segments, particularly in light of organizational changes, acquisition activity and changing laws and regulations. Therefore, these reportable segments may change in the future.
Business and financial overviews for our reportable segments are provided in “MD&A—Reportable Segments.”
Refer to Notes to Consolidated Financial Statements, Note
2
, “
Significant Accounting Policies
” for revenue information by state health plan, and Note
20
, “
Segment Information
,” for segment revenue, profit and total assets information.
COMPETITIVE CONDITIONS AND ENVIRONMENT
We face varying levels of competition. Health care reform proposals may cause organizations to enter or exit the market for government sponsored health programs. However, the licensing requirements and bidding and contracting procedures in some states may present partial barriers to entry into our industry.
We compete for government contracts, renewals of those government contracts, members, and providers. State agencies consider many factors in awarding contracts to health plans. Among such factors are the health plan’s provider network, quality scores, medical management, degree of member satisfaction, timeliness of claims payment, and financial resources. Potential members typically choose a health plan based on a specific provider being a part of the network, the quality of care and services available, accessibility of services, and reputation or name recognition of the health plan. We believe factors that providers consider in deciding whether to contract with
Molina Healthcare, Inc. 2016 Form 10-K | 5
a health plan include potential member volume, payment methods, timeliness and accuracy of claims payment, and administrative service capabilities.
For further competitor information specific to each of our reportable segments, refer to “MD&A—Reportable Segments.”
MANAGEMENT’S DISCUSSION AND ANALYSIS OF FINANCIAL CONDITION AND RESULTS OF OPERATIONS (MD&A)
NON-GAAP FINANCIAL MEASURES
We use non-GAAP financial measures as supplemental metrics in evaluating our financial performance, making financing and business decisions, and forecasting and planning for future periods. For these reasons, management believes such measures are useful supplemental measures to investors in comparing our performance to the performance of other public companies in the health care industry. These non-GAAP financial measures should be considered as supplements to, and not as substitutes for or superior to, GAAP measures.
See further information regarding non-GAAP measures in the “Supplemental Information” section of this MD&A, including the reconciliations to U.S. GAAP. Non-GAAP financial measures referred to in this report are designated with an asterisk (*).
HOW WE ASSESS PERFORMANCE
We derive our revenues primarily from health insurance premiums, and our primary customers are state Medicaid agencies and the federal government.
One of the key metrics used to assess the performance of our most significant segment, the Health Plans segment, is the medical care ratio (“MCR”). The medical care ratio represents the amount of medical care costs as a percentage of premium revenue. Therefore, the underlying gross margin, or the amount earned by the Health Plans segment after medical costs are deducted from premium revenue, is the most important measure of earnings reviewed by management.
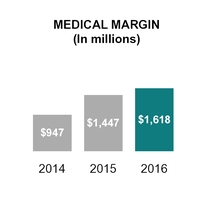
Gross margin for our Health Plans segment is referred to as “Medical margin,” and for our Molina Medicaid Solutions and Other segments, as “Service margin.” The service margin is equal to service revenue minus cost of service revenue. Management’s discussion and analysis of the changes in the individual components of gross margin, by reportable segment, is presented in the “Reportable Segments” section of this MD&A.
Molina Healthcare, Inc. 2016 Form 10-K | 6
KEY PERFORMANCE INDICATORS
(Dollars and membership in millions, except per-share amounts)
|
(1)
|
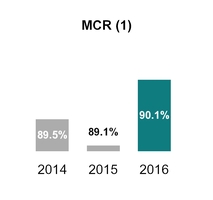
Medical care ratio represents medical care costs as a percentage of premium revenue.
|
Molina Healthcare, Inc. 2016 Form 10-K | 7
|
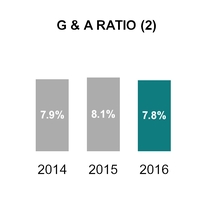
(2)
|
General and administrative expense ratio represents general and administrative expenses as a percentage of total revenue. Net profit margin represents net income as a percentage of total revenue.
|
|
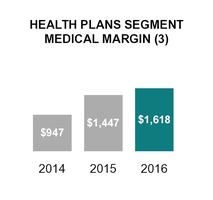
(3)
|
Medical margin is equal to premium revenue minus medical costs.
|
See discussion of Key Performance Indicators in the “Consolidated Results” and “Reportable Segments” sections of this MD&A.
CONSOLIDATED RESULTS
FISCAL YEAR 2016 FINANCIAL HIGHLIGHTS
|
•
|
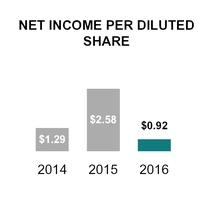
Net income per diluted share decreased to
$0.92
in 2016 compared with
$2.58
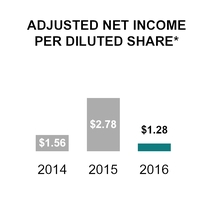
in 2015. Adjusted net income per diluted share* decreased to
$1.28
in 2016 compared with
$2.78
in 2015. The decrease in net income was primarily the result of the declining profitability of our Marketplace program.
|
|
•
|
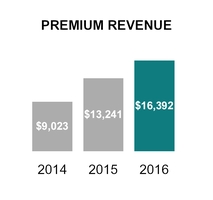
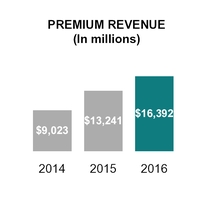
Strong enrollment growth generated approximately
$16.4 billion
of premium revenue, or
24%
more premium revenue in 2016 compared with 2015. Enrollment growth was primarily due to increased Marketplace enrollment and the acquisition of Medicaid managed care membership.
|
|
•
|
The medical care ratio increased to
90.1%
in 2016, from
89.1%
in 2015, due to lower Marketplace margins. The medical care ratio of our Marketplace program increased to
92.9%
in 2016 from
73.8%
in 2015.
|
MOLINA’S 2017 ACTION PLAN
We have identified the following areas of focus and related actions to execute in 2017:
|
1.
|
Stabilize Marketplace Performance:
|
We will continue to advocate for the immediate remediation of risk transfer methodologies that penalize comparatively efficient and affordable health plans like ours and, by extension, those individual consumers in need of affordable health insurance. In particular, we are recommending that the planned change to the Marketplace risk transfer methodology, which is currently scheduled to take effect on January 1, 2018, be brought forward in time and implemented immediately in 2017. Had that same planned methodology change been in effect in 2016, we estimate that our pre-tax income in 2016 would have been approximately $70 million higher.
In January 2017, we filed suit on behalf of our health plans seeking recovery from the federal government of approximately
$52 million
in Marketplace risk corridor payments for calendar year 2015. Based upon current estimates, we believe our health plans are also owed approximately
$90 million
in Marketplace risk corridor payments from the federal government for calendar year 2016, and a further nominal amount for calendar year 2014. Our lawsuit seeks recovery of all of these unpaid amounts. We have not recognized revenue, nor have we recorded a receivable, for any amount due from the federal government for unpaid Marketplace risk corridor payments as of December 31, 2016. We have fully recognized all liabilities due to the federal government that we have incurred under the Marketplace risk corridor program, and have paid all amounts due to the federal government as required.
|
2.
|
Improve Medicaid performance in Illinois, Ohio and Washington:
|
Inadequate premium rates limited profitability in Illinois, Ohio and Washington in 2016. Effective January 1, 2017, we received blended rate increases of approximately 5% in Illinois, 4% in Ohio and 4% in Washington. We expect improved profitability in all three plans in 2017 as a result of these rate increases and company-wide cost containment measures.
|
3.
|
Sustain the improvements achieved in Puerto Rico:
|
Results at our Puerto Rico health plan have improved in the second half of 2016, primarily as a result of management actions undertaken beginning in the spring of 2016. We expect the benefit of those actions to continue into 2017.
Molina Healthcare, Inc. 2016 Form 10-K | 8
REPORTABLE SEGMENTS
SEGMENT SUMMARY
|
2016
|
2015
|
2014
|
|||||||||
|
(In millions)
|
|||||||||||
|
Segment gross margin:
|
|||||||||||
|
Health Plans medical margin
(1)
|
$
|
1,618
|
|
$
|
1,447
|
|
$
|
947
|
|
||
|
Molina Medicaid Solutions service margin
(2)
|
21
|
|
55
|
|
53
|
|
|||||
|
Other
(2)
|
33
|
|
5
|
|
—
|
|
|||||
|
Total segment gross margin
|
1,672
|
|
1,507
|
|
1,000
|
|
|||||
|
Other operating revenues
(3)
|
851
|
|
684
|
|
434
|
|
|||||
|
Other operating expenses
(4)
|
(2,217
|
)
|
(1,804
|
)
|
(1,241
|
)
|
|||||
|
Operating income
|
306
|
|
387
|
|
193
|
|
|||||
|
Other expenses, net
|
101
|
|
65
|
|
58
|
|
|||||
|
Income before income tax expense
|
205
|
|
322
|
|
135
|
|
|||||
|
Income tax expense
|
153
|
|
179
|
|
73
|
|
|||||
|
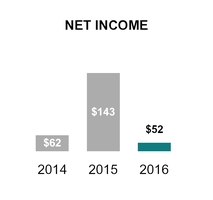
Net income
|
$
|
52
|
|
$
|
143
|
|
$
|
62
|
|
||
_______________________
|
(1)
|
Represents premium revenue minus medical care costs.
|
|
(2)
|
Represents service revenue minus cost of service revenue.
|
|
(3)
|
Other operating revenues include premium tax revenue, health insurer fee revenue, investment income and other revenue.
|
|
(4)
|
Other operating expenses include general and administrative expenses, premium tax expenses, health insurer fee expenses and depreciation and amortization.
|
HEALTH PLANS
BUSINESS OVERVIEW
|
▪
|
96.9%
of total revenue in 2016
|
|
▪
|
98.2%
of total revenue in 2015
|
|
▪
|
Employees: Approximately 7,700
|
Programs and Services
The Health Plans segment consists of health plans in
12
states and the Commonwealth of Puerto Rico, and includes our direct delivery business. As of
December 31, 2016
, these health plans served over
4.2 million
members eligible for Medicaid, Medicare, and other government-sponsored health care programs for low-income families and individuals. This membership includes Affordable Care Act Marketplace (Marketplace) members, most of whom receive government premium subsidies. The health plans are operated by our respective wholly owned subsidiaries in those states, each of which is licensed as a health maintenance organization (HMO).
Our health plans’ state Medicaid contracts generally have terms of
three
to
four
years. These contracts typically contain renewal options exercisable by the state Medicaid agency, and allow either the state or the health plan to terminate the contract with or without cause. Our health plan subsidiaries have generally been successful in retaining their contracts, but such contracts are subject to risk of loss when a state issues a new request for proposal (RFP) open to competitive bidding by other health plans. If one of our health plans is not a successful responsive bidder to a state RFP, its contract may be subject to non-renewal.
In addition to contract renewal, our state Medicaid contracts may be periodically amended to include or exclude certain health benefits (such as pharmacy services, behavioral health services, or long-term care services); populations such as the aged, blind or disabled (ABD); and regions or service areas.
Molina Healthcare, Inc. 2016 Form 10-K | 9
Molina Healthcare, Inc. 2016 Form 10-K | 10
Membership by Health Plan and Program
The following tables set forth our Health Plans membership as of the dates indicated:
_______________________
|
|
As of December 31,
|
|||||||
|
|
2016
|
2015
|
2014
|
|||||
|
Ending Membership by Health Plan:
|
||||||||
|
California
|
683,000
|
|
620,000
|
|
531,000
|
|
||
|
Florida
|
553,000
|
|
440,000
|
|
164,000
|
|
||
|
Illinois
|
195,000
|
|
98,000
|
|
100,000
|
|
||
|
Michigan
|
391,000
|
|
328,000
|
|
242,000
|
|
||
|
New Mexico
|
254,000
|
|
231,000
|
|
212,000
|
|
||
|
New York
(1)
|
35,000
|
|
—
|
|
—
|
|
||
|
Ohio
|
332,000
|
|
327,000
|
|
347,000
|
|
||
|
Puerto Rico
(2)
|
330,000
|
|
348,000
|
|
—
|
|
||
|
South Carolina
|
109,000
|
|
99,000
|
|
118,000
|
|
||
|
Texas
|
337,000
|
|
260,000
|
|
245,000
|
|
||
|
Utah
|
146,000
|
|
102,000
|
|
83,000
|
|
||
|
Washington
|
736,000
|
|
582,000
|
|
497,000
|
|
||
|
Wisconsin
|
126,000
|
|
98,000
|
|
84,000
|
|
||
|
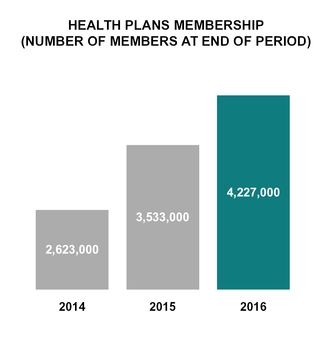
4,227,000
|
|
3,533,000
|
|
2,623,000
|
|
|||
|
Ending Membership by Program:
|
||||||||
|
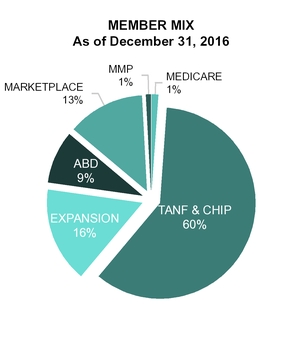
Temporary Assistance for Needy Families (TANF) and Children’s Health Insurance Program (CHIP )
|
2,536,000
|
|
2,312,000
|
|
1,809,000
|
|
||
|
Medicaid Expansion
|
673,000
|
|
557,000
|
|
385,000
|
|
||
|
Marketplace
|
526,000
|
|
205,000
|
|
15,000
|
|
||
|
Aged, Blind or Disabled (ABD)
|
396,000
|
|
366,000
|
|
347,000
|
|
||
|
Medicare-Medicaid Plan (MMP) – Integrated
(3)
|
51,000
|
|
51,000
|
|
18,000
|
|
||
|
Medicare Special Needs Plans (Medicare)
|
45,000
|
|
42,000
|
|
49,000
|
|
||
|
4,227,000
|
|
3,533,000
|
|
2,623,000
|
|
|||
|
(1)
|
The New York health plan was acquired on August 1, 2016.
|
|
(2)
|
The Puerto Rico health plan began serving members on April 1, 2015.
|
|
(3)
|
MMP members who receive both Medicaid and Medicare coverage from Molina Healthcare.
|
Our Industry
Medicaid.
Medicaid was established in 1965 under the U.S. Social Security Act to provide health care and long-term care services and supports to low-income Americans. Although jointly funded by federal and state governments, Medicaid is a state-operated and state-implemented program. Subject to federal laws and regulations, states have significant flexibility to structure their own programs in terms of eligibility, benefits, delivery of services, and provider payments. As a result, there are 56 separate Medicaid programs—one for each U.S. state, each U.S. territory, and the District of Columbia.
The federal government guarantees matching funds to states for qualifying Medicaid expenditures based on each state’s federal medical assistance percentage (FMAP). A state’s FMAP is calculated annually and varies inversely with average personal income in the state. The average FMAP across all jurisdictions is currently about 59%, and ranges from a federally established FMAP floor of 50% to as high as 75%.
We participate in the following Medicaid programs:
|
•
|
TANF - TANF, the most common state-administered Medicaid, covers primarily low-income mothers and children.
|
|
•
|
ABD - State-administered ABD programs cover low-income persons with chronic physical disabilities or behavioral health impairments. ABD beneficiaries typically use more services than those served by other Medicaid programs because of their critical health issues.
|
|
•
|
CHIP - CHIP is a joint federal and state matching program that provides health care coverage to children whose families earn too much to qualify for Medicaid coverage. States have the option of administering CHIP through their Medicaid programs.
|
Molina Healthcare, Inc. 2016 Form 10-K | 11
|
•
|
Medicaid Expansion -
In states that have elected to participate, Medicaid Expansion provides eligibility to nearly all low-income people under age 65 with incomes at or below 138% of the federal poverty line.
|
Marketplace.
The ACA authorized the creation of Marketplace insurance exchanges, allowing individuals and small groups to purchase health insurance that is federally subsidized, effective January 1, 2014. We participate in the Marketplace in all of the states in which we operate, except Illinois, New York, Puerto Rico and South Carolina.
Medicare.
Medicare is a federal program that provides eligible persons age 65 and over and some disabled persons with a variety of hospital, medical insurance, and prescription drug benefits. Medicare is funded by Congress, and administered by CMS. Medicare beneficiaries may enroll in a Medicare Advantage plan, under which managed care plans contract with CMS to provide benefits that are comparable to original Medicare. Such benefits are provided in exchange for a fixed per-member per-month (PMPM) premium payment that varies based on the county in which a member resides, the demographics of the member, and the member’s health condition. Since 2006, Medicare beneficiaries have had the option of selecting a new prescription drug benefit from an existing Medicare Advantage plan. The drug benefit, available to beneficiaries for a monthly premium, is subject to certain cost sharing depending upon the specific benefit design of the selected plan.
MMPs
. Nine million low-income elderly and disabled people are covered under both the Medicare and Medicaid programs. These beneficiaries are more likely than other Medicare beneficiaries to be frail, live with multiple chronic conditions, and have functional and cognitive impairments. Medicare is their primary source of health insurance coverage. Medicaid supplements Medicare by paying for services not covered by Medicare, such as dental care and long-term care services and support, and by helping to cover Medicare’s premiums and cost-sharing requirements. Together, these two programs help to shield very low-income Medicare beneficiaries from potentially unaffordable out-of-pocket medical and long-term care costs. To coordinate care for those who qualify to receive both Medicare and Medicaid services (the “dual eligible”), and to deliver services to these individuals in a more financially efficient manner, some states have undertaken demonstration programs to integrate Medicare and Medicaid services for dual eligible individuals. The health plans participating in such demonstrations are referred to as MMPs. We operate MMPs in six states.
Significant Trends and Developments
ACA.
As a result of the election of President Trump and the GOP control of both houses of Congress, there is currently a great deal of discussion and debate about the repeal and replacement of the ACA. As a result, the future of the ACA and its underlying programs are subject to substantial uncertainty, making long-term business planning exceedingly difficult. We are unable to predict with any degree of certainty whether the ACA will be modified or repealed in its entirety, and if it is repealed, what it will be replaced with; nor are we able to predict when any such changes, if enacted, would become effective.
Currently, there are a number of different legislative proposals being considered, some of which would involve significantly reduced federal spending on the Medicaid program, and constitute a fundamental change in the federal role in health care. These proposals include elements such as the following: ending the entitlement nature of Medicaid (and perhaps Medicare as well) by capping future increases in federal health spending for these programs, and shifting much more of the risk for health costs in the future to states and consumers; reversing the ACA’s expansion of Medicaid that enables states to cover low-income childless adults; changing Medicaid to a state block grant program, including potentially capping spending on a per-enrollee basis (a “per capita cap”); prohibiting the federal government from operating Marketplaces; eliminating the advanced premium tax credits, and cost-sharing reductions for low income individuals who purchase their health insurance through the Marketplaces; expanding and encouraging the use of private health savings accounts; providing for insurance plans that offer fewer and less extensive health insurance benefits than under the ACA’s essential health benefits package, including broader use of catastrophic coverage plans; establishing and funding high risk pools or reinsurance programs for individuals with chronic or high cost conditions; allowing insurers to sell insurance across state lines; and numerous other potential changes and reforms. Changes to or the repeal of the ACA, or the adoption of new health care regulatory laws, could have a material adverse effect on our business, financial condition, cash flows or results of operations.
Proposed Medicare Acquisition.
In August 2016, we entered into substantially identical agreements with each of Aetna Inc. and Humana Inc. to acquire certain of their Medicare Advantage membership and other assets related to such Medicare Advantage business (the Proposed Medicare Acquisition), for cash. The Proposed Medicare Acquisition was subject to closing conditions including, but not limited to, the completion of the proposed acquisition of Humana by Aetna (the Aetna-Humana Merger). In January 2017, the U.S. District Court for the District of Columbia granted the request made by the U.S. Department of Justice in its civil antitrust lawsuit against Aetna and Humana, to prohibit the Aetna-Humana Merger (the District Court Order). In February 2017, the Proposed Medicare
Molina Healthcare, Inc. 2016 Form 10-K | 12
Acquisition was terminated by the parties pursuant to the terms of the transaction. Under the termination agreement, we are entitled to receive from Aetna and Humana an aggregate termination fee of
$75 million
(the breakup fee).
In addition, we are entitled to reimbursement of reasonable and documented out-of-pocket expenses incurred by us and our affiliates in connection with the Proposed Medicare Acquisition. We will record the breakup fee as other income in the first quarter of 2017.
Completed Acquisitions.
Medicaid contract acquisitions at our existing health plans in Illinois, Michigan and Washington added approximately 221,000 Medicaid members in the first quarter of 2016. Acquisition of the outstanding equity interests of Molina Healthcare of New York, Inc., formerly known as Today’s Options of New York, Inc., added approximately
35,000
Medicaid members in the third quarter of 2016.
Basis for our Premium Rates
Medicaid.
Under our Medicaid contracts, state government agencies pay our health plans fixed PMPM rates that vary by state, line of business and demographics; and we arrange, pay for and manage health care services provided to Medicaid beneficiaries. Therefore, our health plans are at risk for the medical costs associated with their members’ health care. The rates we receive are subject to change by each state and, in some instances, provide for adjustments for health risk factors. CMS requires these rates to be actuarially sound. Payments to us under each of our Medicaid contracts are subject to the annual appropriation process in the applicable state.
Medicare.
Under Medicare Advantage, managed care plans contract with CMS to provide benefits in exchange for a fixed PMPM premium payment that varies based on the county in which a member resides, and adjusted for demographic and health risk factors. CMS also considers inflation, changes in utilization patterns and average per capita fee-for-service Medicare costs in the calculation of the fixed PMPM premium payment. Amounts payable to us under the Medicare Advantage contracts are subject to annual revision by CMS, and we elect to participate in each Medicare service area or region on an annual basis. Medicare Advantage premiums paid to us are subject to federal government reviews and audits which can result, and have resulted, in retroactive and prospective premium adjustments. Compared with our Medicaid plans, Medicare Advantage contracts generate higher average PMPM revenues and health care costs.
Marketplace
. For our Marketplace plans, we develop premium rates during the spring of each year for policies effective in the following calendar year. Premium rates are based on our estimates of projected member utilization, medical unit costs, member risk acuity, member risk transfer, and administrative costs, with the intent of realizing a target pretax percentage profit margin. Our actuaries certify the actuarial soundness of Marketplace premiums in the rate filings submitted to the various state and federal authorities for approval.
Premiums by Program
The amount of the premiums paid to our health plans may vary substantially between states and among various government programs. The following table sets forth the ranges of premiums paid to our state health plans by program on a PMPM basis, for the year ended
December 31, 2016
. The “Consolidated” column represents the weighted-average amounts for our total membership by program.
|
PMPM Premiums
|
|||||||||||
|
Low
|
High
|
Consolidated
|
|||||||||
|
TANF and CHIP
|
$
|
120.00
|
|
$
|
400.00
|
|
$
|
180.00
|
|
||
|
Medicaid Expansion
|
300.00
|
|
480.00
|
|
380.00
|
|
|||||
|
Marketplace
|
170.00
|
|
360.00
|
|
230.00
|
|
|||||
|
ABD
|
390.00
|
|
1,520.00
|
|
990.00
|
|
|||||
|
MMP – Integrated
|
1,240.00
|
|
3,240.00
|
|
2,130.00
|
|
|||||
|
Medicare
|
820.00
|
|
1,100.00
|
|
1,030.00
|
|
|||||
Molina Healthcare, Inc. 2016 Form 10-K | 13
Competition
The Medicaid managed care industry is subject to ongoing changes as a result of health care reform, business consolidations and new strategic alliances. We compete with national, regional, and local Medicaid service providers, principally on the basis of size, location, quality of provider network, quality of service, and reputation. Our primary competitors in the Medicaid managed care industry include Centene Corporation, WellCare Health Plans, Inc., UnitedHealth Group Incorporated, Anthem, Inc., and Aetna Inc. Competition can vary considerably from state to state.
Regulation
Our health plans are highly regulated by both state and federal government agencies. Regulation of managed care products and health care services varies from jurisdiction to jurisdiction, and changes in applicable laws and rules occur frequently. Regulatory agencies generally have discretion to issue regulations and interpret and enforce laws and rules. Such agencies have become increasingly active in recent years in their review and scrutiny of health insurers and managed care organizations, including those operating in the Medicaid and Medicare programs.
HIPAA.
In 1996, Congress enacted the Health Insurance Portability and Accountability Act (HIPAA). All health plans are subject to HIPAA, including ours. HIPAA generally requires health plans to:
|
•
|
Establish the capability to receive and transmit electronically certain administrative health care transactions, like claims payments, in a standardized format;
|
|
•
|
Afford privacy to patient health information; and
|
|
•
|
Protect the privacy of patient health information through physical and electronic security measures.
|
Health care reform created additional tools for fraud prevention, including increased oversight of providers and suppliers participating or enrolling in Medicaid, CHIP, and Medicare. Those enhancements included mandatory licensure for all providers, and site visits, fingerprinting, and criminal background checks for higher risk providers.
Regulatory Capital Requirements and Dividend Restrictions.
Our health plans are subject to stringent minimum capitalization requirements that limit their ability to pay dividends to us. For further information, refer to the Notes to Consolidated Financial Statements, Note
19
, “
Commitments and Contingencies
—Regulatory Capital Requirements and Dividend Restrictions.”
FINANCIAL OVERVIEW
Molina Healthcare, Inc. 2016 Form 10-K | 14
2016 Compared with 2015
In
2016
, a
27%
increase in membership, partially offset by a
3%
decrease in revenue PMPM, resulted in increased premium revenue of
24%
, or
$3.2 billion
, when compared with
2015
. The decline in PMPM premium revenue was primarily the result of lower PMPM premiums for Medicaid Expansion membership and an increase in the percentage of our premium revenue derived from TANF and Marketplace membership.
The medical care ratio
increased
to
90.1%
in
2016
, from
89.1%
in
2015
. The increase in our medical care ratio was driven primarily by Marketplace membership. Medical margin (measured in absolute dollars) increased
12%
in
2016
over
2015
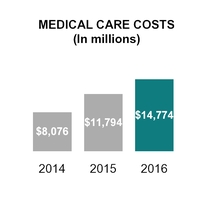
. The medical care ratio of all of our programs excluding Marketplace decreased by 10 basis points between 2015 and 2016, as decreasing margins in Medicaid Expansion (where we saw a 300 basis point increase in our medical care ratio) were offset by improved margins in other programs. Consolidated medical care costs measured on a PMPM basis decreased approximately
3%
in 2016 when compared with 2015.
2015 Compared with 2014
In
2015
, a
42%
increase in membership and a
5%
increase in revenue PMPM resulted in increased premium revenue of
47%
, or over
$4.2 billion
, when compared with 2014.
Enrollment growth was primarily due to increased Medicaid expansion, increased Marketplace and integrated Medicare-Medicaid Plan (MMP) enrollment, and the start-up of the Puerto Rico health plan in April 2015.
Our medical margin increased nearly 53% in 2015 over 2014, and our consolidated medical care ratio decreased to 89.1% in 2015 from 89.5% in 2014.
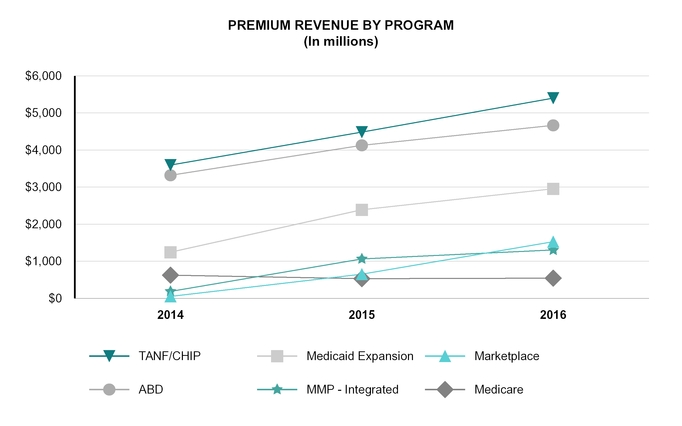
FINANCIAL PERFORMANCE BY PROGRAM
The following tables summarize member months, premium revenue, medical care costs, medical care ratio, and medical margin by program for the periods indicated (PMPM amounts are in whole dollars; member months and other dollar amounts are in millions):
|
Year Ended December 31, 2016
(1)
|
|||||||||||||||||||||||||
|
Member
Months
(2)
|
Premium Revenue
|
Medical Care Costs
|
MCR
(3)
|
Medical Margin
|
|||||||||||||||||||||
|
Total
|
PMPM
|
Total
|
PMPM
|
||||||||||||||||||||||
|
TANF and CHIP
|
30.2
|
|
$
|
5,403
|
|
$
|
179.21
|
|
$
|
4,950
|
|
$
|
164.18
|
|
91.6
|
%
|
$
|
453
|
|
||||||
|
Medicaid Expansion
|
7.8
|
|
2,952
|
|
378.58
|
|
2,475
|
|
317.37
|
|
83.8
|
|
477
|
|
|||||||||||
|
Marketplace
|
6.7
|
|
1,525
|
|
228.44
|
|
1,416
|
|
212.17
|
|
92.9
|
|
109
|
|
|||||||||||
|
ABD
|
4.7
|
|
4,666
|
|
991.24
|
|
4,277
|
|
908.39
|
|
91.6
|
|
389
|
|
|||||||||||
|
MMP
|
0.6
|
|
1,303
|
|
2,131.97
|
|
1,141
|
|
1,866.93
|
|
87.6
|
|
162
|
|
|||||||||||
|
Medicare
|
0.5
|
|
543
|
|
1,033.15
|
|
515
|
|
981.36
|
|
95.0
|
|
28
|
|
|||||||||||
|
50.5
|
|
$
|
16,392
|
|
$
|
324.82
|
|
$
|
14,774
|
|
$
|
292.75
|
|
90.1
|
%
|
$
|
1,618
|
|
|||||||
|
Year Ended December 31, 2015
(1)
|
|||||||||||||||||||||||||
|
Member
Months
(2)
|
Premium Revenue
|
Medical Care Costs
|
MCR
(3)
|
Medical Margin
|
|||||||||||||||||||||
|
Total
|
PMPM
|
Total
|
PMPM
|
||||||||||||||||||||||
|
TANF and CHIP
|
25.5
|
|
$
|
4,483
|
|
$
|
175.64
|
|
$
|
4,122
|
|
$
|
161.50
|
|
92.0
|
%
|
$
|
361
|
|
||||||
|
Medicaid Expansion
|
5.9
|
|
2,389
|
|
408.51
|
|
1,931
|
|
330.18
|
|
80.8
|
|
458
|
|
|||||||||||
|
Marketplace
|
2.6
|
|
652
|
|
251.96
|
|
481
|
|
185.85
|
|
73.8
|
|
171
|
|
|||||||||||
|
ABD
|
4.3
|
|
4,124
|
|
966.83
|
|
3,784
|
|
887.27
|
|
91.8
|
|
340
|
|
|||||||||||
|
MMP
|
0.5
|
|
1,063
|
|
2,034.51
|
|
974
|
|
1,863.93
|
|
91.6
|
|
89
|
|
|||||||||||
|
Medicare
|
0.5
|
|
530
|
|
1,038.15
|
|
502
|
|
982.50
|
|
94.6
|
|
28
|
|
|||||||||||
|
39.3
|
|
$
|
13,241
|
|
$
|
337.28
|
|
$
|
11,794
|
|
$
|
300.43
|
|
89.1
|
%
|
$
|
1,447
|
|
|||||||
_______________________
|
(1)
|
Year ended December 31, 2014 data not presented due to lack of comparability, because ACA-related programs began phasing in during 2014.
|
|
(2)
|
A member month is defined as the aggregate of each month’s ending membership for the period presented.
|
|
(3)
|
“MCR” represents medical costs as a percentage of premium revenue.
|
Molina Healthcare, Inc. 2016 Form 10-K | 15
Medicaid TANF, CHIP and ABD.
TANF, CHIP and ABD revenue increased in
2016
when compared with
2015
, due to health plan acquisitions in late 2015 and 2016, as well as inclusion of a full year of Puerto Rico operations in 2016 (Puerto Rico began operations effective April 1, 2015). The slight decline in the medical care ratio for these programs on a consolidated basis when comparing
2016
with
2015
is not significant given normal margin fluctuations observed when performance is reviewed at this level of detail.
Medicaid Expansion.
Member months increased
33%
in
2016
, when compared with
2015
, as a result of membership growth in all states. Lower premium revenue PMPM more than offset lower medical costs PMPM, leading to an increase in the consolidated medical care ratio for the Medicaid Expansion program. Medicaid Expansion medical care ratios increased in Illinois, Michigan, New Mexico and Ohio.
In the fourth quarter of 2016, we recorded two adjustments to Medicaid Expansion revenue as a result of developments that encompassed the years ended December 31, 2014, 2015 and 2016. Both adjustments, noted below, involved changes to the method of calculation of amounts due back to the states. Under contract provisions that require us to spend certain minimum amounts on medical expenses for our Expansion members, we are required to refund to the states any shortfall of actual medical costs compared with required minimum medical costs.
|
•
|
In the fourth quarter of 2016, our
California health plan received a contract amendment from the California Department of Healthcare Services that allowed us to deduct certain tax expenses in the computation of its Medicaid Expansion minimum medical loss ratio; this minimum medical loss ratio was effective January 1, 2014, through June 30, 2016. As a result of this contract amendment, we increased premium revenue for the year ended December 31, 2016, by approximately
$68 million
, of which
$35 million
related to periods prior to 2016.
|
|
•
|
In
February 2017, the New Mexico Human Services Department (HSD) notified us that it has disallowed certain medically related administrative expenses and other items in the computation of its Medicaid Expansion risk corridor; this corridor was effective January 1, 2014, through December 31, 2016. Although we disagree with their contractual interpretations, we deferred premium revenue amounting to approximately
$45 million
for the year ended December 31, 2016, as a result of this communication, because such revenue is presently subject to refund or adjustment.
Of this amount,
$29 million
relates to dates of service prior to 2016.
At December 31, 2016, our aggregate Medicaid Expansion risk corridor payable to HSD is
$145 million
. We intend to appeal HSD’s ruling on this matter.
|
Marketplace.
The poor performance of our Marketplace program was very detrimental to our financial performance for
the year ended
December 31, 2016
. In 2016, we estimate that our operating loss from the Marketplace program amounted to approximately $110 million, or
$1.21
per diluted share. This operating loss includes the impact of a premium deficiency reserve of
$30 million
for our Marketplace contracts in California and Washington, which was recorded in the fourth quarter of 2016.
The decline in profitability in 2016 compared with 2015 was the result of lower premium revenue PMPM, the premium deficiency reserve noted above, and higher medical costs PMPM. Our Marketplace performance in 2016 continued to suffer from deficiencies in the Marketplace risk transfer methodology that we believe penalizes efficient and affordable health plans like ours and, as a result, those purchasing affordable Marketplace policies ultimately pay higher premiums.
Our 2016 Marketplace results were substantially lower than our expectations based upon our 2016 pricing model. Based upon actual 2016 enrollment, our 2016 Marketplace program was priced to produce income before income taxes of approximately $60 million for all of 2016. The $170 million difference in income before income taxes between our reported results and those we would have expected based upon our pricing model was due to the following factors:
|
•
|
Risk transfer payments were approximately $325 million higher than anticipated in our pricing. Risk transfer payments amounted to 24% of total premium in 2016, compared with a pricing expectation of 9%.
|
|
•
|
Although medical costs were $120 million lower than anticipated by our pricing model, we nevertheless incurred $325 million in additional risk transfer payments noted above.
|
|
•
|
Other items increased income before income taxes by approximately $35 million compared with pricing expectations.
|
The difference between our actual results and those anticipated by our pricing model was exacerbated by the federal government’s failure to pay amounts owed to our health plans under the Marketplace risk corridor program.
Molina Healthcare, Inc. 2016 Form 10-K | 16
We believe our health plans are owed approximately
$90 million
in Marketplace risk corridor payments for 2016 dates of service, but have not recorded any amounts associated with this claim.
MMP and Medicare.
Membership and revenue increased on a consolidated basis for the MMP and Medicare programs when comparing
2016
with
2015
. The medical care ratio for these programs, in the aggregate, decreased due to higher margins for the MMP program.
FINANCIAL PERFORMANCE BY STATE HEALTH PLAN
The following tables summarize member months, premium revenue, medical care costs, medical care ratio, and medical margin by state health plan for the periods indicated (dollars in millions except PMPM amounts):
|
Year Ended December 31, 2016
|
|||||||||||||||||||||||||
|
Member
Months
|
Premium Revenue
|
Medical Care Costs
|
MCR
|
Medical Margin
|
|||||||||||||||||||||
|
Total
|
PMPM
|
Total
|
PMPM
|
||||||||||||||||||||||
|
California
|
8.2
|
|
$
|
2,370
|
|
$
|
290.50
|
|
$
|
2,029
|
|
$
|
248.70
|
|
85.6
|
%
|
$
|
341
|
|
||||||
|
Florida
|
6.7
|
|
1,926
|
|
288.73
|
|
1,765
|
|
264.60
|
|
91.6
|
|
161
|
|
|||||||||||
|
Illinois
|
2.3
|
|
601
|
|
257.99
|
|
568
|
|
243.71
|
|
94.5
|
|
33
|
|
|||||||||||
|
Michigan
|
4.7
|
|
1,520
|
|
321.93
|
|
1,345
|
|
284.82
|
|
88.5
|
|
175
|
|
|||||||||||
|
New Mexico
|
3.0
|
|
1,304
|
|
429.81
|
|
1,209
|
|
398.49
|
|
92.7
|
|
95
|
|
|||||||||||
|
New York
(1)
|
0.2
|
|
82
|
|
446.72
|
|
79
|
|
431.73
|
|
96.6
|
|
3
|
|
|||||||||||
|
Ohio
|
4.0
|
|
1,961
|
|
485.20
|
|
1,747
|
|
432.36
|
|
89.1
|
|
214
|
|
|||||||||||
|
Puerto Rico
(1)
|
4.0
|
|
726
|
|
180.65
|
|
694
|
|
172.57
|
|
95.5
|
|
32
|
|
|||||||||||
|
South Carolina
|
1.3
|
|
378
|
|
296.54
|
|
320
|
|
250.97
|
|
84.6
|
|
58
|
|
|||||||||||
|
Texas
|
4.3
|
|
2,454
|
|
575.01
|
|
2,110
|
|
494.41
|
|
86.0
|
|
344
|
|
|||||||||||
|
Utah
|
1.8
|
|
444
|
|
249.56
|
|
423
|
|
238.03
|
|
95.4
|
|
21
|
|
|||||||||||
|
Washington
|
8.4
|
|
2,218
|
|
263.36
|
|
2,015
|
|
239.21
|
|
90.8
|
|
203
|
|
|||||||||||
|
Wisconsin
|
1.6
|
|
395
|
|
252.94
|
|
388
|
|
248.28
|
|
98.2
|
|
7
|
|
|||||||||||
|
Other
(2)
|
—
|
|
13
|
|
—
|
|
82
|
|
—
|
|
—
|
|
(69
|
)
|
|||||||||||
|
50.5
|
|
$
|
16,392
|
|
$
|
324.82
|
|
$
|
14,774
|
|
$
|
292.75
|
|
90.1
|
%
|
$
|
1,618
|
|
|||||||
|
Year Ended December 31, 2015
|
|||||||||||||||||||||||||
|
Member
Months
|
Premium Revenue
|
Medical Care Costs
|
MCR
|
Medical Margin
|
|||||||||||||||||||||
|
Total
|
PMPM
|
Total
|
PMPM
|
||||||||||||||||||||||
|
California
|
7.1
|
|
$
|
2,200
|
|
$
|
310.89
|
|
$
|
1,926
|
|
$
|
272.22
|
|
87.6
|
%
|
$
|
274
|
|
||||||
|
Florida
|
4.1
|
|
1,199
|
|
289.85
|
|
1,081
|
|
261.49
|
|
90.2
|
|
118
|
|
|||||||||||
|
Illinois
|
1.2
|
|
397
|
|
328.93
|
|
367
|
|
303.72
|
|
92.3
|
|
30
|
|
|||||||||||
|
Michigan
|
3.4
|
|
1,067
|
|
317.15
|
|
903
|
|
268.27
|
|
84.6
|
|
164
|
|
|||||||||||
|
New Mexico
|
2.8
|
|
1,237
|
|
446.27
|
|
1,106
|
|
398.98
|
|
89.4
|
|
131
|
|
|||||||||||
|
New York
(1)
|
—
|
|
—
|
|
—
|
|
—
|
|
—
|
|
—
|
|
—
|
|
|||||||||||
|
Ohio
|
4.1
|
|
2,034
|
|
499.34
|
|
1,718
|
|
421.61
|
|
84.4
|
|
316
|
|
|||||||||||
|
Puerto Rico
(1)
|
3.2
|
|
567
|
|
178.31
|
|
505
|
|
158.80
|
|
89.1
|
|
62
|
|
|||||||||||
|
South Carolina
|
1.3
|
|
348
|
|
267.25
|
|
278
|
|
213.30
|
|
79.8
|
|
70
|
|
|||||||||||
|
Texas
|
3.1
|
|
1,961
|
|
621.37
|
|
1,809
|
|
573.32
|
|
92.3
|
|
152
|
|
|||||||||||
|
Utah
|
1.2
|
|
331
|
|
286.22
|
|
300
|
|
259.32
|
|
90.6
|
|
31
|
|
|||||||||||
|
Washington
|
6.6
|
|
1,602
|
|
242.36
|
|
1,470
|
|
222.36
|
|
91.7
|
|
132
|
|
|||||||||||
|
Wisconsin
|
1.2
|
|
261
|
|
213.48
|
|
215
|
|
176.01
|
|
82.4
|
|
46
|
|
|||||||||||
|
Other
(2)
|
—
|
|
37
|
|
—
|
|
116
|
|
—
|
|
—
|
|
(79
|
)
|
|||||||||||
|
39.3
|
|
$
|
13,241
|
|
$
|
337.28
|
|
$
|
11,794
|
|
$
|
300.43
|
|
89.1
|
%
|
$
|
1,447
|
|
|||||||
Molina Healthcare, Inc. 2016 Form 10-K | 17
|
Year Ended December 31, 2014
|
|||||||||||||||||||||||||
|
Member
Months
|
Premium Revenue
|
Medical Care Costs
|
MCR
|
Medical Margin
|
|||||||||||||||||||||
|
Total
|
PMPM
|
Total
|
PMPM
|
||||||||||||||||||||||
|
California
|
5.6
|
|
$
|
1,523
|
|
$
|
270.51
|
|
$
|
1,269
|
|
$
|
225.37
|
|
83.3
|
%
|
$
|
254
|
|
||||||
|
Florida
|
1.1
|
|
439
|
|
397.79
|
|
419
|
|
379.95
|
|
95.5
|
|
20
|
|
|||||||||||
|
Illinois
|
0.3
|
|
153
|
|
498.48
|
|
141
|
|
456.88
|
|
91.7
|
|
12
|
|
|||||||||||
|
Michigan
|
2.8
|
|
781
|
|
278.68
|
|
661
|
|
235.81
|
|
84.6
|
|
120
|
|
|||||||||||
|
New Mexico
|
2.5
|
|
1,076
|
|
435.17
|
|
996
|
|
402.92
|
|
92.6
|
|
80
|
|
|||||||||||
|
New York
(1)
|
—
|
|
—
|
|
—
|
|
—
|
|
—
|
|
—
|
|
—
|
|
|||||||||||
|
Ohio
|
3.7
|
|
1,553
|
|
425.47
|
|
1,335
|
|
365.87
|
|
86.0
|
|
218
|
|
|||||||||||
|
Puerto Rico
(1)
|
—
|
|
—
|
|
—
|
|
—
|
|
—
|
|
—
|
|
—
|
|
|||||||||||
|
South Carolina
|
1.5
|
|
381
|
|
260.72
|
|
323
|
|
220.89
|
|
84.7
|
|
58
|
|
|||||||||||
|
Texas
|
3.0
|
|
1,318
|
|
442.32
|
|
1,197
|
|
401.81
|
|
90.8
|
|
121
|
|
|||||||||||
|
Utah
|
1.0
|
|
310
|
|
310.64
|
|
285
|
|
286.43
|
|
92.2
|
|
25
|
|
|||||||||||
|
Washington
|
5.5
|
|
1,305
|
|
236.27
|
|
1,219
|
|
220.75
|
|
93.4
|
|
86
|
|
|||||||||||
|
Wisconsin
|
1.0
|
|
156
|
|
150.87
|
|
136
|
|
130.91
|
|
86.8
|
|
20
|
|
|||||||||||
|
Other
(2)
|
—
|
|
28
|
|
—
|
|
95
|
|
—
|
|
—
|
|
(67
|
)
|
|||||||||||
|
28.0
|
|
$
|
9,023
|
|
$
|
322.68
|
|
$
|
8,076
|
|
$
|
288.84
|
|
89.5
|
%
|
$
|
947
|
|
|||||||
______________________________
|
(1)
|
The New York health plan was acquired on August 1, 2016. Our Puerto Rico health plan began serving members on April 1, 2015.
|
|
(2)
|
“Other” medical care costs include primarily medically related administrative costs of the parent company, and direct delivery costs.
|
MEDICAL CARE COSTS BY TYPE
Our medical care costs include amounts that have been paid by us through the reporting date as well as estimated liabilities for medical care costs incurred but not paid by us as of the reporting date. The following table provides the details of consolidated medical care costs by type for the periods indicated (dollars in millions except PMPM amounts):
|
Year Ended December 31,
|
||||||||||||||||||||||||||||||||
|
2016
|
2015
|
2014
|
||||||||||||||||||||||||||||||
|
Amount
|
PMPM
|
% of
Total
|
Amount
|
PMPM
|
% of
Total
|
Amount
|
PMPM
|
% of
Total
|
||||||||||||||||||||||||
|
Fee for service
|
$
|
10,993
|
|
$
|
217.84
|
|
74.4
|
%
|
$
|
8,572
|
|
$
|
218.35
|
|
72.7
|
%
|
$
|
5,673
|
|
$
|
202.87
|
|
70.2
|
%
|
||||||||
|
Pharmacy
|
2,213
|
|
43.84
|
|
15.0
|
|
1,610
|
|
41.01
|
|
13.7
|
|
1,273
|
|
45.54
|
|
15.8
|
|
||||||||||||||
|
Capitation
|
1,218
|
|
24.13
|
|
8.2
|
|
982
|
|
25.02
|
|
8.3
|
|
748
|
|
26.77
|
|
9.3
|
|
||||||||||||||
|
Direct delivery
|
78
|
|
1.55
|
|
0.5
|
|
128
|
|
3.26
|
|
1.1
|
|
96
|
|
3.44
|
|
1.2
|
|
||||||||||||||
|
Other
|
272
|
|
5.39
|
|
1.9
|
|
502
|
|
12.79
|
|
4.2
|
|
286
|
|
10.22
|
|
3.5
|
|
||||||||||||||
|
$
|
14,774
|
|
$
|
292.75
|
|
100.0
|
%
|
$
|
11,794
|
|
$
|
300.43
|
|
100.0
|
%
|
$
|
8,076
|
|
$
|
288.84
|
|
100.0
|
%
|
|||||||||
Molina Healthcare, Inc. 2016 Form 10-K | 18
PREMIUM TAXES
The premium tax ratio (premium tax expense as a percentage of premium revenue plus premium tax revenue) decreased to
2.8%
in
2016
, from
2.9%
in
2015
, primarily due to the significant revenue growth at our Florida health plan, which operates in a state with no premium tax, and growth in MMP revenue. The Medicare portion of MMP revenue is not subject to premium tax.
The premium tax ratio decreased to
2.9%
in
2015
, from
3.2%
in
2014
. This decrease was primarily due to the 2015 increase in MMP revenue.
HEALTH INSURER FEE (HIF) REVENUE AND EXPENSES
HIF revenue, as a percentage of premium revenue, increased slightly to
2.1%
in
2016
, compared with
2.0%
in
2015
. In 2015, our Puerto Rico health plan was not subject to the HIF because it was not operational during the previous year (2014). HIF revenue, as a percentage of premium revenue, was
1.3%
in 2014. During 2015, we recognized approximately $20 million of HIF premium revenue meant to reimburse us for the cost of HIF expense recognized in 2014.
The Consolidated Appropriations Act of 2016 provided for a HIF moratorium in 2017. Therefore, there will be no HIF revenue or expenses in 2017.
MOLINA MEDICAID SOLUTIONS
BUSINESS OVERVIEW
|
▪
|
1.1%
of total revenue in 2016
|
|
▪
|
1.4%
of total revenue in 2015
|
|
▪
|
Employees: Approximately 1,200
|
Programs and Services
The Molina Medicaid Solutions segment provides support to state government agencies in the administration of their Medicaid programs including business processing, information technology development, and administrative services. Molina Medicaid Solutions is under contract with Medicaid agencies in Idaho, Louisiana, Maine, New Jersey, West Virginia, and the U.S. Virgin Islands, and provides drug rebate administration services in Florida.
Our existing state MMIS contracts have terms that currently extend to 2018 through 2025, before renewal options.
Because Medicaid is a state-administered program, every state must have mechanisms, policies, and procedures in place to perform a large number of crucial functions, including the determination of eligibility and the reimbursement of medical providers for services provided. This requirement exists regardless of whether a state has adopted a fee-for-service or a managed care delivery model. MMIS are used by states to support these administrative activities. Although a small number of states build and operate their own MMIS, a far more typical practice is for states to sub-contract the design, development, implementation, and operation of their MMIS to private parties. Through our Molina Medicaid Solutions segment, we actively participate in this market.
Competition and Regulation
Molina Medicaid Solutions competes with large MMIS vendors, such as HP Enterprise Services, ACS (owned by Xerox Corporation), Computer Services Corporation, and CNSI. Molina Medicaid Solutions’ contracts with state government customers may include unique and specialized performance requirements. In particular, contracts with state government customers are subject to various procurement regulations, contract provisions, and other requirements relating to their formation, administration, and performance.
Molina Healthcare, Inc. 2016 Form 10-K | 19
FINANCIAL OVERVIEW
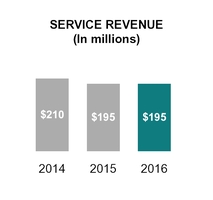
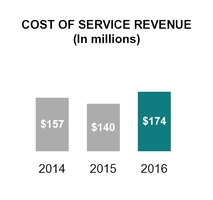
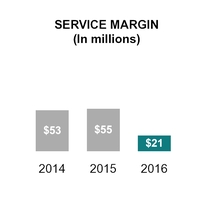
2016
Compared with
2015
Service margin declined
$34 million
in
2016
compared with
2015
, primarily due to increased service costs associated with legacy state contracts that were re-procured.
2015
Compared with
2014
Service revenue declined
$15 million
in 2015 compared with 2014, primarily due to an extension of the Idaho contract under which we are now amortizing certain deferred revenues over a longer term. Service margin increased slightly in 2015 compared with 2014.
OTHER
BUSINESS OVERVIEW
|
▪
|
2.0%
of total revenue in 2016
|
|
▪
|
0.4%
of total revenue in 2015
|
|
▪
|
Employees: Corporate – approximately 6,400. Pathways – approximately 5,500.
|
Programs and Services
The Other segment includes primarily our Pathways behavioral health and social services provider, and corporate amounts not allocated to other reportable segments.
We acquired the outstanding ownership interests in Pathways Health and Community Support, LLC (Pathways), formerly known as Providence Human Services, LLC, in the fourth quarter of 2015.
Substantially all of Pathways’ revenue is derived from contracts with state or local government agencies and government intermediaries, the majority of which are negotiated fee-for-service arrangements. A significant number of these contracts allow the payer to terminate the contract immediately with or without cause.
FINANCIAL OVERVIEW
2016
Compared with
2015
Service margin was
$33 million
in
2016
and insignificant in
2015
. The service margin in
2015
was insignificant because our acquisition of Pathways was not completed until the fourth quarter of 2015.
Molina Healthcare, Inc. 2016 Form 10-K | 20
OTHER CONSOLIDATED INFORMATION
GENERAL AND ADMINISTRATIVE EXPENSES
General and administrative expenses as a percentage of total revenue (the “general and administrative expense ratio”) was
7.8%
in
2016
,
8.1%
in
2015
, and
7.9%
in
2014
. Our general and administrative ratio has been relatively constant since the phase-in of the ACA Medicaid Expansion and Marketplace programs beginning in 2014.
DEPRECIATION AND AMORTIZATION
Depreciation and amortization amounted to
1.0%
,
0.8%
and
1.4%
of total revenue for the years ended December 31, 2016, 2015 and 2014, respectively.
INTEREST EXPENSE
Interest expense increased to
$101 million
for the year ended
December 31, 2016
, compared with
$66 million
for the year ended
December 31, 2015
. The increase was due primarily to our issuance of
$700 million
aggregate principal amount of senior notes (the 5.375% Notes) due November 15, 2022, in the fourth quarter of 2015. For further details regarding this transaction, please refer to Notes to Consolidated Financial Statements, Note
12
, “
Debt
.”
Interest expense increased to
$66 million
for the year ended
December 31, 2015
, compared with
$57 million
for the year ended
December 31, 2014
. The increase was due primarily to our issuance of the 5.375% Notes in the fourth quarter of 2015.
Interest expense includes non-cash interest expense relating to the amortization of the discount on our long-term debt obligations, which amounted to
$31 million
,
$30 million
and
$27 million
for the years ended
December 31, 2016
,
2015
, and
2014
, respectively.
INCOME TAXES
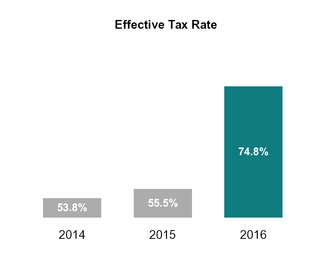
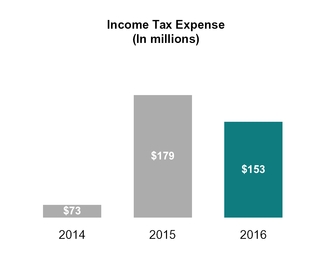
The health insurer fee that we pay to the federal government is not deductible for purposes of determining our income tax expense. The decrease in income before taxes in 2016 compared with 2015, combined with the relatively large amount of reported expenses that are not deductible for tax purposes, has resulted in an effective tax rate in excess of 70% for the full year 2016, compared with
55.5%
for 2015.
The effective tax rate for 2015 was higher than 2014 primarily as a result of certain discrete tax benefits recorded in 2014 that were not recurring in 2015.
Molina Healthcare, Inc. 2016 Form 10-K | 21
LIQUIDITY AND FINANCIAL CONDITION
INTRODUCTION
We manage our cash, investments, and capital structure to meet the short- and long-term obligations of our business while maintaining liquidity and financial flexibility. We forecast, analyze, and monitor our cash flows to enable prudent investment management and financing within the confines of our financial strategy.
Our regulated subsidiaries generate significant cash flows from premium revenue. Such cash flows are our primary source of liquidity. Thus, any future decline in our profitability may have a negative impact on our liquidity. We generally receive premium revenue a short time before we pay for the related health care services. A majority of the assets held by our regulated subsidiaries are in the form of cash, cash equivalents, and investments. After considering expected cash flows from operating activities, we generally invest cash of regulated subsidiaries that exceeds our expected short-term obligations in longer term, investment-grade, and marketable debt securities to improve our overall investment return. These investments are made pursuant to board approved investment policies which conform to applicable state laws and regulations.
Our investment policies are designed to provide liquidity, preserve capital, and maximize total return on invested assets, all in a manner consistent with state requirements that prescribe the types of instruments in which our subsidiaries may invest. These investment policies require that our investments have final maturities of 10 years or less (excluding variable rate securities, for which interest rates are periodically reset) and that the average maturity be three years or less. Professional portfolio managers operating under documented guidelines manage our investments and a portion of our cash equivalents. Our portfolio managers must obtain our prior approval before selling investments where the loss position of those investments exceeds certain levels.
All of our investments are classified as current assets, except for our restricted investments, which are classified as non-current assets, and which are not included in the totals below. Our restricted investments are invested principally in certificates of deposit and U.S. treasury securities; we have the ability to hold our restricted investments until maturity.

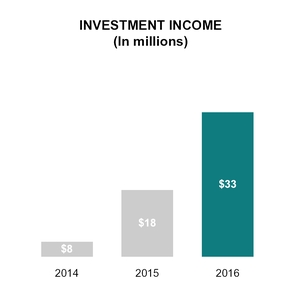
Investment income increased in
2016
compared with
2015
, and in
2015
compared with
2014
, primarily due to the increase in invested assets in each of
2016
and
2015
. See further discussion below in “Liquidity.”
Molina Healthcare, Inc. 2016 Form 10-K | 22
MARKET RISK
Our earnings and financial position are exposed to financial market risk relating changes in interest rates, and the resulting impact on investment income and interest expense.
Substantially all of our investments and restricted investments are subject to interest rate risk and will decrease in value if market interest rates increase. Assuming a hypothetical and immediate 1% increase in market interest rates at December 31, 2016, the fair value of our fixed income investments would decrease by approximately $20 million. Declines in interest rates over time will reduce our investment income.
For further information on fair value measurements and our investment portfolio, please refer to Note
5
, “
Fair Value Measurements
,” Note
6
, “
Investments
,” and Note
10
, “
Restricted Investments
.”
Borrowings under our Credit Facility bear interest based, at our election, on a base rate or an adjusted London Interbank Offered Rate (LIBOR), plus in each case the applicable margin.
As of
December 31, 2016
, no
amounts were outstanding under the Credit Facility.
LIQUIDITY
A condensed schedule of cash flows to facilitate our discussion of liquidity follows:
|
Year Ended December 31,
|
|||||||||||||||||||
|
2016
|
2015
|
2014
|
2015 to 2016 Change
|
2014 to 2015 Change
|
|||||||||||||||
|
(In millions)
|
|||||||||||||||||||
|
Net cash provided by operating activities
|
$
|
673
|
|
$
|
1,125
|
|
$
|
1,060
|
|
$
|
(452
|
)
|
$
|
65
|
|
||||
|
Net cash used in investing activities
|
(202
|
)
|
(1,420
|
)
|
(536
|
)
|
1,218
|
|
(884
|
)
|
|||||||||
|
Net cash provided by financing activities
|
19
|
|
1,085
|
|
79
|
|
(1,066
|
)
|
1,006
|
|
|||||||||
|
Net increase in cash and cash equivalents
|
$
|
490
|
|
$
|
790
|
|
$
|
603
|
|
$
|
(300
|
)
|
$
|
187
|
|
||||
Operating Activities
2016 Compared with 2015
Cash provided by operating activities was
$673 million
in
2016
compared with
$1,125 million
in
2015
, a decrease of
$452 million
. This decrease was due primarily to a
$91 million
decrease in net income, and the following factors:
Receivables and deferred revenue
. Cash flows from operations in each year were impacted by the timing of payments we receive from our states. In general, states may delay our premium payments, which we record as a receivable, or they may prepay the following month’s premium payment, which we record as deferred revenue. We typically receive capitation payments monthly; however, the states in which we operate may decide to adjust their payment schedules which could positively or negatively impact our reported cash flows from operating activities in any given period. In the current year, the net effect of the timing of premiums received at our California and Illinois health plans negatively impacted our cash flows from operating activities.
Medical claims and benefits payable
. In 2016, the change in medical claims and benefits payable reduced cash flows from operations by
$256 million
, primarily because membership and related medical costs grew at a higher rate in 2015 than in 2016, resulting in a lower year-over-year change in 2016.
Amounts due government agencies
. In 2016, the change in amounts due government agencies increased cash flows from operations by
$271 million
, due primarily to additional accruals for ACA Marketplace risk transfer payments. In addition to the impact of amounts due for Marketplace risk transfer, changes in this account relate primarily to Health Plans segment programs that contain medical cost floors or medical cost corridors. Under such programs, a portion of certain Medicaid, Medicare, and Marketplace premiums received by our health plans may be returned if certain minimum amounts are not spent on defined medical care costs.
2015 Compared with 2014
Cash provided by operating activities was
$1,125 million
in
2015
, compared with
$1,060 million
in
2014
, an increase of
$65 million
. This increase was primarily due to an
$81 million
increase in net income, and collection of premiums receivable at our California health plan in the first quarter of 2015. These increases were partially offset by our fourth quarter 2015 Medicaid expansion-related payment to the state of Washington’s Medicaid authority of $247 million, reflected in the change in amounts due to government agencies. In addition, the change in medical claims
Molina Healthcare, Inc. 2016 Form 10-K | 23
and benefits payable reduced cash flows from operations by
$49 million
, primarily because membership and related medical costs grew at a higher rate in 2014 than in 2015, resulting in a lower year-over-year change in 2015.
Investing Activities
2016 Compared with 2015
Cash used in investing activities was
$202 million
in
2016
, compared with
$1,420 million
in
2015
, a decrease of
$1,218 million
. Cash flows from investing activities increased in 2016 due to
$840 million
increased proceeds from sales and maturities of investments, and a reduction in cash paid in business combinations of
$402 million
in 2016 compared with 2015.
2015 Compared with 2014
Cash used in investing activities was
$1,420 million
in
2015
, compared with
$536 million
in
2014
. This increase was due in part to higher purchases of investments, net of sales of maturities, amounting to $477 million, as a result of cash generated from 2015 financing activities, described below.
Financing Activities
2016 Compared with 2015
Cash provided by financing activities was
$19 million
in 2016, compared with
$1,085 million
in
2015
. In 2015, we received net proceeds from our fiscal 2015 offerings of 5.375% Notes, amounting to
$689 million
, and common stock, amounting to
$373 million
, with no comparable activity in 2016.
2015 Compared with 2014
Cash provided by financing activities was
$1,085 million
in 2015, as described above. In 2014, cash flows from financing activities was
$79 million
, which included
$123 million
in net proceeds from our fiscal 2014 offering of 1.625% Notes, partially offset by
$50 million
paid to settle contingent consideration liabilities associated with our 2013 business acquisitions.
FINANCIAL CONDITION
We believe that our cash resources and internally generated funds will be sufficient to support our operations, regulatory requirements, and capital expenditures for at least the next 12 months.
On a consolidated basis, at
December 31, 2016
, our working capital was
$1,418 million
compared with
$1,484 million
at
December 31, 2015
. At
December 31, 2016
, our cash and investments amounted to
$4,689 million
, compared with
$4,241 million
of cash and investments at
December 31, 2015
.
Debt Ratings
. Our 5.375% Notes are rated “BB” by Standard & Poor’s, and “Ba3” by Moody’s Investor Service, Inc. A significant downgrade in our ratings could adversely affect our borrowing capacity and costs.
FUTURE SOURCES AND USES OF LIQUIDITY
Sources
Dividends from Subsidiaries.
When available and as permitted by applicable regulations, cash in excess of the capital needs of our regulated health plans is generally paid in the form of dividends to our unregulated parent company to be used for general corporate purposes. We received $100 million and
$125 million
in dividends from our regulated health plan subsidiaries in
2016
and 2015, respectively. We received $1 million and
$17 million
in dividends from our unregulated subsidiaries during
2016
and 2015, respectively. We did not receive dividends from our subsidiaries in 2014. See further discussion in Notes to Consolidated Financial Statements, Note
19
, “
Commitments and Contingencies
—Regulatory Capital Requirements and Dividend Restrictions,” and Note
22
, “
Condensed Financial Information of Registrant
—Note C - Dividends and Capital Contributions.”
Credit Facility.
Refer to Note
12
, “
Debt
,” for a detailed discussion of our Credit Facility.
Shelf Registration Statement.
We have a shelf registration statement on file with the Securities and Exchange Commission to register an unlimited amount of any combination of debt or equity securities in one or more offerings. Specific information regarding the terms and securities being offered will be provided at the time of an offering. Proceeds from future offerings are expected to be used for general corporate purposes, including, but not limited to, the repayment of debt, investments in or extensions of credit to our subsidiaries and the financing of possible acquisitions or business expansion.
Molina Healthcare, Inc. 2016 Form 10-K | 24
Uses
Regulatory Capital Requirements.
In
2016
,
2015
, and
2014
, we contributed capital amounting to
$338 million
,
$320 million
, and
$248 million
, respectively, to our health plans subsidiaries to satisfy statutory net worth requirements. For a comprehensive discussion of this topic, refer to Notes to Consolidated Financial Statements, Note
19
, “
Commitments and Contingencies
—Regulatory Capital Requirements and Dividend Restrictions.”
Acquisitions.
In
2016
,
2015
, and
2014
, we paid
$48 million
,
$450 million
, and
$44 million
, respectively, for businesses or assets acquired in business combinations. Consistent with our business strategy, we will continue to evaluate acquisition opportunities.
States’ Budgets
. From time to time, the states in which our health plans operate may delay premium payments. For example, the state of Illinois is currently operating without a budget for its current fiscal year. As of
December 31, 2016
, our Illinois health plan served approximately
195,000
members, and recognized premium revenue of approximately
$601 million
for the year ended
December 31, 2016
. As of
February 24, 2017
, the state of Illinois owed us approximately $68 million for certain October, November and December 2016 premiums.
In another example, the Commonwealth of Puerto Rico’s fiscal plan, issued on October 14, 2016, reported that current revenues are insufficient to support existing current operations and debt service. While the Commonwealth reports that it will prioritize health care spending, it stresses the need to address the cap on federal matching funds it receives for its participation in the Medicaid program. Among the fiscal issues expected to further exacerbate the Commonwealth’s current debt crisis is the depletion of ACA funds, estimated to occur in the Commonwealth’s fiscal year 2018. As of
December 31, 2016
, our Puerto Rico health plan served approximately
330,000
members and recorded premium revenue of approximately
$726 million
for the year ended December 31, 2016.
As of
February 24, 2017
, the Commonwealth is current with its premium payments.
Convertible Senior Notes.
Refer to Note
12
, “
Debt
,” for a detailed discussion of our Convertible Senior Notes.
Both our 1.125% Notes and our 1.625% Notes are convertible into cash prior to their respective maturity dates under certain circumstances, one of which relates to the closing price of our common stock over a specified period. We refer to this conversion trigger as the stock price trigger. The stock price trigger for the 1.125% Notes is $53.00 per share. The 1.125% Notes met this trigger in the quarter ended
December 31, 2016
, and are convertible to cash through at least March 31, 2017. Because the 1.125% Notes may be converted into cash within 12 months, the
$471 million
carrying amount is reported in current portion of long-term debt as of
December 31, 2016
.
For economic reasons related to the trading market for our 1.125% Notes, we believe that the amount of the notes that may be converted over the next twelve months, if any, will not be significant. However, if the trading market for our 1.125% Notes becomes closed or restricted due to market turmoil or other reasons such that the notes cannot be traded, or if the trading price of our 1.125% Notes, which normally trade at a marginal premium to the underlying composite stock-and-interest economic value, no longer includes that marginal premium, holders of our 1.125% Notes may elect to convert the notes to cash.
The stock price trigger for the 1.625% Notes is $75.51 per share. The last reported sale price of our common stock as reported on the New York Stock Exchange on
February 24, 2017
was
$48.83
per share. As of
December 31, 2016
, our 1.625% Notes were not convertible. If conversion requests are received, the settlement of the notes must be paid primarily in cash pursuant to the terms of the relevant indentures.
We have sufficient available cash, combined with borrowing capacity available under our Credit Facility, to fund such conversions.
CONTRACTUAL OBLIGATIONS
In the table below, we present our contractual obligations
as of December 31, 2016
. Some of the amounts included in this table are based on management’s estimates and assumptions about these obligations, including their duration, the possibility of renewal, anticipated actions by third parties, and other factors. Because these estimates and assumptions are necessarily subjective, the contractual obligations we will actually pay in future periods may vary from those reflected in the table.
Additionally, we have a variety of other contractual agreements related to acquiring services used in our operations. However, we believe these other agreements do not contain material noncancelable commitments.
Molina Healthcare, Inc. 2016 Form 10-K | 25
|
Total
(1)
|
2017
|
2018-2019
|
2020-2021
|
2022 and after
|
|||||||||||||||
|
(In millions)
|
|||||||||||||||||||
|
Medical claims and benefits payable
|
$
|
1,929
|
|
$
|
1,929
|
|
$
|
—
|
|
$
|
—
|
|
$
|
—
|
|
||||
|
Principal amount of senior notes
(2)
|
1,552
|
|
—
|
|
—
|
|
550
|
|
1,002
|
|
|||||||||
|
Amounts due government agencies
|
1,202
|
|
1,202
|
|
—
|
|
—
|
|
—
|
|
|||||||||
|
Lease financing obligations
|
427
|
|
17
|
|
35
|
|
38
|
|
337
|
|
|||||||||
|
Interest on long-term debt
|
376
|
|
49
|
|
98
|
|
85
|
|
144
|
|
|||||||||
|
Operating leases
|
267
|
|
63
|
|
107
|
|
54
|
|
43
|
|
|||||||||
|
Purchase commitments
|
20
|
|
10
|
|
10
|
|
—
|
|
—
|
|
|||||||||
|
$
|
5,773
|
|
$
|
3,270
|
|
$
|
250
|
|
$
|
727
|
|
$
|
1,526
|
|
|||||
_______________________________
|
(1)
|
As of December 31, 2016
, we have recorded approximately $11 million of unrecognized tax benefits. The table does not contain this amount because we cannot reasonably estimate when or if such amount may be settled. For further information, refer to Notes to Consolidated Financial Statements, Note
14
, “
Income Taxes
.”
|
|
(2)
|
Represents the principal amounts due on our 5.375% Senior Notes due 2022, 1.125% Cash Convertible Senior Notes due 2020, and our 1.625% Convertible Senior Notes due 2044 (1.625% Notes). The 1.625% Notes have a contractual maturity date in 2044; however, on specified dates beginning in 2018, holders of the 1.625% Notes may require us to repurchase some or all of the 1.625% Notes, as described in Notes to Consolidated Financial Statements, Note
12
, “
Debt
.”
|
Commitments and Contingencies.
We are not a party to off-balance sheet financing arrangements, except for operating leases which are disclosed in Notes to Consolidated Financial Statements, Note
19
, “
Commitments and Contingencies
.”
INFLATION
We use various strategies to mitigate the negative effects of health care cost inflation. Specifically, our health plans try to control medical and hospital costs through contracts with independent providers of health care services. Through these contracted providers, our health plans emphasize preventive health care and appropriate use of specialty and hospital services. There can be no assurance, however, that our strategies to mitigate health care cost inflation will be successful. Competitive pressures, new health care and pharmaceutical product introductions, demands from health care providers and customers, applicable regulations, or other factors may affect our ability to control health care costs.
COMPLIANCE COSTS
Our health plans are regulated by both state and federal government agencies. Regulation of managed care products and health care services is an evolving area of law that varies from jurisdiction to jurisdiction. Regulatory agencies generally have discretion to issue regulations and interpret and enforce laws and rules. Changes in applicable laws and rules occur frequently. Compliance with such laws and rules may lead to additional costs related to the implementation of additional systems, procedures and programs that we have not yet identified.
CRITICAL ACCOUNTING ESTIMATES
When we prepare our consolidated financial statements, we use estimates and assumptions that may affect reported amounts and disclosures. Actual results could differ from these estimates. Our most significant accounting estimates relate to:
|
•
|
Health Plans segment medical claims and benefits payable.
See discussion below, and refer to Notes to Consolidated Financial Statements, Note
11
, “
Medical Claims and Benefits Payable
.”
|
Molina Healthcare, Inc. 2016 Form 10-K | 26
|
•
|
Health Plans segment contractual provisions that may adjust or limit revenue or profit.
For a comprehensive discussion of this topic, including amounts recorded in our consolidated financial statements, refer to Notes to Consolidated Financial Statements, Note
2
, “
Significant Accounting Policies
.”
|
|
•
|
Health Plans segment quality incentives.
For a comprehensive discussion of this topic, including amounts recorded in our consolidated financial statements, refer to Notes to Consolidated Financial Statements, Note
2
, “
Significant Accounting Policies
.”
|
|
•
|
Molina Medicaid Solutions segment revenue and cost recognition.
For a comprehensive discussion of this topic, refer to Notes to Consolidated Financial Statements, Note
2
, “
Significant Accounting Policies
.”
|
|
•
|
Goodwill and intangible assets, net.
See discussion below, and refer to Notes to Consolidated Financial Statements, Note
9
, “
Goodwill and Intangible Assets
.”
|
MEDICAL CLAIMS AND BENEFITS PAYABLE - HEALTH PLANS SEGMENT
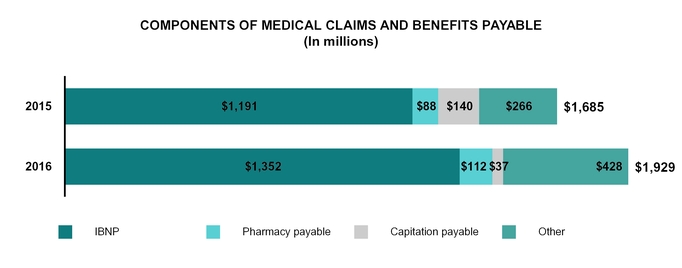
“Other” medical claims and benefits payable include amounts payable to certain providers for which we act as an intermediary on behalf of various state agencies without assuming financial risk. Such receipts and payments do not impact our consolidated statements of income. As of
December 31, 2016
and
2015
, we recorded non-risk provider payables relating to such intermediary arrangements of approximately
$225 million
and
$167 million
, respectively.
The determination of our liability for medical claims and benefits payable is particularly important to the determination of our financial position and results of operations in any given period. Such determination of our liability requires the application of a significant degree of judgment by our management.
As a result, the determination of our liability for medical claims and benefits payable is subject to an inherent degree of uncertainty. Our medical care costs include amounts that have been paid by us through the reporting date, as well as estimated liabilities for medical care costs incurred but not paid by us as of the reporting date. Such medical care cost liabilities include, among other items, unpaid fee-for-service claims, capitation payments owed providers, unpaid pharmacy invoices, and various medically related administrative costs that have been incurred but not paid. We use judgment to determine the appropriate assumptions for determining the required estimates.
The most important element in estimating our medical care costs is our estimate for fee-for-service claims which have been incurred but not paid by us. These fee-for-service costs that have been incurred but have not been paid at the reporting date are collectively referred to as medical costs that are incurred but not paid (IBNP). Our IBNP, as reported on our balance sheet, represents our best estimate of the total amount of claims we will ultimately pay with respect to claims that we have incurred as of the balance sheet date. We estimate our IBNP monthly using actuarial methods based on a number of factors. As indicated in the graph above, our estimated IBNP liability represented
$1,352 million
of our total medical claims and benefits payable of
$1,929 million
as of
December 31, 2016
.
The factors we consider when estimating our IBNP include, without limitation:
Molina Healthcare, Inc. 2016 Form 10-K | 27
|
•
|
claims receipt and payment experience (and variations in that experience),
|
|
•
|
changes in membership,
|
|
•
|
provider billing practices,
|
|
•
|
health care service utilization trends,
|
|
•
|
cost trends,
|
|
•
|
product mix,
|
|
•
|
seasonality,
|
|
•
|
prior authorization of medical services,
|
|
•
|
benefit changes,
|
|
•
|
known outbreaks of disease or increased incidence of illness such as influenza,
|
|
•
|
provider contract changes,
|
|
•
|
changes to Medicaid fee schedules, and
|
|
•
|
the incidence of high dollar or catastrophic claims.
|
Our assessment of these factors is then translated into an estimate of our IBNP liability at the relevant measuring point through the calculation of a base estimate of IBNP, a further provision for adverse claims deviation, and an estimate of the administrative costs of settling all claims incurred through the reporting date. The base estimate of IBNP is derived through application of claims payment completion factors and trended PMPM cost estimates.
For the fifth month of service prior to the reporting date and earlier, we estimate our outstanding claims liability based on actual claims paid, adjusted for estimated completion factors. Completion factors seek to measure the cumulative percentage of claims expense that will have been paid for a given month of service as of the reporting date, based on historical payment patterns.
The following table reflects the hypothetical change in our estimate of claims liability as of
December 31, 2016
that would have resulted had we changed our completion factors for the fifth through the twelfth months preceding
December 31, 2016
, by the percentages indicated. A reduction in the completion factor results in an increase in medical claims liabilities. Dollar amounts are in millions.
|
Increase (Decrease) in Estimated Completion Factors
|
Increase
(Decrease) in Medical Claims and Benefits Payable |
||
|
(6)%
|
$
|
462
|
|
|
(4)%
|
308
|
|
|
|
(2)%
|
154
|
|
|
|
2%
|
(154
|
)
|
|
|
4%
|
(308
|
)
|
|
|
6%
|
(462
|
)
|
|
For the four months of service immediately prior to the reporting date, actual claims paid are not a reliable measure of our ultimate liability, given the inherent delay between the patient/physician encounter and the actual submission of a claim for payment. For these months of service, we estimate our claims liability based on trended PMPM cost estimates. These estimates are designed to reflect recent trends in payments and expense, utilization patterns, authorized services, and other relevant factors. The following table reflects the hypothetical change in our estimate of claims liability as of
December 31, 2016
that would have resulted had we altered our trend factors by the percentages indicated. An increase in the PMPM costs results in an increase in medical claims liabilities. Dollar amounts are in millions.
Molina Healthcare, Inc. 2016 Form 10-K | 28
|
(Decrease) Increase in Trended Per Member Per Month Cost Estimates
|
(Decrease)
Increase
in Medical Claims
and
Benefits Payable
|
||
|
(6)%
|
$
|
(238
|
)
|
|
(4)%
|
(158
|
)
|
|
|
(2)%
|
(79
|
)
|
|
|
2%
|
79
|
|
|
|
4%
|
158
|
|
|
|
6%
|
238
|
|
|
The following per-share amounts are based on a combined federal and state statutory tax rate of 37%, and
56 million
diluted shares outstanding for the year ended
December 31, 2016
. Assuming a hypothetical 1% change in completion factors from those used in our calculation of IBNP at
December 31, 2016
, net income for the year ended
December 31, 2016
would increase or decrease by approximately
$49 million
, or
$0.86
per diluted share. Assuming a hypothetical 1% change in PMPM cost estimates from those used in our calculation of IBNP at
December 31, 2016
, net income for the year ended
December 31, 2016
would increase or decrease by approximately
$25 million
, or
$0.44
per diluted share. The corresponding figures for a 5% change in completion factors and PMPM cost estimates would be
$243 million
, or
$4.32
per diluted share, and
$125 million
, or
$2.22
per diluted share, respectively.
It is important to note that any change in the estimate of either completion factors or trended PMPM costs would usually be accompanied by a change in the estimate of the other component, and that a change in one component would almost always compound rather than offset the resulting distortion to net income. When completion factors are
overestimated
, trended PMPM costs tend to be
underestimated
. Both circumstances will create an overstatement of net income. Likewise, when completion factors are
underestimated
, trended PMPM costs tend to be
overestimated
, creating an understatement of net income. In other words, changes in estimates involving both completion factors and trended PMPM costs will usually act to drive estimates of claims liabilities and medical care costs in the same direction. If completion factors were overestimated by 1%, resulting in an overstatement of net income by approximately
$49 million
, it is likely that trended PMPM costs would be underestimated, resulting in an additional overstatement of net income.
After we have established our base IBNP reserve through the application of completion factors and trended PMPM cost estimates, we then compute an additional liability, once again using actuarial techniques, to account for adverse deviation in our claims payments for which the base actuarial model is not intended to and does not account. We refer to this additional liability as the provision for adverse claims deviation. The provision for adverse claims deviation is a component of our overall determination of the adequacy of our IBNP. It is intended to capture the potential inadequacy of our IBNP estimate as a result of our inability to adequately assess the impact of factors such as changes in the speed of claims receipt and payment, the relative magnitude or severity of claims, known outbreaks of disease such as influenza, our entry into new geographical markets, our provision of services to new populations such as the aged, blind or disabled, changes to state-controlled fee schedules upon which a large proportion of our provider payments are based, modifications and upgrades to our claims processing systems and practices, and increasing medical costs. Because of the complexity of our business, the number of states in which we operate, and the need to account for different health care benefit packages among those states, we make an overall assessment of IBNP after considering the base actuarial model reserves and the provision for adverse claims deviation.
We also include in our IBNP liability an estimate of the administrative costs of settling all claims incurred through the reporting date.
The development of IBNP is a continuous process that we monitor and refine on a monthly basis as additional claims payment information becomes available. As additional information becomes known to us, we adjust our actuarial model accordingly.
On a monthly basis, we review and update our estimated IBNP and the methods used to determine that liability. Any adjustments, if appropriate, are reflected in the period known. While we believe our current estimates are adequate, we have in the past been required to increase significantly our claims reserves for periods previously reported, and
Molina Healthcare, Inc. 2016 Form 10-K | 29
may be required to do so again in the future. Any significant increases to prior period claims reserves would materially decrease reported earnings for the period in which the adjustment is made.
In our judgment, the estimates for completion factors will likely prove to be more accurate than trended PMPM cost estimates because estimated completion factors are subject to fewer variables in their determination. Specifically, completion factors are developed over long periods of time, and are most likely to be affected by changes in claims receipt and payment experience and by provider billing practices. Trended PMPM cost estimates, while affected by the same factors, will also be influenced by health care service utilization trends, cost trends, product mix, seasonality, prior authorization of medical services, benefit changes, outbreaks of disease or increased incidence of illness, provider contract changes, changes to Medicaid fee schedules, and the incidence of high dollar or catastrophic claims. As discussed above, however, changes in estimates involving trended PMPM costs will almost always be accompanied by changes in estimates involving completion factors, and vice versa. In such circumstances, changes in estimation involving both completion factors and trended PMPM costs will act to drive estimates of claims liabilities (and therefore medical care costs) in the same direction.
Refer to Notes to Consolidated Financial Statements, Note
11
, “
Medical Claims and Benefits Payable
,” for additional information regarding the specific factors used to determine our changes in estimates of IBNP, as well as a table presenting the components of the change in our medical claims and benefits payable, for all periods presented in the accompanying consolidated financial statements.
GOODWILL AND INTANGIBLE ASSETS, NET
At
December 31, 2016
, goodwill and intangible assets, net, represented approximately
10%
of total assets and
46%
of total stockholders’ equity, compared with
10%
and
41%
, respectively, at
December 31, 2015
.
Goodwill
Goodwill represents the excess of the purchase price over the fair value of net assets acquired in business combinations.
Goodwill is not amortized, but is subject to an annual impairment test. We are required to test at least annually for impairment, or more frequently if adverse events or changes in circumstances indicate that the asset may be impaired.
Such events or circumstances may include experienced or expected operating cash-flow deterioration or losses, significant loss of membership, loss of state funding, loss of state contracts, and other factors.
We conduct our required annual impairment testing of goodwill during the fourth quarter.
When testing goodwill for impairment, we may first assess qualitative factors, such as industry and market factors, cost factors, and changes in overall performance, to determine if it is more likely than not that the carrying value of a reporting unit exceeds its estimated fair value. If our qualitative assessment indicates that goodwill impairment is more likely than not, we perform additional quantitative analysis. We may also elect to skip the qualitative testing and proceed directly to the quantitative testing.
We believe that the dynamic economic and political environments in which we operate often necessitate the performance of the quantitative test to prove that goodwill is not impaired on an annual basis.
Under the quantitative test we first measure the fair values of our reporting units and compare them to the carrying values of the respective units, including goodwill. Second, if the fair value is less than the carrying value of the reporting unit, then the implied value of goodwill would be calculated and compared with the carrying amount of goodwill to determine the impairment charge, if any.
We estimate the fair values of our reporting units using discounted cash flows.
In the discounted cash flow analyses, we must make assumptions about a wide variety of internal and external factors. Significant assumptions include financial projections of free cash flow (including significant assumptions about operations, capital requirements and income taxes), long-term growth rates for determining terminal value beyond the discretely forecasted periods, and discount rates.
We use a discount rate that corresponds to a market-based weighted-average cost of capital and terminal growth rates that correspond to long-term growth prospects, consistent with the long-term inflation rate.
The fair value of our reporting units with significant goodwill generally exceeded carrying amounts substantially, by margins of greater than 100%. At December 31, 2016, the fair values of our Illinois health plan, Pathways subsidiary, and Molina Medicaid Solutions segment exceeded their carrying amounts by 42%, 54%, and 70%, respectively. The Illinois health plan acquired significant additional membership in 2016. As these members transition to managed care, we will continue to monitor the plan’s future health care costs and expected cash flows. At our Pathways subsidiary, we expect to leverage certain behavioral health capabilities to expand the revenue and
Molina Healthcare, Inc. 2016 Form 10-K | 30
profit margin of our Health Plans segment. Since we acquired Pathways in late 2015, we continue to integrate its operations and develop intersegment services. At the Molina Medicaid Solutions segment, one of the factors considered in the discounted cash flow model is the procurement of new state MMIS contracts. Since our acquisition of this business in 2010, we have entered into three contracts to provide new or replacement MMIS.
Our existing state MMIS contracts have terms that currently extend to 2018 through 2025, before renewal options.
Key assumptions in our cash flow projections, including changes in membership, premium rates, health care and operating cost trends, contract renewals and the procurement of new contracts, and synergies expectations relating to newly acquired businesses, are consistent with those used in our long-range business plan and annual planning process. If these assumptions differ from actual results, the outcome of our goodwill impairment tests could be adversely affected.
Goodwill impairment tests completed in each of the last three years did not result in an impairment loss.
Intangible Assets
Finite-lived, separately-identified intangible assets acquired in business combinations are assets that represent future expected benefits but lack physical substance (such as purchased contract rights and provider contracts).
Our intangible assets are subject to impairment tests when events or circumstances indicate that a finite-lived intangible asset’s (or asset group’s) carrying value may not be recoverable.
Consideration is given to a number of potential impairment indicators. For example, our health plan subsidiaries have generally been successful in obtaining the renewal by amendment of their contracts in each state prior to the actual expiration of their contracts. However, there can be no assurance that these contracts will continue to be renewed.
Following the identification of any potential impairment indicators, to determine whether an impairment exists, we would compare the carrying amount of a finite-lived intangible asset with the undiscounted cash flows that are expected to result from the use of the asset or related group of assets.
If it is determined that the carrying amount of the asset is not recoverable, the amount by which the carrying value exceeds the estimated fair value is recorded as an impairment.
No significant impairment charges relating to long-lived assets, including intangible assets, were recorded in the years ended
December 31, 2016
,
2015
, or
2014
.
SUPPLEMENTAL INFORMATION
FINANCIAL MEASURES THAT SUPPLEMENT U.S. GAAP (NON-GAAP FINANCIAL MEASURES)
We use these non-GAAP financial measures as supplemental metrics in evaluating our financial performance, making financing and business decisions, and forecasting and planning for future periods. For these reasons, management believes such measures are useful supplemental measures to investors in comparing our performance to the performance of other public companies in the health care industry.
EBITDA*
We believe that EBITDA* is particularly helpful in assessing our ability to meet the cash demands of our operating units. The following table reconciles net income, which we believe to be the most comparable GAAP measure, to EBITDA*.
|
Year Ended December 31,
|
|||||||||||
|
2016
|
2015
|
2014
|
|||||||||
|
(In millions)
|
|||||||||||
|
Net income
|
$
|
52
|
|
$
|
143
|
|
$
|
62
|
|
||
|
Adjustments:
|
|||||||||||
|
Depreciation, and amortization of intangible assets and capitalized software
|
161
|
|
120
|
|
114
|
|
|||||
|
Interest expense
|
101
|
|
66
|
|
57
|
|
|||||
|
Income tax expense
|
153
|
|
179
|
|
72
|
|
|||||
|
EBITDA*
|
$
|
467
|
|
$
|
508
|
|
$
|
305
|
|
||
Molina Healthcare, Inc. 2016 Form 10-K | 31
ADJUSTED NET INCOME* AND ADJUSTED NET INCOME PER SHARE*
We believe that adjusted net income* and adjusted net income per diluted share* is very helpful in assessing our financial performance exclusive of the non-cash impact of the amortization of purchased intangibles. The following table reconciles net income, which we believe to be the most comparable GAAP measure, to adjusted net income*.
|
Year Ended December 31,
|
|||||||||||||||||||||||
|
2016
|
2015
|
2014
|
|||||||||||||||||||||
|
(In millions, except diluted per-share amounts)
|
|||||||||||||||||||||||
|
Amount
|
Per share
|
Amount
|
Per share
|
Amount
|
Per share
|
||||||||||||||||||
|
Net income
|
$
|
52
|
|
$
|
0.92
|
|
$
|
143
|
|
$
|
2.58
|
|
$
|
62
|
|
$
|
1.29
|
|
|||||
|
Adjustment:
|
|||||||||||||||||||||||
|
Amortization of intangible assets
|
32
|
|
0.57
|
|
18
|
|
0.32
|
|
20
|
|
0.42
|
|
|||||||||||
|
Income tax effect
(1)
|
(12
|
)
|
(0.21
|
)
|
(7
|
)
|
(0.12
|
)
|
(7
|
)
|
(0.15
|
)
|
|||||||||||
|
Amortization of intangible assets, net of tax effect
|
20
|
|
0.36
|
|
11
|
|
0.20
|
|
13
|
|
0.27
|
|
|||||||||||
|
Adjusted net income*
(2)
|
$
|
72
|
|
$
|
1.28
|
|
$
|
154
|
|
$
|
2.78
|
|
$
|
75
|
|
$
|
1.56
|
|
|||||
________________________
|
(1)
|
Income tax effect of adjustments calculated at the blended federal and state statutory tax rate of 37%.
|
|
(2)
|
Beginning in the first quarter of 2016, we revised our calculation of adjusted net income*. We no longer subtract “Amortization of convertible senior notes and lease financing obligations” from net income to arrive at adjusted net income*. We made this change because various capital transactions completed in 2015 reduced our relative reliance on convertible notes and lease financing as sources of capital. We believe that this change enhances the comparability of these non-GAAP measures with the corresponding non-GAAP measures used by our competitors. All periods presented conform to this presentation.
|
Molina Healthcare, Inc. 2016 Form 10-K | 32
OTHER FINANCIAL DATA
SELECTED FINANCIAL DATA
(In millions, except per-share amounts)
|
|
Year Ended December 31,
|
||||||||||||||||||
|
|
2016
|
2015
|
2014
|
2013
|
2012
|
||||||||||||||
|
Statements of Income Data:
|
|||||||||||||||||||
|
Revenue:
|
|||||||||||||||||||
|
Premium revenue
|
$
|
16,392
|
|
$
|
13,241
|
|
$
|
9,023
|
|
$
|
6,179
|
|
$
|
5,544
|
|
||||
|
Service revenue
(1)
|
539
|
|
253
|
|
210
|
|
205
|
|
188
|
|
|||||||||
|
Premium tax revenue
|
468
|
|
397
|
|
294
|
|
172
|
|
159
|
|
|||||||||
|
Health insurer fee revenue
|
345
|
|
264
|
|
120
|
|
—
|
|
—
|
|
|||||||||
|
Investment income and other revenue
|
38
|
|
23
|
|
20
|
|
33
|
|
23
|
|
|||||||||
|
Total revenue
|
17,782
|
|
14,178
|
|
9,667
|
|
6,589
|
|
5,914
|
|
|||||||||
|
Operating expenses:
|
|||||||||||||||||||
|
Medical care costs
|
14,774
|
|
11,794
|
|
8,076
|
|
5,380
|
|
4,991
|
|
|||||||||
|
Cost of service revenue
(1)
|
485
|
|
193
|
|
157
|
|
161
|
|
141
|
|
|||||||||
|
General and administrative expenses
|
1,393
|
|
1,146
|
|
765
|
|
666
|
|
519
|
|
|||||||||
|
Premium tax expenses
|
468
|
|
397
|
|
294
|
|
172
|
|
159
|
|
|||||||||
|
Health insurer fee expenses
|
217
|
|
157
|
|
89
|
|
—
|
|
—
|
|
|||||||||
|
Depreciation and amortization
|
139
|
|
104
|
|
93
|
|
73
|
|
63
|
|
|||||||||
|
Total operating expenses
|
17,476
|
|
13,791
|
|
9,474
|
|
6,452
|
|
5,873
|
|
|||||||||
|
Operating income
|
306
|
|
387
|
|
193
|
|
137
|
|
41
|
|
|||||||||
|
Other expenses, net:
|
|||||||||||||||||||
|
Interest expense
|
101
|
|
66
|
|
57
|
|
52
|
|
17
|
|
|||||||||
|
Other (income) expense, net
|
—
|
|
(1
|
)
|
1
|
|
4
|
|
1
|
|
|||||||||
|
Total other expenses, net
|
101
|
|
65
|
|
58
|
|
56
|
|
18
|
|
|||||||||
|
Income from continuing operations before income taxes
|
205
|
|
322
|
|
135
|
|
81
|
|
23
|
|
|||||||||
|
Income tax expense
|
153
|
|
179
|
|
73
|
|
36
|
|
10
|
|
|||||||||
|
Income from continuing operations
|
52
|
|
143
|
|
62
|
|
45
|
|
13
|
|
|||||||||
|
Income (loss) from discontinued operations, net of tax expense (benefit)
(2)
|
—
|
|
—
|
|
—
|
|
8
|
|
(3
|
)
|
|||||||||
|
Net income
|
$
|
52
|
|
$
|
143
|
|
$
|
62
|
|
$
|
53
|
|
$
|
10
|
|
||||
|
Basic net income per share:
(3)
|
|||||||||||||||||||
|
Income from continuing operations
|
$
|
0.93
|
|
$
|
2.75
|
|
$
|
1.34
|
|
$
|
0.98
|
|
$
|
0.28
|
|
||||
|
(Loss) income from discontinued operations
|
—
|
|
—
|
|
(0.01
|
)
|
0.18
|
|
(0.07
|
)
|
|||||||||
|
Basic net income per share
|
$
|
0.93
|
|
$
|
2.75
|
|
$
|
1.33
|
|
$
|
1.16
|
|
$
|
0.21
|
|
||||
|
Diluted net income per share:
(3)
|
|||||||||||||||||||
|
Income from continuing operations
|
$
|
0.92
|
|
$
|
2.58
|
|
$
|
1.30
|
|
$
|
0.96
|
|
$
|
0.27
|
|
||||
|
(Loss) income from discontinued operations
|
—
|
|
—
|
|
(0.01
|
)
|
0.17
|
|
(0.06
|
)
|
|||||||||
|
Diluted net income per share
|
$
|
0.92
|
|
$
|
2.58
|
|
$
|
1.29
|
|
$
|
1.13
|
|
$
|
0.21
|
|
||||
|
Weighted average shares outstanding:
|
|||||||||||||||||||
|
Basic
|
55
|
|
52
|
|
47
|
|
46
|
|
46
|
|
|||||||||
|
Diluted
|
56
|
|
56
|
|
48
|
|
47
|
|
47
|
|
|||||||||
_______________________________
|
(1)
|
Service revenue and cost of service revenue include revenue and costs generated by our Pathways subsidiary, which was acquired on November 1, 2015.
|
|
(2)
|
Income (loss) from discontinued operations is presented net of income tax expense (benefit), which was insignificant in
2016
,
2015
and
2014
, and $(10), and $(1), in
2013
and
2012
, respectively.
|
Molina Healthcare, Inc. 2016 Form 10-K | 33
|
(3)
|
Source data for calculations in thousands.
|
|
|
December 31,
|
||||||||||||||||||
|
|
2016
|
2015
|
2014
|
2013
|
2012
|
||||||||||||||
|
Balance Sheet Data:
|
|||||||||||||||||||
|
Cash and cash equivalents
|
$
|
2,819
|
|
$
|
2,329
|
|
$
|
1,539
|
|
$
|
936
|
|
$
|
796
|
|
||||
|
Total assets
|
7,449
|
|
6,576
|
|
4,435
|
|
2,988
|
|
1,901
|
|
|||||||||
|
Long-term debt, including current portion
(1)
|
1,645
|
|
1,609
|
|
887
|
|
770
|
|
261
|
|
|||||||||
|
Total liabilities
|
5,800
|
|
5,019
|
|
3,425
|
|
2,095
|
|
1,119
|
|
|||||||||
|
Stockholders’ equity
|
1,649
|
|
1,557
|
|
1,010
|
|
893
|
|
782
|
|
|||||||||
|
(1)
|
Includes senior notes, lease financing obligations, and other long-term debt.
|
STOCK REPURCHASE PROGRAMS
Purchases of common stock made by us, or on our behalf during the quarter ended December 31,
2016
, including shares withheld by us to satisfy our employees’ income tax obligations, are set forth below:
|
Total Number
of Shares
Purchased
(1)
|
Average Price Paid per
Share (1) |
Total Number of
Shares Purchased as
Part of Publicly
Announced Plans or
Programs
(2)
|
Approximate Dollar Value of Shares Authorized to Be Purchased Under the Plans or Programs
(2)
|
||||||||||
|
October 1 — October 31
|
185
|
|
$
|
58.32
|
|
—
|
|
$
|
50,000,000
|
|
|||
|
November 1 — November 30
|
329
|
|
$
|
53.94
|
|
—
|
|
$
|
50,000,000
|
|
|||
|
December 1 — December 31
|
339
|
|
$
|
52.69
|
|
—
|
|
$
|
50,000,000
|
|
|||
|
853
|
|
$
|
54.39
|
|
—
|
|
|||||||
_______________________________
|
(1)
|
During the quarter ended December 31, 2016, we withheld
853
shares of common stock under our 2011 Equity Incentive Plan to settle our employees’ income tax obligations.
|
|
(2)
|
In December 2015, our board of directors authorized the repurchase of up to
$50 million
in aggregate of our common stock or senior notes. We did not repurchase any shares under this program, which expired without renewal on December 31, 2016.
|
STOCK PERFORMANCE GRAPH
The following graph and related discussion are being furnished solely to accompany this Annual Report on Form 10-K pursuant to Item 201(e) of Regulation S-K and shall not be deemed to be “soliciting materials” or to be “filed” with the U.S. Securities and Exchange Commission (SEC) (other than as provided in Item 201) nor shall this information be incorporated by reference into any future filing under the Securities Act or the Exchange Act, whether made before or after the date hereof and irrespective of any general incorporation language contained therein, except to the extent that we specifically incorporate it by reference into a filing.
The following line graph compares the percentage change in the cumulative total return on our common stock against the cumulative total return of the Standard & Poor’s Corporation Composite 500 Index (S&P 500) and a peer group index for the five-year period from December 31,
2011
to
December 31, 2016
. The comparison assumes $100 was invested on December 31,
2011
, in our common stock and in each of the foregoing indices and assumes reinvestment of dividends. The stock performance shown on the graph below represents historical stock performance and is not necessarily indicative of future stock price performance.
Molina Healthcare, Inc. 2016 Form 10-K | 34
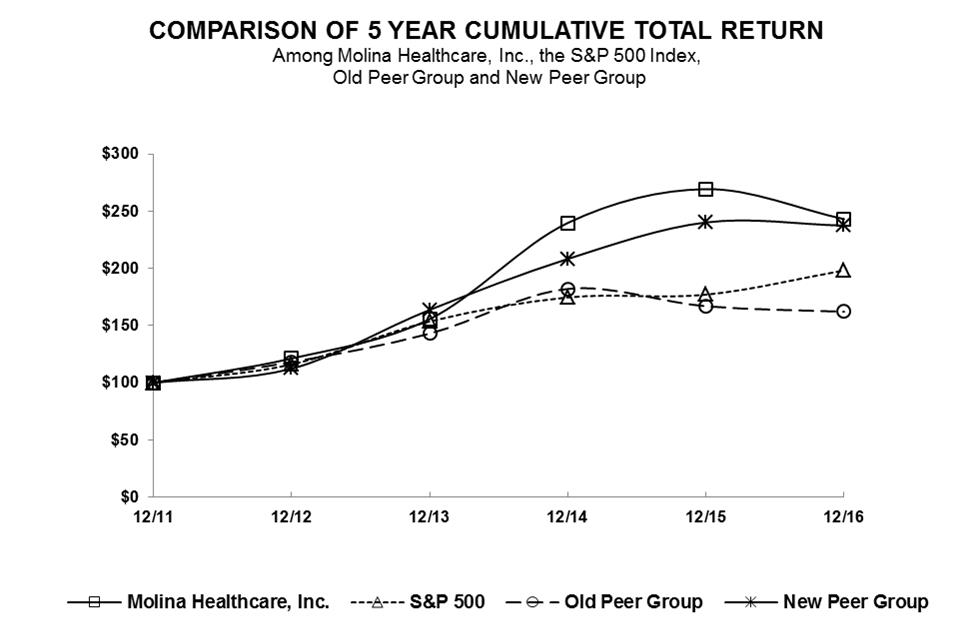
The old peer group index, used in last year’s Annual Report on Form 10-K and also set forth above, consists of Brookdale Senior Living, Inc. (BKD), Catamaran Corporation (CTRX), Centene Corporation (CNC), Community Health Systems, Inc. (CYH), DaVita HealthCare Partners, Inc. (DVA), Health Net, Inc. (HNT), Kindred Healthcare, Inc. (KND), Laboratory Corporation of America Holdings (LH), Life Point Hospitals, Inc. (LPNT), Magellan Health, Inc. (MGLN), Omnicare, Inc. (OCR), Quest Diagnostics, Inc. (DGX), Select Medical Holdings Corporation (SEM), Team Health Holdings, Inc. (TMH), Tenet Healthcare Corporation (THC), Universal American Corporation (UAM), Universal Health Services, Inc. (UHS) and WellCare Health Plans, Inc. (WCG).
The new peer group index consists of Centene Corporation (CNC), Cigna Corporation (CI), DaVita HealthCare Partners, Inc. (DVA), Humana Inc. (HUM), Magellan Health, Inc. (MGLN), Team Health Holdings, Inc. (TMH), Tenet Healthcare Corporation (THC), Triple-S Management Corporation (GTS), Universal American Corporation (UAM), Universal Health Services, Inc. (UHS) and WellCare Health Plans, Inc. (WCG).
Molina Healthcare, Inc. 2016 Form 10-K | 35
STOCK PRICE RANGE AND DIVIDENDS
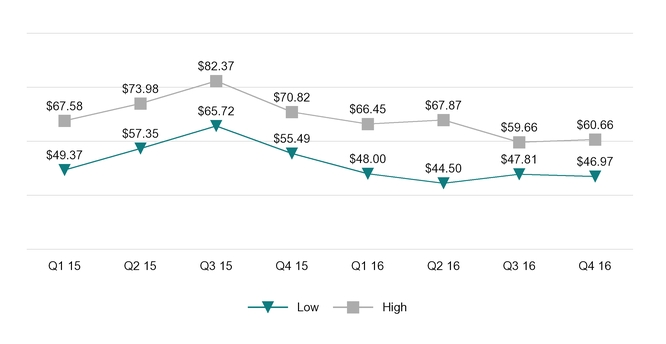
Our common stock is listed on the New York Stock Exchange under the trading symbol “MOH.” As of
February 24, 2017
, there were approximately 120 holders of record of our common stock.
To date we have not paid cash dividends on our common stock. We currently intend to retain any future earnings to fund our projected business growth. However, we intend to periodically evaluate our cash position to determine whether to pay a cash dividend in the future.
Our ability to pay dividends is partially dependent on, among other things, our receipt of cash dividends from our regulated subsidiaries. The ability of our regulated subsidiaries to pay dividends to us is limited by the state departments of insurance in the states in which we operate or may operate, as well as requirements of the government-sponsored health programs in which we participate. Additionally, the indentures governing our outstanding senior notes and the credit agreement governing the revolving credit facility contain various covenants that limit our ability to pay dividends on our common stock.
Any future determination to pay dividends will be at the discretion of our board of directors and will depend upon, among other factors, our results of operations, financial condition, capital requirements and contractual and regulatory restrictions. For more information regarding restrictions on the ability of our regulated subsidiaries to pay dividends to us, please see Notes to Consolidated Financial Statements, Note
19
, “
Commitments and Contingencies
—Regulatory Capital Requirements and Dividend Restrictions.”
PROPERTIES
As of December 31, 2016, the Health Plans segment leased a total of 89 facilities, the Molina Medicaid Solutions segment leased a total of 13 facilities and the Other segment leased a total of 289 facilities. We own a 186,000 square-foot office building in Troy, Michigan and a 24,000 square-foot mixed use (office and clinic) facility in Pomona, California under our Health Plans segment. We own a 26,700 square foot data center in Albuquerque, New Mexico and 40 properties in Pennsylvania, which are primarily residential housing facilities, under our Other segment. While we believe our current and anticipated facilities will be adequate to meet our operational needs for the foreseeable future, we are continuing to periodically evaluate our employee and operational growth prospects to determine if additional space is required, and where it would be best located.
EMPLOYEES
As of
December 31, 2016
, we had approximately 21,000 employees. Our employee base is multicultural and reflects the diverse membership we serve.
Molina Healthcare, Inc. 2016 Form 10-K | 36
AVAILABLE INFORMATION
Dr. C. David Molina founded our Company in 1980 as a provider organization serving low-income families in Southern California. We were originally organized in California as a holding company for our initial health plan and reincorporated in Delaware in 2002.
Our principal executive offices are located at 200 Oceangate, Suite 100, Long Beach, California 90802, and our telephone number is (562) 435-3666.
You can access our website at
www.molinahealthcare.com
to learn more about our Company.
From that site, you can download and print copies of our Annual Reports on Form 10-K, Quarterly Reports on Form 10-Q, and Current Reports on Form 8-K, along with amendments to those reports. You can also download our Corporate Governance Guidelines, Board of Directors committee charters, and Code of Business Conduct and Ethics. We make periodic reports and amendments available, free of charge, as soon as reasonably practicable after we file or furnish these reports to the SEC. We will also provide a copy of any of our corporate governance policies published on our website free of charge, upon request. To request a copy of any of these documents, please submit your request to: Molina Healthcare, Inc., 200 Oceangate, Suite 100, Long Beach, California 90802, Attn: Investor Relations.
Information on or linked to our website is neither part of nor incorporated by reference into this Annual Report on Form 10-K or any other SEC filings.
RISK FACTORS
This Annual Report on Form 10-K and the documents we incorporate by reference in this report contain “forward-looking statements” as discussed in the Forward-Looking Statements section.
The risk factors below should be considered not only with regard to the information contained in this annual report, but also with regard to the information and statements in the other periodic or current reports we file with the SEC, as well as our press releases, presentations to securities analysts or investors, or other communications made by or with the approval of one of our executive officers.
No assurance can be given that we will actually achieve the results contemplated or disclosed in our forward-looking statements. Such statements may turn out to be wrong due to the inherent uncertainties associated with future events. Accordingly, you should not place undue reliance on our forward-looking statements, which reflect management’s analyses, judgments, beliefs, or expectations only as of the date they are made.
The risks and uncertainties described below are those that we currently believe may materially affect us. Additional risks and uncertainties not currently known to us or that we currently deem insignificant may also affect our business and operations. As such, you should not consider this list to be a complete statement of all potential risks or uncertainties. Except to the extent otherwise required by federal securities laws, we do not undertake to address or update forward-looking statements in future filings or communications regarding our business or operating results, and do not undertake to address how any of these factors may have caused results to differ from discussions or information contained in previous filings or communications.
Risks Related to Our Health Plans Segment
We operate in an unstable political environment which creates uncertainties with regard to the sources and amounts of our revenues, volatility with regard to the amount of our medical costs, and vulnerability to unforeseen programmatic or regulatory changes.
As a result of the election of President Trump and the GOP control of both houses of Congress, there is currently a great deal of discussion and debate about the repeal and replacement of the ACA. As a result, the future of the ACA and its underlying programs are subject to substantial uncertainty, making long-term business planning exceedingly difficult. We are unable to predict with any degree of certainty whether the ACA will be modified or repealed in its entirety, and if it is repealed, what it will be replaced with; nor are we able to predict when any such changes, if enacted, would become effective.
Currently, there are a number of different legislative proposals being considered, some of which would involve significantly reduced federal spending on the Medicaid program, and constitute a fundamental change in the federal role in health care. These proposals include elements such as the following: ending the entitlement nature of Medicaid (and perhaps Medicare as well) by capping future increases in federal health spending for these programs, and shifting much more of the risk for health costs in the future to states and consumers; reversing the ACA’s expansion of Medicaid that enables states to cover low-income childless adults; changing Medicaid to a state
Molina Healthcare, Inc. 2016 Form 10-K | 37
block grant program, including potentially capping spending on a per-enrollee basis (a “per capita cap”); prohibiting the federal government from operating Marketplaces; eliminating the advanced premium tax credits, and cost-sharing reductions for low income individuals who purchase their health insurance through the Marketplaces; expanding and encouraging the use of private health savings accounts; providing for insurance plans that offer fewer and less extensive health insurance benefits than under the ACA’s essential health benefits package, including broader use of catastrophic coverage plans; establishing and funding high risk pools or reinsurance programs for individuals with chronic or high cost conditions; allowing insurers to sell insurance across state lines; and numerous other potential changes and reforms. Changes to or the repeal of the ACA, or the adoption of new health care regulatory laws, could have a material adverse effect on our business, financial condition, cash flows or results of operations.
The Medicaid Expansion could be reversed.
In the states that have elected to participate, the ACA provided for the expansion of the Medicaid program to offer eligibility to nearly all low-income people under age 65 with incomes at or below 138% of the federal poverty line. Since January 1, 2014, our health plans in California, Illinois, Michigan, New Mexico, Ohio, and Washington have participated in the Medicaid Expansion program under the ACA. At December 31, 2016, our membership included approximately
673,000
Medicaid Expansion members, or
16%
of our total membership. If the Medicaid Expansion is reversed by repeal of the ACA, we could lose this membership, which could have a material adverse effect on our business, financial condition, cash flows, or results of operations.
The Marketplace could be eliminated, or our continued participation in 2018 could become financially unsustainable.
The ACA authorized the creation of marketplace insurance exchanges (the “Marketplace”), allowing individuals and small groups to purchase federally subsidized health insurance. We participate in the individual Marketplace in nine states. As of
December 31, 2016
, our Marketplace membership represented
13%
of our total membership, or approximately
526,000
members. Our membership in 2017 is even higher, with 920,000 members as of January 31, 2017. The risk of material variances between actual results and our pricing assumptions is compounded by increased uncertainty created by competitors exiting the Marketplace, unknown impacts of legislative and/or regulatory changes, and changes to the risk transfer algorithm.
A number of larger commercial insurance plans, including most recently, Humana Inc., have announced their intention to discontinue their participation in the Marketplace. The perceived instability and impending changes in the Marketplace could further promote reduced participation among the uninsured. Further, the withdrawal of cost sharing subsidiaries and/or premium tax credits, the elimination of the individual mandate to purchase health insurance, the use of special enrollment periods, or any announcement that some or all of our health plans will be leaving the Marketplace for 2018, could additionally impact Marketplace enrollment. These market and political dynamics may increase the risk that our Marketplace products will be selected by individuals who have a higher risk profile or utilization rate than we anticipated when we established the pricing for our Marketplace products, leading to financial losses.
In addition, during 2016 our results were severely impacted by a risk transfer methodology that we believe penalizes comparatively efficient and affordable health plans like ours. That same flawed methodology is also in place for 2017 (although we are advocating for its immediate change). If we fail to accurately project the adverse impact of the risk transfer methodology, our results in 2017 could be adversely and materially affected.
The Medicare-Medicaid Duals Demonstration Pilot Programs could be discontinued or altered, resulting in a loss of premium revenue.
To coordinate care for those who qualify to receive both Medicare and Medicaid services (the “dual eligibles”), and to deliver services to these individuals in a more financially efficient manner, under the direction of CMS some states implemented demonstration pilot programs to integrate Medicare and Medicaid services for dual eligible individuals. The health plans participating in such demonstrations are referred to as Medicare-Medicaid Plans (MMPs). We operate MMPs in six states: California, Illinois, Michigan, Ohio, South Carolina, and Texas. At
December 31, 2016
, our membership included approximately
51,000
integrated MMP members, representing just over
1%
of our total membership. However, the capitation payments paid to us for dual eligible is significantly higher than the capitation payments for other members, representing
8%
of our total premium revenues in 2016. If the states running the MMP pilot programs conclude that the programs are not delivering better coordinated care and reduced cost, they could decide to discontinue the programs, or to substantially alter the programs, resulting in a reduction in our premium revenues.
Molina Healthcare, Inc. 2016 Form 10-K | 38
Continuing changes in health care laws, and in the health care industry, make it difficult to develop actuarially sound rates.
Comprehensive changes to the U.S. health care system make it more difficult for us to manage our business, and increase the likelihood that the assumptions we make with respect to our future operations and results will prove to be inaccurate. The continuing pace of change has made it difficult for us to develop actuarially sound rates because we have limited historical information on which to develop these rates. In the absence of significant historical information to develop actuarial rates, we must make certain assumptions. These assumptions may subsequently prove to be inaccurate. For example, rates of utilization could be significantly higher than we projected, or the assumptions of policymakers about the amount of savings that could be achieved through the use of utilization management in managed care could be flawed. Moreover, our lack of actuarial experience for a particular program, region, or population, could cause us to set our reserves at an inadequate level.
We are dependent upon a small number of state Medicaid contracts for the majority of our revenue.
If the responsive bids of our health plans for new or renewed Medicaid contracts are not successful, or if our government contracts are terminated or are not renewed, our premium revenues could be materially reduced and our operating results could be negatively impacted.
Many of our government contracts are subject to periodic competitive bidding. In 2017, we expect to participate in a competitive bidding process in each of the states of Illinois, Washington, Florida, New Mexico and Texas. In such process, our health plans may face competition from numerous other health plans, many with greater financial resources and greater name recognition than we have. If the responsive bid of one or more of our health plans is not successful, we will lose our Medicaid contract in the applicable state or states, and our premium revenues could be materially reduced as a result. If we are unable to renew, successfully re-bid, or compete for any of our government contracts, or if any of our contracts are terminated or renewed on less favorable terms, our business, financial condition, cash flows, or results of operations could be adversely affected. Alternatively, even if our responsive bids are successful, the bids may be based upon assumptions regarding enrollment, utilization, medical costs, or other factors which could result in the Medicaid contract being less profitable than we had expected or, in extreme cases, could result in a net loss.
Because we derive our premium revenues from a relatively small number of state health plans, adverse changes in any one of the jurisdictions in which we operate could adversely impact our business, financial condition, cash flows, or results of operations.
We currently derive our premium revenues from
12
state health plans and our health plan in the Commonwealth of Puerto Rico. If we are unable to continue to operate in any of those jurisdictions, or if our current operations in any portion of the jurisdictions we are in are significantly curtailed, our revenues could decrease materially. Our reliance on operations in a limited number of jurisdictions could cause our revenue and profitability to change suddenly and unexpectedly in the event of an abrupt loss of membership, significant rate reductions, a loss of a material contract, legislative actions, changes in Medicaid eligibility methodologies, catastrophic claims, an epidemic, an unexpected increase in utilization, general economic conditions, and similar factors in those jurisdictions. Our inability to continue to operate in any of the jurisdictions in which we currently operate, or a significant change in the nature of our existing operations, could have a material adverse effect on our business, financial condition, cash flows, or results of operations.
Our health plans segment operates with very low profit margins, and small changes in operating performance or slight changes to our accounting estimates will have a disproportionate impact on our reported net income.
A substantial portion of our premium revenues is subject to risks related to medical cost expenditure floors and corridors, administrative cost and profit ceilings, premium stabilization programs, and cost-plus and performance-based reimbursement programs.
A substantial portion of our premium revenue is subject to contract provisions pertaining to medical cost floors and corridors, administrative cost and profit ceilings, cost-plus reimbursement, premium stabilization programs, and profit-sharing arrangements. Many of these contract provisions are complex, or are poorly or ambiguously drafted, and thus are potentially subject to differing interpretations by ourselves and the relevant government agency with whom we contract. If the applicable government agency disagrees with our interpretation or implementation of a particular contract provisions at issue, we could be required to adjust the amount of our obligations under these provisions and/or make a payment or payments to the government agency. Any interpretation of these contract
Molina Healthcare, Inc. 2016 Form 10-K | 39
provisions that varies from our interpretation and implementation of the provision, or that is inconsistent with our revenue recognition accounting treatment, could have a material adverse effect on our business, financial condition, cash flows, or results of operations.
In addition, many of our contracts also contain provisions pertaining to at-risk premiums that require us to meet certain quality performance measures to earn all of our contract revenues. If we are unsuccessful in achieving the stated performance measure, we will be unable to recognize the revenue associated with that measure. Any failure of our health plans to satisfy one of these performance measure provisions could have a material adverse effect on our business, financial condition, cash flows or results of operations.
If we are unable to deliver quality care, and maintain good relations with the physicians, hospitals, and other providers with whom we contract, or if we are unable to enter into cost-effective contracts with such providers, our profitability could be adversely affected.
We contract with physicians, hospitals, and other providers as a means to ensure access to health care services for our members, to manage health care costs and utilization, and to better monitor the quality of care being delivered. We compete with other health plans to contract with these providers. We believe providers select plans in which they participate based on criteria including reimbursement rates, timeliness and accuracy of claims payment, potential to deliver new patient volume and/or retain existing patients, effectiveness of resolution of calls and complaints, and other factors. We cannot be sure that we will be able to successfully attract and retain providers to maintain a competitive network in the geographic areas we serve. In addition, in any particular market, providers could refuse to contract with us, demand higher payments, or take other actions which could result in higher health care costs, disruption to provider access for current members, a decline in our growth rate, or difficulty in meeting regulatory or accreditation requirements.
The Medicaid program generally pays doctors and hospitals at levels well below those of Medicare and private insurance. Large numbers of doctors, therefore, do not accept Medicaid patients. In the face of fiscal pressures, some states may reduce rates paid to providers, which may further discourage participation in the Medicaid program.
In some markets, certain providers, particularly hospitals, physician/hospital organizations, and some specialists, may have significant market positions or even monopolies. If these providers refuse to contract with us or utilize their market position to negotiate favorable contracts which are disadvantageous to us, our profitability in those areas could be adversely affected.
Some providers that render services to our members are not contracted with our health plans. In those cases, there is no pre-established understanding between the provider and our health plan about the amount of compensation that is due to the provider. In some states, the amount of compensation is defined by law or regulation, but in most instances it is either not defined or it is established by a standard that is not clearly translatable into dollar terms. In such instances, providers may believe they are underpaid for their services and may either litigate or arbitrate their dispute with our health plan. The uncertainty of the amount to pay and the possibility of subsequent adjustment of the payment could adversely affect our business, financial condition, cash flows, or results of operations.
Failure to attain profitability in any new start-up operations could negatively affect our results of operations.
Start-up costs associated with a new business can be substantial. For example, to obtain a certificate of authority to operate as a health maintenance organization in most jurisdictions, we must first establish a provider network, have infrastructure and required systems in place, and demonstrate our ability to obtain a state contract and process claims. Often, we are also required to contribute significant capital to fund mandated net worth requirements, performance bonds or escrows, or contingency guaranties. If we are unsuccessful in obtaining the certificate of authority, winning the bid to provide services, or attracting members in sufficient numbers to cover our costs, any new business of ours would fail. We also could be required by the state or commonwealth to continue to provide services for some period of time without sufficient revenue to cover our ongoing costs or to recover our start-up costs.
Even if we are successful in establishing a profitable health plan in a new state or commonwealth, increasing membership, revenues, and medical costs will trigger increased mandated net worth requirements which could substantially exceed the net income generated by the health plan. Rapid growth in an existing state or commonwealth will also result in increased net worth requirements. In such circumstances, we may not be able to fund on a timely basis, or at all, the increased net worth requirements with our available cash resources. The expenses associated with starting up a health plan in a new state or commonwealth, or expanding a health plan in
Molina Healthcare, Inc. 2016 Form 10-K | 40
an existing state or commonwealth could have a material adverse effect on our business, financial condition, cash flows, or results of operations.
Difficulties in executing our acquisition strategy could adversely affect our business.
The acquisitions of other health plans and the assignment and assumption of Medicaid contract rights of other health plans have accounted for a significant amount of our growth over the last several years. Although we cannot predict with certainty our rate of growth as the result of acquisitions, we believe that additional acquisitions of all sizes will be important to our future growth strategy. Many of the other potential purchasers of these assets—particularly operators of large commercial health plans—have significantly greater financial resources than we do. Also, many of the sellers may insist on selling assets that we do not want, such as commercial lines of business, or may insist on transferring their liabilities to us as part of the sale of their companies or assets. Even if we identify suitable targets, we may be unable to complete acquisitions on terms favorable to us, or at all, or obtain the necessary financing for these acquisitions. For these reasons, among others, we cannot provide assurance that we will be able to complete favorable acquisitions, especially in light of the volatility in the capital markets over the past several years, or that we will not complete acquisitions that turn out to be unfavorable. Further, to the extent we complete an acquisition, we may be unable to realize the anticipated benefits from such acquisition because of operational factors or difficulty in integrating the acquisition with our existing business. Problems that we may encounter in connection with our integration efforts include the following:
|
•
|
additional employees who are not familiar with our operations or our corporate culture,
|
|
•
|
new provider networks which may operate on terms different from our existing networks,
|
|
•
|
additional members who may decide to transfer to other health care providers or health plans,
|
|
•
|
disparate information, claims processing, and record-keeping systems and difficulties integrating the acquired businesses on our information technology platform,
|
|
•
|
internal controls and accounting policies, including those which require the exercise of judgment and complex estimation processes, such as estimates of claims incurred but not reported, accounting for goodwill, intangible assets, stock-based compensation, and income tax matters, and
|
|
•
|
new regulatory schemes, relationships, practices, and compliance requirements.
|
We are generally required to obtain regulatory approval from one or more state agencies when making acquisitions of health plans. If we seek to acquire a business located in a state in which we do not already operate, we must obtain the necessary licenses to operate in that state. In addition, although we may already operate in a state in which we acquire a new business, we would be required to obtain regulatory approval if, as a result of the acquisition, we will operate in an area of that state in which we did not operate previously. Furthermore, we may be required to renegotiate contracts with the network providers of the acquired business. We may be unable to obtain the necessary governmental approvals, comply with these regulatory requirements or renegotiate the necessary provider contracts in a timely manner, if at all.
The exorbitant cost of specialty drugs and new generic drugs could have a material adverse effect on the level of our medical costs and our results of operations.
Introduction of new high cost specialty drugs and sudden costs spikes for existing drugs increase the risk that the pharmacy cost assumptions used to develop our capitation rates are not adequate to cover the actual pharmacy costs, which jeopardizes the overall actuarial soundness of our rates. Bearing the high costs of new specialty drugs or the high cost inflation of generic drugs without an appropriate rate adjustment or other reimbursement mechanism adversely impacts our financial conditional and operational results. For example, Gilead priced a new hepatitis C drug, Sovaldi, at $84,000 per standard course of therapy in 2014. With the advent of Sovaldi in early 2014, the cost of the drug was generally not factored into our 2014 capitation rates which undermined the actuarial soundness of those rates. Further, the relatively high incidence of hepatitis C in Medicaid populations coupled with the exorbitant cost of Sovaldi created a public health and public financing problem across the country. More recently, the FDA approved the first drug to treat patients with spinal muscular atrophy, Spinraza, in December 2016. After this approval, the distributor of Spinraza announced that one dose will have a list price of $125,000, which means the drug will cost between $650,000 and $750,000 to cover the five or six doses required in the first year, and approximately $375,000 annually thereafter, presumably for the life of the patient. The inordinate cost of Spinraza was not contemplated in the development of our 2017 capitation rates. In addition, evolving regulations and state and federal mandates regarding coverage may impact the ability of our health plans to continue to receive existing price discounts on pharmaceutical products for our members. Other factors affecting our pharmaceutical costs include, but are not limited to, geographic variation in utilization of new and existing pharmaceuticals, and
Molina Healthcare, Inc. 2016 Form 10-K | 41
changes in discounts. Although we will continue to work with state Medicaid agencies in an effort to ensure that we receive appropriate and actuarially sound reimbursement for all new drug therapies and pharmaceuticals trends, there can be no assurance that we will always be successful.
We rely on the accuracy of eligibility lists provided by state governments. Inaccuracies in those lists would negatively affect our results of operations.
Premium payments to our health plans are based upon eligibility lists produced by state governments. From time to time, states require us to reimburse them for premiums paid to us based on an eligibility list that a state later discovers contains individuals who are not in fact eligible for a government sponsored program or are eligible for a different premium category or a different program. Alternatively, a state could fail to pay us for members for whom we are entitled to payment. Our results of operations would be adversely affected as a result of such reimbursement to the state if we make or have made related payments to providers and are unable to recoup such payments from the providers.
The insolvency of a delegated provider could obligate us to pay its referral claims, which could have a material adverse effect on our business, cash flows, or results of operations.
Many of our primary care physicians and a small portion of our specialists and hospitals are paid on a capitated basis. Under capitation arrangements, we pay a fixed amount PMPM to the provider without regard to the frequency, extent, or nature of the medical services actually furnished. Due to insolvency or other circumstances, such providers may be unable to pay claims they have incurred with third parties in connection with referral services provided to our members. The inability of delegated providers to pay referral claims presents us with both immediate financial risk and potential disruption to member care. Depending on states’ laws, we may be held liable for such unpaid referral claims even though the delegated provider has contractually assumed such risk. Additionally, competitive pressures may force us to pay such claims even when we have no legal obligation to do so; or we have already paid claims to a delegated provider and such payments cannot be recouped when the delegated provider becomes insolvent. Liabilities incurred or losses suffered as a result of provider insolvency could have a material adverse effect on our business, financial condition, cash flows, or results of operations.
Numerous circumstances might lead to inadequate premium rates, or to the inability of Medicaid agencies to pay us according to the terms of our contracts with those agencies.
State and federal budget deficits may result in Medicaid, CHIP, or Medicare funding cuts which could have a material adverse effect on our business, financial condition, cash flows, or results of operations.
Nearly all of our premium revenues come from the joint federal and state funding of the Medicaid and CHIP programs. The states in which we operate our health plans regularly face significant budgetary pressures. As discussed below, such budgetary pressures are particularly intense in the Commonwealth of Puerto Rico. State budgetary pressures may result in unexpected Medicaid, CHIP, or Medicare rate cuts which could reduce our revenues and profit margins. Moreover, some federal deficit reduction or entitlement reform proposals would fundamentally change the structure and financing of the Medicaid program. A number of these proposals include both tax increases and spending reductions in discretionary programs and mandatory programs, such as Social Security, Medicare, and Medicaid.
We are unable to determine how any future congressional spending cuts will affect Medicare and Medicaid reimbursement. We believe there will continue to be legislative and regulatory proposals at the federal and state levels directed at containing or lowering the cost of health care that, if adopted, could have a material adverse effect on our business, financial condition, cash flows, or results of operations.
Receipt of inadequate or significantly delayed premiums could negatively affect our business, financial condition, cash flows, or results of operations.
Our premium revenues consist of fixed monthly payments per member, and supplemental payments for other services such as maternity deliveries. These premiums are fixed by contract, and we are obligated during the contract periods to provide health care services as established by the state governments. We use a large portion of our revenues to pay the costs of health care services delivered to our members. If premiums do not increase when expenses related to medical services rise, our medical margins will be compressed, and our earnings will be negatively affected. A state could increase hospital or other provider rates without making a commensurate increase in the rates paid to us, or could lower our rates without making a commensurate reduction in the rates paid to hospitals or other providers. In addition, if the actuarial assumptions made by a state in implementing a rate or benefit change are incorrect or are at variance with the particular utilization patterns of the members of one or more
Molina Healthcare, Inc. 2016 Form 10-K | 42
of our health plans, our medical margins could be reduced. Any of these rate adjustments in one or more of the states in which we operate could have a material adverse effect on our business, financial condition, cash flows, or results of operations.
Furthermore, a state or commonwealth undergoing a budget crisis may significantly delay the premiums paid to one of our health plans. Any significant delay in the monthly payment of premiums to any of our health plans could have a material adverse effect on our business, financial condition, cash flows, or results of operations.
If a state fails to renew its federal waiver application for mandated Medicaid enrollment into managed care or such application is denied, our membership in that state will likely decrease.
States may only mandate Medicaid enrollment into managed care under federal waivers or demonstrations. Waivers and programs under demonstrations are approved for two- to five-year periods and can be renewed on an ongoing basis if the state applies and the waiver request is approved or renewed by CMS. We have no control over this renewal process. If a state in which we operate a health plan does not renew its mandated program or the federal government denies the state’s application for renewal, our business would suffer as a result of a likely decrease in membership.
The Commonwealth of Puerto Rico may fail to pay the premiums of our Puerto Rico health plan, which could negatively impact our business, financial condition, cash flows, or results of operations.
The government of Puerto Rico continues to struggle with major fiscal and liquidity challenges. The extreme financial difficulties faced by the Commonwealth may make it impossible for ASES, the Puerto Rico Medicaid agency, to pay our Puerto Rico health plan under the terms of the parties’ Medicaid contract. As of
December 31, 2016
, our Puerto Rico health plan served approximately
330,000
members, and had recognized premium revenue of approximately
$191 million
in the fourth quarter of 2016, or approximately
$64 million
per month. A default by ASES on its payment obligations under our Medicaid contract, or a determination by ASES to terminate our contract based on insufficient funds available, could result in our having paid, or in our having to pay, provider claims in amounts for which we are not paid reimbursement, and could make it unfeasible for the Puerto Rico health plan to continue to operate. A default by ASES or termination of our Puerto Rico Medicaid contract could have a material adverse effect on our business, financial condition, cash flows, or results of operations.
Pandemics, natural disasters and other health care emergencies may threaten our solvency.
Large-scale medical emergencies in one or more states in which we operate our health plans could significantly increase utilization rates and medical costs.
Large-scale medical emergencies can take many forms and be associated with widespread illness or medical conditions. For example, natural disasters, such as a major earthquake in Los Angeles or Cascadia, or a major hurricane in Florida or South Carolina, could have a significant impact on the health of a large number of our covered members. Other conditions that could impact our members include an influenza epidemic, or newly emergent mosquito-borne illnesses, such as the Zika virus, the West Nile virus, or the Chikungunya virus, conditions for which vaccines may not exist, are not effective, or have not been widely administered. For example, the Zika virus is spreading at epidemic rates in Puerto Rico; a high incidence of Zika cases in Puerto Rico could increase our Puerto Rico’s health plan’s medical expenses beyond the amounts actuarially factored into its capitation rates.
In addition, federal and state law enforcement officials have issued warnings about potential terrorist activity involving biological or other weapons of mass destruction. All of these conditions, and others, could have a significant impact on the health of the population of wide-spread areas. We seek to set our IBNP reserves appropriately to account for anticipatable spikes in utilization, such as for the flu season. However, if one of our health plan states were to experience a large-scale natural disaster, a viral epidemic or pandemic, a significant terrorism attack, or some other large-scale event affecting the health of a large number of our members, our covered medical expenses in that state would rise, which could have a material adverse effect on our business, cash flows, financial condition, or results of operations.
Molina Healthcare, Inc. 2016 Form 10-K | 43
We measure our performance and adjust our actions based upon financial estimates that are inherently subject to retroactive changes.
A failure to accurately estimate incurred but not reported medical care costs may negatively impact our results of operations.
Because of the time lag between when medical services are actually rendered by our providers and when we receive, process, and pay a claim for those medical services, we must continually estimate our medical claims liability at particular points in time, and establish claims reserves related to such estimates. Our estimated reserves for such “incurred but not paid” (IBNP) medical care costs are based on numerous assumptions. We estimate our medical claims liabilities using actuarial methods based on historical data adjusted for claims receipt and payment experience (and variations in that experience), changes in membership, provider billing practices, health care service utilization trends, cost trends, product mix, seasonality, prior authorization of medical services, benefit changes, known outbreaks of disease or increased incidence of illness such as influenza, provider contract changes, changes to Medicaid fee schedules, and the incidence of high dollar or catastrophic claims. Our ability to accurately estimate claims for our newer lines of business or populations, such as with respect to duals, Medicaid expansion members, Marketplace members, or aged, blind or disabled Medicaid members, is negatively impacted by the more limited experience we have had with those populations.
The IBNP estimation methods we use and the resulting reserves that we establish are reviewed and updated, and adjustments, if deemed necessary, are reflected in the current period. Given the numerous uncertainties inherent in such estimates, our actual claims liabilities for a particular quarter or other period could differ significantly from the amounts estimated and reserved for that quarter or period. Our actual claims liabilities have varied and will continue to vary from our estimates, particularly in times of significant changes in utilization, medical cost trends, and populations and markets served.
If our actual liability for claims payments is higher than estimated, our earnings in any particular quarter or annual period could be negatively affected. Our estimates of IBNP may be inadequate in the future, which would negatively affect our results of operations for the relevant time period. Furthermore, if we are unable to accurately estimate IBNP, our ability to take timely corrective actions may be limited, further exacerbating the extent of the negative impact on our results.
We are subject to retroactive adjustment to our Medicaid premium revenue as a result of retroactive risk adjustment; retroactive changes to contract terms and the resolution of differing interpretations of those terms; the difficulty of estimating performance-based premium; and retroactive adjustments to “blended” premium rates to reflect the actual mix of members captured in those blended rates.
The complexity of some of our Medicaid contract provisions; the desire of state Medicaid agencies in some circumstances to retroactively adjust for the acuity of the medical needs of our members; and state delays in processing rate changes can create uncertainty around the amount of revenue we should recognize.
For example, in
February 2017, the New Mexico Human Services Department (HSD) notified us that it has disallowed certain medically related administrative expenses and other items in the computation of its Medicaid Expansion risk corridor; this corridor was effective January 1, 2014, through December 31, 2016. Although we disagree with their contractual interpretations, we deferred premium revenue amounting to approximately
$45 million
for the year ended December 31, 2016, as a result of this communication, because such revenue is presently subject to refund or adjustment.
Of this amount,
$29 million
relates to dates of service prior to 2016.
In another example, in the fourth quarter of 2016, our
California health plan received a contract amendment from the California Department of Healthcare Services that allowed us to deduct certain tax expenses in the computation of its Medicaid Expansion minimum medical loss ratio; this minimum medical loss ratio was effective January 1, 2014, through June 30, 2016. As a result of this contract amendment, we increased premium revenue for the year ended December 31, 2016, by approximately
$68 million
, of which
$35 million
related to periods prior to 2016.
Also in the fourth quarter of 2016, the Illinois Medicaid agency reduced our full year 2016 premium capitation payment by approximately $18 million as a result of a program wide risk adjustment that attempted to reduce revenue to health plans serving members with lower than average acuity and to transfer that premium revenue to health plans serving members with higher than average acuity.
In still another example, the California Medicaid agency has yet to share with us certain premium rates related to calendar year 2015 and 2016. We have also not reached agreement with the California Medicaid agency on the final aid category classifications for some members receiving long term services and supports. Since premium rates
Molina Healthcare, Inc. 2016 Form 10-K | 44
vary significantly by aid category, any difference in classification of these members could result in substantial variances in premium revenue between our current estimates and the amounts ultimately realized. The state Medicaid agency in California is also several years behind in its reconciliation and settlement with us of the difference between expenses that it has paid on our behalf to providers of long term services and supports and the amounts that it has withheld from our premium for those expenses.
Any circumstance such as those described above could have a material adverse effect on our business, financial condition, cash flows, or results of operations.
If we fail to accurately predict and effectively manage our medical care costs, our operating results could be materially and adversely affected.
Our profitability depends to a significant degree on our ability to accurately predict and effectively manage our medical care costs. Historically, our medical care ratio, meaning our medical care costs as a percentage of our premium revenue net of premium tax, has fluctuated substantially, and has varied across our state health plans. Because the premium payments we receive are generally fixed in advance and we operate with a narrow profit margin, relatively small changes in our medical care cost ratio can create significant changes in our overall financial results. For example, if our overall medical care ratio of
90.1%
, for the year ended
December 31, 2016
had been one percentage point higher, or
91.1%
, our net loss per diluted share for the year ended
December 31, 2016
would have been approximately $0.93 rather than our actual net income per diluted share of
$0.92
, a difference of $1.85.
Many factors may affect our medical care costs, including:
|
•
|
the level of utilization of health care services,
|
|
•
|
unexpected patterns in the annual flu season,
|
|
•
|
increases in hospital costs,
|
|
•
|
increased incidences or acuity of high dollar claims related to catastrophic illnesses or medical conditions for which we do not have adequate reinsurance coverage,
|
|
•
|
increased maternity costs,
|
|
•
|
payment rates that are not actuarially sound,
|
|
•
|
changes in state eligibility certification methodologies,
|
|
•
|
relatively low levels of hospital and specialty provider competition in certain geographic areas,
|
|
•
|
increases in the cost of pharmaceutical products and services,
|
|
•
|
changes in health care regulations and practices,
|
|
•
|
epidemics,
|
|
•
|
new medical technologies, and
|
|
•
|
other various external factors.
|
Many of these factors are beyond our control and could reduce our ability to accurately predict and effectively manage the costs of providing health care services. The inability to forecast and manage our medical care costs or to establish and maintain a satisfactory medical care cost ratio, either with respect to a particular state health plan or across the consolidated entity, could have a material adverse effect on our business, financial condition, cash flows, or results of operations.
We operate in a highly regulated environment.
If state regulators do not approve payments of dividends and distributions by our subsidiaries, it may negatively affect our business strategy.
We are a corporate parent holding company and hold most of our assets at, and conduct most of our operations through, direct subsidiaries. As a holding company, our results of operations depend on the results of operations of our subsidiaries. Moreover, we are dependent on dividends or other intercompany transfers of funds from our subsidiaries to meet our debt service and other obligations. The ability of our subsidiaries to pay dividends or make other payments or advances to us will depend on their operating results and will be subject to applicable laws and restrictions contained in agreements governing the debt of such subsidiaries. In addition, our health plan subsidiaries are subject to laws and regulations that limit the amount of dividends and distributions that they can pay to us without prior approval of, or notification to, state regulators. In California, our health plan may dividend, without notice to or approval of the California Department of Managed Health Care, amounts by which its tangible net equity exceeds 130% of the tangible net equity requirement. Our other health plans must give thirty days’ advance notice and the opportunity to disapprove “extraordinary” dividends to the respective state departments of insurance for amounts over the lesser of (a) ten percent of surplus or net worth at the prior year end or (b) the net income for the prior year. The discretion of the state regulators, if any, in approving or disapproving a dividend is not clearly defined. Health plans that declare non-extraordinary dividends must usually provide notice to the regulators
Molina Healthcare, Inc. 2016 Form 10-K | 45
ten or fifteen days in advance of the intended distribution date of the non-extraordinary dividend. We received $100 million and $125 million in dividends from our regulated health plan subsidiaries during 2016 and 2015, respectively. We did not receive any dividends from our regulated health plan subsidiaries during 2014, because significant growth across all of our health plans necessitated that the plans retain their cash to meet increasing net worth requirements. The aggregate additional amounts our health plan subsidiaries could have paid us at
December 31, 2016
and
2015
, without approval of the regulatory authorities, were approximately $201 million and $121 million, respectively. If the regulators were to deny or significantly restrict our subsidiaries’ requests to pay dividends to us, the funds available to our company as a whole would be limited, which could harm our ability to implement our business strategy. For example, we could be hindered in our ability to make debt service payments under the senior notes or the revolving credit facility (Credit Facility).
Our use and disclosure of personally identifiable information and other non-public information, including protected health information, is subject to federal and state privacy and security regulations, and our failure to comply with those regulations or to adequately secure the information we hold could result in significant liability or reputational harm.
State and federal laws and regulations including, but not limited to, HIPAA and the Gramm-Leach-Bliley Act, govern the collection, dissemination, use, privacy, confidentiality, security, availability, and integrity of personally identifiable information (PII), including protected health information, or PHI. HIPAA establishes basic national privacy and security standards for protection of PHI by covered entities and business associates, including health plans such as ours. HIPAA requires covered entities like us to develop and maintain policies and procedures for PHI that is used or disclosed, and to adopt administrative, physical, and technical safeguards to protect PHI. HIPAA also implemented the use of standard transaction code sets and standard identifiers that covered entities must use when submitting or receiving certain electronic health care transactions, including activities associated with the billing and collection of health care claims.
Mandatory penalties for HIPAA violations range from $100 to $50,000 per violation, and up to $1.5 million per violation of the same standard per calendar year. A single breach incident can result in violations of multiple standards, resulting in possible penalties potentially in excess of $1.5 million. If a person knowingly or intentionally obtains or discloses PHI in violation of HIPAA requirements, criminal penalties may also be imposed. HIPAA authorizes state attorneys general to file suit under HIPAA on behalf of state residents. Courts can award damages, costs, and attorneys’ fees related to violations of HIPAA in such cases. While HIPAA does not create a private right of action allowing individuals to sue us in civil court for HIPAA violations, its standards have been used as the basis for a duty of care in state civil suits such as those for negligence or recklessness in the misuse or breach of PHI.
In addition, HIPAA mandates that the Secretary of HHS conduct periodic compliance audits of HIPAA covered entities for compliance with the HIPAA Privacy and Security Standards. Investigations of violations that indicate willful neglect, for which penalties are now mandatory, are statutorily required. It also tasks HHS with establishing a methodology whereby harmed individuals who were the victims of breaches of unsecured PHI may receive a percentage of the civil monetary penalty fine paid by the violator.
HIPAA further requires covered entities to notify affected individuals “without unreasonable delay and in no case later than 60 calendar days after discovery of the breach” if their unsecured PHI is subject to an unauthorized access, use, or disclosure. If a breach affects 500 patients or more, it must be reported to HHS and local media without unreasonable delay, and HHS will post the name of the breaching entity on its public website. If a breach affects fewer than 500 individuals, the covered entity must log it and notify HHS at least annually. We have experienced HIPAA breaches in the past, including breaches affecting over 500 individuals.
The Health Information Technology for Economic and Clinical Health Act (HITECH Act), a part of the American Recovery and Reinvestment Act of 2009, or ARRA, modified certain provisions of HIPAA by, among other things, extending the privacy and security provisions to business associates, mandating new regulations around electronic medical records, expanding enforcement mechanisms, allowing the state Attorneys General to bring enforcement actions, and increasing penalties for violations. As required by ARRA, the Secretary of HHS has promulgated regulations implementing various provisions of the HITECH Act. The Final Omnibus Rule promulgated by HHS in January 2013, included the Final Breach Notification Rule as well as provisions that apply the HIPAA regulatory scheme to business associates. We anticipate that HHS will promulgate additional rules under the HITECH Act to implement provisions of the statute which were not addressed in the Final Omnibus Rule. The various requirements of the HITECH Act and the Final Omnibus Rule have different compliance dates, and in some cases, the applicable compliance date may depend on the publication of additional rules or guidance by HHS. With respect to those requirements whose compliance dates have passed, we believe that we are in compliance with such provisions. With respect to additional requirements that may be issued in the future by HHS, it is our intention to implement any such new requirements on or before the applicable compliance dates.
Molina Healthcare, Inc. 2016 Form 10-K | 46
New health information standards, whether implemented pursuant to HIPAA, congressional action, or otherwise, could have a significant effect on the manner in which we must handle health care related data, and the cost of complying with standards could be significant. If we do not comply with existing or new laws and regulations related to PHI, PII, or non-public information, we could be subject to criminal or civil sanctions. Any security breach involving the misappropriation, loss, or other unauthorized disclosure or use of confidential member information, whether by us or a third party, such as our vendors, could subject us to civil and criminal penalties, divert management’s time and energy, and have a material adverse effect on our business, financial condition, cash flows, or results of operations.
We are subject to extensive fraud and abuse laws that may give rise to lawsuits and claims against us, the outcome of which may have a material adverse effect on our business, financial condition, cash flows, or results of operations.
Because we receive payments from federal and state governmental agencies, we are subject to various laws commonly referred to as “fraud and abuse” laws, including federal and state anti-kickback statutes, prohibited referrals, and the federal False Claims Act, which permit agencies and enforcement authorities to institute a suit against us for violations and, in some cases, to seek treble damages, criminal and civil fines, penalties, and assessments. Violations of these laws can also result in exclusion, debarment, temporary or permanent suspension from participation in government health care programs, or the institution of corporate integrity agreements. Liability under such federal and state statutes and regulations may arise if we know, or it is found that we should have known, that information we provide to form the basis for a claim for government payment is false or fraudulent, and some courts have permitted False Claims Act suits to proceed if the claimant was out of compliance with program requirements. Fraud, waste and abuse prohibitions encompass a wide range of operating activities, including kickbacks or other inducements for referral of members or for the coverage of products (such as prescription drugs) by a plan, billing for unnecessary medical services by a provider, upcoding, payments made to excluded providers, improper marketing, and the violation of patient privacy rights. In particular, there has recently been increased scrutiny by the Department of Justice on health plans’ risk adjustment practices, particularly in the Medicare program. Companies involved in public health care programs such as Medicaid and Medicare are required to maintain compliance programs to detect and deter fraud, waste and abuse, and are often the subject of fraud, waste and abuse investigations and audits. The regulations and contractual requirements applicable to participants in these public-sector programs are complex and subject to change. The federal government has taken the position that claims presented in violation of the federal anti-kickback statute may be considered a violation of the federal False Claims Act. In addition, under the federal civil monetary penalty statute, the U.S. Department of Health and Human Services (HHS), Office of Inspector General has the authority to impose civil penalties against any person who, among other things, knowingly presents, or causes to be presented, certain false or otherwise improper claims.
Qui tam
actions under federal and state law can be brought by any individual on behalf of the government.
Qui tam
actions have increased significantly in recent years, causing greater numbers of health care companies to have to defend a false claim action, pay fines, or be excluded from the Medicare, Medicaid, or other state or federal health care programs as a result of an investigation arising out of such action. We have been the subject of
qui tam
actions in the past and other
qui tam
actions may be filed against us in the future. If we are subject to liability under a
qui tam
or other
actions, our business, financial condition, cash flows, or results of operations could be adversely affected.
Molina Healthcare, Inc. 2016 Form 10-K | 47
Risks Related to the Operation of Our Molina Medicaid Solutions Segment
We operate in an unstable political environment which creates uncertainties with regard to the sources and amounts of our revenues, volatility with regard to the amount of our medical costs, and vulnerability to unforeseen programmatic or regulatory changes.
If federal spending on the Medicaid program is reduced, populations served by Molina Medicaid Solutions could decline and our revenues could be materially reduced.
As noted above, some of the ACA modifications considered involve significantly reduced federal spending on the Medicaid program. Among the proposals being considered include reversing the ACA’s expansion of Medicaid, and changing Medicaid to a state block grant program, possibly including a per capita cap. An end to Medicaid Expansion could lower the populations served by Molina Medicaid Solutions. Changing Medicaid to a state block grant program would turn control of the program to states and cap what the federal government spends on Medicaid each year. Fixed state block grants could mean states will cut benefits or force beneficiaries to take on more cost-sharing. If Medicaid Expansion were reversed and the funding of Medicaid capped, the revenues and cash flows of Molina Medicaid Solutions could decrease materially, and as a result our profitability would be negatively impacted.
We may be unable to retain or renew the state government contracts of the Molina Medicaid Solutions segment on terms consistent with our expectations or at all.
Molina Medicaid Solutions currently provides business processing and information technology development and administrative services to Medicaid agencies in Idaho, Louisiana, Maine, New Jersey, West Virginia, and the U.S. Virgin Islands, and drug rebate administration services in Florida. If we are unable to continue to operate in any of those six jurisdictions, or if our current operations in any of those jurisdictions are significantly curtailed, the revenues and cash flows of Molina Medicaid Solutions could decrease materially, and as a result our profitability would be negatively impacted.
If the responsive bids to RFPs of Molina Medicaid Solutions are not successful, our revenues could be materially reduced and our operating results could be negatively impacted.
The government contracts of Molina Medicaid Solutions may be subject to periodic competitive bidding. In such process, Molina Medicaid Solutions may face competition as other service providers, some with much greater financial resources and greater name recognition, attempt to enter our markets through the competitive bidding process. Molina Medicaid Solutions also anticipates bidding in other states which have issued RFPs for procurement of a new MMIS. If our responsive bids in other states are not successful, we will be unable to grow in a manner consistent with our projections. In addition, we may be unable to support the carrying amount of goodwill we have recorded for this business, because its fair value estimated future cash flows. Even if our responsive bids are successful, the bids may be based upon assumptions or other factors which could result in the contract being less profitable than we had expected or had been the case prior to competitive re-bidding.
Because of the complexity and duration of the services and systems required to be delivered under the government contracts of Molina Medicaid Solutions, there are substantial risks associated with full performance under the contracts.
The state contracts of Molina Medicaid Solutions typically require significant investment in the early stages that is expected to be recovered through billings over the life of the contracts. These contracts involve the construction of new computer systems and communications networks and the development and deployment of complex technologies. Substantial performance risk exists under each contract. Some or all elements of service delivery under these contracts are dependent upon successful completion of the design, development, construction, and implementation phases. Any increased or unexpected costs or delays in connection with the performance of these contracts, including delays caused by factors outside our control, could make these contracts less profitable or unprofitable, which could have an adverse effect on our business, financial condition, cash flows, or results of operations.
If we fail to comply with our state government contracts or government contracting regulations, our business could be adversely affected.
Molina Medicaid Solutions’ contracts with state government customers may include unique and specialized performance requirements. In particular, contracts with state government customers are subject to various
Molina Healthcare, Inc. 2016 Form 10-K | 48
procurement regulations, contract provisions, and other requirements relating to their formation, administration, and performance. Any failure to comply with the specific provisions in our customer contracts or any violation of government contracting regulations could result in the imposition of various civil and criminal penalties, which may include termination of the contracts, forfeiture of profits, suspension of payments, imposition of fines, and suspension from future government contracting. Further, any negative publicity related to our state government contracts or any proceedings surrounding them may damage our business by affecting our ability to compete for new contracts. The termination of a state government contract, our suspension from government work, or any negative impact on our ability to compete for new contracts, could have a material adverse effect on our business, financial condition, cash flows, or results of operations.
Our business may be adversely affected by the transition from traditional fee-for-service to Medicaid managed care.
To reduce expenses, a number of state Medicaid programs are expected to pursue the transition from a fee-for-service focus of their Medicaid programs to a Medicaid managed care focus. A shift in Medicaid payment models from fee-for-service to managed care will require a concomitant shift in the focus of MMIS. In connection with such a transition, MMIS must also make a transition from a system built around claims adjudication to one that performs analytics and can be used to manage Medicaid population health outcomes. If our Molina Medicaid Solutions segment is unable to accomplish this transition, our business, financial condition, cash flows, or results of operations may be adversely affected.
Risks Related to our General Business Operations
We have identified a material weakness in our internal control over financial reporting. If our remedial measures are insufficient to address this material weakness, or if additional material weaknesses or significant deficiencies in our internal control over financial reporting are discovered or occur in the future, our consolidated financial statements may contain material misstatements and we could be required to restate our financial results, which could adversely affect our stock price and result in our inability to maintain compliance with applicable stock exchange listing requirements.
We concluded that there was a material weakness in our internal control over financial reporting as of
December 31, 2016
, because we determined that a material weakness existed in our internal control over financial reporting relating to the operation of an element of our process for calculating the amount owed to California by our California health plan. More specifically, a Medicaid Expansion contract amendment executed in the fourth quarter of 2016 changed the medical loss ratio corridor formula and such amendment was not initially considered in determining the liability.
As a result, we understated net income by $44 million for the year ended December 31, 2016, which is material to our consolidated results for the year ended December 31, 2016. This amount was corrected prior to the issuance of our consolidated financial statements as of and for the year ended December 31, 2016.
A material weakness is a deficiency, or a combination of deficiencies, in internal control over financial reporting, such that there is a reasonable possibility that a material misstatement of the annual or interim financial statements will not be prevented or detected on a timely basis.
Management evaluated our disclosure controls and procedures and internal control over financial reporting as of
December 31, 2016
, and concluded that our internal control over financial reporting was ineffective as of
December 31, 2016
. This Annual Report on Form 10-K reflects management's conclusion regarding the effectiveness of our disclosure controls and procedures and internal control over financial reporting as of
December 31, 2016
. See “Management and Auditor’s Reports - Management’s Evaluation of Disclosure Controls and Procedures and Management’s Report on Internal Control Over Financial Reporting.” The existence of this issue could adversely affect us, our reputation and investors' perception of us.
We are actively engaged in developing a remediation plan to address the material weakness reported as of December 31, 2016. The remediation efforts we expect to implement include the development of robust protocols to ensure that the control relating to the review of a contractual amendment affecting the computation of the Medicaid Expansion medical loss ratio corridor for our California health plan will operate as designed.
We believe these measures will remediate the material weakness identified above and will strengthen our internal control over financial reporting for the computation of our California Medicaid Expansion medical loss ratio corridor. We currently are targeting to complete the implementation of the control enhancements during 2017. We will test the ongoing operating effectiveness of the new controls subsequent to implementation, and consider the material weakness remediated after the applicable remedial controls operate effectively for a sufficient period of time.
Molina Healthcare, Inc. 2016 Form 10-K | 49
If our remedial measures are insufficient to address the material weakness, or if additional material weaknesses or significant deficiencies in our internal control over financial reporting are discovered or occur in the future, our consolidated financial statements may contain material misstatements and we could be required to restate our financial results, which could adversely affect our stock price and result in our inability to maintain compliance with applicable stock exchange listing requirements.
We are dependent on our executive officers and other key employees.
Our operations are highly dependent on the efforts of our executive officers and other key employees. The loss of their leadership, knowledge, and experience could negatively impact our operations. Our ability to replace any departed executive officer or key employee may be difficult and may take an extended period of time because of the limited number of individuals in the health care industry who have the breadth and depth of skills and experience necessary to operate and expand successfully a business such as ours. Competition to hire from this limited pool is intense, and we may be unable to hire, train, retain, or motivate these personnel. If we are unsuccessful in recruiting, retaining, managing, and motivating such personnel, our business, financial condition, cash flows, or results of operations may be adversely affected.
Ineffective management of our growth may negatively affect our business, financial condition, or results of operations.
We expect to continue to grow our membership and to expand into other markets through acquisitions and other opportunities. Continued rapid growth could place a significant strain on our management and on our other resources. Our ability to manage our growth may depend on our ability to strengthen our management team and attract, train, and retain skilled employees, and our ability to implement and improve operational, financial, and management information systems on a timely basis. If we are unable to manage our growth effectively, our business, financial condition, cash flows, or results of operations could be materially and adversely affected.
An impairment charge with respect to our recorded goodwill, or our finite-lived intangible assets, could have a material impact on our financial results.
As of
December 31, 2016
, the carrying amounts of goodwill and intangible assets, net, amounted to
$620 million
, and
$140 million
, respectively. Intangible assets are amortized generally on a straight-line basis over their estimated useful lives.
Goodwill represents the excess of the purchase price over the fair value of net assets acquired in business combinations.
Goodwill is not amortized, but is subject to an annual impairment test. We are required to test at least annually for impairment, or more frequently if adverse events or changes in circumstances indicate that the asset may be impaired.
We estimate the fair values of our reporting units using discounted cash flows.
Finite-lived, separately-identified intangible assets acquired in business combinations are assets that represent future expected benefits but lack physical substance (such as purchased contract rights and provider contracts).
Following the identification of any potential impairment indicators, to determine whether an impairment exists, we would compare the carrying amount of a finite-lived intangible asset with the undiscounted cash flows that are expected to result from the use of the asset or related group of assets.
Key assumptions in our cash flow projections, including changes in membership, premium rates, health care and operating cost trends, contract renewals and the procurement of new contracts, and synergies expectations relating to newly acquired businesses, are consistent with those used in our long-range business plan and annual planning process. If these assumptions differ from actual results, the outcome of our goodwill impairment tests could be adversely affected.
An event or events could occur that would cause us to revise our estimates and assumptions used in analyzing the value of our goodwill, and intangible assets, net. For example, if the responsive bid of one or more of our health plans is not successful, we will lose our Medicaid contract in the applicable state or states. If such state health plans have recorded goodwill and intangible assets, net, the contract loss would result in a non-cash impairment charge. Additionally, if we are unable to procure new state MMIS contracts, or develop synergies relating to our Pathways acquisition, the outcome of our goodwill impairment tests could be adversely affected and result in a non-cash impairment charge. Such a non-cash impairment charge could have a material adverse impact on our financial results.
Molina Healthcare, Inc. 2016 Form 10-K | 50
We face various risks inherent in the government contracting process that could materially and adversely affect our business and profitability, including periodic routine and non-routine reviews, audits, and investigations by government agencies.
We are subject to various risks inherent in the government contracting process. These risks include routine and non-routine governmental reviews, audits, and investigations, and compliance with government reporting requirements. Violation of the laws, regulations, or contract provisions governing our operations, or changes in interpretations of those laws and regulations, could result in the imposition of civil or criminal penalties, the cancellation of our government contracts, the suspension or revocation of our licenses, the exclusion from participation in government sponsored health programs or MMIS contracts, or the revision and recoupment of past payments made based on audit findings. If we are unable to correct any noted deficiencies, or become subject to material fines or other sanctions, we could suffer a substantial reduction in profitability, and could also lose one or more of our government contracts. In addition, government receivables are subject to government audit and negotiation, and government contracts are vulnerable to disagreements with the government. The final amounts we ultimately receive under government contracts may be different from the amounts we initially recognize in our financial statements.
If we sustain a cyber-attack or suffer privacy or data security breaches that disrupt our operations or result in the dissemination of sensitive personal or confidential information, we could suffer increased costs, exposure to significant liability, reputational harm, loss of business, and other serious negative consequences.
As part of our normal operations, we routinely collect, process, store, and transmit large amounts of data, including sensitive personal information as well as proprietary or confidential information relating to our business or third parties. Computer programmers and hackers may be able to penetrate our network security and misappropriate our confidential information or that of third parties, create system disruptions, or cause shutdowns. They also may be able to develop and deploy viruses, worms, and other malicious software programs that attack our systems or otherwise exploit any security vulnerabilities. Because the techniques used to circumvent security systems can be highly sophisticated and change frequently, often are not recognized until launched against a target, and may originate from less regulated and remote areas around the world, we may be unable to implement adequate preventive measures. Our facilities may also be vulnerable to security incidents or security attacks, acts of vandalism or theft, misplaced or lost data, human errors, acts of malicious insiders, or other similar events that could negatively affect our systems and our and our members’ data. The cost to eliminate or address the foregoing security threats and vulnerabilities before or after a cyber-incident could be significant. We may need to expend significant additional resources in the future to continue to protect against potential security breaches or to address problems caused by such attacks or any breach of our systems. Our remediation efforts may not be successful and could result in interruptions, delays, or cessation of service, and loss of members, vendors, and state contracts. In addition, breaches of our security measures and the unauthorized dissemination of sensitive personal information or proprietary information or confidential information about our members could expose our members to the risk of financial or medical identity theft, or expose us or other third parties to a risk of loss or misuse of this information, result in litigation and potential liability for us, damage our reputation, or otherwise have a material adverse effect on our business, financial condition, cash flows, or results of operations.
Any changes to the laws and regulations governing our business, or the interpretation and enforcement of those laws or regulations, could require us to modify our operations and could negatively impact our operating results.
Our business is extensively regulated by the federal government and the states in which we operate. The laws and regulations governing our operations are generally intended to benefit and protect health plan members and providers rather than managed care organizations. The government agencies administering these laws and regulations have broad latitude in interpreting and applying them. These laws and regulations, along with the terms of our government contracts, regulate how we do business, what services we offer, and how we interact with members and the public. For instance, some states mandate minimum medical expense levels as a percentage of premium revenues. These laws and regulations, and their interpretations, are subject to frequent change. The interpretation of certain contract provisions by our governmental regulators may also change. Changes in existing laws or regulations, or their interpretations, or the enactment of new laws or regulations, could reduce our profitability by imposing additional capital requirements, increasing our liability, increasing our administrative and other costs, increasing mandated benefits, forcing us to restructure our relationships with providers, requiring us to implement additional or different programs and systems, or making it more difficult to predict future results. Changes in the interpretation of our contracts could also reduce our profitability if we have detrimentally relied on a prior interpretation.
Molina Healthcare, Inc. 2016 Form 10-K | 51
Our business depends on our information and medical management systems, and our inability to effectively integrate, manage, and keep secure our information and medical management systems could disrupt our operations.
Our business is dependent on effective and secure information systems that assist us in, among other things, processing provider claims, monitoring utilization and other cost factors, supporting our medical management techniques, and providing data to our regulators. Our providers also depend upon our information systems for membership verifications, claims status, and other information. If we experience a reduction in the performance, reliability, or availability of our information and medical management systems, our operations, ability to pay claims, and ability to produce timely and accurate reports could be adversely affected. In addition, if the licensor or vendor of any software which is integral to our operations were to become insolvent or otherwise fail to support the software sufficiently, our operations could be negatively affected.
Our information systems and applications require continual maintenance, upgrading, and enhancement to meet our operational needs. Moreover, our acquisition activity requires transitions to or from, and the integration of, various information systems. If we experience difficulties with the transition to or from information systems or are unable to properly implement, maintain, upgrade or expand our system, we could suffer from, among other things, operational disruptions, loss of members, difficulty in attracting new members, regulatory problems, and increases in administrative expenses.
Because our corporate headquarters are located in Southern California, our business operations may be significantly disrupted as a result of a major earthquake.
Our corporate headquarters is located in Long Beach, California. In addition, the claims of our health plans are also processed in Long Beach. Southern California is exposed to a statistically greater risk of a major earthquake than most other parts of the United States. If a major earthquake were to strike the Los Angeles area, our corporate functions and claims processing could be significantly impaired for a substantial period of time. If there is a major Southern California earthquake, there can be no assurances that our disaster recovery plan will be successful or that the business operations of all our health plans and our Molina Medicaid Solutions segment, including those that are remote from any such event, would not be substantially impacted.
We face claims related to litigation which could result in substantial monetary damages.
We are subject to a variety of legal actions, including medical malpractice actions, provider disputes, employment related disputes, health care regulatory law-based litigation, breach of contract actions, intellectual property infringement actions, and securities class actions. If we incur liability materially in excess of the amount for which we have insurance coverage, our profitability would suffer. In addition, our providers involved in medical care decisions are exposed to the risk of medical malpractice claims. As an employer of physicians and ancillary medical personnel and as an operator of primary care clinics, our plans are subject to liability for negligent acts, omissions, or injuries occurring at one of our clinics or caused by one of our employees. Given the significant amount of some medical malpractice awards and settlements, the medical malpractice insurance that we maintain may not be sufficient or available at a reasonable cost to protect us from damage awards or other liabilities. Even if any claims brought against us are unsuccessful or without merit, we may have to defend ourselves against such claims. The defense of any such actions may be time-consuming and costly, and may distract our management’s attention.
Furthermore, claimants often sue managed care organizations for improper denials of or delays in care, and in some instances improper authorizations of care. Claims of this nature could result in substantial damage awards against us and our providers that could exceed the limits of any applicable medical malpractice insurance coverage. Successful malpractice or tort claims asserted against us, our providers, or our employees could adversely affect our business, financial condition, cash flows, or results of operations.
We cannot predict the outcome of any lawsuit. Some of the liabilities related to litigation that we may incur may not be covered by insurance, the insurers could dispute coverage, or the amount of insurance could be insufficient to cover the damages awarded. In addition, insurance coverage for all or certain types of liability may become unavailable or prohibitively expensive in the future or the deductible on any such insurance coverage could be set at a level which would result in us effectively self-insuring cases against us. The litigation to which we are subject could have a material adverse effect on our business, financial condition, results of operations, and cash flows.
We are subject to competition which negatively impacts our ability to increase penetration in the markets we serve.
We operate in a highly competitive environment and in an industry that is subject to ongoing changes from business consolidations, new strategic alliances, and aggressive marketing practices by other managed care organizations and service providers. Our health plans segment competes for members principally on the basis of size, location,
Molina Healthcare, Inc. 2016 Form 10-K | 52
and quality of provider network, benefits supplied, quality of service, and reputation. Our Molina Medicaid Solutions segment competes for government contracts principally on the basis of cost, quality of service, expertise, and reputation. A number of these competitive elements are partially dependent upon and can be positively affected by the financial resources available to us. Many other organizations with which we compete, including large commercial plans and other service providers, have substantially greater financial and other resources than we do. For these reasons, we may be unable to grow our business, or may lose business to third parties.
Failure to maintain effective internal controls over financial reporting could have a material adverse effect on our business, operating results, and stock price.
The Sarbanes-Oxley Act of 2002 requires, among other things, that we maintain effective internal control over financial reporting. In particular, we must perform system and process evaluation and testing of our internal controls over financial reporting to allow management to report on, and our independent registered public accounting firm to attest to, our internal controls over financial reporting as required by Section 404 of the Sarbanes-Oxley Act of 2002. Our future testing, or the subsequent testing by our independent registered public accounting firm, may reveal deficiencies in our internal controls over financial reporting that are deemed to be material weaknesses. Our compliance with Section 404 will continue to require that we incur substantial accounting expense and expend significant management time and effort. Moreover, if we are unable to comply with the requirements of Section 404 in a timely manner, or if we or our independent registered public accounting firm identify deficiencies in our internal control over financial reporting that are deemed to be material weaknesses, the market price of our stock could decline and we could be subject to sanctions or investigations by the New York Stock Exchange, SEC, or other regulatory authorities which would require additional financial and management resources.
We are subject to risks associated with outsourcing services and functions to third parties.
We contract with independent third party vendors and service providers who provide services to us and our subsidiaries or to whom we delegate selected functions. Our arrangements with third party vendors and service providers may make our operations vulnerable if those third parties fail to satisfy their obligations to us, including their obligations to maintain and protect the security and confidentiality of our information and data or the information and data relating to our members or customers. In addition, we may have disagreements with third party vendors and service providers regarding relative responsibilities for any such failures under applicable business associate agreements or other applicable outsourcing agreements. Further, we may not be adequately indemnified against all possible losses through the terms and conditions of our contracts with third party vendors and service providers. Our outsourcing arrangements could be adversely impacted by changes in vendors’ or service providers’ operations or financial condition or other matters outside of our control. If we fail to adequately monitor and regulate the performance of our third party vendors and service providers, we could be subject to additional risk, including significant cybersecurity risk. Violations of, or noncompliance with, laws and/or regulations governing our business or noncompliance with contract terms by third party vendors and service providers could increase our exposure to liability to our members, providers, or other third parties, or sanctions and/or fines from the regulators that oversee our business. In turn, this could increase the costs associated with the operation of our business or have an adverse impact on our business and reputation. Moreover, if these vendor and service provider relationships were terminated for any reason, we may not be able to find alternative partners in a timely manner or on acceptable financial terms, and may incur significant costs in connection with any such vendor or service provider transition. As a result, we may not be able to meet the full demands of our members or customers and, in turn, our business, financial condition, or results of operations may be harmed. In addition, we may not fully realize the anticipated economic and other benefits from our outsourcing projects or other relationships we enter into with third party vendors and service providers, as a result of regulatory restrictions on outsourcing, unanticipated delays in transitioning our operations to the third party, vendor or service provider noncompliance with contract terms or violations of laws and/or regulations, or otherwise. This could result in substantial costs or other operational or financial problems that could have a material adverse effect on our business, financial condition, cash flows, or results of operations.
Molina Healthcare, Inc. 2016 Form 10-K | 53
Our substantial indebtedness could adversely affect our ability to raise additional capital to fund our operations, limit our ability to react to changes in the economy or our industry, expose us to interest rate risk to the extent of any variable rate debt, and prevent us from meeting our obligations under our outstanding indebtedness.
We have a significant amount of indebtedness. As of
December 31, 2016
, our total indebtedness was approximately
$1,645 million
, including lease financing obligations. As of
December 31, 2016
, we also had
$494 million
available for borrowing under our Credit Facility. Our substantial indebtedness could have significant consequences, including:
|
•
|
increasing our vulnerability to adverse economic, industry, or competitive developments;
|
|
•
|
requiring a substantial portion of our cash flows from operations to be dedicated to the payment of principal and interest on our indebtedness, therefore reducing our ability to use our cash flows to fund operations, make capital expenditures, and pursue future business opportunities;
|
|
•
|
exposing us to the risk of increased interest rates to the extent of any future borrowings, including borrowings under the Credit Facility, at variable rates of interest;
|
|
•
|
making it more difficult for us to satisfy our obligations with respect to our indebtedness, including the Credit Facility and our outstanding senior notes, and any failure to comply with the obligations of any of our debt instruments, including restrictive covenants and borrowing conditions, could result in an event of default under the indenture governing our outstanding senior notes and the agreements governing such other indebtedness;
|
|
•
|
restricting us from making strategic acquisitions or causing us to make non-strategic divestitures;
|
|
•
|
limiting our ability to obtain additional financing for working capital, capital expenditures, product and service development, debt service requirements, acquisitions, and general corporate or other purposes; and
|
|
•
|
limiting our flexibility in planning for, or reacting to, changes in our business or market conditions and placing us at a competitive disadvantage compared to our competitors who are less highly leveraged and who, therefore, may be able to take advantage of opportunities that our substantial indebtedness may prevent us from exploiting.
|
Despite our high indebtedness level, we and our subsidiaries are able to incur substantial additional amounts of debt, including secured debt, which could further exacerbate the risks associated with our substantial indebtedness.
We and our subsidiaries may be able to incur substantial additional indebtedness in the future. Although the indentures governing our outstanding senior notes and the credit agreement governing the Credit Facility contain restrictions on the incurrence of additional indebtedness, these restrictions are subject to a number of significant qualifications and exceptions, and under certain circumstances, the amount of indebtedness that could be incurred in compliance with these restrictions could be substantial. As of
December 31, 2016
, we had approximately
$494 million
available for additional borrowing under our Credit Facility. In addition, the indentures governing our outstanding senior notes and the credit agreement governing our Credit Facility do not prevent us from incurring obligations that do not constitute prohibited indebtedness thereunder. If new debt is added to our and our subsidiaries’ existing debt levels, the related risks that we now face would increase.
Molina Healthcare, Inc. 2016 Form 10-K | 54
The terms of our debt impose, and will impose, restrictions on us that may affect our ability to successfully operate our business and our ability to make payments on our outstanding senior notes.
The indentures governing our outstanding senior notes and the credit agreement governing the Credit Facility contain various covenants that could materially and adversely affect our ability to finance our future operations or capital needs and to engage in other business activities that may be in our best interest. These covenants limit our ability to, among other things:
|
•
|
incur additional indebtedness or issue certain preferred equity;
|
|
•
|
pay dividends on, repurchase, or make distributions in respect of our capital stock, prepay, redeem, or repurchase certain debt or make other restricted payments;
|
|
•
|
make certain investments;
|
|
•
|
create certain liens;
|
|
•
|
sell assets, including capital stock of restricted subsidiaries;
|
|
•
|
enter into agreements restricting our restricted subsidiaries’ ability to pay dividends to us;
|
|
•
|
consolidate, merge, sell, or otherwise dispose of all or substantially all of our assets;
|
|
•
|
enter into certain transactions with our affiliates; and
|
|
•
|
designate our restricted subsidiaries as unrestricted subsidiaries.
|
All of these covenants may restrict our ability to pursue our business strategies. Our ability to comply with these covenants may be affected by events beyond our control, such as prevailing economic conditions and changes in regulations, and if such events occur, we cannot be sure that we will be able to comply. A breach of these covenants could result in a default under the indentures for our outstanding senior notes and/or the credit agreement governing the Credit Facility including, as a result of cross default provisions and, in the case of the Credit Facility permit the lenders to cease making loans to us. If there were an event of default under the indentures governing our outstanding senior notes and/or the credit agreement governing the Credit Facility, holders of such defaulted debt could cause all amounts borrowed under these instruments to be due and payable immediately. Our assets or cash flow may not be sufficient to repay borrowings under our outstanding debt instruments in the event of a default thereunder.
In addition, the restrictive covenants in the credit agreement governing the Credit Facility require us to maintain specified financial ratios and satisfy other financial condition tests. Our ability to meet those financial ratios and tests will depend on our ongoing financial and operating performance, which, in turn, will be subject to economic conditions and to financial, market, and competitive factors, many of which are beyond our control.
If our operating performance declines, we may be required to obtain waivers from the lenders under the Credit Facility, from the holders of our outstanding senior notes or from the holders of other obligations, to avoid defaults thereunder. For example, in February 2017, to avoid default under our Credit Facility as a result of our failure to comply with certain financial covenants therein applicable to the three months ended December 31, 2016, we sought, and obtained, a waiver of such defaults by the required lenders under our Credit Facility.
If we are not able to obtain such waivers, our creditors could exercise their rights upon default, and we could be forced into bankruptcy or liquidation.
We may not have the funds necessary to pay the amounts due upon conversion or required repurchase of our outstanding notes, and our indebtedness may contain limitations on our ability to pay the amounts due upon conversion or required repurchase.
In February 2013, we issued
$550 million
aggregate principal amount of 1.125% cash convertible senior notes due January 15, 2020, unless earlier repurchased or converted. We refer to these notes as our 1.125% Notes. In September 2014, we issued
$302 million
aggregate principal amount of 1.625% convertible senior notes due August 14, 2044, unless earlier repurchased, redeemed, or converted. We refer to these notes as our 1.625% Notes. As of
December 31, 2016
, the aggregate outstanding principal amount of our 1.125% Notes and our 1.625% Notes was
$550 million
and
$302 million
, respectively.
Both our 1.125% Notes and our 1.625% Notes are convertible into cash prior to their respective maturity dates under certain circumstances, one of which relates to the closing price of our common stock over a specified period. We refer to this conversion trigger as the stock price trigger. The stock price trigger for the 1.125% Notes is $53.00 per share. The 1.125% Notes met this trigger in the quarter ended
December 31, 2016
, and are convertible to cash through at least March 31, 2017. Because the 1.125% Notes may be converted into cash within 12 months, the
$471 million
carrying amount is reported in current
Molina Healthcare, Inc. 2016 Form 10-K | 55
portion of long-term debt as of
December 31, 2016
.
For economic reasons related to the trading market for our 1.125% Notes, we believe that the amount of the notes that may be converted over the next twelve months, if any, will not be significant. However, if the trading market for our 1.125% Notes becomes closed or restricted due to market turmoil or other reasons such that the notes cannot be traded, or if the trading price of our 1.125% Notes, which normally trade at a marginal premium to the underlying composite stock-and-interest economic value, no longer includes that marginal premium, holders of our 1.125% Notes may elect to convert the notes to cash.
The stock price trigger for the 1.625% Notes is $75.51 per share. The last reported sale price of our common stock as reported on the New York Stock Exchange on
February 24, 2017
was
$48.83
per share. As of
December 31, 2016
, our 1.625% Notes were not convertible. If conversion requests are received, the settlement of the notes must be paid primarily in cash pursuant to the terms of the relevant indentures.
We have sufficient available cash, combined with borrowing capacity available under our Credit Facility, to fund such conversions.
In addition, in the event of a change in control or the termination in trading of our stock, each holder of our 1.125% Notes and our 1.625% Notes would have the right to require us to purchase some or all of their notes at a purchase price in cash equal to 100% of the principal amount of the notes, plus any accrued and unpaid interest.
In the event of conversions or required repurchases, we may not have enough available cash or be able to obtain financing at the time we are required to comply with our conversion or repurchase obligations. In addition, our ability to comply with these obligations may be limited by law, by regulatory authority, or by agreements governing our future indebtedness. The indentures for the 1.125% Notes and the 1.625% Notes provide that it would be an event of default if we do not make the cash payments due upon conversion or required repurchase of the notes. The occurrence of an event of default under one or both of these indentures may also constitute an event of default under our Credit Facility and under our other indebtedness we may have outstanding at such time. Any such default could have a material adverse effect on our business, financial condition, cash flows, or results of operations.
We may not be able to generate sufficient cash to service all of our indebtedness and may be forced to take other actions to satisfy our obligations under our indebtedness, which may not be successful.
Our ability to make scheduled payments on or to refinance our debt obligations depends on our financial condition and operating performance, which is subject to prevailing economic and competitive conditions and to certain financial, business, and other factors beyond our control. We may not be able to maintain a level of cash flows from operating activities sufficient to permit us to pay the principal, and interest on our indebtedness.
If our cash flows and capital resources are insufficient to fund our debt service obligations, we may be forced to reduce or delay investments and capital expenditures, or to sell assets, seek additional capital, or restructure or refinance our indebtedness. Our ability to restructure or refinance our debt will depend on the condition of the capital markets and our financial condition at such time. Any refinancing of our debt could be at higher interest rates and may require us to comply with onerous covenants, which could further restrict our business operations. The terms of existing or future debt instruments, including the Credit Facility, and the indentures governing our outstanding senior notes, may restrict us from adopting some of these alternatives. In addition, any failure to make payments of interest and principal on our outstanding indebtedness on a timely basis would likely result in a reduction of our credit rating, which would harm our ability to incur additional indebtedness. These alternative measures may not be successful and may not permit us to meet our scheduled debt service obligations.
A lowering or withdrawal of the ratings assigned to our debt securities by rating agencies may increase our future borrowing costs and reduce our access to capital.
There can be no assurance that any rating assigned by the rating agencies to our debt or our corporate rating will remain for any given period of time or that a rating will not be lowered or withdrawn entirely by a rating agency if, in that rating agency’s judgment, future circumstances relating to the basis of the rating, such as adverse changes, so warrant. A lowering or withdrawal of the ratings assigned to our debt securities by rating agencies would likely increase our future borrowing costs and reduce our access to capital, which could have a materially adverse impact on our business, financial condition, cash flows or results of operations.
Molina Healthcare, Inc. 2016 Form 10-K | 56
Risks Related to Our Common Stock
Members of the Molina family own a significant amount of our capital stock, decreasing the influence of other stockholders on stockholder decisions.
Members of the Molina family, either directly or as trustees or beneficiaries of Molina family trusts, in the aggregate owned or were entitled to receive upon certain events approximately 25% of our capital stock as of
December 31, 2016
. Our president and chief executive officer, as well as our chief financial officer, are members of the Molina family, and they are also on our board of directors. Because of the amount of their shareholdings, Molina family members, if they were to act as a group with the trustees of their family trusts, have the ability to significantly influence all matters submitted to stockholders for approval, including the election of directors, amendments to our charter, and any merger, consolidation, or sale of our company. A significant concentration of share ownership can also adversely affect the trading price for our common stock because investors often discount the value of stock in companies that have controlling stockholders. Furthermore, the concentration of share ownership in the Molina family could delay or prevent a merger or consolidation, takeover, or other business combination that could be favorable to our stockholders. Finally, the interests and objectives of the Molina family may be different from those of our company or our other stockholders, and they may vote their common stock in a manner that is contrary to the vote of our other stockholders.
Future sales of our common stock or equity-linked securities in the public market could adversely affect the trading price of our common stock and our ability to raise funds in new stock offerings.
We may issue equity securities in the future, or securities that are convertible into or exchangeable for, or that represent the right to receive, shares of our common stock. Sales of a substantial number of shares of our common stock or other equity securities, including sales of shares in connection with any future acquisitions, could be substantially dilutive to our stockholders. These sales may have a harmful effect on prevailing market prices for our common stock and our ability to raise additional capital in the financial markets at a time and price favorable to us. Moreover, to the extent that we issue restricted stock units, stock appreciation rights, options, or warrants to purchase our common stock in the future and those stock appreciation rights, options, or warrants are exercised or as the restricted stock units vest, our stockholders may experience further dilution. Holders of our shares of common stock have no preemptive rights that entitle holders to purchase a pro rata share of any offering of shares of any class or series and, therefore, such sales or offerings could result in increased dilution to our stockholders. Our certificate of incorporation provides that we have authority to issue
150 million
shares of common stock and
20 million
shares of preferred stock. As of
December 31, 2016
, approximately
57 million
shares of common stock and no shares of preferred or other capital stock were issued and outstanding.
It may be difficult for a third party to acquire us, which could inhibit stockholders from realizing a premium on their stock price.
We are subject to the Delaware anti-takeover laws regulating corporate takeovers. These provisions may prohibit stockholders owning 15% or more of our outstanding voting stock from merging or combining with us. In addition, any change in control of our state health plans would require the approval of the applicable insurance regulator in each state in which we operate.
Our certificate of incorporation and bylaws also contain provisions that could have the effect of delaying, deferring, or preventing a change in control of our company that stockholders may consider favorable or beneficial. These provisions could discourage proxy contests and make it more difficult for our stockholders to elect directors and take other corporate actions. These provisions could also limit the price that investors might be willing to pay in the future for shares of our common stock. These provisions include:
|
•
|
a staggered board of directors, so that it would take three successive annual meetings to replace all directors,
|
|
•
|
prohibition of stockholder action by written consent, and
|
|
•
|
advance notice requirements for the submission by stockholders of nominations for election to the board of directors and for proposing matters that can be acted upon by stockholders at a meeting.
|
In addition, changes of control are often subject to state regulatory notification, and in some cases, prior approval.
Further, our board of directors or a committee thereof has the power, without stockholder approval, to designate the terms of one or more series of preferred stock and issue shares of preferred stock. The ability of our board of directors or a committee thereof to create and issue a new series of preferred stock could impede a merger,
Molina Healthcare, Inc. 2016 Form 10-K | 57
takeover or other business combination involving us or discourage a potential acquirer from making a tender offer for our common stock, which, under certain circumstances, could reduce the market price of our common stock.
LEGAL PROCEEDINGS
Refer to Notes to Consolidated Financial Statements, Note
19
, “
Commitments and Contingencies
—Legal Proceedings,” for a discussion of legal proceedings.
MANAGEMENT AND AUDITOR’S REPORTS
MANAGEMENT’S EVALUATION OF DISCLOSURE CONTROLS AND PROCEDURES
We maintain disclosure controls and procedures, as defined in Rule 13a-15(e) and Rule 15d-15(e) under the Securities Exchange Act of 1934, as amended (the Exchange Act), that are designed to provide reasonable assurance that information required to be disclosed by us in reports we file or submit under the Exchange Act is recorded, processed, summarized and reported within the time periods specified in the SEC's rules and forms. Disclosure controls and procedures include, without limitation, controls and procedures designed to provide reasonable assurance that information required to be disclosed by us in reports we file or submit under the Exchange Act is accumulated and communicated to our management, including our principal executive officer and principal financial officer or persons performing similar functions, as appropriate, to allow timely decisions regarding required disclosure. In designing and evaluating the disclosure controls and procedures, management recognizes that any controls and procedures, no matter how well designed and operated, can provide only reasonable assurance of achieving the desired control objectives, and management is required to apply its judgment in evaluating the cost-benefit relationship of any possible controls and procedures.
Under the supervision and with the participation of our management, including our chief executive officer and our chief financial officer, we carried out an evaluation of the effectiveness of our disclosure controls and procedures as of the end of the period covered by this report pursuant to Rule 13a-15(b) and Rule 15d-15(b) of the Exchange Act. Based on this evaluation, our chief executive officer and our chief financial officer concluded that, as of
December 31, 2016
, our disclosure controls and procedures were not effective at the reasonable assurance level because of the material weakness in our internal control over financial reporting described below. Notwithstanding the material weakness described below, management has concluded that our consolidated financial statements included in this Annual Report on Form 10-K are fairly stated in all material respects in accordance with U.S. generally accepted accounting principles (GAAP) for each of the periods presented herein.
MANAGEMENT’S REPORT ON INTERNAL CONTROL OVER FINANCIAL REPORTING
Management is responsible for establishing and maintaining adequate internal control over financial reporting, as such term is defined in Rule 13a-15(f) under the Exchange Act. Our internal control over financial reporting includes those policies and procedures that (i) pertain to the maintenance of records that, in reasonable detail, accurately and fairly reflect the transactions and dispositions of our assets, (ii) provide reasonable assurance that transactions are recorded as necessary to permit preparation of financial statements in accordance with GAAP, and that our receipts and expenditures are being made only in accordance with authorizations of our management and directors, and (iii) provide reasonable assurance regarding prevention or timely detection of unauthorized acquisition, use, or disposition of our assets that could have a material effect on our financial statements.
Internal control over financial reporting is designed to provide reasonable assurance regarding the reliability of financial reporting and the preparation of financial statements prepared for external purposes in accordance with GAAP. Because of its inherent limitations, internal control over financial reporting may not prevent or detect misstatements. Also, projections of any evaluation of the effectiveness of our internal control over financial reporting to future periods are subject to the risk that controls may become inadequate because of changes in conditions, or that the degree of compliance with the policies or procedures may deteriorate.
Molina Healthcare, Inc. 2016 Form 10-K | 58
Our management has assessed the effectiveness of our internal control over financial reporting as of
December 31, 2016
, based on the framework set forth in
Internal Control-Integrated Framework
(2013)
issued by the Committee of Sponsoring Organizations of the Treadway Commission (COSO).
A material weakness is a deficiency, or a combination of deficiencies, in internal control over financial reporting, such that there is a reasonable possibility that a material misstatement of the annual or interim financial statements will not be prevented or detected on a timely basis.
The Company
determined that a material weakness existed in its internal control over financial reporting relating to the operation of an element of its process for calculating the amount owed to California by its California health plan. More specifically, a Medicaid Expansion contract amendment executed in the fourth quarter of 2016 changed the medical loss ratio corridor formula and such amendment was not initially considered in determining the liability.
As a result, we understated net income by $44 million for the year ended December 31, 2016, which is material to our consolidated results for the year ended December 31, 2016. This amount was corrected prior to the issuance of our consolidated financial statements as of and for the year ended December 31, 2016.
Because of this material weakness, management concluded that we did not maintain effective internal control over financial reporting as of
December 31, 2016
, based on criteria described in
Internal Control - Integrated Framework
(2013) issued by COSO.
Ernst & Young, LLP, the independent registered public accounting firm who audited our Consolidated Financial Statements included in this Form 10-K, has issued a report on our internal control over financial reporting, which expressed an adverse opinion and is included herein.
Remediation Plan for Material Weakness
We are actively engaged in developing a remediation plan to address the material weakness reported as of December 31, 2016. The remediation efforts we expect to implement include the development of robust protocols to ensure that the control relating to the review of a contractual amendment affecting the computation of the Medicaid Expansion medical loss ratio corridor for our California health plan will operate as designed.
We believe these measures will remediate the material weakness identified above and will strengthen our internal control over financial reporting for the computation of our California Medicaid Expansion medical loss ratio corridor. We currently are targeting to complete the implementation of the control enhancements during 2017. We will test the ongoing operating effectiveness of the new controls subsequent to implementation, and consider the material weakness remediated after the applicable remedial controls operate effectively for a sufficient period of time.
If the remedial measures described above are insufficient to address the material weakness described above, or are not implemented timely, or additional deficiencies arise in the future, material misstatements in our interim or annual financial statements may occur in the future and could have the effects described in
“Risk Factors.”
Changes in Internal Control over Financial Reporting
Except as described above, management did not identify any change in our internal control over financial reporting (as defined in Rule 13a-15(f) of the Exchange Act) during the quarter ended
December 31,
2016
, that has materially affected, or is reasonably likely to materially affect, our internal control over financial reporting.
Molina Healthcare, Inc. 2016 Form 10-K | 59
REPORT OF INDEPENDENT REGISTERED PUBLIC ACCOUNTING FIRM
The Board of Directors and Stockholders
of Molina Healthcare, Inc.
We have audited the accompanying consolidated balance sheets of Molina Healthcare, Inc. (the Company) as of
December 31, 2016
and
2015
, and the related consolidated statements of income, comprehensive income, stockholders’ equity and cash flows for each of the three years in the period ended
December 31, 2016
. These financial statements are the responsibility of the Company’s management. Our responsibility is to express an opinion on these financial statements based on our audits.
We conducted our audits in accordance with the standards of the Public Company Accounting Oversight Board (United States). Those standards require that we plan and perform the audit to obtain reasonable assurance about whether the financial statements are free of material misstatement. An audit includes examining, on a test basis, evidence supporting the amounts and disclosures in the financial statements. An audit also includes assessing the accounting principles used and significant estimates made by management, as well as evaluating the overall financial statement presentation. We believe that our audits provide a reasonable basis for our opinion.
In our opinion, the financial statements referred to above present fairly, in all material respects, the consolidated financial position of Molina Healthcare, Inc. at
December 31, 2016
and
2015
, and the consolidated results of its operations and its cash flows for each of the three years in the period ended
December 31, 2016
, in conformity with U.S. generally accepted accounting principles.
We also have audited, in accordance with the standards of the Public Company Accounting Oversight Board (United States), Molina Healthcare, Inc.’s internal control over financial reporting as of
December 31, 2016
, based on criteria established in
Internal Control — Integrated Framework
issued by the Committee of Sponsoring Organizations of the Treadway Commission (2013 framework) and our report dated
March 1, 2017
expressed an adverse opinion thereon.
/s/ ERNST & YOUNG LLP
Los Angeles, California
March 1, 2017
Molina Healthcare, Inc. 2016 Form 10-K | 60
REPORT OF INDEPENDENT REGISTERED PUBLIC ACCOUNTING FIRM
The Board of Directors and Stockholders
of Molina Healthcare, Inc.
We have audited Molina Healthcare, Inc.’s (the "Company’s") internal control over financial reporting as of
December 31, 2016
, based on criteria established in
Internal Control — Integrated Framework
issued by the Committee of Sponsoring Organizations of the Treadway Commission (2013 framework) (the COSO criteria). The Company’s management is responsible for maintaining effective internal control over financial reporting, and for its assessment of the effectiveness of internal control over financial reporting included in the accompanying Management’s Report on Internal Control over Financial Reporting. Our responsibility is to express an opinion on the Company’s internal control over financial reporting based on our audit.
We conducted our audit in accordance with the standards of the Public Company Accounting Oversight Board (United States). Those standards require that we plan and perform the audit to obtain reasonable assurance about whether effective internal control over financial reporting was maintained in all material respects. Our audit included obtaining an understanding of internal control over financial reporting, assessing the risk that a material weakness exists, testing and evaluating the design and operating effectiveness of internal control based on the assessed risk, and performing such other procedures as we considered necessary in the circumstances. We believe that our audit provides a reasonable basis for our opinion.
A company’s internal control over financial reporting is a process designed to provide reasonable assurance regarding the reliability of financial reporting and the preparation of financial statements for external purposes in accordance with generally accepted accounting principles. A company’s internal control over financial reporting includes those policies and procedures that (1) pertain to the maintenance of records that, in reasonable detail, accurately and fairly reflect the transactions and dispositions of the assets of the company; (2) provide reasonable assurance that transactions are recorded as necessary to permit preparation of financial statements in accordance with generally accepted accounting principles, and that receipts and expenditures of the company are being made only in accordance with authorizations of management and directors of the company; and (3) provide reasonable assurance regarding prevention or timely detection of unauthorized acquisition, use, or disposition of the company’s assets that could have a material effect on the financial statements.
Because of its inherent limitations, internal control over financial reporting may not prevent or detect misstatements. Also, projections of any evaluation of effectiveness to future periods are subject to the risk that controls may become inadequate because of changes in conditions, or that the degree of compliance with the policies or procedures may deteriorate.
A material weakness is a deficiency, or combination of deficiencies, in internal control over financial reporting, such that there is a reasonable possibility that a material misstatement of the company’s annual or interim financial statements will not be prevented or detected on a timely basis. The following material weakness has been identified and included in management’s assessment. Management has identified a material weakness in the operating effectiveness of a management review control related to the Company’s process for calculating the amount owed to California with respect to Medicaid Expansion at its California health plan
.
We also have audited, in accordance with the standards of the Public Company Accounting Oversight Board (United States), the consolidated balance sheets of Molina Healthcare, Inc. as of December 31, 2016 and 2015 and the related consolidated statements of income, comprehensive income, stockholders’ equity and cash flows for each of the three years in the period ended December 31, 2016. This material weakness was considered in determining the nature, timing and extent of audit tests applied in our audit of the 2016 financial statements, and this report does not affect our report dated
March 1, 2017
, which expressed an unqualified opinion on those financial statements.
In our opinion, because of the effect of the material weakness described above on the achievement of the objectives of the control criteria, Molina Healthcare, Inc. has not maintained effective internal control over financial reporting as of December 31, 2016, based on the COSO criteria.
|
/s/ ERNST & YOUNG LLP
|
|
Los Angeles, California
March 1, 2017
Molina Healthcare, Inc. 2016 Form 10-K | 61
AUDITED FINANCIAL STATEMENTS AND NOTES
Molina Healthcare, Inc. 2016 Form 10-K | 62
MOLINA HEALTHCARE, INC.
|
|
Year Ended December 31,
|
||||||||||
|
|
2016
|
2015
|
2014
|
||||||||
|
|
(In millions, except per-share data)
|
||||||||||
|
Revenue:
|
|||||||||||
|
Premium revenue
|
$
|
16,392
|
|
$
|
13,241
|
|
$
|
9,023
|
|
||
|
Service revenue
|
539
|
|
253
|
|
210
|
|
|||||
|
Premium tax revenue
|
468
|
|
397
|
|
294
|
|
|||||
|
Health insurer fee revenue
|
345
|
|
264
|
|
120
|
|
|||||
|
Investment income and other revenue
|
38
|
|
23
|
|
20
|
|
|||||
|
Total revenue
|
17,782
|
|
14,178
|
|
9,667
|
|
|||||
|
Operating expenses:
|
|||||||||||
|
Medical care costs
|
14,774
|
|
11,794
|
|
8,076
|
|
|||||
|
Cost of service revenue
|
485
|
|
193
|
|
157
|
|
|||||
|
General and administrative expenses
|
1,393
|
|
1,146
|
|
765
|
|
|||||
|
Premium tax expenses
|
468
|
|
397
|
|
294
|
|
|||||
|
Health insurer fee expenses
|
217
|
|
157
|
|
89
|
|
|||||
|
Depreciation and amortization
|
139
|
|
104
|
|
93
|
|
|||||
|
Total operating expenses
|
17,476
|
|
13,791
|
|
9,474
|
|
|||||
|
Operating income
|
306
|
|
387
|
|
193
|
|
|||||
|
Other expenses, net:
|
|||||||||||
|
Interest expense
|
101
|
|
66
|
|
57
|
|
|||||
|
Other (income) expense, net
|
—
|
|
(1
|
)
|
1
|
|
|||||
|
Total other expenses, net
|
101
|
|
65
|
|
58
|
|
|||||
|
Income before income tax expense
|
205
|
|
322
|
|
135
|
|
|||||
|
Income tax expense
|
153
|
|
179
|
|
73
|
|
|||||
|
Net income
|
$
|
52
|
|
$
|
143
|
|
$
|
62
|
|
||
|
Basic net income (loss) per share:
|
|||||||||||
|
Continuing operations
|
$
|
0.93
|
|
$
|
2.75
|
|
$
|
1.34
|
|
||
|
Discontinued operations
|
—
|
|
—
|
|
(0.01
|
)
|
|||||
|
$
|
0.93
|
|
$
|
2.75
|
|
$
|
1.33
|
|
|||
|
Diluted net income (loss) per share:
|
|||||||||||
|
Continuing operations
|
$
|
0.92
|
|
$
|
2.58
|
|
$
|
1.30
|
|
||
|
Discontinued operations
|
—
|
|
—
|
|
(0.01
|
)
|
|||||
|
$
|
0.92
|
|
$
|
2.58
|
|
$
|
1.29
|
|
|||
|
Weighted average shares outstanding:
|
|||||||||||
|
Basic
|
55
|
|
52
|
|
47
|
|
|||||
|
Diluted
|
56
|
|
56
|
|
48
|
|
|||||
See accompanying notes.
Molina Healthcare, Inc. 2016 Form 10-K | 63
MOLINA HEALTHCARE, INC.
CONSOLIDATED STATEMENTS OF COMPREHENSIVE INCOME
|
|
Year Ended December 31,
|
||||||||||
|
|
2016
|
2015
|
2014
|
||||||||
|
|
(In millions)
|
||||||||||
|
Net income
|
$
|
52
|
|
$
|
143
|
|
$
|
62
|
|
||
|
Other comprehensive income (loss):
|
|||||||||||
|
Unrealized investment gain (loss)
|
3
|
|
(5
|
)
|
—
|
|
|||||
|
Less: effect of income taxes
|
1
|
|
(2
|
)
|
—
|
|
|||||
|
Other comprehensive income (loss), net of tax
|
2
|
|
(3
|
)
|
—
|
|
|||||
|
Comprehensive income
|
$
|
54
|
|
$
|
140
|
|
$
|
62
|
|
||
See accompanying notes.
Molina Healthcare, Inc. 2016 Form 10-K | 64
MOLINA HEALTHCARE, INC.
|
December 31,
|
|||||||
|
2016
|
2015
|
||||||
|
(In millions,
except per-share data)
|
|||||||
|
ASSETS
|
|||||||
|
Current assets:
|
|||||||
|
Cash and cash equivalents
|
$
|
2,819
|
|
$
|
2,329
|
|
|
|
Investments
|
1,758
|
|
1,801
|
|
|||
|
Receivables
|
974
|
|
597
|
|
|||
|
Income taxes refundable
|
39
|
|
13
|
|
|||
|
Prepaid expenses and other current assets
|
131
|
|
192
|
|
|||
|
Derivative asset
|
267
|
|
374
|
|
|||
|
Total current assets
|
5,988
|
|
5,306
|
|
|||
|
Property, equipment, and capitalized software, net
|
454
|
|
393
|
|
|||
|
Deferred contract costs
|
86
|
|
81
|
|
|||
|
Intangible assets, net
|
140
|
|
122
|
|
|||
|
Goodwill
|
620
|
|
519
|
|
|||
|
Restricted investments
|
110
|
|
109
|
|
|||
|
Deferred income taxes
|
10
|
|
18
|
|
|||
|
Other assets
|
41
|
|
28
|
|
|||
|
$
|
7,449
|
|
$
|
6,576
|
|
||
|
LIABILITIES AND STOCKHOLDERS’ EQUITY
|
|||||||
|
Current liabilities:
|
|||||||
|
Medical claims and benefits payable
|
$
|
1,929
|
|
$
|
1,685
|
|
|
|
Amounts due government agencies
|
1,202
|
|
729
|
|
|||
|
Accounts payable and accrued liabilities
|
385
|
|
362
|
|
|||
|
Deferred revenue
|
315
|
|
223
|
|
|||
|
Current portion of long-term debt
|
472
|
|
449
|
|
|||
|
Derivative liability
|
267
|
|
374
|
|
|||
|
Total current liabilities
|
4,570
|
|
3,822
|
|
|||
|
Senior notes
|
975
|
|
962
|
|
|||
|
Lease financing obligations
|
198
|
|
198
|
|
|||
|
Deferred income taxes
|
15
|
|
—
|
|
|||
|
Other long-term liabilities
|
42
|
|
37
|
|
|||
|
Total liabilities
|
5,800
|
|
5,019
|
|
|||
|
Stockholders’ equity:
|
|||||||
|
Common stock, $0.001 par value; 150 shares authorized; outstanding: 57 shares at December 31, 2016 and 56 shares at December 31, 2015
|
—
|
|
—
|
|
|||
|
Preferred stock, $0.001 par value; 20 shares authorized, no shares issued and outstanding
|
—
|
|
—
|
|
|||
|
Additional paid-in capital
|
841
|
|
803
|
|
|||
|
Accumulated other comprehensive loss
|
(2
|
)
|
(4
|
)
|
|||
|
Retained earnings
|
810
|
|
758
|
|
|||
|
Total stockholders’ equity
|
1,649
|
|
1,557
|
|
|||
|
$
|
7,449
|
|
$
|
6,576
|
|
||
See accompanying notes.
Molina Healthcare, Inc. 2016 Form 10-K | 65
MOLINA HEALTHCARE, INC.
CONSOLIDATED STATEMENTS OF STOCKHOLDERS’ EQUITY
|
Common Stock
|
Additional
Paid-in
Capital
|
Accumulated
Other
Comprehensive
Loss
|
Retained
Earnings
|
Total
|
||||||||||||||||||
|
Outstanding
|
Amount
|
|||||||||||||||||||||
|
(In millions)
|
||||||||||||||||||||||
|
Balance at January 1, 2014
|
46
|
|
$
|
—
|
|
$
|
341
|
|
$
|
(1
|
)
|
$
|
553
|
|
$
|
893
|
|
|||||
|
Net income
|
—
|
|
—
|
|
—
|
|
—
|
|
62
|
|
62
|
|
||||||||||
|
Convertible senior notes transactions, including issuance costs
|
2
|
|
—
|
|
22
|
|
—
|
|
—
|
|
22
|
|
||||||||||
|
Share-based compensation
|
2
|
|
—
|
|
30
|
|
—
|
|
—
|
|
30
|
|
||||||||||
|
Tax benefit from share-based compensation
|
—
|
|
—
|
|
3
|
|
—
|
|
—
|
|
3
|
|
||||||||||
|
Balance at December 31, 2014
|
50
|
|
—
|
|
396
|
|
(1
|
)
|
615
|
|
1,010
|
|
||||||||||
|
Net income
|
—
|
|
—
|
|
—
|
|
—
|
|
143
|
|
143
|
|
||||||||||
|
Other comprehensive loss, net
|
—
|
|
—
|
|
—
|
|
(3
|
)
|
—
|
|
(3
|
)
|
||||||||||
|
Common stock offering, including issuance costs
|
6
|
|
—
|
|
373
|
|
—
|
|
—
|
|
373
|
|
||||||||||
|
Share-based compensation
|
—
|
|
—
|
|
26
|
|
—
|
|
—
|
|
26
|
|
||||||||||
|
Tax benefit from share-based compensation
|
—
|
|
—
|
|
8
|
|
—
|
|
—
|
|
8
|
|
||||||||||
|
Balance at December 31, 2015
|
56
|
|
—
|
|
803
|
|
(4
|
)
|
758
|
|
1,557
|
|
||||||||||
|
Net income
|
—
|
|
—
|
|
—
|
|
—
|
|
52
|
|
52
|
|
||||||||||
|
Other comprehensive income, net
|
—
|
|
—
|
|
—
|
|
2
|
|
—
|
|
2
|
|
||||||||||
|
Share-based compensation
|
1
|
|
—
|
|
36
|
|
—
|
|
—
|
|
36
|
|
||||||||||
|
Tax benefit from share-based compensation
|
—
|
|
—
|
|
2
|
|
—
|
|
—
|
|
2
|
|
||||||||||
|
Balance at December 31, 2016
|
57
|
|
$
|
—
|
|
$
|
841
|
|
$
|
(2
|
)
|
$
|
810
|
|
$
|
1,649
|
|
|||||
See accompanying notes.
Molina Healthcare, Inc. 2016 Form 10-K | 66
MOLINA HEALTHCARE, INC.
|
Year Ended December 31,
|
|||||||||||
|
2016
|
2015
|
2014
|
|||||||||
|
(In millions)
|
|||||||||||
|
Operating activities:
|
|||||||||||
|
Net income
|
$
|
52
|
|
$
|
143
|
|
$
|
62
|
|
||
|
Adjustments to reconcile net income to net cash provided by operating activities:
|
|||||||||||
|
Depreciation and amortization
|
182
|
|
126
|
|
134
|
|
|||||
|
Deferred income taxes
|
22
|
|
(7
|
)
|
(2
|
)
|
|||||
|
Share-based compensation
|
26
|
|
23
|
|
22
|
|
|||||
|
Amortization of convertible senior notes and lease financing obligations
|
31
|
|
30
|
|
27
|
|
|||||
|
Other, net
|
16
|
|
19
|
|
7
|
|
|||||
|
Changes in operating assets and liabilities:
|
|||||||||||
|
Receivables
|
(348
|
)
|
56
|
|
(298
|
)
|
|||||
|
Prepaid expenses and other current assets
|
(69
|
)
|
(35
|
)
|
(20
|
)
|
|||||
|
Medical claims and benefits payable
|
226
|
|
482
|
|
531
|
|
|||||
|
Amounts due government agencies
|
473
|
|
202
|
|
470
|
|
|||||
|
Accounts payable and accrued liabilities
|
(4
|
)
|
84
|
|
11
|
|
|||||
|
Deferred revenue
|
92
|
|
24
|
|
74
|
|
|||||
|
Income taxes
|
(26
|
)
|
(22
|
)
|
42
|
|
|||||
|
Net cash provided by operating activities
|
673
|
|
1,125
|
|
1,060
|
|
|||||
|
Investing activities:
|
|||||||||||
|
Purchases of investments
|
(1,929
|
)
|
(1,923
|
)
|
(953
|
)
|
|||||
|
Proceeds from sales and maturities of investments
|
1,966
|
|
1,126
|
|
633
|
|
|||||
|
Purchases of property, equipment and capitalized software
|
(176
|
)
|
(132
|
)
|
(115
|
)
|
|||||
|
Change in restricted investments
|
4
|
|
(6
|
)
|
(34
|
)
|
|||||
|
Net cash paid in business combinations
|
(48
|
)
|
(450
|
)
|
(44
|
)
|
|||||
|
Other, net
|
(19
|
)
|
(35
|
)
|
(23
|
)
|
|||||
|
Net cash used in investing activities
|
(202
|
)
|
(1,420
|
)
|
(536
|
)
|
|||||
|
Financing activities:
|
|||||||||||
|
Proceeds from senior notes offerings, net of issuance costs
|
—
|
|
689
|
|
123
|
|
|||||
|
Proceeds from common stock offering, net of issuance costs
|
—
|
|
373
|
|
—
|
|
|||||
|
Contingent consideration liabilities settled
|
—
|
|
—
|
|
(50
|
)
|
|||||
|
Proceeds from employee stock plans
|
18
|
|
18
|
|
14
|
|
|||||
|
Principal payments on convertible senior notes
|
—
|
|
—
|
|
(10
|
)
|
|||||
|
Other, net
|
1
|
|
5
|
|
2
|
|
|||||
|
Net cash provided by financing activities
|
19
|
|
1,085
|
|
79
|
|
|||||
|
Net increase in cash and cash equivalents
|
490
|
|
790
|
|
603
|
|
|||||
|
Cash and cash equivalents at beginning of period
|
2,329
|
|
1,539
|
|
936
|
|
|||||
|
Cash and cash equivalents at end of period
|
$
|
2,819
|
|
$
|
2,329
|
|
$
|
1,539
|
|
||
See accompanying notes.
Molina Healthcare, Inc. 2016 Form 10-K | 67
MOLINA HEALTHCARE, INC.
CONSOLIDATED STATEMENTS OF CASH FLOWS
(continued)
|
Year Ended December 31,
|
|||||||||||
|
2016
|
2015
|
2014
|
|||||||||
|
(In millions)
|
|||||||||||
|
Supplemental cash flow information:
|
|||||||||||
|
Cash paid during the period for:
|
|||||||||||
|
Income taxes
|
$
|
153
|
|
$
|
197
|
|
$
|
30
|
|
||
|
Interest
|
$
|
66
|
|
$
|
38
|
|
$
|
29
|
|
||
|
Schedule of non-cash investing and financing activities:
|
|||||||||||
|
Convertible senior notes exchange transaction
|
$
|
—
|
|
$
|
—
|
|
$
|
177
|
|
||
|
Increase in non-cash lease financing obligation
|
$
|
—
|
|
$
|
—
|
|
$
|
14
|
|
||
|
Common stock used for stock-based compensation
|
$
|
(8
|
)
|
$
|
(15
|
)
|
$
|
(9
|
)
|
||
|
Details of business combinations:
|
|||||||||||
|
Fair value of assets acquired
|
$
|
(186
|
)
|
$
|
(389
|
)
|
$
|
(52
|
)
|
||
|
Fair value of liabilities assumed
|
28
|
|
41
|
|
—
|
|
|||||
|
Payable to seller
|
8
|
|
—
|
|
8
|
|
|||||
|
Amounts advanced for acquisitions
|
102
|
|
(102
|
)
|
—
|
|
|||||
|
Net cash paid in business combinations
|
$
|
(48
|
)
|
$
|
(450
|
)
|
$
|
(44
|
)
|
||
|
Details of change in fair value of derivatives, net:
|
|||||||||||
|
(Loss) gain on 1.125% Notes Call Option
|
$
|
(107
|
)
|
$
|
45
|
|
$
|
143
|
|
||
|
Gain (loss) on 1.125% Notes Conversion Option
|
107
|
|
(45
|
)
|
(143
|
)
|
|||||
|
Change in fair value of derivatives, net
|
$
|
—
|
|
$
|
—
|
|
$
|
—
|
|
||
See accompanying notes.
Molina Healthcare, Inc. 2016 Form 10-K | 68
NOTES TO CONSOLIDATED FINANCIAL STATEMENTS
1
.
Basis of Presentation
Organization and Operations
Molina Healthcare, Inc. provides quality managed healthcare to people receiving government assistance. We offer cost-effective Medicaid-related solutions to meet the health care needs of low-income families and individuals, and to assist government agencies in their administration of the Medicaid program.
We have
three
reportable segments. These segments consist of our Health Plans segment, which comprises the vast majority of our operations; our Molina Medicaid Solutions segment; and our Other segment, which includes our behavioral health and social services subsidiary, Pathways.
The Health Plans segment consists of health plans in
12
states and the Commonwealth of Puerto Rico, and includes our direct delivery business. As of
December 31, 2016
, these health plans served over
4.2 million
members eligible for Medicaid, Medicare, and other government-sponsored health care programs for low-income families and individuals. This membership includes Affordable Care Act Marketplace (Marketplace) members, most of whom receive government premium subsidies. The health plans are operated by our respective wholly owned subsidiaries in those states, each of which is licensed as a health maintenance organization (HMO).
Our direct delivery business consists primarily of the operation of primary care clinics in several states in which we operate.
Our health plans’ state Medicaid contracts generally have terms of
three
to
four
years. These contracts typically contain renewal options exercisable by the state Medicaid agency, and allow either the state or the health plan to terminate the contract with or without cause. Our health plan subsidiaries have generally been successful in retaining their contracts, but such contracts are subject to risk of loss when a state issues a new request for proposal (RFP) open to competitive bidding by other health plans. If one of our health plans is not a successful responsive bidder to a state RFP, its contract may be subject to non-renewal.
In addition to contract renewal, our state Medicaid contracts may be periodically amended to include or exclude certain health benefits (such as pharmacy services, behavioral health services, or long-term care services); populations such as the aged, blind or disabled (ABD); and regions or service areas.
The Molina Medicaid Solutions segment provides support to state government agencies in the administration of their Medicaid programs including business processing, information technology development, and administrative services. Molina Medicaid Solutions is under contract with Medicaid agencies in Idaho, Louisiana, Maine, New Jersey, West Virginia, and the U.S. Virgin Islands, and provides drug rebate administration services in Florida.
The Other segment includes primarily our Pathways behavioral health and social services provider, and corporate amounts not allocated to other reportable segments.
Recent Developments – Health Plans Segment
Proposed Medicare Acquisition.
In August 2016, we entered into substantially identical agreements with each of Aetna Inc. and Humana Inc. to acquire certain of their Medicare Advantage membership and other assets related to such Medicare Advantage business (the Proposed Medicare Acquisition), for cash. The Proposed Medicare Acquisition was subject to closing conditions including, but not limited to, the completion of the proposed acquisition of Humana by Aetna (the Aetna-Humana Merger). In January 2017, the U.S. District Court for the District of Columbia granted the request made by the U.S. Department of Justice in its civil antitrust lawsuit against Aetna and Humana, to prohibit the Aetna-Humana Merger (the District Court Order). In February 2017, the Proposed Medicare Acquisition was terminated by the parties pursuant to the terms of the transaction. Under the termination agreement, we are entitled to receive from Aetna and Humana an aggregate termination fee of
$75 million
(the breakup fee).
In addition, we are entitled to reimbursement of reasonable and documented out-of-pocket expenses incurred by us and our affiliates in connection with the Proposed Medicare Acquisition. We will record the breakup fee as other income in the first quarter of 2017.
Completed acquisitions. S
ee Note
4
, “
Business Combinations
,” for further information regarding Health Plans segment acquisitions completed during 2016.
Molina Healthcare, Inc. 2016 Form 10-K | 69
Consolidation and Presentation
The consolidated financial statements include the accounts of Molina Healthcare, Inc., its subsidiaries, and variable interest entities in which Molina Healthcare, Inc. is considered to be the primary beneficiary. See Note
18
, “
Variable Interest Entities (VIEs)
,” for more information regarding these variable interest entities. All significant inter-company balances and transactions have been eliminated in consolidation. Financial information related to subsidiaries acquired during any year is included only for periods subsequent to their acquisition.
In the opinion of management, all adjustments considered necessary for a fair presentation of the results as of the date and for the periods presented have been included; such adjustments consist of normal recurring adjustments.
Use of Estimates
The preparation of consolidated financial statements in conformity with GAAP requires management to make estimates and assumptions that affect the reported amounts of assets and liabilities. Estimates also affect the reported amounts of revenues and expenses during the reporting period. Actual results could differ from these estimates. Principal areas requiring the use of estimates include:
|
•
|
The determination of medical claims and benefits payable of our Health Plans segment;
|
|
•
|
Health plan contractual provisions that may limit revenue recognition based upon the costs incurred or the profits realized under a specific contract;
|
|
•
|
Health plan quality incentives that allow us to recognize incremental revenue if certain quality standards are met;
|
|
•
|
Molina Medicaid Solutions segment revenue and cost recognition;
|
|
•
|
Settlements under risk or savings sharing programs;
|
|
•
|
The assessment of deferred contract costs, deferred revenue, long-lived and intangible assets, and goodwill for impairment;
|
|
•
|
The determination of reserves for potential absorption of claims unpaid by insolvent providers;
|
|
•
|
The determination of reserves for the outcome of litigation;
|
|
•
|
The determination of valuation allowances for deferred tax assets; and
|
|
•
|
The determination of unrecognized tax benefits.
|
2
.
Significant Accounting Policies
Certain of our significant accounting policies are discussed within the note to which they specifically relate.
Cash and Cash Equivalents
Cash and cash equivalents consist of cash and short-term, highly liquid investments that are both readily convertible into known amounts of cash and have a maturity of
three months or less
on the date of purchase.
Investments
Our investments are principally held in debt securities, which are grouped into two separate categories for accounting and reporting purposes: available-for-sale securities, and held-to-maturity securities. Available-for-sale securities are recorded at fair value and unrealized gains and losses, if any, are recorded in stockholders’ equity as other comprehensive income, net of applicable income taxes. Held-to-maturity securities are recorded at amortized cost, which approximates fair value, and unrealized holding gains or losses are not generally recognized. Realized gains and losses and unrealized losses judged to be other than temporary with respect to available-for-sale and held-to-maturity securities are included in the determination of net income. The cost of securities sold is determined using the specific-identification method.
Our investment policy requires that all of our investments have final maturities of
10
years or less (excluding variable rate securities where interest rates may be periodically reset), and that the average maturity be
three
years or less. Investments and restricted investments are subject to interest rate risk and will decrease in value if market rates increase. Declines in interest rates over time will reduce our investment income.
Molina Healthcare, Inc. 2016 Form 10-K | 70
In general, our available-for-sale securities are classified as current assets without regard to the securities’ contractual maturity dates because they may be readily liquidated. We monitor our investments for other-than-temporary impairment. For comprehensive discussions of the fair value and classification of our current and non-current investments, see Note
5
, “
Fair Value Measurements
,” Note
6
, “
Investments
,” and Note
10
, “
Restricted Investments
.”
Long-Lived Assets, including Intangible Assets
Long-lived assets consist primarily of property, equipment, capitalized software (see Note
8
, “
Property, Equipment, and Capitalized Software
”), and intangible assets (see Note
9
, “
Goodwill and Intangible Assets
”).
Business Combinations
Accounting for acquisitions requires us to recognize separately from goodwill the assets acquired and the liabilities assumed at their acquisition date fair values.
Goodwill represents the excess of the purchase price over the fair value of net assets acquired in business combinations.
While we use our best estimates and assumptions to accurately value assets acquired and liabilities assumed at the acquisition date, our estimates are inherently uncertain and subject to refinement. As a result, during the measurement period, which may be up to one year from the acquisition date, we may record adjustments to the assets acquired and liabilities assumed with the corresponding offset to goodwill. Upon the conclusion of the final determination of the values of assets acquired or liabilities assumed, or one year after the date of acquisition, whichever comes first, any subsequent adjustments are recorded to our consolidated statements of income. Refer to Note
4
, “
Business Combinations
,” for further details regarding our 2016 acquisitions.
Premium Revenue - Health Plans
Premium revenue is generated primarily from our Medicaid, Medicare and Marketplace contracts, including agreements with other managed care organizations for which we operate as a subcontractor. Premium revenue is generally received based on per member per month (PMPM) rates established in advance of the periods covered. These premium revenues are recognized in the month that members are entitled to receive health care services, and premiums collected in advance are deferred. The state Medicaid programs and the federal Medicare program periodically adjust premiums. Additionally, many of our contracts contain provisions that may adjust or limit revenue or profit, as described below. Consequently, we recognize premium revenue as it is earned under such provisions.
The following table summarizes premium revenue for the periods indicated:
|
Year Ended December 31,
|
||||||||||||||||||||
|
2016
|
2015
|
2014
|
||||||||||||||||||
|
Amount
|
% of Total
|
Amount
|
% of Total
|
Amount
|
% of Total
|
|||||||||||||||
|
(Dollars in millions)
|
||||||||||||||||||||
|
California
|
$
|
2,370
|
|
14.5
|
%
|
$
|
2,200
|
|
16.6
|
%
|
$
|
1,523
|
|
16.9
|
%
|
|||||
|
Florida
|
1,926
|
|
11.7
|
|
1,199
|
|
9.0
|
|
439
|
|
4.9
|
|
||||||||
|
Illinois
|
601
|
|
3.7
|
|
397
|
|
3.0
|
|
153
|
|
1.7
|
|
||||||||
|
Michigan
|
1,520
|
|
9.3
|
|
1,067
|
|
8.1
|
|
781
|
|
8.7
|
|
||||||||
|
New Mexico
|
1,304
|
|
7.9
|
|
1,237
|
|
9.3
|
|
1,076
|
|
11.9
|
|
||||||||
|
New York
|
82
|
|
0.5
|
|
—
|
|
—
|
|
—
|
|
—
|
|
||||||||
|
Ohio
|
1,961
|
|
12.0
|
|
2,034
|
|
15.4
|
|
1,553
|
|
17.2
|
|
||||||||
|
Puerto Rico
|
726
|
|
4.4
|
|
567
|
|
4.3
|
|
—
|
|
—
|
|
||||||||
|
South Carolina
|
378
|
|
2.3
|
|
348
|
|
2.6
|
|
381
|
|
4.2
|
|
||||||||
|
Texas
|
2,454
|
|
15.0
|
|
1,961
|
|
14.8
|
|
1,318
|
|
14.6
|
|
||||||||
|
Utah
|
444
|
|
2.7
|
|
331
|
|
2.5
|
|
310
|
|
3.4
|
|
||||||||
|
Washington
|
2,218
|
|
13.5
|
|
1,602
|
|
12.1
|
|
1,305
|
|
14.5
|
|
||||||||
|
Wisconsin
|
395
|
|
2.4
|
|
261
|
|
2.0
|
|
156
|
|
1.7
|
|
||||||||
|
Direct delivery
|
13
|
|
0.1
|
|
37
|
|
0.3
|
|
28
|
|
0.3
|
|
||||||||
|
$
|
16,392
|
|
100.0
|
%
|
$
|
13,241
|
|
100.0
|
%
|
$
|
9,023
|
|
100.0
|
%
|
||||||
Molina Healthcare, Inc. 2016 Form 10-K | 71
Certain components of premium revenue are subject to accounting estimates and fall into the following categories:
Contractual Provisions That May Adjust or Limit Revenue or Profit
Medicaid
Medical Cost Floors (Minimums), and Medical Cost Corridors.
A portion of our premium revenue may be returned if certain minimum amounts are not spent on defined medical care costs. In the aggregate, we recorded a liability under the terms of such contract provisions of
$272 million
and
$214 million
at
December 31, 2016
and
December 31, 2015
, respectively, to amounts due government agencies. Approximately
$244 million
and
$208 million
of the liability accrued at
December 31, 2016
and
December 31, 2015
, respectively, relates to our participation in Medicaid Expansion programs.
In
February 2017, the New Mexico Human Services Department (HSD) notified us that it has disallowed certain medically related administrative expenses and other items in the computation of its Medicaid Expansion risk corridor; this corridor was effective January 1, 2014, through December 31, 2016. Although we disagree with their contractual interpretations, we deferred premium revenue amounting to approximately
$45 million
for the year ended December 31, 2016, as a result of this communication, because such revenue is presently subject to refund or adjustment.
Of this amount,
$29 million
relates to dates of service prior to 2016.
At December 31, 2016, our aggregate Medicaid Expansion risk corridor payable to HSD is
$145 million
. We intend to appeal HSD’s ruling on this matter.
In the fourth quarter of 2016, our
California health plan received a contract amendment from the California Department of Healthcare Services that allowed us to deduct certain tax expenses in the computation of its Medicaid Expansion minimum medical loss ratio; this minimum medical loss ratio was effective January 1, 2014, through June 30, 2016. As a result of this contract amendment, we increased premium revenue for the year ended December 31, 2016, by approximately
$68 million
, of which
$35 million
related to periods prior to 2016.
In certain circumstances, the health plans may receive additional premiums if amounts spent on medical care costs exceed a defined maximum threshold. Receivables relating to such provisions were insignificant at
December 31, 2016
and
December 31, 2015
.
Profit Sharing and Profit Ceiling.
Our contracts with certain states contain profit-sharing or profit ceiling provisions under which we refund amounts to the states if our health plans generate profit above a certain specified percentage. In some cases, we are limited in the amount of administrative costs that we may deduct in calculating the refund, if any. Liabilities for profits in excess of the amount we are allowed to retain under these provisions were insignificant at
December 31, 2016
and
December 31, 2015
.
Retroactive Premium Adjustments.
In the first quarter of 2016, our Florida health plan recorded a retroactive increase to Medicaid premium revenue of approximately
$18 million
relating to dates of service prior to 2016.
Medicare
Risk Adjustment.
Our Medicare premiums are subject to retroactive increase or decrease based on the health status of our Medicare members (as measured by member risk score). We estimate our members’ risk scores and the related amount of Medicare revenue that will ultimately be realized for the periods presented based on our knowledge of our members’ health status, risk scores and Centers for Medicare & Medicaid Services (CMS) practices. Consolidated balance sheet amounts related to anticipated Medicare risk adjustment premiums and Medicare Part D settlements were insignificant at
December 31, 2016
and
December 31, 2015
.
Minimum MLR
. Additionally, federal regulations have established a minimum annual medical loss ratio (Minimum MLR) of 85% for the Medicare. The medical loss ratio represents medical costs as a percentage of premium revenue. Federal regulations specifically define what constitutes medical costs and premium revenue. If the Minimum MLR is not met, we may be required to pay rebates to the federal government. We recognize estimated rebates under the Minimum MLR as an adjustment to premium revenue in our consolidated statements of income.
Marketplace
Premium Stabilization Programs.
The Affordable Care Act (ACA) established Marketplace premium stabilization programs effective January 1, 2014. These programs, commonly referred to as the “3R’s,” include a permanent risk adjustment program, a transitional reinsurance program, and a temporary risk corridor program. We record receivables or payables related to the 3R programs and the Minimum MLR when the amounts are reasonably
Molina Healthcare, Inc. 2016 Form 10-K | 72
estimable as described below, and, for receivables, collection is reasonably assured. Our receivables (payables) for each of these programs, as of the dates indicated, were as follows:
|
December 31, 2016
|
December 31, 2015
|
||||||||||||||
|
Current Benefit Year
|
Prior Benefit Years
|
Total
|
|||||||||||||
|
(In millions)
|
|||||||||||||||
|
Risk adjustment
|
$
|
(522
|
)
|
$
|
—
|
|
$
|
(522
|
)
|
$
|
(214
|
)
|
|||
|
Reinsurance
|
51
|
|
4
|
|
55
|
|
36
|
|
|||||||
|
Risk corridor
|
(1
|
)
|
—
|
|
(1
|
)
|
(10
|
)
|
|||||||
|
Minimum MLR
|
(1
|
)
|
—
|
|
(1
|
)
|
(3
|
)
|
|||||||
|
•
|
Risk adjustment: Under this permanent program, our health plans’ composite risk scores are compared with the overall average risk score for the relevant state and market pool. Generally, our health plans will make a risk transfer payment into the pool if their composite risk scores are below the average risk score, and will receive a risk transfer payment from the pool if their composite risk scores are above the average risk score. We estimate our ultimate premium based on insurance policy year-to-date experience, and recognize estimated premiums relating to the risk adjustment program as an adjustment to premium revenue in our consolidated statements of income. On June 30, 2016, CMS released the final update on risk transfer and reinsurance payments for the 2015 benefit year, and we adjusted our accruals accordingly. Our risk transfer payment was approximately
$40 million
more than our estimate as of December 31, 2015.
|
|
•
|
Reinsurance: This program is designed to provide reimbursement to insurers for high cost members. Our health plans pay an annual contribution on a per-member basis, and are eligible for recoveries if claims for individual members exceed a specified threshold, up to a maximum amount. We recognize the assessments to fund the transitional reinsurance program as a reduction to premium revenue in our consolidated statements of income. We recognize recoveries under the reinsurance program as a reduction to medical care costs in our consolidated statements of income. This three-year program ended December 31, 2016.
|
|
•
|
Risk corridor: This program is intended to limit gains and losses of insurers by comparing allowable costs to a target amount as defined by CMS. Variances from the target amount exceeding certain thresholds may result in amounts due to or receivables due from CMS. Due to uncertainties as to the amount of federal funding available to support the risk corridor program, we do not recognize amounts receivable under this program. Our estimate of the unrecorded receivable for the Marketplace risk corridor amounted to approximately
$142 million
as of
December 31, 2016
. Of this total amount,
$52 million
relates to the 2015 benefit year and
$90 million
relates to the year ended
December 31, 2016
. All liabilities are recognized as incurred. We estimate our ultimate premium based on insurance policy year-to-date experience, and recognize estimated premiums relating to the risk corridor program as an adjustment to premium revenue in our consolidated statements of income. This three-year program ended December 31, 2016.
|
Additionally, the ACA established a Minimum MLR of 80% for the Marketplace. The medical loss ratio represents medical costs as a percentage of premium revenue. Federal regulations specifically define what constitutes medical costs and premium revenue. If the Minimum MLR is not met, we may be required to pay rebates to our Marketplace policyholders. Each of the 3R programs is taken into consideration when computing the Minimum MLR. We recognize estimated rebates under the Minimum MLR as an adjustment to premium revenue in our consolidated statements of income.
Quality Incentives
At several of our health plans, revenue ranging from approximately
1%
to
3%
of certain health plan premiums is earned only if certain performance measures are met.
During the second quarter of 2016, we were informed by the Texas Department of Health and Human Services that it will not recoup any quality revenue for calendar years 2014, 2015, and 2016. Therefore, we recognized previously deferred quality revenue amounting to approximately
$51 million
in the second quarter of 2016. Of the
$51 million
total adjustment,
$44 million
related to dates of service in 2015 and earlier.
The following table quantifies the quality incentive premium revenue recognized for the periods presented, including the amounts earned in the periods presented and prior periods. Although the reasonably possible effects of a change in estimate related to quality incentive premium revenue as of
December 31, 2016
are not known, we have
Molina Healthcare, Inc. 2016 Form 10-K | 73
no reason to believe that the adjustments to prior periods noted below are not indicative of the potential future changes in our estimates as of
December 31, 2016
, other than the Texas quality revenue recognized in the second quarter of 2016 described above.
|
Year Ended December 31,
|
|||||||||||
|
2016
|
2015
|
2014
|
|||||||||
|
(In millions)
|
|||||||||||
|
Maximum available quality incentive premium - current period
|
$
|
147
|
|
$
|
118
|
|
$
|
90
|
|
||
|
Amount of quality incentive premium revenue recognized in current period:
|
|||||||||||
|
Earned current period
|
$
|
104
|
|
$
|
66
|
|
$
|
40
|
|
||
|
Earned prior periods
|
47
|
|
13
|
|
4
|
|
|||||
|
Total
|
$
|
151
|
|
$
|
79
|
|
$
|
44
|
|
||
|
Quality incentive premium revenue recognized as a percentage of total premium revenue
|
0.9
|
%
|
0.6
|
%
|
0.5
|
%
|
|||||
Medical Care Costs - Health Plans
Expenses related to medical care services are captured in the following categories:
Fee-for-service expenses.
Nearly all hospital services and the majority of our primary care and physician specialist services and LTSS costs are paid on a fee-for-service basis. Under fee-for-service arrangements, we retain the financial responsibility for medical care provided and incur costs based on actual utilization of services. Such expenses are recorded in the period in which the related services are dispensed. The costs of drugs administered in a physician or hospital setting that are not billed through our pharmacy benefit manager are included in fee-for-service costs.
Pharmacy expenses.
All drug, injectibles, and immunization costs paid through our pharmacy benefit manager are classified as pharmacy expenses. As noted above, drugs and injectibles not paid through our pharmacy benefit manager are included in fee-for-service costs, except in those limited instances where we capitate drug and injectible costs.
Capitation expenses.
Many of our primary care physicians and a small portion of our specialists and hospitals are paid on a capitated basis. Under capitation arrangements, we pay a fixed amount PMPM to the provider without regard to the frequency, extent, or nature of the medical services actually furnished. Under capitated arrangements, we remain liable for the provision of certain health care services. Capitation payments are fixed in advance of the periods covered and are not subject to significant accounting estimates. These payments are expensed in the period the providers are obligated to provide services. The financial risk for pharmacy services for a small portion of our membership is delegated to capitated providers.
Direct delivery expenses.
All costs associated with our direct delivery of medical care are separately identified.
Other medical expenses.
All medically related administrative costs, certain provider incentive costs, and other health care expenses are classified as other medical expenses. Medically related administrative costs include, for example, expenses relating to health education, quality assurance, case management, care coordination, disease management, and 24-hour on-call nurses. Salary and benefit costs are a substantial portion of these expenses. For the years ended
December 31, 2016
,
2015
, and
2014
, medically related administrative costs were
$488 million
,
$398 million
,
and
$263 million
,
respectively.
Molina Healthcare, Inc. 2016 Form 10-K | 74
The following table provides the details of our consolidated medical care costs for the periods indicated (dollars in millions, except PMPM amounts):
|
|
Year Ended December 31,
|
|||||||||||||||||||||||||||||||
|
|
2016
|
2015
|
2014
|
|||||||||||||||||||||||||||||
|
Amount
|
PMPM
|
% of
Total
|
Amount
|
PMPM
|
% of
Total
|
Amount
|
PMPM
|
% of
Total
|
||||||||||||||||||||||||
|
Fee-for-service
|
$
|
10,993
|
|
$
|
217.84
|
|
74.4
|
%
|
$
|
8,572
|
|
$
|
218.35
|
|
72.7
|
%
|
$
|
5,673
|
|
$
|
202.87
|
|
70.2
|
%
|
||||||||
|
Pharmacy
|
2,213
|
|
43.84
|
|
15.0
|
|
1,610
|
|
41.01
|
|
13.7
|
|
1,273
|
|
45.54
|
|
15.8
|
|
||||||||||||||
|
Capitation
|
1,218
|
|
24.13
|
|
8.2
|
|
982
|
|
25.02
|
|
8.3
|
|
748
|
|
26.77
|
|
9.3
|
|
||||||||||||||
|
Direct delivery
|
78
|
|
1.55
|
|
0.5
|
|
128
|
|
3.26
|
|
1.1
|
|
96
|
|
3.44
|
|
1.2
|
|
||||||||||||||
|
Other
|
272
|
|
5.39
|
|
1.9
|
|
502
|
|
12.79
|
|
4.2
|
|
286
|
|
10.22
|
|
3.5
|
|
||||||||||||||
|
Total
|
$
|
14,774
|
|
$
|
292.75
|
|
100.0
|
%
|
$
|
11,794
|
|
$
|
300.43
|
|
100.0
|
%
|
$
|
8,076
|
|
$
|
288.84
|
|
100.0
|
%
|
||||||||
Our medical care costs include amounts that have been paid by us through the reporting date, as well as estimated liabilities for medical care costs incurred but not paid by us as of the reporting date. Such medical care cost liabilities include, among other items, unpaid fee-for-service claims, capitation payments owed providers, unpaid pharmacy invoices, and various medically related administrative costs that have been incurred but not paid. We use judgment to determine the appropriate assumptions for determining the required estimates.
The most important element in estimating our medical care costs is our estimate for fee-for-service claims which have been incurred but not paid by us. These fee-for-service costs that have been incurred but have not been paid at the reporting date are collectively referred to as medical costs that are incurred but not paid (IBNP). Our IBNP claims reserve, as reported in our balance sheet, represents our best estimate of the total amount of claims we will ultimately pay with respect to claims that we have incurred as of the balance sheet date. We estimate our IBNP monthly using actuarial methods based on a number of factors. For further information, see Note
11
, “
Medical Claims and Benefits Payable
.”
We report reinsurance premiums as a reduction to premium revenue, while related reinsurance recoveries are reported as a reduction to medical care costs. We limit our risk of catastrophic losses by maintaining high deductible reinsurance coverage. Such reinsurance coverage does not relieve us of our primary obligation to our policyholders. We do not consider this coverage to be material because the cost is not significant and the likelihood that coverage will apply is low.
Taxes Based on Premiums
Health Insurer Fee (HIF).
The federal government under the ACA imposes an annual fee, or excise tax, on health insurers for each calendar year. The HIF is based on a company’s share of the industry’s net premiums written during the preceding calendar year, and is non-deductible for income tax purposes. We recognize expense for the HIF over the year on a straight-line basis. Within our Medicaid program, we must secure additional reimbursement from our state partners for this added cost. We recognize the related revenue when we have obtained a contractual commitment or payment from a state to reimburse us for the HIF; such HIF revenue is recognized ratably throughout the year.
The Consolidated Appropriations Act of 2016 provided for a HIF moratorium in 2017. Therefore, there will be no HIF revenue or expenses in 2017.
Premium and Use Tax.
Certain of our health plans are assessed a tax based on premium revenue collected. The premium revenues we receive from these states include the premium tax assessment. We have reported these taxes on a gross basis, as premium tax revenue and as premium tax expenses in the consolidated statements of income.
Premium Deficiency Reserves on Loss Contracts
We assess the profitability of our medical care policies to identify groups of contracts where current operating results or forecasts indicate probable future losses. If anticipated future variable costs exceed anticipated future premiums and investment income, a premium deficiency reserve is recognized.
In the fourth quarter of 2016, we recorded a premium deficiency reserve of
$30 million
for our Marketplace contracts in California and Washington.
No premium deficiency reserve was recorded as of
December 31, 2015
.
Molina Healthcare, Inc. 2016 Form 10-K | 75
Service Revenue and Cost of Service Revenue — Molina Medicaid Solutions Segment
The payments received by our Molina Medicaid Solutions segment under its state contracts are based on the performance of multiple services. The first of these is the design, development and implementation (DDI) of a Medicaid management information system (MMIS). An additional service, following completion of DDI, is the operation of the MMIS under a business process outsourcing (BPO) arrangement. When providing BPO services (which include claims payment and eligibility processing) we also provide the state with other services including both hosting and support, and maintenance.
We have evaluated our Molina Medicaid Solutions contracts to determine if such arrangements include a software element. Based on this evaluation, we have concluded that these arrangements do not include a software element, and are therefore multiple-element service arrangements.
Additionally, we evaluate each required deliverable under our multiple-element service arrangements to determine whether it qualifies as a separate unit of accounting. Such evaluation is generally based on whether the deliverable has standalone value to the customer. If the deliverable has standalone value, the arrangement’s consideration that is fixed or determinable is then allocated to each separate unit of accounting based on the relative selling price of each deliverable. In general, the consideration allocated to each unit of accounting is recognized as the related goods or services are delivered, limited to the consideration that is not contingent.
We have concluded that the various service elements in our Molina Medicaid Solutions contracts represent a single unit of accounting due to the fact that DDI, which is the only service performed in advance of the other services (all other services are performed over an identical period), does not have standalone value because our DDI services are not sold separately by any vendor and the customer could not resell our DDI services. Further, we have no objective and reliable evidence of fair value for any of the individual elements in these contracts, and at no point in the contract will we have objective and reliable evidence of fair value for the undelivered elements in the contracts. We lack objective and reliable evidence of the fair value of the individual elements of our Molina Medicaid Solutions contracts for the following reasons:
|
•
|
Each contract calls for the provision of its own specific set of services. While all contracts support the system of record for state MMIS, the actual services we provide vary significantly between contracts; and
|
|
•
|
The nature of the MMIS installed varies significantly between our older contracts (proprietary mainframe systems) and our new contracts (commercial off-the-shelf technology solutions).
|
Because we have determined the services provided under our Molina Medicaid Solutions contracts represent a single unit of accounting, and because we are unable to determine a pattern of performance of services during the contract period, we recognize all revenue (both the DDI and BPO elements) associated with such contracts on a straight-line basis over the period during which BPO, hosting, and support and maintenance services are delivered. Therefore, absent any contingencies as discussed in the following paragraph, or contract extensions, we would recognize all revenue associated with those contracts over the initial contract period. When a contract is extended, we generally consider the extension to be a continuation of the single unit of accounting; therefore, the deferred revenue as of the extension date is recognized prospectively over the new remaining term of the contract. In cases where there is no DDI element associated with our contracts, BPO revenue is recognized on a monthly basis as specified in the applicable contract or contract extension.
Provisions specific to each contract may, however, lead us to modify this general principle. In those circumstances, the right of the state to refuse acceptance of services, as well as the related obligation to compensate us, may require us to delay recognition of all or part of our revenue until that contingency (the right of the state to refuse acceptance) has been removed. In those circumstances, we defer recognition of any contingent revenue (whether DDI, BPO services, hosting, and support and maintenance services) until the contingency has been removed.
Costs associated with our Molina Medicaid Solutions contracts include software related costs and other costs. With respect to software related costs, we apply the guidance for internal-use software and capitalize external direct costs of materials and services consumed in developing or obtaining the software, and payroll and payroll-related costs associated with employees who are directly associated with and who devote time to the computer software project. With respect to all other direct costs, such costs are expensed as incurred, unless corresponding revenue is being deferred. If revenue is being deferred, direct costs relating to delivered service elements are deferred as well and are recognized on a straight-line basis over the period of revenue recognition, in a manner consistent with our recognition of revenue that has been deferred. Such direct costs can include:
|
•
|
Transaction processing costs;
|
|
•
|
Employee costs incurred in performing transaction services;
|
Molina Healthcare, Inc. 2016 Form 10-K | 76
|
•
|
Vendor costs incurred in performing transaction services;
|
|
•
|
Costs incurred in performing required monitoring of and reporting on contract performance;
|
|
•
|
Costs incurred in maintaining and processing member and provider eligibility; and
|
|
•
|
Costs incurred in communicating with members and providers.
|
The recoverability of deferred contract costs associated with a particular contract is analyzed on a periodic basis using the undiscounted estimated cash flows of the whole contract over its remaining contract term. If such undiscounted cash flows are insufficient to recover the long-lived assets and deferred contract costs, the deferred contract costs are written down by the amount of the cash flow deficiency. If a cash flow deficiency remains after reducing the balance of the deferred contract costs to zero, any remaining long-lived assets are evaluated for impairment. Any such impairment recognized would equal the amount by which the carrying value of the long-lived assets exceeds the fair value of those assets.
Concentrations of Credit Risk
Financial instruments that potentially subject us to concentrations of credit risk consist primarily of cash and cash equivalents, investments, receivables, and restricted investments. Our investments and a portion of our cash equivalents are managed by professional portfolio managers operating under documented investment guidelines. Our portfolio managers must obtain our prior approval before selling investments where the loss position of those investments exceeds certain levels. Our investments consist primarily of investment-grade debt securities with a maximum maturity of
10
years and an average duration of
three
years or less. Restricted investments are invested principally in certificates of deposit and U.S. treasury securities. Concentration of credit risk with respect to accounts receivable is limited because our payors consist principally of the governments of each state in which our health plan subsidiaries operate.
Risks and Uncertainties
Our profitability depends in large part on our ability to accurately predict and effectively manage medical care costs. We continually review our medical costs in light of our underlying claims experience and revised actuarial data. However, several factors could adversely affect medical care costs. These factors, which include changes in health care practices, inflation, new technologies, major epidemics, natural disasters, and malpractice litigation, are beyond our control and may have an adverse effect on our ability to accurately predict and effectively control medical care costs. Costs in excess of those anticipated could have a material adverse effect on our financial condition, results of operations, or cash flows.
We operate health plans primarily as a direct contractor with the states (or Commonwealth), and in Los Angeles County, California, as a subcontractor to another health plan holding a direct contract with the state. We are therefore dependent upon a small number of contracts to support our revenue. The loss of any one of those contracts could have a material adverse effect on our financial position, results of operations, or cash flows. Our ability to arrange for the provision of medical services to our members is dependent upon our ability to develop and maintain adequate provider networks. Our inability to develop or maintain such networks might, in certain circumstances, have a material adverse effect on our financial position, results of operations, or cash flows.
Recent Accounting Pronouncements Not Yet Adopted
Goodwill Impairment.
In January 2017, the Financial Accounting Standards Board (FASB) issued Accounting Standards Update (ASU) 2017-04,
Simplifying the Test for Goodwill Impairment
, which eliminates the requirement to calculate the implied fair value of goodwill to measure a goodwill impairment charge. Instead, impairment charges will be based on the first step in the two-step impairment test under Accounting Standards Codification (ASC) 350,
Intangibles - Goodwill and Other
. ASU 2017-04 is effective for us beginning January 1, 2020; early adoption is permitted for annual and interim goodwill impairment testing dates after January 1, 2017. We are evaluating the effect of this guidance.
Business Combinations.
In January 2017, the FASB issued ASU 2017-01,
Clarifying the Definition of a Business
, which changes the definition of a business to assist entities with evaluating when a set of transferred assets and activities is considered a business. ASU 2017-01 is effective for us beginning January 1, 2018, and interim periods thereafter on a prospective basis. Adoption of this guidance may be significant to us depending on the size and nature of potential future acquisitions. For future Health Plans segment acquisitions under which the fair value of the assets acquired is concentrated in a single identifiable asset, such as contract rights, the acquisitions will be recorded as asset acquisitions rather than business combinations. The chief difference between an asset acquisition and a business combination is that goodwill only arises in business combinations.
Molina Healthcare, Inc. 2016 Form 10-K | 77
Credit Losses.
In June 2016, the FASB issued ASU 2016-13,
Measurement of Credit Losses on Financial Instruments
. Rather than generally recognizing credit losses when it is probable that the loss has been incurred, the revised guidance requires companies to recognize an allowance for credit losses for the difference between the amortized cost basis of a financial instrument and the amount of amortized cost that the company expects to collect over the instrument’s contractual life. ASU 2016-13 is effective for us beginning January 1, 2020, and must be adopted as a cumulative effect adjustment to retained earnings; early adoption is permitted. We are evaluating the effect of this guidance.
Stock Compensation.
In March 2016, the FASB issued ASU 2016-09,
Improvements to Employee Share-Based Payment Accounting
, which amends ASC Topic 718,
Compensation – Stock Compensation
. ASU 2016-09 simplifies several aspects of accounting for employee share-based payment transactions, including the accounting for income taxes, forfeitures, statutory tax and classification in the statement of cash flows. We will adopt ASU 2016-09 in the first quarter of 2017. We are unable to quantify the impact of adoption, however, because such impact is dependent on future stock prices which cannot be predicted. However, we expect that adoption will not have a significant impact on net income, basic and diluted earnings per share, deferred tax assets and net cash from operations, or our effective tax rate.
Leases.
In February 2016, the FASB issued ASU 2016-02,
Leases (Topic 842),
as modified by ASU 2017-03,
Transition and Open Effective Date Information
. Under ASU 2016-02, an entity will be required to recognize assets and liabilities for the rights and obligations created by leases on the entity’s balance sheet for both finance and operating leases. For leases with a term of 12 months or less, an entity can elect to not recognize lease assets and lease liabilities and expense the lease over a straight-line basis for the term of the lease. ASU 2016-02 will require new disclosures that depict the amount, timing, and uncertainty of cash flows pertaining to an entity’s leases. ASU 2016-02 is effective for us beginning January 1, 2019 and must be adopted using a modified retrospective approach for annual and interim periods beginning after December 15, 2018. Early adoption is permitted. Under this guidance, we will record assets and liabilities relating primarily to our long-term office leases, and are currently evaluating the effect to our consolidated financial statements.
Revenue Recognition.
In May 2014, the FASB issued ASU 2014-09,
Revenue from Contracts with Customers (Topic 606)
, as modified by:
|
•
|
ASU 2015-14,
Deferral of the Effective Date
;
|
|
•
|
ASU 2016-08,
Principal versus Agent Considerations (Reporting Revenue Gross versus Net)
;
|
|
•
|
ASU 2016-10,
Identifying Performance Obligations and Licensing
;
|
|
•
|
ASU 2016-12,
Narrow-Scope Improvements and Practical Expedients
;
|
|
•
|
ASU 2016-20,
Technical corrections and improvements to Topic 606; and
|
|
•
|
ASU 2017-03,
Overall Transition and Open Effective Date Information
.
|
ASU 2014-09 will supersede existing revenue recognition standards with a single model unless those contracts are within the scope of other standards (e.g., an insurance entity’s insurance contracts). The new model requires an entity to recognize revenue to depict the transfer of goods or services to customers in an amount that reflects the consideration to which the entity expects to be entitled in exchange for those goods or services. In addition, new and enhanced disclosures will be required.
We have determined that our Health Plans segment, which comprises the vast majority of our operations, is excluded from the scope of ASU 2014-09, because the recognition of revenue under our Health Plans segment insurance contracts is dictated by other accounting standards governing insurers.
For our Molina Medicaid Solutions segment, we have determined that certain revenue and costs will no longer be deferred and recognized over the service delivery period. Rather, revenue will be recognized based on the expected cost plus gross margin method, and costs will be recognized as incurred. We are currently in the process of quantifying the impact to our consolidated financial position, results of operations, and cash flows.
Two adoption methods are permitted under ASU 2014-09. Under the full retrospective method, the financial statement adjustments are applied to each reporting period presented. Under the modified retrospective method, the cumulative effect of initially applying the guidance is reflected as an adjustment to beginning retained earnings as of the date of adoption. We intend to adopt this standard on January 1, 2018, using the modified retrospective approach.
Other recent accounting pronouncements issued by the FASB (including its Emerging Issues Task Force), the American Institute of Certified Public Accountants, and the Securities and Exchange Commission (SEC) did not
Molina Healthcare, Inc. 2016 Form 10-K | 78
have, or are not believed by management to have, a significant impact on our present or future consolidated financial statements.
Accounting Pronouncements Adopted
Short-Duration Contracts.
In the fourth quarter of 2016, we adopted ASU 2015-09,
Disclosures about Short-Duration Contracts
, which requires additional disclosure on the liability for unpaid claims and claim adjustment expenses. It requires additional disclosure only and had an insignificant impact to our consolidated financial statements. The new disclosures are reported in Note
11
, “
Medical Claims and Benefits Payable
.”
3
.
Net Income per Share
The following table sets forth the calculation of basic and diluted net income per share:
|
December 31,
|
|||||||||||
|
2016
|
2015
|
2014
|
|||||||||
|
(In millions, except net income per share)
|
|||||||||||
|
Numerator:
|
|||||||||||
|
Net income
|
$
|
52
|
|
$
|
143
|
|
$
|
62
|
|
||
|
Denominator:
|
|||||||||||
|
Shares outstanding at the beginning of the period
|
55
|
|
49
|
|
46
|
|
|||||
|
Weighted-average number of shares issued:
|
|||||||||||
|
Common stock offering
|
—
|
|
3
|
|
—
|
|
|||||
|
Convertible senior notes
|
—
|
|
—
|
|
1
|
|
|||||
|
Denominator for basic net income per share
|
55
|
|
52
|
|
47
|
|
|||||
|
Effect of dilutive securities:
|
|||||||||||
|
Share-based compensation
|
—
|
|
1
|
|
—
|
|
|||||
|
Convertible senior notes
(1)
|
—
|
|
1
|
|
1
|
|
|||||
|
1.125% Warrants
(1)
|
1
|
|
2
|
|
—
|
|
|||||
|
Denominator for diluted net income per share
|
56
|
|
56
|
|
48
|
|
|||||
|
Net income per share:
(2)
|
|||||||||||
|
Basic
|
$
|
0.93
|
|
$
|
2.75
|
|
$
|
1.33
|
|
||
|
Diluted
|
$
|
0.92
|
|
$
|
2.58
|
|
$
|
1.29
|
|
||
|
Potentially dilutive common shares excluded from calculations:
(3)
|
|||||||||||
|
1.125% Warrants
|
—
|
|
—
|
|
13
|
|
|||||
_______________________________
|
(1)
|
For more information regarding the convertible senior notes, refer to Note
12
, “
Debt
.” For more information regarding the 1.125% Warrants, refer to Note
15
, “
Stockholders' Equity
.”
|
|
(2)
|
Source data for calculations in thousands.
|
|
(3)
|
The dilutive effect of all potentially dilutive common shares is calculated using the treasury-stock method. Certain potentially dilutive common shares issuable are not included in the computation of diluted net income per share because to do so would be anti-dilutive. For the year ended December 31,
2014
, the 1.125% Warrants were excluded from diluted shares outstanding because the exercise price exceeded the average market price of our common stock.
|
Molina Healthcare, Inc. 2016 Form 10-K | 79
4
.
Business Combinations
Health Plans Segment
In 2016, we closed on several business combinations in the Health Plans segment, consistent with our strategy to grow in our existing markets and expand into new markets. For all of these transactions, we applied the acquisition method of accounting, where the total purchase price was allocated, or preliminarily allocated, to tangible and intangible assets acquired, and liabilities assumed, based on their respective fair values. For the Health Plans acquisitions described below, except New York, only intangible assets were acquired. All of the transactions were funded using available cash, and acquisition-related costs were insignificant.
The individual transactions were as follows:
Illinois.
On January 1, 2016, our Illinois health plan closed on its acquisition of the Medicaid membership, and certain assets related to the Medicaid business of, Accountable Care Chicago, LLC, also known as MyCare Chicago. The final purchase price was approximately
$30 million
, and the Illinois health plan added approximately
50,000
Medicaid members as a result of this transaction.
On January 1, 2016, our Illinois health plan closed on its acquisition of the Medicaid membership, and certain assets related to the Medicaid business, of Loyola Physician Partners, LLC. The final purchase price was approximately
$12 million
, and the Illinois health plan added approximately
18,000
Medicaid members as a result of this transaction.
On March 1, 2016, our Illinois health plan closed on its acquisition of the Medicaid membership, and certain assets related to the Medicaid business, of Better Health Network, LLC. The final purchase price was approximately
$15 million
, and the Illinois health plan added approximately
28,000
Medicaid members as a result of this transaction.
Michigan.
On January 1, 2016, our Michigan health plan closed on its acquisition of the Medicaid and MIChild membership, and certain Medicaid and MIChild assets, of HAP Midwest Health Plan, Inc. The final purchase price was approximately
$31 million
, and the Michigan health plan added approximately
68,000
Medicaid and MIChild members as a result of this transaction.
New York.
On August 1, 2016, we closed on our acquisition of the outstanding equity interests of Today’s Options of New York, Inc., which operates the Total Care Medicaid plan. The initial purchase price was approximately
$38 million
, and we now serve approximately
35,000
Medicaid members in upstate New York as a result of the transaction. The purchase price allocation was finalized, and final purchase price adjustments as provided in the stock purchase agreement were recorded, in the first quarter of 2017.
Washington.
On January 1, 2016, our Washington health plan closed on its acquisition of the Medicaid contracts, and certain assets related to the operation of the Medicaid business, of Columbia United Providers, Inc. The final purchase price was approximately
$28 million
, and the Washington health plan added approximately
57,000
Medicaid members as a result of this transaction.
For these acquisitions, we recorded goodwill to the Health Plans segment amounting to
$96 million
in the aggregate, which relates to future economic benefits arising from expected synergies to be achieved. Such synergies include use of our existing infrastructure to support the added membership. In general, the amount recorded as goodwill is deductible for income tax purposes.
For the transactions that closed on January 1, 2016 (a holiday), approximately
$101 million
of the purchase price consideration was funded to the sellers in December 2015, and was recorded to prepaid expenses and other assets as of December 31, 2015. Such amounts were reported in investing activities in the accompanying consolidated statements of cash flows for the year ended December 31, 2015.
Molina Healthcare, Inc. 2016 Form 10-K | 80
The following table presents the intangible assets identified in the transactions described above. The weighted-average amortization period, in the aggregate, is
5.7 years
.
|
Fair Value
|
Life
|
||||
|
(In millions)
|
(Years)
|
||||
|
Intangible asset type:
|
|||||
|
Contract rights - member list
|
$
|
38
|
|
5
|
|
|
Provider network
|
7
|
|
10
|
||
|
$
|
45
|
|
|||
Other Segment
Pathways.
On November 1, 2015, we acquired the outstanding ownership interests in Pathways Health and Community Support LLC (Pathways). In 2016, we recorded a pre-acquisition contingent liability and corresponding indemnification asset in the amount of
$14 million
in connection with the Rodriguez Litigation matter defined and described further in Note
19
, “
Commitments and Contingencies
.” Also in 2016, certain tax elections were made such that approximately
50%
of the goodwill recorded in this transaction is deductible for income tax purposes. In the fourth quarter of 2016, the purchase price allocation was finalized, which included a
$5 million
increase to goodwill primarily in connection with certain tax-related gross-up payments.
5
.
Fair Value Measurements
We consider the carrying amounts of cash and cash equivalents and other current assets and current liabilities (not including derivatives and the current portion of long-term debt) to approximate their fair values because of the relatively short period of time between the origination of these instruments and their expected realization or payment. For our financial instruments measured at fair value on a recurring basis, we prioritize the inputs used in measuring fair value according to a three-tier fair value hierarchy as follows:
Level 1 — Observable Inputs.
Level 1 financial instruments are actively traded and therefore the fair value for these securities is based on quoted market prices on one or more securities exchanges.
Level 2 — Directly or Indirectly Observable Inputs.
Level 2 financial instruments are traded frequently though not necessarily daily. Fair value for these investments is determined using a market approach based on quoted prices for similar securities in active markets or quoted prices for identical securities in inactive markets.
Level 3 — Unobservable Inputs.
Level 3 financial instruments are valued using unobservable inputs that represent management’s best estimate of what market participants would use in pricing the financial instrument at the measurement date. Our Level 3 financial instruments include derivative financial instruments.
Derivative financial instruments include the
1.125%
Call Option derivative asset and the 1.125% Conversion Option derivative liability. These derivatives are not actively traded and are valued based on an option pricing model that uses observable and unobservable market data for inputs. Significant market data inputs used to determine fair value as of
December 31, 2016
included the price of our common stock, the time to maturity of the derivative instruments, the risk-free interest rate, and the implied volatility of our common stock. As described further in Note
13
, “
Derivatives
,” the 1.125% Call Option asset and the 1.125% Conversion Option liability were designed such that changes in their fair values offset, with minimal impact to the consolidated statements of income. Therefore, the sensitivity of changes in the unobservable inputs to the option pricing model for such instruments is mitigated.
The net changes in fair value of Level 3 financial instruments were insignificant to our results of operations for the year ended
December 31, 2016
.
Molina Healthcare, Inc. 2016 Form 10-K | 81
Our financial instruments measured at fair value on a recurring basis at
December 31, 2016
, were as follows:
|
Total
|
Level 1
|
Level 2
|
Level 3
|
||||||||||||
|
|
(In millions)
|
||||||||||||||
|
Corporate debt securities
|
$
|
1,179
|
|
$
|
—
|
|
$
|
1,179
|
|
$
|
—
|
|
|||
|
Government-sponsored enterprise securities (GSEs)
|
231
|
|
231
|
|
—
|
|
—
|
|
|||||||
|
Municipal securities
|
142
|
|
—
|
|
142
|
|
—
|
|
|||||||
|
U.S. treasury notes
|
84
|
|
84
|
|
—
|
|
—
|
|
|||||||
|
Asset-backed securities
|
69
|
|
—
|
|
69
|
|
—
|
|
|||||||
|
Certificates of deposit
|
53
|
|
—
|
|
53
|
|
—
|
|
|||||||
|
Subtotal - current investments
|
1,758
|
|
315
|
|
1,443
|
|
—
|
|
|||||||
|
1.125% Call Option derivative asset
|
267
|
|
—
|
|
—
|
|
267
|
|
|||||||
|
Total assets measured at fair value on a recurring basis
|
$
|
2,025
|
|
$
|
315
|
|
$
|
1,443
|
|
$
|
267
|
|
|||
|
1.125% Conversion Option derivative liability
|
$
|
267
|
|
$
|
—
|
|
$
|
—
|
|
$
|
267
|
|
|||
|
Total liabilities measured at fair value on a recurring basis
|
$
|
267
|
|
$
|
—
|
|
$
|
—
|
|
$
|
267
|
|
|||
Our financial instruments measured at fair value on a recurring basis at
December 31, 2015
, were as follows:
|
Total
|
Level 1
|
Level 2
|
Level 3
|
||||||||||||
|
|
(In millions)
|
||||||||||||||
|
Corporate debt securities
|
$
|
1,184
|
|
$
|
—
|
|
$
|
1,184
|
|
$
|
—
|
|
|||
|
GSEs
|
211
|
|
211
|
|
—
|
|
—
|
|
|||||||
|
Municipal securities
|
185
|
|
—
|
|
185
|
|
—
|
|
|||||||
|
U.S. treasury notes
|
78
|
|
78
|
|
—
|
|
—
|
|
|||||||
|
Asset-backed securities
|
63
|
|
—
|
|
63
|
|
—
|
|
|||||||
|
Certificates of deposit
|
80
|
|
—
|
|
80
|
|
—
|
|
|||||||
|
Subtotal - current investments
|
1,801
|
|
289
|
|
1,512
|
|
—
|
|
|||||||
|
1.125% Call Option derivative asset
|
374
|
|
—
|
|
—
|
|
374
|
|
|||||||
|
Total assets measured at fair value on a recurring basis
|
$
|
2,175
|
|
$
|
289
|
|
$
|
1,512
|
|
$
|
374
|
|
|||
|
1.125% Conversion Option derivative liability
|
$
|
374
|
|
$
|
—
|
|
$
|
—
|
|
$
|
374
|
|
|||
|
Total liabilities measured at fair value on a recurring basis
|
$
|
374
|
|
$
|
—
|
|
$
|
—
|
|
$
|
374
|
|
|||
Fair Value Measurements – Disclosure Only
The carrying amounts and estimated fair values of our senior notes, which are classified as Level 2 financial instruments, are indicated in the following table.
|
|
December 31, 2016
|
December 31, 2015
|
|||||||||||||
|
|
Carrying
|
Fair Value
|
Carrying
|
Fair Value
|
|||||||||||
|
|
Value
|
Value
|
|||||||||||||
|
|
(In millions)
|
||||||||||||||
|
5.375% Notes
|
$
|
691
|
|
$
|
714
|
|
$
|
689
|
|
$
|
700
|
|
|||
|
1.125% Convertible Notes
|
471
|
|
792
|
|
448
|
|
865
|
|
|||||||
|
1.625% Convertible Notes
|
284
|
|
344
|
|
273
|
|
365
|
|
|||||||
|
|
$
|
1,446
|
|
$
|
1,850
|
|
$
|
1,410
|
|
$
|
1,930
|
|
|||
Molina Healthcare, Inc. 2016 Form 10-K | 82
6
.
Investments
The following tables summarize our investments as of the dates indicated:
|
December 31, 2016
|
|||||||||||||||
|
Amortized
|
Gross
Unrealized
|
Estimated
|
|||||||||||||
|
Cost
|
Gains
|
Losses
|
Fair Value
|
||||||||||||
|
(In millions)
|
|||||||||||||||
|
Corporate debt securities
|
$
|
1,180
|
|
$
|
1
|
|
$
|
2
|
|
$
|
1,179
|
|
|||
|
GSEs
|
232
|
|
—
|
|
1
|
|
231
|
|
|||||||
|
Municipal securities
|
143
|
|
—
|
|
1
|
|
142
|
|
|||||||
|
U.S. treasury notes
|
84
|
|
—
|
|
—
|
|
84
|
|
|||||||
|
Asset-backed securities
|
69
|
|
—
|
|
—
|
|
69
|
|
|||||||
|
Certificates of deposit
|
53
|
|
—
|
|
—
|
|
53
|
|
|||||||
|
$
|
1,761
|
|
$
|
1
|
|
$
|
4
|
|
$
|
1,758
|
|
||||
|
December 31, 2015
|
|||||||||||||||
|
Amortized Cost
|
Gross
Unrealized
|
Estimated Fair Value
|
|||||||||||||
|
Gains
|
Losses
|
||||||||||||||
|
(In millions)
|
|||||||||||||||
|
Corporate debt securities
|
$
|
1,189
|
|
$
|
—
|
|
$
|
5
|
|
$
|
1,184
|
|
|||
|
GSEs
|
212
|
|
—
|
|
1
|
|
211
|
|
|||||||
|
Municipal securities
|
186
|
|
—
|
|
1
|
|
185
|
|
|||||||
|
U.S. treasury notes
|
78
|
|
—
|
|
—
|
|
78
|
|
|||||||
|
Asset-backed securities
|
63
|
|
—
|
|
—
|
|
63
|
|
|||||||
|
Certificates of deposit
|
80
|
|
—
|
|
—
|
|
80
|
|
|||||||
|
$
|
1,808
|
|
$
|
—
|
|
$
|
7
|
|
$
|
1,801
|
|
||||
The contractual maturities of our investments as of
December 31, 2016
are summarized below:
|
Amortized
Cost
|
Estimated
Fair Value
|
||||||
|
(In millions)
|
|||||||
|
Due in one year or less
|
$
|
930
|
|
$
|
930
|
|
|
|
Due after one year through five years
|
806
|
|
803
|
|
|||
|
Due after five years through ten years
|
25
|
|
25
|
|
|||
|
$
|
1,761
|
|
$
|
1,758
|
|
||
Gross realized gains and losses from sales of available-for-sale securities are calculated under the specific identification method and are included in investment income. Gross realized investment gains and losses for the years ended
December 31, 2016
,
2015
and
2014
were insignificant.
We have determined that unrealized gains and losses at
December 31, 2016
and
2015
are temporary in nature, because the change in market value for these securities resulted from fluctuating interest rates, rather than a deterioration of the creditworthiness of the issuers. So long as we maintain the intent and ability to hold these securities to maturity, we are unlikely to experience gains or losses. In the event that we dispose of these securities before maturity, we expect that realized gains or losses, if any, will be insignificant.
Molina Healthcare, Inc. 2016 Form 10-K | 83
The following table segregates those available-for-sale investments that have been in a continuous loss position for less than 12 months, and those that have been in a loss position for 12 months or more as of
December 31, 2016
.
|
In a Continuous Loss Position
for Less than 12 Months
|
In a Continuous Loss Position
for 12 Months or More
|
||||||||||||||||||||
|
Estimated
Fair
Value
|
Unrealized
Losses
|
Total Number of Positions
|
Estimated
Fair
Value
|
Unrealized
Losses
|
Total Number of Positions
|
||||||||||||||||
|
|
(Dollars in millions)
|
||||||||||||||||||||
|
Corporate debt securities
|
$
|
542
|
|
$
|
2
|
|
378
|
|
$
|
—
|
|
$
|
—
|
|
—
|
|
|||||
|
GSEs
|
198
|
|
1
|
|
73
|
|
—
|
|
—
|
|
—
|
|
|||||||||
|
Municipal securities
|
101
|
|
1
|
|
129
|
|
—
|
|
—
|
|
—
|
|
|||||||||
|
$
|
841
|
|
$
|
4
|
|
580
|
|
$
|
—
|
|
$
|
—
|
|
—
|
|
||||||
The following table segregates those available-for-sale investments that have been in a continuous loss position for less than 12 months, and those that have been in a loss position for 12 months or more as of
December 31, 2015
.
|
In a Continuous Loss Position
for Less than 12 Months
|
In a Continuous Loss Position
for 12 Months or More
|
||||||||||||||||||||
|
Estimated
Fair
Value
|
Unrealized
Losses
|
Total Number of Positions
|
Estimated
Fair
Value
|
Unrealized
Losses
|
Total Number of Positions
|
||||||||||||||||
|
|
(Dollars in millions)
|
||||||||||||||||||||
|
Corporate debt securities
|
$
|
825
|
|
$
|
4
|
|
588
|
|
$
|
119
|
|
$
|
1
|
|
87
|
|
|||||
|
GSEs
|
182
|
|
1
|
|
77
|
|
—
|
|
—
|
|
—
|
|
|||||||||
|
Municipal securities
|
128
|
|
1
|
|
181
|
|
—
|
|
—
|
|
—
|
|
|||||||||
|
$
|
1,135
|
|
$
|
6
|
|
846
|
|
$
|
119
|
|
$
|
1
|
|
87
|
|
||||||
Molina Healthcare, Inc. 2016 Form 10-K | 84
7
.
Receivables
Receivables consist primarily of amounts due from government Medicaid agencies, which may be subject to potential retroactive adjustments. Because all of our receivable amounts are readily determinable and substantially all of our creditors are governmental authorities, our allowance for doubtful accounts is insignificant. Any amounts determined to be uncollectible are charged to expense when such determination is made. The information below is presented by segment.
|
December 31,
|
|||||||
|
2016
|
2015
|
||||||
|
(In millions)
|
|||||||
|
California
|
$
|
180
|
|
$
|
104
|
|
|
|
Florida
|
97
|
|
22
|
|
|||
|
Illinois
|
134
|
|
35
|
|
|||
|
Michigan
|
60
|
|
39
|
|
|||
|
New Mexico
|
57
|
|
51
|
|
|||
|
New York
|
26
|
|
—
|
|
|||
|
Ohio
|
82
|
|
66
|
|
|||
|
Puerto Rico
|
37
|
|
33
|
|
|||
|
South Carolina
|
11
|
|
6
|
|
|||
|
Texas
|
79
|
|
56
|
|
|||
|
Utah
|
19
|
|
18
|
|
|||
|
Washington
|
71
|
|
53
|
|
|||
|
Wisconsin
|
33
|
|
22
|
|
|||
|
Direct delivery and other
|
1
|
|
6
|
|
|||
|
Total Health Plans segment
|
887
|
|
511
|
|
|||
|
Molina Medicaid Solutions segment
|
34
|
|
37
|
|
|||
|
Other segment
|
53
|
|
49
|
|
|||
|
$
|
974
|
|
$
|
597
|
|
||
8
.
Property, Equipment, and Capitalized Software
Property and equipment are stated at historical cost. Replacements and major improvements are capitalized, and repairs and maintenance are charged to expense as incurred. Furniture and equipment are generally depreciated using the straight-line method over estimated useful lives ranging from
three
to
seven
years. Software developed for internal use is capitalized. Software is generally amortized over its estimated useful life of
three
years. Leasehold improvements are amortized over the term of the lease, or over their useful lives from
five
to
10
years, whichever is shorter. Buildings are depreciated over their estimated useful lives of
31.5
to
40
years.
The costs associated with certain of our Molina Medicaid Solutions segment equipment and software are capitalized and recorded as deferred contract costs. Such costs are amortized on a straight-line basis over the shorter of the useful life or the contract period, and the amortization is recorded within the heading “Cost of service revenue.”
Molina Healthcare, Inc. 2016 Form 10-K | 85
A summary of property, equipment, and capitalized software is as follows:
|
|
December 31,
|
||||||
|
|
2016
|
2015
|
|||||
|
|
(In millions)
|
||||||
|
Capitalized software
|
$
|
443
|
|
$
|
336
|
|
|
|
Furniture and equipment
|
301
|
|
250
|
|
|||
|
Building and improvements
|
159
|
|
153
|
|
|||
|
Land
|
16
|
|
16
|
|
|||
|
919
|
|
755
|
|
||||
|
Less: accumulated amortization for capitalized software
|
(259
|
)
|
(195
|
)
|
|||
|
Less: accumulated depreciation and amortization on building and improvements, furniture and equipment
|
(206
|
)
|
(167
|
)
|
|||
|
(465
|
)
|
(362
|
)
|
||||
|
Property, equipment, and capitalized software, net
|
$
|
454
|
|
$
|
393
|
|
|
The following table presents all depreciation and amortization recorded in our consolidated statements of income, regardless of whether the item appears as depreciation and amortization, or as cost of service revenue.
|
Year Ended December 31,
|
|||||||||||
|
2016
|
2015
|
2014
|
|||||||||
|
(In millions)
|
|||||||||||
|
Recorded in depreciation and amortization:
|
|||||||||||
|
Amortization of capitalized software
|
$
|
62
|
|
$
|
37
|
|
$
|
41
|
|
||
|
Depreciation of property and equipment
|
45
|
|
50
|
|
34
|
|
|||||
|
Amortization of intangible assets
|
32
|
|
17
|
|
18
|
|
|||||
|
139
|
|
104
|
|
93
|
|
||||||
|
Recorded in cost of service revenue:
|
|||||||||||
|
Amortization of capitalized software
|
22
|
|
15
|
|
18
|
|
|||||
|
Amortization of deferred contract costs
|
21
|
|
6
|
|
20
|
|
|||||
|
43
|
|
21
|
|
38
|
|
||||||
|
Other
|
—
|
|
1
|
|
3
|
|
|||||
|
$
|
182
|
|
$
|
126
|
|
$
|
134
|
|
|||
Molina Center.
In 2011, we acquired two coterminous office buildings in Long Beach, California, known as the Molina Center. In 2013, we entered into a sale-leaseback transaction for the Molina Center. Due to our continuing involvement with the leased property, the sale did not qualify for sales recognition and we remain the “accounting owner” of the property. For further information, see Note
12
, “
Debt
.” Sublease income from third party tenants of the Molina Center is reported as investment income and other revenue in our consolidated statements of income. As of December 31, 2016, future sublease income was insignificant.
9
.
Goodwill and Intangible Assets
Goodwill represents the excess of the purchase price over the fair value of net assets acquired in business combinations.
Goodwill is not amortized, but is subject to an annual impairment test. We are required to test at least annually for impairment, or more frequently if adverse events or changes in circumstances indicate that the asset may be impaired.
When testing goodwill for impairment, we may first assess qualitative factors, such as industry and market factors, cost factors, and changes in overall performance, to determine if it is more likely than not that the carrying value of a reporting unit exceeds its estimated fair value. If our qualitative assessment indicates that goodwill impairment is more likely than not, we perform additional quantitative analysis. We may also elect to skip the qualitative testing and proceed directly to the quantitative testing.
Under the quantitative test we first measure the fair values of our reporting units and compare them to the carrying values of the respective units, including goodwill. Second, if the fair value is less than the carrying value of the
Molina Healthcare, Inc. 2016 Form 10-K | 86
reporting unit, then the implied value of goodwill would be calculated and compared with the carrying amount of goodwill to determine the impairment charge, if any.
We estimate the fair values of our reporting units using discounted cash flows.
In the discounted cash flow analyses, we must make assumptions about a wide variety of internal and external factors. Significant assumptions include financial projections of free cash flow (including significant assumptions about operations, capital requirements and income taxes), long-term growth rates for determining terminal value beyond the discretely forecasted periods, and discount rates.
No
impairment charges relating to goodwill were recorded in the years ended
December 31, 2016
,
2015
, and
2014
.
The following table presents the balances of goodwill as of
December 31, 2016
and
2015
. The Health Plans segment addition relates to the business combinations described in Note
4
, “
Business Combinations
.” The Other segment addition relates to the final purchase price allocation adjustments for our Pathways acquisition in 2015.
|
Health Plans
|
Molina Medicaid Solutions
|
Other
|
Total
|
||||||||||||
|
(In millions)
|
|||||||||||||||
|
Historical goodwill
|
$
|
349
|
|
$
|
71
|
|
$
|
157
|
|
$
|
577
|
|
|||
|
Accumulated impairment losses
|
(58
|
)
|
—
|
|
—
|
|
(58
|
)
|
|||||||
|
Balance, December 31, 2015
|
291
|
|
71
|
|
157
|
|
519
|
|
|||||||
|
Acquisitions
|
96
|
|
—
|
|
—
|
|
96
|
|
|||||||
|
Purchase price allocation adjustments
|
—
|
|
—
|
|
5
|
|
5
|
|
|||||||
|
Balance at December 31, 2016
|
$
|
387
|
|
$
|
71
|
|
$
|
162
|
|
$
|
620
|
|
|||
Intangible Assets.
Finite-lived, separately-identified intangible assets acquired in business combinations are assets that represent future expected benefits but lack physical substance (such as purchased contract rights and provider contracts).
Intangible assets are initially recorded at fair value and are then amortized on a straight-line basis over their expected useful lives, generally between
two
and
15
years.
Our intangible assets are subject to impairment tests when events or circumstances indicate that a finite-lived intangible asset’s (or asset group’s) carrying value may not be recoverable.
Consideration is given to a number of potential impairment indicators. For example, our health plan subsidiaries have generally been successful in obtaining the renewal by amendment of their contracts in each state prior to the actual expiration of their contracts. However, there can be no assurance that these contracts will continue to be renewed.
Following the identification of any potential impairment indicators, to determine whether an impairment exists, we would compare the carrying amount of a finite-lived intangible asset with the undiscounted cash flows that are expected to result from the use of the asset or related group of assets.
If it is determined that the carrying amount of the asset is not recoverable, the amount by which the carrying value exceeds the estimated fair value is recorded as an impairment.
No significant impairment charges relating to long-lived assets, including intangible assets, were recorded in the years ended
December 31, 2016
,
2015
, and
2014
.
Based on the balances of our identifiable intangible assets as of
December 31, 2016
, we estimate that our intangible asset amortization will be
$35 million
in
2017
,
$33 million
in
2018
,
$27 million
in
2019
,
$19 million
in
2020
, and
$8 million
in
2021
. For a presentation of our goodwill and intangible assets by reportable segment, refer to Note
20
, “
Segment Information
.”
Molina Healthcare, Inc. 2016 Form 10-K | 87
The following table provides the details of identified intangible assets, by major class, for the periods indicated:
|
Cost
|
Accumulated
Amortization
|
Carrying Amount
|
|||||||||
|
|
(In millions)
|
||||||||||
|
Intangible assets:
|
|||||||||||
|
Contract rights and licenses
|
$
|
267
|
|
$
|
148
|
|
$
|
119
|
|
||
|
Customer relationships
|
25
|
|
24
|
|
1
|
|
|||||
|
Provider networks
|
34
|
|
14
|
|
20
|
|
|||||
|
Balance at December 31, 2016
|
$
|
326
|
|
$
|
186
|
|
$
|
140
|
|
||
|
Intangible assets:
|
|||||||||||
|
Contract rights and licenses
|
$
|
224
|
|
$
|
120
|
|
$
|
104
|
|
||
|
Customer relationships
|
25
|
|
23
|
|
2
|
|
|||||
|
Provider networks
|
27
|
|
11
|
|
16
|
|
|||||
|
Balance at December 31, 2015
|
$
|
276
|
|
$
|
154
|
|
$
|
122
|
|
||
The changes in the carrying amounts of goodwill and intangible assets, at cost, in
2016
were due to the acquisitions described in Note
4
, “
Business Combinations
.”
10
.
Restricted Investments
Pursuant to the regulations governing our Health Plans segment subsidiaries, we maintain statutory deposits and deposits required by government authorities primarily in certificates of deposit and U.S. treasury securities. We also maintain restricted investments as protection against the insolvency of certain capitated providers. The use of these funds is limited to specific purposes as required by regulation in the various states in which we operate, or as protection against the insolvency of capitated providers. We have the ability to hold our restricted investments until maturity, and as a result, we would not expect the value of these investments to decline significantly due to a sudden change in market interest rates. The following table presents the balances of restricted investments:
|
December 31,
|
|||||||
|
2016
|
2015
|
||||||
|
(In millions)
|
|||||||
|
Florida
|
$
|
22
|
|
$
|
34
|
|
|
|
Illinois
|
3
|
|
—
|
|
|||
|
Michigan
|
1
|
|
1
|
|
|||
|
New Mexico
|
43
|
|
43
|
|
|||
|
New York
|
9
|
|
—
|
|
|||
|
Ohio
|
12
|
|
12
|
|
|||
|
Puerto Rico
|
10
|
|
10
|
|
|||
|
Texas
|
4
|
|
4
|
|
|||
|
Utah
|
4
|
|
4
|
|
|||
|
Wisconsin
|
1
|
|
1
|
|
|||
|
Other
|
1
|
|
—
|
|
|||
|
Total Health Plans segment
|
$
|
110
|
|
$
|
109
|
|
|
Molina Healthcare, Inc. 2016 Form 10-K | 88
The contractual maturities of our restricted investments, which are designated as held-to-maturity and are carried at amortized cost, which approximates fair value, as of
December 31, 2016
are summarized below.
|
Amortized
Cost
|
Estimated
Fair Value
|
||||||
|
(In millions)
|
|||||||
|
Due in one year or less
|
$
|
100
|
|
$
|
100
|
|
|
|
Due after one year through five years
|
10
|
|
10
|
|
|||
|
$
|
110
|
|
$
|
110
|
|
||
11
.
Medical Claims and Benefits Payable
The following table provides the details of our medical claims and benefits payable (including amounts payable for the provision of long-term services and supports, or LTSS) as of the dates indicated.
|
December 31,
|
|||||||||||
|
2016
|
2015
|
2014
|
|||||||||
|
(In millions)
|
|||||||||||
|
Fee-for-service claims incurred but not paid (IBNP)
|
$
|
1,352
|
|
$
|
1,191
|
|
$
|
871
|
|
||
|
Pharmacy payable
|
112
|
|
88
|
|
71
|
|
|||||
|
Capitation payable
|
37
|
|
140
|
|
28
|
|
|||||
|
Other
|
428
|
|
266
|
|
231
|
|
|||||
|
$
|
1,929
|
|
$
|
1,685
|
|
$
|
1,201
|
|
|||
“Other” medical claims and benefits payable include amounts payable to certain providers for which we act as an intermediary on behalf of various government agencies without assuming financial risk. Such receipts and payments do not impact our consolidated statements of income. Non-risk provider payables amounted to
$225 million
,
$167 million
and
$119 million
, as of
December 31, 2016
,
2015
and
2014
, respectively.
The following table presents the components of the change in our medical claims and benefits payable for the periods indicated. The amounts presented for “Components of medical care costs related to: Prior periods” represent the amount by which our original estimate of medical claims and benefits payable at the beginning of the period were more than the actual amount of the liability based on information (principally the payment of claims) developed since that liability was first reported.
|
Year Ended December 31,
|
|||||||||||
|
2016
|
2015
|
2014
|
|||||||||
|
(In millions)
|
|||||||||||
|
Medical claims and benefits payable, beginning balance
|
$
|
1,685
|
|
$
|
1,201
|
|
$
|
670
|
|
||
|
Components of medical care costs related to:
|
|||||||||||
|
Current period
|
14,966
|
|
11,935
|
|
8,123
|
|
|||||
|
Prior periods
|
(192
|
)
|
(141
|
)
|
(46
|
)
|
|||||
|
Total medical care costs
|
14,774
|
|
11,794
|
|
8,077
|
|
|||||
|
Change in non-risk provider payables
|
58
|
|
48
|
|
(32
|
)
|
|||||
|
Payments for medical care costs related to:
|
|||||||||||
|
Current period
|
13,304
|
|
10,448
|
|
7,064
|
|
|||||
|
Prior periods
|
1,284
|
|
910
|
|
450
|
|
|||||
|
Total paid
|
14,588
|
|
11,358
|
|
7,514
|
|
|||||
|
Medical claims and benefits payable, ending balance
|
$
|
1,929
|
|
$
|
1,685
|
|
$
|
1,201
|
|
||
Reinsurance recoverables of
$61 million
,
$46 million
, and
$9 million
, as of December 31, 2016, 2015, and 2014, respectively, are included in receivables.
Molina Healthcare, Inc. 2016 Form 10-K | 89
The following tables provide information about incurred and paid claims development as of
December 31, 2016
, as well as cumulative claims frequency and the total of incurred but not paid claims liabilities. The information is inclusive of the New York health plan we acquired in 2016. The cumulative claim frequency is measured by claim event, and includes claims covered under capitated arrangements.
|
Incurred Claims and Allocated Claims Adjustment Expenses
|
Total IBNP
|
Cumulative number of reported claims
|
|||||||||||||||||
|
Benefit Year
|
2014
(1)
|
2015
(1)
|
2016
|
||||||||||||||||
|
(In millions)
|
|||||||||||||||||||
|
2014
|
$
|
8,284
|
|
$
|
8,139
|
|
$
|
8,138
|
|
$
|
3
|
|
57
|
|
|||||
|
2015
|
12,113
|
|
11,928
|
|
22
|
|
83
|
|
|||||||||||
|
2016
|
15,064
|
|
1,327
|
|
102
|
|
|||||||||||||
|
$
|
35,130
|
|
$
|
1,352
|
|
||||||||||||||
|
Cumulative Paid Claims and Allocated Claims Adjustment Expenses
|
|||||||||||||
|
Benefit Year
|
2014
(1)
|
2015
(1)
|
2016
|
||||||||||
|
(In millions)
|
|||||||||||||
|
2014
|
$
|
7,220
|
|
$
|
8,123
|
|
$
|
8,135
|
|
||||
|
2015
|
10,615
|
|
11,906
|
|
|||||||||
|
2016
|
13,403
|
|
|||||||||||
|
$
|
33,444
|
|
|||||||||||
The following table represents a reconciliation of claims development to the aggregate carrying amount of the liability for medical claims and benefits payable.
|
2016
|
|||||||||
|
(In millions)
|
|||||||||
|
Incurred claims and allocated claims adjustment expenses
|
$
|
35,130
|
|
||||||
|
Less: cumulative paid clams and allocated claims adjustment expenses
|
(33,444
|
)
|
|||||||
|
Non-risk provider payables and other
|
243
|
|
|||||||
|
Medical claims and benefits payable
|
$
|
1,929
|
|
||||||
_______________________________
|
(1)
|
Data presented for these calendar years is required supplementary information, which is unaudited.
|
That portion of our total medical claims and benefits payable liability that is most subject to variability in the estimate is IBNP. Our IBNP, as included in medical claims and benefits payable, represents our best estimate of the total amount of claims we will ultimately pay with respect to claims that we have incurred as of the balance sheet date. We estimate our IBNP monthly using actuarial methods based on a number of factors.
Assuming that our initial estimate of IBNP is accurate, we believe that amounts ultimately paid would generally be between
8%
and
10%
less than the IBNP liability recorded at the end of the period as a result of the inclusion in that liability of the provision for adverse claims deviation and the accrued cost of settling those claims. Because the amount of our initial liability is merely an estimate (and therefore not perfectly accurate), we will always experience variability in that estimate as new information becomes available with the passage of time. Therefore, there can be no assurance that amounts ultimately paid out will fall within the range of 8% to 10% lower than the liability that was initially recorded. Furthermore, because our initial estimate of IBNP is derived from many factors, some of which are qualitative in nature rather than quantitative, we are seldom able to assign specific values to the reasons for a change in estimate—we only know when the circumstances for any one or more factors are out of the ordinary.
The use of a consistent methodology in estimating our liability for medical claims and benefits payable minimizes the degree to which the under– or overestimation of that liability at the close of one period may affect consolidated results of operations in subsequent periods. In particular, the use of a consistent methodology should result in the replenishment of reserves during any given period in a manner that generally offsets the benefit of favorable prior period development in that period. Facts and circumstances unique to the estimation process at any single date, however, may still lead to a material impact on consolidated results of operations in subsequent periods. Any
Molina Healthcare, Inc. 2016 Form 10-K | 90
absence of adverse claims development (as well as the expensing through general and administrative expense of the costs to settle claims held at the start of the period) will lead to the recognition of a benefit from prior period claims development in the period subsequent to the date of the original estimate.
As indicated above, the amounts ultimately paid out on our medical claims and benefits payable liabilities in
2016
,
2015
, and
2014
were less than what we had expected when we had established those liabilities. The differences between our original estimates and the amounts ultimately paid out (or now expected to be ultimately paid out) for the most part related to IBNP. While many related factors working in conjunction with one another serve to determine the accuracy of our estimates, we are seldom able to quantify the impact that any single factor has on a change in estimate. In addition, given the variability inherent in the reserving process, we will only be able to identify specific factors if they represent a significant departure from expectations. As a result, we do not expect to be able to fully quantify the impact of individual factors on changes in estimates.
2016
We believe that the most significant uncertainties relating to our IBNP estimates at
December 31, 2016
are as follows:
|
•
|
Our New York health plan acquisition closed on August 1, 2016, which added approximately
35,000
new members. Because these members are new to Molina and we have little insight into their claims history, our estimates of the liability we have incurred for services provided to these members are subject to more than the usual amount of uncertainty.
|
|
•
|
At our Florida, New Mexico, Puerto Rico, Utah and Washington health plans, we overpaid certain inpatient and outpatient facility claims. We adjusted our claims payment history to reflect the claims payment pattern that would have occurred without these overpayments. For this reason, our liability estimates for these health plans are subject to more than the usual amount of uncertainty.
|
|
•
|
Fluctuations in the volume of claims received in a paper format (rather than an electronic format) during the third quarter of 2016 have created more than the usual amount of uncertainty regarding our estimate of the liability for our California health plan.
|
|
•
|
At our Illinois health plan, certain claims with dates of service in 2014 and 2015 were paid in December 2016. Because of these claims with unusually old dates of service, our liability estimate for the Illinois health plan is subject to more than the usual amount of uncertainty.
|
We recognized favorable prior period claims development in the amount of
$192 million
for the year ended
December 31, 2016
. This amount represents our estimate, as of
December 31, 2016
, of the extent to which our initial estimate of medical claims and benefits payable at
December 31, 2015
was more than the amount that will ultimately be paid out in satisfaction of that liability. We believe the overestimation was due primarily to the following factors:
|
•
|
A new version of diagnostic codes was required for all claims with dates of service on October 1, 2015, and later. As a result, payment was delayed or denied for a significant number of claims due to provider submission of claims with diagnostic codes that were no longer valid. Once providers were able to submit claims with the correct diagnostic codes, our actual costs were ultimately less than expected.
|
|
•
|
At our New Mexico health plan, we overestimated the impact of several pending high-dollar claims, and our actual costs were ultimately less than expected.
|
|
•
|
At our Washington health plan, we overpaid certain outpatient facility claims in 2015 when the state converted to a new payment methodology. We did not include an estimate in our December 31, 2015 reserves for this potential recovery.
|
|
•
|
At our California health plan, we enrolled approximately
55,000
new Medicaid Expansion members in 2015. For these new members, our actual costs were ultimately less than expected.
|
2015
We recognized favorable prior period claims development in the amount of
$141 million
for the year ended
December 31, 2015
. This amount represented our estimate as of
December 31, 2015
, of the extent to which our initial estimate of medical claims and benefits payable at
December 31, 2014
was more than the amount that was ultimately paid out in satisfaction of that liability. We believe the overestimation was due primarily to the following factors:
Molina Healthcare, Inc. 2016 Form 10-K | 91
|
•
|
At our Ohio and California health plans, approximately
61,000
and
100,000
members, respectively, were enrolled in the new Medicaid expansion program during 2014. Also in Ohio, approximately
17,000
members were enrolled in the new MMP program in 2014. Because we lacked sufficient historical claims data, we initially estimated the reserves for these new members based upon a number of factors that included pricing assumptions provided by the state; our expectations regarding pent up demand; our beliefs about the speed at which new members would utilize health care services; and other factors. Our actual costs were ultimately less than expected.
|
|
•
|
At our New Mexico health plan, the state implemented a retroactive increase to the provider fee schedules in mid-2014. As a result, many claims that were previously settled were reopened, and subject to, additional payment. Because our reserving methodology is most accurate when claims payment patterns are consistent and predictable, the payment of additional amounts on claims that in some cases had been settled more than six months before added a substantial degree of complexity to our liability estimation process. Due to the difficulties in addressing that added complexity, liabilities recorded as of December 31, 2014 were in excess of amounts ultimately paid.
|
|
•
|
At our Washington health plan, we collected amounts in 2015 related to certain claims paid in 2013. Such collections were not anticipated in our reserves as of December 31, 2014.
|
2014
We recognized favorable prior period claims development in the amount of
$46 million
for the year ended
December 31, 2014
. This amount represented our estimate as of
December 31, 2014
, of the extent to which our initial estimate of medical claims and benefits payable at December 31, 2013 was more than the amount that was ultimately paid out in satisfaction of that liability. We believe the overestimation was due primarily to the following factors:
|
•
|
At our Ohio health plan, we entered new regions in the state, and a new product, ABD Kids, in July 2013. Because we lacked sufficient historical claims data, we initially estimated the reserves for these new members based upon a number of factors that included pricing assumptions provided by the state; our beliefs about the speed at which new members would utilize health care services; and other factors. Our actual costs were ultimately less than expected.
|
|
•
|
At our Michigan health plan, we overestimated the impact of certain unpaid potentially high-dollar claims. In addition, we overestimated the impact of the flu season on the outpatient claims for November and December 2013, which caused an overestimation in our outpatient reserve liability as of December 31, 2013.
|
12
.
Debt
As of
December 31, 2016
, contractual maturities of debt for the years ending December 31 are as follows:
|
Total
|
2017
|
2018
|
2019
|
2020
|
2021
|
Thereafter
|
|||||||||||||||||||||
|
(In millions)
|
|||||||||||||||||||||||||||
|
5.375% Notes
|
$
|
700
|
|
$
|
—
|
|
$
|
—
|
|
$
|
—
|
|
$
|
—
|
|
$
|
—
|
|
$
|
700
|
|
||||||
|
1.125% Convertible Notes
|
550
|
|
—
|
|
—
|
|
—
|
|
550
|
|
—
|
|
—
|
|
|||||||||||||
|
1.625% Convertible Notes
(1)
|
302
|
|
—
|
|
—
|
|
—
|
|
—
|
|
—
|
|
302
|
|
|||||||||||||
|
$
|
1,552
|
|
$
|
—
|
|
$
|
—
|
|
$
|
—
|
|
$
|
550
|
|
$
|
—
|
|
$
|
1,002
|
|
|||||||
|
(1)
|
The 1.625% Notes have a contractual maturity date in 2044; however, on contractually specified dates beginning in 2018, holders of the 1.625% Notes may require us to repurchase some or all of the 1.625% Notes, or we may redeem any or all of the 1.625% Notes.
|
Molina Healthcare, Inc. 2016 Form 10-K | 92
Substantially all of our debt is held at the parent, which is reported in the Other segment. The principal amounts, unamortized discount (net of premium related to the 1.625% Notes), unamortized issuance costs, and net carrying amounts of debt were as follows:
|
Principal Balance
|
Unamortized Discount
|
Unamortized Issuance Costs
|
Net Carrying Amount
|
||||||||||||
|
|
(In millions)
|
||||||||||||||
|
December 31, 2016:
|
|||||||||||||||
|
5.375% Notes
|
$
|
700
|
|
$
|
—
|
|
$
|
9
|
|
$
|
691
|
|
|||
|
1.125% Convertible Notes
|
550
|
|
73
|
|
6
|
|
471
|
|
|||||||
|
1.625% Convertible Notes
|
302
|
|
16
|
|
2
|
|
284
|
|
|||||||
|
$
|
1,552
|
|
$
|
89
|
|
$
|
17
|
|
$
|
1,446
|
|
||||
|
December 31, 2015:
|
|||||||||||||||
|
5.375% Notes
|
$
|
700
|
|
$
|
—
|
|
$
|
11
|
|
$
|
689
|
|
|||
|
1.125% Convertible Notes
|
550
|
|
95
|
|
7
|
|
448
|
|
|||||||
|
1.625% Convertible Notes
|
302
|
|
25
|
|
4
|
|
273
|
|
|||||||
|
Other
|
1
|
|
—
|
|
—
|
|
1
|
|
|||||||
|
$
|
1,553
|
|
$
|
120
|
|
$
|
22
|
|
$
|
1,411
|
|
||||
Interest cost recognized relating to our convertible senior notes for the periods presented was as follows:
|
Years Ended December 31,
|
|||||||||||
|
2016
|
2015
|
2014
|
|||||||||
|
(In millions)
|
|||||||||||
|
Contractual interest at coupon rate
|
$
|
11
|
|
$
|
11
|
|
$
|
13
|
|
||
|
Amortization of the discount
|
30
|
|
29
|
|
26
|
|
|||||
|
$
|
41
|
|
$
|
40
|
|
$
|
39
|
|
|||
Debt Commitment Letter
On August 2, 2016, in connection with the Proposed Medicare Acquisition, we entered into a debt commitment letter with Barclays Bank PLC (Barclays). The primary terms of the debt commitment letter provided that, subject to satisfaction of certain conditions, including consummation of the Proposed Medicare Acquisition, Barclays would provide us with debt financing up to
$400 million
. The debt commitment letter automatically terminated in February 2017 as a result of the termination of the Proposed Medicare Acquisition. See Note
1
, “
Basis of Presentation
” for further discussion regarding the termination of the Proposed Medicare Acquisition.
5.375% Notes due 2022
On November 10, 2015, we completed the private offering of
$700 million
aggregate principal amount of senior notes (
5.375%
Notes) due November 15, 2022, unless earlier redeemed. In September 2016, we completed a registration rights agreement to exchange the 5.375% Notes for registered notes having substantially identical terms, including guarantees. Interest on the 5.375% Notes is payable semiannually in arrears on May 15 and November 15.
The 5.375% Notes contain customary non-financial covenants and change of control provisions. At
December 31, 2016
, we were in compliance with all financial covenants under the 5.375% Notes. Certain of our wholly owned subsidiaries jointly and severally guarantee our obligations under the 5.375% Notes. See Note
23
, “
Supplemental Condensed Consolidating Financial Information
,” for more information on the guarantors.
Credit Facility
In January 2017, we
entered into an amended unsecured
$500 million
r
evolving credit facility (the Credit Facility).
Outstanding letters of credit amounting to
$6 million
reduce the borrowing capacity to
$494 million
.
The Credit Facility has a term of
five years
and all amounts outstanding will be due and payable on January 31, 2022. Subject to obtaining commitments from existing or new lenders and satisfaction of other specified conditions, we may increase the Credit Facility to up to
$650 million
.
Molina Healthcare, Inc. 2016 Form 10-K | 93
Borrowings under our Credit Facility bear interest based, at our election, on a base rate or an adjusted London Interbank Offered Rate (LIBOR), plus in each case the applicable margin.
In addition to interest payable on the principal amount of indebtedness outstanding from time to time under the Credit Facility, we are required to pay a
quarterly
commitment fee.
Certain of our wholly owned subsidiaries jointly and severally guarantee our obligations under the Credit Facility.
The Credit Facility contains customary non-financial and financial covenants, including a net leverage ratio and an interest coverage ratio.
At
December 31, 2016
, we were not in compliance with the financial covenants under the Credit Facility.
In February 2017, we entered into a Second Amendment to the Credit Facility (the Second Amendment). The Second Amendment modified the Credit Facility’s definition of the earnings measure used in the covenant computations to: a) allow us to receive credit for risk corridor payments owed to, but not received or accrued by us during 2016; and b) account for the difference between the amount of actual risk transfer payments made or accrued by us during 2016, and the amount of risk transfer payments that would have been due to us under the federal government’s proposed 2018 risk adjustment payment transfer formula. The Second Amendment also provides for a waiver by the lenders of our non-compliance with the Credit Facility debt covenants at December 31, 2016.
As of
December 31, 2016
,
no
amounts were outstanding under the Credit Facility.
1.125% Cash Convertible Senior Notes due 2020
In February 2013, we issued
$550 million
aggregate principal amount of
1.125%
cash convertible senior notes (1.125% Notes) due January 15, 2020, unless earlier repurchased or converted.
Interest is payable semiannually in arrears on January 15 and July 15. The 1.125% Notes are senior unsecured obligations and rank senior in right of payment to any of our indebtedness that is expressly subordinated in right of payment to the 1.125% Notes; equal in right of payment to any of our unsecured indebtedness that is not subordinated; effectively junior in right of payment to any of our secured indebtedness to the extent of the value of the assets securing such indebtedness; and structurally junior to all indebtedness and other liabilities of our subsidiaries.
The 1.125% Notes are convertible only into cash, and not into shares of our common stock or any other securities. The initial conversion rate for the 1.125% Notes is
24.5277
shares of our common stock per $1,000 principal amount, or approximately
$40.77
per share of our common stock. Upon conversion, in lieu of receiving shares of our common stock, a holder will receive an amount in cash, per $1,000 principal amount of 1.125% Notes, equal to the settlement amount, determined in the manner set forth in the indenture. We may not redeem the 1.125% Notes prior to the maturity date. Holders may convert their 1.125% Notes only under the following circumstances:
|
•
|
during any calendar quarter commencing after the calendar quarter ending on
June 30, 2013
(and only during such calendar quarter), if the last reported sale price of the common stock for at least
20
trading days (whether or not consecutive) during a period of
30
consecutive trading days ending on the last trading day of the immediately preceding calendar quarter is greater than or equal to
130%
of the conversion price on each applicable trading day;
|
|
•
|
during the
five
business day period immediately after any
five
consecutive trading day period (the measurement period) in which the trading price per
$1,000
principal amount of 1.125% Notes for each trading day of the measurement period was less than
98%
of the product of the last reported sale price of our common stock and the conversion rate on each such trading day;
|
|
•
|
upon the occurrence of specified corporate events; or
|
|
•
|
at any time on or after
July 15, 2019
until the close of business on the second scheduled trading day immediately preceding the maturity date.
|
The 1.125% Notes met the stock price trigger in the quarter ended
December 31, 2016
, and are convertible into cash through at least March 31, 2017. Because the 1.125% Notes may be converted to cash within 12 months, the
$471 million
carrying amount is reported in current portion of long-term debt as of
December 31, 2016
.
The 1.125% Notes contain an embedded cash conversion option (the 1.125% Conversion Option), which was separated from the 1.125% Notes and accounted for separately as a derivative liability, with changes in fair value reported in our consolidated statements of income until the 1.125% Conversion Option settles or expires. The initial fair value liability of the 1.125% Conversion Option simultaneously reduced the carrying value of the 1.125% Notes (effectively an original issuance discount). This discount is amortized to the 1.125% Notes’ principal amount through the recognition of non-cash interest expense over the expected life of the debt. This has resulted in our recognition of interest expense on the 1.125% Notes at an effective rate of approximately
6%
. As of
December 31, 2016
, the 1.125% Notes have a remaining amortization period of
3.0
years. The 1.125% Notes’ if-converted value exceeded
Molina Healthcare, Inc. 2016 Form 10-K | 94
their principal amount by approximately
$182 million
and
$332 million
as of
December 31, 2016
and
December 31, 2015
, respectively.
1.625% Convertible Senior Notes due 2044
In September 2014, we issued
$125 million
principal amount of 1.625% convertible senior notes (1.625% Notes) due August 15, 2044, unless earlier repurchased, redeemed or converted. Combined with the 1.625% Notes issued in an exchange transaction in 2014, the aggregate principal amount of 1.625% Notes issued was
$302 million
. Interest is payable
semiannually
in arrears on February 15 and August 15. In addition, beginning with the semiannual interest period commencing immediately following the interest payment date on August 15, 2018, contingent interest will accrue on the 1.625% Notes during any semiannual interest period in which certain conditions or events occur, or under certain events of default. For example, additional interest of
0.25
% per year will be payable on the 1.625% Notes for any semiannual interest period for which the principal amount of 1.625% Notes outstanding is less than $
100 million
.
The 1.625% Notes are senior unsecured obligations and rank senior in right of payment to any of our indebtedness that is expressly subordinated in right of payment to the 1.625% Notes; equal in right of payment to any of our unsecured indebtedness that is not subordinated; effectively junior in right of payment to any of our secured indebtedness to the extent of the value of the assets securing such indebtedness; and structurally junior to all indebtedness and other liabilities of our subsidiaries.
The initial conversion rate for the 1.625% Notes is
17.2157
shares of our common stock per $1,000 principal amount, or approximately $
58.09
per share of our common stock. Upon conversion, we will pay cash and, if applicable, deliver shares of our common stock to the converting holder in an amount per $1,000 principal amount of 1.625% Notes equal to the settlement amount (as defined in the related indenture).
Holders may convert their 1.625% Notes only under the following circumstances:
|
•
|
during any calendar quarter commencing after the calendar quarter ending on September 30, 2014 (and only during such calendar quarter), if the last reported sale price of the common stock for at least
20
trading days (whether or not consecutive) during a period of
30
consecutive trading days ending on the last trading day of the immediately preceding calendar quarter is greater than or equal to
130%
of the conversion price on each applicable trading day;
|
|
•
|
during the
five
business day period after any
five
consecutive trading day period (the measurement period) in which the trading price per $1,000 principal amount of 1.625% Notes for each trading day of the measurement period was less than
98%
of the product of the last reported sale price of our common stock and the conversion rate on each such trading day;
|
|
•
|
upon the occurrence of specified corporate events;
|
|
•
|
if we call any 1.625% Notes for redemption, at any time until the close of business on the business day immediately preceding the redemption date;
|
|
•
|
during the period from, and including, May 15, 2018 to the close of business on the business day immediately preceding August 19, 2018; or
|
|
•
|
at any time on or after February 15, 2044 until the close of business on the second scheduled trading day immediately preceding the maturity date, holders may convert their 1.625% Notes, in integral multiples of $1,000 principal amount, at the option of the holder regardless of the foregoing circumstances.
|
As of
December 31, 2016
, the 1.625% Notes were not convertible.
We may not redeem the 1.625% Notes prior to
August 19, 2018
. On or after August 19, 2018, we may redeem for cash all or part of the 1.625% Notes, except for the 1.625% Notes we are required to repurchase in connection with a fundamental change or on any specified repurchase date. The redemption price for the 1.625% Notes will equal
100%
of the principal amount of the 1.625% Notes being redeemed, plus accrued and unpaid interest. In addition, holders of the 1.625% Notes may require us to repurchase some or all of the 1.625% Notes for cash on
August 19, 2018
,
August 19, 2024
,
August 19, 2029
,
August 19, 2034
and
August 19, 2039
, in each case, at a specified price equal to 100% of the principal amount of the 1.625% Notes to be repurchased, plus accrued and unpaid interest.
Because the 1.625% Notes are net share settled and have cash settlement features, we have allocated the principal amount between a liability component and an equity component. The reduced carrying value on the 1.625% Notes resulted in a debt discount that is amortized back to the 1.625% Notes’ principal amount through the recognition of non-cash interest expense over the expected life of the debt. The expected life of the debt is
Molina Healthcare, Inc. 2016 Form 10-K | 95
approximately
four
years, beginning on the issuance date and ending on the first date we may redeem the 1.625% Notes in August 2018. As of
December 31, 2016
, the 1.625% Notes have a remaining amortization period of
1.6
years. This has resulted in our recognition of interest expense on the 1.625% Notes at an effective rate approximating what we would have incurred had nonconvertible debt with otherwise similar terms been issued, or approximately
5%
. The outstanding 1.625% Notes’ if-converted value did not exceed their principal amount at
December 31, 2016
, and exceeded their principal amount at
December 31, 2015
by approximately
$10 million
. At
December 31, 2016
and
December 31, 2015
, the equity component of the 1.625% Notes, including the impact of deferred taxes, was $
23 million
.
Lease Financing Obligations
As a result of our continuing involvement in the leasing transactions described below, we are the “accounting owner” of the properties under the leases. The assets are therefore included in our consolidated balance sheets, and are depreciated over their remaining useful lives. The lease financing obligations are amortized over the initial lease terms, such that there will be no gain or loss recorded if the leases are not extended their expiration dates. Payments under the leases adjust the lease financing obligations, and the imputed interest is recorded to interest expense in our consolidated statements of income. Aggregate interest expense under these leases amounted to
$17 million
,
$17 million
and
$16 million
for the years ended
December 31, 2016
,
2015
and 2014, respectively. For information regarding the future minimum lease obligations, refer to Note
19
, “
Commitments and Contingencies
.”
Molina Center and Ohio Exchange.
In 2013, we entered into a sale-leaseback transaction for the Molina Center and our Ohio health plan office building located in Columbus, Ohio, also known as the Ohio Exchange. The sale of these properties did not qualify for sales recognition, because certain lease terms resulted in our continuing involvement with these leased properties. Rent increases
3%
per year through the initial term, which expires in 2038. The lease provides for
six
five
-year renewal options, with renewal rent to be the higher of the
3%
annual escalator or the then-fair market value.
6th and Pine.
Also in 2013, we entered into a construction and lease transaction for
two
office buildings in Long Beach, California (6th and Pine). Due to our participation in the construction project, we retained continuing involvement in the properties. Rent increases
3.4%
per year through the initial term, which expires in 2029. The lease provides for
two
five
-year renewal options, with renewal rent to be determined based on the then-fair market value.
13
.
Derivatives
The following table summarizes the fair values and the presentation of our derivative financial instruments (defined and discussed individually below) in the consolidated balance sheets:
|
December 31,
|
|||||||||
|
Balance Sheet Location
|
2016
|
2015
|
|||||||
|
|
(In millions)
|
||||||||
|
Derivative asset:
|
|||||||||
|
1.125% Call Option
|
Current assets: Derivative asset
|
$
|
267
|
|
$
|
374
|
|
||
|
Derivative liability:
|
|||||||||
|
1.125% Conversion Option
|
Current liabilities: Derivative liability
|
$
|
267
|
|
$
|
374
|
|
||
Our derivative financial instruments do not qualify for hedge treatment; therefore the change in fair value of these instruments is recognized immediately in our consolidated statements of income, and reported in other expense, net. Gains and losses for our derivative financial instruments are presented individually in the consolidated statements of cash flows, supplemental cash flow information.
1.125% Notes Call Spread Overlay.
Concurrent with the issuance of the 1.125% Notes in 2013, we entered into privately negotiated hedge transactions (collectively, the 1.125% Call Option) and warrant transactions (collectively, the 1.125% Warrants), with certain of the initial purchasers of the 1.125% Notes (the Counterparties). We refer to these transactions collectively as the Call Spread Overlay. Under the Call Spread Overlay, the cost of the 1.125% Call Option we purchased to cover the cash outlay upon conversion of the 1.125% Notes was reduced by proceeds from the sale of the 1.125% Warrants. Assuming full performance by the Counterparties (and 1.125% Warrants
Molina Healthcare, Inc. 2016 Form 10-K | 96
strike prices in excess of the conversion price of the 1.125% Notes), these transactions are intended to offset cash payments in excess of the principal amount of the 1.125% Notes due upon any conversion of the 1.125% Notes.
1.125% Call Option.
The
1.125%
Call Option, which is indexed to our common stock, is a derivative asset that requires mark-to-market accounting treatment due to cash settlement features until the 1.125% Call Option settles or expires. For further discussion of the inputs used to determine the fair value of the 1.125% Call Option, refer to Note
5
, “
Fair Value Measurements
.”
1.125% Conversion Option.
The embedded cash conversion option within the
1.125%
Notes is accounted for separately as a derivative liability, with changes in fair value reported in our consolidated statements of income until the cash conversion option settles or expires. For further discussion of the inputs used to determine the fair value of the 1.125% Conversion Option, refer to Note
5
, “
Fair Value Measurements
.”
As of
December 31, 2016
, the 1.125% Call Option and the 1.125% Conversion Option were classified as a current asset and current liability, respectively, because the 1.125% Notes may be converted within 12 months of
December 31, 2016
, as described in Note
12
, “
Debt
.”
14
.
Income Taxes
The provision for income taxes is determined using an estimated annual effective tax rate, which is generally greater than the U.S. federal statutory rate primarily because of state taxes, nondeductible expenses such as the HIF, certain compensation, and other general and administrative expenses. The effective tax rate may be subject to fluctuations during the year, particularly as a result of the level of pretax earnings, and also as new information is obtained. Such information may affect the assumptions used to estimate the annual effective tax rate, including factors such as the mix of pretax earnings in the various tax jurisdictions in which we operate, valuation allowances against deferred tax assets, the recognition or the reversal of the recognition of tax benefits related to uncertain tax positions, and changes in or the interpretation of tax laws in jurisdictions where we conduct business. We recognize deferred tax assets and liabilities for temporary differences between the financial reporting basis and the tax basis of our assets and liabilities, along with net operating loss and tax credit carryovers.
The provision for income taxes consisted of the following:
|
Year Ended December 31,
|
|||||||||||
|
2016
|
2015
|
2014
|
|||||||||
|
(In millions)
|
|||||||||||
|
Current:
|
|||||||||||
|
Federal
|
$
|
134
|
|
$
|
172
|
|
$
|
72
|
|
||
|
State
|
3
|
|
8
|
|
3
|
|
|||||
|
Foreign
|
(6
|
)
|
6
|
|
—
|
|
|||||
|
Total current
|
131
|
|
186
|
|
75
|
|
|||||
|
Deferred:
|
|||||||||||
|
Federal
|
19
|
|
(10
|
)
|
—
|
|
|||||
|
State
|
2
|
|
4
|
|
(2
|
)
|
|||||
|
Foreign
|
1
|
|
(1
|
)
|
—
|
|
|||||
|
Total deferred
|
22
|
|
(7
|
)
|
(2
|
)
|
|||||
|
$
|
153
|
|
$
|
179
|
|
$
|
73
|
|
|||
Molina Healthcare, Inc. 2016 Form 10-K | 97
A reconciliation of the U.S. federal statutory income tax rate to the combined effective income tax rate is as follows:
|
Year Ended December 31,
|
||||||||
|
2016
|
2015
|
2014
|
||||||
|
Statutory federal tax rate
|
35.0
|
%
|
35.0
|
%
|
35.0
|
%
|
||
|
State income taxes, net of federal benefit
|
1.6
|
|
2.4
|
|
0.4
|
|
||
|
Change in unrecognized tax benefits
|
0.5
|
|
0.9
|
|
(0.1
|
)
|
||
|
Nondeductible health insurer fee (HIF)
|
37.0
|
|
17.0
|
|
22.9
|
|
||
|
Nondeductible compensation
|
3.1
|
|
0.6
|
|
(4.1
|
)
|
||
|
Change in purchase agreement that increased tax basis in assets
|
(2.2
|
)
|
—
|
|
—
|
|
||
|
Other
|
(0.2
|
)
|
(0.4
|
)
|
(0.3
|
)
|
||
|
Effective tax rate
|
74.8
|
%
|
55.5
|
%
|
53.8
|
%
|
||
Our effective tax rate is based on expected income, statutory tax rates, and tax planning opportunities available to us in the various jurisdictions in which we operate. Significant management estimates and judgments are required in determining our effective tax rate. We are routinely under audit by federal, state, or local authorities regarding the timing and amount of deductions, nexus of income among various tax jurisdictions, and compliance with federal, state, foreign, and local tax laws.
During 2014, the Internal Revenue Service (IRS) issued final regulations related to compensation deduction limitations applicable to certain health insurance issuers. Pursuant to these final regulations, we reversed amounts treated as nondeductible in 2013 and recognized a tax benefit during 2014.
During
2016
,
2015
, and
2014
, excess tax benefits from share-based compensation amounted to
$2 million
,
$8 million
, and
$3 million
, respectively. These amounts were recorded as a decrease to income taxes payable and an increase to additional paid-in capital.
Deferred tax assets and liabilities are classified as non-current. Significant components of our deferred tax assets and liabilities as of
December 31, 2016
and
2015
were as follows:
|
December 31,
|
|||||||
|
2016
|
2015
|
||||||
|
(In millions)
|
|||||||
|
Accrued expenses
|
$
|
22
|
|
$
|
37
|
|
|
|
Reserve liabilities
|
28
|
|
14
|
|
|||
|
Other accrued medical costs
|
5
|
|
5
|
|
|||
|
Net operating losses
|
13
|
|
7
|
|
|||
|
Unrealized losses
|
1
|
|
2
|
|
|||
|
Unearned premiums
|
27
|
|
21
|
|
|||
|
Lease financing obligation
|
38
|
|
35
|
|
|||
|
Deferred compensation
|
6
|
|
8
|
|
|||
|
Tax credit carryover
|
7
|
|
8
|
|
|||
|
Valuation allowance
|
(16
|
)
|
(9
|
)
|
|||
|
Total deferred income tax assets, net of valuation allowance
|
131
|
|
128
|
|
|||
|
Prepaid expenses
|
(9
|
)
|
(9
|
)
|
|||
|
Depreciation and amortization
|
(104
|
)
|
(83
|
)
|
|||
|
Basis in debt
|
(23
|
)
|
(18
|
)
|
|||
|
Total deferred income tax liabilities
|
(136
|
)
|
(110
|
)
|
|||
|
Net deferred income tax (liability) asset - long term
|
$
|
(5
|
)
|
$
|
18
|
|
|
At
December 31, 2016
, we had state net operating loss carryforwards of
$315 million
, which begin expiring in 2018.
At
December 31, 2016
, we had California enterprise zone tax credit carryovers of
$11 million
, which will begin to expire in 2024.
We evaluate the need for a valuation allowance taking into consideration the ability to carry back and carry forward tax credits and losses, available tax planning strategies and future income, including reversal of temporary differences. We have determined that as of
December 31, 2016
,
$16 million
of deferred tax assets did not satisfy the recognition criteria due to uncertainty regarding the realization of some of our state net operating loss
Molina Healthcare, Inc. 2016 Form 10-K | 98
carryforwards. Therefore, we increased our valuation allowance by
$7 million
, from
$9 million
at
December 31, 2015
, to
$16 million
as of
December 31, 2016
.
We recognize tax benefits only if the tax position is more likely than not to be sustained. We are subject to income taxes in the United States, Puerto Rico, and numerous state jurisdictions. Significant judgment is required in evaluating our tax positions and determining our provision for income taxes. During the ordinary course of business, there are many transactions and calculations for which the ultimate tax determination is uncertain. We establish reserves for tax-related uncertainties based on estimates of whether, and the extent to which, additional taxes will be due. These reserves are established when we believe that certain positions might be challenged despite our belief that our tax return positions are fully supportable. We adjust these reserves in light of changing facts and circumstances, such as the outcome of tax audits. The provision for income taxes includes the impact of reserve provisions and changes to reserves that are considered appropriate.
The roll forward of our unrecognized tax benefits is as follows:
|
Year Ended December 31,
|
|||||||||||
|
2016
|
2015
|
2014
|
|||||||||
|
(In millions)
|
|||||||||||
|
Gross unrecognized tax benefits at beginning of period
|
$
|
(9
|
)
|
$
|
(3
|
)
|
$
|
(8
|
)
|
||
|
Increases in tax positions for current year
|
(1
|
)
|
(1
|
)
|
—
|
|
|||||
|
Increases in tax positions for prior years
|
(1
|
)
|
(5
|
)
|
(1
|
)
|
|||||
|
Settlements
|
—
|
|
—
|
|
6
|
|
|||||
|
Gross unrecognized tax benefits at end of period
|
$
|
(11
|
)
|
$
|
(9
|
)
|
$
|
(3
|
)
|
||
The total amount of unrecognized tax benefits at
December 31, 2016
,
2015
and
2014
that, if recognized, would affect the effective tax rates is
$9 million
,
$7 million
and
$2 million
, respectively. We expect that during the next
12
months it is reasonably possible that unrecognized tax benefit liabilities may decrease by as much as
$2 million
due to the expiration of statutes of limitation.
Our continuing practice is to recognize interest and/or penalties related to unrecognized tax benefits in income tax expense. Amounts accrued for the payment of interest and penalties as of
December 31, 2016
,
2015
and
2014
were insignificant.
We are under examination by the IRS for calendar year 2011 and may be subject to examination for calendar years 2012 through 2015. We are under examination, or may be subject to examination, in Puerto Rico and certain state and local jurisdictions, with the major state jurisdictions being California, Michigan, and Illinois for the years 2009 through 2015.
15
.
Stockholders' Equity
Common Stock Offering.
In June 2015, we completed an underwritten public offering of
5,750,000
shares of our common stock, including the over-allotment option. Net of issuance costs, proceeds from the offering amounted to
$373 million
, or
$64.90
per share, resulting in an increase to additional paid-in capital. We are using the proceeds to finance working capital needs, acquisitions, capital expenditures, and other general corporate activities.
1.125% Warrants.
In connection with the Call Spread Overlay transaction described in Note
13
, “
Derivatives
,” in 2013, we issued
13,490,236
warrants with a strike price of
$53.8475
per share. The number of warrants and the strike price are subject to adjustment under certain circumstances. If the market value per share of our common stock exceeds the strike price of the 1.125% Warrants on any trading day during the
160
trading day measurement period (beginning on April 15, 2020) under the
1.125%
Warrants, we will be obligated to issue to the Counterparties a number of shares equal in value to the product of the amount by which such market value exceeds such strike price and 1/160th of the aggregate number of shares of our common stock underlying the 1.125% Warrants, subject to a share delivery cap. The 1.125% Warrants could separately have a dilutive effect to the extent that the market value per share of our common stock exceeds the applicable strike price of the 1.125% Warrants. Refer to Note
3
, “
Net Income per Share
,” for dilution information for the periods presented. We will not receive any additional proceeds if the 1.125% Warrants are exercised.
Securities Repurchase Programs.
In December 2015, our board of directors authorized the repurchase of up to
$50 million
in aggregate of our common stock or senior notes. We did not repurchase any shares under this program, which expired without renewal on December 31, 2016.
Molina Healthcare, Inc. 2016 Form 10-K | 99
Stock Incentive Plans.
At
December 31, 2016
, we had employee equity incentives outstanding under
two
plans: (1) the 2011 Equity Incentive Plan (2011 Plan); and (2) the 2002 Equity Incentive Plan (from which equity incentives are no longer awarded).
The 2011 Plan provides for the award of restricted shares and units, performance shares and units, stock options and stock bonuses to the company’s officers, employees, directors, consultants, advisers, and other service providers. The 2011 Plan provides for the issuance of up to
4.5 million
shares of common stock.
Restricted share awards are granted with a fair value equal to the market price of our common stock on the date of grant, and generally vest in equal annual installments over periods up to
four
years from the date of grant. We recognize expense for these awards on a straight-line basis. Stock option awards have an exercise price equal to the fair market value of our common stock on the date of grant, generally vest in equal annual installments over periods up to
four
years from the date of grant, and have a maximum term of
ten
years from the date of grant.
In connection with our equity incentive plans and employee stock purchase plan, approximately
674,000
shares of common stock were purchased or vested, net of shares used to settle employees’ income tax obligations, during the year ended
December 31, 2016
.
Charged to general and administrative expenses, total share-based compensation expense was as follows:
|
Year Ended December 31,
|
|||||||||||||||||||||||
|
2016
|
2015
|
2014
|
|||||||||||||||||||||
|
(In millions)
|
|||||||||||||||||||||||
|
Pretax
Charges
|
Net-of-Tax
Amount
|
Pretax
Charges
|
Net-of-Tax
Amount
|
Pretax
Charges
|
Net-of-Tax
Amount
|
||||||||||||||||||
|
Restricted stock and performance awards
|
$
|
20
|
|
$
|
17
|
|
$
|
19
|
|
$
|
13
|
|
$
|
19
|
|
$
|
12
|
|
|||||
|
Employee stock purchase plan and stock options
|
6
|
|
5
|
|
4
|
|
3
|
|
3
|
|
2
|
|
|||||||||||
|
$
|
26
|
|
$
|
22
|
|
$
|
23
|
|
$
|
16
|
|
$
|
22
|
|
$
|
14
|
|
||||||
As of
December 31, 2016
, there was
$29 million
of total unrecognized compensation expense related to unvested restricted share awards, including those with performance conditions, which we expect to recognize over a remaining weighted-average period of
1.7 years
. This unrecognized compensation cost assumes an estimated forfeiture rate of
4.7%
for non-executive employees as of
December 31, 2016
. As of
December 31, 2016
, there was no unrecognized compensation expense related to unvested stock options.
Restricted stock.
Restricted and performance stock activity for the year ended
December 31, 2016
is summarized below:
|
Restricted Shares
|
Performance Shares
|
Total Shares
|
Weighted
Average
Grant Date
Fair Value
|
|||||||||
|
Unvested balance as of December 31, 2015
|
658,156
|
|
376,601
|
|
1,034,757
|
|
$
|
46.68
|
|
|||
|
Granted
|
300,007
|
|
226,010
|
|
526,017
|
|
63.84
|
|
||||
|
Vested
|
(352,292
|
)
|
—
|
|
(352,292
|
)
|
42.06
|
|
||||
|
Canceled
|
—
|
|
(256,955
|
)
|
(256,955
|
)
|
46.24
|
|
||||
|
Forfeited
|
(28,627
|
)
|
—
|
|
(28,627
|
)
|
53.06
|
|
||||
|
Unvested balance as of December 31, 2016
|
577,244
|
|
345,656
|
|
922,900
|
|
$
|
58.15
|
|
|||
The total fair value of restricted awards, including those with performance or market conditions, granted during the years ended
December 31, 2016
,
2015
, and
2014
was
$34 million
,
$28 million
, and
$25 million
, respectively. The total fair value of restricted awards, including those with performance or market conditions, which vested during the years ended
December 31, 2016
,
2015
, and
2014
was
$22 million
,
$39 million
, and
$24 million
, respectively.
Employee Stock Purchase Plan.
Under our employee stock purchase plan (ESPP), eligible employees may purchase common shares at
85%
of the lower of the fair market value of our common stock on either the first or last trading day of each six-month offering period. Each participant is limited to a maximum purchase of
$25,000
(as measured by the fair value of the stock acquired) per year through payroll deductions. We estimate the fair value of the stock issued using the Black-Scholes option pricing model. For the years ended
December 31, 2016
,
2015
, and
2014
, the inputs to this model were as follows: risk-free interest rates of approximately
0.1%
to
0.5%
; expected volatilities ranging from approximately
30%
to
40%
, dividend yields of
0%
, and an average expected life of
0.5
Molina Healthcare, Inc. 2016 Form 10-K | 100
years. We issued approximately
410,000
,
302,000
and
327,000
shares of our common stock under the ESPP during the years ended
December 31, 2016
,
2015
, and
2014
, respectively. The 2011 ESPP provides for the issuance of up to
three million
shares of common stock.
Stock Options.
No
stock options were granted in
2016
,
2015
and
2014
, and stock options outstanding as of
December 31, 2016
were insignificant. The total intrinsic value of options exercised during the years ended
December 31, 2016
,
2015
, and
2014
was
$1 million
,
$6 million
, and
$2 million
, respectively.
16
.
Employee Benefits
We sponsor defined contribution 401(k) plans that cover substantially all full-time salaried and hourly employees of our company and its subsidiaries. Eligible employees are permitted to contribute up to the maximum amount allowed by law. We generally match up to the first
4%
of compensation contributed by employees. Expense recognized in connection with our contributions to the 401(k) plans totaled
$36 million
,
$27 million
and
$21 million
in the years ended
December 31, 2016
,
2015
, and
2014
, respectively.
We also have a nonqualified deferred compensation plan for certain key employees. Under this plan, eligible participants may defer up to
100%
of their base salary and
100%
of their bonus to provide tax-deferred growth for retirement. The funds deferred are invested in corporate-owned life insurance, under a rabbi trust.
17
.
Related Party Transactions
Our California health plan has entered into a provider agreement with Pacific Healthcare IPA (Pacific), which is
50%
owned by the brother-in-law of Dr. J. Mario Molina and John C. Molina. Under the terms of this provider agreement, the California health plan paid Pacific approximately
$1 million
in each of 2015 and 2014 for medical care provided to health plan members. Payments in 2016 were insignificant.
Refer to Note
18
, “
Variable Interest Entities (VIEs)
,” for a discussion of the Joseph M. Molina, M.D. Professional Corporations.
18
.
Variable Interest Entities (VIEs)
Joseph M. Molina M.D., Professional Corporations
The
Joseph M. Molina, M.D. Professional Corporations (JMMPC) were created to further advance our direct delivery business. JMMPC’s primary shareholder is Dr. J. Mario Molina, our chief executive officer, president, and chairman of the board of directors. Dr. Molina is paid no salary and receives no dividends in connection with his work for, or ownership of, JMMPC. JMMPC provides primary care medical services through its employed physicians and other medical professionals. JMMPC also provides certain specialty referral services to our California health plan members through a contracted provider network. Substantially all of the individuals served by JMMPC are members of our health plans. JMMPC does not have agreements to provide professional medical services with any other entities.
Our wholly owned subsidiary, Molina Medical Management, Inc. (MMM), has entered into services agreements with JMMPC to provide clinic facilities, clinic administrative support staff, patient scheduling services and medical supplies to JMMPC. The services agreements were designed such that JMMPC will operate at break even, ensuring the availability of quality care and access for our health plan members. The services agreements provide that the administrative fees charged to JMMPC by MMM are reviewed annually to assure the achievement of this goal. For the years ended December 31, 2016, 2015 and 2014, JMMPC paid
$55 million
,
$69 million
and
$11 million
, respectively, to MMM for clinic administrative services provided by MMM to JMMPC.
Separately, our California, Florida, New Mexico, Utah and Washington health plans have entered into primary care services agreements with JMMPC. These agreements direct our health plans to either fund JMMPC’s operating deficits, or receive JMMPC’s operating surpluses, such that JMMPC will derive no profit or loss. Because the MMM services agreements described above mitigate the likelihood of significant operating deficits or surpluses, such amounts either paid to JMMPC or received by the health plans are generally insignificant. For the years ended
December 31, 2016
,
2015
, and
2014
, our health plans paid
$122 million
,
$117 million
and
$32 million
, respectively, to JMMPC for health care services provided by JMMPC to the health plans’ members.
Molina Healthcare, Inc. 2016 Form 10-K | 101
We have determined that JMMPC is a VIE, and that we are its primary beneficiary. We have reached this conclusion under the power and benefits criterion model according to GAAP. Specifically, we have the power to direct the activities (excluding clinical decisions) that most significantly affect JMMPC’s economic performance, and the obligation to absorb losses or the right to receive benefits that are potentially significant to the VIE, under the agreements described above. Because we are its primary beneficiary, we have consolidated JMMPC. JMMPC’s assets may be used to settle only JMMPC’s obligations, and JMMPC’s creditors have no recourse to the general credit of Molina Healthcare, Inc. As of
December 31, 2016
, JMMPC had total assets of
$18 million
, and total liabilities of
$18 million
. As of
December 31, 2015
, JMMPC had total assets of
$17 million
, and total liabilities of
$17 million
.
Our maximum exposure to loss as a result of our involvement with JMMPC is generally limited to the amounts needed to fund JMMPC’s ongoing payroll, employee benefits and medical care costs associated with JMMPC’s specialty referral activities. We believe that such loss exposures will be insignificant to our consolidated operating results and cash flows for the foreseeable future.
New Markets Tax Credit
In 2011, our New Mexico data center subsidiary entered into a financing transaction with Wells Fargo Community Investment Holdings, LLC (Wells Fargo), its wholly owned subsidiary New Mexico Healthcare Data Center Investment Fund, LLC (Investment Fund), and certain of Wells Fargo’s affiliated Community Development Entities (CDEs), in connection with our participation in the federal government’s New Markets Tax Credit Program (NMTC). The credit amounts to
39%
of the original investment amount and is claimed over a period of
seven
years (
five percent
for each of the first three years, and
six percent
for each of the remaining four years). The investment in the CDE cannot be redeemed before the end of the
seven
-year period.
As a result of a series of simultaneous financing transactions, Wells Fargo contributed capital of
$6 million
to the Investment Fund, and Molina Healthcare, Inc. loaned the principal amount of $
16 million
to the Investment Fund. The Investment Fund then contributed the proceeds to certain CDEs, which, in turn, loaned the proceeds of
$21 million
to our New Mexico data center subsidiary.
We have determined that the financing arrangement with Investment Fund and CDEs is a VIE, that we are the primary beneficiary of the VIE, and we have included it in our consolidated financial statements. Wells Fargo’s contribution of
$6 million
is included in cash at
December 31, 2016
and
December 31, 2015
and the offsetting amount of Wells Fargo’s interest in the financing arrangement is included in other liabilities in the accompanying consolidated balance sheets.
19
.
Commitments and Contingencies
Regulatory Capital Requirements and Dividend Restrictions
Our health plans, which are operated by our respective wholly owned subsidiaries in those states, are subject to state laws and regulations that, among other things, require the maintenance of minimum levels of statutory capital, as defined by each state. Regulators in some states may also enforce capital requirements that require the retention of net worth in excess of amounts formally required by statute or regulation. Such statutes, regulations and informal capital requirements also restrict the timing, payment, and amount of dividends and other distributions that may be paid to us as the sole stockholder. To the extent our subsidiaries must comply with these regulations, they may not have the financial flexibility to transfer funds to us. Based on current statutes and regulations, the net assets in these subsidiaries (after intercompany eliminations) which may not be transferable to us in the form of loans, advances, or cash dividends was approximately
$1,492 million
at
December 31, 2016
, and
$1,229 million
at
December 31, 2015
. Because of the statutory restrictions that inhibit the ability of our health plans to transfer net assets to us, the amount of retained earnings readily available to pay dividends to our stockholders is generally limited to cash, cash equivalents and investments held by the parent company – Molina Healthcare, Inc. Such cash, cash equivalents and investments amounted to
$264 million
and
$612 million
as of
December 31, 2016
and
2015
, respectively.
The National Association of Insurance Commissioners (NAIC), adopted rules effective December 31, 1998, which, if implemented by the states, set minimum capitalization requirements for insurance companies, HMOs, and other entities bearing risk for health care coverage. The requirements take the form of risk-based capital (RBC) rules which may vary from state to state. All of the states in which our health plans operate, except California, Florida and New York, have adopted these rules. Such requirements, if adopted by California, Florida and New York, may increase the minimum capital required for those states.
Molina Healthcare, Inc. 2016 Form 10-K | 102
As of
December 31, 2016
, our health plans had aggregate statutory capital and surplus of approximately
$1,693 million
compared with the required minimum aggregate statutory capital and surplus of approximately
$1,100 million
. All of our health plans were in compliance with the minimum capital requirements at
December 31, 2016
. We have the ability and commitment to provide additional capital to each of our health plans when necessary to ensure that statutory capital and surplus continue to meet regulatory requirements.
Legal Proceedings
The health care and Medicaid-related business process outsourcing industries are subject to numerous laws and regulations of federal, state, and local governments. Compliance with these laws and regulations can be subject to government review and interpretation, as well as regulatory actions unknown and unasserted at this time. Penalties associated with violations of these laws and regulations include significant fines and penalties, exclusion from participating in publicly funded programs, and the repayment of previously billed and collected revenues.
We are involved in legal actions in the ordinary course of business, some of which seek monetary damages, including claims for punitive damages, which are not covered by insurance. We have accrued liabilities for certain matters for which we deem the loss to be both probable and estimable. Although we believe that our estimates of such losses are reasonable, these estimates could change as a result of further developments of these matters. The outcome of legal actions is inherently uncertain and such pending matters for which accruals have not been established have not progressed sufficiently through discovery and/or development of important factual information and legal issues to enable us to estimate a range of possible loss, if any. While it is not possible to accurately predict or determine the eventual outcomes of these items, an adverse determination in one or more of these pending matters could have a material adverse effect on our consolidated financial position, results of operations, or cash flows.
Marketplace Risk Corridor Program.
On January 19, 2017, we filed suit against the United States of America in the United States Court of Federal Claims, Case Number 1:55-cv-01000-UNJ, on behalf of our health plans seeking recovery from the federal government of approximately
$52 million
in Marketplace risk corridor payments for calendar year 2015. Based upon current estimates, we believe our health plans are also owed approximately
$90 million
in Marketplace risk corridor payments from the federal government for calendar year 2016, and a further nominal amount for calendar year 2014. Our lawsuit seeks recovery of all of these unpaid amounts. We have not recognized revenue, nor have we recorded a receivable, for any amount due from the federal government for unpaid Marketplace risk corridor payments as of December 31, 2016. We have fully recognized all liabilities due to the federal government that we have incurred under the Marketplace risk corridor program, and have paid all amounts due to the federal government as required.
Rodriguez v. Providence Community Corrections.
On October 1, 2015,
seven
individuals, on behalf of themselves and all others similarly situated, filed a complaint in the District Court for the Middle District of Tennessee, Nashville Division, Case No. 3:15-cv-01048 (the Rodriquez Litigation), against Providence Community Corrections, Inc. (now known as Pathways Community Corrections, Inc., or PCC). Rutherford County, Tennessee formerly contracted with PCC for the administration of misdemeanor probation, which involved the collection of court costs and fees from probationers. The complaint alleges, among other things, that PCC illegally assessed fees and surcharges against probationers and made improper threats of arrest and probation revocation if the probationers did not pay such amounts. The plaintiffs in the Rodriguez Litigation seek alleged compensatory, treble, and punitive damages, plus attorneys’ fees, for alleged federal and state constitutional violations, as well as alleged violations of the Racketeer Influenced and Corrupt Organization Act. PCC’s agreement with Rutherford County terminated effective March 31, 2016. On November 1, 2015, one month after the Rodriguez Litigation commenced, we acquired PCC from The Providence Service Corporation (Providence) pursuant to a membership interest purchase agreement. In September 2016, the parties to the Rodriguez Litigation accepted a mediation proposal for settlement pursuant to which PCC would pay the plaintiffs
$14 million
. The parties are in the process of finalizing the settlement agreement. We expect to recover the full amount of the settlement under the indemnification provisions of the membership interest purchase agreement with Providence.
United States of America, ex rel., Anita Silingo v. Mobile Medical Examination Services, Inc., et al.
On or around October 14, 2014, Molina Healthcare of California, Molina Healthcare of California Partner Plan, Inc., Mobile Medical Examination Services, Inc. (MedXM), and other health plan defendants were served with a Complaint previously filed under seal in the Central District Court of California by Relator, Anita Silingo, Case No. SACV13-1348-FMO(SHx). The Complaint alleges that MedXM improperly modified medical records and otherwise took inappropriate steps to increase members’ risk adjustment scores, and that the defendants, including Molina Healthcare of California and Molina Healthcare of California Partner Plan, Inc., purportedly turned a “blind eye” to these unlawful practices. On October 22, 2015, the Relator filed a third amended complaint. On July 11, 2016, the District Court dismissed with prejudice the third amended complaint, without leave to amend. On
Molina Healthcare, Inc. 2016 Form 10-K | 103
September 23, 2016, the plaintiff filed an appeal with the Ninth Circuit Court of Appeals. The plaintiff/appellant’s opening brief is due March 6, 2017, and the defendant/appellee’s opening brief is due April 5, 2017.
State of Louisiana.
On June 26, 2014, the state of Louisiana filed a Petition for Damages against Molina Medicaid Solutions, Molina Healthcare, Inc., Unisys, and Paramax Systems Corporation, a subsidiary of Unisys, in the Parish of Baton Rouge, 19th Judicial District, versus number 631612. The Petition alleges that between 1989 and 2012, the defendants utilized an incorrect reimbursement formula for the payment of pharmaceutical claims. We believe that, pursuant to a settlement with the state, this matter will be dismissed against Molina Medicaid Solutions with no liability.
Hospital Management Contract.
During the fourth quarter of 2015, we recorded a contract settlement charge of approximately
$15 million
as a result of our termination of a hospital management agreement.
States’ Budgets
From time to time the states in which our health plans operate may experience financial difficulties, which could lead to delays in premium payments. For example, the state of Illinois is operating without a budget for its current fiscal year. It is unclear when or if the state’s budget difficulties will be resolved. As of
December 31, 2016
, our Illinois health plan served approximately
195,000
members and recognized premium revenue of approximately
$601 million
for the year ended
December 31, 2016
. As of
February 24, 2017
, the state of Illinois owed us approximately
$68 million
for certain October, November and December 2016 premiums.
In another example, the Commonwealth of Puerto Rico’s fiscal plan, issued on October 14, 2016, reported that current revenues are insufficient to support existing current operations and debt service. While the Commonwealth reports that it will prioritize health care spending, it stresses the need to address the cap on federal matching funds it receives for its participation in the Medicaid program. Among the fiscal issues expected to further exacerbate the Commonwealth’s current debt crisis is the depletion of ACA funds, estimated to occur in the Commonwealth’s fiscal year 2018. As of
December 31, 2016
, our Puerto Rico health plan served approximately
330,000
members and recorded premium revenue of approximately
$726 million
for the year ended December 31, 2016.
As of
February 24, 2017
, the Commonwealth is current with its premium payments.
Operating Leases
We lease administrative and clinic facilities and certain equipment under non-cancelable operating leases expiring at various dates through 2027. Facility lease terms generally range from
five
to
10
years with
one
to
two
renewal options for extended terms. In most cases, we are required to make additional payments under facility operating leases for taxes, insurance and other operating expenses incurred during the lease period. Certain of our leases contain rent escalation clauses or lease incentives, including rent abatements and tenant improvement allowances. Rent escalation clauses and lease incentives are taken into account in determining total rent expense to be recognized during the lease term.
Future minimum lease payments by year and in the aggregate under operating leases and lease financing obligations consist of the following amounts:
|
Lease Financing Obligations
|
Operating Leases
|
Total
|
|||||||||
|
(In millions)
|
|||||||||||
|
2017
|
$
|
17
|
|
$
|
63
|
|
$
|
80
|
|
||
|
2018
|
17
|
|
57
|
|
74
|
|
|||||
|
2019
|
18
|
|
50
|
|
68
|
|
|||||
|
2020
|
19
|
|
33
|
|
52
|
|
|||||
|
2021
|
19
|
|
21
|
|
40
|
|
|||||
|
Thereafter
|
337
|
|
43
|
|
380
|
|
|||||
|
$
|
427
|
|
$
|
267
|
|
$
|
694
|
|
|||
Rental expense related to operating leases amounted to
$64 million
,
$44 million
, and
$32 million
for the years ended
December 31, 2016
,
2015
, and
2014
, respectively. The amounts reported in “Lease Financing Obligations” above represent our contractual lease commitments for the properties described in Note
12
, “
Debt
” under the subheading “Lease Financing Obligations.”
Molina Healthcare, Inc. 2016 Form 10-K | 104
Professional Liability Insurance
We carry medical professional liability insurance for health care services rendered in the primary care institutions that we manage. In addition, we also carry errors and omissions insurance for all Molina entities.
Provider Claims
Many of our medical contracts are complex in nature and may be subject to differing interpretations regarding amounts due for the provision of various services. Such differing interpretations have led certain medical providers to pursue us for additional compensation. The claims made by providers in such circumstances often involve issues of contract compliance, interpretation, payment methodology, and intent. These claims often extend to services provided by the providers over a number of years.
Various providers have contacted us seeking additional compensation for claims that we believe to have been settled. These matters, when finally concluded and determined, will not, in our opinion, have a material adverse effect on our business, consolidated financial position, results of operations, or cash flows.
Employment Agreements
In 2002, we entered into employment agreements with our Chief Executive Officer and Chief Financial Officer, which were further amended and restated in 2016. These amended and restated employment agreements had an initial
one
-year term, and are subject to automatic
one
-year extensions thereafter. Should the executives be terminated without cause or resign for good reason before a change of control, as defined, we will pay
400%
of the executive’s base salary then in effect and a prorated termination bonus (
150%
of base salary for the Chief Executive Officer and
125%
of base salary for the Chief Financial Officer), in addition to full vesting of equity compensation, and a cash payment for health and welfare benefits.
In 2013, we entered into employment agreements with our Chief Operating Officer, Chief Accounting Officer, and Chief Legal Officer. These agreements continue until terminated by us, or the executive resigns. If the executive’s employment is terminated by us without cause or the executive resigns for good reason, the executive will be entitled to receive
one
year’s base salary and termination bonus, as defined, full vesting of time-based equity compensation, and a cash payment for health and welfare benefits.
Payment of the severance benefits described above is contingent upon the executive’s signing a release agreement waiving claims against us. If the executives are terminated for cause, no further payments are due under the contracts.
20
.
Segment Information
We have
three
reportable segments. These segments consist of our Health Plans segment, which comprises the vast majority of our operations; our Molina Medicaid Solutions segment; and our Other segment, which includes our behavioral health and social services subsidiary, Pathways.
Our reportable segments are consistent with how we currently manage our business and view the markets we serve.
The Health Plans segment consists of our health plans and our direct delivery business. Our health plans are operating segments that have been aggregated for reporting purposes because they share similar economic characteristics. The Molina Medicaid Solutions segment provides support to state government agencies in the administration of their Medicaid programs including business processing, information technology development, and administrative services.
The Other segment includes primarily our Pathways behavioral health and social services provider, and corporate amounts not allocated to other reportable segments.
Gross margin is the appropriate earnings measure for our reportable segments, based on how our chief operating decision maker currently reviews results, assesses performance, and allocates resources.
Gross margin for our Health Plans segment is referred to as “Medical margin,” and for our Molina Medicaid Solutions and Other segments, as “Service margin.” Medical margin represents the amount earned by the Health Plans segment after medical costs are deducted from premium revenue. The medical care ratio represents the amount of medical care costs as a percentage of premium revenue, and is one of the key metrics used to assess the performance of the Health Plans segment. Therefore, the underlying medical margin is the most important measure of earnings reviewed by the chief operating decision maker. The service margin is equal to service revenue minus cost of service revenue.
Molina Healthcare, Inc. 2016 Form 10-K | 105
|
Health Plans
|
Molina Medicaid Solutions
|
Other
|
Consolidated
|
|||||||||||||
|
(In millions)
|
||||||||||||||||
|
2016
|
||||||||||||||||
|
Total revenue
(1)
|
$
|
17,234
|
|
$
|
195
|
|
$
|
353
|
|
$
|
17,782
|
|
||||
|
Gross margin
|
1,618
|
|
21
|
|
33
|
|
1,672
|
|
||||||||
|
Depreciation and amortization
(2)
|
122
|
|
45
|
|
15
|
|
182
|
|
||||||||
|
Goodwill, and intangible assets, net
|
513
|
|
72
|
|
175
|
|
760
|
|
||||||||
|
Total assets
|
5,897
|
|
267
|
|
1,285
|
|
7,449
|
|
||||||||
|
2015
|
||||||||||||||||
|
Total revenue
(1)
|
13,917
|
|
195
|
|
66
|
|
14,178
|
|
||||||||
|
Gross margin
|
1,447
|
|
55
|
|
5
|
|
1,507
|
|
||||||||
|
Depreciation and amortization
(2)
|
95
|
|
25
|
|
6
|
|
126
|
|
||||||||
|
Goodwill, and intangible assets, net
|
393
|
|
73
|
|
175
|
|
641
|
|
||||||||
|
Total assets
|
4,707
|
|
213
|
|
1,656
|
|
6,576
|
|
||||||||
|
2014
|
||||||||||||||||
|
Total revenue
(1)
|
9,449
|
|
210
|
|
8
|
|
9,667
|
|
||||||||
|
Gross margin
|
947
|
|
53
|
|
—
|
|
1,000
|
|
||||||||
|
Depreciation and amortization
(2)
|
83
|
|
46
|
|
5
|
|
134
|
|
||||||||
|
Goodwill, and intangible assets, net
|
286
|
|
75
|
|
—
|
|
361
|
|
||||||||
|
Total assets
|
3,355
|
|
185
|
|
895
|
|
4,435
|
|
||||||||
______________________
|
(1)
|
Total revenue consists primarily of premium revenue, premium tax revenue and health insurer fee revenue for the Health Plans segment, and service revenue for the Molina Medicaid Solutions and Other segments.
|
|
(2)
|
Depreciation and amortization reported in accompanying consolidated statements of cash flows.
|
The following table reconciles gross margin by segment to consolidated income before income tax expense:
|
Year Ended December 31,
|
|||||||||||
|
2016
|
2015
|
2014
|
|||||||||
|
(In millions)
|
|||||||||||
|
Gross margin:
|
|||||||||||
|
Health Plans
|
$
|
1,618
|
|
$
|
1,447
|
|
$
|
947
|
|
||
|
Molina Medicaid Solutions
|
21
|
|
55
|
|
53
|
|
|||||
|
Other
|
33
|
|
5
|
|
—
|
|
|||||
|
Total gross margin
|
1,672
|
|
1,507
|
|
1,000
|
|
|||||
|
Add: other operating revenues
(1)
|
851
|
|
684
|
|
434
|
|
|||||
|
Less: other operating expenses
(2)
|
(2,217
|
)
|
(1,804
|
)
|
(1,241
|
)
|
|||||
|
Operating income
|
306
|
|
387
|
|
193
|
|
|||||
|
Other expenses, net
|
101
|
|
65
|
|
58
|
|
|||||
|
Income before income tax expense
|
$
|
205
|
|
$
|
322
|
|
$
|
135
|
|
||
______________________
|
(1)
|
Other operating revenues include premium tax revenue, health insurer fee revenue, investment income and other revenue.
|
|
(2)
|
Other operating expenses include general and administrative expenses, premium tax expenses, health insurer fee expenses, and depreciation and amortization.
|
Molina Healthcare, Inc. 2016 Form 10-K | 106
21
.
Quarterly Results of Operations
(Unaudited)
The following table summarizes quarterly unaudited results of operations for the years ended
December 31, 2016
and
2015
.
|
For The Quarter Ended
|
|||||||||||||||
|
March 31,
2016 |
June 30,
2016 |
Sept. 30, 2016
|
December 31,
2016 |
||||||||||||
|
(In millions, except per-share data)
|
|||||||||||||||
|
Premium revenue
|
$
|
3,995
|
|
$
|
4,029
|
|
$
|
4,191
|
|
$
|
4,177
|
|
|||
|
Service revenue
|
140
|
|
135
|
|
133
|
|
131
|
|
|||||||
|
Operating income (loss)
|
89
|
|
105
|
|
118
|
|
(6
|
)
|
|||||||
|
Net income (loss)
|
24
|
|
33
|
|
42
|
|
(47
|
)
|
|||||||
|
Net income (loss) per share
(1)
:
|
|||||||||||||||
|
Basic
|
$
|
0.44
|
|
$
|
0.58
|
|
$
|
0.77
|
|
$
|
(0.85
|
)
|
|||
|
Diluted
|
$
|
0.43
|
|
$
|
0.58
|
|
$
|
0.76
|
|
$
|
(0.85
|
)
|
|||
|
For The Quarter Ended
|
|||||||||||||||
|
March 31,
2015 |
June 30,
2015 |
Sept. 30, 2015
|
December 31,
2015 |
||||||||||||
|
(In millions, except per-share data)
|
|||||||||||||||
|
Premium revenue
|
$
|
2,971
|
|
$
|
3,304
|
|
$
|
3,377
|
|
$
|
3,589
|
|
|||
|
Service revenue
|
52
|
|
47
|
|
47
|
|
107
|
|
|||||||
|
Operating income
|
82
|
|
116
|
|
113
|
|
76
|
|
|||||||
|
Net income
|
28
|
|
39
|
|
46
|
|
30
|
|
|||||||
|
Net income per share
(1)
:
|
|||||||||||||||
|
Basic
|
$
|
0.58
|
|
$
|
0.78
|
|
$
|
0.84
|
|
$
|
0.54
|
|
|||
|
Diluted
|
$
|
0.56
|
|
$
|
0.72
|
|
$
|
0.77
|
|
$
|
0.52
|
|
|||
_______________________________
|
(1)
|
The dilutive effect of all potentially dilutive common shares is calculated using the treasury-stock method. Certain potentially dilutive common shares issuable are not included in the computation of diluted net income per share because to do so would be anti-dilutive.
|
Molina Healthcare, Inc. 2016 Form 10-K | 107
22
.
Condensed Financial Information of Registrant
The condensed balance sheets as of
December 31, 2016
and
2015
, and the related condensed statements of income, comprehensive income and cash flows for each of the three years in the period ended
December 31, 2016
for our parent company Molina Healthcare, Inc. (the Registrant), are presented below.
Condensed Balance Sheets
|
|
December 31,
|
||||||
|
|
2016
|
2015
|
|||||
|
|
(In millions, except per-share data)
|
||||||
|
ASSETS
|
|||||||
|
Current assets:
|
|
|
|||||
|
Cash and cash equivalents
|
$
|
86
|
|
$
|
360
|
|
|
|
Investments
|
178
|
|
252
|
|
|||
|
Receivables
|
2
|
|
—
|
|
|||
|
Income taxes refundable
|
17
|
|
7
|
|
|||
|
Due from affiliates
|
104
|
|
86
|
|
|||
|
Prepaid expenses and other current assets
|
58
|
|
46
|
|
|||
|
Derivative asset
|
267
|
|
374
|
|
|||
|
Total current assets
|
712
|
|
1,125
|
|
|||
|
Property, equipment, and capitalized software, net
|
301
|
|
267
|
|
|||
|
Goodwill and intangible assets, net
|
58
|
|
61
|
|
|||
|
Investments in subsidiaries
|
2,609
|
|
2,205
|
|
|||
|
Deferred income taxes
|
10
|
|
23
|
|
|||
|
Advances to related parties and other assets
|
48
|
|
36
|
|
|||
|
|
$
|
3,738
|
|
$
|
3,717
|
|
|
|
LIABILITIES AND STOCKHOLDERS’ EQUITY
|
|||||||
|
Current liabilities:
|
|
|
|||||
|
Medical claims and benefits payable
|
$
|
1
|
|
$
|
—
|
|
|
|
Accounts payable and accrued liabilities
|
146
|
|
157
|
|
|||
|
Current portion of long-term debt
|
472
|
|
449
|
|
|||
|
Derivative liability
|
267
|
|
374
|
|
|||
|
Total current liabilities
|
886
|
|
980
|
|
|||
|
Senior notes
|
975
|
|
962
|
|
|||
|
Lease financing obligations
|
198
|
|
198
|
|
|||
|
Deferred income taxes
|
11
|
|
—
|
|
|||
|
Other long-term liabilities
|
19
|
|
20
|
|
|||
|
Total liabilities
|
2,089
|
|
2,160
|
|
|||
|
Stockholders’ equity:
|
|||||||
|
Common stock, $0.001 par value; 150 shares authorized; outstanding:
|
|
|
|||||
|
57 shares at December 31, 2016 and 56 shares at December 31, 2015
|
—
|
|
—
|
|
|||
|
Preferred stock, $0.001 par value; 20 shares authorized, no shares issued and outstanding
|
—
|
|
—
|
|
|||
|
Additional paid-in capital
|
841
|
|
803
|
|
|||
|
Accumulated other comprehensive loss
|
(2
|
)
|
(4
|
)
|
|||
|
Retained earnings
|
810
|
|
758
|
|
|||
|
Total stockholders’ equity
|
1,649
|
|
1,557
|
|
|||
|
|
$
|
3,738
|
|
$
|
3,717
|
|
|
See accompanying notes.
Molina Healthcare, Inc. 2016 Form 10-K | 108
Condensed Statements of Income
|
|
Year Ended December 31,
|
||||||||||
|
|
2016
|
2015
|
2014
|
||||||||
|
|
(In millions)
|
||||||||||
|
Revenue:
|
|
|
|
||||||||
|
Management fees
|
$
|
1,062
|
|
$
|
914
|
|
$
|
692
|
|
||
|
Investment income and other revenue
|
16
|
|
17
|
|
14
|
|
|||||
|
Total revenue
|
1,078
|
|
931
|
|
706
|
|
|||||
|
Expenses:
|
|
|
|||||||||
|
Medical care costs
|
73
|
|
55
|
|
46
|
|
|||||
|
General and administrative expenses
|
899
|
|
797
|
|
583
|
|
|||||
|
Depreciation and amortization
|
95
|
|
82
|
|
73
|
|
|||||
|
Total operating expenses
|
1,067
|
|
934
|
|
702
|
|
|||||
|
Operating income (loss)
|
11
|
|
(3
|
)
|
4
|
|
|||||
|
Interest expense
|
101
|
|
66
|
|
57
|
|
|||||
|
Other expense
|
—
|
|
—
|
|
1
|
|
|||||
|
Loss before income taxes and equity in net income of subsidiaries
|
(90
|
)
|
(69
|
)
|
(54
|
)
|
|||||
|
Income tax benefit
|
(24
|
)
|
(21
|
)
|
(27
|
)
|
|||||
|
Net loss before equity in net income of subsidiaries
|
(66
|
)
|
(48
|
)
|
(27
|
)
|
|||||
|
Equity in net income of subsidiaries
|
118
|
|
191
|
|
89
|
|
|||||
|
Net income
|
$
|
52
|
|
$
|
143
|
|
$
|
62
|
|
||
Condensed Statements of Comprehensive Income
|
Year Ended December 31,
|
|||||||||||
|
2016
|
2015
|
2014
|
|||||||||
|
(In millions)
|
|||||||||||
|
Net income
|
$
|
52
|
|
$
|
143
|
|
$
|
62
|
|
||
|
Other comprehensive income (loss):
|
|||||||||||
|
Unrealized investment gain (loss)
|
3
|
|
(5
|
)
|
—
|
|
|||||
|
Less: effect of income taxes
|
1
|
|
(2
|
)
|
—
|
|
|||||
|
Other comprehensive income (loss), net of tax
|
2
|
|
(3
|
)
|
—
|
|
|||||
|
Comprehensive income
|
$
|
54
|
|
$
|
140
|
|
$
|
62
|
|
||
See accompanying notes.
Molina Healthcare, Inc. 2016 Form 10-K | 109
Condensed Statements of Cash Flows
|
|
Year Ended December 31,
|
||||||||||
|
|
2016
|
2015
|
2014
|
||||||||
|
|
(In millions)
|
||||||||||
|
Operating activities:
|
|
|
|
||||||||
|
Net cash provided by operating activities
|
$
|
55
|
|
$
|
113
|
|
$
|
74
|
|
||
|
Investing activities:
|
|
|
|||||||||
|
Capital contributions to subsidiaries
|
(386
|
)
|
(770
|
)
|
(292
|
)
|
|||||
|
Dividends received from subsidiaries
|
101
|
|
142
|
|
—
|
|
|||||
|
Purchases of investments
|
(115
|
)
|
(244
|
)
|
(129
|
)
|
|||||
|
Proceeds from sales and maturities of investments
|
188
|
|
118
|
|
263
|
|
|||||
|
Purchases of property, equipment and capitalized software
|
(125
|
)
|
(91
|
)
|
(94
|
)
|
|||||
|
Change in amounts due to/from affiliates
|
(18
|
)
|
(68
|
)
|
16
|
|
|||||
|
Other, net
|
6
|
|
—
|
|
8
|
|
|||||
|
Net cash used in investing activities
|
(349
|
)
|
(913
|
)
|
(228
|
)
|
|||||
|
Financing activities:
|
|
|
|||||||||
|
Proceeds from senior notes offerings, net of issuance costs
|
—
|
|
689
|
|
123
|
|
|||||
|
Proceeds from common stock offering, net of issuance costs
|
—
|
|
373
|
|
—
|
|
|||||
|
Proceeds from employee stock plans
|
18
|
|
18
|
|
14
|
|
|||||
|
Principal payments on convertible senior notes
|
—
|
|
—
|
|
(11
|
)
|
|||||
|
Other, net
|
2
|
|
5
|
|
3
|
|
|||||
|
Net cash provided by financing activities
|
20
|
|
1,085
|
|
129
|
|
|||||
|
Net (decrease) increase in cash and cash equivalents
|
(274
|
)
|
285
|
|
(25
|
)
|
|||||
|
Cash and cash equivalents at beginning of year
|
360
|
|
75
|
|
100
|
|
|||||
|
Cash and cash equivalents at end of year
|
$
|
86
|
|
$
|
360
|
|
$
|
75
|
|
||
See accompanying notes.
Notes to Condensed Financial Information of Registrant
Note A - Basis of Presentation
The Registrant was incorporated in 2002. Prior to that date, Molina Healthcare of California (formerly known as Molina Medical Centers) operated as a California health plan and as the parent company for three other state health plans. In June 2003, the employees and operations of the corporate entity were transferred from Molina Healthcare of California to the Registrant.
The Registrant’s investment in subsidiaries is stated at cost plus equity in undistributed earnings of subsidiaries since the date of acquisition. The accompanying condensed financial information of the Registrant should be read in conjunction with the consolidated financial statements and accompanying notes.
Note B - Transactions with Subsidiaries
The Registrant provides certain centralized medical and administrative services to its subsidiaries pursuant to administrative services agreements, including medical affairs and quality management, health education, credentialing, management, financial, legal, information systems and human resources services. Fees are based on the fair market value of services rendered and are recorded as operating revenue. Payment is subordinated to the subsidiaries’ ability to comply with minimum capital and other restrictive financial requirements of the states in which they operate. Charges in
2016
,
2015
, and
2014
for these services amounted to
$1,062 million
,
$914 million
, and
$692 million
, respectively, and are included in operating revenue.
The Registrant and its subsidiaries are included in the consolidated federal and state income tax returns filed by the Registrant. Income taxes are allocated to each subsidiary in accordance with an intercompany tax allocation agreement. The agreement allocates income taxes in an amount generally equivalent to the amount which would
Molina Healthcare, Inc. 2016 Form 10-K | 110
be expensed by the subsidiary if it filed a separate tax return. Net operating loss benefits are paid to the subsidiary by the Registrant to the extent such losses are utilized in the consolidated tax returns.
Note C - Dividends and Capital Contributions
When the Registrant receives dividends from its subsidiaries, such amounts are recorded as a reduction to the investments in the respective subsidiaries.
For all periods presented, the Registrant made capital contributions to certain subsidiaries primarily to comply with minimum net worth requirements and to fund business combinations. Such amounts have been recorded as an increase in investment in the respective subsidiaries, net of insignificant returns of capital.
Note D - Related Party Transactions
The Registrant’s related party transactions are described in Note
17
, “
Related Party Transactions
.”
Molina Healthcare, Inc. 2016 Form 10-K | 111
23
.
Supplemental Condensed Consolidating Financial Information
As discussed in Note
12
, “
Debt
,” in November 2015 we completed the private offering of
$700 million
aggregate principal amount of
5.375%
Notes, which were subsequently exchanged for registered notes in September 2016.
The
5.375%
Notes are fully and unconditionally guaranteed by certain of our wholly owned subsidiaries on a joint and several basis, with exceptions considered customary for such guarantees. The
5.375%
Notes and the guarantees are effectively subordinated to all existing and future secured debt of us and our guarantors to the extent of the assets securing such debt. In addition, the
5.375%
Notes and the guarantees are structurally subordinated to all indebtedness and other liabilities and preferred stock of our subsidiaries that do not guarantee the
5.375%
Notes.
In January 2017, pursuant to the terms of the amended Credit Facility described in Note 12, “Debt,” and the terms of the indenture governing the 5.375% Notes, all guarantors immediately prior to January 3, 2017 other than Molina Information Systems, LLC, d/b/a Molina Medicaid Solutions, Molina Pathways, LLC and Pathways Health and Community Support LLC were automatically and unconditionally released as guarantors of our amended Credit Facility and the 5.375% Notes.
The following condensed consolidating financial statements present Molina Healthcare, Inc. (as parent guarantor), the subsidiary guarantors, the subsidiary non-guarantors and eliminations.
MOLINA HEALTHCARE, INC.
CONDENSED CONSOLIDATING STATEMENTS OF INCOME
|
Year Ended December 31, 2016
|
|||||||||||||||||||
|
Parent Guarantor
|
Other Guarantors
|
Non-Guarantors
|
Eliminations
|
Consolidated
|
|||||||||||||||
|
(In millions)
|
|||||||||||||||||||
|
Revenue:
|
|||||||||||||||||||
|
Total revenue
|
$
|
1,078
|
|
$
|
556
|
|
$
|
17,287
|
|
$
|
(1,139
|
)
|
$
|
17,782
|
|
||||
|
Expenses:
|
|||||||||||||||||||
|
Medical care costs
|
73
|
|
54
|
|
14,705
|
|
(58
|
)
|
14,774
|
|
|||||||||
|
Cost of service revenue
|
—
|
|
443
|
|
42
|
|
—
|
|
485
|
|
|||||||||
|
General and administrative expenses
|
899
|
|
48
|
|
1,527
|
|
(1,081
|
)
|
1,393
|
|
|||||||||
|
Premium tax expenses
|
—
|
|
—
|
|
468
|
|
—
|
|
468
|
|
|||||||||
|
Health insurer fee expenses
|
—
|
|
—
|
|
217
|
|
—
|
|
217
|
|
|||||||||
|
Depreciation and amortization
|
95
|
|
12
|
|
32
|
|
—
|
|
139
|
|
|||||||||
|
Total operating expenses
|
1,067
|
|
557
|
|
16,991
|
|
(1,139
|
)
|
17,476
|
|
|||||||||
|
Operating income (loss)
|
11
|
|
(1
|
)
|
296
|
|
—
|
|
306
|
|
|||||||||
|
Interest expense
|
101
|
|
—
|
|
—
|
|
—
|
|
101
|
|
|||||||||
|
(Loss) income before income taxes
|
(90
|
)
|
(1
|
)
|
296
|
|
—
|
|
205
|
|
|||||||||
|
Income tax (benefit) expense
|
(24
|
)
|
(4
|
)
|
181
|
|
—
|
|
153
|
|
|||||||||
|
Net (loss) income before equity in earnings of subsidiaries
|
(66
|
)
|
3
|
|
115
|
|
—
|
|
52
|
|
|||||||||
|
Equity in net earnings of subsidiaries
|
118
|
|
1
|
|
—
|
|
(119
|
)
|
—
|
|
|||||||||
|
Net income
|
$
|
52
|
|
$
|
4
|
|
$
|
115
|
|
$
|
(119
|
)
|
$
|
52
|
|
||||
Molina Healthcare, Inc. 2016 Form 10-K | 112
|
Year Ended December 31, 2015
|
|||||||||||||||||||
|
Parent Guarantor
|
Other Guarantors
|
Non-Guarantors
|
Eliminations
|
Consolidated
|
|||||||||||||||
|
(In millions)
|
|||||||||||||||||||
|
Revenue:
|
|||||||||||||||||||
|
Total revenue
|
$
|
931
|
|
$
|
293
|
|
$
|
13,931
|
|
$
|
(977
|
)
|
$
|
14,178
|
|
||||
|
Expenses:
|
|||||||||||||||||||
|
Medical care costs
|
55
|
|
36
|
|
11,753
|
|
(50
|
)
|
11,794
|
|
|||||||||
|
Cost of service revenue
|
—
|
|
184
|
|
9
|
|
—
|
|
193
|
|
|||||||||
|
General and administrative expenses
|
797
|
|
41
|
|
1,235
|
|
(927
|
)
|
1,146
|
|
|||||||||
|
Premium tax expenses
|
—
|
|
—
|
|
397
|
|
—
|
|
397
|
|
|||||||||
|
Health insurer fee expenses
|
—
|
|
—
|
|
157
|
|
—
|
|
157
|
|
|||||||||
|
Depreciation and amortization
|
82
|
|
4
|
|
18
|
|
—
|
|
104
|
|
|||||||||
|
Total operating expenses
|
934
|
|
265
|
|
13,569
|
|
(977
|
)
|
13,791
|
|
|||||||||
|
Operating (loss) income
|
(3
|
)
|
28
|
|
362
|
|
—
|
|
387
|
|
|||||||||
|
Total other expenses (income), net
|
66
|
|
—
|
|
(1
|
)
|
—
|
|
65
|
|
|||||||||
|
(Loss) income before income taxes
|
(69
|
)
|
28
|
|
363
|
|
—
|
|
322
|
|
|||||||||
|
Income tax (benefit) expense
|
(21
|
)
|
9
|
|
191
|
|
—
|
|
179
|
|
|||||||||
|
Net (loss) income before equity in earnings of subsidiaries
|
(48
|
)
|
19
|
|
172
|
|
—
|
|
143
|
|
|||||||||
|
Equity in net earnings of subsidiaries
|
191
|
|
(1
|
)
|
—
|
|
(190
|
)
|
—
|
|
|||||||||
|
Net income
|
$
|
143
|
|
$
|
18
|
|
$
|
172
|
|
$
|
(190
|
)
|
$
|
143
|
|
||||
|
Year Ended December 31, 2014
|
|||||||||||||||||||
|
Parent Guarantor
|
Other Guarantors
|
Non-Guarantors
|
Eliminations
|
Consolidated
|
|||||||||||||||
|
(In millions)
|
|||||||||||||||||||
|
Revenue:
|
|||||||||||||||||||
|
Total revenue
|
$
|
706
|
|
$
|
240
|
|
$
|
9,454
|
|
$
|
(733
|
)
|
$
|
9,667
|
|
||||
|
Expenses:
|
|||||||||||||||||||
|
Medical care costs
|
46
|
|
27
|
|
8,034
|
|
(31
|
)
|
8,076
|
|
|||||||||
|
Cost of service revenue
|
—
|
|
157
|
|
—
|
|
—
|
|
157
|
|
|||||||||
|
General and administrative expenses
|
583
|
|
29
|
|
855
|
|
(702
|
)
|
765
|
|
|||||||||
|
Premium tax expenses
|
—
|
|
—
|
|
294
|
|
—
|
|
294
|
|
|||||||||
|
Health insurer fee expenses
|
—
|
|
—
|
|
89
|
|
—
|
|
89
|
|
|||||||||
|
Depreciation and amortization
|
73
|
|
5
|
|
15
|
|
—
|
|
93
|
|
|||||||||
|
Total operating expenses
|
702
|
|
218
|
|
9,287
|
|
(733
|
)
|
9,474
|
|
|||||||||
|
Operating income
|
4
|
|
22
|
|
167
|
|
—
|
|
193
|
|
|||||||||
|
Total other expenses, net
|
58
|
|
—
|
|
—
|
|
—
|
|
58
|
|
|||||||||
|
(Loss) income before income taxes
|
(54
|
)
|
22
|
|
167
|
|
—
|
|
135
|
|
|||||||||
|
Income tax (benefit) expense
|
(27
|
)
|
8
|
|
92
|
|
—
|
|
73
|
|
|||||||||
|
Net (loss) income before equity in earnings of subsidiaries
|
(27
|
)
|
14
|
|
75
|
|
—
|
|
62
|
|
|||||||||
|
Equity in net earnings of subsidiaries
|
89
|
|
—
|
|
—
|
|
(89
|
)
|
—
|
|
|||||||||
|
Net income
|
$
|
62
|
|
$
|
14
|
|
$
|
75
|
|
$
|
(89
|
)
|
$
|
62
|
|
||||
Molina Healthcare, Inc. 2016 Form 10-K | 113
MOLINA HEALTHCARE, INC.
CONDENSED CONSOLIDATING STATEMENTS OF COMPREHENSIVE INCOME
|
Year Ended December 31, 2016
|
|||||||||||||||||||
|
Parent Guarantor
|
Other Guarantors
|
Non-Guarantors
|
Eliminations
|
Consolidated
|
|||||||||||||||
|
(In millions)
|
|||||||||||||||||||
|
Net income
|
$
|
52
|
|
$
|
4
|
|
$
|
115
|
|
$
|
(119
|
)
|
$
|
52
|
|
||||
|
Other comprehensive income, net of tax
|
2
|
|
—
|
|
1
|
|
(1
|
)
|
2
|
|
|||||||||
|
Comprehensive income
|
$
|
54
|
|
$
|
4
|
|
$
|
116
|
|
$
|
(120
|
)
|
$
|
54
|
|
||||
|
Year Ended December 31, 2015
|
|||||||||||||||||||
|
Parent Guarantor
|
Other Guarantors
|
Non-Guarantors
|
Eliminations
|
Consolidated
|
|||||||||||||||
|
(In millions)
|
|||||||||||||||||||
|
Net income
|
$
|
143
|
|
$
|
18
|
|
$
|
172
|
|
$
|
(190
|
)
|
$
|
143
|
|
||||
|
Other comprehensive loss, net of tax
|
(3
|
)
|
—
|
|
(3
|
)
|
3
|
|
(3
|
)
|
|||||||||
|
Comprehensive income
|
$
|
140
|
|
$
|
18
|
|
$
|
169
|
|
$
|
(187
|
)
|
$
|
140
|
|
||||
|
Year Ended December 31, 2014
|
|||||||||||||||||||
|
Parent Guarantor
|
Other Guarantors
|
Non-Guarantors
|
Eliminations
|
Consolidated
|
|||||||||||||||
|
(In millions)
|
|||||||||||||||||||
|
Net income
|
$
|
62
|
|
$
|
14
|
|
$
|
75
|
|
$
|
(89
|
)
|
$
|
62
|
|
||||
|
Other comprehensive loss, net of tax
|
—
|
|
—
|
|
—
|
|
—
|
|
—
|
|
|||||||||
|
Comprehensive income
|
$
|
62
|
|
$
|
14
|
|
$
|
75
|
|
$
|
(89
|
)
|
$
|
62
|
|
||||
Molina Healthcare, Inc. 2016 Form 10-K | 114
MOLINA HEALTHCARE, INC.
CONDENSED CONSOLIDATING BALANCE SHEETS
|
December 31, 2016
|
|||||||||||||||||||
|
Parent Guarantor
|
Other Guarantors
|
Non-Guarantors
|
Eliminations
|
Consolidated
|
|||||||||||||||
|
(In millions)
|
|||||||||||||||||||
|
ASSETS
|
|||||||||||||||||||
|
Current assets:
|
|||||||||||||||||||
|
Cash and cash equivalents
|
$
|
86
|
|
$
|
38
|
|
$
|
2,695
|
|
$
|
—
|
|
$
|
2,819
|
|
||||
|
Investments
|
178
|
|
—
|
|
1,580
|
|
—
|
|
1,758
|
|
|||||||||
|
Receivables
|
2
|
|
78
|
|
894
|
|
—
|
|
974
|
|
|||||||||
|
Income tax refundable
|
17
|
|
4
|
|
18
|
|
—
|
|
39
|
|
|||||||||
|
Due from (to) affiliates
|
104
|
|
(19
|
)
|
(85
|
)
|
—
|
|
—
|
|
|||||||||
|
Prepaid expenses and other current assets
|
58
|
|
40
|
|
38
|
|
(5
|
)
|
131
|
|
|||||||||
|
Derivative asset
|
267
|
|
—
|
|
—
|
|
—
|
|
267
|
|
|||||||||
|
Total current assets
|
712
|
|
141
|
|
5,140
|
|
(5
|
)
|
5,988
|
|
|||||||||
|
Property, equipment, and capitalized software, net
|
301
|
|
70
|
|
83
|
|
—
|
|
454
|
|
|||||||||
|
Deferred contract costs
|
—
|
|
86
|
|
—
|
|
—
|
|
86
|
|
|||||||||
|
Goodwill and intangible assets, net
|
58
|
|
223
|
|
479
|
|
—
|
|
760
|
|
|||||||||
|
Restricted investments
|
—
|
|
—
|
|
110
|
|
—
|
|
110
|
|
|||||||||
|
Investment in subsidiaries, net
|
2,609
|
|
42
|
|
—
|
|
(2,651
|
)
|
—
|
|
|||||||||
|
Deferred income taxes
|
10
|
|
—
|
|
—
|
|
—
|
|
10
|
|
|||||||||
|
Other assets
|
48
|
|
4
|
|
5
|
|
(16
|
)
|
41
|
|
|||||||||
|
$
|
3,738
|
|
$
|
566
|
|
$
|
5,817
|
|
$
|
(2,672
|
)
|
$
|
7,449
|
|
|||||
|
LIABILITIES AND STOCKHOLDERS’ EQUITY
|
|||||||||||||||||||
|
Current liabilities:
|
|||||||||||||||||||
|
Medical claims and benefits payable
|
$
|
1
|
|
$
|
—
|
|
$
|
1,928
|
|
$
|
—
|
|
$
|
1,929
|
|
||||
|
Amounts due government agencies
|
—
|
|
—
|
|
1,202
|
|
—
|
|
1,202
|
|
|||||||||
|
Accounts payable and accrued liabilities
|
146
|
|
56
|
|
188
|
|
(5
|
)
|
385
|
|
|||||||||
|
Deferred revenue
|
—
|
|
40
|
|
275
|
|
—
|
|
315
|
|
|||||||||
|
Current portion of long-term debt
|
472
|
|
—
|
|
—
|
|
—
|
|
472
|
|
|||||||||
|
Derivative liability
|
267
|
|
—
|
|
—
|
|
—
|
|
267
|
|
|||||||||
|
Total current liabilities
|
886
|
|
96
|
|
3,593
|
|
(5
|
)
|
4,570
|
|
|||||||||
|
Long-term debt
|
1,173
|
|
—
|
|
16
|
|
(16
|
)
|
1,173
|
|
|||||||||
|
Deferred income taxes
|
11
|
|
40
|
|
(36
|
)
|
—
|
|
15
|
|
|||||||||
|
Other long-term liabilities
|
19
|
|
3
|
|
20
|
|
—
|
|
42
|
|
|||||||||
|
Total liabilities
|
2,089
|
|
139
|
|
3,593
|
|
(21
|
)
|
5,800
|
|
|||||||||
|
Total stockholders’ equity
|
1,649
|
|
427
|
|
2,224
|
|
(2,651
|
)
|
1,649
|
|
|||||||||
|
$
|
3,738
|
|
$
|
566
|
|
$
|
5,817
|
|
$
|
(2,672
|
)
|
$
|
7,449
|
|
|||||
Molina Healthcare, Inc. 2016 Form 10-K | 115
MOLINA HEALTHCARE, INC.
CONDENSED CONSOLIDATING BALANCE SHEETS
|
December 31, 2015
|
|||||||||||||||||||
|
Parent Guarantor
|
Other Guarantors
|
Non-Guarantors
|
Eliminations
|
Consolidated
|
|||||||||||||||
|
(In millions)
|
|||||||||||||||||||
|
ASSETS
|
|||||||||||||||||||
|
Current assets:
|
|||||||||||||||||||
|
Cash and cash equivalents
|
$
|
360
|
|
$
|
42
|
|
$
|
1,927
|
|
$
|
—
|
|
$
|
2,329
|
|
||||
|
Investments
|
252
|
|
—
|
|
1,549
|
|
—
|
|
1,801
|
|
|||||||||
|
Receivables
|
—
|
|
79
|
|
518
|
|
—
|
|
597
|
|
|||||||||
|
Income tax refundable
|
7
|
|
3
|
|
3
|
|
—
|
|
13
|
|
|||||||||
|
Due from (to) affiliates
|
86
|
|
(4
|
)
|
(82
|
)
|
—
|
|
—
|
|
|||||||||
|
Prepaid expenses and other current assets
|
46
|
|
11
|
|
136
|
|
(1
|
)
|
192
|
|
|||||||||
|
Derivative asset
|
374
|
|
—
|
|
—
|
|
—
|
|
374
|
|
|||||||||
|
Total current assets
|
1,125
|
|
131
|
|
4,051
|
|
(1
|
)
|
5,306
|
|
|||||||||
|
Property, equipment, and capitalized software, net
|
267
|
|
52
|
|
74
|
|
—
|
|
393
|
|
|||||||||
|
Deferred contract costs
|
—
|
|
81
|
|
—
|
|
—
|
|
81
|
|
|||||||||
|
Goodwill and intangible assets, net
|
61
|
|
246
|
|
334
|
|
—
|
|
641
|
|
|||||||||
|
Restricted investments
|
—
|
|
—
|
|
109
|
|
—
|
|
109
|
|
|||||||||
|
Investment in subsidiaries, net
|
2,205
|
|
1
|
|
—
|
|
(2,206
|
)
|
—
|
|
|||||||||
|
Deferred income taxes
|
23
|
|
(35
|
)
|
30
|
|
—
|
|
18
|
|
|||||||||
|
Other assets
|
36
|
|
2
|
|
6
|
|
(16
|
)
|
28
|
|
|||||||||
|
$
|
3,717
|
|
$
|
478
|
|
$
|
4,604
|
|
$
|
(2,223
|
)
|
$
|
6,576
|
|
|||||
|
LIABILITIES AND STOCKHOLDERS’ EQUITY
|
|||||||||||||||||||
|
Current liabilities:
|
|||||||||||||||||||
|
Medical claims and benefits payable
|
$
|
—
|
|
$
|
3
|
|
$
|
1,682
|
|
$
|
—
|
|
$
|
1,685
|
|
||||
|
Amounts due government agencies
|
—
|
|
1
|
|
728
|
|
—
|
|
729
|
|
|||||||||
|
Accounts payable and accrued liabilities
|
157
|
|
35
|
|
170
|
|
—
|
|
362
|
|
|||||||||
|
Deferred revenue
|
—
|
|
34
|
|
189
|
|
—
|
|
223
|
|
|||||||||
|
Current portion of long-term debt
|
449
|
|
—
|
|
—
|
|
—
|
|
449
|
|
|||||||||
|
Derivative liability
|
374
|
|
—
|
|
—
|
|
—
|
|
374
|
|
|||||||||
|
Total current liabilities
|
980
|
|
73
|
|
2,769
|
|
—
|
|
3,822
|
|
|||||||||
|
Long-term debt
|
1,160
|
|
—
|
|
16
|
|
(16
|
)
|
1,160
|
|
|||||||||
|
Other long-term liabilities
|
20
|
|
2
|
|
16
|
|
(1
|
)
|
37
|
|
|||||||||
|
Total liabilities
|
2,160
|
|
75
|
|
2,801
|
|
(17
|
)
|
5,019
|
|
|||||||||
|
Total stockholders’ equity
|
1,557
|
|
403
|
|
1,803
|
|
(2,206
|
)
|
1,557
|
|
|||||||||
|
$
|
3,717
|
|
$
|
478
|
|
$
|
4,604
|
|
$
|
(2,223
|
)
|
$
|
6,576
|
|
|||||
Molina Healthcare, Inc. 2016 Form 10-K | 116
MOLINA HEALTHCARE, INC.
CONDENSED CONSOLIDATING STATEMENTS OF CASH FLOWS
|
Year Ended December 31, 2016
|
|||||||||||||||||||
|
Parent Guarantor
|
Other Guarantors
|
Non-Guarantors
|
Eliminations
|
Consolidated
|
|||||||||||||||
|
(In millions)
|
|||||||||||||||||||
|
Operating activities:
|
|||||||||||||||||||
|
Net cash provided by operating activities
|
$
|
55
|
|
45
|
|
573
|
|
—
|
|
$
|
673
|
|
|||||||
|
Investing activities:
|
|||||||||||||||||||
|
Purchases of investments
|
(115
|
)
|
—
|
|
(1,814
|
)
|
—
|
|
(1,929
|
)
|
|||||||||
|
Proceeds from sales and maturities of investments
|
188
|
|
—
|
|
1,778
|
|
—
|
|
1,966
|
|
|||||||||
|
Purchases of property, equipment and capitalized software
|
(125
|
)
|
(34
|
)
|
(17
|
)
|
—
|
|
(176
|
)
|
|||||||||
|
Decrease in restricted investments
|
—
|
|
—
|
|
4
|
|
—
|
|
4
|
|
|||||||||
|
Net cash paid in business combinations
|
—
|
|
(11
|
)
|
(37
|
)
|
—
|
|
(48
|
)
|
|||||||||
|
Capital contributions to subsidiaries
|
(386
|
)
|
20
|
|
366
|
|
—
|
|
—
|
|
|||||||||
|
Dividends received from subsidiaries
|
101
|
|
—
|
|
(101
|
)
|
—
|
|
—
|
|
|||||||||
|
Change in amounts due to/from affiliates
|
(18
|
)
|
3
|
|
15
|
|
—
|
|
—
|
|
|||||||||
|
Other, net
|
6
|
|
(26
|
)
|
1
|
|
—
|
|
(19
|
)
|
|||||||||
|
Net cash (used in) provided by investing activities
|
(349
|
)
|
(48
|
)
|
195
|
|
—
|
|
(202
|
)
|
|||||||||
|
Financing activities:
|
|||||||||||||||||||
|
Proceeds from employee stock plans
|
18
|
|
—
|
|
—
|
|
—
|
|
18
|
|
|||||||||
|
Other, net
|
2
|
|
(1
|
)
|
—
|
|
—
|
|
1
|
|
|||||||||
|
Net cash provided by (used in) financing activities
|
20
|
|
(1
|
)
|
—
|
|
—
|
|
19
|
|
|||||||||
|
Net (decrease) increase in cash and cash equivalents
|
(274
|
)
|
(4
|
)
|
768
|
|
—
|
|
490
|
|
|||||||||
|
Cash and cash equivalents at beginning of period
|
360
|
|
42
|
|
1,927
|
|
—
|
|
2,329
|
|
|||||||||
|
Cash and cash equivalents at end of period
|
$
|
86
|
|
$
|
38
|
|
$
|
2,695
|
|
$
|
—
|
|
$
|
2,819
|
|
||||
Molina Healthcare, Inc. 2016 Form 10-K | 117
|
Year Ended December 31, 2015
|
|||||||||||||||||||
|
Parent Guarantor
|
Other Guarantors
|
Non-Guarantors
|
Eliminations
|
Consolidated
|
|||||||||||||||
|
(In millions)
|
|||||||||||||||||||
|
Operating activities:
|
|||||||||||||||||||
|
Net cash provided by operating activities
|
$
|
113
|
|
58
|
|
954
|
|
—
|
|
$
|
1,125
|
|
|||||||
|
Investing activities:
|
|||||||||||||||||||
|
Purchases of investments
|
(244
|
)
|
—
|
|
(1,679
|
)
|
—
|
|
(1,923
|
)
|
|||||||||
|
Proceeds from sales and maturities of investments
|
118
|
|
—
|
|
1,008
|
|
—
|
|
1,126
|
|
|||||||||
|
Purchases of property, equipment and capitalized software
|
(91
|
)
|
(23
|
)
|
(18
|
)
|
—
|
|
(132
|
)
|
|||||||||
|
Decrease in restricted investments
|
—
|
|
5
|
|
(11
|
)
|
—
|
|
(6
|
)
|
|||||||||
|
Net cash paid in business combinations
|
—
|
|
(214
|
)
|
(236
|
)
|
—
|
|
(450
|
)
|
|||||||||
|
Capital contributions to subsidiaries
|
(770
|
)
|
238
|
|
532
|
|
—
|
|
—
|
|
|||||||||
|
Dividends received from subsidiaries
|
142
|
|
(17
|
)
|
(125
|
)
|
—
|
|
—
|
|
|||||||||
|
Change in amounts due to/from affiliates
|
(68
|
)
|
15
|
|
53
|
|
—
|
|
—
|
|
|||||||||
|
Other, net
|
—
|
|
(35
|
)
|
—
|
|
—
|
|
(35
|
)
|
|||||||||
|
Net cash used in investing activities
|
(913
|
)
|
(31
|
)
|
(476
|
)
|
—
|
|
(1,420
|
)
|
|||||||||
|
Financing activities:
|
|||||||||||||||||||
|
Proceeds from senior notes offerings, net of issuance costs
|
689
|
|
—
|
|
—
|
|
—
|
|
689
|
|
|||||||||
|
Proceeds from common stock offering, net of issuance costs
|
373
|
|
—
|
|
—
|
|
—
|
|
373
|
|
|||||||||
|
Proceeds from employee stock plans
|
18
|
|
—
|
|
—
|
|
—
|
|
18
|
|
|||||||||
|
Other, net
|
5
|
|
—
|
|
—
|
|
—
|
|
5
|
|
|||||||||
|
Net cash provided by financing activities
|
1,085
|
|
—
|
|
—
|
|
—
|
|
1,085
|
|
|||||||||
|
Net increase in cash and cash equivalents
|
285
|
|
27
|
|
478
|
|
—
|
|
790
|
|
|||||||||
|
Cash and cash equivalents at beginning of period
|
75
|
|
15
|
|
1,449
|
|
—
|
|
1,539
|
|
|||||||||
|
Cash and cash equivalents at end of period
|
$
|
360
|
|
$
|
42
|
|
$
|
1,927
|
|
$
|
—
|
|
$
|
2,329
|
|
||||
Molina Healthcare, Inc. 2016 Form 10-K | 118
|
Year Ended December 31, 2014
|
|||||||||||||||||||
|
Parent Guarantor
|
Other Guarantors
|
Non-Guarantors
|
Eliminations
|
Consolidated
|
|||||||||||||||
|
(In millions)
|
|||||||||||||||||||
|
Operating activities:
|
|||||||||||||||||||
|
Net cash provided by operating activities
|
$
|
74
|
|
29
|
|
957
|
|
—
|
|
$
|
1,060
|
|
|||||||
|
Investing activities:
|
|||||||||||||||||||
|
Purchases of investments
|
(129
|
)
|
—
|
|
(824
|
)
|
—
|
|
(953
|
)
|
|||||||||
|
Proceeds from sales and maturities of investments
|
263
|
|
—
|
|
370
|
|
—
|
|
633
|
|
|||||||||
|
Purchases of property, equipment and capitalized software
|
(94
|
)
|
(12
|
)
|
(9
|
)
|
—
|
|
(115
|
)
|
|||||||||
|
Decrease in restricted investments
|
—
|
|
5
|
|
(39
|
)
|
—
|
|
(34
|
)
|
|||||||||
|
Net cash paid in business combinations
|
—
|
|
—
|
|
(44
|
)
|
—
|
|
(44
|
)
|
|||||||||
|
Capital contributions to subsidiaries
|
(292
|
)
|
14
|
|
278
|
|
—
|
|
—
|
|
|||||||||
|
Dividends received from subsidiaries
|
—
|
|
—
|
|
—
|
|
—
|
|
—
|
|
|||||||||
|
Change in amounts due to/from affiliates
|
16
|
|
(1
|
)
|
(15
|
)
|
—
|
|
—
|
|
|||||||||
|
Other, net
|
8
|
|
(29
|
)
|
(2
|
)
|
—
|
|
(23
|
)
|
|||||||||
|
Net cash used in investing activities
|
(228
|
)
|
(23
|
)
|
(285
|
)
|
—
|
|
(536
|
)
|
|||||||||
|
Financing activities:
|
|||||||||||||||||||
|
Proceeds from senior notes offerings, net of issuance costs
|
123
|
|
—
|
|
—
|
|
—
|
|
123
|
|
|||||||||
|
Contingent consideration liabilities settled
|
—
|
|
—
|
|
(50
|
)
|
—
|
|
(50
|
)
|
|||||||||
|
Proceeds from employee stock plans
|
14
|
|
—
|
|
—
|
|
—
|
|
14
|
|
|||||||||
|
Principal payments on convertible senior notes
|
(10
|
)
|
—
|
|
—
|
|
—
|
|
(10
|
)
|
|||||||||
|
Other, net
|
2
|
|
—
|
|
—
|
|
—
|
|
2
|
|
|||||||||
|
Net cash provided by (used in) financing activities
|
129
|
|
—
|
|
(50
|
)
|
—
|
|
79
|
|
|||||||||
|
Net (decrease) increase in cash and cash equivalents
|
(25
|
)
|
6
|
|
622
|
|
—
|
|
603
|
|
|||||||||
|
Cash and cash equivalents at beginning of period
|
100
|
|
9
|
|
827
|
|
—
|
|
936
|
|
|||||||||
|
Cash and cash equivalents at end of period
|
$
|
75
|
|
$
|
15
|
|
$
|
1,449
|
|
$
|
—
|
|
$
|
1,539
|
|
||||
Molina Healthcare, Inc. 2016 Form 10-K | 119
DIRECTORS, EXECUTIVE OFFICERS, AND CORPORATE GOVERNANCE
The following sets forth certain information regarding our executive officers, including the business experience of each executive officer during the past five years:
|
Name
|
Age
|
Position
|
|
J. Mario Molina, M.D.
|
58
|
President and Chief Executive Officer
|
|
John C. Molina, J.D.
|
52
|
Chief Financial Officer
|
|
Terry P. Bayer
|
66
|
Chief Operating Officer
|
|
Joseph W. White
|
58
|
Chief Accounting Officer
|
|
Jeff D. Barlow
|
54
|
Chief Legal Officer and Corporate Secretary
|
Dr. Molina
has served as President and Chief Executive Officer since succeeding his father and company founder, Dr. C. David Molina, in 1996. He has also served as Chairman of the Board of Directors since 1996. Dr. Molina is the brother of John C. Molina.
Mr. Molina
has served as Chief Financial Officer since 1995. He also has served as a member of the Board of Directors since 1994. Mr. Molina is the brother of Dr. J. Mario Molina.
Ms. Bayer
has served as Chief Operating Officer since 2005.
Mr. White
has served as Chief Accounting Officer since 2007.
Mr. Barlow
has served as Chief Legal Officer and Corporate Secretary since 2010.
The remaining information called for by Item 10 of Form 10-K is incorporated by reference to “Election of Directors,” “Corporate Governance and Board of Directors Matters,” and “Section 16(a) Beneficial Ownership Reporting Compliance” in our definitive proxy statement for our
2017
Annual Meeting of Stockholders.
EXHIBITS AND FINANCIAL STATEMENT SCHEDULES
|
(a)
|
The consolidated financial statements and exhibits listed below are filed as part of this report.
|
|
(1)
|
The financial statements included in Financial Statements and Supplementary Data, above, are filed as part of this annual report.
|
|
(2)
|
Financial Statement Schedules
|
None of the schedules apply, or the information required is included in the Notes to the Consolidated Financial Statements.
|
(3)
|
Exhibits
|
Reference is made to the accompanying Index to Exhibits.
Molina Healthcare, Inc. 2016 Form 10-K | 120
SIGNATURES
Pursuant to the requirements of Section 13 or 15(d) of the Securities Exchange Act of 1934, as amended, the undersigned registrant has duly caused this report to be signed on its behalf by the undersigned, thereunto duly authorized, on the
1st
day of March,
2017
.
|
MOLINA HEALTHCARE, INC.
|
|||
|
By:
|
/s/ Joseph M. Molina
|
||
|
Joseph M. Molina, M.D. (Dr. J. Mario Molina)
|
|||
|
Chief Executive Officer
(Principal Executive Officer)
|
|||
Pursuant to the requirements of the Securities Exchange Act of 1934, as amended, this report has been signed below by the following persons on behalf of the registrant and in the capacities and on the dates indicated.
Molina Healthcare, Inc. 2016 Form 10-K | 121
|
Signature
|
Title
|
Date
|
||
|
/s/ Joseph M. Molina
|
Chairman of the Board, Chief Executive Officer, and President
|
March 1, 2017
|
||
|
Joseph M. Molina, M.D.
|
(Principal Executive Officer)
|
|||
|
/s/ John C. Molina
|
Director, Chief Financial Officer, and Treasurer
|
March 1, 2017
|
||
|
John C. Molina, J.D.
|
(Principal Financial Officer)
|
|||
|
/s/ Joseph W. White
|
Chief Accounting Officer
|
March 1, 2017
|
||
|
Joseph W. White
|
(Principal Accounting Officer)
|
|||
|
/s/ Garrey E. Carruthers
|
Director
|
March 1, 2017
|
||
|
Garrey E. Carruthers, Ph.D.
|
||||
|
/s/ Daniel Cooperman
|
Director
|
March 1, 2017
|
||
|
Daniel Cooperman
|
||||
|
/s/ Charles Z. Fedak
|
Director
|
March 1, 2017
|
||
|
Charles Z. Fedak
|
||||
|
/s/ Frank E. Murray
|
Director
|
March 1, 2017
|
||
|
Frank E. Murray, M.D.
|
||||
|
/s/ Steven J. Orlando
|
Director
|
March 1, 2017
|
||
|
Steven J. Orlando
|
||||
|
/s/ Ronna E. Romney
|
Director
|
March 1, 2017
|
||
|
Ronna E. Romney
|
||||
|
/s/ Richard M. Schapiro
|
Director
|
March 1, 2017
|
||
|
Richard M. Schapiro
|
||||
|
/s/ Dale B. Wolf
|
Director
|
March 1, 2017
|
||
|
Dale B. Wolf
|
||||
Molina Healthcare, Inc. 2016 Form 10-K | 122
INDEX TO EXHIBITS
The following exhibits, which are furnished with this annual report or incorporated herein by reference, are filed as part of this annual report.
The agreements included or incorporated by reference as exhibits to this Annual Report on Form 10-K may contain representations and warranties by each of the parties to the applicable agreement. These representations and warranties were made solely for the benefit of the other parties to the applicable agreement and (i) were not intended to be treated as categorical statements of fact, but rather as a way of allocating the risk to one of the parties if those statements prove to be inaccurate; (ii) may have been qualified in such agreement by disclosures that were made to the other party in connection with the negotiation of the applicable agreement; (iii) may apply contract standards of “materiality” that are different from “materiality” under the applicable securities laws; and (iv) were made only as of the date of the applicable agreement or such other date or dates as may be specified in the agreement. The Company acknowledges that, notwithstanding the inclusion of the foregoing cautionary statements, it is responsible for considering whether additional specific disclosures of material information regarding material contractual provisions are required to make the statements in this Annual Report on Form 10-K not misleading.
|
Number
|
Description
|
Method of Filing
|
||
|
2.1
|
Membership Interest Purchase Agreement, dated as of September 3, 2015, by and among The Providence Service Corporation, Ross Innovative Employment Solutions Corp., and Molina Healthcare, Inc.
|
Filed as Exhibit 2.1 to registrant’s Form 8-K filed September 8, 2015.
|
||
|
2.2
|
Amendment to Membership Interest Purchase Agreement, dated as of October 30, 2015, by and among The Providence Service Corporation, Ross Innovative Employment Solutions Corp., and Molina Pathways, LLC, as assignee of all rights and obligations of Molina Healthcare, Inc.
|
Filed as Exhibit 2.2 to registrant’s Form 10-K filed February 26, 2016.
|
||
|
3.1
|
Certificate of Incorporation
|
Filed as Exhibit 3.2 to registrant’s Registration Statement on Form S-1 filed December 30, 2002.
|
||
|
3.2
|
Certificate of Amendment to Certificate of Incorporation
|
Filed as Appendix A to registrant’s Definitive Proxy Statement on Form DEF 14A filed March 25, 2013.
|
||
|
3.3
|
Third Amended and Restated Bylaws of Molina Healthcare, Inc.
|
Filed as Exhibit 3.1 to registrant’s Form 10-Q filed July 30, 2014.
|
||
|
4.1
|
Indenture, dated as of February 15, 2013, by and between Molina Healthcare, Inc. and U.S. Bank, National Association
|
Filed as Exhibit 4.1 to registrant’s Form 8-K filed February 15, 2013.
|
||
|
4.2
|
Form of 1.125% Cash Convertible Senior Note due 2020
|
Included in Exhibit 4.1 to registrant’s Form 8-K filed February 15, 2013.
|
||
|
4.3
|
Indenture, dated as of September 5, 2014, by and between Molina Healthcare, Inc. and U.S. Bank National Association
|
Filed as Exhibit 4.1 to registrant’s Form 8-K filed September 8, 2014.
|
||
|
4.4
|
Form of 1.625% Convertible Senior Note due 2044
|
Included in Exhibit 4.1 to registrant’s Form 8-K filed September 8, 2014.
|
||
|
4.5
|
Form of 1.625% Convertible Senior Notes Due 2044
Note Purchase Agreement, dated as of September 11, 2014, by and between Molina Healthcare, Inc. and certain institutional investors
|
Filed as Exhibit 10.1 to registrant’s Form 8-K filed September 12, 2014.
|
||
|
4.6
|
First Supplemental Indenture, dated as of September 16, 2014, by and between Molina Healthcare, Inc. and the U.S. Bank National Association
|
Filed as Exhibit 4.1 to registrant’s Form 8-K filed
September 17, 2014.
|
||
|
4.7
|
Form of 1.625% Convertible Senior Note due 2044
|
Included in Exhibit 4.1 to registrant’s Form 8-K filed September 17, 2014.
|
||
|
4.8
|
Indenture dated November 10, 2015, by and among Molina Healthcare, Inc., the guarantor parties thereto and U.S. Bank National Association, as Trustee
|
Filed as Exhibit 4.1 to registrant’s Form 8-K filed November 10, 2015.
|
||
|
4.9
|
Form of 5.375% Senior Notes due 2022
|
Filed as Exhibit 4.1 to registrant’s Form 8-K filed November 10, 2015.
|
||
Molina Healthcare, Inc. 2016 Form 10-K | 123
|
Number
|
Description
|
Method of Filing
|
||
|
4.10
|
Form of Guarantee pursuant to Indenture, dated as of November 10, 2015, by and among Molina Healthcare, Inc., the guarantors party thereto and U.S. Bank National Association, as Trustee
|
Filed as Exhibit 4.1 to registrant’s Form 8-K filed November 10, 2015.
|
||
|
4.11
|
Registration Rights Agreement, dated as of November 10, 2015, by and among Molina Healthcare, Inc., the guarantors party thereto and SunTrust Robinson Humphrey, Inc., as representative of the Initial Purchasers (as defined therein)
|
Filed as Exhibit 4.4 to registrant’s Form 8-K filed November 10, 2015.
|
||
|
4.12
|
First Supplemental Indenture, dated as of February 16, 2016, by and among Molina Healthcare, Inc., the guarantors party thereto and U.S. Bank National Association, as trustee
|
Filed as Exhibit 4.1 to registrant’s Form 8-K filed February 18, 2016.
|
||
|
*10.1
|
2002 Equity Incentive Plan
|
Filed as Exhibit 10.13 to registrant’s Form S-1 filed December 30, 2002.
|
||
|
*10.2
|
Molina Healthcare, Inc. Amended and Restated Deferred Compensation Plan (2013)
|
Filed as Exhibit 10.5 to registrant’s Form 10-K filed February 26, 2014.
|
||
|
*10.3
|
Amendment No. 1 to the Molina Healthcare, Inc.
Amended and Restated Deferred Compensation
Plan (2013)
|
Filed as Exhibit 10.6 to registrant’s Form 10-K filed February 26, 2014.
|
||
|
*10.4
|
Amendment No. 2 to the Molina Healthcare, Inc.
Amended and Restated Deferred Compensation Plan (2013)
|
Filed as Exhibit 10.4 to registrant’s Form 10-K filed February 26, 2015.
|
||
|
*10.5
|
2011 Equity Incentive Plan
|
Filed as Exhibit 10.8 to registrant’s Form 10-K filed February 26, 2014.
|
||
|
*10.6
|
2011 Employee Stock Purchase Plan
|
Filed as Exhibit 10.6 to registrant’s Form 10-K filed February 26, 2015.
|
||
|
*10.7
|
Form of Restricted Stock Award Agreement (Executive Officer) under Molina Healthcare, Inc. Equity Incentive Plan
|
Filed as Exhibit 10.3 to registrant’s Form 10-Q filed August 9, 2005.
|
||
|
*10.8
|
Form of Restricted Stock Award Agreement (Outside Director) under Molina Healthcare, Inc. Equity Incentive Plan
|
Filed as Exhibit 10.4 to registrant’s Form 10-Q filed August 9, 2005.
|
||
|
*10.9
|
Form of Restricted Stock Award Agreement (Employee) under Molina Healthcare, Inc. Equity Incentive Plan
|
Filed as Exhibit 10.5 to registrant’s Form 10-Q filed August 9, 2005.
|
||
|
*10.10
|
Form of Stock Option Agreement under Molina Healthcare, Inc. Equity Incentive Plan
|
Filed as Exhibit 10.3 to registrant’s Form 10-K filed March 14, 2007.
|
||
|
*10.11
|
Second Amended and Restated Employment Agreement with J. Mario Molina, M.D. dated March 16, 2016
|
Filed as Exhibit 10.1 to registrant’s Form 8-K filed March 16, 2016.
|
||
|
*10.12
|
Second Amended and Restated Employment Agreement with John C. Molina dated March 16, 2016
|
Filed as Exhibit 10.2 to registrant’s Form 8-K filed March 16, 2016.
|
||
|
*10.13
|
Employment Agreement with Terry Bayer dated June 14, 2013
|
Filed as Exhibit 10.1 to registrant’s Form 8-K filed June 14, 2013.
|
||
|
*10.14
|
Employment Agreement with Joseph White dated June 14, 2013
|
Filed as Exhibit 10.2 to registrant’s Form 8-K filed June 14, 2013.
|
||
|
*10.15
|
Employment Agreement with Jeff Barlow dated June 14, 2013
|
Filed as Exhibit 10.3 to registrant’s Form 8-K filed June 14, 2013.
|
||
|
*10.16
|
Amended and Restated Change in Control Agreement with Terry Bayer, dated as of December 31, 2009
|
Filed as Exhibit 10.4 to registrant’s Form 8-K filed January 7, 2010.
|
||
|
*10.17
|
Amended and Restated Change in Control Agreement with Joseph W. White, dated as of December 31, 2009
|
Filed as Exhibit 10.6 to registrant’s Form 8-K filed January 7, 2010.
|
||
|
*10.18
|
Change in Control Agreement with Jeff D. Barlow, dated as of September 18, 2012
|
Filed as Exhibit 10.16 to registrant’s Form 10-K filed February 28, 2013.
|
||
|
10.19
|
Form of Indemnification Agreement
|
Filed as Exhibit 10.14 to registrant’s Form 10-K filed March 14, 2007.
|
||
|
10.20
|
Base Call Option Transaction Confirmation, dated as of February 11, 2013, between Molina Healthcare, Inc. and JPMorgan Chase Bank, National Association, London Branch
|
Filed as Exhibit 10.1 to registrant’s Form 8-K filed February 15, 2013.
|
||
|
10.21
|
Base Call Option Transaction Confirmation, dated as of February 11, 2013, between Molina Healthcare, Inc. and Bank of America, N.A.
|
Filed as Exhibit 10.2 to registrant’s Form 8-K filed February 15, 2013.
|
||
Molina Healthcare, Inc. 2016 Form 10-K | 124
|
Number
|
Description
|
Method of Filing
|
||
|
10.22
|
Base Warrants Confirmation, dated as of February 11, 2013, between Molina Healthcare, Inc. and JPMorgan Chase Bank, National Association, London Branch
|
Filed as Exhibit 10.3 to registrant’s Form 8-K filed February 15, 2013.
|
||
|
10.23
|
Base Warrants Confirmation, dated as of February 11, 2013, between Molina Healthcare, Inc. and Bank of America, N.A.
|
Filed as Exhibit 10.4 to registrant’s Form 8-K filed February 15, 2013.
|
||
|
10.24
|
Amendment to Base Call Option Transaction Confirmation, dated as of February 13, 2013, between Molina Healthcare, Inc. and JPMorgan Chase Bank, National Association, London Branch
|
Filed as Exhibit 10.5 to registrant’s Form 8-K filed February 15, 2013.
|
||
|
10.25
|
Amendment to Base Call Option Transaction Confirmation, dated as of February 13, 2013, between Molina Healthcare, Inc. and Bank of America, N.A.
|
Filed as Exhibit 10.6 to registrant’s Form 8-K filed February 15, 2013.
|
||
|
10.26
|
Additional Base Warrants Confirmation, dated as of February 13, 2013, between Molina Healthcare, Inc. and JPMorgan Chase Bank, National Association, London Branch
|
Filed as Exhibit 10.7 to registrant’s Form 8-K filed February 15, 2013.
|
||
|
10.27
|
Additional Base Warrants Confirmation, dated as of February 13, 2013, between Molina Healthcare, Inc. and Bank of America, N.A.
|
Filed as Exhibit 10.8 to registrant’s Form 8-K filed February 15, 2013.
|
||
|
10.28
|
Amended and Restated Base Warrants Confirmation, dated as of April 22, 2013, between Molina Healthcare, Inc. and JPMorgan Chase Bank, National Association, London Branch
|
Filed as Exhibit 10.1 to registrant’s Form 10-Q filed May 3, 2013.
|
||
|
10.29
|
Amended and Restated Base Warrants Confirmation, dated as of April 22, 2013, between Molina Healthcare, Inc. and Bank of America, N.A.
|
Filed as Exhibit 10.2 to registrant’s Form 10-Q filed May 3, 2013.
|
||
|
10.30
|
Additional Amended and Restated Base Warrants Confirmation, dated as of April 22, 2013, between Molina Healthcare, Inc. and JPMorgan Chase Bank, National Association, London Branch
|
Filed as Exhibit 10.3 to registrant’s Form 10-Q filed May 3, 2013.
|
||
|
10.31
|
Additional Amended and Restated Base Warrants Confirmation, dated as of April 22, 2013, between Molina Healthcare, Inc. and Bank of America, N.A.
|
Filed as Exhibit 10.4 to registrant’s Form 10-Q filed May 3, 2013.
|
||
|
10.32
|
Lease Agreement, dated as of February 27, 2013, by and between 6
th
& Pine Development, LLC and Molina Healthcare, Inc.
|
Filed as Exhibit 10.32 to registrant’s Form 10-K filed February 28, 2013.
|
||
|
10.33
|
First Amendment to Office Building Lease, effective as of October 31, 2014, by and between 6
th
& Pine Development, LLC and Molina Healthcare, Inc.
|
Filed as Exhibit 10.1 to registrant’s Form 8-K filed November 5, 2014.
|
||
|
10.34
|
Second Amendment to Office Building Lease, effective as of November 2, 2015, by and between 6
th
& Pine Development, LLC and Molina Healthcare, Inc.
|
Filed as Exhibit 10.1 to registrant’s Form 8-K filed November 6, 2015.
|
||
|
10.35
|
Settlement Agreement entered into on October 30, 2013, by and between the Department of Health Care Services and Molina Healthcare of California and Molina Healthcare of California Partner Plan, Inc.
|
Filed as Exhibit 10.1 to registrant’s Form 10-Q filed October 30, 2013.
|
||
|
10.36
|
Credit Agreement, dated as of June 12, 2015, by and among Molina Healthcare, Inc., Molina Information Systems, LLC, Molina Medical Management, Inc., certain lenders named on the signature pages thereto and SunTrust Bank, as Administrative Agent, Swingline Lender and Issuing Bank
|
Filed as Exhibit 10.1 to registrant’s Form 8-K filed June 16, 2015.
|
||
|
10.37
|
First Amendment to Credit Agreement, dated as of January 3, 2017, by and among Molina Healthcare, Inc., the Guarantors party thereto, the Lenders party thereto and SunTrust Bank, as Administrative Agent, Swingline Lender and Issuing Bank, including the amended and restated Credit Agreement attached as
Exhibit A
thereto
|
Filed as Exhibit 10.1 to registrant’s Form 8-K filed January 3, 2017.
|
||
|
10.38
|
Second Amendment to Credit Agreement, dated as of February 15, 2017, by and among Molina Healthcare, Inc., the Guarantors party thereto, the Lenders party thereto and SunTrust Bank, as Administrative Agent, Swingline Lender and Issuing Bank
|
Filed as Exhibit 10.1 to registrant’s Form 8-K filed February 17, 2017.
|
||
Molina Healthcare, Inc. 2016 Form 10-K | 125
|
Number
|
Description
|
Method of Filing
|
||
|
10.39
|
Guarantor Joinder Agreement, dated February 16, 2016, by and among the guarantors party thereto and SunTrust Bank, as Administrative Agent
|
Filed as Exhibit 10.1 to registrant’s Form 8-K filed February 18, 2016.
|
||
|
10.40
|
Purchase Agreement, dated as of February 11, 2013, among Molina Healthcare, Inc. and J.P. Morgan Securities LLC and Merrill Lynch, Pierce, Fenner & Smith Incorporated, as Representatives of the Initial Purchasers
|
Filed as Exhibit 1.1 to registrant’s Form 8-K filed February 15, 2013.
|
||
|
10.41
|
Capitated Medical Group/IPA Provider Services Agreement, effective May 1, 2013, by and between Molina Healthcare of California and Pacific Healthcare IPA
|
Filed as Exhibit 10.42 to registrant’s Form 10-K filed February 26, 2016.
|
||
|
10.42
|
Regulatory Amendment for the Capitated Financial Alignment Demonstration Product to Molina Healthcare of California Group/IPA Provider Services Agreement(s), effective September 26, 2014, by and between Molina Healthcare of California and Pacific Healthcare IPA Associates, Inc.
|
Filed as Exhibit 10.43 to registrant’s Form 10-K filed February 26, 2016.
|
||
|
10.43
|
Capitated Financial Alignment Demonstration Amendment to Molina Healthcare of California Group/IPA Provider Services Agreement, effective as of July 1, 2014, by and between Molina Healthcare of California and Pacific Healthcare IPA Associates, Inc.
|
Filed as Exhibit 10.44 to registrant’s Form 10-K filed February 26, 2016.
|
||
|
12.1
|
Computation of Ratio of Earnings to Fixed Charges
|
Filed herewith.
|
||
|
21.1
|
List of subsidiaries
|
Filed herewith.
|
||
|
23.1
|
Consent of Independent Registered Public Accounting Firm
|
Filed herewith.
|
||
|
31.1
|
Section 302 Certification of Chief Executive Officer
|
Filed herewith.
|
||
|
31.2
|
Section 302 Certification of Chief Financial Officer
|
Filed herewith.
|
||
|
32.1
|
Certificate of Chief Executive Officer pursuant to 18 U.S.C. Section 1350, as adopted pursuant to Section 906 of the Sarbanes-Oxley Act of 2002
|
Filed herewith.
|
||
|
32.2
|
Certificate of Chief Financial Officer pursuant to 18 U.S.C. Section 1350, as adopted pursuant to Section 906 of the Sarbanes-Oxley Act of 2002
|
Filed herewith.
|
||
|
101.INS
|
XBRL Taxonomy Instance Document
|
Filed herewith.
|
||
|
101.SCH
|
XBRL Taxonomy Extension Schema Document
|
Filed herewith.
|
||
|
101.CAL
|
XBRL Taxonomy Extension Calculation Linkbase Document
|
Filed herewith.
|
||
|
101.DEF
|
XBRL Taxonomy Extension Definition Linkbase Document
|
Filed herewith.
|
||
|
101.LAB
|
XBRL Taxonomy Extension Label Linkbase Document
|
Filed herewith.
|
||
|
101.PRE
|
XBRL Taxonomy Extension Presentation Linkbase Document
|
Filed herewith.
|
||
|
*
|
Management contract or compensatory plan or arrangement required to be filed (and/or incorporated by reference) as an exhibit to this Annual Report on Form 10-K pursuant to Item 15(b) of Form 10-K.
|
Molina Healthcare, Inc. 2016 Form 10-K | 126
TABLE OF CONTENTS