MORNINGSTAR, INC.
10-Ks and 10-Qs
|
|
|
|
|
|
|
|
|
|
|
|
|
|
|
|
|
|
|
|
|
|
|
|
|
|
|
|
|
|
|
|
|
|
|
|
|
|
|
|
|
|
|
|
|
|
|
|
|
|
|
|
|
|
|
|
UNITED STATES
SECURITIES AND EXCHANGE COMMISSION
Washington D.C. 20549
|
FORM 10-K
|
||||
|
x
|
ANNUAL REPORT PURSUANT TO SECTION 13 OR 15(d) OF THE SECURITIES EXCHANGE ACT OF 1934
|
FOR THE FISCAL YEAR ENDED DECEMBER 31, 2012
OR
|
¨
|
TRANSITION REPORT PURSUANT TO SECTION 13 OR 15(d) OF THE SECURITIES EXCHANGE ACT OF 1934
|
For the transition period from to
Commission File Number: 000-51280
MORNINGSTAR, INC.
(Exact Name of Registrant as Specified in its Charter)

|
Illinois
|
36-3297908
|
|
|
(State or Other Jurisdiction of
|
(I.R.S. Employer
|
|
|
Incorporation or Organization)
|
Identification Number)
|
|
22 West Washington Street
Chicago, Illinois
60602
(Address of Principal Executive Offices)
(312) 696-6000
(Registrant's Telephone Number, Including Area Code)
Securities registered pursuant to Section 12(b) of the Act:
|
Title of Each Class
|
Name of Each Exchange on Which Registered
|
|
|
Common stock, no par value
|
The NASDAQ Stock Market LLC
|
|
Securities registered pursuant to Section 12(g) of the Act:
None
Indicate by check mark if the Registrant is a well-known seasoned issuer, as defined in Rule 405 of the Securities Act. Yes
x
No
¨
Indicate by check mark if the Registrant is not required to file reports pursuant to Section 13 or Section 15(d) of the Act. Yes
¨
No
x
Indicate by check mark whether the Registrant (1) has filed all reports required to be filed by Section 13 or 15(d) of the Securities Exchange Act of 1934 during the preceding 12 months (or for such shorter period that the Registrant was required to file such reports), and (2) has been subject to such filing requirements for the past 90 days. Yes
x
No
¨
Indicate by check mark whether the registrant has submitted electronically and posted on its corporate Web site, if any, every Interactive Data File required to be submitted and posted pursuant to Rule 405 of Regulation S-T (§232.405 of this chapter) during the preceding 12 months (or for such shorter period that the registrant was required to submit and post such files). Yes
x
No
¨
Indicate by check mark if disclosure of delinquent filers pursuant to Item 405 of Regulation S-K is not contained herein, and will not be contained, to the best of Registrant's knowledge, in definitive proxy or information statements incorporated by reference in Part III of this Form 10-K or any amendment to this Form 10-K.
x
Indicate by check mark whether the registrant is a large accelerated filer, an accelerated filer, a non-accelerated filer, or a smaller reporting company. See the definitions of “large accelerated filer,” “accelerated filer” and “smaller reporting company” in Rule 12b-2 of the Exchange Act. (Check one):
|
Large accelerated filer
x
|
Accelerated filer
¨
|
Non-accelerated filer
¨
|
Smaller reporting company
¨
|
||
|
(Do not check if a smaller reporting company)
|
|||||
Indicate by check mark whether the Registrant is a shell company (as defined in Rule 12b-2 of the Exchange Act). Yes
¨
No
x
The aggregate market value of shares of common stock held by non-affiliates of the Registrant as of June 30, 2012 was
$1,329,810,256
. As of February 22, 2013, there were 46,424,454 shares of the Registrant's common stock, no par value, outstanding.
DOCUMENTS INCORPORATED BY REFERENCE
Certain parts of the Registrant's Definitive Proxy Statement for the 2013 Annual Meeting of Shareholders are incorporated into Part III of this Form 10-K.
Table of Contents
|
|
||
|
|
||
|
|
||
|
|
||
|
|
|
|
|
|
||
|
|
||
|
|
||
|
|
||
|
|
||
|
|
||
|
|
||
|
|
||
|
|
||
|
|
||
2
Morningstar is a leading provider of independent investment research to investors around the world. Our mission is to create great products that help investors reach their financial goals. We offer an extensive line of data, software, and research products for individual investors, financial advisors, and institutional clients through our Investment Information segment. We also provide asset management services for advisors, institutions, and retirement plan participants through our Investment Management segment. In addition to our U.S.-based products and services, we offer local versions of our products designed for investors in Asia, Australia, Canada, Europe, Latin America, and South Africa. Morningstar serves approximately 8.9 million individual investors, 260,000 financial advisors, and 5,100 institutional clients. We have operations in 27 countries.
We maintain a series of comprehensive databases on many types of investments, focusing on investment vehicles that are widely used by investors globally. After building these databases, we add value and insight to the data by applying our core skills of research, technology, and design.
As of December 31, 2012
, we provided extensive data on approximately 416,000 investments, including:
|
•
|
23,500 mutual fund share classes in the United States;
|
|
•
|
119,500 mutual funds and similar vehicles in international markets;
|
|
•
|
10,000 exchange-traded funds (ETFs);
|
|
•
|
3,700 closed-end funds;
|
|
•
|
32,500 stocks;
|
|
•
|
7,000 hedge funds;
|
|
•
|
9,200 separate accounts and collective investment trusts;
|
|
•
|
111,000 variable annuity/life subaccounts and policies;
|
|
•
|
60,500 insurance, pension, and life funds;
|
|
•
|
14,000 unit investment trusts; and
|
|
•
|
4,500 state-sponsored college savings plan portfolios (commonly known as Section 529 College Savings Plans).
|
Our investment database also includes:
|
•
|
86 years of capital markets data capturing performance of several major asset classes;
|
|
•
|
extensive cash flow, ownership, and biographical data on directors and officers;
|
|
•
|
security-level identification information;
|
|
•
|
regulatory documents, disclosure filings, and conference-call transcripts;
|
|
•
|
real-time market data on more than 9 million exchange-traded equities, derivatives, commodities, futures, foreign exchanges, precious metals, news, company fundamentals, and analytics; and
|
|
•
|
real-time price quotes for global foreign currencies.
|
Our business model is based on leveraging our investments in these databases by selling a wide variety of products and services to individual investors, financial advisors, and institutions around the world.
Our data and proprietary analytical tools such as the Morningstar Rating for mutual funds, which rates past performance based on risk- and cost-adjusted returns, and the Morningstar Style Box, which provides a visual summary of a mutual fund's underlying investment style, have become important tools that millions of investors and advisors use in making investment decisions. We've created other tools, such as the Ownership Zone, Sector Delta, and Market Barometer, which allow investors to see how different investments work together to form a portfolio and to track its progress. Our popular Portfolio X-Ray tool helps investors reduce risk and understand the key characteristics of their portfolios based on nine different factors.
3
Since 1998, we've expanded our research efforts on individual stocks and have worked to popularize the concepts of economic moat, a measure of competitive advantage originally developed by Warren Buffett; and margin of safety, which reflects the size of the discount in a stock's price relative to its estimated value. The Morningstar Rating for stocks is based on the stock's current price relative to our analyst-generated fair value estimates, as well as the company's level of business risk and economic moat.
We offer a variety of qualitative measures such as Stewardship Grades, which help investors identify companies and fund firms that have demonstrated a high level of commitment to shareholders and stewardship of investors' capital. We introduced a new global Stewardship Rating for stocks in 2012 that places more emphasis on management decisions that directly improve returns on invested capital and shareholder investment. In 2011, we introduced our forward-looking Morningstar Analyst Rating for funds, a global, qualitative measure based on our analyst research. We also offer qualitative research and ratings on alternative funds, exchange-traded funds, closed-end funds, 529 plans, target-date funds, and stocks.
In 2009, we began publishing credit ratings and associated research on corporate debt issuers. We currently provide ratings on about 700 issuers and also provide research and ratings on commercial mortgage-backed securities. We began publishing analyst research on municipal bonds in 2012. Our fundamental municipal research is designed to assess relative credit quality and fiscal distress using a proprietary, analyst-driven methodology.
We've also developed in-depth advice on security selection and portfolio construction to meet the needs of investors and professionals looking for integrated portfolio solutions. We believe many investors rely on these tools because they offer a useful framework for comparing potential investments and making decisions. Our independence and our history of innovation make us a trusted resource for investors.
4

5
Strategy and Key Objectives
Our strategy is to leverage our unique core capabilities and focus on the customer segments where we have the greatest opportunities to deliver value. For investors and professionals who make their own decisions, Morningstar has the transparent, credible analytical frameworks, powered by Morningstar research, high-quality data, and data visualization that lead to better decisions and better outcomes for investors. For investors and professionals who prefer to outsource the decision-making, Morningstar offers a seasoned team of investment professionals with expertise in asset allocation, manager research, due diligence, and portfolio construction, underpinned by award-winning, independent methodologies and analytical constructs that help clients expand their customer base and mitigate risk.
In 2012, we streamlined and clarified our growth strategies. Instead of five strategic objectives, we're now focusing on three. We no longer separately break out two objectives we formerly identified--create a premier global investment database and expand internationally--because they underpin everything we do, and we now consider them part of our other three objectives.

1. Develop the next-generation software for our investment research platforms, which will offer the most elegant and intuitive user experience for our customers.
We believe that individual investors, financial advisors, and institutional clients increasingly want integrated solutions as opposed to using different research tools for different parts of their portfolios. To help meet this need, our strategy has been to focus our product offerings on our three major platforms:
|
•
|
Morningstar.com for individual investors;
|
|
•
|
Morningstar Advisor Workstation (including Morningstar Office) for financial advisors; and
|
|
•
|
Morningstar Direct for institutional professionals.
|
These products all include integrated research and portfolio tools, allowing investors to use our proprietary information and analysis across multiple security types. With each platform, we believe we can continue to expand our reach with our current audiences, as well as extending our reach to new market segments.
We're now building the next-generation software architecture that will eventually underlie all of our investment research platforms. The new software architecture uses an "app-based" design and takes our software to a much higher design standard that's more intuitive, elegant, and easy-to-use. It also has several technological advantages, including a more streamlined design and development process for commonly used Morningstar capabilities such as portfolio management tools, faster speed to market with new capabilities, and a more consistent user experience across Morningstar's platforms.
6
Our next-generation software works with the touch interfaces commonly used in mobile devices and will eventually eliminate the need for desktop installations, making it easier for our customers to access our software from any device with an Internet connection. We're also significantly improving our charting and graphing capabilities, as well as more deeply integrating charts and graphics with editorial content to provide a new level of context and understanding.
We plan to introduce this new architecture as part of Morningstar Direct in 2013, beginning with new modules for mutual funds, stocks, and real-time market data. Over time, we'd like all of our software solutions to use this single technology architecture. By moving all of our core research products to a common software architecture, we'll be able to leverage our development resources, give our customers a more unified and consistent Morningstar experience, and better showcase our innovative research and analytical tools.
2. Deliver the most effective investment data, research, and ratings to help investors reach their financial goals.
We believe that our leadership position in independent investment research offers a competitive advantage that would be difficult for competitors to replicate. Our goal is to continue producing investment insights that empower investors and focus our research efforts in three major areas:
|
•
|
Extend leadership position in global fund research
. Over the past several years, we have expanded our analyst coverage in fund markets outside of the United States. We've built an integrated team of locally based fund experts to expand our research coverage in additional markets around the world. As of December 31, 2012, we had approximately
110
fund analysts globally, including teams in North America, Europe, Asia, and Australia. We currently produce qualitative analyst research and Morningstar Analyst Ratings on more than 3,400 funds around the world. We plan to continue expanding the number of funds that have Morningstar Analyst Ratings and in-depth qualitative research reports.
|
|
•
|
Continue leveraging our capabilities in stocks.
Our equity research complements our approach to mutual fund analysis, where we focus on analyzing the individual stocks that make up each fund's portfolio. As of December 31, 2012, we provided analyst research on approximately 1,700 companies globally.
|
We're committed to maintaining the broad, high-quality coverage we've become known for as one of the largest providers of independent equity research. We're working to expand distribution of our equity research through a variety of channels, including financial advisors, institutional investment firms, and companies outside of the United States. We believe that investors' increasing awareness of the value of independent research will strengthen our business over the long term. We've also expanded our proprietary stock database, which we view as an important complement to our analyst research.
|
•
|
Build business in credit research and ratings.
We began publishing research and ratings on corporate credit issuers in December 2009 and currently produce research and ratings on about 700 corporate credit issuers. In 2012, we began publishing research on more than 100 municipal bond issuers. We view credit ratings as a natural extension of the equity research we've been producing for the past decade. We believe we have a unique viewpoint to offer on company default risk that leverages our cash-flow modeling expertise, proprietary measures like economic moat, and in-depth knowledge of the companies and industries we cover.
|
We're including this research on our software platforms to provide investors with an additional perspective on fixed-income investments. We also plan to monetize the ratings through enterprise licenses and subscriptions to our institutional equity research clients, who have access to the forecasts, models, and scores underlying the ratings.
We also expanded our fixed-income capabilities with our May 2010 acquisition of Realpoint, LLC, a Nationally Recognized Statistical Rating Organization (NRSRO) now known as Morningstar Credit Ratings, LLC that specializes in research and ratings on commercial mortgage-backed securities (CMBS). We believe investors are looking for better research on these securities and that we're well-positioned to meet this need.
7
3. B
e a world-class investment management organization based on our proprietary research.
We believe assembling and evaluating multimanager portfolios is a natural extension of our expertise in understanding managed investment products. Our investment advisory programs combine managed investment vehicles—typically mutual funds—in portfolios designed to help investors meet their financial goals. When we create portfolios made up of other funds, our goal is to simplify the investment process and help investors access portfolios that match their level of risk tolerance, time horizon, and long-term investment objectives. We draw on our extensive experience analyzing funds and combine quantitative research with a qualitative assessment of manager skill and investment style. We had a total of $94.3 billion in assets under advisement in our Investment Advisory business as of December 31, 2012.
Our advisory business focuses on relationships and agreements where we act as a portfolio construction manager or asset allocation program designer for a mutual fund or variable annuity and receive a basis-point fee. We plan to continue building this business by expanding to reach new markets outside of the United States, expanding our capabilities in areas such as alternative investment strategies, developing more ways to incorporate risk protection and insurance, expanding to reach additional client segments, and focusing on performance and client support.
We also offer managed retirement account services through our Retirement Solutions platform and had $25.1 billion in assets under management in our managed retirement accounts as of December 31, 2012. We offer these services for retirement plan participants who choose to delegate management of their portfolios to our managed account programs, which are quantitative systems that select investment options and make retirement planning choices for the participants. We believe retirement plan participants will continue to adopt managed
accounts because of the complexity involved in retirement planning.
Morningstar Managed Portfolios is a fee-based discretionary asset management service that includes a series of mutual fund, ETF, and stock portfolios tailored to meet specific investment time horizons and risk levels. As of December 31, 2012, we had $4.7 billion in assets under management invested with Morningstar Managed Portfolios.
Target Client Segments
Given the core capabilities discussed above, we're focusing on four primary client segments:
•
Advisor (including independent financial advisors as well as those affiliated with broker-dealers, other intermediaries, and wealth managers);
•
Asset management (including fund companies, insurance companies, and other companies that build and manage portfolios of securities for their clients);
•
Retirement (including retirement plan providers and plan sponsors); and
•
Individual investors.
Acquisitions and Divestitures
Since our founding in 1984, we have focused primarily on organic growth by introducing new products and services and expanding our existing products. From 2006 through 2010, we also completed 24 acquisitions to support our growth objectives (as detailed above). While we may make additional acquisitions to support these objectives, our primary focus now is on integrating previous acquisitions. We did not make any acquisitions in 2012. As part of our efforts to simplify and streamline our operations to focus on our core offerings, we divested several small business lines in 2012.
For information about the acquisitions we made in 2010, refer to Note
7
of the Notes to our Consolidated Financial Statements. For information about the divestitures we made in 2012, refer to Note
8
of the Notes to our Consolidated Financial Statements.
8
Business Segments, Products, and Services
We operate our business in two segments:
|
•
|
Investment Information, which includes all of our data, software, and research products and services. These products are typically sold through subscriptions or license agreements; and
|
|
•
|
Investment Management, which includes all of our asset management operations, which operate as registered investment advisors and earn more than half of their revenue from asset-based fees.
|
The table below shows our revenue by business segment for each of the past three years:
|
2012
|
2011
|
2010
|
|||||||||||||||||||
|
Revenue by Segment ($000)
|
Amount
|
|
%
|
|
Amount
|
|
%
|
|
Amount
|
|
%
|
|
|||||||||
|
Investment Information
|
$
|
529,984
|
|
80.5
|
%
|
$
|
500,909
|
|
79.3
|
%
|
$
|
444,957
|
|
80.1
|
%
|
||||||
|
Investment Management
|
128,304
|
|
19.5
|
|
130,491
|
|
20.7
|
|
110,394
|
|
19.9
|
|
|||||||||
|
Consolidated revenue
|
$
|
658,288
|
|
100.0
|
%
|
$
|
631,400
|
|
100.0
|
%
|
$
|
555,351
|
|
100.0
|
%
|
||||||
For information on segment operating income (loss) refer to Note
5
of the Notes to our Consolidated Financial Statements.
Investment Information
The largest products in this segment based on revenue are Morningstar Data (formerly Licensed Data), a set of investment data spanning all of our investment databases, including real-time pricing and commodity data; Morningstar Advisor Workstation, a web-based investment planning system for independent financial advisors as well as advisors affiliated with larger firms; Morningstar Direct, a web-based institutional research platform; Morningstar.com, which includes both Premium Memberships and Internet advertising sales; and Integrated Web Tools, a set of online tools and components that help institutional clients build customized websites or enhance their existing sites.
Other major products within the Investment Information segment include Principia, our CD-ROM-based software for independent financial advisors; and Morningstar Structured Credit Ratings and Research.
We also offer a variety of financial communications materials, print and online publications, investment indexes, and other investment software products for financial advisors and institutions.
In
2012
, 31.9% of Investment Information segment revenue was from outside of the United States, compared with 32.8% in
2011
and 31.8% in
2010
.
Most of our products for individual investors are designed for investors who are actively involved in the investing process and want to take charge of their own investment decisions. We also reach individuals who want to learn more about investing and investors who seek out third-party sources to validate the advice they receive from brokers or financial planners.
We sell our advisor-related products both directly to independent financial advisors and through enterprise licenses, which allow financial advisors associated with the licensing enterprise to use our products. Our institutional clients include banks, brokerage firms, insurance companies, mutual fund companies, media outlets, and retirement plan sponsors and providers. We also have data reselling agreements with third-party providers of investment tools and applications, allowing us to increase the distribution of our data with minimal additional cost.
We believe the Investment Information segment has a modest amount of seasonality. We've historically had higher revenue in the second quarter because we hold our largest annual investment conference during the quarter. Other products in this segment generally have not shown marked seasonality.
Our largest customer in the Investment Information segment made up approximately 2% of segment revenue in
2012
.
9
Morningstar Data
Morningstar Data gives institutions access to a full range of investment data spanning numerous investment databases, including real-time pricing data and commodity data. We offer data packages that include access to our proprietary statistics, such as the Morningstar Style Box and Morningstar Rating, and a wide range of other data, including information on investment performance, risk, portfolios, operations data, fees and expenses, cash flows, and ownership. Institutions can use Morningstar Data in a variety of investor communications, including websites, print publications, and marketing fact sheets, as well as for internal research and product development. We deliver Morningstar Data through password-protected websites, data feeds, and software and provide daily updates to clients.
Morningstar Commodity Data aggregates energy, commodity, and financial data from more than 200 sources in a single platform and is also available via data feeds. It provides market pricing data, securities reference data, historical event data, predictive analytics, and advanced data management solutions that help customers manage large sets of time-series data and analyze their own proprietary data. Clients include some of the world's largest asset managers, banks, oil companies, power and natural gas trading firms, utilities, risk managers, and agriculture and commodities trading firms.
Morningstar Markets data supports trading and investment decisions with streaming real-time data for instruments traded in major exchanges. We offer adaptable quote displays, charting, qualitative analysis, news, and alerts both in a stand-alone application as well as in other Morningstar products.
Morningstar Data for equities is used by many leading asset management firms, media companies, broker dealers, and other large institutions to support internal research functions, power investment tools, and deliver meaningful information and analysis to investors. Our continuously expanding global data services feature financial statement data, consolidated industry statistics, stock ownership information, and proprietary Morningstar statistics.
In 2012, we continued to enhance our client interfaces to add additional data points and images, streamline data delivery, and enable clients to easily access current data. We also introduced new data feeds and enhanced our Document Library solution to support new compliance requirements for retirement plan providers. We introduced Morningstar Markets Commodities Edition, which allows traders and risk managers to access our expansive historical energy data library and real-time exchange data on one integrated web-based platform. The new platform allows traders to get a truly holistic view of the energy markets and can be accessed on any device with an Internet connection, including smartphones and tablets.
We made numerous enhancements to our real-time markets data in 2012, adding new exchanges and security types as well as tools and services for active traders. We've also been working to integrate our market data and capabilities in Morningstar's other platforms, including Morningstar Direct, Morningstar Advisor Workstation, retail investor websites in Europe, Integrated Web Tools, and other products.
With our equity data, we added detail on 245 financial statement line items to our fundamental data package, as well as other operational ratios for U.S. and global companies. We also signed an agreement with Microsoft to provide investment data for the Bing Finance app on Windows 8. Windows 8 users are able to access a variety of Morningstar stock data, from top-line general measures like market capitalization, trading volume, price range, and competitors; to more granular data such as debt-to-equity ratio, forward price-to-earnings ratio, and return on assets. Investors can also pull up detailed charts showing revenue, profit, and cash reserve statistics, as well as a table showing the most-active mutual funds trading in each security.
Pricing for Morningstar Data is based on the number of funds, market indexes, stocks, commodities, or other securities covered; the amount and depth of information provided for each security; and the number of users and level of distribution. With Morningstar Markets, we charge additional fees for individual components or customization.
For Morningstar Data, our primary competitors are Bloomberg, eVestment Alliance, Interactive Data Corporation, Index Universe, Mergent, PSN/Informa, Standard & Poor's, and Thomson Reuters. Our Commodity Data business competes with several other companies, including GlobalView, IDC Future Source, and ZE Power.
10
Morningstar Data was our largest product in
2012
and accounted for
22.8%
,
22.3%
, and
23.7%
of our consolidated revenue in
2012
,
2011
, and
2010
, respectively.
Morningstar Advisor Workstation
Morningstar Advisor Workstation, a web-based investment planning system, provides financial advisors with a comprehensive set of tools for conducting their core business—including investment research, planning, and presentations. It allows advisors to build and maintain a client portfolio database that can be fully integrated with the firm's back-office technology and resources. Moreover, it helps advisors create customized reports for client portfolios that combine mutual funds, stocks, separate accounts, variable annuity/life subaccounts, ETFs, hedge funds, closed-end funds, 529 plans, offshore funds, and pension and life funds.
As of December 31, 2012
,
162,904
advisors in the United States were licensed to use Advisor Workstation, which is available in two versions: Morningstar Office for independent financial advisors and an enterprise version for financial advisors affiliated with larger firms. The enterprise version includes four core modules: Clients & Portfolios, Research, Sales/Hypotheticals, and Planning. We also offer a variety of other applications, including tools for defined contribution plans; Morningstar Document Library, which helps firms comply with pre- and post-sale document delivery requirements by providing access to prospectuses and supplements in HTML or PDF formats; Analyst Research Center, which complements the quantitative data in Advisor Workstation with independent, qualitative research on stocks, mutual funds, exchange-traded funds, and initial public offerings; and Presentation Library, which gives advisors access to compelling client presentation materials. These applications can be purchased as stand-alone products or combined as part of a full Workstation license.
In 2012, we added Morningstar's new Analyst Ratings for funds as well as global fund reports to Morningstar Advisor Workstation 2.0, a platform we launched in 2010 that incorporates significant technology upgrades along with interface and usability improvements. We migrated more than 90% of our client base to this platform by the end of 2012. We also introduced new capabilities for screening and hypothetical reports, as well as detailed comparisons of fees and commissions for broker-dealers and their affiliated advisors.
For Morningstar Office in 2012, we introduced several new features for integrating with third-party rebalancing tools, managing research and workflows, and researching investment options with a new interactive version of our signature Morningstar Reports.
Pricing for Morningstar Advisor Workstation varies based on the number of users, as well as the level of functionality offered. We typically charge about $3,300 per licensed user for a base configuration of Morningstar Advisor Workstation, but pricing varies significantly based on the scope of the license. For clients who purchase more limited tools-only licenses, the price per user is substantially less. We generally charge $5,700 per user for an annual license for Morningstar Office.
Major competitors for Morningstar Advisor Workstation and Morningstar Office include Advent Software, Charles Schwab, Standard & Poor's, SunGard, Tamarac (a division of Envestnet), and Thomson Reuters.
Morningstar Advisor Workstation is our second-largest product based on revenue and made up
12.8%
,
12.3%
, and
12.6%
of our consolidated revenue in
2012
,
2011
, and
2010
, respectively.
11

Morningstar Direct
Morningstar Direct is a web-based institutional research platform that provides advanced research on the complete range of securities in Morningstar's global database. This comprehensive platform allows research and marketing professionals to conduct advanced performance comparisons and in-depth analyses of a portfolio's underlying investment style. Morningstar Direct includes access to numerous investment universes, including U.S. mutual funds; European and offshore funds; funds based in most major markets around the world; stocks; separate accounts; hedge funds; closed-end funds; ETFs; global equity ownership data; variable annuity and life portfolios; and market indexes.
In 2012, we added additional third-party content, including bond data from Interactive Data Corporation and hedge fund data from Hedge Fund Research. We added more than 260 new data points for UK investment trusts and U.S. closed-end funds. As part of Morningstar Direct's Presentation Studio, we introduced new retirement plan lineup reporting that helps users create and automate retirement plan review books and fact sheets. We also expanded our capabilities in many other areas, including asset allocation, fundamental data, portfolio analysis and attribution, and Excel exporting.
Morningstar Direct's primary competitors are Bloomberg, eVestment Alliance, FactSet Research Systems, and Thomson Reuters.
Morningstar Direct had
7,435
licensed users worldwide as of
December 31, 2012
.
Pricing for Morningstar Direct is based on the number of licenses purchased. We charge $17,000 for the first user, $10,500 for the second user, and $9,000 for each additional user.
Morningstar Direct is our third-largest product based on revenue and accounted for
10.1%
,
8.3%
, and
6.9%
of our consolidated revenue in
2012
,
2011
, and
2010
, respectively.
12

Morningstar.com
Our largest website for individual investors is Morningstar.com in the United States, which includes both Premium Membership revenue (which made up about 60% of Morningstar.com's revenue base in
2012
) and Internet advertising sales (which made up the remaining 40%).
As of December 31, 2012
, the free membership services offered through Morningstar.com had approximately 8.9 million registered users worldwide, who have access to comprehensive data on stocks, mutual funds, ETFs, closed-end funds, 529 plans, commodities, options, bonds, and other investments to help them conduct research and track performance. In addition, Morningstar.com features extensive market data, articles, proprietary portfolio tools, and educational content to help investors of all levels access timely, relevant investment information.
We also offer more than 40 regional investing websites customized to the needs of investors worldwide. Many of these sites feature coverage in local languages with tools and commentary tailored to specific markets.
We use our free content as a gateway into paid Premium Membership, which includes access to written analyst reports on more than 1,200 stocks, 1,100 mutual funds, 400 ETFs, and 110 closed-end funds, as well as our Portfolio X-Ray, asset allocation and portfolio management tools, proprietary stock data, Stewardship Grades and Ratings, and premium stock and fund screeners. We currently offer Premium Membership services in Australia, Canada, China, Italy, the United Kingdom, and the United States.
In 2012, we launched a beta version of a new portfolio aggregation tool that allows users to link their brokerage accounts to eliminate manual data entry and easily access updated data. We also converted our advertising sales system to a global platform to integrate ad sales in Europe and other areas.
Morningstar.com competes with The Motley Fool, Seeking Alpha, TheStreet.com, and Yahoo! Fin
ance as well as other finance sites, such as AOL Money & Finance, Google Finance, Marketwatch.com, MSN Money, and The Wall Street Journal Online.
As of December 31, 2012
, we had
123,899
paid Premium subscribers for Morningstar.com in the United States plus an additional 14,000 paid Premium subscribers in Australia, Canada, China, Italy, and the United Kingdom. We currently charge $22.95 for a monthly subscription, $195 for an annual subscription, $329 for a two-year subscription, and $429 for a three-year subscription for Morningstar.com's Premium service in the United States. We also sell advertising space on Morningstar.com.
Morningstar.com (including local versions outside of the United States) is our fifth-largest product based on revenue and accounted for
8.2%
of our consolidated revenue in
2012
, compared with
8.9%
in
2011
and
9.3%
in
2010
.
13

Morningstar Integrated Web Tools
Morningstar Integrated Web Tools is a set of tools that helps institutional clients build customized websites or enhance their existing sites with Morningstar's online tools and components. We offer a series of components, editorial content, and reports that investment firms can license to build or enhance their websites for financial advisors and individual investors. Outside the United States, clients can customize our offerings with capabilities for regional markets, multiple languages, and local currencies. Our suite of components can be customized to analyze a set of investments, focus on client-defined data points, or perform calculations required by specific products or services. We also offer licenses for investment research, editorial content, and portfolio analysis tools. Integrated Web Tools can be integrated with clients' existing websites and allow users to drill down into the underlying data when researching a potential investment.
In 2012, we transitioned several core tools, including the Multiple Fund Comparison, Cost Comparison, Find Similar Funds, X-Ray, and Risk/Reward Scatterplot, to a more efficient code base, which allowed for enhanced functionality and a more tablet-friendly design. We also expanded our lineup of equity tools and enhanced the functionality of existing equity solutions.
Competitors for Integrated Web Tools include Advisor Software, Inc., Financial Express, Interactive Data Corporation, Markit on Demand (formerly Wall Street on Demand), and Thomson Reuters.
Pricing for Integrated Web Tools consists of both ongoing license fees and one-time development fees and depends
on the audience, the level of distribution, and the scope of information and functionality licensed.
Structured Credit Ratings and Research
Morningstar Credit Ratings, LLC is a Nationally Recognized Statistical Rating Organization (NRSRO) that provides timely new issue and surveillance ratings and analysis for commercial mortgage-backed securities (CMBS) as well as operational risk assessment services.
We rate new issue CMBS securities using a bottom-up approach that blends qualitative, quantitative, and legal analysis of the loan, portfolio, and issuing trust, with detailed underwriting information for 100% of the underlying assets. We provide surveillance ratings and analysis on nearly 6,500 CMBS securities including the loans and properties securing them. We also publish DealView credit reports on CMBS transactions and update our analysis and forecasts monthly. We rated 24% of all new-issue CMBS deals in 2012—making us the fifth-largest player in terms of deals rated.
14
In 2011, we introduced a beta version of our new ratings and surveillance analytics service on residential mortgage-backed securities (RMBS). This service will provide institutional investors with cutting-edge analytics, Morningstar’s monthly DealView Credit Analysis, and timely letter ratings on thousands of secondary market RMBS transactions.
In 2012, we finalized our new issue, surveillance, and servicer advance methodologies that will enable us to rate most RMBS transactions. We also published several research papers detailing our RMBS research methodology and began programming work on a front-end stand-alone RMBS model for rating new issue transactions.
We also offer operational risk assessments that evaluate mortgage servicers, loan originators, and third-party service providers. These assessments focus on non-credit-related operational risks and the likelihood of maintaining current performance levels given ongoing market conditions.
Our structured credit research and ratings business competes with several other firms, including DBRS, Fitch, Kroll Bond Ratings, Moody's, and Standard & Poor's.
Morningstar Credit Ratings primarily charges license-based fees for surveillance ratings and analysis, which are paid for by the user. For new-issue ratings, it charges asset-based fees that are paid by the issuer on the rated balance of the transaction.
Morningstar Principia
Principia is our CD-ROM-based investment research and planning software for financial planners and had
26,807
subscriptions as of
December 31, 2012
. The modules offered in Principia provide data on mutual funds, ETFs, stocks, separate accounts, variable annuity/life subaccounts, closed-end funds, asset allocation, hypotheticals, presentations and education, and defined contribution plans. Each module is available separately or together and features searching, screening, and ranking tools. Principia allows advisors to conduct research on client portfolios and includes three-page Portfolio Snapshot reports that provide a comprehensive picture of the client's portfolio. The Snapshot report shows overall style and sector weightings as well as the cumulative exposure to individual stocks. The Snapshot report is among those approved by the National Association of Securities Dealers for financial advisors to distribute and review with their clients.
In 2012, we developed an additional exporting process for the CAMS (Client Account Management System) module, which offers performance reporting and portfolio accounting. We also continued increasing the percentage of subscribers receiving electronic delivery, reducing our fulfillment costs and giving clients more timely access to the most recent updates.
Principia prices generally range from approximately $690 per year for monthly updates delivered electronically on one investment database to $3,345 per year for monthly updates on the complete package spanning all investment universes, or $7,645 for all investment universes plus additional modules for asset allocation, defined contribution plans, and client account management.
Major competitors for Principia include Standard & Poor's and Thomson Reuters.
Morningstar Equity and Credit Research
As of December 31, 2012
, we offered independent equity research on approximately 1,700 companies globally. Our approach to stock analysis focuses on long-term fundamentals. Our analysts evaluate companies by assessing each firm's competitive advantage, analyzing the level of business risk, and completing an in-depth projection of future cash flows. For the companies we cover, our analysts prepare a fair value estimate, a Morningstar Rating for stocks, a rating for business risk, and an assessment of the company's economic moat. Economic moat is a concept originally developed by Warren Buffett that describes a company's competitive advantage relative to other companies.
We offer Morningstar Equity Research to institutional investors who use it to supplement their own research, as well as to broker-dealers who provide our research to their affiliated financial advisors or individual investor clients. We also deliver our equity research through several other Morningstar products, including our Premium Membership service on Morningstar.com.
15
We currently provide analyst reports on virtually all of the most widely held stocks in major U.S. market indexes, as well as numerous companies based outside the United States. On the credit research side, we provide credit ratings and analysis for about 700 of the largest corporate bond issuers worldwide, including global banks and captive finance subsidiaries. We had approximately
155
equity and credit analysts around the world as of
December 31, 2012
, compared with
140
as of
December 31, 2011
.
In 2012, we launched a new global Analyst Research Center featuring all of our analyst research on stocks, mutual funds, ETFs, corporate credits, and municipal bonds, as well as selected market data. We also released quantitative research on approximately 12,000 North American companies. This methodology extends our research philosophy to companies our analysts would not normally cover.
Our Equity Research services compete with The Applied Finance Group, Credit Suisse HOLT, Renaissance Capital, Standard & Poor's, Value Line, Zacks Investment Research, and several smaller research firms. For institutional clients, we compete with sell-side firms, internal providers, and smaller boutique firms. Competitors for our credit research include Credit Sights, Fitch, Gimme Credit, Moody's, and Standard & Poor's.
Pricing for Morningstar Equity and Credit Research varies based on the level of distribution, the number of securities covered, the amount of custom coverage and client support required, and the length of the contract term.
Morningstar Indexes
We offer an extensive set of investment indexes that can be used to benchmark the market and create investment products. Our index family includes a series of U.S. equity indexes that track the U.S. market by capitalization, sector, and investment style; dividend indexes; a series of active equity indexes based on Morningstar's equity research; a series of bond indexes that track the U.S. market by sector and term structure; global bond and equity indexes; commodity indexes; hedge fund indexes; and asset allocation indexes.
We currently license the Morningstar Indexes to numerous institutions that offer ETFs and exchange-traded notes based on the indexes. Our fees generally consist of an annual licensing fee as well as fees linked to assets under management.
In 2012, we introduced approximately 14 new indexes, including indexes based on factor tilt, active equity, Canadian stocks and bonds, emerging markets, and other asset c
lasses. We believe we're the only index provider that offers indexes spanning all asset categories, which allows us t
o develop indexes that blend various asset classes.
Key competitors for the Morningstar Indexes include Barclays Capital, Dow Jones, the
Financial Times
, McGraw-Hill, MSCI, and Russell Investments.
Investment Management Segment
The largest products and services in this segment based on revenue are Investment Advisory, which focuses on investment monitoring, asset allocation, and portfolio construction for managed accounts made up of other investment vehicles; Retirement Solutions, including the Morningstar Retirement Manager and Advice by Ibbotson platforms; and Morningstar Managed Portfolios, a fee-based discretionary asset management service that includes a series of mutual fund, ETF, and stock portfolios tailored to meet a range of investment time horizons and risk levels that financial advisors can use for their clients' taxable and tax-deferred accounts.
Our client base in this segment includes banks, brokerage firms, insurance companies, mutual fund companies, and retirement plan sponsors and providers. We currently offer investment management services in North America, Europe, Asia, and Australia. Our license agreements in the Investment Management segment have an average contract term of approximately three years, although some of our agreements allow for early termination.
About 17.2% of Investment Management segment revenue was from outside the United States in
2012
, compared with 15.8% in
2011
and 14.2% in
2010
.
16
In addition to the client segments we currently reach, we plan to develop additional distribution channels to reach other client types, including foundations and endowments, defined contribution plans, defined benefit plans, and wealth management firms. We also expect to continue expanding our Investment Management business outside the United States.
For Morningstar Managed Portfolios, our target audience consists of home offices of registered investment advisors affiliated with insurance companies, broker-dealers, and independent financial advisors.
We market our Investment Management services almost exclusively through our institutional sales team, which includes both strategic account managers and more specialized sales representatives. We employ a consultative sales approach and often tailor customized solutions to meet the needs of larger institutions. We have a regional sales team responsible for expanding relationships for Morningstar Managed Portfolios.
We believe our institutional clients value our independence, breadth of information, and customized services; in addition, we believe our research, tools, and advice reach many individual investors through this channel. We also reach approximately 3,200 financial advisors through our Managed Portfolios platform.
The Investment Management segment has not historically shown seasonal business trends; however, business results for this segment are typically more variable because of our emphasis on asset-based fees, which change along with market movements and other factors.
Our largest customer in the Investment Management segment made up approximately 11% of segment revenue in
2012
.
Investment Advisory (formerly Investment Consulting)
Our Investment Advisory business provides institutional investment advisory and management services for asset management firms, broker-dealers, and insurance providers. We offer Investment Advisory services through Morningstar Associates, Inc. (Canada); Morningstar Associates Korea Co., Ltd.; Morningstar Associates, LLC; Morningstar Investment Management Europe, Ltd; Ibbotson Associates, Inc.; Ibbotson Associates Australia Limited; Ibbotson Associates Japan KK; OBSR Advisory Services Limited; and Morningstar Investment Consulting France SAS (formerly Seeds Finance). All of these entities are wholly owned or majority-owned subsidiaries of Morningstar, Inc., and are authorized to provide investment advisory services by the appropriate regulatory agency in their applicable jurisdictions.
Drawing on our proprietary research and methodologies, we deliver four core service offerings: asset allocation, manager evaluation, portfolio management, and 15(c) board consulting services. We focus on delivering customized solutions that improve the investor experience and help our clients build their businesses. Many of our Investment Advisory agreements focus on investment monitoring and asset allocation for multimanager portfolios made up of managed investment products, such as mutual funds and variable annuities. We focus on relationships where we're paid a percentage of assets under management for ongoing investment management and advice, as opposed to one-time relationships where we're paid a flat fee.
We offer these advisory services to clients in most of our major operations globally, including insurance companies, investment management companies, mutual fund companies, and broker-dealers.
Our Investment Advisory business competes primarily with Mercer, Mesirow Financial, Russell Investments, Thomson Reuters, and Wilshire Associates, as well as some smaller firms in the retirement consulting business and various in-house providers of investment advisory services.
Pricing for the Investment Advisory services we provide is based on the scope of work and the level of service required. In the majority of our contracts, we receive asset-based fees, reflecting work as a portfolio construction manager or subadvisor for multimanager portfolios made up of managed investment products.
Investment Advisory was our fourth-largest product based on revenue in
2012
and accounted for
10.0%
,
11.3%
, and
10.6%
of our consolidated revenue in
2012
,
2011
, and
2010
, respectively.
17
Retirement Solutions
Our Retirement Solutions offerings help retirement plan participants plan and invest for retirement. We offer these services both through retirement plan providers (typically third-party asset management companies that offer proprietary mutual funds) and directly to plan sponsors (employers that offer retirement plans to their employees). Clients can select either a hosted solution or our installed software advice solution. We design these solutions to help retirement plan participants accumulate wealth, transition into retirement, and manage income during retirement.
Morningstar Retirement Manager is our advice and managed accounts program that helps plan participants with their retirement goals. It helps investors determine how much to invest and which investments are most appropriate for their portfolios. The program gives guidance explaining whether participants' suggested plans are on target to meet their retirement goals. As part of this service, we deliver personalized recommendations for a target savings goal, a recommended contribution rate to help achieve that goal, a portfolio mix based on risk tolerance, and specific investment recommendations. Participants can elect to have their accounts managed by us through our managed account service or build their own portfolios using our recommendations as a guide.
Morningstar Retirement Manager also helps plan sponsors meet their fiduciary obligations. Morningstar works with plan sponsors to help them better understand their fiduciary obligations and stay ahead of changes in the marketplace. We can act as an ERISA fiduciary by, for example, selecting and monitoring a broad range of diversified plan options. As part of this service, we can construct and monitor the investment lineup, document our investment process, create an Investment Policy Statement, and furnish the plan with detailed quarterly investment and performance reports.
In 2012, we introduced an enhanced version of Morningstar Retirement Manager that incorporates Ibbotson Associates' Wealth Forecasting Engine methodology and transitioned several clients to the combined platform. The combined platform allows us to offer new features, including more personalized savings rate recommendations, retirement age recommendations, both enhanced and optimized strategy recommendations, tax considerations, and the ability to consider other ongoing and retirement expenses.
In addition, we enhanced the Wealth Forecasting Engine to model more complex retirement plan rules, forecast different scenarios, and construct robust retirement solutions. We rolled out a new Morningstar Retirement Manager service, Income Secure, for retirees and participants transitioning to retirement. Income Secure provides customized recommendations for generating income and drawing down assets during retirement.
As of December 31, 2012
, approximately
24.6 million
plan participants had access to Retirement Solutions through approximately
202,000
plan sponsors and
25
plan providers. Pricing for Retirement Solutions depends on several different factors, including the level of services offered (including whether or not such services cause us to be an ERISA fiduciary), the number of participants, the level of systems integration required, and the availability of competing products.
In the retirement advice market, we compete primarily with Financial Engines and Guided Choice.
Morningstar Managed Portfolios
We offer the Morningstar Managed Portfolios program through Morningstar Investment Services, Inc., a registered investment advisor, registered broker-dealer, member of the Financial Industry Regulatory Authority, Inc. (FINRA), and wholly owned subsidiary of Morningstar, Inc.
Morningstar Managed Portfolios is a fee-based discretionary asset management service that includes a series of mutual fund, ETF, and stock portfolios tailored to meet specific investment time horizons and risk levels. This program is only available through financial advisors. Our team of investment professionals uses a disciplined process for asset allocation, fund selection, and portfolio construction. They actively monitor the portfolios and make adjustments as needed. We complement these asset management services with online client-management functions such as risk profiling and access to client statements, transaction capabilities, and performance reports.
In 2012, Morningstar Managed Portfolios surpassed $4 billion in assets under management. Morningstar Investment Services also expanded its relationship with a major independent broker-dealer, making our portfolios available to all of the fee-based financial advisors included in its network.
18
We had approximately
$4.7 billion
in assets under management with about 3,200 financial advisors using the service as of
December 31, 2012
. We charge asset-based fees for Morningstar Managed Portfolios. The management fee is based on a tiered schedule that depends on the client's average daily portfolio balance. Fees for our mutual fund and ETF portfolios generally range from 30 to 40 basis points. We charge 55 basis points for the Select Stock Baskets, which are a managed account service consisting of individually customized stock portfolios based on Morningstar's indexes and independent equity research.
For Morningstar Managed Portfolios, our primary competitors are Brinker Capital, Curian Capital, Envestnet PMC, Genworth Financial, Loring Ward, SEI Investments, and Symmetry Partners. We also compete with in-house research teams at independent broker-dealers who build proprietary portfolios for use on brokerage firm platforms, as well other providers that provide investment strategies or models on these platforms.
Marketing and Sales
We promote our print, software, web-based products and services, and consulting services with a staff of sales and marketing professionals, as well as an in-house public relations team. Our marketing staff includes both product specialists and a corporate marketing group that manages company initiatives. Our sales team includes several strategic account managers who oversee all aspects of our largest institutional client relationships. We also have a sales operations staff, which focuses on tracking and forecasting sales and other tasks to support our sales team. Across our business, we emphasize high levels of product support to help our customers use our products effectively and provide our product managers with feedback from customers. We had approximately 590 sales and marketing professionals on staff as of
December 31, 2012
.
International Operations
We conduct our business operations outside of the United States through wholly owned or majority-owned operating subsidiaries doing business in each of the following countries: Australia, Brazil, Canada, Chile, Denmark, France, Germany, India, Italy, Japan, Korea, Luxembourg, Mexico, the Netherlands, New Zealand, Norway, People's Republic of China (both Hong Kong and the mainland), Singapore, South Africa, Spain, Switzerland, Taiwan, Thailand, United Arab Emirates, and the United Kingdom. See Note
5
of the Notes to our Consolidated Financial Statements for additional information concerning revenue from customers and long-lived assets from our business operations outside the United States.
In addition, we hold minority ownership positions in companies based in Japan and Sweden. As of
December 31, 2012
, we held a minority ownership position (approximately
34%
of the outstanding shares) in Morningstar Japan K.K. (MJKK); this share had a market value of approximately
$36.2 million
. MJKK is publicly traded under ticker 4765 on the Osaka Stock Exchange “Hercules Market.” See Note
9
of the Notes to our Consolidated Financial Statements for information about our investments in unconsolidated entities.
To enable these companies to do business in their designated territories, we provide them with the rights to the Morningstar name and logo and with access to certain of our products and technology. Each company is responsible for developing marketing plans tailored to meet the specific needs of investors within its country and working with Morningstar's data collection and development centers to create and maintain databases, develop new products, and enhance existing products.
See Item 1A—Risk Factors for a discussion of the risks related to our business operations outside of the United States.
Intellectual Property and Other Proprietary Rights
We treat our brand, product names and logos, software, technology, databases, and other products as proprietary. We try to protect this intellectual property by using trademark, copyright, patent and trade secrets laws; licensing and nondisclosure arrangements; and other security measures. For example, in the normal course of business, we only provide our intellectual property to third parties through standard licensing agreements. We use these agreements to define the extent and duration of any third-party usage rights and provide for our continued ownership in any intellectual property furnished.
19
Because of the value of our brand name and logo, we have tried to register one or both of them in all of the relevant international classes under the trademark laws of most of the jurisdictions in which we maintain operating companies. As we move into new countries, we consider adding to these registrations. In some jurisdictions, we also register certain product identifiers. We have registered our name and/or logo in numerous countries and the European Union and have applied for registrations in various other countries.
“Morningstar” and the Morningstar logo are registered marks of Morningstar in the United States and in certain other jurisdictions. The table below includes some of the trademarks and service marks that we use:
|
Advice by Ibbotson ®
|
Morningstar Market Barometer
SM
|
|
|
Ibbotson Associates ®
|
Morningstar Office
SM
|
|
|
Morningstar ® Advisor Workstation
SM
|
Morningstar ® Ownership Zone
SM
|
|
|
Morningstar Analyst Rating
TM
|
Morningstar ® Portfolio X-Ray ®
|
|
|
Morningstar ® Analyst Research Center
SM
|
Morningstar ® Principia ®
|
|
|
Morningstar Direct
SM
|
Morningstar Rating ™
|
|
|
Morningstar ® Equity Research Services
SM
|
Morningstar ® Retirement Manager
SM
|
|
|
Morningstar ® Essentials
TM
|
Morningstar ® Stewardship Grade
SM
|
|
|
Morningstar ® Hypothetical Illustrator
SM
|
Morningstar Style Box ™
|
|
|
Morningstar ® Integrated Web Tools
SM
|
Morningstar.com ®
|
|
|
Morningstar ® Managed Portfolios
SM
|
||
In addition to trademarks, we currently hold several patents in the United States and Canada. We believe these patents represent our commitment to developing innovative products and tools for investors.
License Agreements
In the majority of our licensing agreements, we license our products and/or other intellectual property to our customers for a fee. We generally use our standard agreements, whether in paper or electronic form, and we do not provide our products and services to customers or other users without having an agreement in place.
We maintain licensing agreements with all of our operating companies. We put these agreements in place so these companies can use our intellectual property, such as our products and trademarks, to develop and market similar products under our name in their operating territories.
In the ordinary course of our business, we obtain and use intellectual property from a wide variety of sources, including licensing it from third-party sources, developing it internally, and obtaining it directly from public filings.
Seasonality
We believe our business has a modest amount of seasonality. Some of our smaller products, such as the
Ibbotson Stocks, Bonds, Bills, and Inflation Yearbook
and our annual investment conference in Chicago, generate the majority of their revenue in the first or second quarter of the year. Most of our products are sold with subscription or license terms of at least one year, though, and we recognize revenue ratably over the term of each subscription or license agreement. This tends to moderate seasonality in sales patterns for individual products.
We believe market movements generally have more influence on our performance than seasonality. The amount of revenue we earn from asset-based fees depends on the value of assets on which we provide advisory services, and the size of our asset base can increase or decrease along with trends in market performance.
Largest Customer
In
2012
, our largest customer accounted for less than 3% of our consolidated revenue.
20
Competitive Landscape
The economic and financial information industry has been marked by increased consolidation over the past several years, with the strongest players generally gaining market share at the expense of smaller competitors. Some of our major competitors include Bloomberg; Standard & Poor's, a division of The McGraw-Hill Companies; and Thomson Reuters. These companies have financial resources that are significantly greater than ours. We also have a number of smaller competitors in our two business segments, which we discuss in Business Segments, Products, and Services above.
We believe the most important competitive factors in our industry are brand and reputation, data accuracy and quality, breadth of data coverage, quality of investment analysis and analytics, design, product reliability, and value of the products and services provided.
Major Competitors by Product
|
Morningstar Data
|
Morningstar
Advisor
Workstation
|
Morningstar
Direct
|
Investment
Advisory
|
Morningstar.com
|
Retirement
Solutions
|
|||||||
|
Advent Software
|
•
|
|||||||||||
|
Bloomberg
|
•
|
•
|
||||||||||
|
eVestment Alliance
|
•
|
•
|
||||||||||
|
FactSet Research Services
|
•
|
•
|
||||||||||
|
Financial Engines
|
•
|
|||||||||||
|
Interactive Data Corporation
|
•
|
|||||||||||
|
Mercer
|
•
|
|||||||||||
|
News Corporation*
|
•
|
|||||||||||
|
Russell Investments
|
•
|
|||||||||||
|
Standard & Poor's
|
•
|
•
|
||||||||||
|
Thomson Reuters**
|
•
|
•
|
•
|
•
|
||||||||
|
Wilshire Associates
|
•
|
•
|
||||||||||
* News Corporation includes Dow Jones, MarketWatch, and
SmartMoney
** Thomson Reuters includes Lipper
Research and Development
A key aspect of our growth strategy is to expand our investment research capabilities and enhance our existing products and services. We strive to rapidly adopt new technology that can improve our products and services. We have a flexible technology platform that allows our products to work together across a full range of investment databases, delivery formats, and market segments. As a general practice, we manage our own websites and build our own software rather than relying on outside vendors. This allows us to control our development and better manage costs, enabling us to respond quickly to market changes and to meet customer needs efficiently.
As of December 31, 2012
, our technology team consisted of approximately 900 programmers and technology and infrastructure professionals.
In
2012
,
2011
, and
2010
our development expense represented
7.8%
,
8.4%
, and
8.9%
, respectively, of our revenue. We expect that development expense will continue to represent a meaningful percentage of our revenue in the future.
21
Government Regulation
United States
Investment advisory and broker-dealer businesses are subject to extensive regulation in the United States at both the federal and state level, as well as by self-regulatory organizations. Financial services companies are among the nation's most extensively regulated. The SEC is responsible for enforcing the federal securities laws and oversees federally registered investment advisors and broker-dealers.
As of December 31, 2012
, three of our subsidiaries, Ibbotson Associates, Inc., Morningstar Associates, LLC, and Morningstar Investment Services, Inc. are registered as investment advisors with the SEC under the Investment Advisers Act of 1940, as amended (Advisers Act). As registered investment advisors, these companies are subject to the requirements and regulations of the Advisers Act. Such requirements relate to, among other things, record-keeping, reporting, and standards of care, as well as general anti-fraud prohibitions. As registered investment advisors, all three subsidiaries are subject to on-site examination by the SEC.
In addition, because these three subsidiaries provide investment advisory services to retirement plans and their participants, they may be acting as fiduciaries under the Employee Retirement Income Security Act of 1974 (ERISA). As fiduciaries under ERISA, they have duties of loyalty and prudence, as well as duties to diversify investments and to follow plan documents to comply with the applicable portions of ERISA.
Morningstar Investment Services is a broker-dealer registered under the Securities Exchange Act of 1934 (Exchange Act) and a member of FINRA. The regulation of broker-dealers has, to a large extent, been delegated by the federal securities laws to self-regulatory organizations, including FINRA. Subject to approval by the SEC, FINRA adopts rules that govern its members. FINRA and the SEC conduct periodic examinations of the brokerage operations of Morningstar Investment Services. Broker-dealers are subject to regulations that cover all aspects of the securities business, including sales, capital structure, record-keeping, and the conduct of directors, officers, and employees. Violation of applicable regulations can result in the revocation of a broker-dealer license, the imposition of censures or fines, and the suspension or expulsion of a firm or its officers or employees. Morningstar Investment Services is subject to certain net capital requirements under the Exchange Act. The net capital requirements, which specify minimum net capital levels for registered broker-dealers, are designed to measure the financial soundness and liquidity of broker-dealers.
Morningstar Credit Ratings, LLC is registered with the SEC as a Nationally Recognized Statistical Rating Organization (NRSRO) specializing in rating structured finance investments. As an NRSRO, Morningstar Credit Ratings, LLC is subject to the requirements and regulations under the Exchange Act. Such requirements relate to, among other things, record-keeping, reporting, governance, and conflicts of interest. As part of its NRSRO registration, Morningstar Credit Ratings is subject to annual examinations by the SEC.
Australia
Our subsidiaries that provide financial information services and advice in Australia, Morningstar Australasia Pty Limited and Ibbotson Associates Australia Ltd., must be registered and hold an Australian Financial Services license and are subject to oversight by the Australian Securities and Investments Commission (ASIC). This license requires them to, among other things, maintain positive net asset levels and sufficient cash resources to cover three months of expenses and to comply with the audit requirements of the ASIC.
United Kingdom
Morningstar Investment Management Europe Limited and OBSR Advisory Services Limited are authorized and regulated by the Financial Services Authority (FSA) to provide advisory services in the United Kingdom. As authorized firms, these companies are subject to the requirements and regulations of the FSA. Such requirements relate to, among other things, financial reporting and other reporting obligations, record-keeping, and cross-border requirements.
22
Other Regions
We have a variety of other entities (in Canada, Japan, Korea, Thailand, and France) that are registered with their respective regulatory bodies; however, the amount of business conducted by these entities related to the registration is relatively small.
Additional legislation and regulations, including those relating to the activities of investment advisors and broker-dealers, changes in rules imposed by the SEC or other U.S. or non-U.S. regulatory authorities and self-regulatory organizations, or changes in the interpretation or enforcement of existing laws and rules may adversely affect our business and profitability. Our businesses may be materially affected not only by regulations applicable to it as an investment advisor or broker-dealer, but also by regulations that apply to companies generally.
Employees
We had approximately
3,495
employees as of
December 31, 2012
, including approximately 670 data analysts, 75 designers, 340 investment analysts (including consulting and quantitative research analysts), 900 programmers and technology staff, and 590 sales and marketing professionals. Our employees are not represented by any unions, and we have never experienced a walkout or strike.
Executive Officers
As of
February 28, 2013
, we had 12 executive officers. The table below summarizes information about each of these officers.
|
Name
|
Age
|
Position
|
||
|
Joe Mansueto
|
56
|
Chairman, Chief Executive Officer, and Director
|
||
|
Chris Boruff
|
47
|
President, Software Division
|
||
|
Scott Cooley
|
44
|
Chief Financial Officer
|
||
|
Bevin Desmond
|
46
|
President, International Operations and Global Human Resources
|
||
|
Catherine Gillis Odelbo
|
50
|
Executive Vice President, Corporate Strategy and Partnerships
|
||
|
Greg Goff
|
41
|
Chief Technology Officer
|
||
|
Thomas Idzorek
|
42
|
President, Investment Management Division
|
||
|
Kunal Kapoor
|
37
|
President, Data Division
|
||
|
Don Phillips
|
50
|
President, Investment Research Division and Managing Director
|
||
|
Richard Robbins
|
50
|
General Counsel and Corporate Secretary
|
||
|
James Tanner
|
52
|
Global Head of Business Development and Sales
|
||
|
David W. Williams
|
52
|
Managing Director, Design
|
||
Joe Mansueto
Joe Mansueto founded Morningstar in 1984. He has served as our chairman since our inception and as our chief executive officer from 1984 to 1996 and from 2000 to the present. He holds a bachelor's degree in business administration from The University of Chicago and a master's degree in business administration from The University of Chicago Booth School of Business.
Chris Boruff
Chris Boruff has been president of Morningstar's Software division since January 2009. He is responsible for overseeing strategy, development, and distribution of technology products for individual investors, financial advisors, and institutions, as well as custom solutions for institutions. He joined us in 1996 as product manager for Principia, and from 1997 to 1998, he served as senior product manager of advisor products. From 1999 to 2000, he served as vice president of advisor products, where he was responsible for all marketing related to financial advisors. From 2000 to 2009, he was president of Morningstar's advisor software business. He holds a bachelor's degree in economics and psychology from Northwestern University.
23
Scott Cooley
Scott Cooley has been our chief financial officer since August 2007. Before joining Morningstar in 1996 as a stock analyst, he was a bank examiner for the Federal Deposit Insurance Corporation (FDIC), where he focused on credit analysis and asset-backed securities. From 1996 until 2003, he was an analyst, editor, and manager for Morningstar.com,
Morningstar Mutual Funds
, and other Morningstar publications. He became CEO of Morningstar Australia and Morningstar New Zealand in 2003 and served as co-CEO of these operations following our acquisition of Aspect Huntley in July 2006. He holds a bachelor's degree in economics and social science and a master's degree in history from Illinois State University.
Bevin Desmond
Bevin Desmond has been president of international operations and global human resources for Morningstar since January 2009. She is responsible for identifying and developing our business in new markets, managing and directing operations, launching new products, and overseeing human resources functions for all of Morningstar's global operations. She joined us in 1993 and was one of three employees who started our international business. From 1998 to 2000, she served as manager of all international ventures. From 2000 to 2009, she was president of Morningstar's international business. She has also served as president of institutional software. She holds a bachelor's degree in psychology from St. Mary's College.
Catherine Gillis Odelbo
Catherine Gillis Odelbo has been executive vice president of corporate strategy and partnerships since July 2012. She is responsible for working with Morningstar’s senior management team on the firm’s overall strategic planning process, M&A activities, and major partnerships. Previously, she was president of equity and credit research from 2009 until July 2012. She joined us in 1988 as a mutual fund analyst and from 1999 to 2000 served as senior vice president of content development for the company, as well as publisher and editor of our stock and closed-end fund research. She was president of our Individual segment from 2000 through 2008 and became president of our equity research business in 2009. She holds a bachelor's degree in American history from The University of Chicago and a master's degree in business administration from The University of Chicago Booth School of Business.
Greg Goff
Greg Goff has been chief technology officer for Morningstar since 2011 and is responsible for Morningstar's global technology strategy. Before joining us in 2011, he was senior vice president of global platform technology for The Nielsen Company since 2009. He joined The Nielsen Company in 2004 as vice president of data warehousing. He has also worked for Accenture and BlueMeteor, Inc. in Chicago. He holds a bachelor’s degree in electrical engineering from the University of Illinois at Urbana-Champaign.
Thomas Idzorek
Thomas Idzorek was named president of Morningstar's Investment Management division in May 2012 and is responsible for our investment advisory, retirement solutions, and investment management operations in North America, Europe, Asia, and Australia. He also oversees the Investment Policy Committee for the Investment Management division and serves on Morningstar's retirement plan committee. He joined us in 2006, when we acquired Ibbotson Associates. From 2006 until May 2012, Thomas was chief investment officer for Morningstar Investment Management. He holds a bachelor's degree in marketing from Arizona State University, a master's degree in business administration from Thunderbird School of Global Management, and the Chartered Financial Analyst (CFA) designation.
24
Kunal Kapoor
Kunal Kapoor has been president of Morningstar's Data division since 2012. He is responsible for managing our investment databases and related products. Prior to assuming his current role in 2012, Kunal was president of Equity and Market Data/Software. In 2009, he became president of Individual Software, and in 2010, his role expanded to include our equity data business. Kunal joined the company as a data analyst in 1997 and became a fund analyst in 1998. In 2001 he joined Morningstar Investment Services, Inc., a registered investment advisor and wholly owned subsidiary of Morningstar, Inc., as a senior research analyst. He was named editor of
Morningstar Mutual Funds
, in 2003, and in 2004 was appointed director of mutual fund analysis, where he led Morningstar's team of mutual fund analysts. In 2006, Kunal was named director of business strategy for Morningstar's international operations. He also served as president and chief investment officer of Morningstar Investment Services.
Kunal holds a bachelor's degree in economics and environmental policy from Monmouth College and a master's degree in business administration from The University of Chicago Booth School of Business. He also holds the Chartered Financial Analyst (CFA) designation.
Don Phillips
Don Phillips has been president of Morningstar's Investment Research division, overseeing our global fund, equity, and credit research, since 2012. He joined us in 1986 as our first mutual fund analyst. Don served as our vice president and publisher from 1991 to 1996, as our president from 1996 to 1998, and as our chief executive officer from 1998 to 2000. He has been a managing director since 2000 and in 2009 took on additional responsibilities as president of fund research. Don's role expanded in 2012 to include oversight of our global equity and credit research. He has served on our board of directors since August 1999. Don holds a bachelor's degree from the University of Texas and a master's degree from The University of Chicago.
Richard Robbins
Richard Robbins has been our general counsel and corporate secretary since August 2005. He is responsible for directing Morningstar's legal department and managing our relationships with outside counsel. He also oversees our compliance and corporate communications departments. From May 1999 until he joined Morningstar, he was a partner at Sidley Austin Brown & Wood LLP (now Sidley Austin LLP), which he joined as an associate in August 1991. He holds bachelor's and master's degrees in computer science and electrical engineering from the Massachusetts Institute of Technology and a juris doctor degree from The University of Chicago Law School.
James Tanner
James Tanner joined Morningstar in January 2013 as global head of business development and sales. Previously he served as vice chairman of business development for Markit On Demand, a company he founded as Wall Street On Demand in 1991. In addition to his role as CEO, he also served in various roles for firms that have owned Wall Street On Demand, including head of sales for eBridge and head of distribution and vice chairman of business development for Markit, a UK-based global financial information company. James holds a bachelor’s degree in Russian language and literature from Haverford College and a master’s degree in business administration from Harvard University.
David W. Williams
David W. Williams has been a managing director for Morningstar since 2000. He is in charge of design and its application to brand identity, products, marketing communications, and the workplace. He joined us in 1993 and has been instrumental in establishing design as one of our recognized core capabilities. He holds a bachelor's degree in industrial design from The Ohio State University and a master's degree in fine arts from the Yale University School of Art.
Company Information
We were incorporated in Illinois on May 16, 1984. Our corporate headquarters are located at 22 West Washington Street, Chicago, Illinois, 60602.
25
We maintain a website at
http://corporate.morningstar.com
. Our Annual Report on Form 10-K, quarterly reports on Form 10-Q, current reports on Form 8-K, and amendments to any of these documents are available free of charge on this site as soon as reasonably practicable after the reports are filed with or furnished to the SEC. We also post quarterly press releases on our financial results and other documents containing additional information related to our company on this site. We provide this website and the information contained in or connected to it for informational purposes only. That information is not part of this Annual Report on Form 10-K.
1A. Risk Factors
You should carefully consider the risks described below and all of the other information included in this Form 10-K when deciding whether to invest in our common stock or otherwise evaluating our business. If any of the following risks materialize, our business, financial condition, or operating results could suffer. In this case, the trading price of our common stock could decline, and you may lose all or part of your investment.
Our investment advisory operations may subject us to liability for any losses that result from a breach of our fiduciary duties.
Three of our subsidiaries, Ibbotson Associates, Inc., Morningstar Associates, LLC, and Morningstar Investment Services, Inc. are registered as investment advisors with the SEC under the Investment Advisers Act of 1940, as amended (Advisers Act). As registered investment advisors, these companies are subject to the requirements and regulations of the Advisers Act. Such requirements relate to, among other things, record-keeping, reporting, and standards of care, as well as general anti-fraud prohibitions. As registered investment advisors, all three subsidiaries are subject to on-site examination by the SEC.
In addition, because these three subsidiaries provide investment advisory services to retirement plans and their participants, they may be acting as fiduciaries under the Employee Retirement Income Security Act of 1974 (ERISA). As fiduciaries under ERISA, they have obligations to act in the best interest of their clients. They also have duties of loyalty and prudence, as well as duties to diversify investments and to follow plan documents to comply with the applicable portions of ERISA.
Our subsidiaries outside the United States that have investment advisory operations are subject to similar requirements.
We may face liabilities for actual or claimed breaches of our fiduciary duties, particularly in areas where we provide retirement advice and managed retirement accounts. We may not be able to prevent clients from taking legal action against us for an actual or claimed breach of a fiduciary duty. Because we provided investment advisory and management services on about $
149.5 billion
in assets as of
December 31, 2012
, we could face substantial liabilities if we breach our fiduciary duties.
In addition, we may face other legal liabilities based on the quality and outcome of our investment advisory recommendations, even in the absence of an actual or claimed breach of fiduciary duty.
An outage of our database and network facilities could result in reduced revenue and the loss of customers.
The success of our business depends upon our ability to deliver time-sensitive, up-to-date data and information. We rely on our computer equipment, database storage facilities, and other network equipment, much of which is geographically concentrated in our Chicago headquarters and other backup locations in the United States. We also have extensive information systems outside the United States. Our mission-critical databases and networks are increasingly complex and interdependent. Many of our client contracts contain service-level agreements that require us to meet certain obligations for delivering time-sensitive, up-to-date data and information. We may not be able to meet these obligations in the event of failure or downtime in our information systems. Our operations and those of our suppliers and customers are vulnerable to interruption by fire, earthquake, power loss, telecommunications failure, terrorist attacks, wars, Internet failures or disruptions, computer viruses, and other events beyond our control. Our database and network facilities may also be vulnerable to external attacks that misappropriate our data, corrupt our databases, or limit access to our information systems.
26
We maintain off-site back-up facilities for our database and network equipment, but these facilities could be subject to the same interruptions that may affect our headquarters. We may not be able to fully recover data or information lost during a database or network facility outage. Any losses, service disruption, or damages incurred by us could have a material adverse effect on our business, operating results, or financial condition.
Our business relies heavily on electronic delivery systems and the Internet. Any failures or disruptions could result in reduced revenue and the loss of customers.
Most of our products and services depend heavily on our electronic delivery systems and the Internet. Our ability to deliver information using the Internet may be impaired because of infrastructure failures, service outages at third-party Internet providers, malicious attacks, or other factors. If disruptions, failures, or slowdowns of our electronic delivery systems or the Internet occur, our ability to distribute our products and services effectively and to serve our customers may be impaired.
We could face liability related to our storage of personal information about our users.
Customers routinely input personal investment and financial information, including portfolio holdings and credit card information, on our websites. We also handle an increasing volume of personally sensitive information through our Portfolio Management Service, Enterprise Data Management, managed retirement accounts, and other areas of our business. Contractual commitments to customers as well as laws and industry regulations related to data protection, system availability, and privacy require us to safeguard critical data. We are also required to take appropriate steps to safeguard credit card numbers, social security numbers, and other personally identifiable information. We may suffer malicious attacks seeking to penetrate our network and databases to gain access to personal data. We could be subject to liability if we were to inappropriately disclose any user's personal information or if third parties were able to penetrate our network security or otherwise gain access to any user's name, address, portfolio holdings, or credit card information.
Changes in laws applicable to our investment advisory or credit rating operations, compliance failures, or regulatory action could adversely affect our business.
Our investment advisory operations are a growing part of our overall business. The securities laws and other laws that govern our activities as a registered investment advisor are complex. The activities of our investment advisory operations are primarily subject to provisions of the Investment Advisers Act of 1940 (the Advisers Act) and the Employee Retirement Income Security Act of 1974 (ERISA). In addition, Morningstar Investment Services is a broker-dealer registered under the Securities Exchange Act of 1934 (the Exchange Act) and is subject to the rules of FINRA. We also provide investment advisory services in other areas around the world, and our operations are subject to additional regulations in markets outside the United States.
Over the past several years, we have also made significant investments in our credit rating business. We began publishing credit ratings and associated research on corporate debt issuers in 2009. Although our corporate credit rating business is not currently regulated as a Nationally Recognized Statistical Rating Organization (NRSRO), credit rating and research providers have been under increasing regulatory scrutiny. We cannot predict the future impact of potential future regulatory changes on our corporate credit rating business.
We also expanded our credit rating business operations with our May 2010 acquisition of Realpoint, LLC (now known as Morningstar Credit Ratings, LLC), an NRSRO that specializes in structured finance. As an NRSRO, Morningstar Credit Ratings is subject to various requirements and regulations under the Exchange Act relating to, among other things, record-keeping, reporting, governance, and conflicts of interest. As part of its NRSRO registration, Morningstar Credit Ratings is subject to annual examinations by the SEC.
It is difficult to predict the future effect of the broad and expanding legislative and regulatory requirements affecting our business. The laws, rules, and regulations applicable to our business may change in the future, and we may not be able to comply with any such changes. If we fail to comply with any applicable law, rule, or regulation, we could be fined, sanctioned, or barred from providing investment advisory or credit rating services in the future, which could materially adversely affect our business, operating results, or financial condition.
27
Downturns in the financial sector, global financial markets, and global economy may adversely impact our business.
We believe ongoing economic weakness continues to cause uncertainty and pressure on consumer discretionary spending. The financial crisis of 2008 and 2009, as well as more recent financial and economic uncertainty, has led to spending cutbacks among asset management firms and other financial services companies, which make up a large percentage of our client base. Some institutional clients also implemented additional review processes for new contracts or began to provide certain services, particularly investment advisory services, in-house rather than hiring external service providers. Some institutional clients have also reduced the scope of their operations. For example, several large insurers withdrew from the variable annuity market during 2011 and 2012, while others curtailed their new sales efforts. This has had a negative effect on the services we provide to institutional clients that offer variable annuities.
In 2010 and 2011, rising government debt levels around the world as well as downgrades in sovereign debt issues for some European countries led to market fears about a potential crisis in global sovereign debt. Some European countries have been unable to successfully refinance their debts, leading European finance officials to take measures during 2010 and 2011 to stabilize financial conditions across Europe.
Although sovereign debt problems have been most severe in countries such as Greece, Ireland, and Portugal, concerns have also grown about the stability of Europe as a whole and the future of the euro currency. In
2012
, approximately 16.2% of our consolidated revenue was from Europe, including
7.6%
in Continental Europe and
8.6%
in the United Kingdom. Our European operations are also subject to currency risk related to the euro, which accounted for approximately 5.8% of our consolidated revenue in
2012
and approximately 10.2% of our cash and cash equivalents balance as of
December 31, 2012
. We don't engage in currency hedging or have any positions in derivative instruments to hedge our currency risk. Our reported revenue could suffer if the euro declines relative to the U.S. dollar.
In addition, if financial markets around the world experience negative performance and volatility, demand for our products and services may decline, and our revenue, operating income, and other financial results could suffer. Our business results may also be impacted by negative trends in Internet advertising sales. The financial markets and many businesses operating in the financial services industry are highly volatile and are affected by factors, such as U.S. and foreign economic conditions and general trends in business and finance, that are beyond our control.
Our revenue from asset-based fees may be adversely affected by market declines as well as the effect of cash outflows from portfolios that we help manage.
In
2012
, revenue from asset-based fees made up approximately
12%
of our consolidated revenue and a greater percentage of our operating income. The amount of revenue we earn from asset-based fees depends on the value of assets on which we provide advisory services, and the size of our asset base can increase or decrease along with trends in market performance. The value of assets under advisement may show substantial declines during periods of significant market volatility. The size of these portfolios can also be affected if net inflows into the portfolios on which we provide investment advisory services drop or if these portfolios experience redemptions. If the level of assets on which we provide investment advisory services goes down, we expect our fee-based revenue to show a corresponding decline.
We could face liabilities and/or damage to our reputation as a result of some of our currently pending litigation.
From time to time, we are subject to legal and regulatory proceedings in the ordinary course of our business. These include proceedings relating to aspects of our businesses that are specific to us and proceedings that are typical in the asset management and financial information businesses in which we operate.
We are currently defendants in a number of litigation matters as further described in Item 3—Legal Proceedings of this Annual Report on Form 10-K. In certain of these matters, the plaintiffs are seeking large and/or indeterminate amounts of damages. Litigation is inherently unpredictable, and the outcome of any particular proceeding can never be predicted with certainty. An adverse outcome in a litigation matter could, depending on the facts, have a material financial impact on our company.
28
In addition to its potential financial impact, litigation can have a significant adverse reputational impact. We depend to a large extent on our reputation for integrity and high-caliber professional services. Allegations of improper conduct made by private litigants or regulators, whether the ultimate outcome is favorable or unfavorable to us, as well as negative publicity and press speculation about us, whether valid or not, may harm our reputation, which may be damaging to our business.
Our results could suffer if the mutual fund industry continues to experience slower growth, or if actively managed equity funds continue to attract less investor attention.
A significant portion of our revenue is generated from products and services related to mutual funds. The mutual fund industry has experienced substantial growth over the past 30 years, but suffered along with the market downturn in 2008 and early 2009. Since then, fund assets have increased, but at a slower rate than in previous years. Based on Morningstar's estimates for U.S. mutual fund asset flows, long-term open-end funds had positive net inflows of approximately $243 billion in 2012. However, assets continued to flow out of actively managed stock funds, with investors heavily favoring fixed-income funds and passively managed vehicles. While equity funds had net outflows of approximately $104 billion in 2012, fixed-income funds experienced net inflows of more than $300 billion.
A significant portion of our fund research has historically focused on equity-related funds. In addition, Morningstar is best known for our data and analyst research on actively managed equity funds. Over the past several years, passively managed index funds have seen strong investor interest. This trend continued in 2012, as passively managed vehicles (both mutual funds and ETFs) had nearly $200 billion in net inflows, compared with $7 billion of net outflows for active products. Overall, we estimate that passively managed assets now account for about one-fourth of combined mutual fund and ETF assets.
Continued downturns or volatility in the financial markets, increased investor interest in other investment vehicles, or a lack of investor confidence could continue to reduce investor interest and investment activity. In addition, a continued lessening of investor interest in actively managed equity funds could decrease demand for our products.
Failing to differentiate our products and continuously create innovative, proprietary research tools may harm our competitive position and business results.
We attribute much of our company's success over the past 29 years to our ability to develop innovative, proprietary research tools, such as the Morningstar Rating, Morningstar Style Box, Ownership Zone, and Portfolio X-Ray. We believe these proprietary tools continue to provide us with a competitive advantage, but if tools similar to them become more broadly available through other channels, our competitive position and business results may suffer. Our competitive position and business results may also suffer if other companies are able to successfully introduce innovative, proprietary research tools that gain a wide following. Because of lower technology costs and the growth of open software platforms, we believe the barriers to entry for new competitors have declined, making it easier for new players to enter the market. Smaller companies may also be able to introduce new research tools that gain a wide following. We cannot guarantee that we will continue to successfully develop new product features and tools that differentiate our product offerings from those of our competitors.
Failing to respond to technological change, keep pace with new technology developments, or adopt a successful technology strategy may negatively affect our competitive position and business results.
We believe the technology landscape has been changing at an accelerating rate over the past several years. Changes in technology are fundamentally impacting the ways investors access data and content. Examples include the shift from local network to computing to cloud-based systems, the proliferation of wireless mobile devices, and rapid acceleration in the use of social media platforms. While some of these changes may offer business opportunities for Morningstar, we cannot guarantee that we will successfully adapt our product offerings to meet the rapidly changing technology landscape. We believe our history of rapid technological innovation and expertise in technology have historically given us a competitive advantage. As mentioned above, though, we believe that lower technology costs and growth in open software platforms have lowered barriers to entry for new competitors. Our competitive position and business results may suffer if we fail to develop new technologies to meet client demands, or if we adopt a technology strategy that doesn't align with changes in the market.
29
Competition could reduce our share of the investment research market and hurt our financial performance.
We operate in a highly competitive industry, with many investment research providers competing for business from individual investors, financial advisors, and institutional clients. We compete with many different types of companies that vary in size, product scope, and media focus, including large and well-established distributors of financial information, such as Bloomberg; Standard & Poor's, a division of The McGraw-Hill Companies; and Thomson Reuters. We compete with a variety of other companies in different areas of our business, which we discuss in greater detail in the Business Segments, Products, and Services section in Item 1-Business.
Many of our competitors have larger customer bases and significantly greater resources than we do. This may allow them to respond more quickly to new technologies and changes in demand for products and services, devote greater resources to developing and promoting their services, and make more attractive offers to potential clients, subscribers, and strategic partners. Industry consolidation may also lead to more intense competition. Increased competition could result in price reductions, reduced margins, or loss of market share, any of which could hurt our business, operating results, or financial condition.
The investment information industry is dominated by a few large players, and industry consolidation has increased in the past several years. If providers of data and investment analysis continue to consolidate, our competitive position may suffer.
Our operations outside of the United States are expanding and involve additional challenges that we may not be able to meet.
Our operations outside of the United States have expanded to
$191.3 million
in revenue in
2012
from
$184.9 million
in
2011
. There are risks inherent in doing business outside the United States, including challenges in reaching new markets because of established competitors and limited brand recognition; difficulties in staffing, managing, and integrating non-U.S. operations; difficulties in coordinating and sharing information globally; differences in laws and policies from country to country; exposure to varying legal standards, including intellectual property protection laws; potential tax exposure related to transfer pricing and other issues; heightened risk of fraud and noncompliance; and currency exchange rates and exchange controls. These risks could hamper our ability to expand around the world, which may hurt our financial performance and ability to grow.
As our non-U.S. revenue increases as a percentage of consolidated revenue, fluctuations in foreign currencies present a greater potential risk. We don't engage in currency hedging or have any positions in derivative instruments to hedge our currency risk. Our reported revenue could suffer if certain foreign currencies decline relative to the U.S. dollar, although the impact on operating income may be offset by an opposing currency impact on locally based operating expense. In addition, because we use the local currency of our subsidiaries as the functional currency, our financial results are affected by the translation of foreign currencies into U.S. dollars.
The increasing concentration of data and development work carried out at our offshore facilities may have a negative impact on our business operations, products, and services.
We now have approximately 900 employees working in our data and technology development center in Shenzhen, China, or about one-fourth of our total workforce. Because China has a restrictive government under centralized control, we cannot predict the level of political and regulatory risk that may affect our operations. The concentration of development and data work carried out at this facility also involves operational risks for our network infrastructure. Any difficulties that we face in successfully maintaining our development center in China may harm our business and have a negative impact on the products and services we provide, particularly because of our increasing reliance on this facility.
We have approximately 360 employees who work at our data collection facility in Mumbai, India, which may also be subject to regulatory and political risk (including potential terrorist acts). Like the Shenzhen operation, these facilities also involve operational risks for our network infrastructure.
30
We could face liability for the information we publish, including information based on data we obtain from other parties.
We may be subject to claims for securities law violations, defamation (including libel and slander), negligence, or other claims relating to the information we publish, including our research and ratings on corporate credit issuers. For example, investors may take legal action against us if they rely on published information that contains an error, or a company may claim that we have made a defamatory statement about it or its employees. We could also be subject to claims based on the content that is accessible from our website through links to other websites. We rely on a variety of outside parties as the original sources for the information we use in our published data. These sources include securities exchanges, fund companies, hedge funds, transfer agents, and other data providers. Accordingly, in addition to possible exposure for publishing incorrect information that results directly from our own errors, we could face liability based on inaccurate data provided to us by others. Defending claims based on the information we publish could be expensive and time-consuming and could adversely impact our business, operating results, and financial condition.
Our future success depends on our ability to recruit and retain qualified employees.
We experience competition for analysts and other employees from financial institutions and financial services organizations. These organizations generally have greater resources than we do and therefore may be able to offer significantly more attractive compensation packages to potential employees. Competition for these employees is intense, and we may not be able to retain our existing employees or be able to recruit and retain other highly qualified personnel in the future.
Our future success also depends on the continued service of our executive officers, including Joe Mansueto, our chairman, chief executive officer, and controlling shareholder. Joe is heavily involved in our day-to-day operations, business strategy, and overall company direction. The loss of Joe or other executive officers could hurt our business, operating results, or financial condition. We do not have employment agreements, non-compete agreements, or life insurance policies in place with any of our executive officers. They may leave us and work for our competitors or start their own competing businesses.
Failure to protect our intellectual property rights could harm our brand and ability to compete effectively.
The steps we have taken to protect our intellectual property may not be adequate to safeguard our proprietary information. Further, effective trademark, copyright, and trade secret protection may not be available in every country in which we offer our services. Our continued ability to market one or more of our products under their current names could be adversely affected in those jurisdictions where another person registers, or has a pre-existing registration on one or more of them. Failure to adequately protect our intellectual property could harm our brand, devalue our proprietary content, and affect our ability to compete in the marketplace.
From time to time, we encounter jurisdictions in which one or more third parties have a pre-existing trademark registration in certain relevant international classes that may prevent us from registering our own marks in those jurisdictions. It is possible that our continued ability to use the “Morningstar” name or logo, either on a stand-alone basis or in association with certain products or services, could be compromised in those jurisdictions because of these pre-existing registrations. Similarly, from time to time, we encounter situations in certain jurisdictions where one or more third parties are already using the Morningstar name, either as part of a registered corporate name, a registered domain name or otherwise. Our ability to effectively market certain products and/or services in those locations could be adversely affected by these pre-existing usages.
31
Failing to maintain and protect our brand, independence, and reputation may harm our business. Our reputation and business may also be harmed by allegations made about possible conflicts of interest.
We believe that independence is at the core of our business, and our reputation is our greatest corporate asset. We offer products and services to our institutional clients, which include banks, brokerage firms, insurance companies, mutual fund companies, media outlets, and retirement plan providers and sponsors. Our institutional clients have generated a significant percentage of our consolidated revenue in recent years. We provide ratings, analyst research, and investment recommendations on mutual funds and other investment products offered and securities issued by our institutional clients. We also provide investment advisory and investment management services. The fact that our institutional clients pay us for certain products and services, as well as the fact that in some cases we make investment recommendations within the framework of client constraints, may create the perception that our ratings, research, and recommendations are not impartial.
This perception may undermine the confidence of our customers and potential customers in our reputation as a provider of independent research. Any such loss of confidence or damage to our reputation could hurt our business.
Any failure to uphold our high ethical standards and ensure that our customers have a consistently positive experience with us (either intentionally or inadvertently) could damage our reputation as an objective, honest, and credible source for investment research and information.
Our reputation may also be harmed by factors outside of our control, such as news reports about our clients or adverse publicity about certain investment products.
Control by a principal shareholder could adversely affect our other shareholders.
As of December 31, 2012
, Joe Mansueto, our chairman and chief executive officer, owned approximately 53% of our outstanding common stock. As a result, he has the ability to control substantially all matters submitted to our shareholders for approval, including the election and removal of directors and any merger, consolidation, or sale of our assets. He also has the ability to control our management and affairs. This concentration of ownership may delay or prevent a change in control; impede a merger, consolidation, takeover, or other business combination involving Morningstar; discourage a potential acquirer from making a tender offer or otherwise attempting to obtain control of the company; or result in actions that may be opposed by other shareholders.
Fluctuations in our operating results may negatively affect our stock price.
We believe our business has relatively large fixed costs and low variable costs, which magnify the impact of revenue fluctuations on our operating results. As a result, a decline in our revenue may lead to a larger decline in operating income. A substantial portion of our operating expense is related to personnel costs, marketing programs, office leases, and other infrastructure spending, which generally cannot be adjusted quickly. Our operating expense levels are based on our expectations for future revenue. If actual revenue falls below our expectations, or if our expenses increase before revenues do, our operating results would be materially and adversely affected. In addition, we do not provide earnings guidance or hold one-on-one meetings with institutional investors and research analysts. Because of this policy and limited analyst coverage on our stock, our stock price may be volatile. If our operating results or other operating metrics fail to meet the expectations of outside research analysts and investors, the market price of our common stock may decline.
The future sale of shares of our common stock may negatively affect our stock price.
If our shareholders sell substantial amounts of our common stock, the market price of our common stock could fall. A reduction in ownership by Joe Mansueto or any other large shareholder could cause the market price of our common stock to fall. In addition, the average daily trading volume in our stock is relatively low. The lack of trading activity in our stock may lead to greater fluctuations in our stock price. Low trading volume may also make it difficult for shareholders to make transactions in a timely fashion.
32
Our shareholders may experience dilution in their ownership positions.
In the past, we've granted options to employees as a significant part of their overall compensation package. In 2006, we began granting restricted stock units to our employees and non-employee directors.
As of December 31, 2012
, our employees and non-employee directors held options to acquire
674,479
shares of common stock,
620,379
of which were exercisable at a weighted average price of approximately
$22.66
per share.
As of December 31, 2012
, there were
745,927
restricted stock units outstanding, which have an average remaining vesting period of
33
months. Generally speaking, the company issues a share of stock when a restricted stock unit vests. To the extent that option holders exercise outstanding options to purchase common stock and shares are issued when restricted stock units vest, there will be further dilution. Future grants of stock options or restricted stock units may also result in dilution. We may raise additional funds through future sales of our common stock. Any such financing would result in additional dilution to our shareholders.
Stock option exercises, share repurchases, and other factors may create volatility in our cash flows.
Part of our cash provided by financing activities consists of proceeds from stock option exercises and excess tax benefits related to stock option exercises and vesting of restricted stock units. Excess tax benefits occur at the time a stock option is exercised if the intrinsic value of the option (the difference between the exercise price of the option and the fair value of our stock on the date of exercise) exceeds the fair value of the option at the time of grant. Similarly, excess tax benefits are generated upon vesting of restricted stock units when the market value of our common stock at vesting is greater than the grant price of the restricted stock units. These excess tax benefits reduce the cash we pay for income taxes in the year they are recognized. It is not possible to predict the timing of stock option exercises or the intrinsic value that will be realized. Because of this uncertainty, there may be additional volatility in our cash flows from financing activities.
In addition, our board of directors has authorized a share repurchase program allowing for the repurchase of up to $500 million of our outstanding common stock, of which $188.5 million remains available for future repurchases as of February 22, 2013. We may repurchase shares from time to time at prevailing market prices on the open market or in private transactions in amounts that management deems appropriate. Changes in the amount of repurchase activity from period to period may also cause volatility in our cash flows.
We do not have any unresolved comments from the Staff of the Securities and Exchange Commission regarding our periodic or current reports under the Exchange Act.
As of December 31, 2012
, we leased approximately
305,000
square feet of office space for our U.S. operations, primarily for our office located in Chicago, Illinois. We also lease approximately
351,000
square feet of office space in
24
other countries around the world, including
141,000
square feet in Shenzhen, China. We believe that our existing and planned office facilities are adequate for our needs and that additional or substitute space is available to accommodate growth and expansion.
Open Matters
Life's Good S.T.A.B.L. Hedge Fund
In September 2011, three individual investors in Life's Good S.T.A.B.L. Mortgage hedge fund (LG), Marta Klass, Gregory Martin, and Richard Roellig, filed a complaint in the United States District Court for the Eastern District of Pennsylvania against LG, its principal Robert Stinson, and several other parties, including Morningstar, Inc. (the Klass Matter). The plaintiffs claim that Morningstar committed fraud and aided and abetted the other defendants' breach of fiduciary duty through the 5-star rating LG obtained from Morningstar. The plaintiffs seek unspecified damages. Hedge fund managers self-report their performance data to Morningstar.
33
More than a year before the Klass Matter, in June 2010, the SEC filed suit against LG and other entities claiming they were part of a Ponzi scheme operated by Stinson. As a result, LG and the other entities were placed in court-appointed receivership. Morningstar was not part of the SEC suit or receivership. Since that time, the Receiver, as part of his duties, has been investigating whether to assert claims against third parties. Morningstar is aware of 14 lawsuits filed by the Receiver seeking to recover money for the fund.
In November 2011, Morningstar filed a motion to dismiss the Klass Matter. On behalf of the entities in receivership, the Receiver filed a motion to stay the proceedings because the Receivership Order does not permit suits against the entities in receivership without court permission. The court granted the Receiver's motion and stayed the Klass Matter. In April 2012, the Receiver filed a complaint against Morningstar, in which the Receiver claims that Morningstar is liable for contribution and aiding and abetting Stinson's breach of fiduciary duty and fraud through the 5-star rating LG obtained from Morningstar. The Receiver seeks unspecified damages. The same day the Receiver filed his complaint, Morningstar sought leave from the court to file a counter suit against Stinson and two of his entities-Keystone State Capital Corporation and LG-for, among other things, fraud, misrepresentation, and breach of user agreements. In June 2012, the court denied Morningstar's motion for leave to file suit. The court took no position on the merits of Morningstar's claims, and did not preclude Morningstar from renewing its motion to file a complaint at a later time, but deferred to the Receiver's request not to subject the receivership estate to additional litigation at this early point in the receivership. In August 2012, the court denied Morningstar's motion to dismiss the Receiver's complaint.
Morningstar believes the allegations against it by the Klass plaintiffs and the Receiver have no legal or factual basis and plans to vigorously contest the claims. Morningstar also intends to refile its affirmative claims against Stinson, Keystone, and LG at a later time consistent with the court's order. We cannot predict the outcome of the proceedings.
Business Logic Holding Corporation
In November 2009, Business Logic Holding Corporation filed a complaint in the Circuit Court of Cook County, Illinois against Ibbotson Associates, Inc. and Morningstar, Inc. relating to Ibbotson's prior commercial relationship with Business Logic. Business Logic is alleging breach of contract and trade secret misappropriation in connection with Ibbotson's development of a proprietary web-service software and user interface that connects plan participant data with the Ibbotson Wealth Forecasting Engine. Business Logic seeks, among other things, injunctive relief and unspecified damages. Ibbotson and Morningstar answered the complaint, and Ibbotson asserted a counterclaim against Business Logic alleging trade secret misappropriation and breach of contract, seeking damages and injunctive relief. While Morningstar and Ibbotson are vigorously contesting the claims against them, we cannot predict the outcome of the proceeding.
We have not provided an estimate of loss or range of loss in connection with the matters described above because no such estimate can reasonably be made.
Settled Matters
Egan-Jones Rating Co.
In June 2010, Egan-Jones Rating Co. filed a complaint in the Court of Common Pleas of Montgomery County, Pennsylvania against Realpoint, LLC (now known as Morningstar Credit Ratings, LLC) and Morningstar, Inc. in connection with a December 2007 agreement between Egan-Jones and Morningstar Credit Ratings for certain data-sharing and other services. In addition to damages, Egan-Jones filed a petition seeking an injunction to temporarily prevent Morningstar from offering corporate credit ratings through December 31, 2010. In September 2010, the court denied Egan-Jones's request for a preliminary injunction against Morningstar's corporate credit ratings business. In December 2012, Morningstar Credit Ratings, Morningstar, and Egan Jones entered into a settlement agreement resolving the litigation. All settlement terms are confidential.
Other Matters
In addition to these proceedings, we are involved in legal proceedings and litigation that have arisen in the normal course of our business. Although the outcome of a particular proceeding can never be predicted, we do not believe that the result of any of these other matters will have a material adverse effect on our business, operating results, or financial position.
34
Not applicable.
35
Our common stock is listed on the Nasdaq Global Select Market under the symbol “MORN”.
The following table shows the high and low price per share of our common stock for the periods indicated, as reported on the Nasdaq Global Select Market:
|
2012
|
|
2011
|
|
|||||||||||
|
High
|
|
Low
|
|
High
|
|
Low
|
|
|||||||
|
First Quarter
|
$
|
63.25
|
|
$
|
56.23
|
|
$
|
60.46
|
|
$
|
51.85
|
|
||
|
Second Quarter
|
63.57
|
|
54.71
|
|
60.95
|
|
56.30
|
|
||||||
|
Third Quarter
|
63.08
|
|
56.35
|
|
64.00
|
|
51.11
|
|
||||||
|
Fourth Quarter
|
65.62
|
|
60.69
|
|
61.59
|
|
54.01
|
|
||||||
As of February 22, 2013, the last reported price on the Nasdaq Global Select Market for our common stock was $68.90 per share, and there were 1,479 shareholders of record of our common stock.
In September 2010, our board of directors approved a quarterly dividend of 5 cents per share. The first dividend was paid on January 14, 2011 to shareholders of record on December 31, 2010. We paid a dividend during each quarter of 2011 and 2012. On
December 7, 2012
, our board of directors declared a dividend of
12.5 cents
per share, payable on
December 28, 2012
to shareholders of record as of
December 17, 2012
. This was our fifth dividend payment in 2012 because we opted to pay the dividend in December instead of in January 2013.
The following table shows the dividends declared and paid for the periods indicated:
|
2012
|
|
2011
|
|
|||||||||||
|
Dividends declared
|
|
Dividends paid
|
|
Dividends declared
|
|
Dividends paid
|
|
|||||||
|
First Quarter
|
$
|
0.10
|
|
$
|
0.10
|
|
$
|
0.05
|
|
$
|
0.05
|
|
||
|
Second Quarter
|
0.10
|
|
0.10
|
|
0.05
|
|
0.05
|
|
||||||
|
Third Quarter
|
0.10
|
|
0.10
|
|
0.05
|
|
0.05
|
|
||||||
|
Fourth Quarter
|
0.125
|
|
0.225
|
|
0.10
|
|
0.05
|
|
||||||
Any determination to pay dividends in the future will be at the discretion of our board of directors and will be dependent upon our results of operations, financial condition, contractual restrictions, restrictions imposed by applicable law, and other factors deemed relevant by the board of directors. Future indebtedness and loan facilities could also prohibit or restrict our ability to pay dividends and make distributions to our shareholders.
See Note
12
in our Notes to our Consolidated Financial Statements for a description of our equity compensation plans.
36
Issuer Purchases of Equity Securities*
The following table presents information related to repurchases of common stock we made through September 30, 2012 and during the three months ended December 31, 2012:
|
Period:
|
Total number
of shares
purchased
|
|
Average
price paid
per share
|
|
Total number
of shares
purchased as
part of publicly
announced
programs (1)
|
|
Approximate
dollar value of
shares that
may yet be
purchased
under the
programs (1)
|
|
||||||
|
Cumulative through September 30, 2012
|
3,964,411
|
|
$
|
58.39
|
|
3,964,411
|
|
$
|
68,446,067
|
|
||||
|
October 1, 2012 – October 31, 2012
|
380,375
|
|
63.55
|
|
380,375
|
|
$
|
44,267,029
|
|
|||||
|
November 1, 2012 – November 30, 2012
|
328,276
|
|
63.26
|
|
328,276
|
|
$
|
23,494,256
|
|
|||||
|
December 1, 2012 – December 31, 2012
|
383,533
|
|
63.68
|
|
383,533
|
|
$
|
199,063,689
|
|
|||||
|
Total
|
5,056,595
|
|
$
|
59.49
|
|
5,056,595
|
|
|
|
|||||
_________________________________________________
* Subject to applicable law, we may repurchase shares at prevailing market prices directly on the open market or in privately negotiated transactions in amounts that we deem appropriate.
|
(1)
|
In September 2010, our board of directors approved a share repurchase program that authorized the purchase of up to $100 million of the outstanding common stock with an expiration date of December 31, 2012. In December 2011, the board approved an increase to this program. The board approval authorized the company to repurchase up to an additional $200 million in shares of our outstanding common stock. In December 2012, the board approved another increase to this program. The board approval authorized the company to repurchase up to an additional $200 million in shares of our outstanding common stock with a revised expiration date of December 31, 2014.
|
37
Rule 10b5-1 Sales Plans
Our directors and executive officers may exercise stock options or purchase or sell shares of our common stock in the market from time to time. We encourage them to make these transactions through plans that comply with Exchange Act Rule 10b5-1(c). Morningstar will not receive any proceeds, other than proceeds from the exercise of stock options, related to these transactions. The following table, which we are providing on a voluntary basis, shows the Rule 10b5-1 sales plans entered into by our directors and executive officers that were in effect as of February 1, 2013:
|
Name and Position
|
Date of
Plan
|
Plan Termination Date
|
Number of
Shares
to be
Sold under
the Plan
|
|
Timing of Sales under the Plan
|
Number of Shares Sold under the Plan through February 1, 2013
|
|
Projected
Beneficial
Ownership (1)
|
|
|||||||
|
Jack Noonan Director
|
11/15/2012
|
5/2/2015
|
24,000
|
|
Shares to be sold under the plan if the stock reaches a specified price
|
—
|
|
60,695
|
|
|||||||
|
Scott Cooley
Chief Financial Officer
|
11/19/2012
|
12/31/2013
|
18,000
|
|
Shares to be sold under the plan on specified dates
|
—
|
|
18,323
|
|
|||||||
|
David Williams
Managing Director, Design
|
9/10/2008
|
12/31/2013
|
20,000
|
|
Shares to be sold under the plan if the stock reaches a specified price
|
6,000
|
|
69,876
|
|
|||||||
During the fourth quarter of 2012 and first quarter of 2013, the previously disclosed Rule 10b5-1 sales plans for Chris Boruff, Scott Cooley, Bevin Desmond and her spouse, Cheryl Francis, Steve Kaplan, Cathy Odelbo, Don Phillips, Richard Robbins, and Paul Sturm completed or expired in accordance with their terms.
_______________________________
(1) This column reflects an estimate of the number of shares each identified director and executive officer will beneficially own following the sale of all shares under the Rule 10b5-1 sales plans identified above. This information reflects the beneficial ownership of our common stock on December 31, 2012, and includes shares of our common stock subject to options that were then exercisable or that will have become exercisable by March 1, 2013 and restricted stock units that will vest by March 1, 2013. The estimates do not reflect any changes to beneficial ownership that may have occurred since December 31, 2012. Each director and executive officer identified in the table may amend or terminate his or her Rule 10b5-1 sales plan and may adopt additional Rule 10b5-1 plans in the future.
The selected historical financial data shown below should be read in conjunction with Management's Discussion and Analysis of Financial Condition and Results of Operations and our Consolidated Financial Statements and related notes included elsewhere in this Annual Report on Form 10-K. We have derived our Consolidated Statements of Income Data and Other Consolidated Financial Data for the years ended December 31, 2012, 2011, and 2010 and Consolidated Balance Sheet Data as of December 31, 2012 and 2011 from our audited Consolidated Financial Statements included in this Annual Report on Form 10-K. The Consolidated Statements of Income Data and Other Consolidated Financial Data for the years ended December 31, 2009 and 2008 and Consolidated Balance Sheet Data as of December 31, 2010, 2009, and 2008 were derived from our audited Consolidated Financial Statements, as restated, that are not included in this Annual Report on Form 10-K.
38
|
Consolidated Statements of Income Data
|
||||||||||||||||||||
|
(in thousands except per share amounts)
|
2008
|
|
2009
|
|
2010
|
|
2011
|
|
2012
|
|
||||||||||
|
Revenue
|
$
|
502,457
|
|
$
|
478,996
|
|
$
|
555,351
|
|
$
|
631,400
|
|
$
|
658,288
|
|
|||||
|
Operating expense
|
363,581
|
|
354,323
|
|
434,292
|
|
492,985
|
|
507,620
|
|
||||||||||
|
Operating income
|
138,876
|
|
124,673
|
|
121,059
|
|
138,415
|
|
150,668
|
|
||||||||||
|
Non-operating income, net
|
4,252
|
|
2,934
|
|
6,732
|
|
1,709
|
|
2,957
|
|
||||||||||
|
Income before income taxes and equity in net income of unconsolidated entities
|
143,128
|
|
127,607
|
|
127,791
|
|
140,124
|
|
153,625
|
|
||||||||||
|
Income tax expense
|
54,423
|
|
46,775
|
|
42,756
|
|
43,658
|
|
52,878
|
|
||||||||||
|
Equity in net income of unconsolidated entities
|
1,321
|
|
1,165
|
|
1,422
|
|
1,848
|
|
2,027
|
|
||||||||||
|
Consolidated net income from continuing operations
|
90,026
|
|
81,997
|
|
86,457
|
|
98,314
|
|
102,774
|
|
||||||||||
|
Gain on sale of discontinued operations, net of tax
|
—
|
|
—
|
|
—
|
|
—
|
|
5,188
|
|
||||||||||
|
Consolidated net income
|
90,026
|
|
81,997
|
|
86,457
|
|
98,314
|
|
107,962
|
|
||||||||||
|
Net (income) loss attributable to noncontrolling interests
|
(397
|
)
|
132
|
|
(87
|
)
|
43
|
|
117
|
|
||||||||||
|
Net income attributable to Morningstar, Inc.
|
$
|
89,629
|
|
$
|
82,129
|
|
$
|
86,370
|
|
$
|
98,357
|
|
$
|
108,079
|
|
|||||
|
Net income per share attributable to Morningstar, Inc.:
|
||||||||||||||||||||
|
Basic:
|
||||||||||||||||||||
|
Continuing operations
|
$
|
1.94
|
|
$
|
1.71
|
|
$
|
1.75
|
|
$
|
1.96
|
|
$
|
2.12
|
|
|||||
|
Discontinued operations
|
—
|
|
—
|
|
—
|
|
—
|
|
0.11
|
|
||||||||||
|
Total
|
$
|
1.94
|
|
$
|
1.71
|
|
$
|
1.75
|
|
$
|
1.96
|
|
$
|
2.23
|
|
|||||
|
Diluted:
|
||||||||||||||||||||
|
Continuing operations
|
$
|
1.82
|
|
$
|
1.65
|
|
$
|
1.70
|
|
$
|
1.92
|
|
$
|
2.10
|
|
|||||
|
Discontinued operations
|
—
|
|
—
|
|
—
|
|
—
|
|
0.10
|
|
||||||||||
|
Total
|
$
|
1.82
|
|
$
|
1.65
|
|
$
|
1.70
|
|
$
|
1.92
|
|
$
|
2.20
|
|
|||||
|
Dividends per common share:
|
||||||||||||||||||||
|
Dividends declared per common share
|
$
|
—
|
|
$
|
—
|
|
$
|
0.05
|
|
$
|
0.25
|
|
$
|
0.43
|
|
|||||
|
Dividends paid per common share
|
$
|
—
|
|
$
|
—
|
|
$
|
—
|
|
$
|
0.20
|
|
$
|
0.53
|
|
|||||
|
Weighted average common shares outstanding:
|
||||||||||||||||||||
|
Basic
|
46,139
|
|
48,112
|
|
49,249
|
|
50,032
|
|
48,497
|
|
||||||||||
|
Diluted
|
49,213
|
|
49,793
|
|
50,555
|
|
50,988
|
|
49,148
|
|
||||||||||
|
Other Consolidated Financial Data ($000)
|
2008
|
|
2009
|
|
2010
|
|
2011
|
|
2012
|
|
||||||||||
|
Stock-based compensation expense (1):
|
||||||||||||||||||||
|
Restricted stock units
|
$
|
7,571
|
|
$
|
10,591
|
|
$
|
12,545
|
|
$
|
12,765
|
|
$
|
13,451
|
|
|||||
|
Restricted stock
|
—
|
|
—
|
|
1,248
|
|
2,196
|
|
5,013
|
|
||||||||||
|
Stock options
|
3,710
|
|
1,002
|
|
—
|
|
342
|
|
441
|
|
||||||||||
39
|
Total stock-based compensation expense
|
$
|
11,281
|
|
$
|
11,593
|
|
$
|
13,793
|
|
$
|
15,303
|
|
$
|
18,905
|
|
|||||
|
Cash provided by (used for) investing activities (2)
|
$
|
(179,124
|
)
|
$
|
(174,675
|
)
|
$
|
(87,949
|
)
|
$
|
(110,767
|
)
|
$
|
80,192
|
|
|||||
|
Cash provided by (used for) financing activities (3)
|
$
|
50,737
|
|
$
|
25,320
|
|
$
|
12,525
|
|
$
|
(32,596
|
)
|
$
|
(265,176
|
)
|
|||||
|
Cash provided by operating activities
|
$
|
149,339
|
|
$
|
101,256
|
|
$
|
123,416
|
|
$
|
164,976
|
|
$
|
145,996
|
|
|||||
|
Capital expenditures
|
(48,519
|
)
|
(12,372
|
)
|
(14,771
|
)
|
(23,322
|
)
|
(30,039
|
)
|
||||||||||
|
Free cash flow (4)
|
$
|
100,820
|
|
$
|
88,884
|
|
$
|
108,645
|
|
$
|
141,654
|
|
$
|
115,957
|
|
|||||
|
Consolidated Balance Sheet Data
|
||||||||||||||||||||
|
As of December 31 ($000)
|
2008
|
|
2009
|
|
2010
|
|
2011
|
|
2012
|
|
||||||||||
|
Cash, cash equivalents, and investments
|
$
|
297,577
|
|
$
|
342,553
|
|
$
|
365,416
|
|
$
|
470,192
|
|
$
|
321,418
|
|
|||||
|
Working capital
|
179,819
|
|
236,595
|
|
254,556
|
|
341,400
|
|
217,245
|
|
||||||||||
|
Total assets
|
803,940
|
|
919,083
|
|
1,086,302
|
|
1,172,084
|
|
1,041,952
|
|
||||||||||
|
Deferred revenue (5)
|
130,270
|
|
127,114
|
|
146,267
|
|
155,494
|
|
146,015
|
|
||||||||||
|
Long-term liabilities
|
39,778
|
|
45,792
|
|
52,153
|
|
44,435
|
|
57,692
|
|
||||||||||
|
Total equity
|
530,245
|
|
665,789
|
|
781,425
|
|
857,016
|
|
726,895
|
|
||||||||||
(1) We account for our stock-based compensation expense in accordance with FASB ASC 718, Compensation—Stock Compensation. Our stock-based compensation expense reflects grants of restricted stock units, restricted stock, and stock options.
We began granting restricted stock units in May 2006 and have made additional grants each year since then. We measure the fair value of our restricted stock units on the date of grant based on the market price of the underlying common stock as of the close of trading on the day prior to grant. We amortize that value to stock-based compensation expense, net of estimated forfeitures, ratably over the vesting period.
Beginning in 2010, we began recording expense related to restricted stock issued with the acquisition of Realpoint, LLC. In May 2010, we issued 199,174 shares that will vest over five years from the date of grant. The restricted stock vests ratably over a five-year period from the acquisition date and may be subject to forfeiture if the holder terminates his or her employment during the vesting period. The expense in 2012 and 2011 includes $3.2 million and $0.4 million, respectively, for accelerated vesting of a portion of this restricted stock.
We did not grant any stock options in 2012. In 2011, we granted 92,201 stock options to our executive officers and non-employee directors. We estimate the fair value of our stock options on the date of grant using a Black-Scholes option-pricing model. We amortize the fair values to stock-based compensation expense, net of estimated forfeitures, ratably over the vesting period.
The total expense for stock-based compensation is distributed with other employee compensation costs in the appropriate operating expense categories of our Consolidated Statements of Income. Refer to Note
12
of the Notes to our Consolidated Financial Statements for more information on our stock-based compensation.
(2) Cash provided by (used for) investing activities consists primarily of cash used for acquisitions, purchases of investments, net of proceeds from the sale of investments, capital expenditures, purchases of equity and cost- method investments, and proceeds from the sale of businesses. The level of investing activities can vary from period to period depending on the level of activity in these categories. Refer to Item 7–Management's Discussion and Analysis of Financial Condition and Results of Operations–Liquidity and Capital Resources for more information concerning cash used for investing activities.
40
(3) Cash provided by (used for) financing activities consists primarily of proceeds from stock-option exercises and excess tax benefits. These cash inflows are offset by cash used to repurchase outstanding common stock through our share repurchase program, which we began in the fourth quarter of 2010 and dividend payments. Refer to Item 7–Management's Discussion and Analysis of Financial Condition and Results of Operations–Liquidity and Capital Resources
,
for more information concerning cash provided by financing activities.
(4) Free cash flow is considered a non-GAAP financial measure under SEC regulations. We present this measure as supplemental information to help investors better understand trends in our business results over time. Our management team uses free cash flow to evaluate our business. Free cash flow is not equivalent to any measure required to be reported under GAAP, nor should this data be considered an indicator of liquidity. Moreover, the free cash flow definition we use may not be comparable to similarly titled measures reported by other companies.
(5) We frequently invoice or collect cash in advance of providing services or fulfilling subscriptions for our customers. These amounts are recorded as deferred revenue on our Consolidated Balance Sheets.
The discussion included in this section, as well as other sections of this Annual Report on Form 10-K, contains forward-looking statements as that term is used in the Private Securities Litigation Reform Act of 1995. These statements are based on our current expectations about future events or future financial performance. Forward-looking statements by their nature address matters that are, to different degrees, uncertain, and often contain words such as “may,” “could,” “expect,” “intend,” “plan,” “seek,” “anticipate,” “believe,” “estimate,” “predict,” “potential,” or “continue.” These statements involve known and unknown risks and uncertainties that may cause the events we discuss not to occur or to differ significantly from what we expect. For us, these risks and uncertainties include, among others, general industry conditions and competition, including current global financial uncertainty; the impact of market volatility on revenue from asset-based fees; damage to our reputation resulting from claims made about possible conflicts of interest; liability for any losses that result from an actual or claimed breach of our fiduciary duties; financial services industry consolidation; a prolonged outage of our database and network facilities; challenges faced by our non-U.S. operations; and the availability of free or low-cost investment information.
A more complete description of these risks and uncertainties can be found in Item 1A - Risk Factors of this Annual Report on Form 10-K. If any of these risks and uncertainties materialize, our actual future results may vary significantly from what we expected. We do not undertake to update our forward-looking statements as a result of new information or future events.
All dollar and percentage comparisons, which are often accompanied by words such as “increase,” “decrease,” “grew,” “declined,” “was up,” “was down,” “was flat,” or “was similar” refer to a comparison with the same period in the prior year unless otherwise stated.
Understanding Our Company
Our mission is to create great products that help investors reach their financial goals. We offer an extensive line of data, software, and research products for individual investors, financial advisors, and institutional clients. We also offer asset management services for advisors, institutions, and retirement plan participants. Many of our products are sold through subscriptions or license agreements. As a result, we typically generate recurring revenue.
Morningstar has two operating segments: Investment Information and Investment Management. The Investment Information segment includes all of our data, software, and research products and services. These products and services are typically sold through subscriptions or license agreements. The Investment Management segment includes our asset management operations, which operate as registered investment advisors and earn more than half of their revenue from asset-based fees. We emphasize a decentralized approach to running our business to empower our managers and to create a culture of responsibility and accountability.
Over our 28-year history, we have focused primarily on organic growth by introducing new products and services and expanding our existing products. From 2006 through 2010, we also completed 24 acquisitions to support our growth strategies.
41

42
Key Business Characteristics
Revenue
We generate revenue by selling a variety of investment-related products and services. We sell most of our products and services, including Morningstar Data, Morningstar Advisor Workstation, Morningstar Direct, Morningstar Equity Research, Retirement Solutions, and some of our structured credit research and ratings offerings, through license agreements. Our license agreements typically range from one to three years. We sell some of our other products, such as newsletters, Principia software, and Premium service on Morningstar.com, via subscriptions. These subscriptions are mainly offered for a one-year term, although we also offer terms ranging from one month to three years. We also sell advertising on our websites throughout the world.
For our Investment Advisory services, we generally base our fees on the scope of work and the level of service we provide and calculate them as a percentage of assets under advisement. We also earn fees relating to Morningstar Managed Portfolios and the managed retirement accounts offered through Morningstar Retirement Manager and Advice by Ibbotson that we calculate as a percentage of assets under management. Overall, revenue tied to asset-based fees accounted for about
12%
of our consolidated revenue in
2012
.
Deferred Revenue
We frequently invoice our clients and collect cash in advance of providing services or fulfilling subscriptions for our customers. As a result, we use some of this cash to fund our operations and invest in new product development. Deferred revenue is the largest liability on our Consolidated Balance Sheets and totaled
$146.0 million
as of
December 31, 2012
and
$155.5 million
as of
December 31, 2011
. We expect to recognize this deferred revenue in future periods as we fulfill the service obligations under our subscription, license, and service agreements.
Significant Operating Leverage
Our business requires significant investments to create and maintain proprietary databases and content. We strive to leverage these costs by selling a wide variety of products and services to multiple investor segments, through multiple media, and in many geographical markets. In general, our businesses have high fixed costs, and we expect our revenue to increase or decrease more quickly than our expenses. We believe that while the fixed costs of the investments in our business are relatively high, the variable cost of adding customers is considerably lower, particularly as a significant portion of our products and services focus on Internet-based platforms and assets under management. At times, we will make investments in building our databases and content that will hurt our short-term operating results. During other periods, our profitability may improve because we're able to increase revenue without increasing our cost base at the same rate. When revenue decreases, however, the operating leverage in our business may reduce our profitability.
Operating Expense
We classify our operating expense into separate categories for cost of goods sold, development, sales and marketing, general and administrative, and depreciation and amortization, as described below. We include stock-based compensation expense, as appropriate, in each of these categories.
•
Cost of goods sold.
This category includes compensation expense for employees who produce the products and services we deliver to our customers. For example, this category covers production teams and analysts who write investment research reports. Cost of goods sold also includes other expense such as third-party data purchases, data lines, postage, printing, and shareholder servicing fees for Morningstar Managed Portfolios.
•
Development.
This category includes compensation expense for programmers, designers, and other employees who develop new products and enhance existing products. In some cases, we capitalize the compensation costs associated with certain development projects. This reduces the expense that we would otherwise report in this category. We amortize these capitalized costs over the estimated economic life of the software, which is generally three years, and include this expense in depreciation and amortization.
•
Sales and marketing.
This category includes compensation expense for our sales teams, product managers, and other marketing professionals. We also include the cost of advertising, direct mail campaigns, and other marketing programs to promote our products.
43
•
General and administrative.
This category consists mainly of compensation expense for each segment's management team, as well as human resources, finance, and support employees for each segment. The category also includes compensation expense for senior management and other corporate costs, including corporate systems, finance and accounting, legal, compliance, and facilities expense.
•
Depreciation and amortization.
Our capital expenditures consist of computers, leasehold improvements, and capitalized product development costs related to certain software development projects. We depreciate property and equipment primarily using the straight-line method based on the useful life of the asset, which ranges from three to seven years. We amortize leasehold improvements over the lease term or their useful lives, whichever is shorter. We amortize capitalized product development costs over their estimated economic life, which is generally three years. We also include amortization related to intangible assets, which is mainly driven by acquisitions, in this category. We amortize intangible assets using the straight-line method over their estimated economic useful lives, which range from one to 25 years.
International Operations
We have majority-owned operations in 25 countries outside of the United States and include these in our consolidated financial statements. We account for our minority-owned investments in Japan and Sweden using the equity method.
How We Evaluate Our Business
When our analysts evaluate a stock, they focus on assessing the company's estimated intrinsic value-the value of the company's future cash flows, discounted to their worth in today's dollars. Our approach to evaluating our own business works the same way.
Our goal is to increase the intrinsic value of our business over time, which we believe is the best way to create value for our shareholders. We do not make public financial forecasts for our business because we want to avoid creating any incentives for our management team to make speculative statements about our financial results that could influence the stock price, or to take actions that help us meet short-term forecasts but may not be in the long-term interest of building shareholder value.
We provide three specific measures that can help investors generate their own assessment of how our intrinsic value has changed over time:
•
Revenue (including organic revenue);
•
Operating income (loss); and
•
Free cash flow, which we define as cash provided by or used for operating activities less capital
expenditures.
Organic revenue is considered a non-GAAP financial measure under Securities and Exchange Commission (SEC) regulations. We define organic revenue as consolidated revenue excluding acquisitions, divestitures, and foreign currency translations. We present organic revenue because we believe it helps investors better compare our period-to-period results, and our management team uses this measure to evaluate the performance of our business.
Free cash flow is also considered a non-GAAP financial measure. We present this measure as supplemental information to help investors better understand trends in our business results over time. Our management team uses free cash flow to evaluate our business. Free cash flow is not equivalent to any measure required under U.S. generally accepted accounting principles (GAAP) and should not be considered an indicator of liquidity. Moreover, the free cash flow definition we use may not be comparable to similarly titled measures reported by other companies.
44
To evaluate how successful we've been in maintaining existing business for products and services that have renewable revenue, we calculate a retention rate. We use two different methods for calculating retention. For subscription-based products (including our print newsletters, Morningstar.com Premium Membership service, and Principia software), we track the number of subscriptions retained during the year. For products sold through contracts and licenses, we use the contract value method, which is based on tracking the dollar value of renewals compared with the total dollar value of contracts up for renewal during the period. We include changes in the contract value in the renewal amount, unless the change specifically results from adding a new product that we can identify. We also include variable-fee contracts in this calculation and use the previous quarter's actual revenue as the base rate for calculating the renewal percentage. The retention rate excludes setup and customization fees, migrations to other Morningstar products, and contract renewals that were pending as of January 31, 2013.
The Year 2012 in Review
Industry Overview
We monitor developments in the economic and financial information industry on an ongoing basis. We use these insights to help inform our company strategy, product development plans, and marketing initiatives.
Despite lingering concerns about the pending fiscal cliff and the strength of the economic recovery, the U.S. stock market finished 2012 with double-digit returns for the year, following only a slight positive return in 2011. Morningstar's U.S. Market Index, a broad market benchmark, ended the year up 16.3%. Global markets closed out the year with similarly strong results.
Total U.S. mutual fund assets rose to $13.0 trillion as of December 31, 2012, compared with $11.6 trillion as of December 31, 2011, based on data from the Investment Company Institute (ICI). Although aggregate cash flows to mutual funds were positive for the year, investors continued to heavily favor fixed-income funds rather than equity funds. Based on Morningstar's analysis of fund flow trends, fixed-income funds experienced net inflows of more than $300 billion in 2012, but equity funds had net outflows of approximately $100 billion. Global mutual fund
assets showed a similar trend, with total assets increasing but asset flows favoring fixed-income funds.
Investors have also continued to favor passively managed index funds rather than actively managed portfolios. This trend continued in 2012, as passively managed vehicles had more than $260 billion in net inflows, compared with about $190 billion of net inflows for active products (both mutual funds and ETFs).
The number of mutual funds in the United States was essentially unchanged (excluding multiple share classes), with about 7,600 funds in both 2012 and 2011 based on ICI data. The number of global mutual funds rose to about 73,500 as of September 30, 2012, compared with about 72,000 as of September 30, 2011, based on ICI data.
ETFs continued to increase in popularity relative to traditional mutual funds. The U.S. ETF industry closed out 2012 with more than $1.3 trillion in assets under management based on ICI data, up from about $1 trillion at the end of 2011.
Based on data from ComScore, aggregate page views to financial and investment sites declined by about 9% in 2012, while the number of pages viewed per visit and time spent per visit were each down roughly 20%. The number of unique visitors, meanwhile, fell about 4%. We believe these trends reflect individual investors' continuing lower level of interest in financial- and investment-related content in the wake of the market downturn. For Morningstar.com, metrics such as pages viewed per visit, time spent per visit, and unique visitors also declined, although unique visitors rose slightly during the fourth quarter.
Amid these trends, we believe online advertising spending by financial services companies was weaker in 2012. Although Magna Global, a division of Interpublic Group, estimates that global online advertising revenue rose about 14% across all industries in 2012, financial services companies have been cautious about spending.
45
In the wake of the financial crisis of 2008 and 2009, regulators have continued to implement new rules for financial services companies globally. Many of these relate to financial advisor compensation, fees and expenses, investor disclosure, and the use of hedge funds and alternative investments. In the United Kingdom, for example, the Retail Distribution Review (RDR), which emphasizes increased regulation of advisory fees, higher professional standards for financial advisors, and an emphasis on "whole of market" investment solutions, became effective in December 2012. Advisors are now required to give clients a choice of all investment vehicles (including funds, ETFs, and other products) and demonstrate that they consider different investment options without bias. We believe this requirement may increase the business need for investment information on multiple investment types, which we offer through products such as Morningstar Direct and Morningstar Advisor Workstation.
In the European Union, Undertakings for Collective Investments in Transferable Securities (UCITS) is a set of EU directives designed to enable funds to operate across the EU based upon authorization from one state regulator. UCITS IV, which came into effect in July 2011, included requirements for a new Key Investor Information Document (KIID), an easy-to-read annual factsheet that replaces the Simplified Prospectus. Every UCITS fund that is promoted to retail investors is now required to produce a KIID and issue an updated copy each year. We've started using our data and production capabilities to help fund companies produce and distribute these documents.
In Australia, the government has introduced a series of Future of Financial Advice reforms, with implementation voluntary beginning in July 2012 and mandatory beginning in July 2013. Many of these related to fiduciary standards and compensation structures for financial advisors.
In the United States, President Obama signed the Dodd-Frank Wall Street Reform and Consumer Protection Act (Dodd-Frank) into law in July 2010. Dodd-Frank creates a number of new regulatory, supervisory, and advisory bodies and touches on the regulation of virtually every aspect of U.S. financial markets and activities. Dodd-Frank also left numerous matters to be addressed through rulemaking and other regulatory action, giving the regulators significant discretion in many areas. As a result, the final shape and effect of the legislation are continuing to emerge.
Dodd-Frank included a number of corporate governance and disclosure requirements that apply to publicly traded companies generally. It also included changes to the regulatory framework for credit rating agencies granting the SEC more oversight over Nationally Recognized Statistical Rating Organizations (NRSROs), including our Morningstar Credit Ratings subsidiary. While we believe Dodd-Frank and related regulations will not have a significant effect on Morningstar (other than Morningstar Credit Ratings), we continue to monitor the potential impact on our clients.
We are also monitoring a pending amendment to the Department of Labor's ERISA underwriting exemptions that would expand the number of approved rating agencies. In many cases, market issuers favor ratings from ERISA-approved agencies. Morningstar Credit Ratings doesn't currently qualify as an ERISA-eligible agency under existing Department of Labor requirements, but would qualify under the proposed amendment.
46
Consolidated Results
|
Key Metrics ($000)
|
2012
|
|
2011
|
|
2010
|
|
2012 Change
|
|
2011 Change
|
|
|||||||||
|
Revenue
|
$
|
658,288
|
|
$
|
631,400
|
|
555,351
|
|
4.3
|
%
|
13.7
|
%
|
|||||||
|
Operating income
|
$
|
150,668
|
|
$
|
138,415
|
|
121,059
|
|
8.9
|
%
|
14.3
|
%
|
|||||||
|
Operating margin
|
22.9
|
%
|
21.9
|
%
|
21.8
|
%
|
1.0
|
|
pp
|
0.1
|
|
pp
|
|||||||
|
Cash provided by (used for) investing activities
|
$
|
80,192
|
|
$
|
(110,767
|
)
|
(87,949
|
)
|
NMF
|
|
25.9
|
%
|
|||||||
|
Cash provided by (used for) financing activities
|
$
|
(265,176
|
)
|
$
|
(32,596
|
)
|
12,525
|
|
713.5
|
%
|
NMF
|
|
|||||||
|
Cash provided by operating activities
|
$
|
145,996
|
|
$
|
164,976
|
|
123,416
|
|
(11.5
|
)%
|
33.7
|
%
|
|||||||
|
Capital expenditures
|
(30,039
|
)
|
(23,322
|
)
|
(14,771
|
)
|
28.8
|
%
|
57.9
|
%
|
|||||||||
|
Free cash flow
|
$
|
115,957
|
|
$
|
141,654
|
|
$
|
108,645
|
|
(18.1
|
)%
|
30.4
|
%
|
||||||
____________________________________________________________________________________________
pp — percentage points
NMF — Not meaningful
As noted in How We Evaluate Our Business, we define free cash flow as cash provided by or used for operating activities less capital expenditures. Please refer to the discussion on page 45 for more detail.
Because we’ve made several acquisitions in recent years and had two divestitures in 2012, comparing our financial results from year to year is complex. To make it easier for investors to compare our results in different periods, we provide information on both organic revenue, which reflects our underlying business excluding acquisitions, divestitures, and the effect of foreign currency translations, and revenue from acquisitions and divestitures. We include an acquired operation as part of our revenue from acquisitions for 12 months after we complete the acquisition. After that, we include it in organic revenue. We include a divested operation as part of revenue from divestitures for 12 months after we complete the divestiture.
Consolidated organic revenue (revenue excluding acquisitions, divestitures, and the effect of foreign currency translations) is considered a non-GAAP financial measure. The definition of organic revenue we use may not be the same as similarly titled measures used by other companies. Organic revenue should not be considered an alternative to any measure of performance as promulgated under GAAP.
47
The table below shows the period in which we included each acquired operation in revenue from acquisitions.

Consolidated Revenue
In 2012, our consolidated revenue increased
4.3%
to
$658.3 million
. We had no incremental revenue during 2012 from acquisitions. Our 2011 results included revenue of $1.1 million from businesses that we sold in 2012 and that did not recur in 2012. Currency movements had a negative effect, lowering revenue growth by $4.6 million. The euro, and to a lesser extent, the British pound, were the primary contributors to the negative currency impact.
Excluding acquisitions, divestitures, and the effect of foreign currency translations, our consolidated revenue rose by
$32.6 million
, or
5.2%
, in
2012
. Leading the growth was Morningstar Direct, followed by Morningstar Data. Morningstar Advisor Workstation and Integrated Web Tools also contributed to the organic revenue increase, although to a lesser extent. These factors helped offset the loss of business from the largest client in our Investment Management segment. As previously announced, this client began managing several fund-of-funds portfolios in- house in April 2012. We recognized $3.8 million in associated revenue in 2012 compared with $12.4 million in 2011.
In 2011, our consolidated revenue increased
13.7%
to
$631.4 million
. We had
$15.3 million
in incremental revenue during 2011 from acquisitions completed in 2010, mainly reflecting incremental revenue from Morningstar Credit Ratings, LLC (formerly Realpoint, LLC) and, to a lesser extent, the annuity intelligence business of Advanced Sales and Marketing Corporation and Old Broad Street Research Ltd. (OBSR). Acquisitions contributed about
2.8
percentage points to our consolidated revenue growth. Currency movements also had a positive effect, contributing approximately
1.8
percentage points to revenue growth. The Australian dollar, and to a lesser extent, the British pound, the euro, and the Canadian dollar were the primary contributors to the currency benefit.
Excluding acquisitions and the effect of foreign currency translations, our consolidated revenue rose
$50.6 million
, or
9.1%
, in
2011
, with increases across all major product lines. Leading the growth were Morningstar Direct and Investment Advisory Services, followed by Morningstar Integrated Web Tools, Morningstar Data, and Morningstar Advisor Workstation. Internet advertising sales from Morningstar.com, Retirement Solutions, and Structured Credit Ratings also contributed to the organic revenue increase, although to a lesser extent.
48

The tables below reconcile consolidated revenue with organic revenue (revenue excluding acquisitions, divestitures, and the effect of foreign currency translations):
|
2012 vs. 2011 ($000)
|
2012
|
|
2011
|
|
Change
|
|
|||||
|
Consolidated revenue
|
$
|
658,288
|
|
$
|
631,400
|
|
4.3
|
%
|
|||
|
Less: acquisitions
|
—
|
|
—
|
|
NMF
|
|
|||||
|
Less: divestitures
|
—
|
|
(1,057
|
)
|
NMF
|
|
|||||
|
Unfavorable effect of foreign currency translations
|
4,620
|
|
—
|
|
NMF
|
|
|||||
|
Organic revenue
|
$
|
662,908
|
|
$
|
630,343
|
|
5.2
|
%
|
|||
|
2011 vs. 2010 ($000)
|
2011
|
|
2010
|
|
Change
|
|
|||||
|
Consolidated revenue
|
$
|
631,400
|
|
$
|
555,351
|
|
13.7
|
%
|
|||
|
Less: acquisitions
|
(15,326
|
)
|
—
|
|
NMF
|
|
|||||
|
Less: divestitures
|
—
|
|
—
|
|
NMF
|
|
|||||
|
Favorable effect of foreign currency translations
|
(10,116
|
)
|
—
|
|
NMF
|
|
|||||
|
Organic revenue
|
$
|
605,958
|
|
$
|
555,351
|
|
9.1
|
%
|
|||
|
2010 vs. 2009 ($000)
|
2010
|
|
2009
|
|
Change
|
|
|||||
|
Consolidated revenue
|
$
|
555,351
|
|
$
|
478,996
|
|
15.9
|
%
|
|||
|
Less: acquisitions
|
(47,850
|
)
|
—
|
|
NMF
|
|
|||||
|
Less: divestitures
|
—
|
|
—
|
|
NMF
|
|
|||||
|
Favorable effect of foreign currency translations
|
(4,362
|
)
|
—
|
|
NMF
|
|
|||||
|
Organic revenue
|
$
|
503,139
|
|
$
|
478,996
|
|
5.0
|
%
|
|||
49

International Revenue
Revenue from international operations was down slightly as a percentage of total revenue in
2012
compared with
2011
and up slightly compared with 2010. Our non-U.S. revenue was
29.1%
of consolidated revenue in
2012
, compared with
29.3%
in
2011
and
28.3%
in
2010
. More than half of our international revenue came from Europe, with most of the remainder from Australia and Canada. Divested businesses contributed $1.0 million to 2011 revenue that did not recur in 2012.
Foreign currency translations had a negative effect on international revenue in 2012, but a positive effect in 2011. Foreign currency translations decreased revenue by
$4.6 million
in
2012
, but increased revenue by
$10.1 million
in
2011
. Excluding acquisitions, divestitures, and the effect of foreign currency translations, non-U.S. revenue rose
6.5%
in
2012
and
7.7%
in
2011
, primarily reflecting stronger product sales in Europe and Canada, partially offset by lower revenue in Australia.
50
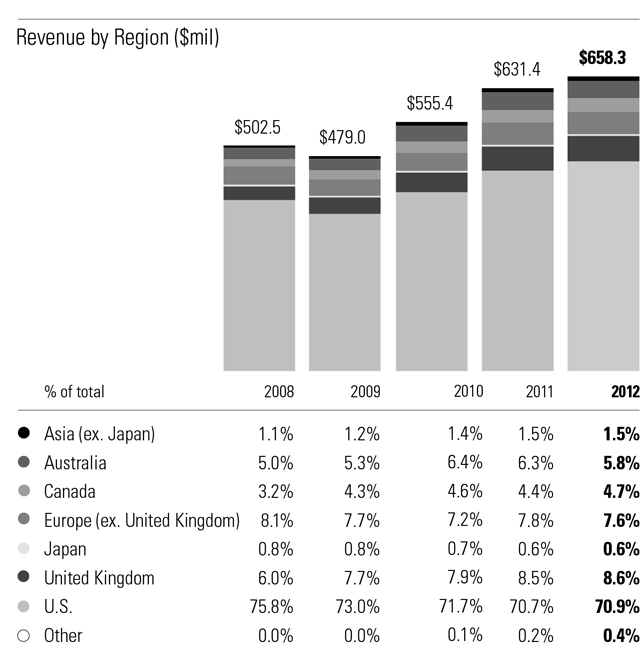
International organic revenue (international revenue excluding acquisitions, divestitures, and the effect of foreign currency translations) is considered a non-GAAP financial measure. The definition of international organic revenue we use may not be the same as similarly titled measures used by other companies. International organic revenue should not be considered an alternative to any measure of performance as promulgated under GAAP.
The tables below present a reconciliation from international revenue to international organic revenue (international revenue excluding acquisitions, divestitures, and the impact of foreign currency translations):
|
($000)
|
2012
|
|
2011
|
|
Change
|
|
|||||
|
International revenue
|
$
|
191,341
|
|
$
|
184,930
|
|
3.5
|
%
|
|||
|
Less: acquisitions
|
—
|
|
—
|
|
NMF
|
|
|||||
|
Less: divestitures
|
—
|
|
(982
|
)
|
NMF
|
|
|||||
|
Unfavorable effect of foreign currency translations
|
4,620
|
|
—
|
|
NMF
|
|
|||||
|
International organic revenue
|
$
|
195,961
|
|
$
|
183,948
|
|
6.5
|
%
|
|||
|
($000)
|
2011
|
|
2010
|
|
Change
|
|
|||||
|
International revenue
|
$
|
184,930
|
|
$
|
157,136
|
|
17.7
|
%
|
|||
|
Less: acquisitions
|
(5,561
|
)
|
—
|
|
NMF
|
|
|||||
|
Less: divestitures
|
—
|
|
—
|
|
NMF
|
|
|||||
|
Favorable effect of foreign currency translations
|
(10,116
|
)
|
—
|
|
NMF
|
|
|||||
|
International organic revenue
|
$
|
169,253
|
|
$
|
157,136
|
|
7.7
|
%
|
|||
51
|
($000)
|
2010
|
|
2009
|
|
Change
|
|
|||||
|
International revenue
|
$
|
157,136
|
|
$
|
129,160
|
|
21.7
|
%
|
|||
|
Less: acquisitions
|
(16,953
|
)
|
—
|
|
NMF
|
|
|||||
|
Less: divestitures
|
—
|
|
—
|
|
NMF
|
|
|||||
|
Favorable effect of foreign currency translations
|
(4,362
|
)
|
—
|
|
NMF
|
|
|||||
|
International organic revenue
|
$
|
135,821
|
|
$
|
129,160
|
|
5.2
|
%
|
|||
Largest Products Based on Revenue
Our five largest products based on revenue—Morningstar Data (previously Licensed Data), Morningstar Advisor Workstation, Morningstar Direct, Investment Advisory Services (previously Investment Consulting), and Morningstar.com—made up
63.9%
of consolidated revenue in
2012
. While the percentage of revenue made up by our top five products has remained relatively consistent over the past three years, the relative size of products within the top five has changed each year. Morningstar Data has been our largest product for the last three years.
Beginning in 2012, we reviewed the revenue classification for our Morningstar Data product. The Morningstar Data product now includes Morningstar Commodity Data. In addition, as part of our global product structure, we reviewed the revenue classification for our Investment Advisory Services (previously Investment Consulting) revenue to better align our non-U.S. operations with our U.S. product definitions. Subsequent to the first quarter, we made some additional, minor reclassifications for Morningstar Advisor Workstation and Morningstar.com. We reclassified the prior-year information for consistency with the current-year presentation. As presented in the tables below, these reclassifications changed the order of Advisor Workstation and Investment Advisory Services in our top five products in 2011, but did not have any effect on the order of our top five products in 2010.
|
Top Five Products (Segment) 2012
|
Revenue ($000)
|
% of Consolidated Revenue
|
|
||||
|
Morningstar Data (formerly Licensed Data) (Investment Information)
|
$
|
150,352
|
|
22.8
|
%
|
||
|
Morningstar Advisor Workstation (Investment Information)
|
84,264
|
|
12.8
|
%
|
|||
|
Morningstar Direct (Investment Information)
|
66,236
|
|
10.1
|
%
|
|||
|
Investment Advisory Services (formerly Investment Consulting) (Investment Management)
|
66,126
|
|
10.0
|
%
|
|||
|
Morningstar.com (Investment Information)
|
53,671
|
|
8.2
|
%
|
|||
|
Top Five Products (Segment) 2011
|
Revenue ($000)
|
% of Consolidated Revenue
|
|
||||
|
Morningstar Data (formerly Licensed Data) (Investment Information)
|
$
|
140,594
|
|
22.3
|
%
|
||
|
Morningstar Advisor Workstation (Investment Information)
|
77,882
|
|
12.3
|
%
|
|||
|
Investment Advisory Services (formerly Investment Consulting) (Investment Management)
|
71,253
|
|
11.3
|
%
|
|||
|
Morningstar.com (Investment Information)
|
56,352
|
|
8.9
|
%
|
|||
|
Morningstar Direct (Investment Information)
|
52,481
|
|
8.3
|
%
|
|||
|
Top Five Products (Segment) 2010
|
Revenue ($000)
|
% of Consolidated Revenue
|
|
||||
|
Morningstar Data (formerly Licensed Data) (Investment Information)
|
$
|
131,488
|
|
23.7
|
%
|
||
|
Morningstar Advisor Workstation (Investment Information)
|
69,782
|
|
12.6
|
%
|
|||
|
Investment Advisory Services (formerly Investment Consulting) (Investment Management)
|
58,742
|
|
10.6
|
%
|
|||
|
Morningstar.com (Investment Information)
|
51,756
|
|
9.3
|
%
|
|||
|
Morningstar Direct (Investment Information)
|
38,069
|
|
6.9
|
%
|
|||
52
Retention and Renewal Rates
As discussed in How We Evaluate Our Business, we calculate retention and renewal rates to help measure how successful we've been in maintaining existing business for products and services that have renewable revenue. The following graph illustrates these two metrics over the past five years:

For contract-based products and services (such as Morningstar Data, Investment Advisory Services, Morningstar Direct, and Morningstar Advisor Workstation), we estimate that our weighted average renewal rate was between 90% and 95%, within the same range as 2011. While the loss of business from our largest client had a negative effect on the renewal rate for Investment Advisory Services, renewals for other major products were slightly higher, on average, than in 2011. The figure for contract-based products includes the effect of price changes and changes to the contract value upon renewal, as well as changes in the value of variable-fee contracts.
In 2012, we estimate that our retention rate for subscription-based products, such as Principia, Morningstar.com's Premium Membership service, and print and online newsletters, was between 65% and 70%, within the same range as 2011.
Consolidated Operating Expense
|
($000)
|
2012
|
|
2011
|
|
2010
|
|
||||||
|
Operating expense
|
$
|
507,620
|
|
$
|
492,985
|
|
434,292
|
|
||||
|
% change
|
3.0
|
%
|
13.5
|
%
|
22.6
|
%
|
||||||
|
% of revenue
|
77.1
|
%
|
78.1
|
%
|
78.2
|
%
|
||||||
|
Change
|
(1.0
|
)
|
pp
|
(0.1
|
)
|
pp
|
4.2
|
|
pp
|
|||
2012 vs. 2011
In
2012
, our consolidated operating expense increased
$14.6 million
or
3.0%
.
53
Higher salary expense of $14.0 million was the primary driver of the increase. The majority of the increase in salary expense reflects the full-year effect of regular pay raises and market adjustments made in July 2011, as well as regular pay raises made in July 2012. The rest of the increase represents the full-year salary impact of 2011 new hires and incremental expense for new hires in 2012. We review employee salaries annually and implemented salary adjustments in the third quarter of 2012 and 2011. We had approximately
3,495
employees worldwide as of
December 31, 2012
, compared with
3,465
as of
December 31, 2011
and
3,225
as of
December 31, 2010
.
Higher professional fees, production expense, company-sponsored benefits, including matching contributions to our 401(k) plan in the United States, and stock-based compensation expense also contributed to the increase in operating expense, although to a lesser extent than the salary expense discussed above. Our stock-based compensation expense in 2012 includes $3.2 million for accelerated vesting of restricted stock issued to a former executive in the structured credit research unit when we acquired the business. Additional data purchases contributed to the $3.8 million growth in production expense.
Partially offsetting these increases was lower bonus expense of approximately $6.4 million in 2012. Lower discretionary spending, including advertising and marketing and travel expense also offset the increases. In addition, we capitalized $8.5 million of operating expense in 2012, primarily for software development. In comparison, we capitalized $5.3 million of operating expense in 2011.
General and administrative expense (G&A) in 2012 included about $1.6 million for a litigation settlement and an impairment charge for one of our smaller products.
However, our results included a benefit of approximately $1.0 million for the resolution of a prior-year business tax expense matter. Conversely, our results in 2011 included $1.4 million of expense related to this business tax. Our G&A results for 2011 also included $3.2 million of expense for the separation agreement with our former chief operating officer. This expense did not recur in 2012.
Intangible amortization expense decreased
$3.3 million
, primarily because certain intangible assets from some of our earlier acquisitions are now fully amortized. In addition, our 2011 results included $1.6 million of expense for the accelerated amortization of certain trade names and the impairment of one trade name. Offsetting the decrease in amortization expense was higher depreciation expense of $3.5 million.
Operating expense as a percentage of revenue decreased
1.0
percentage point in 2012, as the
4.3%
increase in revenue slightly outpaced the
3.0%
increase in operating expense.
2011 vs. 2010
In
2011
, our consolidated operating expense increased
$58.7 million
or
13.5%
. We completed seven acquisitions in 2010. Because of the timing of these acquisitions, our results include operating expense that did not exist in 2010. Incremental operating expense from acquired businesses represented approximately $13.4 million, or 23%, of the increase.
Higher salary expense represented approximately 55%, or $32.0 million, of the total operating expense increase in 2011, reflecting additional hiring in 2011 and the full-year salary effect of 2010 new hires, and, to a lesser extent, additional headcount from acquisitions completed in 2010. Salary adjustments that were effective in July 2011 also contributed to the increase. We review employee salaries annually and have generally implemented salary adjustments in the third quarter. We had approximately
3,465
employees worldwide as of
December 31, 2011
, compared with
3,225
as of
December 31, 2010
and 2,605 as of December 31, 2009. About half of the headcount growth in 2011 reflects continued hiring for our development centers in China and India, with most of the remainder in the United States. The latter includes about 30 employees hired in July 2011 in Chicago as part of the Morningstar Development Program, a two-year rotational training program for entry-level employees.
Incentive compensation and employee benefit costs represented approximately 24%, or $14.1 million, of the overall operating expense increase. Higher bonus expense and sales commissions both contributed to the growth in incentive compensation. Bonus expense rose $5.7 million, which was slightly offset by a $0.4 million gap between bonuses paid in the first quarter and the amount accrued in 2010. Although total bonuses paid were $0.4 million lower than the amount accrued, there were some greater differences by cost category, which we describe below. Sales commission expense was up $2.8 million, primarily in the United States and Europe. In 2011, we reinstated some of the benefits we temporarily suspended in previous years. This included increasing the matching contributions to our 401(k) plan in the United States, representing $2.3 million of additional expense.
54
Higher production expense, travel, and rent expense also contributed to operating expense growth, although to a lesser extent than the compensation-related items discussed above. Higher data purchases for our operations in the U.S. and Europe contributed to the $4.2 million growth in production expense. The $1.5 million increase in rent expense primarily reflects higher rent for our new office space in Shenzhen, China, and, to a lesser extent, for our office space in Chicago. Our 2010 results included an expense of $1.0 million to increase liabilities for vacant office space. This expense did not recur in 2011, partially offsetting the higher rent expense in 2011.
Intangible amortization expense increased
$2.4 million
. The increase primarily reflects amortization expense from 2010 acquisitions, and to a lesser extent, the accelerated amortization of certain trade names and the impairment of one trade name. The increase was partially offset by the runoff of amortization expense for certain intangible assets from some of our earlier acquisitions that are now fully amortized.
Our 2011 results include $3.2 million of expense for the separation agreement with our former chief operating officer. Operating expense in 2010 included $2.0 million related to the separation agreement between Morningstar and the former head of Morningstar Associates. This expense did not recur in 2011.
We capitalized $5.3 million of operating expense in 2011, primarily for software development within the Structured Credit Ratings business, Morningstar Commodity Data, and for Morningstar Direct. In 2010, we capitalized $0.8 million of operating expense for software development.
Operating expense as a percentage of revenue decreased
0.1
percentage points in 2011, as the
13.7%
increase in revenue slightly outpaced the
13.5%
increase in operating expense.
Cost of Goods Sold
|
($000)
|
2012
|
|
2011
|
|
2010
|
|
|||||||
|
Cost of goods sold
|
$
|
195,347
|
|
$
|
182,132
|
|
$
|
157,068
|
|
||||
|
% change
|
7.3
|
%
|
16.0
|
%
|
22.1
|
%
|
|||||||
|
% of revenue
|
29.7
|
%
|
28.8
|
%
|
28.3
|
%
|
|||||||
|
Change
|
0.9
|
|
pp
|
0.5
|
|
pp
|
1.4
|
|
pp
|
||||
|
Gross profit
|
$
|
462,941
|
|
$
|
449,268
|
|
$
|
398,283
|
|
||||
|
% change
|
3.0
|
%
|
12.8
|
%
|
13.7
|
%
|
|||||||
|
Gross margin
|
70.3
|
%
|
71.2
|
%
|
71.7
|
%
|
|||||||
|
Change
|
(0.9
|
)
|
pp
|
(0.5
|
)
|
pp
|
(1.4
|
)
|
pp
|
||||
Cost of goods sold is our largest category of operating expense, representing more than one-third of our total operating expense. Our business relies heavily on human capital, and cost of goods sold includes the compensation expense for employees who produce our products and services. Approximately one-half of our employees are included in this cost category.
Cost of goods sold rose
$13.2 million
in
2012
and
$25.1 million
in
2011
. Higher salaries contributed approximately 55% and 50% of the total increase in 2012 and 2011, respectively, primarily from additional headcount. Higher production expense of $3.8 million and $4.2 million also contributed to the increase in both years, primarily from additional data purchases for our operations in the U.S. and Europe. Other compensation-related expense, primarily employee benefit costs, also contributed to the increase in 2012.
In 2011, higher bonus expense of $3.8 million for the 2011 annual bonus was offset by a $1.6 million reduction in bonus expense related to the prior-year bonus because we paid a smaller portion of the
2011
bonus to employees in this category. Please refer to the section,
Bonus Expense,
for additional information.
Approximately 20% of the increase in
2011
was related to acquisitions.
Our gross margin declined by about
0.9
percentage points and
0.5
percentage points in
2012
and
2011
, respectively, as expenses in this category increased at a faster rate compared with revenue growth.
55
Development Expense
|
($000)
|
2012
|
|
2011
|
|
2010
|
|
|||||||
|
Development expense
|
$
|
51,436
|
|
$
|
53,157
|
|
$
|
49,244
|
|
||||
|
% change
|
(3.2
|
)%
|
7.9
|
%
|
28.3
|
%
|
|||||||
|
% of revenue
|
7.8
|
%
|
8.4
|
%
|
8.9
|
%
|
|||||||
|
Change
|
(0.6
|
)
|
pp
|
(0.5
|
)
|
pp
|
0.9
|
|
pp
|
||||
Development expense decreased
$1.7 million
in
2012
. We capitalized $8.5 million of operating expense in
2012
compared with $5.3 million in
2011
for software development, reducing the expense that we would otherwise report in this category. Lower bonus expense of $1.8 million also contributed to the decline. Higher salaries and other compensation-related expense for our development teams partially offset the favorable effect of the capitalized operating expense in 2012.
Development expense increased
$3.9 million
in
2011
mainly because of higher salaries, benefits, and bonus expense for our development teams. We capitalized $5.3 million of operating expense in 2011 and $0.8 million in 2010 for software development, reducing the expense that we would otherwise report in this category. Development expense from acquisitions also contributed to the increase in 2011, but to a lesser extent.
We had approximately 820 employees included in development expense as of
December 31, 2012
compared with 830 as of
December 31, 2011
and 760 as of
December 31, 2010
.
As a percentage of revenue, development expense was down slightly in
2012
and 2011, primarily reflecting the effect of capitalizing operating expense for software development.
Sales and Marketing Expense
|
($000)
|
2012
|
|
2011
|
|
2010
|
|
|||||||
|
Sales and marketing expense
|
$
|
108,884
|
|
$
|
106,699
|
|
$
|
95,473
|
|
||||
|
% change
|
2.0
|
%
|
11.8
|
%
|
33.0
|
%
|
|||||||
|
% of revenue
|
16.5
|
%
|
16.9
|
%
|
17.2
|
%
|
|||||||
|
Change
|
(0.4
|
)
|
pp
|
(0.3
|
)
|
pp
|
2.2
|
|
pp
|
||||
Sales and marketing expense increased
$2.2 million
in
2012
. Higher salary expense of $4.1 million and higher bonus expense of $1.5 million were partially offset by lower advertising and marketing expense and lower commissions. Full-year bonus expense was flat in 2012; however, in the first quarter of 2012, we paid a greater portion of the 2011 bonus to employees in this category compared with our initial estimate, contributing $1.0 million to the bonus expense recorded in 2012. Please refer to the section,
Bonus Expense,
for additional information.
Sales and marketing expense increased
$11.2 million
in
2011
.
Approximately 17% of the growth in sales and marketing expense in the year was related to acquisitions. Higher salary-related expense represents about 53% of the overall expense increase in
2011
. Higher sales commission expense, other compensation-related expenses, and travel expense also contributed to the increase in the year. Lower bonus expense partially offset the increase.
As a percentage of revenue, sales and marketing expense was down in
2012
primarily reflecting lower advertising and marketing expense and commissions as a percentage of revenue. As a percentage of revenue, sales and marketing expense was down in 2011, primarily reflecting lower bonus expense as a percentage of revenue.
56
General and Administrative Expense
|
($000)
|
2012
|
|
2011
|
|
2010
|
|
|||||||
|
General and administrative expense
|
$
|
108,857
|
|
$
|
108,084
|
|
$
|
92,843
|
|
||||
|
% change
|
0.7
|
%
|
16.4
|
%
|
11.1
|
%
|
|||||||
|
% of revenue
|
16.5
|
%
|
17.1
|
%
|
16.7
|
%
|
|||||||
|
Change
|
(0.6
|
)
|
pp
|
0.4
|
|
pp
|
(0.8
|
)
|
pp
|
||||
General and Administrative (G&A) expense rose
$0.8 million
in
2012
. Higher professional fees and higher stock-based compensation expense contributed to the total increase in G&A. Our stock-based compensation expense in 2012 includes $3.2 million for accelerated vesting of restricted stock issued to a former executive in the structured credit research unit when we acquired the business. Lower bonus expense of $5.7 million in 2012 partially offset the increase. Current-year bonus expense was down $2.8 million. In addition, in the first quarter of 2011, we paid a greater portion of the 2010 bonus to employees in this category compared with our initial estimate, contributing $2.6 million to the bonus expense recorded in 2011. Please refer to the section,
Bonus Expense,
for additional information.
G&A expense in 2012 included about $1.6 million of expense for a litigation settlement and an impairment charge for one of our smaller products. However, as mentioned above, our 2012 results included a benefit of approximately $1.0 million from the resolution of a prior-year business tax expense matter. Conversely, our results for 2011 included $1.4 million of expense related to this business tax. G&A in 2011 also included $3.2 million for the separation agreement with our former chief operating officer. This expense did not recur in 2012.
G&A rose
$15.2 million
in
2011
. Higher compensation-related expense including salaries, bonus expense, and other compensation-related costs contributed about 70% of the total increase in G&A expense. Bonus expense included in G&A expense increased $3.6 million in 2011. In the first quarter of 2011, we paid a greater portion of the 2010 bonus to employees in this category compared with our initial estimate, contributing $2.6 million of the full-year increase. Please refer to the section,
Bonus Expense,
for additional information. Higher rent expense, mainly for our office space in China and additional office space in Chicago, also contributed to the growth in G&A expense, although to a lesser extent.
G&A expense in 2011 included a $0.8 million reduction in sales tax accruals and a $2.0 million business tax rebate for our operations in China. Partially offsetting these two items was $1.4 million of business tax expense related to prior years. G&A expense in 2011 also includes $3.2 million of expense for the separation agreement with our former chief operating officer. Our 2010 results include $1.0 million to increase liabilities for vacant office space and $2.0 million related to a previously announced separation agreement between Morningstar and the former head of Morningstar Associates. These two expenses did not recur in 2011.
G&A expense as a percentage of revenue was down
0.6
percentage points in
2012
after increasing 0.4 percentage points in
2011
.
Depreciation and Amortization Expense
|
($000)
|
2012
|
|
2011
|
|
2010
|
|
|||||||
|
Depreciation expense
|
$
|
19,152
|
|
$
|
15,646
|
|
$
|
14,814
|
|
||||
|
Amortization expense
|
23,944
|
|
27,267
|
|
24,850
|
|
|||||||
|
Total depreciation and amortization expense
|
$
|
43,096
|
|
$
|
42,913
|
|
$
|
39,664
|
|
||||
|
% change
|
0.4
|
%
|
8.2
|
%
|
24.1
|
%
|
|||||||
|
% of revenue
|
6.5
|
%
|
6.8
|
%
|
7.1
|
%
|
|||||||
|
Change
|
(0.3
|
)
|
pp
|
(0.3
|
)
|
pp
|
0.4
|
|
pp
|
||||
Depreciation expense rose
$3.5 million
in
2012
, primarily related to increased capital expenditures for our operations in the United States. Depreciation expense increased
$0.8 million
in
2011
, primarily related to our new office space in China.
57
Amortization expense decreased
$3.3 million
in
2012
, primarily because certain intangible assets from some of our earlier acquisitions are now fully amortized. In addition, our 2011 results included $1.6 million of expense for the accelerated amortization of certain trade names and the impairment of one trade name. Amortization expense increased
$2.4 million
in
2011
, reflecting amortization of intangible assets related to acquisitions, and to a lesser extent, the accelerated amortization of certain trade names and the impairment of one trade name. The increase was partially offset by the runoff of amortization expense for certain intangible assets from some of our earlier acquisitions that are now fully amortized.
We expect that amortization of intangible assets will be an ongoing cost for the remaining life of the assets. We estimate that aggregate amortization expense for intangible assets will be
$21.2 million
in
2013
. Our estimates of future amortization expense for intangible assets may be affected by additional acquisitions, divestitures, changes in the estimated average useful lives, and currency translations.
As a percentage of revenue, depreciation and amortization expense was down slightly in
2012
and
2011
.
Stock-Based Compensation Expense
Stock-based compensation expense relates to grants of restricted stock units (RSUs), restricted stock, and stock options.
|
($000)
|
2012
|
|
2011
|
|
2010
|
|
|||||||
|
Restricted stock units
|
$
|
13,451
|
|
$
|
12,765
|
|
$
|
12,545
|
|
||||
|
Restricted stock
|
5,013
|
|
2,196
|
|
1,248
|
|
|||||||
|
Stock options
|
441
|
|
342
|
|
—
|
|
|||||||
|
Total stock-based compensation expense
|
$
|
18,905
|
|
$
|
15,303
|
|
$
|
13,793
|
|
||||
Restricted Stock Units:
Our stock-based compensation expense related to RSUs has increased over the past three years. We began granting RSUs in May 2006 and have made additional grants each year since then. We recognize the expense related to RSUs over the vesting period, which is four years for employees and three years for non-employee directors. We estimate forfeitures for these awards and typically adjust the estimated forfeitures to actual forfeiture experience in the third quarter. The expense recorded in 2011 was favorably affected by $0.5 million for restricted stock units that were forfeited in the first quarter.
Restricted Stock:
Beginning in 2010, we began recording expense related to restricted stock issued with the acquisition of Realpoint. In May 2010, we issued 199,174 shares that will vest over five years from the date of grant. The restricted stock vests ratably over a five-year period from the acquisition date and may be subject to forfeiture if the holder terminates his or her employment during the vesting period. The expense in 2012 and 2011 includes $3.2 million and $0.4 million, respectively, for accelerated vesting of a portion of this restricted stock.
Stock Options:
We did not grant any stock options in 2012. In 2011, we granted 92,201 stock options to our executive officers and non-employee directors. These stock options vest ratably over a four-year period for executive officers and a three-year period for non-employee directors and expire 10 years after the date of grant. Using a Black-Scholes option pricing model, we estimated the fair value of these grants. We amortize this value to stock-based compensation expense ratably over the options' vesting period.
We estimate forfeitures of these awards and adjust the estimated forfeitures to actual forfeiture experience in the third quarter.
We describe our stock-based compensation in more detail in Note
12
of the Notes to our Consolidated Financial Statements.
58
Stock-based compensation is included in each of our operating expense categories, as shown below:
|
($000)
|
2012
|
|
2011
|
|
2010
|
|
|||||||
|
Cost of goods sold
|
$
|
4,488
|
|
$
|
4,150
|
|
$
|
3,473
|
|
||||
|
Development
|
1,928
|
|
2,086
|
|
1,840
|
|
|||||||
|
Sales and marketing
|
1,937
|
|
1,871
|
|
1,786
|
|
|||||||
|
General and administrative
|
10,552
|
|
7,196
|
|
6,694
|
|
|||||||
|
Stock-based compensation expense
|
$
|
18,905
|
|
$
|
15,303
|
|
$
|
13,793
|
|
||||
|
% change
|
23.5
|
%
|
10.9
|
%
|
19.0
|
%
|
|||||||
|
% of revenue
|
2.9
|
%
|
2.4
|
%
|
2.5
|
%
|
|||||||
|
Change
|
0.5
|
|
pp
|
(0.1
|
)
|
pp
|
0.1
|
|
pp
|
||||
Based on grants of RSUs, stock options, and restricted stock made through
December 31, 2012
, we anticipate that stock-based compensation expense will be $13.5 million in 2013. This amount is subject to change based on additional equity grants or changes in our estimated forfeiture rate related to these grants.
Bonus Expense
The amount of bonus expense is not a fixed cost. Instead, the size of the bonus pool varies each year based on a number of items, including changes in full-year operating income relative to the previous year and other factors. We review and update our estimates and the bonus pool size quarterly, primarily based on our expectations for full-year operating income relative to budget. We record bonus expense throughout the year and pay annual bonuses to employees in the first quarter of the following year.
|
($000)
|
2012
|
|
2011
|
|
2010
|
|
|||||||
|
Bonus expense
|
$
|
36,241
|
|
$
|
42,621
|
|
$
|
37,322
|
|
||||
|
% change
|
(15.0
|
)%
|
14.2
|
%
|
77.6
|
%
|
|||||||
|
% of revenue
|
5.5
|
%
|
6.8
|
%
|
6.7
|
%
|
|||||||
|
Change
|
(1.3
|
)
|
pp
|
0.1
|
|
pp
|
2.3
|
|
pp
|
||||
Bonus expense, which we include in each of our operating expense categories, decreased
$6.4 million
in
2012
and increased $
5.3 million
in
2011
.
Overall, bonus expense represented about
5.5%
,
6.8%
, and
6.7%
of revenue in
2012
,
2011
, and
2010
, respectively.
59
Bonus expense consisted of both the current-year bonus expense and the true-up related to the prior-year bonus accrual. We adjust the prior-year bonus estimate to the actual bonus payout during the first quarter, which is when the payout occurs. This true-up had a favorable effect of $0.1 million on total bonus expense in 2012 and $0.4 million in 2011. While total bonuses paid out in 2012 and 2011 were only slightly lower compared with the amounts expensed in 2011 and 2010, respectively, there were some differences by cost category. The table below presents the effect of these two factors by cost category and in total for 2012 and 2011:
|
($000)
|
2012
|
|
2011
|
|
2010
|
|
2012 Change
|
|
2011 Change
|
|
||||||||||||
|
Cost of goods sold:
|
||||||||||||||||||||||
|
Current-year expense
|
$
|
16,873
|
|
$
|
18,957
|
|
$
|
15,176
|
|
$
|
(2,084
|
)
|
$
|
3,781
|
|
|||||||
|
Prior-year true-up
|
116
|
|
(1,577
|
)
|
—
|
|
1,693
|
|
(1,577
|
)
|
||||||||||||
|
Total cost of goods sold
|
16,989
|
|
17,380
|
|
15,176
|
|
(391
|
)
|
2,204
|
|
||||||||||||
|
Development:
|
||||||||||||||||||||||
|
Current-year expense
|
6,629
|
|
8,472
|
|
6,615
|
|
(1,843
|
)
|
1,857
|
|
||||||||||||
|
Prior-year true-up
|
(950
|
)
|
(959
|
)
|
—
|
|
9
|
|
(959
|
)
|
||||||||||||
|
Total development
|
5,679
|
|
—
|
|
7,513
|
|
6,615
|
|
(1,834
|
)
|
898
|
|
||||||||||
|
Sales and marketing:
|
||||||||||||||||||||||
|
Current-year expense
|
3,698
|
|
3,695
|
|
4,567
|
|
3
|
|
(872
|
)
|
||||||||||||
|
Prior-year true-up
|
973
|
|
(521
|
)
|
—
|
|
1,494
|
|
(521
|
)
|
||||||||||||
|
Total sales and marketing
|
4,671
|
|
—
|
|
3,174
|
|
4,567
|
|
1,497
|
|
(1,393
|
)
|
||||||||||
|
General and administrative:
|
||||||||||||||||||||||
|
Current-year expense
|
9,177
|
|
11,945
|
|
10,964
|
|
(2,768
|
)
|
981
|
|
||||||||||||
|
Prior-year true-up
|
(275
|
)
|
2,609
|
|
—
|
|
(2,884
|
)
|
2,609
|
|
||||||||||||
|
Total general and administrative
|
8,902
|
|
—
|
|
14,554
|
|
10,964
|
|
(5,652
|
)
|
3,590
|
|
||||||||||
|
Total current-year expense
|
36,377
|
|
43,069
|
|
37,322
|
|
(6,692
|
)
|
5,747
|
|
||||||||||||
|
Total prior-year true-up
|
(136
|
)
|
(448
|
)
|
—
|
|
312
|
|
(448
|
)
|
||||||||||||
|
Total bonus expense
|
$
|
36,241
|
|
$
|
42,621
|
|
$
|
37,322
|
|
$
|
(6,380
|
)
|
|
$
|
5,299
|
|
||||||
Consolidated Operating Income
|
($000)
|
2012
|
|
2011
|
|
2010
|
|
|||||||
|
Operating income
|
$
|
150,668
|
|
$
|
138,415
|
|
$
|
121,059
|
|
||||
|
% change
|
8.9
|
%
|
14.3
|
%
|
(2.9
|
)%
|
|||||||
|
Operating margin
|
22.9
|
%
|
21.9
|
%
|
21.8
|
%
|
|||||||
|
Change
|
1.0
|
|
pp
|
0.1
|
|
pp
|
(4.2
|
)
|
pp
|
||||
Consolidated operating income increased
$12.3 million
in
2012
, and our margin was up
1.0
percentage point in
2012
. Our revenue growth of
$26.9 million
outpaced the increase in our costs of
$14.6 million
.
Lower bonus expense contributed 1.3 percentage points to our margin growth in 2012. In addition, capitalized operating expense for software development contributed 0.5 percentage points to our margin growth in
2012
. Higher salaries and other compensation-related expense as a percentage of revenue partially offset these increases.
Consolidated operating income increased
$17.4 million
, and our margin was up slightly in
2011
. We had revenue growth of
$76.0 million
, which outpaced expense growth of
$58.7 million
.
60
Capitalized operating expense for software development contributed 0.7 percentage points to our margin growth in
2011
. Higher salaries and other compensation-related expense as a percentage of revenue partially offset the benefit of the capitalized operating expense. In addition, acquisitions had a slight negative effect on the margin.
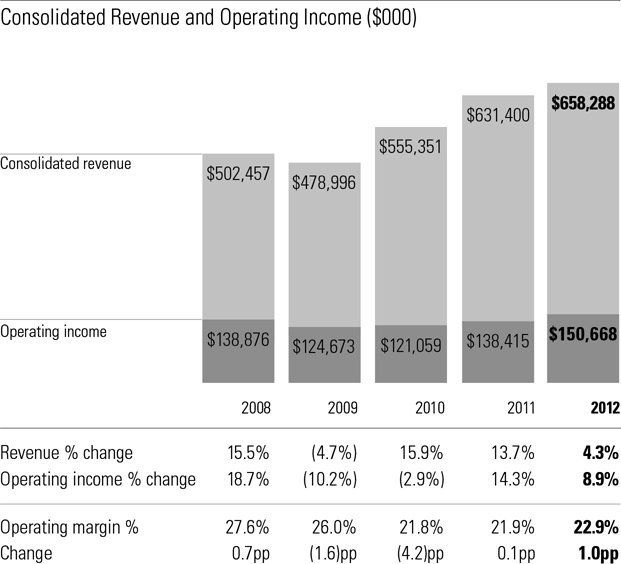
Consolidated Free Cash Flow
As described in more detail above, we define free cash flow as cash provided by or used for operating activities less capital expenditures. We present free cash flow solely as supplemental disclosure to help investors better understand how much cash is available after we spend money to operate our business. Our management team uses free cash flow to evaluate our business. Free cash flow is not a measure of performance set forth under GAAP. Also, the free cash flow definition we use may not be comparable to similarly titled measures used by other companies.
We generated positive free cash flow in
2012
,
2011
, and
2010
as our cash provided by operating activities has consistently exceeded capital expenditures, as shown below:
|
($000)
|
2012
|
|
2011
|
|
2010
|
|
2012 Change
|
|
2011 Change
|
|
||||||||
|
Cash provided by operating activities
|
$
|
145,996
|
|
$
|
164,976
|
|
$
|
123,416
|
|
(11.5
|
)%
|
33.7
|
%
|
|||||
|
Capital expenditures
|
(30,039
|
)
|
(23,322
|
)
|
(14,771
|
)
|
28.8
|
%
|
57.9
|
%
|
||||||||
|
Free cash flow
|
$
|
115,957
|
|
$
|
141,654
|
|
$
|
108,645
|
|
(18.1
|
)%
|
30.4
|
%
|
|||||
Free cash flow decreased
$25.7 million
in
2012
and increased
$33.0 million
in
2011
.
61
Cash provided by operating activities:
Cash provided by operating activities decreased
$19.0 million
in
2012
, reflecting the
negative cash flow effect of changes in operating assets and liabilities, a
$9.3 million
increase in cash paid for taxes, and a $5.3 million increase in bonuses paid in the first quarter of
2012
, partially offset by higher net income (adjusted for non-cash items). We made cash payments of
$47.4 million
for income taxes in 2012, compared with
$38.1 million
in 2011. We made bonus payments of
$42.8 million
in the first quarter of
2012
, compared with
$37.5 million
in the first quarter of
2011
.
Cash provided by operating activities increased
$41.6 million
in
2011
, reflecting the positive cash flow effect of changes in operating assets and liabilities and higher net income (adjusted for non-cash items), partially offset by a
$16.1 million
increase in bonuses paid in the first quarter of
2011
. We made bonus payments of
$37.5 million
in the first quarter of
2011
, compared with
$21.4 million
in the first quarter of
2010
.
62
To provide investors with additional insight into our financial results, we provide a comparison between the change in consolidated net income and the change in operating cash flow:
|
($000)
|
2012
|
|
2011
|
|
2010
|
|
2012 Change
|
|
2011 Change
|
|
||||||||||
|
Consolidated net income
|
$
|
107,962
|
|
$
|
98,314
|
|
$
|
86,457
|
|
$
|
9,648
|
|
$
|
11,857
|
|
|||||
|
Adjustments to reconcile consolidated net income to net cash flows from operating activities:
|
||||||||||||||||||||
|
Excess tax benefits from stock-option exercises and vesting of restricted stock units
|
(7,210
|
)
|
(9,525
|
)
|
(7,507
|
)
|
2,315
|
|
(2,018
|
)
|
||||||||||
|
Depreciation and amortization expense
|
43,096
|
|
42,913
|
|
39,664
|
|
183
|
|
3,249
|
|
||||||||||
|
Stock-based compensation expense
|
18,905
|
|
15,303
|
|
13,793
|
|
3,602
|
|
1,510
|
|
||||||||||
|
Gain on sale of discontinued operations, net of tax
|
(5,188
|
)
|
—
|
|
—
|
|
(5,188
|
)
|
—
|
|
||||||||||
|
Loss on sale of cost-method investment
|
2,034
|
|
—
|
|
—
|
|
2,034
|
|
—
|
|
||||||||||
|
Holding gain upon acquisition of additional ownership of equity-method investments
|
—
|
|
—
|
|
(4,564
|
)
|
—
|
|
4,564
|
|
||||||||||
|
All other non-cash items included in net income
|
5,447
|
|
(4,455
|
)
|
(888
|
)
|
9,902
|
|
(3,567
|
)
|
||||||||||
|
Changes in operating assets and liabilities, net of effects of acquisitions:
|
||||||||||||||||||||
|
Cash paid for bonuses
|
(42,820
|
)
|
(37,464
|
)
|
(21,360
|
)
|
(5,356
|
)
|
(16,104
|
)
|
||||||||||
|
Cash paid for income taxes
|
(47,355
|
)
|
(38,054
|
)
|
(37,624
|
)
|
(9,301
|
)
|
(430
|
)
|
||||||||||
|
Cash paid related to adjusting the tax treatment of certain stock options originally considered incentive stock options
|
—
|
|
—
|
|
(4,887
|
)
|
—
|
|
4,887
|
|
||||||||||
|
Cash paid for separation agreements
|
(137
|
)
|
(4,113
|
)
|
—
|
|
3,976
|
|
(4,113
|
)
|
||||||||||
|
Accounts receivable
|
(17,124
|
)
|
(3,858
|
)
|
(23,652
|
)
|
(13,266
|
)
|
19,794
|
|
||||||||||
|
Deferred revenue
|
7,769
|
|
9,578
|
|
5,752
|
|
(1,809
|
)
|
3,826
|
|
||||||||||
|
Income taxes—current
|
46,150
|
|
48,805
|
|
42,193
|
|
(2,655
|
)
|
6,612
|
|
||||||||||
|
Accrued compensation
|
34,096
|
|
51,753
|
|
38,413
|
|
(17,657
|
)
|
13,340
|
|
||||||||||
|
Other assets
|
223
|
|
2,728
|
|
(2,341
|
)
|
(2,505
|
)
|
5,069
|
|
||||||||||
|
Accounts payable and accrued liabilities
|
1,173
|
|
(4,821
|
)
|
(759
|
)
|
5,994
|
|
(4,062
|
)
|
||||||||||
|
All other
|
(1,025
|
)
|
(2,128
|
)
|
726
|
|
1,103
|
|
(2,854
|
)
|
||||||||||
|
Cash provided by operating activities
|
$
|
145,996
|
|
$
|
164,976
|
|
$
|
123,416
|
|
$
|
(18,980
|
)
|
$
|
41,560
|
|
|||||
In
2012
, the decrease in cash from operations more than offset the positive change in net income adjusted for non-cash items, primarily because of the negative cash flow effect of accounts receivable and accrued compensation. An increase in cash paid for income taxes and cash paid for bonuses also contributed to the decrease.
63
In
2011
, the increase in cash from operations exceeded the change in net income adjusted for non-cash items, primarily because of the positive cash flow effect of accounts receivable, accrued compensation, and income taxes—current. In addition, the cash flow from operations in 2010 includes a $4.9 million payment related to adjusting the tax treatment of certain stock options originally considered incentive stock options (ISOs). This payment did not recur in 2011. These items, which favorably affected the year-over-year comparison, were partially offset by the increase in bonus payments in 2011. Cash provided by operating activities in
2011
also reflects
$4.1 million
of payments for separation agreements with two former executives.
FASB ASC 718,
Compensation—Stock Compensation
, requires that we classify excess tax benefits as a financing activity, which contributes to the difference between net income and cash from operations. In
2012
and
2011
, we classified
$7.2 million
and
$9.5 million
, respectively, of excess tax benefits as financing activities. We describe these excess tax benefits in the Liquidity and Capital Resources section.
Capital expenditures:
We spent
$30.0 million
for capital expenditures in
2012
, primarily for computer hardware and software, internally developed capitalized software, and spending for an expansion of office space in Chicago.
We spent
$23.3 million
for capital expenditures in
2011
, primarily for computer hardware and software, internally developed capitalized software, and leasehold improvements.
In
2012
, capital expenditures increased
$6.7 million
, primarily for capitalized software and computer hardware and software for our U.S. operations and internally developed capitalized software.
Segment Results
|
Key Metrics ($000)
|
2012
|
|
2011
|
|
2010
|
|
2012 Change
|
|
2011 Change
|
|
||||||||||
|
Revenue
|
|
|
|
|
||||||||||||||||
|
Investment Information
|
$
|
529,984
|
|
$
|
500,909
|
|
$
|
444,957
|
|
5.8
|
%
|
12.6
|
%
|
|||||||
|
Investment Management
|
128,304
|
|
130,491
|
|
110,394
|
|
(1.7
|
)%
|
18.2
|
%
|
||||||||||
|
Consolidated revenue
|
$
|
658,288
|
|
$
|
631,400
|
|
$
|
555,351
|
|
4.3
|
%
|
13.7
|
%
|
|||||||
|
Operating income (loss)
|
|
|
|
|
||||||||||||||||
|
Investment Information
|
$
|
150,700
|
|
$
|
131,514
|
|
$
|
127,740
|
|
14.6
|
%
|
3.0
|
%
|
|||||||
|
Investment Management
|
61,127
|
|
69,649
|
|
56,816
|
|
(12.2
|
)%
|
22.6
|
%
|
||||||||||
|
Intangible amortization and corporate depreciation expense
|
(33,674
|
)
|
(34,659
|
)
|
(32,094
|
)
|
(2.8
|
)%
|
8.0
|
%
|
||||||||||
|
Corporate unallocated
|
(27,485
|
)
|
(28,089
|
)
|
(31,403
|
)
|
(2.2
|
)%
|
(10.6
|
)%
|
||||||||||
|
Consolidated operating income
|
$
|
150,668
|
|
$
|
138,415
|
|
$
|
121,059
|
|
8.9
|
%
|
14.3
|
%
|
|||||||
|
Operating margin
|
|
|
|
|
||||||||||||||||
|
Investment Information
|
28.4
|
%
|
26.3
|
%
|
28.7
|
%
|
2.1
|
|
pp
|
(2.4
|
)
|
pp
|
||||||||
|
Investment Management
|
47.6
|
%
|
53.4
|
%
|
51.5
|
%
|
(5.8
|
)
|
pp
|
1.9
|
|
pp
|
||||||||
|
Consolidated operating margin
|
22.9
|
%
|
21.9
|
%
|
21.8
|
%
|
1.0
|
|
pp
|
0.1
|
|
pp
|
||||||||
Investment Information Segment
The Investment Information segment includes all of our data, software, and research products and services. These products are typically sold through subscriptions or license agreements.
64
The largest products in this segment based on revenue are Morningstar Data (formerly Licensed Data), Morningstar Advisor Workstation (including Morningstar Office), Morningstar Direct, Morningstar.com, Morningstar Integrated Web Tools, and Morningstar Principia. Morningstar Data is a set of investment data spanning all of our investment databases, including real-time pricing and commodity data, and is available through electronic data feeds. Advisor Workstation is a web-based investment planning system for advisors. Advisor Workstation is available in two editions: Morningstar Office for independent financial advisors and an enterprise edition for financial advisors affiliated with larger firms. Morningstar Direct is a web-based institutional research platform. Morningstar.com includes both Premium Memberships and Internet advertising sales. Morningstar Integrated Web Tools is a set of services that help institutional clients build customized websites or enhance their existing sites with our online tools and components. Principia is our CD-ROM-based investment research and planning software for advisors.
The Investment Information segment also includes Morningstar Equity Research, which we distribute through several channels. We sell Morningstar Equity Research to companies that purchase our research for their own use or provide our research to their affiliated advisors or individual investor clients. The segment also includes Morningstar Credit Research and Morningstar Structured Credit Ratings. The latter is provided by Morningstar Credit Ratings, LLC, a Nationally Recognized Statistical Rating Organization specializing in structured finance. It offers securities ratings, research, surveillance services, and data to help institutional investors identify risk in commercial mortgage-backed securities (CMBS).
We also offer a variety of financial communications and newsletters, other institutional and advisor software, and investment indexes.
This segment represented approximately 80% of our consolidated revenue in
2012
,
2011
, and
2010
.

Revenue
In
2012
, Investment Information segment revenue increased
$29.1 million
, or
5.8%
, to
$530.0 million
. Our software, data, and investment research product lines all contributed to the revenue growth. Morningstar Direct, Morningstar Data, and Morningstar Advisor Workstation were the main contributors to revenue growth in 2012, partially offset by lower revenue for Morningstar.com. In addition, our 2011 results included revenue of about $1.1 million from businesses that we sold in 2012 that did not recur in 2012.
65
Investment Information segment revenue increased
$56.0 million
, or
12.6%
, to
$500.9 million
in
2011
. Acquisitions contributed
$13.5 million
of revenue in
2011
, primarily from Morningstar Credit Ratings, LLC and to a lesser extent from the annuity intelligence business of Advanced Sales and Marketing Corporation (ASMC), Morningstar Denmark, and OBSR. Revenue from acquisitions represented approximately 3 percentage points of the revenue increase in 2011. Excluding acquisitions, our software, data, and investment research product lines all contributed to the revenue growth. Organic revenue for our software product lines was up $26.2 million, driven by Morningstar Direct, and to a lesser extent by Morningstar Integrated Web Tools, Advisor Workstation, and Morningstar.com. Morningstar Data and Morningstar Credit Ratings drove revenue growth in our data and investment research product lines, respectively.
Morningstar Direct was the largest contributor to the increase in segment revenue in both
2012
and
2011
. Morningstar Direct contributed approximately 43% and 39% of the organic revenue growth for the segment in
2012
and 2011, respectively. The number of licenses for Morningstar Direct increased to
7,435
worldwide, compared with
6,144
as of
December 31, 2011
and
4,773
as of
December 31, 2010
, with strong growth in both the United States and internationally. The growth reflects additional licenses for both new and existing clients, and, to a lesser extent, client migrations from both Institutional Workstation and Morningstar EnCorr to Morningstar Direct.
Morningstar Data was the second-largest contributor to segment revenue growth in both
2012
and
2011
, reflecting strong renewal rates and new client contracts for managed products data. Morningstar Data gives institutions access to a full range of proprietary investment data spanning numerous investment databases, including real-time pricing data and commodity data. The data packages we offer include proprietary statistics, such as the Morningstar Style Box and Morningstar Rating, and a wide range of other data, including information on investment performance, risk, portfolios, operations data, fees and expenses, cash flows, and ownership.
Higher revenue from Morningstar Integrated Web Tools and Advisor Workstation (mainly Morningstar Office) also contributed to revenue growth in 2012 and 2011, but to a lesser extent. The number of U.S. licenses for Morningstar Advisor Workstation increased to
162,904
as of
December 31, 2012
compared with
160,287
as of
December 31, 2011
, and
157,395
as of
December 31, 2010
. The increase in the number of U.S. licenses compared with December 31, 2010 was partially due to incremental licenses added through our acquisition of ASMC. Lower revenue for Principia partially offset the higher revenue from these two products. Principia subscriptions totaled
26,807
as of
December 31, 2012
, down from
31,270
as of
December 31, 2011
and
32,681
as of
December 31, 2010
.
Revenue for Morningstar.com, which includes Internet advertising sales and Premium Membership subscriptions, decreased in 2012, but contributed to the growth in the segment's revenue in
2011
. Revenue was down in 2012 because of declining paid Premium subscriptions, primarily in the United States, and a difficult advertising sales market. The increase in 2011 Morningstar.com revenue was driven entirely by higher Internet advertising sales. Internet advertising revenue decreased 4.2% in
2012
compared with an increase of 18.8% in
2011
. Premium subscriptions for the U.S. version of Morningstar.com declined to
123,899
as of
December 31, 2012
, compared with
130,354
as of December 31, 2011 and
138,149
as of
December 31, 2010
. However, consistent with the trend over the past few years, we moderately increased subscription prices for U.S. Premium Membership in both January
2012
and
2011
, which partly offset the revenue decline associated with the lower subscription levels. Newsletter revenue declined in both 2012 and 2011, primarily because of lower advertising sales for our trade magazines in Australia.
Revenue for our investment research products was up in
2012
and 2011, mainly reflecting higher revenue for equity and fund research. Structured Credit Ratings also contributed to the increase in 2011, but was up only slightly in 2012. Revenue growth was slow in 2012 because of competitive pricing pressure. Within the structured credit ratings business in 2011, we had strong revenue growth earlier in the year driven by new issue rating assignments in the CMBS market. In 2011, we rated 13 new issue CMBS deals, more than double the number in 2010.
Operating Income
In
2012
, operating income for the Investment Information segment increased
$19.2 million
, or
14.6%
, as revenue rose more than operating expense.
66
Operating expense was up
$9.9 million
in
2012
. Higher salary-related expense, which increased $11.3 million compared with 2011, was the primary contributor to the increase. Company-sponsored benefits, including matching contributions to our 401(k) plan in the United States, stock-based compensation expense, and production expense also contributed to the increase in operating expense, although to a lesser extent than salary expense. Our stock-based compensation expense in 2012 includes $3.2 million for accelerated vesting of a portion of a restricted stock grant. Additional data purchases for our operations in the United States and Europe contributed to the growth in production expense.
Lower incentive compensation, including bonus expense and commissions, and discretionary costs, including advertising, marketing, and travel, partially offset the higher expense. Bonus expense decreased $4.6 million in 2012.
The Investment Information segment's operating margin increased
2.1
percentage points in
2012
, primarily reflecting lower bonus expense as a percentage of revenue, and, to a lesser extent, lower commission expense and discretionary spending as a percentage of revenue. Lower bonus expense contributed 1.2 percentage points to the margin improvement in
2012
.
In
2011
, operating income for the Investment Information segment increased
$3.8 million
, or
3.0%
, as revenue grew more than operating expense.
Operating expense was up
$52.2 million
in
2011
. Additional costs from acquisitions contributed approximately 18% of this increase. Higher salary-related expense and incentive compensation, including sales commission and bonus expense, contributed about 71% of the overall expense increase. Higher salary-related expense reflects additional hiring in 2011 and the full-year salary impact of 2010 new hires, and, to a lesser extent, additional headcount from acquisitions completed in 2010. Salary adjustments that were effective in July 2011 also contributed to the growth in salary expense. Costs for employee benefits, including health care and matching contributions to our 401(k) plan in the United States, contributed about 9% of the increase in 2011.
The Investment Information segment's operating margin decreased 2.4 percentage points in
2011
, primarily because of higher salary expense as a percentage of revenue, and, to a lesser extent, employee benefit and bonus costs as a percentage of revenue. Higher salary expense contributed 2.0 percentage points to the decline in
2011
. Acquisitions had only a minor effect on the segment margin.
Investment Management Segment
The Investment Management segment includes all of our asset management operations, which earn more than half of their revenue from asset-based fees.
The key products and services in this segment based on revenue are Investment Advisory Services (formerly Investment Consulting), which focuses on investment monitoring and asset allocation for multimanager portfolios, including mutual funds and variable annuities; Retirement Solutions, including the Morningstar Retirement Manager and Advice by Ibbotson platforms; and Morningstar Managed Portfolios, a fee-based discretionary asset management service that includes a series of mutual fund, ETF, and stock portfolios tailored to meet a range of investment time horizons, risk levels, and investment strategies that financial advisors can use for their clients’ taxable and tax-deferred accounts.
Our Investment Advisory Services business has multiple fee structures, which vary by client. In general, we seek to receive asset-based fees for any work we perform that involves managing investments or acting as a subadvisor to investment portfolios. For any individual contract, we may receive flat fees, variable asset-based fees, or a combination of the two. Some of our contracts include minimum fee levels that provide us with a flat payment up to a specified asset level, above which we also receive variable asset-based fees. In the majority of our contracts that include variable asset-based fees, we bill clients quarterly in arrears based on average assets for the quarter. The method of calculation varies by client; some contracts include provisions for calculating average assets based on daily data, while others use weekly or monthly data. Other contracts may include provisions for monthly billing or billing based on assets as of the last day of the billing period rather than on average assets.
67
In our Retirement Solutions business, our contracts may include one-time setup fees, technology licensing fees, asset-based fees for managed retirement accounts, fixed and variable fees for advice and guidance, or a combination of these fee structures. Our Retirement Solutions business also includes plan sponsor and custom target-date consulting arrangements. Fees for these services may be based on the level of assets under advisement in these arrangements.
We do not disclose a fee range for our Investment Advisory Services and Retirement Solutions businesses because our fee structures are customized by client. In addition, we believe disclosing a fee range would be detrimental to our competitive position. We disclose changes in the nature of the underlying services we provide or their associated fee structures (for example, a change from flat fees to asset-based fees) in our SEC filings to the extent that they are material to our financial results.
For Morningstar Managed Portfolios, we charge asset-based fees, which are based on a tiered schedule that depends on the client’s account balance. Fees for our mutual fund and ETF portfolios generally range from 30 to 40 basis points. We charge fees of 55 basis points for our customized stock portfolios.
In addition, we offer Managed Portfolios through our subsidiary Ibbotson Associates Australia, which provides asset management services primarily to institutional clients and individual investors.
This segment represented approximately 20% of our consolidated revenue in
2012
,
2011
, and
2010
, respectively.

Revenue
Investment Management segment revenue decreased
$2.2 million
, or
1.7%
, in
2012
. Our largest client in the Investment Management segment began managing several fund-of-funds portfolios in-house in April 2012. We recognized $3.8 million in associated revenue in 2012 compared with $12.4 million in 2011. Excluding the loss of this business, Investment Advisory Services revenue was up $3.4 million in 2012. Revenue for Morningstar Managed Portfolios, and to a lesser extent, Retirement Solutions, also rose in 2012, partially offsetting the loss of business discussed above.
68
Investment Management segment revenue increased
$20.1 million
, or
18.2%
, in
2011
. Revenue from acquisitions was
$1.9 million
, primarily from the OBSR and Seeds acquisitions. Excluding acquisitions, revenue was up across all three of our key product and service lines in
2011
. Investment Advisory Services was the primary driver of the revenue increase and was driven by higher revenue in the United States and, to a lesser extent, in Europe. Retirement Solutions and Managed Portfolios also contributed to the revenue increase, but to a lesser extent. Managed Portfolios for Ibbotson Associates Australia was down, partially offsetting the revenue growth.
The variable annuity industry, which accounted for approximately 15% of Investment Management segment revenue in 2012, continues to face challenges. Accordingly, we expect there will be further pressure on revenue from clients in the variable annuity industry.
We had
$81.4 million
in revenue from asset-based fees in
2012
, a slight decrease of
$0.3 million
compared with
$81.7 million
in
2011
. In
2010
, revenue from asset-based fees was
$67.7 million
. Revenue from asset-based fees made up approximately
12.4%
of consolidated revenue in
2012
, down slightly from
12.9%
in
2011
. Within the Investment Management segment, revenue from asset-based fees made up slightly more than 60% of segment revenue over the past three years.
Total assets under advisement and management were
$149.5 billion
as of
December 31, 2012
, a decrease from
$180.9 billion
as of
December 31, 2011
and up slightly from
$149.2 billion
as of
December 31, 2010
. As mentioned above, our largest Investment Management client began managing several fund-of-fund portfolios in-house in April 2012. These portfolios represented $11.8 billion of our assets as of December 31, 2011. In addition, a change in the scope of services we provide to an existing client during the fourth quarter of 2012 lowered our assets by about $42.9 billion. About $22 billion of the total assets as of
December 31, 2011
compared with December 31, 2010 reflects additional assets for existing clients' fund-of-funds programs for which we now receive asset-based fees. The increase in assets represents incremental growth for an existing revenue stream.
The asset totals as of the end of each year don't fully reflect the change in average asset levels during the year. The asset-based fees we earn are primarily based on average asset levels during each quarter. Average assets under advisement and management (calculated based on available quarterly or monthly data) were approximately $180.6 million in
2012
, up 9.3% from $165.3 billion in
2011
, and up 52.1% from $118.7 billion in
2010
.
Assets under Advisement and Management for Investment Advisory Services
|
|
As of December 31
|
|||||||||||
|
($ billions)
|
2012
|
|
2011
|
|
2010
|
|
||||||
|
Assets under advisement — United States
|
$
|
89.0
|
|
$
|
135.6
|
|
$
|
107.2
|
|
|||
|
Assets under advisement and management —International
|
5.3
|
|
1.9
|
|
0.8
|
|
||||||
|
Total
|
$
|
94.3
|
|
$
|
137.5
|
|
$
|
108.0
|
|
|||
We provided Investment Advisory Services on
$94.3 billion
in assets as of
December 31, 2012
compared with
$137.5 billion
in assets as of
December 31, 2011
and
$108.0 billion
in assets as of
December 31, 2010
.
The asset totals include relationships for which we receive basis-point fees, including consulting arrangements and other agreements where we act as a portfolio construction manager for a mutual fund or variable annuity. We also provide Investment Advisory services for some assets for which we receive a flat fee; we do not include these assets in the total reported above.
Excluding changes related to new contracts and cancellations, changes in the value of assets under advisement can come from two primary sources: gains or losses related to overall trends in market performance, and net inflows or outflows caused when investors add to or redeem shares from these portfolios.
Assets under advisement and management decreased
$43.2 billion
, or
31.4%
, compared with
December 31, 2011
. As mentioned above, our largest Investment Management client began managing several fund-of-funds portfolios in-house in April 2012. These portfolios represented $11.8 billion, or 8.6% of our Investment Advisory Services assets under advisement and management as of December 31, 2011. In addition, a change in the scope of services we provide to an existing client lowered our assets by about $42.9 billion. Excluding these effects, assets under advisement and management rose 8.3%, primarily reflecting asset inflows and market performance.
69
Total assets under advisement and management for Investment Advisory Services as of
December 31, 2011
increased
27.3%
compared with
December 31, 2010
. Approximately 75% of the increase reflects additional assets for existing clients' fund-of-funds programs for which we now receive asset-based fees. The remainder of the increase reflects net client inflows and market performance.
We cannot separately quantify cash inflows and outflows for these portfolios because we do not have custody of the assets in the majority of our investment management businesses. The information we receive from many of our clients does not separately identify the effect of cash inflows and outflows on asset balances for each period. We also cannot precisely quantify the effect of market appreciation or depreciation because the majority of our clients have discretionary authority to implement their own portfolio allocations.
Assets under Advisement and Management for Retirement Solutions
|
|
As of December 31
|
|||||||||||
|
($ billions)
|
2012
|
|
2011
|
|
2010
|
|
||||||
|
Assets under management
|
$
|
25.1
|
|
$
|
19.9
|
|
$
|
19.6
|
|
|||
|
Assets under advisement
|
22.1
|
|
17.5
|
|
15.5
|
|
||||||
|
Total
|
$
|
47.2
|
|
$
|
37.4
|
|
$
|
35.1
|
|
|||
Assets under management for managed retirement accounts increased to
$25.1 billion
as of
December 31, 2012
compared with $
19.9 billion
as of
December 31, 2011
and $
19.6 billion
as of
December 31, 2010
. Assets under advisement for plan sponsor and custom target-date arrangements increased to
$22.1 billion
as of
December 31, 2012
, compared with $
17.5 billion
as of
December 31, 2011
and $
15.5 billion
as of
December 31, 2010
.
We cannot separately quantify the factors affecting assets under management and advisement for our managed retirement accounts. These factors primarily consist of employer and employee contributions, plan administrative fees, market movements, and participant loans and hardship withdrawals. We cannot quantify the impact of these other factors because the information we receive from the plan providers does not separately identify these transactions or the changes in balances caused by market movement.
The table below shows the number of retirement plan participants who had access to the services offered through our Retirement Solutions programs, as well as the number of plan sponsors and plan providers that provide this access.
|
|
As of December 31
|
||||||||
|
2012
|
|
2011
|
|
2010
|
|
||||
|
Plan participants (millions)
|
24.6
|
|
24.7
|
|
23.5
|
|
|||
|
Plan sponsors (approximate)
|
202,000
|
|
192,000
|
|
150,000
|
|
|||
|
Plan providers
|
25
|
|
25
|
|
23
|
|
|||
Morningstar Managed Portfolios
Revenue for Morningstar Managed Portfolios increased $2.9 million in 2012. The growth mainly reflects higher average asset levels during
2012
compared with
2011
. Assets under management for Morningstar Managed Portfolios were
$4.7 billion
as of
December 31, 2012
, compared with
$3.1 billion
as of
December 31, 2011
, reflecting positive market performance and strong net inflows. Revenue for Morningstar Managed Portfolios increased $2.4 million in 2011, reflecting higher average asset levels during 2011 compared with 2010. Assets under management for Morningstar Managed Portfolios were
$3.1 billion
as of
December 31, 2011
compared with
$2.7 billion
as of
December 31, 2010
, reflecting strong net inflows.
70
Ibbotson Associates Australia Managed Portfolios
Revenue for Ibbotson Associates Australia Managed Portfolios declined about $0.7 million in
2012
and $1.1 million in 2011. The lower revenue mainly reflects slightly lower average assets levels during
2012
compared with
2011
and 2011 compared with 2010. Assets under management for Ibbotson Australia totaled
$3.3 billion
as of
December 31, 2012
, up from
$2.9 billion
as of
December 31, 2011
, and down slightly compared with
$3.4 billion
as of
December 31, 2010
.
Operating Income
Operating income for the Investment Management segment decreased
$8.5 million
, or
12.2%
, in
2012
. In
2011
, operating income increased
$12.8 million
, or
22.6%
. In 2012, revenue increased less than operating expense.
Operating expense in the segment rose
$6.3 million
, or
10.4%
, in
2012
. Operating expense rose primarily because of higher professional fees and compensation-related expense, including higher salaries and commissions, in the United States as well as higher expense for operations outside of the United States. Lower bonus expense of $2.6 million partially offset these factors.
In
2011
, operating expense in this segment rose
$7.3 million
, or
13.6%
. Additional costs from acquisitions contributed approximately 25% of the total operating expense increase. Excluding acquisitions, higher operating expenses for operations outside of the United States contributed the majority of the operating expense growth. Higher salaries and professional fees also contributed to the increase, but to a lesser extent. Bonus expense was essentially unchanged from the previous. Operating expense in 2010 included $2.0 million related to a separation agreement between Morningstar and the former head of Morningstar Associates. This expense did not recur in 2011.
Operating margin decreased
5.8
percentage points to
47.6%
in
2012
, as operating expense growth exceeded the growth in revenue. Higher professional fees, costs for operations outside the United States, and salary expense, all as a percentage of revenue, contributed to the margin decline. Lower bonus expense as a percentage of revenue partially offset these increases.
The segment's operating margin increased
1.9
percentage points to
53.4%
in
2011
, as revenue growth exceeded the change in operating expenses. Lower salary expense and bonus expense as a percentage of revenue contributed to the increase, partially offset by higher expenses outside of the United Stated and higher professional fees as a percentage of revenue. In addition, acquisitions had a slight negative effect on the margin in
2011
. The 2010 margin was negatively affected by the $2.0 million separation agreement, which reduced the 2010 margin by approximately 2.0 percentage points.
Corporate Items
This category includes general corporate costs, which we do not allocate to our business segments. The corporate items category also includes amortization expense related to intangible assets recorded for acquisitions and capitalization of internal product development costs. The table below shows the components of corporate items that affected our consolidated operating income:
|
($000)
|
2012
|
|
2011
|
|
2010
|
|
||||||
|
Amortization expense
|
$
|
23,944
|
|
$
|
27,267
|
|
$
|
24,850
|
|
|||
|
Depreciation expense
|
9,730
|
|
7,392
|
|
7,244
|
|
||||||
|
Corporate unallocated expense
|
27,485
|
|
28,089
|
|
31,403
|
|
||||||
|
Corporate items
|
$
|
61,159
|
|
$
|
62,748
|
|
$
|
63,497
|
|
|||
|
% change
|
(2.5
|
)%
|
(1.2
|
)%
|
(4.7
|
)%
|
||||||
71
Amortization of intangible assets decreased
$3.3 million
in
2012
primarily because certain intangible assets from some of our earlier acquisitions are now fully amortized. In addition, our 2011 results included $1.6 million of expense for the accelerated amortization of certain trade names and the impairment of one trade name. Amortization expense increased
$2.4 million
in
2011
, reflecting amortization of intangible assets related to acquisitions, and to a lesser extent, the accelerated amortization of certain trade names and the impairment of one trade name. The increase was partially offset by the runoff of amortization expense for certain intangible assets from some of our earlier acquisitions that are now fully amortized.
As of
December 31, 2012
and
December 31, 2011
, respectively, we had
$116.7
million and
$139.8 million
of net intangible assets. We amortize these assets over their estimated lives, ranging from one to 20 years. We estimate that aggregate amortization expense for intangible assets will be approximately
$21.2 million
in 2013.
Depreciation expense for corporate items increased
$2.3 million
in 2012 primarily related to increased capital expenditures for our operations in the United States. Depreciation expense did not change significantly in
2011
.
Corporate unallocated expense decreased
$0.6 million
in
2012
. In
2012
, we capitalized $8.5 million of expense for software development, compared with $5.3 million in
2011
, favorably affecting the year-over-year comparison. In addition, our corporate unallocated expense for 2011 included $3.2 million of expense for the separation agreement with our former chief operating officer. This expense did not recur in 2012. Higher professional fees, salaries, and production expense partially offset these favorable items.
Corporate unallocated expense decreased
$3.3 million
in
2011
. In
2011
, we capitalized $5.3 million of expense for software development, compared with $0.8 million in
2010
, favorably affecting the year-over-year comparison. Lower professional fees also contributed to the decrease, although to a lesser extent. In addition, a $1.0 million expense related to vacant office space recorded in 2010 did not recur in 2011, favorably affecting the comparison with the previous year. Higher salaries partially offset these favorable items. In addition, our corporate unallocated expense for
2011
includes $3.2 million of expense for the separation agreement with our former chief operating officer.
Equity in Net Income of Unconsolidated Entities, Non-Operating Income (Expense), and Income Tax Expense
Equity in Net Income of Unconsolidated Entities
|
($000)
|
2012
|
|
2011
|
|
2010
|
|
||||||
|
Equity in net income of unconsolidated entities
|
$
|
2,027
|
|
$
|
1,848
|
|
$
|
1,422
|
|
|||
Equity in net income of unconsolidated entities includes our portion of the net income (loss) of Morningstar Japan K.K. (MJKK), Morningstar Sweden AB, and beginning in the fourth quarters of 2011 and 2012, YCharts, Inc. (YCharts) and Inquiry Financial Europe AB, respectively. In the first six months of 2010, this category also included our portion of the net income (loss) of Morningstar Denmark. Equity in net income of unconsolidated entities is primarily from our position in MJKK.
In September 2012, we acquired a 34% minority equity stake in Inquiry Financial Europe AB for $3.6 million, paid in cash. In November 2011, we acquired a 22% minority equity stake in YCharts for $2.5 million, paid in cash.
72
In July 2010, we acquired an additional 75% ownership interest in Morningstar Danmark A/S (Morningstar Denmark), increasing our ownership percentage to 100%. As a result, we no longer account for our investment in Morningstar Denmark using the equity method. Beginning in the third quarter of 2010, we consolidate the assets, liabilities, and results of operations of Morningstar Denmark in our Consolidated Financial Statements.
We describe our investments in unconsolidated entities in more detail in Note
9
of the Notes to our Consolidated Financial Statements.
Non-Operating Income (Expense)
The following table presents the components of net non-operating income (expense):
|
($000)
|
2012
|
|
2011
|
|
2010
|
|
||||||
|
Interest income
|
$
|
5,464
|
|
$
|
3,679
|
|
$
|
2,718
|
|
|||
|
Interest expense
|
(311
|
)
|
(1,318
|
)
|
(281
|
)
|
||||||
|
Other income (expense), net
|
(2,196
|
)
|
(652
|
)
|
4,295
|
|
||||||
|
Non-operating income, net
|
$
|
2,957
|
|
$
|
1,709
|
|
$
|
6,732
|
|
|||
Interest income mainly reflects interest from our investment portfolio. Interest income in 2012 also includes approximately $0.7 million of interest income related to the $1.0 million of business tax refund for prior years recorded in 2012, as discussed above in the section,
Consolidated Results
. The increase in interest income in
2011
reflects higher balances of cash equivalents and investments.
In 2011, interest expense included $0.9 million related to the $1.4 million of business tax expense for prior years recorded in 2011, as discussed above in the section
Consolidated Results
.
In 2012, other income (expense), net included a loss of $2.0 million on the sale of our investment in Bundle. We previously accounted for this investment using the cost method. In 2010, other income (expense), net included a holding gain of approximately $4.6 million. This gain represented the difference between the estimated fair value and the book value of our investment in Morningstar Denmark at the date of acquisition.
Other income (expense), net also includes foreign currency exchange gains and losses arising from the ordinary course of business related to our U.S. and non-U.S. operations, realized gains and losses from our investment portfolio, gains and losses on sale of fixed assets, and royalty income from MJKK. The net other expense in
2011
primarily represented unrealized exchange losses on foreign currency denominated balances.
Income Tax Expense
The following table summarizes the components of our effective tax rate:
|
($000)
|
2012
|
|
2011
|
|
2010
|
|
||||||
|
Income before income taxes and equity in net income of unconsolidated entities
|
$
|
153,625
|
|
$
|
140,124
|
|
$
|
127,791
|
|
|||
|
Equity in net income of unconsolidated entities
|
2,027
|
|
1,848
|
|
1,422
|
|
||||||
|
Net (income) loss attributable to the noncontrolling interest
|
117
|
|
43
|
|
(87
|
)
|
||||||
|
Total
|
$
|
155,769
|
|
$
|
142,015
|
|
$
|
129,126
|
|
|||
|
Income tax expense
|
$
|
52,878
|
|
$
|
43,658
|
|
$
|
42,756
|
|
|||
|
Effective tax rate
|
33.9
|
%
|
30.7
|
%
|
33.1
|
%
|
||||||
For a reconciliation of the U.S. federal tax rate to our effective income tax rate, refer to Note
15
of the Notes to our Consolidated Financial Statements.
Our effective tax rate in
2012
was
33.9%
, an increase of
3.2
percentage points compared with
30.7%
in
2011
. The higher tax rate in
2012
reflects lower tax credits and incentives in the current year, as well as certain deferred income tax benefits recorded in 2011.
73
In
2011
, our effective tax rate was
30.7%
, a decrease of 2.4 percentage points compared with
33.1%
in
2010
. The lower tax rate in 2011 reflects:
|
•
|
the positive effect of increased tax credits and incentives related to Morningstar's research and development activities;
|
|
•
|
our domestic production activities (Section 199) deduction, some of which relate to prior years;
|
|
•
|
effects of tax audit settlements; and
|
|
•
|
the recognition of certain deferred income tax benefits.
|
Additionally, in 2010, the use of foreign net operating losses that had previously been subject to a valuation allowance reduced our effective tax rate. This benefit did not recur in 2011.
In
2012
, we recorded a net increase of $0.5 million of gross unrecognized tax benefits, which increased our income tax expense.
As of December 31, 2012
, we had
$12.7 million
of gross unrecognized tax benefits, of which
$12.7 million
, if recognized, would reduce our effective income tax rate and decrease our income tax expense by
$10.4 million
. As of
December 31, 2011
, we had
$12.2 million
of gross unrecognized tax benefits, of which $11.9 million, if recognized, would reduce our effective income tax rate and decrease our income tax expense by $9.8 million.
As of December 31, 2012
, our Consolidated Balance Sheet included a current liability of approximately
$6.6 million
and a non-current liability of
$5.7 million
for unrecognized tax benefits. As of
December 31, 2011
, our Consolidated Balance Sheet included a current liability of
$5.3 million
and a non-current liability of
$6.2 million
for unrecognized tax benefits. These amounts include interest and penalties, less any associated tax benefits.
We have not provided federal and state income taxes on accumulated undistributed earnings of certain foreign subsidiaries, because these earnings have been permanently reinvested. Approximately 42% of our cash, cash equivalents, and investments as of
December 31, 2012
is held by our operations outside of the United States. As such, we believe that our cash balances and investments in the United States, along with cash generated from our U.S. operations, will be sufficient to meet our U.S. operating and cash needs for the foreseeable future, without requiring us to repatriate earnings from these foreign subsidiaries. It is not practicable to determine the amount of the unrecognized deferred tax liability related to the undistributed earnings.
We are currently under audit by federal and various state and local tax authorities in the United States, as well as tax authorities in certain non-U.S. jurisdictions. It is likely that the examination phase of some of these audits will conclude in 2013. It is not possible to estimate the effect of current audits on previously recorded unrecognized tax benefits.
Liquidity and Capital Resources
We believe our available cash balances and investments, along with cash generated from operations, will be sufficient to meet our operating and cash needs for at least the next 12 months. We invest our cash reserves in cash equivalents and investments, consisting primarily of fixed-income securities. We maintain a conservative investment policy for our investments and invest a portion of these assets in municipal securities with high-quality stand-alone credit ratings. We also invest a portion of our investments balance (approximately 25% as of December 31,
2012
) in proprietary Morningstar portfolios. These portfolios may consist of stocks, bonds, options, mutual funds, or ETFs. Investments in our portfolio have a maximum maturity of two years; the weighted average maturity is approximately one year. Approximately 58% of our cash, cash equivalents, and investments as of
December 31, 2012
was held by our operations in the United States, down from about 80% as of December 31, 2011. We used cash generated from our operations in the United States to fund our share repurchase program and dividends to shareholders.
We intend to use our cash, cash equivalents, and investments for general corporate purposes, including working capital and funding future growth. To date, we have not needed to access any significant commercial credit and have not attempted to borrow or establish any lines of credit.
74
In
2012
, we paid dividends of
$25.5 million
. On
December 7, 2012
, our board of directors approved a payment of a dividend of 12.5 cents per share payable on
December 28, 2012
to shareholders of record as of
December 17, 2012
. This was our fifth dividend payment in 2012 because we opted to pay the dividend in December instead of in January 2013. We expect to make a recurring dividend payment of 12.5 cents per share in 2013. In
February
2013
, our board of directors declared a dividend of
12.5 cents
per share. The dividend is payable on
April 30, 2013
to shareholders of record as of
April 12, 2013
.
In December 2012, the board approved an increase to our $300 million share repurchase program. The board approval authorized us to repurchase up to an additional
$200 million
in shares of our outstanding common stock, bringing the total amount authorized under the program to $500 million. We may repurchase shares from time to time at prevailing market prices on the open market or in private transactions in amounts that we deem appropriate. In 2012, we repurchased a total of 4,258,258 shares for approximately $256.5 million, of which $4.7 million was settled and paid early in the first quarter of 2013. As of
December 31, 2012
, we had repurchased a total of
5,056,595
shares for
$300.9 million
under this program.

Cash, Cash Equivalents, and Investments
As of
December 31, 2012
, we had cash, cash equivalents, and investments of
$321.4
million, a decrease of
$148.8
million compared with
$470.2 million
as of
December 31, 2011
. The decrease reflects
$251.8 million
used to repurchase common stock, bonus payments of $42.8 million made during the first quarter of 2012 related to the 2011 bonus,
$30.0 million
of capital expenditures, and
$25.5 million
of dividends paid. In addition, we used cash of approximately
$10.3 million
to acquire minority equity stakes in HelloWallet LLC and Inquiry Financial Europe AB.
These items, which decreased our cash, cash equivalents, and investments balance, were partially offset by cash inflows from net income, adjusted for non-cash items and, to a much lesser extent, cash received of
$5.7 million
from the sale of two businesses and
$4.8 million
of cash from stock-option proceeds.
We expect to use a portion of our cash and investments balances in the first quarter of 2013 to make annual bonus payments of approximately $36 million.
75
Cash Provided by Operating Activities
Our main source of capital is cash generated from operating activities.
In
2012
, cash provided by operating activities was
$146.0
million, driven by
$165.0 million
of net income, adjusted for non-cash items, partially offset by
$19.1 million
in changes in our net operating assets and liabilities. Accounts receivable was the primary contributor to the unfavorable effect of changes in our net operating assets and liabilities. A decrease in accrued compensation also contributed to the unfavorable impact of changes in our net operating assets and liabilities, although to a lesser extent. The decline in accrued compensation primarily reflects the bonus payments made in the first quarter of 2012 of approximately $42.8 million, partially offset by the current- year bonus liability as of year-end 2012.
In
2011
, cash provided by operating activities was
$165.0 million
, driven by
$142.6 million
of net income, adjusted for non-cash items and changes in our net operating assets and liabilities of
$22.4 million
. Changes in our operating assets and liabilities mainly benefited from increases in accrued compensation and income taxes. The growth in accrued compensation primarily reflects the bonus liability as of year-end 2011, partially offset by bonus payments made in the first quarter of
2011
of approximately
$37.5 million
. The cash flow benefit of income taxes was partially offset by tax payments of
$38.1 million
made during
2011
. Cash provided by operating activities in
2011
also reflects
$4.1 million
of payments for previously announced separation agreements with two former executives.
In
2010
, cash provided by operating activities was
$123.4 million
, driven by
$127.0 million
of net income, adjusted for non-cash items partially offset by
$3.5 million
in changes from our net operating assets and liabilities. We paid
$21.4 million
in annual bonus payments in the first quarter of
2010
and made tax payments of approximately
$37.6 million
. In addition, in
2010
, we paid $4.9 million to one former and two then current executives to adjust the tax treatment of certain stock options originally considered incentive stock options. The cash flow impact of these items was partially offset by the cash flow benefits of accrued compensation and income taxes payable.

Cash Provided by (Used for) Investing Activities
Cash provided by (used for) investing activities consists primarily of cash used for acquisitions, purchases of investments less proceeds from the maturity or sale of investments, cash used for capital expenditures, purchases of equity and cost-method investments, and proceeds from the sale of businesses. The level of investing activities varies from period to period depending on activity in these categories. Cash provided by investing activities was
$80.2 million
in
2012
, compared with cash used for investing activities of
$110.8 million
in
2011
and
$87.9 million
in
2010
.
76
In
2012
, proceeds from the maturity and sale of investments exceeded the purchases of investments by
$114.8 million
. In contrast, in
2011
, purchases of investments exceeded the proceeds from the maturity and sale of investments by
$85.3 million
. In 2010, proceeds from the maturity and sale of investments exceeded the purchases of investments by
$28.6 million
. In 2012, we used these proceeds to fund our share repurchase program. In 2010, we transferred funds from our investment portfolio to cash and cash equivalents to pay for acquisitions made in 2010. As of
December 31, 2012
and
December 31, 2011
, we had investments, consisting primarily of fixed-income securities, of
$157.5
million and
$269.8
million, respectively. As of
December 31, 2012
, our investments represented
49%
of our total cash, cash equivalents, and investments balance down from 57% as of
December 31, 2011
.
Capital expenditures were
$30.0 million
,
$23.3 million
, and
$14.8 million
in
2012
,
2011
, and
2010
, respectively. The
2012
capital expenditures reflect spending on computer hardware and software, internally developed capitalized software for our U.S. operations, and an expansion of our office space in Chicago. The
2011
capital expenditures reflect spending on computer hardware and software and internally developed capitalized software for our U.S. operations as well as remaining payments for our development center in China. Capital expenditures in
2010
include spending for our office space in Shenzhen, China. We expect to make total capital expenditures of approximately $33 million to $38 million in 2013, primarily for computer hardware and software, leasehold improvements for new and existing office locations, and capitalized software.
We did not complete any acquisitions in
2012
or 2011. In 2011, we received cash of approximately $0.6 million as an adjustment to the purchase price of one of our 2010 acquisitions. In
2010
, we completed seven acquisitions for
$102.3 million
, net of cash acquired. The majority of the cash used for acquisitions was related to our purchase of Realpoint, OBSR, Morningstar Denmark, and the annuity intelligence business of Advanced Sales and Marketing Corp.
In 2012, we used cash of approximately
$10.3 million
to acquire minority equity stakes in HelloWallet LLC and Inquiry Financial Europe AB. In 2011, we used cash of approximately $2.5 million to acquire a minority equity stake in YCharts, Inc.
In 2012, we received cash of approximately
$5.7 million
as proceeds from the sale of two businesses. In October 2012, we sold Morningstar Investor Relations Services to UK-based Investis, a leading specialist in digital corporate communications for public companies. In October 2012, we also sold the Morningstar Australasia trade publishing assets to Sterling Publishing Pty Ltd.
Cash Provided by (Used for) Financing Activities
Cash provided by (used for) financing activities consists primarily of net proceeds from stock-option exercises and excess tax benefits related to stock-option exercises and vesting of restricted stock units. These cash inflows may be offset by dividend payments and cash used to repurchase outstanding common stock through our share repurchase program.
Excess tax benefits occur at the time a stock option is exercised when the intrinsic value of the option (the difference between the fair value of our stock on the date of exercise and the exercise price of the option) is greater than the fair value of the option at the time of grant. Similarly, the vesting of restricted stock units generates excess tax benefits when the market value of our common stock on the vesting date exceeds the grant price of the restricted stock units. These excess tax benefits reduce the cash we pay for income taxes in the year they are recognized. It is not possible to predict the timing of stock-option exercises or the intrinsic value that will be achieved at the time options are exercised or upon vesting of restricted stock units. As a result, we expect cash flow from financing activities to vary over time. Note
12
in the Notes to our Consolidated Financial Statements includes additional information concerning stock options and restricted stock units outstanding as of
December 31, 2012
.
In
2012
, cash used for financing activities was
$265.2 million
. We paid cash of approximately
$251.8 million
under our share repurchase program in
2012
. In addition, we made dividend payments of
$25.5
million. Partially offsetting these cash outflows were net proceeds from stock-option exercises of
$4.8
million and excess tax benefits related to stock-option exercises and vesting of restricted stock units of
$7.2
million.
77
In 2011, cash used for financing activities was $32.6 million. We paid cash of approximately $40.7 million under our share repurchase program in 2011. In addition, we made dividend payments of $10.0 million. Partially offsetting these cash outflows were proceeds from stock-option exercises of $8.7 million and excess tax benefits related to stock-option exercises and vesting of restricted stock units of $9.5 million.
In
2012
, we used cash of
$265.2 million
for financing activities, compared with
$32.6 million
in
2011
. The net change of
$232.6 million
was driven by an increase in cash used to repurchase common shares of
$211.1 million
and an increase in dividends paid of
$15.4 million
in
2012
.
In
2010
, cash provided by financing activities was
$12.5 million
. Proceeds from stock-option exercises totaled
$9.2 million
, while excess tax benefits related to stock-option exercises and vesting of restricted stock units totaled
$7.5 million
. Partially offsetting these inflows was
$3.8 million
of cash used to repurchase outstanding common stock through our share repurchase program. In
2010
, cash provided by financing activities decreased by
$12.8 million
, driven by a decrease in proceeds from stock-option exercises, cash used to repurchase common shares, and (to a lesser extent) from a decline in excess tax benefits.
Employees exercised approximately
0.5 million
,
0.7 million
, and
0.8 million
stock options in
2012
,
2011
, and
2010
, respectively. The total intrinsic value (the difference between the market value of our stock on the date of exercise and the exercise price of the option) of options exercised during
2012
,
2011
, and
2010
, was
$22.5 million
,
$29.9 million
, and
$31.4 million
, respectively.
Acquisitions
We did not complete any acquisitions in 2012 or 2011. We invested a total of
$102.0 million
, less cash acquired, related to acquisitions over the past three years. We describe these acquisitions, including purchase price and product offerings, in Note
7
of the Notes to our Consolidated Financial Statements.
Divestitures
We sold two businesses in 2012 and received a total of
$5.7 million
related to these sales. For more information, please see Note
8
of the Notes to our Consolidated Financial Statements.
Subsequent Events
See Note
18
in the Notes to our Consolidated Financial Statements for information on events subsequent to
December 31, 2012
.
Application of Critical Accounting Policies and Estimates
Our discussion and analysis of our financial condition and results of operations are based on our Consolidated Financial Statements, which have been prepared in accordance with GAAP. We discuss our significant accounting policies in Note
3
of the Notes to our Consolidated Financial Statements. The preparation of financial statements in accordance with GAAP requires our management team to make estimates and assumptions that affect the reported amounts of assets, liabilities, revenue, expense, and related disclosures included in our Consolidated Financial Statements.
We evaluate our estimates on an ongoing basis. We base our estimates on historical experience and various other assumptions that we believe are reasonable. Based on these assumptions and estimates, we make judgments about the carrying values of assets and liabilities that are not readily apparent from other sources. Our actual results could vary from these estimates and assumptions. If actual amounts are different from previous estimates, we include revisions in our results of operations for the period in which the actual amounts become known.
We believe the following critical accounting policies reflect the significant judgments and estimates used in the preparation of our Consolidated Financial Statements:
78
Revenue Recognition
Much of our revenue comes from the sale of subscriptions or licenses for print publications, software, and Internet-based products and services. We recognize this revenue in equal amounts over the term of the subscription or license, which generally ranges from one to three years. We also provide analysis, consulting, retirement advice, and other services. We recognize this revenue when the service is provided or during the service obligation period defined in the contract.
We make significant judgments related to revenue recognition, including whether fees are fixed or determinable and whether the collection of payment is probable. For contracts that combine multiple products and services, we make judgments regarding the value of each element in the arrangement based on selling prices of the items when sold separately. Delivery of our products and services is a prerequisite to the recognition of revenue. If arrangements include an acceptance provision, we begin recognizing revenue upon the receipt of customer acceptance.
We make judgments at the beginning of an arrangement regarding whether or not collection is probable. Probability of collection is assessed on a case-by-case basis. We typically sell to institutional customers with whom we have a history of successful collections.
Deferred revenue is the amount invoiced or collected in advance for subscriptions, licenses, or services that has not yet been recognized as revenue. As of
December 31, 2012
, our deferred revenue was
$146.0 million
. We expect to recognize this deferred revenue in future periods as we fulfill our service obligations. The amount of deferred revenue may increase or decrease primarily based on the mix of contracted products and services and the volume of new and renewal subscriptions. The timing of future revenue recognition may change depending on the terms of the license agreements and the timing of fulfilling our service obligations. We believe that the estimate related to revenue recognition is a critical accounting estimate, and to the extent that there are material differences between our determination of deferred revenue and actual results, our financial condition or results of operations may be affected.
Purchase Price Allocation
Between 2006 and 2010, we acquired numerous companies that complement our business operations. We did not complete any acquisitions in 2012 or 2011. In 2010, the total cash paid for acquisitions, less cash acquired, was
$102.3 million
. As of
December 31, 2012
, we have recorded
$320.8 million
of goodwill arising from acquisitions. As of
December 31, 2012
, we allocated
$246.8 million
of gross value to intangible assets, primarily for customer-related assets, technology-based assets, and intellectual property. The estimated useful lives of the intangible assets range from one to 25 years.
Allocating the purchase price to the acquired assets and liabilities involves management judgment. For each acquisition, we allocate the purchase price to the assets acquired, liabilities assumed, and goodwill in accordance with ASC 805,
Business Combinations
. Once it has been determined that recognition of an asset or liability in a business combination is appropriate, we generally measure the asset or liability at fair value in accordance with the principles of ASC 820,
Fair Value Measurements and Disclosures
. Fair value is the price that would be received to sell an asset or paid to transfer a liability in an orderly transaction between market participants at the measurement date.
The determination of the fair values of intangible assets requires significant management judgment in each of the following areas:
|
•
|
Identify the acquired intangible assets: For each acquisition, we identify the intangible assets acquired. These intangible assets generally consist of customer relationships, trademarks and trade names, technology-related intangibles including internally developed software and databases, and non-compete agreements.
|
|
•
|
Estimate the fair value of these intangible assets: We consider various approaches to value the intangible assets. These valuation approaches include the cost approach, which measures the value of an asset based on the cost to reproduce it or replace it with another asset of like utility; the market approach, which values the asset through an analysis of sales and offerings of comparable assets; and the income approach, which measures the value of an asset based by measuring the present worth of the economic benefits it is expected to produce.
|
79
|
•
|
Estimate the remaining useful life of the assets: For each intangible asset, we use judgment and assumptions to establish the remaining useful life of the asset. For example, for customer relationships, we determine the estimated useful life with reference to observed customer attrition rates. For technology-related assets such as databases, we make judgments about the demand for current data and historical metrics in establishing the remaining useful life. For internally developed software, we estimate an obsolescence factor associated with the software.
|
|
•
|
Assess the appropriate method for recording amortization expense over the intangible asset's useful life: We use judgment to determine the rate at which the amortization expense should be recognized. In accordance with ASC 350,
Intangibles - Goodwill and Other
, the method of amortization should reflect the pattern in which the economic benefits of the intangible asset are consumed or otherwise used up. If that pattern cannot be reliably determined, a straight-line amortization method should be used. Based on this guidance, we amortize intangible assets over their expected useful life using a straight-line amortization method.
|
We believe that the accounting estimates related to purchase price allocations are critical accounting estimates because the assumptions impact the amounts and classifications of assets and liabilities presented in our Consolidated Balance Sheets, the amount of amortization and depreciation expense, if any, recorded in our Consolidated Statements of Income, and the impairment testing performed in subsequent periods.
Goodwill
Goodwill recorded on our Consolidated Balance Sheet as of
December 31, 2012
was
$320.8 million
. In accordance with ASC 350,
Intangibles-Goodwill and Other
, we do not amortize goodwill. Instead, it is subject to an impairment test annually, or whenever indicators of impairment exist, based on a discounted cash-flow model. An impairment would occur if the carrying amount of a reporting unit, including goodwill, exceeded the fair value of that reporting unit. In 2011, we altered the definition of our reporting units to align with the definition of our operating segments. This realignment occurred because of our successful efforts to integrate acquired businesses and leverage proprietary content across multiple products. As a result, the businesses that previously represented components of our operating segments no longer met the criteria for recognition as reporting units. Our reporting units constitute businesses for which discrete financial information, which is regularly reviewed by management, is available. We performed annual impairment reviews in the fourth quarter of
2012
,
2011
, and
2010
and did not record any significant impairment losses in these years, reflecting our assessment that our estimates of fair value substantially exceeded the carrying value of our reporting units.
The process of evaluating the potential impairment of goodwill is subjective and requires significant judgment. In estimating the fair value of the reporting units, we make estimates and judgments about the future cash flows of the reporting unit. These estimates include assumptions about future market growth and trends, forecasted revenue and costs, capital investments, appropriate discount rates, and other variables that can significantly affect the value of the reporting unit.
Although our cash flow forecasts are based on assumptions that are consistent with plans and estimates we use to manage the underlying business, there is significant judgment in determining the cash flows attributable to these businesses over a long-term horizon. We update these assumptions and cash flow estimates at least annually.
We believe that the accounting estimate related to goodwill impairment is a critical accounting estimate because the assumptions used are highly susceptible to changes in the operating results and cash flows of the reporting units. If actual results differ from our estimates, future tests may indicate an impairment of goodwill. This would result in a non-cash charge, adversely affecting our results of operations.
Impairment of Long-Lived Assets
Our Consolidated Balance Sheet as of
December 31, 2012
includes
$84.0 million
of property, equipment, and capitalized software, net of accumulated depreciation, and
$116.7 million
of intangible assets, net of accumulated amortization. In accordance with FASB ASC 360-10-35
, Subsequent Measurement—Impairment or Disposal of Long-Lived Assets
, we review our property, equipment, capitalized software, and intangible assets for impairment whenever events or changes in circumstances indicate that the carrying value may not be recoverable. Such events or changes may include deterioration in the business climate for a specific product or service. If the total of projected future undiscounted cash flows is less than the carrying amount of an asset, we may need to record an impairment loss based on the excess of the carrying amount over the fair value of the assets.
80
Estimates of future cash flows and the estimated useful lives associated with these assets are critical to the assessment of recoverability and fair values. They are susceptible to change from period to period because of the requirement to make assumptions about future cash flows generated over extended periods of time. Changes in these estimates could result in a determination of asset impairment, which would result in a reduction to the carrying value and could adversely affect our operating results in the related period.
Stock-Based Compensation
We include stock-based compensation expense in each of our operating expense categories. Our stock-based compensation expense primarily reflects grants of restricted stock units and restricted stock.
Under FASB ASC 718
, Compensation—Stock Compensation
, stock-based compensation expense is measured at the grant date based on the fair value of the award, and the cost is recognized as expense ratably over the award's vesting period. We measure the fair value of our restricted stock units on the date of grant based on the market price of the underlying common stock as of the close of trading on the day prior to grant. We estimate expected forfeitures of stock-based awards at the grant date and recognize compensation cost only for those awards expected to vest. We ultimately adjust this forfeiture assumption to the actual forfeiture rate. Therefore, changes in the forfeiture assumptions do not impact the total amount of expense ultimately recognized over the vesting period. Instead, different forfeiture assumptions would only impact the timing of expense recognition over the vesting period.
We adjust the stock-based compensation expense during the third quarter to reflect those awards that ultimately vested. In addition, we update our estimate of the forfeiture rate that will be applied to awards not yet vested.
We believe that the estimates related to stock-based compensation expense are critical accounting estimates because the assumptions used could significantly impact the timing and amount of stock-based compensation expense recorded in our Consolidated Financial Statements.
Income Taxes
Our effective tax rate is based on the mix of income and losses in our U.S. and non-U.S. operations, statutory tax rates, and tax-planning opportunities available to us in the various jurisdictions in which we operate. Significant judgment is required to evaluate our tax positions.
Tax law requires us to include items in our tax return at different times from when these items are reflected in our Consolidated Statements of Income. As a result, the effective tax rate reflected in our Consolidated Financial Statements is different from the tax rate reported on our tax return (our cash tax rate). Some of these differences, such as expenses that are not deductible in our tax return, are permanent. Other differences, such as depreciation expense, reverse over time. These timing differences create deferred tax assets and liabilities. We determine our deferred tax assets and liabilities based on temporary differences between the financial reporting and the tax basis of assets and liabilities. The excess tax benefits associated with stock-option exercises and vesting of restricted stock units also create a difference between our cash tax rate and the effective tax rate in our Consolidated Income Statement.
As of
December 31, 2012
, we had gross deferred tax assets of
$36.8 million
and gross deferred tax liabilities of
$43.2 million
. The deferred tax assets include
$12.4 million
of deferred tax assets related to
$50.6 million
of net operating losses (NOLs) of our non-U.S. operations. In assessing the realizability of our deferred tax assets, we consider whether it is more likely than not that some portion or all of the deferred tax assets will not be realized. We have recorded a valuation allowance against all but approximately
$4.0 million
of the non-U.S. NOLs, reflecting the likelihood that the benefit of the NOLs will not be realized.
In assessing the need for a valuation allowance, we consider both positive and negative evidence, including tax-planning strategies, projected future taxable income, and recent financial performance. If we determine a lesser allowance is required at some point in the future, we would record a reduction to our tax expense and valuation allowance. These adjustments would be made in the same period we determined the change in the valuation allowance was needed. This would cause our income tax expense, effective tax rate, and net income to fluctuate.
81
We assess uncertain tax positions in accordance with FASB ASC 740
, Income Taxes.
We use judgment to identify, recognize, and measure the amounts to be recorded in the financial statements related to tax positions taken or expected to be taken in a tax return. We recognize liabilities to represent our potential future obligations to taxing authorities for the benefits taken in our tax returns. We adjust these liabilities, including any impact of the related interest and penalties, in light of changing facts and circumstances such as the progress of a tax audit. A number of years may elapse before a particular matter for which we have established a reserve is audited and finally resolved. The number of years with open tax audits varies depending on the tax jurisdiction.
We use judgment to classify unrecognized tax benefits as either current or noncurrent liabilities in our Consolidated Balance Sheets. Settlement of any particular issue would usually require the use of cash. We generally classify liabilities associated with unrecognized tax benefits as noncurrent liabilities. It typically takes several years between our initial tax return filing and the final resolution of any uncertain tax positions with the tax authority. We recognize favorable resolutions of tax matters for which we have previously established reserves as a reduction to our income tax expense when the amounts involved become known.
Assessing the future tax consequences of events that have been recognized in our Consolidated Financial Statements or tax returns requires judgment. Variations in the actual outcome of these future tax consequences could materially impact our financial position, results of operations, or cash flows.
Contingencies
We are subject to various claims and contingencies related to legal proceedings and investigations, which we describe in Note
16
of the Notes to our Consolidated Financial Statements. These legal proceedings involve inherent uncertainties including, but not limited to, court rulings, negotiations between affected parties, and government actions. Assessing the probability of loss for such contingencies and determining how to accrue the appropriate liabilities requires judgment. If actual results differ from our assessments, our financial position, results of operations, or cash flows would be affected.
Recently Issued Accounting Pronouncements
In February 2013, the FASB issued ASU No. 2013-2,
Comprehensive Income (Topic 220).
The amended guidance requires us to show the effects of items reclassified out of each component of accumulated other comprehensive income to net income on the face of the financial statements. For Morningstar, the ASU No. 2013-2 was effective on January 1, 2013. We do not expect the provisions of ASU No. 2013-2 to have a material impact on our consolidated financial statements.
82
Contractual Obligations
The table below shows our known contractual obligations as of
December 31, 2012
and the expected timing of cash payments related to these contractual obligations:
|
($000)
|
2013
|
|
2014
|
|
2015
|
|
2016
|
|
2017
|
|
Thereafter
|
|
Total
|
|
||||||||||||||
|
Minimum commitments on non-cancelable operating lease obligations (1)
|
$
|
17,570
|
|
$
|
17,584
|
|
$
|
16,337
|
|
$
|
15,833
|
|
$
|
14,978
|
|
$
|
52,706
|
|
$
|
135,008
|
|
|||||||
|
Unrecognized tax benefits (2)
|
6,568
|
|
—
|
|
—
|
|
—
|
|
—
|
|
—
|
|
6,568
|
|
||||||||||||||
|
Total
|
$
|
24,138
|
|
$
|
17,584
|
|
$
|
16,337
|
|
$
|
15,833
|
|
$
|
14,978
|
|
$
|
52,706
|
|
$
|
141,576
|
|
|||||||
(1) The non-cancelable operating lease obligations are mainly for lease commitments for office space.
(2) Represents unrecognized tax benefits (including penalties and interest, less the impact of any associated tax
benefits) recorded in accordance with FASB ASC 740,
Income Taxes
. The amount included in the table represents items that may be resolved through settlement of tax audits or for which the statutes of limitations are expected to lapse during 2013. The table excludes
$5.7 million
of unrecognized tax benefits, included as a long-term liability in our Consolidated Balance Sheet as of
December 31, 2012
, for which we cannot make a reasonably reliable estimate of the period of payment.
83
Our investment portfolio is actively managed and may suffer losses from fluctuating interest rates, market prices, or adverse security selection. We invest our investment portfolio mainly in high-quality fixed-income securities. As of
December 31, 2012
, our cash, cash equivalents, and investments balance was
$321.4
million. Based on our estimates, a 100 basis-point change in interest rates would change the fair value of our investment portfolio by approximately
$0.2
million.
As our non-U.S. revenue increases as a percentage of our consolidated revenue, fluctuations in foreign currencies present a greater potential risk. Our European operations are subject to currency risk related to the euro. To date, we have not engaged in currency hedging, and we do not currently have any positions in derivative instruments to hedge our currency risk. Our results could suffer if certain foreign currencies decline relative to the U.S. dollar. In addition, because we use the local currency of our subsidiaries as the functional currency, we are affected by the translation of foreign currencies into U.S. dollars.
84
Report of Independent Registered Public Accounting Firm
The Board of Directors and Stockholders
Morningstar, Inc.:
We have audited the accompanying consolidated balance sheets of Morningstar, Inc. and subsidiaries as of December 31, 2012 and 2011, and the related consolidated statements of income, comprehensive income, equity, and cash flows for each of the years in the two‑year period ended December 31, 2012. These consolidated financial statements are the responsibility of the Company's management. Our responsibility is to express an opinion on these consolidated financial statements based on our audits.
We conducted our audits in accordance with the standards of the Public Company Accounting Oversight Board (United States). Those standards require that we plan and perform the audit to obtain reasonable assurance about whether the financial statements are free of material misstatement. An audit includes examining, on a test basis, evidence supporting the amounts and disclosures in the financial statements. An audit also includes assessing the accounting principles used and significant estimates made by management, as well as evaluating the overall financial statement presentation. We believe that our audits provide a reasonable basis for our opinion.
In our opinion, the consolidated financial statements referred to above present fairly, in all material respects, the financial position of Morningstar, Inc. and subsidiaries as of December 31, 2012 and 2011, and the results of their operations and their cash flows for each of the years in the two‑year period ended December 31, 2012, in conformity with U.S. generally accepted accounting principles.
We also have audited, in accordance with the standards of the Public Company Accounting Oversight Board (United States), Morningstar, Inc.'s internal control over financial reporting as of December 31, 2012, based on criteria established in
Internal Control - Integrated Framework
issued by the Committee of Sponsoring Organizations of the Treadway Commission (COSO), and our report dated February 28, 2013 expressed an unqualified opinion on the effectiveness of the Company's internal control over financial reporting.
(signed) KPMG LLP
Chicago, Illinois
February 28, 2013
85
Report of Independent Registered Public Accounting Firm
The Board of Directors and Shareholders
Morningstar, Inc.:
We have audited Morningstar, Inc.'s internal control over financial reporting as of December 31, 2012, based on criteria established in
Internal Control - Integrated Framework
issued by the Committee of Sponsoring Organizations of the Treadway Commission (COSO). Morningstar, Inc.'s management is responsible for maintaining effective internal control over financial reporting and for its assessment of the effectiveness of internal control over financial reporting, included in the accompanying Management's Report on Internal Control Over Financial Reporting, appearing in Item 9A. Our responsibility is to express an opinion on the Company's internal control over financial reporting based on our audit.
We conducted our audit in accordance with the standards of the Public Company Accounting Oversight Board (United States). Those standards require that we plan and perform the audit to obtain reasonable assurance about whether effective internal control over financial reporting was maintained in all material respects. Our audit included obtaining an understanding of internal control over financial reporting, assessing the risk that a material weakness exists, and testing and evaluating the design and operating effectiveness of internal control based on the assessed risk. Our audit also included performing such other procedures as we considered necessary in the circumstances. We believe that our audit provides a reasonable basis for our opinion.
A company's internal control over financial reporting is a process designed to provide reasonable assurance regarding the reliability of financial reporting and the preparation of financial statements for external purposes in accordance with generally accepted accounting principles. A company's internal control over financial reporting includes those policies and procedures that (1) pertain to the maintenance of records that, in reasonable detail, accurately and fairly reflect the transactions and dispositions of the assets of the company; (2) provide reasonable assurance that transactions are recorded as necessary to permit preparation of financial statements in accordance with generally accepted accounting principles, and that receipts and expenditures of the company are being made only in accordance with authorizations of management and directors of the company; and (3) provide reasonable assurance regarding prevention or timely detection of unauthorized acquisition, use, or disposition of the company's assets that could have a material effect on the financial statements.
Because of its inherent limitations, internal control over financial reporting may not prevent or detect misstatements. Also, projections of any evaluation of effectiveness to future periods are subject to the risk that controls may become inadequate because of changes in conditions, or that the degree of compliance with the policies or procedures may deteriorate.
In our opinion, Morningstar, Inc. maintained, in all material respects, effective internal control over financial reporting as of December 31, 2012, based on criteria established in
Internal Control - Integrated Framework
issued by the Committee of Sponsoring Organizations of the Treadway Commission (COSO).
We also have audited, in accordance with the standards of the Public Company Accounting Oversight Board (United States), the consolidated balance sheets of Morningstar, Inc. and subsidiaries as of December 31, 2012 and 2011, and the related consolidated statements of income, comprehensive income, equity, and cash flows for each of the years in the two-year period ended December 31, 2012, and our report dated February 28, 2013 expressed an unqualified opinion on those consolidated financial statements.
(signed) KPMG LLP
Chicago, Illinois
February 28, 2013
86
REPORT OF INDEPENDENT REGISTERED PUBLIC ACCOUNTING FIRM
The Board of Directors and Shareholders
Morningstar, Inc.
We have audited the accompanying consolidated statements of income, comprehensive income, equity, and cash flows of Morningstar, Inc. and subsidiaries (“the Company”) for the year ended December 31, 2010. Our audit also included the financial statement schedule for 2010 presented in Item 15(a). These financial statements and schedule are the responsibility of the Company's management. Our responsibility is to express an opinion on these financial statements and schedule based on our audit.
We conducted our audit in accordance with the standards of the Public Company Accounting Oversight Board (United States). Those standards require that we plan and perform the audit to obtain reasonable assurance about whether the financial statements are free of material misstatement. An audit includes examining, on a test basis, evidence supporting the amounts and disclosures in the financial statements. An audit also includes assessing the accounting principles used and significant estimates made by management, as well as evaluating the overall financial statement presentation. We believe that our audit provides a reasonable basis for our opinion.
In our opinion, the financial statements referred to above present fairly, in all material respects, the consolidated results of operations and cash flows of Morningstar, Inc. and subsidiaries for the year ended December 31, 2010, in conformity with U.S. generally accepted accounting principles. Also, in our opinion, the related financial statement schedule for the year ended December 31, 2010, when considered in relation to the basic consolidated financial statements taken as a whole, presents fairly in all material respects the information set forth therein.
/s/ Ernst & Young LLP
Chicago, Illinois
February 28, 2011
87
Morningstar, Inc. and Subsidiaries
|
(in thousands except per share amounts)
|
2012
|
|
2011
|
|
2010
|
|
||||||
|
Revenue
|
$
|
658,288
|
|
$
|
631,400
|
|
$
|
555,351
|
|
|||
|
Operating expense (1):
|
||||||||||||
|
Cost of goods sold
|
195,347
|
|
182,132
|
|
157,068
|
|
||||||
|
Development
|
51,436
|
|
53,157
|
|
49,244
|
|
||||||
|
Sales and marketing
|
108,884
|
|
106,699
|
|
95,473
|
|
||||||
|
General and administrative
|
108,857
|
|
108,084
|
|
92,843
|
|
||||||
|
Depreciation and amortization
|
43,096
|
|
42,913
|
|
39,664
|
|
||||||
|
Total operating expense
|
507,620
|
|
492,985
|
|
434,292
|
|
||||||
|
Operating income
|
150,668
|
|
138,415
|
|
121,059
|
|
||||||
|
Non-operating income (expense):
|
||||||||||||
|
Interest income, net
|
5,153
|
|
2,361
|
|
2,437
|
|
||||||
|
Other income (expense), net
|
(2,196
|
)
|
(652
|
)
|
4,295
|
|
||||||
|
Non-operating income, net
|
2,957
|
|
1,709
|
|
6,732
|
|
||||||
|
Income before income taxes and equity in net income of unconsolidated entities
|
153,625
|
|
140,124
|
|
127,791
|
|
||||||
|
Income tax expense
|
52,878
|
|
43,658
|
|
42,756
|
|
||||||
|
Equity in net income of unconsolidated entities
|
2,027
|
|
1,848
|
|
1,422
|
|
||||||
|
Consolidated net income from continuing operations
|
102,774
|
|
98,314
|
|
86,457
|
|
||||||
|
Gain on sale of discontinued operations, net of tax
|
5,188
|
|
—
|
|
—
|
|
||||||
|
Consolidated net income
|
107,962
|
|
98,314
|
|
86,457
|
|
||||||
|
Net (income) loss attributable to the noncontrolling interest
|
117
|
|
43
|
|
(87
|
)
|
||||||
|
Net income attributable to Morningstar, Inc.
|
$
|
108,079
|
|
$
|
98,357
|
|
$
|
86,370
|
|
|||
|
Amounts attributable to Morningstar, Inc.:
|
||||||||||||
|
Net income from continuing operations, net of tax
|
$
|
102,891
|
|
$
|
98,357
|
|
$
|
86,370
|
|
|||
|
Net income from discontinued operations, net of tax
|
5,188
|
|
—
|
|
—
|
|
||||||
|
Net income attributable to Morningstar, Inc.
|
$
|
108,079
|
|
$
|
98,357
|
|
$
|
86,370
|
|
|||
|
Net income per share attributable to Morningstar, Inc.:
|
||||||||||||
|
Basic:
|
||||||||||||
|
Continuing operations
|
$
|
2.12
|
|
$
|
1.96
|
|
$
|
1.75
|
|
|||
|
Discontinued operations
|
0.11
|
|
—
|
|
—
|
|
||||||
|
$
|
2.23
|
|
$
|
1.96
|
|
$
|
1.75
|
|
||||
|
Diluted:
|
||||||||||||
|
Continuing operations
|
$
|
2.10
|
|
$
|
1.92
|
|
$
|
1.70
|
|
|||
|
Discontinued operations
|
0.10
|
|
—
|
|
—
|
|
||||||
|
$
|
2.20
|
|
$
|
1.92
|
|
$
|
1.70
|
|
||||
|
Dividends per common share:
|
||||||||||||
|
Dividends declared per common share
|
$
|
0.43
|
|
$
|
0.25
|
|
$
|
0.05
|
|
|||
|
Dividends paid per common share
|
$
|
0.53
|
|
$
|
0.20
|
|
$
|
—
|
|
|||
|
Weighted average shares outstanding:
|
||||||||||||
|
Basic
|
48,497
|
|
50,032
|
|
49,249
|
|
||||||
|
Diluted
|
49,148
|
|
50,988
|
|
50,555
|
|
||||||
|
|
2012
|
|
2011
|
|
2010
|
|
||||||
|
(1) Includes stock-based compensation expense of:
|
|
|
||||||||||
|
Cost of goods sold
|
$
|
4,488
|
|
$
|
4,150
|
|
$
|
3,473
|
|
|||
|
Development
|
1,928
|
|
2,086
|
|
1,840
|
|
||||||
|
Sales and marketing
|
1,937
|
|
1,871
|
|
1,786
|
|
||||||
|
General and administrative
|
10,552
|
|
7,196
|
|
6,694
|
|
||||||
|
Total stock-based compensation expense
|
$
|
18,905
|
|
$
|
15,303
|
|
$
|
13,793
|
|
|||
See notes to consolidated financial statements.
88
Morningstar, Inc. and Subsidiaries
Consolidated Statements of Comprehensive Income
|
(in thousands)
|
2012
|
|
2011
|
|
2010
|
|
||||||
|
Consolidated net income
|
$
|
107,962
|
|
$
|
98,314
|
|
$
|
86,457
|
|
|||
|
Other comprehensive income (loss), net of tax:
|
||||||||||||
|
Foreign currency translation adjustment
|
6,838
|
|
(2,345
|
)
|
4,909
|
|
||||||
|
Unrealized gains (losses) on securities:
|
||||||||||||
|
Unrealized holding gains (losses) arising during period
|
1,455
|
|
(773
|
)
|
417
|
|
||||||
|
Reclassification of gains included in net income
|
(344
|
)
|
(166
|
)
|
(172
|
)
|
||||||
|
Other comprehensive income (loss)
|
7,949
|
|
(3,284
|
)
|
5,154
|
|
||||||
|
Comprehensive income
|
115,911
|
|
95,030
|
|
91,611
|
|
||||||
|
Comprehensive (income) loss attributable to noncontrolling interest
|
268
|
|
(179
|
)
|
(156
|
)
|
||||||
|
Comprehensive income attributable to Morningstar, Inc.
|
$
|
116,179
|
|
$
|
94,851
|
|
$
|
91,455
|
|
|||
See notes to consolidated financial statements.
89
Morningstar, Inc. and Subsidiaries
|
As of December 31 (in thousands except share amounts)
|
2012
|
|
2011
|
|
||||
|
Assets
|
|
|
|
|
||||
|
Current assets:
|
|
|
|
|
||||
|
Cash and cash equivalents
|
$
|
163,889
|
|
$
|
200,437
|
|
||
|
Investments
|
157,529
|
|
269,755
|
|
||||
|
Accounts receivable, less allowance of $569 and $835, respectively
|
114,361
|
|
113,312
|
|
||||
|
Deferred tax asset, net
|
3,741
|
|
5,104
|
|
||||
|
Income tax receivable, net
|
14,267
|
|
7,445
|
|
||||
|
Other
|
20,823
|
|
15,980
|
|
||||
|
Total current assets
|
474,610
|
|
612,033
|
|
||||
|
Property, equipment, and capitalized software, net
|
84,022
|
|
68,196
|
|
||||
|
Investments in unconsolidated entities
|
35,305
|
|
27,642
|
|
||||
|
Goodwill
|
320,845
|
|
318,492
|
|
||||
|
Intangible assets, net
|
116,732
|
|
139,809
|
|
||||
|
Other assets
|
10,438
|
|
5,912
|
|
||||
|
Total assets
|
$
|
1,041,952
|
|
$
|
1,172,084
|
|
||
|
Liabilities and equity
|
|
|
|
|
||||
|
Current liabilities:
|
|
|
|
|
||||
|
Accounts payable and accrued liabilities
|
$
|
43,777
|
|
$
|
41,403
|
|
||
|
Accrued compensation
|
67,317
|
|
73,124
|
|
||||
|
Deferred revenue
|
146,015
|
|
155,494
|
|
||||
|
Other
|
256
|
|
612
|
|
||||
|
Total current liabilities
|
257,365
|
|
270,633
|
|
||||
|
Accrued compensation
|
8,281
|
|
5,724
|
|
||||
|
Deferred tax liability, net
|
21,583
|
|
15,940
|
|
||||
|
Deferred rent
|
15,368
|
|
14,604
|
|
||||
|
Other long-term liabilities
|
12,460
|
|
8,167
|
|
||||
|
Total liabilities
|
315,057
|
|
315,068
|
|
||||
|
Equity:
|
|
|
|
|
||||
|
Morningstar, Inc. shareholders’ equity:
|
|
|
|
|
||||
|
Common stock, no par value, 200,000,000 shares authorized, of which 46,541,571 and 50,083,940 shares were outstanding as of December 31, 2012 and December 31, 2011, respectively
|
5
|
|
5
|
|
||||
|
Treasury stock at cost, 5,214,070 shares as of December 31, 2012 and 980,177 shares as of December 31, 2011
|
(301,839
|
)
|
(46,701
|
)
|
||||
|
Additional paid-in capital
|
521,285
|
|
491,432
|
|
||||
|
Retained earnings
|
496,354
|
|
409,022
|
|
||||
|
Accumulated other comprehensive income (loss):
|
||||||||
|
Currency translation adjustment
|
8,925
|
|
1,936
|
|
||||
|
Unrealized gain (loss) on available-for-sale investments
|
787
|
|
(324
|
)
|
||||
|
Total accumulated other comprehensive income
|
9,712
|
|
1,612
|
|
||||
|
Total Morningstar, Inc. shareholders’ equity
|
725,517
|
|
855,370
|
|
||||
|
Noncontrolling interest
|
1,378
|
|
1,646
|
|
||||
|
Total equity
|
726,895
|
|
857,016
|
|
||||
|
Total liabilities and equity
|
$
|
1,041,952
|
|
$
|
1,172,084
|
|
||
See notes to consolidated financial statements.
90
Morningstar, Inc. and Subsidiaries
Consolidated Statement of Equity
|
|
Morningstar, Inc. Shareholders’ Equity
|
|
|
||||||||||||||||||||||||||||
|
Accumulated
Other
Comprehensive
Income
(Loss)
|
|
||||||||||||||||||||||||||||||
|
|
Common Stock
|
|
|
Additional
Paid-in
Capital
|
|
Non
Controlling
Interests
|
|
|
|||||||||||||||||||||||
|
(in thousands, except share amounts)
|
Shares
Outstanding
|
|
Par
Value
|
|
Treasury
Stock
|
|
Retained
Earnings
|
|
Total
Equity
|
|
|||||||||||||||||||||
|
Balance as of December 31, 2009
|
48,768,541
|
|
$
|
5
|
|
$
|
(3,130
|
)
|
$
|
428,139
|
|
$
|
239,573
|
|
$
|
33
|
|
$
|
1,169
|
|
$
|
665,789
|
|
||||||||
|
Net income (loss)
|
|
|
—
|
|
—
|
|
—
|
|
86,370
|
|
—
|
|
87
|
|
86,457
|
|
|||||||||||||||
|
Other comprehensive income (loss):
|
|||||||||||||||||||||||||||||||
|
Unrealized gain on available-for-sale investments, net of tax of $252
|
|
|
—
|
|
—
|
|
—
|
|
—
|
|
417
|
|
—
|
|
417
|
|
|||||||||||||||
|
Reclassification of adjustments for gains included in net income, net of income tax of $103
|
|
|
—
|
|
—
|
|
—
|
|
—
|
|
(172
|
)
|
—
|
|
(172
|
)
|
|||||||||||||||
|
Foreign currency translation adjustment, net
|
|
|
—
|
|
—
|
|
—
|
|
—
|
|
4,840
|
|
69
|
|
4,909
|
|
|||||||||||||||
|
Other comprehensive income (loss), net
|
|
|
—
|
|
—
|
|
—
|
|
—
|
|
5,085
|
|
69
|
|
5,154
|
|
|||||||||||||||
|
Issuance of common stock related to stock-option exercises and vesting of restricted stock units, net
|
1,182,069
|
|
—
|
|
274
|
|
8,946
|
|
—
|
|
—
|
|
—
|
|
9,220
|
|
|||||||||||||||
|
Stock-based compensation — restricted stock units
|
|
|
—
|
|
—
|
|
12,545
|
|
—
|
|
—
|
|
—
|
|
12,545
|
|
|||||||||||||||
|
Stock-based compensation — restricted stock
|
—
|
|
—
|
|
1,248
|
|
—
|
|
—
|
|
—
|
|
1,248
|
|
|||||||||||||||||
|
Excess tax benefit derived from stock-option exercises and vesting of restricted stock units
|
|
|
—
|
|
—
|
|
7,507
|
|
—
|
|
—
|
|
—
|
|
7,507
|
|
|||||||||||||||
|
Common shares repurchased
|
(76,218
|
)
|
—
|
|
(3,785
|
)
|
—
|
|
—
|
|
—
|
|
—
|
|
(3,785
|
)
|
|||||||||||||||
|
Dividends declared — common shares outstanding
|
—
|
|
—
|
|
—
|
|
(2,494
|
)
|
—
|
|
—
|
|
(2,494
|
)
|
|||||||||||||||||
|
Dividends declared — restricted stock units
|
—
|
|
—
|
|
41
|
|
(41
|
)
|
—
|
|
—
|
|
—
|
|
|||||||||||||||||
|
Adjustment to noncontrolling interest
|
|
|
—
|
|
—
|
|
—
|
|
—
|
|
—
|
|
(216
|
)
|
(216
|
)
|
|||||||||||||||
|
Balance as of December 31, 2010
|
49,874,392
|
|
5
|
|
(6,641
|
)
|
458,426
|
|
323,408
|
|
5,118
|
|
1,109
|
|
781,425
|
|
|||||||||||||||
|
Net income (loss)
|
|
|
—
|
|
—
|
|
—
|
|
98,357
|
|
—
|
|
(43
|
)
|
98,314
|
|
|||||||||||||||
|
Other comprehensive income (loss):
|
|||||||||||||||||||||||||||||||
|
Unrealized gain on available-for-sale investments, net of tax of $447
|
|
|
—
|
|
—
|
|
—
|
|
—
|
|
(773
|
)
|
—
|
|
(773
|
)
|
|||||||||||||||
|
Reclassification of adjustments for gains included in net income, net of income tax of $94
|
|
|
—
|
|
—
|
|
—
|
|
—
|
|
(166
|
)
|
—
|
|
(166
|
)
|
|||||||||||||||
|
Foreign currency translation adjustment, net
|
|
|
—
|
|
—
|
|
—
|
|
—
|
|
(2,567
|
)
|
222
|
|
(2,345
|
)
|
|||||||||||||||
|
Other comprehensive income (loss), net
|
|
|
—
|
|
—
|
|
—
|
|
—
|
|
(3,506
|
)
|
222
|
|
(3,284
|
)
|
|||||||||||||||
|
Issuance of common stock related to stock-option exercises and vesting of restricted stock units, net
|
931,667
|
|
—
|
|
612
|
|
8,090
|
|
—
|
|
—
|
|
—
|
|
8,702
|
|
|||||||||||||||
|
Stock-based compensation — restricted stock units
|
|
|
—
|
|
—
|
|
12,765
|
|
—
|
|
—
|
|
—
|
|
12,765
|
|
|||||||||||||||
|
Stock-based compensation — restricted stock
|
|
|
—
|
|
—
|
|
2,196
|
|
—
|
|
—
|
|
—
|
|
2,196
|
|
|||||||||||||||
|
Stock-based compensation — stock-options
|
—
|
|
—
|
|
342
|
|
—
|
|
—
|
|
—
|
|
342
|
|
|||||||||||||||||
|
Excess tax benefit derived from stock-option exercises and vesting of restricted stock units
|
|
|
—
|
|
—
|
|
9,525
|
|
—
|
|
—
|
|
—
|
|
9,525
|
|
|||||||||||||||
|
Common shares repurchased
|
(722,119
|
)
|
—
|
|
(40,672
|
)
|
—
|
|
—
|
|
—
|
|
—
|
|
(40,672
|
)
|
|||||||||||||||
|
Dividends declared — common shares outstanding
|
|
|
—
|
|
—
|
|
—
|
|
(12,550
|
)
|
—
|
|
—
|
|
(12,550
|
)
|
|||||||||||||||
|
Dividends declared — restricted stock units
|
|
|
—
|
|
—
|
|
184
|
|
(193
|
)
|
—
|
|
—
|
|
(9
|
)
|
|||||||||||||||
|
Adjustment to noncontrolling interest
|
|
|
—
|
|
—
|
|
(96
|
)
|
—
|
|
—
|
|
358
|
|
262
|
|
|||||||||||||||
|
Balance as of December 31, 2011
|
50,083,940
|
|
5
|
|
(46,701
|
)
|
491,432
|
|
409,022
|
|
1,612
|
|
1,646
|
|
857,016
|
|
|||||||||||||||
|
Net income (loss)
|
—
|
|
—
|
|
—
|
|
108,079
|
|
—
|
|
(117
|
)
|
107,962
|
|
|||||||||||||||||
|
Other comprehensive income (loss):
|
|||||||||||||||||||||||||||||||
|
Unrealized loss on available-for-sale investments, net of income tax of $614
|
—
|
|
—
|
|
—
|
|
—
|
|
1,455
|
|
—
|
|
1,455
|
|
|||||||||||||||||
|
Reclassification of adjustments for gains included in net income, net of income tax of $194
|
—
|
|
—
|
|
—
|
|
—
|
|
(344
|
)
|
—
|
|
(344
|
)
|
|||||||||||||||||
|
Foreign currency translation adjustment, net
|
—
|
|
—
|
|
—
|
|
—
|
|
6,989
|
|
(151
|
)
|
6,838
|
|
|||||||||||||||||
|
Other comprehensive income (loss), net
|
—
|
|
—
|
|
—
|
|
—
|
|
8,100
|
|
(151
|
)
|
7,949
|
|
|||||||||||||||||
|
Issuance of common stock related to stock-option exercises and vesting of restricted stock units, net
|
715,888
|
|
—
|
|
1,342
|
|
3,467
|
|
—
|
|
—
|
|
—
|
|
4,809
|
|
|||||||||||||||
|
Stock-based compensation — restricted stock units
|
—
|
|
—
|
|
13,451
|
|
—
|
|
—
|
|
—
|
|
13,451
|
|
|||||||||||||||||
|
Stock-based compensation — restricted stock
|
—
|
|
—
|
|
5,013
|
|
—
|
|
—
|
|
—
|
|
5,013
|
|
|||||||||||||||||
|
Stock-based compensation — stock-options
|
—
|
|
—
|
|
441
|
|
—
|
|
—
|
|
—
|
|
441
|
|
|||||||||||||||||
|
Excess tax benefit derived from stock-option exercises and vesting of restricted stock units
|
—
|
|
—
|
|
7,210
|
|
—
|
|
—
|
|
—
|
|
7,210
|
|
|||||||||||||||||
|
Common shares repurchased
|
(4,258,257
|
)
|
—
|
|
(256,480
|
)
|
—
|
|
—
|
|
—
|
|
—
|
|
(256,480
|
)
|
|||||||||||||||
|
Dividends declared — common shares outstanding
|
—
|
|
—
|
|
—
|
|
(20,420
|
)
|
—
|
|
—
|
|
(20,420
|
)
|
|||||||||||||||||
|
Dividends declared — restricted stock units
|
—
|
|
—
|
|
271
|
|
(327
|
)
|
—
|
|
—
|
|
(56
|
)
|
|||||||||||||||||
|
Balance as of December 31, 2012
|
46,541,571
|
|
$
|
5
|
|
$
|
(301,839
|
)
|
$
|
521,285
|
|
$
|
496,354
|
|
$
|
9,712
|
|
$
|
1,378
|
|
$
|
726,895
|
|
||||||||
See notes to consolidated financial statements.
91
Morningstar, Inc. and Subsidiaries
|
(in thousands)
|
2012
|
|
2011
|
|
2010
|
|
||||||
|
Operating activities
|
|
|
|
|
||||||||
|
Consolidated net income
|
$
|
107,962
|
|
$
|
98,314
|
|
$
|
86,457
|
|
|||
|
Adjustments to reconcile consolidated net income to net cash flows from operating activities:
|
||||||||||||
|
Depreciation and amortization
|
43,096
|
|
42,913
|
|
39,664
|
|
||||||
|
Deferred income taxes
|
6,316
|
|
(4,436
|
)
|
211
|
|
||||||
|
Stock-based compensation expense
|
18,905
|
|
15,303
|
|
13,793
|
|
||||||
|
Provision for bad debt
|
1,016
|
|
1,237
|
|
413
|
|
||||||
|
Equity in net income of unconsolidated entities
|
(2,027
|
)
|
(1,848
|
)
|
(1,422
|
)
|
||||||
|
Excess tax benefits from stock-option exercises and vesting of restricted stock units
|
(7,210
|
)
|
(9,525
|
)
|
(7,507
|
)
|
||||||
|
Gain on sale of discontinued operations, net of tax
|
(5,188
|
)
|
—
|
|
—
|
|
||||||
|
Loss on sale of cost-method investment
|
2,034
|
|
—
|
|
—
|
|
||||||
|
Holding gain upon acquisition of additional ownership of equity-method investments
|
—
|
|
—
|
|
(4,564
|
)
|
||||||
|
Other, net
|
142
|
|
592
|
|
(90
|
)
|
||||||
|
Changes in operating assets and liabilities, net of effects of acquisitions:
|
||||||||||||
|
Accounts receivable
|
(17,124
|
)
|
(3,858
|
)
|
(23,652
|
)
|
||||||
|
Other assets
|
223
|
|
2,728
|
|
(2,341
|
)
|
||||||
|
Accounts payable and accrued liabilities
|
1,173
|
|
(4,821
|
)
|
(759
|
)
|
||||||
|
Accrued compensation
|
(8,861
|
)
|
10,176
|
|
12,166
|
|
||||||
|
Income taxes—current
|
(1,205
|
)
|
10,751
|
|
4,569
|
|
||||||
|
Deferred revenue
|
7,769
|
|
9,578
|
|
5,752
|
|
||||||
|
Deferred rent
|
407
|
|
(1,030
|
)
|
1,364
|
|
||||||
|
Other liabilities
|
(1,432
|
)
|
(1,098
|
)
|
(638
|
)
|
||||||
|
Cash provided by operating activities
|
145,996
|
|
164,976
|
|
123,416
|
|
||||||
|
Investing activities
|
|
|
|
|
||||||||
|
Purchases of investments
|
(145,491
|
)
|
(383,281
|
)
|
(186,283
|
)
|
||||||
|
Proceeds from maturities and sales of investments
|
260,317
|
|
297,956
|
|
214,929
|
|
||||||
|
Capital expenditures
|
(30,039
|
)
|
(23,322
|
)
|
(14,771
|
)
|
||||||
|
Acquisitions, net of cash acquired
|
—
|
|
300
|
|
(102,324
|
)
|
||||||
|
Proceeds from sale of a business, net
|
5,734
|
|
—
|
|
—
|
|
||||||
|
Purchases of equity- and cost-method investments
|
(10,304
|
)
|
(2,450
|
)
|
—
|
|
||||||
|
Other, net
|
(25
|
)
|
30
|
|
500
|
|
||||||
|
Cash provided by (used for) investing activities
|
80,192
|
|
(110,767
|
)
|
(87,949
|
)
|
||||||
|
Financing activities
|
|
|
|
|
||||||||
|
Proceeds from stock-option exercises, net
|
4,809
|
|
8,702
|
|
9,220
|
|
||||||
|
Excess tax benefits from stock-option exercises and vesting of restricted stock units
|
7,210
|
|
9,525
|
|
7,507
|
|
||||||
|
Common shares repurchased
|
(251,813
|
)
|
(40,672
|
)
|
(3,785
|
)
|
||||||
|
Dividends paid
|
(25,487
|
)
|
(10,041
|
)
|
—
|
|
||||||
|
Other, net
|
105
|
|
(110
|
)
|
(417
|
)
|
||||||
|
Cash provided by (used for) financing activities
|
(265,176
|
)
|
(32,596
|
)
|
12,525
|
|
||||||
|
Effect of exchange rate changes on cash and cash equivalents
|
2,440
|
|
(1,352
|
)
|
1,688
|
|
||||||
|
Net increase (decrease) in cash and cash equivalents
|
(36,548
|
)
|
20,261
|
|
49,680
|
|
||||||
|
Cash and cash equivalents—beginning of period
|
200,437
|
|
180,176
|
|
130,496
|
|
||||||
|
Cash and cash equivalents—end of period
|
$
|
163,889
|
|
$
|
200,437
|
|
$
|
180,176
|
|
|||
|
Supplemental disclosure of cash flow information:
|
|
|
|
|
||||||||
|
Cash paid for income taxes
|
$
|
47,355
|
|
$
|
38,054
|
|
$
|
37,624
|
|
|||
|
Supplemental information of non-cash investing and financing activities:
|
||||||||||||
|
Unrealized gain (loss) on available-for-sale investments
|
$
|
1,723
|
|
$
|
(1,480
|
)
|
$
|
394
|
|
|||
|
Equipment obtained under long-term financing arrangement
|
$
|
4,551
|
|
$
|
—
|
|
$
|
—
|
|
|||
See notes to consolidated financial statements.
92
MORNINGSTAR, INC. AND SUBSIDIARIES
NOTES TO CONSOLIDATED FINANCIAL STATEMENTS
|
1.
|
Description of Business
|
Morningstar, Inc. and its subsidiaries (Morningstar, we, our), is a provider of independent investment research to investors around the world. We offer an extensive line of data, software, and research products for individual investors, financial advisors, and institutional clients. We also offer asset management services for advisors, institutions, and retirement plan participants. We have operations in
27
countries.
2. Correction
In 2012, we identified errors related to purchases of investments and proceeds from maturities and sales of investments included on our Consolidated Statement of Cash Flows for the year ended December 31, 2011 that had not been previously detected. We did not properly disclose the correct total in each category by equal, but offsetting, amounts. The financial statements have been corrected to increase the purchases of investments and proceeds from maturities and sales of investments as shown in the table below. The error existed in the first quarter of 2012, but does not exist in the cumulative statement as of and for the 12 months ended December 31, 2012.
The following table shows our previously reported amounts, the correction, and our as corrected amounts:
|
($000)
|
Previously Reported
|
|
Correction
|
|
As Corrected
|
|
||||||
|
Investing Activities
|
||||||||||||
|
Purchases of investments
|
$
|
(320,193
|
)
|
$
|
(63,088
|
)
|
$
|
(383,281
|
)
|
|||
|
Proceeds from maturities and sales of investments
|
$
|
234,868
|
|
$
|
63,088
|
|
$
|
297,956
|
|
|||
|
Cash used for investing activities
|
$
|
(110,767
|
)
|
$
|
—
|
|
$
|
(110,767
|
)
|
|||
3
. Summary of Significant Accounting Policies
The acronyms that appear in these Notes to our Consolidated Financial Statements refer to the following:
|
ASC
|
Accounting Standards Codification
|
|
ASU
|
Accounting Standards Update
|
|
EITF
|
Emerging Issues Task Force
|
|
FASB
|
Financial Accounting Standards Board
|
|
SEC
|
Securities and Exchange Commission
|
Principles of Consolidation.
We conduct our business operations through wholly owned or majority-owned operating subsidiaries. The accompanying consolidated financial statements include the accounts of Morningstar, Inc. and our subsidiaries. The assets, liabilities, and results of operations of subsidiaries in which we have a controlling interest have been consolidated. All significant intercompany accounts and transactions have been eliminated.
We account and report the noncontrolling (minority) interests in our Consolidated Financial Statements in accordance with FASB ASC 810,
Consolidation
. A noncontrolling interest is the portion of equity (net assets) in a subsidiary not attributable, directly or indirectly, to the parent company. We report the noncontrolling interest in our Consolidated Balance Sheet within equity separate from the shareholders' equity attributable to Morningstar, Inc. In addition, we present the net income (loss) and comprehensive income (loss) attributed to Morningstar, Inc.'s shareholders and the noncontrolling interest in our Consolidated Statements of Income, Consolidated Statements of Comprehensive Income, and Consolidated Statements of Equity.
We account for investments in entities in which we exercise significant influence, but do not control, using the equity method.
93
Through our Investment Management segment (see Note
5
, Segment and Geographical Area Information), we manage certain funds outside of the United States that are considered variable interest entities. For the majority of these variable interest entities, we do not have a variable interest in them. In cases where we do have a variable interest, we are not the primary beneficiary. Accordingly, we do not consolidate any of these variable interest entities.
Comprehensive Income.
In June 2011, the FASB issued ASU No. 2011-05,
Presentation of Comprehensive Income.
In accordance with ASU No. 2011-05, we present the total of comprehensive income, the components of net income, and the components of other comprehensive income (OCI) in two separate but consecutive statements, our Consolidated Statements of Income and separately, our Consolidated Statements of Comprehensive Income. We no longer present total comprehensive income in our Consolidated Statement of Equity.
Use of Estimates.
The preparation of financial statements in conformity with accounting principles generally accepted in the United States requires us to make estimates and assumptions that affect the reported amounts of assets, liabilities, revenues, and expenses during the reporting period. Actual results may differ from these estimates.
Reclassifications
. Certain amounts reported in previous years have been reclassified to conform to the 2012 presentation.
Cash and Cash Equivalents.
Cash and cash equivalents consist of cash and investments with original maturities of three months or less. We state them at cost, which approximates fair value. We state at fair value the portion of our cash equivalents that are invested in money market funds, which are actively traded and have quoted market prices.
Investments.
We account for our investments in accordance with FASB ASC 320,
Investments-Debt and Equity Securities.
We classify our investments into three categories: held-to-maturity, trading, and available-for-sale.
|
•
|
Held-to-maturity: We classify certain investments, primarily certificates of deposit, as held-to-maturity securities, based on our intent and ability to hold these securities to maturity. We record held-to-maturity investments at amortized cost in our Consolidated Balance Sheets.
|
|
•
|
Trading: We classify certain other investments, primarily equity securities, as trading securities, primarily to satisfy the requirements of one of our wholly owned subsidiaries, which is a registered broker-dealer. We include realized and unrealized gains and losses associated with these investments as a component of our operating income in our Consolidated Statements of Income. We record these securities at their fair value in our Consolidated Balance Sheets.
|
|
•
|
Available-for-sale: Investments not considered held-to-maturity or trading securities are classified as available-for-sale securities. Available-for-sale securities primarily consist of fixed-income securities. We report unrealized gains and losses for available-for-sale securities as other comprehensive income (loss), net of related income taxes. We record these securities at their fair value in our Consolidated Balance Sheets.
|
Fair Value Measurements.
We follow FASB ASC 820,
Fair Value Measurements
. FASB ASC 820 defines fair value, establishes a framework for measuring fair value, and expands disclosures about fair value measurements. Under FASB ASC 820, fair value is defined as the price that would be received to sell an asset or paid to transfer a liability in an orderly transaction between market participants at the measurement date. The standard applies whenever other standards require (or permit) assets or liabilities to be measured at fair value. The standard does not expand the use of fair value in any new circumstances and does not require any new fair value measurements.
Effective January 1, 2012, we adopted FASB ASU No. 2011-04,
Fair Value Measurement (Topic 820): Amendments to Achieve Common Fair Value Measurement and Disclosure Requirements in U.S. GAAP and IFRS
. ASU No. 2011-04 clarifies existing fair value measurement and disclosure requirements, amends certain fair value measurement principles, and requires additional disclosures about fair value measurements. The adoption of ASU No. 2011-04 did not have a material impact on our Consolidated Financial Statements.
94
FASB ASC 820 uses a fair value hierarchy based on three broad levels of valuation inputs as described below:
|
•
|
Level 1: Valuations based on quoted prices in active markets for identical assets or liabilities that the company has the ability to access.
|
|
•
|
Level 2: Valuations based on quoted prices in markets that are not active or for which all significant inputs are observable, either directly or indirectly.
|
|
•
|
Level 3: Valuations based on inputs that are unobservable and significant to the overall fair value measurement.
|
We provide additional information about our cash equivalents and investments that are subject to valuation under FASB ASC 820 in Note
6
in these Notes to our Consolidated Financial Statements.
The Fair Value Option for Financial Assets and Financial Liabilities.
FASB ASC 825,
Financial Instruments
, permits entities the option to measure many financial instruments and certain other items at fair value with changes in fair value recognized in earnings each period. FASB ASC 825 allows the fair value option to be elected on an instrument-by-instrument basis when the asset or liability is initially recognized or when there's an event that gives rise to a new basis of accounting for that instrument. We do not apply this fair value option to any of our eligible assets.
Concentration of Credit Risk.
No single customer is large enough to pose a significant credit risk to our operations or financial condition. For the years ended December 31, 2012, 2011, and 2010, no single customer represented 5% or more of our consolidated revenue. If receivables from our customers become delinquent, we begin a collections process. We maintain an allowance for doubtful accounts based on our estimate of the probable losses of accounts receivable.
Property, Equipment, and Depreciation.
We state property and equipment at historical cost, net of accumulated depreciation. We depreciate property and equipment primarily using the straight-line method based on the useful life of the asset, which ranges from
three
to
seven
years. We amortize leasehold improvements over the lease term or their useful lives, whichever is shorter.
Computer Software and Internal Product Development Costs.
We capitalize certain costs in accordance with FASB ASC 350-40,
Internal-Use Software
, FASB ASC 350-50,
Website Development Costs,
and FASB ASC 985,
Software
. Internal product development costs mainly consist of employee costs for developing new web-based products and certain major enhancements of existing products. We amortize these costs on a straight-line basis over the estimated economic life, which is generally
three
years. Capitalized software development costs related to projects that have not been placed into service yet are included in our construction in progress balance.
Business Combinations
. Over the past several years, we have acquired companies that complement our business operations. For each acquisition, we allocate the purchase price to the assets acquired, liabilities assumed, and goodwill. We follow FASB ASC 805,
Business Combinations
. We recognize and measure the fair value of the acquired operation as a whole, and the assets acquired and liabilities assumed at their full fair values as of the date control is obtained, regardless of the percentage ownership in the acquired operation or how the acquisition was achieved. We expense direct costs related to the business combination, such as advisory, accounting, legal, valuation, and other professional fees, as incurred. We recognize restructuring costs, including severance and relocation for employees of the acquired entity, as post-combination expenses unless the target entity meets the criteria of FASB ASC 420,
Exit or Disposal Cost Obligations
on the acquisition date.
As part of the purchase price allocation, we follow the requirements of FASB ASC 740,
Income Taxes.
This includes establishing deferred tax assets or liabilities reflecting the difference between the values assigned for financial statement purposes and values applicable for income tax purposes. In certain acquisitions, the goodwill resulting from the purchase price allocation may not be deductible for income tax purposes. FASB ASC 740 prohibits recognition of a deferred tax asset or liability for temporary differences in goodwill if goodwill is not amortizable and deductible for tax purposes.
95
Goodwill
. Changes in the carrying amount of our recorded goodwill are mainly the result of business acquisitions and divestitures. In accordance with FASB ASC 350,
Intangibles - Goodwill and Other
, we do not amortize goodwill; instead, goodwill is subject to an impairment test annually, or whenever indicators of impairment exist. An impairment would occur if the carrying amount of a reporting unit exceeded the fair value of that reporting unit. In 2011, we altered the definition of our reporting units to align with the definition of our operating segments. This realignment occurred because of our successful efforts to integrate acquired businesses and leverage proprietary content across multiple products. As a result, the businesses that previously represented components of our operating segments no longer met the criteria for recognition as reporting units. Our reporting units constitute businesses for which discrete financial information, which is regularly reviewed by management, is available. We performed annual impairment reviews in the fourth quarter of 2012, 2011, and 2010. We did not record any significant impairment losses in 2012, 2011, and 2010.
Intangible Assets.
We amortize intangible assets using the straight-line method over their estimated economic useful lives, which range from
one
to
25
years. We have no intangible assets with indefinite useful lives. In accordance with FASB ASC 360-10-35,
Subsequent Measurement-Impairment or Disposal of Long Lived Assets
, we review intangible assets for impairment whenever events or changes in circumstances indicate that the carrying value may not be recoverable. If the value of future undiscounted cash flows is less than the carrying amount of an asset, we record an impairment loss based on the excess of the carrying amount over the fair value of the asset. We recorded an impairment loss of approximately
$800,000
in 2011. We did not record any impairment losses in 2012 or 2010. The impairment charge is included in our amortization expense on our Consolidated Statements of Income.
Revenue Recognition
: We recognize revenue in accordance with SEC SAB Topic 13,
Revenue Recognition
, ASC 605-25,
Revenue Recognition: Multiple Element Arrangements
, and ASC 985-605,
Software: Revenue Recognition
.
Effective January 1, 2011, we adopted FASB ASU No. 2009-13,
Revenue Recognition (Topic 605): Multiple-Deliverable Revenue Arrangements
. ASU 2009-13 superseded EITF Issue 00-21,
Revenue Arrangements with Multiple Deliverables
and establishes the accounting and reporting guidance for arrangements when a vendor performs multiple revenue-generating activities, addresses how to separate deliverables, and specifies how to measure and allocate arrangement consideration. We applied this guidance for revenue arrangements entered into or materially modified from January 1, 2011. The adoption of ASU 2009-13 did not significantly affect either the timing or amount of our revenue recognition.
We recognize revenue when all of the following conditions are met:
|
•
|
There is persuasive evidence of an arrangement, as evidenced by a signed contract;
|
|
•
|
Delivery of our products and services is a prerequisite for recognition of revenue. If arrangements include an acceptance provision, we generally begin recognizing revenue upon the receipt of customer acceptance;
|
|
•
|
The amount of fees to be paid by the customer is fixed or determinable; and
|
|
•
|
The collectibility of the fees is reasonably assured.
|
We generate revenue through sales of Morningstar Data, Morningstar Advisor Workstation (including Morningstar Office), Morningstar Direct, Morningstar Equity Research, Premium Membership fees for Morningstar.com, our structured credit research and ratings offerings, and a variety of other investment-related products and services. We generally structure the revenue agreements for these offerings as licenses or subscriptions. We recognize revenue from licenses and subscription sales ratably as we deliver the product or service and over the service obligation period defined by the terms of the customer contract. For new-issue ratings and analysis for CMBS, we charge asset-based fees that are paid by the issuer on the rated balance of the transaction and recognize the revenue immediately upon issuance of the transaction.
We also generate revenue from Internet advertising, primarily from “impression-based” contracts. For advertisers who use our cost-per-impression pricing, we charge fees each time we display their ads on our site.
Investment Advisory Services includes a broad range of services. Pricing for the consulting services is based on the scope of work and the level of service required, and includes asset-based fees for work we perform that involves investment management or acting as a subadvisor to investment portfolios. In arrangements that involve asset-based fees, we generally invoice clients quarterly in arrears based on average assets for the quarter. We recognize asset-based fees once the fees are fixed and determinable assuming all other revenue recognition criteria are met.
96
Our Retirement Solutions offerings help retirement plan participants plan and invest for retirement. We offer these services both through retirement plan providers (typically third-party asset management companies that offer proprietary mutual funds) and directly to plan sponsors (employers that offer retirement plans to their employees). For our Retirement Solutions offerings, we provide both a hosted solution as well as proprietary installed software advice solution. Clients can integrate the installed customized software into their existing systems to help investors accumulate wealth, transition into retirement, and manage income during retirement. The revenue arrangements for Retirement Solutions generally extend over multiple years. Our contracts may include one-time setup fees, implementation fees, technology licensing and maintenance fees, asset-based fees for managed retirement accounts, fixed and variable fees for advice and guidance, or a combination of these fee structures. Upon customer acceptance, we recognize revenue ratably over the term of the agreement. We recognize asset-based fees and variable fees in excess of any minimum once the value is fixed and determinable.
Some of our revenue arrangements with our customers combine multiple products and services. These products and services may be provided at different points in time or over different time periods within the same arrangement. We allocate fees to the separate deliverables based on the deliverables’ relative selling price, which is generally based on the price we charge when the same deliverable is sold separately.
We record taxes imposed on revenue-producing transactions (such as sales, use, value-added, and some excise taxes) on a net basis; therefore, we exclude such taxes from revenue in our Consolidated Statements of Income.
Deferred revenue represents the portion of subscriptions billed or collected in advance of the service being provided, which we expect to recognize as revenue in future periods. Certain arrangements may have cancellation or refund provisions. If we make a refund, it typically reflects the amount collected from a customer for which we have not yet provided services. The refund therefore results in a reduction of deferred revenue.
Advertising Costs.
Advertising costs include expenses incurred for various print and Internet ads, search engine fees, and direct mail campaigns. We expense advertising costs as incurred. The table below summarizes our advertising expense for the past three years:
|
($000)
|
2012
|
|
2011
|
|
2010
|
|
||||||
|
Advertising expense
|
$
|
6,306
|
|
$
|
8,210
|
|
$
|
8,572
|
|
|||
Stock-Based Compensation Expense.
We account for our stock-based compensation expense in accordance with FASB ASC 718,
Compensation—Stock Compensation
. Our stock-based compensation expense reflects grants of restricted stock units, restricted stock, and stock options. We measure the fair value of our restricted stock units and restricted stock on the date of grant based on the closing market price of Morningstar's common stock on the day prior to grant. For stock options granted in 2011, we estimated the fair value of our stock options on the date of grant using a Black-Scholes option-pricing model. We amortize the fair values to stock-based compensation expense, net of estimated forfeitures, ratably over the vesting period.
We estimate expected forfeitures of all employee stock-based awards and recognize compensation cost only for those awards expected to vest. We determine forfeiture rates based on historical experience and adjust the estimated forfeitures to actual forfeiture experience as needed.
Liability for Sabbatical Leave.
In certain of our operations, we offer employees a sabbatical leave. Although the sabbatical policy varies by region, in general, Morningstar's full-time employees are eligible for six weeks of paid time off after four years of continuous service. We account for our sabbatical liability in accordance with FASB ASC 710-10-25
, Compensated Absences
. We record a liability for employees' sabbatical benefits over the period employees earn the right for sabbatical leave.
Income Taxes.
We record deferred income taxes for the temporary differences between the carrying amount of assets and liabilities for financial statement purposes and the amounts used for income tax purposes in accordance with FASB ASC 740,
Income Taxes
. FASB ASC 740 prescribes the minimum recognition threshold a tax position is required to meet before being recognized in the financial statements, and also provides guidance on derecognition, measurement, classification, interest and penalties, accounting in interim periods, and disclosure for uncertain tax positions.
97
We recognize interest and penalties related to unrecognized tax benefits as part of income tax expense in our Consolidated Statements of Income. We classify liabilities related to unrecognized tax benefits as either current liabilities or “Other long-term liabilities” in our Consolidated Balance Sheet, depending on when we expect to make payment.
Income per Share
. We compute and present income per share in accordance with FASB ASC 260,
Earnings Per Share
. The difference between weighted average shares outstanding and diluted shares outstanding primarily reflects the dilutive effect associated with our stock-based compensation plans. Beginning in 2010, we further compute income per share in accordance with FASB ASC 260-10-45-59A,
Participating Securities and the Two Class Method
.
In May 2010, we issued restricted stock in conjunction with the acquisition of Realpoint, LLC (now Morningstar Credit Ratings, LLC). Because the restricted stock contains nonforfeitable rights to dividends, it meets the criteria of a participating security. Under the two-class method, we allocate earnings between common stock and participating securities. The two-class method includes an earnings allocation formula that determines earnings per share for each class of common stock according to dividends declared and undistributed earnings for the period. For purposes of calculating earnings per share, we reduce our reported net earnings by the amount allocated to participating securities to arrive at the earnings allocated to common stock shareholders.
ASC 260-10-45-59A requires the dilutive effect of participating securities to be calculated using the more dilutive of the treasury stock or the two-class method. We have determined the two-class method to be the more dilutive. As such, we adjusted the earnings allocated to common stock shareholders in the basic earnings per share calculation for the reallocation of undistributed earnings to participating securities to calculate diluted earnings per share.
Foreign Currency.
We translate the financial statements of non-U.S. subsidiaries to U.S. dollars using the period-end exchange rate for assets and liabilities and an average exchange rate for revenue and expense. We use the local currency as the functional currency for all of our non-U.S. subsidiaries. We record translation adjustments for non-U.S. subsidiaries as a component of “Other comprehensive income (loss)” in our Consolidated Statements of Comprehensive Income. We include exchange gains and losses arising from transactions denominated in currencies other than the functional currency in “Other income (expense), net” in our Consolidated Statements of Income.
98
4. Income Per Share
The following table shows how we reconcile our net income and the number of shares used in computing basic and diluted income per share:
|
(in thousands, except per share amounts)
|
2012
|
|
2011
|
|
2010
|
|
||||||
|
Basic net income per share attributable to Morningstar, Inc.:
|
||||||||||||
|
Net income attributable to Morningstar, Inc.:
|
$
|
108,079
|
|
$
|
98,357
|
|
$
|
86,370
|
|
|||
|
Less: Distributed earnings available to participating securities
|
(41
|
)
|
(40
|
)
|
(10
|
)
|
||||||
|
Less: Undistributed earnings available to participating securities
|
(47
|
)
|
(259
|
)
|
(335
|
)
|
||||||
|
Numerator for basic net income per share — undistributed and distributed earnings available to common shareholders
|
$
|
107,991
|
|
$
|
98,058
|
|
$
|
86,025
|
|
|||
|
Weighted average common shares outstanding
|
48,497
|
|
50,032
|
|
49,249
|
|
||||||
|
Basic net income per share attributable to Morningstar, Inc.:
|
||||||||||||
|
Continuing operations
|
$
|
2.12
|
|
$
|
1.96
|
|
$
|
1.75
|
|
|||
|
Discontinued operations
|
0.11
|
|
—
|
|
—
|
|
||||||
|
Total
|
$
|
2.23
|
|
$
|
1.96
|
|
$
|
1.75
|
|
|||
|
Diluted net income per share attributable to Morningstar, Inc.:
|
||||||||||||
|
Numerator for basic net income per share — undistributed and distributed earnings available to common shareholders
|
$
|
107,991
|
|
$
|
98,058
|
|
$
|
86,025
|
|
|||
|
Add: Undistributed earnings allocated to participating securities
|
47
|
|
259
|
|
335
|
|
||||||
|
Less: Undistributed earnings reallocated to participating securities
|
(46
|
)
|
(254
|
)
|
(326
|
)
|
||||||
|
Numerator for diluted net income per share — undistributed and distributed earnings available to common shareholders
|
$
|
107,992
|
|
$
|
98,063
|
|
$
|
86,034
|
|
|||
|
|
|
|
|
|||||||||
|
Weighted average common shares outstanding
|
48,497
|
|
50,032
|
|
49,249
|
|
||||||
|
Net effect of dilutive stock options and restricted stock units
|
651
|
|
956
|
|
1,306
|
|
||||||
|
Weighted average common shares outstanding for computing diluted income per share
|
49,148
|
|
50,988
|
|
50,555
|
|
||||||
|
|
|
|
|
|||||||||
|
Diluted net income per share attributable to Morningstar, Inc.:
|
||||||||||||
|
Continuing operations
|
$
|
2.10
|
|
$
|
1.92
|
|
$
|
1.70
|
|
|||
|
Discontinued operations
|
0.10
|
|
—
|
|
—
|
|
||||||
|
Total
|
$
|
2.20
|
|
$
|
1.92
|
|
$
|
1.70
|
|
|||
The following table shows the number of weighted average stock options, restricted stock units, and restricted stock excluded from our calculation of diluted earnings per share from both continuing operations and net earnings because their inclusion would have been anti-dilutive:
|
(in thousands)
|
2012
|
|
2011
|
|
2010
|
|
|||
|
Weighted Average stock options
|
83
|
|
55
|
|
—
|
|
|||
|
Weighted average restricted stock units
|
7
|
|
—
|
|
—
|
|
|||
|
Weighted average restricted stock
|
—
|
|
—
|
|
—
|
|
|||
|
Total
|
90
|
|
55
|
|
—
|
|
|||
These stock options and restricted stock units could be included in the calculation in the future.
99
5. Segment and Geographical Area Information
Morningstar has two operating segments:
|
•
|
Investment Information.
The Investment Information segment includes all of our data, software, and research products and services. These products are typically sold through subscriptions or license agreements.
|
The largest products in this segment based on revenue are Morningstar Data (formerly Licensed Data), Morningstar Advisor Workstation (including Morningstar Office), Morningstar Direct, Morningstar.com, Morningstar Integrated Web Tools, and Morningstar Principia. Morningstar Data is a set of investment data spanning all of our investment databases, including real-time pricing and commodity data, and is available through electronic data feeds. Advisor Workstation is a web-based investment planning system for advisors. Advisor Workstation is available in two editions: Morningstar Office for independent financial advisors and an enterprise edition for financial advisors affiliated with larger firms. Morningstar Direct is a web-based institutional research platform. Morningstar.com includes both Premium Memberships and Internet advertising sales. Morningstar Integrated Web Tools is a set of services that helps institutional clients build customized websites or enhance their existing sites with Morningstar’s online tools and components. Principia is our CD-ROM-based investment research and planning software for advisors.
The Investment Information segment also includes Morningstar Equity Research, which we distribute through several channels. We sell Morningstar Equity Research to companies that purchase our research for their own use or provide our research to their affiliated advisors or individual investor clients.
The Investment Information segment also includes Morningstar Credit Research and Morningstar Structured Credit Ratings. The latter is provided by Morningstar Credit Ratings, LLC, a Nationally Recognized Statistical Rating Organization specializing in structured finance. It offers securities ratings, research, surveillance services, and data to help institutional investors identify risk in commercial mortgage-backed securities (CMBS).
We also offer a variety of financial communications and newsletters, other institutional and advisor software, and investment indexes.
|
•
|
Investment Management.
The Investment Management segment includes all of our asset management operations, which earn the majority of their revenue from asset-based fees.
|
The key products and services in this segment based on revenue are Investment Advisory Services (formerly Investment Consulting), which focuses on investment monitoring and asset allocation for funds of funds, including mutual funds and variable annuities; Retirement Solutions, including the Morningstar Retirement Manager and Advice by Ibbotson platforms; and Morningstar Managed Portfolios, a fee-based discretionary asset management service that includes a series of mutual fund, exchange-traded fund, and stock portfolios tailored to meet a range of investment time horizons and risk levels that financial advisors can use for their clients' taxable and tax-deferred accounts. In addition, we offer Managed Portfolios through our subsidiary Ibbotson Australia which provides asset management services primarily to institutional clients and individual investors.
100
Our segment accounting policies are the same as those described in Note
3
, except for the capitalization and amortization of internal product development costs, amortization of intangible assets, and costs related to corporate functions. We exclude these items from our operating segment results to provide our chief operating decision maker with a better indication of each segment’s ability to generate cash flow. This information is one of the criteria used by our chief operating decision maker in determining how to allocate resources to each segment. We include capitalization and amortization of internal product development costs, amortization of intangible assets, and costs related to corporate functions in the Corporate Items category. Our segment disclosures are consistent with the business segment information provided to our chief operating decision maker on a recurring basis; for that reason, we don’t present balance sheet information by segment. We disclose goodwill by segment in accordance with the requirements of FASB ASC 350-20-50,
Intangibles - Goodwill - Disclosure.
The following tables present information about our operating segments:
|
2012 Segment Information
|
||||||||||||||||
|
|
Year ended December 31, 2012
|
|||||||||||||||
|
($000)
|
Investment
Information
|
|
Investment
Management
|
|
Corporate Items
|
|
Total
|
|
||||||||
|
External revenue
|
$
|
529,984
|
|
$
|
128,304
|
|
$
|
—
|
|
$
|
658,288
|
|
||||
|
Operating expense, excluding stock-based compensation expense, depreciation, and amortization
|
356,165
|
|
64,765
|
|
24,689
|
|
445,619
|
|
||||||||
|
Stock-based compensation expense
|
13,831
|
|
2,278
|
|
2,796
|
|
18,905
|
|
||||||||
|
Depreciation and amortization
|
9,288
|
|
134
|
|
33,674
|
|
43,096
|
|
||||||||
|
Operating income (loss)
|
$
|
150,700
|
|
$
|
61,127
|
|
$
|
(61,159
|
)
|
$
|
150,668
|
|
||||
|
U.S. capital expenditures
|
|
|
|
|
$
|
22,280
|
|
|||||||||
|
Non-U.S. capital expenditures
|
|
|
|
|
|
|
$
|
7,759
|
|
|||||||
|
U.S. revenue
|
|
|
|
|
|
|
$
|
466,947
|
|
|||||||
|
Non-U.S. revenue
|
|
|
|
|
|
|
$
|
191,341
|
|
|||||||
|
As of December 31, 2012
|
||||||||||||||||
|
($000)
|
Investment
Information
|
|
Investment
Management
|
|
Corporate Items
|
|
Total
|
|
||||||||
|
Goodwill
|
$
|
279,164
|
|
$
|
41,681
|
|
$
|
—
|
|
$
|
320,845
|
|
||||
|
U.S. long-lived assets
|
$
|
60,371
|
|
|||||||||||||
|
Non-U.S. long-lived assets
|
$
|
23,651
|
|
|||||||||||||
101
|
2011 Segment Information
|
||||||||||||||||
|
|
Year ended December 31, 2011
|
|||||||||||||||
|
($000)
|
Investment
Information
|
|
Investment
Management
|
|
Corporate Items
|
|
Total
|
|
||||||||
|
External revenue
|
$
|
500,909
|
|
$
|
130,491
|
|
$
|
—
|
|
$
|
631,400
|
|
||||
|
Operating expense, excluding stock-based compensation expense, depreciation, and amortization
|
351,194
|
|
58,596
|
|
24,979
|
|
434,769
|
|
||||||||
|
Stock-based compensation expense
|
10,113
|
|
2,080
|
|
3,110
|
|
15,303
|
|
||||||||
|
Depreciation and amortization
|
8,088
|
|
166
|
|
34,659
|
|
42,913
|
|
||||||||
|
Operating income (loss)
|
$
|
131,514
|
|
$
|
69,649
|
|
$
|
(62,748
|
)
|
$
|
138,415
|
|
||||
|
U.S. capital expenditures
|
|
|
|
|
|
|
$
|
13,816
|
|
|||||||
|
Non-U.S. capital expenditures
|
|
|
|
|
|
|
$
|
9,506
|
|
|||||||
|
U.S. revenue
|
|
|
|
|
|
|
$
|
446,470
|
|
|||||||
|
Non-U.S. revenue
|
|
|
|
|
|
|
$
|
184,930
|
|
|||||||
|
|
As of December 31, 2011
|
|||||||||||||||
|
($000)
|
Investment
Information
|
|
Investment
Management
|
|
Corporate Items
|
|
Total
|
|
||||||||
|
Goodwill
|
$
|
277,059
|
|
$
|
41,433
|
|
$
|
—
|
|
$
|
318,492
|
|
||||
|
U.S. long-lived assets
|
|
|
|
|
|
|
$
|
44,572
|
|
|||||||
|
Non-U.S. long-lived assets
|
|
|
|
|
|
|
$
|
23,624
|
|
|||||||
|
2010 Segment Information
|
||||||||||||||||
|
|
Year ended December 31, 2010
|
|||||||||||||||
|
($000)
|
Investment
Information
|
|
Investment
Management
|
|
Corporate Items
|
Total
|
|
|||||||||
|
External revenue
|
$
|
444,957
|
|
$
|
110,394
|
|
$
|
—
|
|
$
|
555,351
|
|
||||
|
Operating expense, excluding stock-based compensation expense, depreciation, and amortization
|
301,722
|
|
51,361
|
|
27,752
|
|
380,835
|
|
||||||||
|
Stock-based compensation expense
|
8,110
|
|
2,032
|
|
3,651
|
|
13,793
|
|
||||||||
|
Depreciation and amortization
|
7,385
|
|
185
|
|
32,094
|
|
39,664
|
|
||||||||
|
Operating income (loss)
|
$
|
127,740
|
|
$
|
56,816
|
|
$
|
(63,497
|
)
|
$
|
121,059
|
|
||||
|
U.S. capital expenditures
|
|
|
|
$
|
5,067
|
|
||||||||||
|
Non-U.S. capital expenditures
|
|
|
|
$
|
9,704
|
|
||||||||||
|
U.S. revenue
|
|
|
|
$
|
398,215
|
|
||||||||||
|
Non-U.S. revenue
|
|
|
|
$
|
157,136
|
|
||||||||||
|
As of December 31, 2010
|
||||||||||||||||
|
($000)
|
Investment
Information
|
|
Investment
Management
|
|
Corporate Items
|
|
Total
|
|
||||||||
|
Goodwill
|
$
|
275,611
|
|
$
|
42,050
|
|
$
|
—
|
|
$
|
317,661
|
|
||||
|
U.S. long-lived assets
|
$
|
39,496
|
|
|||||||||||||
|
Non-U.S. long-lived assets
|
$
|
22,609
|
|
|||||||||||||
102
Information by geographical region is as follows:
|
External revenue by geographic region
|
|||||||||||||
|
Year ended December 31
|
|||||||||||||
|
($000)
|
2012
|
|
2011
|
|
2010
|
|
|||||||
|
United States
|
$
|
466,947
|
|
$
|
446,470
|
|
$
|
398,215
|
|
||||
|
United Kingdom
|
56,794
|
|
53,427
|
|
43,797
|
|
|||||||
|
Europe, excluding the United Kingdom
|
49,844
|
|
49,507
|
|
39,851
|
|
|||||||
|
Australia
|
38,229
|
|
39,761
|
|
35,638
|
|
|||||||
|
Canada
|
30,664
|
|
27,808
|
|
25,533
|
|
|||||||
|
Asia, excluding Japan
|
9,934
|
|
9,240
|
|
7,855
|
|
|||||||
|
Japan
|
3,831
|
|
3,948
|
|
3,871
|
|
|||||||
|
Other
|
2,045
|
|
1,239
|
|
591
|
|
|||||||
|
Total
|
$
|
658,288
|
|
$
|
631,400
|
|
$
|
555,351
|
|
||||
|
Long-lived assets by geographic region
|
||||||||||||
|
As of December 31
|
||||||||||||
|
($000)
|
2012
|
|
2011
|
|
2010
|
|
||||||
|
United States
|
$
|
60,371
|
|
$
|
44,572
|
|
39,496
|
|
||||
|
United Kingdom
|
7,435
|
|
7,512
|
|
5,960
|
|
||||||
|
Europe, excluding the United Kingdom
|
2,356
|
|
2,629
|
|
3,479
|
|
||||||
|
Australia
|
1,402
|
|
1,415
|
|
1,554
|
|
||||||
|
Canada
|
1,773
|
|
2,076
|
|
2,395
|
|
||||||
|
Asia, excluding Japan
|
10,445
|
|
9,656
|
|
8,874
|
|
||||||
|
Japan
|
84
|
|
282
|
|
233
|
|
||||||
|
Other
|
156
|
|
54
|
|
114
|
|
||||||
|
Total
|
$
|
84,022
|
|
$
|
68,196
|
|
62,105
|
|
||||
6. Investments and Fair Value Measurements
We account for our investments in accordance with FASB ASC 320,
Investments—Debt and Equity Securities.
We classify our investments in three categories: available-for-sale, held-to-maturity, and trading. We monitor the concentration, diversification, maturity, and liquidity of our investment portfolio, which is primarily invested in fixed-income securities, and classify our investment portfolio as shown below:
|
As of December 31
|
||||||||
|
($000)
|
2012
|
|
2011
|
|
||||
|
Available-for-sale
|
$
|
125,786
|
|
$
|
247,917
|
|
||
|
Held-to-maturity
|
26,357
|
|
16,347
|
|
||||
|
Trading securities
|
5,386
|
|
5,491
|
|
||||
|
Total
|
$
|
157,529
|
|
$
|
269,755
|
|
||
103
The following table shows the cost, unrealized gains (losses), and fair values related to investments classified as available-for-sale and held-to-maturity:
|
|
As of December 31, 2012
|
As of December 31, 2011
|
||||||||||||||||||||||||||||||
|
($000)
|
Cost
|
|
Unrealized
Gain
|
|
Unrealized
Loss
|
|
Fair
Value
|
|
Cost
|
|
Unrealized
Gain
|
|
Unrealized
Loss
|
|
Fair
Value
|
|
||||||||||||||||
|
Available-for-sale:
|
|
|
|
|
|
|
|
|
|
|
|
|
|
|
|
|
||||||||||||||||
|
Government obligations
|
$
|
40,669
|
|
$
|
29
|
|
$
|
(608
|
)
|
$
|
40,090
|
|
$
|
139,099
|
|
$
|
72
|
|
$
|
(402
|
)
|
$
|
138,769
|
|
||||||||
|
Corporate bonds
|
49,339
|
|
36
|
|
(292
|
)
|
49,083
|
|
61,589
|
|
14
|
|
(280
|
)
|
61,323
|
|
||||||||||||||||
|
Foreign obligations
|
2,437
|
|
1
|
|
(19
|
)
|
2,419
|
|
—
|
|
—
|
|
—
|
|
—
|
|
||||||||||||||||
|
Commercial paper
|
2,000
|
|
—
|
|
—
|
|
2,000
|
|
29,964
|
|
2
|
|
(7
|
)
|
29,959
|
|
||||||||||||||||
|
Equity securities and exchange-traded funds
|
19,613
|
|
1,359
|
|
(323
|
)
|
20,649
|
|
8,461
|
|
368
|
|
(558
|
)
|
8,271
|
|
||||||||||||||||
|
Mutual funds
|
10,499
|
|
1,092
|
|
(46
|
)
|
11,545
|
|
9,298
|
|
363
|
|
(66
|
)
|
9,595
|
|
||||||||||||||||
|
Total
|
$
|
124,557
|
|
$
|
2,517
|
|
$
|
(1,288
|
)
|
125,786
|
|
$
|
248,411
|
|
$
|
819
|
|
$
|
(1,313
|
)
|
$
|
247,917
|
|
|||||||||
|
Held-to-maturity:
|
|
|
|
|
|
|
|
|
|
|
|
|
|
|
|
|
||||||||||||||||
|
Certificates of deposit
|
$
|
26,357
|
|
$
|
—
|
|
$
|
—
|
|
$
|
26,357
|
|
$
|
16,347
|
|
$
|
—
|
|
$
|
—
|
|
$
|
16,347
|
|
||||||||
As of
December 31, 2012
and
December 31, 2011
, investments with unrealized losses for greater than a 12-month period were not material to the Consolidated Balance Sheets and were not deemed to have other than temporary declines in value.
The table below shows the cost and fair value of investments classified as available-for-sale and held-to-maturity based on their contractual maturities as of
December 31, 2012
and
December 31, 2011
. The expected maturities of certain fixed-income securities may differ from their contractual maturities because some of these holdings have call features that allow the issuers the right to prepay obligations without penalties.
|
|
As of December 31, 2012
|
As of December 31, 2011
|
||||||||||||||
|
($000)
|
Cost
|
|
Fair Value
|
|
Cost
|
|
Fair Value
|
|
||||||||
|
Available-for-sale:
|
|
|
|
|
|
|
|
|
||||||||
|
Due in one year or less
|
$
|
87,599
|
|
$
|
86,784
|
|
$
|
155,651
|
|
$
|
155,247
|
|
||||
|
Due in one to two years
|
6,846
|
|
6,808
|
|
75,001
|
|
74,804
|
|
||||||||
|
Equity securities, exchange-traded funds, and mutual funds
|
30,112
|
|
32,194
|
|
17,759
|
|
17,866
|
|
||||||||
|
Total
|
$
|
124,557
|
|
$
|
125,786
|
|
$
|
248,411
|
|
$
|
247,917
|
|
||||
|
Held-to-maturity:
|
|
|
|
|
|
|
|
|
||||||||
|
Due in one year or less
|
$
|
26,352
|
|
$
|
26,352
|
|
$
|
16,342
|
|
$
|
16,342
|
|
||||
|
Due in one to three years
|
5
|
|
5
|
|
5
|
|
5
|
|
||||||||
|
Total
|
$
|
26,357
|
|
$
|
26,357
|
|
$
|
16,347
|
|
$
|
16,347
|
|
||||
As of
December 31, 2012
and
December 31, 2011
, held-to-maturity investments included a
$1,500,000
and a
$1,600,000
certificate of deposit, respectively, held primarily as collateral against bank guarantees for our office leases, primarily in Australia.
104
The following table shows the realized gains and losses arising from sales of our investments classified as available-for-sale recorded in our Consolidated Statements of Income:
|
($000)
|
2012
|
|
2011
|
|
2010
|
|
||||||
|
Realized gains
|
$
|
1,671
|
|
$
|
761
|
|
$
|
276
|
|
|||
|
Realized losses
|
(1,133
|
)
|
(501
|
)
|
(1
|
)
|
||||||
|
Realized gains, net
|
$
|
538
|
|
$
|
260
|
|
$
|
275
|
|
|||
We determine realized gains and losses using the specific identification method.
The following table shows the net unrealized gains (losses) on trading securities as recorded in our Consolidated Statements of Income:
|
($000)
|
2012
|
|
2011
|
|
2010
|
|
||||||
|
Unrealized gains (losses), net
|
$
|
269
|
|
$
|
(387
|
)
|
$
|
237
|
|
|||
The fair value of our assets subject to fair value measurements and that are measured at fair value on a recurring basis using the fair value hierarchy and the necessary disclosures under FASB ASC 820,
Fair Value Measurement
, are as follows:
|
|
Fair Value
|
Fair Value Measurements as of December 31, 2012
|
||||||||||||||
|
|
as of
|
Using Fair Value Hierarchy
|
||||||||||||||
|
($000)
|
December 31, 2012
|
Level 1
|
|
Level 2
|
|
Level 3
|
|
|||||||||
|
Available-for-sale investments
|
|
|
|
|
|
|
|
|
||||||||
|
Government obligations
|
$
|
40,090
|
|
$
|
—
|
|
$
|
40,090
|
|
$
|
—
|
|
||||
|
Corporate bonds
|
49,083
|
|
—
|
|
49,083
|
|
—
|
|
||||||||
|
Foreign obligations
|
2,419
|
|
—
|
|
2,419
|
|
—
|
|
||||||||
|
Commercial paper
|
2,000
|
|
—
|
|
2,000
|
|
—
|
|
||||||||
|
Equity securities and exchange-traded funds
|
20,649
|
|
20,649
|
|
—
|
|
—
|
|
||||||||
|
Mutual funds
|
11,545
|
|
11,545
|
|
—
|
|
—
|
|
||||||||
|
Trading securities
|
5,386
|
|
5,386
|
|
—
|
|
—
|
|
||||||||
|
Cash equivalents
|
398
|
|
398
|
|
—
|
|
—
|
|
||||||||
|
Total
|
$
|
131,570
|
|
$
|
37,978
|
|
$
|
93,592
|
|
$
|
—
|
|
||||
|
|
Fair Value
|
Fair Value Measurements as of December 31, 2011
|
||||||||||||||
|
|
as of
|
Using Fair Value Hierarchy
|
||||||||||||||
|
($000)
|
December 31, 2011
|
Level 1
|
|
Level 2
|
|
Level 3
|
|
|||||||||
|
Available-for-sale investments
|
|
|
|
|
|
|
|
|
||||||||
|
Government obligations
|
$
|
138,769
|
|
$
|
—
|
|
$
|
138,769
|
|
$
|
—
|
|
||||
|
Corporate bonds
|
61,323
|
|
—
|
|
61,323
|
|
—
|
|
||||||||
|
Commercial paper
|
29,959
|
|
—
|
|
29,959
|
|
—
|
|
||||||||
|
Equity securities and exchange-traded funds
|
8,271
|
|
8,271
|
|
—
|
|
—
|
|
||||||||
|
Mutual funds
|
9,595
|
|
9,595
|
|
—
|
|
—
|
|
||||||||
|
Trading securities
|
5,491
|
|
5,491
|
|
—
|
|
—
|
|
||||||||
|
Cash equivalents
|
30,818
|
|
30,818
|
|
—
|
|
—
|
|
||||||||
|
Total
|
$
|
284,226
|
|
$
|
54,175
|
|
$
|
230,051
|
|
$
|
—
|
|
||||
|
Level 1:
|
Valuations based on quoted prices in active markets for identical assets or liabilities that we have the ability to access.
|
|
Level 2:
|
Valuations based on quoted prices in markets that are not active or for which all significant inputs are observable, either directly or indirectly.
|
105
|
Level 3:
|
Valuations based on inputs that are unobservable and significant to the overall fair value measurement.
|
Based on our analysis of the nature and risks of our investments in equity securities and mutual funds, we have determined that presenting these investment categories each in the aggregate is appropriate.
There were no transfers between levels one and two during the year ended December 31, 2012.
We measure the fair value of money market funds, equity securities, and exchange-traded funds based on quoted prices in active markets for identical assets or liabilities. All other financial instruments were valued either based on recent trades of securities in inactive markets or based on quoted market prices of similar instruments and other significant inputs derived from observable market data. We did not hold any securities categorized as Level 3 as of December 31, 2012 and December 31, 2011.
7. Acquisitions, Goodwill, and Other Intangible Assets
2012
and 2011 Acquisitions
We did not complete any acquisitions in 2012 and 2011.
2010
Acquisitions
Aegis Equities Research
In April 2010, we acquired Aegis Equities Research, a provider of independent equity research in Australia, for
$10,269,000
in cash, net of cash acquired. We began including the financial results of this acquisition in our Consolidated Financial Statements on April 1, 2010. The following table summarizes our allocation of the purchase price to the estimated fair values of the assets acquired and liabilities assumed at the date of acquisition:
|
($000)
|
|
|||
|
Cash and cash equivalents
|
$
|
51
|
|
|
|
Investments
|
55
|
|
||
|
Accounts receivable
|
198
|
|
||
|
Other non-current assets
|
62
|
|
||
|
Intangible assets
|
5,801
|
|
||
|
Goodwill
|
5,117
|
|
||
|
Deferred revenue
|
(617
|
)
|
||
|
Other current and non-current liabilities
|
(347
|
)
|
||
|
Total purchase price
|
$
|
10,320
|
|
|
The allocation includes
$5,801,000
of acquired intangible assets, as follows:
|
($000)
|
|
Weighted Average Useful Life (years)
|
||||
|
Customer-related assets
|
$
|
1,879
|
|
10
|
||
|
Technology-based assets
|
3,253
|
|
6
|
|||
|
Intellectual property (trademarks and trade names)
|
46
|
|
1
|
|||
|
Non-competition agreement
|
623
|
|
3
|
|||
|
Total intangible assets
|
$
|
5,801
|
|
7
|
||
106
Goodwill of
$5,117,000
represents the premium we paid over the fair value of the net tangible and intangible assets acquired with this acquisition. We paid this premium for a number of reasons, including the strategic benefits of creating a larger analyst team that will enable us to expand our coverage of Australian-listed companies, provide Australian clients with more robust independent research, and give us the potential to expand our services in multiple delivery channels. Approximately
$1,787,000
of the intangible assets is deductible for income tax purposes over a period of approximately
three
years from the acquisition date.
Old Broad Street Research Ltd
In April 2010, we acquired Old Broad Street Research Ltd. (OBSR) for
$17,937,000
in cash, net of cash acquired. OBSR is a provider of fund research, ratings, and investment consulting services in the United Kingdom and offers an array of customized consulting services including model portfolios, advice on fund construction, and corporate governance services that are used by many of the leading financial advisers and fund platforms. We began including the financial results of this acquisition in our Consolidated Financial Statements on April 12, 2010.
The following table summarizes our allocation of the purchase price to the estimated fair values of the assets acquired and liabilities assumed at the date of acquisition:
|
($000)
|
|
|||
|
Cash and cash equivalents
|
$
|
4,632
|
|
|
|
Accounts receivable and other current assets
|
986
|
|
||
|
Other non-current assets
|
1,632
|
|
||
|
Intangible assets
|
9,266
|
|
||
|
Goodwill
|
12,422
|
|
||
|
Deferred revenue
|
(2,633
|
)
|
||
|
Accounts payable and accrued and other current liabilities
|
(1,342
|
)
|
||
|
Deferred tax liability--non-current
|
(2,317
|
)
|
||
|
Other non-current liabilities
|
(77
|
)
|
||
|
Total purchase price
|
$
|
22,569
|
|
|
The allocation includes
$9,266,000
of acquired intangible assets, as follows:
|
($000)
|
|
Weighted Average Useful Life (years)
|
||||
|
Customer-related assets
|
$
|
7,073
|
|
13
|
||
|
Technology-based assets
|
1,424
|
|
5
|
|||
|
Intellectual property (trademarks and trade names)
|
769
|
|
10
|
|||
|
Total intangible assets
|
$
|
9,266
|
|
12
|
||
Goodwill of
$12,422,000
represents the premium we paid over the fair value of the acquired net tangible and intangible assets. We paid this premium for a number of reasons, including the strategic benefit of adding to our existing fund research team in London and continuing to build our thought leadership in investment research. OBSR will also help us expand our investment consulting presence in the United Kingdom, where we already provide asset allocation, manager selection, and portfolio construction services to institutions and intermediaries.
The deferred tax liability of
$2,317,000
is primarily because the amortization expense related to intangible assets is not deductible for income tax purposes.
107
Realpoint, LLC
In May 2010, we acquired Realpoint, LLC (Realpoint), a Nationally Recognized Statistical Rating Organization (NRSRO) that specializes in structured finance. Realpoint offers securities ratings, research, surveillance services, and data to help institutional investors identify credit risk in commercial mortgage-backed securities. Institutional investment firms subscribe to Realpoint's ratings and analytics, including money managers who invest in commercial mortgage-backed securities. We began including the financial results of this acquisition in our Consolidated Financial Statements on May 3, 2010. In 2011, we renamed Realpoint as Morningstar Credit Ratings, LLC.
In conjunction with this acquisition, we paid
$38,327,000
in cash, net of cash acquired, and issued
199,174
shares of restricted stock to the selling employee-shareholders. Because of the terms of the restricted share agreements and in accordance with FASB ASC 805,
Business Combinations
, we account for these grants as stock-based compensation expense and not as part of the acquisition consideration. See Note
12
for additional information concerning the accounting for this restricted stock.
The following table summarizes our allocation of the purchase price to the estimated fair values of the assets acquired and liabilities assumed at the date of acquisition:
|
($000)
|
|
|||
|
Cash and cash equivalents
|
$
|
5,489
|
|
|
|
Accounts receivable and other current assets
|
3,567
|
|
||
|
Other non-current assets
|
738
|
|
||
|
Deferred tax asset--non-current
|
195
|
|
||
|
Intangible assets
|
19,120
|
|
||
|
Goodwill
|
24,903
|
|
||
|
Deferred revenue
|
(7,316
|
)
|
||
|
Accounts payable and accrued and other current liabilities
|
(2,785
|
)
|
||
|
Other non-current liabilities
|
(95
|
)
|
||
|
Total purchase price
|
$
|
43,816
|
|
|
The allocation includes
$19,120,000
of acquired intangible assets, as follows:
|
($000)
|
|
Weighted Average Useful Life (years)
|
||||
|
Customer-related assets
|
$
|
5,000
|
|
10
|
||
|
Technology-based assets
|
13,610
|
|
10
|
|||
|
Intellectual property (trademarks and trade names)
|
300
|
|
1
|
|||
|
Non-competition agreement
|
210
|
|
6
|
|||
|
Total intangible assets
|
$
|
19,120
|
|
10
|
||
Goodwill of
$24,903,000
represents the premium we paid over the fair value of the acquired net tangible and intangible assets. We paid this premium for a number of reasons, including the opportunity for Morningstar to enter the structured finance ratings and analysis business.
The value assigned to goodwill, intangible assets, and restricted stock at the date of grant are deductible for income tax purposes over a period of approximately 15 years from the acquisition date.
108
Increased Ownership Interest in Morningstar Danmark A/S
In July 2010, we acquired an additional
75%
interest in Morningstar Danmark A/S (Morningstar Denmark), increasing our ownership to
100%
from
25%
. Morningstar Denmark's main offering is the investment information website for individual investors, Morningstar.dk, which provides fund and ETF data, portfolio tools, and market analysis. We began consolidating the financial results of this acquisition in our Consolidated Financial Statements on July 1, 2010.
Morningstar Denmark's total estimated fair value of
$20,192,000
includes
$15,467,000
in cash paid to acquire the remaining 75% interest in Morningstar Denmark and
$4,725,000
related to the 25% of Morningstar Denmark we previously held. We determined the fair value of the previously held 25% investment independent of the acquired controlling interest and recorded a non-cash holding gain of
$4,564,000
. The following table summarizes our allocation of the estimated fair values of the assets acquired and liabilities assumed at the date of acquisition:
|
($000)
|
|
|||
|
Cash and cash equivalents
|
$
|
915
|
|
|
|
Accounts receivable and other current assets
|
632
|
|
||
|
Other non-current assets
|
65
|
|
||
|
Intangible assets
|
9,854
|
|
||
|
Goodwill
|
12,342
|
|
||
|
Deferred revenue
|
(496
|
)
|
||
|
Deferred tax liability
|
(2,504
|
)
|
||
|
Other current and non-current liabilities
|
(616
|
)
|
||
|
Total fair value of Morningstar Denmark
|
$
|
20,192
|
|
|
The allocation includes
$9,854,000
of acquired intangible assets, as follows:
|
($000)
|
|
Weighted Average Useful Life (years)
|
||||
|
Customer-related assets
|
$
|
9,130
|
|
14
|
||
|
Technology-based assets
|
724
|
|
6
|
|||
|
Total intangible assets
|
$
|
9,854
|
|
13
|
||
We recognized a deferred tax liability of
$2,504,000
mainly because the amortization expense related to certain intangible assets is not deductible for income tax purposes.
Goodwill of
$12,342,000
represents the premium over the fair value of the net tangible and intangible assets acquired with this acquisition. We paid this premium for a number of reasons, including the opportunity to offer Morningstar's full suite of products and services to investors in Denmark and further leveraging Morningstar's global reach, investment databases, and technology expertise.
Annuity intelligence business of Advanced Sales and Marketing Corporation (ASMC)
In November 2010, we acquired the annuity intelligence business of Advanced Sales and Marketing Corporation (ASMC) for
$14,113,000
in cash. The acquisition includes the Annuity Intelligence Report (AI Report), a web-based service that helps broker-dealers, insurers, and the financial professionals they support better understand and more effectively present variable annuity products to their clients. The AI Report service leverages a proprietary database of more than 1,000 variable annuities that includes “plain-English” translations of complex but important information found in prospectuses and other public filings. We began including the financial results of this acquisition in our Consolidated Financial Statements on November 1, 2010.
109
The following table summarizes our allocation of the purchase price to the estimated fair values of the assets acquired and liabilities assumed at the date of acquisition:
|
($000)
|
|
|||
|
Accounts receivable and other current assets
|
$
|
163
|
|
|
|
Other non-current assets
|
9
|
|
||
|
Intangible assets
|
6,300
|
|
||
|
Goodwill
|
9,028
|
|
||
|
Deferred revenue
|
(1,364
|
)
|
||
|
Accounts payable and accrued and other current liabilities
|
(23
|
)
|
||
|
Total purchase price
|
$
|
14,113
|
|
|
The allocation includes
$6,300,000
of acquired intangible assets, as follows:
|
($000)
|
|
Weighted Average Useful Life (years)
|
||||
|
Customer-related assets
|
$
|
4,100
|
|
20
|
||
|
Technology-based assets
|
2,100
|
|
9
|
|||
|
Intellectual property (trademarks and trade names)
|
100
|
|
10
|
|||
|
Total intangible assets
|
$
|
6,300
|
|
16
|
||
The goodwill value of
$9,028,000
represents the premium we paid over the fair value of the acquired net tangible and intangible assets. We paid this premium for a number of reasons, including the opportunity to combine Morningstar's strength in variable annuity subaccount data and modeling tools with AI Report's product-level data and proprietary methodologies.
The value assigned to goodwill and intangible assets are deductible for income tax purposes over a period of approximately
15
years from the acquisition date.
Other Acquisitions in 2010
We also completed two other acquisitions in 2010:
|
•
|
Footnoted business of Financial Fineprint Inc.: In February 2010, we acquired the Footnoted business of Financial Fineprint Inc. (Footnoted), a blog for professional money managers, analysts, and individual investors. Footnoted Pro, a service for institutional investors, provides insight on actionable items and trends in SEC filings. The acquisition includes the Footnoted.org website and the Footnoted Pro service. We began including the financial results of this acquisition in our Consolidated Financial Statements on February 1, 2010.
|
|
•
|
Seeds Group: In July 2010, we acquired Seeds Group (Seeds), a leading provider of investment consulting services and fund research in France. Through its subsidiary Seeds Finance, Seeds provides investment consulting services and specializes in asset liability management, manager selection, plan construction, risk, and portfolio management in alternative investments and active strategies. Its subsidiary, Multiratings.com, provides a fund research and investment education website for advisor groups and institutions. We began including the financial results of this acquisition in our Consolidated Financial Statements on July 1, 2010.
|
The combined purchase price for these two acquisitions was
$6,113,000
less acquired cash.
110
For these two acquisitions, the following table summarizes our allocation of the purchase price to the estimated fair values of the assets acquired and liabilities assumed at the dates of acquisition:
|
($000)
|
|
|||
|
Cash
|
$
|
1,442
|
|
|
|
Accounts receivable and other current assets
|
939
|
|
||
|
Other non-current assets
|
179
|
|
||
|
Intangible assets
|
2,661
|
|
||
|
Goodwill
|
3,869
|
|
||
|
Deferred revenue
|
(159
|
)
|
||
|
Accounts payable and accrued and other current liabilities
|
(576
|
)
|
||
|
Deferred tax liability--non-current
|
(800
|
)
|
||
|
Total purchase price
|
$
|
7,555
|
|
|
The allocation includes
$2,661,000
of acquired intangible assets, as follows:
|
($000)
|
|
Weighted Average Useful Life (years)
|
||||
|
Customer-related assets
|
$
|
1,835
|
|
10
|
||
|
Technology-based assets
|
447
|
|
4
|
|||
|
Intellectual property (trademarks and trade names)
|
379
|
|
10
|
|||
|
Total intangible assets
|
$
|
2,661
|
|
9
|
||
Goodwill
The following table shows the changes in our goodwill balances from January 1,
2011
to
December 31, 2012
:
|
|
($000)
|
|
|
|
Balance as of January 1, 2011
|
$
|
317,661
|
|
|
Adjustments to 2010 Acquisitions:
|
|||
|
Acquisition of Aegis Equities Research
|
(417
|
)
|
|
|
Acquisition of Realpoint, LLC
|
1,800
|
|
|
|
Acquisition of annuity intelligence business of Advanced Sales and Marketing Corp.
|
107
|
|
|
|
Acquisition of Footnoted business of Financial Fineprint Inc. and Seeds Group
|
(103
|
)
|
|
|
Other, primarily currency translation
|
(556
|
)
|
|
|
Balance as of December 31, 2011
|
$
|
318,492
|
|
|
Sale of Morningstar Investor Relations and other businesses
|
(937
|
)
|
|
|
Other, primarily currency translation
|
3,290
|
|
|
|
Balance as of December 31, 2012
|
$
|
320,845
|
|
We did not record any significant impairment losses in
2012
,
2011
, or
2010
, respectively, as the estimated fair values exceeded the carrying values of the reporting units. We perform our annual impairment testing during the fourth quarter of each year.
111
Intangible Assets
The following table summarizes our intangible assets:
|
|
As of December 31, 2012
|
As of December 31, 2011
|
||||||||||||||||||||||||||
|
($000)
|
Gross
|
|
Accumulated
Amortization
|
|
Net
|
|
Weighted
Average
Useful Life
(years)
|
Gross
|
|
Accumulated
Amortization
|
|
Net
|
|
Weighted
Average
Useful Life
(years)
|
||||||||||||||
|
Intellectual property
|
$
|
30,621
|
|
$
|
(21,527
|
)
|
$
|
9,094
|
|
9
|
$
|
32,293
|
|
$
|
(20,455
|
)
|
$
|
11,838
|
|
9
|
||||||||
|
Customer-related assets
|
132,798
|
|
(63,005
|
)
|
69,793
|
|
12
|
134,396
|
|
(52,611
|
)
|
81,785
|
|
12
|
||||||||||||||
|
Supplier relationships
|
240
|
|
(96
|
)
|
144
|
|
20
|
240
|
|
(84
|
)
|
156
|
|
20
|
||||||||||||||
|
Technology-based assets
|
81,333
|
|
(43,809
|
)
|
37,524
|
|
9
|
80,694
|
|
(35,130
|
)
|
45,564
|
|
9
|
||||||||||||||
|
Non-competition agreement
|
1,765
|
|
(1,588
|
)
|
177
|
|
4
|
1,751
|
|
(1,285
|
)
|
466
|
|
4
|
||||||||||||||
|
Total intangible assets
|
$
|
246,757
|
|
$
|
(130,025
|
)
|
$
|
116,732
|
|
10
|
$
|
249,374
|
|
$
|
(109,565
|
)
|
$
|
139,809
|
|
10
|
||||||||
In 2011, we recorded an impairment loss of approximately
$800,000
for the masthead related to one of the magazines we acquired from Aspect Huntley in 2006. We did not record any significant impairment losses in
2012
or 2010.
The following table summarizes our amortization expense related to intangible assets:
|
($000)
|
2012
|
|
2011
|
|
2010
|
|
||||||
|
Amortization expense
|
$
|
23,944
|
|
$
|
27,267
|
|
$
|
24,850
|
|
|||
We amortize intangible assets using the straight-line method over their expected economic useful lives.
Based on acquisitions and divestitures completed through
December 31, 2012
, we expect intangible amortization expense for 2013 and subsequent years as follows:
|
|
($000)
|
|
|
|
2013
|
$
|
21,246
|
|
|
2014
|
19,984
|
|
|
|
2015
|
19,164
|
|
|
|
2016
|
14,558
|
|
|
|
2017
|
9,951
|
|
|
Our estimates of future amortization expense for intangible assets may be affected by additional acquisitions, divestitures, changes in the estimated average useful life, and currency translations.
8. Discontinued Operations
In October 2012, we sold Morningstar Investor Relations Services to UK-based Investis, a leading specialist in digital corporate communications for public companies. In October 2012, we also sold the Morningstar Australasia trade publishing assets to Sterling Publishing Pty Ltd. We have not reclassified the operating results of these businesses, included as part of our Investment Information segment, to discontinued operations, nor have we reclassified the related assets and liabilities to held for disposition, because these amounts are not significant to our consolidated statements or segment disclosures.
112
The following table summarizes the amounts included in our Consolidated Statements of Income for discontinued operations for the years ended December 31, 2012, 2011, and 2010:
|
($000)
|
2012
|
|
2011
|
|
2010
|
|
||||||
|
Gain on sales of businesses
|
$
|
6,193
|
|
$
|
—
|
|
$
|
—
|
|
|||
|
Income tax expense
|
1,005
|
|
—
|
|
—
|
|
||||||
|
Earnings from discontinued operations, net of tax
|
$
|
5,188
|
|
$
|
—
|
|
$
|
—
|
|
|||
9. Investments in Unconsolidated Entities
Our investments in unconsolidated entities consist primarily of the following:
|
As of December 31
|
||||||||
|
($000)
|
2012
|
|
2011
|
|
||||
|
Investment in MJKK
|
$
|
20,540
|
|
$
|
19,662
|
|
||
|
Other equity method investments
|
6,288
|
|
2,807
|
|
||||
|
Investments accounted for using the cost method
|
8,477
|
|
5,173
|
|
||||
|
Total investments in unconsolidated entities
|
$
|
35,305
|
|
$
|
27,642
|
|
||
Morningstar Japan K.K.
Morningstar Japan K.K. (MJKK) develops and markets products and services customized for the Japanese market. MJKK’s shares are traded on the Osaka Stock Exchange, “Hercules Market,” using the ticker 4765. We account for our investment in MJKK using the equity method. The following table summarizes our ownership percentage in MJKK and the market value of this investment based on MJKK’s publicly quoted share price:
|
As of December 31
|
||||||||
|
|
2012
|
|
2011
|
|
||||
|
Morningstar’s approximate ownership of MJKK
|
34
|
%
|
33
|
%
|
||||
|
Approximate market value of Morningstar’s ownership in MJKK:
|
|
|
|
|
||||
|
Japanese yen (¥000)
|
¥
|
3,109,579
|
|
¥
|
2,797,704
|
|
||
|
Equivalent U.S. dollars ($000)
|
$
|
36,227
|
|
$
|
36,146
|
|
||
Other
Equity Method Investments
. As of
December 31, 2012
and
2011
, other equity method investments includes our investments in Morningstar Sweden AB (Morningstar Sweden) and YCharts, Inc. (YCharts). Morningstar Sweden develops and markets products and services customized for investors in Sweden. Our ownership interest in Morningstar Sweden was approximately
24%
as of
December 31, 2012
and
2011
. YCharts is a technology company that provides stock research and analysis. Our ownership interest in YCharts was approximately
22%
as of
December 31, 2012
and
2011
. As of
December 31, 2012
, other equity method investments also includes our investment in Inquiry Financial Europe AB (Inquiry Financial). In September 2012, we acquired a minority equity stake in Inquiry Financial for
$3,554,000
. Inquiry Financial is a provider of sell-side consensus estimate data. Our ownership interest in Inquiry Financial was approximately
34%
as of
December 31, 2012
.
We did not record any impairment losses on our equity method investments in 2012 or
2011
.
113
Cost Method Investments.
As of
December 31, 2012
, our cost method investments consist mainly of minority investments in Pitchbook Data, Inc. (Pitchbook) and HelloWallet LLC (HelloWallet). Pitchbook offers detailed data and information about private equity transactions, investors, companies, limited partners, and service providers. HelloWallet is a provider of personalized financial guidance to employees of
Fortune
1000 companies. We paid approximately
$6,750,000
for the minority equity stake in HelloWallet in the first quarter of 2012. As of
December 31, 2011
, our cost method investments consisted mainly of minority investments in Pitchbook and Bundle Corporation (Bundle). Bundle is a social media company dedicated to helping people make smarter spending and saving choices. We sold our investment in Bundle for approximately
$966,000
in the fourth quarter of 2012. We included the loss of approximately
$2,034,000
on the sale of the investment in our non-operating expense.
We did not record any impairment losses on our cost method investments in
2012
or
2011
.
10. Property, Equipment, and Capitalized Software
The following table shows our property, equipment, and capitalized software summarized by major category:
|
As of December 31
|
||||||||
|
($000)
|
2012
|
|
2011
|
|
||||
|
Computer equipment
|
$
|
42,312
|
|
$
|
35,269
|
|
||
|
Capitalized software
|
39,643
|
|
25,918
|
|
||||
|
Furniture and fixtures
|
22,804
|
|
19,918
|
|
||||
|
Leasehold improvements
|
51,333
|
|
47,042
|
|
||||
|
Telephone equipment
|
1,951
|
|
1,805
|
|
||||
|
Construction in progress
|
13,489
|
|
8,993
|
|
||||
|
Property, equipment, and capitalized software, at cost
|
171,532
|
|
138,945
|
|
||||
|
Less accumulated depreciation
|
(87,510
|
)
|
(70,749
|
)
|
||||
|
Property, equipment, and capitalized software, net
|
$
|
84,022
|
|
$
|
68,196
|
|
||
The following table shows the amount of capitalized software development costs included in construction in progress:
|
As of December 31
|
||||||||
|
($000)
|
2012
|
|
2011
|
|
||||
|
Capitalized software development costs not yet placed into service
|
$
|
6,477
|
|
$
|
6,122
|
|
||
The following table summarizes our depreciation expense:
|
($000)
|
2012
|
|
2011
|
|
2010
|
|
||||||
|
Depreciation expense
|
$
|
19,152
|
|
$
|
15,646
|
|
$
|
14,814
|
|
|||
114
11
. Operating Leases
The following table shows our minimum future rental commitments due in each of the next five years and thereafter for all non-cancelable operating leases, consisting primarily of leases for office space:
|
Minimum Future Rental Commitments
|
($000)
|
|
||
|
2013
|
$
|
17,570
|
|
|
|
2014
|
17,584
|
|
||
|
2015
|
16,337
|
|
||
|
2016
|
15,833
|
|
||
|
2017
|
14,978
|
|
||
|
Thereafter
|
52,706
|
|
||
|
Total
|
$
|
135,008
|
|
|
The following table summarizes our rent expense including taxes, insurance, and other operating costs:
|
($000)
|
2012
|
|
2011
|
|
2010
|
|
||||||
|
Rent expense
|
$
|
20,736
|
|
$
|
20,122
|
|
$
|
18,638
|
|
|||
Deferred rent includes build-out and rent abatement allowances received, which are amortized over the remaining portion of the original term of the lease as a reduction in office lease expense. We include deferred rent, as appropriate, in “Accounts payable and accrued liabilities” and “Deferred rent, noncurrent” on our Consolidated Balance Sheets.
|
As of December 31
|
||||||||
|
($000)
|
2012
|
|
2011
|
|
||||
|
Deferred rent
|
$
|
27,783
|
|
$
|
27,282
|
|
||
Liability for Vacant Office Space
In 2010, we recorded changes to our liability for vacant office space, primarily for the former Ibbotson headquarters. We increased the liability related to this vacant office space because we anticipated receiving lower sublease income and expected it would take more time than previously estimated to identify a tenant. In addition, we increased our liability for vacant office space related to the equity research and data business acquired from CPMS.
We include our liability for vacant office space in "Accounts payable and accrued liabilities" and "Other long-term liabilities", as appropriate, on our Consolidated Balance Sheets. The following table shows the change in our liability for vacant office space from
December 31, 2010
to
December 31, 2012
:
|
Liability for Vacant Office Space
|
($000)
|
|
||
|
Balance as of December 31, 2010
|
$
|
2,429
|
|
|
|
Reduction of liability for lease and other related payments
|
(1,510
|
)
|
||
|
Balance as of December 31, 2011
|
919
|
|
||
|
Reduction of liability for lease and other related payments
|
(774
|
)
|
||
|
Balance as of December 31, 2012
|
$
|
145
|
|
|
115
12
. Stock-Based Compensation
Stock-Based Compensation Plans
Our shareholders approved the Morningstar 2011 Stock Incentive Plan (the 2011 Plan) on May 17, 2011. As of that date we stopped granting awards under the Morningstar 2004 Stock Incentive Plan (the 2004 Plan). The 2004 Plan amended and restated the Morningstar 1993 Stock Option Plan, the Morningstar 2000 Stock Option Plan, and the Morningstar 2001 Stock Option Plan.
The 2011 Plan provides for a variety of stock-based awards, including, among other things, stock options, restricted stock units, and restricted stock. We granted stock options, restricted stock units, and restricted stock under the 2004 Plan.
All of our employees and our non-employee directors are eligible for awards under the 2011 Plan.
Grants awarded under the 2011 Plan or the 2004 Plan that are forfeited, canceled, settled, or otherwise terminated without a distribution of shares, or shares withheld by us in connection with the exercise of options, will be available for awards under the 2011 Plan. Any shares subject to awards under the 2011 Plan, but not under the 2004 Plan, that are withheld by us in connection with the payment of any required income tax withholding will be available for awards under the 2011 Plan.
The following table summarizes the number of shares available for future grants under our 2011 Plan:
|
As of December 31
|
|||
|
(000)
|
2012
|
|
|
|
Shares available for future grants
|
4,731
|
|
|
Accounting for Stock-Based Compensation Awards
The following table summarizes our stock-based compensation expense and the related income tax benefit we recorded in the past three years:
|
($000)
|
2012
|
|
2011
|
|
2010
|
|
||||||
|
Restricted stock units
|
$
|
13,451
|
|
$
|
12,765
|
|
$
|
12,545
|
|
|||
|
Restricted stock
|
5,013
|
|
2,196
|
|
1,248
|
|
||||||
|
Stock options
|
441
|
|
342
|
|
—
|
|
||||||
|
Total stock-based compensation expense
|
$
|
18,905
|
|
$
|
15,303
|
|
$
|
13,793
|
|
|||
|
Income tax benefit related to the stock-based compensation expense
|
$
|
3,686
|
|
$
|
3,535
|
|
$
|
3,500
|
|
|||
The following table summarizes the amount of unrecognized stock-based compensation expense as of
December 31, 2012
and the expected number of months over which the expense will be recognized:
|
Unrecognized stock-based compensation expense ($000)
|
|
Expected amortization period (months)
|
||||
|
Restricted stock units
|
$
|
29,577
|
|
33
|
||
|
Restricted stock
|
906
|
|
28
|
|||
|
Stock options
|
1,078
|
|
27
|
|||
|
Total unrecognized stock-based compensation expense
|
$
|
31,561
|
|
32
|
||
In accordance with FASB ASC 718,
Compensation—Stock Compensation
, we estimate forfeitures of employee stock-based awards and recognize compensation cost only for those awards expected to vest. We adjust the stock-based compensation expense during the third quarter to reflect those awards that ultimately vested and update our estimate of the forfeiture rate that will be applied to awards not yet vested.
116
Restricted Stock Units
Restricted stock units represent the right to receive a share of Morningstar common stock when that unit vests. Restricted stock units granted to employees vest ratably over a four-year period. Restricted stock units granted to non-employee directors vest ratably over a three-year period. For restricted stock units granted through December 31, 2008, employees could elect to defer receipt of the Morningstar common stock issued upon vesting of the restricted stock unit.
We measure the fair value of our restricted stock units on the date of grant based on the closing market price of the underlying common stock on the day prior to grant. We amortize that value to stock-based compensation expense, net of estimated forfeitures, ratably over the vesting period.
The following table summarizes restricted stock unit activity during the past three years:
|
Restricted Stock Units (RSUs)
|
Unvested
|
|
Vested but
Deferred
|
|
Total
|
|
Weighted
Average
Grant Date Value
per RSU
|
|
|||||
|
RSUs Outstanding - January 1, 2010
|
681,425
|
|
39,594
|
|
721,019
|
|
$
|
46.99
|
|
||||
|
Granted
|
399,349
|
|
—
|
|
399,349
|
|
47.76
|
|
|||||
|
Vested
|
(232,292
|
)
|
—
|
|
(232,292
|
)
|
47.77
|
|
|||||
|
Vested but deferred
|
(16,748
|
)
|
16,748
|
|
—
|
|
—
|
|
|||||
|
Issued
|
—
|
|
(11,153
|
)
|
(11,153
|
)
|
49.29
|
|
|||||
|
Forfeited
|
(54,068
|
)
|
—
|
|
(54,068
|
)
|
46.70
|
|
|||||
|
RSUs Outstanding - December 31, 2010
|
777,666
|
|
45,189
|
|
822,855
|
|
47.14
|
|
|||||
|
Granted
|
292,398
|
|
—
|
|
292,398
|
|
57.36
|
|
|||||
|
Dividend equivalents
|
2,673
|
|
—
|
|
2,673
|
|
48.57
|
|
|||||
|
Vested
|
(256,623
|
)
|
—
|
|
(256,623
|
)
|
48.28
|
|
|||||
|
Vested but deferred
|
(1,753
|
)
|
1,753
|
|
—
|
|
—
|
|
|||||
|
Issued
|
—
|
|
(26,866
|
)
|
(26,866
|
)
|
46.69
|
|
|||||
|
Forfeited
|
(73,318
|
)
|
—
|
|
(73,318
|
)
|
47.59
|
|
|||||
|
RSUs Outstanding - December 31, 2011
|
741,043
|
|
20,076
|
|
761,119
|
|
50.66
|
|
|||||
|
Granted
|
341,282
|
|
—
|
|
341,282
|
|
56.26
|
|
|||||
|
Dividend equivalents
|
6,405
|
|
130
|
|
6,535
|
|
52.02
|
|
|||||
|
Vested
|
(270,695
|
)
|
—
|
|
(270,695
|
)
|
50.12
|
|
|||||
|
Vested but deferred
|
(892
|
)
|
892
|
|
—
|
|
—
|
|
|||||
|
Issued
|
—
|
|
(2,316
|
)
|
(2,316
|
)
|
73.28
|
|
|||||
|
Forfeited
|
(89,998
|
)
|
—
|
|
(89,998
|
)
|
50.84
|
|
|||||
|
RSUs Outstanding - December 31, 2012
|
727,145
|
|
18,782
|
|
745,927
|
|
53.37
|
|
|||||
Restricted Stock
In conjunction with the Realpoint acquisition in May 2010, we issued
199,174
shares of restricted stock to the selling employee-shareholders under the 2004 Stock Incentive Plan. The restricted stock vests ratably over a five-year period from the acquisition date and may be subject to forfeiture if the holder terminates his or her employment during the vesting period.
Because of the terms of the restricted share agreements prepared in conjunction with the Realpoint acquisition, we account for the grant of restricted shares as stock-based compensation expense and not as part of the acquisition consideration. See Note
7
, in the Notes to our Consolidated Financial Statements, for additional information concerning the Realpoint acquisition.
117
We measured the fair value of the restricted stock on the date of grant based on the closing market price of our common stock on the day prior to the grant. We amortize the fair value of
$9,363,000
to stock-based compensation expense over the vesting period. The stock-based compensation expense recorded in
2012
and
2011
includes approximately
$3,238,000
and
$396,000
, respectively, of expense recognized upon the accelerated vesting of restricted stock. We have assumed that all of the remaining restricted stock will ultimately vest, and therefore we have not incorporated a forfeiture rate for purposes of determining the stock-based compensation expense.
Stock Options
Stock options granted to employees vest ratably over a four-year period. Grants to our non-employee directors vest ratably over a three-year period. All grants expire 10 years after the date of grant. Almost all of the outstanding options granted under the 2004 Stock Incentive Plan have a premium price feature in which the exercise price increases over the term of the option at a rate equal to the 10-year Treasury bond yield as of the date of grant. Options granted under the 2011 Plan have an exercise price equal to the fair market value on the grant date.
In May 2011, we granted
86,106
stock options under the 2004 Stock Incentive Plan. In November 2011, we granted
6,095
stock options under the 2011 Plan. We estimated the fair value of the options on the grant date using a Black-Scholes option-pricing model. The weighted average fair value of options granted during 2011 was
$23.81
per share, based on the following assumptions:
|
Assumptions for Black-Scholes Option Pricing Model
|
|||
|
Expected life (years):
|
7.4
|
|
|
|
Volatility factor:
|
35.1
|
%
|
|
|
Dividend yield:
|
0.35
|
%
|
|
|
Interest rate:
|
2.87
|
%
|
|
The following tables summarize stock option activity in the past three years for our various stock option grants. The first table includes activity for options granted at an exercise price below the fair value per share of our common stock on the grant date; the second table includes activity for all other option grants.
|
2012
|
2011
|
2010
|
|||||||||||||||||||
|
Options Granted At an Exercise Price Below the Fair Value Per Share on the Grant Date
|
Underlying
Shares
|
|
Weighted
Average
Exercise
Price
|
|
Underlying
Shares
|
|
Weighted
Average
Exercise
Price
|
|
Underlying
Shares
|
|
Weighted
Average
Exercise
Price
|
|
|||||||||
|
Options outstanding—beginning of year
|
398,859
|
|
$
|
19.72
|
|
648,885
|
|
$
|
18.91
|
|
809,169
|
|
$
|
17.75
|
|
||||||
|
Granted
|
—
|
|
—
|
|
—
|
|
—
|
|
—
|
|
—
|
|
|||||||||
|
Canceled
|
(650
|
)
|
14.70
|
|
—
|
|
—
|
|
(1,250
|
)
|
14.21
|
|
|||||||||
|
Exercised
|
(115,514
|
)
|
20.19
|
|
(250,026
|
)
|
19.25
|
|
(159,034
|
)
|
16.62
|
|
|||||||||
|
Options outstanding—end of year
|
282,695
|
|
20.55
|
|
398,859
|
|
19.72
|
|
648,885
|
|
18.91
|
|
|||||||||
|
Options exercisable—end of year
|
282,695
|
|
$
|
20.55
|
|
398,859
|
|
$
|
19.72
|
|
648,885
|
|
$
|
18.91
|
|
||||||
118
|
2012
|
2011
|
2010
|
|||||||||||||||||||
|
All Other Option Grants, Excluding Activity Shown Above
|
Underlying
Shares
|
|
Weighted
Average
Exercise
Price
|
|
Underlying
Shares
|
|
Weighted
Average
Exercise
Price
|
|
Underlying
Shares
|
|
Weighted
Average
Exercise
Price
|
|
|||||||||
|
Options outstanding—beginning of year
|
818,552
|
|
$
|
22.76
|
|
1,207,540
|
|
$
|
17.09
|
|
1,868,408
|
|
$
|
16.15
|
|
||||||
|
Granted
|
—
|
|
—
|
|
92,201
|
|
57.42
|
|
—
|
|
—
|
|
|||||||||
|
Canceled
|
(22,330
|
)
|
39.75
|
|
(1,960
|
)
|
16.04
|
|
(15,524
|
)
|
13.72
|
|
|||||||||
|
Exercised
|
(404,438
|
)
|
16.60
|
|
(479,229
|
)
|
16.17
|
|
(645,344
|
)
|
19.73
|
|
|||||||||
|
Options outstanding—end of year
|
391,784
|
|
28.98
|
|
818,552
|
|
22.76
|
|
1,207,540
|
|
17.09
|
|
|||||||||
|
Options exercisable—end of year
|
337,684
|
|
$
|
24.42
|
|
726,351
|
|
$
|
18.36
|
|
1,207,540
|
|
$
|
17.09
|
|
||||||
The following table summarizes the total intrinsic value (difference between the market value of our stock on the date of exercise and the exercise price of the option) of options exercised:
|
($000)
|
2012
|
|
2011
|
|
2010
|
|
||||||
|
Intrinsic value of options exercised
|
$
|
22,526
|
|
$
|
29,899
|
|
$
|
31,410
|
|
|||
The table below shows additional information for options outstanding and exercisable as of
December 31, 2012
:
|
|
Options Outstanding
|
Options Exercisable
|
||||||||||||||||||||||||
|
Range of Exercise Prices
|
Number of Options
|
|
Weighted
Average
Remaining
Contractual
Life (years)
|
Weighted
Average
Exercise
Price
|
|
Aggregate
Intrinsic
Value
($000)
|
|
Exercisable Shares
|
|
Weighted Average Remaining Contractual Life (years)
|
Weighted Average Exercise Price
|
|
Aggregate Intrinsic Value ($000)
|
|
||||||||||||
|
$8.57 - $14.70
|
74,244
|
|
0.35
|
$
|
8.59
|
|
$
|
4,027
|
|
74,244
|
|
0.35
|
$
|
8.59
|
|
$
|
4,027
|
|
||||||||
|
$20.51- $46.79
|
528,560
|
|
2.16
|
23.48
|
|
20,800
|
|
528,560
|
|
2.16
|
23.48
|
|
20,800
|
|
||||||||||||
|
57.28 - $59.35
|
71,675
|
|
8.54
|
57.46
|
|
385
|
|
17,575
|
|
8.54
|
57.46
|
|
89
|
|
||||||||||||
|
|
|
|
|
|
|
|
|
|
|
|
|
|
|
|
||||||||||||
|
$8.57 - $59.35
|
674,479
|
|
2.64
|
25.45
|
|
$
|
25,212
|
|
620,379
|
|
2.12
|
22.66
|
|
$
|
24,916
|
|
||||||||||
|
Vested or Expected to Vest
|
||||||||||||||||||||||||||
|
$8.57 - $59.35
|
674,479
|
|
2.64
|
$
|
25.45
|
|
$
|
25,212
|
|
|||||||||||||||||
The aggregate intrinsic value in the table above represents the total pretax intrinsic value all option holders would have received if they had exercised all outstanding options on
December 31, 2012
. The intrinsic value is based on our closing stock price of
$62.83
on that date.
Excess Tax Benefits Related to Stock-Based Compensation
FASB ASC 718,
Compensation—Stock Compensation,
requires that we classify the cash flows that result from excess tax benefits as financing cash flows. Excess tax benefits correspond to the portion of the tax deduction taken on our income tax return that exceeds the amount of tax benefit related to the compensation cost recognized in our Statement of Income. The following table summarizes our excess tax benefits for the past three years:
|
($000)
|
2012
|
|
2011
|
|
2010
|
|
||||||
|
Excess tax benefits related to stock-based compensation
|
$
|
7,210
|
|
$
|
9,525
|
|
$
|
7,507
|
|
|||
119
13. Defined Contribution Plan
We sponsor a defined contribution 401(k) plan, which allows our U.S.-based employees to voluntarily contribute pre-tax dollars up to a maximum amount allowable by the U.S. Internal Revenue Service. In
2012
and 2011, we made matching contributions to our 401(k) plan in the United States in an amount equal to
75 cents
for every dollar of an employee's contribution, up to a maximum of
7%
of the employee's compensation in the pay period. In 2010, we made matching contributions to our 401(k) plan in the United States in an amount equal to
50 cents
for every dollar of an employee's contribution, up to a maximum of
7%
of the employee's compensation in the pay period.
The following table summarizes our matching contributions:
|
($000)
|
2012
|
|
2011
|
|
2010
|
|
||||||
|
401(k) matching contributions
|
$
|
6,642
|
|
$
|
5,601
|
|
$
|
3,321
|
|
|||
14. Non-Operating Income
The following table presents the components of our net non-operating income:
|
($000)
|
2012
|
|
2011
|
|
2010
|
|
||||||
|
Interest income
|
$
|
5,464
|
|
$
|
3,679
|
|
$
|
2,718
|
|
|||
|
Interest expense
|
(311
|
)
|
(1,318
|
)
|
(281
|
)
|
||||||
|
Other income (expense), net
|
(2,196
|
)
|
(652
|
)
|
4,295
|
|
||||||
|
Non-operating income, net
|
$
|
2,957
|
|
$
|
1,709
|
|
$
|
6,732
|
|
|||
Interest income primarily reflects interest from our investment portfolio. Interest income in 2012 includes approximately
$700,000
of interest income related to the
$1,000,000
of business tax refund for prior years recorded in 2012, as discussed above in the section, Consolidated Results. In 2011, interest expense of
$1,318,000
included approximately
$900,000
related to the
$1,400,000
of business tax expense for prior years recorded in the second quarter of 2011, as discussed above in the section,
Consolidated Results
.
In 2012, other income (expense), net included the loss on the sale of our investment in Bundle Corporation of
$2,034,000
. See Note
9
for additional information concerning our investment in Bundle Corporation. In 2010, this category included the holding gain of
$4,564,000
resulting from the difference between the estimated fair value and the book value of our investment in Morningstar Denmark. See Note
7
for additional information concerning Morningstar Denmark.
Other income (expense), net also includes foreign currency exchange gains and losses arising from the ordinary course of business related to our U.S. and non-U.S. operations, realized gains and losses from our investment portfolio, gains and losses on sale of fixed assets, and royalty income from MJKK.
15. Income Taxes
Income Tax Expense and Effective Tax Rate
The following table shows our income tax expense and our effective tax rate:
|
($000)
|
2012
|
|
2011
|
|
2010
|
|
||||||
|
Income before income taxes and equity in net income of unconsolidated entities
|
$
|
153,625
|
|
$
|
140,124
|
|
$
|
127,791
|
|
|||
|
Equity in net income of unconsolidated entities
|
2,027
|
|
1,848
|
|
1,422
|
|
||||||
|
Net (income) loss attributable to the noncontrolling interest
|
117
|
|
43
|
|
(87
|
)
|
||||||
|
Total
|
$
|
155,769
|
|
$
|
142,015
|
|
$
|
129,126
|
|
|||
|
Income tax expense
|
$
|
52,878
|
|
$
|
43,658
|
|
$
|
42,756
|
|
|||
|
Effective tax rate
|
33.9
|
%
|
30.7
|
%
|
33.1
|
%
|
||||||
120
The following table reconciles our income tax expense at the U.S. federal income tax rate of 35% to income tax expense as recorded:
|
2012
|
2011
|
2010
|
|||||||||||||||||||
|
($000, except percentages)
|
Amount
|
|
%
|
|
Amount
|
|
%
|
|
Amount
|
|
%
|
|
|||||||||
|
Income tax expense at U.S. federal rate
|
$
|
54,519
|
|
35.0
|
%
|
$
|
49,705
|
|
35.0
|
%
|
$
|
45,194
|
|
35.0
|
%
|
||||||
|
State income taxes, net of federal income tax benefit
|
1,510
|
|
1.0
|
|
1,376
|
|
1.0
|
|
1,756
|
|
1.3
|
|
|||||||||
|
Stock-based compensation activity
|
516
|
|
0.3
|
|
440
|
|
0.3
|
|
97
|
|
0.1
|
|
|||||||||
|
Non-U.S. withholding taxes, net of federal income tax effect, and foreign tax credits
|
307
|
|
0.2
|
|
346
|
|
0.2
|
|
77
|
|
0.1
|
|
|||||||||
|
Net change in valuation allowance related to non-U.S. deferred tax assets, primarily net operating losses
|
(630
|
)
|
(0.4
|
)
|
394
|
|
0.3
|
|
(1,186
|
)
|
(0.9
|
)
|
|||||||||
|
Impact of equity in net income of unconsolidated entities
|
—
|
|
—
|
|
—
|
|
—
|
|
79
|
|
0.1
|
|
|||||||||
|
Difference between U.S. federal statutory and foreign tax rates
|
(2,777
|
)
|
(1.8
|
)
|
(2,393
|
)
|
(1.7
|
)
|
(2,567
|
)
|
(2.0
|
)
|
|||||||||
|
Adjustment to accruals for state taxes
|
—
|
|
—
|
|
—
|
|
—
|
|
(2,633
|
)
|
(2.0
|
)
|
|||||||||
|
Change in unrecognized tax benefits
|
967
|
|
0.6
|
|
3,126
|
|
2.2
|
|
2,869
|
|
2.2
|
|
|||||||||
|
Credits and incentives
|
(1,494
|
)
|
(1.0
|
)
|
(7,734
|
)
|
(5.4
|
)
|
(984
|
)
|
(0.8
|
)
|
|||||||||
|
Recognition of deferred tax assets
|
—
|
|
—
|
|
(1,778
|
)
|
(1.3
|
)
|
—
|
|
—
|
|
|||||||||
|
Other - net
|
(40
|
)
|
—
|
|
176
|
|
0.1
|
|
54
|
|
—
|
|
|||||||||
|
Total income tax expense
|
$
|
52,878
|
|
33.9
|
%
|
$
|
43,658
|
|
30.7
|
%
|
$
|
42,756
|
|
33.1
|
%
|
||||||
Income tax expense consists of the following:
121
|
($000)
|
2012
|
|
2011
|
|
2010
|
|
||||||
|
Current tax expense:
|
||||||||||||
|
U.S.
|
||||||||||||
|
Federal
|
$
|
38,821
|
|
$
|
41,520
|
|
$
|
38,901
|
|
|||
|
State
|
1,997
|
|
1,808
|
|
2,445
|
|
||||||
|
Non-U.S.
|
5,719
|
|
5,756
|
|
4,122
|
|
||||||
|
Current tax expense
|
46,537
|
|
49,084
|
|
45,468
|
|
||||||
|
Deferred tax expense (benefit):
|
||||||||||||
|
U.S.
|
||||||||||||
|
Federal
|
6,287
|
|
(1,011
|
)
|
61
|
|
||||||
|
State
|
334
|
|
(242
|
)
|
(7
|
)
|
||||||
|
Non-U.S.
|
(280
|
)
|
(4,173
|
)
|
(2,766
|
)
|
||||||
|
Deferred tax expense (benefit), net
|
6,341
|
|
(5,426
|
)
|
(2,712
|
)
|
||||||
|
Income tax expense
|
$
|
52,878
|
|
$
|
43,658
|
|
$
|
42,756
|
|
|||
The following table provides our income before income taxes and equity in net income of unconsolidated entities, generated by our U.S. and non-U.S. operations:
|
($000)
|
2012
|
|
2011
|
|
2010
|
|
||||||
|
U.S.
|
$
|
128,920
|
|
$
|
123,390
|
|
$
|
112,357
|
|
|||
|
Non-U.S.
|
24,705
|
|
16,734
|
|
15,434
|
|
||||||
|
Income before income taxes and equity in net income of unconsolidated entities
|
$
|
153,625
|
|
$
|
140,124
|
|
$
|
127,791
|
|
|||
122
Deferred Tax Assets and Liabilities
We recognize deferred income taxes for the temporary differences between the carrying amount of assets and liabilities for financial statement purposes and their tax basis. The tax effects of the temporary differences that give rise to the deferred income tax assets and liabilities are as follows:
|
As of December 31
|
||||||||
|
($000)
|
2012
|
|
2011
|
|
||||
|
Deferred tax assets:
|
||||||||
|
Stock-based compensation expense
|
$
|
4,019
|
|
$
|
5,567
|
|
||
|
Accrued liabilities
|
8,402
|
|
7,789
|
|
||||
|
Net operating loss carryforwards - U.S. federal and state
|
930
|
|
1,009
|
|
||||
|
Net operating loss carryforwards - Non-U.S.
|
12,386
|
|
13,297
|
|
||||
|
Research and development
|
246
|
|
631
|
|
||||
|
Deferred royalty revenue
|
383
|
|
403
|
|
||||
|
Allowance for doubtful accounts
|
515
|
|
503
|
|
||||
|
Deferred rent
|
9,031
|
|
8,847
|
|
||||
|
Unrealized exchange losses, net
|
—
|
|
159
|
|
||||
|
Other
|
846
|
|
383
|
|
||||
|
Total deferred tax assets
|
36,758
|
|
38,588
|
|
||||
|
Deferred tax liabilities:
|
||||||||
|
Acquired intangible assets
|
(14,535
|
)
|
(17,558
|
)
|
||||
|
Property, equipment, and capitalized software
|
(14,615
|
)
|
(8,523
|
)
|
||||
|
Unrealized exchange gains, net
|
(444
|
)
|
—
|
|
||||
|
Prepaid expenses
|
(3,694
|
)
|
(1,724
|
)
|
||||
|
Accrued liabilities
|
—
|
|
—
|
|
||||
|
Investments in unconsolidated entities
|
(9,905
|
)
|
(9,580
|
)
|
||||
|
Total deferred tax liabilities
|
(43,193
|
)
|
(37,385
|
)
|
||||
|
Net deferred tax asset (liability) before valuation allowance
|
(6,435
|
)
|
1,203
|
|
||||
|
Valuation allowance
|
(11,407
|
)
|
(12,039
|
)
|
||||
|
Net deferred tax liability
|
$
|
(17,842
|
)
|
$
|
(10,836
|
)
|
||
The deferred tax assets and liabilities are included in our Consolidated Balance Sheets as follows:
|
As of December 31
|
||||||||
|
($000)
|
2012
|
|
2011
|
|
||||
|
Deferred tax asset, net - current
|
$
|
3,741
|
|
$
|
5,104
|
|
||
|
Deferred tax liability, net - non-current
|
(21,583
|
)
|
(15,940
|
)
|
||||
|
Net deferred tax liability
|
$
|
(17,842
|
)
|
$
|
(10,836
|
)
|
||
The following table summarizes our U.S. net operating loss (NOL) carryforwards:
|
As of December 31
|
||||||||||
|
($000)
|
2012
|
2011
|
||||||||
|
Expiration Date
|
Expiration Date
|
|||||||||
|
U.S. federal NOLs subject to expiration dates
|
$
|
2,362
|
|
2023
|
$
|
2,587
|
|
2023
|
||
123
Our U.S. federal NOL carryforward as of
December 31, 2012
of
$2,362,000
is subject to limitations on the use of the NOL imposed by the U.S. Internal Revenue Code, and therefore is limited to approximately
$225,000
per year.
The following table summarizes our NOL carryforwards for our non-U.S. operations:
|
As of December 31
|
||||||||
|
($000)
|
2012
|
|
2011
|
|
||||
|
Non-U.S. NOLs subject to expiration dates from 2014 through 2032
|
$
|
6,064
|
|
$
|
5,048
|
|
||
|
Non-U.S. NOLs with no expiration date
|
44,504
|
|
45,002
|
|
||||
|
Total
|
$
|
50,568
|
|
$
|
50,050
|
|
||
|
Non-U.S. NOLs not subject to valuation allowances
|
$
|
4,031
|
|
$
|
5,284
|
|
||
The increase
in non-U.S. NOL carryforwards as of
December 31, 2012
compared with 2011 primarily reflects additional NOL carryforwards in our non-U.S. operations as well as the impact of currency translations.
We have not provided federal and state income taxes on accumulated undistributed earnings of certain foreign subsidiaries aggregating approximately
$95,100,000
as of
December 31, 2012
, because these earnings have been permanently reinvested. It is not practicable to determine the amount of the unrecognized deferred tax liability related to the undistributed earnings.
In assessing the realizability of our deferred tax assets, we consider whether it is more likely than not that some portion or all of the deferred tax assets will not be realized. We have recorded a valuation allowance against all but approximately
$4,031,000
of the non-U.S. NOLs, reflecting the likelihood that the benefit of these NOLs will not be realized.
Accounting for Uncertainty in Tax Positions
We conduct business globally and as a result, we file income tax returns in U.S. federal, state, local, and foreign jurisdictions. In the normal course of business we are subject to examination by tax authorities throughout the world. The open tax years for our U.S. Federal tax returns and most state tax returns include the years 2008 to the present. In non-U.S. jurisdictions, the statute of limitations generally extends to years prior to 2005.
We are currently under audit by federal, state and local tax authorities in the United States as well as tax authorities in certain non-U.S. jurisdictions. It is likely that the examination phase of some of these U.S. federal, state, local, and non-U.S. audits will conclude in 2013. It is not possible to estimate the impact of current audits on previously recorded unrecognized tax benefits.
As of
December 31, 2012
, our Consolidated Balance Sheet included a current liability of
$6,568,000
and a non-current liability of
$5,659,000
for unrecognized tax benefits. These amounts include interest and penalties, less any associated tax benefits.
The table below reconciles the beginning and ending amount of the gross unrecognized tax benefits as follows:
|
($000)
|
2012
|
|
2011
|
|
||||
|
Gross unrecognized tax benefits - beginning of the year
|
$
|
12,189
|
|
$
|
9,089
|
|
||
|
Increases as a result of tax positions taken during a prior-year period
|
445
|
|
1,639
|
|
||||
|
Decreases as a result of tax positions taken during a prior-year period
|
(1,153
|
)
|
(876
|
)
|
||||
|
Increases as a result of tax positions taken during the current period
|
2,008
|
|
3,662
|
|
||||
|
Decreases relating to settlements with tax authorities
|
(299
|
)
|
(1,001
|
)
|
||||
|
Reductions as a result of lapse of the applicable statute of limitations
|
(491
|
)
|
(324
|
)
|
||||
|
Gross unrecognized tax benefits - end of the year
|
$
|
12,699
|
|
$
|
12,189
|
|
||
124
In
2012
, we recorded a net increase of
$1,299,000
of gross unrecognized tax benefits before settlements and lapses of statutes of limitations, of which
$875,000
increased our income tax expense by
$702,000
. In addition, we reduced our unrecognized tax benefits by
$790,000
for settlements and lapses of statutes of limitations, of which
$207,000
decreased our income tax expense by
$207,000
.
As of
December 31, 2012
, we had
$12,699,000
of gross unrecognized tax benefits, of which
$12,699,000
, if recognized, would reduce our effective income tax rate and decrease our income tax expense by
$10,446,000
.
We record interest and penalties related to uncertain tax positions as part of our income tax expense. The following table summarizes our gross liability for interest and penalties:
|
As of December 31
|
||||||||
|
($000)
|
2012
|
|
2011
|
|
||||
|
Liabilities for interest and penalties
|
$
|
2,232
|
|
$
|
1,726
|
|
||
We recorded the increase in the liability, net of any tax benefits, to income tax expense in our Consolidated Statement of Income in
2012
.
16. Contingencies
Open Matters
Life's Good S.T.A.B.L. Hedge Fund
In September 2011, three individual investors in Life's Good S.T.A.B.L. Mortgage hedge fund (LG), Marta Klass, Gregory Martin, and Richard Roellig, filed a complaint in the United States District Court for the Eastern District of Pennsylvania against LG, its principal Robert Stinson, and several other parties, including Morningstar, Inc. (the Klass Matter). The plaintiffs claim that Morningstar committed fraud and aided and abetted the other defendants' breach of fiduciary duty through the 5-star rating LG obtained from Morningstar. The plaintiffs seek unspecified damages. Hedge fund managers self-report their performance data to Morningstar.
More than a year before the Klass Matter, in June 2010, the SEC filed suit against LG and other entities claiming they were part of a Ponzi scheme operated by Stinson. As a result, LG and the other entities were placed in court-appointed receivership. Morningstar was not part of the SEC suit or receivership. Since that time, the Receiver, as part of his duties, has been investigating whether to assert claims against third parties. Morningstar is aware of 14 lawsuits filed by the Receiver seeking to recover money for the fund.
In November 2011, Morningstar filed a motion to dismiss the Klass Matter. On behalf of the entities in receivership, the Receiver filed a motion to stay the proceedings because the Receivership Order does not permit suits against the entities in receivership without court permission. The court granted the Receiver's motion and stayed the Klass Matter. In April 2012, the Receiver filed a complaint against Morningstar, in which the Receiver claims that Morningstar is liable for contribution and aiding and abetting Stinson's breach of fiduciary duty and fraud through the 5-star rating LG obtained from Morningstar. The Receiver seeks unspecified damages. The same day the Receiver filed his complaint, Morningstar sought leave from the court to file a counter suit against Stinson and two of his entities-Keystone State Capital Corporation and LG-for, among other things, fraud, misrepresentation, and breach of user agreements. In June 2012, the court denied Morningstar's motion for leave to file suit. The court took no position on the merits of Morningstar's claims, and did not preclude Morningstar from renewing its motion to file a complaint at a later time, but deferred to the Receiver's request not to subject the receivership estate to additional litigation at this early point in the receivership. In August 2012, the court denied Morningstar's motion to dismiss the Receiver's complaint.
Morningstar believes the allegations against it by the Klass plaintiffs and the Receiver have no legal or factual basis and plans to vigorously contest the claims. Morningstar also intends to refile its affirmative claims against Stinson, Keystone, and LG at a later time consistent with the court's order. We cannot predict the outcome of the proceedings.
125
Business Logic Holding Corporation
In November 2009, Business Logic Holding Corporation filed a complaint in the Circuit Court of Cook County, Illinois against Ibbotson Associates, Inc. and Morningstar, Inc. relating to Ibbotson's prior commercial relationship with Business Logic. Business Logic is alleging breach of contract and trade secret misappropriation in connection with Ibbotson's development of a proprietary web-service software and user interface that connects plan participant data with the Ibbotson Wealth Forecasting Engine. Business Logic seeks, among other things, injunctive relief and unspecified damages. Ibbotson and Morningstar answered the complaint, and Ibbotson asserted a counterclaim against Business Logic alleging trade secret misappropriation and breach of contract, seeking damages and injunctive relief. While Morningstar and Ibbotson are vigorously contesting the claims against them, we cannot predict the outcome of the proceeding.
We have not provided an estimate of loss or range of loss in connection with the matters described above because no such estimate can reasonably be made.
Settled Matters
Egan-Jones Rating Co.
In June 2010, Egan-Jones Rating Co. filed a complaint in the Court of Common Pleas of Montgomery County, Pennsylvania against Realpoint, LLC (now known as Morningstar Credit Ratings, LLC) and Morningstar, Inc. in connection with a December 2007 agreement between Egan-Jones and Morningstar Credit Ratings for certain data-sharing and other services. In addition to damages, Egan-Jones filed a petition seeking an injunction to temporarily prevent Morningstar from offering corporate credit ratings through December 31, 2010. In September 2010, the court denied Egan-Jones's request for a preliminary injunction against Morningstar's corporate credit ratings business. In December 2012, Morningstar Credit Ratings, Morningstar, and Egan Jones entered into a settlement agreement resolving the litigation. All settlement terms are confidential.
Other Matters
In addition to these proceedings, we are involved in legal proceedings and litigation that have arisen in the normal course of our business. Although the outcome of a particular proceeding can never be predicted, we do not believe that the result of any of these other matters will have a material adverse effect on our business, operating results, or financial position.
17. Share Repurchase Program
In September 2010, the board of directors approved a share repurchase program that authorizes the repurchase of up to
$100 million
in shares of our outstanding common stock. In December 2011, the board approved an increase to the
$100 million
share repurchase program it announced in 2010. The board approval authorized the company to repurchase up to an additional
$200 million
in shares of our outstanding common stock. In December 2012, the board approval authorized the company to repurchase an additional
$200 million
, increasing the repurchase program from
$300 million
to
$500 million
. We may repurchase shares from time to time at prevailing market prices on the open market or in private transactions in amounts that we deem appropriate. As of
December 31, 2012
, we had repurchased a total of
5,056,595
shares for
$300,936,000
under this authorization.
18. Subsequent Events
In
February
2013
, our board of directors declared a quarterly dividend of
12.5 cents
per share. The dividend is payable on
April 30, 2013
to shareholders of record as of
April 12, 2013
.
19. Recently Issued Accounting Pronouncements
In February 2013, the FASB issued ASU No. 2013-2,
Comprehensive Income (Topic 220).
The amended guidance requires us to show the effects of items reclassified out of each component of accumulated other comprehensive income to net income on the face of the financial statement where net income is presented. For Morningstar, the ASU No. 2013-2 is effective on January 1, 2013. We do not expect the provisions of ASU No. 2013-2 to have a material impact on our consolidated financial statements.
126
20. Selected Quarterly Financial Data (unaudited)
|
2011
|
|
2012
|
|
||||||||||||||||||||||||||||||
|
(in thousands except per share amounts)
|
Q1
|
|
Q2
|
|
Q3
|
|
Q4
|
|
Q1
|
|
Q2
|
|
Q3
|
|
Q4
|
|
|||||||||||||||||
|
Revenue
|
$
|
151,767
|
|
$
|
161,011
|
|
$
|
160,051
|
|
$
|
158,571
|
|
$
|
160,759
|
|
$
|
165,968
|
|
$
|
160,952
|
|
$
|
170,609
|
|
|||||||||
|
Total operating expense (1)
|
119,958
|
|
122,404
|
|
126,187
|
|
124,436
|
|
130,360
|
|
124,832
|
|
121,088
|
|
131,340
|
|
|||||||||||||||||
|
Operating income
|
31,809
|
|
38,607
|
|
33,864
|
|
34,135
|
|
30,399
|
|
41,136
|
|
39,864
|
|
39,269
|
|
|||||||||||||||||
|
Non-operating income (expense), net
|
774
|
|
9
|
|
(579
|
)
|
1,505
|
|
659
|
|
995
|
|
1,880
|
|
(577
|
)
|
|||||||||||||||||
|
Income before income taxes and equity in net income of unconsolidated entities
|
32,583
|
|
38,616
|
|
33,285
|
|
35,640
|
|
31,058
|
|
42,131
|
|
41,744
|
|
38,692
|
|
|||||||||||||||||
|
Income tax expense
|
10,518
|
|
12,724
|
|
12,343
|
|
8,073
|
|
11,511
|
|
14,744
|
|
15,186
|
|
11,437
|
|
|||||||||||||||||
|
Equity in net income (loss) of unconsolidated entities
|
374
|
|
595
|
|
428
|
|
451
|
|
566
|
|
497
|
|
478
|
|
486
|
|
|||||||||||||||||
|
Consolidated net income from continuing operations
|
22,439
|
|
26,487
|
|
21,370
|
|
28,018
|
|
20,113
|
|
27,884
|
|
27,036
|
|
27,741
|
|
|||||||||||||||||
|
Gain on sale of discontinued operations, net of tax
|
—
|
|
—
|
|
—
|
|
—
|
|
—
|
|
—
|
|
—
|
|
5,188
|
|
|||||||||||||||||
|
Consolidated net income
|
22,439
|
|
26,487
|
|
21,370
|
|
28,018
|
|
20,113
|
|
27,884
|
|
27,036
|
|
32,929
|
|
|||||||||||||||||
|
Net (income) loss attributable to the noncontrolling interests
|
98
|
|
(2
|
)
|
10
|
|
(63
|
)
|
24
|
|
4
|
|
34
|
|
55
|
|
|||||||||||||||||
|
Net income attributable to Morningstar, Inc.
|
$
|
22,537
|
|
$
|
26,485
|
|
$
|
21,380
|
|
$
|
27,955
|
|
$
|
20,137
|
|
$
|
27,888
|
|
$
|
27,070
|
|
$
|
32,984
|
|
|||||||||
|
Net income per share attributable to Morningstar, Inc.
|
|||||||||||||||||||||||||||||||||
|
Basic:
|
|||||||||||||||||||||||||||||||||
|
Continuing operations
|
$
|
0.45
|
|
$
|
0.53
|
|
$
|
0.42
|
|
$
|
0.56
|
|
$
|
0.40
|
|
$
|
0.57
|
|
$
|
0.56
|
|
$
|
0.59
|
|
|||||||||
|
Discontinued operations
|
—
|
|
—
|
|
—
|
|
—
|
|
—
|
|
—
|
|
—
|
|
0.11
|
|
|||||||||||||||||
|
$
|
0.45
|
|
$
|
0.53
|
|
$
|
0.42
|
|
$
|
0.56
|
|
$
|
0.40
|
|
$
|
0.57
|
|
$
|
0.56
|
|
$
|
0.70
|
|
||||||||||
|
Diluted:
|
|||||||||||||||||||||||||||||||||
|
Continuing operations
|
|
$
|
0.44
|
|
|
$
|
0.52
|
|
|
$
|
0.42
|
|
|
$
|
0.55
|
|
|
$
|
0.40
|
|
|
$
|
0.56
|
|
|
$
|
0.56
|
|
|
$
|
0.58
|
|
|
|
Discontinued operations
|
—
|
|
—
|
|
—
|
|
—
|
|
—
|
|
—
|
|
—
|
|
0.11
|
|
|||||||||||||||||
|
$
|
0.44
|
|
$
|
0.52
|
|
$
|
0.42
|
|
$
|
0.55
|
|
$
|
0.40
|
|
$
|
0.56
|
|
$
|
0.56
|
|
$
|
0.69
|
|
||||||||||
|
Dividends per common share:
|
|||||||||||||||||||||||||||||||||
|
Dividends declared per common share
|
$
|
0.05
|
|
$
|
0.05
|
|
$
|
0.05
|
|
$
|
0.10
|
|
$
|
0.10
|
|
$
|
0.10
|
|
$
|
0.10
|
|
$
|
0.13
|
|
|||||||||
|
Dividends paid per common share
|
$
|
0.05
|
|
$
|
0.05
|
|
$
|
0.05
|
|
$
|
0.05
|
|
$
|
0.10
|
|
$
|
0.10
|
|
$
|
0.10
|
|
$
|
0.23
|
|
|||||||||
|
Weighted average shares outstanding:
|
|||||||||||||||||||||||||||||||||
|
Basic
|
49,800
|
|
50,165
|
|
50,278
|
|
49,883
|
|
49,938
|
|
49,195
|
|
47,975
|
|
46,913
|
|
|||||||||||||||||
|
Diluted
|
50,953
|
|
51,142
|
|
51,123
|
|
50,732
|
|
50,758
|
|
49,856
|
|
48,481
|
|
47,511
|
|
|||||||||||||||||
|
2011
|
|
2012
|
|
||||||||||||||||||||||||||||||
|
(in thousands)
|
Q1
|
|
Q2
|
|
Q3
|
|
Q4
|
|
Q1
|
|
Q2
|
|
Q3
|
|
Q4
|
|
|||||||||||||||||
|
(1) Includes stock-based compensation expense of:
|
$
|
3,649
|
|
$
|
3,843
|
|
$
|
3,951
|
|
$
|
3,860
|
|
$
|
3,866
|
|
$
|
3,734
|
|
$
|
3,994
|
|
$
|
7,311
|
|
|||||||||
127
None.
(a) Evaluation of Disclosure Controls and Procedures
Disclosure controls and procedures are designed to reasonably assure that information required to be disclosed in the reports filed or submitted under the Exchange Act is recorded, processed, summarized, and reported within the time periods specified in the SEC's rules and forms. Disclosure controls and procedures include, without limitation, controls and procedures designed to reasonably assure that information required to be disclosed in the reports filed under the Exchange Act is accumulated and communicated to management, including the chief executive officer and chief financial officer, as appropriate, to allow timely decisions regarding required disclosure.
We carried out an evaluation, under the supervision and with the participation of our management, including our chief executive officer and chief financial officer, of the effectiveness of the design and operation of our disclosure controls and procedures, as defined in Rules 13a-15(e) and 15d-15(e) of the Securities Exchange Act of 1934, as of
December 31, 2012
. Based on that evaluation, our chief executive officer and chief financial officer concluded that our disclosure controls and procedures are effective to provide reasonable assurance that information required to be disclosed in the reports we file or submit under the Exchange Act is recorded, processed, summarized, and reported as and when required and is accumulated and communicated to management, including the chief executive officer and chief financial officer, as appropriate to allow timely decisions regarding required disclosure.
(b) Management's Report on Internal Control Over Financial Reporting
Our management is responsible for establishing and maintaining adequate internal control over financial reporting. Our internal control over financial reporting is a process designed to provide reasonable assurance regarding the reliability of financial reporting and the preparation of financial statements for external purposes in accordance with U.S. generally accepted accounting principles.
We carried out an evaluation, under the supervision and with the participation of our management, including our chief executive officer and chief financial officer, of the effectiveness of our internal control over financial reporting based on the framework set forth in Internal Control - Integrated Framework issued by the Committee of Sponsoring Organizations of the Treadway Commission.
Based on that evaluation, our management concluded that our internal control over financial reporting was effective as of
December 31, 2012
. KPMG LLP, our independent registered public accounting firm, has issued its report on the effectiveness of our internal control over financial reporting, which is included in Part II, Item 8 of this Form 10-K under the caption “Financial Statements and Supplementary Data” and incorporated herein by reference.
(c) Changes in Internal Controls Over Financial Reporting
There were no changes in our internal controls over financial reporting during our fiscal quarter ended
December 31, 2012
that have materially affected, or are reasonably likely to materially affect, our internal control over financial reporting.
There is no information that was required to be disclosed in a report on Form 8-K during the fourth quarter of the year covered by this Annual Report on Form 10-K that was not reported.
128
The information contained under the headings Proposal 1 - Election of Directors, Board of Directors and Corporate Governance - Independent Directors, Board of Directors and Corporate Governance - Board Committees and Charters, and Section 16(a) Beneficial Ownership Reporting Compliance in the definitive proxy statement for our 2013 Annual Meeting of Shareholders (the Proxy Statement) and the information contained under the heading Executive Officers in Part I of this report is incorporated herein by reference in response to this item.
We have adopted a code of ethics, which is posted in the Investor Relations section of our website at
http://corporate.morningstar.com
. We intend to include on our website any amendments to, or waivers from, a provision of the code of ethics that apply to our principal executive officer, principal financial officer, principal accounting officer, or controller that relates to any element of the code of ethics definition contained in Item 406(b) of SEC Regulation S-K. Shareholders may request a free copy of these documents by sending an e-mail to investors@morningstar.com.
The information contained under the headings Board of Directors and Corporate Governance—Directors' Compensation, Compensation Discussion and Analysis, Compensation Committee Report, Compensation Committee Interlocks and Insider Participation, and Executive Compensation in the Proxy Statement is incorporated herein by reference in response to this item.
The information contained under the headings Security Ownership of Certain Beneficial Owners and Management and Equity Compensation Plan Information in the Proxy Statement is incorporated herein by reference in response to this item.
The information contained under the headings Certain Relationships and Related Party Transactions and Board of Directors and Corporate Governance - Independent Directors in the Proxy Statement is incorporated herein by reference in response to this item.
The information contained under the headings Audit Committee Report and Principal Accounting Firm Fees in the Proxy Statement is incorporated herein by reference in response to this item.
129
(a)
1. Consolidated Financial Statements
The following documents are filed as part of this Annual Report on Form 10-K under Item 8--Financial Statements and Supplementary Data:
|
Report of KPMG LLP, Independent Registered Public Accounting Firm
|
|
|
Report of Ernst & Young LLP, Independent Registered Public Accounting Firm
|
|
|
Financial Statements:
|
|
|
Consolidated Statements of Income--Years ended December 31, 2012, 2011, and 2010
|
|
|
Consolidated Statements of Comprehensive Income--Years ended December 31, 2012, 2011, and 2010
|
|
|
Consolidated Balance Sheets--December 31, 2012 and 2011
|
|
|
Consolidated Statements of Equity--Years ended December 31, 2012, 2011, and 2010
|
|
|
Consolidated Statements of Cash Flows--Years ended December 31, 2012, 2011, and 2010
|
|
|
Notes to Consolidated Financial Statements
|
|
2. Financial Statement Schedules
REPORT OF INDEPENDENT REGISTERED PUBLIC ACCOUNTING FIRM
The report of KPMG LLP dated
February 28, 2013
concerning the Financial Statement Schedule II, Morningstar, Inc., and subsidiaries Valuation and Qualifying Accounts, is included at the beginning of Part II, Item 8 of this Annual Report on Form 10-K for the years ended
December 31, 2012
and December 31, 2011.
The report of Ernst & Young LLP dated February 28, 2011 concerning the Financial Statement Schedule II, Morningstar, Inc., and subsidiaries Valuation and Qualifying Accounts, is included at the beginning of Part II, Item 8 of this Annual Report on Form 10-K for the year ended December 31, 2010.
The following financial statement schedule is filed as part of this Annual Report on Form 10-K:
Schedule II: Valuation and Qualifying Accounts
All other schedules have been omitted as they are not required, not applicable, or the required information is otherwise included.
|
($000)
|
Balance at Beginning of Year
|
Charged (Credited) to Costs & Expenses
|
Additions (Deductions) Including Currency Translations
|
Balance at End of Year
|
||||||||||||
|
Allowance for doubtful accounts:
|
||||||||||||||||
|
Year ended December 31,
|
||||||||||||||||
|
2012
|
$
|
835
|
|
$
|
1,016
|
|
$
|
(1,282
|
)
|
$
|
569
|
|
||||
|
2011
|
1,056
|
|
1,237
|
|
(1,458
|
)
|
835
|
|
||||||||
|
2010
|
1,339
|
|
413
|
|
(696
|
)
|
1,056
|
|
||||||||
130
3. Exhibits
|
Exhibit
|
|
Description
|
|
|
3.1
|
|
Amended and Restated Articles of Incorporation of Morningstar are incorporated by reference to Exhibit 3.1 to our Registration Statement on Form S-1, as amended, Registration No. 333-115209 (the Registration Statement).
|
|
|
3.2
|
|
By-laws of Morningstar, as in effect on July 28, 2006, are incorporated by reference to Exhibit 3.2 to our Current Report on Form 8-K that we filed with the SEC on July 31, 2006.
|
|
|
4.1
|
|
Specimen Common Stock Certificate is incorporated by reference to Exhibit 4.1 to the Registration Statement.
|
|
|
10.1*
|
|
Form of Indemnification Agreement is incorporated by reference to Exhibit 10.1 to the Registration Statement.
|
|
|
10.2*
|
|
Morningstar Incentive Plan, as amended and restated effective January 1, 2009, is incorporated by reference to Exhibit 10.1 to our Current Report on Form 8-K that we filed with the SEC on May 20, 2009.
|
|
|
10.3*
|
|
Morningstar 2004 Stock Incentive Plan, as amended and restated effective as of July 24, 2009, is incorporated by reference to Exhibit 10.1 to our Quarterly Report on Form 10-Q for the quarter ended June 30, 2009.
|
|
|
10.4*
|
|
Morningstar 2011 Stock Incentive Plan is incorporated by reference to Exhibit 10.1 to our Current Report on Form 8-K that we filed with the SEC on May 18, 2011.
|
|
|
10.5*
|
|
Form of Morningstar 2004 Stock Incentive Plan Stock Option Agreement is incorporated by reference to Exhibit 10.5 to our Annual Report on Form 10-K for the year ended December 31, 2005.
|
|
|
10.6*
|
|
Form of Morningstar 2004 Stock Incentive Plan Restricted Stock Unit Award Agreement for awards made prior to November 15, 2007 is incorporated by reference to Exhibit 10.1 to our Quarterly Report on Form 10-Q for the quarter ended March 31, 2006 (the March 2006 10-Q).
|
|
|
10.7*
|
|
Form of Morningstar 2004 Stock Incentive Plan Director Restricted Stock Unit Award Agreement for awards made prior to November 15, 2007 is incorporated by reference to Exhibit 10.2 to the March 2006 10-Q.
|
|
|
10.8*
|
|
Form of Morningstar 2004 Stock Incentive Plan Restricted Stock Unit Award Agreement for awards made on and after November 15, 2007 and prior to January 1, 2009 is incorporated by reference to Exhibit 10.8 to our Annual Report Form 10-K for the year ended December 31, 2007 (the 2007 10-K).
|
|
|
10.9*
|
|
Form of Morningstar 2004 Stock Incentive Plan Restricted Stock Unit Award Agreement for awards made on and after January 1, 2009 is incorporated by reference to Exhibit 10.10 to our Annual Report on Form 10-K for the year ended December 31, 2008 (the 2008 10-K).
|
|
|
10.10*
|
Form of Morningstar 2004 Stock Incentive Plan Stock Option Agreement for awards made on May 15, 2011 is incorporated by reference to Exhibit 10.1 to our Quarterly Report on Form 10-Q for the quarter ended June 30, 2011 (the June 2011 10-Q).
|
||
|
10.11*
|
|
Form of Morningstar 2004 Stock Incentive Plan Director Stock Option Agreement for awards made on May 15, 2011 is incorporated by reference to Exhibit 10.2 to the June 2011 10-Q.
|
|
|
10.12*
|
|
Form of Morningstar 2004 Stock Incentive Plan Deferral Election Form is incorporated by reference to Exhibit 10.3 to the March 2006 10-Q.
|
|
|
10.13*
|
|
Form of Morningstar 2004 Stock Incentive Plan Director Deferral Election Form is incorporated by reference to Exhibit 10.4 to the March 2006 10-Q.
|
|
|
10.14*
|
|
Form of Morningstar 2011 Stock Incentive Plan Restricted Stock Unit Award Agreement is incorporated by reference to Exhibit 10.1 to our Quarterly Report on Form 10-Q for the quarter ended September 30, 2011 (the September 2011 10-Q).
|
|
|
10.15*
|
|
Form of Morningstar 2011 Stock Incentive Plan Director Restricted Stock Unit Award Agreement is incorporated by reference to Exhibit 10.1 to the September 2011 10-Q.
|
|
|
10.16*
|
|
Form of Morningstar 2011 Stock Incentive Plan Stock Option Agreement is incorporate by reference to Exhibit 10.18 to our Annual Report on Form 10-K for the year ended December 31, 2011 (the 2011 10-K)
|
|
|
10.17*
|
|
Form of Morningstar 2011 Stock Incentive Plan Director Stock Option Agreement is incorporated by reference to Exhibit 10.19 to the 2011 10-K.
|
|
|
10.18*
|
|
Agreement dated as of February 18, 2010 between Tao Huang and Morningstar is incorporated by reference to Exhibit 10.1 to our Current Report on Form 8-K that we filed with the SEC on February 18, 2010.
|
|
131
|
10.19*
|
|
Separation Agreement dated as of November 10, 2010 between Morningstar Associates, Morningstar, and Patrick Reinkemeyer is incorporated by reference to Exhibit 10.1 to our Current Report on Form 8-K that we filed with the SEC on November 10, 2010.
|
|
|
10.20*
|
|
Separation Agreement dated as of January 27, 2011 between Morningstar and Tao Huang is incorporated by reference to Exhibit 10.1 to our Current Report on Form 8-K that we filed with the SEC on January 28, 2011.
|
|
|
21.1†
|
|
Subsidiaries of Morningstar.
|
|
|
23.1†
|
|
Consent of KPMG LLP.
|
|
|
23.2†
|
|
Consent of Ernst & Young LLP.
|
|
|
31.1†
|
|
Certification of Chief Executive Officer pursuant to Rule 13a-14(a) and 15d-14(a) of the Securities Exchange Act of 1934, as amended.
|
|
|
31.2†
|
|
Certification of Chief Financial Officer pursuant to Rule 13a-14(a) and 15d-14(a) of the Securities Exchange Act of 1934, as amended.
|
|
|
32.1†
|
|
Certification of Chief Executive Officer Pursuant to 18 U.S.C. 1350, as adopted pursuant to Section 906 of the Sarbanes-Oxley Act of 2002.
|
|
|
32.2†
|
|
Certification of Chief Financial Officer Pursuant to 18 U.S.C. 1350, as adopted pursuant to Section 906 of the Sarbanes-Oxley Act of 2002.
|
|
|
101†
|
|
The following financial information from Morningstar Annual Report on Form 10-K for the year ended December 31, 2011, filed with the SEC on February 28, 2013, formatted in XBRL: (i) Consolidated Statements of Income, (ii) Consolidated Statements of Comprehensive Income, (iii) Consolidated Balance Sheets, (iv) Consolidated Statement of Equity, (v) Consolidated Statements of Cash Flows and (vi) the Notes to Consolidated Financial Statements.
|
|
* Management contract with a director or executive officer or a compensatory plan or arrangement in which directors or executive officers are eligible to participate.
† Filed herewith.
132
SIGNATURES
Pursuant to the requirements of Section 13 or 15(d) of the Securities Exchange Act of 1934, the registrant has duly caused this report to be signed on its behalf by the undersigned thereunto duly authorized on
February 28, 2013
.
|
|
|
MORNINGSTAR, INC.
|
|
|
|
|
|
|
|
By:
|
/s/ Joe Mansueto
|
||
|
|
|
Joe Mansueto
|
|
|
|
|
Title: Chairman of the Board and Chief Executive Officer
|
|
Pursuant to the requirements of the Securities Exchange Act of 1934, this report has been signed below by the following persons on behalf of the registrant and in the capacities and on the dates indicated.
|
Signature
|
Title
|
Date
|
||
|
/s/ Joe Mansueto
|
Chairman of the Board and Chief Executive
|
February 28, 2013
|
||
|
Joe Mansueto
|
Officer (principal executive officer)
|
|||
|
/s/ Scott Cooley
|
Chief Financial Officer (principal
|
February 28, 2013
|
||
|
Scott Cooley
|
accounting and financial officer)
|
|||
|
/s/ Donald J. Phillips II
|
Director
|
February 28, 2013
|
||
|
Donald J. Phillips II
|
||||
|
/s/ Cheryl Francis
|
Director
|
February 28, 2013
|
||
|
Cheryl Francis
|
||||
|
/s/ Steven Kaplan
|
Director
|
February 28, 2013
|
||
|
Steven Kaplan
|
||||
|
/s/ Bill Lyons
|
Director
|
February 28, 2013
|
||
|
Bill Lyons
|
||||
|
/s/ Jack Noonan
|
Director
|
February 28, 2013
|
||
|
Jack Noonan
|
||||
|
/s/ Paul Sturm
|
Director
|
February 28, 2013
|
||
|
Paul Sturm
|
||||
|
/s/ Hugh Zentmyer
|
Director
|
February 28, 2013
|
||
|
Hugh Zentmyer
|
||||
133
TABLE OF CONTENTS
Part IItem 1. BusinessItem 1B. Unresolved Staff CommentsItem 2. PropertiesItem 3. Legal ProceedingsItem 4. Mine Safety DisclosuresPart IIItem 5. Market For Registrant's Common Equity, Related Stockholder Matters and Issuer Purchases Of Equity SecuritiesItem 6. Selected Financial DataItem 7. Management S Discussion and Analysis Of Financial Condition and Results Of OperationsItem 7A. Quantitative and Qualitative Disclosures About Market RiskItem 8. Financial Statements and Supplementary DataItem 9. Changes in and Disagreements with Accountants on Accounting and Financial DisclosureItem 9A. Controls and ProceduresItem 9B. Other InformationPart IIIItem 10. Directors, Executive Officers, and Corporate GovernanceItem 11. Executive CompensationItem 12. Security Ownership Of Certain Beneficial Owners and Management and Related Stockholder MattersItem 13. Certain Relationships and Related Transactions, and Director IndependenceItem 14. Principal Accountant Fees and ServicesPart IVItem 15. Exhibits and Financial Statement Schedules