MORNINGSTAR, INC.
10-Ks and 10-Qs
|
|
|
|
|
|
|
|
|
|
|
|
|
|
|
|
|
|
|
|
|
|
|
|
|
|
|
|
|
|
|
|
|
|
|
|
|
|
|
|
|
|
|
|
|
|
|
|
|
|
|
|
|
|
|
|
UNITED STATES
SECURITIES AND EXCHANGE COMMISSION
Washington D.C. 20549
|
FORM 10-K
|
||||
|
x
|
ANNUAL REPORT PURSUANT TO SECTION 13 OR 15(d) OF THE SECURITIES EXCHANGE ACT OF 1934
|
FOR THE FISCAL YEAR ENDED DECEMBER 31,
2018
OR
|
¨
|
TRANSITION REPORT PURSUANT TO SECTION 13 OR 15(d) OF THE SECURITIES EXCHANGE ACT OF 1934
|
For the transition period from to
Commission File Number: 000-51280
MORNINGSTAR, INC.
(Exact Name of Registrant as Specified in its Charter)

|
Illinois
|
36-3297908
|
|
|
(State or Other Jurisdiction of
|
(I.R.S. Employer
|
|
|
Incorporation or Organization)
|
Identification Number)
|
|
22 West Washington Street
Chicago, Illinois
60602
(Address of Principal Executive Offices)
(312) 696-6000
(Registrant's Telephone Number, Including Area Code)
Securities registered pursuant to Section 12(b) of the Act:
|
Title of Each Class
|
Name of Each Exchange on Which Registered
|
|
|
Common stock, no par value
|
The Nasdaq Stock Market LLC
|
|
Securities registered pursuant to Section 12(g) of the Act:
None
Indicate by check mark if the Registrant is a well-known seasoned issuer, as defined in Rule 405 of the Securities Act. Yes
x
No
¨
Indicate by check mark if the Registrant is not required to file reports pursuant to Section 13 or Section 15(d) of the Act. Yes
¨
No
x
Indicate by check mark whether the Registrant (1) has filed all reports required to be filed by Section 13 or 15(d) of the Securities Exchange Act of 1934 during the preceding 12 months (or for such shorter period that the Registrant was required to file such reports), and (2) has been subject to such filing requirements for the past 90 days. Yes
x
No
¨
Indicate by check mark whether the registrant has submitted electronically every Interactive Data File required to be submitted pursuant to Rule 405 of Regulation S-T (§232.405 of this chapter) during the preceding 12 months (or for such shorter period that the registrant was required to submit such files). Yes
x
No
¨
Indicate by check mark if disclosure of delinquent filers pursuant to Item 405 of Regulation S-K is not contained herein, and will not be contained, to the best of Registrant's knowledge, in definitive proxy or information statements incorporated by reference in Part III of this Form 10-K or any amendment to this Form 10-K.
x
Indicate by check mark whether the registrant is a large accelerated filer, an accelerated filer, a non-accelerated filer, a smaller reporting company, or an emerging growth company. See the definitions of “large accelerated filer,” “accelerated filer,” “smaller reporting company,” and "emerging growth company" in Rule 12b-2 of the Exchange Act.
|
Large accelerated filer
x
|
Accelerated filer
¨
|
Non-accelerated filer
¨
|
Smaller reporting company
¨
|
Emerging growth company
o
|
||
If an emerging growth company, indicate by check mark if the registrant has elected not to use the extended transition period for complying with any new or revised financial accounting standards provided pursuant to Section 13(a) of the Exchange Act.
o
Indicate by check mark whether the Registrant is a shell company (as defined in Rule 12b-2 of the Exchange Act). Yes
¨
No
x
The aggregate market value of shares of common stock held by non-affiliates of the Registrant as of June 30,
2018
was
$2.4 billion
. As of February 15,
2019
, there were
42,587,504
shares of the Registrant's common stock, no par value, outstanding.
DOCUMENTS INCORPORATED BY REFERENCE
Certain parts of the Registrant's Definitive Proxy Statement for the
2019
Annual Meeting of Shareholders are incorporated into Part III of this Form 10-K.
Table of Contents
|
|
||
|
|
||
|
|
||
|
|
||
|
|
|
|
|
|
||
|
|
||
|
|
||
|
|
||
|
|
||
|
|
||
|
|
||
|
|
||
|
|
||
|
|
||
2
Part I
Item 1. Business
Overview
Morningstar, Inc. is a leading provider of independent investment research in North America, Europe, Australia, and Asia. Our core competencies are data, research, and design, and we employ each of these to create products that clearly convey complex investment information to investors of all kinds. We started with affordable publications for individuals, then moved to creating technology solutions for professionals to help them research and select investments for clients. Today, we offer a suite of cloud-based solutions that serve individuals, financial advisors, asset managers, retirement plan providers and sponsors, and institutional investors in the private capital markets. In addition, we apply our valuation-based investing approach to managing assets for clients who prefer not to make investment decisions themselves. Since our founding in 1984, we’ve expanded our presence in global markets where investors need an independent view they can trust.
We help investors in two simple ways. First, we support individual investors and financial professionals who make their own investment decisions with an extensive product line of web-based tools, investment data, and research that helps investors make the most suitable choices and recommendations. Our customers have access to a wide selection of fundamental equity research, manager research, credit ratings, and private capital markets research directly on our proprietary desktop or web-based software platforms, through subscriptions, data feeds, and third-party distributors.
Second, we provide investment management services, investment analysis platforms, and portfolio management and accounting software tools to advisors and financial institutions. Our managed portfolio offerings help financial institutions deliver investor-friendly products based on our valuation-driven, goals-based approach to investing. Applying our expertise in asset allocation, investment selection, and portfolio construction, our global investment team creates long-term investment strategies built on Morningstar’s expertise. We help retirement plan sponsors build high-quality savings programs for employees. Our financial technology solutions allow advisors to continually demonstrate their value to clients, from creating an initial investment proposal to reporting portfolio performance and providing automated rebalancing tools.
As of December 31, 2018, we served approximately 255,000 financial advisors, 1,500 asset management firms, 30 retirement plan providers, 248,000 retirement plans, and 10 million individual investors. We also provide data on the private capital markets to approximately 3,700 institutional clients.
Our independence and our history of innovation make us a trusted resource for investors. While other companies may offer research, ratings, data, software products, or investment management services, we are one of the few companies that can deliver all of these with the best interest of the investor in mind. We believe putting investors first, paired with the way we use information design and technology to communicate complex financial information, sets us apart from our peers in the financial services industry.
Morningstar covers a wide range of investment offerings, including managed investment products, publicly listed companies, fixed-income securities, private capital markets, and real-time global market data. We focus our data and research efforts on several different areas:
Manager research (including mutual funds, exchange-traded funds, separate accounts, and other vehicles)
We’ve been providing independent analyst research on managed investment strategies since the mid-1980s. We use this analysis to provide research reports and qualitative, forward-looking Morningstar Analyst Ratings for approximately 4,800 funds, ETFs, and separately managed accounts globally. We also publish qualitative research and ratings on state-sponsored college savings plans, target-date funds, and health-savings accounts. This analysis augments other quantitative ratings and analytics, such as the Morningstar Rating for funds (the “star rating”), which ranks managed investment strategies such as mutual funds based on their past performance versus peers. In addition, the Morningstar Style Box visually depicts a strategy’s underlying investment style, making it easier to compare investments and build portfolios. The star rating and style box have become important tools that millions of investors and advisors use in making investment decisions.
3
In recent years, we’ve launched several new ratings. The Morningstar Sustainability Rating helps investors evaluate funds based on environmental, social, and governance factors. Morningstar now provides Sustainability Ratings for approximately 45,000 investment vehicles. The Morningstar Quantitative Rating is a forward-looking rating that uses algorithmic techniques to evaluate mutual funds. It employs machine-learning to infer patterns in the way Morningstar’s manager-research analysts assign ratings to funds and then applies those learnings to rate funds the analysts don’t cover. It significantly expands the breadth of our forward-looking ratings.
As of December 31, 2018, we had about 120 manager research analysts globally, including teams in North America, Europe, Australia, and Asia.
Equity research
As part of our research efforts on individual stocks, we popularized the concepts of economic moat, a measure of competitive advantage originally developed by Warren Buffett, and margin of safety, which reflects the size of the discount in a stock's price relative to its estimated value. The Morningstar Rating for stocks is based on the stock's current price relative to our analyst-generated fair value estimates, as well as the company's level of business risk and economic moat. Our analysts cover approximately 1,500 companies using a consistent, proprietary methodology that focuses on fundamental analysis, competitive advantage assessment, and intrinsic value estimation. Morningstar’s data and research on publicly traded companies is used extensively in products throughout the company, such as institutional equity research, Morningstar Indexes such as the Morningstar Wide Moat Focus Index, our Global Market Barometer, and as a basis for equity portfolio strategies used in our managed portfolios.
PitchBook, which we acquired in December 2016, focuses on private capital markets. PitchBook Analyst Research taps into proprietary data, such as valuations, deal multiples, and fund returns, to deliver analysis that allows clients to quickly gauge trends, map industries, and identify notable company sets in the private capital markets. In 2017, we integrated our publicly traded company fundamental data into the PitchBook platform, allowing institutional investors to better evaluate opportunities in both public and private markets. Morningstar's institutional equity research is also available on the PitchBook platform.
As of December 31, 2018, we had about 110 public equity analysts and 20 private equity analysts globally, making us one of the largest providers of independent equity research. In addition to our analyst-driven coverage, we provide quantitative ratings and reports for approximately 55,000 publicly traded companies globally. These quantitative public equity ratings draw on the fundamental research of our equity analyst team and provide a forward-looking statistical view of the valuation, competitive advantage, and level of uncertainty for stocks that are often under-followed by other research firms.
Credit ratings
Morningstar Credit Ratings, LLC, our credit ratings subsidiary, is a Nationally Recognized Statistical Rating Organization (NRSRO) that is focused on structured finance and credit ratings for corporate issuers and financial institutions. We bring transparency, unique perspectives, and superior client service to investors across the fixed-income markets. We provide new issue and surveillance ratings and analysis for commercial mortgage-backed securities (CMBS), residential mortgage-backed securities (RMBS), and other types of asset-backed securities (ABS), as well as credit ratings on corporate and financial issuers and their individual debt issuances.
As of December 31, 2018, we had about 70 U.S.-based credit analysts.
Portfolio advice methodologies
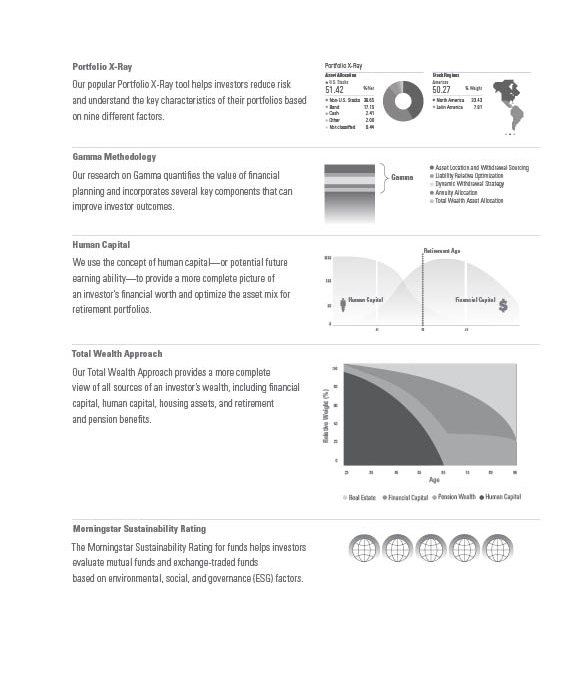
Since our beginning, Morningstar has provided individual investors with tools to monitor their own investments, such as the Ownership Zone, Sector Delta, and Portfolio X-Ray. These do-it-yourself applications allow investors to see how different investments work together to form a portfolio and to track its progress.
4
We also continue to improve our total wealth approach to investing and asset allocation capabilities, which are mainly used in the investment management products we offer to professional investors. We also look for ways to infuse these capabilities into decision support tools. Whereas traditional asset allocation methodologies focus solely on financial assets (such as stocks and bonds), our investment management group has developed methodologies that provide a more holistic view of all sources of wealth, including financial capital, human capital, housing assets, and retirement and pension benefits. Our investment management group offers in-depth advice on asset allocation, portfolio construction, and security selection to meet the needs of investors and professionals looking for integrated portfolio solutions. We’ve also published research on "gamma," an innovative measure that quantifies how much additional retirement income investors can generate by making better financial planning decisions.
The following graphics describe some of our portfolio advice methodologies in greater detail:
5

6
7
Our Mission
Our mission is to empower investor success. Everything we do at Morningstar is in the service of the investor. The investing ecosystem is complex and navigating it with confidence requires a trusted, independent voice. Our perspective--built every day by more than 5,000 employees across the globe--is delivered to institutions, advisors, and individuals with a single-minded purpose: to empower every investor with the conviction that he or she can make better-informed decisions and realize success on his or her own terms.
Our Strategy
Our strategy is to deliver insights and experiences to clients that are essential to investing. Proprietary data sets, meaningful analytics, independent research and effective investment strategies are at the core of the powerful digital solutions that investors across client segments rely on.
We execute our strategy through four connected elements: our people, our work, our clients, and our brand. The interaction between these four elements has enabled Morningstar to establish a position in the industry that is differentiated from our competition. We believe that our intangible assets, including the strength of our brand and our unique intellectual property, are difficult for competitors to replicate. Additionally, we strive to ensure our customers receive demonstrable value from our solutions causing them to be reluctant to undertake the cost of switching to other providers.
Trends Defining Our Business
We are focusing our strategy plan around three secular trends that are shaping the investment industry and defining the solutions we expect our customers to demand in the future.
Investors embracing a new generation of solutions require differentiated data, research, and analytics
A new generation of approaches and technologies is creating simpler and more personal experiences for the end investor. Established financial solution providers are competing against both startups and diversifying competitors to provide these experiences. Data and analytics are driving this trend, and we are well-positioned to provide these resources.
Investors demand advice providers deliver more value to earn their fees
This change in investor expectations is driving change for all participants across the financial services industry. Therefore, we are focused on delivering digitized advice solutions that enable advisors to become more efficient, allowing them to allocate more time to the highest value activities. As part of this, we anticipate that investment decisions by all market participants will increasingly be influenced by third-party expertise and that the importance of financial planning will continue to grow.
Convergence of public and private markets
The private markets have become increasingly important and are influencing the public markets more than ever. Private companies are currently staying private longer, leading to a structurally lower level of public companies and the shift of a large portion of company capital (market capitalization) out of the public view. In response, new insights and solutions will be required to help sophisticated investors and their service providers navigate investment strategies that will be increasingly reliant on both public and private investment opportunities. Our unique ability to combine our leading private market data and insights along with our expanding public market data coverage puts us in a position to capitalize on this market convergence.
Major Customer Groups
Given our strategy and core capabilities discussed above, we focus on five primary customer groups:
|
•
|
Advisor (including independent financial advisors and those affiliated with broker/dealers or other intermediaries);
|
|
•
|
Asset management (including fund companies, insurance companies, and other companies that build and manage portfolios of securities for their clients);
|
|
•
|
Workplace/retirement (including retirement plan providers and plan sponsors);
|
|
•
|
Individual investor; and
|
|
•
|
Private market/venture capital investors.
|
8
Advisor
Financial advisors work with individual investors to help them reach their financial goals. This customer group includes independent advisors at registered investment advisor (RIA) firms, advisors affiliated with independent broker/dealers, dually registered advisors, and “captive” advisors who are employees of a broker/dealer. These broker/dealers include wirehouses, regional broker/dealers, and banks. The advisor landscape is broad in both the U. S. and in other parts of the world where we focus. Our largest market is the U.S., where Cerulli Associates estimates there were almost 312,000 financial advisors as of the end of
2018
.
We believe our deep understanding of individual investors’ needs allows us to work with advisors to help them make more efficient use of their time and deliver better investment outcomes for their clients. Our advisor solutions also draw on Morningstar’s proprietary investment research methodologies and research insights.
We sell our advisor-related solutions both directly to independent financial advisors and through enterprise licenses, which allow financial advisors associated with the licensing firm to use our products.
We are expanding the range of services we offer to help financial advisors with all aspects of their daily workflow needs, including investment decision-making, portfolio construction, client monitoring and reporting, practice management, portfolio rebalancing that connects with custodial and trading interfaces, and financial planning. Because advisors are increasingly outsourcing investment management, we're continuing to enhance Morningstar Managed Portfolios to help advisors save time and reduce compliance risk.
Our main products for financial advisors are Morningstar Advisor Workstation, Morningstar Office, and Morningstar Managed Portfolios.
Asset management
Asset management firms manufacture financial products and manage and distribute investment portfolios. We estimate that there are more than 3,200 asset management firms globally, ranging from large, global firms to firms with small fund lineups and operations in a single market or region. The asset management customer group includes individuals involved in sales, marketing, product development, business intelligence, and distribution, as well as investment management (often referred to as the “buy side”), which includes portfolio management and research.
Our asset management offerings help companies connect with their clients because of Morningstar’s strong brand presence with both financial advisors and individual investors. We offer a global reach and have earned investors’ trust in our unbiased approach, investor-centric mission, and thought leadership.
The key products we offer for asset management firms include Morningstar Direct for Asset Management, Morningstar Data, and Morningstar Indexes. For the buy side, key products include Morningstar Research, Morningstar Credit Ratings, Morningstar Data, and Morningstar Direct.
Workplace/retirement
In the U.S., 401(k) retirement plans and other defined contribution (DC) plan types, such as 403(b)s and the Thrift Savings Plan, are becoming the dominant plan type offered by employers. According to the Investment Company Institute, there were $8.1 trillion in assets in DC plans at end of the third quarter of 2018, compared to $3.2 trillion in private-sector defined benefit (DB) plans and $6.1 trillion in government DB plans.
DC plans are now helping millions of workers in the U.S. save for retirement and significant strides have been made to roll out automated plan design features, such as auto-enrollment and auto-savings increases. The industry continues to struggle to boost employee savings rates and retirement readiness. We believe that a significant market exists for solutions, such as our managed accounts offering, that are designed to address these shortcomings by providing personalized advice that helps individuals build assets for retirement and beyond.
9
Other countries continue to follow in the footsteps of the U.S., abandoning traditional DB plans and pensions in favor of DC-focused solutions that shift saving for retirement from the employer to employee. Currently, our main focus is the U.S. market as it continues to demonstrate healthy growth and still rewards investment. Additionally, many of our solutions are not easily adapted to foreign markets due to significant differences in regulatory frameworks that govern retirement saving and investing.
Our retirement solutions primarily reach individual investors through employers (plan sponsors) that offer DC plans for their employees. We can work directly with plan sponsors to help them design a suitable retirement program, but more typically, we deliver our retirement solutions through retirement plan providers that package our advice and investment lineups with administrative and record-keeping services. We recently expanded into the broker/dealer market by developing a solution called Morningstar Plan Advantage that helps advisors grow their retirement plan book of business.
Our main product offerings for the workplace/retirement customer group include managed retirement accounts, fiduciary services, and custom models.
Individual investors
We offer tools and content for individual investors who invest to build wealth and save for other goals, such as retirement or college tuition. A Gallup survey released in April 2018 found that approximately 55% of individuals in the U.S. invest in the stock market either directly, through mutual funds, or self-directed retirement plans. We design most of our products for individual investors who are actively involved in the investing process and want to take charge of their own investment decisions. We also reach individuals who want to learn more about investing or want to validate the advice they receive from brokers or financial advisors.
Our main product for individual investors is Morningstar.com, which can be accessed via desktop, tablet, or mobile phone applications, and includes both paid Premium Memberships and free content available to registered users and visitors. We also reach individual investors through licensing our content to other websites, such as Yahoo Finance, MSN Money, and Google Finance.
Private market/venture capital investors
Through PitchBook, we reach approximately 3,700 investment and research firms and their service providers, including venture capital and private equity firms, corporate development teams, investment banks, limited partners, lenders, law firms, and accounting firms.
PitchBook covers the full lifecycle of venture capital, private equity, and M&A, including the limited partners, investment funds, and service providers involved. Our main product for this customer group is the PitchBook Platform, an all-in-one research and analysis workstation that gives clients the ability to access data, discover new connections, and conduct research on potential investment opportunities.
Business Model
We sell products and services that generate revenue in three major categories:
Licensed-based:
The majority of our research, data, and proprietary platforms are accessed via subscriptions or contract-based licensing arrangements that grant access on either a per user or enterprise-basis for a specified period of time. Licensed-based revenue includes Morningstar Data, Morningstar Direct, Morningstar Advisor Workstation, Morningstar Office, PitchBook Data, Premium Memberships on Morningstar.com, and other similar products. Licensed-based revenue represented
73.7%
of our 2018 consolidated revenue compared to
73.2%
in 2017 and
72.6%
in 2016.
Asset-based:
We charge basis points and other fees for assets under management or advisement. Our Morningstar Investment Management, Workplace Solutions, and Morningstar Indexes products all fall under asset-based revenue. Asset-based revenue represented
19.6%
of our 2018 consolidated revenue compared to
20.0%
in 2017 and
20.5%
in 2016.
10
Transaction-based:
Ad sales on Morningstar.com and our Credit Ratings products comprise the majority of the products that are transactional, or one-time, in nature, versus the recurring revenue streams represented by our licensed and asset-based products. Transaction-based revenue represented
6.7%
of our 2018 consolidated revenue compared to
6.8%
in 2017 and
7.0%
in 2016.
Major Products and Services
The section below describes our top five products by 2018 revenue and some of our other key products and services.
Morningstar Data
Morningstar Data gives institutions access to a full range of investment data spanning numerous investment databases, including equity fundamentals, managed investments, and real-time pricing and market data. We offer licenses and data feeds for our proprietary statistics, such as the Morningstar Style Box and Morningstar Rating, and a wide range of other data, including information on investment performance, risk, portfolios, operations data, fees and expenses, cash flows, financial statement data, consolidated industry statistics, and investment ownership. Institutions use Morningstar Data in a variety of investor communications, including websites, print publications, and marketing fact sheets, as well as for internal research and product development.
The Morningstar Data team pursues emerging technologies including robotics process automation (RPA), machine learning, and natural language processing to further automate the remaining manual, nonstructured, and complex data acquisition processes that traditional technologies are not able to address. This automation initiative has gained traction with the creation of machine learning models that reduce the time and effort to collect data, thus creating additional capacity to acquire new data sets. We’ve also made considerable progress in developing a scalable, easy-to-use global data delivery system that allows our users to define how they want to access information in a manner that works best for their application. This includes delivery of investment data via flat files, but future enhancements will offer a robust application programming interface (API) to access data and the ability for us to stream data directly to our clients.
In
2018
, our data expansion efforts led to the addition of environmental, social, and governance (ESG) intentionality attributes, strategic beta attributes, clean shares (service fee arrangements), revenue by region (geo-segment data) analytics, and economic exposure analytics. In Europe, we collected and delivered new regulatory data sets including Markets in Financial Instruments Directive (MiFID II) in Europe, Packaged Retail and Insurance-based Investment Products (PRIIPs) in Europe, and the German Investment Tax Act in Germany. In Asia-Pacific, we expanded our Chinese fund sales suitability data and added a data set for annual report financials of Japanese-domiciled funds, including attributes such as interest income, profit and loss on the buying and selling of securities, futures capital gains, net income, stock futures ratio, and bond futures ratio. We also continued to invest in and expand our equity data sets, including daily total shares outstanding for higher-quality calculation of market capitalization and free float; the collection of CEO pay, median pay, and the ratio between them for U.S. companies; and normalized profitability metrics, bank reserve requirements, debt maturity schedules, and other industry metrics for the largest 8,000 companies. We also launched four fixed-income data-feed packages, including interest rate risk, return analytics, exposure analytics, and credit risk analytics, which surface more than 35 new data points.
Pricing for Morningstar Data is based on the number of investment vehicles covered, the amount of information provided for each security, the frequency of updates, the method of delivery, the size of the licensing firm, the level of distribution, and the specific intention for a client’s use of Morningstar Data, otherwise known as the “use-case.”
Our main competitors for mutual fund data include Financial Express and Thomson Reuters on a global basis, as well as smaller players that focus on local or regional information. For market and equity data, we primarily compete with FactSet, Financial Express, Interactive Data, and Thomson Reuters.
Morningstar Data is our largest product based on revenue and accounted for
18.2%
,
18.2%
, and
19.4%
of our consolidated revenue in
2018
,
2017
, and
2016
, respectively.
11
Morningstar Direct
Morningstar Direct is an investment-analysis platform built for asset management and financial services professionals
that includes data and advanced analytical tools on the complete range of securities in Morningstar's global database, as well as privately held investments and data from third-party providers. It helps portfolio managers, investment consultants, financial product managers, wealth managers, and other financial professionals develop, select, and monitor investments. Users can create advanced performance comparisons and in-depth analyses of an investment's underlying investment style, as well as custom-branded reports and presentations.
In
2018
, we launched Morningstar Direct for Asset Management and Morningstar Direct for Wealth Management. These next-generation editions of Morningstar Direct all share the common, web-based Morningstar Cloud platform, allowing us to deliver workflow-specific functionality, more frequent upgrades, and continuous client support in a more efficient manner than the desktop-based Direct product. We also launched our new Investor Pulse business intelligence application, which allows users to explore flows data to pinpoint investor trends and predict future outcomes. This feature is exclusively available on the web-based editions of Morningstar Direct.
In 2018, we released dozens of new ESG data points for clients to analyze in the web-based editions of Morningstar Direct, including our new Carbon Score, which assesses a portfolio’s overall carbon risk. Clients can also view and stress test aggregate sustainability scores of a specific portfolio. For a more accurate picture of fund holdings, our new Economic Exposure view in the web-based editions of Morningstar Direct reveals the underlying asset value of certain derivatives contracts rather than the value of the contracts themselves. We also developed a proprietary methodology that shows the geographic location of a portfolio’s revenue exposure, measured by where its underlying companies actually receive the revenue.
Morningstar Direct's primary competitors are Bloomberg, eVestment Alliance, FactSet Research System’s Cognity and SPAR, Strategic Insight’s Simfund, and Thomson Reuters’ Eikon.
Morningstar Direct had
15,033
licensed users worldwide as of December 31,
2018
.
Pricing for Direct is based on the number of licenses purchased. Add-on features, like the advanced Global Risk Model, may incur additional fees.
Morningstar Direct is our second-largest product based on revenue and accounted for
13.5%
,
13.6%
, and
13.8%
of our consolidated revenue in
2018
,
2017
, and
2016
, respectively.

12
Morningstar Investment Management
Morningstar Investment Management’s flagship offering is Morningstar Managed Portfolios, an advisor service consisting of model portfolios designed mainly for fee-based independent financial advisors. Morningstar Managed Portfolios are primarily multi-asset strategies built using mutual funds, ETFs, and individual securities, and are tailored to meet specific investment time horizons, risk levels, and projected outcomes to help investors reach their financial goals.
Morningstar Managed Portfolios are available through two channels: our fee-based discretionary asset management service, also known as a turnkey asset management program (TAMP), or as strategist models on third-party managed account platforms. To date, our TAMP is available only in the U.S., whereas we strictly act as a model provider in our international markets.
Our TAMP is an end-to-end fee-based advisory experience, in which advisors access our model portfolios through a proprietary technology platform that offers functionality such as proposals, client reporting, customer service, and back-office features such as trading. Using our TAMP allows the advisor to share fiduciary responsibility with us.
Morningstar Managed Portfolios are also offered on third-party platforms in both the U.S. and our international markets. When acting solely as a model provider, we do not provide any of the functionality that is provided by our TAMP, nor do we have an advisory relationship with the advisor’s end client.
In 2018, we launched Morningstar Funds Trust (Trust), a series of nine open-end, multimanager mutual funds registered under the Investment Company Act of 1940.The Morningstar Funds--available exclusively through the U.S. version of the Morningstar Managed Portfolios service--were designed to replace third-party mutual funds used in our managed portfolios. As of December 31, 2018, we have converted approximately $1 billion of existing client assets into model portfolios that use the Morningstar Funds, and given advisor demand for high-quality, cost-effective, outsourced investment management, we expect demand for our portfolios that use Morningstar Funds to grow in 2019 and beyond.
We charge asset-based program fees for Morningstar Managed Portfolios, which are typically based on the type of service (i.e., TAMP versus strategist models) and the products contained within the portfolios.
In addition to Morningstar Managed Portfolios, other services we provide include institutional asset management (e.g., act as a subadvisor) and asset allocation services for asset managers, broker/dealers, and insurance providers. We offer these services through a variety of registered entities in Australia, Canada, UAE, France, Hong Kong, India, Japan, South Africa, the United Kingdom, and the U.S.
We base pricing for institutional asset management and asset allocation services on the scope of work, our degree of investment discretion, and the level of service required. In the majority of our contracts, we receive asset-based fees.
For Morningstar Managed Portfolios offered through our TAMP, our primary competitors are AssetMark, Brinker Capital, and SEI Investments. Our primary strategist offering competitors are Blackrock, Envestnet PMC, Russell, and Vanguard in the U.S., and we face competition from Financial Express and Seven in EMEA, and Dimensional, Russell, and Vanguard in Australia. We also compete with in-house research teams at independent broker/dealers who build proprietary portfolios for use on brokerage firm platforms, as well other registered investment advisors that provide investment strategies or models on these platforms.
Morningstar Investment Management is our third-largest product based on revenue and made up
10.9%
,
11.1%
, and
11.5%
of our consolidated revenue in
2018
,
2017
, and
2016
, respectively.
13
PitchBook Data
PitchBook Data, Inc., which we acquired in December 2016, provides data and research covering the private capital markets, including venture capital, private equity, and mergers and acquisitions (M&A). PitchBook's main product is the PitchBook Platform, an all-in-one research and analysis workstation for sophisticated investment and research professionals, including venture capital and private equity firms, corporate development teams, investment banks, limited partners, lenders, law firms, and accounting firms. Close to 23,000 professionals use this software to source deals, raise funds, build buyer lists, create benchmarks, network, and more. To accommodate their diverse needs, the platform offers advanced search functionality, a fully customizable dashboard and email alerts that help users discover and monitor relevant information.
PitchBook also offers a mobile application, Excel plug-in, data feeds, and flexible, à la carte data solutions that allow clients to access a variety of data points on demand.
In
2018
, we delivered over 300 upgrade releases through the PitchBook Platform, making it easier and faster to derive meaningful insights into the evolving capital markets. We also focused on expanding datasets, adding coverage of over 320,000 new private middle market companies and also substantially increasing the number of financial statements available for more than 70,000 European private companies already covered. We also built new advanced search functionality for private debt and lenders, a dataset that makes up a substantial portion of the private capital markets but has been historically difficult to research. Over the past year, we increased the number of lenders we cover to 8,800 firms from 3,100 firms. We also integrated thematic and company-specific public equity research from Morningstar alongside PitchBook's own extensive private equity, venture capital, and M&A research. Our redesigned Research Center provides analysis spanning the public and private market continuum and offers greater transparency into the calculation methodologies behind key figures reported in public company financials, such as EBITDA and enterprise value.
PitchBook's main competitors are CB Insights, Dow Jones VentureSource, Prequin, S&P Capital IQ, and Thomson Reuters.
Pricing for the PitchBook Platform is based on the number of seats, with the standard base license fees per user, with customized prices for large enterprises, boutiques, and startup firms.
PitchBook is our fourth-largest product based on revenue and made up
9.8%
of our consolidated revenue in
2018
, compared with
7.0%
in
2017
.
Morningstar Advisor Workstation
Morningstar Advisor Workstation is a web-based portfolio management system that combines Morningstar’s data, research, and analytics with best-in-class proposal and presentation generation tools. The software is typically sold through an enterprise contract and is primarily for retail advisors and home-office advisors due to its strong ties and integrations with home-office systems and processes and a library of FINRA-reviewed reports for compliance purposes. It allows advisors to build and maintain a client portfolio database that can be fully integrated with the home-office firm's back-office technology and resources. Moreover, it helps advisors present and clearly illustrate their portfolio investment strategies through an easy-to-understand reporting output.
In
2018
, we continued to enhance integrations with several leading third-party platforms, including Skience from Athene Group, MoneyGuidePro, eMoney, Redtail, and Albridge, to help advisors import client data into all aspects of their daily workflows.
As of December 31, 2018, approximately 170 companies held licenses for the enterprise version of Morningstar Advisor Workstation, which accounts for approximately 185,000 users globally. Pricing for Morningstar Advisor Workstation varies based on the number of users, as well as the number of databases licensed and level of functionality. We charge fixed annual fees per licensed user for a base configuration of Morningstar Advisor Workstation, but pricing varies significantly based on the scope of the license.
Competitors for Morningstar Advisor Workstation include AdvisoryWorld (LPL Financial), YCharts, ASI, Kwanti, and Financial Express outside of the U.S. Occasionally, broker/dealers also decide to build their own internal tools and attempt to bring their advisors’ practice management tools in-house.
14
Morningstar Advisor Workstation is our fifth-largest product based on revenue and made up
8.8%
,
9.6%
, and
10.3%
of our consolidated revenue in
2018
,
2017
, and
2016
, respectively.

Morningstar Office
Morningstar Office is
a portfolio and practice management software package for independent registered investment advisors (RIAs) that combines portfolio accounting and reporting with Morningstar’s data, analytics, and research.
In 2018, Morningstar Office Cloud, our next-generation web-based product for advisors, joined the web-based editions of Morningstar Direct on the Morningstar Cloud platform. Morningstar Office Cloud product enhancements include upgrades to Presentation Studio, which include a custom reporting solution, improvements to practice billing capabilities, user-defined security reclassifications, and a personal finance management component.
Primary competitors to Morningstar Office Cloud include Black Diamond, Envestnet’s Tamarac, Orion Advisor Services, and Advyzon.
As of December 31, 2018, approximately 5,500 financial advisors in the U.S. and the United Kingdom were licensed to use Morningstar Office.
Workplace Solutions
Morningstar Workplace Solutions includes several different offerings, including managed retirement accounts (MRA), fiduciary services, Morningstar Lifetime Allocation Funds, and custom models.
Delivered primarily through the Morningstar Retirement Manager platform, our MRA program helps retirement plan participants define, track, and achieve their retirement goals. As part of this service, we deliver personalized recommendations for a target retirement income goal, a recommended contribution rate to help achieve that goal, a portfolio mix based on our Total Wealth methodology, and specific investment recommendations. We then manage the participant’s investment portfolio for them, assuming full discretionary control. We also offer Advisor Managed Accounts, a program that allows financial advisors to specify and assume fiduciary responsibility for the underlying portfolios that we use in our service. We do not hold assets in custody for the managed retirement accounts we provide.
Our main competitors in MRA are Financial Engines, Fidelity, and Guided Choice. Companies that provide automated investment advice to consumers, such as Betterment and Wealthfront, are also attempting to break into employer-sponsored retirement markets.
15
In our fiduciary services offering, we help plan sponsors build out an appropriate investment lineup for their participants while helping to mitigate their fiduciary risk. Morningstar Plan Advantage is an extension of our fiduciary services that includes a technology platform that enables advisors at broker/dealer firms to more easily offer fiduciary protection, provider pricing, and investment reporting services to their plan sponsor clients.
Our main competitors in fiduciary services are Mesirow and Wilshire Associates, but we are starting to see growing competition with Envestnet and smaller players such as Leafhouse Financial and Iron Financial. Broker/dealers are also looking to introduce their own fiduciary services in direct competition with recordkeepers.
With our custom models, we offer two different services. We work with retirement plan recordkeepers to design scalable solutions for their investment lineups, including target maturity models and risk-based models. We also provide custom model services direct to large plan sponsors, creating target date funds that are customized around a plan’s participant demographics and investment menus. For custom models, we often compete with retirement plan consultants. We also serve as a nondiscretionary subadvisor and index provider for the Morningstar Lifetime Allocation Funds, a series of target-date collective investment trust funds (CITs) offered by UBS Asset Management to retirement plan sponsors. Retirement plan sponsors can select a conservative, moderate, or growth version of the glide path for the funds based on the needs of participants in the plan. For the Lifetime Allocation Funds, we compete with other providers of target-date funds.
In
2018
, we signed our first large wealth management firm onto Morningstar Plan Advantage.
Pricing for Workplace Solutions depends on several different factors, including the level of services offered (including whether the services involve acting as a fiduciary under the Employee Retirement Income Security Act, or ERISA), the number of participants, the level of systems integration required, and the availability of competing products.

Morningstar.com
Our largest website, Morningstar.com, helps individual investors discover, evaluate, and monitor stocks, bonds, ETFs, and mutual funds; build and monitor portfolios; and monitor the markets. Revenue is generated from paid memberships through Morningstar Premium and Internet advertising sales.
Our Morningstar Premium offering is focused on bringing clarity and confidence to investment decisions. Members have access to proprietary Morningstar research, ratings, data, and tools, including analyst reports, portfolio management tools (such as Portfolio X-Ray), and stock and fund screeners.
16
We currently offer Premium Membership services in Australia, Canada, Italy, the United Kingdom, and the U.S.
While many consumer-facing websites purchase advertising programmatically, Morningstar.com owns and sells digital advertising on a direct basis. In our experience, advertisers that desire to reach our significant user base of engaged individual investors support Morningstar.com’s value as a unique, high-quality web property.
In 2018, we successfully migrated all of our Premium membership to the newly redesigned Morningstar.com. The new Morningstar.com features streamlined navigation, a new quote page with an enhanced Analyst Report interface, and a Best Investment Center that prescreens our favorite stock, ETF, and mutual fund ideas.
Morningstar.com primarily competes with trading platforms that concurrently offer research and investing advice, such as Fidelity, Schwab, TD Ameritrade, and eTrade. Research sites, such as The Motley Fool, Seeking Alpha, and Zacks Investment Research, also compete with us for paid membership. In addition, free or “freemium” websites such as Yahoo Finance, Dow Jones/Marketwatch, The Wall Street Journal, Kiplinger, and TheStreet.com all compete for the advertising dollars of entities wishing to reach an engaged audience of investors.
As of December 31, 2018, Morningstar.com had approximately 10 million registered free members worldwide. We also had approximately 116,000 paid Premium members in the U.S. plus an additional
15,000
Premium members across other global markets. We charge a monthly, annual, or multi-year subscription fee for Morningstar.com's Premium Membership service.

The graph below shows our annual retention rates for subscription-based products, which are primarily Morningstar.com's Premium Membership service and newsletter products. In
2018
, we estimate that our annual retention rate for subscription-based products was approximately 68%, compared to 66% in
2017
.

17
Morningstar Credit Ratings
Morningstar Credit Ratings, LLC is an NRSRO that provides timely new issue and surveillance ratings for structured finance transactions, as well as corporate issuers and financial institutions and their individual debt issuances. We provide ratings on a broad range of structured finance securities, including commercial mortgage-backed securities (CMBS), residential mortgage-backed securities (RMBS), single-family rental securities, collateralized loan obligations, and other asset-backed securities (ABS). We also provide other (non-credit rating) services such as CMBS deal monitoring, corporate credit estimates, and operational risk assessment services.
In
2018
, we invested heavily in our CMBS rating business, introducing a new methodology for rating CMBS single asset/single borrower (SASB) transactions, and updating our existing methodology for rating CMBS conduit transactions. We also provided RMBS and ABS market participants with cutting edge thought leadership throughout the year.
Our business competes with several other firms, including DBRS, Fitch, Kroll Bond Ratings, Moody’s, and S&P Global Ratings.
For new-issue ratings, we charge one-time fees to the issuer based on the type of security, the size of the transaction, and the complexity of the issue. Our rating fees also can cover surveillance of the transaction until the securities mature. We charge annual fees for our subscription-based CMBS monitoring service. Pricing for this service varies depending on the solution and the level of access within a client organization.
Morningstar Indexes
We offer a broad range of indexes that can be used as performance benchmarks and for the purposes of creating investment products. Our indexes track major asset classes, including global equity, global fixed income and commodities. We offer multi-asset indexes, strategic beta indexes based on Morningstar’s proprietary research, and sustainability indexes.
In 2018, several global asset managers launched low-cost investment vehicles tracking Morningstar’s beta indexes. In addition, products based on our factor-based indexes, which included dividend-based indexes and moat-focused indexes that draw upon our proprietary research launched in the U.S., Europe, and Asia. We launched additional sustainability-focused index families, including Low Carbon Risk, Sustainable Environment, and Sustainability Leaders.
More than 100 firms have now joined the Morningstar Open Indexes Project, which allows asset managers and other firms the ability to benchmark their investments against more than 100 Morningstar global equity indexes for free. The goal of the project is to lower benchmarking costs for the industry and improve outcomes for investors in response to the escalating costs of licensing market-cap-weighted equity indexes. Participants receive price return, total return, net return, and month-end constituent data for indexes included in the project.
We license Morningstar Indexes to numerous institutions that offer ETFs, exchange-traded notes, and structured products based on the indexes. Firms license Morningstar Indexes for both product creation (where we typically receive the greater of a minimum fee or basis points tied to assets under management) and data licensing (where we typically receive annual licensing fees). In both cases, our pricing varies based on the level of distribution, the type of user, and the specific indexes licensed.
Major competitors for Morningstar Indexes include FTSE Russell, MSCI, S&P Dow Jones Indices (offered through S&P Global), and Bloomberg Indices.
Largest Customer
In
2018
, our largest customer accounted for less than 2% of our consolidated revenue.
18
Acquisitions and Divestitures
Since our founding in 1984, we've supported our organic growth by introducing new products and services and expanding our existing offerings. From 2006 through
2018
, we also completed 31 acquisitions to support our growth objectives. We did not make any significant acquisitions in 2018. We divested our 15(c) board consulting services product line in the first quarter of 2018.
For more information about our acquisitions and divestitures, refer to Notes
8
and
9
of the Notes to our Consolidated Financial Statements.
International Operations
We conduct our business operations outside of the U.S. through wholly owned or majority-owned operating subsidiaries based in each of the following
26
countries: Australia, Brazil, Canada, Chile, Denmark, France, Germany, India, Italy, Japan, Luxembourg, Mexico, the Netherlands, New Zealand, Norway, People's Republic of China (both Hong Kong and the mainland), Singapore, South Africa, South Korea, Spain, Sweden, Switzerland, Taiwan, Thailand, United Arab Emirates, and the United Kingdom. See Note
6
of the Notes to our Consolidated Financial Statements for additional information concerning revenue from customers and long-lived assets from our business operations outside the U.S.
Intellectual Property and Other Proprietary Rights
We treat our brand name and logo, product names, databases and related content, software, technology, know-how, and the like as proprietary. We seek to protect this intellectual property by using: (i) trademark, copyright, patent and trade secrets laws; (ii) licensing and nondisclosure agreements; and (iii) other security and related technical measures designed to restrict unauthorized access and use. For example, we generally provide our intellectual property to third parties through the use of standard licensing agreements, which define the extent and duration of any third-party usage rights and provide for our continued ownership in any intellectual property furnished.
Because of the value of our brand name and logo, we generally seek to register one or both of them as trademarks in all relevant international classes in any jurisdiction in which we have business offices or significant operations. We have registered the Morningstar name and/or logo in approximately 50 jurisdictions, including the European Union, and have registrations pending in several others. In some jurisdictions, we may also choose to register one or more product names.
“Morningstar” and the Morningstar logo are both registered marks of Morningstar in the U.S. The table below includes some of the trademarks and service marks referenced in this report:
|
Morningstar® Advisor Workstation
SM
|
|
Morningstar® Plan Advantage
SM
|
|
Morningstar Analyst Rating
TM
|
|
Morningstar® Portfolio X-Ray®
|
|
Morningstar® ByAllAccounts®
|
|
Morningstar Rating™
|
|
Morningstar® Data
|
|
Morningstar® Retirement Manager
SM
|
|
Morningstar Direct
SM
|
|
Morningstar Style Box™
|
|
Morningstar® Enterprise Components
|
|
Morningstar Sustainability Rating™
|
|
Morningstar® Indexes
|
Morningstar.com®
|
|
|
Morningstar® Managed Portfolios
SM
|
|
PitchBook®
|
|
Morningstar Market Barometer
SM
|
||
|
Morningstar Office
SM
|
|
|
In addition to trademark registrations, we hold several patents in the U.S., including a patent for a coordinate-based document processing system and several patents held by our wholly owned subsidiary, Morningstar Investment Management LLC, for lifetime asset allocation and asset allocation with annuities.
19
License Agreements
We license our products and related intellectual property to our customers, generally for a fee. Generally, we use our standard agreement forms, and we do not provide our products and services to customers or other users without having an agreement in place.
We maintain licensing agreements with most of our larger Morningstar operating companies around the world to allow them to access and use our intellectual property, including, without limitation, our products, trademarks, databases and content, technology, and know-how. We put these agreements in place to allow our operating companies to both market standard Morningstar products and services in their operating territories and to develop and sell territory-specific variants of those products under the Morningstar name in their specific territories.
In the ordinary course of our business, we obtain and use intellectual property from a variety of sources, including licensing it from third-party providers, developing it internally, and gathering it through publicly available sources (e.g., regulatory filings).
Seasonality
We believe our business has a minimal amount of seasonality. Some of our smaller products, such as our annual investment conference in Chicago, generate the majority of their revenue in the first or second quarter of the year. We sell most of our products with subscription or license terms of at least one year and we recognize revenue ratably over the term of each subscription or license agreement. This tends to offset most of the seasonality in our business.
We believe market movements generally have more influence on our performance than seasonality. The revenue we earn from asset-based fees depends on the value of assets on which we provide advisory services, and the size of our asset base can increase or decrease along with trends in market performance.
Competitive Landscape
The economic and financial information industry includes a few large firms as well as numerous smaller companies, including startup firms. Some of our main competitors include Bloomberg, S&P Global, and Thomson Reuters. These companies have financial resources that are significantly greater than ours. We also compete with a variety of other companies in specific areas of our business. We discuss some of the key competitors in each area in the Major Products and Services section of this report.
We believe the most important competitive factors in our industry are brand and reputation, data accuracy and quality, technology, breadth of data coverage, quality of investment research and analytics, design, product reliability, and value of the products and services provided.
Research and Development
A key aspect of our growth strategy is to expand our investment research capabilities and enhance our existing products and services. We strive to adopt new technology that can improve our products and services. As a general practice, we manage our own websites and build our own software rather than relying on outside vendors. This allows us to control our technology development and better manage costs, enabling us to respond quickly to market changes and to meet customer needs efficiently. As of December 31,
2018
, our technology team consisted of approximately 1,400 programmers and technology and infrastructure professionals.
Government Regulation
United States
Investment advisory and broker/dealer businesses are subject to extensive regulation in the U.S. at both the federal and state level, as well as by self-regulatory organizations. Financial services companies are among the nation's most extensively regulated. The SEC is responsible for enforcing the federal securities laws and oversees federally registered investment advisors and broker/dealers.
20
Three of our subsidiaries, Morningstar Investment Management LLC, Morningstar Investment Services LLC, and Morningstar Research Services LLC, are registered as investment advisors with the SEC under the Investment Advisers Act of 1940 (Advisers Act). As Registered Investment Advisors, these companies are subject to the requirements and regulations of the Advisers Act. These requirements relate to, among other things, record-keeping, reporting, and standards of care, as well as general anti-fraud prohibitions. As Registered Investment Advisors, these subsidiaries are subject to on-site examination by the SEC.
In 2018, Morningstar Funds Trust's registration as an open-end management investment company under the Investment Company Act of 1940, as amended (Investment Company Act), was declared effective by the SEC. Morningstar Investment Management serves as the sponsor and investment advisor of the Trust; and therefore is subject to the requirements of the Investment Company Act. These requirements relate to, among other things, record-keeping, reporting, standards of care, valuation, and distribution. As sponsor and investment advisor to the Trust, Morningstar Investment Management is subject to on-site examinations by the SEC.
Connected with the Trust, Morningstar Investment Management is registered with the U.S. Commodity Futures Trading Commission as a 'commodity pool operator' (CPO) and a member of the National Futures Association (NFA). As such, Morningstar Investment Management is subject to the requirements and regulations applicable to CPOs under the Commodity Exchange Act. These requirements relate to, among other things, record-keeping and reporting. As a CPO, Morningstar Investment Management is subject to on-site examinations for the NFA and/or the U.S. Commodity Futures Trading Commission.
In addition, in cases where these subsidiaries provide investment advisory services to retirement plans and their participants, they may be acting as fiduciaries under the Employee Retirement Income Security Act of 1974 (ERISA). As fiduciaries under ERISA, they have duties of loyalty and prudence, as well as duties to diversify investments and to follow plan documents to comply with the applicable portions of ERISA.
Morningstar Investment Services LLC is a broker/dealer registered under the Securities Exchange Act of 1934 (Exchange Act) and a member of FINRA. The regulation of broker/dealers has, to a large extent, been delegated by the federal securities laws to self-regulatory organizations, including FINRA. Subject to approval by the SEC, FINRA adopts rules that govern its members. FINRA and the SEC conduct periodic examinations of the brokerage operations of Morningstar Investment Services.
Broker/dealers are subject to regulations that cover all aspects of the securities business, including sales, capital structure, record-keeping, and the conduct of directors, officers, and employees. Violation of applicable regulations can result in the revocation of a broker/dealer license, the imposition of censures or fines, and the suspension or expulsion of a firm or its officers or employees. As a registered broker/dealer, Morningstar Investment Services is subject to certain net capital requirements under the Exchange Act. These requirements are designed to regulate the financial soundness and liquidity of broker/dealers.
Morningstar Credit Ratings, LLC is registered with the SEC as a Nationally Recognized Statistical Rating Organization (NRSRO) specializing in rating structured finance investments, corporate credit issuers, and financial institutions. As an NRSRO, Morningstar Credit Ratings is subject to certain requirements and regulations under the Exchange Act. These requirements relate to, among other things, record-keeping, reporting, governance, and conflicts of interest. As part of its NRSRO registration, Morningstar Credit Ratings is subject to annual examination by the SEC.
Australia
Morningstar Australasia Pty Limited and Morningstar Investment Management Australia Ltd. are subsidiaries that provide financial information services and advice in Australia. They are registered under an Australian Financial Services license and subject to oversight by the Australian Securities and Investments Commission (ASIC). This license requires them to, among other things, maintain positive net asset levels and sufficient cash resources to cover three months of expenses and to comply with the audit requirements of the ASIC.
21
United Kingdom
Morningstar Investment Management Europe Ltd. is authorized and regulated by the Financial Conduct Authority (FCA) to provide advisory services in the United Kingdom. As an authorized firm, Morningstar Investment Management Europe Ltd. is subject to the requirements and regulations of the FCA. Such requirements relate to, among other things, financial reporting and other reporting obligations, record-keeping, and cross-border requirements.
In addition, our index business, as a non-European Union administrator of indexes, will be seeking recognition from the FCA under EU benchmark regulations so that our indexes can continue to be used by EU sponsors or investable products (e.g., ETFs). Morningstar Investment Management Europe Ltd. will act as our legal representative for this purpose in the EU. Compliance with these regulations will require us to, among other things, comply with the IOSCO Principles for Financial Benchmarks and related certification requirements.
Other Regions
We have a variety of other entities (including in Canada, France, Hong Kong, India, Japan, Korea, and South Africa) that are registered with their respective regulatory bodies; however, the amount of business conducted by these entities related to the registration is relatively small.
Additional legislation and regulations--including those not directly tied to investment advisory activities (e.g. privacy and cybersecurity) as well as changes in rules imposed by the SEC or other U.S. or non-U.S. regulatory authorities and self-regulatory organizations--or changes in the interpretation or enforcement of existing laws and rules may adversely affect our business and profitability.
Employees
We had
5,416
employees globally as of December 31,
2018
. Our U.S.-based employees are not represented by any unions, and we have never experienced a walkout or strike.
Executive Officers
As of
March 1, 2019
, we had nine executive officers. The table below summarizes information about each of these officers.
|
Name
|
|
Age
|
|
Position
|
|
Joe Mansueto
|
|
62
|
|
Executive Chairman
|
|
Kunal Kapoor
|
|
43
|
|
Chief Executive Officer
|
|
Jason Dubinsky
|
|
45
|
|
Chief Financial Officer
|
|
Bevin Desmond
|
|
52
|
|
Head of Talent and Culture
|
|
Danny Dunn
|
|
43
|
Chief Revenue Officer
|
|
|
Haywood Kelly
|
|
50
|
|
Head of Global Research
|
|
Pat Maloney
|
61
|
General Counsel
|
||
|
Daniel Needham
|
|
40
|
|
President and Chief Investment Officer, Investment Management
|
|
Tricia Rothschild
|
|
52
|
|
Chief Product Officer
|
Joe Mansueto
Joe Mansueto founded Morningstar in 1984 and became executive chairman in 2017. He has served as chairman of the board since the company's inception. He served as our chief executive officer from 1984 to 1996 and again from 2000 to 2016.
22
Under Joe’s leadership, Morningstar has been named twice to
Fortune
magazine’s “100 Best Companies to Work For” list, in 2011 and 2012. The
Chicago Tribune
recognized Morningstar as one of the top 100 workplaces in the Chicago area in 2010, 2011, and 2012, and
Crain’s Chicago Business
listed Morningstar in its Fast Fifty feature in 2007, 2008, 2009, and 2011. Morningstar won the 2010 AIGA Chicago Chapter Corporate Design Leadership Award, which recognizes forward-thinking organizations that have advanced design by promoting it as a meaningful business policy.
In December 2016,
InvestmentNews
named Joe to its list of 20 Icons & Innovators. MutualFundWire.com recognized Joe as one of the 10 most influential individuals in the mutual fund industry in 2015, and he was the recipient of PLANSPONSOR’s Lifetime Achievement Award in 2013. In 2010, Joe received the Tiburon CEO Summit award, MutualFundWire.com named him ninth on its list of the 100 Most Influential People of the year, and
Chicago
magazine listed Joe among its top 40 Chicago pioneers over the past four decades. In 2007,
SmartMoney
magazine recognized him in the “SmartMoney Power 30,” its annual list of the 30 most powerful forces in business and finance. He received the Distinguished Entrepreneurial Alumnus Award from The University of Chicago Booth School of Business in 2000.
Joe holds a bachelor's degree in business administration from The University of Chicago and a master's degree in business administration from The University of Chicago Booth School of Business.
Kunal Kapoor
Kunal Kapoor is chief executive officer of Morningstar and a member of our board of directors. Before assuming his current role in 2017, he served as president, responsible for product development and innovation, sales and marketing, and driving strategic prioritization across the firm.
Before becoming president in 2015, Kunal was head of global products and client solutions. Kunal became head of our global client solutions group in 2013 and took on additional responsibility for the products group in February 2014. For part of 2013, he was president of our Data Division, and from 2010 until 2012, he was president of Equity and Market Data/Software. In 2009 and 2010, he was president of Individual Software. Kunal joined Morningstar in 1997.
He holds a bachelor's degree in economics and environmental policy from Monmouth College and a master's degree in business administration from The University of Chicago Booth School of Business. He also holds the Chartered Financial Analyst (CFA) designation.
Jason Dubinsky
Jason Dubinsky is chief financial officer for Morningstar, responsible for controllership, tax, treasury, internal audit, financial planning and analysis, real estate, procurement, and investor relations.
Before joining Morningstar in 2017, Jason served as senior vice president and chief financial officer of planning and central operations for Walgreens Boots Alliance, Inc., where he was responsible for accounting and shared service functions for Walgreens' U.S. operations and led the financial planning and analysis function for the global business. Prior to the merger of Walgreens and Alliance Boots in 2014, he was Walgreens' vice president of finance and treasurer, with responsibility for business unit finance, treasury operations, risk management, and investor relations. Before joining Walgreens in 2009, he served as vice president of investment banking at Goldman Sachs and Lehman Brothers, where he led mergers and acquisitions and corporate finance activity for clients across various industries.
Jason holds a bachelor's degree in business administration from the University of Michigan and a master’s degree in business administration from New York University's Stern School of Business.
Bevin Desmond
Bevin Desmond is head of talent and culture, a role she has held since 2010. She is responsible for overseeing talent and culture for all of Morningstar’s global operations. Previously, she was head of global markets from 2010 to 2017 and head of international operations from 2001 until 2010. She joined Morningstar in 1993.
Bevin holds a bachelor's degree in psychology from St. Mary's College.
23
Danny Dunn
Danny Dunn is chief revenue officer for Morningstar. He is responsible for sales philosophy, strategy, and execution to drive revenue growth.
Before joining Morningstar in 2016, Danny was vice president of the Midwest enterprise unit for IBM, a global information technology firm. He was responsible for marketing, strategy, sales, channels, and customer service for the complete IBM portfolio, including Cloud, Software, Services, Systems, and IBM Credit, LLC in the region. Prior to that, he was regional director for IBM's Chicago enterprise unit in 2013 and 2014, territory director for IBM's Wisconsin business unit from 2011 until June 2013, and territory sales leader for IBM Global Services from 2009 until July 2011. Before joining IBM in 2007, he led sales, account management, and client service at Neology, a software and technology consulting division of SmithBucklin Corporation.
Danny holds a bachelor’s degree from the University of Vermont and a master’s degree in business administration, with concentrations in marketing, strategy, and managerial economics, from the Kellogg School of Management at Northwestern University.
Haywood Kelly
Haywood Kelly is head of global research for Morningstar and oversees our global fund, equity, and credit research and data operations. Before taking on his current role in January 2014, he was head of equity and credit research since 2009 and took on additional responsibility for equity data in 2013. Haywood joined Morningstar in 1991.
He holds a bachelor’s degree in economics from The University of Chicago, where he graduated as a member of Phi Beta Kappa. He also holds the CFA designation.
Pat Maloney
Pat Maloney is general counsel for Morningstar. He is responsible for directing Morningstar’s legal department and managing its relationships with outside counsel. He also oversees Morningstar’s compliance department.
Before joining Morningstar in June 2016, Pat was a partner at Sheppard Mullin Richter & Hampton LLP from July 2012 through April 2016 in the firm’s corporate and securities practice. Previously, he was a partner at K&L Gates LLP and its legacy predecessor firm, Bell, Boyd & Lloyd LLP. Early in his career, he was an associate with the New York law firm of Dewey Ballantine and an Assistant General Counsel with the Prudential Insurance Company of America.
Pat holds a bachelor’s degree with honors from The University of Chicago and a juris doctor degree with honors from The University of Chicago Law School. He is admitted to practice law in Illinois and New York.
Daniel Needham
Daniel Needham is president and chief investment officer (CIO) of Morningstar Investment Management and is responsible for building investment management solutions based on our proprietary research. Before taking on his current role in February 2015, he served as CIO for Morningstar Investment Management and was previously managing director and CIO for Morningstar Investment Management’s Asia-Pacific Operations. He joined our company when Morningstar acquired Intech Pty Ltd. (now Ibbotson Associates Australia) in 2009, where he served as CIO. Before joining Intech in 2002, Daniel worked for Zurich Financial Services in Sydney.
He holds a bachelor's degree in commerce with a major in finance and economics from the University of Sydney. He also holds the CFA designation.
Tricia Rothschild
Tricia Rothschild is chief product officer for Morningstar. She is responsible for product strategy, innovation, development, and execution for the solutions delivered to clients.
24
Before taking on her current role in January 2017, Tricia was head of global advisor solutions for Morningstar, setting the strategic direction for our wealth management and online brokerage business and overseeing priorities for this customer group. From September 2012 until February 2013, Tricia was senior vice president of advisor software for Morningstar. Previously, she served as senior vice president for Morningstar's equity research business and held a variety of research and product management roles after joining Morningstar in 1993.
Tricia holds a bachelor’s degree from Northwestern University and a master’s degree in Russian and Central European economics from Indiana University. She also holds the CFA designation.
Company Information
We were incorporated in Illinois on May 16, 1984. Our corporate headquarters is located at 22 West Washington Street, Chicago, Illinois, 60602.
We maintain a website at
http://www.morningstar.com/company.
Our annual report on Form 10-K, quarterly reports on Form 10-Q, current reports on Form 8-K, and amendments to any of these documents are available free of charge on this site as soon as reasonably practicable after the reports are filed with or furnished to the SEC. We also post quarterly press releases on our financial results and other documents containing additional information related to our company on this site. We provide this website and the information contained in or connected to it for informational purposes only. That information is not part of this Annual Report on Form 10-K.
Item 1A. Risk Factors
You should carefully consider the risks described below and all of the other information included in this Form 10-K when deciding whether to invest in our common stock or otherwise evaluating our business. If any of the following risks materialize, our business, financial condition, or operating results could suffer. In that case, the trading price of our common stock could decline, and you may lose all or part of your investment. Our operations could also be affected by other risks that are not presently known to us or that we currently consider to be immaterial to our operations.
Our investment management operations may subject us to liability for any losses that result from a breach of our fiduciary duties.
Three of our subsidiaries, Morningstar Investment Management LLC, Morningstar Investment Services LLC, and Morningstar Research Services LLC, are registered as investment advisors with the SEC under the Advisers Act. As Registered Investment Advisors, these companies are subject to the requirements and regulations of the Advisers Act. These requirements relate to, among other things, record-keeping, reporting, and standards of care, as well as general anti-fraud prohibitions. As Registered Investment Advisors, these subsidiaries are subject to on-site examination by the SEC.
In addition, in cases where these subsidiaries provide investment advisory services to retirement plans and their participants, they may be acting as fiduciaries under the Employee Retirement Income Security Act of 1974. As fiduciaries under ERISA, they have obligations to act in the best interest of their clients. They also have duties of loyalty and prudence, as well as duties to diversify investments and to follow plan documents to comply with the applicable portions of ERISA.
Our subsidiaries outside the U.S. that have investment advisory operations are subject to similar requirements.
25
We may face liabilities for actual or claimed breaches of our fiduciary duties, particularly in areas where we provide retirement advice and managed retirement accounts. In some of our retirement contracts, we act as an ERISA fiduciary by, for example, selecting and monitoring a broad range of diversified plan options. We also provide a managed account service for retirement plan participants who elect to have their accounts managed by our programs. Such activities have been the subject of increasing class action litigation in recent years. For example, in 2017, a participant in a pension plan filed a putative class action proceeding against us alleging that we, together with other defendant parties, violated the Racketeer Influenced and Corrupt Organizations Act by allegedly engaging in actions to steer plan participants into high-cost investments that pay unwarranted fees to the defendants. As described in more detail in Item 3 of this Form 10-K under Legal Proceedings, our motion to dismiss that proceeding was recently granted, but there can be no assurance that other putative class action proceedings based on the same or other legal theories may not be brought against us in different contexts or, if brought, will be successfully dismissed. As of December 31,
2018
, we had
$58.2 billion
in assets under management in our managed retirement accounts. We could face substantial liabilities related to our management of these assets.
We rely on automated investment technology for our retirement advice and managed retirement accounts services. The Wealth Forecasting Engine is our core advice and managed accounts engine that determines appropriate asset allocations for retirement plan participants and assigns individuals to portfolios. We also rely on automated portfolio construction tools. Problems could arise if these programs do not work as intended, particularly if we failed to detect program errors over an extended period. Clients may take legal action against us for an actual or claimed breach of a fiduciary duty. If we make an error, we may be subject to potentially large liabilities for make-whole payments and/or litigation. We cannot quantify the potential size of these liabilities with any level of precision.
In addition, we may face other legal liabilities based on the quality and outcome of our investment advisory recommendations, even in the absence of an actual or claimed breach of fiduciary duty or based on our investment management fees and expenses. In total, we provided investment advisory and management services on approximately $193.0 billion in assets as of December 31,
2018
. We could face substantial liabilities related to our work on these assets.
Failing to maintain and protect our brand, independence, and reputation may harm our business. Our reputation and business may also be harmed by allegations made about possible conflicts of interest or by other negative publicity or media reports.
We believe independence is at the core of our business, and our reputation is our greatest corporate asset. We rely on our reputation for integrity and high-caliber products and services. Any failure to uphold our high ethical standards and ensure that our customers have a consistently positive experience with us could damage our reputation as an objective, honest, and credible source for investment research and information. Allegations of improper conduct, whether the ultimate outcome is favorable or unfavorable to us, as well as any negative publicity or media reports about Morningstar, whether valid or not, may harm our reputation and damage our business.
We provide ratings, analyst research, and investment recommendations on mutual funds and other investment products offered by our institutional clients. We also provide investment advisory and investment management services. While we don’t charge asset management firms for their products to be rated, we do charge licensing fees for the use of our ratings. We also receive payments from issuers for our new-issue credit ratings on various types of asset-backed securities and corporate bond issues. These payments may create the perception that our ratings, research, and recommendations are not impartial.
This perception may undermine the confidence of our customers and potential customers in our reputation as a provider of independent research and investment recommendations. Any such loss of confidence or damage to our reputation could hurt our business.
Our reputation may also be harmed by factors outside of our control, such as news reports about our clients or adverse publicity about certain investment products. Our reputation could also suffer if we fail to produce competitive performance in our investment management offerings.
26
Failing to differentiate our products and continuously create innovative, proprietary research tools, or to successfully transition clients to new versions of such tools, may harm our competitive position and business results.
We attribute much of our company's success over the past 35 years to our ability to develop innovative, proprietary research tools, such as Gamma, the Morningstar Rating, Morningstar Style Box, Ownership Zone, and Portfolio X-Ray. More recently, we’ve developed unique concepts and tools such as Investor Pulse, which combines fund data with predictive analytics. We believe these innovations set us apart because most of our competitors focus on providing data or software rather than creating their own proprietary research frameworks. We also believe our ability to develop innovative, proprietary research tools is at the core of what drives Morningstar’s value for all of our customer groups.
If we fail to continuously innovate and develop new tools to meet the needs of our customers, our competitive position and business results may suffer. In addition, our reputation could be harmed if we’re perceived as not moving quickly enough to meet the changing needs of investors. Clients may also delay purchases of our currently offered research tools in anticipation of us offering new products or enhanced versions of existing products. Our competitive position and business results may also suffer if other companies are able to successfully introduce innovative, proprietary research tools that gain attention from our clients. We believe lower technology costs, the growth of open software platforms, and cloud computing technologies have lowered the barriers to entry for new competitors, making it easier for new players to enter the market. Smaller companies, including startup firms funded by private equity and venture capital, may be able to move more quickly to develop research and tools that gain a wide following.
In addition, the value of our data, research and software tools may be negatively affected by the increasing amount of information and tools that are available for free, or at low cost, through Internet sources or other low-cost delivery systems. Although we believe our products and services contain value-added features and functionality that deeply embed them in our customers’ workflows, such developments may over time reduce the demand for, or customers’ willingness to pay for, certain of our products and services.
If we fail to introduce innovative, proprietary research tools and frameworks, we may not generate enough interest from potential clients to win new business. We cannot guarantee that we will successfully develop new product features and tools that differentiate our product offerings from those of our competitors.
In addition, we must make long-term investments and commit significant resources often before knowing whether such investments will result in products or services that satisfy our clients’ needs or generate revenues sufficient to justify such investments. In addition, from time to time, we also incur costs to transition clients to new or enhanced products or services. A current example of a product in transition is our web-based version of Morningstar Direct, to which we hope to transition clients who use the desktop version over the next three years. Such transitions can involve material execution risks and challenges. If we are unable to manage these investments and transitions successfully, our business, financial condition, and results of operations could be materially adversely affected.
We could face liability related to our storage of personal information about individuals as well as portfolio and account-level information as a result of successful cyberattacks, the failure of cybersecurity systems and procedures, or the failure to implement data privacy legal requirements.
Customers routinely enter personal investment and financial information, including portfolio holdings, account numbers, and credit card information, on our websites. In addition, we handle increasing amounts of personally identifiable information in areas such as Morningstar Retirement Manager, Morningstar Managed Portfolios, ByAllAccounts, Morningstar Office, and Morningstar.com. ByAllAccounts uses technology to collect, consolidate, and transform financial account data and deliver it to any platform, and accordingly, it handles a large volume of personally identifiable information as part of its normal business operations.
27
Any failure to safeguard this information could damage our reputation and business results. We must continuously invest in systems, processes, and controls to guard against the risk of improper access to this information, which could be disclosed through employee errors, other inadvertent release, social engineering, hacking, computer malware, failure to restrict access, or failure to properly purge and protect data. We may suffer malicious attacks by individuals or groups seeking to attack our products and services or penetrate our network and databases to gain access to personal data or to launch or coordinate distributed denial of service attacks. These attacks have become increasingly frequent, sophisticated, and difficult to detect. Any material cybersecurity failures or incidents could cause us to experience reputational harm, loss of customers, regulatory actions, sanctions or other statutory penalties, litigation or financial losses that are either not insured against or not fully covered through any insurance maintained by us, and increased expenses related to addressing or mitigating the risks associated with any such material failures or incidents.
Contractual commitments to customers as well as laws and industry regulations related to data protection, system availability, and privacy require us to safeguard critical data. We are also required to take appropriate steps to safeguard credit card numbers, Social Security numbers, and other information about individuals or their accounts. In the European Union, the General Data Protection Regulation (GDPR), which became effective May 25, 2018, imposes, among other things, stringent requirements regarding the information to be provided to, and the consents required from, individuals to justify a business using their personal data in certain circumstances, as well as new rights of data subjects to correct or delete data about them, data portability rights, and the right to object to certain automated decision-making processes. Failure to comply with GDPR requirements could result in penalties of up to 4% of worldwide revenues. Data privacy regulation continues to proliferate, as various jurisdictions such as the People's Republic of China, the Republic of Brazil, and the State of California join the European Union in adopting comprehensive data privacy regulation. Because operations in the financial services industry require the processing of significant amounts of personally identifiable information (PII), we believe the burdens of regulation, and possibly inconsistent regulation, will proliferate, and we expect to continue to be subject to increased scrutiny by clients and regulators. We could be subject to liability if we were to inappropriately collect, retain, or disclose any user's personal information under the requirements of laws and regulations such as the GDPR, which contemplate substantial enterprise-level penalties for noncompliance.
Our business continuity program may not be adequate in the event of a material emergency affecting one or more of our U.S. or offshore business centers or adverse political or regulatory developments in countries in which we have significant data and development operations.
We have approximately 1,500 employees working at our corporate headquarters in Chicago, Illinois. These include most of our executive leadership team, as well as substantial numbers of employees involved in the delivery of most of our major products and services. If our headquarters were to become unusable due to a natural disaster, a violent incident, or another dangerous emergency, we might not be able to continue business operations at an acceptable level that would meet all our legal and contractual commitments. Our failure to successfully implement and deploy a business continuity plan, either at an enterprise level or with respect to particular business centers, could materially affect our business operations and have a material adverse effect on our financial condition and results of operations.
We now have approximately 1,000 employees working in our data and technology development center in Shenzhen, China. We rely on these employees to maintain and update our mutual fund database and work on other projects. Because China has a restrictive government under centralized control and the relationship between the U.S. and China is experiencing a period of increased political, military, trade, and other commercial tensions, our operations are subject to political and regulatory risk, which is inherently unpredictable. Laws and regulations relating to data privacy, security, protection of intellectual property rights, and acceptable telecommunication infrastructure in China, as well as the enforcement environment for such laws and regulations, are in certain cases uncertain and evolving. In addition, this facility is subject from time to time to extreme weather events. The concentration of certain types of development and data work carried out at this facility also involves operational risks for parts of our network infrastructure. While we have short-term backup plans in place, it would be difficult for us to maintain and update our mutual fund database if we were unable to access our Shenzhen operations for an extended period of time. Any difficulties that we face in continuing to operate our development center in China may harm our business and have a negative impact on the products and services we provide.
28
We have approximately 1,250 employees who work at our data collection, technology and operational center in Mumbai, India. These employees maintain and update our equity database and PitchBook's data and research operations, and provide shared services to many of our operations. This location is subject to extreme weather events and political unrest, including public protests that can disrupt transportation and make it difficult for employees to commute to and from work. The electrical infrastructure of Mumbai is also subject to more frequent interruptions than are experienced at our other major facilities. In addition, Mumbai has experienced and may in the future experience terrorist attacks. While we have short-term backup plans in place to address such business continuity issues, it would be challenging for us to maintain and update our equity database or continue to provide certain shared services to our worldwide operations if we were unable to access our Mumbai operations for an extended period of time.
We have approximately 145 contract employees based in Kolkata, India who support the PitchBook data and research operations and approximately 165 contract employees based in Ukraine who work on software development for the PitchBook product. Ukraine has been subject to significant political unrest and military incursions. Any extended disruptions to our contract operations in these locations would make it difficult for us to meet our operating goals related to PitchBook Data.
Failing to respond to technological change, keep pace with new technology developments, or adopt a successful technology strategy may negatively affect our competitive position and business results.
We believe the technology landscape has been changing at an accelerating rate over the past several years. Changes in technology are fundamentally changing the ways investors access data and content. Examples include the shift from local network computing to cloud-based systems, the proliferation of wireless mobile devices, rapid acceleration in the use of social media platforms, and the dissemination of data through application programming interfaces that permit real-time updating rather than raw data feeds.
Our software development process is based on frequently rolling out new features so that we can quickly incorporate user feedback. While some changes in technology may offer opportunities for Morningstar, we cannot guarantee that we will successfully adapt our product offerings to meet evolving customer needs. If we fail to develop and implement new technology rapidly enough, we may sacrifice new business opportunities or renewals from existing customers. We may also incur additional operating expense if major software projects take longer than anticipated. Our competitive position and business results may suffer if we fail to develop new technologies to meet client demands, if our execution speed is too slow, or if we adopt a technology strategy that doesn't align with changes in the market.
Our results could suffer if the mutual fund industry continues to experience slower growth, if actively managed equity funds continue to attract less investor attention, or if the industry continues to meaningfully consolidate.
We generate a significant portion of our revenue from products and services related to mutual funds, and part of our growth since 1984 can be attributed to favorable industry trends. The mutual fund industry has experienced substantial growth over the past 35 years but suffered during the market downturn of 2008 and 2009. Since then, fund assets have increased, but at a slower rate than in previous years. Some of that slower growth is attributable to the growth of ETFs as a mutual fund alternative, and we have accordingly expanded our research coverage and analyst ratings to include ETFs. However, ETFs generally track passive investing strategies and charge lower management fees than active strategies, which may affect both the profitability of asset managers, on whose success we in part depend, and the perceived value of our research regarding ETFs.
A significant portion of our fund research has historically focused on equity-related funds. In addition, we are best-known for our data and analyst research on actively managed equity funds. Over the past 15 years, passively managed index funds have seen greater investor interest, and this trend has accelerated in recent years. In
2018
, actively managed mutual funds and ETFs suffered about $303 billion in net outflows, compared with net inflows of more than $457 billion for passively managed funds and ETFs. Overall, we estimate that passively managed portfolios now account for more than one-third of combined mutual fund and ETF assets. The growth of online wealth management tools that provide automated, algorithm-based portfolio management advice, sometimes called robo-advice, may further accelerate the adoption of passively managed portfolios and reduce demand for our data and analyst research.
29
The growth of the mutual fund industry is also being affected by increasing merger and acquisition activity within the asset management industry, which is reducing the number of asset managers offering mutual funds and ETFs, the pruning by some mutual fund and ETF platforms of the number of funds available for purchase, and the continuing impacts of regulation. With respect to regulation, the revised Markets in Financial Instruments Directive (MiFID II) in the European Union (EU), which became effective in January 2018, requires that asset managers pay banks and brokers for investment research. This may give larger asset managers, which are better able to absorb such costs, a competitive advantage. While MiFID II has presented us with new business opportunities, it has also caused some of our clients to adapt their business practices and pricing models significantly to reflect or avoid these new costs, which may adversely affect their demand for our services. In addition, the continuing uncertainty around the withdrawal of the United Kingdom from the EU, known as Brexit, has created substantial concern among our U.K. client base around their future operations.
Prolonged downturns or volatility in the financial markets, increased investor interest in other investment vehicles, or a lack of investor confidence could continue to reduce investor interest and investment activity. In addition, a continued lessening of investor interest in actively managed equity funds could decrease demand for our products, including our software, data, and analyst research.
An outage of our database, technology-based products and services or network facilities could result in reduced revenue and the loss of customers, and our movement of parts of our technological infrastructure to the public cloud could expose us to various third party provider risks.
The success of our business depends upon our ability to deliver time-sensitive, up-to-date data and information. We rely primarily on our computer equipment, database storage facilities, and other network equipment, which is located across multiple facilities in the U.S. We also have extensive information systems outside the U.S. Our mission-critical databases and networks are complex and interdependent, which increases the risk of failure. Problems in our network systems may lead to cascading effects involving product downtime, overloading of third-party data centers, and other issues that may affect our clients. Many of our client contracts contain service-level agreements that require us to meet certain obligations for delivering time-sensitive, up-to-date data and information. We may not be able to meet these obligations in the event of failure or downtime in our information systems.
Our operations and those of our suppliers and customers are vulnerable to interruption by fire, earthquake, power loss, telecommunications failure, terrorist attacks, wars, computer viruses, and other events beyond our control. Our database and network facilities may also be vulnerable to external attacks that misappropriate our data, corrupt our databases, or limit access to our information systems. To defend against these threats, we implement a series of controls focusing on both prevention and detection, including firewalls, intrusion detection systems, automated scanning and testing, server hardening, antivirus software, training, and patch management. We make significant investments in servers, storage, and other network infrastructure to prevent incidents of network failure and downtime, but we cannot guarantee that these efforts will work as planned.
Most of our products and services depend heavily on our electronic delivery systems and the Internet, although we are shifting the delivery of several of our products and services to cloud-based delivery systems. Our ability to deliver information using the Internet may be impaired because of infrastructure failures, service outages at third-party Internet providers, malicious attacks, or other factors. If disruptions, failures, or slowdowns of our electronic delivery systems or the Internet occur, our ability to distribute our products and services effectively and to serve our customers may be impaired.
We maintain off-site backup facilities for our data, but we cannot guarantee that these facilities will operate as expected during an interruption that affects our headquarters. There may be single points of failure that affect our core databases, data transfer interfaces, or storage area networks. We may not be able to fully recover data or information lost during a database or network facility outage. Any losses, service disruption, or damages incurred by us could have a material adverse effect on our business, operating results, or financial condition.
30
Our movement of parts of our technological infrastructure to the public cloud and software-as-a-service (SaaS) solutions presents a variety of additional risks, including risks relating to sharing the same computing resources with other users, the use by cloud and SaaS providers of virtualization products and various security issues relating thereto, reliance on cloud and SaaS providers’ authentication, authorization and access control mechanisms, a lack of control over cloud and SaaS providers’ redundancy systems and fault tolerances, and a reduced ability to directly address client concerns over data security and privacy. Any disruption of or interference with our use of the public cloud or SaaS solutions, or any information security breach at any cloud or SaaS provider, could materially impact our operations and have an adverse effect on our business. Over time, a growing dependence of our technology infrastructure on the public cloud and SaaS solutions also risks us becoming overly dependent on particular suppliers, which could adversely affect the pricing we receive from such suppliers and limit our ability to transition away from such suppliers in the event of service-quality issues.
Compliance failures, regulatory action, or changes in laws applicable to our investment advisory or credit rating operations could adversely affect our business.
Our investment management operations are a growing part of our overall business. The securities laws and other laws that govern our investment advisory activities are complex. The activities of our investment advisory operations in the U.S. are subject to provisions of the Advisers Act, ERISA, and, in the case of our advisory relationship with the Morningstar Funds Trust, the Investment Company Act of 1940 and the Commodity Exchange Act. In addition, Morningstar Investment Services is a broker/dealer registered under the Exchange Act and is subject to the rules of FINRA. We also provide investment advisory services in other areas around the world, and our operations are subject to additional regulations in markets outside the U.S. If we fail to comply with securities laws and other regulatory requirements, we may be subject to fines or other events that could have a negative effect on our business. In addition, depending on the outcome of the negotiations between the United Kingdom and the EU over the terms of Brexit, our investment management operations in the United Kingdom could lose their "passporting" permissions that permit them to conduct business in other European jurisdictions. Such a loss of permissions could require us to restructure our European investment management operations in order to reacquire necessary "passporting" permissions and preserve client relationships, which restructuring could have an adverse effect on the cost structure and results of operations of that business.
Over the past several years, we have also made significant investments in our credit rating business. Our Morningstar Credit Ratings, LLC subsidiary is an NRSRO that specializes in structured finance, corporate credit issuers, and financial institutions. Credit rating and research providers continue to be subject to intensive regulatory scrutiny. As an NRSRO, Morningstar Credit Ratings is subject to various requirements and regulations under the Exchange Act relating to, among other things, record-keeping, reporting, governance, and conflicts of interest. As part of its NRSRO registration, Morningstar Credit Ratings is subject to annual examination by the SEC, as well as periodic investigations by the SEC and other governmental authorities relating to matters of regulatory interest such as industry practices and personnel matters. The cost and management distraction resulting from such examinations and investigations may have a negative effect on our credit rating business.
Our index business could be negatively affected by increased regulation of benchmarks generally, which could increase the costs and risks of producing and administering indexes. For example, since January 2018, the benchmark industry has been subject to new regulation in the EU. Such regulations may discourage market participants from continuing to use, administer or contribute to indexes, trigger changes in the rules or methodologies relating indexes, and/or lead to declining demand for indexes.
The laws, rules, and regulations, and their interpretations, applicable to our business may change in the future, and we may not be able to comply with these changes without extensive changes to our business practices. In addition, the broad scope of our business operations makes it more difficult to monitor areas that may be subject to regulatory and compliance risk. If we fail to comply with any applicable law, rule, or regulation, we could be fined, sanctioned, or barred from providing investment advisory, credit rating or index services in the future, which could adversely affect our business.
31
Volatility in the financial sector, global financial markets, and global economy may impact our results, resulting in lower revenue from asset-based fees and credit ratings business, as well as other parts of our business to a lesser extent.
Our business results are partly driven by factors outside of our control, including general economic and financial market trends. Any unfavorable changes in the environment we operate in could cause a corresponding negative effect on our business results. As a result, we may experience lower revenue, operating income, and other financial results in the event of a market downturn.
Many of our customers are asset management firms and other financial services companies, which are also subject to external trends and changes. For example, the financial crisis of 2008 and 2009 led to spending cutbacks among many of the companies to which we sell. Some institutional clients have implemented additional review processes for new contracts or started providing certain services, such as investment management, in-house rather than hiring outside service providers. Some institutional clients have also reduced the scope of their operations, and merger and acquisition activity in the asset management sector has in the past, and may in the future, reduce the number of potential asset management clients.
Many companies in the financial services industry have also been subject to increasing government regulation and pressure to reduce fees. In turn, many of these firms have sought to reduce their operating costs by working with fewer service providers and/or negotiating lower fees for services they purchase.
In addition, our revenue from asset-based fees may be adversely affected by market declines, cash outflows from portfolios that we help manage, and the industrywide trend toward lower asset-based fees.
In
2018
, asset-based revenue made up
19.6%
of our consolidated revenue. The amount of asset-based revenue we earn primarily depends on the value of assets on which we provide advisory services, and the size of our asset base can increase or decrease along with trends in market performance. In
2018
, the U.S. and many international markets experienced valuation decreases, which in some cases were substantial. These market trends were unfavorable in terms of the value of assets we have under management or advisement and the effect on our asset-based revenue, and there can be no assurance such trends will not continue.
Asset levels can also be affected if net inflows into the portfolios on which we provide investment advisory services drop or if these portfolios experience redemptions. A drop in net inflows or an increase in redemptions can result from a variety of factors, including overall market conditions and volatility or a decline in investment performance. If the level of assets on which we provide investment advisory or investment management services goes down, we expect our fee-based revenue to show a corresponding decline.
In 2018, the Morningstar Funds Trust, a registered open-end mutual fund for which Morningstar Investment Management acts as investment advisor under an investment management agreement, commenced investment operations. The Board of Trustees of the Morningstar Funds Trust must annually approve the terms of the investment management agreement (including fees) and can terminate the agreement upon 60-days' notice. If the Morningstar Funds Trust seeks to lower the fees that we receive or terminate its contract with us, we would experience a decline in fees earned from the Morningstar Funds, which could have a material adverse effect on the revenues and net income of our investment advisory services.
Our business results may also be hurt by negative trends in Internet advertising sales, which made up 2.7% of consolidated revenue in
2018
. Many advertisers have shifted some of their advertising spend to programmatic buying platforms that target users on other sites, which has from time to time had a negative effect on advertising revenue for our website for individual investors, Morningstar.com. We are uncertain whether this trend will continue.
Our structured credit rating business, which made up 3.6% of consolidated revenue in
2018
, is subject to volatility from trends in new issuance of commercial mortgage-backed securities and other structured credits. If industrywide issuance for such securities declines, our revenue associated with this line of business may also go down. We have also expanded our coverage to include corporate credit issuers and financial institutions, which are also subject to volatility in issuance patterns based on market conditions.
32
Our PitchBook Data business may also be subject to cyclical trends. Many of PitchBook's clients are investment banks and other participants in the capital and merger and acquisition markets, which are subject to periodic business downturns driven by changes in such markets. During these downturns, they often seek to reduce spending on third-party services as well as the number of employees, which would directly affect the number of prospective clients for PitchBook. As a data and research provider focusing on the private capital markets (including venture capital, private equity, and M&A), PitchBook may also be subject to volatility based on the amount of activity and market interest in these areas.
Our acquisitions and other investments may not produce the results we anticipate. We may also incur debt in connection with acquisitions, which may limit our financial flexibility.
We have completed numerous acquisitions over the past 10 years, and we intend to continue to pursue selective acquisitions to support our business strategy. However, there can be no assurance we can identify suitable acquisition candidates at acceptable prices. In addition, each acquisition presents potential challenges and risks. We may not achieve the growth targets that we established for the acquired business at the time of the acquisition. The process of integration may require more resources than we anticipated. We may assume unintended liabilities or experience operating difficulties or costs that we did not anticipate. We may also fail to retain key personnel of the acquired business which would make it difficult to follow through on our operating goals for the business. If an acquisition does not generate the results we anticipate, it could have a material adverse effect on our business, financial condition, and results of operations.
In connection with certain acquisitions, we have incurred indebtedness. Under our existing revolving credit facility, we can borrow up to $300.0 million. The term of this facility expires in December 2020. Under the terms of our agreement with the lender, we are subject to certain restrictions and financial covenants, which may limit our financial flexibility. As of December 31,
2018
, borrowings in the principal amount of $70.0 million are outstanding under such facility.
We also have, and intend to continue to make, various investments in companies where we do not have or obtain a controlling interest. Such investments are motivated both by their prospective financial return and the access they give us to certain new technologies, products, business ideas and management teams. While we obtain various rights in connection with such investments, the future value of such investments is highly dependent on the management skill of the managers of those companies.
We expect to continue making acquisitions and establishing investments and joint ventures as part of our long-term business strategy. Acquisitions, investments, and joint ventures involve a number of risks. They can be time-consuming and may divert management’s attention from day-to-day operations, particularly if numerous acquisitions are in process at the same time. Financing an acquisition could result in dilution from issuing equity securities, reduce our financial flexibility because of reductions in our cash balance, or result in a weaker balance sheet from incurring debt.
Our future success depends on our ability to recruit, develop, and retain qualified employees.
We experience competition for analysts, technology experts, and other employees from other companies and organizations. Competition for these employees is intense, and we may not be able to retain our existing employees or be able to recruit and retain other highly qualified personnel in the future. In addition, we are exposed to overall rising wage scales in the employment markets in which some of our facilities are located, such as our development center in China, which negatively affects our ability to hire personnel generally without significantly increasing our compensation costs. In China, we believe our ability to hire qualified personnel is also being negatively impacted by the preference of job candidates to work for Chinese companies, as opposed to multinationals, in a period of increasing international tensions.
Our future success also depends on the continued service of our executive officers, including Joe Mansueto, our executive chairman and controlling shareholder. At the end of 2016, Joe changed his role to focus less on our day-to-day business operations, but he remains heavily involved our strategy and overall company direction. The loss of Joe, our chief executive officer, Kunal Kapoor, or other executive officers could hurt our business, operating results, or financial condition. We do not have employment agreements, noncompete agreements, or life insurance policies in place with any of our executive officers. They may leave us and work for our competitors or start their own competing businesses.
33
Our operations outside of the U.S. involve additional challenges that we may not be able to meet.
Our operations outside of the U.S. generated
$255.7 million
in revenue in
2018
, or about 25% of our consolidated revenue. There are risks inherent in doing business outside the U.S., including challenges in reaching new markets because of established competitors and limited brand recognition; difficulties in staffing, managing, and integrating non-U.S. operations; difficulties in coordinating and sharing information globally; differences in laws and policies from country to country; exposure to varying legal standards, including intellectual property protection laws; potential tax exposure related to transfer pricing and other issues; heightened risk of fraud and noncompliance; and currency exchange rates and exchange controls. In addition, new risks have arisen from the assertion by various national governments of greater control over the movements of people and information across national borders. For example, changes to immigration policy in the United Kingdom as a result of Brexit and in the U.S. as a result of the current administration’s more restrictive immigration enforcement could adversely affect our ability to attract and retain talent from other countries, In addition, China’s government has recently backed various measures that could compromise the privacy and security of our proprietary information or information concerning our customers including a ban on nonstate sanctioned virtual private networks and requirements that multinational firms acquire and use equipment from Chinese telecom suppliers. These risks could hamper our ability to expand around the world, which may hurt our financial performance and ability to grow.
We don't engage in currency hedging or have any positions in derivative instruments to hedge our currency risk. Our reported revenue could suffer if certain foreign currencies decline relative to the U.S. dollar, although the impact on operating income may be offset by an opposing currency impact on locally based operating expense.
We could face liability for the information we publish or the reports and other documents produced by our software products, including information, reports, and documents based on data we obtain from other parties.
We may be subject to claims for securities law violations, defamation (including libel and slander), negligence, or other claims relating to the information we publish, including our research and credit ratings on issuers of structured credits and corporate credits. For example, investors may take legal action against us if they rely on published information that contains an error, or a company may claim that we have made a defamatory statement about it or its employees.
Some of our products support the investment processes or the client account reporting practices and other activities of our clients who manage significant assets of other parties. Use of our products as part of such activities creates the risk that clients, or the parties whose assets are managed by our clients, may pursue claims for us for losses that may have some connection to our products. In the case of software products, even though most of our contracts for such products contain limitations of our liability in such cases, we may be required to make such clients or their customers whole for any losses in order to maintain our business relationships. We could also be subject to claims based on the content that is accessible from our website through links to other websites.
We rely on a variety of outside parties as the original sources for the information we use in our published data. These sources include securities exchanges, fund companies, hedge funds, transfer agents, and other data providers. We also incorporate data from a variety of third-party sources for PitchBook Data. Accordingly, in addition to possible exposure for publishing incorrect information that results directly from our own errors, we could face liability based on inaccurate data provided to us by others.
We could be subject to claims by providers of publicly available data and information we compile from websites and other sources that we have improperly obtained that data in violation of the source’s copyrights or terms of use or based on the provisions of new legislation such as GDPR that limits the bases on which businesses can collect personal information from and about individuals. We could also be subject to claims from third parties from which we license data and information that we have used or redistributed the data or information in ways not permitted by our license rights. Defending claims based on the information we publish could be expensive and time-consuming and could adversely impact our business, operating results, and financial condition.
34
Failure to protect our intellectual property rights
,
or claims of intellectual property infringement against us, could harm our brand and ability to compete effectively.
The steps we have taken to protect our intellectual property may not be adequate to safeguard our proprietary information. We rely primarily on patent, trademark, copyright, and trade secret rights, as well as contractual protections and technical safeguards, to protect our intellectual property rights and proprietary information. Despite these efforts, third parties may still attempt to challenge, invalidate, or circumvent our rights or improperly obtain our proprietary information. Further, effective trademark, copyright, and trade secret protection may not be available in every country in which we offer our services. Failure to adequately protect our intellectual property could harm our brand, devalue our proprietary content, and affect our ability to compete in the marketplace.
From time to time, we encounter jurisdictions in which one or more third parties have a pre-existing trademark registration in certain relevant international classes that may prevent us from registering our own marks in those jurisdictions. Our continued ability to use the “Morningstar” name or logo, either on a stand-alone basis or in association with certain products or services, could be compromised in those jurisdictions because of these pre-existing registrations. Similarly, from time to time, we encounter situations in certain jurisdictions where one or more third parties are already using the Morningstar name, either as part of a registered corporate name, a registered domain name, or otherwise. Our ability to effectively market certain products and/or services in those locations could be adversely affected by these pre-existing usages.
We have from time to time been subject to claims by third parties alleging infringement of their intellectual property rights. Such claims can also be alleged against clients, customers, or distributors of our products or services whom we have agreed to indemnify against third party claims of infringement. The defense of such claims can be costly and consume valuable management time and attention. We may be forced to settle such claims on unfavorable terms, which can include the payment of damages, the entry into royalty or licensing arrangements on commercially unfavorable terms, or the suspension of our ability to offer affected products or services. If litigation were to arise from any such claim, there can be no certainty we would prevail in it. If any of these risks were to materialize, it could have a material adverse effect on our business, financial condition, or results of operations.
Control by a principal shareholder could adversely affect our other shareholders.
As of December 31,
2018
, Joe Mansueto, our executive chairman, owned approximately 54% of our outstanding common stock. As a result, he has the ability to control substantially all matters submitted to our shareholders for approval, including the election and removal of directors and any merger, consolidation, or sale of our assets. He also has the ability to control our management and affairs. This concentration of ownership may delay or prevent a change in control; impede a merger, consolidation, takeover, or other business combination involving Morningstar; discourage a potential acquirer from making a tender offer or otherwise attempting to obtain control of the company; or result in actions that may be opposed by other shareholders.
Fluctuations in our operating results may negatively affect our stock price.
We believe our business has relatively large fixed costs and low variable costs, which magnify the impact of revenue fluctuations on our operating results. As a result, a decline in our revenue may lead to a larger decline in operating income. In addition, because we manage our business with a long-term perspective, we generally don’t make significant adjustments to our strategy or cost structure in response to short-term factors. As a result, our operating results may suffer in the short term. In addition, we do not provide earnings guidance or hold one-on-one meetings with institutional investors and research analysts. Because of this policy and limited analyst coverage on our stock, our stock price may not always reflect the intrinsic value of our business and assets. If our operating results or other operating metrics fail to meet the expectations of outside research analysts and investors, the market price of our common stock may decline.
The future sale of shares of our common stock may negatively affect our stock price.
If our significant shareholders sell substantial amounts of our common stock, the market price of our common stock could fall. A reduction in ownership by Joe Mansueto or any other large shareholder could cause the market price of our common stock to fall. In addition, the average daily trading volume in our stock is relatively low. The lack of trading activity in our stock may lead to greater fluctuations in our stock price. Low trading volume may also make it difficult for shareholders to make transactions in a timely fashion.
35
Item 1B. Unresolved Staff Comments
We do not have any unresolved comments from the Staff of the Securities and Exchange Commission regarding our periodic or current reports under the Exchange Act.
Item 2. Properties
As of December 31, 2018
, we leased approximately
474,000
square feet of office space for our U.S. operations, primarily for our corporate headquarters located in Chicago, Illinois. We also lease another
443,000
square feet of office space in
26
other countries around the world, including approximately
121,000
square feet in Shenzhen, China. We believe that our existing and planned office facilities are adequate for our needs and that additional or substitute space is available to accommodate growth and expansion.
Item 3. Legal Proceedings
Michael D. Green
In August 2017, Michael D. Green, individually and purportedly on behalf of all others similarly situated, filed a complaint in the U.S. District Court for the Northern District of Illinois. The complaint named as defendants Morningstar, Inc., Prudential Investment Management Services LLC, and Prudential Retirement Insurance and Annuity Co., and contained one count alleging violation of the Racketeer Influenced and Corrupt Organizations Act (RICO). Plaintiff, a participant in a pension plan, alleged that the defendants engaged in concerted racketeering actions to steer plan participants into high-cost investments that pay unwarranted fees to the defendants. The complaint sought unspecified compensatory damages for plaintiff and the members of the putative class, treble damages, injunctive relief, costs, and attorneys’ fees. We filed a motion to dismiss the complaint for failure to state a claim, which the court granted without prejudice on March 16, 2018. On April 13, 2018, plaintiff filed an amended complaint, substituting Morningstar Investment Management LLC for Morningstar, Inc. as a defendant, and which again contained one count alleging violation of RICO and sought unspecified compensatory damages for plaintiff and the members of the putative class, treble damages, injunctive relief, costs, and attorneys' fees. We moved to dismiss the amended complaint on May 11, 2018, which the court granted with prejudice on January 16, 2019. No appeal was taken by the deadline for doing so.
Other Matters
We are involved from time to time in legal proceedings and litigation that arise in the normal course of our business. While it is difficult to predict the outcome of any particular proceeding, we do not believe the result of any of these matters will have a material adverse effect on our business, operating results, or financial position.
Item 4. Mine Safety Disclosures
Not applicable.
36
Part II
Item 5. Market for Registrant's Common Equity, Related Stockholder Matters and Issuer Purchases of Equity Securities
Our common stock is listed on the Nasdaq Global Select Market under the symbol "MORN".
As of February 15,
2019
, there were 969 shareholders of record of our common stock.
We paid four dividends during
2018
. In the fourth quarter of
2018
, we increased our quarterly cash dividend from 25 cents per share to 28 cents per share. While subsequent dividends will be subject to board approval, we expect to pay a regular quarterly dividend of
28 cents
per share in
2019
.
Any determination to pay dividends in the future will be at the discretion of our board of directors and will be dependent upon our results of operations, financial condition, contractual restrictions, restrictions imposed by applicable law, and other factors deemed relevant by the board of directors. Future indebtedness and loan facilities could also prohibit or restrict our ability to pay dividends and make distributions to our shareholders.
Issuer Purchases of Equity Securities
Subject to applicable law, we may repurchase shares at prevailing market prices directly on the open market or in privately negotiated transactions in amounts that we deem appropriate.
We have an ongoing authorization, most recently approved by the board of directors on December 8, 2017, to repurchase up to
$500.0 million
in shares of the company's outstanding common stock. The authorization expires on
December 31, 2020
.
The following table presents information related to repurchases of common stock we made during the three months ended
December 31, 2018
:
|
Period:
|
Total number
of shares
purchased
|
Average
price paid
per share
|
Total number
of shares
purchased as
part of publicly
announced
programs
|
Approximate
dollar value of
shares that
may yet be
purchased
under the
programs
|
||||||||||
|
October 1, 2018 - October 31, 2018
|
24,300
|
|
$
|
115.44
|
|
24,300
|
|
$
|
486,676,922
|
|
||||
|
November 1, 2018 - November 30, 2018
|
11,539
|
|
116.54
|
|
11,539
|
|
485,331,944
|
|
||||||
|
December 1, 2018 - December 31, 2018
|
57,117
|
|
109.80
|
|
57,117
|
|
479,059,100
|
|
||||||
|
Total
|
92,956
|
|
$
|
112.11
|
|
92,956
|
|
|
|
|||||
37
Rule 10b5-1 Sales Plans
Our directors and executive officers may exercise stock options or purchase or sell shares of our common stock in the market from time to time. We encourage them to make these transactions through plans that comply with Exchange Act Rule 10b5-1(c). Morningstar will not receive any proceeds, other than proceeds from the exercise of stock options, related to these transactions. The following table, which we are providing on a voluntary basis, shows the Rule 10b5-1 sales plans entered into by our directors and executive officers that were in effect as of January 31, 2019:
|
Name and Position
|
Date of
Plan
|
Plan Termination Date
|
Number of
Shares
to be
Sold under
the Plan
|
Timing of Sales under the Plan
|
Number of Shares Sold under the Plan through January 31, 2019
|
Projected
Beneficial
Ownership (1)
|
||||||||||
|
Joe Mansueto Executive Chairman
|
3/20/2018
|
4/30/2019
|
1,600,000
|
|
Shares to be sold under the plan if the stock reaches specified prices
|
1,200,000
|
|
22,597,901
|
|
|||||||
|
Joe Mansueto Executive Chairman
|
11/26/2018
|
4/30/2020
|
1,600,000
|
|
Shares to be sold under the plan if the stock reaches specified prices beginning May 1, 2019
|
—
|
|
20,997,901
|
|
|||||||
During the fourth quarter of
2018
, the previously disclosed Rule 10b5-1 sales plan for Gail Landis and Bill Lyons completed in accordance with their terms.
_______________________________
(1)
This column reflects an estimate of the number of shares Joe Mansueto will beneficially own following the sale of all shares under the Rule 10b5-1 sales plan. This information reflects the beneficial ownership of our common stock on
December 31, 2018
, and includes shares of our common stock subject to options that were then exercisable or that will have become exercisable by March 1, 2019 and restricted stock units that will vest by March 1, 2019. The estimates do not reflect any changes to beneficial ownership that may have occurred since
December 31, 2018
. Joe may amend or terminate his Rule 10b5-1 sales plans and may adopt additional Rule 10b5-1 plans in the future.
38
Item 6. Selected Financial Data
The selected historical financial data shown below should be read in conjunction with Management's Discussion and Analysis of Financial Condition and Results of Operations and our Consolidated Financial Statements and related notes included elsewhere in this Annual Report on Form 10-K. We have derived our Consolidated Statements of Income Data and Consolidated Cash Flow Data for the years ended December 31,
2018
,
2017
, and
2016
and Consolidated Balance Sheet Data as of December 31,
2018
and
2017
from our audited Consolidated Financial Statements included elsewhere in this Annual Report on Form 10-K. The Consolidated Statements of Income Data and Consolidated Cash Flow Data for the years ended December 31,
2015
and
2014
and Consolidated Balance Sheet Data as of December 31,
2016
,
2015
, and
2014
were derived from our audited Consolidated Financial Statements that are not included in this Annual Report on Form 10-K.
|
Consolidated Statements of Income Data
|
|||||||||||||||||||||
|
(in millions except per share amounts)
|
2014
|
2015
|
2016
|
2017
|
2018
|
||||||||||||||||
|
Revenue
|
$
|
760.1
|
|
$
|
788.8
|
|
$
|
798.6
|
|
$
|
911.7
|
|
$
|
1,019.9
|
|
(1)
|
|||||
|
Operating expense
|
654.5
|
|
(2)
|
598.2
|
|
617.8
|
|
741.9
|
|
804.1
|
|
||||||||||
|
Operating income
|
105.6
|
|
(2)
|
190.6
|
|
180.8
|
|
169.8
|
|
215.8
|
|
(1)
|
|||||||||
|
Non-operating income, net
|
8.4
|
|
3.1
|
|
44.1
|
|
(3)
|
11.3
|
|
(3)
|
17.1
|
|
(3)
|
||||||||
|
Income before income taxes and equity in net income (loss) of unconsolidated entities
|
114.0
|
|
193.7
|
|
224.9
|
|
181.1
|
|
232.9
|
|
|||||||||||
|
Equity in net income (loss) of unconsolidated entities
|
—
|
|
1.8
|
|
(0.2
|
)
|
(1.3
|
)
|
(2.1
|
)
|
|||||||||||
|
Income tax expense
|
35.7
|
|
62.7
|
|
63.7
|
|
42.9
|
|
47.8
|
|
|||||||||||
|
Consolidated net income
|
78.3
|
|
132.8
|
|
161.0
|
|
136.9
|
|
183.0
|
|
|||||||||||
|
Net income attributable to noncontrolling interests
|
—
|
|
(0.2
|
)
|
—
|
|
—
|
|
—
|
|
|||||||||||
|
Net income attributable to Morningstar, Inc.
|
$
|
78.3
|
|
$
|
132.6
|
|
$
|
161.0
|
|
$
|
136.9
|
|
$
|
183.0
|
|
||||||
|
Net income per share attributable to Morningstar, Inc.:
|
|||||||||||||||||||||
|
Basic:
|
|||||||||||||||||||||
|
Continuing operations
|
$
|
1.75
|
|
$
|
3.00
|
|
$
|
3.74
|
|
$
|
3.21
|
|
$
|
4.30
|
|
||||||
|
Diluted:
|
|||||||||||||||||||||
|
Continuing operations
|
$
|
1.74
|
|
$
|
3.00
|
|
$
|
3.72
|
|
$
|
3.18
|
|
$
|
4.25
|
|
||||||
|
Dividends per common share:
|
|||||||||||||||||||||
|
Dividends declared per common share
|
$
|
0.70
|
|
$
|
0.79
|
|
$
|
0.89
|
|
$
|
0.94
|
|
$
|
1.03
|
|
||||||
|
Dividends paid per common share
|
$
|
0.68
|
|
$
|
0.76
|
|
$
|
0.88
|
|
$
|
0.92
|
|
$
|
1.00
|
|
||||||
|
Weighted average common shares outstanding:
|
|||||||||||||||||||||
|
Basic
|
44.7
|
|
44.2
|
|
43.0
|
|
42.7
|
|
42.6
|
|
|||||||||||
|
Diluted
|
44.9
|
|
44.3
|
|
43.3
|
|
43.0
|
|
43.0
|
|
|||||||||||
39
|
Consolidated Cash Flow Data (in millions)
|
2014
|
2015
|
2016
|
2017
|
2018
|
||||||||||||||||
|
Cash provided by operating activities
|
$
|
136.6
|
|
(2)
|
$
|
241.5
|
|
$
|
213.7
|
|
$
|
250.1
|
|
$
|
314.8
|
|
(1)
|
||||
|
Capital expenditures
|
(58.3
|
)
|
(57.3
|
)
|
(62.8
|
)
|
(66.6
|
)
|
(76.1
|
)
|
|||||||||||
|
Free cash flow (4)
|
$
|
78.3
|
|
(2)
|
$
|
184.2
|
|
$
|
150.9
|
|
$
|
183.5
|
|
$
|
238.7
|
|
(1)
|
||||
|
Cash used for investing activities (5)
|
$
|
(31.2
|
)
|
$
|
(79.5
|
)
|
$
|
(274.2
|
)
|
$
|
(60.8
|
)
|
$
|
(49.9
|
)
|
||||||
|
Cash provided by (used for) financing activities (6)
|
$
|
(76.1
|
)
|
$
|
(127.5
|
)
|
$
|
123.7
|
|
$
|
(157.5
|
)
|
$
|
(188.8
|
)
|
||||||
|
Consolidated Balance Sheet Data
|
|||||||||||||||||||||
|
As of December 31 (in millions)
|
2014
|
2015
|
2016
|
2017
|
2018
|
||||||||||||||||
|
Cash, cash equivalents, and investments
|
$
|
224.6
|
|
$
|
248.6
|
|
$
|
304.0
|
|
$
|
353.3
|
|
$
|
395.9
|
|
||||||
|
Working capital
|
97.0
|
|
105.5
|
|
177.1
|
|
206.6
|
|
238.8
|
|
|||||||||||
|
Total assets
|
1,010.3
|
|
1,029.0
|
|
1,350.9
|
|
1,405.7
|
|
1,453.8
|
|
|||||||||||
|
Deferred revenue (7)
|
146.0
|
|
152.0
|
|
179.5
|
|
185.5
|
|
210.0
|
|
|||||||||||
|
Long-term liabilities
|
62.1
|
|
84.0
|
|
359.2
|
|
(8)
|
277.6
|
|
(8)
|
156.3
|
|
(8)
|
||||||||
|
Total equity
|
654.4
|
|
640.6
|
|
696.8
|
|
804.9
|
|
934.7
|
|
|||||||||||
(1) Revenue, operating income, and free cash flow in 2018 includes a $10.5 million revenue benefit related to an amended license agreement and a corresponding favorable cash impact.
(2) Operating income and free cash flow for 2014 included a $61.0 million litigation settlement expense and corresponding cash outflow.
(3) Non-operating income in 2016 included a $37.1 million holding gain related to the purchase of the remaining ownership interest in PitchBook, which was previously a minority investment. Non-operating income in 2017 included a $16.7 million gain related to the sale of HelloWallet. Non-operating income in 2018 includes a $10.5 million gain related to the sale of our 15(c) board consulting services product line.
(4) Free cash flow is considered a non-GAAP financial measure under SEC regulations. We present this measure as supplemental information to help investors better understand trends in our business results over time. Our management team uses free cash flow to evaluate our business. Free cash flow is not equivalent to any measure required to be reported under GAAP, nor should this data be considered an indicator of liquidity. Moreover, the free cash flow definition we use may not be comparable to similarly titled measures reported by other companies.
(5) Cash used for investing activities consists primarily of cash used for acquisitions, purchases of investments, net of proceeds from the sale of investments, capital expenditures, purchases of equity and cost-method investments, and proceeds from the sale of businesses, product lines, and equity investments. The level of investing activities can vary from period to period depending on the level of activity in these categories. Refer to Item 7—Management's Discussion and Analysis of Financial Condition and Results of Operations—Liquidity and Capital Resources for more information concerning cash used for investing activities.
(6) Cash provided by (used for) financing activities consists primarily of cash used to make repayments on our revolving credit facility, repurchase outstanding common stock through our share repurchase program, and dividend payments. These cash outflows are partially offset by proceeds from our revolving credit facility and stock option exercises. Refer to Item 7—Management's Discussion and Analysis of Financial Condition and Results of Operations—Liquidity and Capital Resources for more information concerning cash used for financing activities.
40
(7) We frequently invoice or collect cash in advance of providing services or fulfilling subscriptions for our customers and record these balances as deferred revenue. These amounts represent both current and non-current deferred revenue.
(8) Long-term liabilities in 2016, 2017, and 2018 includes $250.0 million, $180.0 million, and $70.0 million of long-term debt, respectively.
Item 7. Management’s Discussion and Analysis of Financial Condition and Results of Operations
The discussion included in this section, as well as other sections of this Annual Report on Form 10-K, contains forward-looking statements as that term is used in the Private Securities Litigation Reform Act of 1995. These statements are based on our current expectations about future events or future financial performance. Forward-looking statements by their nature address matters that are, to different degrees, uncertain, and often contain words such as “may,” “could,” “expect,” “intend,” “plan,” “seek,” “anticipate,” “believe,” “estimate,” “predict,” “potential,” or “continue.” These statements involve known and unknown risks and uncertainties that may cause the events we discuss not to occur or to differ significantly from what we expect. For us, these risks and uncertainties
include, among others:
|
•
|
liability for any losses that result from an actual or claimed breach of our fiduciary duties;
|
|
•
|
failing to maintain and protect our brand, independence, and reputation;
|
|
•
|
failing to differentiate our products and continuously create innovative, proprietary research tools;
|
|
•
|
liability related to the storage of personal information related to individuals as well as portfolio and account-level information;
|
|
•
|
inadequacy of our business continuity program in the event of a material emergency or adverse political or regulatory developments;
|
|
•
|
failing to respond to technological change, keep pace with new technology developments, or adopt a successful technology strategy;
|
|
•
|
trends in the asset management industry, including the decreasing popularity of actively managed investment vehicles and increased industry consolidation;
|
|
•
|
an outage of our database, technology-based products and services, or network facilities or the movement of parts of our technology infrastructure to the public cloud;
|
|
•
|
compliance failures, regulatory action, or changes in laws applicable to our investment advisory or credit rating operations;
|
|
•
|
volatility in the financial sector, global financial markets, and global economy and its effect on our revenue from asset-based fees and credit ratings business;
|
|
•
|
the failure of acquisitions and other investments to produce the results we anticipate;
|
|
•
|
the failure to recruit, develop, and retain qualified employees;
|
|
•
|
challenges faced by our non-U.S. operations, including the concentration of data and development work at our offshore facilities in China and India;
|
|
•
|
liability relating to the acquisition or redistribution of data or information we acquire or errors included therein; and
|
|
•
|
the failure to protect our intellectual property rights or claims of intellectual property infringement against us.
|
A more complete description of these risks and uncertainties can be found in Item 1A—Risk Factors of this Annual Report on Form 10-K. If any of these risks and uncertainties materialize, our actual future results may vary significantly from what we expected. We do not undertake to update our forward-looking statements as a result of new information or future events.
All dollar and percentage comparisons, which are often accompanied by words such as “increase,” “decrease,” “grew,” “declined,” “was up,” “was down,” “was flat,” or “was similar” refer to a comparison with the prior year unless otherwise stated.
41
Understanding Our Company
Key Business Characteristics
We offer an extensive line of products and services for individual investors, financial advisors, asset managers, retirement plan providers and sponsors, and institutional investors and other participants in the private capital markets. Many of our products are sold through subscriptions or license agreements. As a result, we typically generate recurring revenue.
Revenue
We generate revenue by selling a variety of investment-related products and services. We sell many of our products and services, including Morningstar Data, Morningstar Advisor Workstation, Morningstar Direct, Morningstar Research, and PitchBook Data, through license agreements. Our license agreements typically range from one to three years. We sell some of our other products, such as Premium Membership service on Morningstar.com, via subscriptions. These subscriptions are mainly offered for a one-year term, although we offer terms ranging from one month to three years.
Our investment management products have multiple fee structures, which vary by client and region. In general, we seek to receive asset-based fees for any work we perform that involves managing investments or acting as a subadvisor to investment portfolios. For any individual contract, we may receive flat fees, variable asset-based fees, or a combination of the two. Some of our contracts include minimum fee levels that provide us with a flat payment up to a specified asset level, above which we also receive variable asset-based fees. In the majority of our contracts that include variable asset-based fees, we bill clients quarterly in arrears based on average assets for the quarter. Other contracts may include provisions for monthly billing or billing based on assets as of the last day of the billing period rather than on average assets.
In our Workplace Solutions area, our contracts may include one-time setup fees, technology licensing fees, asset-based fees for managed retirement accounts, fixed and variable fees for advice and guidance, or a combination of these fee structures. We also offer plan sponsor advice and custom target-date consulting arrangements. Fees for these services may be based on the level of assets under advisement.
We also generate transaction-based revenue, including the sale of advertising on our websites and sponsorship of conferences. In our credit ratings business, we primarily generate revenue through our provision of ratings on new issues of securities.
Deferred Revenue
We invoice some of our clients and collect cash in advance of providing services or fulfilling subscriptions for our customers. We use some of this cash to fund our operations and invest in new product development. Deferred revenue is the largest liability on our Consolidated Balance Sheets and totaled $
210.0 million
(of which
$195.8 million
was classified as a current liability with an additional $
14.2 million
included in other long-term liabilities) at the end of
2018
. For
2017
, the amount of deferred revenue was $
185.5 million
(of which
$171.3 million
was classified as a current liability with an additional $
14.2 million
included in other long-term liabilities). We expect to recognize this deferred revenue in future periods as we fulfill the service obligations under our subscription, license, and service agreements.
Significant Operating Leverage
Our business requires significant investments to create and maintain proprietary software, databases, and content. While the fixed costs of the investments we make in our business are relatively high, the variable cost of adding customers is relatively low. This reflects our business focus on Internet-based platforms and assets under management. At times, we may make investments in building our databases and content that cause weaker short-term operating results. During other periods, our profitability may improve because we're able to increase revenue without increasing our cost base at the same rate. When revenue decreases, however, we may not be able to adjust our cost base at a corresponding rate.
42
Operating Expense
We classify our operating expense into separate categories for cost of revenue, sales and marketing, general and administrative, and depreciation and amortization, as described below. We include stock-based compensation expense, as appropriate, in each of these categories.
•
Cost of revenue.
This category includes compensation expense for employees who produce the products and services we deliver to our customers. For example, this category covers production teams and analysts who write investment research reports. It also includes compensation expense for programmers, designers, and other employees who develop new products and enhance existing products. In some cases, we capitalize the compensation costs associated with certain software development projects. This reduces the expense that we would otherwise report in this category. Cost of revenue also includes other expenses such as third-party data purchases and data lines.
•
Sales and marketing.
This category includes compensation expense for our sales teams, product managers, and marketing professionals. We also include the cost of advertising, direct mail campaigns, and other marketing and promotion efforts in this category.
•
General and administrative.
This category includes compensation expense for our management team and other corporate functions, including employees in our compliance, finance, human resources, and legal departments. It also includes costs for corporate systems and facilities.
•
Depreciation and amortization.
Our capital expenditures are mainly for capitalized software development costs, information technology equipment, and leasehold improvements. We depreciate property and equipment primarily using the straight-line method based on the useful lives of the assets, which range from three to seven years. We amortize leasehold improvements over the lease term or their useful lives, whichever is shorter. We amortize capitalized software development costs over their estimated economic life, generally three years. We also include amortization related to identifiable intangible assets, which is mainly driven by acquisitions, in this category. We amortize intangible assets using the straight-line method over their estimated economic useful lives, which range from one to 25 years.
International Operations
As of
December 31, 2018
, we had majority-owned operations in
26
countries outside of the U.S. and included their results of operations and financial condition in our consolidated financial statements. We account for certain minority-owned investments in international locations, including Morningstar Japan K.K. (MJKK) and Sustainalytics Holding B.V. (Sustainalytics), using the equity method.
How We Evaluate Our Business
When our analysts evaluate a stock, they focus on assessing the company's estimated intrinsic value, which is based on estimated future cash flows, discounted to their value in today's dollars. Our approach to evaluating our own business works the same way.
Our goal is to increase the intrinsic value of our business over time, which we believe is the best way to create value for our shareholders. We do not make public financial forecasts for our business because we want to avoid creating any incentives for our management team to make speculative statements about our financial results that could influence our stock price or take actions that help us meet short-term forecasts, but may not build long-term shareholder value.
We provide three specific measures that can help investors generate their own assessment of how our intrinsic value has changed over time:
•
Revenue (including organic revenue);
•
Operating income (loss); and
•
Free cash flow.
Organic revenue and free cash flow are not measures of performance set forth under U.S. generally accepted accounting principles (GAAP).
43
We define organic revenue as consolidated revenue excluding acquisitions, divestitures, adoption of accounting changes, and foreign currency translations. We present organic revenue because we believe it helps investors better compare our period-to-period results, and our management team uses this measure to evaluate the performance of our business. We exclude revenue from businesses acquired or divested from organic revenue for a period of 12 months after we complete the acquisition or divestiture. For adoption of accounting changes, we exclude the effects of the adoption for the new revenue recognition standard effective January 1, 2018, as prior period results have not been adjusted. Organic revenue is not equivalent to any measure required under GAAP and may not be comparable to similarly titled measures reported by other companies.
We define free cash flow as cash provided by or used for operating activities less capital expenditures. We present free cash flow as supplemental information to help investors better understand trends in our business results over time. Our management team uses free cash flow to evaluate our business. Free cash flow is not equivalent to any measure required under GAAP and should not be considered an indicator of liquidity. Moreover, the free cash flow definition we use may not be comparable to similarly titled measures reported by other companies.
To evaluate how successful we've been in maintaining existing business for products and services that have renewable revenue, we calculate retention and renewal rates using two different methods. For subscription-based products, we calculate a retention rate based on the number of subscriptions retained during the year as a percentage of the number of subscriptions up for renewal. For products sold through contracts and licenses, we use the contract value method, which is based on tracking the dollar value of renewals compared with the total dollar value of contracts up for renewal during the period. We include changes in the contract value in the renewal amount, unless the change specifically results from adding a new product that we can identify. We also include variable-fee contracts in this calculation and use the actual revenue for the previous comparable fiscal period as the base rate for calculating the renewal percentage. The renewal rate excludes setup and customization fees, migrations to other Morningstar products, and contract renewals that were pending as of January 31, 2019.
The Year 2018 in Review
We continually monitor developments in the economic and financial information industry. We use these insights to help inform our company strategy, product development plans, and marketing initiatives.
Volatility characterized global equity markets in 2018, as the prospect of trade wars shook global economic expectations, a decade’s worth of low-interest rates began reversing, and political uncertainty in the U.S. and Europe further impacted the outlook.
The Morningstar U.S. Market Index, a broad market benchmark, hit a record high on September 20, 2018, then fell 14.6%
by year-end. This index finished 2018 with a full-year loss of 5.1%
, ending a run that lasted the better part of a decade.
International equities fared even worse,
as Morningstar’s Global Markets ex-U.S. Index finished 2018 down 13.7%, with the Developed Markets ex-U.S. Index down 13.9% and the Emerging Markets Index down 13.2%.
Rising interest rates, especially at the long end of the yield curve, along with widening corporate bond credit spreads hampered fixed-income returns in 2018. Over the course of the year, the interest rate on 10-year U.S. Treasury bonds rose 27 basis points. The total annual return for Morningstar's Core Bond Index (our broadest measure of the fixed-income universe) was essentially unchanged for the year. Breaking the overall index down, Morningstar's Short-Term Core Bond Index rose approximately 1.5% and the Intermediate Core Bond Index rose 0.9%, but these gains were offset by the Long-Term Core Bond Index, which fell 3.2%.
Based on Morningstar Asset Flows data, U.S. fund assets, composed of both long-term open-end mutual funds and exchange-traded funds (ETFs), totaled about $17.0 trillion as of December 31, 2018, compared with over $18.1 trillion as of December 31, 2017. Ending the year at approximately $3.4 trillion in assets under management, the U.S. ETF industry remained largely flat year-over-year, as market declines slightly offset investor inflows. In contrast, assets under management in U.S. long-term open-end funds declined to $13.6 trillion from $14.7 trillion in the prior year due to both market declines and investor outflows. In 2018, investors continued to favor passively-managed vehicles, with net inflows of more than $457.0 billion for passively managed funds and ETFs.
Although actively-managed vehicles in aggregate experienced over $303.0 billion of outflows in 2018, most of the decline came from actively-managed U.S. equity mutual funds. Actively-managed ETFs attracted almost $27 billion of investor flows through 2018.
44
Based on PitchBook Platform data, on an aggregated basis, U.S. private capital markets experienced record performance in 2018, as evidenced by many different metrics. Over $713 billion worth of private equity-backed transactions were recorded across an estimated 4,828 completed deals, setting a record for the number of completed deals in a year. The total deal-value figure represented the second-highest yearly figure PitchBook has ever reported. In addition, despite significant volatility in various asset classes, valuations across private equity and M&A remained stable.
The U.S. venture capital market also set a record in 2018 for the most capital ever invested in a single year. Driven by record amounts of capital invested in financing rounds of at least $100 million, roughly $131 billion in capital was invested. Over $55 billion in capital was raised by new vehicles, representing a 62.7% year-over-year increase and setting a record for the most capital raised in a single year. European markets also experienced a surge in total capital deployed by venture capital investors. Driven by an increase in the median deal size across all investment stages, over €20.5 billion was raised by European-headquartered startups in 2018, the largest figure in at least a decade.
Regulatory Environment
In addition to industry developments in 2018, there are several longer-term regulatory trends we consider relevant to our business, as outlined below.
In the wake of the financial crisis of 2008 and 2009, regulators have continued to implement new frameworks for financial services companies globally. Many of these rules relate to financial advisor compensation, fees and expenses, investor disclosure, and the use of hedge funds and alternative investments.
In the United Kingdom, for example, the Retail Distribution Review (RDR), which emphasizes increased regulation of advisory fees, higher professional standards for financial advisors, and "whole of market" investment solutions, became effective in January 2013. The RDR also restricted the use of commission payments for products sold to individual investors. The U.K. regulator is monitoring the implementation of RDR and is scheduled to publish a review of its findings in 2019. In addition to the RDR, the U.K. regulator and Her Majesty's Treasury (HMT) launched the Financial Advice Market Review (FAMR) in 2015 in light of concerns that the market for financial advice was not working well for consumers. FAMR aimed to explore ways in which the government, industry, and regulators could take collective steps to stimulate the development of a market, which delivers affordable and accessible financial advice and guidance to everyone. FAMR's final report, published in March 2016, set out 28 recommendations intended to tackle barriers to consumers accessing advice. The Financial Conduct Authority (FCA) and HMT will review the outcomes of FAMR in 2019.
In the United Kingdom, the FCA will also publish the final report of its Platforms Market Study in 2019. The Study explores the value offered, competition and whether the relationships between platforms, advisers, asset managers and fund ratings providers work in the interests of investors. Also, as of September 2019, U.K. fund managers must appoint a minimum of two independent directors to their boards and conduct an annual assessment of the value that they deliver to investors. These new rules are borne from the regulators Asset Management Market Study that sought to ensure fund managers compete on the value they deliver and act in the interests of investors.
In the European Union, the new version of the Markets in Financial Instruments Directive (MiFID II), became effective in January 2018. The main provisions include, among other things, limits on portfolio managers' use of third-party research, quality and organizational rules regarding the provision of advice, additional governance requirements for the manufacturing and distribution of financial instruments and structured deposits, requirements for firms to provide clients with details of all costs and charges related to their investments, and new rules for disclosing the cumulative effect of costs on investor returns.
With respect to indexes, European Union Benchmarks Regulation 2016/1011 came into force on June 30, 2016 with a majority of its provisions having a compliance date of January 1, 2018. The principal objective of the Regulation is to ensure benchmarks used in financial instruments and financial contracts or to measure the performance of investment funds (e.g., a tracking index of a ETF) are free of conflicts of interest, are used appropriately and reflect the actual market or economic reality they are intended to measure. This Regulation applies to Morningstar’s index group as a result of making available its indexes to European investable product sponsors (e.g., ETF sponsors) as the tracking index for their investable product.
45
The European Commission announced its Action Plan on Sustainable Finance in May 2018. The proposed amendments would adjust the Benchmarks Regulation to create a new category of low-carbon and positive carbon benchmarks as well as change MiFID II to include ESG preferences in the advice they offer to investors. The Plan also proposed new regulations on disclosures relating to sustainable investments and risks and on the establishment of a unified classification system on what can be considered an environmentally sustainable economic activity.
In Australia, the Royal Commission into Misconduct in the Banking, Superannuation and Financial Services Industry has been investigating banking and wealth management businesses. In a final report issued on February 1, 2019, the commission did not recommend the elimination of vertically integrated wealth management business models but has proposed a tighter set of rules around such vertical integration to make it more difficult to inappropriately incentivize the sale of financial products through aligned distribution channels. In particular financial advisers will be required to disclose to a client why they are not independent, impartial and unbiased before providing advice. The commission has also recommended a stronger regulatory presence with the imposition of more fines and an increase in enforcement litigation. The fund management industry also continues to be an area of regulatory reform with the introduction of the Asia Region Funds Passport and Corporate Collective Investment Vehicle Schemes, the review of fees and costs disclosure for managed investment and superannuation funds, and a suite of seven new and updated regulatory guides for the fund management industry.
In the U.S., the U.S. Department of Labor’s (DOL) new fiduciary standard that would have expanded the definition of a fiduciary for certain financial advisors who provide advice related to retirement planning was struck down by the U.S. Court of Appeals for the Fifth Circuit in March 2018. The new rule was previously scheduled to go into effect in April 2017. In April 2018, the SEC proposed “Regulation Best Interest” and may finalize this rule in 2019. Regulation Best Interest echoes many of the principals of the DOL’s rule, although it does not contain the same types of bright-line prohibitions on certain kinds of compensation, nor expose advisors to class-action lawsuits.
Regulators in the financial services industry have indicated they are increasingly concerned by risk factors related to senior management accountability, data protection and privacy, and cybersecurity. For example, jurisdictions such as Hong Kong, the U.K., Australia, and Singapore have adopted or are considering the adoption of more stringent rules that will require that specific individuals be identified as responsible for certain senior management functions and will hold a firm’s senior management team personally accountable for their own and their firm’s actions and conduct. Data privacy regulation continues to proliferate, as various jurisdictions such as the People's Republic of China, the Republic of Brazil, and the State of California join the European Union in adopting comprehensive data privacy regulation. Since operations in the financial services industry require the processing of significant amounts of personally identifiable information (PII), we believe the burdens of regulation, and possibly inconsistent regulation, will proliferate. As a related matter, issues of cybersecurity as they relate to the identification and mitigation of system vulnerabilities should also grow in prominence as services rendered by the industry become increasingly digital over time. For example, the SEC's Office of Compliance Inspections and Examinations has indicated that its 2019 examination programs will prioritize cybersecurity with an emphasis on, among other things, proper configuration of network storage devices, information security governance, and policies and procedures related to retail trading information security.
We believe these regulatory tends will continue in financial markets worldwide.
46
Supplemental Operating Metrics (Unaudited)
The tables below summarize our key product metrics and other supplemental data.
|
As of December 31,
|
||||||||||||||||||||
|
2018
|
2017
|
2016
|
2018 Change
|
2017 Change
|
||||||||||||||||
|
Our business
|
||||||||||||||||||||
|
Morningstar.com Premium Membership subscriptions (U.S.)
|
116,402
|
|
118,462
|
|
118,339
|
|
(1.7
|
)%
|
0.1
|
%
|
||||||||||
|
Morningstar.com average monthly unique users (U.S.)
|
2,090,972
|
|
1,964,513
|
|
1,941,218
|
|
6.4
|
%
|
(1)
|
1.2
|
%
|
|||||||||
|
Advisor Workstation clients (U.S.)
|
171
|
|
182
|
|
175
|
|
(6.0
|
)%
|
4.0
|
%
|
||||||||||
|
Morningstar Office licenses (U.S.)
|
4,378
|
|
4,330
|
|
4,286
|
|
1.1
|
%
|
1.0
|
%
|
||||||||||
|
Morningstar Direct licenses
|
15,033
|
|
13,884
|
|
12,492
|
|
8.3
|
%
|
11.1
|
%
|
||||||||||
|
PitchBook Platform licenses
|
22,979
|
|
13,908
|
|
9,723
|
|
65.2
|
%
|
43.0
|
%
|
||||||||||
|
Asset value linked to Morningstar Indexes ($bil)
|
$
|
46.8
|
|
$
|
34.4
|
|
$
|
25.5
|
|
36.0
|
%
|
34.9
|
%
|
|||||||
|
Assets under management and advisement (approximate) ($bil) (2)
|
||||||||||||||||||||
|
Workplace Solutions
|
||||||||||||||||||||
|
Managed Accounts (3)
|
58.2
|
|
57.6
|
|
46.9
|
|
1.0
|
%
|
22.8
|
%
|
||||||||||
|
Fiduciary Services
|
41.0
|
|
42.5
|
|
34.3
|
|
(3.5
|
)%
|
23.9
|
%
|
||||||||||
|
Custom Models
|
29.0
|
|
28.0
|
|
23.2
|
|
3.6
|
%
|
20.7
|
%
|
||||||||||
|
Workplace Solutions (total)
|
$
|
128.2
|
|
$
|
128.1
|
|
$
|
104.4
|
|
0.1
|
%
|
22.7
|
%
|
|||||||
|
Morningstar Investment Management
|
||||||||||||||||||||
|
Morningstar Managed Portfolios
|
41.7
|
|
40.5
|
|
(4)
|
31.0
|
|
(4)
|
3.0
|
%
|
30.6
|
%
|
||||||||
|
Institutional Asset Management
|
16.8
|
|
16.4
|
|
(5)
|
56.8
|
|
(5)
|
2.4
|
%
|
(71.1
|
)%
|
||||||||
|
Asset Allocation Services
|
6.5
|
|
9.5
|
|
7.2
|
|
(31.6
|
)%
|
31.9
|
%
|
||||||||||
|
Morningstar Investment Management (total)
|
$
|
65.0
|
|
$
|
66.4
|
|
(6)
|
$
|
95.0
|
|
(6)
|
(2.1
|
)%
|
(30.1
|
)%
|
|||||
|
Average assets under management and advisement ($bil)
|
$
|
200.1
|
|
$
|
206.2
|
|
$
|
192.0
|
|
(3.0
|
)%
|
7.4
|
%
|
|||||||
|
Number of new-issue ratings completed
|
138
|
|
97
|
|
70
|
|
42.3
|
%
|
38.6
|
%
|
||||||||||
|
Asset value of new-issue ratings ($bil)
|
$
|
58.2
|
|
$
|
39.0
|
|
$
|
30.7
|
|
49.2
|
%
|
27.0
|
%
|
|||||||
|
Our employees (approximate)
|
||||||||||||||||||||
|
Worldwide headcount
|
5,416
|
|
4,920
|
|
4,550
|
|
(7)
|
10.1
|
%
|
8.1
|
%
|
|||||||||
47
|
Year ended December 31,
|
||||||||||||||||||||
|
(in millions)
|
2018
|
2017
|
2016
|
2018 Change
|
2017 Change
|
|||||||||||||||
|
Key product and investment area revenue (8)
|
||||||||||||||||||||
|
Morningstar Data (9)
|
$
|
185.2
|
|
$
|
166.1
|
|
(10)
|
$
|
154.7
|
|
(10)
|
11.5
|
%
|
7.3
|
%
|
|||||
|
Morningstar Direct
|
137.9
|
|
124.4
|
|
110.5
|
|
10.9
|
%
|
12.6
|
%
|
||||||||||
|
Morningstar Investment Management (11)
|
111.2
|
|
101.0
|
|
(10)
|
92.2
|
|
(10)
|
10.1
|
%
|
9.5
|
%
|
||||||||
|
PitchBook Data
|
99.6
|
|
63.6
|
|
4.1
|
|
(12)
|
56.6
|
%
|
NMF
|
|
|||||||||
|
Morningstar Advisor Workstation
|
90.0
|
|
87.3
|
|
82.4
|
|
3.1
|
%
|
6.0
|
%
|
||||||||||
|
Workplace Solutions
|
75.3
|
|
73.5
|
|
71.3
|
|
2.4
|
%
|
(13)
|
3.2
|
%
|
(13)
|
||||||||
|
Morningstar Credit Ratings
|
36.3
|
|
31.4
|
|
26.4
|
|
15.6
|
%
|
18.8
|
%
|
||||||||||
|
Revenue by Type (8)
|
||||||||||||||||||||
|
License-based (14)
|
$
|
751.6
|
|
$
|
667.7
|
|
(10)
|
$
|
579.4
|
|
(10)
|
12.6
|
%
|
15.2
|
%
|
|||||
|
Asset-based (15)
|
200.4
|
|
182.2
|
|
(10)
|
163.6
|
|
(10)
|
10.0
|
%
|
11.4
|
%
|
||||||||
|
Transaction-based (16)
|
67.9
|
|
61.8
|
|
(10)
|
55.6
|
|
(10)
|
9.8
|
%
|
11.2
|
%
|
||||||||
(1) In prior periods, the Company estimated traffic on Morningstar.com using a combination of internal tools and a third-party platform. The new website launched in the first quarter of 2018 now allows tracking of 100% of website traffic using a third-party platform. The Company believes the current reporting is a more accurate representation of traffic, and this change in methodology is the primary driver of the difference in reported traffic numbers versus 2017.
(2) The asset totals shown above (including assets we either manage directly or for which we provide consulting or subadvisory work) only include assets for which we receive basis-point fees. Some of our client contracts include services for which we receive a flat fee, but we do not include those assets in the total reported.
Excluding changes related to new contracts and cancellations, changes in the value of assets under advisement can come from two primary sources: gains or losses related to overall trends in market performance, and net inflows or outflows caused when investors add to or redeem shares from these portfolios.
Aside from Morningstar Managed Portfolios, it's difficult for our Investment Management business to quantify these cash inflows and outflows. The information we receive from most of our clients does not separately identify the effect of cash inflows and outflows on asset balances for each period. We also cannot specify the effect of market appreciation or depreciation because the majority of our clients have discretionary authority to implement their own portfolio allocations.
(3) Many factors can cause changes in assets under management and advisement for our managed retirement accounts, including employer and employee contributions, plan administrative fees, market movements, and participant loans and hardship withdrawals. The information we receive from the plan providers does not separately identify these transactions or the changes in balances caused by market movement.
(4) 2017 and 2016 amounts are revised to include assets from Australia, which were previously reflected in Institutional Asset Management. 2016 was also revised to include assets from South Africa.
(5) The 2017 decline was due to client losses related to a strategic shift away from our customized investment management offerings to Managed Portfolios. Also, 2017 and 2016 numbers were revised to exclude Australia and South Africa assets, which are reflected in Morningstar Managed Portfolios.
(6) Excludes $1.4 billion and $1.2 billion of assets under advisement and management related to Manager Selection Services as of December 31, 2017 and 2016, respectively, that were reclassified to Morningstar Data. The associated revenue is included in Morningstar Data.
(7) Revised to exclude temporary employees and part-time employees who work less than 30 hours a week.
(8) Key product and investment area revenue and revenue by type includes the effect of foreign currency translations.
(9) The adoption of ASC Topic 606 favorably impacted Morningstar Data revenue during
2018
by $1.5 million.
48
(10) Restated from prior periods due to realignment of individual products within the product groups.
(11) The adoption of ASC Topic 606 favorably impacted Morningstar Investment Management revenue during
2018
by $5.0 million.
(12) Morningstar did not acquire full ownership of PitchBook until December 2016; therefore 2016 results reflected one month of operations.
(13) Excluding the negative 6.5 percentage point impact of the HelloWallet divestiture, revenue increased by 9.7% for the full year in 2017. Excluding the negative 4.6 percentage point impact of the HelloWallet divestiture, revenue increased by 7.0% for the full year in 2018.
(14) License-based revenue includes Morningstar Data, Morningstar Direct, Morningstar Advisor Workstation, Morningstar Enterprise Components, Morningstar Research, PitchBook Data, and other similar products. License-based revenue during 2018 included a $10.5 million revenue benefit related to an amended license agreement.
(15) Asset-based revenue includes Morningstar Investment Management, Workplace Solutions, and Morningstar Indexes.
(16) Transaction-based revenue includes Morningstar Credit Ratings, Internet advertising sales, and Conferences.
Consolidated Results
|
Key Metrics (in millions)
|
2018
|
2017
|
2016
|
2018 Change
|
2017 Change
|
||||||||||||||
|
Revenue
|
$
|
1,019.9
|
|
$
|
911.7
|
|
$
|
798.6
|
|
11.9
|
%
|
14.2
|
%
|
||||||
|
Operating income
|
$
|
215.8
|
|
$
|
169.8
|
|
$
|
180.8
|
|
27.1
|
%
|
(6.0
|
)%
|
||||||
|
Operating margin
|
21.2
|
%
|
18.6
|
%
|
22.6
|
%
|
2.6
|
|
pp
|
(4.0
|
)
|
pp
|
|||||||
|
Cash used for investing activities
|
$
|
(49.9
|
)
|
$
|
(60.8
|
)
|
$
|
(274.2
|
)
|
(17.9
|
)%
|
(77.8
|
)%
|
||||||
|
Cash provided by (used for) financing activities
|
$
|
(188.8
|
)
|
$
|
(157.5
|
)
|
$
|
123.7
|
|
19.9
|
%
|
(227.3
|
)%
|
||||||
|
Cash provided by operating activities
|
$
|
314.8
|
|
$
|
250.1
|
|
$
|
213.7
|
|
25.9
|
%
|
17.0
|
%
|
||||||
|
Capital expenditures
|
(76.1
|
)
|
(66.6
|
)
|
(62.8
|
)
|
14.3
|
%
|
6.1
|
%
|
|||||||||
|
Free cash flow
|
$
|
238.7
|
|
$
|
183.5
|
|
$
|
150.9
|
|
30.1
|
%
|
21.6
|
%
|
||||||
____________________________________________________________________________________________
pp — percentage points
We define free cash flow as cash provided by or used for operating activities less capital expenditures. Please refer to the discussion in How We Evaluate our Business for more detail.
Consolidated Revenue
|
(in millions)
|
2018
|
2017
|
2016
|
2018 Change
|
2017 Change
|
|||||||||||||
|
Consolidated revenue
|
$
|
1,019.9
|
|
$
|
911.7
|
|
$
|
798.6
|
|
11.9
|
%
|
14.2
|
%
|
|||||
In
2018
and
2017
, our consolidated revenue rose
11.9%
and
14.2%
, respectively. Foreign currency movements increased revenue by
$4.0 million
in
2018
and had no net material impact on revenue in
2017
.
We
experienced strong revenue growth across all revenue types during
2018
.
49
License-based revenue grew 12.6% during
2018
. We experienced continued demand for license-based products, such as PitchBook Data, Morningstar Data, and Morningstar Direct. Revenue from PitchBook Data increased by $36.0 million due primarily to strong sales of new licenses and high renewal rates. The number of PitchBook Platform licenses increased to
22,979
at the end of
2018
, compared with
13,908
at the end of
2017
and
9,723
at the end of
2016
. Morningstar Data revenue increased by $19.1 million in 2018, as result of adding new clients and expanding our relationships with existing clients by adding additional datasets primarily within our managed products and market data product lines.
Revenue from Morningstar Direct rose $13.5 million in 2018, reflecting growth in licenses for both new and existing clients and certain price increases. The number of licenses for Morningstar Direct increased to
15,033
worldwide at the end of
2018
, compared with
13,884
at the end of
2017
and
12,492
at the end of
2016
, with growth in both the U.S. and internationally.
During 2018, licensed-based revenue also included a $10.5 million revenue benefit related to an amended license agreement recorded in the third quarter.
Asset-based revenue increased 10.0% during
2018
, primarily driven by Morningstar Managed Portfolios and Workplace Solutions. The adoption of Topic 606 favorably impacted asset-based revenue growth by 2.7 percentage points during 2018. See Note
18
of the Notes to our Consolidated Financial Statements (Note
18
) for additional information. Morningstar Investment Management revenue increased $10.2 million during 2018 due to growth in Morningstar Managed Portfolios offset by declines in institutional asset management. Workplace Solutions revenue increased 2.4% during 2018. Excluding the negative 4.6 percentage point impact of the HelloWallet divestiture in 2017, Workplace Solutions revenue increased by 7.0% for the full year in 2018. The asset-based revenue we earn in both Morningstar Investment Management and Workplace Solutions is generally based on average asset levels during each quarter. Average assets under management and advisement (calculated based on available average quarterly or monthly data) were approximately
$200.1 billion
in
2018
, compared with
$206.2 billion
in
2017
and
$192.0 billion
in
2016
.
Transaction-based revenue grew 9.8% during
2018
, driven by Morningstar Credit Ratings and ad sales on Morningstar.com. Morningstar Credit Ratings completed 138 new-issue ratings, primarily of structured finance securities, representing a 49.2% increase in the asset value of the issues rated during 2018 compared to 2017.
Some of the main contributors to the
2017
revenue increase were PitchBook Data, Morningstar Direct, Morningstar Data, Morningstar Managed Portfolios, Workplace Solutions, and Morningstar Credit Ratings.
Organic revenue
To allow for more meaningful comparisons of our results in different periods, we provide information about organic revenue, which reflects our underlying business excluding acquisitions, divestitures, adoption of accounting changes, and the effect of foreign currency translations. In 2018, we divested our 15(c) board consulting services product line and did not make any significant acquisitions. We also adopted Topic 606 on January 1, 2018, which had a favorable impact on revenue. In 2017, we divested HelloWallet and did not make any acquisitions.
We exclude revenue from acquired businesses from our organic revenue growth calculation for a period of 12 months after we complete the acquisition. For divestitures, we exclude revenue in the prior period for which there is no comparable revenue in the current period.
Foreign currency translation had a favorable effect of
$4.0 million
on revenue in
2018
. Our 2017 results included revenue of $6.1 million from our divestitures of HelloWallet and our 15(c) board consulting services product line, which did not recur in 2018. Our adoption of Topic 606 on January 1, 2018 also favorably impacted revenue by
$6.7 million
during 2018, primarily revenue from Institutional Asset Management and Morningstar Managed Portfolios. See Note
18
for additional information. Excluding acquisitions, divestitures, adoption of accounting changes, and foreign currency translations, organic revenue increased
11.4%
in
2018
.
50
In
2017
, we had
$57.5 million
in incremental revenue from acquisitions, primarily from PitchBook. Revenue in 2016 included $4.4 million of revenue from HelloWallet, which we divested in the second quarter of 2017 that did not recur in the second half of 2017. Revenue from PitchBook was treated as acquired revenue through November 2017 and was incorporated into organic growth statistics after December 1, 2017. Because HelloWallet was divested in the second quarter of 2017, we excluded HelloWallet's last six months of 2016 revenue from our organic revenue growth calculation. In addition, foreign currency translations had no net material impact on revenue in
2017
. Excluding acquisitions, divestitures, and foreign currency translations, organic revenue increased
7.6%
in
2017
.

The tables below reconcile consolidated revenue with organic revenue:
|
2018 vs. 2017 (in millions)
|
2018
|
2017
|
Change
|
||||||||
|
Consolidated revenue
|
$
|
1,019.9
|
|
$
|
911.7
|
|
11.9
|
%
|
|||
|
Less: acquisitions
|
—
|
|
—
|
|
—
|
|
|||||
|
Less: divestitures
|
—
|
|
(6.1
|
)
|
NMF
|
|
|||||
|
Less: adoption of accounting changes
|
(6.7
|
)
|
—
|
|
NMF
|
|
|||||
|
Effect of foreign currency translations
|
(4.0
|
)
|
—
|
|
NMF
|
|
|||||
|
Organic revenue
|
$
|
1,009.2
|
|
$
|
905.6
|
|
11.4
|
%
|
|||
|
2017 vs. 2016 (in millions)
|
2017
|
2016
|
Change
|
||||||||
|
Consolidated revenue
|
$
|
911.7
|
|
$
|
798.6
|
|
14.2
|
%
|
|||
|
Less: acquisitions
|
(57.5
|
)
|
—
|
|
NMF
|
|
|||||
|
Less: divestitures
|
—
|
|
(4.4
|
)
|
NMF
|
|
|||||
|
Less: adoption of accounting changes
|
—
|
|
—
|
|
—
|
|
|||||
|
Effect of foreign currency translations
|
—
|
|
—
|
|
—
|
|
|||||
|
Organic revenue
|
$
|
854.2
|
|
$
|
794.2
|
|
7.6
|
%
|
|||
____________________________________________________________________________________________
NMF — Not meaningful
Organic revenue (revenue excluding acquisitions, divestitures, adoption of accounting changes, and the effect of foreign currency translations) is considered a non-GAAP financial measure. The definition of organic revenue we use may not be the same as similarly titled measures used by other companies. Organic revenue should not be considered an alternative to any measure of performance as promulgated under GAAP.
51
Revenue by region
|
Year ended December 31
|
||||||||||||||||||
|
(in millions)
|
2018
|
2017
|
2016
|
2018 Change
|
2017 Change
|
|||||||||||||
|
United States
|
$
|
764.2
|
|
$
|
687.0
|
|
$
|
590.5
|
|
11.2
|
%
|
16.3
|
%
|
|||||
|
United Kingdom
|
72.4
|
|
64.7
|
|
61.1
|
|
11.9
|
%
|
5.9
|
%
|
||||||||
|
Continental Europe
|
81.2
|
|
69.9
|
|
62.6
|
|
16.2
|
%
|
11.7
|
%
|
||||||||
|
Australia
|
40.9
|
|
34.6
|
|
32.2
|
|
18.2
|
%
|
7.5
|
%
|
||||||||
|
Canada
|
30.7
|
|
29.4
|
|
28.2
|
|
4.4
|
%
|
4.3
|
%
|
||||||||
|
Asia
|
24.5
|
|
21.2
|
|
20.0
|
|
15.6
|
%
|
6.0
|
%
|
||||||||
|
Other
|
6.0
|
|
4.9
|
|
4.0
|
|
22.4
|
%
|
22.5
|
%
|
||||||||
|
Total International
|
255.7
|
|
224.7
|
|
208.1
|
|
13.8
|
%
|
8.0
|
%
|
||||||||
|
Consolidated revenue
|
$
|
1,019.9
|
|
$
|
911.7
|
|
$
|
798.6
|
|
11.9
|
%
|
14.2
|
%
|
|||||
International revenue comprised approximately 25% of our consolidated revenue in
2018
and
2017
, compared with 26% in
2016
. About 60% of our international revenue is from Continental Europe and the United Kingdom. We also have a fairly large revenue base in Australia and Canada.
Revenue from international operations increased
$31.0 million
, or
13.8%
, in
2018
and
$16.6 million
, or
8.0%
in
2017
.
The tables below present a reconciliation from international revenue to international organic revenue:
|
2018 vs. 2017 (in millions)
|
2018
|
2017
|
Change
|
||||||||
|
International revenue
|
$
|
255.7
|
|
$
|
224.7
|
|
13.8
|
%
|
|||
|
Less: acquisitions
|
—
|
|
—
|
|
—
|
|
|||||
|
Less: divestitures
|
—
|
|
—
|
|
—
|
|
|||||
|
Less: adoption of accounting changes
|
(6.4
|
)
|
—
|
|
NMF
|
|
|||||
|
Effect of foreign currency translations
|
(4.0
|
)
|
—
|
|
NMF
|
|
|||||
|
International organic revenue
|
$
|
245.3
|
|
$
|
224.7
|
|
9.2
|
%
|
|||
|
2017 vs. 2016 (in millions)
|
2017
|
2016
|
Change
|
||||||||
|
International revenue
|
$
|
224.7
|
|
$
|
208.1
|
|
8.0
|
%
|
|||
|
Less: acquisitions
|
—
|
|
—
|
|
—
|
|
|||||
|
Less: divestitures
|
—
|
|
—
|
|
—
|
|
|||||
|
Less: adoption of accounting changes
|
—
|
|
—
|
|
—
|
|
|||||
|
Effect of foreign currency translations
|
—
|
|
—
|
|
—
|
|
|||||
|
International organic revenue
|
$
|
224.7
|
|
$
|
208.1
|
|
8.0
|
%
|
|||
International organic revenue (international revenue excluding acquisitions, divestitures, adoption of accounting changes, and the effect of foreign currency translations) is considered a non-GAAP financial measure. The definition of international organic revenue we use may not be the same as similarly titled measures used by other companies. International organic revenue should not be considered an alternative to any measure of performance as promulgated under GAAP.
52
I
nternational organic revenue increased
9.2%
during 2018. Morningstar Data, Morningstar Direct, and Morningstar Managed Portfolios were the main contributors to the organic international growth. Our adoption of Topic 606 on January 1, 2018 also favorably impacted international revenue by
$6.4 million
during 2018, primarily revenue from Institutional Asset Management and Morningstar Managed Portfolios in Australia. See Note
18
for additional information.
In
2017
, international organic revenue increased
8.0%
.
Renewal Rates
As discussed in
How We Evaluate Our Business
, we calculate retention and renewal rates to help measure how successful we've been in maintaining existing business for products and services that have renewable revenue.
The graph below illustrates our retention metrics over the past five years for contract-based products and services, primarily Morningstar Data, Morningstar Direct, PitchBook, Morningstar Advisor Workstation, and Morningstar Office.

For these contract-based products and services, we estimate that our weighted average annual renewal rate was approximately 100% in
2018
, compared with 102% in
2017
. The figure for contract-based products includes the effect of price changes; increasing client bases upon contract renewal; changes to the contract value upon renewal (such as increased users); and changes in the value of variable-fee contracts. These factors, therefore, can lead to a renewal rate percentage over 100%.
Consolidated Operating Expense
|
|
||||||||||||||||||||
|
(in millions)
|
2018
|
2017
|
2016
|
2018 Change
|
2017 Change
|
|||||||||||||||
|
Cost of revenue
|
$
|
411.1
|
|
$
|
386.6
|
|
$
|
344.3
|
|
6.3
|
%
|
12.3
|
%
|
|||||||
|
% of revenue
|
40.3
|
%
|
42.4
|
%
|
43.1
|
%
|
(2.1)
|
pp
|
(0.7
|
)
|
pp
|
|||||||||
|
Sales and marketing
|
148.5
|
|
134.3
|
|
97.6
|
|
10.6
|
%
|
37.6
|
%
|
||||||||||
|
% of revenue
|
14.6
|
%
|
14.7
|
%
|
12.2
|
%
|
(0.1
|
)
|
pp
|
2.5
|
|
pp
|
||||||||
|
General and administrative
|
147.8
|
|
129.8
|
|
105.2
|
|
13.9
|
%
|
23.3
|
%
|
||||||||||
|
% of revenue
|
14.5
|
%
|
14.2
|
%
|
13.2
|
%
|
0.3
|
pp
|
1.0
|
pp
|
||||||||||
|
Depreciation and amortization
|
96.7
|
|
91.2
|
|
70.7
|
|
6.0
|
%
|
28.9
|
%
|
||||||||||
|
% of revenue
|
9.5
|
%
|
10.0
|
%
|
8.9
|
%
|
(0.5
|
)
|
pp
|
1.1
|
pp
|
|||||||||
|
Total operating expense
|
$
|
804.1
|
|
$
|
741.9
|
|
$
|
617.8
|
|
8.4
|
%
|
20.1
|
%
|
|||||||
|
% of revenue
|
78.8
|
%
|
81.4
|
%
|
77.4
|
%
|
(2.6)
|
pp
|
4.0
|
pp
|
||||||||||
53
In
2018
, operating expense increased
$62.2 million
, or
8.4%
. Foreign currency translations increased our operating expense by $2.6 million in
2018
.
Compensation expense (which primarily consists of salaries, bonus, and other company-sponsored benefits) increased $33.4 million in 2018. Salary expense increased by $17.4 million, primarily driven by higher headcount at PitchBook. We accrued higher bonus expense of $16.5 million in 2018 due to stronger performance against our internal targets.
Production expense increased $9.7 million in 2018, related primarily to our adoption of Topic 606. See Note
18
for additional information. Depreciation expense increased
$8.4 million
in 2018, driven mainly by depreciation expense related to capitalized software development incurred over the past several years. Stock-based compensation expense increased $7.7 million in 2018 due to stronger performance against our incentive plan targets as well as accelerated vesting related to retirement or service provisions.
Offsetting these expenses in 2018 was an increase in capitalized software development of $7.2 million. Lower intangible amortization of
$2.9 million
also offset the increase in expenses in 2018 as certain intangible assets from some of our earlier acquisitions are now fully amortized. Commission expense also decreased $2.9 million as a result of the adoption of Topic 606.
We had
5,416
employees worldwide at the end of
2018
, compared with
4,920
in
2017
. This increase reflects continued investment in our key growth initiatives, including operations in India and PitchBook in the U.S. and Europe.
In
2017
, our operating expense increased $124.1 million, or 20.1%. Foreign currency translations reduced our operating expense by $0.6 million in
2017
.
Higher compensation expense, depreciation expense, professional fees, and sales commission expense were the main drivers that contributed to the increase in operating expense in 2017.
Compensation expense increased $65.5 million in
2017
with bonus expense increasing $18.7 million. Bonus expense was higher due to stronger performance against our internal targets. Depreciation expense in
2017
included a $4.1 million impairment charge for certain software licenses due to a shift toward a cloud-based strategy.
Partially offsetting our 2017 total operating expense increase was an increase in internally developed capitalized software. In
2017
, we capitalized
$46.3 million
of software development expense compared to
$28.2 million
of software development expense in
2016
.
We had
4,920
employees worldwide at the end of
2017
, compared with
4,550
in
2016
. This increase reflected continued investment in our key growth initiatives, including data operations in India and China and PitchBook in the U.S. and Europe.
Cost of revenue
Cost of revenue is our largest category of operating expense, representing about one-half of our total operating expense. Our business relies heavily on human capital, and cost of revenue includes the compensation expense for employees who produce our products and services. We include compensation expense for approximately 80% of our employees in this category.
Cost of revenue increased
$24.5 million
, or
6.3%
, in
2018
. Higher compensation expense of $15.8 million was the largest contributor to the increase with bonus expense increasing $9.8 million. Higher production expense also contributed to the unfavorable variance in this category and includes $6.7 million of expense related to our adoption of Topic 606. See Note
18
for additional information.
Higher internally developed capitalized software partially offset these increases. Continuous focus on development of our major software platforms, coupled with bringing new products and capabilities to market, resulted in an increase in capitalized software development, which in turn reduced operating expense. During
2018
, we capitalized
$53.5 million
associated with software development activities, mainly related to enhanced capabilities in our products, internal infrastructure, and software, including PitchBook, Morningstar Cloud Platform, and Morningstar Enterprise Components. In comparison, we capitalized $
46.3 million
in
2017
.
54
Cost of revenue increased
$42.3 million
in
2017
. Higher compensation expense of $36.1 million was the largest contributor to the increase with bonus expense increasing $12.0 million. Professional fees and production expense also contributed to the increase in this category.
Partially offsetting these increases was an increase in internally developed capitalized software. We accelerated development of our major software platforms, resulting in an increase in capitalized software development, which reduced operating expense. During
2017
, we capitalized
$46.3 million
, associated with software development activities, mainly related to PitchBook, Morningstar Data, Workplace Solutions, and additional enhancements to reporting, financial planning, and other capabilities in our products. In comparison, we capitalized $28.2 million in 2016.
As a percentage of revenue, cost of revenue decreased
2.1
percentage points in
2018
and
0.7
percentage points in
2017
.
Sales and marketing
Sales and marketing expense increased
$14.2 million
, or
10.6%
, in
2018
, reflecting a $11.8 million increase in compensation expense. Offsetting this increase was a decrease of $2.9 million in commission expense that is now being capitalized as a result of the adoption of Topic 606. Advertising and marketing spend also decreased $1.1 million during
2018
due to a shift in strategy and mix of spend related to greater use of digital channels versus direct mail campaigns.
Sales and marketing expense increased
$36.7 million
in
2017
. Compensation expense increased $21.2 million due primarily to higher headcount at PitchBook. Sales commission expense also increased $12.6 million during 2017.
As a percentage of revenue, sales and marketing expense was flat in
2018
and increased 2.5 percentage points in
2017
.
General and administrative
General and administrative expense increased
$18.0 million
, or
13.9%
, during
2018
. Compensation expense increased $5.8 million during
2018
with bonus expense increasing $2.9 million. Stock-based compensation increased $5.1 million due to accelerated vesting related to retirement or service provisions and more equity awards granted. Rent expense increased $2.1 million and software subscriptions increased $2.1 million during
2018
.
General and administrative expense increased
$24.6 million
, or
23.3%
, during
2017
. Compensation expense increased $8.2 million due to higher headcount at PitchBook. Stock-based compensation increased $6.3 million, primarily for management bonus plan expense related to PitchBook during
2017
. Rent expense and software subscriptions also contributed to the increase in
2017
.
General and administrative expense as a percentage of revenue was flat in
2018
and
1.0
percentage point in
2017
.
Depreciation and amortization
Overall, depreciation and amortization increased
$5.5 million
, or
6.0%
, in
2018
and
$20.5 million
, or
28.9%
, in
2017
.
Depreciation expense rose
$8.4 million
in
2018
, mainly driven by depreciation expense related to capitalized software development incurred over the past several years. Intangible amortization expense decreased
$2.9 million
in
2018
as certain intangible assets from some of our earlier acquisitions are now fully amortized.
Depreciation expense rose $16.3 million in
2017
from higher depreciation expense related to capitalized software development and computer equipment incurred over the past several years. Depreciation expense during 2017 also included a $4.1 million impairment charge for certain software licenses due to a shift toward a cloud-based strategy. Intangible amortization expense increased $4.2 million in 2017 due to additional amortization expense for the intangible assets of PitchBook offset by certain intangible assets from some previous acquisitions that are now fully amortized.
55
We expect that amortization of intangible assets will be an ongoing cost. We estimate that this expense will total approximately
$19.2 million
in
2019
. Our estimates of future amortization expense for intangible assets may be affected by additional acquisitions, divestitures, changes in the estimated average useful lives, and foreign currency translation.
Consolidated Operating Income and Operating Margin
|
(in millions)
|
2018
|
2017
|
2016
|
||||||||||
|
Operating income
|
$
|
215.8
|
|
$
|
169.8
|
|
$
|
180.8
|
|
||||
|
% change
|
27.1
|
%
|
(6.0
|
)%
|
(5.2
|
)%
|
|||||||
|
Operating margin
|
21.2
|
%
|
18.6
|
%
|
22.6
|
%
|
|||||||
|
Change
|
2.6
|
|
pp
|
(4.0
|
)
|
pp
|
(1.6
|
)
|
pp
|
||||
Consolidated operating income increased
$46.0 million
in
2018
as revenue increased
$108.2 million
and operating expense increased
$62.2 million
. Operating margin was
21.2%
, an increase of
2.6
percentage points compared with
2017
.
For 2018, the $10.5 million revenue benefit related to an amended license agreement positively impacted operating income growth by 6.2 percentage points and operating margin by 0.8 percentage points. This recognition of revenue was not accompanied by a commensurate increase in operating expense.
Consolidated operating income decreased $11.0 million in
2017
as revenue increased $113.1 million and operating expense increased $124.1 million. Operating margin was
18.6%
, a decrease of
4.0
percentage points compared with
2016
.

56
Non-Operating Income, Equity in Net Loss of Unconsolidated Entities, and Effective Tax Rate and Income Tax Expense
Non-Operating Income
The following table presents the components of non-operating income, net:
|
(in millions)
|
2018
|
2017
|
2016
|
|||||||||
|
Interest income
|
$
|
2.3
|
|
$
|
1.9
|
|
$
|
1.8
|
|
|||
|
Interest expense
|
(4.1
|
)
|
(5.5
|
)
|
(1.5
|
)
|
||||||
|
Gain on sale of investments, net
|
1.0
|
|
3.2
|
|
0.6
|
|
||||||
|
Gain on sale of business
|
—
|
|
16.7
|
|
—
|
|
||||||
|
Gain on sale of product line
|
10.5
|
|
—
|
|
—
|
|
||||||
|
Gain on sale of equity investments
|
5.6
|
|
—
|
|
—
|
|
||||||
|
Holding gain upon acquisition of additional ownership of equity-method investments
|
—
|
|
—
|
|
37.1
|
|
||||||
|
Other income (expense), net
|
1.8
|
|
(5.0
|
)
|
6.1
|
|
||||||
|
Non-operating income, net
|
$
|
17.1
|
|
$
|
11.3
|
|
$
|
44.1
|
|
|||
Interest income mainly reflects interest from our investment portfolio. Interest expense mainly relates to the outstanding principal balance on our credit facility. Gain on sale of business relates to our sale of HelloWallet in June 2017. Gain on sale of product line relates to the sale of our 15(c) board consulting services product line in the first quarter of 2018. Gain on sale of equity investments relates to the sale of a portion of our equity ownership interest in Morningstar Japan K.K. (MJKK) in the third quarter of 2018.
Non-operating income in 2016 includes the $37.1 million gain we recorded with the purchase of the remaining ownership interest in PitchBook, which was previously a minority investment.
Other income (expense), net primarily includes foreign currency exchange gains and losses arising from resulting from U.S. dollar denominated short-term investments held in non-U.S. jurisdictions.
Equity in Net Loss of Unconsolidated Entities
|
(in millions)
|
2018
|
2017
|
2016
|
|||||||||
|
Equity in net loss of unconsolidated entities
|
$
|
(2.1
|
)
|
$
|
(1.3
|
)
|
$
|
(0.2
|
)
|
|||
Equity in net loss of unconsolidated entities primarily reflects income from Morningstar Japan K.K. (MJKK) offset by losses in our other equity method investments.
We describe our investments in unconsolidated entities in more detail in Note
10
of the Notes to our Consolidated Financial Statements.
Effective Tax Rate and Income Tax Expense
The following table summarizes the components of our effective tax rate:
|
(in millions)
|
2018
|
2017
|
2016
|
|||||||||
|
Income before income taxes and equity in net loss of unconsolidated entities
|
$
|
232.9
|
|
$
|
181.1
|
|
$
|
224.9
|
|
|||
|
Equity in net loss of unconsolidated entities
|
(2.1
|
)
|
(1.3
|
)
|
(0.2
|
)
|
||||||
|
Total
|
$
|
230.8
|
|
$
|
179.8
|
|
$
|
224.7
|
|
|||
|
Income tax expense
|
$
|
47.8
|
|
$
|
42.9
|
|
$
|
63.7
|
|
|||
|
Effective tax rate
|
20.7
|
%
|
23.9
|
%
|
28.3
|
%
|
||||||
57
U.S. Tax Reform
On December 22, 2017, the President of the United States signed into law the Tax Cuts and Jobs Act (Tax Reform Act). The legislation significantly changed U.S. tax law by, among other things, lowering corporate income tax rates, changing to a territorial tax system and imposing a transitional tax on deemed repatriated earnings of foreign subsidiaries. The Tax Reform Act permanently reduces the U.S. corporate income tax rate from a maximum of 35% to a flat 21% rate, effective from January 1, 2018.
In response to the enactment of the Tax Reform Act, the SEC issued Staff Accounting Bulletin No. 118 (SAB 118) to address the complexity in accounting which allowed SEC registrants to record provisional amounts in earnings for the year ended December 31, 2017. In the fourth quarter of 2017, we recorded provisional estimates in accordance with SAB 118. In the fourth quarter of 2018, we completed our accounting for the Tax Reform Act within the one-year measurement period required by SAB 118.
We are also subject to additional provisions of the Tax Reform Act effective from January 1, 2018.
Refer to Note
15
of the Notes to our Consolidated Financial Statements for information on the provisions of the Tax Reform Act and the amounts that we recorded in our Consolidated Statements of Income for the year ended December 31, 2018, and for a reconciliation of the U.S. federal tax rate to our effective income tax rate.
Our effective tax rate in 2018 was
20.7%
, a decrease of
3.2
percentage points compared with
23.9%
in
2017
, primarily due to the 2018 tax impacts of the Tax Reform Act and also because of updates to our provisional tax estimates recorded in 2017.
Our effective tax rate in
2017
was
23.9%
, a decrease of
4.4
percentage points compared with
28.3%
in
2016
, primarily because of the provisional tax impacts of the Tax Reform Act.
Liquidity and Capital Resources
As of
December 31, 2018
, we had cash, cash equivalents, and investments of
$395.9 million
, up
$42.6 million
from the end of
2017
. The increase reflects cash provided by operating activities, net proceeds of $15.5 million related to the sale and purchase of investments, and proceeds of
$10.5 million
related to the sale of our 15(c) board consulting services product line in the first quarter of 2018. The sale of a portion of an equity-method investment also generated proceeds of $7.9 million. These items were partially offset by
$110.0 million
of repayments of long-term debt,
$76.1 million
of capital expenditures, dividends paid of
$42.6 million
,
$20.9 million
used to repurchase common stock under our share repurchase program, and
$13.3 million
for employee taxes paid from withholding of restricted stock units. Purchases of equity-method investments of
$7.4 million
also offset the cash inflows.

58
Cash provided by operating activities is our main source of cash. In
2018
, cash provided by operating activities was
$314.8 million
, reflecting
$296.3 million
of net income, adjusted for non-cash items and
$18.5 million
in positive changes from our net operating assets and liabilities, which included bonus payments of $48.2 million.
In December 2018, we amended our credit agreement to extend the maturity date to December 21, 2020 with no other changes in terms. The agreement provides us with a borrowing capacity of up to
$300.0 million
. We had an outstanding principal balance of
$70.0 million
as of
December 31, 2018
, leaving borrowing availability of
$230.0 million
. The credit agreement also contains financial covenants under which we: (i) may not exceed a maximum consolidated leverage ratio of 3.00 to 1.00 and (ii) are required to maintain a minimum consolidated interest coverage ratio of not less than 3.00 to 1.00. We were in compliance with the financial covenants at
December 31, 2018
.
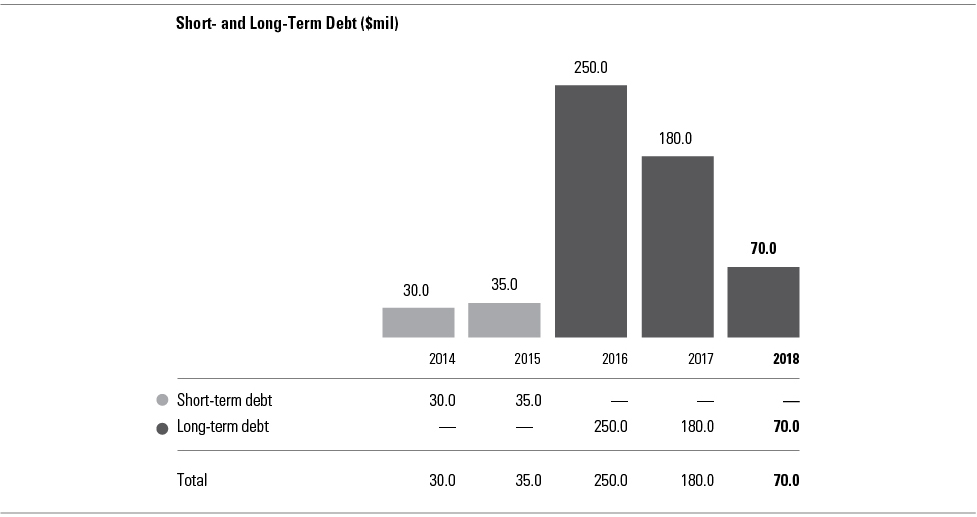
We believe our available cash balances and investments, along with cash generated from operations and our line of credit, will be sufficient to meet our operating and cash needs for at least the next 12 months. We invest our cash reserves in cash equivalents and investments. We maintain a conservative investment policy for our investments. We invest a portion of our investment balance (approximately $24.1 million, or 91% of our total investments balance as of
December 31, 2018
) in stocks, bonds, options, mutual funds, money market funds, or exchange-traded products that replicate the model portfolios and strategies created by Morningstar. These investment accounts may also include exchange-traded products where Morningstar is an index provider.
Approximately 67% of our cash, cash equivalents, and investments as of
December 31, 2018
was held by our operations outside the U.S., down from about 69% as of December 31,
2017
. The amount of accumulated undistributed earnings of our foreign subsidiaries was approximately $209.2 million as of December 31, 2018. In February 2019, we repatriated approximately $45.8 million of these foreign earnings back to the U.S. Otherwise, we generally consider our U.S. directly-owned foreign subsidiary earnings to be permanently reinvested. We have not recorded deferred income taxes on the $209.2 million primarily because most of these earnings were previously subject to the one-time deemed mandatory repatriation tax under that Tax Reform Act, which we recorded in 2017 as an expense in our Consolidated Statement of Income.
We intend to use our cash, cash equivalents, and investments for general corporate purposes, including working capital and funding future growth.
In December 2017, the board of directors approved a new share repurchase program that authorizes the company to repurchase up to
$500.0 million
in shares of the company's outstanding common stock, effective January 1, 2018. The authorization expires on December 31, 2020. In
2018
, we repurchased a total of approximately
0.2 million
shares for
$20.9 million
and had approximately
$479.1 million
available for future repurchases as of
December 31, 2018
.
59
In
2018
, we also paid dividends of
$42.6 million
. In February
2019
, our board of directors declared a quarterly dividend of 28 cents per share. The dividend is payable on
April 30, 2019
to shareholders of record as of
April 5, 2019
. While subsequent dividends will be subject to board approval, we expect to make regular quarterly dividend payments of 28 cents per share in
2019
.
We expect to continue making capital expenditures in
2019
, primarily for computer hardware and software provided by third parties, internally developed software, and leasehold improvements for new and existing office locations. We continue to adopt more public cloud and software as a service applications for new initiatives and are in the process of migrating relevant parts of our data center to the public cloud over the next several years. During this migration, we expect to run certain applications and infrastructure in parallel. These actions will have some transitional effects on our level of capital expenditures and operating expenses.
We also expect to use a portion of our cash and investments balances in the first quarter of
2019
to make annual bonus payments of approximately $62.0 million related to the
2018
bonus compared to $48.2 million in
2017
.
Consolidated Free Cash Flow
As described in more detail above, we define free cash flow as cash provided by or used for operating activities less capital expenditures. We present free cash flow solely as supplemental disclosure to help investors better understand how much cash is available after we spend money to operate our business. Our management team uses free cash flow to evaluate our business. Free cash flow is not a measure of performance set forth under GAAP. Also, the free cash flow definition we use may not be comparable to similarly titled measures used by other companies.
|
(in millions)
|
2018
|
2017
|
2016
|
2018 Change
|
2017 Change
|
|||||||||||||
|
Cash provided by operating activities
|
$
|
314.8
|
|
$
|
250.1
|
|
$
|
213.7
|
|
25.9
|
%
|
17.0
|
%
|
|||||
|
Capital expenditures
|
(76.1
|
)
|
(66.6
|
)
|
(62.8
|
)
|
14.3
|
%
|
6.1
|
%
|
||||||||
|
Free cash flow
|
$
|
238.7
|
|
$
|
183.5
|
|
$
|
150.9
|
|
30.1
|
%
|
21.6
|
%
|
|||||
We generated free cash flow of
$238.7 million
in
2018
, an increase of
$55.2 million
versus
2017
. The change reflects a
$64.7 million
increase in cash provided by operating activities as well as a
$9.5 million
increase in capital expenditures.
We generated free cash flow of
$183.5 million
in
2017
, an increase of
$32.6 million
versus
2016
. The change reflects a
$36.4 million
increase in cash provided by operating activities as well as a
$3.8 million
increase in capital expenditures.
Acquisitions
We paid a total of
$193.0 million
, less cash acquired, related to acquisitions over the past three years. We describe these acquisitions in Note
8
of the Notes to our Consolidated Financial Statements.
We paid a total of
$48.7 million
related to purchasing additional investments in unconsolidated entities over the past three years. We describe these investments in Note
10
of the Notes to our Consolidated Financial Statements.
Divestitures
We sold our 15(c) board consulting services product line in 2018 and received a total of $10.5 million related to this sale. We sold HelloWallet in 2017 and received a total of
$23.7 million
related to this sale. For more information, please see Note
9
of the Notes to our Consolidated Financial Statements.
60
Application of Critical Accounting Policies and Estimates
Our discussion and analysis of our financial condition and results of operations are based on our Consolidated Financial Statements, which have been prepared in accordance with GAAP. We discuss our significant accounting policies in Note
2
of the Notes to our Consolidated Financial Statements. The preparation of financial statements in accordance with GAAP requires our management team to make estimates and assumptions that affect the reported amounts of assets, liabilities, revenue, expense, and related disclosures included in our Consolidated Financial Statements.
We continually evaluate our estimates. We base our estimates on historical experience and various other assumptions that we believe are reasonable. Based on these assumptions and estimates, we make judgments about the carrying values of assets and liabilities that are not readily apparent from other sources. Our actual results could vary from these estimates and assumptions. If actual amounts are different from previous estimates, we include revisions in our results of operations for the period in which the actual amounts become known.
We believe the following critical accounting policies reflect the significant judgments and estimates used in the preparation of our Consolidated Financial Statements:
Revenue Recognition
Most of our revenue comes from the sale of subscriptions or licenses for data, software, and Internet-based products and services. We recognize this revenue in equal amounts over the term of the subscription or license, which generally ranges from one to three years. We also provide research, investment management, retirement advice, and other services. We recognize this revenue when the service is provided or during the service obligation period defined in the contract.
We make significant judgments related to revenue recognition, including identifying the transaction price in a contract. It is probable that we will collect all of the consideration to which we will be entitled in exchange for the goods or services that will be transferred to the customer. For contracts that combine multiple products and services, we make judgments regarding the value of each element in the arrangement based on selling prices of the items when sold separately. We recognize revenue as we satisfy our performance obligations under the terms of the contracts with our customers. If arrangements include an acceptance provision, we begin recognizing revenue upon the receipt of customer acceptance.
We make judgments at the beginning of an arrangement regarding whether or not collection of the consideration to which we are entitled is probable. We typically sell to institutional customers with whom we have a history of successful collections and assess the probability of collection on a case-by-case basis.
Deferred revenue is the amount invoiced or collected in advance for subscriptions, licenses, or services that has not yet been recognized as revenue. Deferred revenue is the largest liability on our Consolidated Balance Sheets, and at the end of
2018
, it totaled
$210.0 million
(of which
$195.8 million
was classified as a current liability with an additional
$14.2 million
included in other long-term liabilities). We expect to recognize this deferred revenue in future periods as we fulfill our service obligations under our subscription, license, and service agreements.
The amount of deferred revenue may increase or decrease based on the mix of contracted products and services and the volume of new and renewal subscriptions. The timing of future revenue recognition may change depending on the terms of the license agreements and the timing of fulfilling our service obligations. To the extent that there are material differences between our determination of deferred revenue and actual results, our financial condition or results of operations may be affected.
Acquisitions, Goodwill, and Other Intangible Assets
Our financial statements reflect the operations of an acquired business starting from the completion of the transaction. We record the estimated fair value of assets acquired and liabilities assumed as of the date of acquisition.
Allocating the purchase price to the acquired assets and liabilities involves management judgment. We base the fair value estimates on available historical information and on future expectations and assumptions that we believe are reasonable, but these estimates are inherently uncertain.
61
Determining the fair value of intangible assets requires significant management judgment in each of the following areas:
|
•
|
Identify the acquired intangible assets: For each acquisition, we identify the intangible assets acquired. These intangible assets generally consist of customer relationships, trademarks and trade names, technology-related intangibles (including internally developed software and databases), and noncompete agreements.
|
|
•
|
Estimate the fair value of these intangible assets: We consider various approaches to value the intangible assets. These include the cost approach, which measures the value of an asset based on the cost to reproduce it or replace it with another asset of like utility; the market approach, which values the asset through an analysis of sales and offerings of comparable assets; and the income approach, which measures the value of an asset based on the present value of the economic benefits it is expected to produce.
|
|
•
|
Estimate the remaining useful life of the assets: For each intangible asset, we use judgment and assumptions to establish the remaining useful life of the asset. For example, for customer relationships, we determine the estimated useful life with reference to observed customer attrition rates. For technology-related assets such as databases, we make judgments about the demand for current data and historical metrics in establishing the remaining useful life. For internally developed software, we estimate an obsolescence factor associated with the software.
|
We record any excess of the purchase price over the estimated fair values of the net assets acquired as goodwill, which is not amortized. Instead, it is subject to an impairment test annually or whenever indicators of impairment exist. We review the carrying value of goodwill for impairment at least annually based on our assessment of impairment indicators. If impairment indicators exist, we reduce the goodwill balance to reflect the revised fair value.
We believe the accounting estimates related to purchase price allocations and subsequent goodwill impairment testing are critical accounting estimates because changes in these assumptions could materially affect the amounts and classifications of assets and liabilities presented in our Consolidated Balance Sheets, as well as the amount of amortization and depreciation expense, if any, recorded in our Consolidated Statements of Income.
Stock-Based Compensation
We include stock-based compensation expense in each of our operating expense categories. Our stock-based compensation expense primarily reflects grants of restricted stock units, performance share awards, and market stock units.
We measure stock-based compensation expense at the grant date based on the fair value of the award and recognize the expense ratably over the award's vesting period. We measure the fair value of our restricted stock units on the date of grant based on the market price of the underlying common stock as of the close of trading on the day before the grant. We estimate expected forfeitures of stock-based awards at the grant date and recognize compensation cost only for those awards expected to vest. We later adjust this forfeiture assumption to the actual forfeiture rate. Therefore, changes in the forfeiture assumptions do not change the total amount of expense ultimately recognized over the vesting period. Instead, different forfeiture assumptions would only affect the timing of expense recognition over the vesting period.
We adjust the stock-based compensation expense to reflect those awards that ultimately vested and update our estimate of the forfeiture rate that will be applied to awards not yet vested.
Income Taxes
Our effective tax rate is based on the mix of income and losses in our U.S. and non-U.S. operations, statutory tax rates, and tax-planning opportunities available to us in the various jurisdictions in which we operate. Significant judgment is required to evaluate our tax positions.
62
Because of timing differences required by tax law, the effective tax rate reflected in our Consolidated Financial Statements is different from the tax rate reported on our tax return (our cash tax rate). Some of these differences, such as expenses that are not deductible in our tax return, are permanent. Other differences, such as depreciation expense, reverse over time. These timing differences create deferred tax assets and liabilities. We determine our deferred tax assets and liabilities based on temporary differences between the financial reporting and the tax basis of assets and liabilities.
As of
December 31, 2018
, we had gross deferred tax assets of
$37.9 million
and gross deferred tax liabilities of
$58.1 million
. The deferred tax assets include
$2.4 million
of deferred tax assets related to
$10.6 million
of net operating losses (NOLs) of our non-U.S. operations. In assessing the realizability of our deferred tax assets, we consider whether it is more likely than not that some portion or all of the deferred tax assets will not be realized. We have recorded a valuation allowance against all but approximately
$2.0 million
of the non-U.S. NOLs, reflecting the likelihood that the benefit of the NOLs will not be realized. We have not recorded a valuation allowance against the U.S. federal NOLs of
$1.0 million
because we expect the benefit of the U.S. federal NOLs to be fully utilized before expiration.
In assessing the need for a valuation allowance, we consider both positive and negative evidence, including tax planning strategies, projected future taxable income, and recent financial performance. If we determine a lower allowance is required at some point in the future, we would record a reduction to our tax expense and valuation allowance. These adjustments would be made in the same period we determined the change in the valuation allowance was needed. This would cause our income tax expense, effective tax rate, and net income to fluctuate.
We use judgment to identify, recognize, and measure the amounts of uncertain tax positions to be recorded in the financial statements related to tax positions taken or expected to be taken in a tax return. We recognize liabilities to represent our potential future obligations to taxing authorities for the benefits taken in our tax returns. We adjust these liabilities, including any impact of the related interest and penalties, in light of changing facts and circumstances, such as the progress of a tax audit. A number of years may elapse before a particular matter for which we have established a reserve is audited and finally resolved. The number of years with open tax audits varies depending on the tax jurisdiction.
We use judgment to classify unrecognized tax benefits as either current or noncurrent liabilities in our Consolidated Balance Sheets. Settlement of any particular issue would usually require the use of cash. We generally classify liabilities associated with unrecognized tax benefits as noncurrent liabilities. It typically takes several years between our initial tax return filing and the final resolution of any uncertain tax positions with the tax authority. We recognize favorable resolutions of tax matters for which we have previously established reserves as a reduction to our income tax expense when the amounts involved become known.
Assessing the future tax consequences of events that have been recognized in our Consolidated Financial Statements or tax returns requires judgment. Variations in the actual outcome of these future tax consequences could materially impact our financial position, results of operations, or cash flows.
Contingencies
We are subject to various claims and contingencies related to legal proceedings and investigations. These legal proceedings involve inherent uncertainties including, but not limited to, court rulings, negotiations between affected parties, and government actions. Assessing the probability of loss for such contingencies and determining how to accrue the appropriate liabilities requires judgment. If actual results differ from our assessments, our financial position, results of operations, or cash flows would be affected.
63
Recently Issued Accounting Pronouncements
Leases:
On February 25, 2016, the Financial Accounting Standards Board (FASB) issued ASU No. 2016-02,
Leases (Topic 842)
, which will require lessees to recognize almost all leases on their balance sheet as a right-of-use asset and a lease liability. The new standard became effective for us on January 1, 2019. The new standard originally required the use of a modified retrospective approach upon adoption. In July 2018, the FASB issued ASU No. 2018-11,
Leases (Topic 842) - Targeted Improvements
, which allows an additional transition method to adopt the new lease standard at the adoption date instead of the beginning of the earliest period presented and recognize a cumulative-effect adjustment to the beginning balance of retained earnings in the period of adoption. We elected this transition method at the adoption date of January 1, 2019. We continue to evaluate the effect that the new standard will have on our consolidated financial statements and related disclosures. We are making meaningful progress on our implementation plan and achieving project milestones, including a comprehensive review of our lease portfolio to identify all leases where the company is either a lessor or lessee. In addition, we implemented lease accounting software in early 2019 to assist in our ongoing lease data collection, tracking and analysis, and are updating our lease processes and related internal controls to reflect changes required to ensure readiness for adoption. We are updating our accounting policies and plan to make an accounting policy election to keep leases with an initial term of 12 months or less off of the balance sheet. We also plan to recognize those lease payments in the Consolidated Statements of Income on a straight-line basis over the lease term. We do not believe the new standard will have a material impact on our liquidity. The adoption of the new lease standard will have no impact on our debt-covenant compliance under our current agreements.
Income Statement-Reporting Comprehensive Income:
On February 14, 2018, the FASB issued ASU No. 2018-02,
Income Statement-Reporting Comprehensive Income (Topic 220): Reclassification of Certain Tax Effects from Accumulated Other Comprehensive Income
, to address a specific consequence of the Tax Cuts and Jobs Act (the Tax Reform Act) by allowing a reclassification from accumulated other comprehensive income (loss) to retained earnings for stranded tax effects resulting from the Tax Reform Act’s reduction of the U.S. federal corporate income tax rate. The new standard became effective for us on January 1, 2019 and is to be applied either in the period of adoption or retrospectively to each period in which the effect of the change in the U.S. federal corporate income tax rate in the Tax Reform Act is recognized. We are evaluating the effect that the new standard will have on our consolidated financial statements and related disclosures.
Compensation—Stock Compensation:
On June 20, 2018, the FASB issued ASU No. 2018-07,
Compensation—Stock Compensation (Topic 718) - Improvements to Nonemployee Share-Based Payment Accounting,
which aligns the accounting for share-based payment awards issued to employees and nonemployees. Under the new standard, the existing employee guidance will apply to nonemployee share-based transactions (as long as the transaction is not effectively a form of financing), with the exception of specific guidance related to the attribution of compensation cost. The cost of nonemployee awards will continue to be recorded as if the grantor had paid cash for the goods or services. In addition, the contractual term can be used in lieu of an expected term in the option-pricing model for nonemployee awards. The new standard became effective for us on January 1, 2019 and should be applied to all new awards granted after the date of adoption. We are evaluating the effect that the new standard will have on our consolidated financial statements and related disclosures.
Cloud Computing
: On August 29, 2018, the FASB issued ASU No. 2018-15,
Customer's Accounting for Fees Paid in a Cloud Computing Arrangement
, which helps entities evaluate the accounting for fees paid by a customer in a cloud computing arrangement (CCA) by providing guidance for determining when an arrangement includes a software license and when an arrangement is solely a hosted CCA service. Under the new standard, customers will apply the same criteria for capitalizing implementation costs as they would for an arrangement that has a software license. The new guidance also prescribes the balance sheet, income statement, and cash flow classification of the capitalized implementation costs and related amortization expense and requires additional quantitative and qualitative disclosures. The new standard is effective for us on January 1, 2020. Early adoption is permitted, including adoption in any interim period for which financial statements have not been issued. Entities can choose to adopt the new guidance prospectively to eligible costs incurred on or after the date this guidance is first applied or retrospectively. We are evaluating the effect that the new standard will have on our consolidated financial statements and related disclosures.
64
Contractual Obligations
The table below shows our known contractual obligations as of
December 31, 2018
, and the expected timing of cash payments related to these contractual obligations:
|
(in millions)
|
2019
|
2020
|
2021
|
2022
|
2023
|
Thereafter
|
Total
|
|||||||||||||||||||||
|
Minimum commitments on non-cancelable operating lease obligations (1)
|
$
|
34.4
|
|
$
|
36.0
|
|
$
|
32.2
|
|
$
|
20.8
|
|
$
|
15.1
|
|
$
|
47.7
|
|
$
|
186.2
|
|
|||||||
|
Minimum payments related to long-term financing agreements
|
0.8
|
|
0.1
|
|
—
|
|
—
|
|
—
|
|
—
|
|
0.9
|
|
||||||||||||||
|
Minimum payments on credit facility (2)
|
2.4
|
|
72.4
|
|
—
|
|
—
|
|
—
|
|
—
|
|
74.8
|
|
||||||||||||||
|
Unrecognized tax benefits (3)
|
6.6
|
|
—
|
|
—
|
|
—
|
|
—
|
|
—
|
|
6.6
|
|
||||||||||||||
|
Total
|
$
|
44.2
|
|
$
|
108.5
|
|
$
|
32.2
|
|
$
|
20.8
|
|
$
|
15.1
|
|
$
|
47.7
|
|
$
|
268.5
|
|
|||||||
(1) The non-cancelable operating lease obligations are mainly for office space.
(2) The minimum payments on the credit facility reflect the current outstanding principal balance of
$70.0 million
and an estimate for interest and commitment fees.
(3) Represents unrecognized tax benefits (including penalties and interest, less the impact of any associated tax benefits). The amount included in the table represents items that may be resolved through settlement of tax audits or for which the statutes of limitations are expected to lapse during 2019. The table excludes
$7.1 million
of unrecognized tax benefits, included as a long-term liability in our Consolidated Balance Sheet as of
December 31, 2018
, for which we cannot make a reasonably reliable estimate of the period of payment.
65
Item 7A. Quantitative and Qualitative Disclosures about Market Risk
Our investment portfolio is actively managed and may suffer losses from fluctuating interest rates, market prices, or adverse security selection. These accounts may consist of stocks, bonds, options, mutual funds, money market funds, or exchange-traded products that replicate the model portfolios and strategies created by Morningstar. These investment accounts may also include exchange-traded products where Morningstar is an index provider. As of
December 31, 2018
, our cash, cash equivalents, and investments balance was
$395.9
million. Based on our estimates, a 100 basis-point change in interest rates would not have a material effect on the fair value of our investment portfolio.
We are subject to risk from fluctuations in the interest rates related to our long-term debt. The interest rates are based upon the applicable LIBOR rate plus an applicable margin for such loans or the lender's base rate plus an applicable margin for such loans. On an annualized basis, based on
December 31, 2018
, estimated LIBOR rates, we estimate a 100 basis-point change in the LIBOR rate would have a $0.7 million impact.
We are subject to risk from fluctuations in foreign currencies from our operations outside of the U.S. To date, we have not engaged in currency hedging, and we do not currently have any positions in derivative instruments to hedge our currency risk.
The table below shows our exposure to foreign currency denominated revenue and operating income for the year ended December 31,
2018
:
|
(in millions, except foreign currency rates)
|
Euro
|
British Pound
|
Australian Dollar
|
Other Foreign Currencies
|
||||||||||||
|
Foreign currency rate in U.S. dollars as of December 31, 2018
|
1.1446
|
|
1.2737
|
|
0.7055
|
|
—
|
|
||||||||
|
Foreign denominated percentage of revenue
|
5.1
|
%
|
7.1
|
%
|
3.9
|
%
|
8.9
|
%
|
||||||||
|
Foreign denominated percentage of operating income
|
11.1
|
%
|
(1.6
|
)%
|
1.6
|
%
|
(11.2
|
)%
|
||||||||
|
Estimated effect of a 10% adverse currency fluctuation on revenue
|
$
|
(6.6
|
)
|
$
|
(10.2
|
)
|
$
|
(6.1
|
)
|
$
|
(11.6
|
)
|
||||
|
Estimated effect of a 10% adverse currency fluctuation on operating income
|
$
|
(3.1
|
)
|
$
|
0.3
|
|
$
|
(0.7
|
)
|
$
|
2.6
|
|
||||
The table below shows our net investment exposure in foreign currencies as of
December 31, 2018
:
|
(in millions)
|
Euro
|
British Pound
|
Australian Dollar
|
Other Foreign Currencies
|
||||||||||||
|
Assets, net of unconsolidated entities
|
$
|
153.0
|
|
$
|
141.0
|
|
$
|
54.7
|
|
$
|
174.6
|
|
||||
|
Liabilities
|
130.5
|
|
27.8
|
|
19.5
|
|
28.8
|
|
||||||||
|
Net currency position
|
$
|
22.5
|
|
$
|
113.2
|
|
$
|
35.2
|
|
$
|
145.8
|
|
||||
|
Estimated effect of a 10% adverse currency fluctuation on equity
|
$
|
(2.2
|
)
|
$
|
(11.3
|
)
|
$
|
(3.5
|
)
|
$
|
(14.6
|
)
|
||||
66
Item 8. Financial Statements and Supplementary Data
Report of Independent Registered Public Accounting Firm
The Board of Directors and Shareholders
Morningstar, Inc.:
Opinion on the Consolidated Financial Statements
We have audited the accompanying consolidated balance sheets of Morningstar, Inc. and subsidiaries (the Company) as of December 31, 2018 and 2017, the related consolidated statements of income, comprehensive income, equity, and cash flows for each of the years in the three-year period ended December 31, 2018, and the related notes and financial statement Schedule II - Valuation and Qualifying Accounts (collectively, the consolidated financial statements). In our opinion, the consolidated financial statements present fairly, in all material respects, the financial position of the Company as of December 31, 2018 and 2017, and the results of its operations and its cash flows for each of the years in the three-year period ended December 31, 2018, in conformity with U.S. generally accepted accounting principles.
We also have audited, in accordance with the standards of the Public Company Accounting Oversight Board (United States) (PCAOB), the Company’s internal control over financial reporting as of December 31, 2018, based on criteria established in
Internal Control - Integrated Framework (2013)
issued by the Committee of Sponsoring Organizations of the Treadway Commission, and our report dated March 1, 2019 expressed an unqualified opinion on the effectiveness of the Company’s internal control over financial reporting.
Change in Accounting Principle
As discussed in Note 2 to the consolidated financial statements, the Company has changed its method of accounting for revenue from contracts with customers in 2018 due to the adoption of Financial Accounting Standards Board Accounting Standards Codification Topic 606 -
Revenue from Contracts with Customers.
Basis for Opinion
These consolidated financial statements are the responsibility of the Company’s management. Our responsibility is to express an opinion on these consolidated financial statements based on our audits. We are a public accounting firm registered with the PCAOB and are required to be independent with respect to the Company in accordance with the U.S. federal securities laws and the applicable rules and regulations of the Securities and Exchange Commission and the PCAOB.
We conducted our audits in accordance with the standards of the PCAOB. Those standards require that we plan and perform the audit to obtain reasonable assurance about whether the consolidated financial statements are free of material misstatement, whether due to error or fraud. Our audits included performing procedures to assess the risks of material misstatement of the consolidated financial statements, whether due to error or fraud, and performing procedures that respond to those risks. Such procedures included examining, on a test basis, evidence regarding the amounts and disclosures in the consolidated financial statements. Our audits also included evaluating the accounting principles used and significant estimates made by management, as well as evaluating the overall presentation of the consolidated financial statements. We believe that our audits provide a reasonable basis for our opinion.
/s/ KPMG LLP
We have served as the Company’s auditor since 2011.
.
Chicago, Illinois
March 1, 2019
67
Report of Independent Registered Public Accounting Firm
The Board of Directors and Shareholders
Morningstar, Inc.:
Opinion on Internal Control Over Financial Reporting
We have audited Morningstar, Inc.’s and subsidiaries’ (the Company) internal control over financial reporting as of December 31, 2018, based on criteria established in
Internal Control - Integrated Framework (2013)
issued by the Committee of Sponsoring Organizations of the Treadway Commission. In our opinion, the Company maintained, in all material respects, effective internal control over financial reporting as of December 31, 2018, based on criteria established in
Internal Control - Integrated Framework (2013)
issued by the Committee of Sponsoring Organizations of the Treadway Commission.
We also have audited, in accordance with the standards of the Public Company Accounting Oversight Board (United States) (PCAOB), the consolidated balance sheets of the Company as of December 31, 2018 and 2017, the related consolidated statements of income, comprehensive income, equity, and cash flows for each of the years in the three-year period ended December 31, 2018, and the related notes and financial statement Schedule II - Valuation and Qualifying Accounts (collectively, the consolidated financial statements), and our report dated March 1, 2019, expressed an unqualified opinion on those consolidated financial statements.
Basis for Opinion
The Company’s management is responsible for maintaining effective internal control over financial reporting and for its assessment of the effectiveness of internal control over financial reporting, included in the accompanying Mangament’s Report on Internal Control over Financial Reporting. Our responsibility is to express an opinion on the Company’s internal control over financial reporting based on our audit. We are a public accounting firm registered with the PCAOB and are required to be independent with respect to the Company in accordance with the U.S. federal securities laws and the applicable rules and regulations of the Securities and Exchange Commission and the PCAOB.
We conducted our audit in accordance with the standards of the PCAOB. Those standards require that we plan and perform the audit to obtain reasonable assurance about whether effective internal control over financial reporting was maintained in all material respects. Our audit of internal control over financial reporting included obtaining an understanding of internal control over financial reporting, assessing the risk that a material weakness exists, and testing and evaluating the design and operating effectiveness of internal control based on the assessed risk. Our audit also included performing such other procedures as we considered necessary in the circumstances. We believe that our audit provides a reasonable basis for our opinion.
Definition and Limitations of Internal Control Over Financial Reporting
A company’s internal control over financial reporting is a process designed to provide reasonable assurance regarding the reliability of financial reporting and the preparation of financial statements for external purposes in accordance with generally accepted accounting principles. A company’s internal control over financial reporting includes those policies and procedures that (1) pertain to the maintenance of records that, in reasonable detail, accurately and fairly reflect the transactions and dispositions of the assets of the company; (2) provide reasonable assurance that transactions are recorded as necessary to permit preparation of financial statements in accordance with generally accepted accounting principles, and that receipts and expenditures of the company are being made only in accordance with authorizations of management and directors of the company; and (3) provide reasonable assurance regarding prevention or timely detection of unauthorized acquisition, use, or disposition of the company’s assets that could have a material effect on the financial statements.
68
Because of its inherent limitations, internal control over financial reporting may not prevent or detect misstatements. Also, projections of any evaluation of effectiveness to future periods are subject to the risk that controls may become inadequate because of changes in conditions, or that the degree of compliance with the policies or procedures may deteriorate.
/s/ KPMG LLP
Chicago, Illinois
March 1, 2019
69
Morningstar, Inc. and Subsidiaries
Consolidated Statements of Income
|
Year ended December 31 (in millions except per share amounts)
|
2018
|
2017
|
2016
|
|||||||||
|
Revenue
|
$
|
1,019.9
|
|
$
|
911.7
|
|
$
|
798.6
|
|
|||
|
Operating expense:
|
||||||||||||
|
Cost of revenue
|
411.1
|
|
386.6
|
|
344.3
|
|
||||||
|
Sales and marketing
|
148.5
|
|
134.3
|
|
97.6
|
|
||||||
|
General and administrative
|
147.8
|
|
129.8
|
|
105.2
|
|
||||||
|
Depreciation and amortization
|
96.7
|
|
91.2
|
|
70.7
|
|
||||||
|
Total operating expense
|
804.1
|
|
741.9
|
|
617.8
|
|
||||||
|
Operating income
|
215.8
|
|
169.8
|
|
180.8
|
|
||||||
|
Non-operating income:
|
||||||||||||
|
Interest income (expense), net
|
(1.8
|
)
|
(3.6
|
)
|
0.3
|
|
||||||
|
Gain on sale of investments, reclassified from other comprehensive income
|
1.0
|
|
3.2
|
|
0.6
|
|
||||||
|
Gain on sale of business
|
—
|
|
16.7
|
|
—
|
|
||||||
|
Gain on sale of a product line
|
10.5
|
|
—
|
|
—
|
|
||||||
|
Gain on sale of equity investments
|
5.6
|
|
—
|
|
—
|
|
||||||
|
Holding gain upon acquisition of additional ownership of equity method investments
|
—
|
|
—
|
|
37.1
|
|
||||||
|
Other income (expense), net
|
1.8
|
|
(5.0
|
)
|
6.1
|
|
||||||
|
Non-operating income, net
|
17.1
|
|
11.3
|
|
44.1
|
|
||||||
|
Income before income taxes and equity in net loss of unconsolidated entities
|
232.9
|
|
181.1
|
|
224.9
|
|
||||||
|
Equity in net loss of unconsolidated entities
|
(2.1
|
)
|
(1.3
|
)
|
(0.2
|
)
|
||||||
|
Income tax expense
|
47.8
|
|
42.9
|
|
63.7
|
|
||||||
|
Consolidated net income
|
$
|
183.0
|
|
$
|
136.9
|
|
$
|
161.0
|
|
|||
|
Net income per share:
|
||||||||||||
|
Basic
|
$
|
4.30
|
|
$
|
3.21
|
|
$
|
3.74
|
|
|||
|
Diluted
|
$
|
4.25
|
|
$
|
3.18
|
|
$
|
3.72
|
|
|||
|
Dividends per common share:
|
||||||||||||
|
Dividends declared per common share
|
$
|
1.03
|
|
$
|
0.94
|
|
$
|
0.89
|
|
|||
|
Dividends paid per common share
|
$
|
1.00
|
|
$
|
0.92
|
|
$
|
0.88
|
|
|||
|
Weighted average shares outstanding:
|
||||||||||||
|
Basic
|
42.6
|
|
42.7
|
|
43.0
|
|
||||||
|
Diluted
|
43.0
|
|
43.0
|
|
43.3
|
|
||||||
See notes to consolidated financial statements.
70
Morningstar, Inc. and Subsidiaries
Consolidated Statements of Comprehensive Income
|
Year ended December 31 (in millions)
|
2018
|
2017
|
2016
|
|||||||||
|
Consolidated net income
|
$
|
183.0
|
|
$
|
136.9
|
|
$
|
161.0
|
|
|||
|
Other comprehensive income (loss), net of tax:
|
||||||||||||
|
Foreign currency translation adjustment
|
(26.6
|
)
|
33.4
|
|
(27.8
|
)
|
||||||
|
Unrealized gains (losses) on securities:
|
||||||||||||
|
Unrealized holding gains (losses) arising during period
|
(1.0
|
)
|
3.4
|
|
3.3
|
|
||||||
|
Reclassification of gains included in net income
|
(0.8
|
)
|
(1.9
|
)
|
(2.4
|
)
|
||||||
|
Other comprehensive income (loss)
|
(28.4
|
)
|
34.9
|
|
(26.9
|
)
|
||||||
|
Comprehensive income
|
$
|
154.6
|
|
$
|
171.8
|
|
$
|
134.1
|
|
|||
See notes to consolidated financial statements.
71
Morningstar, Inc. and Subsidiaries
Consolidated Balance Sheets
|
As of December 31 (in millions except share amounts)
|
2018
|
2017
|
||||||
|
Assets
|
|
|
|
|
||||
|
Current assets:
|
|
|
|
|
||||
|
Cash and cash equivalents
|
$
|
369.3
|
|
$
|
308.2
|
|
||
|
Investments
|
26.6
|
|
45.1
|
|
||||
|
Accounts receivable, less allowance for doubtful accounts of $4.0 and $3.2, respectively
|
172.2
|
|
148.2
|
|
||||
|
Income tax receivable, net
|
1.8
|
|
—
|
|
||||
|
Deferred commissions
|
14.8
|
|
—
|
|
||||
|
Other current assets
|
16.9
|
|
28.3
|
|
||||
|
Total current assets
|
601.6
|
|
529.8
|
|
||||
|
Property, equipment, and capitalized software, net
|
143.5
|
|
147.4
|
|
||||
|
Investments in unconsolidated entities
|
63.1
|
|
62.0
|
|
||||
|
Goodwill
|
556.7
|
|
564.9
|
|
||||
|
Intangible assets, net
|
73.9
|
|
95.4
|
|
||||
|
Deferred commissions, non-current
|
10.3
|
|
—
|
|
||||
|
Other assets
|
4.7
|
|
6.2
|
|
||||
|
Total assets
|
$
|
1,453.8
|
|
$
|
1,405.7
|
|
||
|
Liabilities and equity
|
|
|
|
|
||||
|
Current liabilities:
|
|
|
|
|
||||
|
Accounts payable and accrued liabilities
|
$
|
54.4
|
|
$
|
49.2
|
|
||
|
Accrued compensation
|
109.5
|
|
92.0
|
|
||||
|
Deferred revenue
|
195.8
|
|
171.3
|
|
||||
|
Other current liabilities
|
3.1
|
|
10.7
|
|
||||
|
Total current liabilities
|
362.8
|
|
323.2
|
|
||||
|
Accrued compensation
|
11.8
|
|
11.7
|
|
||||
|
Deferred tax liability, net
|
22.2
|
|
23.6
|
|
||||
|
Long-term debt
|
70.0
|
|
180.0
|
|
||||
|
Deferred rent
|
24.5
|
|
26.9
|
|
||||
|
Deferred revenue, non-current
|
14.2
|
|
14.2
|
|
||||
|
Other long-term liabilities
|
13.6
|
|
21.2
|
|
||||
|
Total liabilities
|
519.1
|
|
600.8
|
|
||||
|
Equity:
|
|
|
|
|
||||
|
Morningstar, Inc. shareholders’ equity:
|
|
|
|
|
||||
|
Common stock, no par value, 200,000,000 shares authorized, of which 42,624,118 and 42,547,707 shares were outstanding as of December 31, 2018 and December 31, 2017, respectively
|
—
|
|
—
|
|
||||
|
Treasury stock at cost, 10,816,672 and 10,633,637 shares as of December 31, 2018 and December 31, 2017, respectively
|
(726.8
|
)
|
(708.2
|
)
|
||||
|
Additional paid-in capital
|
621.7
|
|
601.0
|
|
||||
|
Retained earnings
|
1,114.8
|
|
958.7
|
|
||||
|
Accumulated other comprehensive loss:
|
||||||||
|
Currency translation adjustment
|
(74.5
|
)
|
(47.9
|
)
|
||||
|
Unrealized gain (loss) on available-for-sale investments
|
(0.5
|
)
|
1.3
|
|
||||
|
Total accumulated other comprehensive loss
|
(75.0
|
)
|
(46.6
|
)
|
||||
|
Total equity
|
934.7
|
|
804.9
|
|
||||
|
Total liabilities and equity
|
$
|
1,453.8
|
|
$
|
1,405.7
|
|
||
See notes to consolidated financial statements.
72
Morningstar, Inc. and Subsidiaries
Consolidated Statements of Equity
|
|
Morningstar, Inc. Shareholders’ Equity
|
|
|||||||||||||||||||||||||||||
|
Accumulated
Other
Comprehensive
Loss
|
|
||||||||||||||||||||||||||||||
|
|
Common Stock
|
|
|
Additional
Paid-in
Capital
|
|
Non
Controlling
Interest
|
|
|
|||||||||||||||||||||||
|
(in millions, except share amounts)
|
Shares
Outstanding
|
|
Par
Value
|
|
Treasury
Stock
|
|
Retained
Earnings
|
|
Total
Equity
|
|
|||||||||||||||||||||
|
Balance as of December 31, 2015
|
43,403,076
|
|
$
|
—
|
|
$
|
(619.8
|
)
|
$
|
575.5
|
|
$
|
739.2
|
|
$
|
(54.6
|
)
|
$
|
0.3
|
|
$
|
640.6
|
|
||||||||
|
Net income
|
|
|
—
|
|
—
|
|
—
|
|
161.0
|
|
—
|
|
—
|
|
161.0
|
|
|||||||||||||||
|
Other comprehensive loss:
|
|||||||||||||||||||||||||||||||
|
Unrealized gain on available-for-sale investments, net of tax of $1.3
|
|
|
—
|
|
—
|
|
—
|
|
—
|
|
3.3
|
|
—
|
|
3.3
|
|
|||||||||||||||
|
Reclassification of adjustments for gains included in net income, net of income tax of $1.8
|
|
|
—
|
|
—
|
|
—
|
|
—
|
|
(2.4
|
)
|
—
|
|
(2.4
|
)
|
|||||||||||||||
|
Foreign currency translation adjustment, net
|
|
|
—
|
|
—
|
|
—
|
|
—
|
|
(27.8
|
)
|
—
|
|
(27.8
|
)
|
|||||||||||||||
|
Other comprehensive loss, net
|
|
|
—
|
|
—
|
|
—
|
|
—
|
|
(26.9
|
)
|
—
|
|
(26.9
|
)
|
|||||||||||||||
|
Issuance of common stock related to stock-option exercises and vesting of restricted stock units, net
|
174,911
|
|
—
|
|
1.4
|
|
(6.0
|
)
|
—
|
|
—
|
|
—
|
|
(4.6
|
)
|
|||||||||||||||
|
Stock-based compensation — restricted stock units
|
|
|
—
|
|
—
|
|
14.6
|
|
—
|
|
—
|
|
—
|
|
14.6
|
|
|||||||||||||||
|
Stock-based compensation — performance share awards
|
|
|
—
|
|
—
|
|
(0.1
|
)
|
—
|
|
—
|
|
—
|
|
(0.1
|
)
|
|||||||||||||||
|
Common shares repurchased
|
(644,993
|
)
|
—
|
|
(49.5
|
)
|
—
|
|
—
|
|
—
|
|
—
|
|
(49.5
|
)
|
|||||||||||||||
|
Dividends declared — common shares outstanding
|
—
|
|
—
|
|
—
|
|
(38.3
|
)
|
—
|
|
—
|
|
(38.3
|
)
|
|||||||||||||||||
|
Balance as of December 31, 2016
|
42,932,994
|
|
—
|
|
(667.9
|
)
|
584.0
|
|
861.9
|
|
(81.5
|
)
|
0.3
|
|
696.8
|
|
|||||||||||||||
|
Net income
|
|
|
—
|
|
—
|
|
—
|
|
136.9
|
|
—
|
|
—
|
|
136.9
|
|
|||||||||||||||
|
Other comprehensive income:
|
|||||||||||||||||||||||||||||||
|
Unrealized gain on available-for-sale investments, net of tax of $1.8
|
|
|
—
|
|
—
|
|
—
|
|
—
|
|
3.4
|
|
—
|
|
3.4
|
|
|||||||||||||||
|
Reclassification of adjustments for gains included in net income, net of income tax of $1.2
|
|
|
—
|
|
—
|
|
—
|
|
—
|
|
(1.9
|
)
|
—
|
|
(1.9
|
)
|
|||||||||||||||
|
Foreign currency translation adjustment, net
|
|
|
—
|
|
—
|
|
—
|
|
—
|
|
33.4
|
|
—
|
|
33.4
|
|
|||||||||||||||
|
Other comprehensive income, net
|
|
|
—
|
|
—
|
|
—
|
|
—
|
|
34.9
|
|
—
|
|
34.9
|
|
|||||||||||||||
|
Issuance of common stock related to stock-option exercises and vesting of restricted stock units, net
|
161,445
|
|
—
|
|
1.6
|
|
(6.2
|
)
|
—
|
|
—
|
|
—
|
|
(4.6
|
)
|
|||||||||||||||
|
Stock-based compensation — restricted stock units
|
|
|
—
|
|
—
|
|
16.5
|
|
—
|
|
—
|
|
—
|
|
16.5
|
|
|||||||||||||||
|
Stock-based compensation — performance share awards
|
|
|
—
|
|
—
|
|
7.1
|
|
—
|
|
—
|
|
—
|
|
7.1
|
|
|||||||||||||||
|
Stock-based compensation — market stock units
|
|
|
—
|
|
—
|
|
0.5
|
|
—
|
|
—
|
|
—
|
|
0.5
|
|
|||||||||||||||
|
Common shares repurchased
|
(546,732
|
)
|
—
|
|
(41.9
|
)
|
—
|
|
—
|
|
—
|
|
—
|
|
(41.9
|
)
|
|||||||||||||||
|
Dividends declared — common shares outstanding
|
|
|
—
|
|
—
|
|
—
|
|
(40.1
|
)
|
—
|
|
—
|
|
(40.1
|
)
|
|||||||||||||||
|
Purchase of additional interest in majority-owned investment
|
—
|
|
—
|
|
(0.9
|
)
|
—
|
|
—
|
|
(0.3
|
)
|
(1.2
|
)
|
|||||||||||||||||
|
Balance as of December 31, 2017
|
42,547,707
|
|
—
|
|
(708.2
|
)
|
601.0
|
|
958.7
|
|
(46.6
|
)
|
—
|
|
804.9
|
|
|||||||||||||||
|
Cumulative effect of accounting change related to the adoption of ASU No. 2014-09
|
|
|
|
|
|
|
17.0
|
|
|
|
|
|
17.0
|
|
|||||||||||||||||
|
Net income
|
—
|
|
—
|
|
—
|
|
183.0
|
|
—
|
|
—
|
|
183.0
|
|
|||||||||||||||||
|
Other comprehensive loss:
|
|||||||||||||||||||||||||||||||
|
Unrealized loss on available-for-sale investments, net of income tax of $0.7
|
—
|
|
—
|
|
—
|
|
—
|
|
(1.0
|
)
|
—
|
|
(1.0
|
)
|
|||||||||||||||||
|
Reclassification of adjustments for gains included in net income, net of income tax of $0.3
|
—
|
|
—
|
|
—
|
|
—
|
|
(0.8
|
)
|
—
|
|
(0.8
|
)
|
|||||||||||||||||
|
Foreign currency translation adjustment, net
|
—
|
|
—
|
|
—
|
|
—
|
|
(26.6
|
)
|
—
|
|
(26.6
|
)
|
|||||||||||||||||
|
Other comprehensive loss, net
|
—
|
|
—
|
|
—
|
|
—
|
|
(28.4
|
)
|
—
|
|
(28.4
|
)
|
|||||||||||||||||
|
Issuance of common stock related to stock-option exercises and vesting of restricted stock units, net of shares withheld for taxes on settlements of restricted stock units
|
278,656
|
|
—
|
|
2.3
|
|
(15.5
|
)
|
—
|
|
—
|
|
—
|
|
(13.2
|
)
|
|||||||||||||||
|
Reclassification of awards previously liability-classified that were converted to equity
|
—
|
|
4.5
|
|
—
|
|
—
|
|
—
|
|
4.5
|
|
|||||||||||||||||||
|
Stock-based compensation — restricted stock units
|
—
|
|
—
|
|
19.8
|
|
—
|
|
—
|
|
—
|
|
19.8
|
|
|||||||||||||||||
|
Stock-based compensation — performance share awards
|
|
|
—
|
|
—
|
|
10.2
|
|
—
|
|
—
|
|
—
|
|
10.2
|
|
|||||||||||||||
|
Stock-based compensation — market stock units
|
—
|
|
—
|
|
1.7
|
|
—
|
|
—
|
|
—
|
|
1.7
|
|
|||||||||||||||||
|
Common shares repurchased
|
(202,245
|
)
|
—
|
|
(20.9
|
)
|
—
|
|
—
|
|
—
|
|
—
|
|
(20.9
|
)
|
|||||||||||||||
|
Dividends declared — common shares outstanding
|
—
|
|
—
|
|
—
|
|
(43.9
|
)
|
—
|
|
—
|
|
(43.9
|
)
|
|||||||||||||||||
|
Balance as of December 31, 2018
|
42,624,118
|
|
$
|
—
|
|
$
|
(726.8
|
)
|
$
|
621.7
|
|
$
|
1,114.8
|
|
$
|
(75.0
|
)
|
$
|
—
|
|
$
|
934.7
|
|
||||||||
See notes to consolidated financial statements.
73
Morningstar, Inc. and Subsidiaries
Consolidated Statements of Cash Flows
|
Year ended December 31 (in millions)
|
2018
|
2017
|
2016
|
|||||||||
|
Operating activities
|
|
|
|
|
||||||||
|
Consolidated net income
|
$
|
183.0
|
|
$
|
136.9
|
|
$
|
161.0
|
|
|||
|
Adjustments to reconcile consolidated net income to net cash flows from operating activities:
|
||||||||||||
|
Depreciation and amortization
|
96.7
|
|
91.2
|
|
70.7
|
|
||||||
|
Deferred income taxes
|
(1.1
|
)
|
(14.1
|
)
|
4.7
|
|
||||||
|
Stock-based compensation expense
|
31.7
|
|
24.1
|
|
14.5
|
|
||||||
|
Provision for bad debt
|
2.5
|
|
2.3
|
|
1.3
|
|
||||||
|
Equity in net loss of unconsolidated entities
|
2.1
|
|
1.3
|
|
0.2
|
|
||||||
|
Gain on sale of business
|
—
|
|
(16.7
|
)
|
—
|
|
||||||
|
Gain on sale of a product line
|
(10.5
|
)
|
—
|
|
—
|
|
||||||
|
Gain on sale of equity investments
|
(5.6
|
)
|
—
|
|
—
|
|
||||||
|
Holding gain upon acquisition of additional ownership of equity-method investments
|
—
|
|
—
|
|
(37.1
|
)
|
||||||
|
Other, net
|
(2.5
|
)
|
1.8
|
|
(6.8
|
)
|
||||||
|
Changes in operating assets and liabilities, net of effects of acquisitions:
|
||||||||||||
|
Accounts receivable
|
(29.6
|
)
|
(1.2
|
)
|
(0.1
|
)
|
||||||
|
Other assets
|
13.4
|
|
(7.8
|
)
|
1.1
|
|
||||||
|
Deferred commissions
|
25.1
|
|
—
|
|
—
|
|
||||||
|
Accounts payable and accrued liabilities
|
6.0
|
|
0.7
|
|
3.4
|
|
||||||
|
Accrued compensation
|
(9.5
|
)
|
20.2
|
|
(8.8
|
)
|
||||||
|
Income taxes—current
|
(12.4
|
)
|
9.7
|
|
1.0
|
|
||||||
|
Deferred revenue
|
28.6
|
|
2.5
|
|
6.7
|
|
||||||
|
Deferred rent
|
(2.0
|
)
|
2.6
|
|
(2.9
|
)
|
||||||
|
Other liabilities
|
(1.1
|
)
|
(3.4
|
)
|
4.8
|
|
||||||
|
Cash provided by operating activities
|
314.8
|
|
250.1
|
|
213.7
|
|
||||||
|
Investing activities
|
|
|
|
|
||||||||
|
Purchases of investments
|
(35.7
|
)
|
(34.9
|
)
|
(32.0
|
)
|
||||||
|
Proceeds from maturities and sales of investments
|
51.2
|
|
42.2
|
|
28.6
|
|
||||||
|
Capital expenditures
|
(76.1
|
)
|
(66.6
|
)
|
(62.8
|
)
|
||||||
|
Acquisitions, net of cash acquired
|
(0.4
|
)
|
(1.0
|
)
|
(191.6
|
)
|
||||||
|
Proceeds from sale of a business, net
|
—
|
|
23.7
|
|
—
|
|
||||||
|
Proceeds from sale of a product line
|
10.5
|
|
—
|
|
—
|
|
||||||
|
Proceeds from sale of equity-method investments
|
7.9
|
|
—
|
|
—
|
|
||||||
|
Purchases of equity- and cost-method investments
|
(7.4
|
)
|
(24.8
|
)
|
(16.5
|
)
|
||||||
|
Other, net
|
0.1
|
|
0.6
|
|
0.1
|
|
||||||
|
Cash used for investing activities
|
(49.9
|
)
|
(60.8
|
)
|
(274.2
|
)
|
||||||
|
Financing activities
|
|
|
|
|
||||||||
|
Common shares repurchased
|
(20.9
|
)
|
(42.3
|
)
|
(48.8
|
)
|
||||||
|
Dividends paid
|
(42.6
|
)
|
(39.3
|
)
|
(37.9
|
)
|
||||||
|
Proceeds from short-term debt
|
—
|
|
—
|
|
40.0
|
|
||||||
|
Repayment of short-term debt
|
—
|
|
—
|
|
(15.0
|
)
|
||||||
|
Proceeds from long-term debt
|
—
|
|
—
|
|
190.0
|
|
||||||
|
Repayment of long-term debt
|
(110.0
|
)
|
(70.0
|
)
|
—
|
|
||||||
|
Proceeds from stock-option exercises
|
0.1
|
|
0.2
|
|
0.4
|
|
||||||
|
Employee taxes withheld for restricted stock units
|
(13.3
|
)
|
(4.8
|
)
|
(5.0
|
)
|
||||||
|
Other, net
|
(2.1
|
)
|
(1.3
|
)
|
—
|
|
||||||
|
Cash provided by (used for) financing activities
|
(188.8
|
)
|
(157.5
|
)
|
123.7
|
|
||||||
|
Effect of exchange rate changes on cash and cash equivalents
|
(15.0
|
)
|
17.3
|
|
(11.2
|
)
|
||||||
|
Net increase in cash and cash equivalents
|
61.1
|
|
49.1
|
|
52.0
|
|
||||||
|
Cash and cash equivalents—beginning of period
|
308.2
|
|
259.1
|
|
207.1
|
|
||||||
|
Cash and cash equivalents—end of period
|
$
|
369.3
|
|
$
|
308.2
|
|
$
|
259.1
|
|
|||
|
2018
|
2017
|
2016
|
||||||||||
|
Supplemental disclosure of cash flow information:
|
|
|
|
|
||||||||
|
Cash paid for income taxes
|
$
|
67.0
|
|
$
|
47.1
|
|
$
|
58.0
|
|
|||
|
Cash paid for interest
|
$
|
3.7
|
|
$
|
5.4
|
|
$
|
1.2
|
|
|||
|
Supplemental information of non-cash investing and financing activities:
|
||||||||||||
|
Unrealized gain (loss) on available-for-sale investments
|
$
|
(2.7
|
)
|
$
|
2.0
|
|
$
|
1.2
|
|
|||
|
Software and equipment obtained under long-term financing arrangement
|
$
|
—
|
|
$
|
0.6
|
|
$
|
9.0
|
|
|||
See notes to consolidated financial statements.
74
MORNINGSTAR, INC. AND SUBSIDIARIES
NOTES TO CONSOLIDATED FINANCIAL STATEMENTS
|
1.
|
Description of Business
|
Morningstar, Inc. and its subsidiaries (Morningstar, we, our, the company) provide independent investment research for investors around the world. We offer an extensive line of products and services for individual investors, financial advisors, asset managers, retirement plan providers and sponsors, and private market/venture capital investors. We have operations in
27
countries.
2
. Summary of Significant Accounting Policies
The acronyms that appear in these Notes to our Consolidated Financial Statements refer to the following:
|
ASC
|
Accounting Standards Codification
|
|
ASU
|
Accounting Standards Update
|
|
EITF
|
Emerging Issues Task Force
|
|
FASB
|
Financial Accounting Standards Board
|
|
SEC
|
Securities and Exchange Commission
|
Principles of Consolidation.
We conduct our business operations through wholly owned or majority-owned operating subsidiaries. The accompanying consolidated financial statements include the accounts of Morningstar, Inc. and our subsidiaries. We consolidate assets, liabilities, and results of operations of subsidiaries in which we have a controlling interest and eliminate all significant intercompany accounts and transactions.
We account for investments in entities in which we exercise significant influence, but do not control, using the equity method.
As part of our investment management operations, we manage certain funds outside of the U.S. that are considered variable interest entities. For the majority of these variable interest entities, we do not have a variable interest. In cases where we do have a variable interest, we are not the primary beneficiary. Accordingly, we do not consolidate any of these variable interest entities.
Use of Estimates.
The preparation of financial statements in conformity with accounting principles generally accepted in the U.S. requires us to make estimates and assumptions that affect the reported amounts of assets, liabilities, revenues, and expenses during the reporting period. Actual results may differ from these estimates.
Cash and Cash Equivalents.
Cash and cash equivalents consist of cash and investments with original maturities of three months or less. We state them at cost, which approximates fair value. We state the portion of our cash equivalents that are invested in money market funds at fair value, as these funds are actively traded and have quoted market prices.
Investments.
We account for our investments in accordance with FASB ASC 320,
Investments—Debt and Equity Securities.
We classify our investments into three categories: held-to-maturity, trading, and available-for-sale.
|
•
|
Held-to-maturity: We classify certain investments, primarily certificates of deposit, as held-to-maturity securities, based on our intent and ability to hold these securities to maturity. We record held-to-maturity investments at amortized cost in our Consolidated Balance Sheets.
|
|
•
|
Trading: We classify certain other investments, primarily equity securities, as trading securities as these relate mainly to investments tracking the strategies of our newsletter portfolios. We include realized and unrealized gains and losses associated with these investments as a component of our operating income in our Consolidated Statements of Income. We record these securities at their fair value in our Consolidated Balance Sheets.
|
75
|
•
|
Available-for-sale: Investments not considered held-to-maturity or trading securities are classified as available-for-sale securities. Available-for-sale securities primarily consist of equity securities, exchange-traded funds, and mutual funds. We report unrealized gains and losses for available-for-sale securities as other comprehensive income (loss), net of related income taxes. We record these securities at their fair value in our Consolidated Balance Sheets.
|
Fair Value Measurements.
FASB ASC 820,
Fair Value Measurements
(FASB ASC 820) defines fair value, establishes a framework for measuring fair value, and expands disclosures about fair value measurements. Under FASB ASC 820, fair value is defined as the price that would be received to sell an asset or paid to transfer a liability in an orderly transaction between market participants as of the measurement date. The standard applies whenever other standards require (or permit) assets or liabilities to be measured at fair value.
FASB ASC 820 uses a fair value hierarchy based on three broad levels of valuation inputs:
|
•
|
Level 1: Valuations based on quoted prices in active markets for identical assets or liabilities that the company has the ability to access.
|
|
•
|
Level 2: Valuations based on quoted prices in markets that are not active or for which all significant inputs are observable, either directly or indirectly.
|
|
•
|
Level 3: Valuations based on inputs that are unobservable and significant to the overall fair value measurement.
|
We provide additional information about our cash equivalents and investments that are subject to valuation under FASB ASC 820 in Note
7
.
Concentration of Credit Risk.
No single customer is large enough to pose a significant credit risk to our operations or financial condition. For the years ended December 31,
2018
,
2017
, and
2016
, no single customer represented 5% or more of our consolidated revenue. If receivables from our customers become delinquent, we begin a collections process. We maintain an allowance for doubtful accounts based on our estimate of the probable losses of accounts receivable.
Property, Equipment, and Depreciation.
We state property and equipment at historical cost, net of accumulated depreciation. We depreciate property and equipment primarily using the straight-line method based on the useful life of the asset, which generally is
three
years. We amortize leasehold improvements over the lease term or their useful lives, whichever is shorter.
Computer Software and Internal Product Development Costs.
We capitalize certain costs in accordance with FASB ASC 350-40,
Internal-Use Software
, FASB ASC 350-50,
Website Development Costs,
and FASB ASC 985,
Software
. Internal product development costs mainly consist of employee costs for developing new web-based products and certain major enhancements of existing products. We amortize these costs on a straight-line basis over the estimated economic life, which is generally
three
years. We include capitalized software development costs related to projects that have not been placed into service in our construction in progress balance.
The table below summarizes our depreciation expense related to internally developed software for the past three years:
|
(in millions)
|
2018
|
2017
|
2016
|
|||||||||
|
Internally developed software depreciation expense
|
$
|
42.8
|
|
$
|
30.6
|
|
$
|
20.0
|
|
|||
The table below summarizes our capitalized software development costs for the past three years:
|
(in millions)
|
2018
|
2017
|
2016
|
|||||||||
|
Capitalized software development costs
|
$
|
53.5
|
|
$
|
46.3
|
|
$
|
28.2
|
|
|||
76
Business Combinations
. When we make acquisitions, we allocate the purchase price to the assets acquired, liabilities assumed, and goodwill. We follow FASB ASC 805,
Business Combinations
. We recognize and measure the fair value of the acquired operation as a whole, as well as the assets acquired and liabilities assumed, at their full fair values as of the date we obtain control, regardless of the percentage ownership in the acquired operation or how the acquisition was achieved. We expense direct costs related to the business combination, such as advisory, accounting, legal, valuation, and other professional fees, as incurred. We recognize restructuring costs, including severance and relocation for employees of the acquired entity, as post-combination expenses unless the target entity meets the criteria of FASB ASC 420,
Exit or Disposal Cost Obligations
, on the acquisition date.
As part of the purchase price allocation, we follow the requirements of FASB ASC 740,
Income Taxes.
This includes establishing deferred tax assets or liabilities reflecting the difference between the values assigned for financial statement purposes and income tax purposes. In certain acquisitions, the goodwill resulting from the purchase price allocation may not be deductible for income tax purposes. FASB ASC 740 prohibits recognition of a deferred tax asset or liability for temporary differences in goodwill if goodwill is not amortizable and deductible for tax purposes.
Goodwill
. Changes in the carrying amount of our recorded goodwill are mainly the result of business acquisitions, divestitures, and the effect of foreign currency translations. In accordance with FASB ASC 350,
Intangibles—Goodwill and Other
, we do not amortize goodwill; instead, goodwill is subject to an impairment test annually, or whenever indicators of impairment exist. An impairment would occur if the carrying amount of a reporting unit exceeded the fair value of that reporting unit. We performed annual impairment reviews in the fourth quarter of
2018
and
2017
. We did not record any impairment losses in
2018
,
2017
, and 2016.
Intangible Assets.
We amortize intangible assets using the straight-line method over their estimated useful lives, which range from
one
to
20
years. We have no intangible assets with indefinite useful lives. In accordance with FASB ASC 360-10-35,
Subsequent Measurement—Impairment or Disposal of Long-Lived Assets
, we review intangible assets for impairment whenever events or changes in circumstances indicate that the carrying value may not be recoverable. If the value of future undiscounted cash flows is less than the carrying amount of an asset group, we record an impairment loss based on the excess of the carrying amount over the fair value of the asset group. We did not record any impairment losses in
2018
,
2017
, and 2016.
Revenue Recognition.
On January 1, 2018, we began recognizing revenue in accordance with ASC Topic 606,
Revenue from Contracts with Customers
. The Company has retained much of the same accounting treatment used to recognize revenue under ASC Topic 606 as under accounting standards in effect in prior periods (see Note
18
for additional information).
Under ASC Topic 606, we recognize revenue by applying the following five-step model to each of our customer arrangements:
1.
Identify the customer contract;
2.
Identify the performance obligations in the contract;
3.
Determine the transaction price;
4.
Allocate the transaction price to the performance obligations; and
5.
Recognize revenue when (or as) performance obligations are satisfied.
Revenues are recognized when (or as) performance obligations are satisfied by transferring a promised product or service to the customer. Products or services are transferred when (or as) the customer obtains control of the product or service. The transaction price for a customer arrangement is the amount we expect to be entitled to in exchange for transferring the promised product or service. The transaction price may include fixed amounts, variable amounts, or both. Amounts invoiced in excess of the revenue recognized for the services transferred during the period will result in an increase to deferred revenue. The timing of cash payments is typically
thirty
to
sixty
days after the performance obligation has been satisfied and these payments reduce our outstanding accounts receivable.
Revenue from contracts with customers is derived from license-based arrangements, asset-based arrangements, and transaction-based arrangements.
77
License-based revenue is generated through subscription contracts with our customers of Morningstar Data, Morningstar Direct, Morningstar Advisor Workstation, Morningstar Enterprise Components, PitchBook Data, and other similar products. Our performance obligations under these contracts are typically satisfied over time, as the customer has access to the product or service during the term of the subscription license and the level of service is consistent during the contract period. Therefore, we recognize revenue for these performance obligations on a straight-line basis, typically over terms of
12
to
36 months
.
Asset-based revenue is generated through consulting service contracts with our customers of Morningstar Investment Management, Workplace Solutions, and Morningstar Indexes. Our performance obligations under these contracts are satisfied over time as the customer receives continuous access to a service for the contract term. We recognize revenue over the contract term based on the value of assets under management and a tiered fee agreed to with the customer (typically in a range of
30
-
55
basis points of the customer’s average daily portfolio balance). Asset-based arrangements typically have a term of
12
to
36 months
. The fees from such arrangements represent variable consideration, and the customer does not make separate purchasing decisions that result in additional performance obligations. Significant changes in the underlying fund assets, or significant disruptions in the market, are evaluated to determine if revisions on estimates of earned asset-based fees for the current quarter are needed. An estimate of variable consideration is included in the initial transaction price only to the extent it is probable that a significant reversal in the amount of revenue recognized will not occur. Estimates of asset-based fees are based on the most recently reported quarter, and, as a result, it is unlikely a significant reversal of revenue would occur.
Transaction-based revenue is generated through contracts with our customers for Internet advertising, Morningstar Conferences, and Morningstar Credit Ratings. Our performance obligations for Internet advertising and Morningstar Conferences are satisfied as the service is delivered, and therefore we recognize revenue when the performance obligation is satisfied (as the customer’s advertisements are displayed and at the completion of the Morningstar Conference). Our performance obligations for Morningstar Credit Ratings include the issuance of the rating and may include surveillance services for a period of time as agreed with the customer. We allocate the transaction price to the deliverables based on their relative selling price, which is generally based on the price we charge when the same deliverable is sold separately. Our performance obligation for the issuance of the rating is satisfied when the rating is issued, which is when we recognize the related revenue. Our performance obligations for surveillance services is satisfied over time, as the customer has access to the service during the surveillance period and the level of service is consistent during the contract period. Therefore, we recognize revenue for this performance obligation on a straight-line basis.
Our contracts with customers may include multiple performance obligations. For most of these arrangements, we generally allocate revenue to each performance obligation based on its estimated standalone selling price. We generally determine standalone selling prices based on prices charged to customers when the same performance obligation is sold separately.
Our contracts with customers may include third-party involvement in providing goods or services to the customer. The inclusion of third-party content does not result in separate performance obligations because is it not delivered separately from the other license obligations. In these arrangements, the customer has contracted to receive a single, bundled solution with third-party and Morningstar content delivered via Morningstar’s subscription services. Revenue and related costs of revenue from third-party content is presented on a gross basis within the condensed consolidated financial statements.
We record taxes imposed on revenue-producing transactions (such as sales, use, value-added, and some excise taxes) on a net basis; therefore, we exclude such taxes from revenue in our Consolidated Statements of Income.
Deferred revenue represents the portion of licenses or subscriptions billed or collected in advance of the service being provided which we expect to recognize as revenue in future periods. Certain arrangements may have cancellation or refund provisions. If we make a refund, it typically reflects the amount collected from a customer for which we have not yet provided services. The refund therefore results in a reduction of deferred revenue.
78
Sales Commissions.
Under prior accounting standards, the Company expensed sales incentive compensation costs, (sales commissions) as incurred. However, upon adopting ASC Topic 606 and ASC 340-40,
Other Assets and Deferred Costs - Contracts with Customers
, on January 1, 2018 (see Note
18
for additional information), we began capitalizing sales commissions, which are considered directly attributable to obtaining a customer contract. Such costs are capitalized using a portfolio approach that aggregates these costs by legal entity within their geographical regions. Capitalized sales commissions are amortized using the straight-line method over a period that is consistent with the transfer of the products or services to the customer to which the sales commission relates. The period of transfer for each portfolio is the shorter of the weighted-average customer life, or the economic life of the underlying technology that delivers the products or services. As of December 31, 2018, the period of transfer was determined to be
two
to
three
years. Discretionary amounts which are added to sales commission payments are expensed as incurred, as they are not considered to be directly attributable to obtaining a customer contract.
Advertising Costs.
Advertising costs include expenses incurred for various print and Internet ads, search engine fees, and direct mail campaigns. We expense advertising costs as incurred. The table below summarizes our advertising expense for the past three years:
|
(in millions)
|
2018
|
2017
|
2016
|
|||||||||
|
Advertising expense
|
$
|
6.4
|
|
$
|
7.0
|
|
$
|
7.6
|
|
|||
Stock-Based Compensation Expense.
We account for our stock-based compensation expense in accordance with FASB ASC 718,
Compensation—Stock Compensation
. Our stock-based compensation expense reflects grants of restricted stock units, restricted stock, performance share awards, market stock units, and stock options. We measure the fair value of our restricted stock units, restricted stock, and performance share awards on the date of grant based on the closing market price of Morningstar's common stock on the day prior to grant. For market stock units, we estimate the fair value of the awards using a Monte Carlo valuation model. For stock options, we estimate the fair value of our stock options on the date of grant using a Black-Scholes option-pricing model. We amortize the fair values to stock-based compensation expense, net of estimated forfeitures, ratably over the vesting period.
We estimate expected forfeitures of all employee stock-based awards and recognize compensation cost only for those awards expected to vest. We determine forfeiture rates based on historical experience and adjust the estimated forfeitures to actual forfeiture experience as needed.
Liability for Sabbatical Leave.
In some of our locations, we offer employees a sabbatical leave. Although the sabbatical policy varies by region, Morningstar's full-time employees are generally eligible for
six
weeks of paid time off after
four
years of continuous service. We account for our sabbatical liability in accordance with FASB ASC 710-10-25
, Compensated Absences
. We record a liability for employees' sabbatical benefits over the period employees earn the right for sabbatical leave and include this liability in Accrued Compensation in our Consolidated Balance Sheet.
Income Taxes.
We record deferred income taxes for the temporary differences between the carrying amount of assets and liabilities for financial statement purposes and tax purposes in accordance with FASB ASC 740,
Income Taxes
(FASB ASC 740). FASB ASC 740 prescribes the minimum recognition threshold a tax position is required to meet before being recognized in the financial statements. It also provides guidance on derecognition, measurement, classification, interest and penalties, accounting in interim periods, and disclosure for uncertain tax positions.
We recognize interest and penalties related to unrecognized tax benefits as part of income tax expense in our Consolidated Statements of Income. We classify liabilities related to unrecognized tax benefits as either current or long-term liabilities in our Consolidated Balance Sheet, depending on when we expect to make payment.
3
. Credit Arrangements
In December 2018, we amended our credit agreement to extend the maturity date to December 21, 2020 with no other changes in terms. The credit agreement provides us with a borrowing capacity of up to
$300.0 million
and provides for issuance of up to
$25.0 million
of letters of credit under the revolving credit facility.
79
The interest rate applicable to any loan under the credit agreement is, at our option, either: (i) the applicable London interbank offered rate (LIBOR) plus an applicable margin for such loans, which ranges between
1.00%
and
1.75%
, based on our consolidated leverage ratio or (ii) the lender's base rate plus the applicable margin for such loans, which ranges between
2.00%
and
2.75%
, based on our consolidated leverage ratio.
The credit agreement also contains financial covenants under which we: (i) may not exceed a maximum consolidated leverage ratio of
3.00
to 1.00 and (ii) are required to maintain a minimum consolidated interest coverage ratio of not less than
3.00
to 1.00. We were in compliance with the financial covenants as of
December 31, 2018
.
We had an outstanding principal balance of
$70.0 million
at a one-month LIBOR interest rate plus 100 basis points as of
December 31, 2018
, leaving borrowing availability of
$230.0 million
.
4
. Income Per Share
The following table shows how we reconcile our net income and the number of shares used in computing basic and diluted income per share:
|
(in millions, except per share amounts)
|
2018
|
2017
|
2016
|
|||||||||
|
Basic net income per share attributable to Morningstar, Inc.:
|
||||||||||||
|
Net income attributable to Morningstar, Inc.
|
$
|
183.0
|
|
$
|
136.9
|
|
$
|
161.0
|
|
|||
|
Weighted average common shares outstanding
|
42.6
|
|
42.7
|
|
43.0
|
|
||||||
|
Basic net income per share attributable to Morningstar, Inc.
|
$
|
4.30
|
|
$
|
3.21
|
|
$
|
3.74
|
|
|||
|
Diluted net income per share attributable to Morningstar, Inc.:
|
||||||||||||
|
Net income attributable to Morningstar, Inc.
|
$
|
183.0
|
|
$
|
136.9
|
|
$
|
161.0
|
|
|||
|
|
|
|
|
|||||||||
|
Weighted average common shares outstanding
|
42.6
|
|
42.7
|
|
43.0
|
|
||||||
|
Net effect of dilutive stock options and restricted stock units
|
0.4
|
|
0.3
|
|
0.3
|
|
||||||
|
Weighted average common shares outstanding for computing diluted income per share
|
43.0
|
|
43.0
|
|
43.3
|
|
||||||
|
|
|
|
|
|||||||||
|
Diluted net income per share attributable to Morningstar, Inc.
|
$
|
4.25
|
|
$
|
3.18
|
|
$
|
3.72
|
|
|||
The number of weighted average restricted stock units, performance share awards, and market stock units excluded from our calculation of diluted earnings per share, as their inclusion would have been anti-dilutive, was immaterial during the periods presented.
5
. Revenue
Disaggregation of Revenue
The following table presents our revenue disaggregated by revenue type. Sales and usage-based taxes are excluded from revenue.
80
|
Year ended December 31
|
||||||||||||
|
(in millions)
|
2018
|
2017
|
2016
|
|||||||||
|
License-based
|
$
|
751.6
|
|
$
|
667.7
|
|
$
|
579.4
|
|
|||
|
Asset-based
|
200.4
|
|
182.2
|
|
163.6
|
|
||||||
|
Transaction-based
|
67.9
|
|
61.8
|
|
55.6
|
|
||||||
|
Consolidated revenue
|
$
|
1,019.9
|
|
$
|
911.7
|
|
$
|
798.6
|
|
|||
License-based performance obligations are generally satisfied over time as the customer has access to the product or service during the term of the subscription license and the level of service is consistent during the contract period. License-based agreements typically have a term of
12
to
36 months
. License-based revenue is generated from the sale of Morningstar Data, Morningstar Direct, Morningstar Advisor Workstation, Morningstar Enterprise Components, Morningstar Research, PitchBook Data, and other similar products.
Asset-based performance obligations are satisfied over time as the customer receives continuous access to a service for the term. Asset-based arrangements typically have a term of
12
to
36 months
. The asset-based fees represent variable consideration and the customer does not make separate purchasing decisions that result in additional performance obligations. Significant changes in the underlying fund assets, or significant disruptions in the market, are evaluated to determine if revisions of estimates of earned asset-based fees are needed for the current quarter. An estimate of variable consideration is included in the initial transaction price only to the extent it is probable that a significant reversal in the amount of the revenue recognized will not occur. Estimates of asset-based fees are based on the most recently completed quarter and as a result, it is unlikely a significant reversal of revenue would occur. Asset-based revenue includes Morningstar Investment Management, Workplace Solutions, and Morningstar Indexes.
Transaction-based performance obligations are satisfied when the product or service is completed or delivered. Transaction-based revenue includes Morningstar Credit Ratings, Internet Advertising Sales, and Conferences. Morningstar Credit Ratings may include surveillance services, which are recognized over time, as the customer has access to the service during the surveillance period.
Contract liabilities
Our contract liabilities represent deferred revenue. We record contract liabilities when cash payments are received or due in advance of our performance, including amounts which are refundable. The contract liabilities balance as of
December 31, 2018
had a net increase of
$24.5 million
, primarily driven by cash payments received or due in advance of satisfying our performance obligations. We recognized
$163.0 million
of revenue in 2018 that was included in the contract liabilities balance as of
December 31, 2017
.
We expect to recognize revenue related to our contract liabilities for
2019
and subsequent years as follows:
|
(in millions)
|
As of December 31, 2018
|
|||
|
2019
|
$
|
388.9
|
|
|
|
2020
|
93.7
|
|
||
|
2021
|
28.0
|
|
||
|
2022
|
11.0
|
|
||
|
2023
|
5.4
|
|
||
|
Thereafter
|
43.6
|
|
||
|
$
|
570.6
|
|
||
The aggregate amount of revenue we expect to recognize for 2019 and subsequent years is higher than our contract liability balance of
$210.0 million
as of
December 31, 2018
. The difference represents the value of performance obligations for signed contracts where we have not yet begun to satisfy the performance obligations, partially satisfied performance obligations, or have not yet billed the customer.
81
The table above does not include variable consideration for unsatisfied performance obligations related to certain of our licensed-based, asset-based, and transaction-based contracts as of
December 31, 2018
. We are applying the optional exemption as the variable consideration relates to these unsatisfied performance obligations being fulfilled as a series. The performance obligations related to these contracts are expected to be satisfied over the next
12
to
36
months as services are provided to the client. For licensed-based contracts, the consideration received for services performed is based on future user count, which will be known at the time the services are performed. The variable consideration for this revenue can be affected by the number of user licenses. For asset-based contracts, the consideration received for services performed is based on future asset values, which will be known at the time the services are performed. The variable consideration for this revenue can be affected by changes in the underlying value of fund assets due to client redemptions, additional investments, or significant movements in the market. For transaction-based contracts such as Internet advertising, the consideration received for services performed is based on the number of impressions, which will be known once impressions are created. The variable consideration for this revenue can be affected by the timing and quantity of impressions in any given period.
The table above also does not include revenue for unsatisfied performance obligations related to certain of our license-based and transaction-based contracts as of
December 31, 2018
. We are applying the optional exemption as the performance obligations for such contracts have an expected duration of one year or less. For certain license-based contracts, the remaining performance obligation is expected to be less than one year based on the corresponding subscription terms. For transaction-based contracts, such as new credit rating issuances and the Morningstar conference, the related performance obligations are expected to be satisfied within the next twelve months.
Contract Assets
Our contract assets represent accounts receivable, less allowance for doubtful accounts and deferred commissions. We did not record any impairment losses on receivables or deferred commissions in
2018
.
The following table summarizes our contract assets balance:
|
(in millions)
|
As of December 31, 2018
|
As of December 31, 2017
|
||||||
|
Accounts receivable, less allowance for doubtful accounts
|
$
|
172.2
|
|
$
|
148.2
|
|
||
|
Deferred commissions
|
14.8
|
|
—
|
|
||||
|
Deferred commissions, non-current
|
10.3
|
|
—
|
|
||||
|
Total contract assets
|
$
|
197.3
|
|
$
|
148.2
|
|
||
The following table shows the change in our deferred commissions balance from January 1, 2018 to
December 31, 2018
:
|
|
(in millions)
|
|||
|
Balance as of January 1, 2018
|
$
|
22.7
|
|
|
|
Commissions earned and capitalized
|
19.4
|
|
||
|
Amortization of capitalized amounts
|
(17.0
|
)
|
||
|
Balance as of December 31, 2018
|
$
|
25.1
|
|
|
6
. Segment and Geographical Area Information
Segment Information
We report our results in a single reportable segment, which reflects how our chief operating decision maker allocates resources and evaluates our financial results. Because we have a single reportable segment, all required financial segment information can be found directly in the Consolidated Financial Statements. The accounting policies for our reportable segment are the same as those described in Note
2
. We evaluate the performance of our reporting segment based on revenue and operating income.
82
Geographical Area Information
The tables below summarize our revenue and long-lived assets by geographical area:
|
External revenue by geographical area
|
||||||||||||
|
Year ended December 31
|
||||||||||||
|
(in millions)
|
2018
|
2017
|
2016
|
|||||||||
|
United States
|
$
|
764.2
|
|
$
|
687.0
|
|
$
|
590.5
|
|
|||
|
United Kingdom
|
72.4
|
|
64.7
|
|
61.1
|
|
||||||
|
Continental Europe
|
81.2
|
|
69.9
|
|
62.6
|
|
||||||
|
Australia
|
40.9
|
|
34.6
|
|
32.2
|
|
||||||
|
Canada
|
30.7
|
|
29.4
|
|
28.2
|
|
||||||
|
Asia
|
24.5
|
|
21.2
|
|
20.0
|
|
||||||
|
Other
|
6.0
|
|
4.9
|
|
4.0
|
|
||||||
|
Total International
|
255.7
|
|
224.7
|
|
208.1
|
|
||||||
|
Consolidated revenue
|
$
|
1,019.9
|
|
$
|
911.7
|
|
$
|
798.6
|
|
|||
|
Long-lived assets by geographical area
|
||||||||
|
As of December 31
|
||||||||
|
(in millions)
|
2018
|
2017
|
||||||
|
United States
|
$
|
126.4
|
|
$
|
131.9
|
|
||
|
United Kingdom
|
3.8
|
|
6.0
|
|
||||
|
Continental Europe
|
1.3
|
|
1.7
|
|
||||
|
Australia
|
5.0
|
|
2.3
|
|
||||
|
Canada
|
0.3
|
|
0.2
|
|
||||
|
Asia
|
6.5
|
|
5.2
|
|
||||
|
Other
|
0.2
|
|
0.1
|
|
||||
|
Total International
|
17.1
|
|
15.5
|
|
||||
|
Consolidated property, equipment, and capitalized software, net
|
$
|
143.5
|
|
$
|
147.4
|
|
||
The long-lived asset by geographical area does not include deferred commissions, non-current as the balance is not significant.
7
. Investments and Fair Value Measurements
We classify our investments into three categories: available-for-sale, held-to-maturity, and trading. Our investment portfolio consists of stocks, bonds, options, mutual funds, money market funds, or exchange-traded products that replicate the model portfolios and strategies created by Morningstar. These investment accounts may also include exchange-traded products where Morningstar is an index provider. We classify our investment portfolio as shown below:
83
|
As of December 31
|
||||||||
|
(in millions)
|
2018
|
2017
|
||||||
|
Available-for-sale
|
$
|
20.1
|
|
$
|
21.5
|
|
||
|
Held-to-maturity
|
2.5
|
|
21.9
|
|
||||
|
Trading securities
|
4.0
|
|
1.7
|
|
||||
|
Total
|
$
|
26.6
|
|
$
|
45.1
|
|
||
The following table shows the cost, unrealized gains (losses), and fair values related to investments classified as available-for-sale and held-to-maturity:
|
|
As of December 31, 2018
|
As of December 31, 2017
|
||||||||||||||||||||||||||||||
|
(in millions)
|
Cost
|
Unrealized
Gain
|
Unrealized
Loss
|
Fair
Value
|
Cost
|
Unrealized
Gain
|
Unrealized
Loss
|
Fair
Value
|
||||||||||||||||||||||||
|
Available-for-sale:
|
|
|
|
|
|
|
|
|
|
|
|
|
|
|
|
|
||||||||||||||||
|
Equity securities and exchange-traded funds
|
$
|
17.9
|
|
$
|
1.2
|
|
$
|
(1.8
|
)
|
$
|
17.3
|
|
$
|
17.1
|
|
$
|
2.4
|
|
$
|
(0.6
|
)
|
$
|
18.9
|
|
||||||||
|
Mutual funds
|
3.0
|
|
—
|
|
(0.2
|
)
|
2.8
|
|
2.4
|
|
0.2
|
|
—
|
|
2.6
|
|
||||||||||||||||
|
Total
|
$
|
20.9
|
|
$
|
1.2
|
|
$
|
(2.0
|
)
|
$
|
20.1
|
|
$
|
19.5
|
|
$
|
2.6
|
|
$
|
(0.6
|
)
|
$
|
21.5
|
|
||||||||
|
Held-to-maturity:
|
|
|
|
|
|
|
|
|
||||||||||||||||||||||||
|
Certificates of deposit
|
$
|
2.5
|
|
$
|
—
|
|
$
|
—
|
|
$
|
2.5
|
|
$
|
19.9
|
|
$
|
—
|
|
$
|
—
|
|
$
|
19.9
|
|
||||||||
|
Convertible note
|
—
|
|
—
|
|
—
|
|
—
|
|
2.0
|
|
—
|
|
—
|
|
2.0
|
|
||||||||||||||||
|
Total
|
$
|
2.5
|
|
$
|
—
|
|
$
|
—
|
|
$
|
2.5
|
|
$
|
21.9
|
|
$
|
—
|
|
$
|
—
|
|
$
|
21.9
|
|
||||||||
As of
December 31, 2018
and
December 31, 2017
, investments with unrealized losses for greater than a 12-month period were not material to the Consolidated Balance Sheets and were not deemed to have other than temporary declines in value.
The table below shows the cost and fair value of investments classified as available-for-sale and held-to-maturity based on their contractual maturities as of
December 31, 2018
and
December 31, 2017
.
|
|
As of December 31, 2018
|
As of December 31, 2017
|
||||||||||||||
|
(in millions)
|
Cost
|
Fair Value
|
Cost
|
Fair Value
|
||||||||||||
|
Available-for-sale:
|
|
|
|
|
|
|
|
|
||||||||
|
Equity securities, exchange-traded funds, and mutual funds
|
$
|
20.9
|
|
$
|
20.1
|
|
$
|
19.5
|
|
$
|
21.5
|
|
||||
|
Total
|
$
|
20.9
|
|
$
|
20.1
|
|
$
|
19.5
|
|
$
|
21.5
|
|
||||
|
Held-to-maturity:
|
|
|
|
|
|
|
|
|
||||||||
|
Due in one year or less
|
$
|
2.3
|
|
$
|
2.3
|
|
$
|
19.7
|
|
$
|
19.7
|
|
||||
|
Due in one to three years
|
0.2
|
|
0.2
|
|
2.2
|
|
2.2
|
|
||||||||
|
Total
|
$
|
2.5
|
|
$
|
2.5
|
|
$
|
21.9
|
|
$
|
21.9
|
|
||||
84
The following table shows the realized gains and losses arising from sales of our investments classified as available-for-sale recorded in our Consolidated Statements of Income:
|
(in millions)
|
2018
|
2017
|
2016
|
|||||||||
|
Realized gains
|
$
|
1.8
|
|
$
|
3.4
|
|
$
|
1.6
|
|
|||
|
Realized losses
|
(0.8
|
)
|
(0.2
|
)
|
(1.0
|
)
|
||||||
|
Realized gains, net
|
$
|
1.0
|
|
$
|
3.2
|
|
$
|
0.6
|
|
|||
We determine realized gains and losses using the specific identification method.
The following table shows the net unrealized gains (losses) on trading securities as recorded in our Consolidated Statements of Income:
|
(in millions)
|
2018
|
2017
|
2016
|
|||||||||
|
Unrealized gains (losses), net
|
$
|
(0.2
|
)
|
$
|
0.1
|
|
$
|
—
|
|
|||
The table below shows the fair value of our assets subject to fair value measurements that are measured at fair value on a recurring basis using a fair value hierarchy:
|
Level 1:
|
Valuations based on quoted prices in active markets for identical assets or liabilities that we have the ability to access.
|
|
Level 2:
|
Valuations based on quoted prices in markets that are not active or for which all significant inputs are observable, either directly or indirectly.
|
|
Level 3:
|
Valuations based on inputs that are unobservable and significant to the overall fair value measurement.
|
|
|
Fair Value
|
Fair Value Measurements as of December 31, 2018
|
||||||||||||||
|
|
as of
|
Using Fair Value Hierarchy
|
||||||||||||||
|
(in millions)
|
December 31, 2018
|
Level 1
|
|
Level 2
|
|
Level 3
|
|
|||||||||
|
Available-for-sale investments
|
|
|
|
|
|
|
|
|
||||||||
|
Equity securities and exchange-traded funds
|
$
|
17.3
|
|
$
|
17.3
|
|
$
|
—
|
|
$
|
—
|
|
||||
|
Mutual funds
|
2.8
|
|
2.8
|
|
—
|
|
—
|
|
||||||||
|
Trading securities
|
4.0
|
|
4.0
|
|
—
|
|
—
|
|
||||||||
|
Cash equivalents
|
0.1
|
|
0.1
|
|
—
|
|
—
|
|
||||||||
|
Total
|
$
|
24.2
|
|
$
|
24.2
|
|
$
|
—
|
|
$
|
—
|
|
||||
|
|
Fair Value
|
Fair Value Measurements as of December 31, 2017
|
||||||||||||||
|
|
as of
|
Using Fair Value Hierarchy
|
||||||||||||||
|
(in millions)
|
December 31, 2017
|
Level 1
|
|
Level 2
|
|
Level 3
|
|
|||||||||
|
Available-for-sale investments
|
|
|
|
|
|
|
|
|
||||||||
|
Equity securities and exchange-traded funds
|
$
|
18.9
|
|
$
|
18.9
|
|
$
|
—
|
|
$
|
—
|
|
||||
|
Mutual funds
|
2.6
|
|
2.6
|
|
—
|
|
—
|
|
||||||||
|
Trading securities
|
1.7
|
|
1.7
|
|
—
|
|
—
|
|
||||||||
|
Cash equivalents
|
0.5
|
|
0.5
|
|
—
|
|
—
|
|
||||||||
|
Total
|
$
|
23.7
|
|
$
|
23.7
|
|
$
|
—
|
|
$
|
—
|
|
||||
Based on our analysis of the nature and risks of our investments in equity securities and mutual funds, we have determined that presenting each of these investment categories in the aggregate is appropriate.
We measure the fair value of money market funds, mutual funds, equity securities, and exchange-traded funds based on quoted prices in active markets for identical assets or liabilities. We did not hold any securities categorized as Level 2 or Level 3 as of
December 31, 2018
and
December 31, 2017
.
85
8
. Acquisitions, Goodwill, and Other Intangible Assets
2018 Acquisitions
We did not complete any significant acquisitions in 2018.
2017 Acquisitions
We did not complete any significant acquisitions in 2017.
2016 Acquisitions
Increased Ownership Interest in PitchBook Data, Inc. (PitchBook)
In December 2016, we acquired an additional
78%
interest in PitchBook Data, Inc. (PitchBook), increasing our ownership to
100%
from
22%
. PitchBook delivers data, research, and technology covering the private capital markets, including venture capital, private equity, and mergers and acquisitions. We began consolidating the financial results of this acquisition in our Consolidated Financial Statements on December 1, 2016. PitchBook contributed
$4.1 million
of revenue and
$7.5 million
of operating expense during the one-month period that PitchBook was included in our consolidated results for 2016.
PitchBook's total estimated fair value of
$235.1 million
as of the acquisition date includes
$188.2 million
in cash paid to acquire the remaining
78%
interest in PitchBook as well as a
$46.9 million
fair value related to our previous
22%
ownership interest. The book value of this ownership immediately prior to the acquisition date was
$9.8 million
, and we recorded a noncash holding gain of
$37.1 million
for the difference between the fair value and the book value of our previously held investment. We used the income approach and a discounted cash flow analysis of PitchBook’s projected revenue, operating expense, and other amounts to arrive at the estimated fair value. The gain is classified as "Holding gain upon acquisition of additional ownership of equity-method investments" in our Consolidated Statement of Income for the year ended December 31, 2016.
The transaction has been accounted for using the acquisition method of accounting, which requires that assets acquired and liabilities assumed be recognized at their fair values as of the acquisition date.
Adjustments recorded in the measurement period to the purchase price allocation were not significant. The following table summarizes our allocation of the estimated fair values of the assets acquired and liabilities assumed at the date of acquisition:
|
(in millions)
|
||||
|
Cash and cash equivalents
|
$
|
12.4
|
|
|
|
Accounts receivable
|
10.8
|
|
||
|
Other current and non-current assets
|
3.2
|
|
||
|
Intangible assets
|
60.7
|
|
||
|
Goodwill
|
192.0
|
|
||
|
Deferred revenue
|
(22.0
|
)
|
||
|
Deferred tax liability, net
|
(12.3
|
)
|
||
|
Other current and non-current liabilities
|
(9.7
|
)
|
||
|
Total fair value of PitchBook
|
$
|
235.1
|
|
|
Accounts receivable acquired were recorded at gross contractual amounts receivable, which approximates fair value.
86
The allocation includes
$60.7 million
of acquired intangible assets, as follows:
|
(in millions)
|
Weighted Average Useful Life (years)
|
|||||
|
Customer-related assets
|
$
|
17.1
|
|
10
|
||
|
Technology-based assets
|
40.8
|
|
5
|
|||
|
Intellectual property (trademarks and trade names)
|
2.8
|
|
4
|
|||
|
Total intangible assets
|
$
|
60.7
|
|
6
|
||
We recognized a net deferred tax liability of
$12.3 million
mainly because the amortization expense related to certain intangible assets is not deductible for income tax purposes.
Goodwill of
$192.0 million
represents the excess over the fair value of the net tangible and intangible assets acquired with this acquisition. We paid this premium for a number of reasons, including the opportunity to offer comprehensive data coverage across the full life cycle of private market transactions. The goodwill is not deductible for income tax purposes.
Unaudited Pro Forma Information for PitchBook Acquisition
The following unaudited pro forma information presents a summary of our Consolidated Statements of Income for the years ended December 31, 2016 and 2015, as if we had completed the PitchBook acquisition as of January 1, 2015.
This unaudited pro forma information is presented for illustrative purposes and is not intended to represent or be indicative of the actual results of operations of the combined company that would have been achieved had the acquisition occurred at the beginning of the earliest period presented, nor is it intended to represent or be indicative of future results of operations.
In calculating the pro forma information below, we included an estimate of amortization expense related to the intangible assets acquired, stock-based compensation expense related to the PitchBook bonus plan (see Note 13 for additional information), and interest expense incurred on the long-term debt. The 2016 pro forma net income excludes the
$37.1 million
noncash holding gain generated in connection with the transaction.
|
Unaudited Pro Forma Financial Information (in millions)
|
2016
|
2015
|
||||||
|
Revenue
|
$
|
834.1
|
|
$
|
813.3
|
|
||
|
Operating income
|
157.7
|
|
170.0
|
|
||||
|
Net income
|
105.5
|
|
117.1
|
|
||||
|
Basic net income per share attributable to Morningstar, Inc.
|
$
|
2.45
|
|
$
|
2.65
|
|
||
|
Diluted net income per share attributable to Morningstar, Inc.
|
$
|
2.44
|
|
$
|
2.65
|
|
||
RequiSight, LLC (RightPond)
On March 31, 2016, we acquired RequiSight, LLC, which does business as RightPond, a provider of business intelligence data and analytics on defined-contribution and defined-benefit plans for financial services firms. We began consolidating the financial results of RightPond in our Consolidated Financial Statements on March 31, 2016.
InvestSoft Technology, Inc. (InvestSoft)
On May 31, 2016, we acquired InvestSoft Technology, Inc. (InvestSoft), a provider of fixed-income analytics. We began consolidating the financial results of InvestSoft in our Consolidated Financial Statements on May 31, 2016.
87
Goodwill
The following table shows the changes in our goodwill balances from January 1,
2017
to
December 31, 2018
:
|
|
(in millions)
|
|||
|
Balance as of January 1, 2017
|
$
|
556.8
|
|
|
|
Divestiture of HelloWallet (See Note 9)
|
(2.4
|
)
|
||
|
Foreign currency translation and adjustments to purchase price allocation
|
10.5
|
|
||
|
Balance as of December 31, 2017
|
$
|
564.9
|
|
|
|
Other, primarily foreign currency translation
|
(8.2
|
)
|
||
|
Balance as of December 31, 2018
|
$
|
556.7
|
|
|
We did not record any impairment losses in
2018
,
2017
, or 2016 as the estimated fair value of our reporting unit exceeded its carrying value. We perform our annual impairment testing during the fourth quarter of each year.
Intangible Assets
The following table summarizes our intangible assets:
|
|
As of December 31, 2018
|
As of December 31, 2017
|
||||||||||||||||||||||||||
|
(in millions)
|
Gross
|
Accumulated
Amortization
|
Net
|
Weighted
Average
Useful Life
(years)
|
Gross
|
Accumulated
Amortization
|
Net
|
Weighted
Average
Useful Life
(years)
|
||||||||||||||||||||
|
Intellectual property
|
$
|
30.8
|
|
$
|
(29.2
|
)
|
$
|
1.6
|
|
9
|
$
|
31.5
|
|
$
|
(28.9
|
)
|
$
|
2.6
|
|
9
|
||||||||
|
Customer-related assets
|
153.0
|
|
(111.7
|
)
|
41.3
|
|
12
|
156.6
|
|
(108.1
|
)
|
48.5
|
|
12
|
||||||||||||||
|
Supplier relationships
|
0.2
|
|
(0.1
|
)
|
0.1
|
|
20
|
0.2
|
|
(0.1
|
)
|
0.1
|
|
20
|
||||||||||||||
|
Technology-based assets
|
126.9
|
|
(96.3
|
)
|
30.6
|
|
7
|
127.9
|
|
(84.2
|
)
|
43.7
|
|
7
|
||||||||||||||
|
Non-competition agreements
|
2.4
|
|
(2.1
|
)
|
0.3
|
|
5
|
2.5
|
|
(2.0
|
)
|
0.5
|
|
5
|
||||||||||||||
|
Total intangible assets
|
$
|
313.3
|
|
$
|
(239.4
|
)
|
$
|
73.9
|
|
10
|
$
|
318.7
|
|
$
|
(223.3
|
)
|
$
|
95.4
|
|
10
|
||||||||
The following table summarizes our amortization expense related to intangible assets:
|
(in millions)
|
2018
|
2017
|
2016
|
|||||||||
|
Amortization expense
|
$
|
20.7
|
|
$
|
23.6
|
|
$
|
19.4
|
|
|||
We did not record any impairment losses involving intangible assets in
2018
,
2017
, or 2016.
We amortize intangible assets using the straight-line method over their expected economic useful lives.
Based on acquisitions and divestitures completed through
December 31, 2018
, we expect intangible amortization expense for
2019
and subsequent years to be as follows:
|
|
(in millions)
|
|||
|
2019
|
$
|
19.2
|
|
|
|
2020
|
16.2
|
|
||
|
2021
|
12.9
|
|
||
|
2022
|
5.0
|
|
||
|
2023
|
5.0
|
|
||
|
Thereafter
|
15.6
|
|
||
88
Our estimates of future amortization expense for intangible assets may be affected by additional acquisitions, divestitures, changes in the estimated average useful life, and foreign currency translation.
9
. Divestiture
2018 Divestitures
In January 2018, we sold our 15(c) board consulting services product line for
$10.5 million
and recorded a gain of
$10.5 million
on the sale.
2017 Divestitures
On June 30, 2017, we sold HelloWallet to KeyBank National Association, a bank-based financial services company. We recorded a noncash gain on the sale of
$16.7 million
. This gain mainly represents the sale proceeds of
$23.7 million
less
$2.4 million
of goodwill and the write-off of the remaining net book value of the acquired intangible assets. As some aspects of HelloWallet had been integrated into Morningstar's single reporting unit, the goodwill attributable to this transaction was calculated using a relative fair value allocation method.
The sale of HelloWallet did not meet the criteria to be classified as a discontinued operation because the divestiture did not represent a strategic shift that has, or will have, a major effect on our operations and financial results.
The following table summarizes the amounts included in the gain on sale of business for the year ended December 31, 2017:
|
Year ended December 31
|
||||
|
(in millions)
|
2017
|
|
||
|
Proceeds received
|
$
|
23.7
|
|
|
|
Intangibles and internally developed software
|
(4.5
|
)
|
||
|
Goodwill
|
(2.4
|
)
|
||
|
Other assets and liabilities
|
(0.1
|
)
|
||
|
Total gain on sale of business
|
$
|
16.7
|
|
|
10
. Investments in Unconsolidated Entities
Our investments in unconsolidated entities consist primarily of the following:
|
As of December 31
|
||||||||
|
(in millions)
|
2018
|
2017
|
||||||
|
Investment in MJKK
|
$
|
23.9
|
|
$
|
26.4
|
|
||
|
Investment in Sustainalytics
|
25.7
|
|
20.7
|
|
||||
|
Other-equity method investments
|
10.3
|
|
12.6
|
|
||||
|
Investments accounted for using the cost method
|
3.2
|
|
2.3
|
|
||||
|
Total investments in unconsolidated entities
|
$
|
63.1
|
|
$
|
62.0
|
|
||
89
Morningstar Japan K.K.
Morningstar Japan K.K. (MJKK) develops and markets financial information products and services customized for the Japanese market. MJKK’s shares are traded on the Tokyo Stock Exchange under the ticker 47650. We account for our investment in MJKK using the equity method. The following table summarizes our ownership percentage in MJKK and the market value of this investment based on MJKK’s publicly quoted share price:
|
As of December 31
|
||||||||
|
|
2018
|
2017
|
||||||
|
Morningstar’s approximate ownership of MJKK
|
30
|
%
|
34
|
%
|
||||
|
Approximate market value of Morningstar’s ownership in MJKK:
|
|
|
|
|
||||
|
Japanese yen (¥ in millions)
|
¥
|
7,525.4
|
|
¥
|
10,649.6
|
|
||
|
Equivalent U.S. dollars ($ in millions)
|
$
|
68.4
|
|
$
|
94.6
|
|
||
Sustainalytics Holding B.V.
In July 2017, we acquired a minority stake in Sustainalytics Holding B.V. (Sustainalytics), which is an independent environmental, social, and governance and corporate governance research, ratings, and analysis firm supporting investors around the world with the development and implementation of responsible investment strategies. Our ownership in Sustainalytics was
44%
as of
December 31, 2018
and
40%
as of
December 31, 2017
.
11
. Property, Equipment, and Capitalized Software
The following table shows our property, equipment, and capitalized software summarized by major category:
|
As of December 31
|
||||||||
|
(in millions)
|
2018
|
2017
|
||||||
|
Capitalized software
|
$
|
294.8
|
|
$
|
239.2
|
|
||
|
Capitalized equipment
|
83.5
|
|
81.6
|
|
||||
|
Furniture and fixtures
|
29.6
|
|
27.6
|
|
||||
|
Leasehold improvements
|
77.3
|
|
72.5
|
|
||||
|
Telephone equipment
|
2.1
|
|
2.3
|
|
||||
|
Construction in progress
|
7.9
|
|
8.9
|
|
||||
|
Property, equipment, and capitalized software, at cost
|
495.2
|
|
432.1
|
|
||||
|
Less accumulated depreciation
|
(351.7
|
)
|
(284.7
|
)
|
||||
|
Property, equipment, and capitalized software, net
|
$
|
143.5
|
|
$
|
147.4
|
|
||
The following table summarizes our depreciation expense:
|
(in millions)
|
2018
|
2017
|
2016
|
|||||||||
|
Depreciation expense
|
$
|
76.0
|
|
$
|
67.6
|
|
$
|
51.3
|
|
|||
Depreciation expense in
2017
includes a
$4.1 million
impairment charge for certain software licenses due to a shift toward a cloud-based strategy.
90
12
. Operating Leases
The following table shows our minimum future rental commitments due in each of the next five years and thereafter for all non-cancelable operating leases, consisting primarily of commitments for office space:
|
Minimum Future Rental Commitments
|
(in millions)
|
|||
|
2019
|
$
|
34.4
|
|
|
|
2020
|
36.0
|
|
||
|
2021
|
32.2
|
|
||
|
2022
|
20.8
|
|
||
|
2023
|
15.1
|
|
||
|
Thereafter
|
47.7
|
|
||
|
Total
|
$
|
186.2
|
|
|
The following table summarizes our rent expense, including taxes, insurance, and related operating costs:
|
(in millions)
|
2018
|
2017
|
2016
|
|||||||||
|
Rent expense
|
$
|
32.5
|
|
$
|
30.3
|
|
$
|
26.3
|
|
|||
Deferred rent includes build-out and rent abatement allowances received, which are amortized over the remaining portion of the original term of the lease as a reduction in office lease expense. We include deferred rent, as appropriate, in “Accounts payable and accrued liabilities” and “Deferred rent, noncurrent” on our Consolidated Balance Sheets.
|
As of December 31
|
||||||||
|
(in millions)
|
2018
|
2017
|
||||||
|
Deferred rent
|
$
|
28.6
|
|
$
|
31.2
|
|
||
13
. Stock-Based Compensation
Stock-Based Compensation Plans
Our shareholders approved the Morningstar 2011 Stock Incentive Plan (the 2011 Plan) on May 17, 2011. As of that date, we stopped granting awards under the Morningstar 2004 Stock Incentive Plan (the 2004 Plan). The 2004 Plan amended and restated the Morningstar 1993 Stock Option Plan, the Morningstar 2000 Stock Option Plan, and the Morningstar 2001 Stock Option Plan.
The 2011 Plan provides for a variety of stock-based awards, including, among other things, restricted stock units, restricted stock, performance share awards, market stock units, and stock options. We granted restricted stock units, restricted stock, and stock options under the 2004 Plan.
All of our employees and our non-employee directors are eligible for awards under the 2011 Plan.
Grants awarded under the 2011 Plan or the 2004 Plan that are forfeited, canceled, settled, or otherwise terminated without a distribution of shares, or shares withheld by us in connection with the exercise of options, will be available for awards under the 2011 Plan. For any shares subject to awards that are withheld by us in connection with the payment of any required income tax withholding, the 2011 Plan provides for the ability to have these shares become available for new awards, but this feature of the 2011 plan has not been implemented.
The following table summarizes the number of shares available for future grants under our 2011 Plan:
|
As of December 31
|
|||
|
(in millions)
|
2018
|
||
|
Shares available for future grants
|
3.1
|
|
|
91
Accounting for Stock-Based Compensation Awards
The following table summarizes our stock-based compensation expense and the related income tax benefit we recorded in the past three years:
|
Year ended December 31
|
||||||||||||
|
(in millions)
|
2018
|
2017
|
2016
|
|||||||||
|
Restricted stock units
|
$
|
19.8
|
|
$
|
16.5
|
|
$
|
14.6
|
|
|||
|
Performance share awards
|
10.2
|
|
7.1
|
|
(0.1
|
)
|
||||||
|
Market stock units
|
1.7
|
|
0.5
|
|
—
|
|
||||||
|
Total stock-based compensation expense
|
$
|
31.7
|
|
$
|
24.1
|
|
$
|
14.5
|
|
|||
|
Income tax benefit related to the stock-based compensation expense
|
$
|
7.0
|
|
$
|
7.8
|
|
$
|
4.3
|
|
|||
The following table summarizes the stock-based compensation expense included in each of our operating expense categories for the past three years:
|
Year ended December 31
|
||||||||||||
|
(in millions)
|
2018
|
2017
|
2016
|
|||||||||
|
Cost of revenue
|
$
|
11.7
|
|
$
|
9.6
|
|
$
|
7.5
|
|
|||
|
Sales and marketing
|
3.5
|
|
3.0
|
|
1.9
|
|
||||||
|
General and administrative
|
16.5
|
|
11.5
|
|
5.1
|
|
||||||
|
Total stock-based compensation expense
|
$
|
31.7
|
|
$
|
24.1
|
|
$
|
14.5
|
|
|||
The following table summarizes the amount of unrecognized stock-based compensation expense as of
December 31, 2018
and the expected number of months over which the expense will be recognized:
|
Unrecognized stock-based compensation expense (in millions)
|
Weighted average expected amortization period (months)
|
|||||
|
Restricted stock units
|
$
|
36.9
|
|
33
|
||
|
Market stock units
|
5.2
|
|
28
|
|||
|
Total unrecognized stock-based compensation expense
|
$
|
42.1
|
|
32
|
||
In accordance with FASB ASC 718,
Compensation—Stock Compensation
, we estimate forfeitures of employee stock-based awards and recognize compensation cost only for those awards expected to vest.
Restricted Stock Units
Restricted stock units represent the right to receive a share of Morningstar common stock when that unit vests. Restricted stock units granted to employees vest ratably over a
four
-year period. Restricted stock units granted to non-employee directors vest ratably over a
three
-year period.
We measure the fair value of our restricted stock units on the date of grant based on the closing market price of the underlying common stock on the day prior to grant. We amortize that value to stock-based compensation expense, net of estimated forfeitures, ratably over the vesting period.
92
The following table summarizes restricted stock unit activity during the past three years:
|
Restricted Stock Units (RSUs)
|
Unvested
|
Vested but
Deferred
|
Total
|
Weighted
Average
Grant Date Value
per RSU
|
|||||||||
|
RSUs Outstanding - December 31, 2015
|
572,526
|
|
14,924
|
|
587,450
|
|
$
|
72.14
|
|
||||
|
Granted
|
241,609
|
|
—
|
|
241,609
|
|
77.82
|
|
|||||
|
Dividend equivalents
|
370
|
|
136
|
|
506
|
|
56.52
|
|
|||||
|
Vested
|
(225,590
|
)
|
—
|
|
(225,590
|
)
|
69.39
|
|
|||||
|
Issued
|
—
|
|
(5,312
|
)
|
(5,312
|
)
|
44.47
|
|
|||||
|
Forfeited
|
(47,670
|
)
|
—
|
|
(47,670
|
)
|
74.45
|
|
|||||
|
RSUs Outstanding - December 31, 2016
|
541,245
|
|
9,748
|
|
550,993
|
|
$
|
75.77
|
|
||||
|
Granted
|
331,470
|
|
—
|
|
331,470
|
|
78.33
|
|
|||||
|
Dividend equivalents
|
—
|
|
78
|
|
78
|
|
60.99
|
|
|||||
|
Vested
|
(212,005
|
)
|
—
|
|
(212,005
|
)
|
75.38
|
|
|||||
|
Issued
|
—
|
|
(6,547
|
)
|
(6,547
|
)
|
49.40
|
|
|||||
|
Forfeited
|
(55,831
|
)
|
—
|
|
(55,831
|
)
|
76.49
|
|
|||||
|
RSUs Outstanding - December 31, 2017
|
604,879
|
|
3,279
|
|
608,158
|
|
$
|
77.52
|
|
||||
|
Granted
|
243,614
|
|
—
|
|
243,614
|
|
108.60
|
|
|||||
|
Dividend equivalents
|
—
|
|
16
|
|
16
|
|
73.28
|
|
|||||
|
Vested
|
(279,774
|
)
|
—
|
|
(279,774
|
)
|
80.68
|
|
|||||
|
Issued
|
—
|
|
(3,295
|
)
|
(3,295
|
)
|
73.28
|
|
|||||
|
Forfeited
|
(41,254
|
)
|
—
|
|
(41,254
|
)
|
86.47
|
|
|||||
|
RSUs Outstanding - December 31, 2018
|
527,465
|
|
—
|
|
527,465
|
|
$
|
89.53
|
|
||||
Performance Share Awards
In March 2016, executive officers, other than Joe Mansueto, and certain other employees, were granted performance share awards. These awards entitle the holder to a number of shares of Morningstar common stock equal to the number of notional performance shares that become vested. Each award specifies a number of performance shares that will vest if pre-established target performance goals are attained. The number of performance shares that actually vest may be more or less than the specified number of performance shares to the extent Morningstar exceeds or fails to achieve, respectively, the target performance goals over a
three
-year performance period.
We base the grant date fair value for these awards on the closing market price of the underlying common stock on the day prior to the grant date. We amortize that value to stock-based compensation expense ratably over the vesting period based on the satisfaction of the performance condition that is most likely to be satisfied over the
three
-year performance period.
The table below shows target performance share awards granted and shares that would be issued at current performance levels for performance share awards granted as of
December 31, 2018
:
|
As of December 31, 2018
|
||||
|
Target performance share awards granted
|
41,439
|
|
||
|
Weighted average fair value per award
|
$
|
81.71
|
|
|
|
Number of shares that would be issued based on current performance levels
|
—
|
|
||
|
Unamortized expense, based on current performance levels (in millions)
|
$
|
—
|
|
|
93
Market Stock Units
In May and November 2017 and 2018,
executive officers, other than Joe Mansueto, and certain other employees, were granted market stock units. These market stock units represent the right to receive a target number of shares that will vest at the end of a three-year performance period depending on the company’s total shareholder return over that three-year period.
We measure the fair value of our market stock units on the date of grant using a Monte Carlo valuation model. We amortize that value to stock-based compensation expense ratably over the vesting period.
We used the following assumptions to estimate the fair value of our market stock units during 2017 and
2018
:
|
Assumptions for Monte Carlo Valuation Model
|
|||||||
|
Grant Date
|
Expected volatility
|
Dividend yield
|
Risk-free interest rate
|
||||
|
May 15, 2017
|
17.4
|
%
|
1.20
|
%
|
1.49
|
%
|
|
|
November 15, 2017
|
17.7
|
%
|
1.04
|
%
|
1.79
|
%
|
|
|
May 15, 2018
|
17.4
|
%
|
0.89
|
%
|
2.70
|
%
|
|
|
November 15, 2018
|
19.6
|
%
|
0.83
|
%
|
2.92
|
%
|
|
The table below shows market stock units granted and target market stock units outstanding as of
December 31, 2018
:
|
As of December 31, 2018
|
||||
|
Market stock units granted
|
84,153
|
|
||
|
Weighted average fair value per award
|
$
|
89.58
|
|
|
|
Number of target market stock units outstanding
|
81,274
|
|
||
|
Unamortized expense, based on current performance levels (in millions)
|
$
|
5.2
|
|
|
PitchBook Bonus Plan
In connection with our acquisition of PitchBook, we adopted a management bonus sub-plan under the 2011 Plan for certain employees of PitchBook (the PitchBook Plan). Pursuant to the terms of the PitchBook Plan, awards having an aggregate target value equal to
$30.0 million
will be available for issuance with annual grants of
$7.5 million
for 2017,
$7.5 million
in 2018, and
$15.0 million
in 2019. Subject to the satisfaction of certain conditions, we have agreed to renew the PitchBook Plan for the 2020-2022 period. Pursuant to the terms of this renewal, awards having an aggregate target value equal to
$30.0 million
will be available for issuance with annual grants of
$7.5 million
for 2020,
$7.5 million
in 2021, and
$15.0 million
in 2022
.
Each grant will consist of performance-based share unit awards which will vest over a
one
-year period and will be measured primarily based on the achievement of certain annual revenue targets specifically related to PitchBook’s business. Upon achievement of these targets, earned performance units will be settled in shares of our common stock on a
one
-for-one basis. If PitchBook exceeds certain performance conditions, the PitchBook Plan participants will receive payment for performance units in excess of the aggregate target values described above. If PitchBook fails to meet threshold performance conditions, the PitchBook Plan participants will not be entitled to receive payment for any performance units.
The table below shows target performance share awards granted and shares that will be issued based on final performance levels for performance share awards granted as of
December 31, 2018
:
|
As of December 31, 2018
|
||||
|
Target performance share awards granted
|
77,716
|
|
||
|
Weighted average fair value per award
|
$
|
95.53
|
|
|
|
Number of shares that will be issued based on final 2018 performance levels
|
106,854
|
|
||
|
Unamortized expense, based on current performance levels (in millions)
|
$
|
—
|
|
|
94
Stock Options
Stock options granted to employees vest ratably over a
four
-year period. Grants to our non-employee directors vest ratably over a
three
-year period. All grants expire
10
years after the date of grant.
In May 2011, we granted
86,106
stock options under the 2004 Stock Incentive Plan. In November 2011, we granted
6,095
stock options under the 2011 Plan. All options granted in 2011 have an exercise price equal to the fair market value on the grant date. We estimated the fair value of the options on the grant date using a Black-Scholes option-pricing model. The weighted average fair value of options granted during 2011 was
$23.81
per share, based on the following assumptions:
|
Assumptions for Black-Scholes Option Pricing Model
|
|||
|
Expected life (years)
|
7.4
|
|
|
|
Volatility factor
|
35.1
|
%
|
|
|
Dividend yield
|
0.35
|
%
|
|
|
Interest rate
|
2.87
|
%
|
|
The following table summarizes stock option activity in the past three years for our various stock option grants:
|
2018
|
2017
|
2016
|
|||||||||||||||||||
|
Option Grants
|
Underlying
Shares
|
Weighted
Average
Exercise
Price
|
Underlying
Shares
|
Weighted
Average
Exercise
Price
|
Underlying
Shares
|
Weighted
Average
Exercise
Price
|
|||||||||||||||
|
Options outstanding—beginning of year
|
41,685
|
|
$
|
57.28
|
|
46,001
|
|
$
|
57.28
|
|
52,096
|
|
$
|
57.52
|
|
||||||
|
Granted
|
—
|
|
—
|
|
—
|
|
—
|
|
—
|
|
—
|
|
|||||||||
|
Canceled
|
—
|
|
—
|
|
—
|
|
—
|
|
—
|
|
—
|
|
|||||||||
|
Exercised
|
(1,000
|
)
|
57.28
|
|
(4,316
|
)
|
57.28
|
|
(6,095
|
)
|
59.35
|
|
|||||||||
|
Options outstanding—end of year
|
40,685
|
|
$
|
57.28
|
|
41,685
|
|
$
|
57.28
|
|
46,001
|
|
$
|
57.28
|
|
||||||
|
Options exercisable—end of year
|
40,685
|
|
$
|
57.28
|
|
41,685
|
|
$
|
57.28
|
|
46,001
|
|
$
|
57.28
|
|
||||||
The following table summarizes the total intrinsic value (difference between the market value of our stock on the date of exercise and the exercise price of the option) of options exercised:
|
(in millions)
|
2018
|
2017
|
2016
|
|||||||||
|
Intrinsic value of options exercised
|
$
|
0.1
|
|
$
|
0.1
|
|
$
|
0.1
|
|
|||
The table below shows additional information for options outstanding and exercisable as of
December 31, 2018
:
|
|
Options Outstanding
|
Options Exercisable
|
||||||||||||||||||||||||
|
Range of Exercise Prices
|
Number of Options
|
Weighted
Average
Remaining
Contractual
Life (years)
|
Weighted
Average
Exercise
Price
|
Aggregate
Intrinsic
Value
(in millions)
|
Exercisable Shares
|
Weighted Average Remaining Contractual Life (years)
|
Weighted Average Exercise Price
|
Aggregate
Intrinsic
Value
(in millions)
|
||||||||||||||||||
|
$57.28
|
40,685
|
|
2.37
|
$
|
57.28
|
|
$
|
2.1
|
|
40,685
|
|
2.37
|
$
|
57.28
|
|
$
|
2.1
|
|
||||||||
|
Vested or Expected to Vest
|
||||||||||||||||||||||||||
|
$57.28
|
40,685
|
|
2.37
|
$
|
57.28
|
|
$
|
2.1
|
|
|||||||||||||||||
The aggregate intrinsic value in the table above represents the total pretax intrinsic value all option holders would have received if they had exercised all outstanding options on
December 31, 2018
. The intrinsic value is based on our closing stock price of
$109.84
on December 31,
2018
.
95
14
. Defined-Contribution Plan
We sponsor a defined-contribution 401(k) plan, which allows our U.S.-based employees to voluntarily contribute pretax dollars up to a maximum amount allowable by the U.S. Internal Revenue Service. In
2018
,
2017
, and
2016
, we made matching contributions to our 401(k) plan in the U.S. in an amount equal to
75 cents
for every dollar of an employee's contribution, up to a maximum of
7%
of the employee's compensation in the pay period.
The following table summarizes our matching contributions:
|
(in millions)
|
2018
|
2017
|
2016
|
|||||||||
|
401(k) matching contributions
|
$
|
11.0
|
|
$
|
10.4
|
|
$
|
9.0
|
|
|||
15
. Income Taxes
Income Tax Expense and Effective Tax Rate
The following table shows our income tax expense and our effective tax rate for the years ended December 31,
2018
,
2017
, and
2016
:
|
(in millions)
|
2018
|
2017
|
2016
|
|||||||||
|
Income before income taxes and equity in net loss of unconsolidated entities
|
$
|
232.9
|
|
$
|
181.1
|
|
$
|
224.9
|
|
|||
|
Equity in net loss of unconsolidated entities
|
(2.1
|
)
|
(1.3
|
)
|
(0.2
|
)
|
||||||
|
Total
|
$
|
230.8
|
|
$
|
179.8
|
|
$
|
224.7
|
|
|||
|
Income tax expense
|
$
|
47.8
|
|
$
|
42.9
|
|
$
|
63.7
|
|
|||
|
Effective tax rate
|
20.7
|
%
|
23.9
|
%
|
28.3
|
%
|
||||||
On December 22, 2017, the President of the United States signed into law the Tax Reform Act. The legislation significantly changed U.S. tax law by, among other things, lowering corporate income tax rates, changing to a territorial tax system and imposing a transitional tax on deemed repatriated earnings of foreign subsidiaries. The Tax Reform Act permanently reduces the U.S. corporate income tax rate from a maximum of 35% to a flat 21% rate, effective from January 1, 2018.
In our consolidated financial statements for the year ended December 31, 2017, we recognized a
$10.6 million
discrete net tax benefit. SAB 118 allowed for the recording of provisional amounts which were primarily comprised of the following:
|
•
|
A
$14.7 million
deferred tax benefit from revaluing our net U.S. deferred tax liabilities at December 31, 2017 to reflect the new U.S. corporate tax rate.
|
|
•
|
A tax expense of
$7.5 million
for the transitional tax liability on deemed repatriated earnings of foreign subsidiaries. This tax expense was offset by a tax benefit of a
$6.4 million
reduction of a deferred tax liability previously recorded for our foreign equity method investments.
|
|
•
|
A tax expense of
$3.0 million
related to changes in our indefinite reinvestment assertion. We recorded deferred taxes in the amount of
$3.0 million
for foreign withholding taxes that would be due upon remittance of dividends from certain of our foreign affiliates.
|
In the fourth quarter of 2018, we completed our accounting for the Tax Reform Act within the one-year measurement period required by SAB 118. Changes from our provisional estimates recorded in 2017 were not significant but were favorable and resulted in an additional decrease in our tax expense recorded in our Consolidated Statements of Income in 2018.
In addition to the reduction of the U.S. corporate income tax rate to a flat 21% rate discussed above, we are subject to the following provisions of the Tax Reform Act effective from January 1, 2018:
96
|
•
|
impose a new minimum tax on certain non-U.S. earnings, irrespective of the territorial system of taxation, and generally allows for the repatriation of future earnings of foreign subsidiaries without incurring additional U.S. taxes by transitioning to a territorial system of taxation (Global Intangible Low-Taxed Income or GILTI Tax);
|
|
•
|
eliminate tax incentives for domestic production activities in the United States (the Section 199 Deduction) but create an incentive for U.S. companies to sell, lease or license goods and services abroad by allowing for a new deduction for Foreign-Derived Intangible Income (the FDII Deduction);
|
|
•
|
subject certain payments made by a U.S. company to related foreign companies to certain minimum taxes (Base Erosion Anti-Abuse Tax or BEAT);
|
|
•
|
disallow net business interest deductions in excess of 30% of adjusted U.S. taxable income without regard to interest expense, interest income, taxes, net operating losses, depreciation and amortization for years beginning before January 1, 2022, (generally, EBITDA) and taxable income without regard to interest and taxes (EBIT) thereafter with indefinite carryforwards of excess interest expense (the 163(j) Interest Limitation);
|
|
•
|
reduces deductions with respect to certain employee fringe benefits and reduces deductions for compensation paid to specified executive officers.
|
With respect to the above provisions, our effective tax rate in the 12 months ended December 31, 2018 is favorably impacted as a result of the federal statutory income tax rate change from 35% of 21% and the tax benefits of the FDII Deduction. The impact of these favorable provisions is offset by the loss of tax benefits eliminated with the repeal of the Section 199 Deduction, the incremental tax expense attributable to GILTI Tax and, to a lesser extent, the incremental tax expense for disallowed deductions for employee fringe benefits and executive compensation. Our effective tax rate in the 12 months ended December 31, 2018 was not impacted by BEAT or the 163(j) Interest Limitation.
With respect to the GILTI Tax, we are required to make an accounting policy election of either (1) treating taxes due on U.S. inclusions in taxable income related to the GILTI Tax as a current period expense when incurred or (2) factoring such amounts into the measurement of our deferred taxes. We have elected to account for GILTI Tax as a period expense in the period in which it is incurred, and, therefore, have not provided for any deferred tax impact of GILTI Tax in our Consolidated Statements of Income or Consolidated Balance Sheets.
The amount of accumulated undistributed earnings of our foreign subsidiaries was approximately
$209.2 million
as of December 31, 2018. In February 2019, we repatriated approximately
$45.8 million
of these foreign earnings back to the U.S. Otherwise, we generally consider our U.S. directly-owned foreign subsidiary earnings to be permanently reinvested. We have not recorded deferred income taxes on the
$209.2 million
primarily because most of these earnings were previously subject to the one-time deemed mandatory repatriation tax under that Tax Reform Act, which we recorded in 2017 as an expense in our Consolidated Statements of Income. Certain foreign affiliate parent companies are not indefinitely reinvested, and thus, we maintain a deferred tax liability for foreign withholding taxes.
97
The following table reconciles our income tax expense at the U.S. federal income tax rate to income tax expense as recorded:
|
2018
|
2017
|
2016
|
|||||||||||||||||||
|
(in millions, except percentages)
|
Amount
|
|
%
|
|
Amount
|
|
%
|
|
Amount
|
|
%
|
|
|||||||||
|
Income tax expense at U.S. federal rate
|
$
|
48.5
|
|
21.0
|
%
|
$
|
63.0
|
|
35.0
|
%
|
$
|
78.6
|
|
35.0
|
%
|
||||||
|
State income taxes, net of federal income tax benefit
|
7.4
|
|
3.2
|
|
3.0
|
|
1.7
|
|
4.5
|
|
2.0
|
|
|||||||||
|
Change in U.S. tax rate
|
(0.6
|
)
|
(0.3
|
)
|
(14.7
|
)
|
(8.2
|
)
|
—
|
|
—
|
|
|||||||||
|
Deemed mandatory repatriation
|
(1.2
|
)
|
(0.5
|
)
|
7.5
|
|
4.2
|
|
—
|
|
—
|
|
|||||||||
|
Reduction of deferred tax liabilities for foreign equity method investments
|
(0.5
|
)
|
(0.2
|
)
|
(6.4
|
)
|
(3.6
|
)
|
—
|
|
—
|
|
|||||||||
|
Withholding tax - repatriation
|
—
|
|
—
|
|
3.0
|
|
1.7
|
|
—
|
|
—
|
|
|||||||||
|
Stock-based compensation activity
|
(2.6
|
)
|
(1.1
|
)
|
0.3
|
|
0.2
|
|
(0.6
|
)
|
(0.3
|
)
|
|||||||||
|
Equity in net income of unconsolidated subsidiaries (including holding gains upon acquisition)
|
1.0
|
|
0.4
|
|
1.2
|
|
0.7
|
|
(12.1
|
)
|
(5.4
|
)
|
|||||||||
|
Book gain over tax gain on sale of HelloWallet
|
—
|
|
—
|
|
(6.8
|
)
|
(3.8
|
)
|
—
|
|
—
|
|
|||||||||
|
Net change in valuation allowance related to non-U.S. deferred tax assets, primarily net operating losses
|
(0.2
|
)
|
(0.1
|
)
|
0.1
|
|
0.1
|
|
(0.1
|
)
|
—
|
|
|||||||||
|
Difference between U.S. federal statutory and foreign tax rates
|
0.2
|
|
0.1
|
|
(5.2
|
)
|
(2.9
|
)
|
(5.3
|
)
|
(2.4
|
)
|
|||||||||
|
Change in unrecognized tax benefits
|
1.0
|
|
0.4
|
|
1.2
|
|
0.7
|
|
2.6
|
|
1.2
|
|
|||||||||
|
Credits and incentives
|
(3.6
|
)
|
(1.6
|
)
|
(3.7
|
)
|
(2.1
|
)
|
(3.7
|
)
|
(1.6
|
)
|
|||||||||
|
GILTI tax
|
1.4
|
|
0.6
|
|
—
|
|
—
|
|
—
|
|
—
|
|
|||||||||
|
FDII deduction
|
(5.1
|
)
|
(2.2
|
)
|
—
|
|
—
|
|
—
|
|
—
|
|
|||||||||
|
Other - net
|
2.1
|
|
0.9
|
|
0.4
|
|
0.2
|
|
(0.2
|
)
|
(0.1
|
)
|
|||||||||
|
Total income tax expense
|
$
|
47.8
|
|
20.7
|
%
|
$
|
42.9
|
|
23.9
|
%
|
$
|
63.7
|
|
28.3
|
%
|
||||||
Income tax expense consists of the following:
|
Year ended December 31
|
||||||||||||
|
(in millions)
|
2018
|
2017
|
2016
|
|||||||||
|
Current tax expense:
|
||||||||||||
|
U.S.
|
||||||||||||
|
Federal
|
$
|
31.0
|
|
$
|
40.3
|
|
$
|
42.8
|
|
|||
|
State
|
11.1
|
|
6.6
|
|
6.5
|
|
||||||
|
Non-U.S.
|
12.3
|
|
9.9
|
|
9.7
|
|
||||||
|
Current tax expense
|
54.4
|
|
56.8
|
|
59.0
|
|
||||||
|
Deferred tax expense (benefit):
|
||||||||||||
|
U.S.
|
||||||||||||
|
Federal
|
(3.0
|
)
|
(10.9
|
)
|
5.1
|
|
||||||
|
State
|
(1.7
|
)
|
(1.9
|
)
|
0.4
|
|
||||||
|
Non-U.S.
|
(1.9
|
)
|
(1.1
|
)
|
(0.8
|
)
|
||||||
|
Deferred tax expense, net
|
(6.6
|
)
|
(13.9
|
)
|
4.7
|
|
||||||
|
Income tax expense
|
$
|
47.8
|
|
$
|
42.9
|
|
$
|
63.7
|
|
|||
98
The following table provides our income before income taxes and equity in net income (loss) of unconsolidated entities, generated by our U.S. and non-U.S. operations:
|
Year ended December 31
|
||||||||||||
|
(in millions)
|
2018
|
2017
|
2016
|
|||||||||
|
U.S.
|
$
|
188.2
|
|
$
|
143.5
|
|
$
|
186.5
|
|
|||
|
Non-U.S.
|
44.7
|
|
37.6
|
|
38.4
|
|
||||||
|
Income before income taxes and equity in net loss of unconsolidated entities
|
$
|
232.9
|
|
$
|
181.1
|
|
$
|
224.9
|
|
|||
Deferred Tax Assets and Liabilities
We recognize deferred income taxes for the temporary differences between the carrying amount of assets and liabilities for financial statement purposes and their tax basis. The tax effects of the temporary differences that give rise to the deferred income tax assets and liabilities are as follows:
|
As of December 31
|
||||||||
|
(in millions)
|
2018
|
2017
|
||||||
|
Deferred tax assets:
|
||||||||
|
Stock-based compensation expense
|
$
|
4.7
|
|
$
|
3.7
|
|
||
|
Accrued liabilities
|
17.0
|
|
14.2
|
|
||||
|
Deferred revenue
|
3.7
|
|
3.5
|
|
||||
|
Net operating loss carryforwards - U.S. federal and state
|
0.2
|
|
1.9
|
|
||||
|
Net operating loss carryforwards - Non-U.S.
|
2.4
|
|
3.1
|
|
||||
|
Credits and incentive carryforwards
|
—
|
|
0.3
|
|
||||
|
Deferred royalty revenue
|
0.3
|
|
0.2
|
|
||||
|
Allowance for doubtful accounts
|
1.4
|
|
1.1
|
|
||||
|
Deferred rent
|
7.4
|
|
6.2
|
|
||||
|
Unrealized exchange losses, net
|
0.2
|
|
—
|
|
||||
|
Other
|
0.6
|
|
0.3
|
|
||||
|
Total deferred tax assets
|
37.9
|
|
34.5
|
|
||||
|
Deferred tax liabilities:
|
||||||||
|
Acquired intangible assets
|
(16.5
|
)
|
(18.6
|
)
|
||||
|
Property, equipment, and capitalized software
|
(26.7
|
)
|
(24.6
|
)
|
||||
|
Unrealized exchange gains, net
|
—
|
|
(0.6
|
)
|
||||
|
Prepaid expenses
|
(7.1
|
)
|
(3.9
|
)
|
||||
|
Investments in unconsolidated entities
|
(4.8
|
)
|
(5.4
|
)
|
||||
|
Withholding tax - foreign dividends
|
(3.0
|
)
|
(3.0
|
)
|
||||
|
Total deferred tax liabilities
|
(58.1
|
)
|
(56.1
|
)
|
||||
|
Net deferred tax liability before valuation allowance
|
(20.2
|
)
|
(21.6
|
)
|
||||
|
Valuation allowance
|
(2.0
|
)
|
(2.0
|
)
|
||||
|
Deferred tax liability, net
|
$
|
(22.2
|
)
|
$
|
(23.6
|
)
|
||
99
The deferred tax assets and liabilities are presented in our Consolidated Balance Sheets as follows:
|
As of December 31
|
||||||||
|
(in millions)
|
2018
|
2017
|
||||||
|
Deferred tax liability, net
|
$
|
(22.2
|
)
|
$
|
(23.6
|
)
|
||
The following table summarizes our U.S. net operating loss (NOL) carryforwards:
|
As of December 31
|
||||||||||
|
(in millions)
|
2018
|
2017
|
||||||||
|
Expiration Dates
|
Expiration Dates
|
|||||||||
|
U.S. federal NOLs subject to expiration dates
|
$
|
1.0
|
|
2023
|
$
|
9.1
|
|
2023-2036
|
||
The net decrease in the U.S. federal NOL carryforwards as of December 31,
2018
compared with
2017
primarily reflects the utilization of U.S. federal NOLs. We have not recorded a valuation allowance against the U.S. federal NOLs of
$1.0 million
because we expect the benefit of the U.S. federal NOLs to be fully utilized before expiration.
The following table summarizes our NOL carryforwards for our non-U.S. operations:
|
As of December 31
|
||||||||
|
(in millions)
|
2018
|
2017
|
||||||
|
Non-U.S. NOLs subject to expiration dates from 2019 through 2038
|
$
|
5.5
|
|
$
|
5.7
|
|
||
|
Non-U.S. NOLs with no expiration date
|
5.1
|
|
9.1
|
|
||||
|
Total
|
$
|
10.6
|
|
$
|
14.8
|
|
||
|
Non-U.S. NOLs not subject to valuation allowances
|
$
|
2.0
|
|
$
|
5.4
|
|
||
The change in non-U.S. NOL carryforwards as of
December 31, 2018
compared with
2017
primarily reflects the use of NOL carryforwards offset by NOLs generated.
In assessing the realizability of our deferred tax assets, we consider whether it is more likely than not that some portion or all of the deferred tax assets will not be realized. We have recorded a valuation allowance against all but approximately
$2.0
million of the non-U.S. NOLs, reflecting the likelihood that the benefit of these NOLs will not be realized.
Unrecognized Tax Benefits
We conduct business globally and as a result, we file income tax returns in U.S. federal, state, local, and foreign jurisdictions. In the normal course of business, we are subject to examination by tax authorities throughout the world. The open tax years for our U.S. Federal tax returns and most state tax returns include the years 2015 to the present.
We are currently under audit by state and local tax authorities in the U.S. as well as tax authorities in certain non-U.S. jurisdictions. It is likely that the examination phase of some of these state, local, and non-U.S. audits will conclude in
2019
. It is not possible to estimate the effect of current audits on previously recorded unrecognized tax benefits.
As of
December 31, 2018
, our Consolidated Balance Sheet included a current liability of
$6.6 million
and a non-current liability of
$7.1 million
for unrecognized tax benefits. As of December 31,
2017
, our Consolidated Balance Sheet included a current liability of
$8.7 million
and a noncurrent liability of
$7.0 million
for unrecognized tax benefits. These amounts include interest and penalties, less any associated tax benefits.
100
The table below reconciles the beginning and ending amount of the gross unrecognized tax benefits as follows:
|
(in millions)
|
2018
|
2017
|
||||||
|
Gross unrecognized tax benefits - beginning of the year
|
$
|
18.7
|
|
$
|
18.4
|
|
||
|
Increases as a result of tax positions taken during a prior-year period
|
0.8
|
|
1.4
|
|
||||
|
Decreases as a result of tax positions taken during a prior-year period
|
(0.3
|
)
|
(0.4
|
)
|
||||
|
Increases as a result of tax positions taken during the current period
|
1.6
|
|
1.9
|
|
||||
|
Decreases relating to settlements with tax authorities
|
(2.5
|
)
|
—
|
|
||||
|
Reductions as a result of lapse of the applicable statute of limitations
|
(5.2
|
)
|
(2.6
|
)
|
||||
|
Gross unrecognized tax benefits - end of the year
|
$
|
13.1
|
|
$
|
18.7
|
|
||
In
2018
, we recorded a net increase of
$2.1 million
of gross unrecognized tax benefits before settlements and lapses of statutes of limitations, of which
$2.1 million
increased our income tax expense by
$2.1 million
.
In addition, we reduced our unrecognized tax benefits by
$7.7 million
for settlements and lapses of statutes of limitations, of which
$1.5 million
decreased our income tax expense by
$1.4 million
.
The reduction in our unrecognized tax benefits and the decrease to our tax expense for settlements and lapses of statutes of limitation were attributable to the following:
|
•
|
In the first quarter of 2018, we settled certain of our U.S. federal and state tax audits including our federal audit for the tax periods covering 2008 to 2012. The impact of the audit settlements decreased our gross unrecognized tax benefits by
$2.4 million
but the impact on our tax expense was nominal because the liabilities that we reserved for these audits were approximate to the final settlement amounts.
|
|
•
|
In second and third quarters of 2018, there were lapses of statutes of limitation for unsuccessful state refund claims which decreased our gross unrecognized tax benefits by
$3.4 million
. We did not previously record a financial statement benefit for the state refund claims, and, therefore, this decrease had no impact on our income tax expense.
|
|
•
|
In the third and fourth quarters of 2018, there were other lapses of statutes of limitation, which decreased our gross unrecognized tax benefits by
$1.9 million
and our income tax expense by
$1.4 million
.
|
As of
December 31, 2018
, we had
$13.1 million
of gross unrecognized tax benefits, of which
$13.1 million
, if recognized, would reduce our effective income tax rate and decrease our income tax expense by
$12.6 million
.
We record interest and penalties related to uncertain tax positions as part of our income tax expense. The following table summarizes our gross liability for interest and penalties:
|
As of December 31
|
||||||||
|
(in millions)
|
2018
|
2017
|
||||||
|
Liabilities for interest and penalties
|
$
|
1.3
|
|
$
|
1.7
|
|
||
We recorded the decrease in the liabilities for penalties and interest, net of any tax benefits, to income tax expense in our Consolidated Statement of Income in
2018
.
101
16
. Contingencies
Michael D. Green
In August 2017, Michael D. Green, individually and purportedly on behalf of all others similarly situated, filed a complaint in the U.S. District Court for the Northern District of Illinois. The complaint named as defendants Morningstar, Inc., Prudential Investment Management Services LLC, and Prudential Retirement Insurance and Annuity Co., and contained one count alleging violation of the Racketeer Influenced and Corrupt Organizations Act (RICO). Plaintiff, a participant in a pension plan, alleged that the defendants engaged in concerted racketeering actions to steer plan participants into high-cost investments that pay unwarranted fees to the defendants. The complaint sought unspecified compensatory damages for plaintiff and the members of the putative class, treble damages, injunctive relief, costs, and attorneys’ fees. We filed a motion to dismiss the complaint for failure to state a claim, which the court granted without prejudice on March 16, 2018. On April 13, 2018, plaintiff filed an amended complaint, substituting Morningstar Investment Management LLC for Morningstar, Inc. as a defendant, and which again contained one count alleging violation of RICO and sought unspecified compensatory damages for plaintiff and the members of the putative class, treble damages, injunctive relief, costs, and attorneys' fees. We moved to dismiss the amended complaint on May 11, 2018, which the court granted with prejudice on January 16, 2019. No appeal was taken by the deadline for doing so.
Data Audits and Reviews
In our global data business, we include in our products or directly redistribute to our customers data and information licensed from third-party vendors. Our compliance with the terms of these licenses is subject to audit by the third-party vendors, and we also regularly review our compliance with the terms of the licenses. We are undergoing several such third-party vendor audits and internal reviews, and the results and findings may indicate that we may be required to make a payment for prior data usage. Due to lack of available information and data, as well as potential variations of the audit or internal review findings, we are not able to reasonably estimate a possible loss, or range of losses for some matters. While we cannot predict the outcomes, we do not believe the results of any audits will have a material adverse effect on our business, operating results, or financial position.
We record accrued liabilities for litigation, regulatory, and other business matters when those matters represent loss contingencies that are both probable and estimable. In these cases, there may be an exposure to loss in excess of any amounts accrued. When a loss contingency is not both probable and estimable, we do not establish an accrued liability. As a litigation, regulatory, or other business matter develops, we evaluate on an ongoing basis whether such matter presents a loss contingency that is probable and estimable.
Other Matters
We are involved from time to time in legal proceedings and litigation that arise in the normal course of our business. While it is difficult to predict the outcome of any particular proceeding, we do not believe the result of any of these matters will have a material adverse effect on our business, operating results, or financial position.
17
. Share Repurchase Program
In December 2017, the board of directors approved a new share repurchase program that authorizes the company to repurchase up to
$500.0 million
in shares of the company's outstanding common stock effective January 1, 2018. The authorization expires on
December 31, 2020
. We may repurchase shares from time to time at prevailing market prices on the open market or in private transactions in amounts that we deem appropriate.
As of
December 31, 2018
, we had repurchased a total of
202,245
shares for
$20.9 million
under this authorization, leaving
$479.1 million
available for future repurchases.
102
18
. Recent Accounting Pronouncements
Recently adopted accounting pronouncements
Revenue Recognition:
On May 28, 2014, the FASB issued ASU No. 2014-09 (Topic 606),
Revenue from Contracts with Customers
, which requires an entity to recognize the amount of revenue to which it expects to be entitled for the transfer of promised goods or services to customers. The original effective date for ASU 2014-09 would have required us to adopt it beginning on January 1, 2017. In August 2015, the FASB issued ASU No. 2015-14,
Revenue from Contracts with Customers
—
Deferral of the Effective Date
, which deferred the effective date of ASU 2014-09 for one year and permitted early adoption as early as the original effective date. We elected the deferral, and the new standard was effective for us on January 1, 2018. We also adopted ASU No. 2016-08, ASU No. 2016-10, ASU No. 2016-11, ASU No. 2016-12, and ASU No. 2016-20 on January 1, 2018.
We adopted Topic 606 using the modified retrospective transition method applied to those contracts which were not completed as of January 1, 2018. Upon adoption, we recognized the cumulative effect of adopting this guidance as an adjustment to our opening balance of retained earnings. Prior periods were not retrospectively adjusted.
The impact to revenue as a result of applying Topic 606 was an increase of
$6.7 million
for the year ended December 31, 2018 and relates to a change in presentation of revenue and costs associated with third-party content and data. Such revenue and costs were presented on a net basis prior to the adoption of Topic 606 and are now presented on a gross basis.
We also changed our accounting for expenses related to our sales commission plans as a result of adopting Topic 606. Due to our method of adoption, we recorded a deferred commission asset, and related deferred tax liability, as of January 1, 2018 for sales commissions that were expensed in prior periods. This change resulted in an opening net adjustment to retained earnings of
$17.0 million
, with an offsetting increase to our deferred commissions and deferred income tax liabilities relating to prior periods.
The following table summarizes the cumulative effect of the changes to our unaudited condensed consolidated balance sheet as of January 1, 2018 from the adoption of Topic 606:
|
(in millions)
|
Balance at December 31, 2017
|
Adjustments due to Topic 606
|
Balance at
January 1, 2018
|
|||||||||
|
Assets:
|
||||||||||||
|
Deferred commissions, current and non-current
|
$
|
—
|
|
$
|
22.7
|
|
$
|
22.7
|
|
|||
|
Liabilities:
|
||||||||||||
|
Deferred income tax liability
|
$
|
—
|
|
$
|
5.7
|
|
$
|
5.7
|
|
|||
|
Equity:
|
||||||||||||
|
Retained earnings
|
$
|
—
|
|
$
|
17.0
|
|
$
|
17.0
|
|
|||
The following table illustrates the impact that adopting Topic 606 has had on our reported results in the audited consolidated balance sheet as of December 31, 2018 and the audited consolidated statements of income for the year ended December 31, 2018:
|
As of December 31, 2018
|
||||||||||||
|
(in millions)
|
As Reported
|
Impact of adopting Topic 606
|
Balances without adoption of Topic 606
|
|||||||||
|
Balance Sheet:
|
||||||||||||
|
Accounts receivable, less allowance
|
$
|
172.2
|
|
$
|
—
|
|
$
|
172.2
|
|
|||
|
Deferred commissions, current and non-current
|
25.1
|
|
25.1
|
|
—
|
|
||||||
|
Deferred revenue, current and non-current
|
210.0
|
|
—
|
|
210.0
|
|
||||||
103
|
2018
|
||||||||||||
|
(in millions)
|
As Reported
|
Impact of adopting Topic 606
|
Balances without adoption of Topic 606
|
|||||||||
|
Income Statement:
|
||||||||||||
|
Revenue
|
$
|
1,019.9
|
|
$
|
6.7
|
|
$
|
1,013.2
|
|
|||
|
Cost of revenue
|
411.1
|
|
6.7
|
|
404.4
|
|
||||||
|
Sales and marketing
|
148.5
|
|
2.9
|
|
151.4
|
|
||||||
|
Operating income
|
215.8
|
|
(2.9
|
)
|
212.9
|
|
||||||
Intangibles
—
Goodwill and Other:
On January 26, 2017, the FASB issued ASU No. 2017-04,
Intangibles
—
Goodwill and Other
, which simplifies the accounting for goodwill impairment. The guidance removes Step 2 of the goodwill impairment test, which requires a hypothetical purchase price allocation. A goodwill impairment will now be the amount by which a reporting unit’s carrying value exceeds its fair value, not to exceed the carrying amount of goodwill. All other goodwill impairment guidance will remain largely unchanged. Entities will continue to have the option to perform a qualitative assessment to determine if a quantitative impairment test is necessary. The same one-step impairment test will be applied to goodwill at all reporting units, even those with zero or negative carrying amounts. Entities will be required to disclose the amount of goodwill at reporting units with zero or negative carrying amounts. The new standard is effective for us on January 1, 2020. The new standard is required to be applied prospectively. Early adoption is permitted for any impairment tests performed after January 1, 2017. We elected to early adopt the new standard on October 1, 2018 as we perform our annual impairment review in the fourth quarter. The adoption did not have an impact on our consolidated financial statements and related disclosures.
Recently Issued Accounting Pronouncements Not Yet Adopted
Leases:
On February 25, 2016, the FASB issued ASU No. 2016-02,
Leases (Topic 842)
, which will require lessees to recognize almost all leases on their balance sheet as a right-of-use asset and a lease liability. The new standard became effective for us on January 1, 2019. The new standard originally required the use of a modified retrospective approach upon adoption. In July 2018, the FASB issued ASU No. 2018-11,
Leases (Topic 842) - Targeted Improvements
, which allows an additional transition method to adopt the new lease standard at the adoption date instead of the beginning of the earliest period presented, and recognize a cumulative-effect adjustment to the beginning balance of retained earnings in the period of adoption. We elected this transition method at the adoption date of January 1, 2019. We continue to evaluate the effect that the new standard will have on our consolidated financial statements and related disclosures. We are making meaningful progress on our implementation plan and are achieving project milestones, including a comprehensive review of our lease portfolio to identify all leases where the company is either a lessor or lessee. In addition, we implemented lease accounting software in early 2019 to assist in our ongoing lease data collection, tracking and analysis, and are updating our lease processes and related internal controls to reflect changes required to ensure readiness for adoption. We are updating our accounting policies and plan to make an accounting policy election to keep leases with an initial term of 12 months or less off of the balance sheet. We also plan to recognize those lease payments in the Consolidated Statements of Income on a straight-line basis over the lease term. We do not believe the new standard will have a material impact on our liquidity. The adoption of the new lease standard will have no impact on our debt-covenant compliance under our current agreements.
Income Statement-Reporting Comprehensive Income:
On February 14, 2018, the FASB issued ASU No. 2018-02,
Income Statement-Reporting Comprehensive Income (Topic 220): Reclassification of Certain Tax Effects from Accumulated Other Comprehensive Income
, to address a specific consequence of the Tax Reform Act by allowing a reclassification from accumulated other comprehensive income (loss) to retained earnings for stranded tax effects resulting from the Tax Reform Act’s reduction of the U.S. federal corporate income tax rate. The new standard became effective for us on January 1, 2019 and is to be applied either in the period of adoption or retrospectively to each period in which the effect of the change in the U.S. federal corporate income tax rate in the Tax Reform Act is recognized. We are evaluating the effect that the new standard will have on our consolidated financial statements and related disclosures.
104
Compensation—Stock Compensation:
On June 20, 2018, the FASB issued ASU No. 2018-07,
Compensation—Stock Compensation (Topic 718) - Improvements to Nonemployee Share-Based Payment Accounting,
which aligns the accounting for share-based payment awards issued to employees and nonemployees. Under the new standard, the existing employee guidance will apply to nonemployee share-based transactions (as long as the transaction is not effectively a form of financing), with the exception of specific guidance related to the attribution of compensation cost. The cost of nonemployee awards will continue to be recorded as if the grantor had paid cash for the goods or services. In addition, the contractual term can be used in lieu of an expected term in the option-pricing model for nonemployee awards. The new standard became effective for us on January 1, 2019 and should be applied to all new awards granted after the date of adoption. We are evaluating the effect that the new standard will have on our consolidated financial statements and related disclosures.
Cloud Computing
: On August 29, 2018, the FASB issued ASU No. 2018-15,
Customer's Accounting for Fees Paid in a Cloud Computing Arrangement
, which helps entities evaluate the accounting for fees paid by a customer in a cloud computing arrangement (CCA) by providing guidance for determining when an arrangement includes a software license and when an arrangement is solely a hosted CCA service. Under the new standard, customers will apply the same criteria for capitalizing implementation costs as they would for an arrangement that has a software license. The new guidance also prescribes the balance sheet, income statement, and cash flow classification of the capitalized implementation costs and related amortization expense, and requires additional quantitative and qualitative disclosures. The new standard is effective for us on January 1, 2020. Early adoption is permitted, including adoption in any interim period for which financial statements have not been issued. Entities can choose to adopt the new guidance prospectively to eligible costs incurred on or after the date this guidance is first applied or retrospectively. We are evaluating the effect that the new standard will have on our consolidated financial statements and related disclosures.
19
. Selected Quarterly Financial Data (unaudited)
|
2017
|
2018
|
|||||||||||||||||||||||||||
|
(in millions except per share amounts)
|
Q1
|
Q2
|
Q3
|
Q4
|
Q1
|
Q2
|
Q3
|
Q4
|
||||||||||||||||||||
|
Revenue
|
$209.5
|
$229.2
|
$
|
229.9
|
|
$
|
243.1
|
|
$
|
243.5
|
|
$
|
252.4
|
|
$
|
261.3
|
|
(1)
|
$
|
262.7
|
|
|||||||
|
Total operating expense
|
181.1
|
183.2
|
177.1
|
|
200.5
|
|
196.0
|
|
198.8
|
|
195.9
|
|
213.4
|
|
||||||||||||||
|
Operating income
|
28.4
|
46.0
|
52.8
|
|
42.6
|
|
47.5
|
|
53.6
|
|
65.4
|
|
49.3
|
|
||||||||||||||
|
Non-operating income (expense), net
|
(1.3)
|
15.3
|
(2)
|
(2.0
|
)
|
(0.7
|
)
|
9.3
|
|
(2)
|
1.4
|
|
7.3
|
|
(0.9
|
)
|
||||||||||||
|
Income before income taxes and equity in net income (loss) of unconsolidated entities
|
27.1
|
61.3
|
50.8
|
|
41.9
|
|
56.8
|
|
55.0
|
|
72.7
|
|
48.4
|
|
||||||||||||||
|
Equity in net income (loss) of unconsolidated entities
|
(0.8)
|
(0.2)
|
—
|
|
(0.3
|
)
|
(1.5
|
)
|
(0.4
|
)
|
0.3
|
|
(0.5
|
)
|
||||||||||||||
|
Income tax expense
|
8.3
|
15.0
|
16.9
|
|
2.7
|
|
(3)
|
13.4
|
|
12.8
|
|
16.1
|
|
5.5
|
|
|||||||||||||
|
Consolidated net income
|
$18.0
|
$46.1
|
$
|
33.9
|
|
$
|
38.9
|
|
$
|
41.9
|
|
$
|
41.8
|
|
$
|
56.9
|
|
$
|
42.4
|
|
||||||||
|
Net income per share:
|
||||||||||||||||||||||||||||
|
Basic
|
$0.42
|
$1.07
|
$
|
0.80
|
|
$
|
0.91
|
|
$
|
0.99
|
|
$
|
0.98
|
|
$
|
1.33
|
|
$
|
0.99
|
|
||||||||
|
Diluted
|
|
$0.42
|
|
$1.07
|
|
$
|
0.79
|
|
|
$
|
0.91
|
|
|
$
|
0.98
|
|
|
$
|
0.97
|
|
|
$
|
1.32
|
|
|
$
|
0.99
|
|
|
Dividends per common share:
|
||||||||||||||||||||||||||||
|
Dividends declared per common share
|
$0.23
|
$0.23
|
$
|
—
|
|
$
|
0.48
|
|
$
|
0.25
|
|
$
|
0.25
|
|
$
|
—
|
|
$
|
0.53
|
|
||||||||
|
Dividends paid per common share
|
$0.23
|
$0.23
|
$
|
0.23
|
|
$
|
0.23
|
|
$
|
0.25
|
|
$
|
0.25
|
|
$
|
0.25
|
|
$
|
0.25
|
|
||||||||
|
Weighted average shares outstanding:
|
||||||||||||||||||||||||||||
|
Basic
|
42.9
|
42.9
|
42.5
|
|
42.5
|
|
42.5
|
|
42.6
|
|
42.6
|
|
42.7
|
|
||||||||||||||
|
Diluted
|
43.2
|
43.1
|
42.8
|
|
42.9
|
|
42.9
|
|
43.0
|
|
43.1
|
|
43.1
|
|
||||||||||||||
(1) Revenue in the third quarter of 2018 includes a
$10.5 million
revenue benefit related to an amended license agreement.
105
(2) Non-operating income in the second quarter of
2017
included a
$17.5 million
gain on the sale of HelloWallet. We recorded an immaterial adjustment to this gain in the fourth quarter of 2017. Non-operating income in first quarter of 2018 includes a
$10.5 million
gain related to the sale of our 15(c) board consulting services product line.
(3) Tax expense in the fourth quarter of
2017
includes a net benefit of
$10.6 million
related to the impact of the Tax Reform Act.
Item 9. Changes in and Disagreements with Accountants on Accounting and Financial Disclosure
Not applicable.
Item 9A. Controls and Procedures
(a) Evaluation of Disclosure Controls and Procedures
We design disclosure controls and procedures to reasonably assure that information required to be disclosed in the reports filed or submitted under the Exchange Act is recorded, processed, summarized, and reported within the time periods specified in the SEC's rules and forms. Disclosure controls and procedures include, without limitation, controls and procedures designed to reasonably assure that information required to be disclosed in the reports filed under the Exchange Act is accumulated and communicated to management, including the chief executive officer and chief financial officer, as appropriate, to allow timely decisions regarding required disclosure.
We carried out an evaluation of the effectiveness of the design and operation of our disclosure controls and procedures, as defined in Rules 13a-15(e) and 15d-15(e) of the Exchange Act, as of
December 31, 2018
. Management, including our chief executive officer and chief financial officer, participated in and supervised this evaluation. Based on that evaluation, our chief executive officer and chief financial officer concluded that our disclosure controls and procedures are effective to provide reasonable assurance that information required to be disclosed in the reports we file or submit under the Exchange Act meets the requirements listed above.
(b) Management's Report on Internal Control Over Financial Reporting
Our management is responsible for establishing and maintaining adequate internal control over financial reporting. Our internal control over financial reporting is a process designed to provide reasonable assurance regarding the reliability of financial reporting and the preparation of financial statements for external purposes in accordance with U.S. generally accepted accounting principles.
We carried out an evaluation, under the supervision and with the participation of our management, including our chief executive officer and chief financial officer, of the effectiveness of our internal control over financial reporting based on the framework set forth in Internal Control
—
Integrated Framework (2013) issued by the Committee of Sponsoring Organizations of the Treadway Commission.
Based on that evaluation, our management concluded that our internal control over financial reporting was effective as of
December 31, 2018
.
KPMG LLP, our independent registered public accounting firm, has issued its report on the effectiveness of our internal control over financial reporting, which is included in Part II, Item 8 of this Form 10-K under the caption “Financial Statements and Supplementary Data” and incorporated herein by reference.
(c) Changes in Internal Control Over Financial Reporting
Beginning on January 1, 2018, we implemented ASU No. 2014-09,
Revenue from Contracts with Customers
and the related revenue ASUs. Although the new revenue standard had an immaterial impact on our ongoing net income, we did implement changes to our processes related to revenue recognition and the control activities within them. These included the development of new policies based on the five-step model provided in the new revenue standard, new training, ongoing contract review requirements, and gathering of information provided for disclosures. We also implemented changes to our processes related to sales commissions and the control activities related to such processes.
106
Other than the changes noted above, there were no changes in our internal control over financial reporting during the full year ended
December 31, 2018
that have materially affected, or are reasonably likely to materially affect, our internal control over financial reporting.
Item 9B. Other Information
There is no information that was required to be disclosed in a report on Form 8-K during the fourth quarter of the year covered by this Annual Report on Form 10-K that was not reported.
107
Part III
Item 10. Directors, Executive Officers, and Corporate Governance
The information contained under the headings Proposal 1
—
Election of Directors, Board of Directors and Corporate Governance
—
Independent Directors, Board of Directors and Corporate Governance
—
Board Committees and Charters, and Section 16(a) Beneficial Ownership Reporting Compliance in the definitive proxy statement for our
2019
Annual Meeting of Shareholders (the Proxy Statement) and the information contained under the heading Executive Officers in Part I of this report is incorporated herein by reference in response to this item.
We have adopted a code of ethics, which is posted in the Investor Relations area of our corporate website at
https://shareholders.morningstar.com
in the Governance section. We intend to include on our website any amendments to, or waivers from, a provision of the code of ethics that apply to our principal executive officer, principal financial officer, principal accounting officer, or controller that relates to any element of the code of ethics definition contained in Item 406(b) of SEC Regulation S-K. Shareholders may request a free copy of these documents by sending an e-mail to investors@morningstar.com.
Item 11. Executive Compensation
The information contained under the headings Board of Directors and Corporate Governance—Directors' Compensation, Compensation Discussion and Analysis, Compensation Committee Report, Compensation Committee Interlocks and Insider Participation, and Executive Compensation in the Proxy Statement is incorporated herein by reference in response to this item.
Item 12. Security Ownership of Certain Beneficial Owners and Management and Related Stockholder Matters
The information contained under the headings Security Ownership of Certain Beneficial Owners and Management and Equity Compensation Plan Information in the Proxy Statement is incorporated herein by reference in response to this item.
Item 13. Certain Relationships and Related Transactions, and Director Independence
The information contained under the headings Certain Relationships and Related Party Transactions and Board of Directors and Corporate Governance—Independent Directors in the Proxy Statement is incorporated herein by reference in response to this item.
Item 14. Principal Accountant Fees and Services
The information contained under the headings Audit Committee Report and Principal Accounting Firm Fees in the Proxy Statement is incorporated herein by reference in response to this item.
108
Part IV
Item 15. Exhibits and Financial Statement Schedules
(a)
1. Consolidated Financial Statements
The following documents are filed as part of this Annual Report on Form 10-K under Item 8
—
Financial Statements and Supplementary Data:
|
Report of KPMG LLP, Independent Registered Public Accounting Firm
|
|
|
Financial Statements:
|
|
|
Consolidated Statements of Income—Years ended December 31, 2018, 2017, and 2016
|
|
|
Consolidated Statements of Comprehensive Income—Years ended December 31, 2018, 2017, and 2016
|
|
|
Consolidated Balance Sheets—December 31, 2018 and 2017
|
|
|
Consolidated Statements of Equity—Years ended December 31, 2018, 2017, and 2016
|
|
|
Consolidated Statements of Cash Flows—Years ended December 31, 2018, 2017, and 2016
|
|
|
Notes to Consolidated Financial Statements
|
|
2. Financial Statement Schedules
REPORT OF INDEPENDENT REGISTERED PUBLIC ACCOUNTING FIRM
The report of KPMG LLP dated
March 1, 2019
concerning the Financial Statement Schedule II, Morningstar, Inc., and subsidiaries Valuation and Qualifying Accounts, is included at the beginning of Part II, Item 8 of this Annual Report on Form 10-K for the years ended
December 31, 2018
, December 31,
2017
, and December 31,
2016
.
The following financial statement schedule is filed as part of this Annual Report on Form 10-K:
Schedule II: Valuation and Qualifying Accounts
All other schedules have been omitted as they are not required, not applicable, or the required information is otherwise included.
|
(in millions)
|
Balance at Beginning of Year
|
Charged (Credited) to Costs & Expenses
|
Additions (Deductions) Including Currency Translations
|
Balance at End of Year
|
||||||||||||
|
Allowance for doubtful accounts:
|
||||||||||||||||
|
Year ended December 31,
|
||||||||||||||||
|
2018
|
$
|
3.2
|
|
$
|
2.4
|
|
$
|
(1.6
|
)
|
$
|
4.0
|
|
||||
|
2017
|
2.1
|
|
2.3
|
|
(1.2
|
)
|
3.2
|
|
||||||||
|
2016
|
1.8
|
|
1.3
|
|
(1.0
|
)
|
2.1
|
|
||||||||
109
3. Exhibits
|
Exhibit
|
Description
|
|
|
Amended and Restated Articles of Incorporation of Morningstar are incorporated by reference to Exhibit 3.1 to our Registration Statement on Form S-1, as amended, Registration No. 333-115209 (the Registration Statement).
|
||
|
By-laws of Morningstar, as in effect on February 27, 2018, are incorporated by reference to Exhibit 3.1 to our Current Report on Form 8-K that we filed with the SEC on February 28, 2018.
|
||
|
Specimen Common Stock Certificate is incorporated by reference to Exhibit 4.1 to the Registration Statement.
|
||
|
Form of Indemnification Agreement is incorporated by reference to Exhibit 10.1 to the Registration Statement.
|
||
|
Morningstar Incentive Plan, as amended and restated effective January 1, 2014, is incorporated by reference to Exhibit 10.2 to our Annual Report on Form 10-K for the year ended December 31, 2013.
|
||
|
Morningstar 2004 Stock Incentive Plan, as amended and restated effective as of July 24, 2009, is incorporated by reference to Exhibit 10.1 to our Quarterly Report on Form 10-Q for the quarter ended June 30, 2009.
|
||
|
Morningstar 2011 Stock Incentive Plan is incorporated by reference to Exhibit 10.1 to our Current Report on Form 8-K that we filed with the SEC on May 18, 2011.
|
||
|
Form of Morningstar 2004 Stock Incentive Plan Stock Option Agreement for awards made on May 15, 2011 is incorporated by reference to Exhibit 10.1 to our Quarterly Report on Form 10-Q for the quarter ended June 30, 2011 (the June 2011 10-Q).
|
||
|
Form of Morningstar 2004 Stock Incentive Plan Director Stock Option Agreement for awards made on May 15, 2011 is incorporated by reference to Exhibit 10.2 to the June 2011 10-Q.
|
||
|
Form of Morningstar 2011 Stock Incentive Plan Restricted Stock Unit Award Agreement for awards made on and after May 15, 2013 is incorporated by reference to Exhibit 10.1 to our Quarterly Report on Form 10-Q for the quarter ended June 30, 2013 (the June 2013 10-Q).
|
||
|
Form of Morningstar 2011 Stock Incentive Plan Director Restricted Stock Unit Award Agreement, as amended and restated effective December 3, 2015 is incorporated by reference to Exhibit 10.12 to our Annual Report on Form 10-K for the year ended December 31, 2015 (the 2015 10-K).
|
||
|
Form of Morningstar 2011 Stock Incentive Plan Performance Share Award Agreement, as amended and restated effective December 3, 2015, for awards made on and after March 15, 2015 is incorporated by reference to Exhibit 10.14 to the 2015 10-K.
|
||
|
Form of Morningstar 2011 Stock Incentive Plan CEO Restricted Stock Unit Award Agreement for award made on January 3, 2017 is incorporated by reference to Exhibit 10.11 to our Annual Report on Form 10-K for the year ended December 31, 2016.
|
||
|
10.11
*
|
Form of Morningstar 2011 Stock Incentive Plan Market Stock Unit Award Agreement for awards made on May 15, 2017 is incorporated by reference to Exhibit 10.1 to our Quarterly Report on Form 10-Q for the quarter ended June 30, 2017.
|
|
|
Form of Morningstar 2011 Stock Incentive Plan Market Stock Unit Award Agreement for awards made on and after November 15, 2017 is incorporated by reference to Exhibit 10.12 to our Annual Report on Form 10-K for the year ended December 31, 2017 (the 2017 10-K).
|
||
|
Form of Morningstar 2011 Stock Incentive Plan Restricted Stock Unit Award Agreement for awards made on and after November 15, 2017 is incorporated by reference to Exhibit 10.13 to the 2017 10-K.
|
||
|
Form of Morningstar 2011 Stock Incentive Plan CFO Restricted Stock Unit Award Agreement for award made on November 15, 2017 is incorporated by reference to Exhibit 10.14 to the 2017 10-K.
|
||
|
Amended and Restated Credit Agreement dated as of November 4, 2016 and Amendment No. 1 to Amended and Restated Credit Agreement dated as of December 21, 2018, each among Morningstar, Inc., certain subsidiaries of Morningstar, Inc., and Bank of America, N.A. are incorporated by reference to Exhibit 10.1 to our Current Report on Form 8-K that we filed with the SEC on December 28, 2018.
|
||
|
Subsidiaries of Morningstar.
|
||
|
Consent of KPMG LLP.
|
||
|
Certification of Chief Executive Officer pursuant to Rule 13a-14(a) and 15d-14(a) of the Securities Exchange Act of 1934, as amended.
|
||
|
Certification of Chief Financial Officer pursuant to Rule 13a-14(a) and 15d-14(a) of the Securities Exchange Act of 1934, as amended.
|
||
|
Certification of Chief Executive Officer pursuant to 18 U.S.C. 1350, as adopted pursuant to Section 906 of the Sarbanes-Oxley Act of 2002.
|
||
110
|
Certification of Chief Financial Officer pursuant to 18 U.S.C. 1350, as adopted pursuant to Section 906 of the Sarbanes-Oxley Act of 2002.
|
||
|
101†
|
The following financial information from Morningstar Annual Report on Form 10-K for the year ended December 31, 2018, filed with the SEC on March 1, 2019, formatted in XBRL: (i) Consolidated Statements of Income, (ii) Consolidated Statements of Comprehensive Income, (iii) Consolidated Balance Sheets, (iv) Consolidated Statements of Equity, (v) Consolidated Statements of Cash Flows and (vi) the Notes to Consolidated Financial Statements.
|
|
* Management contract with a director or executive officer or a compensatory plan or arrangement in which directors or executive officers are eligible to participate.
† Filed or furnished herewith.
Item 16. Form 10-K Summary
None.
111
SIGNATURES
Pursuant to the requirements of Section 13 or 15(d) of the Securities Exchange Act of 1934, the registrant has duly caused this report to be signed on its behalf by the undersigned thereunto duly authorized on
March 1, 2019
.
|
|
|
MORNINGSTAR, INC.
|
|
|
|
|
|
|
|
By:
|
/s/ Kunal Kapoor
|
||
|
|
|
Kunal Kapoor
|
|
|
|
|
Title: Chief Executive Officer
|
|
Pursuant to the requirements of the Securities Exchange Act of 1934, this report has been signed below by the following persons on behalf of the registrant and in the capacities and on the dates indicated.
112
|
Signature
|
Title
|
Date
|
||
|
/s/ Kunal Kapoor
|
Chief Executive Officer
|
March 1, 2019
|
||
|
Kunal Kapoor
|
(principal executive officer) and Director
|
|||
|
/s/ Jason Dubinsky
|
Chief Financial Officer (principal
|
March 1, 2019
|
||
|
Jason Dubinsky
|
financial officer)
|
|||
|
/s/ Kimberly McGarry
|
Chief Accounting Officer (principal
|
March 1, 2019
|
||
|
Kimberly McGarry
|
accounting officer)
|
|||
|
/s/ Joe Mansueto
|
Chairman of the Board
|
March 1, 2019
|
||
|
Joe Mansueto
|
||||
|
/s/ Robin Diamonte
|
Director
|
March 1, 2019
|
||
|
Robin Diamonte
|
||||
|
/s/ Cheryl Francis
|
Director
|
March 1, 2019
|
||
|
Cheryl Francis
|
||||
|
/s/ Steven Kaplan
|
Director
|
March 1, 2019
|
||
|
Steven Kaplan
|
||||
|
/s/ Gail Landis
|
Director
|
March 1, 2019
|
||
|
Gail Landis
|
||||
|
/s/ Bill Lyons
|
Director
|
March 1, 2019
|
||
|
Bill Lyons
|
||||
|
/s/ Jack Noonan
|
Director
|
March 1, 2019
|
||
|
Jack Noonan
|
||||
|
/s/ Caroline Tsay
|
Director
|
March 1, 2019
|
||
|
Caroline Tsay
|
||||
|
/s/ Hugh Zentmyer
|
Director
|
March 1, 2019
|
||
|
Hugh Zentmyer
|
||||
113
TABLE OF CONTENTS
Part IItem 1. BusinessItem 1A. Risk FactorsItem 1B. Unresolved Staff CommentsItem 2. PropertiesItem 3. Legal ProceedingsItem 4. Mine Safety DisclosuresPart IIItem 5. Market For Registrant's Common Equity, Related Stockholder Matters and Issuer Purchases Of Equity SecuritiesItem 6. Selected Financial DataItem 7. Management S Discussion and Analysis Of Financial Condition and Results Of OperationsItem 7A. Quantitative and Qualitative Disclosures About Market RiskItem 8. Financial Statements and Supplementary DataItem 9. Changes in and Disagreements with Accountants on Accounting and Financial DisclosureItem 9A. Controls and ProceduresItem 9B. Other InformationPart IIIItem 10. Directors, Executive Officers, and Corporate GovernanceItem 11. Executive CompensationItem 12. Security Ownership Of Certain Beneficial Owners and Management and Related Stockholder MattersItem 13. Certain Relationships and Related Transactions, and Director IndependenceItem 14. Principal Accountant Fees and ServicesPart IVItem 15. Exhibits and Financial Statement SchedulesItem 16. Form 10-k Summary