MOSAIC CO
10-Ks and 10-Qs
|
|
|
|
|
|
|
|
|
|
|
|
|
|
|
|
|
|
|
|
|
|
|
|
|
|
|
|
|
|
|
|
|
|
|
|
|
|
|
|
|
|
|
|
|
|
|
|
|
|
|
|
|
|
|
|
UNITED STATES
SECURITIES AND EXCHANGE COMMISSION
Washington, D.C. 20549
______________________________
FORM 10-K
______________________________
x
ANNUAL REPORT PURSUANT TO SECTION 13 OR 15(d) OF
THE SECURITIES EXCHANGE ACT OF 1934
For the year ended
December 31, 2018
¨
TRANSITION REPORT PURSUANT TO SECTION 13 OR 15(d) OF
THE SECURITIES EXCHANGE ACT OF 1934
For the transition period from
_____
to
_____
Commission file number 001-32327
______________________________
The Mosaic Company
(Exact name of registrant as specified in its charter)
______________________________
|
Delaware
|
20-1026454
|
|
|
(State or other jurisdiction of
incorporation or organization)
|
(I.R.S. Employer
Identification No.)
|
|
3033 Campus Drive
Suite E490
Plymouth, Minnesota 55441
(800) 918-8270
(Address and zip code of principal executive offices and registrant’s telephone number, including area code)
______________________________
Securities registered pursuant to Section 12(b) of the Act:
|
Title of each class
|
Name of each exchange on which registered
|
|
|
Common Stock, par value $0.01 per share
|
New York Stock Exchange
|
|
______________________________
Securities registered pursuant to Section 12(g) of the Act: NONE
Indicate by check mark if the registrant is a well-known seasoned issuer, as defined in Rule 405 of the Securities Act. Yes
x
No
¨
Indicate by check mark if the registrant is not required to file reports pursuant to Section 13 or Section 15(d) of the Act. Yes
¨
No
x
Indicate by check mark whether the registrant: (1) has filed all reports required to be filed by Section 13 or 15(d) of the Securities Exchange Act of 1934 during the preceding 12 months (or for such shorter period that the registrant was required to file such reports); and (2) has been subject to such filing requirements for the past 90 days. Yes
x
No
¨
Indicate by check mark whether the registrant has submitted electronically every Interactive Data File required to be submitted pursuant to Rule 405 of Regulation S-T (§232.405 of this chapter) during the preceding 12 months (or for such shorter period that the registrant was required to submit such files). Yes
x
No
¨
Indicate by check mark if disclosure of delinquent filers pursuant to Item 405 of Regulation S-K (§229.405 of this chapter) is not contained herein, and will not be contained, to the best of registrant’s knowledge, in definitive proxy or information statements incorporated by reference in Part III of this Form 10-K or any amendment to this Form 10-K.
x
Indicate by check mark whether the registrant is a large accelerated filer, an accelerated filer, a non-accelerated filer, a smaller reporting company, or an emerging growth company. See the definitions of “large accelerated filer”, “accelerated filer”, “smaller reporting company”, and “emerging growth company” in Rule 12b-2 of the Exchange Act. (Check one): Large accelerated filer
x
Accelerated filer
¨
Non-accelerated filer
¨
Smaller reporting company
¨
Emerging growth company
¨
If an emerging growth company, indicate by check mark if the registrant has elected not to use the extended transition period for complying with any new or revised financial accounting standards provided pursuant to Section 13(a) of the Exchange Act.
¨
Indicate by check mark whether the registrant is a shell company (as defined in Rule 12b-2 of the Exchange Act). Yes
¨
No
x
As of June 30,
2018
, the aggregate market value of the registrant’s voting common stock held by stockholders, other than directors, executive officers, subsidiaries of the Registrant and any other person known by the Registrant as of the date hereof to beneficially own ten percent or more of any class of Registrant’s outstanding voting common stock, and consisting of shares of Common Stock, was approximately
$10.9 billion
based upon the closing price of a share of Common Stock on the New York Stock Exchange on that date.
Indicate the number of shares outstanding of each of the registrant’s classes of common stock:
385,470,499
shares of Common Stock as of
March 1, 2019
.
DOCUMENTS INCORPORATED BY REFERENCE
|
1.
|
Portions of the registrant’s definitive proxy statement to be delivered in conjunction with the
2019
Annual Meeting of Stockholders (Part III)
|
2018
FORM 10-K CONTENTS
|
Part I:
|
|
Page
|
|
Item 1.
|
||
|
•
Overview
|
||
|
Item 1A.
|
||
|
Item 1B.
|
||
|
Item 2.
|
||
|
Item 3.
|
||
|
Item 4.
|
||
|
Part II:
|
||
|
Item 5.
|
||
|
Item 6.
|
||
|
Item 7.
|
||
|
Item 7A.
|
||
|
Item 8.
|
||
|
Item 9.
|
||
|
Item 9A.
|
||
|
Item 9B.
|
||
|
Part III:
|
||
|
Item 10.
|
||
|
Item 11.
|
||
|
Item 12.
|
||
|
Item 13.
|
||
|
Item 14.
|
||
|
Part IV.
|
||
|
Item 15.
|
||
|
Item 16.
|
||
PART I.
Item 1. Business.
OVERVIEW
The Mosaic Company is the world’s leading producer and marketer of concentrated phosphate and potash crop nutrients. Through our broad product offering, we are a single source supplier of phosphate- and potash-based crop nutrients and animal feed ingredients. We serve customers in approximately 40 countries. We are the largest integrated phosphate producer in the world and one of the largest producers and marketers of phosphate-based animal feed ingredients in North America and Brazil. Following our January 8, 2018 acquisition (the “
Acquisition
”) of the global phosphate and potash operations of Vale S.A. conducted through Mosaic Fertilizantes P&K S.A. (formerly Vale Fertilizantes S.A.), we are the leading fertilizer production and distribution company in Brazil. We mine phosphate rock in Florida and Brazil. We process rock into finished phosphate products at facilities in Florida, Louisiana and Brazil. Upon completion of the Acquisition, we became the majority owner of an entity operating a phosphate rock mine in the Bayovar region in Peru, in which we previously held a minority equity interest. We are one of the four largest potash producers in the world. We mine potash in Saskatchewan, New Mexico and Brazil. We have other production, blending or distribution operations in Brazil, China, India and Paraguay, as well as a strategic equity investment in a joint venture that operates a phosphate rock mine and chemical complexes in the Kingdom of Saudi Arabia. Our distribution operations serve the top four nutrient-consuming countries in the world: China, India, the United States and Brazil.
The Mosaic Company is a Delaware corporation that was incorporated in March 2004 and serves as the parent company of the business that was formed through the October 2004 combination of IMC Global Inc. and the fertilizer businesses of Cargill, Incorporated. We are publicly traded on the New York Stock Exchange under the ticker symbol “MOS” and are headquartered in Plymouth, Minnesota. We will be relocating our headquarters to Tampa, Florida in 2019.
To reflect the fact that our Brazilian business is no longer strictly a distribution business, as well as the significance of our investment in Brazil, we realigned our business segments effective as of January 1, 2018 (the “
Realignment
”). The new segment is called Mosaic Fertilizantes and includes the operations of Brazil and Paraguay. The results of the Miski Mayo Mine are consolidated in our Phosphates segment. The results of our existing China and India distribution businesses, which were previously reported in our International Distribution segment, were moved into the Corporate, Eliminations and Other category. These changes were effective during the first quarter of 2018 as this is how our chief operating decision maker began viewing and evaluating our operations. The Corporate, Eliminations, and Other category now includes the results of the China and India distribution businesses, intersegment eliminations, including profit on intersegment sales, unrealized mark-to-market gains and losses on derivatives, debt expenses and Streamsong Resort
®
results of operations.
We conduct our business through wholly and majority-owned subsidiaries as well as businesses in which we own less than a majority or a non-controlling interest. After the Realignment, we are organized into three reportable business segments: Phosphates, Potash and Mosaic Fertilizantes. The following charts show the respective contributions to
2018
sales volumes, net sales and operating earnings for each of our business segments in effect at December 31, 2018:
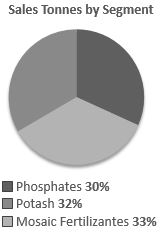
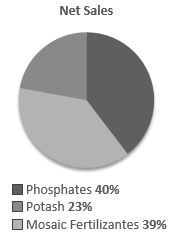
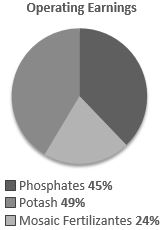
1
We account for approximately 14% of estimated global annual phosphate production. We also account for approximately 13% of estimated global annual potash production.
Phosphates Segment
— We sell phosphate-based crop nutrients and animal feed ingredients throughout North America and internationally. We account for approximately 73% of estimated North American annual production of concentrated phosphate crop nutrients.
Potash Segment —
We sell potash throughout North America and internationally, principally as fertilizer, but also for use in industrial applications and, to a lesser degree, as animal feed ingredients. We account for approximately 40% of estimated North American annual potash production.
Mosaic Fertilizantes Segment —
We produce and sell phosphate and potash-based crop nutrients, and animal feed ingredients, in Brazil. In addition to five phosphate rock mines, four chemical plants and a potash mine in Brazil, this segment consists of sales offices, crop nutrient blending and bagging facilities, port terminals and warehouses in Brazil and Paraguay. The Mosaic Fertilizantes segment also serves as a distribution outlet for our Phosphates and Potash segments. We account for approximately 77% of estimated annual production of concentrated phosphate crop nutrients in Brazil and 100% of estimated annual potash production in Brazil.
As used in this report:
|
•
|
“
Mosaic
” means The Mosaic Company;
|
|
•
|
“
we
”, “
us
”, and “
our
” refer to Mosaic and its direct and indirect subsidiaries, individually or in any combination;
|
|
•
|
“
Cargill
” means Cargill, Incorporated and its direct and indirect subsidiaries, individually or in any combination;
|
|
•
|
“
Cargill Crop Nutrition
” means the crop nutrient business we acquired from Cargill in the Combination;
|
|
•
|
“
Combination
” means the October 22, 2004 combination of IMC and Cargill Crop Nutrition; and
|
statements as to our industry position reflect information from the most recent period available.
Business Developments during
2018
We took the following steps toward achieving our strategic priorities:
|
•
|
On January 8, 2018, we completed the Acquisition of Vale Fertilizantes S.A. (now known as Mosaic Fertilizantes P&K S.A., which we also refer to as Mosaic Fertilizantes). The aggregate consideration paid by Mosaic at closing was $1.08 billion in cash (after giving effect to certain adjustments based on matters such as the working capital of the Acquired Business, which were estimated at the time of closing) and 34,176,574 shares of our Common Stock, par value $0.01 per share, which were valued at $26.92 per share at closing. The assets we acquired include five Brazilian phosphate rock mines; four chemical plants; a potash mine in Brazil; an additional 40% economic interest in the Miski Mayo Mine, which increased our aggregate interest to 75%; and a potash project in Kronau, Saskatchewan. In 2018, we realized
$158 million
of targeted savings and synergies, net of costs to achieve, related to the Acquisition, as well as an additional $21 million in benefits from our business-to-business marketing strategy. We expect to achieve our previously announced goal of $275 million by the end of 2019.
|
|
•
|
On December 1, 2018, the Ma’aden Wa’ad Al Shamal Phosphate Company (“
MWSPC
”), our joint venture with Saudi Arabian Mining Company (“
Ma’aden
”) and Saudi Basic Industries Corporation (“
SABIC
”) that owns and operates integrated phosphate production facilities in the Kingdom of Saudi Arabia, commenced commercial operations of the DAP plant, thereby bringing the entire project to the commercial production phase. We expect DAP production to gradually ramp-up until it reaches 3.0 million tonnes in annual production capacity. In 2018, MWSPC produced 1.4 million tonnes of phosphate products. Our cash investment at December 31, 2018 and as of the date of this report, is approximately
$770 million
. We did not make any contributions in 2018 and do not expect future contributions will be needed. However, we are contractually obligated to make future cash contributions of approximately $70 million, if needed.
|
|
•
|
During 2018, we prepaid
$684 million
against our term loan and paid off
$89 million
in maturing bonds bringing our total repayments of long-term debt, including other long-term debt, in 2018 to over $800 million.
|
|
•
|
We had record sales volumes of 2.9 million tonnes of MicroEssentials
®
in 2018.
|
2
|
•
|
We continued the expansion of capacity in our Potash segment with the K3 shafts at our Esterhazy mine, which began to mine a limited amount of potash ore in 2017. Following ramp-up, we expect this expansion to add an estimated 0.9 million tonnes to our existing potash operational capacity in Saskatchewan. Once completed, we expect this will provide us with the opportunity to eliminate future brine inflow management costs and risk by 2024.
|
|
•
|
In December, we received the final permit to mine the Ona phosphate reserves, which will extend our Florida phosphate mining for decades.
|
|
•
|
We continue to focus on optimizing our asset portfolio. On August 31, 2018, we temporarily idled our South Pasture, Florida beneficiation plant for an indefinite period of time.
|
We have included additional information about these and other developments in our business during
2018
in our Management’s Discussion and Analysis of Financial Condition and Results of Operations (“
Management’s Analysis
”) and in the Notes to our Consolidated Financial Statements.
BUSINESS SEGMENT INFORMATION
The discussion below of our business segment operations should be read in conjunction with the following information that we have included in this report:
|
•
|
The risk factors discussed in this report in Part I, Item 1A, “Risk Factors.”
|
|
•
|
Our Management’s Analysis.
|
|
•
|
The financial statements and supplementary financial information in our Consolidated Financial Statements (“
Consolidated Financial Statements
”).
|
This information is incorporated by reference in this report in Part II, Item 8, “Financial Statements and Supplementary Data.”
Phosphates Segment
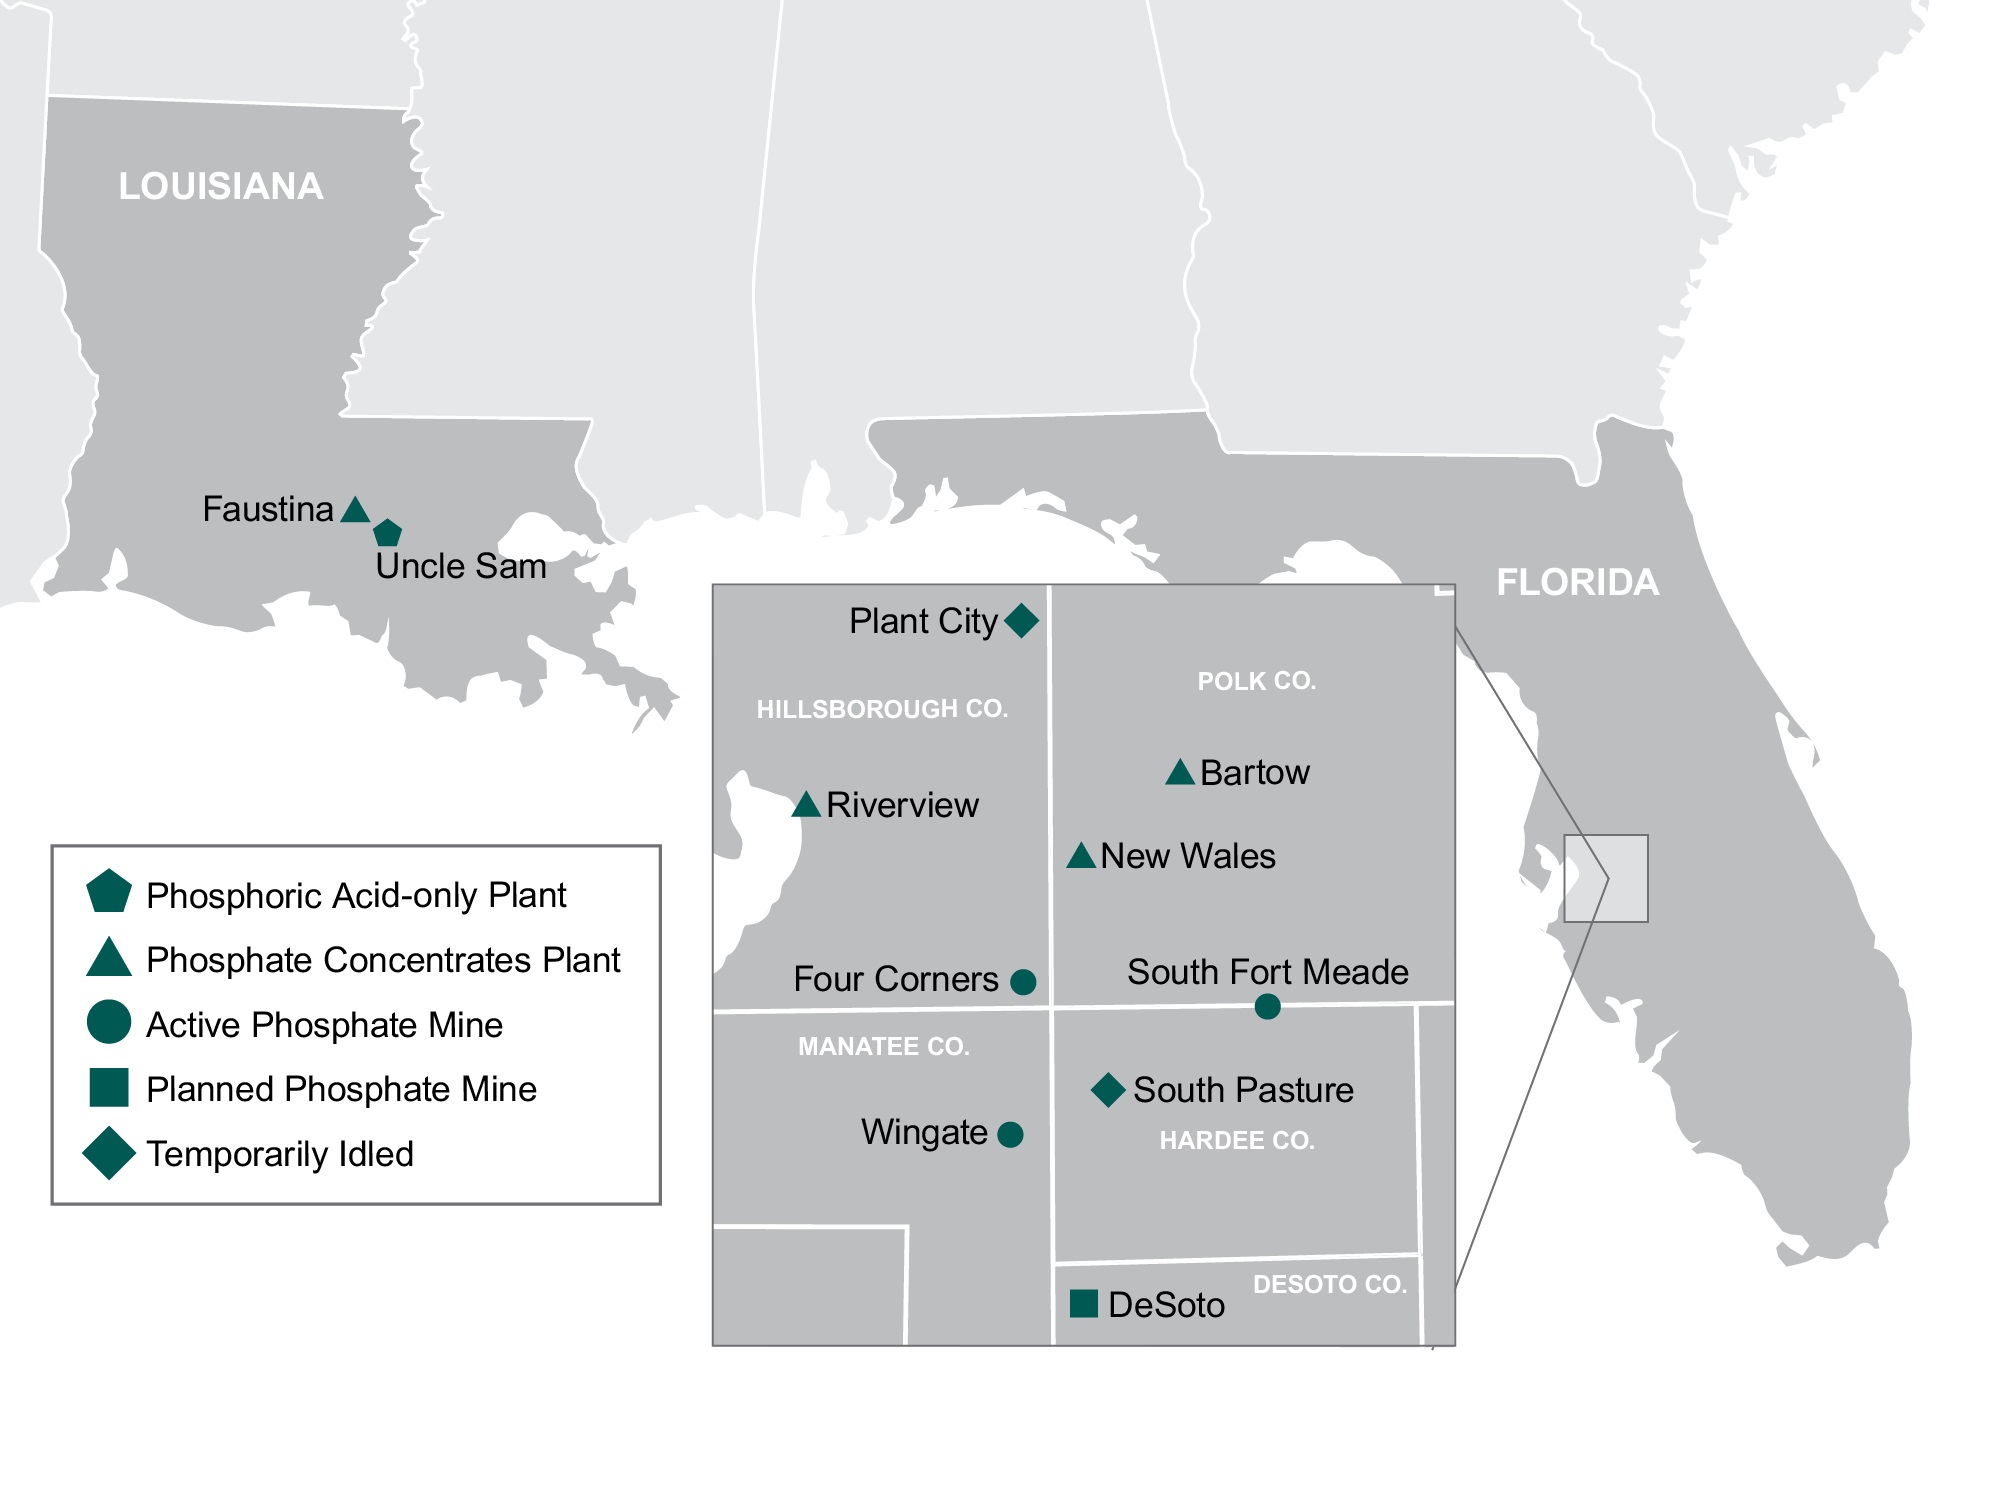
Our Phosphates business segment owns and operates mines and production facilities in Florida which produce concentrated phosphate crop nutrients and phosphate-based animal feed ingredients, and processing plants in Louisiana which produce concentrated phosphate crop nutrients. As part of the Acquisition, we acquired an additional 40% economic interest in the Miski Mayo Phosphate Mine in Peru, which increased our aggregate interest to 75%. The results of the Miski Mayo Mine are now included in our Phosphates segment.
The following map shows the locations of each of our phosphate concentrates plants in the United States and the locations of each of our active, temporarily idled, and planned phosphate mines in Florida. The reserves associated with our Ona location have been allocated to other active mines based on our future mining plans:
3
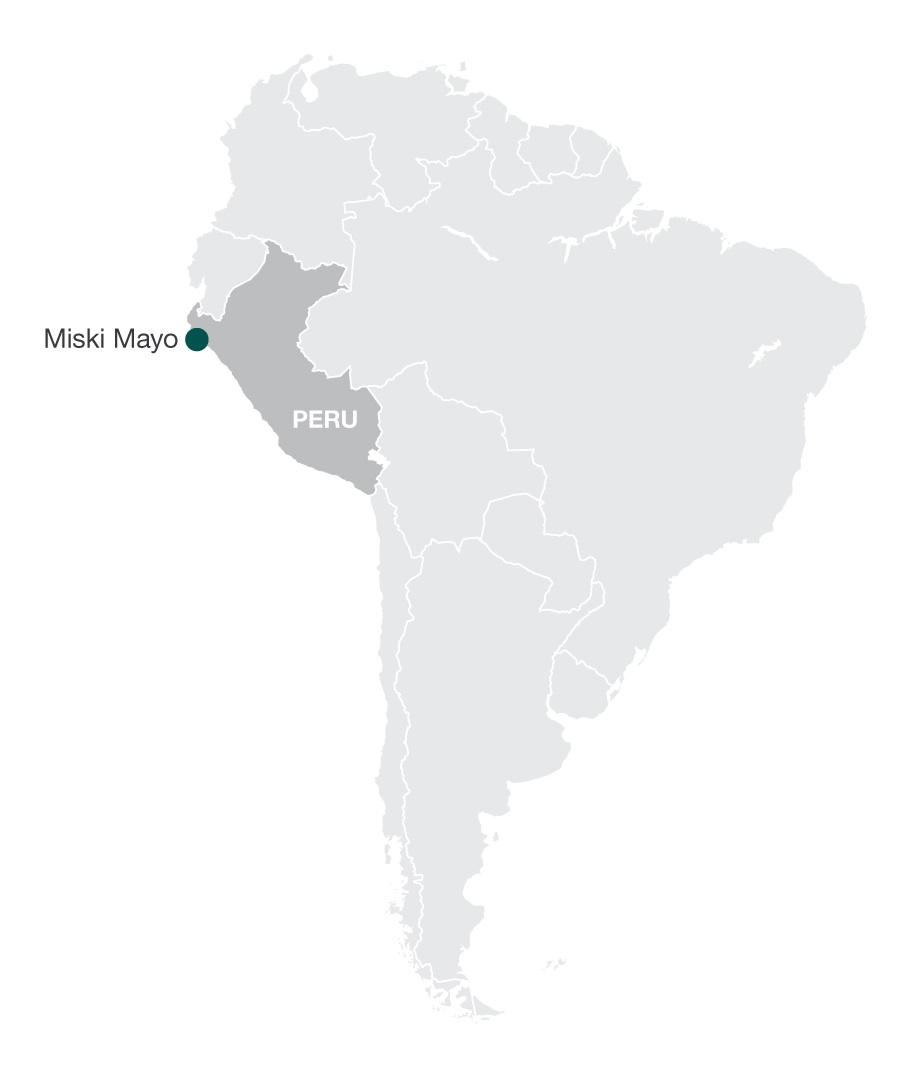
The following map shows the location of the Miski Mayo phosphate mine in Peru:
4
U.S. Phosphate Crop Nutrients and Animal Feed Ingredients
Our U.S. phosphates operations have capacity to produce approximately
5.3 million
tonnes of phosphoric acid (“
P
2
O
5
”) per year, or about 7% of world annual capacity and about 55% of North American annual capacity. Phosphoric acid is produced by reacting finely ground phosphate rock with sulfuric acid. Phosphoric acid is the key building block for the production of high analysis or concentrated phosphate crop nutrients and animal feed products, and is the most comprehensive measure of phosphate capacity and production and a commonly used benchmark in our industry. Our U.S. phosphoric acid production totaled approximately
3.9 million
tonnes during
2018
. Our U.S. operations account for approximately 9% of estimated global annual production and 56% of estimated North American annual output.
Our phosphate crop nutrient products are marketed worldwide to crop nutrient manufacturers, distributors, retailers and farmers. Our principal phosphate crop nutrient products are:
|
•
|
Diammonium Phosphate (18-46-0)
Diammonium Phosphate (“
DAP
”) is the most widely used high-analysis phosphate crop nutrient worldwide. DAP is produced by first combining phosphoric acid with anhydrous ammonia in a reaction vessel. This initial reaction creates a slurry that is then pumped into a granulation plant where it is reacted with additional ammonia to produce DAP. DAP is a solid granular product that is applied directly or blended with other solid plant nutrient products such as urea and potash.
|
|
•
|
Monoammonium Phosphate (11-52-0)
Monoammonium Phosphate (“
MAP
”) is the second most widely used high-analysis phosphate crop nutrient and the fastest growing phosphate product worldwide. MAP is also produced by first combining phosphoric acid with anhydrous ammonia in a reaction vessel. The resulting slurry is then pumped into the granulation plant where it is reacted with additional phosphoric acid to produce MAP. MAP is a solid granular product that is applied directly or blended with other solid plant nutrient products.
|
|
•
|
MicroEssentials
®
is a value-added ammoniated phosphate product that is enhanced through a patented process that creates very thin platelets of sulfur and other micronutrients, such as zinc, on the granulated product. The patented process incorporates both the sulfate and elemental forms of sulfur, providing season-long availability to crops.
|
5
Production of our animal feed ingredients products is located at our New Wales, Florida facility. We market our feed phosphate primarily under the leading brand names of Biofos
®
and Nexfos
®
.
Annual capacity by plant as of
December 31, 2018
and production volumes by plant for
2018
are listed below:
|
(tonnes in millions)
|
Phosphoric Acid
|
Processed Phosphate
(a)
/DAP/MAP/ MicroEssentials
®
/Feed Phosphate
|
||||||||||
|
|
Operational Capacity
(b)
|
Operational Capacity
(b)
|
||||||||||
|
Facility
|
Production
(c)
|
Production
(c)
|
||||||||||
|
Florida:
|
||||||||||||
|
Bartow
|
0.9
|
|
1.0
|
|
2.3
|
|
2.3
|
|
||||
|
New Wales
|
1.7
|
|
1.5
|
|
4.1
|
|
3.2
|
|
||||
|
Riverview
|
0.9
|
|
0.8
|
|
1.7
|
|
1.6
|
|
||||
|
Plant City
(d)
|
1.0
|
|
—
|
|
2.0
|
|
—
|
|
||||
|
4.5
|
|
3.3
|
|
10.1
|
|
7.1
|
|
|||||
|
Louisiana:
|
||||||||||||
|
Faustina
|
—
|
|
—
|
|
1.6
|
|
1.3
|
|
||||
|
Uncle Sam
|
0.8
|
|
0.6
|
|
—
|
|
—
|
|
||||
|
0.8
|
|
0.6
|
|
1.6
|
|
1.3
|
|
|||||
|
Total
|
5.3
|
|
3.9
|
|
11.7
|
|
8.4
|
|
||||
______________________________
|
(a)
|
Our ability to produce processed phosphates has been less than our annual operational capacity stated in the table above, except to the extent we purchase phosphoric acid. Factors affecting actual production are described in note (c) below.
|
|
(b)
|
Operational capacity is our estimated long-term capacity based on an average amount of scheduled down time, including maintenance and scheduled turnaround time, and product mix, and no significant modifications to operating conditions, equipment or facilities.
|
|
(c)
|
Actual production varies from annual operational capacity shown in the above table due to factors that include among others the level of demand for our products, maintenance and turnaround time, accidents, mechanical failure, product mix, and other operating conditions.
|
|
(d)
|
On December 10, 2017, we temporarily idled our Plant City, Florida phosphate manufacturing facility.
|
The phosphoric acid produced at Uncle Sam is shipped to Faustina, where it is used to produce DAP, MAP and MicroEssentials
®
. Our Faustina plant also manufactures ammonia that is mostly consumed in our concentrate plants.
We produced approximately 7.9 million tonnes of concentrated phosphate crop nutrients during
2018
and accounted for approximately 73% of estimated North American annual production.
Phosphate Rock
Phosphate rock is the key mineral used to produce phosphate crop nutrients and feed phosphate. Our Florida phosphate rock mines produced approximately
14.2 million
tonnes in
2018
and accounted for approximately 85% of estimated North American annual production. We are the world’s second largest miner of phosphate rock (excluding China) and currently operate four mines in North America with a combined annual capacity of approximately
17.2 million
tonnes. Additionally, we own 75% of the Miski Mayo Mine in Peru which has an annual capacity of
4.0 million
tonnes. Production of one tonne of DAP requires between 1.6 and 1.7 tonnes of phosphate rock.
All of our wholly owned phosphate mines and related mining operations in North America are located in central Florida. During
2018
, we operated four active mines in Florida: Four Corners, South Fort Meade, Wingate and South Pasture. On August 31, 2018, we temporarily idled our South Pasture, Florida phosphates mine. We plan to develop Ona and DeSoto reserves to replace reserves that will be depleted at various times during the next decade. As part of the Acquisition, we acquired an additional 40% economic interest in the Miski Mayo Mine in Peru, which increased our aggregate interest to 75%. Our investment in the Miski Mayo Mine allows us to supplement our other produced rock to meet our overall fertilizer
6
production needs. Effective with the closing of the Acquisition, we have the right to use or sell to third parties 75% of Miski Mayo's annual production.
The phosphate deposits of Florida are of sedimentary origin and are part of a phosphate-bearing province that extends from southern Florida north along the Atlantic coast into southern Virginia. Our active Florida phosphate mines are primarily located in what is known as the Bone Valley Member of the Peace River Formation in the Central Florida Phosphate District. The southern portions of the Four Corners and Wingate mines are in what is referred to as the Undifferentiated Peace River Formation, in which the Ona and DeSoto reserves we plan to develop are also located. Phosphate mining has been conducted in the Central Florida Phosphate District since the late 1800’s. The potentially mineable portion of the district encompasses an area approximately 80 miles in length in a north-south direction and approximately 40 miles in width.
In Florida, we extract phosphate ore using large surface mining machines that we own called “draglines.” Prior to extracting the ore, the draglines must first remove a 10 to 50 foot layer of sandy overburden. At our Wingate mine, we also utilize dredges to remove the overburden and mine the ore. We then process the ore at beneficiation plants that we own at each active mine where the ore goes through washing, screening, sizing and flotation processes designed to separate the phosphate rock from sands, clays and other foreign materials
.
Prior to commencing operations at any of our planned future mines, we may need to acquire new draglines or move existing draglines to the mines and, unless the beneficiation plant at an existing mine were used, construct a beneficiation plant.
The phosphates deposits of Peru are located within the shallow north-trending Sechura Basin, in the Piura region, hosting successive inter-layered marine sediments of Phosphate. We extract phosphate ore from the Miski Mayo mine using excavators. The ore is then transported by truck to the feeding platform for supply of the feeder-breakers, which feeds the conveyor belt for the beneficiation plant that we own. The ore is then processed with successive stages of washing and gravimetric separations of seawater. The final stage of the process is washing with desalinated water to remove salts from the concentrate. The concentrate is then shipped to North America for use in our own production or sold to third parties.
The following table shows, for each of our phosphate mines, annual capacity as of
December 31, 2018
and rock production volume and grade for the years
2018
,
2017
, and 2016:
|
(tonnes in
millions)
|
Annual
Operational
Capacity
(a)(b)
|
2018
|
2017
|
2016
|
|||||||||||||||||||||||||
|
Facility
|
Production
(b)
|
Average
BPL
(c)
|
% P2O5
(d)
|
Production
(b)
|
Average
BPL
(c)
|
%
P2O5
(d)
|
Production
(b)
|
Average
BPL
(c)
|
%
P2O5
(d)
|
||||||||||||||||||||
|
Four Corners
(f)
|
7.0
|
|
6.9
|
|
62.2
|
|
28.5
|
|
6.4
|
|
62.4
|
|
28.5
|
|
5.3
|
|
63.2
|
|
28.9
|
|
|||||||||
|
South Fort Meade
|
5.5
|
|
4.2
|
|
63.1
|
|
28.9
|
|
4.4
|
|
63.6
|
|
29.1
|
|
4.2
|
|
63.0
|
|
28.8
|
|
|||||||||
|
South Pasture
(e)
|
3.2
|
|
1.5
|
|
62.5
|
|
28.6
|
|
2.8
|
|
62.6
|
|
28.6
|
|
3.4
|
|
62.5
|
|
28.6
|
|
|||||||||
|
Wingate
|
1.5
|
|
1.6
|
|
61.3
|
|
28.1
|
|
1.4
|
|
62.5
|
|
28.6
|
|
1.3
|
|
63.1
|
|
28.9
|
|
|||||||||
|
North America
|
17.2
|
|
14.2
|
|
62.4
|
|
28.6
|
|
15.0
|
|
62.8
|
|
28.7
|
|
14.2
|
|
63.0
|
|
28.8
|
|
|||||||||
|
Miski Mayo
(g) (h)
|
4.0
|
|
4.1
|
|
64.9
|
|
29.7
|
|
—
|
|
—
|
|
—
|
|
—
|
|
—
|
|
—
|
|
|||||||||
|
Total
|
21.2
|
|
18.3
|
|
62.9
|
|
28.8
|
|
15.0
|
|
62.8
|
|
28.7
|
|
14.2
|
|
63.0
|
|
28.8
|
|
|||||||||
______________________________
|
(a)
|
Annual operational capacity is the expected average long-term annual capacity considering constraints represented by the grade, quality and quantity of the reserves being mined as well as equipment performance and other operational factors.
|
|
(b)
|
Actual production varies from annual operational capacity shown in the above table due to factors that include among others the level of demand for our products, the quality of the reserves, the nature of the geologic formations we are mining at any particular time, maintenance and turnaround time, accidents, mechanical failure, weather conditions, and other operating conditions, as well as the effect of recent initiatives intended to improve operational excellence.
|
|
(c)
|
Bone Phosphate of Lime (“
BPL
”) is a traditional reference to the amount (by weight percentage) of calcium phosphate contained in phosphate rock or a phosphate ore body. A higher BPL corresponds to a higher percentage of calcium phosphate.
|
7
|
(d)
|
The percent of P
2
O
5
in the above table represents a measure of the phosphate content in phosphate rock or a phosphate ore body. A higher percentage corresponds to a higher percentage of phosphate content in phosphate rock or a phosphate ore body.
|
|
(e)
|
On August 31, 2018, we temporarily idled our South Pasture, Florida beneficiation plant for an indefinite period of time.
|
|
(f)
|
Production at the Four Corners mine includes rock mined at the South Pasture Extension Mine in Hardee County from September 2018 to December 2018.
|
|
(g)
|
With the closing of the Acquisition on January 8, 2018, we acquired an additional 40% economic interest in the Miski Mayo phosphate rock mine in the Bayovar region of Peru, bringing our aggregate interest to 75% in 2018. Their results are included in the Phosphates segment from the date of the Acquisition.
|
|
(h)
|
Annual operational capacity and production tonnes for Miski Mayo are presented on a wet tonne basis based on average moisture levels of 3.5% to 4.5% as it exits the drying process and is prepared for shipping. Operational capacity and production on a dry tonne basis would be 3.8 million tonnes and 3.9 million tonnes respectively.
|
Reserves
We estimate our phosphate rock reserves based upon exploration core drilling as well as technical and economic analyses to determine that reserves can be economically mined. Proven (measured) reserves are those resources of sufficient concentration to meet minimum physical, chemical and economic criteria related to our current product standards and mining and production practices. Our estimates of probable (indicated) reserves are based on information similar to that used for proven reserves, but sites for drilling are farther apart or are otherwise less adequately spaced than for proven reserves, although the degree of assurance is high enough to assume continuity between such sites. Proven reserves are determined using a minimum drill hole spacing in two locations per 40 acre block. Probable reserves have less than two drill holes per 40 acre block, but geological data provides a high degree of assurance that continuity exists between sites.
The following table sets forth our proven and probable phosphate reserves as of
December 31, 2018
:
|
(tonnes in millions)
|
Reserve Tonnes
(a)(b)(c)
|
|
Average
BPL
(d)
|
%
P
2
O
5
|
||||
|
Active Mines
|
||||||||
|
Four Corners
(f)
|
84.4
|
|
64.3
|
|
29.4
|
|
||
|
South Fort Meade
|
14.0
|
|
62.4
|
|
28.5
|
|
||
|
Wingate
|
28.7
|
|
63.0
|
|
28.9
|
|
||
|
Miski Mayo
(g)
|
93.8
|
|
65.7
|
|
30.1
|
|
||
|
Total Active Mines
|
220.9
|
|
64.6
|
|
29.6
|
|
||
|
Temporarily Idled
|
||||||||
|
South Pasture
|
138.2
|
|
63.1
|
|
28.9
|
|
||
|
Planned Mining
|
||||||||
|
East Ona
(h)
|
110.9
|
|
65.1
|
|
29.8
|
|
||
|
DeSoto
|
150.9
|
|
(e)
|
64.1
|
|
29.3
|
|
|
|
Total Planned Mining
|
261.8
|
|
64.5
|
|
29.5
|
|
||
|
Total Mining
|
620.9
|
|
64.3
|
|
29.4
|
|
||
______________________________
|
(a)
|
Reserves are in areas that are fully accessible for mining; free of surface or subsurface encumbrance, legal setbacks, wetland preserves and other legal restrictions that preclude permittable access for mining; believed by us to be permittable; and meet specified minimum physical, economic and chemical criteria related to current mining and production practices.
|
|
(b)
|
Reserve estimates are generally established by our personnel without a third party review. There has been no third party review of reserve estimates within the last five years. The reserve estimates have been prepared in accordance with the standards set forth in Industry Guide 7 promulgated by the United States Securities and Exchange Commission (“
SEC
”).
|
|
(c)
|
Of the reserves shown,
494.8 million
tonnes are proven reserves, while probable reserves totaled
32.3 million
tonnes.
|
|
(d)
|
Average product BPL ranges from approximately 62% to 66%.
|
|
(e)
|
In connection with the purchase in 1996 of approximately 111.1 million tonnes of the reported DeSoto reserves, we agreed to (i) pay royalties of between $0.50 and $0.90 per ton of rock mined based on future levels of DAP margins, and
|
8
(ii) pay to the seller lost income from the loss of surface use to the extent we use the property for mining related purposes before January 1, 2020.
|
(f)
|
The Four Corners reserves include the Ona West reserve tonnes.
|
|
(g)
|
We pay royalties to the government of Peru based on a percentage of net sales and final determined price. These royalty payments average approximately $6 million annually.
|
|
(h)
|
The Ona reserves are expected to be mined through our South Pasture and Four Corners mine locations.
|
We generally own the reserves shown for active mines in the table above, with the only significant exceptions being further described below:
|
•
|
We own the above-ground assets of the South Fort Meade mine, including the beneficiation plant, rail track and the initial clay settling areas. A limited partnership, South Ft. Meade Partnership, L.P. (“
SFMP
”), owns the majority of the mineable acres shown in the table for the South Fort Meade mine.
|
|
•
|
We currently have a 95% economic interest in the profits and losses of SFMP. SFMP is included as a consolidated subsidiary in our financial statements.
|
|
•
|
We have a long-term mineral lease with SFMP. This lease expires on the earlier of December 31, 2025 or on the date that we have completed mining and reclamation obligations associated with the leased property. Lease provisions include royalty payments and a commitment to give mining priority to the South Fort Meade phosphate reserves. We pay the partnership a royalty on each BPL short ton mined and shipped from the areas that we lease from it. Royalty payments to SFMP normally average approximately $12 million annually.
|
|
•
|
Through its arrangements with us, SFMP also earns income from mineral lease payments, agricultural lease payments and interest income, and uses those proceeds primarily to pay dividends to its equity owners.
|
|
•
|
The surface rights to approximately 942 acres for the South Fort Meade Mine are owned by SFMP, while the U.S. government owns the mineral rights beneath. We control the rights to mine these reserves under a mining lease agreement and pay royalties on the tonnage extracted. Under the lease, we paid an immaterial amount of royalties to the U.S. Government in
2018
.
|
In light of the long-term nature of our rights to our reserves, we expect to be able to mine all reported reserves that are not currently owned prior to termination or expiration of our rights. Additional information regarding permitting is included in Part I, Item 1A, “Risk Factors”, and under “Environmental, Health, Safety and Security Matters—Operating Requirements and Impacts—Permitting” in our Management’s Analysis.
Investments in MWSPC
We own a 25% interest in MWSPC and, in connection with our equity share, we are entitled to market approximately 25% of MWSPC’s production. MWSPC consists of a mine and two chemical complexes (the “
Project
”) that produce phosphate fertilizers and other downstream phosphates products in the Kingdom of Saudi Arabia. The greenfield project was built in the northern region of Saudi Arabia at Wa’ad Al Shamal Minerals Industrial City, and includes further expansion of processing plants in Ras Al Khair Minerals Industrial City, which is located on the east coast of Saudi Arabia. Ammonia operations commenced in late 2016 and, on December 1, 2018, MWSPC commenced commercial operations of the DAP plant, thereby bringing the entire project to the commercial production phase. DAP production will gradually ramp-up until it reaches an expected 3.0 million tonnes in annual production capacity. The Project is expected to benefit from the availability of key raw nutrients from sources within Saudi Arabia.
We currently estimate that the total cost to develop and construct the integrated phosphate production facilities will approximate
$8.0 billion
, which we expect to be funded primarily through investments by us, Ma’aden and SABIC, and through borrowing arrangements and other external project financing facilities (“
Funding Facilities
”). Our cash investment in the Project at
December 31, 2018
was approximately
$770 million
. We did not make any contributions in 2018 and do not expect future contributions will be needed. However, we are contractually obligated to make future cash contributions of approximately $70 million, if needed.
Sulfur
We use molten sulfur at our phosphates concentrates plants to produce sulfuric acid primarily for use in our production of phosphoric acid. We purchased approximately 4.2 million long tons of sulfur during
2018
. We purchase the majority of this sulfur from North American oil and natural gas refiners who are required to remove or recover sulfur during the refining
9
process. Production of one tonne of DAP requires approximately 0.40 long tons of sulfur. We procure our sulfur from multiple sources and receive it by truck, rail, barge and vessel, either directly at our phosphate plants or have it sent for gathering to terminals that are located on the U.S. gulf coast. In addition, we use formed sulfur received through Tampa ports, which are delivered by truck to our New Wales facility and melted through our sulfur melter.
We own and operate sulfur terminals in Houston, Texas and Riverview, Florida. We also lease terminal space in Tampa, Florida and Galveston and Beaumont, Texas. We have long-term time charters on two ocean-going tugs/barges and one ocean-going vessel that transports molten sulfur from the Texas terminals to Tampa and then onward by truck to our Florida phosphate plants. In addition, we own a 50% equity interest in Gulf Sulphur Services Ltd., LLLP (“
Gulf Sulphur Services
”), which is operated by our joint venture partner. Gulf Sulphur Services has a sulfur transportation and terminaling business in the Gulf of Mexico, and handles these functions for a substantial portion of our Florida sulfur volume. Our sulfur logistic assets also include a large fleet of leased railcars that supplement our marine sulfur logistic system. Our Louisiana operations are served by truck from nearby refineries.
Although sulfur is readily available from many different suppliers and can be transported to our phosphate facilities by a variety of means, sulfur is an important raw material used in our business that has in the past been and may in the future be the subject of volatile pricing and availability. Alternative transportation and terminaling facilities might not have sufficient capacity to fully serve all of our facilities in the event of a disruption to current transportation or terminaling facilities. Changes in the price of sulfur or disruptions to sulfur transportation or terminaling facilities could have a material impact on our business. We have included a discussion of sulfur prices in our Management’s Analysis.
Ammonia
We use ammonia together with phosphoric acid to produce DAP, MAP and MicroEssentials
®
. We consumed approximately 1.3 million tonnes of ammonia during
2018
. Production of one tonne of DAP requires approximately 0.23 tonnes of ammonia. We purchase approximately one-third of our ammonia from various suppliers in the spot market with the remaining two-thirds either purchased through our ammonia supply agreement (the “
CF Ammonia Supply Agreement
”) with an affiliate of CF Industries Inc. (“
CF
”) or produced internally at our Faustina, Louisiana location.
Our Florida ammonia needs are currently supplied under multi-year contracts with both domestic and offshore producers. Ammonia for our New Wales and Riverview plants is terminaled through an owned ammonia facility at Port Sutton, Florida. Ammonia for our Bartow plant is terminaled through another ammonia facility owned and operated by a third party at Port Sutton, Florida pursuant to an agreement that provides for service through 2019 with automatic renewal for an additional two-year period unless either party terminates as provided in the agreement. Ammonia is transported by pipeline from the terminals to our production facilities. We have service agreements with the operators of the pipelines for Bartow, New Wales, and Riverview, which provide service through June 30, 2019 with an annual auto-renewal provision unless either party objects.
Under the CF Ammonia Supply Agreement, Mosaic agreed to purchase approximately
545,000
to
725,000
tonnes of ammonia per year during a term that commenced in 2017 and may extend until December 31, 2032, at a price tied to the prevailing price of U.S. natural gas. For 2018, our minimum purchase obligation was approximately 520,000 tonnes, and actual purchases were 525,326 tonnes. In the second half of 2017, a specialized tug and barge unit began transporting ammonia for us between a load location at Donaldsonville, Louisiana and a discharge location at Tampa, Florida. Additional information about this chartered unit and its financing is provided in Note
23
of our Consolidated Financial Statements. We expect a majority of the ammonia purchased under the CF Ammonia Supply Agreement to be received by barge at the port of Tampa and delivered to our Florida facilities as described in the preceding paragraph. While the market prices of natural gas and ammonia have changed since we executed this agreement in 2013 and will continue to change, we expect that the agreement will provide us a competitive advantage over its term, including by providing a reliable long-term ammonia supply.
We produce ammonia at Faustina, Louisiana primarily for our own consumption. Our annual capacity is approximately 450,000 tonnes. From time to time, we sell surplus ammonia to unrelated parties and/or may transport surplus ammonia to the port of Tampa. In addition, under certain circumstances we are permitted to receive ammonia at Faustina under the CF Ammonia Supply Agreement.
Although ammonia is readily available from many different suppliers and can be transported to our phosphates facilities by a variety of means, ammonia is an important raw material used in our business that has in the past been and may in the future
10
be the subject of volatile pricing, and alternative transportation and terminaling facilities might not have sufficient capacity to fully serve all of our facilities in the event of a disruption to existing transportation or terminaling facilities. Changes in the price of ammonia or disruptions to ammonia transportation or terminaling could have a material impact on our business. We have included a discussion of ammonia prices in our Management’s Analysis.
Natural Gas for Phosphates
Natural gas is the primary raw material used to manufacture ammonia. At our Faustina facility, ammonia is manufactured on site. The majority of natural gas is purchased through firm delivery contracts based on published index-based prices and is sourced from Texas and Louisiana via pipelines interconnected to the Henry Hub. We use over-the-counter swap and/or option contracts to forward price portions of future gas purchases. We typically purchase approximately 16 million MMbtu of natural gas per year for use in ammonia production at Faustina.
Our ammonia requirements for our Florida operations are purchased rather than manufactured on site, so while we typically purchase approximately two million MMbtu of natural gas per year in Florida, it is only used as a thermal fuel for various phosphate production processes.
Florida Land Holdings
We are a significant landowner in the State of Florida, which has in the past been considered one of the fastest areas of population growth in the United States. We own land comprising over 290,000 acres held in fee simple title in central Florida, and have the right to mine additional properties which contain phosphate rock reserves. Some of our land holdings are needed to operate our Phosphates business, while a portion of our land assets, such as certain reclaimed properties, are no longer required for our ongoing operations. As a general matter, more of our reclaimed property becomes available for uses other than for phosphate operations each year. Our real property assets are generally comprised of concentrates plants, port facilities, phosphate mines and other property which we have acquired through our presence in Florida. Our long-term future land use strategy is to optimize the value of our land assets. For example, we developed Streamsong Resort
®
(the “
Resort
”), a destination resort and conference center, in an area of previously mined land as part of our long-term business strategy to maximize the value and utility of our extensive land holdings in Florida. In addition to the two golf courses and clubhouse that were opened in December 2012, the Resort and conference center opened in January 2014. In 2015, in response to market demand, we began construction of a third golf course and ancillary facilities, which were completed and opened in 2017.
Potash Segment
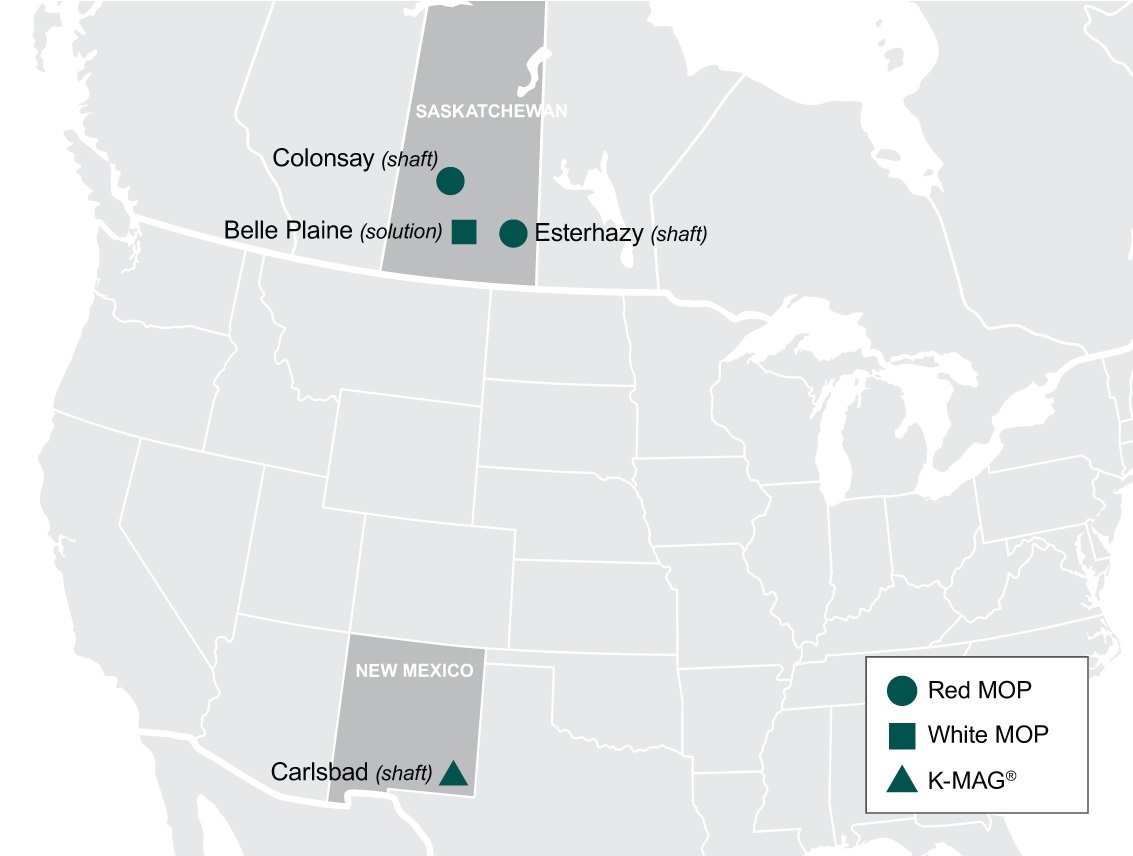
We are one of the leading potash producers in the world. We mine and process potash in Canada and the United States and sell potash in North America and internationally. The term “potash” applies generally to the common salts of potassium. Muriate of potash (“
MOP
”) is the primary source of potassium for the crop nutrient industry. Red MOP has traces of iron oxide. The granular and standard grade Red MOP products are well suited for direct fertilizer application and bulk blending. White MOP has a higher percent potassium oxide (“
K
2
O
”). White MOP, besides being well suited for the agricultural market, is used in many industrial applications. We also produce a double sulfate of potash magnesia product, which we market under our brand name K-Mag
®
, at our Carlsbad, New Mexico facility.
Our potash products are marketed worldwide to crop nutrient manufacturers, distributors and retailers and are also used in the manufacturing of mixed crop nutrients and, to a lesser extent, in animal feed ingredients. We also sell potash to customers for industrial use. In addition, our potash products are used for de-icing and as a water softener regenerant.
In
2018
, we operated three potash mines in Canada, including two shaft mines with a total of three production shafts and one solution mine, as well as one potash shaft mine in the United States. We also own related mills or refineries at each of the mines. Also, as part of the Acquisition, we acquired a potash project in Kronau, Saskatchewan.
We continue the expansion of capacity in our Potash segment with the K3 shafts at our Esterhazy mine. Following ramp-up, these shafts are expected to add an estimated 0.9 million tonnes to our annual potash operational capacity. This will provide an infrastructure to move ore from K3 to the K1 and K2 mills. In December 2018, the production hoist for K3 was commissioned. As K3 production ramps up, we plan to cease underground mining at K1 in 2021 and at K2 in late 2023, which thereafter would eliminate our brine inflow costs at such mine shafts.
11
It is possible that the costs of inflow remedial efforts at Esterhazy may increase in the future, before the shutdown of K1 and K2 mining, and that such an increase could be material, or, in the extreme scenario, that the brine inflows, risk to employees or remediation costs may increase to a level which would cause us to change our mining processes or abandon the mines. See “Key Factors that can Affect Results of Operations and Financial Condition” and “Potash Net Sales and Gross Margin” in our Management’s Analysis and “Our Esterhazy mine has had an inflow of salt saturated brine for more than 30 years” in Part I, Item 1A, “Risk Factors” in this report, which are incorporated herein by reference, for a discussion of costs, risks and other information relating to the brine inflows.
The map below shows the location of each of our potash mines.
Our North American potash annualized operational capacity totals
10.5 million
tonnes of product per year and accounts for approximately 12% of world annual capacity and 36% of North American annual capacity. Production during
2018
totaled
9.2 million
tonnes. We account for approximately 13% of estimated world annual production and 40% of estimated North American annual production.
12
The following table shows, for each of our potash mines, annual capacity as of
December 31, 2018
and volume of mined ore, average grade and finished product output for years
2018
,
2017
and
2016
:
|
(tonnes in millions)
|
|
|
2018
|
2017
|
2016
|
|||||||||||||||||||||||||||
|
Facility
|
Annualized
Proven
Peaking
Capacity
(a)(c)(d)
|
Annual
Operational
Capacity
(a)(b)(d)(e)
|
Ore
Mined
|
Grade
%
K2O
(f)
|
Finished
Product
(b)
|
Ore
Mined
|
Grade
%
K2O
(f)
|
Finished
Product
(b)
|
Ore
Mined
|
Grade
%
K2O
(f)
|
Finished
Product (b) |
|||||||||||||||||||||
|
Canada
|
||||||||||||||||||||||||||||||||
|
Belle Plaine—MOP
|
3.9
|
|
3.0
|
|
10.6
|
|
18.0
|
|
2.8
|
|
10.2
|
|
18.0
|
|
2.7
|
|
9.0
|
|
18.0
|
|
2.4
|
|
||||||||||
|
Colonsay—MOP
(g) (h)
|
2.6
|
|
1.5
|
|
3.4
|
|
26.8
|
|
1.2
|
|
3.4
|
|
24.4
|
|
1.1
|
|
1.6
|
|
25.7
|
|
0.5
|
|
||||||||||
|
Esterhazy—MOP
|
6.3
|
|
5.3
|
|
13.9
|
|
23.7
|
|
4.6
|
|
13.1
|
|
24.0
|
|
4.3
|
|
12.6
|
|
24.4
|
|
4.2
|
|
||||||||||
|
Canadian Total
|
12.8
|
|
9.8
|
|
27.9
|
|
21.9
|
|
8.6
|
|
26.7
|
|
21.7
|
|
8.1
|
|
23.2
|
|
22.0
|
|
7.1
|
|
||||||||||
|
United States
|
||||||||||||||||||||||||||||||||
|
Carlsbad—K-Mag®
(i)
|
0.9
|
|
0.7
|
|
3.0
|
|
6.1
|
|
0.6
|
|
3.2
|
|
5.5
|
|
0.6
|
|
2.7
|
|
5.4
|
|
0.5
|
|
||||||||||
|
United States Total
|
0.9
|
|
0.7
|
|
3.0
|
|
6.1
|
|
0.6
|
|
3.2
|
|
5.5
|
|
0.6
|
|
2.7
|
|
5.4
|
|
0.5
|
|
||||||||||
|
Totals
|
13.7
|
|
10.5
|
|
30.9
|
|
20.4
|
|
9.2
|
|
29.9
|
|
20.0
|
|
8.7
|
|
25.9
|
|
20.3
|
|
7.6
|
|
||||||||||
______________________________
|
(a)
|
Finished product.
|
|
(b)
|
Actual production varies from annual operational capacity shown in the above table due to factors that include among others the level of demand for our products, maintenance and turnaround time, the quality of the reserves and the nature of the geologic formations we are mining at any particular time, accidents, mechanical failure, product mix, and other operating conditions.
|
|
(c)
|
Represents full capacity assuming no turnaround or maintenance time.
|
|
(d)
|
The annualized proven peaking capacity shown above is the capacity currently used to determine our share of Canpotex, Limited (“
Canpotex
”) sales. Canpotex members’ respective shares of Canpotex sales are based upon the members’ respective proven peaking capacities for producing potash. When a Canpotex member expands its production capacity, the new capacity is added to that member’s proven peaking capacity based on a proving run at the maximum production level. Alternatively, after January 2017, Canpotex members may elect to rely on an independent engineering firm and approved protocols to calculate their proven peaking capacity. The annual operational capacity reported in the table above can exceed the annualized proven peaking capacity until the proving run has been completed. Our share of Canpotex was 38.1% in 2016 through July 1, 2017, when it decreased to 36.2%. It has remained at that level through December 31, 2018.
|
|
(e)
|
Annual operational capacity is our estimated long term potash capacity based on the quality of reserves and the nature of the geologic formations expected to be mined, milled and/or processed over the long term, average amount of scheduled down time, including maintenance and scheduled turnaround time, and product mix, and no significant modifications to operating conditions, equipment or facilities. Operational capacities will continue to be updated to the extent new production results impact ore grades assumptions.
|
|
(f)
|
Grade % K
2
O is a traditional reference to the percentage (by weight) of potassium oxide contained in the ore. A higher percentage corresponds to a higher percentage of potassium oxide in the ore.
|
|
(g)
|
In July 2016, we temporarily idled our Colonsay, Saskatchewan potash mine for the remainder of 2016 in light of reduced customer demand while adapting to challenging potash market conditions. We resumed production in January 2017.
|
|
(h)
|
We have the ability to reach an annual operating capacity of 2.1 million tonnes over time by increasing our staffing levels and investment in mine development activities.
|
|
(i)
|
K-Mag
®
is a specialty product that we produce at our Carlsbad facility.
|
Canadian Mines
We operate three Canadian potash facilities all located in the southern half of the Province of Saskatchewan, including our solution mine at Belle Plaine, two interconnected mine shafts at our Esterhazy shaft mine and our shaft mine at Colonsay. In addition, we are expanding our Esterhazy mine for the K3 shaft.
Extensive potash deposits are found in the southern half of the Province of Saskatchewan. The potash ore is contained in a predominantly rock salt formation known as the Prairie Evaporites. The Prairie Evaporites deposits are bounded by limestone
13
formations and contain the potash beds. Three potash deposits of economic importance occur in Saskatchewan: the Esterhazy, Belle Plaine and Patience Lake members. The Patience Lake member is mined at Colonsay, and the Esterhazy member at Esterhazy. At Belle Plaine all three members are mined. Each of the major potash members contains several potash beds of different thicknesses and grades. The particular beds mined at Colonsay and Esterhazy have a mining height of 11 and 8 feet, respectively. At Belle Plaine several beds of different thicknesses are mined.
Our potash mines in Canada produce MOP exclusively. Esterhazy and Colonsay utilize shaft mining while Belle Plaine utilizes solution mining technology. Traditional potash shaft mining takes place underground at depths of over 1,000 meters where continuous mining machines cut out the ore face and load it onto conveyor belts. The ore is then crushed, moved to storage bins and hoisted to refineries above ground. In contrast, our solution mining process involves heated brine, which is pumped through a “cluster” to dissolve the potash in the ore beds at a depth of approximately 1,500 meters. A cluster consists of a series of boreholes drilled into the potash ore. A separate distribution center at each cluster controls the brine flow. The solution containing dissolved potash and salt is pumped to a refinery where sodium chloride, a co-product of this process, is separated from the potash through the use of evaporation and crystallization techniques. Concurrently, the solution is pumped into a cooling pond where additional crystallization occurs and the resulting product is recovered via a floating dredge. Refined potash is dewatered, dried and sized. Our Canadian operations produce 13 different MOP products, including industrial grades, many through proprietary processes.
Our potash mineral rights in the Province of Saskatchewan consist of the following:
|
Belle Plaine
|
Colonsay
|
Esterhazy
|
Total
|
||||||||
|
Acres under control
|
|||||||||||
|
Owned in fee
|
16,270
|
|
9,880
|
|
116,482
|
|
142,632
|
|
|||
|
Leased from Province
|
51,598
|
|
120,383
|
|
197,574
|
|
369,555
|
|
|||
|
Leased from others
|
—
|
|
3,692
|
|
85,059
|
|
88,751
|
|
|||
|
Total under control
|
67,868
|
|
133,955
|
|
399,115
|
|
600,938
|
|
|||
We believe that our mineral rights in Saskatchewan are sufficient to support current operations for more than a century. Leases are generally renewable at our option for successive terms, generally 21 years each, except that certain of the acres shown above as “Leased from others” are leased under long-term leases with terms (including renewals at our option) that expire from 2023 to 2170.
As part of the Vale Fertilizantes transaction, Mosaic acquired the assets of Vale Potash Canada Ltd. and its greenfield potash project in the Kronau area approximately 27 kilometers southeast of Regina, Saskatchewan. In addition, Mosaic leases approximately 294,000 acres of mineral rights from the government of Saskatchewan, and approximately 99,700 acres of freehold mineral rights in the Kronau/Regina area, which have not been developed and are not included in the table above.
We pay Canadian resource taxes consisting of the Potash Production Tax and resource surcharge. The Potash Production Tax is a Saskatchewan provincial tax on potash production and consists of a base payment and a profits tax. We also pay a percentage of the value of resource sales from our Saskatchewan mines. In addition to the Canadian resource taxes, royalties are payable to the mineral owners in respect of potash reserves or production of potash. We have included a further discussion of the Canadian resource taxes and royalties in our Management’s Analysis.
Since December 1985, we have effectively managed an inflow of salt saturated brine into our Esterhazy mine. At various times since then, we have experienced changing amounts and patterns of brine inflows at Esterhazy. To date, the brine inflow, including our remediation efforts to control it, has not had a material impact on our production processes or volumes. The volume of the net brine inflow (the rate of inflow less the amount we are pumping out of the mine) or net outflow (when we are pumping more brine out of the mine than the rate of inflow) fluctuates and is dependent on a number of variables, such as the location of the source of the inflow; the magnitude of the inflow; available pumping, surface and underground brine storage capacities; underground injection well capacities, and the effectiveness of calcium chloride and cementatious grout used to reduce or prevent the inflows, among other factors. As a result of these brine inflows, we incur expenditures, certain of which have been capitalized and others that have been charged to expense, in accordance with accounting principles generally accepted in the United States of America.
14
It is possible that the costs of remedial efforts at Esterhazy may further increase in the future and that such an increase could be material, or, in the extreme scenario, that the brine inflows, risk to employees or remediation costs may increase to a level which would cause us to change our mining processes or abandon the mine. See “Key Factors that can Affect Results of Operations and Financial Condition” and “Potash Net Sales and Gross Margin” in our Management’s Analysis and “Our Esterhazy mine has had an inflow of salt saturated brine for more than 30 years” in Part I, Item 1A, “Risk Factors” in this report, which are incorporated herein by reference, for a discussion of costs, risks and other information relating to the brine inflows. The K3 shafts at our Esterhazy mine are part of our potash expansion plan, which is also designed to mitigate risk from current and future inflows.
Due to the ongoing brine inflow at Esterhazy, subject to exceptions that are limited in scope and amount, we are unable to obtain insurance coverage for underground operations for water incursion problems for the K1 and K2 shafts. Like other potash producers’ shaft mines, our Colonsay, Saskatchewan, and Carlsbad, New Mexico, mines are also subject to the risks of inflow of water as a result of their shaft mining operations, but water inflow risks at these mines are included in our insurance coverage subject to deductibles, limited coverage terms and lower sub-limits negotiated with our insurers.
United States Mine
In the United States, we have a shaft mine located in Carlsbad, New Mexico. The ore reserves at our Carlsbad mine are made up of langbeinite, a double sulfate of potassium and magnesium. This type of potash reserve occurs in a predominantly rock salt formation known as the Salado Formation. The McNutt Member of this formation consists of eleven units of economic importance, of which we currently mine one. The McNutt Member’s evaporite deposits are interlayered with anhydrite, polyhalite, potassium salts, clay, and minor amounts of sandstone and siltstone.
Continuous underground mining methods are utilized to extract the ore. Drum type mining machines are used to cut the langbeinite ore from the face. Mined ore is then loaded onto conveyors, transported to storage areas, and then hoisted to the surface for further processing at our refinery.
We produce a double sulfate of potash magnesia product, which we market under our brand name K-Mag
®
, at our Carlsbad facility.
At the Carlsbad facility, we mine and refine potash from 77,221 acres of mineral rights. We control these reserves pursuant to either (i) leases from the U.S. government that, in general, continue in effect at our option (subject to readjustment by the U.S. government every 20 years) or (ii) leases from the State of New Mexico that continue as long as we continue to produce from them. These reserves contain an estimated total of 162 million tonnes of potash mineralization (calculated after estimated extraction losses) in one mining bed evaluated at thicknesses ranging from 6.5 feet to 10 feet. At average refinery rates, these ore reserves are estimated to be sufficient to yield 28.6 million tonnes of langbeinite concentrates with an average grade of approximately 22% K
2
O. At projected rates of production, we estimate that Carlsbad’s reserves of langbeinite are sufficient to support operations for approximately 47.5 years.
Royalties for the U.S. operations amounted to approximately $7.1 million in
2018
. These royalties are established by the U.S. Department of the Interior, Bureau of Land Management, in the case of the Carlsbad leases from the U.S. government, and pursuant to provisions set forth in the leases, in the case of the Carlsbad state leases.
Reserves
Our estimates below of our potash reserves and non-reserve potash mineralization are based on exploration drill hole data, seismic data and actual mining results over more than 35 years. Proven reserves are estimated by identifying material in place that is delineated on at least two sides and material in place within a half-mile radius or distance from an existing sampled mine entry or exploration core hole. Probable reserves are estimated by identifying material in place within a one mile radius from an existing sampled mine entry or exploration core hole. Historical extraction ratios from the many years of mining results are then applied to both types of material to estimate the proven and probable reserves. We believe that all reserves and non-reserve potash mineralization reported below are potentially recoverable using existing production shaft and refinery locations.
15
Our estimated recoverable potash ore reserves and non-reserve potash mineralization as of
December 31, 2018
for each of our mines are as follows:
|
(tonnes of ore in millions)
|
Reserves
(a)(b)
|
Potash
Mineralization
(a)(c)
|
|||||||
|
Facility
|
Recoverable
Tonnes
|
Average
Grade
(% K2O)
|
Potentially
Recoverable
Tonnes
|
||||||
|
Canada
|
|||||||||
|
Belle Plaine
|
819
|
|
18.0
|
|
2,363
|
|
|||
|
Colonsay
|
295
|
|
26.3
|
|
441
|
|
|||
|
Esterhazy
|
879
|
|
24.7
|
|
674
|
|
|||
|
sub-totals
|
1,993
|
|
22.2
|
|
3,478
|
|
|||
|
United States
|
|||||||||
|
Carlsbad
|
162
|
|
5.2
|
|
—
|
|
|||
|
Totals
|
2,155
|
|
20.9
|
|
3,478
|
|
|||
______________________________
|
(a)
|
There has been no third party review of reserve estimates within the last five years. The reserve estimates have been prepared in accordance with the standards set forth in Industry Guide 7 promulgated by the SEC.
|
|
(b)
|
Includes
1.3 billion
tonnes of proven reserves and
0.9 billion
tonnes of probable reserves.
|
|
(c)
|
The non-reserve potash mineralization reported in the table in some cases extends to the boundaries of the mineral rights we own or lease. Such boundaries are up to 16 miles from the closest existing sampled mine entry or exploration core hole. Based on available geologic data, the non-reserve potash mineralization represents potash that we expect to mine in the future, but it may not meet all of the technical requirements for categorization as proven or probable reserves under Industry Guide 7.
|
As discussed more fully above, we either own the reserves and mineralization shown above or lease them pursuant to mineral leases that generally remain in effect or are renewable at our option, or are long-term leases. Accordingly, we expect to be able to mine all reported reserves that are leased prior to termination or expiration of the existing leases.
Natural Gas
Natural gas is used at our Belle Plaine solution mine as a fuel to produce steam and to dry potash products. The steam is used to generate electricity and provide thermal energy to the evaporation, crystallization and solution mining processes. The Belle Plaine solution mine typically accounts for approximately 78% of our Potash segment’s total natural gas requirements for potash production. At our shaft mines, natural gas is used as a fuel to heat fresh air supplied to the shaft mines and for drying potash products. Combined natural gas usage for both the solution and shaft mines totaled 17 million MMbtu during
2018
. We purchase our natural gas requirements on firm delivery index price-based physical contracts and on short term spot-priced physical contracts. Our Canadian operations purchase all of their physical gas in Saskatchewan using AECO price indices references and transport the gas to our plants via the TransGas pipeline system. The U.S. potash operation in New Mexico purchases physical gas in the southwest respective regional market using the TransWestern El Paso Permian Basin market pricing reference. We use financial derivative contracts to manage the pricing on portions of our natural gas requirements.
Mosaic Fertilizantes Segment
Our Mosaic Fertilizantes segment owns and operates mines, chemical plants, crop nutrient blending and bagging facilities, port terminals and warehouses in Brazil and Paraguay, which produce and sell concentrated phosphates crop nutrients, phosphate-based animal feed ingredients and pot
a
sh fertilizer. The following map shows the locations of our operations in Brazil and Paraguay.
16
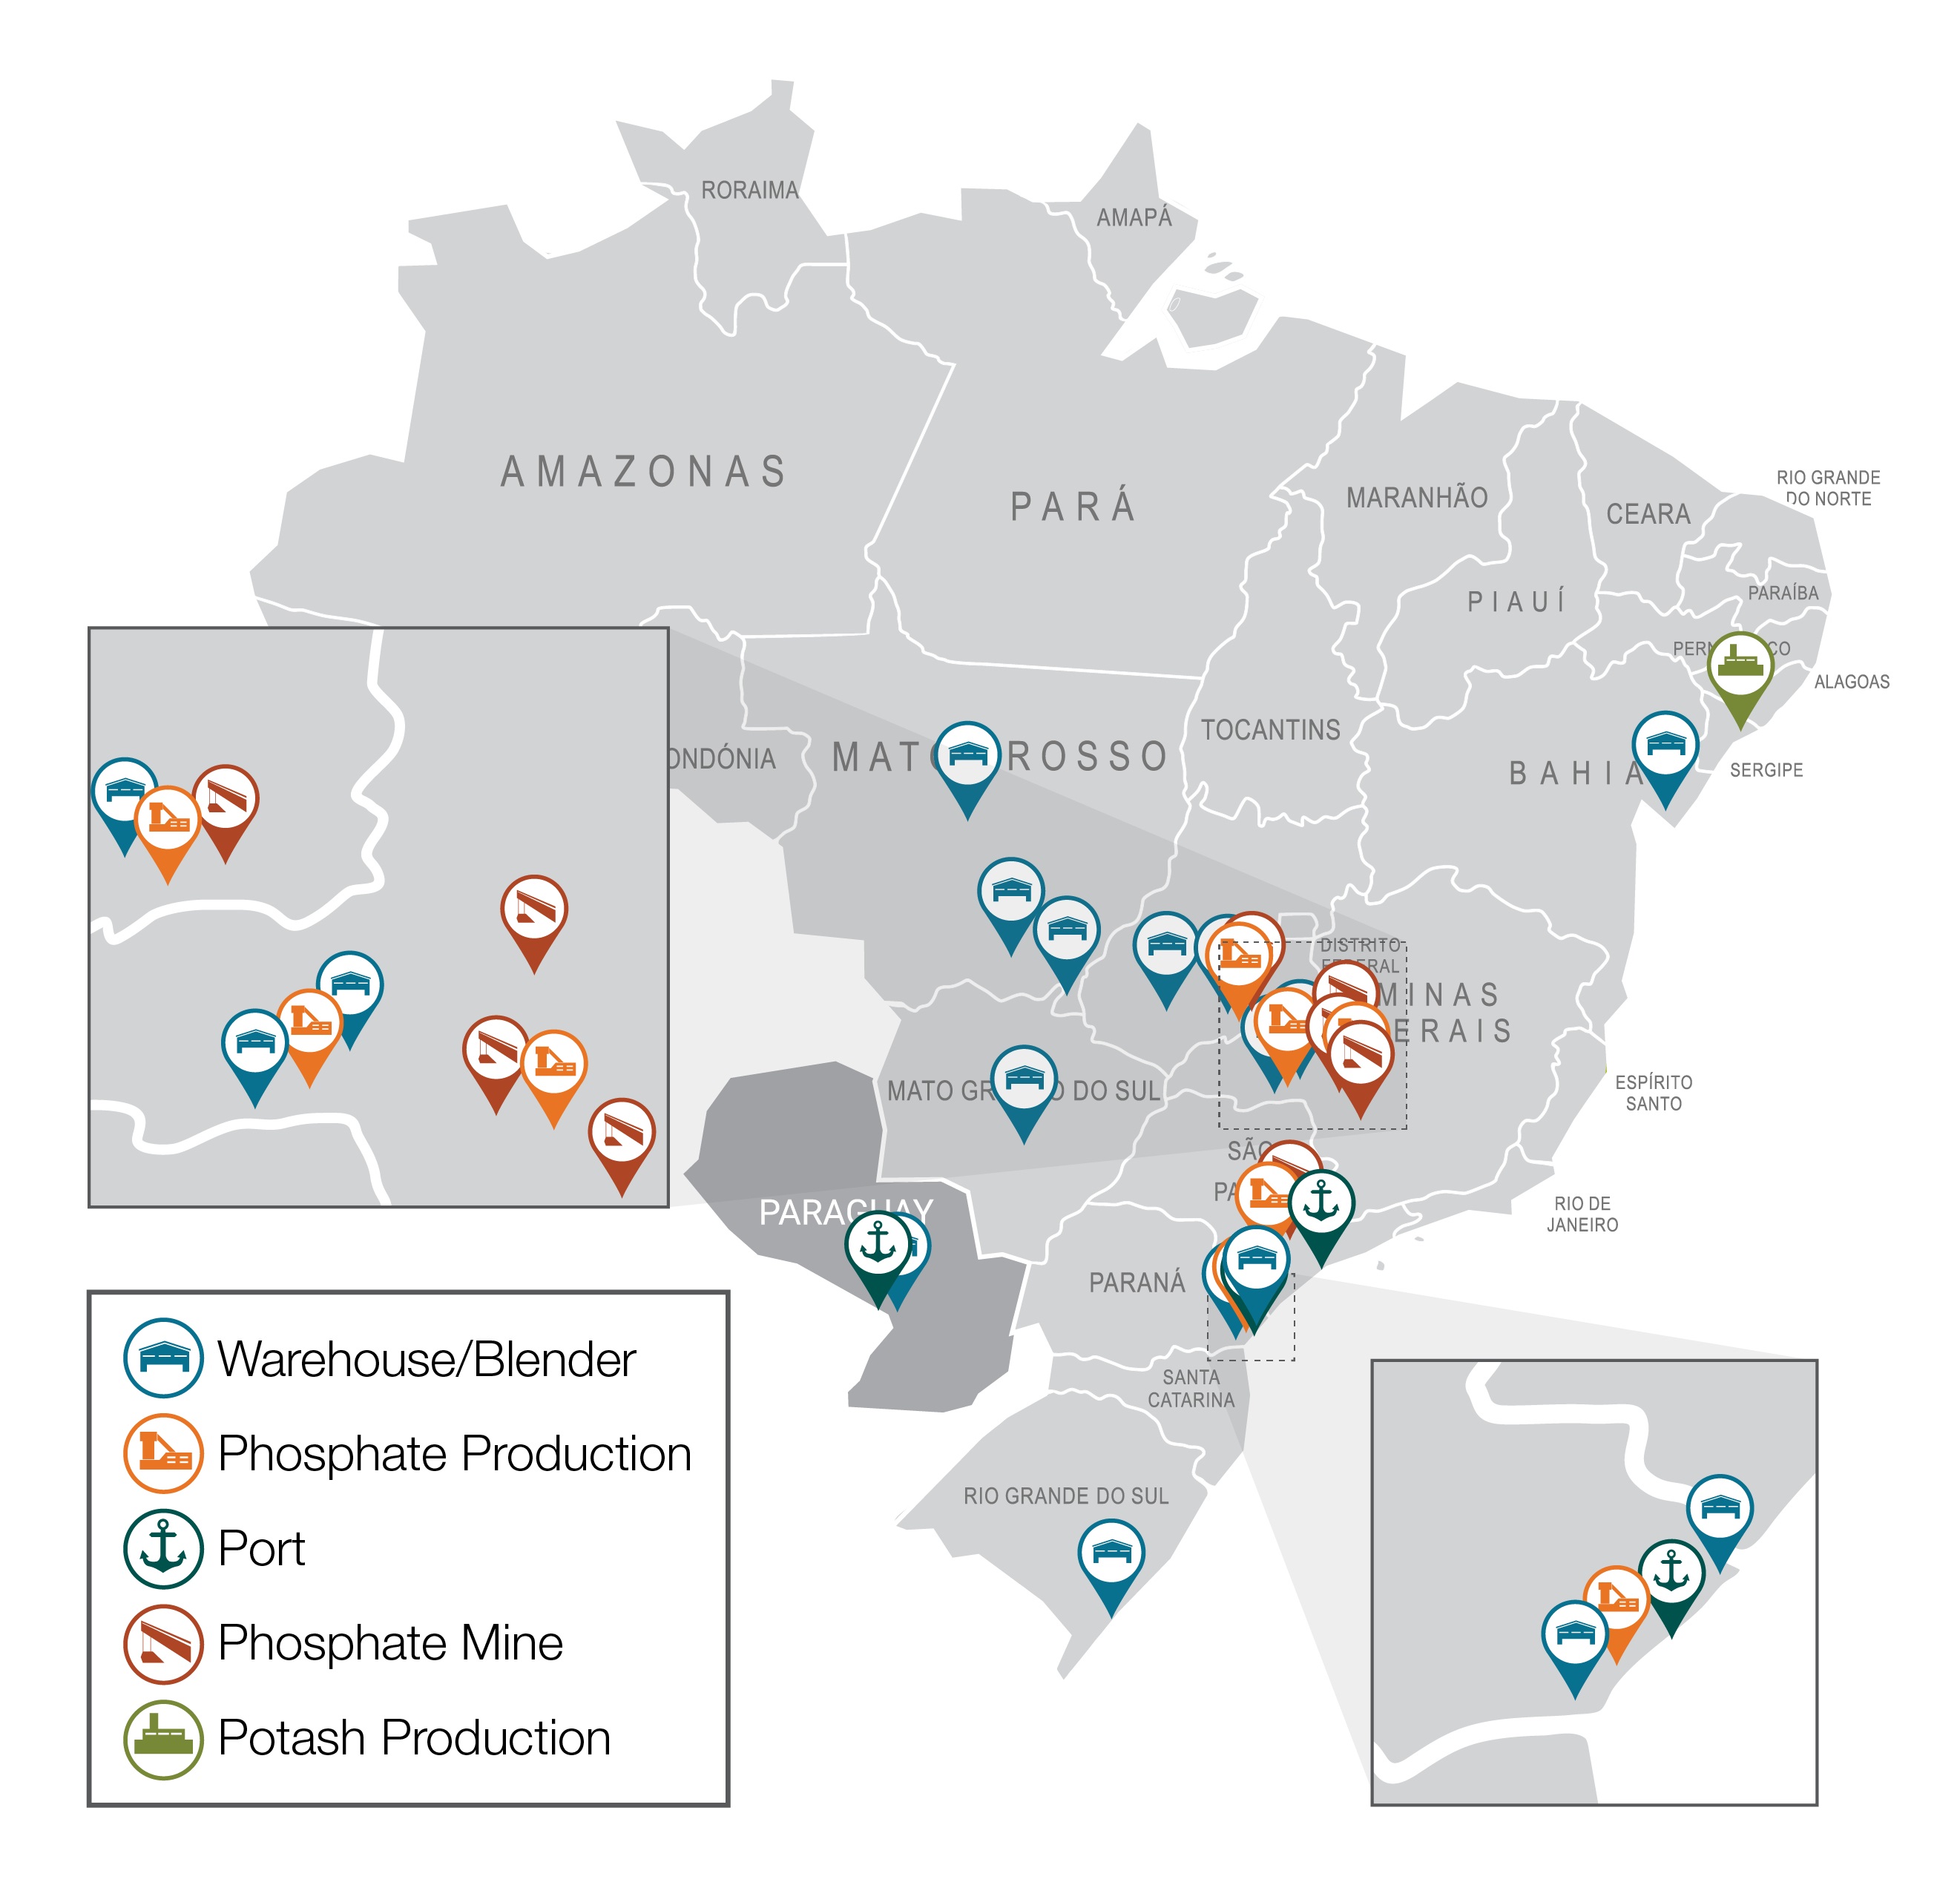
We are the largest producer and one of the largest distributors of blended crop nutrients for agricultural use in Brazil. We produce and sell phosphate and potash-based crop nutrients, and animal feed ingredients through our operations. Our operations in Brazil include five phosphate rock mines; four chemical plants and a potash mine. We own and operate twelve blending plants in Brazil and one blending plant and port in Paraguay. In addition, we lease several other warehouses and blending units depending on sales and production levels. We also have a 62% ownership interest in Fospar, S.A. (“
Fospar
”). Fospar owns and operates an SSP granulation plant, which produces approximately 0.5 million tonnes of SSP per year, and a deep-water port and throughput warehouse terminal facility in Paranagua, Brazil. The port facility at Paranagua handles approximately 3.0 million tonnes of imported crop nutrients. In 2018, Mosaic Fertilizantes sold approximately
9.1 million
tonnes of crop nutrient products and accounted for approximately 24% of fertilizer shipments in Brazil.
We have the capability to annually produce approximately 4.0 million tonnes of phosphate and potash-based crop nutrients and animal feed ingredients. Crop nutrient products produced are marketed to crop nutrient manufacturers, distributors, retailers and farmers.
In addition to producing crop nutrients, Mosaic Fertilizantes purchases phosphates, potash and nitrogen products which are either used to produce blended crop nutrients (“
Blends
”) or for resale. In 2018, Mosaic Fertilizantes purchased 1.6 million
17
tonnes of phosphate-based products, primarily MicroEssentials
®
, from our Phosphates segment, and
2.4 million
tonnes of potash products from our Potash segment and Canpotex.
Phosphate Crop Nutrients and Animal Feed Ingredients
Our Brazilian phosphates operations have capacity to produce approximately 1.1 million tonnes of phosphoric acid (“
P
2
O
5
”) per year, or about 68% of Brazilian annual capacity. Phosphoric acid is produced by reacting ground phosphate rock with sulfuric acid. Phosphoric acid is the key building block for the production of high analysis or concentrated phosphate crop nutrients and animal feed products, and is the most comprehensive measure of phosphate capacity and production and a commonly used benchmark in our industry. Our Brazilian phosphoric acid production totaled approximately 1.1 million tonnes in 2018 and accounted for approximately 86% of Brazilian annual output.
Our principal phosphate crop nutrient products are:
|
•
|
Monoammonium Phosphate
(11-52-0) MAP is a crop nutrient composed of two macronutrients, nitrogen and phosphoric acid. This slurry is added inside a rotary drum type granulator with ammonia to complete the neutralization reaction and produce MAP.
|
|
•
|
Triple superphosphate (TSP)
TSP is a highly concentrated phosphate crop nutrient. TSP is produced from the phosphate rock reaction with phosphoric acid in a kuhlmann type reactor. The process for the production of TSP in Brazil is run of pile where the product undergoes a curing process of approximately 7 days for later granulation.
|
|
•
|
Single superphosphate (SSP)
SSP is a crop nutrient with a low concentration of phosphorus that is used in agriculture because of the sulfur content in its formulation. SSP is produced from mixing phosphate rock with sulfuric acid in a kuhlmann or malaxador type reactor, after the reaction the product goes to the curing process and then feeds the granulation units.
|
|
•
|
Dicalcium phosphate (DCP)
Dicalcium phosphate is produced by the reaction of desulphurized phosphoric acid with limestone. At Uberaba, it is produced from the reaction of concentrated phosphoric acid with limestone slurry. At Cajati the phosphoric acid is diluted with dry limestone. The reaction of the DCP occurs in a kuhlmann or spinden type reactor.
|
Our primary mines and chemical plants are located in the states of Minas Gerais, Sao Paulo, and Goias. Production of our animal feed ingredients products is located at our Uberaba, Minas Gerais, and Cajati, Sao Paulo facilities. We market our feed phosphate primarily under the brand names of Foscálcio.
Annual capacity by plant as of December 31, 2018 and production volumes by plant for 2018 are listed below:
|
(tonnes of ore in millions)
|
Phosphoric acid
|
Processed Phosphate (MAP/TSP/SSP/DCP/Feed)
|
|||||||||
|
Facility
|
Capacity
|
Production
|
Capacity
|
Production
|
|||||||
|
Phosphate
|
|||||||||||
|
Uberaba
|
0.9
|
|
0.9
|
|
1.9
|
|
1.7
|
|
|||
|
Cajati
|
0.2
|
|
0.2
|
|
0.5
|
|
0.4
|
|
|||
|
Araxá
|
—
|
|
—
|
|
1.1
|
|
1.0
|
|
|||
|
Catalao
|
—
|
|
—
|
|
0.4
|
|
0.4
|
|
|||
|
Total
|
1.1
|
|
1.1
|
|
3.9
|
|
3.5
|
|
|||
______________________________
|
(a)
|
Our ability to produce processed phosphates has been less than our annual operational capacity as stated in the table above, except to the extent we purchase phosphoric acid. Factors affecting actual production are described in note (c) below.
|
|
(b)
|
The annual production capacity was calculated using the hourly capacity, days stopped for annual maintenance and OEE (historical utilization factor and capacity factor).
|
|
(c)
|
Actual production varies from annual operational capacity shown in the table above due to factors that include, among others, the level of demand for our products, maintenance and turnaround time, accidents, mechanical failure, and other.
|
18
The phosphoric acid produced at Cajati is used to produce DCP. The phosphoric acid produced at Uberaba is used to produce MAP, TSP and DCP. We produced approximately
3.5 million
tonnes of concentrated phosphate crop nutrients during 2018 which accounted for approximately 77% of estimated Brazilian annual production.
Phosphate Rock
Phosphate rock is the key mineral used to produce phosphate crop nutrients and feed phosphate. Our phosphate rock production in Brazil totaled approximately
4.0 million
tonnes in 2018 which accounted for approximately 69% of estimated Brazilian annual production. We are the largest producer of phosphate rock in Brazil and currently operate four mines with a combined annual capacity of approximately
5.0 million
tonnes. Production of one tonne of MAP requires 1.6 to 1.7 tonnes of phosphate rock. Production of one tonne of SSP requires between 0.6 to 0.7 tonnes of phosphate rock. Production of one tonne of TSP required 1.4 tonnes of phosphate rock.
Our wholly owned phosphate mines and related mining operations in Brazil are located in the states of Minas Gerais, Goiás
and São Paulo, Brazil. During 2018, we operated five active mines; Araxá, Patrocínio and Tapira, in the state of Minas Gerais; Catalão, in the state of Goiás; and Cajati, in the state of São Paulo. Patrocínio began operations in 2016 and is still ramping up to its full production capacity.
All of our Brazilian phosphate rock mines are open pit mines. The phosphate ore is extracted by drilling and blasting, loaded by backhoe into trucks and transported to the processing plants at each mine, with the exception of Patrocínio which does not have its own processing plant. The ore extracted at Patrocínio is transported by rail to Araxá for processing. We process the ore at beneficiation plants that we own.
The following table shows the annual capacity of rock production volume and grade for each of our phosphate mines as of December 31, 2018:
|
(tonnes in millions)
|
Capacity
(a)
|
|
Production
(b)
|
Average BPL
(c)
|
%
P
2
O
5(d)
|
||||||
|
Facility
|
|||||||||||
|
Catalão
|
1.0
|
|
|
0.8
|
|
74.8
|
|
34.2
|
|
||
|
Tapira
|
2.1
|
|
|
1.9
|
|
77.4
|
|
35.4
|
|
||
|
Araxá/Patrocínio
|
1.3
|
|
0.8
|
|
75.4
|
|
34.5
|
|
|||
|
Cajati
|
0.6
|
|
|
0.5
|
|
75.6
|
|
34.6
|
|
||
|
Total
|
5.0
|
|
|
4.0
|
|
76.2
|
|
34.9
|
|
||
______________________________
|
(a)
|
Annual operational capacity is the expected average long-term annual capacity considering constraints represented by the grade, quality and quantity of the reserves being mined as well as equipment performance and other operational factors.
|
|
(b)
|
Actual production varies from annual operational capacity shown in the above table due to factors that include among others the level of demand for our products, the quality of the reserves, the nature of the geologic formations we are mining at any particular time, maintenance and turnaround time, accidents, mechanical failure, weather conditions, and other operating conditions, as well as the effect of recent initiatives intended to improve operational excellence.
|
|
(c)
|
Bone Phosphate of Lime ("
BPL
") is a traditional reference to the amount (by weight percentage) of calcium phosphate contained in phosphate rock or a phosphate ore body. A higher BPL corresponds to a higher percentage of calcium phosphate.
|
|
(d)
|
The percent of P
2
O
5
in the above table represents a measure of the phosphate content in phosphate rock or a phosphate ore body. A higher percentage corresponds to a higher percentage of phosphate content in phosphate rock or a phosphate ore body.
|
Phosphate Reserves
The evaluation of mineral reserves is based upon exploration core drilling as well as technical and economic analyses to determine that reserves can be economically mined. Proven (measured) reserves are those resources of sufficient concentration to meet minimum physical, chemical and economic criteria related to our current product standards and mining and production practices. Our estimates or probable (indicated) reserves are based on information similar to that used for proven reserves, but sites for drilling are father apart or are otherwise less adequately spaced than for proven reserves,
19
although the degree of assurance is high enough to assume continuity between such sites. Historically, prior to the Acquisition, the reserve information presented by Vale was in probable tonnes. We are currently in the process of having further technical work performed by independent third parties that will provide the information necessary to determine the proven reserves.
The following table sets forth our probable phosphates reserves as of December 31, 2018;
|
(tonnes in millions)
|
Reserve Tonnes
(a)(b)
|
|
%
P
2
O
5
|
||
|
Active Mines
|
|||||
|
Catalão
|
74.3
|
|
|
11.1
|
|
|
Tapira
|
629.9
|
|
|
7.6
|
|
|
Araxá
|
15.8
|
|
|
11.8
|
|
|
Patrocínio
(c)
|
480.0
|
|
12.1
|
|
|
|
Cajati
|
73.6
|
|
5.1
|
|
|
|
Total Mines
|
1,273.6
|
|
|
9.4
|
|
______________________________
|
(a)
|
Tonnage is stated in millions of run of mine dry metric tons and Grade is % P205, after adjustments for depletion, mining dilution and recovery.
|
|
(b)
|
Mineral reserves were audited by external consulting firms during 2018 and reviewed internally.
|
|
(c)
|
The declared reserves correspond to the original scope of the Patrocínio mine. These tonnes are expected to be mined from the Araxá mine.
|
We are required to pay royalties to mineral owners and resource taxes to the Brazilian government for phosphate and potash production. The resource taxes, known as Compensação Financeira pela Exploração de Recursos Minerais or CFEM
,
are regulated by
the National Mining Agency. In 2018, we paid royalties and resource taxes of approximately $23 million.
Sulfur
We use molten sulfur at our phosphates concentrates plants to produce sulfuric acid, one of the key components used in our production of phosphoric acid. We consumed approximately 1.2 million long tons of sulfur for our own production during 2018. We purchase approximately 80% of the volume under annual supply agreements from oil and natural gas refiners, who are required to remove or recover sulfur during the refining process. The remaining 20% is purchased in the spot market.
Sulfur is imported through the Tiplam port and transported by rail to the Uberaba plant and by truck to the
Araxá
and Cajati locations.
Although sulfur is readily available from many different suppliers and can be transported to our phosphate facilities by a variety of means, sulfur is an important raw material used in our business that has in the past been and could in the future be subject to volatile pricing and availability. Alternative transportation and terminaling facilities might not have sufficient capacity to fully serve all of our facilities in the event of a disruption to current transportation or terminaling facilities. Changes in the price of sulfur or disruptions or sulfur transportation or terminaling facilities could have a material impact on our business.
Ammonia
We use ammonia, together with phosphoric acid, to produce MAP, and to a lesser extent for SSP production. We consumed approximately 140,000 tonnes of ammonia during 2018. Production of one tonne of MAP requires approximately 0.137 tonnes of ammonia. We purchase all of our ammonia under a long-term supply agreement with a single supplier. Ammonia is imported through the Tiplam port and transported by truck to Uberaba, Araxá and Catalão.
We own approximately 1% of the Tiplam terminal in Santos, Sao Paulo. Our ownership percentage, along with a contractual agreement, guarantee us unloading priority for ammonia and also provide us unloading capacity for rock, sulfur and crop nutrients.
20
Although ammonia is readily available from many different suppliers and can be transported to our phosphates facility by a variety of means, ammonia is an important raw material used in our business that has in the past been and in the future, could be subject to volatile pricing. Alternative transportation and terminaling facilities might not have sufficient capacity to fully serve all of our facilities in the event of a disruption to existing transportation or terminaling facilities. Changes in the price of ammonia or disruptions to ammonia transportation of terminaling could have a material impact on our business. We have included a discussion of ammonia prices in our Management's Discussion and Analysis.
Brazilian Potash
We conduct potash operations through the leased Taquari-Vassouras shaft mine, which is the only potash mine in Brazil, located in Rosario do Catete, in the Brazilian state of Sergipe. We also own a related refinery at the site. We produce and sell potash product domestically. MOP is the primary source of potassium for the crop nutrient industry in Brazil. Red MOP has traces of iron oxide. The granular and standard grade Red MOP products are well-suited for direct fertilizer application and bulk blending. Our potash product is marketed in Brazil to crop nutrient manufacturers, distributors and retailers and is also used in the manufacturing of crop nutrients.
Potash Mine
The potash deposit is in the Taquari-Vassouras sub-basin and the Taquari-Vassouras Industrial Complex is in Rosário do Catete. It can be reached by road and is also served by rail about 9km from the site and a port facility about 40 km from the mine site. The underground mining operations comprises three municipalities: Rosário do Catete, Capela and Carmópolis.
The ore is sylvinite (KCL, NaCL) containing sylvite (KCl) and halite (NaCl). It is mined at a depth of 500 to 740 m by room and pillar methods using six continuous miners. Room and pillar is a mining system in which the mined material is extracted across a horizontal plane, creating horizontal arrays of rooms and pillars. The ore is extracted in two phases. In the first, "pillars" of untouched material are left to support the roof overburden, and open areas or "rooms" are extracted underground; the pillars are then partially extracted in the same manner. The technique is usually used for relatively flat-lying deposits.
The beneficiation process operation begins at the run-of-mine stockpile. The material is conveyed to the processing circuit where it is divided into eight major units: crushing, concentration, dissolution, drying, compaction, storage and shipping.
Our current potash annualized operational capacity totals 520,000 tonnes of product per year and accounts for 100% of Brazilian annual capacity. Production totaled 345,000 tonnes in 2018, with a K20 grade of 58%. Production during 2018 was impacted by operational issues, including an underground roof failure and electrical transformer issues.
In 2018, we paid royalties of approximately $5 million related to the leasing of potash assets and mining rights for Taquari.
Reserves
Our estimate of our potash reserves is based on exploration drill hole data, seismic data and actual mining results. We believe that all reserves are potentially recoverable using existing production and refinery locations. As of December 31, 2018, we had probable reserves of 11.4 million tonnes with an average K2O grade of 23.55%. We are currently in the process of having further technical work performed by independent third parties that will provide the information necessary to determine the proven reserves. Based on current estimates, we believe the reserves will be exhausted in 2023.
Land Holdings
Mosaic Fertilizantes owns properties and the surface rights of certain additional rural lands comprising over 32,000 hectares (79,000 acres) in the States of São Paulo, Minas Gerais, Goiás, Paraná, Mato Grosso, Santa Catarina, Bahia and Sergipe, and has the right to mine additional properties which contain phosphate rock or potash reserves. Most of our land holdings are needed to operate our phosphate and potash production and fertilizer distribution businesses. A portion of our land assets may no longer be required for our current operations and may be leased to third parties, for agricultural or other purposes, or may be set aside for mineral or environmental conservation. Our real property assets are generally comprised of concentrates plants, port facilities and phosphate and potash mines, crop nutrient blending and bagging facilities and other properties which we have acquired through our presence in Brazil.
21
India and China Distribution Businesses
As part of the Realignment, during the first quarter of 2018, the China and India distribution businesses, which had previously been reported in the International Distribution segment, were moved into the Corporate, Eliminations and Other category. Corporate, Eliminations and Other also includes intersegment eliminations, including profit on intersegment sales, unrealized mark-to-market gains and losses on derivatives, debt expenses and our Streamsong Resort
®
results of operations.
Our China and India distribution businesses market phosphate-, potash- and nitrogen-based crop nutrients and provide other ancillary services to wholesalers, cooperatives, independent retailers, and farmers in the Asia-Pacific regions. These operations provide our Phosphates and Potash segments access to key markets outside of North and South America and serve as a marketing agent for our Phosphates segment. In 2018, the India and China operations purchased 138,616 tonnes of phosphate-based products from our Phosphates segment and MWSPC, and 184,542 tonnes of potash products from our Potash segment and Canpotex. They also purchase phosphates, potash and nitrogen products from unrelated third parties, which we either use to produce blended crop nutrients or for resale.
In China, we own two 300,000-tonne per year capacity blending plants. In
2018
, we sold approximately 165,000 tonnes of Blends and distributed another 537,000 tonnes of phosphate and potash crop nutrients in China.
In India, we have distribution facilities to import and sell crop nutrients. In
2018
, we distributed approximately 660,000 tonnes of phosphate and potash crop nutrient products in India.
SALES AND DISTRIBUTION ACTIVITIES
United States and Canada
We have a United States and Canada sales and marketing team that serves our business segments. We sell to wholesale distributors, retail chains, cooperatives, independent retailers and national accounts.
Customer service and the ability to effectively minimize the overall supply chain costs are key competitive factors in the crop nutrient and animal feed ingredients businesses. In addition to our production facilities, to service the needs of our customers, we own or have contractual throughput or other arrangements at strategically located distribution warehouses along or near the Mississippi and Ohio Rivers as well as in other key agricultural regions of the United States and Canada. From these facilities, we distribute Mosaic-produced phosphate and potash products for customers who in turn resell the product into the distribution channel or directly to farmers in the United States and Canada.
We own port facilities in Tampa, Florida and Houston, Texas, which have deep water berth capabilities providing access to the Gulf of Mexico. We discontinued operations at the Houston, Texas facility in 2017 and expect to sell the facility in 2019. We also own warehouse distribution facilities in Savage, Minnesota; Pekin, Illinois; and Henderson, Kentucky.
In addition to the facilities that we own, our U.S. distribution operations also include leased distribution space or contractual throughput agreements in other key geographical areas such as California, Florida, Illinois, Indiana, Iowa, Kentucky, Louisiana, Minnesota, Missouri, Nebraska, North Dakota, Ohio, Oklahoma, Texas and Wisconsin.
Our Canadian customers include independent dealers and national accounts. We also lease and own warehouse facilities in Saskatchewan, Ontario, Quebec and Manitoba in Canada.
International
Outside of the United States and Canada, we market our Phosphates segment’s products through our Mosaic Fertilizantes segment and our China and India distribution businesses, as well as a salesforce focused on geographies outside of North America. The countries that account for the largest amount of our phosphates sales outside the United States, by volume, are Brazil, Canada, Australia and Mexico.
Our sales outside of the United States and Canada of Saskatchewan potash products are made through Canpotex. Canpotex sales are allocated between its members based on peaking capacity. In 2018, our share of Canpotex sales remained at 36.2%.
Our potash exports from Carlsbad are sold through our own sales force. We also market our Potash segment’s products through our Mosaic Fertilizantes segment and our China and India distribution businesses, which acquire potash primarily
22
through Canpotex. The countries that account for the largest amount of international potash sales, by volume, are Brazil, China, Indonesia, India and Malaysia.
To service the needs of our customers, our Mosaic Fertilizantes segment includes a network of strategically located sales offices, crop nutrient blending and bagging facilities, port terminals and warehouse distribution facilities that we own and operate. The blending and bagging facilities primarily produce Blends from phosphate, potash and nitrogen. The average product mix in our Blends (by volume) contains approximately 50% phosphate, 35% potash and 15% nitrogen, although this mix differs based on seasonal and other factors. All of our production in Brazil is consumed within the country.
Our India and China distribution businesses also includes a network of strategically located sales offices, crop nutrient blending and bagging facilities, port terminals and warehouse distribution facilities. These businesses serve primarily as a sales outlet for our North American Phosphates production, as well as additional phosphate production we market from our MWSPC joint venture, both for resale and as an input for Blends. Our Potash segment also has historically furnished the majority of the raw materials needs for the production of Blends, primarily via Canpotex, and is expected to continue to do so in the future.
Other Products
With a strong brand position in a multi-billion dollar animal feed ingredients global market, our Phosphates segment supplies animal feed ingredients for poultry and livestock to customers in North America, Latin America and Asia. Our potash sales to non-agricultural users are primarily to large industrial accounts and the animal feed industry. Additionally, in North America, we sell potash for de-icing and as a water softener regenerant, as well as fluorosilicic acid for water fluoridation. In Brazil, we also sell phospsogypsum.
COMPETITION
Because crop nutrients are global commodities available from numerous sources, crop nutrition companies compete primarily on the basis of delivered price. Other competitive factors include product quality, cost and availability of raw materials, customer service, plant efficiency and availability of product. As a result, markets for our products are highly competitive. We compete with a broad range of domestic and international producers, including farmer cooperatives, subsidiaries of larger companies, and independent crop nutrient companies. Foreign competitors often have access to cheaper raw materials, are required to comply with less stringent regulatory requirements or are owned or subsidized by governments and, as a result, may have cost advantages over North American companies. We believe that our extensive North American and international production and distribution system provides us with a competitive advantage by allowing us to achieve economies of scale, transportation and storage efficiencies, and obtain market intelligence. Also, we believe our premium products, such as MicroEssentials, provide us a competitive advantage with customers in North and South America.
Unlike many of our competitors, we have our own distribution system to sell phosphate- and potash-based crop nutrients and animal feed ingredients, whether produced by us or by other third parties, around the globe. In North America, we have one of the largest and most strategically located distribution systems for crop nutrients, including warehouse facilities in key agricultural regions. We also have an extensive network of distribution facilities internationally, including in the key growth regions of South America and Asia, with port terminals, warehouses, and blending plants in Brazil, Paraguay, China, and India. Our global presence allows us to efficiently serve customers in approximately 40 countries.
Phosphates Segment
Our Phosphates segment operates in a highly competitive global market. Among the competitors in the global phosphate industry are domestic and foreign companies, as well as foreign government-supported producers in Asia and North Africa. Phosphate producers compete primarily based on price, as well as product quality, service and innovation. Major integrated producers of feed phosphates are located in the United States, Europe and China. Many smaller producers are located in emerging markets around the world. Many of these smaller producers are not miners of phosphate rock or manufacturers of phosphoric acid and are required to purchase this material on the open market.
We believe that we are a low-cost integrated producer of phosphate-based crop nutrients, due in part to our scale, vertical integration and strategic network of production and distribution facilities. As the world’s largest producer of concentrated phosphates, as well as the second largest miner of phosphate rock in the world and the largest in the United States, we maintain an advantage over some competitors as the scale of operations effectively reduces production costs per unit. We are also vertically integrated to captively supply one of our key inputs, phosphate rock, to our phosphate production facilities. We
23
believe that our position as an integrated producer of phosphate rock provides us with a significant cost advantage over competitors that are non-integrated phosphate producers. In addition, our ownership in the Miski Mayo Mine allows us to supplement our overall phosphate rock needs. We also sell a portion of Miski Mayo production to third parties. MWSPC enables us to not only further diversify our sources of phosphates but also improve our access to key agricultural countries in Asia and the Middle East.
We produce ammonia at our Faustina, Louisiana concentrates plant in quantities sufficient to meet approximately one third of our total ammonia needs in North America. With no captive ammonia production supplying all our Florida operations, we are subject to significant volatility in our purchase price of ammonia from world markets. The CF Ammonia Supply Agreement provides us with a long-term supply of a substantial volume of ammonia at prices based on the price of natural gas, and is intended to lessen this volatility.
With our dedicated sulfur transportation barges and tugs, and our 50% ownership interest in Gulf Sulphur Services, we are also well-positioned to source an adequate, flexible and cost-effective supply of sulfur to our Florida and Louisiana phosphate production facilities, our third key input. We believe that our investments in sulfur assets continue to afford us a competitive advantage compared to other producers in cost and access to sulfur.
With facilities in both central Florida and Louisiana, we are logistically well positioned to fulfill our needs at very competitive prices. Those multiple production points also afford us the flexibility to optimally balance supply and demand.
Potash Segment
Potash is a commodity available from several geographical regions around the world and, consequently, the market is highly competitive. Through our participation in Canpotex, we compete outside of North America against various independent and state-owned potash producers. Canpotex has substantial expertise and logistical resources for the international distribution of potash, including strategically located export assets in Portland, Oregon, St. John, New Brunswick, and Vancouver, British Columbia. Our principal methods of competition with respect to the sale of potash include product pricing, and offering consistent, high-quality products and superior service. We believe that our potash cost structure is competitive in the industry and should improve as we continue to complete our potash expansion projects.
Mosaic Fertilizantes
The Mosaic Fertilizantes segment operates in a highly competitive market in Brazil. We compete with a broad range of domestic and international producers, including farmer cooperatives, subsidiaries of larger companies, and independent crop nutrient companies. We believe that having a vertically integrated business, internationally but also in Brazil, provides us with a competitive advantage by allowing us to achieve economies of scale, transportation and storage efficiencies, and obtain market intelligence.
Mosaic Fertilizantes has a wide variety of customers including farmers, blenders, and other local distributors. We compete with local businesses that offer a wide variety of products that are available from many sources. We believe the strategic location of our mines and chemical plants, in close proximity to our customers, and the benefit of our own distribution network, gives us an advantage over most of our competitors. The vertical integration of our wholly-owned production, along with our distribution network, as well as our focus on product innovation and customer solutions, position us with an advantage over many of our competitors. We have a strong brand in Brazil. In addition to having access to our own production, our distribution activities have the capability to supply a wide variety of crop nutrients to our dealer/farmer customer base.
FACTORS AFFECTING DEMAND
Our results of operations historically have reflected the effects of several external factors which are beyond our control and have in the past produced significant downward and upward swings in operating results. Revenues are highly dependent upon conditions in the agriculture industry and can be affected by, among other factors: crop conditions; changes in agricultural production practices; worldwide economic conditions, including the increasing world population, household incomes, and demand for more protein-rich food, particularly in developing regions such as China, India, and Latin America; changing demand for biofuels; variability in commodity pricing; governmental policies; the level of inventories in the crop nutrient distribution channels; customer expectations about farmer economics, future crop nutrient prices and availability, and transportation costs, among other matters; market trends in raw material costs; market prices for crop nutrients; and weather. Furthermore, our crop nutrients business is seasonal to the extent farmers and agricultural enterprises in the markets in which
24
we compete purchase more crop nutrient products during the spring and fall. The international scope of our business, spanning the northern and southern hemispheres, reduces to some extent the seasonal impact on our business. The degree of seasonality of our business can change significantly from year to year due to conditions in the agricultural industry and other factors. The seasonal nature of our businesses requires significant working capital for inventory in advance of the planting seasons.
We sell products throughout the world. Unfavorable changes in trade protection laws, policies and measures, government policies and other regulatory requirements affecting trade; unexpected changes in tax and trade treaties; strengthening or weakening of foreign economies as well as political relations with the United States may cause sales trends to customers in one or more foreign countries to differ from sales trends in the United States.
Our international operations are subject to risks from changes in foreign currencies, or government policy, which can affect local farmer economics.
OTHER MATTERS
Employees
We had approximately 12,900 employees as of
December 31, 2018
, consisting of approximately 9,400 salaried and 3,500 hourly employees. There are also approximately 700 hourly employees at the Miski Mayo mine, of which we own 75% and its results are consolidated within our results of operations.
Labor Relations
As of
December 31, 2018
:
|
•
|
We had ten collective bargaining agreements with unions covering 88% of our hourly employees in the U.S. and Canada. Of these employees, approximately 27% are covered under collective bargaining agreements scheduled to expire in 2019.
|
|
•
|
Agreements with 34 unions covered all employees in Brazil, representing 96% of our international employees. More than one agreement may govern our relations with each of these unions. In general, the agreements are renewable on an annual basis.
|
Failure to renew any of our union agreements could result in a strike or labor stoppage that could have a material adverse effect on our operations. However, we have not experienced significant work stoppage in many years and historically have had good labor relations.
Information Available on our Website
Our annual reports on Form 10-K, quarterly reports on Form 10-Q, current reports on Form 8-K, and amendments thereto, filed with the SEC pursuant to Section 13(a) of the Securities Exchange Act of 1934, as amended, and the rules and regulations thereunder are made available free of charge on our website, (www.mosaicco.com), as soon as reasonably practicable after we electronically file such material with, or furnish it to, the SEC. These reports are also available on the SEC's website (www.sec.gov). The information contained on our website and the SEC's website is not being incorporated in this report.
EXECUTIVE OFFICERS
Information regarding our executive officers as of
March 12, 2019
is set forth below:
25
|
Name
|
Age
|
Position
|
|||
|
Bruce M. Bodine Jr.
|
47
|
|
Senior Vice President—Phosphates
|
||
|
Clint C. Freeland
|
50
|
|
Senior Vice President—Chief Financial Officer
|
||
|
Mark J. Isaacson
|
56
|
|
Senior Vice President, General Counsel and Corporate Secretary
|
||
|
Richard N. McLellan
|
62
|
|
Senior Vice President—Mosaic Fertilizantes
|
||
|
James “Joc” C. O’Rourke
|
58
|
|
Chief Executive Officer, President and Director
|
||
|
Walter F. Precourt III
|
54
|
|
Senior Vice President—Strategy and Growth
|
||
|
Corrine D. Ricard
|
55
|
|
Senior Vice President—Commercial
|
||
|
Karen A. Swager
|
48
|
|
Senior Vice President—Potash
|
||
Bruce M. Bodine Jr.
Mr. Bodine was named Senior Vice President - Phosphates and, also provides executive oversight for the corporate procurement organization effective as of January 1, 2019. Prior to that, he served as our Senior Vice President - Potash beginning in June 2016, as our Vice President - Potash ( from April to May 2016), prior to that, as our Vice President - Supply Chain (from August 2015 to March 2016), prior to that as our Vice President - Operations Business Development (from October 2014 to August 2015), prior to that as Vice President - Operations for our Esterhazy and Colonsay potash production facilities (from July 2013 to October 2014), prior to that as the General Manager, Esterhazy (from September 2012 to June 2013) and prior to that as the General Manager, Four Corners (from March 2010 to August 2012). Before that, Mr. Bodine held various plant and mine development management positions in the Phosphates segment beginning with Mosaic’s formation in 2004, and prior to that he served in various engineering leadership positions with our predecessor company, IMC Global Inc. Mr. Bodine serves on the Board Directors for the Saskatchewan Potash Producers Association and the Saskatchewan Chamber of Commerce.
Clint C. Freeland.
Mr. Freeland was named Senior Vice President and Chief Financial Officer in June 2018. Prior to joining Mosaic, Mr. Freeland served as Executive Vice President and Chief Financial Officer of Dynegy Inc. from July 2011 until Dynegy’s merger with Vistra Energy Corp. in April 2018. Mr. Freeland was responsible for Dynegy’s financial affairs, including finance and accounting, treasury, tax and banking and credit agency relationships. In November 2011, as part of a reorganization of its subsidiaries, certain of Dynegy’s affiliates filed voluntary petitions for reorganization under Chapter 11 of the U.S. Bankruptcy Code (the "Code") and, in July 2012, Dynegy filed a voluntary petition for reorganization under Chapter 11 of the Code. Dynegy emerged from Bankruptcy in October 2012. Prior to joining Dynegy, Mr. Freeland served as Senior Vice President, Strategy & Financial Structure of NRG Energy, Inc. from February 2009 to July 2011. Mr. Freeland served as NRG’s Senior Vice President and Chief Financial Officer from February 2008 to February 2009 and its Vice President and Treasurer from April 2006 to February 2008. Prior to joining NRG, Mr. Freeland held various key financial roles within the energy sector.
Mark J. Isaacson.
Mr. Isaacson was named Senior Vice President, General Counsel and Corporate Secretary in August 2015 and previously served as our Vice President, General Counsel and Corporate Secretary since August 2014. Mr. Isaacson joined Mosaic upon its formation in 2004 as its Chief Phosphates Counsel before being promoted to Vice President, Associate General Counsel and Chief Compliance Officer in 2011 and to Vice President, Acting General Counsel and Corporate Secretary in June 2014. Prior to joining Mosaic, Mr. Isaacson worked for 15 years at Cargill, Inc., where he served as Senior Attorney for a number of its business units.
Richard N. McLellan.
Mr. McLellan was appointed Senior Vice President - Mosaic Fertilizantes in May 2018. Prior to that time, he served as Senior Vice President - Brazil since February 2017, Senior Vice President—Commercial since April 2007, and before that as our Vice President—North American Sales since December 2005 and as Country Manager for our (and, prior to the Combination, Cargill’s) Brazilian crop nutrient business since November 2002. Mr. McLellan joined Cargill in 1989 and held various roles in its Canadian and U.S. operations, including grain, retail and wholesale crop nutrient distribution.
James “Joc” C. O’Rourke.
Mr. O’Rourke was promoted to President and Chief Executive Officer effective in August 2015. Previously, he served as Executive Vice President—Operations and Chief Operating Officer since August 2012 and before that as Executive Vice President—Operations since January 2009. Prior to joining Mosaic, Mr. O’Rourke was President, Australia Pacific for Barrick Gold Corporation, the largest gold producer in Australia, since May 2006, where he was responsible for the Australia Pacific Business Unit, consisting of ten gold and copper mines in Australia and Papua New Guinea. Before that, Mr. O’Rourke was Executive General Manager in Australia and Managing Director of Placer Dome Asia
26
Pacific Ltd., the second largest gold producer in Australia, from December 2004, where he was responsible for the Australia Business Unit, consisting of five gold and copper mines; and General Manager of Western Australia Operations for Iluka Resources Ltd., the world’s largest zircon and second largest titanium producer, from September 2003, where he was responsible for six mining and concentrating operations and two mineral separation/synthetic rutile refineries. Mr. O’Rourke had previously held various management, engineering and other roles in the mining industry in Canada and Australia since 1984. Mr. O’Rourke has served on our Board of Directors since May 2015 and is also a director of The Toro Company.
Walter F. Precourt III.
Mr. Precourt was named Senior Vice President-Strategy and Growth effective January 1, 2019, and has provided executive oversight for the Environmental, Health and Safety organization since June 2016. He previously served as Senior Vice President - Phosphates and provided executive oversight for the corporate procurement organization from June 2016 until January 1, 2019, as our Senior Vice President—Potash Operations from May 2012 to June 2016, and before that he led our Environment, Health and Safety organization since joining Mosaic in 2009. Prior to joining Mosaic, Mr. Precourt was employed by cement and mineral component producer Holcim (U.S.) where he initially led its safety transformation and later became Vice President of Environment and Government Affairs. Mr. Precourt started his career at The Dow Chemical Company where he served in a variety of roles in Operations, Technology, Capital Project Management, and Environmental, Health and Safety. Mr. Precourt served as a director and was the past Chairman of the Board of the Saskatchewan Potash Producers Association and was a director of Fertilizer Canada.
Corrine D. Ricard.
Ms. Ricard was appointed Senior Vice President - Commercial in February 2017 and is also currently overseeing our human resources organization. Prior to that time, she served as our Senior Vice President—Human Resources since April 2012, and before that she held a number of other leadership positions at Mosaic, including Vice President—International Distribution, Vice President—Business Development and Vice President—Supply Chain. Prior to Mosaic’s formation, Ms. Ricard worked for Cargill in various roles, including risk management, supply chain and commodity trading.
Karen A. Swager.
Ms. Swager was named Senior Vice President-Potash in January 2019. Previously, Ms. Swager held leadership positions at Mosaic, including Vice President - Minerals, Vice President - Mining Operations and General Manager in our Phosphates business. She also led the mine planning and strategy group for the Phosphates business.
Our executive officers are generally elected to serve until their respective successors are elected and qualified or until their earlier death, resignation or removal. No “family relationships,” as that term is defined in Item 401(d) of Regulation S-K, exist among any of the listed officers or between any such officer and any member of our board of directors.
Item 1A. Risk Factors.
Our business, financial condition or results of operations could be materially adversely affected by any of the risks and uncertainties described below.
Our Esterhazy mine has had an inflow of salt saturated brine for more than 30 years.
Since December 1985, we have had inflows of salt saturated brine into our Esterhazy, Saskatchewan mine. Over the past century, several potash mines experiencing water inflow problems have flooded. In order to control brine inflows at Esterhazy, we have incurred, and will continue to incur, expenditures, certain of which, due to their nature, have been capitalized, while others have been charged to expense.
At various times, we experience changing amounts and patterns of brine inflows at the Esterhazy mine. Periodically, some of these inflows have exceeded available pumping capacity. If that were to continue for several months without abatement, it could exceed our available storage capacity and ability to effectively manage the brine inflow. This could adversely affect production at the Esterhazy mine. The brine inflow is variable, resulting in both net inflows (the rate of inflow is more than the amount we are pumping out of the mine) and net outflows (when we are pumping more brine out of the mine than the rate of inflow). There can be no assurance that:
|
•
|
our pumping, surface storage, underground storage or injection well capacities for brine will continue to be sufficient, or that the pumping, grouting and other measures that we use to manage the inflows at the Esterhazy mine will continue to be effective;
|
|
•
|
there will not be a disruption in the supply of calcium chloride, which is a primary material used to reduce or prevent the flow of incoming brine;
|
|
•
|
our estimates of the volumes of net inflows or net outflows of brine, or storage capacity for brine at the Esterhazy mine, are accurate;
|
27
|
•
|
the volumes of the brine inflows will not fluctuate from time to time, the rate of the brine inflows will not be greater than our prior experience or current assumptions, changes in inflow patterns will not adversely affect our ability to locate and manage the inflows, or that any such fluctuations, increases or changes would not be material; and
|
the expenditures to control the inflows will be consistent with our prior experience or future estimates.
From time to time, new or improved technology becomes available to facilitate our remediation of the inflows, such as when horizontal drilling techniques were developed and refined. Taking advantage of these new or improved technologies may require significant capital expenditures and/or may increase our costs of remediation.
Due to the ongoing brine inflow at Esterhazy, subject to exceptions that are limited in scope and amount, we are unable to obtain insurance coverage for underground operations for water incursion problems. Our mines at Colonsay, Saskatchewan, and Carlsbad, New Mexico, are also subject to the risks of inflow of water as a result of our shaft mining operations.
It is possible that the costs of remedial efforts at Esterhazy may further increase in the future and that such an increase could be material, or, in the extreme scenario, that the brine inflows, risk to employees or remediation costs may increase to a level which would cause us to change our mining processes or abandon the mines. See the “Key Factors that can Affect Results of Operations and Financial Condition” and “Potash Net Sales and Gross Margin” sections of our Management’s Analysis, which sections are incorporated herein by reference, for a discussion of costs, risks and other information relating to the brine inflows.
Our operating results are highly dependent upon and fluctuate based upon business and economic conditions and governmental policies affecting the agricultural industry in which we or our customers operate. These factors are outside of our control and may significantly affect our profitability.
Our operating results are highly dependent upon business and economic conditions and governmental policies, which we cannot control, affecting the agricultural industry. The agricultural products business can be affected by a number of factors. The most important of these factors are:
|
•
|
weather patterns and field conditions (particularly during periods of traditionally high crop nutrients consumption);
|
|
•
|
quantities of crop nutrients imported to and exported from;
|
|
•
|
current and projected grain inventories and prices, which are heavily influenced by U.S. exports and world-wide grain markets; and
|
|
•
|
Governmental policies, including farm and biofuel policies, which may directly or indirectly influence the number of acres planted, the level of grain inventories, the mix of crops planted or crop prices or otherwise negatively affect our operating results.
|
International market conditions, which are also outside of our control, may also significantly influence our operating results. The international market for crop nutrients is influenced by such factors as the relative value of the U.S. dollar and its impact upon the cost of importing crop nutrients, foreign agricultural policies, including subsidy policies, the existence of, or changes in, import or foreign currency exchange barriers in certain foreign markets, changes in the hard currency demands of certain countries and other regulatory policies of foreign governments, as well as the laws and policies of the United States affecting foreign trade and investment.
Our most important products are global commodities, and we face intense global competition from other crop nutrient producers that can affect our prices and volumes.
Our most important products are concentrated phosphate crop nutrients, including diammonium phosphate, or DAP, monoammonium phosphate, or MAP, MicroEssentials
®
and muriate of potash, or MOP. We sell most of our DAP, MAP and MOP in the form of global commodities. Our sales of these products face intense global competition from other crop nutrient producers.
Changes in competitors’ production or shifts in their marketing focus have in the past significantly affected both the prices at which we sell our products and the volumes that we sell, and are likely to continue to do so in the future.
Competitors are more likely to increase their production at times when world agricultural and crop nutrient markets are strong, and to focus on sales into regions where their returns are highest. Increases in the global supply of DAP, MAP and MOP or competitors’ increased sales into regions in which we have significant sales could adversely affect our prices and volumes.
Competitors and potential new entrants in the markets for both concentrated phosphate crop nutrients and potash have in recent years expanded capacity, or begun, or announced plans, to expand capacity or build new facilities. The extent to which
28
current global or local economic and financial conditions, changes in global or local economic and financial conditions, or other factors may cause delays or cancellation of some of these ongoing or planned projects, or result in the acceleration of existing or new projects, is unclear. In addition, the level of exports by producers of concentrated phosphate crop nutrients in China depends to a significant extent on Chinese government actions to curb exports through, among other measures, prohibitive export taxes at times when the government believes it desirable to assure ample domestic supplies of concentrated phosphate crop nutrients to stimulate grain and oilseed production.
In addition, the other member of Canpotex is among our competitors who are expanding their potash production capacity. Each of Canpotex member's respective shares of Canpotex sales is based upon that member's respective proven peaking capacity for producing potash. When a Canpotex member expands its production capacity, the new capacity is added to that member’s proven peaking capacity based on a proving run at the maximum production level. Alternatively, after January 2017, Canpotex members may elect to rely on an independent engineering firm and approved protocols to calculate their proven peaking capacity. Antitrust and competition laws prohibit the members of Canpotex from coordinating their production decisions, including the timing of their respective proving runs. Worldwide potash production levels during these proving runs could exceed then-current market demand, resulting in an oversupply of potash and lower potash prices.
We cannot accurately predict when or whether competitors’ or new entrants’ ongoing or planned capacity expansions or new facilities will be completed, the timing of competitors’ tests to prove peaking capacity for Canpotex purposes, the cumulative effect of these and recently completed expansions, the impact of future decisions by the Chinese government on the level of Chinese exports of concentrated phosphate crop nutrients, or the effects of these or other actions by our competitors on the prices for our products or the volumes that we will be able to sell. The effects of any of these events occurring could be materially adverse to our results of operations.
Our crop nutrients and other products are subject to price and demand volatility resulting from periodic imbalances of supply and demand, which may cause our results of operations to fluctuate.
Historically, the market for crop nutrients has been cyclical, and prices and demand for our products have fluctuated to a significant extent, particularly for phosphates and, to a lesser extent, potash. Periods of high demand, increasing profits and high capacity utilization tend to lead to new plant investment and increased production in the industry. This growth increases supply until the market is over-saturated, leading to declining prices and declining capacity utilization until the cycle repeats.
As a result, crop nutrient prices and volumes have been, and are expected to continue to be, volatile. This price and volume volatility may cause our results of operations to fluctuate and potentially deteriorate. The price at which we sell our crop nutrient products and our sales volumes could fall in the event of industry oversupply conditions, which could have a material adverse effect on our business, financial condition and results of operations. In contrast, high prices may lead our customers and farmers to delay purchasing decisions in anticipation of future lower prices, thus impacting our sales volumes.
Due to reduced market demand, depressed agricultural economic conditions and other factors, we and our predecessors have at various times suspended or reduced production at some of our facilities. The extent to which we utilize available capacity at our facilities will cause fluctuations in our results of operations, as we will incur costs for any temporary or indefinite shutdowns of our facilities and lower sales tend to lead to higher fixed costs as a percentage of sales.
Variations in crop nutrient application rates may exacerbate the cyclicality of the crop nutrient markets.
Farmers are able to maximize their economic return by applying optimum amounts of crop nutrients. Farmers’ decisions about the application rate for each crop nutrient, or to forego application of a crop nutrient, particularly phosphate and potash, vary from year to year depending on a number of factors, including, among others, crop prices, crop nutrient and other crop input costs or the level of the crop nutrient remaining in the soil following the previous harvest. Farmers are more likely to increase application rates when crop prices are relatively high, crop nutrient and other crop input costs are relatively low and the level of the crop nutrient remaining in the soil is relatively low. Conversely, farmers are likely to reduce or forego application when farm economics are weak or declining or the level of the crop nutrients remaining in the soil is relatively high. This variability in application rates can materially accentuate the cyclicality in prices for our products and our sales volumes.
Our crop nutrient business is seasonal, which may result in carrying significant amounts of inventory and seasonal variations in working capital, and our inability to predict future seasonal crop nutrient demand accurately may result in excess inventory or product shortages.
The crop nutrient business is seasonal. Farmers tend to apply crop nutrients during two short application periods, the strongest one in the Spring, before planting, and the other in the Fall, after harvest. As a result, the strongest demand for our
29
products typically occurs during the Spring planting season, with a second period of strong demand following the Fall harvest. In contrast, we and other crop nutrient producers generally produce our products throughout the year. As a result, we and/or our customers generally build inventories during the low demand periods of the year in order to ensure timely product availability during the peak sales seasons. The seasonality of crop nutrient demand results in our sales volumes and net sales typically being the highest during the North American Spring season and our working capital requirements typically being the highest just prior to the start of the Spring season. Our quarterly financial results can vary significantly from one year to the next due to weather-related shifts in planting schedules and purchasing patterns.
If seasonal demand exceeds our projections, we will not have enough product and our customers may acquire products from our competitors, which would negatively impact our profitability. If seasonal demand is less than we expect, we will be left with excess inventory and higher working capital and liquidity requirements. The degree of seasonality of our business can change significantly from year to year due to conditions in the agricultural industry and other factors.
The distribution channels for crop nutrients have capacity to build significant levels of inventories, which can adversely affect our sales volumes and selling prices.
In order to balance the production needs of crop nutrient producers with farmers’ seasonal use of crop nutrients, crop nutrient distribution channels need to have the capacity to build significant inventories. The build-up of inventories in the distribution channels can become excessive, particularly during the cyclical periods of low demand that have been typical in the crop nutrient industry. When there are excessive inventories in the distribution channel, our sales volumes and selling prices can be adversely impacted, even during periods in which farmers’ use of crop nutrients may remain strong.
Changes in transportation costs can affect our sales volumes and selling prices.
The cost of delivery is a significant factor in the total cost to customers and farmers of crop nutrients. As a result, changes in transportation costs, or in customer expectations about them, can affect our sales volumes and prices.
Customer expectations about future events can have a significant effect on the demand for our products. These expectations can significantly affect our sales volumes and selling prices.
Customer expectations about future events have had and are expected to continue to have an effect on the demand and prices for crop nutrients. Future events that may be affected by customer expectations include, among others:
|
•
|
Customer expectations about future crop nutrient prices and availability.
|
Customer expectations about selling prices and availability of crop nutrients have had and are expected to continue to have an effect on the demand for crop nutrients. When customers anticipate increasing crop nutrient selling prices, customers tend to accumulate inventories before the anticipated price increases. This can result in a lag in our realization of rising market prices for our products. Conversely, customers tend to delay their purchases when they anticipate future selling prices for crop nutrients will stabilize or decrease, adversely affecting our sales volumes and selling prices. Customer expectations about availability of crop nutrients can have similar effects on sales volumes and prices.
|
•
|
Customer expectations about future farmer economics.
|
Similarly, customer expectations about future farmer economics have had and are expected to continue to have an effect on the demand for crop nutrients. When customers anticipate improving farmer economics, customers tend to accumulate crop nutrient inventories in anticipation of increasing sales volumes and selling prices. This can result in a lag in our realization of rising market prices for our products. Conversely, when customers anticipate declining farmer economics, customers tend to reduce the level of their purchases of crop nutrients, adversely affecting our sales volumes and selling prices.
|
•
|
Changes in customer expectations about transportation costs.
|
As discussed above, increasing transportation costs effectively increase customers’ and farmers’ costs for crop nutrients and can reduce the amount we realize for our sales. Expectations of decreasing transportation costs can result in customers and farmers anticipating that they may be able to decrease their costs by delaying purchases. As a result, changes in customer expectations about transportation costs can affect our sales volumes and prices.
30
We conduct our operations primarily through a limited number of key production and distribution facilities. Any disruption at any one of these facilities could have a material adverse impact on our business. The risk of material disruption increases when demand for our products results in high operating rates at our facilities.
We conduct our operations through a limited number of key production and distribution facilities. These facilities include our phosphate mines and concentrates plants; our potash mines; and the ports and other distribution facilities through which we, Canpotex and any joint ventures in which we participate, conduct our respective businesses, as well as other commercial arrangements with unrelated third parties. Any disruption of operations at any one of these facilities has the possibility of significantly affecting our production or our ability to distribute our products. Operating these facilities at high rates during periods of high demand for our products increases the risk of mechanical or structural failures, decreases the time available for routine maintenance and increases the impact on our operating results from any disruption. A disruption of operations at any one of our key facilities could have a material adverse effect on our results of operations or financial condition.
Examples of the types of events that could result in a disruption at one of these facilities include: adverse weather; strikes or other work stoppages; deliberate, malicious acts, including acts of terrorism; political and economic instability; cyber attacks; risks associated with our international operations; changes in permitting, financial assurance or other environmental, health and safety laws or other changes in the regulatory environment in which we operate; legal and regulatory proceedings; our relationships with the other member of Canpotex and any joint ventures in which we participate and their or our exit from participation in Canpotex or any such joint ventures; other changes in our commercial arrangements with unrelated third parties; brine inflows at our Esterhazy, Saskatchewan, mine or our other shaft mines; mechanical failure and accidents or other failures occurring in the course of operating activities, including at our gypstacks, clay settling areas and tailing dams; and other factors.
Insurance market conditions, our loss experience and other factors affect the insurance coverage that we carry, and we are not fully insured against all potential hazards and risks incident to our business. As a result, our insurance coverage may not adequately cover our losses.
We maintain property, business interruption and casualty insurance policies, but we are not fully insured against all potential hazards and risks incident to our business. We are subject to various self-retentions and deductibles under these insurance policies. As a result of market conditions, our loss experience and other factors, our premiums, self-retentions and deductibles for insurance policies can increase substantially and, in some instances, certain insurance may become unavailable or available only for reduced amounts of coverage. In addition, significantly increased costs could lead us to decide to reduce, or possibly eliminate, coverage. As a result, a disruption of operations at one of our key facilities or a significant casualty could have a material adverse effect on our results of operations or financial condition.
Important raw materials and energy used in our businesses in the past have been and may in the future be the subject of volatile pricing. Changes in the price of our raw materials could have a material impact on our businesses.
Natural gas, ammonia and sulfur are key raw materials used in the manufacture of phosphate crop nutrient products. Natural gas is used as both a chemical feedstock and a fuel to produce anhydrous ammonia, which is a raw material used in the production of concentrated phosphate products. Natural gas is also a significant energy source used in the potash solution mining process. From time to time, our profitability has been and may in the future be impacted by the price and availability of these raw materials and other energy costs. Because most of our products are commodities, there can be no assurance that we will be able to pass through increased costs to our customers. A significant increase in the price of natural gas, ammonia, sulfur or energy costs that is not recovered through an increase in the price of our related crop nutrients products could have a material adverse impact on our business. In addition, under our long-term CF Ammonia Supply Agreement we have agreed to purchase approximately
545,000
to
725,000
tonnes of ammonia per year during a term that may extend until December 31, 2032, and at a price to be determined by a formula based on the prevailing price of U.S. natural gas. If the price of natural gas rises or the market price for ammonia falls outside of the range anticipated at execution of this agreement, we may not realize a cost benefit from the natural gas-based pricing over the term of the agreement, or the cost of our ammonia under the agreement could become a competitive disadvantage.
During periods when the price for concentrated phosphates is falling because of falling raw material prices, we may experience a lag in realizing the benefits of the falling raw materials prices. This lag can adversely affect our gross margins and profitability.
During some periods, changes in market prices for raw materials can lead to changes in the global market prices for concentrated phosphate crop nutrients. In particular, the global market prices for concentrated phosphate crop nutrients can be affected by changes in the market prices for sulfur, ammonia, phosphate rock and/or phosphoric acid raw materials.
31
Increasing market prices for these raw materials tend to put upward pressure on the selling prices for concentrated phosphate crop nutrients, and decreasing market prices for these raw materials tend to put downward pressure on selling prices for concentrated phosphate crop nutrients. When the market prices for these raw materials plunge rapidly, the selling prices for our concentrated phosphate crop nutrients can fall more rapidly than we are able to consume our raw material inventory that we purchased or committed to purchase in the past at higher prices. As a result, our costs may not fall as rapidly as the selling prices of our products. Until we are able to consume the higher-priced raw materials, our gross margins and profitability can be adversely affected.
During periods when the prices for our products are falling because of falling raw material prices, we could be required to write-down the value of our inventories. Any such write-down would adversely affect our results of operations and the level of our assets.
We carry our inventories at the lower of cost or market. In periods when the market prices for our products are falling rapidly, including in response to falling market prices for raw materials, it is possible that we could be required to write-down the value of our inventories if market prices fall below our costs. Any such write-down would adversely affect our results of operations and the value of our assets. Any such effect could be material.
Our estimates of future selling prices reflect in part the purchase commitments we have from our customers. As a result, defaults on these existing purchase commitments because of the global or local economic and financial conditions or for other reasons could adversely affect our estimates of future selling prices and require additional inventory write-downs.
In the event of a disruption to existing terminaling facilities or transportation for our products or raw materials, alternative terminaling facilities or transportation might not be available on a timely basis or have sufficient capacity to fully serve all of our customers or facilities.
In the event of a disruption of existing terminaling facilities or transportation for our products or raw materials, alternative terminaling facilities or transportation might not be available on a timely basis or have sufficient capacity to fully serve all of our customers or facilities.
Terminaling facilities and transportation include the ports and other distribution facilities through which we, Canpotex and the joint ventures in which we participate, conduct our respective businesses; transportation and related equipment arrangements; and other commercial arrangements with unrelated third parties.
Examples of the types of events that could result in a disruption of terminaling facilities or transportation include: adverse weather; strikes or other work stoppages; deliberate, malicious acts, including cyber attacks; political and economic instability and other risks associated with our international operations; changes in permitting, financial assurance or other environmental, health and safety laws or other changes in the regulatory environment in which we operate; legal and regulatory proceedings; our relationships with the other member of Canpotex and any joint ventures in which we participate and their or our exit from participation in Canpotex or any such joint ventures; other changes in our commercial arrangements with unrelated third parties; accidents occurring in the course of operating activities; lack of truck, rail, barge or ship transportation; and other factors. We discuss a number of these examples in more detail throughout this Risk Factors section. Such disruption could adversely impact our business and financial results of operations.
We are subject to risks associated with our international sales and operations, which could negatively affect our sales to customers in foreign countries as well as our operations and assets in foreign countries. Some of these factors may also make it less attractive to distribute cash generated by our operations outside the United States to our stockholders, or to utilize cash generated by our operations in one country to fund our operations or repayments of indebtedness in another country or to support other corporate purposes.
For
2018
, we derived approximately
69%
of our net sales from customers located outside of the United States. As a result, we are subject to numerous risks and uncertainties relating to international sales and operations, including:
|
•
|
difficulties and costs associated with complying with a wide variety of complex laws, treaties and regulations;
|
|
•
|
unexpected changes in regulatory environments;
|
|
•
|
increased government ownership and regulation of the economy in the countries we serve;
|
|
•
|
political and economic instability, including the possibility for civil unrest, inflation and adverse economic conditions resulting from governmental attempts to reduce inflation, such as imposition of higher interest rates and wage and price controls;
|
|
•
|
unpredictable tax audit practices of various governments;
|
32
|
•
|
nationalization of properties by foreign governments;
|
|
•
|
the imposition of tariffs, exchange controls, trade barriers or other restrictions, or government-imposed increases in the cost of resources and materials necessary for the conduct of our operations or the completion of strategic initiatives, including with respect to our joint ventures; and
|
|
•
|
currency exchange rate fluctuations between the U.S. dollar and foreign currencies, particularly the Brazilian real and the Canadian dollar.
|
The occurrence of any of the above in the countries in which we operate or elsewhere could jeopardize or limit our ability to transact business there and could adversely affect our revenues and operating results and the value of our assets located outside of the United States.
In addition, tax regulations and tax audit practices, currency exchange controls and other restrictions may also make it economically unattractive to:
|
•
|
distribute cash generated by our operations outside the United States to our stockholders; or
|
|
•
|
utilize cash generated by our operations in one country to fund our operations or repayments of indebtedness in another country or to support other corporate purposes.
|
Changes in tax laws or regulations or their interpretation, or exposure to additional tax liabilities, could materially adversely affect our operating results and financial condition.
We are subject to taxes, including income taxes, resource taxes and royalties, and non-income based taxes in the U.S., Canada, China, Brazil and other countries where we operate. Changes in tax laws or regulations or their interpretation could result in higher taxes, which could materially adversely affect our operating results and financial condition.
In 2018, U.S. federal tax law changes took effect. This was a significant change to the U.S. tax system of taxation resulting in numerous areas open to interpretation given the newness and breadth of changes to the rules. As a result, risk exists related to developing interpretation and application of the new rules that could result in higher taxes which could materially adversely affect our operating results and financial condition.
We are subject to periodic audits by various levels of tax authorities in all countries where we have meaningful operations. The due process, audit and appeal practices and procedures of such authorities may vary significantly by jurisdiction, may be unpredictable (and unreliable) in nature and may result in significant risk to us. For various reason, some governments may issue significant reassessments on audit based positions not fully grounded in law or in fact, even though, upon disputing the reassessments, a great many are overturned on administrative appeal and through the court system. Certain systems involve tax litigation as a common practice. In certain countries, there are requirements to pay a reassessment (even though the matter has not been finally decided by the tax administration or a court of law) while the taxpayer has a well-supported objection and appeals administratively or in court. This may result in tying up significant funds and/or creating adverse treasury and credit risks that may interrupt, impede or otherwise materially affect our business operations.
Our assets outside of North America are located in countries with volatile conditions, which could subject us and our assets to significant risks.
We are a global business with substantial assets located outside of the United States and Canada. Our operations in Brazil, China, India and Paraguay are a fundamental part of our business. We have a majority interest in the joint venture entity operating the Miski Mayo mine in Peru that supplies phosphate rock to us. We also have a joint venture investment in MWSPC, which operates a mine and chemical complexes that produce phosphate fertilizers and other downstream products in the Kingdom of Saudi Arabia. Volatile economic, political and market conditions in these and other emerging market countries may have a negative impact on our operations, operating results and financial condition. In addition, unfavorable changes in trade protection laws, policies and measures, or governmental actions and policies and other regulatory requirements affecting trade and the pricing and sourcing of our raw materials, may also have a negative impact on our operations, operating results and financial condition.
Natural resource extraction is an important part of the economy in Peru, and, in the past, there have been protests against other natural resource operations in Peru. There remain numerous social conflicts that exist within the natural resource sector in Peru. As a result, there is potential for active protests against natural resource companies. If the Government of Peru’s proactive efforts to address the social and environmental issues surrounding natural resource activities are not successful, protests could extend to or impact the Miski Mayo mine and adversely affect our interest in the Miski Mayo joint venture or the supply of phosphate rock to us from the mine.
33
Adverse weather conditions, including the impact of hurricanes, and excess heat, cold, snow, rainfall and drought, have in the past, and may in the future, adversely affect our operations, particularly our Phosphates business, and result in increased costs, decreased production and potential liabilities.
Adverse weather conditions, including the impact of hurricanes and excess heat, cold, snow, rainfall and drought, have in the past and may in the future adversely affect our operations, particularly our Phosphates business. In the past, hurricanes have resulted in minor physical damage to our facilities in Florida and Louisiana. In addition, a release of process wastewater at our Riverview, Florida facility during a 2004 hurricane resulted in a small civil fine, settlement for an immaterial amount of claims for natural resource damages by governmental agencies and an ongoing private lawsuit.
Additionally, water treatment costs, particularly at our Florida operations, due to high water balances, tend to increase significantly following excess rainfall from hurricanes or other adverse weather. Some of our Florida facilities have had or could have high water levels that may require treatment. High water balances in the past at phosphate facilities in Florida also led the Florida Department of Environmental Protection (“
FDEP
”) to adopt new rules requiring phosphate production facilities to meet more stringent process water management objectives for phosphogypsum management systems.
If additional excess rainfall or hurricanes occur in coming years, our facilities may be required to take additional measures to manage process water to comply with existing or future requirements and these measures could potentially have a material effect on our business and financial condition.
Adverse weather may also cause a loss of production due to disruptions in our supply chain or adversely affect delivery of our products to our customers. For example, oil refineries that supply sulfur to us may suspend operations as a result of a hurricane, and incoming shipments of ammonia can be delayed, disrupting production at our Florida or Louisiana facilities and delivery of our products.
Drought can also adversely affect us. For example, drought can reduce farmers’ crop yields and the uptake of phosphates and potash, reducing the need for application of additional phosphates and potash for the next planting season. Drought can also lower river levels, adversely affecting delivery of our products to our customers.
Our operations are dependent on having the required permits and approvals from governmental authorities. Denial or delay by a government agency in issuing any of our permits and approvals or imposition of restrictive conditions on us with respect to these permits and approvals may impair our business and operations.
We hold numerous governmental environmental, mining and other permits and approvals authorizing operations at each of our facilities. Our ability to continue operations at a facility could be materially affected by a government agency decision to deny or delay issuing a new or renewed permit or approval, to revoke or substantially modify an existing permit or approval or to substantially change conditions applicable to a permit modification, or by legal actions that successfully challenge our permits.
Expanding our operations or extending operations into new areas is also predicated upon securing the necessary environmental or other permits or approvals. We have been engaged in, and over the next several years, we and our subsidiaries will be continuing our, efforts to obtain permits in support of our anticipated Florida mining operations at certain of our properties.
A denial of our permits, the issuance of permits with cost-prohibitive conditions, substantial delays in issuing key permits, or legal actions that prevent us from relying on permits or revocation of permits, could prevent us from mining at certain of our properties and thereby have a material adverse effect on our business, financial condition or results of operations.
For example:
|
•
|
In Florida, local community involvement has become an increasingly important factor in the permitting process for mining companies, and various counties and other parties in Florida have in the past filed and continue to file lawsuits challenging the issuance of some of the permits we require. These actions can significantly delay issuance of the permits we need to initiate mining.
|
|
•
|
Delays in receiving a federal permit authorizing impacts to jurisdictional wetlands and waters can impact the scheduled progression of mining activities. For example, due to delays in obtaining the federal CWA Section 404 Permit for the new 24,000 acre Ona Mine in Hardee County, Florida, the mining plan and schedule were modified to limit mining to a 900-acre upland area where no jurisdictional wetlands or waters existed. Since we had already obtained the required State and County approvals for the Ona Mine, mining would start in the upland-only area because no federal 404 Permit would be required. Implementing the upland mining option was caused by the federal
|
34
permitting delay but was necessary to maintain an adequate supply of phosphate rock. The initial site preparation work commenced in late 2018 and was confined to the Ona Mine upland area. Continuing to limit mining to the upland-only area of the Ona Mine would have severely reduced the amount of phosphate rock extracted from the property, increased site preparation costs, resulted in much lower production grade, and increased reclamation costs. Issuance of the federal 404 Permit for the entire Ona Mine in late December 2018 avoided the need to continue with the upland-only backup plan.
We have included additional discussion about permitting for our phosphate mines in Florida under “Environmental, Health, Safety and Security Matters—Operating Requirements and Impacts—Permitting” in our Management’s Analysis.
We are subject to financial assurance requirements as part of our routine business operations. These financial assurance requirements affect our costs and increase our liquidity requirements. If we were unable to satisfy applicable financial assurance requirements, we might not be able to obtain or maintain permits we need to operate our business as we have in the past. Our need to comply with these requirements could materially affect our business, results of operations or financial condition.
In many cases, as a condition to procuring or maintaining permits and approvals or otherwise, we are required to comply with financial assurance requirements of governmental authorities. The purpose of these requirements is to provide comfort to the government that sufficient funds will be available for the ultimate closure, post-closure care or reclamation of our facilities.
In some cases, we are able to comply through the satisfaction of applicable state financial strength tests. But, if we are unable to do so, we must utilize alternative methods of complying with the financial assurance requirements or we would be prevented from continuing our mining operations and also could be subject to enforcement proceedings brought by relevant government agencies. Potential alternative methods of compliance include providing credit support in the form of cash escrows or trusts, surety bonds from surety or insurance companies, letters of credit from banks, or other forms of financial instruments or collateral to satisfy the financial assurance requirements or negotiating a consent agreement that establishes a different form of financial assurance. Use of alternative means of financial assurance imposes additional expense on us. Some of them, such as letters of credit, also use a portion of our available liquidity. Other alternative means of financial assurance, such as surety bonds, may in some cases require collateral and generally require us to obtain a discharge of the bonds or to post additional collateral (typically in the form of cash or letters of credit) at the request of the issuer of the bonds. Collateral that is required may be in many forms including letters of credit or other financial instruments that utilize a portion of our available liquidity, or in the form of assets such as real estate, which reduces our flexibility to manage or sell assets.
For example:
|
•
|
With respect to two facilities we acquired as part of our acquisition of the Florida phosphate assets and assumption of certain related liabilities of CF (the “
CF Phosphate Assets Acquisition
”), (i) we currently use a financial test supported by a corporate guarantee to meet Florida state regulations governing financial assurance related to the post-closure care of the phosphogypsum stack at our closed Bonnie facility in Florida, and (ii) under the terms of a consent decree with federal and state regulators we currently provide credit support in the form of a surety bond from insurance companies, as a means of financial assurance for closure and post-closure care requirements for the phosphogypsum stack at our Plant City, Florida facility. These financial assurance funding obligations require estimates of future expenditures that could be impacted by refinements in scope, technological developments, cost inflation, changes in regulations, discount rates and the timing of activities. Additional financial assurance commitments could be required in the future if increases in cost estimates exceed the assurance amount currently in place. In addition, with respect to the Plant City facility, our use of a surety bond may in some cases require that we obtain a discharge of the bond or post collateral at the request of the issuers of the bond. Required collateral may be in many forms including letters of credit or other financial instruments that utilize a portion of our available liquidity. Any of these circumstances could materially adversely affect our business, results of operations or financial condition.
|
|
•
|
As more fully discussed in Note
14
of our Notes to Consolidated Financial Statements, in 2016 under the terms of two consent decrees with federal and state regulators, we deposited a total of $630 million into two trust funds to provide additional financial assurance for the estimated costs of closure and post-closure care of most of our other phosphogypsum management systems in Florida (excluding those acquired as part of the CF Phosphate Assets Acquisition) and Louisiana. As required under one of the consent decrees, we have also issued a $50 million letter of credit to further support our financial assurance obligations. We have also agreed to guarantee the difference between the amounts held in each trust fund (including earnings) and the estimated closure and long-term care costs. Compliance with the financial assurance requirements included in these consent decrees satisfies substantially all of
|
35
our state financial assurance obligations relating to the covered facilities, which were historically satisfied without the need for any expenditure of corporate funds, to the extent our financial statements met certain balance sheet and income statement financial strength tests.
In the past, we have also not always been able to satisfy applicable financial strength tests, and, in the future, it is possible that we will not be able to pass the applicable financial strength tests, negotiate or receive approval of consent decrees, establish escrow or trust accounts or obtain letters of credit, surety bonds or other financial instruments on acceptable terms and conditions or at a reasonable cost, or that the form and/or cost of compliance could increase, which could materially adversely affect our business, results of operations or financial condition.
We have included additional discussion about financial assurance requirements under “Off Balance Sheet Arrangements and Obligations—Other Commercial Commitments” in our Management’s Analysis.
The other environmental, health and safety regulations to which we are subject may also have a material adverse effect on our business, financial condition and results of operations.
In addition to permitting and financial assurance requirements, we are subject to numerous other environmental, health and safety laws and regulations in the U.S., Canada, China, Brazil and other countries where we operate. These laws and regulations govern a wide range of matters, including environmental controls, land reclamation, discharges to air and water and remediation of hazardous substance releases. They significantly affect our operating activities as well as the level of our operating costs and capital expenditures. In some international jurisdictions, environmental laws change frequently and it may be difficult for us to determine if we are in compliance with all material environmental laws at any given time. If we are not in compliance, or the changes require new investment in our business, our financial condition and results of operations may be materially adversely affected.
We are, and may in the future be, involved in legal and regulatory proceedings that could be material to us. These proceedings include “legacy” matters arising from activities of our predecessor companies and from facilities and businesses that we have never owned or operated.
We have in the past been, are currently and in the future, may be subject to legal and regulatory proceedings that could be material to our business, results of operations, liquidity or financial condition. Joint ventures in which we participate could also become subject to these sorts of proceedings. These proceedings may be brought by the government or private parties and may arise out of a variety of matters, including:
|
•
|
Allegations by the government or private parties that we have violated the permitting, financial assurance or other environmental, health and safety laws and regulations discussed above. For example, in connection with our settlement of matters relating to the U.S. Environmental Protection Agency’s ongoing review of mineral processing industries under the U.S. Resource Conservation and Recovery Act, we entered into the consent decrees discussed above and in Note
14
of our Notes to Consolidated Financial Statements, which required us to provide additional financial assurance as described above, pay cash penalties of approximately $8 million in the aggregate, modify certain operating practices and undertake certain capital improvement projects over a period of several years that are expected to result in capital expenditures likely to exceed $200 million in the aggregate. We are also involved in other proceedings alleging that, or to review whether, we have violated environmental laws in the United States and Brazil.
|
|
•
|
Other environmental, health and safety matters, including alleged personal injury, wrongful death, complaints that our operations are adversely impacting nearby farms and other business operations, other property damage, subsidence from mining operations, spills or releases to the environment, natural resource damages and other damage to the environment, arising out of operations, including accidents, could result in material impacts to our operations and facilities. For example, several actions were initiated by the government and private parties related to a release of process wastewater at our Riverview, Florida facility in connection with a 2004 hurricane. In addition, a putative class action lawsuit was filed following the water loss incident that occurred at our New Wales, Florida facility in 2016. In connection with that incident, we also entered into an administrative consent order with the FDEP, as discussed in greater detail in Note
22
of our Notes to Consolidated Financial Statements.
|
|
•
|
Antitrust, commercial, tax (including tax audits) and other disputes. For example, we were one of a number of defendants in multiple class-action lawsuits, in which the plaintiffs sought unspecified amounts of damages including treble damages, alleging that we and other defendants conspired to, among other matters, fix the price at which potash was sold in the United States, allocated market shares and customers and fraudulently concealed their
|
36
anticompetitive conduct. In January 2013, we settled these class action antitrust lawsuits for an aggregate of $43.8 million.
The legal and regulatory proceedings to which we are currently or may in the future be subject can, depending on the circumstances, result in monetary damage awards, fines, penalties, other liabilities, injunctions or other court or administrative rulings that interrupt, impede or otherwise materially affect our business operations, and/or criminal sanctions.
Among other environmental laws, the U.S. Comprehensive Environmental Response, Compensation, and Liability Act (“
CERCLA
”) imposes liability, including for cleanup costs, without regard to fault or to the legality of a party’s conduct, on certain categories of persons, including current and former owners and operators of a site and parties who are considered to have contributed to the release of “hazardous substances” into the environment. Under CERCLA, or various U.S. state analogues, a party may, under certain circumstances, be required to bear more than its proportional share of cleanup costs at a site where it has liability if payments cannot be obtained from other responsible parties. As a crop nutrient company producing and managing chemicals, we periodically may incur liabilities and cleanup costs, under CERCLA and other environmental laws, with regard to our current or former facilities, adjacent or nearby third-party facilities or offsite disposal locations.
Pending and potential legal and regulatory proceedings may arise out of our present activities, including operations at current facilities. They may also arise out of past activities by us, our predecessor companies and subsidiaries that our predecessors have sold. These past activities were in some cases at facilities that we and our subsidiaries no longer own or operate and may have never owned or operated.
Settlements of legal and regulatory matters frequently require court approval. In the event a court were not to approve of a settlement, it is possible that we and the other party or parties to the matter might not be able to settle it on terms that were acceptable to all parties or that we could be required to accept more stringent terms of settlement than required by the opposing parties.
We have included additional information with respect to pending legal and regulatory proceedings in Note
22
of our Notes to Consolidated Financial Statements and in this report in Part I, Item 3, “Legal Proceedings”.
These legal and regulatory proceedings involve inherent uncertainties and could negatively impact our business, results of operations, liquidity or financial condition.
The permitting, financial assurance and other environmental, health and safety laws and regulations to which we are subject may become more stringent over time. This could increase the effects on us of these laws and regulations, and the increased effects could be material.
Continued government and public emphasis on environmental, health and safety issues in the U.S., Canada, China, Brazil, Paraguay and other countries where we operate can be expected to result in requirements that apply to us and our operations that are more stringent than those that are described above and elsewhere in this report. These more stringent requirements may include, among other matters;
|
•
|
Increased levels of future investments and expenditures for environmental controls at ongoing operations, which will be charged against income from future operations; increased levels of the financial assurance requirements to which we are subject, increased efforts or costs to obtain permits or denial of permits.
|
|
•
|
Other new or interpretations of existing statutes or regulations that impose new or more stringent restrictions or liabilities, including liabilities or additional financial assurance requirements under CERCLA or similar statutes, restrictions or liabilities related to elevated levels of naturally-occurring radiation that arise from disturbing the ground in the course of mining activities; and other matters that could increase our expenses, capital requirements or liabilities or adversely affect our business, liquidity or financial condition. In addition, to the extent restrictions imposed in countries where our competitors operate, such as China, India, Former Soviet Union countries or Morocco, are less stringent than in the countries where we operate, our competitors could gain cost or other competitive advantages over us. These effects could be material.
|
Among other matters, in recent years there have been a number of initiatives relating to nutrient discharges. New regulatory restrictions developed through these initiatives could have a material effect on either us or our customers. For example, the Gulf Coast Ecosystem Restoration Task Force, established by executive order of the President and comprised of five Gulf States and eleven federal agencies, delivered a final strategy for long-term ecosystem restoration for the Gulf Coast in 2016. The strategy calls for, among other matters, reduction of the flow of excess nutrients into the Gulf through state nutrient reduction frameworks, new nutrient reduction approaches and reduction of agricultural and urban sources of excess nutrients.
37
Implementation of the strategy will require legislative or regulatory action at the state level. We cannot predict what the requirements of any such legislative or regulatory action could be or whether or how it would affect us or our customers.
In June 2015, the EPA and the Corps jointly issued a final rule that proposed to clarify but may actually expand the scope of waters regulated under the federal Clean Water Act. The final rule (the “2015
Clean Water Rule
”) became effective in August 2015, but has been challenged through numerous lawsuits. In October 2015, the U.S. Court of Appeals for the Sixth Circuit issued an order staying the effectiveness of the final rule nationwide pending adjudication of substantive challenges to the rule. In June 2017, EPA and the Corps issued a proposed rule that would rescind the Clean Water Rule and re-codify regulatory text that existed prior to enactment of the 2015 Clean Water Rule.
In January 2018, the U.S. Supreme Court unanimously held all challenges to the 2015 Clean Water Rule must be heard in federal district courts rather than in the federal courts of appeal, overruling a decision by the Sixth Circuit Court of Appeals. With the Sixth Circuit Court of Appeals no longer having jurisdiction, that court lifted its 2015 nationwide stay in February 2018. After the nationwide stay was lifted, a number of U.S. District Courts revived dormant litigation that challenged the 2015 Clean Water Rule. In June 2018, the U.S. District Court for the Southern District of Georgia entered an injunction against implementation of the 2015 Clean Water Rule covering 11 states, including Florida. As of September 18, 2018, federal district courts have put the 2015 Clean Water Rule on hold in 28 states. The 2015 Clean Water Rule is now in effect in 22 states, the District of Columbia, and the U.S. territories.
On December 11, 2018, the EPA and Corps issued a proposed new Clean Water Rule that is designed to replace the 2015 Clean Water Rule. The agencies' proposed rule is intended to provide clarity, predictability and consistency so that the regulated community can better understand where the Clean Water Act applies - and where it does not.
We believe the 2015 Clean Water Rule, if not rescinded, or replaced by the proposed rule issued on December 11, 2018, may expand the types and extent of water resources regulated under federal law, therefore potentially expanding our permitting and reporting requirements, increasing our costs of compliance, including costs associated with wetlands and stream mitigation, lengthening the time necessary to obtain permits, and potentially restricting our ability to mine certain of our phosphate rock reserves. These effects could be material.
Regulatory restrictions on greenhouse gas emissions and climate change regulations in the United States, Canada or elsewhere could adversely affect us, and these effects could be material.
Various governmental initiatives to limit greenhouse gas emissions are under way or under consideration around the world. These initiatives could restrict our operating activities, require us to make changes in our operating activities that would increase our operating costs, reduce our efficiency or limit our output, require us to make capital improvements to our facilities, increase our energy, raw material and transportation costs or limit their availability, or otherwise adversely affect our results of operations, liquidity or capital resources, and these effects could be material to us.
Governmental greenhouse gas emission initiatives include, among others
,
the December 2015 agreement (the “
Paris Agreement
”) which was the outcome of the 21
st
session of the Conference of the Parties under the United Nations Framework Convention on Climate Change (UNFCCC). The Paris Agreement, which was signed by nearly 200 nations, including the United States and Canada, entered into force in late 2016 and sets out a goal of limiting the average rise in temperatures for this century to below 2 degrees Celsius. Each signatory is expected to develop its own plan (referred to as a Nationally Determined Contribution, or “
NDC
”) for reaching that goal.
In May 2017, the United States President announced that the United States would withdraw from the Paris Agreement. Under Article 28 of that agreement, the earliest such a withdrawal could be effective is November 2020. In 2015, prior to this announcement, the United States had submitted an NDC aiming to achieve, by 2025, an economy-wide target of reducing greenhouse gas emissions by 26-28% below its 2005 level. The NDC also aims to use best efforts to reduce emissions by 28%. The U.S. target covers all greenhouse gases that were a part of the 2014 Inventory of
Greenhouse Gas Emissions and Sinks. While it is unclear whether the U.S. executive administration will proceed to withdraw from the Paris Agreement, various legislative or regulatory initiatives relating to greenhouse gases have been adopted or considered by the U.S. Congress, the EPA or various states and those initiatives already adopted may be used to implement the U.S.’s NDC. Additionally, more stringent laws and regulations may be enacted to accomplish the goals set out in the NDC.
Canada’s intended NDC aims to achieve, by 2030, an economy-wide target of reducing greenhouse gas emissions by 30% below 2005 levels. In late 2016, the federal government announced plans for a comprehensive tax on carbon emissions, under which provinces opting out of the tax would have the option of adopting a cap-and-trade system. In the plans, the federal government also committed to implementing a federal carbon pricing backstop system that will apply in any province or territory that does not have a carbon pricing system in place by 2018.
As of January 1, 2019, a carbon tax of $20/tonne
38
now applies in Canada for any emitter not covered under the federal backstop program or approved provincial program. In addition, the Province of Saskatchewan, in which our Canadian potash mines are located, has publicly stated that a carbon pricing system will not be implemented in the province and that legal action will be sought against the federal government. In December 2017, Saskatchewan announced a comprehensive plan to address climate change that does not include an economy-wide price on carbon but does include a system of tariffs and credits for large emitters. The plan was reviewed and approved, in part, by the federal government in October 2018. Our Saskatchewan Potash facilities will be subject to the Saskatchewan climate change plan regarding emissions at our facilities; however, indirect costs from the carbon tax associated with electricity, natural gas consumption, and transportation may be passed through to Mosaic. As implementation of the Paris Agreement proceeds, more stringent laws and regulations may be enacted to accomplish the goals set out in Canada's NDC, such as the Clean Fuel Standard, which is now under development in Ottawa. We will also continue to monitor developments relating to the legislation, as well as the potential future effect on our operating activities, energy, raw material and transportation costs, results of operations, liquidity or capital resources.
It is possible that future legislation or regulation addressing climate change, including in response to the Paris Agreement or any new international agreements, could adversely affect our operating activities, energy, raw material and transportation costs, results of operations, liquidity or capital resources, and these effects could be material or adversely impact our competitive advantage. In addition, to the extent climate change restrictions imposed in countries where our competitors operate, such as China, India, Former Soviet Union countries or Morocco, are less stringent than in the United States or Canada, our competitors could gain cost or other competitive advantages over us.
Future climate change could adversely affect us.
The prospective impact of climate change on our operations and those of our customers and farmers remains uncertain. Scientists have hypothesized that the impacts of climate change could include changes in rainfall patterns, water shortages, changing sea levels, changing storm patterns and intensities, and changing temperature levels and that these changes could be severe. These impacts could vary by geographic location. Severe climate change could impact our costs and operating activities, the location and cost of global grain and oilseed production, and the supply and demand for grains and oilseeds. At the present time, we cannot predict the prospective impact of climate change on our results of operations, liquidity or capital resources, or whether any such effects could be material to us.
Some of our competitors and potential competitors have greater resources than we do, which may place us at a competitive disadvantage and adversely affect our sales and profitability. These competitors include state-owned and government-subsidized entities in other countries.
We compete with a number of producers throughout the world, including state-owned and government-subsidized entities. Some of these entities may have greater total resources than we do, and may be less dependent on earnings from crop nutrients sales than we are. In addition, some of these entities may have access to lower cost or government-subsidized natural gas supplies, placing us at a competitive disadvantage. Furthermore, certain governments as owners of some of our competitors may be willing to accept lower prices and profitability on their products in order to support domestic employment or other political or social goals. To the extent other producers of crop nutrients enjoy competitive advantages or are willing to accept lower profit levels, the price of our products, our sales volumes and our profits may be adversely affected.
We do not own a controlling equity interest in our non-consolidated companies, some of which are foreign companies, and therefore our operating results and cash flow may be materially affected by how the governing boards and majority owners operate such businesses. There may also be limitations on monetary distributions from these companies that are outside of our control. Together, these factors may lower our equity earnings or cash flow from such businesses and negatively impact our results of operations.
In 2013, we entered into an agreement to form MWSPC, a joint venture to develop a mine and chemical complexes for an estimated
$8.0 billion
that produces phosphate fertilizers and other downstream products in the Kingdom of Saudi Arabia. We have a 25% interest in the joint venture and expect our cash investment could be up to
$840 million
, approximately
$770 million
of which had been funded as of December 31, 2018. The success of MWSPC will depend on, among other matters, the completion of development and full commencement of operations of production facilities in the Kingdom of Saudi Arabia, the future success of current plans for completion of the development and for the operation of MWSPC, including the availability and affordability of necessary resources and materials and access to appropriate infrastructure, and any future changes in those plans, as well as the general economic and political stability of the region.
39
We also hold minority ownership interests in companies that are not controlled by us. We expect that the operations and results of MWSPC will be, and the operations or results of some of the other companies are, significant to us, and their operations can affect our earnings. Because we do not control these companies either at the board or stockholder levels and because local laws in foreign jurisdictions and contractual obligations may place restrictions on monetary distributions by these companies, we cannot ensure that these companies will operate efficiently (or, in the case of MWSPC, in compliance with the terms of any funding facility for which we may provide financial guarantees), pay dividends, or generally follow the desires of our management by virtue of our board or stockholder representation. As a result, these companies may contribute less than anticipated to our earnings and cash flow, negatively impacting our results of operations and liquidity. Additionally, in the case of MWSPC, we may be called upon to provide funds to satisfy MWSPC’s debt obligations to the extent we provide financial guarantees in connection with its funding facilities.
Strikes or other forms of work stoppage or slowdown could disrupt our business and lead to increased costs.
Our financial performance is dependent on a reliable and productive work force. A significant portion of our workforce, and that of the joint ventures in which we participate, is covered by collective bargaining agreements with unions. Unsuccessful contract negotiations or adverse labor relations could result in strikes or slowdowns. Any disruptions may decrease our production and sales or impose additional costs to resolve disputes. The risk of adverse labor relations may increase as our profitability increases because labor unions’ expectations and demands generally rise at those times.
Accidents occurring in the course of our operating activities could result in significant liabilities, interruptions or shutdowns of facilities or the need for significant safety or other expenditures.
We engage in mining and industrial activities that can result in serious accidents. If our safety procedures are not effective, or if an accident occurs, we could be subject to liabilities arising out of personal injuries or death, our operations could be interrupted and we might have to shut down or abandon affected facilities. Accidents could cause us to expend significant amounts to remediate safety issues or to repair damaged facilities. For example:
|
•
|
Some of our facilities are subject to potential damage from earthquakes.
|
The excavation of mines can result in potential seismic events or can increase the likelihood or potential severity of a seismic event. The rise and fall of water levels, such as those arising from the brine inflows and our remediation activities at our Esterhazy mine, can also result in or increase the likelihood or potential severity of a seismic event. Our Esterhazy mine has experienced minor seismic events from time to time and southern Louisiana has had at least one such experience recently. A significant seismic event at one of our facilities or mines could result in serious injuries or death, or damage to or flooding operations, or damage to adjoining properties or facilities of unrelated third parties. In an extreme scenario, seismic activity could cause us to disrupt our operations, or change our mining process or abandon the mine.
|
•
|
Our underground potash shaft mines are subject to risk from fire. In the event of a fire, if our emergency procedures are not successful, we could have significant injuries or deaths. In addition, fire at one of our underground shaft mines could halt our operations at the affected mine while we investigate the origin of the fire or for longer periods for remedial work or otherwise.
|
Our underground potash shaft mines at Esterhazy and Colonsay, Saskatchewan, Carlsbad, New Mexico and Taquari-Vassouras, Brazil are subject to risk from fire. Any failure of our safety procedures in the future could result in serious injuries or death, or shutdowns, which could result in significant liabilities and/or impact on the financial performance of our Potash business, including a possible material adverse effect on our results of operations, liquidity or financial condition.
|
•
|
We handle significant quantities of ammonia at several of our facilities. If our safety procedures are not effective, an accident involving our ammonia operations could result in serious injuries or death, or result in the shutdown of our facilities.
|
We produce ammonia at our Faustina, Louisiana phosphate concentrates plant, use ammonia in significant quantities at all of our Florida and Louisiana phosphates concentrates plants and store ammonia at some of our distribution facilities. For our Florida phosphates concentrates plants, ammonia is received at terminals in Tampa and transported by pipelines to our facilities. We also use ammonia in our Brazil phosphate operations. Our ammonia is generally stored and transported at high pressures or cryogenically. An accident could occur that could result in serious injuries or death, or the evacuation of areas near an accident. An accident could also result in property damage or the
40
shutdown of our phosphates concentrates plants, the ammonia terminals, or pipelines serving those plants or our other ammonia storage and handling facilities. As a result, an accident involving ammonia could have a material adverse effect on our results of operations, liquidity or financial condition.
|
•
|
We also use or produce other hazardous or volatile chemicals at some of our facilities. If our safety procedures are not effective, an accident involving these other hazardous or volatile chemicals could result in serious injuries or death, or result in the shutdown of our facilities.
|
We use sulfuric acid in the production of concentrated phosphates in our Florida and Louisiana U.S. operations and our Brazil operations. Some of our Florida facilities produce fluorosilicic acid, which is a hazardous chemical, for resale to third parties. We also use or produce other hazardous or volatile chemicals at some of our facilities. An accident involving any of these chemicals could result in serious injuries or death, or evacuation of areas near an accident. An accident could also result in property damage or shutdown of our facilities, or cause us to expend significant amounts to remediate safety issues or to repair damaged facilities. As a result, an accident involving any of these chemicals could have a material adverse effect on our results of operations, liquidity or financial condition.
We use tailings, sediments and water dams to manage residual materials generated by our Brazilian mining operations. If our safety procedures are not effective, an accident involving these impoundments could result in serious injuries or death, damage to property or the environment, or result in the shutdown of our facilities, any of which could materially adversely affect our results of operations in Brazil.
Mining and processing of potash and phosphate generate residual materials that must be managed both during the operation of the facility and upon facility closure. Potash tailings, consisting primarily of salt and clay, are stored in surface disposal sites. Phosphate clay residuals from mining in Brazil are deposited in large tailing dams. They are regularly monitored to evaluate structural stability and for leaks. The failure of tailings dams and other impoundments at any of our Brazilian mining operations could cause severe property and environmental damage and loss of life. As a result, we apply significant financial resources and both internal and external technical resources towards operating those facilities safely.
We own and maintain 11 tailings dams in Brazil. With the exception of one tailings dam, all have current certificates of stability issued by external consultants, and are in compliance with Brazilian legal, operational and safety requirements. In addition, we have arranged for an independent third-party assessment of all of our Brazilian dams, which we expect to be completed during the second quarter of 2019.
We continue to augment our existing practices in an effort to reduce the risk of catastrophic failure and expect all tailings dams to be in compliance with Brazilian safety requirements in the near future.
In the ordinary course of business, we may need to build and license new dams.
In response to recent large scale tailings dam failures in Brazil at unaffiliated mines, new legislation at both federal and state levels has introduced rules regarding tailings dam safety, construction, environmental licenses and operations. We cannot predict the full impact of these legislative actions, or future actions, or whether or how it would affect our Brazilian operations or customers.
Any accident involving our Brazilian tailings
dams could have a material adverse effect on our results of operations in Brazil
.
Deliberate, malicious acts, including cyber attacks and terrorism, could damage our facilities, disrupt our operations or injure employees, contractors, customers or the public and result in liability to us.
Intentional acts of destruction could hinder our sales or production and disrupt our supply chain. Our facilities could be damaged or destroyed, reducing our operational production capacity and requiring us to repair or replace our facilities at substantial cost. Employees, contractors and the public could suffer substantial physical injury for which we could be liable. Governmental authorities may impose security or other requirements that could make our operations more difficult or costly. The consequences of any such actions could adversely affect our operating results and financial condition.
We may be adversely affected by changing antitrust laws to which we are subject. Increases in crop nutrient prices can increase the scrutiny to which we are subject under these laws.
We are subject to antitrust and competition laws in various countries throughout the world. We cannot predict how these laws or their interpretation, administration and enforcement will change over time. Changes in antitrust laws globally, or in their interpretation, administration or enforcement, may limit our existing or future operations and growth, or the operations of Canpotex, which serves as an export association for our Potash business. Increases in crop nutrient prices have in the past resulted in increased scrutiny of the crop nutrient industry under antitrust and competition laws and can increase the risk that
41
these laws could be interpreted, administered or enforced in a manner that could affect our operating practices or impose liability on us in a manner that could materially adversely affect our operating results and financial condition.
We may be adversely affected by other changes in laws resulting from increases in food and crop nutrient prices.
Increases in prices for, among other things, food, fuel and crop inputs (including crop nutrients) have in the past been the subject of significant discussion by various governmental bodies and officials throughout the world. In response to increases, it is possible that governments in one or more of the locations in which we operate or where we or our competitors sell our products could take actions that could affect us. Such actions could include, among other matters, changes in governmental policies relating to agriculture and biofuels (including changes in subsidy levels), price controls, tariffs, windfall profits taxes or export or import taxes. Any such actions could materially adversely affect our operating results and financial condition.
Our competitive position could be adversely affected if we are unable to participate in continuing industry consolidation.
Most of our products are readily available from a number of competitors, and price and other competition in the crop nutrient industry is intense. In addition, crop nutrient production facilities and distribution activities frequently benefit from economies of scale. As a result, particularly during pronounced cyclical troughs, the crop nutrient industry has a long history of consolidation. Mosaic itself is the result of a number of industry consolidations. We expect consolidation among crop nutrient producers could continue. Our competitive position could suffer to the extent we are not able to expand our own resources either through consolidations, acquisitions, joint ventures or partnerships. In the future, we may not be able to find suitable companies to combine with, assets to purchase or joint venture or partnership opportunities to pursue. Even if we are able to locate desirable opportunities, we may not be able to enter into transactions on economically acceptable terms. If we do not successfully participate in continuing industry consolidation, our ability to compete successfully could be adversely affected and result in the loss of customers or an uncompetitive cost structure, which could adversely affect our sales and profitability.
Our strategy for managing market and interest rate risk may not be effective.
Our businesses are affected by fluctuations in market prices for our products, the purchase price of natural gas, ammonia and sulfur consumed in operations, freight and shipping costs, foreign currency exchange rates and interest rates. We periodically enter into derivatives and forward purchase contracts to mitigate some of these risks. However, our strategy may not be successful in minimizing our exposure to these fluctuations. See “Market Risk” in our Management’s Analysis and Note
15
of our Notes to Consolidated Financial Statements that is incorporated by reference in this report in Part II, Item 8.
A shortage or unavailability of railcars, tugs, barges and ships for carrying our products and the raw materials we use in our business could result in customer dissatisfaction, loss of production or sales and higher transportation or equipment costs.
We rely heavily upon truck, rail, tug, barge and ocean freight transportation to obtain the raw materials we need and to deliver our products to our customers. In addition, the cost of transportation is an important part of the final sale price of our products. Finding affordable and dependable transportation is important in obtaining our raw materials and to supply our customers. Higher costs for these transportation services or an interruption or slowdown due to factors including high demand, high fuel prices, labor disputes, layoffs or other factors affecting the availability of qualified transportation workers, adverse weather or other environmental events, or changes to rail, barge or ocean freight systems, could negatively affect our ability to produce our products or deliver them to our customers, which could affect our performance and results of operations.
Strong demand for grain and other products and a strong world economy increase the demand for and reduce the availability of transportation, both domestically and internationally. Shortages of railcars, barges and ocean transport for carrying product and increased transit time may result in customer dissatisfaction, loss of sales and higher equipment and transportation costs. In addition, during periods when the shipping industry has a shortage of ships, the substantial time needed to build new ships prevents rapid market response. Delays and missed shipments due to transportation shortages, including vessels, barges, railcars and trucks, could result in customer dissatisfaction or loss of sales potential, which could negatively affect our performance and results of operations.
Additionally, we have agreed under our long-term CF Ammonia Supply Agreement to purchase approximately
545,000
to
725,000
tonnes of ammonia per year during a term that may extend until December 31, 2032, at a price to be determined by a formula based on the prevailing price of U.S. natural gas. We are obligated to provide for transportation of the ammonia
42
under the agreement, and if we fail to take the required minimum annual amount, CF may elect to require us to make payment of liquidated damages or terminate the agreement. Payment of significant liquidated damages or an election by CF to terminate the agreement could adversely affect our business.
A lack of customers’ access to credit can adversely affect their ability to purchase our products.
Some of our customers require access to credit to purchase our products. A lack of available credit to customers in one or more countries, due to global or local economic conditions or for other reasons, could adversely affect demand for crop nutrients.
We extend trade credit to our customers and guarantee the financing that some of our customers use to purchase our products. Our results of operations may be adversely affected if these customers are unable to repay the trade credit from us or financing from their banks. Increases in prices for crop nutrient, other agricultural inputs and grain may increase this risk.
We extend trade credit to our customers in the United States and throughout the world, in some cases for extended periods of time. In Brazil, where there are fewer third-party financing sources available to farmers, we also have several programs under which we guarantee customers’ financing from financial institutions that they use to purchase our products. As our exposure to longer trade credit extended throughout the world and use of guarantees in Brazil increases, we are increasingly exposed to the risk that some of our customers will not pay us or the amounts we have guaranteed. Additionally, we become increasingly exposed to risk due to weather and crop growing conditions, fluctuations in commodity prices or foreign currencies, and other factors that influence the price, supply and demand for agricultural commodities. Significant defaults by our customers could adversely affect our financial condition and results of operations.
Increases in prices for crop nutrients increase the dollar amount of our sales to customers. The larger dollar value of our customers’ purchases may also lead them to request longer trade credit from us and/or increase their need for us to guarantee their financing of our products. Either factor could increase the amount of our exposure to the risk that our customers may be unable to repay the trade credit from us or financing from their banks that we guarantee. In addition, increases in prices for other agricultural inputs and grain may increase the working capital requirements, indebtedness and other liabilities of our customers, increase the risk that they will default on the trade credit from us or their financing that we guarantee, and decrease the likelihood that we will be able to collect from our customers in the event of their default.
Provisions in our restated certificate of incorporation and bylaws and of Delaware law may prevent or delay an acquisition of our company, which could decrease the trading price of our common stock.
Our restated certificate of incorporation and our amended and restated bylaws contain provisions that could have the effect of rendering more difficult or discouraging an acquisition deemed undesirable by our board of directors. These provisions include the ability of our board of directors to issue preferred stock without stockholder approval, a prohibition on stockholder action by written consent and the inability of our stockholders to request that our board of directors or chairman of our board call a special meeting of stockholders.
We are also subject to Section 203 of the Delaware General Corporation Law. In general, Section 203 prohibits a publicly held Delaware corporation from engaging in a “business combination” with an “interested stockholder” for a period of three years from the date of the transaction in which the person became an interested stockholder, unless the interested stockholder attained this status with the approval of the board of directors or unless the business combination was approved in a prescribed manner. A “business combination” includes mergers, asset sales and other transactions resulting in a financial benefit to the interested stockholder. Subject to exceptions, an “interested stockholder” is a person who, together with affiliates and associates, owns, or within three years owned, 15% or more of the corporation’s voting stock. This statute could prohibit or delay the accomplishment of mergers or other takeover or change in control attempts with respect to us and, accordingly, may discourage attempts to acquire us.
These provisions apply not only when they may protect our stockholders from coercive or otherwise unfair takeover tactics but even if the offer may be considered beneficial by some stockholders and could delay or prevent an acquisition that our board of directors determines is in our best interests and those of our stockholders.
Our success will continue to depend on our ability to attract and retain highly qualified and motivated employees.
We believe our continued success depends on the collective abilities and efforts of our employees. Like many businesses, a significant number of our employees, including some of our most highly skilled employees with specialized expertise in potash and phosphates operations, will be approaching retirement age throughout the next decade and beyond. In addition, we
43
compete for a talented workforce with other businesses, particularly within the mining and chemicals industries in general and the crop nutrients industry in particular. Our expansion plans are highly dependent on our ability to attract, retain and train highly qualified and motivated employees who are essential to the success of our ongoing operations as well as to our expansion plans. If we were to be unsuccessful in attracting, retaining and training the employees we require, our ongoing operations and expansion plans could be materially and adversely affected.
Future product or technological innovation could affect our business.
Future product or technological innovations by third parties such as the development of seeds that require less crop nutrients, the development of substitutes for our products or developments in the application of crop nutrients, if they occur, could have the potential to adversely affect the demand for our products and our results of operations, liquidity and capital resources.
We may fail to fully realize the anticipated benefits and synergies of our acquisition (the “Acquisition”) of the global phosphate and potash operations of Vale S.A. (“Vale”) conducted through Vale Fertilizantes S.A. (now known as Mosaic Fertilizantes P&K S.A.).
The success of the Acquisition will depend, in part, on our ability to realize the anticipated benefits and synergies. Our ability to realize these anticipated benefits and synergies is subject to certain risks including:
|
•
|
our ability to successfully integrate Mosaic Fertilizantes to eliminate duplicative overhead and other costs and realize our cost savings goals;
|
|
•
|
whether the combined operations will perform as expected;
|
|
•
|
whether the integration of Mosaic Fertilizantes takes longer than anticipated or involves higher than projected integration costs;
|
|
•
|
whether the integration process disrupts our on-going operations or diverts the attention of our management from our current operations; and
|
|
•
|
political and economic instability in Brazil or changes in government regulation or policy in Brazil, such as higher costs associated with the implementation of new freight tables;
|
The success of our other strategic initiatives depends on our ability to effectively manage these initiatives, and to successfully integrate and grow acquired businesses.
In addition to the Acquisition, we have other significant ongoing strategic initiatives, including, principally our plans to expand the annual production capacity of our Potash business and MWSPC. These strategic initiatives involve capital and other expenditures of several billions of dollars over a number of years and require effective project management and, in the case of strategic acquisitions, successful integration. To the extent the processes we (or, for the MWSPC, we together with our joint venture partners) put in place to manage these initiatives or integrate and grow acquired businesses are not effective, our capital expenditure and other costs may exceed our expectations or the benefits we expect from these initiatives might not be fully realized, or both, thereby resulting in adverse effects on our operating results and financial condition.
We may fail to fully realize the anticipated benefits and cost savings of our long-term CF Ammonia Supply Agreement.
We use ammonia as a raw material in the production of our concentrated phosphate products. Under our long-term CF Ammonia Supply Agreements we have agreed to purchase approximately
545,000
to
725,000
tonnes of ammonia per year during a term that may extend until December 31, 2032 at a price to be determined by a formula based on the prevailing price of U.S. natural gas.
The success of this agreement will depend, in part, on our ability to realize cost savings from the agreement’s natural gas based pricing. If the price of natural gas rises materially or the market price for ammonia falls outside of the range we currently anticipate over the term of the agreement, we may not realize a cost benefit from the agreement, or the cost of our ammonia under the agreement could be a competitive disadvantage. In addition, our ability to realize benefits and cost savings is subject to certain additional risks, including whether CF successfully performs its obligations under the agreement over the life of its commitment and our ability to take delivery of the required minimum annual amount of ammonia over the life of our commitment.
44
Cyber attacks could disrupt our operations and have a material adverse impact on our business.
As a global company, we utilize and rely upon information technology systems in many aspects of our business, including internal and external communications and the management of our accounting, financial, production and supply chain functions. As we become more dependent on information technologies to conduct our operations, and as the number and sophistication of cyber attacks increase, the risks associated with cyber security increase. These risks apply to us, our employees, and to third parties on whose systems we rely for the conduct of our business. Failure to effectively anticipate, prevent, detect and recover from the increasing number and sophistication of cyber attacks could result in theft, loss or misuse of, or damage or modification of our information, and cause disruptions or delays in our business, reputational damage and third-party claims, which could have a material adverse effect on our results of operations or financial condition.
Item 1B. Unresolved Staff Comments.
None.
Item 2. Properties.
Information regarding our plant and properties is included in Part I, Item 1, “Business,” of this report.
Item 3. Legal Proceedings.
We have included information about legal and environmental proceedings in Note
22
of our Notes to Consolidated Financial Statements. That information is incorporated herein by reference.
We are also subject to the following legal and environmental proceedings in addition to those described in Note
22
of our Consolidated Financial Statements included in this report:
Water of the United States. In June 2015, the EPA and the U.S. Army Corps of Engineers (the "Corps") jointly issued a final rule that proposed to clarify but may actually expand the scope of waters regulated under the federal Clean Water Act. The final rule (the "2015 Clean Water Rule") became effective in August 2015, but has been challenged through numerous lawsuits. In October 2015, the U.S. Court of Appeals for the Sixth Circuit issued an order staying the effectiveness of the final rule nationwide pending adjudication of substantive challenges to the rule. In early 2017, the U.S. President issued an Executive Order directing the EPA and the Corps to publish a proposed rule rescinding or revising the new rule. In June 2017, the EPA and the Corps issued a proposed rule that would rescind the 2015 Clean Water Rule and re-codify regulatory text that existed prior to enactment of the 2015 Clean Water Rule. In November 2017, the EPA issued a rule notice proposing to extend the applicability date of the 2015 Clean Water Rule for two years from the date of final actions on the proposed rule, to provide continuity and regulatory certainty while agencies proceed to consider potential changes to the 2015 Clean Water Rule.
In January 2018, the U.S. Supreme Court unanimously held all challenges to the 2015 Clean Water Rule must be heard in federal district courts rather than in the federal courts of appeal, overruling a decision by the Sixth Circuit's Court of Appeals. With the Sixth Circuit Court of Appeals no longer having jurisdiction, the court lifted its 2015 nationwide stay in February 2018. After the nationwide stay was lifted, a number of U.S. District Courts revived dormant litigation that challenged the 2015 Clean Water Rule. In June 2018, the U.S. District Court for the Southern District of Georgia entered an injunction against implementation of the 2015 Clean Water Rule covering 11 states, including Florida. As of September 2018, federal district courts have put the 2015 Clean Water Rule on hold in 28 states, the District of Colombia and the U.S. territories.
On December 11, 2018, the EPA and Corps issued a proposed new Clean Water Rule that is designed to replace the 2015 Clean Water Rule. The agencies' proposed rule is intended to provide clarity, predictability and consistency so that the regulated community can better understand where the Clean Water Act applies - and where it does not.
We believe the 2015 Clean Water Rule, if not rescinded, or replaced by the proposed rule issued on December 11, 2018, may expand the types and extent of water resources regulated under federal law, thereby potentially expanding our permitting and reporting requirements, increasing our costs of compliance, including costs associated with wetlands and stream mitigation, lengthening the time necessary to obtain permits, and potentially restricting our ability to mine certain of our phosphate rock reserves.
Item 4. Mine Safety Disclosures.
45
Information concerning mine safety violations or other regulatory matters required by Section 1503(a) of the Dodd-Frank Wall Street Reform and Consumer Protection Act and Item 104 of Regulation S-K is included in Exhibit 95 to this report.
46
PART II.
Item 5. Market for Registrant’s Common Equity, Related Stockholder Matters and Issuer Purchases of Equity Securities.
We have included information about the market price of, dividends on and the number of holders of our common stock under “Quarterly Results (Unaudited)” in the financial information that is incorporated by reference in this report in Part II, Item 8, “Financial Statements and Supplementary Data.”
The principal stock exchange on which our common stock is traded is The New York Stock Exchange under the symbol "MOS."
The following provides information related to equity compensation plans:
|
Plan category
|
Number of shares to be
issued upon exercise of
outstanding options,
warrants and rights
(a)
|
Weighted-average
exercise price of
outstanding options,
warrants and rights
(b)
|
Number of shares remaining
available for future issuance
under equity compensation plans
(excluding shares reflected
in first column)
|
|||||||
|
Equity compensation plans approved by stockholders
|
4,900,272
|
|
$
|
49.20
|
|
35,514,673
|
|
|||
|
Equity compensation plans not approved by stockholders
|
—
|
|
—
|
|
—
|
|
||||
|
Total
|
4,900,272
|
|
$
|
49.20
|
|
35,514,673
|
|
|||
______________________________
|
(a)
|
Includes grants of stock options, time-based restricted stock units, and total shareholder return (“
TSR
”) and return on invested capital (“
ROIC
”) performance units. For purposes of the table above, the number of shares to be issued under a performance unit award reflects the maximum number of shares of our common stock that may be issued pursuant to such performance award. The actual number of shares to be issued under a TSR performance unit award will depend on the change in the market price of our common stock over a three-year vesting period, with no shares issued if the market price of a share of our common stock at the vesting date plus dividends thereon is less than 50% of its market price on the date of grant and the maximum number issued only if the market price of a share of our common stock at the vesting date plus dividends thereon is at least twice its market price on the date of grant. The actual number of shares to be issued under an ROIC performance unit award will depend on the cumulative spread between our ROIC and our weighted-average cost of capital over a three-year period.
|
|
(b)
|
Includes weighted average exercise price of stock options only.
|
Pursuant to our equity compensation plans, we have granted and may in the future grant employee stock options to purchase shares of common stock of Mosaic for which the purchase price may be paid by means of delivery to us by the optionee of shares of common stock of Mosaic that are already owned by the optionee (at a value equal to market value on the date of the option exercise). During the period covered by this report, no options to purchase shares of common stock of Mosaic were exercised for which the purchase price was so paid.
On May 14, 2015, we announced our 2015 Repurchase Program, which allows us to repurchase up to $1.5 billion of our Common Stock through open market purchases, accelerated share repurchase arrangements, privately negotiated transactions or otherwise. The 2015 Repurchase Program has no set expiration date. During the quarter ended December 31, 2018, no repurchases were made under this program. At December 31, 2018, we had approximately $850 million of repurchase authorization remaining under the program.
Item 6. Selected Financial Data.
We have included selected financial data for calendar years
2018
,
2017
,
2016
,
2015
, and
2014
under “Five Year Comparison,” in the financial information that is included in this report in Part II, Item 8, “Financial Statements and Supplementary Data.” This information is incorporated herein by reference.
Item 7. Management’s Discussion and Analysis of Financial Condition and Results of Operations.
47
The Management’s Discussion and Analysis of Financial Condition and Results of Operations listed in the Financial Table of Contents included in this report is incorporated herein by reference.
Item 7A. Quantitative and Qualitative Disclosures about Market Risk.
We have included a discussion about market risks under “Market Risk” in the Management’s Analysis that is included in this report in Part II, Item 7, “Management’s Discussion and Analysis of Financial Condition and Results of Operations”. This information is incorporated herein by reference.
Item 8. Financial Statements and Supplementary Data.
Our Consolidated Financial Statements, the Notes to Consolidated Financial Statements, the report of our Independent Registered Public Accounting Firm, and the information under “Quarterly Results” listed in the Financial Table of Contents included in this report are incorporated herein by reference. All other schedules for which provision is made in the applicable accounting regulation of the SEC are not required under the related instructions or are inapplicable, and therefore, have been omitted.
Item 9. Changes in and Disagreements with Accountants on Accounting and Financial Disclosures.
None.
Item 9A. Controls and Procedures.
|
(a)
|
Disclosure Controls and Procedures
|
We maintain disclosure controls and procedures designed to ensure that information required to be disclosed in our filings under the Securities Exchange Act of 1934 (the “
Exchange Act
”) is (i) recorded, processed, summarized and reported within the time periods specified in the SEC’s rules and forms, and (ii) accumulated and communicated to management, including our principal executive officer and our principal financial officer, to allow timely decisions regarding required disclosures. Our management, with the participation of our principal executive officer and our principal financial officer, has evaluated the effectiveness of our disclosure controls and procedures as of the end of the period covered by this Annual Report on Form 10-K. Our principal executive officer and our principal financial officer have concluded, based on such evaluations, that our disclosure controls and procedures were effective for the purpose for which they were designed as of the end of such period.
|
(b)
|
Management’s Report on Internal Control Over Financial Reporting
|
We have included management’s report on internal control over financial reporting under “Management’s Report on Internal Control Over Financial Reporting” listed in the Financial Table of Contents included in this report.
We have included our registered public accounting firm’s attestation report on our internal controls over financial reporting under “Report of Independent Registered Public Accounting Firm” listed in the Financial Table of Contents included in this report.
This information is incorporated herein by reference.
|
(c)
|
Changes in Internal Control Over Financial Reporting
|
Our management, with the participation of our principal executive officer and our principal financial officer, has evaluated any change in internal control over financial reporting that occurred during the quarter ended
December 31, 2018
in accordance with the requirements of Rule 13a-15(d) promulgated by the SEC under the Exchange Act. There were no changes in internal control over financial reporting identified in connection with management’s evaluation that occurred during the quarter ended
December 31, 2018
that have materially affected, or are reasonably likely to materially affect, our internal control over financial reporting.
In accordance with relevant SEC guidance, the scope of management’s evaluation excluded internal control over financial reporting for Vale Fertilizantes S.A., which we acquired on January 8, 2018. The Acquired Business represents $3.3 billion of our total assets as of December 31, 2018 and $1.3 billion of our total net sales for the year ended December 31, 2018.
Item 9B. Other Information.
48
None.
49
PART III.
Item 10. Directors, Executive Officers and Corporate Governance.
The information contained under the headings “Proposal No. 1—Election of Directors,” “Corporate Governance—Committees of the Board of Directors,” and “Section 16(a) Beneficial Ownership Reporting Compliance” included in our definitive proxy statement for our
2019
annual meeting of stockholders and the information contained under “Executive Officers of the Registrant” in Part I, Item 1, “Business,” in this report is incorporated herein by reference.
We have a Code of Business Conduct and Ethics within the meaning of Item 406 of Regulation S-K adopted by the SEC under the Exchange Act that applies to our principal executive officer, principal financial officer and principal accounting officer. Our Code of Business Conduct and Ethics is available on Mosaic’s website (www.mosaicco.com), and we intend to satisfy the disclosure requirement under Item 5.05 of Form 8-K regarding any amendment to, or waiver from, a provision of our code of ethics by posting such information on our website. The information contained on Mosaic’s website is not being incorporated herein.
Item 11. Executive Compensation.
The information under the headings “Director Compensation”, “Executive Compensation”, and “Compensation Committee Interlocks and Insider Participation” included in our definitive proxy statement for our
2019
annual meeting of stockholders is incorporated herein by reference.
Item 12. Security Ownership of Certain Beneficial Owners and Management and Related Stockholder Matters.
The information under the headings “Beneficial Ownership of Securities” and “Certain Relationships and Related Transactions” included in our definitive proxy statement for our
2019
annual meeting of stockholders is incorporated herein by reference. The table set forth in Part II, Item 5, “Market for Registrant’s Common Equity, Related Stockholder Matters and Issuer Purchases of Equity Securities,” of this report is also incorporated herein by reference.
Item 13. Certain Relationships and Related Transactions, and Director Independence.
The information under the headings “Corporate Governance—Board Independence,” “Corporate Governance—Committees of the Board of Directors,” “Corporate Governance—Other Policies Relating to the Board of Directors—Policy and Procedures Regarding Transactions with Related Persons,” and “Certain Relationships and Related Transactions” included in our definitive proxy statement for our
2019
annual meeting of stockholders is incorporated herein by reference.
Item 14. Principal Accounting Fees and Services.
The information included under “Audit Committee Report and Payment of Fees to Independent Registered Public Accounting Firm—Fees Paid to Independent Registered Public Accounting Firm” and “Audit Committee Report and Payment of Fees to Independent Registered Public Accounting Firm—Pre-approval of Independent Registered Public Accounting Firm Services” included in our definitive proxy statement for our
2019
annual meeting of stockholders is incorporated herein by reference.
50
PART IV.
Item 15. Exhibits and Financial Statement Schedules.
|
(a)
|
(1)
|
Consolidated Financial Statements filed as part of this report are listed in the Financial Table of Contents included in this report and incorporated by reference in this report in Part II, Item 8, “Financial Statements and Supplementary Data.”
|
||||
|
(2)
|
All schedules for which provision is made in the applicable accounting regulations of the SEC are listed in this report in Part II, Item 8, “Financial Statements and Supplementary Data.”
|
|||||
|
(3)
|
Reference is made to the Exhibit Index in (b) below.
|
|||||
|
(b)
|
Exhibits
|
|||||
|
Exhibit No.
|
Description
|
Incorporated Herein by
Reference to
|
Filed with
Electronic
Submission
|
|||
|
2.i.
|
|
Exhibit 2.1 to Mosaic’s Current Report on Form 8-K dated October 22, 2004, and filed on October 28, 2004
(2)
|
||||
|
2.ii
|
Exhibit 2.1 to Mosaic’s Current Report on Form 8-K dated and filed on December 19, 2016
(2)
|
|||||
|
2.ii.a
|
Exhibit 2.1 to Mosaic’s Current Report on Form 8-K dated December 28, 2017 and filed on January 2, 2018
(2)
|
|||||
|
2.ii.b
|
Exhibit 2.3 to Mosaic’s Current Report on Form 8-K dated January 8, 2018 and filed on January 9, 2018
(2)
|
|||||
|
3.i.
|
Exhibit 3.i to Mosaic’s Current Report on Form 8-K dated May 19, 2016 and filed on May 23, 2016
(2)
|
|||||
|
3.ii.
|
Exhibit 3.ii to Mosaic’s Current Report on Form 8-K dated May 19, 2016 and filed on May 23, 2016
(2)
|
|||||
|
4.i
|
Exhibit 4.i to Mosaic’s Current Report on Form 8-K dated November 18, 2016 and filed on November 21, 2016
(2)
|
|||||
|
4.ii.
|
Exhibit 4.1 to Mosaic’s Current Report on Form 8-K dated October 24, 2011 and filed on October 24, 2011
(2)
|
|||||
51
|
4.iii.
|
Registrant hereby agrees to furnish to the Commission, upon request, all other instruments defining the rights of holders of each issue of long-term debt of the Registrant and its consolidated subsidiaries
|
|||||
|
10.ii.a
|
Exhibit 10.1 to Mosaic’s Current Report on Form 8-K dated October 24, 2017 and filed on October 30, 2017
|
|||||
|
10.ii.b
|
Exhibit 10.2 to Mosaic’s Current Report on Form 8-K dated October 24, 2017 and filed on October 30, 2017
|
|||||
|
10.iii.a.
(3)
|
Appendix A to Mosaic’s Proxy Statement dated August 25, 2009
(2)
|
|||||
|
10.iii.a.1
(3)
|
Exhibit 10.iii.u. to Mosaic’s Annual Report on Form 10-K for the Fiscal Year ended May 31, 2011
(2)
|
|||||
|
10.iii.a.2
(3)
|
Exhibit 10.iii.a. to Mosaic’s Quarterly Report on Form 10-Q for the Quarterly Period ended August 31, 2008
(2)
|
|||||
|
10.iii.a.3
(3)
|
Exhibit 10.iii.b. to Mosaic’s Quarterly Report on Form 10-Q for the Quarterly Period ended August 31, 2011
(2)
|
|||||
|
10.iii.b
(3)
|
X
|
|||||
|
10.iii.c.1
(3)
|
Exhibit 10.iii.b. to Mosaic’s Quarterly Report on Form 10-Q for the Quarterly Period ended November 30, 2008
(2)
|
|||||
|
10.iii.c.2
(3)
|
Exhibit 10.iii.r. to Mosaic’s Annual Report on Form 10-K for the Fiscal Year ended May 31, 2011
(2)
|
|||||
|
10.iii.c.3
(3)
|
Exhibit 10.1 to Mosaic’s Current Report on Form 8-K dated March 5, 2015 and filed on March 11, 2015
(2)
|
|||||
|
10.iii.c.4
(3)
|
Exhibit 10.iii.c.4 to Mosaic’s Quarterly Report on Form 10-Q for the Quarterly Period ended March 31, 2017
(2)
|
|||||
|
10.iii.c.5
(3)
|
X
|
|||||
52
|
10.iii.d.1
(3)
|
Exhibit 10.iii.d to Mosaic’s Quarterly Report on Form 10-Q for the Quarterly Period ended March 31, 2017
(2)
|
|||||
|
10.iii.d.2
(3)
|
Exhibit 10.iii.d.2 to Mosaic’s Quarterly Report on Form 10-Q for the Quarterly Period ended June 30, 2017
(2)
|
|||||
|
10.iii.d.3
(3)
|
Exhibit 10.iii.d.3 to Mosaic’s Annual Report on Form 10-K for the fiscal year ended December 31, 2016
(2)
|
|||||
|
10.iii.d.4
(3)
|
Exhibit 10.1 to Mosaic’s Current Report on Form 8-K dated May 17, 2017 and filed on May 19, 2017
(2)
|
|||||
|
10.iii.d.5
(3)
|
Exhibit 10.1 to Mosaic's Current Report on Form 8-K/A dated January 31, 2018 and filed on March 12, 2018
|
|||||
|
10.iii.d.6
(3)
|
Exhibit 10.2 to Mosaic's Quarterly Report on Form 10-Q for the Quarterly Period ended March 31, 2018.
|
|||||
|
10.iii.d.7
(3)
|
Exhibit 10.1 to Mosaic's Quarterly Report on Form 10-Q for the Quarterly Period ended June 30, 2018
|
|||||
|
10.iii.d.8
(3)
|
Exhibit 10.2 to Mosaic's Quarterly Report on Form 10-Q for the Quarterly Period ended June 30, 2018
|
|||||
|
10.iii.d.9
(3)
|
Exhibit 10.3 to Mosaic's Quarterly Report on Form 10-Q for the Quarterly Period ended June 30, 2018
|
|||||
|
10.iii.e.1
(3)
|
Exhibit 10.iii.b. to Mosaic’s Quarterly Report on Form 10-Q for the Quarterly Period ended August 31, 2012
(2)
|
|||||
|
10.iii.e.2
(3)
|
Exhibit 10.iii.x. to Mosaic’s Annual Report on Form 10-K of Mosaic for the fiscal year ended May 31, 2013
(2)
|
|||||
|
10.iii.f.
(3)
|
Exhibit 10.iii. to Mosaic’s Current Report on Form 8-K dated October 8, 2008, and filed on October 14, 2008(2)
|
|||||
53
|
10.iii.g.
(3)
|
Exhibit 10.iii.g to Mosaic’s Annual Report on Form 10-K for the fiscal year ended December 31, 2016(2)
|
|||||
|
10.iii.h.
(3)
|
Fourth Paragraph of Item 1.01 of Mosaic’s Current Report on Form 8-K dated May 26, 2005, and filed on June 1, 2005(2)
|
|||||
|
10.iii.i.
(3)
|
The material under “Compensation Discussion and Analysis—Elements of Compensation—Executive Life and Disability Plans” in Mosaic’s Proxy Statement dated April 2, 2014(2)
|
|||||
|
10.iii.j.
(3)
|
Exhibit 10.iii.j to Mosaic’s Annual Report on Form 10-K for the fiscal year ended December 31, 2016(2)
|
|||||
|
10.iii.k.
(3)
|
Appendix B to Mosaic’s Proxy Statement dated April 2, 2014(2)
|
|||||
|
10.iii.k.1
(3)
|
Exhibit 10.iii.a. to Mosaic’s Quarterly Report on Form 10-Q for the Quarterly Period ended March 31, 2015(2)
|
|||||
|
10.iii.k.2
(3)
|
Exhibit 10.iii.a. to Mosaic’s Quarterly Report on Form 10-Q for the Quarterly Period ended March 31, 2016(2)
|
|||||
|
10.iii.k.4
(3)
|
Exhibit 10.iii.e. to Mosaic’s Quarterly Report on Form 10-Q for the Quarterly Period ended March 31, 2016(2)
|
|||||
|
10.iii.k.7
(3)
|
Exhibit 10.iii.b. to Mosaic’s Quarterly Report on Form 10-Q for the Quarterly Period ended March 31, 2016(2)
|
|||||
|
10.iii.k.9
(3)
|
Exhibit 10.iii.d. to Mosaic’s Quarterly Report on Form 10-Q for the Quarterly Period ended March 31, 2016(2)
|
|||||
|
10.iii.k.10
(3)
|
Exhibit 10.iii.c. to Mosaic’s Quarterly Report on Form 10-Q for the Quarterly Period ended March 31, 2016(2)
|
|||||
54
|
10.iii.k.12
(3)
|
Exhibit 10.iii.kk to Mosaic’s Quarterly Report on Form 10-Q for the Quarterly Period Ended June 30, 2016(2)
|
|||||
|
10.iii.k.13
(3)
|
Exhibit 10.iii.k.1 to Mosaic’s Quarterly Report on Form 10-Q for the Quarterly Period ended March 31, 2017(2)
|
|||||
|
10.iii.k.14
(3)
|
Exhibit 10.iii.k.2 to Mosaic’s Quarterly Report on Form 10-Q for the Quarterly Period ended March 31, 2017(2)
|
|||||
|
10.iii.k.15
(3)
|
Exhibit 10.2 to Mosaic’s Current Report on Form 8-K dated May 17, 2017 and filed on May 19, 2017(2)
|
|||||
|
10.iii.k.16
(3)
|
X
|
|||||
|
10.iii.k.17
(3)
|
X
|
|||||
|
10.iv.a
|
Exhibit 10.i. to Mosaic’s Quarterly Report on Form 10-Q for the Quarterly Period ended June 30, 2014(2)
|
|||||
|
10.iv.b
|
Exhibit 10.iv.b to Mosaic’s Annual Report on Form 10-K for the fiscal year ended December 31, 2016(2)
|
|||||
|
10.v.a
|
Exhibit 10.1. to Mosaic’s Current Report on Form 8-K dated September 30, 2015 and filed on October 6, 2015(2)
|
|||||
55
|
10.v.b
|
Exhibit 10.v.i to Mosaic’s Quarterly Report on Form 10-Q for the Quarterly Period Ended June 30, 2016(2)
|
|||||
|
10.v.c
|
Exhibit 10.2. to Mosaic’s Current Report on Form 8-K dated September 30, 2015 and filed on October 6, 2015(2)
|
|||||
|
10.v.d
|
Exhibit 10.v.ii to Mosaic’s Quarterly Report on Form 10-Q for the Quarterly Period Ended June 30, 2016(2)
|
|||||
|
21
|
X
|
|||||
|
23
|
X
|
|||||
|
24
|
X
|
|||||
|
31.1
|
X
|
|||||
|
31.2
|
X
|
|||||
|
32.1
|
X
|
|||||
|
32.2
|
X
|
|||||
|
95
|
X
|
|||||
|
101
|
Interactive Data Files
|
X
|
||||
|
(c)
|
Summarized financial information of 50% or less owned persons is included in Note 9 of Notes to Consolidated Financial Statements. Financial statements and schedules are omitted as none of such persons are significant under the tests specified in Regulation S-X under Article 3.09 of general instructions to the financial statements.
|
|||||
*********************************************
|
(1)
|
Mosaic agrees to furnish supplementally to the Commission a copy of any omitted schedules and exhibits to the extent required by rules of the Commission upon request.
|
|
(2)
|
SEC File No. 001-32327
|
|
(3)
|
Denotes management contract or compensatory plan.
|
|
(4)
|
Confidential information has been omitted from this Exhibit and filed separately with the Securities and Exchange Commission pursuant to a confidential treatment request under Rule 24b-2 of the Securities Exchange Act of 1934, as amended.
|
56
Item 16. Form 10-K Summary.
None.
57
*********************************************
SIGNATURES
Pursuant to the requirements of Section 13 or 15(d) of the Securities Exchange Act of 1934, the registrant has duly caused this report to be signed on its behalf by the undersigned, thereunto duly authorized.
|
THE MOSAIC COMPANY
|
|
(Registrant)
|
|
/s/ James “Joc” C. O’Rourke
|
|
James “Joc” C. O’Rourke
|
|
Chief Executive Officer and President
|
Date:
March 12, 2019
S-1
Pursuant to the requirements of the Securities Exchange Act of 1934, this report has been signed below by the following persons on behalf of the registrant and in the capacities and on the dates indicated:
|
Name
|
Title
|
Date
|
||
|
/s/ James “Joc” C. O’Rourke
|
Chief Executive Officer and President and Director (principal executive officer)
|
March 12, 2019
|
||
|
James “Joc” C. O’Rourke
|
||||
|
/s/ Clint C. Freeland
|
Senior Vice President and Chief Financial Officer (principal financial officer and principal accounting officer)
|
March 12, 2019
|
||
|
Clint C. Freeland
|
||||
|
*
|
Chairman of the Board of Directors
|
March 12, 2019
|
||
|
Gregory L. Ebel
|
||||
|
*
|
Director
|
March 12, 2019
|
||
|
Oscar P. Bernardes
|
||||
|
*
|
Director
|
March 12, 2019
|
||
|
Nancy E. Cooper
|
||||
|
*
|
Director
|
March 12, 2019
|
||
|
Timothy S. Gitzel
|
||||
|
*
|
Director
|
March 12, 2019
|
||
|
Denise C. Johnson
|
||||
|
*
|
Director
|
March 12, 2019
|
||
|
Emery N Koenig
|
||||
|
*
|
Director
|
March 12, 2019
|
||
|
Robert L. Lumpkins
|
||||
|
*
|
Director
|
March 12, 2019
|
||
|
William T. Monahan
|
||||
|
*
|
Director
|
March 12, 2019
|
||
|
Luciano Siani Pires
|
||||
|
*
|
Director
|
March 12, 2019
|
||
|
David T. Seaton
|
||||
|
*
|
Director
|
March 12, 2019
|
||
|
Steven M. Seibert
|
||||
|
*
|
Director
|
March 12, 2019
|
||
|
Kelvin R. Westbrook
|
||||
|
*By:
|
||
|
/s/ Mark J. Isaacson
|
||
|
Mark J. Isaacson
Attorney-in-Fact
|
||
S-2
Financial Table of Contents
|
|
Page
|
F-1
Management’s Discussion and Analysis of Financial Condition and Results of Operations
Introduction
The Mosaic Company (before or after the Cargill Transaction, as defined below, “
Mosaic
”, and with its consolidated subsidiaries, “
we
”, “
us
”, “
our
”, or the “
Company
”) is the parent company of the business that was formed through the business combination (“
Combination
”) of IMC Global Inc. and the Cargill Crop Nutrition fertilizer businesses of Cargill, Incorporated and its subsidiaries (collectively, “
Cargill
”) on October 22, 2004. In May 2011, Cargill divested its approximately 64% equity interest in us in a split-off to its stockholders and a debt exchange with certain Cargill debt holders.
We produce and market concentrated phosphate and potash crop nutrients. We conduct our business through wholly and majority owned subsidiaries as well as businesses in which we own less than a majority or a non-controlling interest, including consolidated variable interest entities and investments accounted for by the equity method.
On January 8, 2018, we completed our acquisition (the “
Acquisition
”) of Vale Fertilizantes S.A. (now known as Mosaic Fertilizantes P&K S.A. or the “
Acquired Business
”). Upon completion of the Acquisition, we became the leading fertilizer producer and distributor in Brazil. To reflect the fact that our Brazilian business is no longer strictly a distribution business as well as the significance of our investment in Brazil, we realigned our business segments (the “
Realignment
”). Beginning in the first quarter of 2018, we reported the results of the Mosaic Fertilizantes business as a segment, along with our other reportable segments of Phosphates and Potash.
After the Realignment, we are organized into the following business segments:
|
•
|
Our
Phosphates
business segment owns and operates mines and production facilities in Florida which produce concentrated phosphate crop nutrients and phosphate-based animal feed ingredients, and processing plants in Louisiana which produce concentrated phosphate crop nutrients for sale domestically and internationally. As part of the Acquisition, we acquired an additional 40% economic interest in the Miski Mayo Phosphate Mine in Peru, which increased our aggregate interest to 75%. These results are now consolidated in the Phosphates segment. The Phosphates segment also includes our 25% interest in the Ma'aden Wa'ad Al Shamal Phosphate Company (the “
MWSPC
”), a joint venture to develop, own and operate integrated phosphate production facilities in the Kingdom of Saudi Arabia. We market approximately 25% of the MWSPC phosphate production. We recognize our equity in the net earnings or losses relating to MWSPC on a one-quarter reporting lag in our Condensed Consolidated Statements of Earnings.
|
|
•
|
Our
Potash
business segment owns and operates potash mines and production facilities in Canada and the U.S. which produce potash-based crop nutrients, animal feed ingredients and industrial products. Potash sales include domestic and international sales. We are a member of Canpotex, Limited (“
Canpotex
”), an export association of Canadian potash producers through which we sell our Canadian potash outside the U.S. and Canada.
|
|
•
|
Our
Mosaic Fertilizantes
business segment consists of the assets in Brazil that we acquired in the Acquisition, which include five Brazilian phosphate rock mines; four phosphate chemical plants and a potash mine in Brazil. The segment also includes our legacy distribution business in South America which, consists of sales offices, crop nutrient blending and bagging facilities, port terminals and warehouses in Brazil and Paraguay. We also have a majority interest in Fospar S.A., which owns and operates a single superphosphate granulation plant and a deep-water crop nutrition port and throughput warehouse terminal facility in Brazil.
|
Intersegment eliminations, unrealized mark-to-market gains/losses on derivatives, debt expenses, Streamsong Resort
®
results of operations and the results of the China and India distribution businesses are included within Corporate, Eliminations and Other. See Note
25
of the Consolidated Financial Statements in this report for segment results.
Key Factors that can Affect Results of Operations and Financial Condition
Our primary products, phosphate and potash crop nutrients, are, to a large extent, global commodities that are also available from a number of domestic and international competitors, and are sold by negotiated contracts or by reference to published market prices. The markets for our products are highly competitive, and the most important competitive factor for our products is delivered price. Business and economic conditions and governmental policies affecting the agricultural industry and customer sentiment are the most significant factors affecting worldwide demand for crop nutrients. The profitability of our businesses is heavily influenced by worldwide supply and demand for our products, which affects our sales prices and volumes. Our costs per tonne to produce our products are also heavily influenced by fixed costs associated with owning and
F-2
operating our major facilities, significant raw material costs in our Phosphates and Mosaic Fertilizantes businesses, and fluctuations in currency exchange rates.
Our products are generally sold based on the market prices prevailing at the time the sales contract is signed or through contracts which are priced at the time of shipment based on a formula. Additionally, in certain circumstances the final price of our products is determined after shipment based on the current market at the time the price is agreed to with the customer. Forward sales programs at fixed prices increase the lag between prevailing market prices and our average realized selling prices. The mix and parameters of these sales programs vary over time based on our marketing strategy, which considers factors that include, among others, optimizing our production and operating efficiency within warehouse limitations, as well as customer requirements. The use of forward sales programs and the level of customer prepayments may vary from period to period due to changing supply and demand environments, seasonality, and market sentiments.
World prices for the key raw material inputs for concentrated phosphate products, including ammonia, sulfur and phosphate rock, have an effect on industry-wide phosphate prices and production costs. The primary feedstock for producing ammonia is natural gas, and costs for ammonia are generally highly dependent on the supply and demand balance for ammonia. In North America, we purchase approximately one-third of our ammonia from various suppliers in the spot market with the remaining two-thirds either purchased through a long-term ammonia supply agreement (the “
CF Ammonia Supply Agreement
”) with an affiliate of CF Industries, Inc. (“
CF
”) or produced internally at our Faustina, Louisiana location. The CF Ammonia Supply Agreement provides for U.S. natural gas-based pricing that is intended to lessen pricing volatility. We entered into the agreement in late 2013, and we began purchasing under it in the second half of 2017. If the price of natural gas rises or the market price for ammonia falls outside of the range anticipated at execution of the agreement, we may not realize a cost benefit from the natural gas-based pricing over the term of the agreement, or the cost of our ammonia under the agreement could be a competitive disadvantage. Based on the prevailing market prices of natural gas and ammonia as of the date of this report, the difference between what we would pay under the agreement versus what we would pay for ammonia on the spot market is not material. However, we continue to expect that the agreement will provide us a competitive advantage over its term, including by providing a reliable long-term ammonia supply. In Brazil, we purchase all of our ammonia under a long-term supply agreement with a single supplier.
Sulfur is a global commodity that is primarily produced as a by-product of oil refining. The market price is based primarily on the supply and demand balance for sulfur. We believe our current and future investments in sulfur transformation and transportation assets will enhance our competitive advantage. We produce and procure most of our phosphate rock requirements through either wholly or partly owned mines. In addition to producing phosphate rock, Mosaic Fertilizantes purchases phosphates, potash and nitrogen products which are either used to produce blended crop nutrients (“
Blends
”) or for resale.
Our per tonne selling prices for potash are affected by shifts in the product mix, geography and customer mix. Our Potash business is significantly affected by Canadian resource taxes and royalties that we pay to the Province of Saskatchewan in order for us to mine and sell our potash products. In addition, cost of goods sold is affected by a number of factors, including: fluctuations in the Canadian dollar; the level of periodic inflationary pressures on resources in western Canada, where we produce most of our potash; natural gas costs for operating our potash solution mine at Belle Plaine, Saskatchewan; and the operating costs we incur to manage salt saturated brine inflows at our potash mine at Esterhazy, Saskatchewan, which are affected by changes in the amount and pattern of the inflows. We also incur capital costs to manage the brine inflows at Esterhazy.
We manage brine inflows at Esterhazy through a number of methods, primarily by reducing or preventing particular sources of brine inflow by locating the point of entry through the use of various technologies, including 3D seismic surveys, micro seismic monitoring, injecting calcium chloride into the targeted areas from surface, and grouting targeted areas from underground. We also pump brine out of the mine, which we impound in surface storage areas and dispose of by injecting it below the surface through the use of injection wells. Excess brine is also stored in mined-out areas of the mine, and the level of this stored brine fluctuates, from time to time, depending on the net inflow or net outflow rate. To date, our brine inflow and remediation efforts have not had a material impact on our production processes or volumes. In recent years, we have been investing in additional capacity and technology to manage the brine inflows. For example, we have significantly expanded our pumping capacity at Esterhazy in the last several years, introduced horizontal drilling capabilities, and have added brine injection capacity at a site that is remote from our current mine workings. These efforts allow us to be more disciplined and efficient in our approach to managing the brine inflow and to reduce our costs. We are currently developing the K3 shaft at our Esterhazy mine. Once completed, this will provide us the opportunity to eliminate future brine inflow management costs and risk.
F-3
Our results of operations are also affected by changes in currency exchange rates due to our international footprint. The most significant currency impacts are generally from the Canadian dollar and the Brazilian real.
A discussion of these and other factors that affected our results of operations and financial condition for the periods covered by this Management’s Discussion and Analysis of Financial Condition and Results of Operations is set forth in further detail below. This Management’s Discussion and Analysis of Financial Condition and Results of Operations should also be read in conjunction with the narrative description of our business in Item 1, and the risk factors described in Item 1A, of Part I of this annual report on Form 10-K, and our Consolidated Financial Statements, accompanying notes and other information listed in the accompanying Financial Table of Contents.
Throughout the discussion below, we measure units of production, sales and raw materials in metric tonnes which are the equivalent of 2,205 pounds, unless we specifically state that we mean short or long ton(s), which are the equivalent of 2,000 pounds and 2,240 pounds, respectively. In addition, we measure natural gas, a raw material used in the production of our products, in MMBTU, which stands for one million British Thermal Units (BTU). One BTU is equivalent to 1.06 Joules.
In the following table, there are certain percentages that are not considered to be meaningful and are represented by “NM”.
Results of Operations
The following table shows the results of operations for the years ended
December 31, 2018
,
2017
, and
2016
:
|
|
Years Ended December 31,
|
2018-2017
|
2017-2016
|
||||||||||||||||||||||
|
(in millions, except per share data)
|
2018
|
2017
|
2016
|
Change
|
Percent
|
Change
|
Percent
|
||||||||||||||||||
|
Net sales
|
$
|
9,587.3
|
|
$
|
7,409.4
|
|
$
|
7,162.8
|
|
$
|
2,177.9
|
|
29
|
%
|
$
|
246.6
|
|
3
|
%
|
||||||
|
Cost of goods sold
|
8,088.9
|
|
6,566.6
|
|
6,352.8
|
|
1,522.3
|
|
23
|
%
|
213.8
|
|
3
|
%
|
|||||||||||
|
Gross margin
|
1,498.4
|
|
842.8
|
|
810.0
|
|
655.6
|
|
78
|
%
|
32.8
|
|
4
|
%
|
|||||||||||
|
Gross margin percentage
|
15.6
|
%
|
11.4
|
%
|
11.3
|
%
|
4.2
|
%
|
|
|
0.1
|
%
|
|
|
|||||||||||
|
Selling, general and administrative expenses
|
341.1
|
|
301.3
|
|
304.2
|
|
39.8
|
|
13
|
%
|
(2.9
|
)
|
(1
|
)%
|
|||||||||||
|
Other operating expenses
|
229.0
|
|
75.8
|
|
186.8
|
|
153.2
|
|
NM
|
|
(111.0
|
)
|
(59
|
)%
|
|||||||||||
|
Operating earnings
|
928.3
|
|
465.7
|
|
319.0
|
|
462.6
|
|
99
|
%
|
146.7
|
|
46
|
%
|
|||||||||||
|
Interest expense, net
|
(166.1
|
)
|
(138.1
|
)
|
(112.4
|
)
|
(28.0
|
)
|
20
|
%
|
(25.7
|
)
|
23
|
%
|
|||||||||||
|
Foreign currency transaction (loss) gain
|
(191.9
|
)
|
49.9
|
|
40.1
|
|
(241.8
|
)
|
NM
|
|
9.8
|
|
24
|
%
|
|||||||||||
|
Other expense
|
(18.8
|
)
|
(3.5
|
)
|
(4.3
|
)
|
(15.3
|
)
|
NM
|
|
0.8
|
|
(19
|
)%
|
|||||||||||
|
Earnings from consolidated companies before income taxes
|
551.5
|
|
374.0
|
|
242.4
|
|
177.5
|
|
47
|
%
|
131.6
|
|
54
|
%
|
|||||||||||
|
Provision for (benefit from) income taxes
|
77.1
|
|
494.9
|
|
(74.2
|
)
|
(417.8
|
)
|
(84
|
)%
|
569.1
|
|
NM
|
|
|||||||||||
|
Earnings (loss) from consolidated companies
|
474.4
|
|
(120.9
|
)
|
316.6
|
|
595.3
|
|
NM
|
|
(437.5
|
)
|
(138
|
)%
|
|||||||||||
|
Equity in net (loss) earnings of nonconsolidated companies
|
(4.5
|
)
|
16.7
|
|
(15.4
|
)
|
(21.2
|
)
|
(127
|
)%
|
32.1
|
|
NM
|
|
|||||||||||
|
Net earnings (loss) including noncontrolling interests
|
469.9
|
|
(104.2
|
)
|
301.2
|
|
574.1
|
|
NM
|
|
(405.4
|
)
|
(135
|
)%
|
|||||||||||
|
Less: Net (loss) earnings attributable to noncontrolling interests
|
(0.1
|
)
|
3.0
|
|
3.4
|
|
(3.1
|
)
|
(103
|
)%
|
(0.4
|
)
|
(12
|
)%
|
|||||||||||
|
Net earnings (loss) attributable to Mosaic
|
$
|
470.0
|
|
$
|
(107.2
|
)
|
$
|
297.8
|
|
$
|
577.2
|
|
NM
|
|
$
|
(405.0
|
)
|
(136
|
)%
|
||||||
|
Diluted net earnings (loss) per share attributable to Mosaic
|
$
|
1.22
|
|
$
|
(0.31
|
)
|
$
|
0.85
|
|
$
|
1.53
|
|
NM
|
|
$
|
(1.16
|
)
|
(136
|
)%
|
||||||
|
Diluted weighted average number of shares outstanding
|
386.4
|
|
350.9
|
|
351.7
|
|
|
|
|||||||||||||||||
F-4
Overview of the Years ended
December 31, 2018
,
2017
, and
2016
Net earnings (loss) attributable to Mosaic for the year ended
December 31, 2018
was
$470.0 million
, or
$1.22
per diluted share, compared to
$(107.2) million
, or
$(0.31)
per diluted share for 2017, and
$297.8 million
, or
$0.85
per diluted share for
2016
. Current year net earnings were favorably impacted by increased average selling prices across our business units.
In 2018, net earnings (loss) were negatively impacted by $432 million, or ($0.90) per diluted share, related to notable items of which the significant items are following:
•
Foreign currency transaction losses of $192 million, or $(0.39) per diluted share
•
Other operating expenses primarily related to the Acquisition of $80 million, or $(0.17) per diluted share
|
•
|
The write-off of $57 million, or ($0.13) per diluted share, of engineering and other costs for discontinued projects in relation to changes in strategic plans
|
•
Revisions in the estimated costs of our asset retirement obligations of $30 million, or ($0.06) per diluted share
•
Unrealized losses on derivatives of $33 million, or $(0.07) per diluted share
•
Expenses of $30 million related to a refinement of our weighted average inventory costing, or $(0.06) per diluted share
•
Non-operating expenses of $12 million related to realized losses on RCRA trust securities, or $(0.02) per diluted share
In addition, our diluted per share calculation in the current year was impacted by the issuance of approximately 34 million shares of common stock to Vale S.A. in January 2018, as part of the Acquisition, which increased our outstanding share amount.
Net earnings (loss) for 2017 included a discrete income tax expense of $451 million, or ($1.30)
per diluted share, primarily related to
enactment of the U.S. Tax Cuts and Jobs Act.
Net earnings (loss) also
included: (i) a net impact to royalties and Canadian resource tax expense of $25 million after tax, or ($0.07) per diluted share, related to the expected resolution of a royalty matter with the government of Saskatchewan to settle disputed Canadian potash royalties for prior years and related royalty and tax impacts, and (ii) charges of $33 million in other operating expenses, or $(0.11) per diluted share, related to items that are further discussed in the Other Income Statement Items section of this Management’s Discussion and Analysis of Financial Condition and Results of Operations. In addition, we recorded a pre-tax gain of $49 million, or $0.15 per diluted share, related to foreign currency transaction gains, the effect of which was partially offset by unrealized mark-to-market losses on derivatives of $13 million, or ($0.03) per diluted share, in 2017.
Net earnings (loss) for 2016 included discrete income tax benefits of $54 million, or $0.16 per diluted share. Our 2016 results included $135 million in other operating expenses, or $(0.40) per diluted share, related to items which are further discussed in the Other Income Statement Items section of Management’s Discussion and Analysis of Financial Condition and Results of Operations. Reflected in our 2016 results was the write-off of a capital project at one of our equity investments, of which our share was approximately $24 million, or $16 million after tax and $(0.05) per diluted share. In addition, we recorded $111 million, or $0.24 per diluted share, related to foreign currency transaction gains and unrealized mark-to-market gains on derivatives in 2016.
Additional significant factors that affected our results of operations and financial condition in
2018
,
2017
and
2016
are listed below. These factors are discussed in more detail in the following sections of this Management’s Discussion and Analysis of Financial Condition and Results of Operations.
Year ended
December 31, 2018
Operating earnings for the year ended December 31, 2018 were favorably impacted by an increase in phosphates selling prices in the current year compared to the prior year. Phosphate finished product selling prices in the current year were impacted by an increase in global demand. Global demand grew faster than supply due to a reduction in global product availability, resulting from the temporary idling of our Plant City, Florida phosphates manufacturing facility in the fourth quarter of 2017, and a delay in competitors' new capacity coming online. The benefit from the increase in selling prices was partially offset by lower sales volumes, as a result of temporarily idling our Plant City, Florida facility and higher raw material costs, primarily sulfur.
F-5
Operating results were also favorably impacted by increases in the average selling price of potash in the current year compared to the prior year. Prices have trended upward over the past year due to improved market sentiment, driven by stronger global demand, and a delay in competitors' new capacity ramping up. This benefit was partially offset by higher Canadian resource taxes and our increased plant spending from higher production volumes in the current year.
Operating results were also favorably impacted by the operations of the Acquired Business, an increase in average selling prices in Brazil and the favorable impact of the strengthening of the US dollar relative to the Brazilian real in our Mosaic Fertilizantes segment.
Other highlights in
2018
:
We took the following steps toward achieving our strategic priorities in 2018:
|
•
|
On January 8, 2018, we completed the Acquisition of Vale Fertilizantes S.A. (now known as Mosaic Fertilizantes P&K S.A., which we also refer to as Mosaic Fertilizantes). The aggregate consideration paid by Mosaic at closing was $1.08 billion in cash (after giving effect to certain adjustments based on matters such as the working capital of the Acquired Business, which were estimated at the time of closing) and 34,176,574 shares of our Common Stock, par value $0.01 per share, which was valued at $26.92 per share at closing. The assets acquired include five Brazilian phosphate rock mines; four chemical plants; a potash mine in Brazil; an additional 40% economic interest in the Miski Mayo Mine, which increased our aggregate interest to 75%; and a potash project in Kronau, Saskatchewan. In 2018, we realized
$158 million
of targeted savings and synergies, net of costs to achieve, related to the Acquisition, as well as an additional $21 million in benefits from our business-to-business marketing strategy. We expect to achieve our previously announced goal of $275 million of annual savings and synergies by the end of 2019.
|
|
•
|
On December 1, 2018, the Ma’aden Wa’ad Al Shamal Phosphate Company (“
MWSPC
”), our joint venture with Saudi Arabian Mining Company (“
Ma’aden
”) and Saudi Basic Industries Corporation (“
SABIC
”) that owns and operates integrated phosphate production facilities in the Kingdom of Saudi Arabia, commenced commercial operations of the DAP plant, thereby bringing the entire project to the commercial production phase. We expect DAP production to gradually ramp-up until it reaches 3.0 million tonnes in annual production capacity. In 2018, MWSPC produced 1.4 million tonnes of phosphate products. Our cash investment at December 31, 2018 and as of the date of this report, is approximately
$770 million
. We did not make any contributions in 2018 and do not expect future contributions will be needed. However, we are contractually obligated to make future cash contributions of approximately $70 million, if needed.
|
|
•
|
During 2018, we prepaid $684 million against our term loan and paid off $89 million in maturing bonds, bringing our total repayments of long-term debt, including other long-term debt, in 2018 to over $800 million.
|
|
•
|
We had record sales volumes of
2.9
million tonnes of MicroEssentials
®
in 2018.
|
|
•
|
We continued the expansion of capacity in our Potash segment with the K3 shafts at our Esterhazy mine, which began to mine a limited amount of potash ore in 2017. Following ramp-up, we expect this expansion will add an estimated 0.9 million tonnes to our existing potash operational capacity. Once completed, this will provide us the opportunity to eliminate future brine inflow management costs and risk by 2024.
|
|
•
|
In December, we received the final permit to mine the Ona phosphate reserves, which will extend our Florida phosphate mining for decades.
|
|
•
|
We continue to focus on optimizing our asset portfolio. On August 31, 2018, we temporarily idled our South Pasture, Florida beneficiation plant for an indefinite period of time.
|
Subsequent to year end, on March 7, 2019, we announced that we would reduce our phosphate production by approximately 300,000 tonnes for the spring planting season in North America due to continued weather concerns across key U.S. growing regions, along with higher than normal carryover inventory level from the fall.
Year ended December 31, 2017
Operating earnings for the year ended December 31, 2017 were favorably impacted by higher potash production levels and an increase in potash sales volumes. Higher potash sales volumes, particularly export sales volumes, favorably impacted net
F-6
sales and operating results in 2017 compared to 2016. In July 2016, we temporarily idled our Colonsay, Saskatchewan potash mine for the remainder of 2016 in light of reduced customer demand. We did not have a shut-down of similar length in 2017. In 2016, export sales volumes were low due to the delay in settlement of the China potash contract, which negatively impacted customer sentiment, affecting the timing of sales to other major markets. A similar delay in 2017 did not have a major impact on these markets. We also saw an increase in domestic sales volumes in the fourth quarter of 2017 due to a strong winter fill program and improved customer sentiment.
Phosphate operating earnings for the year ended December 31, 2017 were favorably impacted by the $52.1 million gain from our sale of approximately 1,500 acres of vacant and undesignated real property near our Faustina facility in Louisiana. Partially offsetting this was the impact of a decline in the average selling price of feed products in 2017 compared to 2016. Selling prices for these products were unfavorably impacted by increased competitor shipments into North America. The negative impact from lower selling prices was partially offset by lower raw material costs used in production in 2017 compared to 2016. Phosphate sales volumes were lower for the year ended December 31, 2017 compared to 2016. A significant portion of the decrease was a result of the impacts of Hurricane Irma, which occurred in the third quarter of 2017.
In the fourth quarter of 2017, average selling prices for phosphates and potash began to increase due to a change in sentiment that helped drive higher demand.
Year ended December 31, 2016
Operating earnings for the year ended December 31, 2016 were unfavorably impacted by significantly lower average selling prices for phosphates and potash, partially offset by lower phosphates raw material costs and higher phosphates sales volumes.
Our net sales and operating results for the year ended December 31, 2016 were negatively impacted by a decline in phosphates average selling prices compared to 2015. Phosphates average selling prices were unfavorably impacted by cautious purchasing behavior in the first half of 2016, driven by aggressive pricing by global producers and lower grain and oilseed prices. Selling prices were also influenced by lower raw material prices driven by global supply and demand of sulfur and ammonia. In the second half of 2016, sales volumes increased due to low phosphate pipeline inventory levels and concerns about tightness in product availability. A significant portion of the increase in our sales volumes was from sales of MicroEssentials
®
in North America and Brazil.
Lower potash average selling prices unfavorably impacted net sales and operating results in 2016 compared to 2015. In 2016, potash average selling prices were negatively impacted by the global competitive environment, driven by a strengthening of the U.S. dollar versus significantly devalued local currencies of other producers. Potash prices were also influenced by lower global grain and oilseed prices. Delays in settlement of the Chinese potash contract and high inventory levels early in 2016 also added downward pressure to potash selling prices during the first half of 2016.
F-7
Phosphates Net Sales and Gross Margin
The following table summarizes the Phosphates segment’s net sales, gross margin, sales volume, selling prices and raw material prices:
|
Years Ended December 31,
|
2018-2017
|
2017-2016
|
|||||||||||||||||||||||
|
(in millions, except price per tonne or unit)
|
2018
|
2017
|
2016
|
Change
|
Percent
|
Change
|
Percent
|
||||||||||||||||||
|
Net sales:
|
|||||||||||||||||||||||||
|
North America
|
$
|
2,283.0
|
|
$
|
2,061.7
|
|
$
|
2,133.2
|
|
$
|
221.3
|
|
11
|
%
|
$
|
(71.5
|
)
|
(3
|
)%
|
||||||
|
International
|
1,603.3
|
|
1,527.5
|
|
1,577.7
|
|
75.8
|
|
5
|
%
|
(50.2
|
)
|
(3
|
)%
|
|||||||||||
|
Total
|
3,886.3
|
|
3,589.2
|
|
3,710.9
|
|
297.1
|
|
8
|
%
|
(121.7
|
)
|
(3
|
)%
|
|||||||||||
|
Cost of goods sold
|
3,304.8
|
|
3,257.0
|
|
3,361.1
|
|
47.8
|
|
1
|
%
|
(104.1
|
)
|
(3
|
)%
|
|||||||||||
|
Gross margin
|
$
|
581.5
|
|
$
|
332.2
|
|
$
|
349.8
|
|
$
|
249.3
|
|
75
|
%
|
$
|
(17.6
|
)
|
(5
|
)%
|
||||||
|
Gross margin as a percentage of net sales
|
15.0
|
%
|
9.3
|
%
|
9.4
|
%
|
|||||||||||||||||||
|
Sales volumes
(a)
(in thousands of metric tonnes)
|
|||||||||||||||||||||||||
|
DAP/MAP
|
4,947
|
|
6,339
|
|
6,845
|
|
(1,392
|
)
|
(22
|
)%
|
(506
|
)
|
(7
|
)%
|
|||||||||||
|
Specialty
(b)
|
3,411
|
|
3,121
|
|
2,835
|
|
290
|
|
9
|
%
|
286
|
|
10
|
%
|
|||||||||||
|
Total finished product tonnes
|
8,358
|
|
9,460
|
|
9,680
|
|
(1,102
|
)
|
(12
|
)%
|
(220
|
)
|
(2
|
)%
|
|||||||||||
|
Rock
(c)
|
1,401
|
|
—
|
|
—
|
|
1,401
|
|
NM
|
|
—
|
|
NM
|
|
|||||||||||
|
Total Phosphates Segment Tonnes
(a)
|
9,759
|
|
9,460
|
|
9,680
|
|
299
|
|
3
|
%
|
(220
|
)
|
(2
|
)%
|
|||||||||||
|
Realized prices ($/tonne)
|
|||||||||||||||||||||||||
|
Average finished product selling price (destination)
|
$
|
453
|
|
$
|
379
|
|
$
|
383
|
|
$
|
74
|
|
20
|
%
|
$
|
(4
|
)
|
(1
|
)%
|
||||||
|
Average rock selling price (destination)
(a)
|
$
|
71
|
|
$
|
—
|
|
$
|
—
|
|
$
|
71
|
|
NM
|
|
$
|
—
|
|
NM
|
|
||||||
|
Average cost per unit consumed in cost of goods sold:
|
|||||||||||||||||||||||||
|
Ammonia (metric tonne)
|
$
|
334
|
|
$
|
312
|
|
$
|
307
|
|
$
|
22
|
|
7
|
%
|
$
|
5
|
|
2
|
%
|
||||||
|
Sulfur (long ton)
|
$
|
138
|
|
$
|
91
|
|
$
|
105
|
|
$
|
47
|
|
52
|
%
|
$
|
(14
|
)
|
(13
|
)%
|
||||||
|
Blended rock (metric tonne)
|
$
|
58
|
|
$
|
59
|
|
$
|
61
|
|
$
|
(1
|
)
|
(2
|
)%
|
$
|
(2
|
)
|
(3
|
)%
|
||||||
|
Production volume (in thousands of metric tonnes) - North America
|
8,357
|
|
9,425
|
|
9,520
|
|
(1,068
|
)
|
(11
|
)%
|
(95
|
)
|
(1
|
)%
|
|||||||||||
(a)
Includes intersegment sales volumes.
(b)
Includes sales volumes of MicroEssentials® and animal feed ingredients.
(c) Sales volumes of rock are presented on a wet tonne basis based on average moisture levels of 3.5% to 4.5% as it exits the drying process and is prepared for shipping.
Year Ended December 31,
2018
compared to Year Ended December 31,
2017
The Phosphates segment’s net sales were
$3.9 billion
for the year ended December 31,
2018
, compared to
$3.6 billion
for the same period a year ago. The increase in net sales was due to higher average selling prices that resulted in an increase of approximately $500 million, partially offset by lower sales volumes which resulted in a decrease in net sales of approximately $300 million. Consolidated sales of phosphate rock from the Miski Mayo mine also contributed approximately $100 million to net sales for the year ended December 31, 2018. We began consolidating the Miski Mayo results in the current year due to the additional 40% economic interest acquired in the Acquisition, which increased our aggregate ownership interest in the mine to 75%.
Our average finished product selling price was
$453
per tonne for the year ended December 31,
2018
compared to
$379
per tonne for the same period a year ago. The positive impact on net sales related to selling price was primarily attributable to an increase in global demand, as well as a reduction in global product availability due to the temporary idling of our Plant City, Florida phosphates manufacturing facility and a delay in competitors' new capacity coming online.
The Phosphates segment’s sales volumes of finished products decreased to
8.4 million
tonnes for the year ended December 31,
2018
, compared to
9.5 million
tonnes in
2017
. The decrease in sales volumes in the current year was primarily due to the temporary idling of our Plant City, Florida phosphates manufacturing facility, partially offset by record sales volumes of MicroEssentials® products.
F-8
Gross margin for the Phosphates segment increased to
$581.5 million
in the current year compared with
$332.2 million
for the prior year. The increase was primarily driven by the $500 million impact of higher selling prices in the current year, which included higher selling prices from MicroEssentials® products that sell at a premium to conventional products, and a favorable impact of lower rock costs of approximately $55 million. This was partially offset by negative impacts of higher sulfur and ammonia costs of approximately $220 million in the current year due to the tightening of global supply and demand for each of these raw materials. In addition, gross margin in the current year was unfavorably impacted by approximately $50 million, due to idle plant costs, depreciation expense and increased water transportation costs at our Plant City, Florida facility and South Pasture, Florida mine, and $20 million related to a refinement made during the current year to our weighted average inventory costing.
The average consumed price for ammonia for our North American operations increased to
$334
per tonne in
2018
from
$312
a year ago. We purchase approximately one-third of our ammonia from various suppliers in the spot market, with the remaining two-thirds either purchased through an ammonia supply agreement or produced internally at our Faustina, Louisiana location. The average consumed price for sulfur for our North American operations increased to
$138
per long ton for the year ended
December 31, 2018
from
$91
in the same period a year ago. The purchase price of these raw materials is driven by global supply and demand. The consumed ammonia and sulfur prices also include transportation, transformation, and storage costs. The average consumed cost of purchased and produced rock decreased to
$58
per tonne in the current year from
$59
a year ago. Our rock costs have benefited from the consolidation of Miski Mayo as well as using less rock purchased from third parties in the current year period compared to the prior year.
The Phosphates segment’s production of crop nutrient dry concentrates and animal feed ingredients decreased to
8.4 million
tonnes for the year ended
December 31, 2018
, compared to
9.4 million
in
2017
. This volume decrease in the current year was primarily due to the idling of our Plant City, Florida phosphates manufacturing facility. For the year ended
December 31, 2018
, our operating rate for processed phosphate production increased to 86%, excluding Plant City capacity, which was not considered available capacity, compared to 81% in the same period of the prior year.
Our North American phosphate rock production was
14.2 million
tonnes in the current year compared with
15.0 million
tonnes in the same period a year ago. The decrease from the prior year was due to the lower production from the temporary idling of our South Pasture, Florida mine in August 2018. Phosphate rock production for the Miski Mayo mine, which was a nonconsolidated equity investment in 2017, was 4.1 million wet tonnes in the current year, which was a production record for the mine.
Year Ended December 31, 2017 compared to Year Ended December 31, 2016
The Phosphates segment’s net sales were $3.6 billion for the year ended December 31, 2017, compared to $3.7 billion for 2016. The decrease in net sales was due to lower average selling prices and lower sales volumes, which each had a negative impact on net sales of approximately $60 million compared to the prior year.
Our average finished product selling price was $379 per tonne for the year ended December 31, 2017 compared to $383 in 2016. The negative impact on net sales related to selling price was primarily attributable to a decline in the selling price of feed products, which were impacted by increased competition in the current year, as well as a shift in the product mix of MAP and MicroEssentials
®
products.
The Phosphates segment’s sales volumes decreased to 9.5 million tonnes for the year ended December 31, 2017, compared to 9.7 million tonnes in 2016. The decrease in sales volumes in 2017 was due to a decrease in feed volumes, which were negatively impacted by increased competition from lower priced competitors in the market and lost sales volumes related to impacts from Hurricane Irma.
Gross margin for the Phosphates segment decreased to $332.2 million in the current year compared with $349.8 million for 2016. Lower average selling prices and lower sales volumes resulted in decreases to gross margin of approximately $60 million and $10 million, respectively. This was offset by approximately $70 million related to lower raw material costs. Gross margin was negatively impacted by approximately $40 million related to planned and unplanned downtime at our Faustina, Louisiana ammonia facility, mostly in the second quarter of 2017.
The average consumed price for ammonia for our North American operations increased to $312 per tonne in 2017 from $307 in 2016. The average consumed price for sulfur for our North American operations decreased to $91 per long ton for the year ended December 31, 2017, from $105 in 2016. The purchase price of these raw materials is driven by global supply and demand. The average consumed cost of purchased and produced rock decreased to $59 per tonne in 2017 from $61 in 2016. The percentage of phosphate rock purchased from our Miski Mayo Mine included in cost of goods sold in our North American operations was 9% for the years ended December 31, 2017 and 2016.
F-9
The Phosphates segment’s production of crop nutrient dry concentrates and animal feed ingredients was 9.4 million tonnes for the year ended December 31, 2017 and 9.5 million tonnes for the year ended December 31, 2016, resulting in an operating rate of 81% for processed phosphate production for both 2017 and 2016. On December 10, 2017, we temporarily idled our Plant City, Florida phosphate manufacturing facility.
Our phosphate rock production was 15.0 million tonnes in 2017 compared with 14.2 million tonnes in 2016. We generally manage our rock production consistent with our long term mine plans.
Potash Net Sales and Gross Margin
The following table summarizes the Potash segment’s net sales, gross margin, sales volume and selling price:
|
Years Ended December 31,
|
2018-2017
|
2017-2016
|
|||||||||||||||||||||||
|
(in millions, except price per tonne or unit)
|
2018
|
2017
|
2016
|
Change
|
Percent
|
Change
|
Percent
|
||||||||||||||||||
|
Net sales:
|
|||||||||||||||||||||||||
|
North America
|
$
|
1,298.6
|
|
$
|
1,097.3
|
|
$
|
1,024.3
|
|
$
|
201.3
|
|
18
|
%
|
$
|
73.0
|
|
7
|
%
|
||||||
|
International
|
875.3
|
|
755.3
|
|
661.4
|
|
120.0
|
|
16
|
%
|
93.9
|
|
14
|
%
|
|||||||||||
|
Total
|
2,173.9
|
|
1,852.6
|
|
1,685.7
|
|
321.3
|
|
17
|
%
|
166.9
|
|
10
|
%
|
|||||||||||
|
Cost of goods sold
|
1,576.7
|
|
1,461.0
|
|
1,429.1
|
|
115.7
|
|
8
|
%
|
31.9
|
|
2
|
%
|
|||||||||||
|
Gross margin
|
$
|
597.2
|
|
$
|
391.6
|
|
$
|
256.6
|
|
$
|
205.6
|
|
53
|
%
|
$
|
135.0
|
|
53
|
%
|
||||||
|
Gross margin as a percentage of net sales
|
27.5
|
%
|
21.1
|
%
|
15.2
|
%
|
|||||||||||||||||||
|
Sales volume
(a)
(in thousands of metric tonnes)
|
|||||||||||||||||||||||||
|
MOP
|
7,991
|
|
7,923
|
|
7,254
|
|
68
|
|
1
|
%
|
669
|
|
9
|
%
|
|||||||||||
|
Specialty
(b)
|
791
|
|
678
|
|
524
|
|
113
|
|
17
|
%
|
154
|
|
29
|
%
|
|||||||||||
|
Total Potash Segment Tonnes
|
8,782
|
|
8,601
|
|
7,778
|
|
181
|
|
2
|
%
|
823
|
|
11
|
%
|
|||||||||||
|
Realized prices ($/tonne)
|
|||||||||||||||||||||||||
|
Average finished product selling price (destination)
|
$
|
248
|
|
$
|
215
|
|
$
|
217
|
|
$
|
33
|
|
15
|
%
|
$
|
(2
|
)
|
(1
|
)%
|
||||||
|
Production volume (in thousands of metric tonnes)
|
9,239
|
|
8,650
|
|
7,596
|
|
589
|
|
7
|
%
|
1,054
|
|
14
|
%
|
|||||||||||
(a)
Includes intersegment sales volumes.
(b)
Includes sales volumes of K-mag, Aspire and animal feed ingredients.
Year Ended December 31,
2018
compared to Year Ended December 31,
2017
The Potash segment’s net sales increased to
$2.2 billion
for the year ended
December 31, 2018
, compared to
$1.9 billion
in the same period a year ago. The increase in net sales was driven by a favorable impact from higher average selling prices of approximately $260 million and higher sales volumes of approximately $40 million compared to the prior year.
Our average finished product selling price was
$248
per tonne for the year ended
December 31, 2018
, an increase of
$33
per tonne compared with the prior year period, due to improved market sentiment driven by stronger global demand and a delay in competitors' new capacity ramping up.
The Potash segment’s sales volumes
increased
to
8.8 million
tonnes for the year ended
December 31, 2018
, compared to
8.6 million
tonnes in the same period a year ago, due to improved market sentiment driven by stronger demand. In the current year, recognized sales volumes were negatively impacted by Canpotex's adoption of the new revenue standards which resulted in the deferral of approximately 450,000 tonnes as of December 31, 2018.
Gross margin for the Potash segment
increased
to
$597.2 million
in the current year, from
$391.6 million
in the prior year period. Gross margin was positively impacted by $260 million related to the increase in selling prices. This was partially offset by approximately $60 million related to the net impact of higher Canadian resource taxes and lower royalties as discussed below. These and other factors affecting gross margin are further discussed below.
We had expense of
$159.4 million
from Canadian resource taxes for the year ended December 31, 2018, compared to $70.1 million in the prior year period. Royalty expense decreased to
$39.4 million
for the year ended December 31, 2018, compared to $71.9 million in the prior year period. The fluctuations in Canadian resource taxes and royalty expense are a result of higher profitability from higher average selling prices and lower capital expenditures in the current year, and the resolution of a royalty matter with the government of Saskatchewan in the prior year.
F-10
We incurred $154.7 million in brine management expenses, including depreciation on brine assets, at our Esterhazy mine in
2018
, compared to $151.3 million in
2017
. We have been effectively managing the brine inflows at Esterhazy since 1985, and from time to time we experience changes to the amounts and patterns of brine inflows. Inflows continue to be within the range of our historical experience. Brine inflow expenditures continue to reflect the cost of addressing changing inflow patterns, including inflows from below our mine workings, which can be more complex and costly to manage. The Esterhazy mine has significant brine storage capacity. Depending on inflow rates, pumping and disposal rates, and other variables, the volume of brine stored in the mine may change significantly from period to period. In general, the higher the level of brine stored in the mine, the less time available to mitigate new or increased inflows that exceed our capacity for pumping or disposal of brine outside the mine, and therefore the less time to avoid flooding and/or loss of the mine. Our past investments in remote injection and increased pumping capacities facilitate our management of the brine inflows and the amount of brine stored in the mine. We are continuing the expansion of capacity in our Potash segment with the K3 shafts at our Esterhazy mine. Once completed, this will provide us the opportunity to eliminate future brine inflow management costs and risks by closing our K1 and K2 shafts.
For the year ended
December 31, 2018
, potash production increased to
9.2 million
tonnes compared to
8.7 million
tonnes in the prior year period, due to less down time in the current year. Our operating rate for potash production was 88% for
2018
, compared to 87% for 2017. Our operating rate in 2018 reflects higher capacity as a result of a proving run at our Belle Plaine mine completed in 2017.
Year Ended December 31, 2017 compared to Year Ended December 31, 2016
The Potash segment’s net sales increased to $1.9 billion for the year ended December 31, 2017, compared to $1.7 billion in 2016. The increase was primarily due to higher sales volumes that resulted in an increase in net sales of approximately $180 million.
Our average finished product selling price was $215 per tonne for the year ended December 31, 2017, compared with $217 per tonne in 2016. The benefit from the increase in our average MOP selling price was more than offset by a decrease in our average K-Mag sales price, due to increased competition in this area.
The Potash segment’s sales volumes increased to 8.6 million tonnes for the year ended December 31, 2017, compared to 7.8 million tonnes in 2016 due to the factors discussed in the Overview.
Gross margin for the Potash segment increased to $391.6 million in 2017, from $256.6 million in 2016. Gross margin was positively impacted by approximately $40 million related to higher sales volumes, partially offset by a decrease of approximately $10 million driven by a decrease in our average K-Mag sales price as discussed above. Gross margin was also favorably impacted by approximately $120 million, due to the effects of operating more efficiently at higher levels of production, partially offset by an increase of approximately $50 million related to royalty expense, as described below. These and other factors affecting gross margin and costs are further discussed below.
We had expense of $70.1 million from Canadian resource taxes for the year ended December 31, 2017, compared to $101.1 million in 2016. Royalty expense increased to $71.9 million for the year ended December 31, 2017, compared to $20.5 million in 2016. The increase in royalty expense for 2017 was related to the resolution of a royalty matter with the government of Saskatchewan to settle disputed Canadian potash royalties for prior years. This had a favorable impact on Canadian resource taxes for 2017. Canadian resource taxes were also lower in 2017 due to a shift in the mix of production by mine.
We incurred $151.3 million in expenses, including depreciation on brine assets, at our Esterhazy mine in 2017, compared to $153.4 million in 2016.
For the year ended December 31, 2017, potash production was 8.7 million tonnes compared to 7.6 million tonnes in 2016. Our operating rate for potash production was 87% for 2017 compared to 72% for 2016. In 2016, we took steps to scale our operations, in light of reduced customer demand, by idling our Colonsay, Saskatchewan potash mine for the second half of 2016. In 2017, we also completed a proving run at our Belle Plaine mine in February 2017, which resulted in favorable production compared to 2016.
F-11
Mosaic Fertilizantes Net Sales and Gross Margin
The following table summarizes the Mosaic Fertilizantes segment’s net sales, gross margin, sales volume and selling price. The prior year activity reflects our former International Distribution segment excluding our China and India distribution activity, which is now being reported in Corporate, Eliminations and Other.
|
Years Ended December 31,
|
2018-2017
|
2017-2016
|
|||||||||||||||||||||||
|
(in millions, except price per tonne or unit)
|
2018
|
2017
|
2016
|
Change
|
Percent
|
Change
|
Percent
|
||||||||||||||||||
|
Net Sales
|
$
|
3,747.1
|
|
$
|
2,220.1
|
|
$
|
2,113.9
|
|
$
|
1,527.0
|
|
69
|
%
|
$
|
106.2
|
|
5
|
%
|
||||||
|
Cost of goods sold
|
3,364.2
|
|
2,091.5
|
|
1,988.9
|
|
1,272.7
|
|
61
|
%
|
102.6
|
|
5
|
%
|
|||||||||||
|
Gross margin
|
$
|
382.9
|
|
$
|
128.6
|
|
$
|
125.0
|
|
$
|
254.3
|
|
198
|
%
|
$
|
3.6
|
|
3
|
%
|
||||||
|
Gross margin as a percent of net sales
|
10.2
|
%
|
5.8
|
%
|
5.9
|
%
|
|||||||||||||||||||
|
Sales volume (in thousands of metric tonnes)
|
|||||||||||||||||||||||||
|
Phosphate produced in Brazil
|
2,847
|
|
302
|
|
265
|
|
2,545
|
|
NM
|
|
37
|
|
14
|
%
|
|||||||||||
|
Potash produced in Brazil
|
323
|
|
—
|
|
—
|
|
323
|
|
NM
|
|
—
|
|
NM
|
|
|||||||||||
|
Purchased nutrients
|
5,964
|
|
5,714
|
|
5,406
|
|
250
|
|
4
|
%
|
308
|
|
6
|
%
|
|||||||||||
|
Total Mosaic Fertilizantes Segment Tonnes
|
9,134
|
|
6,016
|
|
5,671
|
|
3,118
|
|
52
|
%
|
345
|
|
6
|
%
|
|||||||||||
|
Realized prices ($/tonne)
|
|||||||||||||||||||||||||
|
Average finished product selling price (destination)
|
$
|
410
|
|
$
|
369
|
|
$
|
373
|
|
$
|
41
|
|
11
|
%
|
$
|
(4
|
)
|
(1
|
)%
|
||||||
|
Purchases ('000 tonnes)
|
|||||||||||||||||||||||||
|
DAP/MAP from Mosaic
|
539
|
|
659
|
|
843
|
|
(120
|
)
|
(18
|
)%
|
(184
|
)
|
(22
|
)%
|
|||||||||||
|
MicroEssentials® from Mosaic
|
1,058
|
|
912
|
|
790
|
|
146
|
|
16
|
%
|
122
|
|
15
|
%
|
|||||||||||
|
Potash from Mosaic/Canpotex
|
2,361
|
|
2,073
|
|
1,697
|
|
288
|
|
14
|
%
|
376
|
|
22
|
%
|
|||||||||||
|
Production volume (in thousands of metric tonnes)
|
3,749
|
|
472
|
|
413
|
|
3,277
|
|
NM
|
59
|
|
14
|
%
|
||||||||||||
Year Ended December 31,
2018
compared to Year Ended December 31,
2017
The Mosaic Fertilizantes segment’s net sales increased to
$3.7 billion
for the year ended
December 31, 2018
, compared to
$2.2 billion
for
2017
. The increase in net sales during the current year was due to approximately $1.2 billion of net sales from the Acquired Business and approximately $300 million due to increases in average selling prices. The increase in average selling prices was due to better market conditions, higher international pricing of fertilizer and increased sales volumes in both conventional and premium products resulting from our growth strategy.
The overall average finished product selling price increased
$41
per tonne to
$410
per tonne for
2018
, due to an increase in the price of materials used to make our purchased nutrient products and higher demand of fertilizer as a result of better market conditions.
The Mosaic Fertilizantes segment’s sales volume increased to
9.1 million
tonnes for the year ended
December 31, 2018
, compared to
6.0 million
tonnes for the same period a year ago, primarily due to the sales volumes from the Acquired business.
Our total gross margin increased to
$382.9 million
for the year ended
December 31, 2018
, from
$128.6 million
in the prior year. The increase is primarily due to the Acquired Business, favorable inventory positioning and the benefit of favorable foreign exchange impacts in the current year. In addition, gross margin was also favorably impacted by approximately $49 million related to the effect of the purchase price adjustment for the fair market value of acquired inventory, primarily on rock.
The average consumed price for ammonia for our Brazilian operations was $376 per tonne for the year ended December 31, 2018. The average consumed sulfur price for our Brazilian operations was $197 per long ton for the year ended December 31, 2018. The consumed ammonia and sulfur prices also include transportation, transformation, and storage costs.
Year Ended December 31, 2017 compared to Year Ended December 31, 2016
F-12
The Mosaic Fertilizantes segment’s net sales increased to $2.2 billion for the year ended December 31, 2017, compared to $2.1 billion for 2016. In 2017, higher sales volumes favorably impacted net sales by approximately $130 million compared to 2016. This was
partially offset by a decrease in average selling price, which negatively impacted net sales by approximately
$21 million
compared to 2016
.
The overall average finished product selling price decreased $4 per tonne to $369 per tonne for 2017, driven primarily by a change in the mix of products sold and lower market prices.
The Mosaic Fertilizantes segment’s sales volume increased to 6.0 million tonnes for the year ended December 31, 2017, compared to 5.7 million tonnes for 2016, as a result of strong overall demand in Brazil. This increased demand was a result of our focused efforts to grow premium product sales, particularly MicroEssentials
®
sales, and better demand for MOP.
Our total gross margin increased to $128.6 million for the year ended December 31, 2017, compared with $125.0 million for 2016 due to increased sales volumes.
Corporate, Eliminations and Other
In addition to our three operating segments, we assign certain costs to Corporate, Eliminations and Other, which is presented separately in Note
25
to our Notes to Condensed Consolidated Financial Statements. As part of the Realignment, during the first quarter of 2018, the results of the China and India distribution business, which had previously been reported in our International Distribution segment, were moved into the Corporate, Eliminations and Other category. In addition, the Corporate, Eliminations and Other category includes, intersegment eliminations, including profit on intersegment sales, unrealized mark-to-market gains and losses on derivatives, debt expenses and Streamsong Resort
®
results of operations. Our operating results for the years ended December 31, 2017 and 2016 have been recast to reflect the Realignment.
Gross margin for Corporate, Eliminations and Other was a loss of
$63.2 million
for the year ended December 31,
2018
, compared to a loss of
$9.6 million
in the same period a year ago. The change was driven by a higher elimination of profit on intersegment sales of $43.7 million in the current year period, due to increased intersegment sales volumes and higher average selling prices, compared to $8.4 million in the prior year period. Contributing to the change was a net unrealized loss of $32.4 million in the current year period, primarily on foreign currency derivatives for Canada, compared to a net unrealized loss of $12.3 million in the prior year period. Distribution operations in India and China had revenues and gross margin of
$533.9 million
and
$42.8 million
, respectively, for the year ended December 31, 2018, compared to revenues and gross margin of
$493.2 million
and
$46.9 million
, respectively, for the year ended December 31, 2017. Sales volumes of finished products were 1.4 million tonnes for the years ended December 31, 2018 and 2017.
Gross margin for Corporate, Eliminations and Other was a loss of $9.6 million for the year ended December 31, 2017, compared to a gain of $78.6 million in 2016. The change was driven by an unrealized loss in 2017 of $12.3 million, primarily on foreign currency derivatives, compared to a gain of $70.4 million in the prior year period. We also had a higher elimination of profit on intersegment sales of $8.4 million in the current year period, compared to a favorable $24.8 million in 2016. Distribution operations in India and China had revenues and gross margin of
$493.2 million
and
$46.9 million
, respectively, for the year ended December 31, 2017, compared to revenues and gross margin of
$419.6 million
and
$21.2 million
, respectively, for the year ended December 31, 2016. Sales volumes of finished products were 1.4 million tonnes for the year ended December 31, 2017, compared to 1.1 million tonnes in 2016.
F-13
Other Income Statement Items
|
|
Years Ended December 31,
|
2018-2017
|
2017-2016
|
||||||||||||||||||||||
|
(in millions)
|
2018
|
2017
|
2016
|
Change
|
Percent
|
Change
|
Percent
|
||||||||||||||||||
|
Selling, general and administrative expenses
|
$
|
341.1
|
|
$
|
301.3
|
|
$
|
304.2
|
|
$
|
39.8
|
|
13
|
%
|
$
|
(2.9
|
)
|
(1
|
)%
|
||||||
|
Other operating expenses
|
229.0
|
|
75.8
|
|
186.8
|
|
153.2
|
|
NM
|
|
(111.0
|
)
|
(59
|
)%
|
|||||||||||
|
Interest (expense)
|
(215.8
|
)
|
(171.3
|
)
|
(140.6
|
)
|
(44.5
|
)
|
26
|
%
|
(30.7
|
)
|
22
|
%
|
|||||||||||
|
Interest income
|
49.7
|
|
33.2
|
|
28.2
|
|
16.5
|
|
50
|
%
|
5.0
|
|
18
|
%
|
|||||||||||
|
Interest expense, net
|
(166.1
|
)
|
(138.1
|
)
|
(112.4
|
)
|
(28.0
|
)
|
20
|
%
|
(25.7
|
)
|
23
|
%
|
|||||||||||
|
Foreign currency transaction (loss) gain
|
(191.9
|
)
|
49.9
|
|
40.1
|
|
(241.8
|
)
|
NM
|
|
9.8
|
|
24
|
%
|
|||||||||||
|
Other expense
|
(18.8
|
)
|
(3.5
|
)
|
(4.3
|
)
|
(15.3
|
)
|
NM
|
|
0.8
|
|
(19
|
)%
|
|||||||||||
|
Provision for (benefit from) income taxes
|
77.1
|
|
494.9
|
|
(74.2
|
)
|
(417.8
|
)
|
(84
|
)%
|
569.1
|
|
NM
|
|
|||||||||||
|
Equity in net (loss) earnings of nonconsolidated companies
|
(4.5
|
)
|
16.7
|
|
(15.4
|
)
|
(21.2
|
)
|
(127
|
)%
|
32.1
|
|
NM
|
|
|||||||||||
Selling, General and Administrative Expenses
Selling, general and administrative expenses were
$341.1 million
for the year ended
December 31, 2018
, compared to
$301.3 million
for the same period a year ago. Approximately $20 million of the increase in the current year is due to the operations of the Acquired Business, and approximately $20 million is related to higher incentive compensation expense in the current year.
Selling, general and administrative expenses were $301.3 million for the year ended December 31, 2017, compared to $304.2 million for the same period in 2016. The benefit of cost reduction initiatives in 2017 was approximately $13.0 million more than in 2016. This was partially offset by increased bad debt expense and the impact of inflation.
Other Operating Expenses
Other operating expenses were
$229.0 million
for the year ended
December 31, 2018
, compared to
$75.8 million
for the prior year period. Other operating expenses typically relate to four major categories: 1) Asset Retirement Obligations (“
AROs
”), 2) environmental and legal reserves, 3) insurance reimbursements and 4) gain/loss on sale or disposal of fixed assets. The current year includes $57 million of asset write-off expense, $40 million of fees and integration costs related to the Acquisition, $30 million of ARO expenses and adjustments, $29 million to capture synergies and $11 million in estimated earn-out obligations due to Vale.
Other operating expenses were $75.8 million for the year ended December 31, 2017, compared to $186.8 million for the same period in 2016. The year ended December 31, 2017 includes professional service costs of $26 million related to the Acquisition, $14 million related to an increase in our reserve for estimated costs associated with the sinkhole at our New Wales facility, which is discussed further in Note
22
to our Consolidated Financial Statements, $20 million of restructuring expense related to the temporary idling of our Plant City, Florida phosphate manufacturing facility, and $11 million of ARO expenses and adjustments. These were partially offset by a pre-tax gain on the sale of approximately 1,500 acres of vacant and undesignated real property near our Faustina facility in Louisiana of $52.1 million.
In 2016, other operating expenses included an expense of $70 million related to our reserve for estimated costs associated with a sinkhole that formed at our New Wales phosphate production facility in Florida, a loss of $43 million related to the cancellation of the construction of a barge intended to transport ammonia and $19 million of severance costs related to organizational restructuring, partially offset by the receipt of approximately $28 million in insurance proceeds related to a warehouse roof at our Carlsbad, New Mexico location that collapsed in 2014.
Interest Expense, Net
F-14
Net interest expense increased to
$166.1 million
for the year ended December 31, 2018, compared to
$138.1 million
in 2017 and
$112.4 million
in 2016. The year over year increases were due to higher debt levels and lower capitalized interest compared to the prior periods. The year ended December 31, 2017, also included the negative impact of approximately $12 million related to settlement of our pre-issuance interest rate swap agreements.
Foreign Currency Transaction (Loss) Gain
In
2018
, we recorded a foreign currency transaction loss of
$191.9 million
. The loss was the result of the effect of the strengthening of the U.S. dollar relative to the Brazilian real on significant U.S. dollar-denominated payables held by our Brazilian subsidiaries and the strengthening of the U.S. dollar relative to the Canadian dollar on significant U.S. dollar-denominated intercompany loans.
In 2017, we recorded a foreign currency transaction gain of $49.9 million. The gain was mainly the result of the weakening of the U.S. dollar relative to the Canadian dollar on significant U.S. dollar-denominated intercompany loans, partially offset by U.S. dollar cash held by our Canadian subsidiaries and the strengthening of the U.S. dollar relative to the Brazilian Real on significant U.S. dollar-denominated payables held by our Brazilian subsidiaries.
In 2016, we recorded a foreign currency transaction gain of $40.1 million. The gain was mainly the result of the weakening of the U.S. dollar relative to the Canadian dollar on significant U.S. dollar-denominated intercompany loans and the weakening of the U.S. dollar relative to the Brazilian Real on significant U.S. dollar-denominated payables.
Other Expense
For the years ended December 31, 2018, 2017 and 2016, we had other expense of
$18.8 million
,
$3.5 million
and
$4.3 million
, respectively. The current year includes $12 million of realized losses on investments held in two financial assurance trust funds created in 2016 to provide additional financial assurance for the estimated costs of closure and long-term care of our Florida and Louisiana phosphogypsum management systems (the “
RCRA Trusts
”). The year ended December 31, 2017 included $1 million of realized gains from investments held by the RCRA trusts. The year ended December 31, 2016, included realized losses from investments held by the RCRA Trusts of $10 million, partially offset by the gain on sale of an equity investment of approximately $7 million.
Equity in Net (Loss) Earnings of Nonconsolidated Companies
For the year ended December 31, 2018, we had a loss from equity of nonconsolidated companies of
$4.5 million
, net of tax, compared to gain of
$16.7 million
, net of tax, for the prior year. The current year loss was primarily related to the operations of MWSPC, which commenced DAP production in 2018. The gain in the prior year was related to income from MWSPC, which began ammonia production in late 2016, partially offset by losses from the joint venture that owned the Miski Mayo mine, whose operations were impacted by flooding in the region earlier in 2017.
The loss in 2016 was due to the decision by Canpotex not to proceed with construction of a new export terminal at the Port of Prince Rupert in British Columbia, as Canpotex determined it had sufficient port access and terminal capacity options to meet its needs. Mosaic's share of the loss was $24 million, or $16 million, net of tax.
Provision for (Benefit from) Income Taxes
|
Effective
Tax Rate
|
Provision for
Income Taxes
|
||||||
|
Year Ended December 31, 2018
|
14.0
|
%
|
$
|
77.1
|
|
||
|
Year Ended December 31, 2017
|
132.3
|
%
|
494.9
|
|
|||
|
Year Ended December 31, 2016
|
(30.6
|
)%
|
(74.2
|
)
|
|||
For all years, our income tax is impacted by the mix of earnings across jurisdictions in which we operate, by a benefit associated with depletion, and by the impact of certain entities being taxed in both their foreign jurisdiction and the U.S., including foreign tax credits for various taxes incurred.
On December 22, 2017, The Act was enacted, significantly altering U.S. corporate income tax law. The SEC issued Staff Accounting Bulletin 118, which allows companies to record reasonable estimates of enactment impacts where the underlying analysis and calculations are not yet complete (“Provisional Estimates”). The Provisional Estimates must be finalized within a one-year measurement period. In the period ending December 31, 2017, we recorded Provisional Estimates of the impact of The Act of $457.5 million related to several key changes in the law. As of December 31, 2018, the impacts of The Act have
F-15
been finalized. All future impacts of future issued guidance will be appropriately accounted for in the period in which the law is enacted.
The Act imposed a one-time tax on “deemed” repatriation of foreign subsidiaries’ earnings and profits. The repatriation resulted in an estimated non-cash charge of $107.7 million. The charge was offset by a $202.6 million, non-cash reduction in the deferred tax liability related to certain undistributed earnings. Both of these items were recorded in the period ending December 31, 2017. The December 31, 2017 provisional estimates have been revised and finalized in the period ending December 31, 2018 resulting in an additional benefit of $9.0 million of which a cost of $12.2 million is included in the tax expense specific to the period and a benefit of $21.2 million is included in the annual effective tax rate. However, the benefit of $21.2 million results from certain provisions of The Act that pertain to the repatriation that, based on proposed guidance from the U.S. Internal Revenue Service, we anticipate could reverse when the regulations are finalized.
As of December 31, 2017, we recognized a $2.3 million non-cash, deferred tax benefit related to the reduction of the U.S. federal rate from 35 percent to 21 percent.
The Act significantly modified the U.S. taxation of foreign earnings and the treatment of the related foreign tax credits. In December 2017, as a result of these changes, we recorded valuation allowances against our foreign tax credits and our anticipatory foreign tax credits of $105.8 million and $440.3 respectively. As of December 2018, we concluded that the foreign tax credits would more likely than not be utilized and the related valuation allowance of $105.8 million was reversed as a benefit. This benefit arose due to both revisions in the estimated impact of The Act and estimates with respect to future forecasted income. Of the $105.8 million benefit, $30.6 million was recorded as tax benefit specific to the period.
As of December 31, 2018, we have recorded a valuation allowance recorded against the branch basket foreign tax credits of $156.8 million and anticipatory foreign tax credits of $361.6 million.
The Act repeals the corporate alternative minimum tax, or AMT, system and allows for the cash refund of excess AMT credits. As of December 31, 2017, the refundable AMT amounts were subject to a set of federal budgeting rules where a certain portion of the refundable amount would permanently be disallowed (the “Sequestration Rules”). We estimated that we would receive a cash refund of $121.5 million net of an $8.6 million charge related to the Sequestration Rules. In 2018, guidance was released that concluded that the Sequestration Rules do sequestration does not apply to AMT credits related to The Act. As of December 31, 2018, we estimate that we will receive a cash refund of $100.4 million and the sequestration charge of $8.6 million recorded at December 31, 2017 has been reversed. The estimated refundable alternative minimum tax credit was included in other non-current assets at both December 31, 2018 and December 31, 2017.
The Act introduced a new category of taxable income called global intangible low-taxed income (“GILTI”). No provisional estimates were recorded as of December 31, 2017 for the impacts of GILTI since we had not completed our full analysis of that provision of The Act. We have included GILTI in our December 31, 2018 provision for income taxes, which did not have a material impact to the Company for the current year. We have elected an accounting policy to record any GILTI liabilities as period costs.
In the year ended December 31, 2018, other items specific to the period included a cost of $0.7 million related to the following: a benefit of ($30.6) million related to revised valuation allowances on foreign tax credits, a $12.2 million cost as a result of revisions to the provisional estimates related to The Act, a $15.0 million cost for withholding taxes related to undistributed earnings, a cost of $11.7 million for valuation allowances in foreign jurisdictions, a benefit of ($8.6) million related to release of the sequestration on future AMT refunds, and other miscellaneous benefits of $1.0 million.
In the year ended December 31, 2017, tax expense specific to the period included a cost of $15.1 million related to the $10.4 million pre-tax charges resulting from the resolution of a royalty matter with the government of Saskatchewan and related royalty impacts, a $7.5 million cost related to share-based compensation, and a $6.7 million expense related to the Peru rate change, offset by a $14.9 million U.S. state deferred benefit and other miscellaneous benefits of $6.1 million.
In the year ended December 31, 2016, tax expense specific to the period included a benefit of $54.2 million, which includes a domestic benefit of $85.8 million related to the resolution of an Advanced Pricing Agreement, which is a tax treaty-based process, partially offset by a $23.3 million expense related to distributions from certain non-U.S. subsidiaries and $8.3 million of expense primarily related to share-based excess cost. For further information, please see Note
13
to our Notes to Consolidated Financial Statements.
F-16
Critical Accounting Estimates
We prepare our Consolidated Financial Statements in conformity with accounting principles generally accepted in the United States of America which requires us to make various judgments, estimates and assumptions that could have a significant impact on our reported results and disclosures. We base these estimates on historical experience and other assumptions believed to be reasonable at the time we prepare our financial statements. Changes in these estimates could have a material effect on our Consolidated Financial Statements.
Our significant accounting policies can be found in Note
2
of our Notes to Consolidated Financial Statements. We believe the following accounting policies include a higher degree of judgment and complexity in their application and are most critical to aid in fully understanding and evaluating our reported financial condition and results of operations.
Accounting for Business Combinations
We account for business combinations under the acquisition method of accounting. This method requires the recording of acquired assets and assumed liabilities at their acquisition date fair values. The excess of the purchase price over the fair value of assets acquired and liabilities assumed is recorded as goodwill. Determining the fair value of assets acquired and liabilities assumed requires management’s judgment and often involves the use of significant estimates and assumptions, including management assumptions and third party information. Although independent appraisals may be used to assist in the determination of the fair values of certain assets and liabilities, those determinations are usually based on significant estimates provided by management, such as forecasted revenue or profit. The fair value of mineral reserves, certain other long lived assets and AROs are based on assumptions with respect to future cash inflows and outflows, and discount rates. The fair values of property, plant and equipment are based on the consideration that unless otherwise identified, they will continue to be used "as is" and as part of the ongoing business. In contemplation of the in-use premise and the nature of the assets, the fair value is developed primarily using a cost approach. See Note
24
of our Notes to Consolidated Financial Statements for additional information regarding the acquisition of Mosaic Fertilizantes P&K S.A.
Recoverability of Goodwill
Goodwill is the excess of the purchase price consideration over the estimated fair value of net assets of acquired businesses. The carrying value of goodwill in our reporting units is tested annually as of October 31st for possible impairment. We typically use an income approach valuation model, representing present value of future cash flows, to determine the fair value of a reporting unit. Growth rates for sales and profits are determined using inputs from our annual strategic and long range planning process. The rates used to discount projected future cash flows reflect a weighted average cost of capital based on the Company’s industry, capital structure and risk premiums, including those reflected in the current market capitalization. When preparing these estimates, management considers each reporting unit’s historical results, current operating trends, and specific plans in place. These estimates are impacted by various factors including inflation, the general health of the economy and market competition. In addition, events and circumstances that might be indicators of possible impairment are assessed during other interim periods. As of October 31,
2018
, the date of the annual impairment testing, the Company concluded that the fair values of all reporting units were in excess of their respective carrying values and the goodwill for those units was not impaired. However, we determined that our Potash reporting unit had an estimated fair value that was not in significant excess of its carrying value. As a result, the goodwill assigned to the Potash reporting unit could be at risk of future impairment. Our other reporting units have substantial fair value in excess of their carrying values. See Note
10
of our Notes to Consolidated Financial Statements for additional information regarding the goodwill impairment analysis, including the methodologies and assumptions used in estimating the fair values of our reporting units. As of
December 31, 2018
, we had
$1.7 billion
of goodwill.
Useful Lives of Depreciable Assets, Methods of Depreciation, and Rates of Depletion
We estimate initial useful lives of property, plant and equipment, and/or methods of depreciation, based on operational experience, current technology, improvements made to the assets, and anticipated business plans. Factors affecting the fair value of our assets may also affect the estimated useful lives of our assets and these factors can change. Therefore, we periodically review the estimated remaining useful lives of our facilities and other significant assets and adjust our depreciation rates prospectively where appropriate.
Depletion expenses for mining operations, including mineral reserves, are generally determined using the units-of-production method based on estimates of recoverable reserves. These estimates may change based on new information regarding the extent or quality of mineral reserves, permitting or changes in mining strategies.
F-17
Environmental Liabilities and Asset Retirement Obligations
We record accrued liabilities for various environmental and reclamation matters including the demolition of former operating facilities, and AROs.
Contingent environmental liabilities are described in Note
22
of our Notes to Consolidated Financial Statements. Accruals for environmental matters are based primarily on third-party estimates for the cost of remediation at previously operated sites and estimates of legal costs for ongoing environmental litigation. We regularly assess the likelihood of material adverse judgments or outcomes, the effects of potential indemnification, as well as potential ranges or probability of losses. We determine the amount of accruals required, if any, for contingencies after carefully analyzing each individual matter. Estimating the ultimate settlement of environmental matters requires us to develop complex and interrelated assumptions based on experience with similar matters, our history, precedents, evidence, and facts specific to each matter. Actual costs incurred in future periods may vary from the estimates, given the inherent uncertainties in evaluating environmental exposures. As of
December 31, 2018
, and
2017
, we had accrued
$58.6 million
and
$35.1 million
, respectively, for environmental matters.
As indicated in Note
14
of our Notes to Consolidated Financial Statements, we recognize AROs in the period in which we have an existing legal obligation, and the amount of the liability can be reasonably estimated. We utilize internal engineering experts as well as third-party consultants to assist in determining the costs of retiring certain of our long-term operating assets. Assumptions and estimates reflect our historical experience and our best judgments regarding future expenditures. The assumed costs are inflated based on an estimated inflation factor and discounted based on a credit-adjusted risk-free rate. For active facilities, fluctuations in the estimated costs (including those resulting from a change in environmental regulations), inflation rates and discount rates can have a significant impact on the corresponding assets and liabilities recorded in the Consolidated Balance Sheets. However, changes in the assumptions for our active facilities would not have a significant impact on the Consolidated Statements of Earnings in the year they are identified. For closed facilities, fluctuations in the estimated costs, inflation, and discount rates have an impact on the Consolidated Statements of Earnings in the year they are identified as there is no asset related to these items. Phosphate land reclamation activities in North America generally occur concurrently with mining operations; as such, we accrue and expense reclamation costs as we mine. As of
December 31, 2018
, and
2017
,
$1.2 billion
and
$859.3 million
, respectively, was accrued for AROs (current and noncurrent amounts) in North and South America. In August 2016, Mosaic deposited $630 million into two trust funds as financial assurance to support certain estimated future asset retirement obligations. See Note
14
of our Notes to Consolidated Financial Statements for additional information regarding the EPA RCRA Initiative.
Income Taxes
We make estimates for income taxes in three major areas: uncertain tax positions, valuation allowances, and U.S. deferred income taxes on our non-U.S. subsidiaries’ undistributed earnings.
On December 22, 2017, The Act was enacted, significantly altering U.S. corporate income tax law. The SEC issued Staff Accounting Bulletin 118, which allows companies to record reasonable estimates of enactment impacts where the all of the underlying analysis and calculations are not yet complete. The Provisional Estimates must be finalized within a one year measurement period. In the period ending December 31, 2017, we recorded Provisional Estimates of the impact of The Act of $457.5 million related to several key changes in the law. As of December 31, 2018, the impacts of The Act have been finalized. All future impacts of future issued guidance will be appropriately accounted for in the period in which the law is enacted.
The Act imposed a one-time tax on “deemed” repatriation of foreign subsidiaries’ earnings and profits. The repatriation resulted in an estimated non-cash charge of $107.7 million. The charge was offset by a $202.6 million, non-cash reduction in the deferred tax liability related to certain undistributed earnings. Both of these items were recorded in the period ending December 31, 2017. The December 31, 2017 provisional estimates have been revised and finalized in the period ending December 31, 2018 resulting in an additional benefit of $9.0 million of which a cost of $12.2 million is included in the tax expense specific to the period and a benefit of $21.2 million is included in the annual effective tax rate. However, the benefit of $21.2 million results from certain provisions of The Act that pertain to the repatriation that, based on proposed guidance from the U.S. Internal Revenue Service, we anticipate could reverse when the regulations are finalized.
As of December 31, 2017, we recognized a $2.3 million non-cash, deferred tax benefit related to the reduction of the U.S. federal rate from 35 percent to 21 percent.
F-18
The Act significantly modified the U.S. taxation of foreign earnings and the treatment of the related foreign tax credits. In December 2017, as a result of these changes, we recorded valuation allowances against our foreign tax credits and our anticipatory foreign tax credits of $105.8 million and $440.3 respectively. As of December 2018, we concluded that the foreign tax credits would more likely than not be utilized and the related valuation allowance of $105.8 million was reversed as a benefit. This benefit arose due to both revisions in the estimated impact of The Act and estimates with respect to future forecasted income. Of the $105.8 million benefit, $30.6 million was recorded as tax benefit specific to the period.
As of December 31, 2018, we have recorded a valuation allowance recorded against the U.S. branch basket foreign tax credits of $156.8 million and anticipatory foreign tax credits of $361.6 million.
The Act repeals the corporate alternative minimum tax, or AMT, system and allows for the cash refund of excess AMT credits. As of December 31, 2017, the refundable AMT amounts were subject to a set of federal budgeting rules where a certain portion of the refundable amount would permanently be disallowed (the “Sequestration Rules”). We estimated that we would receive a cash refund of $121.5 million net of an $8.6 million charge related to the Sequestration Rules. In 2018, guidance was released that concluded that the Sequestration Rules do not apply to AMT credits related to The Act. As of December 31, 2018, we estimate that we will receive a cash refund of $100.4 million and the sequestration charge of $8.6 million recorded at December 31, 2017 has been reversed. The estimated refundable alternative minimum tax credit was included in other non-current assets at both December 31, 2018 and December 31, 2017.
The Act introduced a new category of taxable income called global intangible low-taxed income (“GILTI”). No provisional estimates were recorded as of December 31, 2017 for the impacts of GILTI since we had not completed our full analysis of that provision of The Act. We have included GILTI in our December 31, 2018 provision for income taxes, which did not have a material impact to the Company for the current year. We have elected an accounting policy to record any GILTI liabilities as period costs.
Beginning in calendar year 2018, under The Act, any dividends from controlled foreign corporations will be tax-free from a U.S. income tax perspective. Additionally, there will not be any foreign tax credits associated with foreign dividends. Therefore, there are no federal U.S. implications of future repatriations on non-U.S. subsidiaries’ undistributed earnings. However, since there are no U.S. foreign tax credits associated with foreign dividends, any foreign withholding tax associated with a future repatriation will need to be accrued if the earnings are not permanently reinvested.
Due to Mosaic’s global operations, we assess uncertainties and judgments in the application of complex tax regulations in a multitude of jurisdictions. Future changes in judgment related to the expected ultimate resolution of uncertain tax positions will affect earnings in the quarter of such change. While it is often difficult to predict the final outcome or the timing of resolution of any particular uncertain tax position, our liabilities for income taxes reflect what we believe to be the more likely than not outcome. We adjust these liabilities, as well as the related interest, in light of changing facts and circumstances, including negotiations with taxing authorities in various jurisdictions, outcomes of tax litigation, and resolution of disputes arising from tax audits in the normal course of business. Settlement of any particular position may require the use of cash. Based upon an analysis of tax positions taken on prior year returns and expected positions to be taken on the current year return, management has identified gross uncertain income tax positions of
$38.1 million
as of
December 31, 2018
.
A valuation allowance is provided for deferred tax assets for which it is more likely than not that the related tax benefits will not be realized. Significant judgment is required in evaluating the need for and magnitude of appropriate valuation allowances. The realization of the Company’s deferred tax assets is dependent on generating certain types of future taxable income, using both historical and projected future operating results, the source of future income, the reversal of existing taxable temporary differences, taxable income in prior carry-back years (if permitted) and the availability of tax planning strategies. As of
December 31, 2018
, and
2017
, we had a valuation allowance of
$1.5 billion
and
$584.1 million
, respectively. Changes in tax laws, assumptions with respect to future taxable income, tax planning strategies, resolution of matters under tax audit and foreign currency exchange rates could result in adjustment to these allowances.
We have not recorded U.S. deferred income taxes on certain of our non-U.S. subsidiaries’ undistributed earnings as such amounts are intended to be reinvested outside the United States indefinitely. Generally, such amounts become subject to U.S. taxation upon the remittance of dividends and under certain other circumstances. It is not practicable to estimate the amount of additional U.S. tax liabilities we would incur.
We have included a further discussion of income taxes in Note
13
of our Notes to Consolidated Financial Statements.
F-19
Liquidity and Capital Resources
We define liquidity as the ability to generate or access adequate amounts of cash to meet current cash needs. We assess our liquidity in terms of our ability to fund working capital requirements, fund sustaining and opportunity capital projects, pursue strategic opportunities and make capital management decisions, which include making payments on and issuing indebtedness and making distributions to our shareholders, either in the form of share repurchases or dividends. Our liquidity, to a certain extent, is subject to general economic, financial, competitive and other factors that are beyond our control.
As of
December 31, 2018
, we had cash and cash equivalents of
$0.8 billion
, plus marketable securities held in trusts to fund future obligations of
$0.6 billion
, long-term debt, including current maturities of
$4.5 billion
and short-term debt of
$11.5 million
, and stockholders’ equity of
$10.6 billion
. We have a target liquidity buffer of $2.5 billion, including cash and available committed credit facilities. We also target debt leverage ratios that are consistent with investment grade credit ratings. Our capital allocation priorities include maintaining our investment grade ratings and financial strength, sustaining our assets, including ensuring the safety and reliability of our assets, investing to support our strategic initiatives and returning excess cash to shareholders, including paying our dividend. During 2018, we completed the Acquisition. The cash paid at closing was $1.08 billion (adjusted based on matters such as the estimated working capital of Vale Fertilizantes at the time of closing). We funded this amount with the proceeds of a $1.25 billion public debt offering that was completed in November 2017. The remainder of the debt offering was used to pay transaction costs and expenses and to fund the majority of the $200 million that we prepaid against our outstanding term loan in January 2018. We prepaid the remaining $684 million of the term loan in 2018 and paid off $89 million in maturing bonds, bringing total repayments of long-term debt, including other long-term notes, to over $800 million in 2018. During
2018
, we invested
$954.5 million
in capital expenditures and returned cash to shareholders through cash dividends of
$38.5 million
. In January 2019, we increased our annual dividend target to $0.20 per share.
All of our cash and cash equivalents are diversified in highly rated investment vehicles. Our cash and cash equivalents are held either in the U.S. or held by non-U.S. subsidiaries and are not subject to significant foreign currency exposures, as the majority are held in investments denominated in U.S. dollars as of December 31, 2018. These funds may create foreign currency transaction gains or losses, however, depending on the functional currency of the entity holding the cash.
In addition, there are no significant restrictions that would preclude us from bringing these funds back to the U.S.; however, The Act significantly altered U.S. corporate income tax law. The Act imposed a one-time tax on the “deemed” repatriation of foreign subsidiaries’ earnings and profits. The repatriation resulted in an estimated non-cash charge of $107.7 million. The charge was offset by a $202.6 million, non-cash reduction in the deferred tax liability related to certain undistributed earnings, as discussed in Note
13
of our Notes to Consolidated Financial Statements.
Cash Requirements
We have certain contractual obligations that require us to make cash payments on a scheduled basis. These include, among other things, long-term debt payments, interest payments, operating leases, unconditional purchase obligations, and funding requirements of pension and postretirement obligations. Our long-term debt has maturities ranging from one year to 25 years. Unconditional purchase obligations are our largest contractual cash obligations. These include obligations for capital expenditures related to our expansion projects, contracts to purchase raw materials such as sulfur, ammonia, phosphate rock and natural gas, obligations to purchase raw materials for our international distribution activities and equity contributions for or loans to nonconsolidated investments, including MWSPC. Other large cash obligations are our AROs and other environmental obligations primarily related to our Phosphates and Mosaic Fertilizantes segments. We expect to fund our AROs, purchase obligations, long-term debt and capital expenditures with a combination of operating cash flows, cash and cash equivalents, and borrowings. See Off-Balance Sheet Arrangements and Obligations below for the amounts owed by Mosaic under Contractual Cash Obligations and for more information on other environmental obligations, and the discussion of MWSPC in Note
9
of our Notes to Consolidated Financial Statements for more information on this matter.
Sources and Uses of Cash
The following table represents a comparison of the net cash provided by operating activities, net cash used in investing activities, and net cash provided by (used in) financing activities for calendar years
2018
,
2017
, and
2016
:
F-20
|
Years Ended December 31,
|
||||||||||||||||||||||||||
|
(in millions)
|
2018-2017
|
2017-2016
|
||||||||||||||||||||||||
|
Cash Flow
|
2018
|
2017
|
2016
|
Change
|
Percent
|
Change
|
Percent
|
|||||||||||||||||||
|
Net cash provided by operating activities
|
$
|
1,409.8
|
|
$
|
935.5
|
|
$
|
1,260.2
|
|
$
|
474.3
|
|
51
|
%
|
$
|
(324.7
|
)
|
(26
|
)%
|
|||||||
|
Net cash used in investing activities
|
(1,944.7
|
)
|
(667.8
|
)
|
(1,866.0
|
)
|
(1,276.9
|
)
|
(191
|
)%
|
1,198.2
|
|
64
|
%
|
||||||||||||
|
Net cash (used in) provided by financing activities
|
(724.8
|
)
|
1,200.8
|
|
(888.6
|
)
|
(1,925.6
|
)
|
160
|
%
|
2,089.4
|
|
(235
|
)%
|
||||||||||||
As of
December 31, 2018
, we had cash and cash equivalents of
$0.8 billion
. Funds generated by operating activities, available cash and cash equivalents, and our revolving credit facility continue to be our most significant sources of liquidity. We believe funds generated from the expected results of operations and available cash, cash equivalents and borrowings either under our revolving credit facility or through long-term borrowings will be sufficient to finance our operations, including our expansion plans, existing strategic initiatives, and expected dividend payments for the next 12 months.
There can be no assurance, however, that we will continue to generate cash flows at or above current levels. At
December 31, 2018
, we had
$1.99 billion
available under our $2.0 billion revolving credit facility.
Operating Activities
Net cash flow from operating activities has provided us with a significant source of liquidity. For the year ended
December 31, 2018
, net cash provided by operating activities was
$1.4 billion
, compared to
$0.9 billion
in the same period of the prior year. Our results of operations, after non-cash adjustments to net earnings, contributed
$1.4 billion
to cash flows from operating activities during
2018
compared to $
1.3 billion
during
2017
. During
2018
, we had an unfavorable working capital change of
$21.7 million
compared to an unfavorable change of
$316.9 million
during
2017
.
The change in working capital for the year ended
December 31, 2018
was primarily driven by an unfavorable impact from the changes in inventories of
$497.4 million
mostly offset by the favorable impact of the change in accounts payable and accrued liabilities of
$342.0 million
and a favorable impact from the change in other current assets and noncurrent assets of
$86.7 million
.
The increase in inventories was primarily related to increased raw material costs and building inventory volumes in all our segments at year-end. The favorable change in accounts payable was primarily driven by the timing of payments and an increase in raw material costs. Accrued liabilities increased due to liabilities associated with customer prepayments in Brazil and prepayments from an affiliate. The favorable impact in other current and noncurrent assets is primarily due to receiving a tax refund and payment of subsidy amounts in India in the current year.
The change in working capital for the year ended December 31, 2017, was primarily driven by unfavorable impacts from the changes in inventories of $155.7 million, an unfavorable impact from the change in net receivables of $91.2 million, and an unfavorable impact from the change in accounts payable and accrued liabilities of $65.7 million. The change in inventories was primarily related to the increased cost of ammonia in the fourth quarter of 2017, compared to the same period in 2016, and to more inventory in transit at December 31, 2017, compared to December 31, 2016. The unfavorable impact in accounts payable and accrued liabilities was primarily due to a decrease in our accrual for costs associated with the New Wales sinkhole, as many of these costs were paid in 2017, and the timing of payments in 2017 compared to 2016. The change in net receivables is due to primarily to higher sales volumes in December 2017, compared to December 2016.
The change in assets and liabilities for the year ended December 31, 2016, was primarily driven by favorable impacts from the changes in inventories of $263.0 million and other current and noncurrent assets of $239.8 million, partially offset by an unfavorable impact from the change in accounts payable and accrued liabilities of $243.9 million. The change in inventories was primarily related to the lower cost of raw material and inventory purchases. The change in other current and noncurrent assets was driven by a decrease in the balance of final price deferred product and a decrease in income tax receivable. The balance of our final price deferred product decreased during 2016 as rising prices late in the year caused customers to price product at the end of 2016. Income taxes receivable decreased due to the receipt of a refund for income taxes in 2016. The unfavorable impact in accounts payable was primarily due to the timing of payments for our operations in Brazil.
F-21
Investing Activities
Net cash used in investing activities for the year ended
December 31, 2018
was
$1.9 billion
, compared to
$0.7 billion
in the same period a year ago. In the current year, we completed the Acquisition for approximately $1.0 billion. See further discussion of the Acquisition in Note
24
of our Notes to Consolidated Financial Statements. We also had capital expenditures of
$954.5 million
in 2018.
Net cash used in investing activities was
$0.7 billion
for the year ended December 31, 2017, which included an investment of $62.5 million in MWSPC and $300.7 million of proceeds on net sales of assets. Included in net proceeds on sales of assets was $52.1 million related to the sale of land near our Faustina, Louisiana facility and $230.0 million for the sale of an articulated tug and barge unit to an affiliate of Savage Companies. See Note
23
of our Notes to Consolidated Financial Statements in this report for further discussion. We also had capital expenditures of $820.2 million in 2017.
Net cash used in investing activities for the year ended December 31, 2016 was $1.9 billion. Included in net cash used in investing activities in 2016 was an investment of $220.0 million in MWSPC. In addition, we invested $169.0 million in a consolidated affiliate for the construction of vessels intended to transport anhydrous ammonia, primarily for Mosaic’s operations. In 2016, we had capital expenditures of $843.1 million. Also, in 2016, approximately $200 million, previously held in the Plant City Trust, was released to us after we arranged for substitute financial assurance through delivery of a surety bond by insurance companies for financial assurance purposes, as discussed in Note
14
of our Notes to Consolidated Financial Statements.
Financing Activities
Net cash used in financing activities was
$0.7 billion
for the year ended
December 31, 2018
. In 2018, we made payments on our long-term debt of
$802.9 million
. We also received net proceeds from short-term borrowings of
$10.7 million
and net proceeds from structured accounts payable of
$72.0 million
. During 2018, we paid dividends of
$38.5 million
.
Net cash provided by financing activities was
$1.2 billion
for the year ended December 31, 2017. On November 13, 2017, we completed a $1.25 billion public debt offering consisting of $550 million aggregate principal amount of 3.250% senior notes due 2022 and $700 million aggregate principal amount of 4.050% senior notes due 2027. Financing activities for 2017 also reflected net proceeds from structured accounts payable of $248.3 million and dividends paid of $210.6 million.
Net cash used in financing activities was
$0.9 billion
for the year ended December 31, 2016. Cash used in financing activities for 2016 reflected net payments for structured accounts payable of $358.6 million and dividends paid of $385.1 million. During 2016, we also purchased shares of our common stock for approximately $75.0 million under our 2015 Repurchase Program.
Debt Instruments, Guarantees and Related Covenants
See Note
11
of our Notes to Consolidated Financial Statements for additional information relating to our financing arrangements, which is hereby incorporated by reference.
Financial Assurance Requirements
In addition to various operational and environmental regulations primarily related to our Phosphates segment, we incur liabilities for reclamation activities under which we are subject to financial assurance requirements. In various jurisdictions in which we operate, particularly Florida and Louisiana, we are required to pass a financial strength test or provide credit support, typically in the form of cash deposits, surety bonds or letters of credit. See Other Commercial Commitments under Off-Balance Sheet Arrangements and Obligations and Note
22
of our Notes to Consolidated Financial Statements for additional information about these requirements.
Off-Balance Sheet Arrangements and Obligations
Off-Balance Sheet Arrangements
In accordance with the definition under rules of the Securities and Exchange Commission (“
SEC
”), the following qualify as off-balance sheet arrangements:
F-22
|
•
|
certain obligations under guarantee contracts that have “any of the characteristics identified in Financial Accounting Standards Board (“
FASB
”) Accounting Standards Codification (“
ASC
”) paragraph ASC 460-10-15-4 (Guarantees Topic)”;
|
|
•
|
a retained or contingent interest in assets transferred to an unconsolidated entity or similar arrangement that serves as credit, liquidity or market risk support to that entity for such assets;
|
|
•
|
any obligation, including a contingent obligation, under a contract that would be accounted for as derivative instruments except that it is both indexed to the registrant’s own stock and classified as equity; and
|
|
•
|
any obligation, arising out of a variable interest in an unconsolidated entity that is held by, and material to, the registrant, where such entity provides financing, liquidity, market risk or credit risk support to the registrant, or engages in leasing, hedging or research and development services with the registrant.
|
Information regarding guarantees that meet the above requirements is included in Note
17
of our Notes to Consolidated Financial Statements and is hereby incorporated by reference. We do not have any contingent interest in assets transferred, derivative instruments, or variable interest entities that qualify as off-balance sheet arrangements under SEC rules.
Contractual Cash Obligations
The following is a summary of our contractual cash obligations as of
December 31, 2018
:
|
|
|
Payments by Calendar Year
|
||||||||||||||||||
|
(in millions)
|
Total
|
Less than 1
year
|
1 - 3
years
|
3 - 5
years
|
More than 5
years
|
|||||||||||||||
|
Long-term debt
(a)
|
$
|
4,517.5
|
|
$
|
26.0
|
|
$
|
525.0
|
|
$
|
1,543.2
|
|
$
|
2,423.3
|
|
|||||
|
Estimated interest payments on long-term debt
(b)
|
2,342.3
|
|
209.5
|
|
411.0
|
|
345.1
|
|
1,376.7
|
|
||||||||||
|
Operating leases
|
324.6
|
|
97.5
|
|
131.5
|
|
64.7
|
|
30.9
|
|
||||||||||
|
Purchase commitments
(c)
|
5,745.6
|
|
2,586.5
|
|
1,084.6
|
|
636.6
|
|
1,437.9
|
|
||||||||||
|
Pension and postretirement liabilities
(d)
|
440.1
|
|
9.5
|
|
93.6
|
|
96.5
|
|
240.5
|
|
||||||||||
|
Total contractual cash obligations
|
$
|
13,370.1
|
|
$
|
2,929.0
|
|
$
|
2,245.7
|
|
$
|
2,686.1
|
|
$
|
5,509.3
|
|
|||||
______________________________
|
(a)
|
Long-term debt primarily consists of unsecured notes, capital leases, unsecured debentures and secured notes.
|
|
(b)
|
Based on interest rates and debt balances as of
December 31, 2018
.
|
|
(c)
|
Based on prevailing market prices as of
December 31, 2018
. The majority of value of items more than 5 years is related to our CF Ammonia Supply Agreement. For additional information related to our purchase commitments, see Note
21
of our Notes to Consolidated Financial Statements.
|
|
(d)
|
The
2019
pension plan payments are based on minimum funding requirements. For years thereafter, pension plan payments are based on expected benefits paid. The postretirement plan payments are based on projected benefit payments. The above amounts include our North America and Brazil plans.
|
In addition to the above, we are contractually obligated to fund our investment in MWSPC by approximately
$70 million
, if needed.
Other Commercial Commitments
The following is a summary of our other commercial commitments as of
December 31, 2018
:
|
|
|
Commitment Expiration by Calendar Year
|
||||||||||||||||||
|
(in millions)
|
Total
|
Less than 1
year
|
1 - 3
years
|
3 - 5
years
|
More than 5
years
|
|||||||||||||||
|
Letters of credit
|
$
|
68.7
|
|
$
|
68.7
|
|
$
|
—
|
|
$
|
—
|
|
$
|
—
|
|
|||||
|
Surety bonds
|
497.7
|
|
497.7
|
|
—
|
|
—
|
|
—
|
|
||||||||||
|
Total
|
$
|
566.4
|
|
$
|
566.4
|
|
$
|
—
|
|
$
|
—
|
|
$
|
—
|
|
|||||
F-23
The surety bonds and letters of credit generally expire within one year or less but a substantial portion of these instruments provide financial assurance for continuing obligations and, therefore, in most cases, must be renewed on an annual basis. We issue letters of credit through our revolving credit facility and bi-lateral agreements. As of
December 31, 2018
, we had
$14.3 million
of outstanding letters of credit through our credit facility and
$54.4 million
outstanding through bi-lateral agreements. We primarily incur liabilities for reclamation activities in our Florida operations and for phosphogypsum management system (“
Gypstack
”) closure in our Florida and Louisiana operations where, for permitting purposes, we must either pass a test of financial strength or provide credit support, typically in the form of cash deposits, surety bonds or letters of credit. As of
December 31, 2018
, we had
$203.3 million
in surety bonds and a
$50 million
letter of credit included in the amount above, outstanding for reclamation obligations, primarily related to mining in Florida, and a
$233.7 million
surety bond delivered to EPA as a substitute for the financial assurance provided through the Plant City Trust. The surety bonds generally require us to obtain a discharge of the bonds or to post additional collateral (typically in the form of cash or letters of credit) at the request of the issuer of the bonds.
We are subject to financial assurance requirements related to the closure and post-closure care of our Gypstacks in Florida and Louisiana. These requirements include Florida and Louisiana state financial assurance regulations, and financial assurance requirements under the terms of consent decrees that we have entered into with respect to our facilities in Florida and Louisiana. These include a consent decree (the “
Plant City Consent Decree
”) with the Environmental Protection Agency (“
EPA
”) and the Florida Department of Environmental Protection (“
FDEP
”) relating to the Plant City, Florida facility we acquired as part of the CF Phosphate Assets Acquisition (the “
Plant City Facility
”) and two separate consent decrees (collectively, the “
2015 Consent Decrees
”) with federal and state regulators that include financial assurance requirements for the closure and post-closure care of substantially all of our Gypstacks in Florida and Louisiana, other than those acquired as part of the CF Phosphate Assets Acquisition, which are discussed separately below.
See Note
14
of our Notes to Consolidated Financial Statements for additional information relating to our financial assurance obligations, including the Plant City Consent Decree and the 2015 Consent Decrees, which information is incorporated by reference.
Currently, state financial assurance requirements in Florida and Louisiana for the closure and post-closure care of Gypstacks are, in general terms, based upon the same assumptions and associated estimated values as the AROs recognized for financial reporting purposes. For financial reporting purposes, we recognize the AROs based on the estimated future closure and post-closure costs of Gypstacks, the undiscounted value of which is approximately $1.9 billion. The value of the AROs for closure and post-closure care of Mosaic’s Gypstacks, discounted to the present value based on a credit-adjusted risk-free rate, is reflected on our Consolidated Balance Sheets in the amount of approximately $578.4 million as of
December 31, 2018
. Compliance with the financial assurance requirements in Florida and Louisiana is generally based on the undiscounted Gypstack closure estimates.
We satisfy substantially all of our Florida, Louisiana and federal financial assurance requirements through compliance with the financial assurance requirements under the 2015 Consent Decrees, by providing third-party credit support in the form of surety bonds (including under the Plant City Consent Decree), and a financial test mechanism supported by a corporate guarantee (
“Bonnie Financial Test
”) related to a closed Florida phosphate concentrates facility in Bartow, Florida (the “
Bonnie Facility
”) as discussed below. We comply with our remaining state financial assurance requirements because our financial strength permits us to meet applicable financial strength tests. However, at various times we have not met the applicable financial strength tests and there can be no assurance that we will be able to meet the applicable financial strength tests in the future. In the event we do not meet either financial strength test, we could be required to seek an alternate financial strength test acceptable to state regulatory authorities or provide credit support, which may include surety bonds, letters of credit and cash escrows or trust funds. Cash escrows or trust funds would be classified as restricted cash on our Consolidated Balance Sheets. Assuming we maintain our current levels of liquidity and capital resources, we do not expect that these Florida and Louisiana requirements will have a material effect on our results of operations, liquidity or capital resources.
As part of the CF Phosphate Assets Acquisition, we assumed certain ARO related to Gypstack Closure Costs at both the Plant City Facility and the Bonnie Facility. Associated with these assets are two related financial assurance arrangements for which we became responsible and that provided sources of funds for the estimated Gypstack Closure Costs for these facilities, pursuant to federal or state law, which the government can draw against in the event we cannot perform such closure activities. One was initially a trust (the
“Plant City Trust”
) established to meet the requirements under a consent decree with EPA and the FDEP with respect to RCRA compliance at Plant City that also satisfied Florida financial assurance
F-24
requirements at that site. Beginning in September 2016, as a substitute for the financial assurance provided through the Plant City Trust, we have provided financial assurance for Plant City in the form of a surety bond delivered to EPA (the
“Plant City Bond”
). The amount of the Plant City Bond is
$233.7 million
, at December 31, 2018, which reflects our closure cost estimates at that date. The other was also a trust fund (the
“Bonnie Facility Trust”
) established to meet the requirements under Florida financial assurance regulations that apply to the Bonnie Facility. On July 27, 2018, we received
$21.0 million
from the Bonnie Facility Trust by substituting the trust fund for the Bonnie Financial Test supported by a corporate guarantee as allowed by state regulations. Both financial assurance funding obligations require estimates of future expenditures that could be impacted by refinements in scope, technological developments, new information, cost inflation, changes in regulations, discount rates and the timing of activities. Under our current approach to satisfying applicable requirements, additional financial assurance would be required in the future if increases in cost estimates exceed the face amount of the Plant City Bond or the amount supported by the Bonnie Financial Test.
Other Long-Term Obligations
The following is a summary of our other long-term obligations, including Gypstacks and land reclamation, as of
December 31, 2018
:
|
|
|
Payments by Calendar Year
|
||||||||||||||||||
|
(in millions)
|
Total
|
Less than 1
year
|
1 - 3
years
|
3 - 5
years
|
More than 5
years
|
|||||||||||||||
|
ARO
(a)
|
$
|
2,826.1
|
|
$
|
145.0
|
|
$
|
258.5
|
|
$
|
158.9
|
|
$
|
2,263.7
|
|
|||||
______________________________
|
(a)
|
Represents the undiscounted estimated cash outflows required to settle the AROs. The corresponding present value of these future expenditures is
$1.2 billion
as of
December 31, 2018
, and is reflected in our accrued liabilities and other noncurrent liabilities in our Consolidated Balance Sheets.
|
In addition to the above, in 2014, we entered into five-year fertilizer supply agreements providing for Mosaic to supply ADM’s fertilizer needs in Brazil and Paraguay.
Most of our export sales of potash crop nutrients are marketed through a North American export association, Canpotex, which funds its operations in part through third-party financing facilities. As a member, Mosaic or our subsidiaries are, subject to certain conditions and exceptions, contractually obligated to reimburse Canpotex for their pro rata share of any operating expenses or other liabilities incurred. The reimbursements are made through reductions to members’ cash receipts from Canpotex.
Commitments are set forth in Note
21
of our Notes to Consolidated Financial Statements and are hereby incorporated by reference.
Income Tax Obligations
Gross uncertain tax positions as of
December 31, 2018
of
$38.1 million
are not included in the other long-term obligations table presented above because the timing of the settlement of unrecognized tax benefits cannot be reasonably determined. For further discussion, refer to Note
13
of our Notes to Consolidated Financial Statements.
Market Risk
We are exposed to the impact of fluctuations in the relative value of currencies, fluctuations in interest rates, fluctuations in the purchase prices of natural gas, nitrogen, ammonia and sulfur consumed in operations, and changes in freight costs, as well as changes in the market value of our financial instruments. We periodically enter into derivatives in order to mitigate our interest rate risks, foreign currency risks and the effects of changing commodity prices and freight prices, but not for speculative purposes. Unrealized mark-to-market gains and losses on derivatives are recorded in Corporate, Eliminations and Other. Once realized, they are recorded in the related business segment.
Foreign Currency Exchange Rates
Due to the global nature of our operations, we are exposed to currency exchange rate changes, which may cause fluctuations in earnings and cash flows. Our primary foreign currency exposures are the Canadian dollar and Brazilian real. To reduce
F-25
economic risk and volatility on expected cash flows that are denominated in the Canadian dollar and Brazilian real, we use financial instruments that may include forward contracts, zero-cost collars and/or futures.
The functional currency of several of our Canadian entities is the Canadian dollar. For those entities, sales are primarily denominated in U.S. dollars, but the costs are paid principally in Canadian dollars. We generally enter into derivative instruments for a portion of the currency risk exposure on anticipated cash inflows and outflows, including contractual outflows for our Potash expansion and other capital expenditures denominated in Canadian dollars. Mosaic hedges cash flows on a declining basis, up to 18 months for the Canadian dollar. Starting in 2018, we entered into hedges up to 36 months for expected Canadian dollar capital expenditures related to our Esterhazy K3 expansion program. A stronger Canadian dollar generally reduces these entities’ operating earnings. A weaker Canadian dollar has the opposite effect. Depending on the underlying exposure, such derivatives can create additional earnings volatility because we do not apply hedge accounting. Gains or losses on these derivative contracts, both for open contracts at quarter-end (unrealized) and settled contracts (realized), are recorded in either cost of goods sold or foreign currency transaction gain (loss).
The functional currency for our Brazilian subsidiaries is the Brazilian real. We finance our Brazilian inventory purchases with U.S. dollar-denominated liabilities. We hedge cash flows on a declining basis, up to 12 months for the Brazilian real. Due to the Acquisition, our exposure to the Brazilian real has increased and, as a result, the amount of foreign derivatives that we have entered into related to the Brazilian real has increased. A stronger Brazilian real relative to the U.S. dollar has the impact of reducing these liabilities on a functional currency basis. When this occurs, an associated foreign currency transaction gain is recorded as non-operating income. A weaker Brazilian real generally has the opposite effect. We also enter into derivative instruments for a portion of our currency risk exposure on anticipated cash flows, and record an associated gain or loss in the foreign currency transaction gain (loss) line in the Consolidated Statements of Earnings. A stronger Brazilian real generally reduces our Brazilian subsidiaries operating earnings. A weaker Brazilian real has the opposite effect.
As discussed above, we have Canadian dollar, Brazilian real, and other foreign currency exchange contracts. As of
December 31, 2018
, and
2017
, the fair value of our major foreign currency exchange contracts were
($49.1)
million and
$9.4
million, respectively. We recorded an unrealized loss of $31.4 million in cost of goods sold and recorded an unrealized loss of $25.6 million in foreign currency transaction gain (loss) in the Consolidated Statements of Earnings for 2018.
F-26
The table below provides information about Mosaic’s significant foreign exchange derivatives.
|
|
As of December 31, 2018
|
As of December 31, 2017
|
||||||||||||||||||||||||||
|
Expected
Maturity Date
Years ending
December 31,
|
Fair
Value
|
Expected
Maturity Date
Years ending
December 31,
|
Fair
Value
|
|||||||||||||||||||||||||
|
(in millions)
|
2019
|
2020
|
2021
|
2018
|
2019
|
|||||||||||||||||||||||
|
Foreign Currency Exchange Forwards
|
||||||||||||||||||||||||||||
|
Canadian Dollar
|
$
|
(40.7
|
)
|
$
|
12.3
|
|
||||||||||||||||||||||
|
Notional (million US$) - long Canadian dollars
|
$
|
651.3
|
|
$
|
170.1
|
|
$
|
138.2
|
|
$
|
444.4
|
|
$
|
39.1
|
|
|||||||||||||
|
Weighted Average Rate - Canadian dollar to U.S. dollar
|
1.2989
|
|
1.2877
|
|
1.3025
|
|
1.2850
|
|
1.2791
|
|
||||||||||||||||||
|
Foreign Currency Exchange Non-Deliverable Forwards
|
||||||||||||||||||||||||||||
|
Brazilian Real
|
$
|
(2.5
|
)
|
$
|
1.3
|
|
||||||||||||||||||||||
|
Notional (million US$) - short Brazilian real
|
$
|
535.1
|
|
$
|
—
|
|
$
|
—
|
|
$
|
174.9
|
|
$
|
—
|
|
|
|
|||||||||||
|
Weighted Average Rate - Brazilian real to U.S. dollar
|
3.8385
|
|
—
|
|
—
|
|
3.3001
|
|
—
|
|
||||||||||||||||||
|
Notional (million US$) - long Brazilian real
|
$
|
459.1
|
|
$
|
—
|
|
$
|
—
|
|
$
|
174.9
|
|
$
|
—
|
|
|||||||||||||
|
Weighted Average Rate - Brazilian real to U.S. dollar
|
3.8333
|
|
—
|
|
—
|
|
3.3414
|
|
—
|
|
||||||||||||||||||
|
Indian Rupee
|
$
|
(5.9
|
)
|
$
|
(4.2
|
)
|
||||||||||||||||||||||
|
Notional (million US$) - short Indian rupee
|
$
|
137.9
|
|
$
|
—
|
|
$
|
—
|
|
$
|
196.0
|
|
$
|
—
|
|
|||||||||||||
|
Weighted Average Rate - Indian rupee to U.S. dollar
|
73.0517
|
|
—
|
|
—
|
|
65.8215
|
|
—
|
|
||||||||||||||||||
|
Total Fair Value
|
$
|
(49.1
|
)
|
$
|
9.4
|
|
||||||||||||||||||||||
Commodities
We use forward purchase contracts, swaps and occasionally three-way collars to reduce the risk related to significant price changes in our inputs and product prices. In addition, the natural gas-based pricing under the CF Ammonia Supply Agreement is intended to lessen ammonia pricing volatility.
All gains and losses on commodities contracts are recorded in cost of goods sold in the Consolidated Statements of Earnings.
As of
December 31, 2018
, and
2017
, the fair value of our major commodities contracts were
($17.0) million
and
($17.6) million
, respectively. We recorded an unrealized loss of $1.2 million in cost of goods sold on the Consolidated Statements of Earnings in 2018.
Our primary commodities exposure relates to price changes in natural gas.
The table below provides information about Mosaic’s natural gas derivatives which are used to manage the risk related to significant price changes in natural gas.
F-27
|
|
As of December 31, 2018
|
As of December 31, 2017
|
||||||||||||||||||||||||||||||||||
|
Expected Maturity Date
Years ending
December 31,
|
Fair Value
|
Expected Maturity Date
Years ending
December 31,
|
Fair Value
|
|||||||||||||||||||||||||||||||||
|
(in millions)
|
2019
|
2020
|
2021
|
2022
|
2018
|
2019
|
2020
|
|||||||||||||||||||||||||||||
|
Natural Gas Swaps
|
$
|
(17.0
|
)
|
$
|
(17.6
|
)
|
||||||||||||||||||||||||||||||
|
Notional (million MMBtu) - long
|
20.4
|
|
15.8
|
|
13.2
|
|
2.9
|
|
18.2
|
|
19.9
|
|
5.0
|
|
||||||||||||||||||||||
|
Weighted Average Rate (US$/MMBtu)
|
$
|
2.22
|
|
$
|
1.92
|
|
$
|
1.73
|
|
$
|
1.47
|
|
$
|
3.16
|
|
$
|
3.01
|
|
$
|
3.14
|
|
|||||||||||||||
|
Total Fair Value
|
$
|
(17.0
|
)
|
$
|
(17.6
|
)
|
||||||||||||||||||||||||||||||
Interest Rates
We manage interest expense through interest rate contracts to convert a portion of our fixed-rate debt into floating-rate debt. From time to time, we also enter into interest rate swap agreements to hedge our exposure to changes in future interest rates related to anticipated debt issuances. As of
December 31, 2018
, and
2017
, the fair value of our interest rate contracts was ($9.5) million and ($2.2) million, respectively. We recorded an unrealized gain of $0.7 million in interest expense on the Consolidated Statements of Earnings for 2018.
Summary
Overall, there have been no material changes in our primary market risk exposures since the prior year. In
2019
, we do not expect any material changes in our primary risk exposures. Additional information about market risk associated with our investments held in the RCRA Trusts is provided in Note
12
of our Notes to Consolidated Financial Statements. For additional information related to derivatives, see Notes
15
and
16
of our Notes to Consolidated Financial Statements.
Environmental, Health, Safety and Security Matters
We are subject to an evolving complex of international, federal, state, provincial and local environmental, health, safety and security (“
EHS
”) laws that govern the production, distribution and use of crop nutrients and animal feed ingredients. These EHS laws regulate or propose to regulate: (i) conduct of mining, production and supply chain operations, including employee safety and facility security procedures; (ii) management and/or remediation of potential impacts to air, soil and water quality from our operations; (iii) disposal of waste materials; (iv) reclamation of lands after mining; (v) management and handling of raw materials; (vi) product content; and (vii) use of products by both us and our customers.
We have a comprehensive EHS management program that seeks to achieve sustainable, predictable and verifiable EHS performance. Key elements of our EHS program include: (i) identifying and managing EHS risk; (ii) complying with legal requirements; (iii) improving our EHS procedures and protocols; (iv) educating employees regarding EHS obligations; (v) retaining and developing professional qualified EHS staff; (vi) evaluating facility conditions; (vii) evaluating and enhancing safe workplace behaviors; (viii) performing audits; (ix) formulating EHS action plans; and (x) assuring accountability of all managers and other employees for EHS performance. Our business units are responsible for implementing day-to-day elements of our EHS program, assisted by an integrated staff of EHS professionals. We conduct audits to verify that each facility has identified risks, achieved regulatory compliance, implemented continuous EHS improvement, and incorporated EHS management systems into day-to-day business functions.
New or proposed regulatory programs can present significant challenges in ascertaining future compliance obligations, implementing compliance plans, and estimating future costs until implementing regulations have been finalized and definitive regulatory interpretations have been adopted. New or proposed regulatory requirements may require modifications to our facilities or to operating procedures and these modifications may involve significant capital costs or increases in operating costs.
We have expended, and anticipate that we will continue to expend, substantial financial and managerial resources to comply with EHS standards and to continue to improve our environmental stewardship. In
2019
, excluding capital expenditures arising out of the consent decrees referred to under “EPA RCRA Initiative” in Note
14
of our Notes to Consolidated Financial Statements, we expect environmental capital expenditures to total approximately $200 million, primarily related to: (i) modification or construction of waste management infrastructure and water treatment systems; (ii) construction and
F-28
modification projects associated with Gypstacks and clay settling ponds at our Phosphates facilities and tailings management areas for our Potash mining and processing facilities; (iii) upgrading or new construction of air pollution control equipment at some of the concentrates plants; and (iv) capital projects associated with remediation of contamination at current or former operations. Additional expenditures for land reclamation, Gypstack closure and water treatment activities are expected to total approximately $140 million in
2019
. In
2020
, we estimate environmental capital expenditures will be approximately $190 million and expenditures for land reclamation activities, Gypstack closure and water treatment activities are expected to be approximately $120 million. In the years ended December 31,
2018
and
2017
, we spent approximately $350 million and $280 million, respectively, for environmental capital expenditures, land reclamation activities, Gypstack closure and water treatment activities. No assurance can be given that greater-than-anticipated EHS capital expenditures or land reclamation, Gypstack closure or water treatment expenditures will not be required in
2019
or in the future.
Operating Requirements and Impacts
Permitting
. We hold numerous environmental, mining and other permits and approvals authorizing operations at each of our facilities. Our ability to continue operations at a facility could be materially affected by a government agency decision to deny or delay issuing a new or renewed permit or approval, to revoke or substantially modify an existing permit or approval or to substantially change conditions applicable to a permit modification, or by legal actions that successfully challenge our permits.
Expanding our operations or extending operations into new areas is also predicated upon securing the necessary environmental or other permits or approvals. We have been engaged in, and over the next several years will be continuing, efforts to obtain permits in support of our anticipated Florida mining operations at certain of our properties. For years, we have successfully permitted mining properties and anticipate that we will be able to permit these properties as well.
A denial of our permits, the issuance of permits with cost-prohibitive conditions, substantial delays in issuing key permits, legal actions that prevent us from relying on permits or revocation of permits can prevent or delay our mining at the affected properties and thereby materially affect our business, results of operations, liquidity or financial condition.
In addition, in Florida, local community involvement has become an increasingly important factor in the permitting process for mining companies, and various counties and other parties in Florida have in the past filed and continue to file lawsuits challenging the issuance of some of the permits we require. These actions can significantly delay permit issuance. Additional information regarding certain potential or pending permit challenges is provided in Note
22
to our Consolidated Financial Statements and is incorporated herein by reference.
Waters of the United States.
In June 2015, EPA and the U.S. Army Corps of Engineers (the “
Corps
”) jointly issued a final rule that proposed to clarify but may actually expand the scope of waters regulated under the federal Clean Water Act. The final rule (the “
2015 Clean Water Rule
”) became effective in August 2015, but has been challenged through numerous lawsuits. In October 2015, the U.S. Court of Appeals for the Sixth Circuit issued an order staying the effectiveness of the final rule nationwide pending adjudication of substantive challenges to the rule. In early 2017, the U.S. President issued an Executive Order directing EPA and the Corps to publish a proposed rule rescinding or revising the new rule, and in June 2017 EPA and the Corps issued a proposed rule that would rescind the 2015 Clean Water Rule and re-codify regulatory text that existed prior to enactment of the 2015 Clean Water Rule. In November 2017, EPA issued a rule notice proposing to extend the applicability date of the 2015 Clean Water Rule for two years from the date of final action on the proposed rule, to provide continuity and regulatory certainty while agencies proceed to consider potential changes to the 2015 Clean Water Rule.
In January 2018, the U.S. Supreme Court unanimously held all challenges to the 2015 Clean Water Rule must be heard in federal district courts rather than in the federal courts of appeal, overruling a decision by the Sixth Circuit Court of Appeals. With the Sixth Circuit Court of Appeals no longer having jurisdiction, that court lifted its 2015 nationwide stay in February 2018. After the nationwide stay was lifted, a number of U.S. District Courts revived dormant litigation that challenged the 2015 Clean Water Rule. In June 2018, the U.S. District Court for the Southern District of Georgia entered an injunction against implementation of the 2015 Clean Water Rule covering 11 states, including Florida. As of September 18, 2018, federal district courts have put the 2015 Clean Water Rule on hold in 28 states. The 2015 Clean Water Rule is now in effect in 22 states, the District of Columbia, and the U.S. territories.
On December 11, 2018, the EPA and Corps issued a proposed new Clean Water Rule designed to replace the 2015 Clean Water Rule. The agencies’ proposed rule is intended to provide clarity, predictability and consistency so that the regulated community can better understand where the Clean Water Act applies - and where it does not.
F-29
We believe the 2015 Clean Water Rule, if not rescinded, or replaced by the proposed rule issued on December 11, 2018, may expand the types and extent of land and water resources regulated under federal law, thereby potentially expanding our permitting and reporting requirements, increasing our costs of compliance, including costs associated with wetlands and stream mitigation, lengthening the time necessary to obtain permits, and potentially restricting our ability to mine certain of our phosphate rock reserves.
Water Quality Regulations for Nutrient Discharges.
New nutrient regulatory initiatives could have a material effect on either us or our customers. For example, the Gulf Coast Ecosystem Restoration Task Force, established by executive order of the President and comprised of five Gulf States and eleven federal agencies, has delivered a final strategy for long-term ecosystem restoration for the Gulf Coast. The strategy calls for, among other matters, reduction of the flow of excess nutrients into the Gulf of Mexico through state nutrient reduction frameworks, new nutrient reduction approaches and reduction of agricultural and urban sources of excess nutrients. Implementation of the strategy will require legislative or regulatory action at the state level. We cannot predict what the requirements of any such legislative or regulatory action could be or whether or how it would affect us or our customers.
Reclamation Obligations.
During our phosphate mining operations, we remove overburden in order to retrieve phosphate rock reserves. Once we have finished mining in an area, we use the overburden and sand tailings produced by the beneficiation process to reclaim the area in accordance with approved reclamation plans and applicable laws. We have incurred and will continue to incur significant costs to fulfill our reclamation obligations.
Management of Residual Materials and Closure of Management Areas.
Mining and processing of potash and phosphate generate residual materials that must be managed both during the operation of the facility and upon facility closure. Potash tailings, consisting primarily of salt and clay, are stored in surface disposal sites. Phosphate clay residuals from mining are deposited in clay settling ponds. Processing of phosphate rock with sulfuric acid generates phosphogypsum that is stored in Gypstacks.
During the life of the tailings management areas, clay settling ponds and Gypstacks, we have incurred and will continue to incur significant costs to manage our potash and phosphate residual materials in accordance with environmental laws and regulations and with permit requirements. Additional legal and permit requirements will take effect when these facilities are closed. Our asset retirement obligations are further discussed in Note
14
of our Notes to Consolidated Financial Statements.
New Wales Water Loss Incident
. In August 2016, a sinkhole developed under one of the two cells of the active Gypstack at our New Wales facility in Polk County, Florida, resulting in process water from the stack draining into the sinkhole. The incident was reported to the FDEP and EPA and in connection with the incident, our subsidiary, Mosaic Fertilizer, LLC (“
Mosaic Fertilizer
”), entered into a consent order (the “
Order
”) with the FDEP in October 2016 under which Mosaic Fertilizer agreed to, among other things, implement an approved remediation plan to close the sinkhole; perform additional water monitoring and if necessary, assessment and rehabilitation activities in the event of identified off-site impacts; provide financial assurance; and evaluate the risk of potential future sinkhole formation at our active Florida Gypstack operations. The incident and the Order are further discussed in Note
22
of our Notes to Consolidated Financial Statements.
Financial Assurance
.
Separate from our accounting treatment for reclamation and closure liabilities, some jurisdictions in which we operate have required us either to pass a test of financial strength or provide credit support, typically cash deposits, surety bonds, financial guarantees or letters of credit, to address phosphate mining reclamation liabilities and closure liabilities for clay settling areas and Gypstacks. See “Other Commercial Commitments” under “Off-Balance Sheet Arrangements and Obligations” above for additional information about these requirements. We also have obligations under certain consent decrees and a separate financial assurance arrangement relating to our facilities in Florida and Louisiana. Two consent decrees that became effective in 2016 resolved claims under the U.S. Resource Conservation and Recovery Act and state hazardous waste laws relating to our management of certain waste materials onsite at certain fertilizer manufacturing facilities in Florida and Louisiana. Under these consent decrees, in 2016 we deposited $630 million in cash into two trust funds to provide additional financial assurance for the estimated costs of closure and post-closure care of our phosphogypsum management systems. In addition, in 2017, we issued a letter of credit in the amount of $50 million to further support our financial assurance obligation under the Florida 2015 Consent Decree. While our actual Gypstack Closure Costs are generally expected to be paid by us in the normal course of our Phosphates business over a period that may not end until three decades or more after a Gypstack has been closed, the funds on deposit in the RCRA Trusts can be drawn by the applicable governmental authority in the event we cannot perform our closure and long term care obligations. If and when our estimated Gypstack Closure Costs with respect to the facilities associated with a RCRA Trust are sufficiently lower than the amount on deposit in that RCRA Trust, we have the right to request that the excess funds be released to us. The same is
F-30
true for the RCRA Trust balance remaining after the completion of our obligations, which will be performed over a period that may not end until three decades or more after a Gypstack has been closed. See the discussion under “EPA RCRA Initiative” in Note
14
of our Notes to Consolidated Financial Statements for additional information about these matters.
We have accepted a proposal by the Province of Saskatchewan under which we would establish a trust valued at $25 million (Canadian dollars) in satisfaction of financial assurance requirements for closure of our Saskatchewan potash facilities. The trust is to be fully funded by us by 2021 in equal annual installments which began in July 2014.
In January 2017, proposed rules were issued under the U.S. Comprehensive Environmental Response, Compensation, and Liability Act, commonly known as CERCLA or the Superfund law, that would require owners and operators of certain classes of hardrock mines and mineral processing facilities to demonstrate financial ability to cover potential costs of future cleanup efforts for their operations and costs of health assessments and natural resource damage. As proposed, the rules would apply to phosphate mining, phosphate fertilizer manufacturing and potash mining operations. In December 2017, EPA issued the final rule for hardrock mining, concluding that no financial assurance under CERCLA was required for the sector. Supporters of financial responsibility for hardrock mines and mineral processing facilities may challenge that rule. EPA has announced it will undertake similar rulemaking in phases for three additional sectors, including chemical manufacturing. We cannot predict at this time when EPA will issue proposed rules or what, if any, financial assurance requirements may ultimately be developed or required for our operations. Accordingly, we cannot predict the prospective impact of any such financial responsibility requirements on our results of operations, liquidity or capital resources, or whether any such effects could be material to us.
Climate Change
We are committed to finding ways to meet the challenges of crop nutrient and animal feed ingredient production and distribution in the context of the need to reduce greenhouse gas emissions. While focused on helping the world grow the food it needs, we have proven our commitment to using our resources more efficiently and have implemented innovative energy recovery technologies that result in our generation of much of the energy we need, particularly in our U.S. Phosphates operations, from high efficiency heat recovery systems that result in lower greenhouse gas emissions.
Climate Change Regulation.
Various governmental initiatives to limit greenhouse gas emissions are under way or under consideration around the world. These initiatives could restrict our operating activities, require us to make changes in our operating activities that would increase our operating costs, reduce our efficiency or limit our output, require us to make capital improvements to our facilities, increase our energy, raw material and transportation costs or limit their availability, or otherwise adversely affect our results of operations, liquidity or capital resources, and these effects could be material to us.
The direct greenhouse gas emissions from our operations result primarily from:
|
•
|
Combustion of natural gas to produce steam and dry potash products at our Belle Plaine, Saskatchewan, potash solution mine. To a lesser extent, at our potash shaft mines, natural gas is used as a fuel to heat fresh air supplied to the shaft mines and for drying potash products.
|
|
•
|
The use of natural gas as a feedstock in the production of ammonia at our Faustina, Louisiana phosphates plant.
|
|
•
|
Process reactions from naturally occurring carbonates in phosphate rock.
|
In addition, the production of energy and raw materials that we purchase from unrelated parties for use in our business and energy used in the transportation of our products and raw materials are sources of greenhouse gas emissions.
Governmental greenhouse gas emission initiatives include, among others, the December 2015 agreement (the “
Paris Agreement
”) which was the outcome of the 21
st
session of the Conference of the Parties under the United Nations Framework Convention on Climate Change. The Paris Agreement, which was signed by nearly 200 nations including the United States and Canada, entered into force in late 2016 and sets out a goal of limiting the average rise in temperatures for this century to below 2 degrees Celsius. Each signatory is expected to develop its own plan (referred to as a Nationally Determined Contribution, or “
NDC
”) for reaching that goal.
In May 2017, the U.S. President announced that the United States would withdraw from the Paris Agreement. Under Article 28 of that agreement, the earliest such a withdrawal could be effective is November 2020. In 2015, prior to this announcement,
the United States had submitted an NDC aiming to achieve, by 2025, an economy-wide target of reducing greenhouse gas emissions by 26-28% below its 2005 level. The NDC also aims to use best efforts to reduce emissions by 28%. The U.S. target covers all greenhouse gases that were a part of the 2014 Inventory of
Greenhouse Gas Emissions and
F-31
Sinks. While it is unclear whether the U.S. executive administration will proceed to withdraw from the Paris Agreement, various legislative or regulatory initiatives relating to greenhouse gases have been adopted or considered by the U.S. Congress, EPA or various states and those initiatives already adopted may be used to implement the U.S. NDC. Additionally, more stringent laws and regulations may be enacted to accomplish the goals set out in the NDC.
Canada’s intended NDC aims to achieve, by 2030, an economy-wide target of reducing greenhouse gas emissions by 30% below 2005 levels. In late 2016, the federal government announced plans for a comprehensive tax on carbon emissions, under which provinces opting out of the tax would have the option of adopting a cap-and-trade system. In the plans, the federal government also committed to implementing a federal carbon pricing backstop system that will apply in any province or territory that does not have a carbon pricing system in place by 2018. As of January 1, 2019, a carbon tax of $20 per tonne now applies in Canada for any emitter not covered under the federal backstop program or approved provincial program. In addition, the Province of Saskatchewan, in which our Canadian potash mines are located, has stated that a carbon pricing system will not be implemented in the province and that legal action will be sought against the federal government. In December 2017, Saskatchewan announced a comprehensive plan to address climate change that does not include an economy-wide price on carbon but does include a system of tariffs and credits for large emitters. The plan was reviewed and approved, in part, by the federal government in October 2018. Our Saskatchewan Potash facilities will be subject to the Saskatchewan climate change plan regarding emissions at our facilities; however, indirect costs from the carbon tax associated with electricity, natural gas consumption, and transportation may be passed through to Mosaic. As implementation of the Paris Agreement proceeds, more stringent laws and regulations may be enacted to accomplish the goals set out in Canada's NDC, such as the Clean Fuel Standard, which is now under development in Ottawa. We will also continue to monitor developments relating to the anticipated legislation, as well as the potential future effect on our operating activities, energy, raw material and transportation costs, results of operations, liquidity or capital resources.
It is possible that future legislation or regulation addressing climate change, including in response to the Paris Agreement or any new international agreements, could adversely affect our operating activities, energy, raw material and transportation costs, results of operations, liquidity or capital resources, and these effects could be material or adversely impact our competitive advantage. In addition, to the extent climate change restrictions imposed in countries where our competitors operate, such as China, India, Former Soviet Union countries or Morocco, are less stringent than in the United States or Canada, our competitors could gain cost or other competitive advantages over us.
Operating Impacts Due to Climate Change.
The prospective impact of climate change on our operations and those of our customers and farmers remains uncertain. Scientists have hypothesized that the impacts of climate change could include changes in rainfall patterns, water shortages, changing sea levels, changing storm patterns and intensities, and changing temperature levels and that these changes could be severe. These impacts could vary by geographic location. Severe climate change could impact our costs and operating activities, the location and cost of global grain and oilseed production, and the supply and demand for grains and oilseeds. At the present time, we cannot predict the prospective impact of climate change on our results of operations, liquidity or capital resources, or whether any such effects could be material to us.
Remedial Activities
CERCLA (aka Superfund) and state analogues impose liability, without regard to fault or to the legality of a party’s conduct, on certain categories of persons, including those who have disposed of “hazardous substances” at a third-party location. Under Superfund, or its various state analogues, one party may be responsible for the entire site, regardless of fault or the locality of its disposal activity. We have contingent environmental remedial liabilities that arise principally from three sources which are further discussed below: (i) facilities currently or formerly owned by our subsidiaries or their predecessors; (ii) facilities adjacent to currently or formerly owned facilities; and (iii) third-party Superfund or state equivalent sites where we are alleged to have disposed of hazardous materials. Taking into consideration established accruals for environmental remedial matters of approximately
$58.6 million
as of
December 31, 2018
, expenditures for these known conditions currently are not expected, individually or in the aggregate, to have a material effect on our business or financial condition. However, material expenditures could be required in the future to remediate the contamination at known sites or at other current or former sites.
Remediation at Our Facilities.
Many of our formerly owned or current facilities have been in operation for a number of years. The historical use and handling of regulated chemical substances, crop and animal nutrients and additives as well as by-product or process tailings at these facilities by us and predecessor operators have resulted in soil, surface water and groundwater impacts.
F-32
At many of these facilities, spills or other releases of regulated substances have occurred previously and potentially could occur in the future, possibly requiring us to undertake or fund cleanup efforts under Superfund or otherwise. In some instances, we have agreed, pursuant to consent orders or agreements with the appropriate governmental agencies, to undertake certain investigations, which currently are in progress, to determine whether remedial action may be required to address site impacts. At other locations, we have entered into consent orders or agreements with appropriate governmental agencies to perform required remedial activities that will address identified site conditions. Taking into account established accruals, future expenditures for these known conditions currently are not expected, individually or in the aggregate, to have a material adverse effect on our business or financial condition. However, material expenditures by us could be required in the future to remediate the environmental impacts at these or at other current or former sites.
Remediation at Third-Party Facilities.
Various third parties have alleged that our historical operations have impacted neighboring off-site areas or nearby third-party facilities. In some instances, we have agreed, pursuant to orders from or agreements with appropriate governmental agencies or agreements with private parties, to undertake or fund investigations, some of which currently are in progress, to determine whether remedial action, under Superfund or otherwise, may be required to address off-site impacts. Our remedial liability at these sites, either alone or in the aggregate, taking into account established accruals, currently is not expected to have a material adverse effect on our business or financial condition. As more information is obtained regarding these sites, this expectation could change.
Liability for Off-Site Disposal Locations.
Currently, we are involved or concluding involvement for off-site disposal at several Superfund or equivalent state sites. Moreover, we previously have entered into settlements to resolve liability with regard to Superfund or equivalent state sites. In some cases, such settlements have included “reopeners,” which could result in additional liability at such sites in the event of newly discovered contamination or other circumstances. Our remedial liability at such disposal sites, either alone or in the aggregate, currently is not expected to have a material adverse effect on our business or financial condition. As more information is obtained regarding these sites and the potentially responsible parties involved, this expectation could change.
Product Requirements and Impacts
International, federal, state and provincial standards require us to register many of our products before these products can be sold. The standards also impose labeling requirements on these products and require us to manufacture the products to formulations set forth on the labels. We believe that, when handled and used as intended, based on the available data, crop nutrient materials do not pose harm to human health or the environment and that any additional standards or regulatory requirements relating to product requirements and impacts will not have a material adverse effect on our business or financial condition.
Additional Information
For additional information about phosphate mine permitting in Florida, our environmental liabilities, the environmental proceedings in which we are involved, our asset retirement obligations related to environmental matters, and our related accounting policies, see Environmental Liabilities and AROs under Critical Accounting Estimates above and Notes
2
,
14
, and
22
of our Notes to Consolidated Financial Statements.
Sustainability
We are committed to making informed choices that improve our corporate governance, financial strength, operational efficiency, environmental stewardship, community engagement and resource management. Through these efforts, we intend to sustain our business and experience lasting success.
We have included, or incorporate by reference, throughout this annual report on Form 10-K discussions of various matters relating to our sustainability, in its broadest sense, that we believe may be material to our investors. These matters include, but are not limited to, discussions about: corporate governance, including the leadership and respective roles of our Board of Directors and its committees, and management; recent and prospective developments in our business; product development; risk, enterprise risk management and risk oversight; the regulatory and permitting environment for our business and ongoing regulatory and permitting initiatives; executive compensation practices; employee and contractor safety; and other EHS matters including climate change, water management, energy and other operational efficiency initiatives, reclamation and asset retirement obligations. Other matters relating to sustainability are included in our sustainability reports that are available on our website at www.mosaicco.com/sustainability. Our sustainability reports are not incorporated by reference in this annual report on Form 10-K.
F-33
Contingencies
Information regarding contingencies in Note
22
of our Notes to Consolidated Financial Statements is incorporated herein by reference.
Related Parties
Information regarding related party transactions is set forth in Note
23
of our Notes to Consolidated Financial Statements and is incorporated herein by reference.
Recently Issued Accounting Guidance
Recently issued accounting guidance is set forth in Note
3
of our Notes to Consolidated Financial Statements and is incorporated herein by reference.
Forward-Looking Statements
Cautionary Statement Regarding Forward Looking Information
All statements, other than statements of historical fact, appearing in this report constitute “forward-looking statements” within the meaning of the Private Securities Litigation Reform Act of 1995. These statements include, among other things, statements about our expectations, beliefs, intentions or strategies for the future, including statements about our recently completed Acquisition and the anticipated benefits and synergies of the Acquisition, statements about MWSPC and its nature, impact and benefits, statements about other proposed or pending future transactions or strategic plans, statements concerning our future operations, financial condition and prospects, statements regarding our expectations for capital expenditures, statements concerning our level of indebtedness and other information, and any statements of assumptions regarding any of the foregoing. In particular, forward-looking statements may include words such as "anticipate", "believe", "could", "estimate", "expect", "intend", "may", "potential", "predict", "project" or "should". These statements involve certain risks and uncertainties that may cause actual results to differ materially from expectations as of the date of this filing.
Factors that could cause reported results to differ materially from those expressed or implied by the forward-looking statements include, but are not limited to, the following:
|
•
|
difficulties with realization of the benefits of the Acquisition, including the risks that the Acquired Business may not be integrated successfully,
|
|
•
|
the anticipated synergies or cost or capital expenditure savings from the Acquisition may not be fully realized or may take longer to realize than expected,
|
|
•
|
because of political and economic instability in Brazil or changes in government policy in Brazil, our operations could be disrupted as higher costs of doing business could result, including those associated with implementation of new freight tables and new mining legislation;
|
|
•
|
business and economic conditions and governmental policies affecting the agricultural industry where we or our customers operate, including price and demand volatility resulting from periodic imbalances of supply and demand;
|
|
•
|
changes in farmers’ application rates for crop nutrients;
|
|
•
|
changes in the operation of world phosphate or potash markets, including continuing consolidation in the crop nutrient industry, particularly if we do not participate in the consolidation;
|
|
•
|
the expansion or contraction of production capacity or selling efforts by competitors or new entrants in the industries in which we operate, including the effects of actions by members of Canpotex to prove the production capacity of potash expansion projects, through proving runs or otherwise;
|
|
•
|
the expected cost of MWSPC and our expected remaining investment to be made in it, the amount, terms, availability and sufficiency of funding for MWSPC from us, Saudi Arabian Mining Company and Saudi Basic Industries Corporation and existing or future external sources, the timely development and commencement of operations of production facilities in the Kingdom of Saudi Arabia, political and economic instability in the region, and in general the future success of current plans for the joint venture and any future changes in those plans;
|
F-34
|
•
|
build-up of inventories in the distribution channels for our products that can adversely affect our sales volumes and selling prices;
|
|
•
|
the effect of future product innovations or development of new technologies on demand for our products;
|
|
•
|
seasonality in our business that results in the need to carry significant amounts of inventory and seasonal peaks in working capital requirements, and may result in excess inventory or product shortages;
|
|
•
|
changes in the costs, or constraints on supplies, of raw materials or energy used in manufacturing our products, or in the costs or availability of transportation for our products;
|
|
•
|
declines in our selling prices or significant increases in costs that can require us to write down our inventories to the lower of cost or market, or require us to impair goodwill or other long-lived assets, or establish a valuation allowance against deferred tax assets;
|
|
•
|
the effects on our customers of holding high cost inventories of crop nutrients in periods of rapidly declining market prices for crop nutrients;
|
|
•
|
the lag in realizing the benefit of falling market prices for the raw materials we use to produce our products that can occur while we consume raw materials that we purchased or committed to purchase in the past at higher prices;
|
|
•
|
customer expectations about future trends in the selling prices and availability of our products and in farmer economics;
|
|
•
|
disruptions to existing transportation or terminaling facilities, including those of Canpotex or any joint venture in which we participate;
|
|
•
|
shortages or other unavailability of railcars, tugs, barges and ships for carrying our products and raw materials;
|
|
•
|
the effects of and change in trade, monetary, environmental, tax and fiscal policies, laws and regulations;
|
|
•
|
foreign exchange rates and fluctuations in those rates;
|
|
•
|
tax regulations, currency exchange controls and other restrictions that may affect our ability to optimize the use of our liquidity;
|
|
•
|
other risks associated with our international operations, including any potential adverse effects related to the Miski Mayo mine in the event that protests against natural resource companies in Peru were to extend to or impact the Miski Mayo mine;
|
|
•
|
adverse weather conditions affecting our operations, including the impact of potential hurricanes, excessive heat, cold, snow or rainfall, or drought;
|
|
•
|
difficulties or delays in receiving, challenges to, increased costs of obtaining or satisfying conditions of, or revocation or withdrawal of required governmental and regulatory approvals, including permitting activities;
|
|
•
|
changes in the environmental and other governmental regulation that applies to our operations, including federal legislation or regulatory action expanding the types and extent of water resources regulated under federal law and the possibility of further federal or state legislation or regulatory action affecting or related to greenhouse gas emissions, including carbon taxes or other measures that may be implemented in Canada or other jurisdictions in which we operate, or of restrictions or liabilities related to elevated levels of naturally-occurring radiation that arise from disturbing the ground in the course of mining activities or possible efforts to reduce the flow of nutrients into the Gulf of Mexico, the Mississippi River basin or elsewhere;
|
|
•
|
the potential costs and effects of implementation of federal or state water quality standards for the discharge of nitrogen and/or phosphorus into Florida waterways;
|
|
•
|
the financial resources of our competitors, including state-owned and government-subsidized entities in other countries;
|
|
•
|
the possibility of defaults by our customers on trade credit that we extend to them or on indebtedness that they incur to purchase our products and that we guarantee, particularly when we are exiting our business operations or locations that produced or sold the products to that customer;
|
|
•
|
any significant reduction in customers’ liquidity or access to credit that they need to purchase our products;
|
F-35
|
•
|
the effectiveness of the processes we put in place to manage our significant strategic priorities, including the expansion of our Potash business and our investment in MWSPC, and to successfully integrate and grow acquired businesses;
|
|
•
|
actual costs of various items differing from management’s current estimates, including, among others, asset retirement, environmental remediation, reclamation or other environmental obligations and Canadian resource taxes and royalties, or the costs of MWSPC, its existing or future funding and our commitments in support of such funding;
|
|
•
|
the costs and effects of legal and administrative proceedings and regulatory matters affecting us, including environmental, tax or administrative proceedings, complaints that our operations are adversely impacting nearby farms, businesses, other property uses or properties, settlements thereof and actions taken by courts with respect to approvals of settlements, costs related to defending and resolving global audit, appeal or court activity, and other, and other further developments in legal proceedings and regulatory matters;
|
|
•
|
the success of our efforts to attract and retain highly qualified and motivated employees;
|
|
•
|
strikes, labor stoppages or slowdowns by our work force or increased costs resulting from unsuccessful labor contract negotiations, and the potential costs and effects of compliance with new regulations affecting our workforce, which increasingly focus on wages and hours, healthcare, retirement and other employee benefits;
|
|
•
|
brine inflows at our Esterhazy, Saskatchewan potash mine as well as potential inflows at our other shaft mines;
|
|
•
|
accidents or other incidents involving our properties or operations, including potential fires, explosions, seismic events, sinkholes, unsuccessful tailings management, ineffective mine safety procedures, or releases of hazardous or volatile chemicals;
|
|
•
|
terrorism or other malicious intentional acts, including cybersecurity risks such as attempts to gain unauthorized access to, or disable, our information technology systems, or our costs of addressing malicious intentional acts;
|
|
•
|
other disruptions of operations at any of our key production and distribution facilities, particularly when they are operating at high operating rates;
|
|
•
|
changes in antitrust and competition laws or their enforcement;
|
|
•
|
actions by the holders of controlling equity interests in businesses in which we hold a noncontrolling interest;
|
|
•
|
changes in our relationships with other members of Canpotex or any joint venture in which we participate or their or our exit from participation in Canpotex or any such export association or joint venture, and other changes in our commercial arrangements with unrelated third parties;
|
|
•
|
the adequacy of our property, business interruption and casualty insurance policies to cover potential hazards and risks incident to our business, and our willingness and ability to maintain current levels of insurance coverage as a result of market conditions, our loss experience and other factors;
|
|
•
|
difficulties in realizing benefits under our long-term natural gas based pricing ammonia supply agreement with CF Industries, Inc., including the risks that the cost savings initially anticipated from the agreement may not be fully realized over the term of the agreement or that the price of natural gas or the market price for ammonia during the agreement's term are at levels at which the agreement’s natural gas based pricing is disadvantageous to us, compared with purchases in the spot market; and
|
|
•
|
other risk factors reported from time to time in our Securities and Exchange Commission reports.
|
Material uncertainties and other factors known to us are discussed in Item 1A, “Risk Factors,” of our annual report on Form 10-K for the year ended
December 31, 2018
and incorporated by reference herein as if fully stated herein.
We base our forward-looking statements on information currently available to us, and we undertake no obligation to update or revise any of these statements, whether as a result of changes in underlying factors, new information, future events or other developments.
F-36
Report of Independent Registered Public Accounting Firm
To the Stockholders and Board of Directors
The Mosaic Company:
Opinion on the Consolidated Financial Statements
We have audited the accompanying consolidated balance sheets of The Mosaic Company and subsidiaries (the “Company”) as of December 31, 2018 and 2017, the related consolidated statements of earnings, comprehensive income, cash flows, and equity for each of the years in the three‑year period ended December 31, 2018, and the related notes and Schedule II-Valuation and Qualifying Accounts (collectively, the “consolidated financial statements”). In our opinion, the consolidated financial statements present fairly, in all material respects, the financial position of the Company as of December 31, 2018 and 2017, and the results of its operations and its cash flows for each of the years in the three‑year period ended December 31, 2018, in conformity with U.S. generally accepted accounting principles.
We also have audited, in accordance with the standards of the Public Company Accounting Oversight Board (United States) (“PCAOB”), the Company’s internal control over financial reporting as of December 31, 2018, based on criteria established in
Internal Control - Integrated Framework (2013)
issued by the Committee of Sponsoring Organizations of the Treadway Commission, and our report dated March 12, 2019 expressed
an unqualified opinion on the effectiveness of the Company’s internal control over financial reporting.
Our report dated March 12, 2019 on internal control over financial reporting as of December 31, 2018, contains an explanatory paragraph that states management excluded from its assessment of the effectiveness of internal control over financial reporting as of December 31, 2018, Mosaic Fertilizantes P&K S.A.’s internal control over financial reporting associated with total assets of $3.3 billion and total net sales of $1.3 billion included in the consolidated financial statements of the Company as of and for the year ended December 31, 2018. Our audit of internal control over financial reporting of the Company also excluded an evaluation of the internal control over financial reporting of the newly acquired business.
Change in Accounting Principle
As discussed in Note 3 to the consolidated financial statements, effective January 1, 2018, the Company adopted Accounting Standards Update (ASU) 2014-09,
Revenue from Contracts with Customers
, and several related amendments, as issued by the Financial Accounting Standards Board (FASB). This change was adopted using the modified retrospective method.
Basis for Opinion
These consolidated financial statements are the responsibility of the Company’s management. Our responsibility is to express an opinion on these consolidated financial statements based on our audits. We are a public accounting firm registered with the PCAOB and are required to be independent with respect to the Company in accordance with the U.S. federal securities laws and the applicable rules and regulations of the Securities and Exchange Commission and the PCAOB.
We conducted our audits in accordance with the standards of the PCAOB. Those standards require that we plan and perform the audit to obtain reasonable assurance about whether the consolidated financial statements are free of material misstatement, whether due to error or fraud. Our audits included performing procedures to assess the risks of material misstatement of the consolidated financial statements, whether due to error or fraud, and performing procedures that respond to those risks. Such procedures included examining, on a test basis, evidence regarding the amounts and disclosures in the consolidated financial statements. Our audits also included evaluating the accounting principles used and significant estimates made by management, as well as evaluating the overall presentation of the consolidated financial statements. We believe that our audits provide a reasonable basis for our opinion.
/s/ KPMG LLP
We have served as the Company’s auditor since 2004.
Minneapolis, Minnesota
March 12, 2019
F-37
Report of Independent Registered Public Accounting Firm
To the Stockholders and Board of Directors
The Mosaic Company:
Opinion on Internal Control Over Financial Reporting
We have audited The Mosaic Company’s and
subsidiaries’ (the Company) internal control over financial reporting as of December 31, 2018, based on criteria established in
Internal Control - Integrated Framework (2013)
issued by the Committee of Sponsoring Organizations of the Treadway Commission. In our opinion, the Company maintained, in all material respects, effective internal control over financial reporting as of December 31, 2018, based on criteria established in
Internal Control - Integrated Framework (2013)
issued by the Committee of Sponsoring Organizations of the Treadway Commission
We also have audited, in accordance with the standards of the Public Company Accounting Oversight Board (United States) (PCAOB), the consolidated balance sheets of the Company as of December 31, 2018 and 2017, the related consolidated statements of earnings, comprehensive income, equity, and cash flows for each of the years in the three-year period ended December 31, 2018, and the related notes and Schedule II-Valuation and Qualifying Accounts (collectively, the consolidated financial statements), and our report dated March 12, 2019 expressed an unqualified opinion on those consolidated financial statements
.
The Company acquired Mosaic Fertilizantes P&K S.A. during 2018, and management excluded from its assessment of the effectiveness of the Company’s internal control over financial reporting as of December 31, 2018, Mosaic Fertilizantes P&K S.A.’s internal control over financial reporting associated with total assets of $3.3 billion and total net sales of $1.3 billion included in the consolidated financial statements of the Company as of and for the year ended December 31, 2018. Our audit of internal control over financial reporting of the Company also excluded an evaluation of the internal control over financial reporting of the newly acquired business.
Basis for Opinion
The Company’s management is responsible for maintaining effective internal control over financial reporting and for its assessment of the effectiveness of internal control over financial reporting, included in the accompanying Management’s Annual Report on Internal Control over Financial Reporting. Our responsibility is to express an opinion on the Company’s internal control over financial reporting based on our audit. We are a public accounting firm registered with the PCAOB and are required to be independent with respect to the Company in accordance with the U.S. federal securities laws and the applicable rules and regulations of the Securities and Exchange Commission and the PCAOB.
We conducted our audit in accordance with the standards of the PCAOB. Those standards require that we plan and perform the audit to obtain reasonable assurance about whether effective internal control over financial reporting was maintained in all material respects. Our audit of internal control over financial reporting included obtaining an understanding of internal control over financial reporting, assessing the risk that a material weakness exists, and testing and evaluating the design and operating effectiveness of internal control based on the assessed risk. Our audit also included performing such other procedures as we considered necessary in the circumstances. We believe that our audit provides a reasonable basis for our opinion.
Definition and Limitations of Internal Control Over Financial Reporting
A company’s internal control over financial reporting is a process designed to provide reasonable assurance regarding the reliability of financial reporting and the preparation of financial statements for external purposes in accordance with generally accepted accounting principles. A company’s internal control over financial reporting includes those policies and procedures that (1) pertain to the maintenance of records that, in reasonable detail, accurately and fairly reflect the transactions and dispositions of the assets of the company; (2) provide reasonable assurance that transactions are recorded as necessary to permit preparation of financial statements in accordance with generally accepted accounting principles, and that receipts and expenditures of the company are being made only in accordance with authorizations of management and directors of the company; and (3) provide reasonable assurance regarding prevention or timely detection of unauthorized acquisition, use, or disposition of the company’s assets that could have a material effect on the financial statements.
Because of its inherent limitations, internal control over financial reporting may not prevent or detect misstatements. Also, projections of any evaluation of effectiveness to future periods are subject to the risk that controls may become inadequate because of changes in conditions, or that the degree of compliance with the policies or procedures may deteriorate.
/s/ KPMG LLP
Minneapolis, Minnesota
March 12, 2019
F-38
Consolidated Statements of Earnings
In millions, except per share amounts
|
|
Years Ended December 31,
|
||||||||||
|
|
2018
|
2017
|
2016
|
||||||||
|
Net sales
|
$
|
9,587.3
|
|
$
|
7,409.4
|
|
$
|
7,162.8
|
|
||
|
Cost of goods sold
|
8,088.9
|
|
6,566.6
|
|
6,352.8
|
|
|||||
|
Gross margin
|
1,498.4
|
|
842.8
|
|
810.0
|
|
|||||
|
Selling, general and administrative expenses
|
341.1
|
|
301.3
|
|
304.2
|
|
|||||
|
Other operating expenses
|
229.0
|
|
75.8
|
|
186.8
|
|
|||||
|
Operating earnings
|
928.3
|
|
465.7
|
|
319.0
|
|
|||||
|
Interest expense, net
|
(166.1
|
)
|
(138.1
|
)
|
(112.4
|
)
|
|||||
|
Foreign currency transaction (loss) gain
|
(191.9
|
)
|
49.9
|
|
40.1
|
|
|||||
|
Other expense
|
(18.8
|
)
|
(3.5
|
)
|
(4.3
|
)
|
|||||
|
Earnings from consolidated companies before income taxes
|
551.5
|
|
374.0
|
|
242.4
|
|
|||||
|
Provision for (benefit from) income taxes
|
77.1
|
|
494.9
|
|
(74.2
|
)
|
|||||
|
Earnings (loss) from consolidated companies
|
474.4
|
|
(120.9
|
)
|
316.6
|
|
|||||
|
Equity in net (loss) earnings of nonconsolidated companies
|
(4.5
|
)
|
16.7
|
|
(15.4
|
)
|
|||||
|
Net earnings (loss) including noncontrolling interests
|
469.9
|
|
(104.2
|
)
|
301.2
|
|
|||||
|
Less: Net (loss) earnings attributable to noncontrolling interests
|
(0.1
|
)
|
3.0
|
|
3.4
|
|
|||||
|
Net earnings (loss) attributable to Mosaic
|
$
|
470.0
|
|
$
|
(107.2
|
)
|
$
|
297.8
|
|
||
|
Basic net earnings (loss) per share attributable to Mosaic
|
$
|
1.22
|
|
$
|
(0.31
|
)
|
$
|
0.85
|
|
||
|
Basic weighted average number of shares outstanding
|
384.8
|
|
350.9
|
|
350.4
|
|
|||||
|
Diluted net earnings (loss) per share attributable to Mosaic
|
$
|
1.22
|
|
$
|
(0.31
|
)
|
$
|
0.85
|
|
||
|
Diluted weighted average number of shares outstanding
|
386.4
|
|
350.9
|
|
351.7
|
|
|||||
See Accompanying Notes to Consolidated Financial Statements
F-39
Consolidated Statements of Comprehensive Income
In millions
|
|
Years Ended December 31,
|
||||||||||
|
|
2018
|
2017
|
2016
|
||||||||
|
Net earnings (loss) including noncontrolling interest
|
$
|
469.9
|
|
$
|
(104.2
|
)
|
$
|
301.2
|
|
||
|
Other comprehensive (loss) income, net of tax
|
|||||||||||
|
Foreign currency translation (loss) gain, net of tax benefit (expense) of $24.5, ($11.4) and $9.8, respectively
|
(596.9
|
)
|
240.5
|
|
192.3
|
|
|||||
|
Net actuarial (loss) gain and prior service cost, net of tax (expense) benefit of ($2.4), ($2.1), and $3.1, respectively
|
(10.6
|
)
|
6.3
|
|
(3.2
|
)
|
|||||
|
Realized gain on interest rate swap, net of tax expense of $0.1, $0.7 and $1.0, respectively
|
2.2
|
|
1.7
|
|
1.5
|
|
|||||
|
Net gain (loss) on marketable securities held in trust fund, net of tax (expense) benefit of ($0.2), ($1.0) and $3.3, respectively
|
4.6
|
|
1.7
|
|
(7.8
|
)
|
|||||
|
Other comprehensive (loss) income
|
(600.7
|
)
|
250.2
|
|
182.8
|
|
|||||
|
Comprehensive (loss) income
|
(130.8
|
)
|
146.0
|
|
484.0
|
|
|||||
|
Less: Comprehensive (loss) income attributable to noncontrolling interest
|
(5.3
|
)
|
2.6
|
|
5.5
|
|
|||||
|
Comprehensive (loss) income attributable to Mosaic
|
$
|
(125.5
|
)
|
$
|
143.4
|
|
$
|
478.5
|
|
||
See Accompanying Notes to Consolidated Financial Statements
F-40
Consolidated Balance Sheets
In millions, except per share amounts
|
|
December 31,
|
||||||
|
|
2018
|
2017
|
|||||
|
Assets
|
|||||||
|
Current assets:
|
|||||||
|
Cash and cash equivalents
|
$
|
847.7
|
|
$
|
2,153.5
|
|
|
|
Receivables, net
|
838.5
|
|
642.6
|
|
|||
|
Inventories
|
2,270.2
|
|
1,547.2
|
|
|||
|
Other current assets
|
280.6
|
|
273.2
|
|
|||
|
Total current assets
|
4,237.0
|
|
4,616.5
|
|
|||
|
Property, plant and equipment, net
|
11,746.5
|
|
9,711.7
|
|
|||
|
Investments in nonconsolidated companies
|
826.6
|
|
1,089.5
|
|
|||
|
Goodwill
|
1,707.5
|
|
1,693.6
|
|
|||
|
Deferred income taxes
|
343.8
|
|
254.6
|
|
|||
|
Other assets
|
1,257.8
|
|
1,267.5
|
|
|||
|
Total assets
|
$
|
20,119.2
|
|
$
|
18,633.4
|
|
|
|
Liabilities and Equity
|
|||||||
|
Current liabilities:
|
|||||||
|
Short-term debt
|
$
|
11.5
|
|
$
|
6.1
|
|
|
|
Current maturities of long-term debt
|
26.0
|
|
343.5
|
|
|||
|
Structured accounts payable arrangements
|
572.8
|
|
386.2
|
|
|||
|
Accounts payable
|
780.9
|
|
540.9
|
|
|||
|
Accrued liabilities
|
1,092.5
|
|
754.4
|
|
|||
|
Total current liabilities
|
2,483.7
|
|
2,031.1
|
|
|||
|
Long-term debt, less current maturities
|
4,491.5
|
|
4,878.1
|
|
|||
|
Deferred income taxes
|
1,080.6
|
|
1,117.3
|
|
|||
|
Other noncurrent liabilities
|
1,458.7
|
|
967.8
|
|
|||
|
Equity:
|
|||||||
|
Preferred stock, $0.01 par value, 15,000,000 shares authorized, none issued and outstanding as of December 31, 2018 and 2017
|
—
|
|
—
|
|
|||
|
Common stock, $0.01 par value, 1,000,000,000 shares authorized, 389,242,360 shares issued and 385,470,085 shares outstanding as of December 31, 2018, 388,998,498 shares issued and 351,049,649 shares outstanding as of December 31, 2017
|
3.8
|
|
3.5
|
|
|||
|
Capital in excess of par value
|
985.9
|
|
44.5
|
|
|||
|
Retained earnings
|
11,064.7
|
|
10,631.1
|
|
|||
|
Accumulated other comprehensive loss
|
(1,657.1
|
)
|
(1,061.6
|
)
|
|||
|
Total Mosaic stockholders’ equity
|
10,397.3
|
|
9,617.5
|
|
|||
|
Non-controlling interests
|
207.4
|
|
21.6
|
|
|||
|
Total equity
|
10,604.7
|
|
9,639.1
|
|
|||
|
Total liabilities and equity
|
$
|
20,119.2
|
|
$
|
18,633.4
|
|
|
See Accompanying Notes to Consolidated Financial Statements
F-41
Consolidated Statements of Cash Flows
In millions, except per share amounts
|
|
Years Ended December 31,
|
||||||||||
|
|
2018
|
2017
|
2016
|
||||||||
|
Cash Flows from Operating Activities
|
|||||||||||
|
Net earnings (loss) including noncontrolling interests
|
$
|
469.9
|
|
$
|
(104.2
|
)
|
$
|
301.2
|
|
||
|
Adjustments to reconcile net earnings including noncontrolling interests to net cash provided by operating activities:
|
|||||||||||
|
Depreciation, depletion and amortization
|
883.9
|
|
665.5
|
|
711.2
|
|
|||||
|
Amortization of acquired inventory
|
(49.2
|
)
|
—
|
|
—
|
|
|||||
|
Deferred and other income taxes
|
(101.8
|
)
|
612.4
|
|
(182.6
|
)
|
|||||
|
Equity in net loss of nonconsolidated companies, net of dividends
|
12.9
|
|
34.4
|
|
32.6
|
|
|||||
|
Accretion expense for asset retirement obligations
|
48.0
|
|
25.7
|
|
40.4
|
|
|||||
|
Share-based compensation expense
|
27.5
|
|
28.0
|
|
30.5
|
|
|||||
|
Loss on write-down of long-lived asset
|
—
|
|
—
|
|
43.5
|
|
|||||
|
Unrealized loss (gain) on derivatives
|
58.9
|
|
8.3
|
|
(70.1
|
)
|
|||||
|
Loss (gain) on disposal of fixed assets
|
63.1
|
|
(25.5
|
)
|
27.0
|
|
|||||
|
Other
|
18.3
|
|
7.8
|
|
18.2
|
|
|||||
|
Changes in assets and liabilities, net of acquisitions:
|
|||||||||||
|
Receivables, net
|
5.9
|
|
(91.2
|
)
|
3.5
|
|
|||||
|
Inventories, net
|
(497.4
|
)
|
(155.7
|
)
|
263.0
|
|
|||||
|
Other current assets and noncurrent assets
|
86.7
|
|
(23.7
|
)
|
239.8
|
|
|||||
|
Accounts payable and accrued liabilities
|
342.0
|
|
(65.7
|
)
|
(243.9
|
)
|
|||||
|
Other noncurrent liabilities
|
41.1
|
|
19.4
|
|
45.9
|
|
|||||
|
Net cash provided by operating activities
|
1,409.8
|
|
935.5
|
|
1,260.2
|
|
|||||
|
Cash Flows from Investing Activities
|
|||||||||||
|
Capital expenditures
|
(954.5
|
)
|
(820.1
|
)
|
(843.1
|
)
|
|||||
|
Purchases of available-for-sale securities - restricted
|
(534.5
|
)
|
(1,676.3
|
)
|
(1,659.4
|
)
|
|||||
|
Proceeds from sale of available-for-sale securities - restricted
|
518.8
|
|
1,658.1
|
|
1,029.3
|
|
|||||
|
Proceeds from sale of assets
|
12.6
|
|
300.7
|
|
0.9
|
|
|||||
|
Acquisition, net of cash acquired
|
(985.3
|
)
|
—
|
|
—
|
|
|||||
|
Investments in nonconsolidated companies
|
—
|
|
(62.5
|
)
|
(244.0
|
)
|
|||||
|
Investments in consolidated affiliate
|
(1.5
|
)
|
(49.5
|
)
|
(169.0
|
)
|
|||||
|
Other
|
(0.3
|
)
|
(18.2
|
)
|
19.3
|
|
|||||
|
Net cash used in investing activities
|
(1,944.7
|
)
|
(667.8
|
)
|
(1,866.0
|
)
|
|||||
|
Cash Flows from Financing Activities
|
|||||||||||
|
Payments of short-term debt
|
(144.4
|
)
|
(601.4
|
)
|
(421.3
|
)
|
|||||
|
Proceeds from issuance of short-term debt
|
155.1
|
|
631.4
|
|
397.0
|
|
|||||
|
Payments of structured accounts payable arrangements
|
(762.1
|
)
|
(418.5
|
)
|
(792.2
|
)
|
|||||
|
Proceeds from structured accounts payable arrangements
|
834.1
|
|
666.8
|
|
433.6
|
|
|||||
|
Payments of long-term debt
|
(802.9
|
)
|
(102.2
|
)
|
(769.1
|
)
|
|||||
|
Proceeds from issuance of long-term debt
|
39.3
|
|
1,251.4
|
|
720.0
|
|
|||||
|
Payment of financing costs
|
—
|
|
(15.4
|
)
|
—
|
|
|||||
|
Repurchases of stock
|
—
|
|
—
|
|
(75.0
|
)
|
|||||
|
Cash dividends paid
|
(38.5
|
)
|
(210.6
|
)
|
(385.1
|
)
|
|||||
|
Other
|
(5.4
|
)
|
(0.7
|
)
|
3.5
|
|
|||||
|
Net cash (used in) provided by financing activities
|
(724.8
|
)
|
1,200.8
|
|
(888.6
|
)
|
|||||
|
Effect of exchange rate changes on cash
|
(63.7
|
)
|
14.5
|
|
68.8
|
|
|||||
|
Net change in cash, cash equivalents and restricted cash
|
(1,323.4
|
)
|
|
1,483.0
|
|
|
(1,425.6
|
)
|
|||
|
Cash, cash equivalents and restricted cash—beginning of period
|
2,194.4
|
|
711.4
|
|
2,137.0
|
|
|||||
|
Cash, cash equivalents and restricted cash—end of period
|
$
|
871.0
|
|
|
$
|
2,194.4
|
|
|
$
|
711.4
|
|
See Accompanying Notes to Consolidated Financial Statements
F-42
THE MOSAIC COMPANY
CONSOLIDATED STATEMENTS OF CASH FLOWS (Continued)
(In millions)
|
Years Ended December 31,
|
|||||||||||
|
2018
|
2017
|
2016
|
|||||||||
|
Reconciliation of cash, cash equivalents and restricted cash reported within the consolidated balance sheets to the consolidated statements of cash flows:
|
|||||||||||
|
Cash and cash equivalents
|
$
|
847.7
|
|
$
|
2,153.5
|
|
$
|
673.1
|
|
||
|
Restricted cash in other current assets
|
7.5
|
|
8.3
|
|
7.0
|
|
|||||
|
Restricted cash in other assets
|
15.8
|
|
32.6
|
|
31.3
|
|
|||||
|
Total cash, cash equivalents and restricted cash shown in the statement of cash flows
|
$
|
871.0
|
|
$
|
2,194.4
|
|
$
|
711.4
|
|
||
See Accompanying Notes to Consolidated Financial Statements
F-43
Consolidated Statements of Equity
In millions, except per share data
|
|
|
Dollars
|
||||||||||||||||||||||||
|
|
Shares
|
Mosaic Shareholders
|
||||||||||||||||||||||||
|
|
Common
Stock
|
Common
Stock
|
Capital in
Excess
of Par Value
|
Retained
Earnings
|
Accumulated
Other
Comprehensive
Loss
|
Non-
Controlling
Interests
|
Total
Equity
|
|||||||||||||||||||
|
Balance as of December 31, 2015
|
352.5
|
|
$
|
3.5
|
|
$
|
6.4
|
|
$
|
11,014.8
|
|
$
|
(1,492.9
|
)
|
$
|
33.2
|
|
$
|
9,565.0
|
|
||||||
|
Total comprehensive income (loss)
|
—
|
|
—
|
|
—
|
|
297.8
|
|
180.7
|
|
5.5
|
|
484.0
|
|
||||||||||||
|
Stock option exercises
|
0.5
|
|
—
|
|
3.8
|
|
—
|
|
—
|
|
—
|
|
3.8
|
|
||||||||||||
|
Stock based compensation
|
—
|
|
—
|
|
29.2
|
|
—
|
|
—
|
|
—
|
|
29.2
|
|
||||||||||||
|
Repurchases of stock
|
(2.8
|
)
|
—
|
|
(9.5
|
)
|
(65.5
|
)
|
—
|
|
—
|
|
(75.0
|
)
|
||||||||||||
|
Dividends ($1.10 per share)
|
—
|
|
—
|
|
—
|
|
(383.7
|
)
|
—
|
|
—
|
|
(383.7
|
)
|
||||||||||||
|
Dividends for noncontrolling interests
|
—
|
|
—
|
|
—
|
|
—
|
|
—
|
|
(0.8
|
)
|
(0.8
|
)
|
||||||||||||
|
Balance as of December 31, 2016
|
350.2
|
|
3.5
|
|
29.9
|
|
10,863.4
|
|
(1,312.2
|
)
|
37.9
|
|
9,622.5
|
|
||||||||||||
|
Total comprehensive income (loss)
|
—
|
|
—
|
|
—
|
|
(107.2
|
)
|
250.6
|
|
2.6
|
|
146.0
|
|
||||||||||||
|
Vesting of restricted stock units
|
0.8
|
|
—
|
|
(12.8
|
)
|
—
|
|
—
|
|
—
|
|
(12.8
|
)
|
||||||||||||
|
Stock based compensation
|
—
|
|
—
|
|
27.4
|
|
—
|
|
—
|
|
—
|
|
27.4
|
|
||||||||||||
|
Dividends ($0.35 per share)
|
—
|
|
—
|
|
—
|
|
(125.1
|
)
|
—
|
|
—
|
|
(125.1
|
)
|
||||||||||||
|
Dividends for noncontrolling interests
|
—
|
|
—
|
|
—
|
|
—
|
|
—
|
|
(0.7
|
)
|
(0.7
|
)
|
||||||||||||
|
Distribution to noncontrolling interests
|
—
|
|
—
|
|
—
|
|
—
|
|
—
|
|
(18.2
|
)
|
(18.2
|
)
|
||||||||||||
|
Balance as of December 31, 2017
|
351.0
|
|
3.5
|
|
44.5
|
|
10,631.1
|
|
(1,061.6
|
)
|
21.6
|
|
9,639.1
|
|
||||||||||||
|
Adoption of ASC Topic 606
|
—
|
|
—
|
|
—
|
|
2.7
|
|
—
|
|
—
|
|
2.7
|
|
||||||||||||
|
Total comprehensive income (loss)
|
—
|
|
—
|
|
—
|
|
470.0
|
|
(595.5
|
)
|
(5.3
|
)
|
(130.8
|
)
|
||||||||||||
|
Vesting of restricted stock units
|
0.3
|
|
—
|
|
(3.4
|
)
|
—
|
|
—
|
|
—
|
|
(3.4
|
)
|
||||||||||||
|
Stock based compensation
|
—
|
|
—
|
|
25.1
|
|
—
|
|
—
|
|
—
|
|
25.1
|
|
||||||||||||
|
Acquisition of Vale Fertilizantes
|
34.2
|
|
0.3
|
|
919.7
|
|
—
|
|
—
|
|
—
|
|
920.0
|
|
||||||||||||
|
Dividends ($0.10 per share)
|
—
|
|
—
|
|
—
|
|
(39.1
|
)
|
—
|
|
—
|
|
(39.1
|
)
|
||||||||||||
|
Dividends for noncontrolling interests
|
—
|
|
—
|
|
—
|
|
—
|
|
—
|
|
(0.6
|
)
|
(0.6
|
)
|
||||||||||||
|
Equity from noncontrolling interests
|
—
|
|
—
|
|
—
|
|
—
|
|
—
|
|
191.7
|
|
191.7
|
|
||||||||||||
|
Balance as of December 31, 2018
|
385.5
|
|
$
|
3.8
|
|
$
|
985.9
|
|
$
|
11,064.7
|
|
$
|
(1,657.1
|
)
|
$
|
207.4
|
|
$
|
10,604.7
|
|
||||||
See Accompanying Notes to Consolidated Financial Statements
F-44
Notes to Consolidated Financial Statements
Tables in millions, except per share amounts
1
. ORGANIZATION AND NATURE OF BUSINESS
The Mosaic Company (“
Mosaic
”, and, with its consolidated subsidiaries, “
we
”, “
us
”, “
our
”, or the “
Company
”) produces and markets concentrated phosphate and potash crop nutrients. We conduct our business through wholly and majority owned subsidiaries and businesses in which we own less than a majority or a noncontrolling interest, including consolidated variable interest entities and investments accounted for by the equity method.
On January 8, 2018, we completed our acquisition (the “
Acquisition
”) of Vale Fertilizantes S.A. (now known as Mosaic Fertilizantes P&K S.A. or the “
Acquired Business
”). Upon completion of the Acquisition, we became the leading fertilizer producer and distributor in Brazil. To reflect the fact that our Brazilian business is no longer strictly a distribution business, as well as the significance of our investment in Brazil, we realigned our business segments (the “
Realignment
”). Beginning in the first quarter of 2018, we report the results of the Mosaic Fertilizantes business as a segment, along with our other reportable segments of Phosphates and Potash.
After the Realignment, we are organized into the following business segments:
|
•
|
Our
Phosphates
business segment owns and operates mines and production facilities in Florida which produce concentrated phosphate crop nutrients and phosphate-based animal feed ingredients, and processing plants in Louisiana which produce concentrated phosphate crop nutrients. As part of the Acquisition, we acquired an additional
40%
economic interest in the Miski Mayo Phosphate Mine in Peru, which increased our aggregate interest to
75%
. These results are now consolidated in the Phosphates segment. The Phosphates segment also includes our
25%
interest in the Ma'aden Wa'ad Al Shamal Phosphate Company (the “
MWSPC
”), a joint venture to develop, own and operate integrated phosphate production facilities in the Kingdom of Saudi Arabia. We market approximately
25%
of the MWSPC phosphate production. We recognize our equity in the net earnings or losses relating to MWSPC on a one-quarter lag in our Consolidated Statements of Earnings.
|
|
•
|
Our
Potash
business segment owns and operates potash mines and production facilities in Canada and the U.S. which produce potash-based crop nutrients, animal feed ingredients and industrial products. Potash sales include domestic and international sales. We are a member of Canpotex, Limited (“
Canpotex
”), an export association of Canadian potash producers through which we sell our Canadian potash outside the U.S. and Canada.
|
|
•
|
Our
Mosaic Fertilizantes
business segment includes the assets in Brazil that we acquired in the Acquisition, which include five Brazilian phosphate rock mines, four phosphate chemical plants and a potash mine in Brazil. The segment also includes our legacy distribution business in South America, which consists of sales offices, crop nutrient blending and bagging facilities, port terminals and warehouses in Brazil and Paraguay. We also have a majority interest in Fospar S.A., which owns and operates a single superphosphate granulation plant and a deep-water crop nutrition port and throughput warehouse terminal facility in Brazil.
|
Intersegment eliminations, unrealized mark-to-market gains/losses on derivatives, debt expenses, Streamsong Resort
®
results of operations and the results of our China and India distribution businesses are included within Corporate, Eliminations and Other.
2
. SUMMARY OF SIGNIFICANT ACCOUNTING POLICIES
Statement Presentation and Basis of Consolidation
The accompanying Consolidated Financial Statements have been prepared in accordance with accounting principles generally accepted in the United States of America (“
U.S. GAAP
”). Throughout the Notes to Consolidated Financial Statements, amounts in tables are in millions of dollars except for per share data and as otherwise designated.
The accompanying Consolidated Financial Statements include the accounts of Mosaic and its majority owned subsidiaries. Certain investments in companies in which we do not have control but have the ability to exercise significant influence are accounted for by the equity method.
F-45
Accounting Estimates
Preparation of the Consolidated Financial Statements in conformity with GAAP requires management to make estimates and assumptions that affect the reported amounts of assets and liabilities and disclosure of contingent assets and liabilities at the date of the financial statements and the reported amounts of net sales and expenses during the reporting periods. The most significant estimates made by management relate to the estimates of fair value of acquired assets and liabilities, the recoverability of non-current assets including goodwill, the useful lives and net realizable values of long-lived assets, environmental and reclamation liabilities, including asset retirement obligations (“
ARO
”), the costs of our employee benefit obligations for pension plans and postretirement benefits, income tax-related accounts, including the valuation allowance against deferred income tax assets, inventory valuation and accruals for pending legal and environmental matters. Actual results could differ from these estimates.
Revenue Recognition
We generate revenues primarily by producing and marketing phosphate and potash crop nutrients. Revenue is recognized when control of the product is transferred to the customer, which is generally upon transfer of title to the customer based on the contractual terms of each arrangement. Title is typically transferred to the customer upon shipment of the product. In certain circumstances, which are referred to as final price deferred arrangements, we ship product prior to the establishment of a valid sales contract. In such cases, we retain control of the product and do not recognize revenue until a sales contract has been agreed to with the customer.
Revenue is measured as the amount of consideration we expect to receive in exchange for the transfer of our goods. Our products are generally sold based on market prices prevailing at the time the sales contract is signed or through contracts which are priced at the time of shipment based on a formula. Sales incentives are estimated as earned by the customer and recorded as a reduction of revenue. Shipping and handling costs are included as a component of cost of goods sold.
Non-Income Taxes
We pay Canadian resource taxes consisting of the Potash Production Tax and resource surcharge. The Potash Production Tax is a Saskatchewan provincial tax on potash production and consists of a base payment and a profits tax. In addition to the Canadian resource taxes, royalties are payable to the mineral owners with respect to potash reserves or production of potash. These resource taxes and royalties are recorded in our cost of goods sold. Our Canadian resource tax and royalty expenses were
$198.8 million
,
$142.0 million
and
$121.6 million
during
2018
,
2017
and
2016
, respectively.
We have approximately
$90.4 million
of assets recorded as of
December 31, 2018
related to PIS and Cofins, which is a Brazilian federal value-added tax, and income tax credits mostly earned in 2008 through 2018 that we believe will be realized through paying income taxes, paying other federal taxes, or receiving cash refunds. Should the Brazilian government determine that these are not valid credits upon audit, this could impact our results in such period. We have recorded the PIS and Cofins credits at amounts which we believe are probable of collection. Information regarding PIS and Cofins taxes already audited is included in Note
22
of our Notes to Consolidated Financial Statements.
Foreign Currency Translation
The Company’s reporting currency is the U.S. dollar; however, for operations located in Canada and Brazil, the functional currency is the local currency. Assets and liabilities of these foreign operations are translated to U.S. dollars at exchange rates in effect at the balance sheet date, while income statement accounts and cash flows are translated to U.S. dollars at the average exchange rates for the period. For these operations, translation gains and losses are recorded as a component of accumulated other comprehensive income in equity until the foreign entity is sold or liquidated. Transaction gains and losses result from transactions that are denominated in a currency other than the functional currency of the operation, primarily accounts receivable and intercompany loans in our Canadian entities denominated in U.S. dollars, and accounts payable in Brazil denominated in U.S. dollars. These foreign currency transaction gains and losses are presented separately in the Consolidated Statement of Earnings.
Cash and Cash Equivalents
Cash and cash equivalents include short-term, highly liquid investments with original maturities of
90
days or less, and other highly liquid investments that are payable on demand such as money market accounts, certain certificates of deposit and repurchase agreements. The carrying amount of such cash equivalents approximates their fair value due to the short-term and highly liquid nature of these instruments.
F-46
Concentration of Credit Risk
In the U.S., we sell our products to manufacturers, distributors and retailers, primarily in the Midwest and Southeast. Internationally, our potash products are sold primarily through Canpotex, an export association. A concentration of credit risk arises from our sales and accounts receivable associated with the international sales of potash product through Canpotex. We consider our concentration risk related to the Canpotex receivable to be mitigated by their credit policy, which requires the underlying receivables to be substantially insured or secured by letters of credit. As of
December 31, 2018
, there was an immaterial amount of accounts receivable due from Canpotex, compared to
$37.8 million
of accounts receivable due from Canpotex in
2017
. During
2018
,
2017
, and
2016
, sales to Canpotex were
$820.1 million
,
$700.6 million
and
$604.5 million
, respectively.
Inventories
Inventories of raw materials, work-in-process products, finished goods and operating materials and supplies are stated at the lower of cost or net realizable value. Costs for substantially all inventories are determined using the weighted average cost basis. To determine the cost of inventory, we allocate fixed expense to the costs of production based on the normal capacity, which refers to a range of production levels and is considered the production expected to be achieved over a number of periods or seasons under normal circumstances, taking into account the loss of capacity resulting from planned maintenance. Fixed overhead costs allocated to each unit of production should not increase due to abnormally low production. Those excess costs are recognized as a current period expense. When a production facility is completely shut down temporarily, it is considered “idle”, and all related expenses are charged to cost of goods sold.
Net realizable value of our inventory is defined as forecasted selling prices less reasonably predictable selling costs. Significant management judgment is involved in estimating forecasted selling prices including various demand and supply variables. Examples of demand variables include grain and oilseed prices, stock-to-use ratios and changes in inventories in the crop nutrients distribution channels. Examples of supply variables include forecasted prices of raw materials, such as phosphate rock, sulfur, ammonia, and natural gas, estimated operating rates and industry crop nutrient inventory levels. Results could differ materially if actual selling prices differ materially from forecasted selling prices. Charges for lower of cost or market are recognized in our Consolidated Statements of Earnings in the period when there is evidence of a decline of market value below cost.
Property, Plant and Equipment and Recoverability of Long-Lived Assets
Property, plant and equipment are stated at cost. Costs of significant assets include capitalized interest incurred during the construction and development period. Repairs and maintenance, including planned major maintenance and plant turnaround costs, are expensed when incurred.
Depletion expenses for mining operations, including mineral reserves, are generally determined using the units-of-production method based on estimates of recoverable reserves. Depreciation is computed principally using the straight-line method and units-of-production method over the following useful lives: machinery and equipment
three
to
25
years, and buildings and leasehold improvements
three
to
40
years.
We estimate initial useful lives based on experience and current technology. These estimates may be extended through sustaining capital programs. Factors affecting the fair value of our assets or periods of expected use may also affect the estimated useful lives of our assets and these factors can change. Therefore, we periodically review the estimated remaining lives of our facilities and other significant assets and adjust our depreciation rates prospectively where appropriate.
We have worked extensively to ensure the mechanical integrity of our fixed assets in order to help prolong their useful lives, while helping to improve asset utilization and potential cash preservation. As a result, we completed an in-depth review of our fixed assets and concluded that for certain assets, we would make a change to the units-of-production depreciation method from the straight-line method to better reflect the pattern of consumption of those assets. We also determined the expected lives of certain mining and production equipment and reserves were longer than the previously estimated useful lives used to determine depreciation in our financial statements. As a result, effective January 1, 2017, we changed our estimates of the useful lives and method of determining the depreciation of certain equipment to better reflect the estimated periods during which these assets will remain in service. The effect of this change in estimates reduced depreciation expense, thus increasing operating earnings, by approximately
$65 million
in 2017. Amounts may vary throughout the year due to changes in production levels. As a result of this change and actions taken to prolong asset lives, we expect our maintenance expense to increase in the future.
F-47
Long-lived assets are reviewed for impairment whenever events or changes in circumstances indicate that the carrying amount may not be recoverable. An impairment assessment involves management judgment and estimates of factors such as industry and market conditions, the economic life of the asset, sales volume and prices, inflation, raw materials costs, cost of capital, tax rates and capital spending. The carrying amount of a long-lived asset group is not recoverable if it exceeds the sum of the undiscounted cash flows expected to result from the use and eventual disposition of the asset group. If it is determined that an impairment loss has occurred, the loss is measured as the amount by which the carrying amount of the long-lived asset group exceeds its fair value.
Leases
Leases in which the risk of ownership is retained by the lessor are classified as operating leases. Leases which substantially transfer all of the benefits and risks inherent in ownership to the lessee are classified as capital leases. Assets acquired under capital leases are depreciated on the same basis as property, plant and equipment. Rental payments are expensed on a straight-line basis. Leasehold improvements are depreciated over the depreciable lives of the corresponding fixed assets or the related lease term, whichever is shorter.
Structured Accounts Payable Arrangements
In Brazil, we finance some of our potash-based fertilizer, sulfur, ammonia and other raw material product purchases through third-party financing arrangements. These arrangements provide that the third-party intermediary advance the amount of the scheduled payment to the vendor, less an appropriate discount, at a scheduled payment date and Mosaic makes payment to the third-party intermediary at a later date, stipulated in accordance with the commercial terms negotiated. At December 31,
2018
and
2017
, these structured accounts payable arrangements were
$572.8 million
and
$386.2 million
, respectively.
Contingencies
Accruals for environmental remediation efforts are recorded when costs are probable and can be reasonably estimated. In determining these accruals, we use the most current information available, including similar past experiences, available technology, consultant evaluations, regulations in effect, the timing of remediation and cost-sharing arrangements. Adjustments to accruals, recorded as needed in our Consolidated Statement of Earnings each quarter, are made to reflect changes in and current status of these factors.
We are involved from time to time in claims and legal actions incidental to our operations, both as plaintiff and defendant. We have established what we currently believe to be adequate accruals for pending legal matters. These accruals are established as part of an ongoing worldwide assessment of claims and legal actions that takes into consideration such items as advice of legal counsel, individual developments in court proceedings, changes in the law, changes in business focus, changes in the litigation environment, changes in opponent strategy and tactics, new developments as a result of ongoing discovery, and our experience in defending and settling similar claims. The litigation accruals at any time reflect updated assessments of the then-existing claims and legal actions. The final outcome or potential settlement of litigation matters could differ materially from the accruals which we have established. Legal costs are expensed as incurred.
Pension and Other Postretirement Benefits
Mosaic offers a number of benefit plans that provide pension and other benefits to qualified employees. These plans include defined benefit pension plans, supplemental pension plans, defined contribution plans and other postretirement benefit plans.
We accrue the funded status of our plans, which is representative of our obligations under employee benefit plans and the related costs, net of plan assets measured at fair value. The cost of pensions and other retirement benefits earned by employees is generally determined with the assistance of an actuary using the projected benefit method prorated on service and management’s best estimate of expected plan investment performance, salary escalation, retirement ages of employees and expected healthcare costs.
Additional Accounting Policies
To facilitate a better understanding of our consolidated financial statements we have disclosed the following significant accounting policies (with the exception of those identified above) throughout the following notes, with the related financial disclosures by major caption:
F-48
|
Note
|
Topic
|
Page
|
||
|
7
|
||||
|
9
|
||||
|
10
|
||||
|
12
|
||||
|
13
|
||||
|
14
|
||||
|
15
|
||||
|
16
|
||||
|
20
|
||||
3
. RECENTLY ISSUED ACCOUNTING GUIDANCE
Recently Adopted Accounting Pronouncements
On January 1, 2018, we adopted ASC Topic 606, “Revenue from Contracts with Customers” and related amendments (“new revenue standard”) using the modified retrospective method applied to those revenue contracts which were not completed as of January 1, 2018. See Note
4
of our Notes to Condensed Consolidated Financial Statements for additional information regarding the impacts of the new revenue standard.
In January 2016, the Financial Accounting Standards Board ("FASB") issued guidance
which
addresses certain aspects of recognition, measurement, presentation, and disclosure of financial instruments. This guidance was effective for us beginning January 1, 2018, and did not have a material effect on our consolidated financial statements.
In December 2017, The U.S. Tax Cuts and Jobs Act (“
The Act
”) was enacted, significantly altering U.S. corporate income tax law. The FASB has issued guidance related to the newly enacted corporate income tax law changes enacted in December 2017. As of December 31, 2018, the impacts of The Act have been finalized. See Note
13
of our Notes to Consolidated Financial Statements for additional information regarding the impacts of The Act.
Pronouncements Issued But Not Yet Adopted
In February 2016, the FASB issued guidance which requires recognizing lease assets and lease liabilities on the balance sheet and disclosing key information about leasing arrangements. This guidance, including subsequent amendments, is effective for us beginning January 1, 2019, with early adoption permitted. The provisions of this guidance are to be applied using a modified retrospective approach at either the adoption date or the beginning of the earliest comparative period presented in the financial statements. We will not early adopt this guidance, and have determined that we will utilize certain initial calculational guidance for existing leases provided in the standard for use in the modified retrospective approach. We will apply this guidance as of the adoption date, January 1, 2019. We have largely completed the process of gathering information about our lease arrangements, and evaluating provisions of our leases against the recognition requirements of the new guidance. Additionally, we are implementing an integrated lease information system solution and changes to internal procedures necessary to meet the requirements of the new guidance. Upon adoption of the guidance as of January 1, 2019, we expect to record a right-of-use asset and lease liability related to our operating leases of approximately
$250.0 million
. The accounting for our existing capital leases (now called finance leases) will remain largely unchanged. We continue to asses all potential impacts of the guidance and given normal ongoing business dynamics, preliminary conclusions are subject to change.
4
. REVENUE
Adoption of ASC Topic 606, “Revenue with Customers”
On January 1, 2018, we adopted ASC Topic 606, “Revenue from Contracts with Customers” and related amendments (“new revenue standard”) using the modified retrospective method applied to those revenue contracts which were not completed as of January 1, 2018. We recognized the cumulative effect of initially applying the new revenue standard as a net increase to opening retained earnings of
$2.7 million
, net of tax, as of January 1, 2018, with the impact primarily related to deferred North America revenue at December 31, 2017.
F-49
The comparative information for the years ended December 31, 2017 and 2016 has not been restated and continues to be reported under the accounting standards in effect for those periods. The adoption of the new standard has not had a significant impact on our results of operations on an ongoing basis. The cumulative effects of the changes made to our consolidated January 1, 2018 balance sheet for the adoption of the new revenue standard were as follows (in millions):
|
Balance at
|
Adjustments
|
Balance at
|
|||||||||
|
December 31, 2017
|
upon adoption
|
January 1, 2018
|
|||||||||
|
Balance Sheet
|
|||||||||||
|
Receivables, net
|
$
|
642.6
|
|
$
|
18.2
|
|
$
|
660.8
|
|
||
|
Inventories
|
1,547.2
|
|
(13.3
|
)
|
1,533.9
|
|
|||||
|
Deferred income tax asset
|
254.6
|
|
(1.3
|
)
|
253.3
|
|
|||||
|
Accrued Liabilities
|
754.4
|
|
0.9
|
|
755.3
|
|
|||||
|
Retained earnings
|
10,631.1
|
|
2.7
|
|
10,633.8
|
|
|||||
Revenue Recognition
We generate revenues primarily by producing and marketing phosphate and potash crop nutrients. Revenue is recognized when control of the product is transferred to the customer, which is generally upon transfer of title to the customer based on the contractual terms of each arrangement. Title is typically transferred to the customer upon shipment of the product. In certain circumstances, which are referred to as final price deferred arrangements, we ship product prior to the establishment of a valid sales contract. In such cases, we retain control of the product and do not recognize revenue until a sales contract has been agreed to with the customer.
Revenue is measured as the amount of consideration we expect to receive in exchange for the transfer of our goods. Our products are generally sold based on market prices prevailing at the time the sales contract is signed or through contracts which are priced at the time of shipment based on a formula. Sales incentives are estimated as earned by the customer and recorded as a reduction of revenue. Shipping and handling costs are included as a component of cost of goods sold.
For information regarding sales by product type and by geographic area, see Note
25
of our Notes to Consolidated Financial Statements.
Under the new revenue standard, the timing of revenue recognition is accelerated for certain sales arrangements due to the emphasis on transfer of control rather than risks and rewards. Certain sales where revenue was previously deferred until risk was fully assumed by the customer will now be recognized when the product is shipped. Additionally, the timing of when we record revenue on sales by Canpotex has been impacted by their adoption of new revenue standards. The total impact of adoption on our condensed consolidated statement of earnings and balance sheet was as follows (in millions):
|
For the year ended December 31, 2018
|
|||||||||||||||||||
|
Elimination of Revenue Deferral
|
Canpotex Impact (a)
|
Balances Without New Revenue Standards
|
|||||||||||||||||
|
As Reported
|
Impact
|
||||||||||||||||||
|
Income Statement
|
|||||||||||||||||||
|
Net sales
|
$
|
9,587.3
|
|
$
|
(87.9
|
)
|
$
|
96.4
|
|
$
|
9,595.8
|
|
(8.5
|
)
|
|||||
|
Cost of goods sold
|
8,088.9
|
|
(64.3
|
)
|
54.1
|
|
8,078.7
|
|
10.2
|
|
|||||||||
|
Provision for (benefit from) income taxes
|
77.1
|
|
(2.1
|
)
|
5.8
|
|
80.8
|
|
(3.7
|
)
|
|||||||||
|
Net earnings (loss) attributable to Mosaic
|
470.0
|
|
(21.5
|
)
|
36.5
|
|
485.0
|
|
(15.0
|
)
|
|||||||||
|
Balance Sheet
|
|||||||||||||||||||
|
Receivables, net
|
$
|
838.5
|
|
$
|
(107.3
|
)
|
$
|
96.4
|
|
$
|
827.6
|
|
$
|
10.9
|
|
||||
|
Inventories
|
2,270.2
|
|
48.1
|
|
(42.8
|
)
|
2,275.5
|
|
(5.3
|
)
|
|||||||||
|
Other current assets
|
280.6
|
|
23.5
|
|
—
|
|
304.1
|
|
(23.5
|
)
|
|||||||||
|
Deferred income tax asset
|
343.8
|
|
3.4
|
|
(5.8
|
)
|
341.4
|
|
2.4
|
|
|||||||||
|
Accrued liabilities
|
1,092.5
|
|
(8.1
|
)
|
11.4
|
|
1,095.8
|
|
(3.3
|
)
|
|||||||||
|
Retained earnings
|
11,064.7
|
|
(24.2
|
)
|
36.4
|
|
11,076.9
|
|
(12.2
|
)
|
|||||||||
______________________________
F-50
|
(a)
|
Includes impact from Canpotex's adoption of new revenue standards, resulting in a deferral of approximately
450,000
tonnes as of December 31, 2018.
|
Practical Expedients and Exemptions
We generally expense sales commissions when incurred because the amortization period would have been one year or less. These costs are recorded within sales and marketing expenses.
We have elected to recognize the cost for freight and shipping as an expense in cost of sales, when control over the product has passed to the customer.
5
. OTHER FINANCIAL STATEMENT DATA
The following provides additional information concerning selected balance sheet accounts:
|
|
December 31,
|
||||||
|
(in millions)
|
2018
|
2017
|
|||||
|
Receivables
|
|||||||
|
Trade
|
$
|
703.7
|
|
$
|
563.6
|
|
|
|
Non-trade
|
136.1
|
|
81.3
|
|
|||
|
839.8
|
|
644.9
|
|
||||
|
Less allowance for doubtful accounts
|
1.3
|
|
2.3
|
|
|||
|
$
|
838.5
|
|
$
|
642.6
|
|
||
|
Inventories
|
|||||||
|
Raw materials
|
$
|
147.5
|
|
$
|
37.8
|
|
|
|
Work in process
|
625.5
|
|
349.9
|
|
|||
|
Finished goods
|
1,343.8
|
|
1,035.1
|
|
|||
|
Final price deferred
(a)
|
39.3
|
|
38.6
|
|
|||
|
Operating materials and supplies
|
114.1
|
|
85.8
|
|
|||
|
$
|
2,270.2
|
|
$
|
1,547.2
|
|
||
|
Other current assets
|
|||||||
|
Income and other taxes receivable
|
$
|
149.2
|
|
$
|
141.3
|
|
|
|
Prepaid expenses
|
86.8
|
|
69.0
|
|
|||
|
Other
|
44.6
|
|
62.9
|
|
|||
|
$
|
280.6
|
|
$
|
273.2
|
|
||
|
Other assets
|
|||||||
|
Restricted cash
|
$
|
15.8
|
|
$
|
32.6
|
|
|
|
MRO inventory
|
134.6
|
|
114.8
|
|
|||
|
Marketable securities held in trust - restricted
|
632.3
|
|
628.0
|
|
|||
|
Indemnification asset
|
30.7
|
|
—
|
|
|||
|
Long-term receivable
|
91.7
|
|
—
|
|
|||
|
Other
|
352.7
|
|
492.1
|
|
|||
|
$
|
1,257.8
|
|
$
|
1,267.5
|
|
||
F-51
|
|
December 31,
|
||||||
|
(in millions)
|
2018
|
2017
|
|||||
|
Accrued liabilities
|
|||||||
|
Accrued dividends
|
$
|
11.8
|
|
$
|
12.1
|
|
|
|
Payroll and employee benefits
|
217.5
|
|
159.5
|
|
|||
|
Asset retirement obligations
|
136.3
|
|
98.1
|
|
|||
|
Customer prepayments
|
199.8
|
|
140.4
|
|
|||
|
Accrued income tax
|
65.5
|
|
1.4
|
|
|||
|
Other
|
461.6
|
|
342.9
|
|
|||
|
$
|
1,092.5
|
|
$
|
754.4
|
|
||
|
Other noncurrent liabilities
|
|||||||
|
Asset retirement obligations
|
$
|
1,023.8
|
|
$
|
761.2
|
|
|
|
Accrued pension and postretirement benefits
|
146.3
|
|
53.7
|
|
|||
|
Unrecognized tax benefits
|
33.0
|
|
33.5
|
|
|||
|
Other
|
255.6
|
|
119.4
|
|
|||
|
$
|
1,458.7
|
|
$
|
967.8
|
|
||
______________________________
|
(a)
|
Final price deferred is product that has shipped to customers, but the price has not yet been agreed upon.
|
Interest expense, net was comprised of the following in
2018
,
2017
and
2016
:
|
|
Years Ended December 31,
|
||||||||||
|
(in millions)
|
2018
|
2017
|
2016
|
||||||||
|
Interest income
|
$
|
49.7
|
|
$
|
33.2
|
|
$
|
28.2
|
|
||
|
Less interest expense
|
215.8
|
|
171.3
|
|
140.6
|
|
|||||
|
Interest expense, net
|
$
|
(166.1
|
)
|
$
|
(138.1
|
)
|
$
|
(112.4
|
)
|
||
6
. PROPERTY, PLANT AND EQUIPMENT
Property, plant and equipment consist of the following:
|
|
December 31,
|
||||||
|
(in millions)
|
2018
|
2017
|
|||||
|
Land
|
$
|
321.5
|
|
$
|
245.9
|
|
|
|
Mineral properties and rights
|
4,478.2
|
|
3,540.4
|
|
|||
|
Buildings and leasehold improvements
|
2,760.9
|
|
2,473.0
|
|
|||
|
Machinery and equipment
(a)
|
8,955.7
|
|
7,933.5
|
|
|||
|
Construction in-progress
|
2,164.7
|
|
1,793.0
|
|
|||
|
18,681.0
|
|
15,985.8
|
|
||||
|
Less: accumulated depreciation and depletion
|
6,934.5
|
|
6,274.1
|
|
|||
|
$
|
11,746.5
|
|
$
|
9,711.7
|
|
||
______________________________
|
(a)
|
Includes assets under capital leases of approximately
$340.9 million
and
$345.0 million
as of
December 31, 2018
and
2017
, respectively.
|
Depreciation and depletion expense was
$878.2 million
,
$659.4 million
and
$703.8 million
for
2018
,
2017
and
2016
, respectively. Capitalized interest on major construction projects was
$22.1 million
,
$23.9 million
and
$38.5 million
for
2018
,
2017
and
2016
.
F-52
7
. EARNINGS PER SHARE
The numerator for basic and diluted earnings per share (“EPS”) is net earnings attributable to Mosaic. The denominator for basic EPS is the weighted average number of shares outstanding during the period. The denominator for diluted EPS also includes the weighted average number of additional common shares that would have been outstanding if the dilutive potential common shares had been issued, unless the shares are anti-dilutive.
The following is a reconciliation of the numerator and denominator for the basic and diluted EPS computations:
|
|
Years Ended December 31,
|
||||||||||
|
(in millions)
|
2018
|
2017
|
2016
|
||||||||
|
Net earnings (loss) attributable to Mosaic
|
$
|
470.0
|
|
$
|
(107.2
|
)
|
$
|
297.8
|
|
||
|
Basic weighted average number of shares outstanding attributable to common stockholders
|
384.8
|
|
350.9
|
|
350.4
|
|
|||||
|
Dilutive impact of share-based awards
|
1.6
|
|
—
|
|
1.3
|
|
|||||
|
Diluted weighted average number of shares outstanding
|
386.4
|
|
350.9
|
|
351.7
|
|
|||||
|
Basic net earnings (loss) per share
|
$
|
1.22
|
|
$
|
(0.31
|
)
|
$
|
0.85
|
|
||
|
Diluted net earnings (loss) per share
|
$
|
1.22
|
|
$
|
(0.31
|
)
|
$
|
0.85
|
|
||
A total of
2.0 million
shares for
2018
,
3.5 million
shares for
2017
, and
3.0 million
shares for
2016
of common stock subject to issuance upon exercise of stock options have been excluded from the calculation of diluted EPS because the effect would have been anti-dilutive.
8
. CASH FLOW INFORMATION
Supplemental disclosures of cash paid for interest and income taxes and non-cash investing and financing information is as follows:
|
|
Years Ended December 31,
|
||||||||||
|
(in millions)
|
2018
|
2017
|
2016
|
||||||||
|
Cash paid during the period for:
|
|||||||||||
|
Interest
|
$
|
196.0
|
|
$
|
178.9
|
|
$
|
163.0
|
|
||
|
Less amount capitalized
|
22.1
|
|
23.9
|
|
38.5
|
|
|||||
|
Cash interest, net
|
$
|
173.9
|
|
$
|
155.0
|
|
$
|
124.5
|
|
||
|
Income taxes
|
$
|
(34.2
|
)
|
$
|
(70.1
|
)
|
$
|
(65.4
|
)
|
||
Acquiring or constructing property, plant and equipment by incurring a liability does not result in a cash outflow for us until the liability is paid. In the period the liability is incurred, the change in operating accounts payable on the Consolidated Statements of Cash Flows is adjusted by such amount. In the period the liability is paid, the amount is reflected as a cash outflow from investing activities. The applicable net change in operating accounts payable that was classified to investing activities on the Consolidated Statements of Cash Flows was
$(96.8) million
,
$11.1 million
and
$43.7 million
for
2018
,
2017
, and
2016
respectively.
We accrued
$11.8 million
related to the dividends declared in
2018
that will be paid in
2019
. At
December 31, 2017
and 2016, we had accrued dividends of
$12.1 million
and
$96.3 million
which were paid in
2018
and
2017
, respectively.
On October 24, 2017, a lease financing transaction was completed with respect to an articulated tug and barge unit that is being used to transport ammonia for our operations. As described in more detail in Note
23
, we had provided bridge loans to a consolidated affiliate for construction of the unit, and that entity also received construction loans from a joint venture in which we hold a
50%
interest. Following the application of proceeds from the transaction, all outstanding construction loans to the joint venture entity, together with accrued interest, were repaid.
F-53
We had non cash investing and financing transactions related to assets acquired under capital leases in
2017
of
$267.9 million
. Non cash investing and financing transactions related to assets acquired under capital leases were immaterial in
2018
.
Depreciation, depletion and amortization includes
$878.2 million
,
$659.4 million
, and
$703.8 million
related to depreciation and depletion of property, plant and equipment, and
$5.7 million
,
$6.1 million
, and
$7.4 million
related to amortization of intangible assets for
2018
,
2017
, and
2016
, respectively.
9
. INVESTMENTS IN NON-CONSOLIDATED COMPANIES
We have investments in various international and domestic entities and ventures. The equity method of accounting is applied to such investments when the ownership structure prevents us from exercising a controlling influence over operating and financial policies of the businesses but still allow us to have significant influence. Under this method, our equity in the net earnings or losses of the investments is reflected as equity in net earnings of non-consolidated companies on our Consolidated Statements of Earnings. The effects of material intercompany transactions with these equity method investments are eliminated, including the gross profit on sales to and purchases from our equity-method investments which is deferred until the time of sale to the final third party customer. The cash flow presentation of dividends received from equity method investees is determined by evaluation of the facts, circumstances and nature of the distribution.
A summary of our equity-method investments, which were in operation as of
December 31, 2018
, is as follows:
|
Entity
|
Economic Interest
|
||
|
Gulf Sulphur Services LTD., LLLP
|
50.0
|
%
|
|
|
River Bend Ag, LLC
|
50.0
|
%
|
|
|
IFC S.A.
|
45.0
|
%
|
|
|
MWSPC
|
25.0
|
%
|
|
|
Canpotex
|
36.2
|
%
|
|
The summarized financial information shown below includes all non-consolidated companies carried on the equity method.
|
|
Years Ended December 31,
|
||||||||||
|
(in millions)
|
2018
|
2017
|
2016
|
||||||||
|
Net sales
|
$
|
3,555.6
|
|
$
|
2,871.2
|
|
$
|
2,307.9
|
|
||
|
Net earnings (loss)
|
(5.4
|
)
|
95.3
|
|
11.9
|
|
|||||
|
Mosaic’s share of equity in net earnings (loss)
|
(4.5
|
)
|
16.7
|
|
(15.4
|
)
|
|||||
|
Total assets
|
9,042.9
|
|
8,623.6
|
|
8,665.4
|
|
|||||
|
Total liabilities
|
6,658.2
|
|
5,971.9
|
|
6,310.1
|
|
|||||
|
Mosaic’s share of equity in net assets
|
609.1
|
|
712.8
|
|
651.5
|
|
|||||
The difference between our share of equity in net assets as shown in the above table and the investment in non-consolidated companies as shown on the Consolidated Balance Sheets is mainly due to the July 1, 2016, equity contribution of
$120 million
we made to MWSPC, representing the remaining liability for our portion of mineral rights value transferred to MWSPC from Ma’aden. As of December 31, 2018, MWSPC represented
85%
of the total assets and
80%
of the total liabilities in the table above. MWSPC commenced ammonia operations in late 2016 and, on December 1, 2018, commenced commercial operations of its DAP plant, thereby bringing the entire project to the commercial production phase. We expect DAP production to gradually ramp-up until it reaches
3.0 million
tonnes in annual production capacity which is expected in 2020. In
2018
our loss in net earnings was
$9.5 million
, compared to equity in net earnings of
$32.0 million
in
2017
. MWSPC earnings for the period ended December 31, 2016 were immaterial.
MWSPC owns and operates a mine and two chemical complexes that produce phosphate fertilizers and other downstream phosphates products in the Kingdom of Saudi Arabia. We currently estimate that the cost to develop and construct the integrated phosphate production facilities (the “
Project
”) will approximate
$8.0 billion
when finished, which has been funded primarily through investments by us, Ma’aden and SABIC (together, the “
Project Investors
”), and through borrowing arrangements and other external project financing facilities (“
Funding Facilities
”). The production facilities are expected to
F-54
have a capacity of approximately
3.0 million
tonnes of finished product per year when fully operational. We market approximately
25%
of the production of the joint venture.
On June 30, 2014, MWSPC entered into Funding Facilities with a consortium of
20
financial institutions for a total amount of approximately
$5.0 billion
.
Also on June 30, 2014, in support of the Funding Facilities, we, together with Ma’aden and SABIC, agreed to provide our respective proportionate shares of the funding necessary for MWSPC by:
|
(a)
|
Contributing equity or making shareholder subordinated loans of up to
$2.4 billion
to fund project costs to complete and commission the Project (the “
Equity Commitments
”).
|
|
(b)
|
Through the earlier of Project completion or June 30, 2020, contributing equity, making shareholder subordinated loans or providing bank subordinated loans, to fund cost overruns on the Project (the “
Additional Cost Overrun Commitment
”).
|
|
(c)
|
Through the earlier of Project completion or June 30, 2020, contributing equity, making shareholder loans or providing bank subordinated loans to fund scheduled debt service (excluding accelerated amounts) payable under the Funding Facilities and certain other amounts (such commitment, the “
DSU Commitment
” and such scheduled debt service and other amounts, “
Scheduled Debt Service
”). Our proportionate share of amounts covered by the DSU Commitment is not anticipated to exceed approximately
$200 million
. The fair value of the DSU Commitment at December 31,
2018
is not material.
|
|
(d)
|
From the earlier of the Project completion date or June 30, 2020, to the extent there is a shortfall in the amounts available to pay Scheduled Debt Service, depositing for the payment of Scheduled Debt Service an amount up to the respective amount of certain shareholder tax amounts, and severance fees under MWSPC’s mining license, paid within the prior
36
months by MWSPC on behalf of the Project Investors, if any.
|
In January 2016, MWSPC received approval from the Saudi Industrial Development Fund (“
SIDF
”) for loans in the total amount of approximately
$1.1 billion
for the Project, subject to the finalization of definitive agreements. In 2017, MWSPC entered into definitive agreements with SIDF to draw up to
$560 million
from the total SIDF-approved amount (the “
SIDF Loans
”). In September of 2018, we received communication that SIDF agreed to waive Mosaic's Parent Guarantee. MWSPC received approval to access the remaining SIDF facility of
$506 million
which was subsequently drawn in December 2018. Mosaic continues to have Equity Commitments, the Additional Cost Overrun Commitment and the DSU Commitment in relation to MWSPC project financing.
As of
December 31, 2018
, our cash investment was
$770 million
. We did not make any contributions in 2018 and do not expect future contributions will be needed even though we are contractually obligated to make future cash contributions of approximately
$70 million
.
10
. GOODWILL
Goodwill is carried at cost, not amortized, and represents the excess of the purchase price and related costs over the fair value assigned to the net identifiable assets of a business acquired. We test goodwill for impairment on a quantitative basis at the reporting unit level on an annual basis or upon the occurrence of events that may indicate possible impairment. The test resulted in
no
impairment in the periods presented.
The changes in the carrying amount of goodwill, by reporting unit, as of
December 31, 2018
and
2017
, are as follows:
F-55
|
(in millions)
|
Phosphates
|
Potash
|
Mosaic Fertilizantes
|
Corporate, Eliminations and Other
|
Total
|
|||||||||||||
|
Balance as of December 31, 2016
|
$
|
492.4
|
|
$
|
1,013.6
|
|
$
|
124.9
|
|
$
|
—
|
|
$
|
1,630.9
|
|
|||
|
Foreign currency translation
|
—
|
|
63.3
|
|
(0.6
|
)
|
—
|
|
62.7
|
|
||||||||
|
Balance as of December 31, 2017
|
492.4
|
|
1,076.9
|
|
124.3
|
|
—
|
|
1,693.6
|
|
||||||||
|
Foreign currency translation
|
—
|
|
(76.5
|
)
|
(5.8
|
)
|
—
|
|
(82.3
|
)
|
||||||||
|
Allocation of goodwill due to Realignment
|
—
|
|
—
|
|
(12.1
|
)
|
12.1
|
|
—
|
|
||||||||
|
Goodwill acquired in the Vale acquisition
|
96.2
|
|
—
|
|
—
|
|
—
|
|
96.2
|
|
||||||||
|
Balance as of December 31, 2018
|
$
|
588.6
|
|
$
|
1,000.4
|
|
$
|
106.4
|
|
$
|
12.1
|
|
$
|
1,707.5
|
|
|||
We elected early adoption of ASU 2017-04 effective January 1, 2017, “Intangibles─Goodwill and Other (Topic 350): Simplifying the Test for Goodwill Impairment.” As a result, we removed Step 2 of the goodwill impairment test, which requires a hypothetical purchase price allocation. Goodwill impairment will now be the amount by which a reporting unit’s carrying value exceeds its fair value, not to exceed the carrying amount of goodwill.
In connection with the Realignment and the Acquisition we performed a review of goodwill in the quarter ended March 31, 2018, and no impairment was identified. Based on the proportionate share of business enterprise value (representative of the fair value) we assigned a portion of goodwill to Corporate and Other at that time.
As of October 31, 2018, we performed our annual quantitative assessment. In performing our assessment, we estimated the fair value of each of our reporting units using the income approach, also known as the discounted cash flow (“
DCF
”) method. The income approach utilized the present value of cash flows to estimate fair value. The future cash flows for our reporting units were projected based on our estimates, at that time, for revenue, operating income and other factors (such as working capital and capital expenditures for each reporting unit). To determine if the fair value of each of our reporting units with goodwill exceeded its carrying value, we assumed sales volume growth rates based on our long-term expectations, our internal selling prices and raw material prices for years one through five, which were anchored in projections from CRU International Limited, an independent third party data source. Selling prices and raw material prices for years six and beyond were based on anticipated market growth. The discount rates used in our DCF method were based on a weighted-average cost of capital (“
WACC
”), determined from relevant market comparisons. A terminal value growth rate of
2%
was applied to the final year of the projected period and reflected our estimate of stable growth. We then calculated a present value of the respective cash flows for each reporting unit to arrive at an estimate of fair value under the income approach. Finally, we compared our estimates of fair values for our reporting units, to our October 31, 2017 total public market capitalization, based on our common stock price at that date.
In making this assessment, we considered, among other things, expectations of projected net sales and cash flows, assumptions impacting the WACC, changes in our stock price and changes in the carrying values of our reporting units with goodwill. We also considered overall business conditions. Based on our
2018
annual impairment test, no reporting units were considered at risk of impairment.
Based on our quantitative evaluation at October 31, 2018, we determined that our Potash reporting unit had an estimated fair value that was not in significant excess of its carrying value. As a result, we concluded that the goodwill assigned to the Potash reporting unit was not impaired, but could be at risk of future impairment. We continue to believe that our long-term financial goals will be achieved. As a result of our analysis, we did not take a goodwill impairment charge.
The Phosphates, Mosaic Fertilizantes, and Corporate, Eliminations and Other reporting units were evaluated and not considered at risk of goodwill impairment at October 31, 2018.
Assessing the potential impairment of goodwill involves certain assumptions and estimates in our model that are highly sensitive and include inherent uncertainties that are often interdependent and do not change in isolation such as product prices, raw material costs, WACC, and terminal value growth rate. If any of these are different from our assumptions, future tests may indicate an impairment of goodwill, which would result in non-cash charges, adversely affecting our results of operations.
Of the factors discussed above, WACC is more sensitive than others. Assuming that all other components of our fair value estimate remain unchanged, a change in the WACC would have the following effect on estimated fair values in excess of carrying values:
F-56
|
Sensitivity Analysis - Percent of Fair Values in Excess of Carrying Values
|
||||||||||
|
|
|
Excess at Current WACC
|
|
WACC Decreased by 50 Basis Points
|
WACC Decreased by 25 Basis Points
|
WACC Increased by 25 Basis Points
|
|
WACC Increased by 50 Basis Points
|
||
|
Potash Reporting Unit
|
|
18.0%
|
|
24.5%
|
21.3%
|
14.7%
|
|
11.3%
|
||
As of
December 31, 2018
,
$153.9 million
of goodwill was tax deductible.
11
. FINANCING ARRANGEMENTS
Mosaic Credit Facility
On November 18, 2016, we entered into a new unsecured
five
-year credit facility of up to
$2.72 billion
(the “
Mosaic Credit Facility
”), which includes a
$2.0 billion
revolving credit facility and a
$720 million
term loan facility (the “
Term Loan Facility
”). The Mosaic Credit Facility is intended to serve as our primary senior unsecured bank credit facility. It increased, extended and replaced our prior unsecured credit facility, which consisted of a revolving facility of up to
$1.5 billion
(the “
Prior Credit Facility
”). Letters of credit outstanding under the Prior Credit Facility in the amount of approximately
$18.3 million
became letters of credit under the Mosaic Credit Facility. The maturity date of the Mosaic Credit Facility, including final maturity of the term loan thereunder, is
November 18, 2021
. The Term Loan Facility is described below under “Long-Term Debt, including Current Maturities.”
The Mosaic Credit Facility has cross-default provisions that, in general, provide that a failure to pay principal or interest under any one item of other indebtedness in excess of
$50 million
or
$75 million
for multiple items of other indebtedness, or breach or default under such indebtedness that permits the holders thereof to accelerate the maturity thereof, will result in a cross-default.
The Mosaic Credit Facility requires Mosaic to maintain certain financial ratios, including a ratio of Consolidated Indebtedness to Consolidated Capitalization Ratio (as defined) of no greater than
0.65
to
1.0
as well as a minimum Interest Coverage Ratio (as defined) of not less than
3.0
to
1.0
. We were in compliance with these ratios as of
December 31, 2018
.
The Mosaic Credit Facility also contains other events of default and covenants that limit various matters. These provisions include limitations on indebtedness, liens, investments and acquisitions (other than capital expenditures), certain mergers, certain sales of assets and other matters customary for credit facilities of this nature.
As of
December 31, 2018
, we had outstanding letters of credit that utilized a portion of the amount available for revolving loans under the Mosaic Credit Facility of
$14.3 million
. At
December 31, 2017
, we had outstanding letters of credit of
$15.4 million
. The net available borrowings for revolving loans under the Mosaic Credit Facility as of
December 31, 2018
and
2017
were approximately
$1.99 billion
and
$1.98 billion
, respectively. Unused commitment fees under the Mosaic Credit Facility and Prior Credit Facility accrued at an average annual rate of
0.20%
for
2018
,
0.16%
for
2017
, and
0.13%
for
2016
, generating expenses of
$4.0 million
,
$3.3 million
and
$2.0 million
, respectively.
Short-Term Debt
Short-term debt consists of the revolving credit facility under the Mosaic Credit Facility, under which there were no borrowings as of
December 31, 2018
, and various other short-term borrowings related to our related to our international operations in India, China and Brazil These other short-term borrowings outstanding were
$11.5 million
and
$6.1 million
as of
December 31, 2018
and
2017
, respectively.
We had additional outstanding bilateral letters of credit of
$54.4 million
as of
December 31, 2018
, which includes
$50.0 million
as required by the 2015 Consent Decrees as described further in Note
14
of our Consolidated Financial Statements.
Long-Term Debt, including Current Maturities
On November 13, 2017, we issued new senior notes consisting of
$550 million
aggregate principal amount of
3.250%
senior notes due 2022 and
$700 million
aggregate principal amount of
4.050%
senior notes due 2027 (collectively, the “
Senior Notes of 2017
”). Proceeds from the Senior Notes of 2017 were used to fund the cash portion of the purchase price of the
F-57
Acquisition paid at closing, transactions costs and expenses, and to fund a portion of the prepayment of the Term Loan Facility.
The Mosaic Credit Facility included the Term Loan Facility, under which we borrowed
$720 million
. The proceeds were used to prepay a prior term loan facility. In 2018, we prepaid the outstanding balance of
$684 million
under the Term Loan Facility, without premium or penalty.
We have additional senior notes outstanding, consisting of (i)
$900 million
aggregate principal amount of
4.25%
senior notes due 2023,
$500 million
aggregate principal amount of
5.45%
senior notes due 2033, and
$600 million
aggregate principal amount of
5.625%
senior notes due 2043 (collectively, the “
Senior Notes of 2013
”); and (ii)
$450 million
aggregate principal amount of
3.750%
senior notes due 2021 and
$300 million
aggregate principal amount of
4.875%
senior notes due 2041 (collectively, the “
Senior Notes of 2011
”).
The Senior Notes of 2011, the Senior Notes of 2013 and the Senior Notes of 2017 are Mosaic’s senior unsecured obligations and rank equally in right of payment with Mosaic’s existing and future senior unsecured indebtedness. The indenture governing these notes contains restrictive covenants limiting debt secured by liens, sale and leaseback transactions and mergers, consolidations and sales of substantially all assets, as well as other events of default.
Two debentures issued by Mosaic Global Holdings, Inc., one of our consolidated subsidiaries, the first due in 2018 (the “
2018 Debentures
”), was paid off on the maturity date of August 1, 2018, and the second due in 2028 (the “
2028 Debentures
”), remains outstanding with balance of
$147.1 million
, as of
December 31, 2018
. The indentures governing the 2028 Debentures also contain restrictive covenants limiting debt secured by liens, sale and leaseback transactions and mergers, consolidations and sales of substantially all assets, as well as events of default. The obligations under the 2028 Debentures are guaranteed by the Company and several of its subsidiaries.
Long-term debt primarily consists of unsecured notes, term loans, capital leases, unsecured debentures and secured notes. Long-term debt as of
December 31, 2018
and
2017
, respectively, consisted of the following:
|
(in millions)
|
December 31, 2018
Stated Interest Rate |
December 31, 2018
Effective Interest Rate |
Maturity Date
|
December 31, 2018
Stated Value |
Combination Fair
Market
Value Adjustment
|
Discount on Notes Issuance
|
December 31, 2018
Carrying Value |
December 31, 2017
Stated Value |
Combination Fair
Market
Value Adjustment
|
Discount on Notes Issuance
|
December 31, 2017
Carrying Value |
|||||||||||||||||||||||||||
|
Unsecured notes
|
3.25% -
5.63%
|
5.01%
|
2021-
2043
|
$
|
4,000.0
|
|
$
|
—
|
|
$
|
(7.3
|
)
|
$
|
3,992.7
|
|
$
|
4,000.0
|
|
$
|
—
|
|
$
|
(8.5
|
)
|
$
|
3,991.5
|
|
|||||||||||
|
Unsecured debentures
|
7.30%
|
7.19%
|
2028
|
147.1
|
|
1.1
|
|
—
|
|
148.2
|
|
236.1
|
|
1.4
|
|
—
|
|
237.5
|
|
|||||||||||||||||||
|
Term loan
(a)
|
Libor plus 1.25%
|
Variable
|
2021
|
—
|
|
—
|
|
—
|
|
—
|
|
684.0
|
|
—
|
|
—
|
|
684.0
|
|
|||||||||||||||||||
|
Capital leases
|
2.24% -
19.95% |
4.00%
|
2019-
2030 |
302.2
|
|
—
|
|
—
|
|
302.2
|
|
326.6
|
|
—
|
|
—
|
|
326.6
|
|
|||||||||||||||||||
|
Other
(b)
|
2.50% -
9.98%
|
7.98%
|
2021-
2026
|
58.0
|
|
16.4
|
|
—
|
|
74.4
|
|
(18.0
|
)
|
—
|
|
—
|
|
(18.0
|
)
|
|||||||||||||||||||
|
Total long-term debt
|
4,507.3
|
|
|
17.5
|
|
|
(7.3
|
)
|
|
4,517.5
|
|
|
5,228.7
|
|
|
1.4
|
|
|
(8.5
|
)
|
|
5,221.6
|
|
|||||||||||||||
|
Less current portion
|
24.7
|
|
2.3
|
|
(1.0
|
)
|
26.0
|
|
344.2
|
|
0.4
|
|
(1.1
|
)
|
343.5
|
|
||||||||||||||||||||||
|
Total long-term debt, less current maturities
|
$
|
4,482.6
|
|
|
$
|
15.2
|
|
|
$
|
(6.3
|
)
|
|
$
|
4,491.5
|
|
|
$
|
4,884.5
|
|
|
$
|
1.0
|
|
|
$
|
(7.4
|
)
|
|
$
|
4,878.1
|
|
|||||||
______________________________
|
(a)
|
Term loan facility is pre-payable.
|
|
(b)
|
Includes deferred financing fees related to our long term debt.
|
Scheduled maturities of long-term debt are as follows for the periods ending December 31:
F-58
|
(in millions)
|
|
||
|
2019
|
$
|
26.0
|
|
|
2020
|
39.2
|
|
|
|
2021
|
485.8
|
|
|
|
2022
|
580.4
|
|
|
|
2023
|
962.8
|
|
|
|
Thereafter
|
2,423.3
|
|
|
|
Total
|
$
|
4,517.5
|
|
12
. MARKETABLE SECURITIES HELD IN TRUSTS
In August 2016, Mosaic deposited
$630 million
into two trust funds (together, the “
RCRA
Trusts
”) created to provide additional financial assurance in the form of cash for the estimated costs (“
Gypstack Closure Costs
”) of closure and long-term care of our Florida and Louisiana phosphogypsum management systems (“
Gypstacks
”), as described further in Note
14
of our Notes to Consolidated Financial Statements. Our actual Gypstack Closure Costs are generally expected to be paid by us in the normal course of our Phosphate business; however, funds held in each of the RCRA Trusts can be drawn by the applicable governmental authority in the event we cannot perform our closure and long term care obligations. When our estimated Gypstack Closure Costs with respect to the facilities associated with a RCRA Trust are sufficiently lower than the amount on deposit in that RCRA Trust, we have the right to request that the excess funds be released to us. The same is true for the RCRA Trust balance remaining after the completion of our obligations, which will be performed over a period that may not end until
three
decades or more after a Gypstack has been closed. The investments held by the RCRA Trusts are managed by independent investment managers with discretion to buy, sell, and invest pursuant to the objectives and standards set forth in the related trust agreements. Amounts reserved to be held or held in the RCRA Trusts (including losses or reinvested earnings) are included in other assets on our Condensed Consolidated Balance Sheets.
The RCRA Trusts hold investments, which are restricted from our general use, in marketable debt securities classified as available-for-sale and are carried at fair value. As a result, unrealized gains and losses are included in other comprehensive income until realized, unless it is determined that the carrying value of an investment is impaired on an other-than-temporary basis. There were
no
other-than-temporary impairment write-downs on available-for-sale securities during the year ended
December 31, 2018
.
We review the fair value hierarchy classification on a quarterly basis. Changes in the ability to observe valuation inputs may result in a reclassification of levels for certain securities within the fair value hierarchy. We determine the fair market values of our available-for-sale securities and certain other assets based on the fair value hierarchy described below:
Level 1: Values based on unadjusted quoted prices in active markets that are accessible at the measurement date for identical assets or liabilities.
Level 2: Values based on quoted prices for similar instruments in active markets, quoted prices for identical or similar instruments in markets that are not active, or model-based valuation techniques for which all significant assumptions are observable in the market.
Level 3: Values generated from model-based techniques that use significant assumptions not observable in the market. These unobservable assumptions reflect our own estimates of assumptions that market participants would use in pricing the asset or liability. Valuation techniques include use of option pricing models, discounted cash flow models and similar techniques.
The estimated fair value of the investments in the RCRA Trusts is as of
December 31, 2018
and
December 31, 2017
are as follows:
F-59
|
December 31, 2018
|
|||||||||||||||
|
Amortized
Cost
|
Gross
Unrealized
Gains
|
Gross
Unrealized
Losses
|
Fair
Value
|
||||||||||||
|
Level 1
|
|||||||||||||||
|
Cash and cash equivalents
|
$
|
4.0
|
|
$
|
—
|
|
$
|
—
|
|
$
|
4.0
|
|
|||
|
Level 2
|
|||||||||||||||
|
Corporate debt securities
|
180.8
|
|
0.3
|
|
(4.3
|
)
|
176.8
|
|
|||||||
|
Municipal bonds
|
186.1
|
|
0.5
|
|
(3.4
|
)
|
183.2
|
|
|||||||
|
U.S. government bonds
|
262.1
|
|
3.3
|
|
—
|
|
265.4
|
|
|||||||
|
Total
|
$
|
633.0
|
|
$
|
4.1
|
|
$
|
(7.7
|
)
|
$
|
629.4
|
|
|||
|
December 31, 2017
|
|||||||||||||||
|
Amortized
Cost
|
Gross
Unrealized
Gains
|
Gross
Unrealized
Losses
|
Fair
Value
|
||||||||||||
|
Level 1
|
|||||||||||||||
|
Cash and cash equivalents
|
$
|
1.2
|
|
$
|
—
|
|
$
|
—
|
|
$
|
1.2
|
|
|||
|
Level 2
|
|||||||||||||||
|
Corporate debt securities
|
186.1
|
|
0.4
|
|
(2.2
|
)
|
184.3
|
|
|||||||
|
Municipal bonds
|
184.5
|
|
0.5
|
|
(2.7
|
)
|
182.3
|
|
|||||||
|
U.S. government bonds
|
261.7
|
|
—
|
|
(4.4
|
)
|
257.3
|
|
|||||||
|
Total
|
$
|
633.5
|
|
$
|
0.9
|
|
$
|
(9.3
|
)
|
$
|
625.1
|
|
|||
The following tables show gross unrealized losses and fair values of the RCRA Trusts’ available-for-sale securities that have been in a continuous unrealized loss position deemed to be temporary as of
December 31, 2018
and
December 31, 2017
.
|
December 31, 2018
|
December 31, 2017
|
||||||||||||||
|
Less than 12 months
|
Less than 12 months
|
||||||||||||||
|
Fair
Value
|
Gross
Unrealized
Losses
(a)
|
Fair
Value
|
Gross
Unrealized
Losses
(a)
|
||||||||||||
|
Corporate debt securities
|
$
|
43.9
|
|
$
|
(0.6
|
)
|
$
|
44.3
|
|
$
|
(0.3
|
)
|
|||
|
Municipal bonds
|
12.3
|
|
—
|
|
64.5
|
|
(0.5
|
)
|
|||||||
|
U.S. government bonds
|
—
|
|
—
|
|
255.0
|
|
(4.4
|
)
|
|||||||
|
Total
|
$
|
56.2
|
|
$
|
(0.6
|
)
|
$
|
363.8
|
|
$
|
(5.2
|
)
|
|||
|
December 31, 2018
|
December 31, 2017
|
||||||||||||||
|
Greater than 12 months
|
Greater than 12 months
|
||||||||||||||
|
Fair
Value
|
Gross
Unrealized
Losses
(a)
|
Fair
Value
|
Gross
Unrealized
Losses
(a)
|
||||||||||||
|
Corporate debt securities
|
$
|
103.4
|
|
$
|
(3.7
|
)
|
$
|
100.4
|
|
$
|
(1.9
|
)
|
|||
|
Municipal bonds
|
117.5
|
|
(3.4
|
)
|
83.3
|
|
(2.2
|
)
|
|||||||
|
U.S. government bonds
|
—
|
|
—
|
|
—
|
|
—
|
|
|||||||
|
Total
|
$
|
220.9
|
|
$
|
(7.1
|
)
|
$
|
183.7
|
|
$
|
(4.1
|
)
|
|||
______________________________
|
(a)
|
Represents the aggregate of the gross unrealized losses that have been in a continuous unrealized loss position as of
December 31, 2018
and
December 31, 2017
.
|
F-60
The following table summarizes the balance by contractual maturity of the available-for-sale debt securities invested by the RCRA Trusts as of
December 31, 2018
. Actual maturities may differ from contractual maturities because the issuers of the securities may have the right to prepay obligations before the underlying contracts mature.
|
December 31, 2018
|
|||
|
Due in one year or less
|
$
|
37.3
|
|
|
Due after one year through five years
|
148.8
|
|
|
|
Due after five years through ten years
|
407.0
|
|
|
|
Due after ten years
|
32.3
|
|
|
|
Total debt securities
|
$
|
625.4
|
|
For the twelve months ended
December 31, 2018
realized gains and (losses), were
$0.3 million
and
$(13.5) million
, respectively. For the twelve months ended
December 31, 2017
, realized gains and (losses) were
$4.7 million
and
$(3.5) million
, respectively.
13
. INCOME TAXES
In preparing our Consolidated Financial Statements, we utilize the asset and liability approach in accounting for income taxes. We recognize income taxes in each of the jurisdictions in which we have a presence. For each jurisdiction, we estimate the actual amount of income taxes currently payable or receivable, as well as deferred income tax assets and liabilities attributable to temporary differences between the financial statement carrying amounts of existing assets and liabilities and their respective tax bases. Deferred income tax assets and liabilities are measured using enacted tax rates expected to apply to taxable income in the years in which these temporary differences are expected to be recovered or settled. The effect on deferred tax assets and liabilities of a change in tax rates is recognized in income in the period that includes the enactment date.
The provision for income taxes for
2018
,
2017
and
2016
, consisted of the following:
|
|
Years Ended December 31,
|
||||||||||
|
(in millions)
|
2018
|
2017
|
2016
|
||||||||
|
Current:
|
|||||||||||
|
Federal
|
$
|
24.5
|
|
$
|
(167.6
|
)
|
$
|
(41.7
|
)
|
||
|
State
|
1.8
|
|
14.9
|
|
(15.9
|
)
|
|||||
|
Non-U.S.
|
147.2
|
|
31.0
|
|
94.9
|
|
|||||
|
Total current
|
173.5
|
|
(121.7
|
)
|
37.3
|
|
|||||
|
Deferred:
|
|||||||||||
|
Federal
|
(105.1
|
)
|
602.3
|
|
(147.9
|
)
|
|||||
|
State
|
9.9
|
|
(39.9
|
)
|
3.9
|
|
|||||
|
Non-U.S.
|
(1.2
|
)
|
54.2
|
|
32.5
|
|
|||||
|
Total deferred
|
(96.4
|
)
|
616.6
|
|
(111.5
|
)
|
|||||
|
(Benefit from) provision for income taxes
|
$
|
77.1
|
|
$
|
494.9
|
|
$
|
(74.2
|
)
|
||
F-61
The components of earnings from consolidated companies before income taxes, and the effects of significant adjustments to tax computed at the federal statutory rate, were as follows:
|
|
Years Ended December 31,
|
||||||||||
|
(in millions)
|
2018
|
2017
|
2016
|
||||||||
|
United States earnings (loss)
|
$
|
322.7
|
|
$
|
(82.5
|
)
|
$
|
(96.4
|
)
|
||
|
Non-U.S. earnings
|
228.8
|
|
456.5
|
|
338.8
|
|
|||||
|
Earnings from consolidated companies before income taxes
|
$
|
551.5
|
|
$
|
374.0
|
|
$
|
242.4
|
|
||
|
Computed tax at the U.S. federal statutory rate
|
21.0
|
%
|
35.0
|
%
|
35.0
|
%
|
|||||
|
State and local income taxes, net of federal income tax benefit
|
2.0
|
%
|
(0.1
|
)%
|
(6.1
|
)%
|
|||||
|
Percentage depletion in excess of basis
|
(6.7
|
)%
|
(13.2
|
)%
|
(34.4
|
)%
|
|||||
|
Impact of non-U.S. earnings
|
11.8
|
%
|
(46.9
|
)%
|
(4.0
|
)%
|
|||||
|
Change in valuation allowance
|
(15.2
|
)%
|
148.8
|
%
|
7.7
|
%
|
|||||
|
Resolution of uncertain tax positions
|
(0.4
|
)%
|
—
|
%
|
(34.9
|
)%
|
|||||
|
Share-based excess cost/(benefits)
|
0.7
|
%
|
2.0
|
%
|
2.2
|
%
|
|||||
|
Other items (none in excess of 5% of computed tax)
|
0.8
|
%
|
6.7
|
%
|
3.9
|
%
|
|||||
|
Effective tax rate
|
14.0
|
%
|
132.3
|
%
|
(30.6
|
)%
|
|||||
2018 Effective Tax Rate
In the year ended December 31, 2018, there were three types of items impacting the effective tax rate; 1) items attributable to ordinary business operations during the year, 2) other items specific to the period, and 3) impacts recorded due to the U.S. Tax Cuts and Jobs Act (“
The Act
”).
The tax impact of our ordinary business operations is impacted by the mix of earnings across jurisdictions in which we operate, by a benefit associated with depletion, changes in valuation allowances and by the impact of certain entities being taxed in both their foreign jurisdiction and the U.S., including foreign tax credits for various taxes incurred.
Tax expense specific to the period included a cost of
$0.7 million
. This relates to various items including: a benefit of
($30.6) million
related to revised valuation allowances on foreign tax credits, a
$12.2 million
cost as a result of revisions to the provisional estimates related to The Act, a
$15.0 million
cost for withholding taxes related to undistributed earnings, a cost of
$11.7 million
for valuation allowances in foreign jurisdictions, a benefit of
($8.6) million
related to release of the sequestration on future AMT refunds, and other miscellaneous benefits of
$1.0 million
.
Impacts of the Tax Cuts and Jobs Act
On December 22, 2017, The Act was enacted, significantly altering U.S. corporate income tax law. The SEC issued Staff Accounting Bulletin 118, which allows companies to record reasonable estimates of enactment impacts where the underlying analysis and calculations are not yet complete (“
Provisional Estimates
”). The Provisional Estimates must be finalized within a one-year measurement period. In the period ending December 31, 2017, we recorded Provisional Estimates of the impact of The Act of
$457.5 million
related to several key changes in the law. As of December 31, 2018, the impacts of The Act have been finalized. All future impacts of future issued guidance will be appropriately accounted for in the period in which the law is enacted.
The Act imposed a one-time tax on “deemed” repatriation of foreign subsidiaries’ earnings and profits. The repatriation resulted in an estimated non-cash charge of
$107.7 million
. The charge was offset by a
$202.6 million
, non-cash reduction in the deferred tax liability related to certain undistributed earnings. Both of these items were recorded in the period ending December 31, 2017. The December 31, 2017 provisional estimates have been revised and finalized in the period ending December 31, 2018 resulting in an additional benefit of
$9.0 million
of which a cost of
$12.2 million
is included in the tax expense specific to the period and a benefit of
$21.2 million
is included in the annual effective tax rate. However, the benefit of
$21.2 million
results from certain provisions of The Act that pertain to the repatriation that, based on proposed guidance from the U.S. Internal Revenue Service, we anticipate could reverse when the regulations are finalized.
F-62
As of December 31, 2017, we recognized a
$2.3 million
non-cash, deferred tax benefit related to the reduction of the U.S. federal rate from
35 percent
to
21 percent
.
The Act significantly modified the U.S. taxation of foreign earnings and the treatment of the related foreign tax credits. In December 2017, as a result of these changes, we recorded valuation allowances against our foreign tax credits and our anticipatory foreign tax credits of
$105.8 million
and
$440.3 million
, respectively. As of December 2018, we concluded that the foreign tax credits would more likely than not be utilized and the related valuation allowance of
$105.8 million
was reversed as a benefit. This benefit arose due to both revisions in the estimated impact of The Act and estimates with respect to future forecasted income. Of the
$105.8 million
benefit,
$30.6 million
was recorded as tax benefit specific to the period.
As of December 31, 2018, we have recorded a valuation allowance recorded against U.S. branch basket foreign tax credits of
$156.8 million
and anticipatory foreign tax credits of
$361.6 million
.
The Act repeals the corporate alternative minimum tax, or AMT, system and allows for the cash refund of excess AMT credits. As of December 31, 2017, the refundable AMT amounts were subject to a set of federal budgeting rules where a certain portion of the refundable amount would permanently be disallowed (the
“Sequestration Rules”
). We estimated that we would receive a cash refund of
$121.5 million
net of an
$8.6 million
charge related to the Sequestration Rules. In 2018, guidance was released that concluded that the Sequestration Rules do not apply to AMT credits related to The Act. As of December 31, 2018, we estimate that we will receive a cash refund of
$100.4 million
and the sequestration charge of
$8.6 million
recorded at December 31, 2017 has been reversed. The estimated refundable alternative minimum tax credit was included in other non-current assets at both December 31, 2018 and December 31, 2017.
The Act introduced a new category of taxable income called global intangible low-taxed income (
“GILTI”
). No provisional estimates were recorded as of December 31, 2017 for the impacts of GILTI since we had not completed our full analysis of that provision of The Act. We have included GILTI in our December 31, 2018 provision for income taxes, which did not have a material impact to the Company for the current year. We have elected an accounting policy to record any GILTI liabilities as period costs.
2017 Effective Tax Rate
In the year ended December 31, 2017, there were three types of items impacting the effective tax rate; 1) items attributable to ordinary business operations during the year, 2) other items specific to the period, and 3) impacts recorded due to the enactment of the U.S. Tax Cuts and Jobs Act.
The tax impact of our ordinary business operations is impacted by the mix of earnings across jurisdictions in which we operate, by a benefit associated with depletion, and by the impact of certain entities being taxed in both their foreign jurisdiction and the U.S., including foreign tax credits for various taxes incurred.
Tax expense specific to the period included a cost of
$15.1 million
related to a
$10.4 million
pre-tax charge resulting from the resolution of a royalty matter with the government of Saskatchewan and related royalty impacts, a
$7.5 million
cost related to share-based compensation, and an expense of
$6.7 million
related to the effect on deferred income tax liabilities of an increase in the statutory tax rate for one of our equity method investments, offset by a
$14.9 million
U.S. state deferred benefit and other miscellaneous benefits of
$6.1 million
.
2016 Effective Tax Rate
In the year ended December 31, 2016, tax expense specific to the period included a benefit of
$54.2 million
, which includes a domestic benefit of
$85.8 million
related to the resolution of an Advanced Pricing Agreement, which is a tax treaty-based process, partially offset by a
$23.3 million
expense related to distributions from certain non-U.S. subsidiaries and
$8.3 million
of expense primarily related to share-based excess cost.
During 2016, our income tax rate was favorably impacted by the mix of earnings across the jurisdictions in which we operate and by a benefit associated with depletion when compared to the year ended December 31, 2015. Our income tax rate is lower in 2016 compared to 2015 because our deductions are relatively fixed in dollars, while our profitability has been reduced; therefore, the deductions are a larger percentage of income.
F-63
Significant components of our deferred tax liabilities and assets as of December 31 were as follows:
|
|
December 31,
|
||||||
|
(in millions)
|
2018
|
2017
|
|||||
|
Deferred tax liabilities:
|
|||||||
|
Depreciation and amortization
|
$
|
317.3
|
|
$
|
864.2
|
|
|
|
Depletion
|
390.8
|
|
260.9
|
|
|||
|
Partnership tax basis differences
|
64.6
|
|
67.6
|
|
|||
|
Undistributed earnings of non-U.S. subsidiaries
|
15.0
|
|
15.0
|
|
|||
|
Other liabilities
|
10.3
|
|
150.6
|
|
|||
|
Total deferred tax liabilities
|
$
|
798.0
|
|
$
|
1,358.3
|
|
|
|
Deferred tax assets:
|
|||||||
|
Alternative minimum tax credit carryforwards
|
$
|
76.5
|
|
$
|
46.8
|
|
|
|
Capital loss carryforwards
|
3.0
|
|
0.1
|
|
|||
|
Foreign tax credit carryforwards
|
493.5
|
|
322.9
|
|
|||
|
Net operating loss carryforwards
|
408.9
|
|
112.0
|
|
|||
|
Pension plans and other benefits
|
33.4
|
|
2.1
|
|
|||
|
Asset retirement obligations
|
187.6
|
|
174.1
|
|
|||
|
Deferred revenue
|
—
|
|
252.0
|
|
|||
|
Other assets
|
388.8
|
|
169.7
|
|
|||
|
Subtotal
|
1,591.7
|
|
1,079.7
|
|
|||
|
Valuation allowance
|
1,530.5
|
|
584.1
|
|
|||
|
Net deferred tax assets
|
61.2
|
|
495.6
|
|
|||
|
Net deferred tax liabilities
|
$
|
(736.8
|
)
|
$
|
(862.7
|
)
|
|
We have certain entities that are taxed in both their local currency jurisdiction and the U.S. As a result, we have deferred tax balances for both jurisdictions. As of
December 31, 2018
and
2017
, these non-U.S. deferred taxes are offset by approximately
$361.6 million
and
$440.3 million
, respectively, of anticipated foreign tax credits included within our depreciation and depletion components of deferred tax liabilities above. Due to The Act, we have recorded a valuation allowance against the anticipated foreign tax credits of
$361.6 million
and
$440.3 million
for December 31, 2018 and 2017, respectively.
As of
December 31, 2018
, we had estimated carryforwards for tax purposes as follows: alternative minimum tax credits of
$76.5 million
, plus an additional
$100.4 million
of alternative minimum tax credits that we estimate will be refundable due to The Act, net operating losses of
$1,892.5 million
, foreign tax credits of
$493.5 million
and
$2.2 million
of non-U.S. business credits. These carryforward benefits may be subject to limitations imposed by the Internal Revenue Code, and in certain cases, provisions of foreign law. As discussed above, we estimate that
$100.4 million
of the alternative minimum tax credit carryforwards will be refunded while the remaining
$76.5 million
are expected to be utilized to offset future U.S. federal tax liabilities. Approximately
$869.5 million
of our net operating loss carryforwards relate to Brazil and can be carried forward indefinitely but are limited to
30 percent
of taxable income each year. The majority of the remaining net operating loss carryforwards relate to certain U.S. states and can be carried forward for
20
years. Of the
$493.5 million
of foreign tax credits, approximately
$39.3 million
have an expiration date of 2023, approximately
$232.6 million
have an expiration date of 2026, and approximately
$221.6 million
have an expiration date of 2028. The realization of our foreign tax credit carryforwards is dependent on market conditions, tax law changes, and other business outcomes including our ability to generate certain types of taxable income. As a result of changes in U.S. tax law due to The Act, the Company recorded valuation allowances against its branch basket foreign tax credits of
$156.8 million
at December 31, 2018.
The Act imposed a one-time tax on the “deemed” repatriation of foreign subsidiaries’ earnings and profits and establishes an exemption from U.S. tax for future dividends from foreign subsidiaries. As such, we are only subject to withholding tax on the actual repatriation of non-U.S. earnings. As of December 31, 2018, the company has recorded a
$15 million
deferred tax liability associated with the future repatriation of
$300 million
of undistributed earnings of non-U.S. subsidiaries.
F-64
Valuation Allowance
In assessing the need for a valuation allowance, we consider whether it is more likely than not that some portion or all of the deferred tax assets will not be realized. We evaluate our ability to realize the tax benefits associated with deferred tax assets by analyzing the relative impact of all the available positive and negative evidence regarding our forecasted taxable income using both historical and projected future operating results, the reversal of existing taxable temporary differences, taxable income in prior carry-back years (if permitted) and the availability of tax planning strategies. The ultimate realization of deferred tax assets is dependent upon the generation of certain types of future taxable income during the periods in which those temporary differences become deductible. In making this assessment, we consider the scheduled reversal of deferred tax liabilities, our ability to carry back the deferred tax asset, projected future taxable income, and tax planning strategies. A valuation allowance will be recorded in each jurisdiction in which a deferred income tax asset is recorded when it is more likely than not that the deferred income tax asset will not be realized. Changes in deferred tax asset valuation allowances typically impact income tax expense.
For the year ended
December 31, 2018
, the valuation allowance increased by
$945.8 million
, of which
$956.2 million
related to valuation allowances on the Vale acquisition and
$30.7 million
related to changes in the U.S. tax law imposed by The Act. The remaining amount relates to our conclusion that we are not more likely than not to use attributes at other foreign jurisdictions.
For the year ended
December 31, 2017
, the valuation allowance increased by
$553.5 million
, of which
$546.1 million
related to changes in the U.S. tax law imposed by The Act and the remaining amount is due to our conclusion that we are not more likely than not to use attributes at a Netherlands subsidiary.
For the year ended year ended
December 31, 2016
, the valuation allowance increased by
$18.7 million
primarily due to our conclusion that we are not more likely than not to use attributes at a Netherlands subsidiary and certain U.S. states.
Uncertain Tax Positions
Accounting for uncertain income tax positions is determined by prescribing a minimum probability threshold that a tax position must meet before a financial statement benefit is recognized. This minimum threshold is that a tax position is more likely than not to be sustained upon examination by the applicable taxing authority, including resolution of any related appeals or litigation processes, based on the technical merits of the position. The tax benefit to be recognized is measured as the largest amount of benefit that is greater than a fifty percent likelihood of being realized upon ultimate settlement.
As of
December 31, 2018
, we had
$38.1 million
of gross uncertain tax positions. If recognized, the benefit to our effective tax rate in future periods would be approximately
$20.5 million
of that amount. During
2018
, we recorded gross increases in our uncertain tax positions of
$1.2 million
related to certain U.S. and non-U.S. tax matters, of which
$0.7 million
impacted the effective tax rate. This increase was offset by items not included in gross uncertain tax positions.
Based upon the information available as of
December 31, 2018
, it is reasonably possible that the amount of unrecognized tax benefits will change in the next twelve months; however, the change cannot reasonably be estimated.
|
|
Years Ended December 31,
|
||||||||||
|
(in millions)
|
2018
|
2017
|
2016
|
||||||||
|
Gross unrecognized tax benefits, beginning of period
|
$
|
39.3
|
|
$
|
27.1
|
|
$
|
98.6
|
|
||
|
Gross increases:
|
|||||||||||
|
Prior period tax positions
|
0.3
|
|
1.9
|
|
13.5
|
|
|||||
|
Current period tax positions
|
3.8
|
|
8.5
|
|
6.9
|
|
|||||
|
Gross decreases:
|
|||||||||||
|
Prior period tax positions
|
(2.9
|
)
|
—
|
|
(91.6
|
)
|
|||||
|
Currency translation
|
(2.4
|
)
|
1.8
|
|
(0.3
|
)
|
|||||
|
Gross unrecognized tax benefits, end of period
|
$
|
38.1
|
|
$
|
39.3
|
|
$
|
27.1
|
|
||
F-65
We recognize interest and penalties related to unrecognized tax benefits as a component of our income tax expense. Interest and penalties accrued in our Consolidated Balance Sheets as of
December 31, 2018
and
2017
are
$4.9 million
and
$4.1 million
, respectively, and are included in other noncurrent liabilities in the Consolidated Balance Sheets.
We operate in multiple tax jurisdictions, both within the United States and outside the United States, and face audits from various tax authorities regarding transfer pricing, deductibility of certain expenses, and intercompany transactions, as well as other matters. With few exceptions, we are no longer subject to examination for tax years prior to 2012.
Mosaic is continually under audit by various tax authorities in the normal course of business. Such tax authorities may raise issues contrary to positions taken by the Company. If such positions are ultimately not sustained by the Company this could result in material assessments to the Company. The costs related to defending, if needed, such positions on appeal or in court may be material. The Company believes that any issues considered are properly accounted for.
We are currently under audit by the Canada Revenue Agency for the tax years ended May 31, 2012 through December 31, 2014 and 2015. Based on the information available, we do not anticipate significant changes to our unrecognized tax benefits as a result of these examinations other than the amounts discussed above.
14
. ACCOUNTING FOR ASSET RETIREMENT OBLIGATIONS
We recognize our estimated asset retirement obligations (“
AROs
”) in the period in which we have an existing legal obligation associated with the retirement of a tangible long-lived asset, and the amount of the liability can be reasonably estimated. The ARO is recognized at fair value when the liability is incurred with a corresponding increase in the carrying amount of the related long lived asset. We depreciate the tangible asset over its estimated useful life. The liability is adjusted in subsequent periods through accretion expense which represents the increase in the present value of the liability due to the passage of time. Such depreciation and accretion expenses are included in cost of goods sold for operating facilities and other operating expense for indefinitely closed facilities.
Our legal obligations related to asset retirement require us to: (i) reclaim lands disturbed by mining as a condition to receive permits to mine phosphate ore reserves; (ii) treat low pH process water in Gypstacks to neutralize acidity; (iii) close and monitor Gypstacks at our Florida and Louisiana facilities at the end of their useful lives; (iv) remediate certain other conditional obligations; (v) remove all surface structures and equipment, plug and abandon mine shafts, contour and revegetate, as necessary, and monitor for five years after closing our Carlsbad, New Mexico facility and (vi) decommission facilities, manage tailings and execute site reclamation at our Saskatchewan potash mines at the end of their useful lives; (vii) de-commission mines in Brazil and Peru acquired as part of the Acquisition and (viii) de-commission plant sites and close Gypstacks in Brazil, also as part of the Acquisition. The estimated liability for these legal obligations is based on the estimated cost to satisfy the above obligations which is discounted using a credit-adjusted risk-free rate.
A reconciliation of our AROs is as follows:
|
|
Years Ended December 31,
|
||||||
|
(in millions)
|
2018
|
2017
|
|||||
|
AROs, beginning of period
|
$
|
859.3
|
|
$
|
849.9
|
|
|
|
Liabilities acquired in the Acquisition
|
258.9
|
|
—
|
|
|||
|
Liabilities incurred
|
27.8
|
|
27.1
|
|
|||
|
Liabilities settled
|
(69.6
|
)
|
(64.8
|
)
|
|||
|
Accretion expense
|
48.0
|
|
25.7
|
|
|||
|
Revisions in estimated cash flows
|
78.2
|
|
15.7
|
|
|||
|
Foreign currency translation
|
(42.5
|
)
|
5.7
|
|
|||
|
AROs, end of period
|
1,160.1
|
|
859.3
|
|
|||
|
Less current portion
|
136.3
|
|
98.1
|
|
|||
|
$
|
1,023.8
|
|
$
|
761.2
|
|
||
F-66
North America Gypstack Closure Costs
A majority of our ARO relates to Gypstack Closure Costs in Florida and Louisiana. For financial reporting purposes, we recognize our estimated Gypstack Closure Costs at their present value. This present value determined for financial reporting purposes is reflected on our Consolidated Balance Sheets in accrued liabilities and other noncurrent liabilities. As of
December 31, 2018
, and
December 31, 2017
, the present value of our Gypstack Closure Costs ARO reflected in our Consolidated Balance Sheet was approximately
$578.4 million
and
$529.7 million
, respectively.
As discussed below, we have arrangements to provide financial assurance for the estimated Gypstack Closure Costs associated with our facilities in Florida and Louisiana.
EPA RCRA Initiative
. On September 30, 2015, we and our subsidiary, Mosaic Fertilizer, LLC (“
Mosaic Fertilizer
”), reached agreements with the U.S. Environmental Protection Agency (“
EPA
”), the U.S. Department of Justice (“
DOJ
”), the Florida Department of Environmental Protection (“
FDEP
”) and the Louisiana Department of Environmental Quality (“
LDEQ
”) on the terms of two consent decrees (collectively, the “
2015 Consent Decrees
”) to resolve claims relating to our management of certain waste materials onsite at our Riverview, New Wales, Mulberry, Green Bay, South Pierce and Bartow fertilizer manufacturing facilities in Florida and our Faustina and Uncle Sam facilities in Louisiana. This followed a 2003 announcement by the EPA Office of Enforcement and Compliance Assurance that it would be targeting facilities in mineral processing industries, including phosphoric acid producers, for a thorough review under the U.S. Resource Conservation and Recovery Act (“
RCRA
”) and related state laws. As discussed below, a separate consent decree was previously entered into with EPA and the FDEP with respect to RCRA compliance at the Plant City, Florida phosphate concentrates facility (the “
Plant City Facility
”) that we acquired as part of our acquisition (the “
CF Phosphate Assets Acquisition
”) of the Florida phosphate assets and assumption of certain related liabilities of CF Industries, Inc. (“
CF
”).
The remaining monetary obligations under the 2015 Consent Decrees include:
|
•
|
Modification of certain operating practices and undertaking certain capital improvement projects over a period of several years that are expected to result in capital expenditures likely to exceed
$200 million
in the aggregate.
|
|
•
|
Provision of additional financial assurance for the estimated Gypstack Closure Costs for Gypstacks at the covered facilities. The RCRA Trusts are discussed in Note
12
to our Consolidated Financial Statements. In addition, we have agreed to guarantee the difference between the amounts held in each RCRA Trust (including any earnings) and the estimated closure and long-term care costs.
|
As of
December 31, 2018
, the undiscounted amount of our Gypstack Closure Costs
ARO associated with the facilities covered by the 2015 Consent Decrees, determined using the assumptions used for financial reporting purposes, was approximately
$1.5 billion
, and the present value of our Gypstack Closure Costs ARO reflected in our Consolidated Balance Sheet for those facilities was approximately
$457.1 million
.
Plant City and Bonnie Facilities
. As part of the CF Phosphate Assets Acquisition, we assumed certain AROs related to Gypstack Closure Costs at both the Plant City Facility and a closed Florida phosphate concentrates facility in Bartow, Florida (the “
Bonnie Facility
”) that we acquired. Associated with these assets are two related financial assurance arrangements for which we became responsible and that provides sources of funds for the estimated Gypstack Closure Costs for these facilities, pursuant to federal or state law: the government entities can draw against such amounts in the event we cannot perform such closure activities. One was initially a trust (the “
Plant City Trust
”) established to meet the requirements under a consent decree with the EPA and the FDEP with respect to RCRA compliance at Plant City that also satisfied Florida financial assurance requirements at that site. Beginning in September 2016, as a substitute for the financial assurance provided through the Plant City Trust, we have provided financial assurance for Plant City in the form of a surety bond (the “
Plant City Bond
”). The amount of the Plant City Bond is
$233.7 million
, at December 31, 2018, which reflects our closure cost estimates at that date. The other was also a trust fund (the “
Bonnie Facility Trust
”) established to meet the requirements under Florida financial assurance regulations that apply to the Bonnie Facility. On July 27, 2018, we received
$21.0 million
from the Bonnie Facility Trust by substituting the trust fund for a financial test mechanism (“
Bonnie Financial Test
”) supported by a corporate guarantee as allowed by state regulations. Both financial assurance funding obligations require estimates of future expenditures that could be impacted by refinements in scope, technological developments, new information, cost inflation, changes in regulations, discount rates and the timing of activities. Under our current approach to satisfying applicable requirements, additional financial assurance would be required in the future if increases in cost estimates exceed the face amount of the Plant City Bond or the amount supported by the Bonnie Financial Test.
F-67
As of
December 31, 2018
, and
December 31, 2017
, the aggregate amounts of AROs associated with the Plant City Facility and Bonnie Facility gypstack closure costs included in our consolidated balance sheet were
$109.2 million
and
$97.7 million
, respectively. The aggregate amount represented by the Plant City Bond exceeds the aggregate amount of ARO associated with that Facility. This is because the amount of financial assurance we are required to provide represents the aggregate undiscounted estimated amount to be paid by us in the normal course of our Phosphates business over a period that may not end until three decades or more after the Gypstack has been closed, whereas the ARO included in our Consolidated Balance Sheet reflects the discounted present value of those estimated amounts.
15
. ACCOUNTING FOR DERIVATIVE INSTRUMENTS AND HEDGING ACTIVITIES
We periodically enter into derivatives to mitigate our exposure to foreign currency risks, interest rate movements and the effects of changing commodity prices. We record all derivatives on the Consolidated Balance Sheets at fair value. The fair value of these instruments is determined by using quoted market prices, third party comparables, or internal estimates. We net our derivative asset and liability positions when we have a master netting arrangement in place. Changes in the fair value of the foreign currency, commodity and freight derivatives are immediately recognized in earnings. As of
December 31, 2018
, and
2017
, the gross asset position of our derivative instruments was
$13.4 million
and
$15.6 million
, respectively, and the gross liability position of our liability instruments was
$89.4 million
and
$26.7 million
, respectively. Due to the Acquisition, our foreign currency derivatives have increased in 2018.
We do not apply hedge accounting treatments to our foreign currency exchange contracts, commodities contracts, or freight contracts. Unrealized gains and (losses) on foreign currency exchange contracts used to hedge cash flows related to the production of our products are included in cost of goods sold in the Consolidated Statements of Earnings. Unrealized gains and (losses) on commodities contracts and certain forward freight agreements are also recorded in cost of goods sold in the Consolidated Statements of Earnings. Unrealized gains or (losses) on foreign currency exchange contracts used to hedge cash flows that are not related to the production of our products are included in the foreign currency transaction gain/(loss) caption in the Consolidated Statements of Earnings.
We apply fair value hedge accounting treatment to our fixed-to-floating interest rate contracts. Under these arrangements, we agree to exchange, at specified intervals, the difference between fixed and floating interest amounts calculated by reference to an agreed-upon notional principal amount. The mark-to-market of these fair value hedges is recorded as gains or losses in interest expense. These fair value hedges are considered to be highly effective and, thus, as of December 31,
2018
, the impact on earnings due to hedge ineffectiveness was immaterial. Consistent with Mosaic’s intent to have floating rate debt as a portion of its outstanding debt, in December 2016 and the first quarter of 2017, we entered into
four
and
five
, respectively, fixed-to-floating interest rate swap agreements with a total notional amount of
$310.0 million
and
$275.0 million
, respectively, related to our Senior Notes due 2023.
In December 2016, we entered into forward starting interest rate swap agreements to hedge our exposure to changes in future interest rates related to an anticipated debt issuance to fund the cash portion of the Acquisition as described in Note
24
. We did not apply hedge accounting treatment to these contracts, and we used cash to settle our obligation at the time of pricing of the related debt. In November 2017, we completed the debt issuance and settled all of our outstanding pre-issuance interest rate swap agreements. These agreements had a negative impact on pre-tax earnings of approximately
$12 million
for the year ended December 31, 2017.
The following is the total absolute notional volume associated with our outstanding derivative instruments:
|
(in millions of Units)
|
||||||||||
|
Instrument
|
Derivative Category
|
Unit of Measure
|
December 31,
2018 |
December 31,
2017 |
||||||
|
Foreign currency derivatives
|
Foreign Currency
|
US Dollars
|
2,091.7
|
|
813.5
|
|
||||
|
Interest rate derivatives
|
Interest Rate
|
US Dollars
|
585.0
|
|
585.0
|
|
||||
|
Natural gas derivatives
|
Commodity
|
MMbtu
|
52.2
|
|
43.0
|
|
||||
Credit-Risk-Related Contingent Features
Certain of our derivative instruments contain provisions that are governed by International Swap and Derivatives Association agreements with the counterparties. These agreements contain provisions that allow us to settle for the net amount between
F-68
payments and receipts, and also state that if our debt were to be rated below investment grade, certain counterparties to the derivative instruments could request full collateralization on derivative instruments in net liability positions. The aggregate fair value of all derivative instruments with credit-risk-related contingent features that were in a liability position as of
December 31, 2018
, and
2017
was
$37.9 million
and
$15.0 million
, respectively. We have no cash collateral posted in association with these contracts. If the credit-risk-related contingent features underlying these agreements were triggered on
December 31, 2018
, we would have been required to post an additional
$36.8 million
of collateral assets, which are either cash or U.S. Treasury instruments, to the counterparties.
Counterparty Credit Risk
We enter into foreign exchange, certain commodity and interest rate derivatives, primarily with a diversified group of highly rated counterparties. We continually monitor our positions and the credit ratings of the counterparties involved and limit the amount of credit exposure to any one party. While we may be exposed to potential losses due to the credit risk of non-performance by these counterparties, material losses are not anticipated. We closely monitor the credit risk associated with our counterparties and customers and to date have not experienced material losses.
16
. FAIR VALUE MEASUREMENTS
Following is a summary of the valuation techniques for assets and liabilities recorded in our Consolidated Balance Sheets at fair value on a recurring basis:
Foreign Currency Derivatives
—The foreign currency derivative instruments that we currently use are forward contracts and zero-cost collars, which typically expire within
eighteen months
. Most of the valuations are adjusted by a forward yield curve or interest rates. In such cases, these derivative contracts are classified within Level 2. Some valuations are based on exchange-quoted prices, which are classified as Level 1. Changes in the fair market values of these contracts are recognized in the Consolidated Financial Statements as a component of cost of goods sold in our Corporate, Eliminations and Other segment, or foreign currency transaction (gain) loss. As of
December 31, 2018
and
2017
, the gross asset position of our foreign currency derivative instruments was
$13.1 million
and
$15.4 million
, respectively, and the gross liability position of our foreign currency derivative instruments was
$62.2 million
and
$6.5 million
, respectively.
Commodity Derivatives
—The commodity contracts primarily relate to natural gas. The commodity derivative instruments that we currently use are forward purchase contracts, swaps, and three-way collars. The natural gas contracts settle using NYMEX futures or AECO price indexes, which represent fair value at any given time. The contracts’ maturities and settlements are scheduled for future months and settlements are scheduled to coincide with anticipated gas purchases during those future periods. Quoted market prices from NYMEX and AECO are used to determine the fair value of these instruments. These market prices are adjusted by a forward yield curve and are classified within Level 2. Changes in the fair market values of these contracts are recognized in the Consolidated Financial Statements as a component of cost of goods sold in our Corporate, Eliminations and Other segment. As of
December 31, 2018
and
2017
, the gross asset position of our commodity derivative instruments was
$0.3 million
and
$0.1 million
, respectively, and the gross liability position of our commodity derivative instruments was
$17.7 million
and
$17.9 million
, respectively.
Interest Rate Derivatives
—We manage interest expense through interest rate contracts to convert a portion of our fixed-rate debt into floating-rate debt. We also enter into interest rate swap agreements to hedge our exposure to changes in future interest rates related to anticipated debt issuances. Valuations are based on external pricing sources and are classified as Level 2. Changes in the fair market values of these contracts are recognized in the Consolidated Financial Statements as a component of interest expense. As of
December 31, 2018
and
2017
, the gross asset position of our interest rate swap instruments was
zero
and
$0.1 million
, respectively, and the gross liability position of our interest rate swap instruments was
$9.5 million
and
$2.3 million
, respectively.
F-69
Financial Instruments
The carrying amounts and estimated fair values of our financial instruments are as follows:
|
|
December 31,
|
||||||||||||||
|
|
2018
|
2017
|
|||||||||||||
|
|
Carrying
|
Fair
|
Carrying
|
Fair
|
|||||||||||
|
(in millions)
|
Amount
|
Value
|
Amount
|
Value
|
|||||||||||
|
Cash and cash equivalents
|
$
|
847.7
|
|
$
|
847.7
|
|
$
|
2,153.5
|
|
$
|
2,153.5
|
|
|||
|
Accounts receivable
|
838.5
|
|
838.5
|
|
642.6
|
|
642.6
|
|
|||||||
|
Accounts payable
|
780.9
|
|
780.9
|
|
540.9
|
|
540.9
|
|
|||||||
|
Structured accounts payable arrangements
|
572.8
|
|
572.8
|
|
386.2
|
|
386.2
|
|
|||||||
|
Short-term debt
|
11.5
|
|
11.5
|
|
6.1
|
|
6.1
|
|
|||||||
|
Long-term debt, including current portion
|
4,517.5
|
|
4,554.6
|
|
5,221.6
|
|
5,431.8
|
|
|||||||
For cash and cash equivalents, accounts receivable, net, accounts payable, structured accounts payable arrangements and short-term debt, the carrying amount approximates fair value because of the short-term maturity of those instruments. The fair value of long-term debt, including the current portion, is estimated using quoted market prices for the publicly registered notes and debentures, classified as Level 1 and Level 2, respectively, within the fair value hierarchy, depending on the market liquidity of the debt. For information regarding the fair value of our marketable securities held in trusts, see Note
12
of our Notes to Consolidated Financial Statements.
17
. GUARANTEES AND INDEMNITIES
We enter into various contracts that include indemnification and guarantee provisions as a routine part of our business activities. Examples of these contracts include asset purchase and sale agreements, surety bonds, financial assurances to regulatory agencies in connection with reclamation and closure obligations, commodity sale and purchase agreements, and other types of contractual agreements with vendors and other third parties. These agreements indemnify counterparties for matters such as reclamation and closure obligations, tax liabilities, environmental liabilities, litigation and other matters, as well as breaches by Mosaic of representations, warranties and covenants set forth in these agreements. In many cases, we are essentially guaranteeing our own performance, in which case the guarantees do not fall within the scope of the accounting and disclosures requirements under U.S. GAAP.
Our more significant guarantees and indemnities are as follows:
Guarantees to Brazilian Financial Parties.
From time to time, we issue guarantees to financial parties in Brazil for certain amounts owed the institutions by certain customers of Mosaic. The guarantees are for all or part of the customers’ obligations. In the event that the customers default on their payments to the institutions and we would be required to perform under the guarantees, we have in most instances obtained collateral from the customers. We monitor the nonperformance risk of the counterparties and have noted no material concerns regarding their ability to perform on their obligations. The guarantees generally have a one-year term, but may extend up to two years or longer depending on the crop cycle, and we expect to renew many of these guarantees on a rolling twelve-month basis. As of
December 31, 2018
, we have estimated the maximum potential future payment under the guarantees to be
$64.3 million
. The fair value of our guarantees is immaterial to the Consolidated Financial Statements as of
December 31, 2018
and 2017.
Other Indemnities.
Our maximum potential exposure under other indemnification arrangements can range from a specified dollar amount to an unlimited amount, depending on the nature of the transaction. Total maximum potential exposure under these indemnification arrangements is not estimable due to uncertainty as to whether claims will be made or how they will be resolved. We do not believe that we will be required to make any material payments under these indemnity provisions.
Because many of the guarantees and indemnities we issue to third parties do not limit the amount or duration of our obligations to perform under them, there exists a risk that we may have obligations in excess of the amounts described above. For those guarantees and indemnities that do not limit our liability exposure, we may not be able to estimate what our liability would be until a claim is made for payment or performance due to the contingent nature of these arrangements.
F-70
18
. PENSION PLANS AND OTHER BENEFITS
We sponsor pension and postretirement benefits through a variety of plans including defined benefit plans, defined contribution plans, and postretirement benefit plans in North America and certain of our international locations. We reserve the right to amend, modify, or terminate the Mosaic sponsored plans at any time, subject to provisions of the Employee Retirement Income Security Act of 1974 (“
ERISA
”), prior agreements and our collective bargaining agreements.
Defined Benefit
We sponsor various defined benefit pension plans in the U.S. and in Canada. Benefits are based on different combinations of years of service and compensation levels, depending on the plan. Generally, contributions to the U.S. plans are made to meet minimum funding requirements of ERISA, while contributions to Canadian plans are made in accordance with Pension Benefits Acts instituted by the provinces of Saskatchewan and Ontario. Certain employees in the U.S. and Canada, whose pension benefits exceed Internal Revenue Code and Canada Revenue Agency limitations, respectively, are covered by supplementary non-qualified, unfunded pension plans.
We sponsor various defined benefit pension plans in Brazil, and we acquired through the Acquisition, multi-employer pension plans for certain of our Brazil associates. All our pension plans are governed by the Brazilian pension plans regulatory agency, National Superintendence of Supplementary Pensions (“
PREVIC
”). Our Brazil plans are not individually significant to the Company's consolidated financial statements after factoring in the multi-employer pension plan indemnification that we acquired through the Acquisition. We made contributions to these plans, net of indemnification, of
$1.0 million
during the year ended December 31, 2018.
F-71
Accounting for Pension Plans
The year-end status of the North American pension plans was as follows:
|
|
Pension Plans
|
||||||
|
|
Years Ended December 31,
|
||||||
|
(in millions)
|
2018
|
2017
|
|||||
|
Change in projected benefit obligation:
|
|||||||
|
Benefit obligation at beginning of period
|
$
|
766.1
|
|
$
|
713.5
|
|
|
|
Service cost
|
6.2
|
|
5.9
|
|
|||
|
Interest cost
|
24.0
|
|
24.3
|
|
|||
|
Actuarial (gain) loss
|
(48.3
|
)
|
44.2
|
|
|||
|
Currency fluctuations
|
(28.0
|
)
|
24.0
|
|
|||
|
Benefits paid
|
(46.4
|
)
|
(45.8
|
)
|
|||
|
Projected benefit obligation at end of period
|
$
|
673.6
|
|
$
|
766.1
|
|
|
|
Change in plan assets:
|
|||||||
|
Fair value at beginning of period
|
$
|
793.2
|
|
$
|
715.6
|
|
|
|
Currency fluctuations
|
(30.7
|
)
|
25.9
|
|
|||
|
Actual return
|
(22.0
|
)
|
85.8
|
|
|||
|
Company contribution
|
7.1
|
|
11.7
|
|
|||
|
Benefits paid
|
(46.4
|
)
|
(45.8
|
)
|
|||
|
Fair value at end of period
|
$
|
701.2
|
|
$
|
793.2
|
|
|
|
Funded status of the plans as of the end of period
|
$
|
27.6
|
|
$
|
27.1
|
|
|
|
Amounts recognized in the consolidated balance sheets:
|
|||||||
|
Noncurrent assets
|
$
|
40.5
|
|
$
|
41.1
|
|
|
|
Current liabilities
|
(0.7
|
)
|
(0.8
|
)
|
|||
|
Noncurrent liabilities
|
(12.2
|
)
|
(13.2
|
)
|
|||
|
Amounts recognized in accumulated other comprehensive (income) loss
|
|||||||
|
Prior service costs
|
$
|
16.9
|
|
$
|
20.8
|
|
|
|
Actuarial loss
|
107.7
|
|
109.8
|
|
|||
The accumulated benefit obligation for the defined benefit pension plans was
$673.0 million
and
$765.1 million
as of
December 31, 2018
and
2017
, respectively.
F-72
The components of net annual periodic benefit costs and other amounts recognized in other comprehensive income include the following components:
|
|
Pension Plans
|
|||||||||||
|
(in millions)
|
Years Ended December 31,
|
|||||||||||
|
2018
|
2017
|
2016
|
||||||||||
|
Net Periodic Benefit Cost
|
||||||||||||
|
Service cost
|
$
|
6.2
|
|
$
|
5.9
|
|
$
|
5.8
|
|
|||
|
Interest cost
|
24.0
|
|
24.3
|
|
25.1
|
|
||||||
|
Expected return on plan assets
|
(39.7
|
)
|
(41.3
|
)
|
(44.9
|
)
|
||||||
|
Amortization of:
|
||||||||||||
|
Prior service cost
|
2.4
|
|
2.3
|
|
1.7
|
|
||||||
|
Actuarial loss
|
9.1
|
|
2.8
|
|
5.0
|
|
||||||
|
Preliminary net periodic benefit cost (income)
|
$
|
2.0
|
|
$
|
(6.0
|
)
|
$
|
(7.3
|
)
|
|||
|
Curtailment/settlement expense
|
1.2
|
|
2.4
|
|
6.2
|
|
||||||
|
Total net periodic benefit cost (income)
|
$
|
3.2
|
|
$
|
(3.6
|
)
|
$
|
(1.1
|
)
|
|||
|
Other Changes in Plan Assets and Benefit Obligations Recognized in Other Comprehensive Income
|
||||||||||||
|
Prior service (credit) cost recognized in other comprehensive income
|
$
|
(4.3
|
)
|
$
|
(3.8
|
)
|
$
|
8.9
|
|
|||
|
Net actuarial loss (gain) recognized in other comprehensive income
|
5.0
|
|
(4.0
|
)
|
(2.5
|
)
|
||||||
|
Total recognized in other comprehensive income (loss)
|
$
|
0.7
|
|
$
|
(7.8
|
)
|
$
|
6.4
|
|
|||
|
Total recognized in net periodic benefit (income) cost and other comprehensive income
|
$
|
3.9
|
|
$
|
(11.4
|
)
|
$
|
5.3
|
|
|||
The estimated net actuarial (gain) loss and prior service cost (credit) for the pension plans and postretirement plans that will be amortized from accumulated other comprehensive income into net periodic benefit cost in
2019
is
$12.1 million
.
The following estimated benefit payments, which reflect estimated future service are expected to be paid by the related plans in the years ending December 31:
|
(in millions)
|
Pension Plans
Benefit Payments
|
Other Postretirement
Plans Benefit Payments
|
Medicare Part D
Adjustments
|
||||||||
|
2019
|
$
|
40.4
|
|
$
|
4.2
|
|
$
|
0.2
|
|
||
|
2020
|
41.1
|
|
4.2
|
|
0.2
|
|
|||||
|
2021
|
41.9
|
|
4.1
|
|
0.2
|
|
|||||
|
2022
|
42.8
|
|
3.9
|
|
0.2
|
|
|||||
|
2023
|
43.1
|
|
3.8
|
|
0.2
|
|
|||||
|
2024-2028
|
215.0
|
|
17.5
|
|
0.5
|
|
|||||
In
2019
, we expect to contribute cash of at least
$4.4 million
to the pension plans to meet minimum funding requirements. Also in
2019
, we anticipate contributing cash of
$4.2 million
to the postretirement medical benefit plans to fund anticipated benefit payments.
Plan Assets and Investment Strategies
The Company’s overall investment strategy is to obtain sufficient return and provide adequate liquidity to meet the benefit obligations of our pension plans. Investments are made in public securities to ensure adequate liquidity to support benefit payments. Domestic and international stocks and bonds provide diversification to the portfolio.
For the U.S. plans, we utilize an asset allocation policy that seeks to reduce funded status volatility over time. As such, the primary investment objective beyond accumulating sufficient assets to meet future benefit obligations is to monitor and
F-73
manage the assets of the plan to better insulate the asset portfolio from changes in interest rates that impact the liabilities. This requires an interest rate management strategy to reduce the sensitivity in the plan’s funded status and having a portion of the plan’s assets invested in return-seeking strategies. Currently, our policy includes an
80%
allocation to fixed income and
20%
to return-seeking strategies. The plans also have de-risking glide paths that will increase this protection as funded status improves. Actual allocations may experience temporary fluctuations based on market movements and investment strategies.
For the Canadian pension plans the primary investment objective is to secure the promised pension benefits through capital preservation and appreciation to better manage the asset/liability gap and interest rate risk. A secondary investment objective is to most effectively manage investment volatility to reduce the variability of the Company’s required contributions. The plans are expected to achieve an annual overall return, over a five year rolling period, consistent with or in excess of total fund benchmarks that reflect each plan’s strategic allocations and respective market benchmarks at the individual asset class level. Management of the asset/liability gap of the plans and performance results are reviewed quarterly. Until September 2018, Mosaic had the four Canadian pension plans, two salaried and two hourly plans, managed in one master trust. In order to better match the assets with the liabilities of each plan, Mosaic decided to split the master trust into one trust for each plan. Currently, our policy includes an
80%
allocation to fixed income and
20%
to return-seeking strategies for the salaried plans and
60%
allocation to fixed income and
40%
to return-seeking strategies for the hourly plans. Actual allocations may experience temporary fluctuations based on market movements and investment strategies.
A significant amount of the assets are invested in funds that are managed by a group of professional investment managers through Mosaic’s investment advisor. These funds are mainly commingled funds. Performance is reviewed by Mosaic management monthly by comparing each fund’s return to a benchmark with an in-depth quarterly review presented by Mosaic’s investment advisor to the Global Pension Investment Committee. We do not have significant concentrations of credit risk or industry sectors within the plan assets. Assets may be indirectly invested in Mosaic stock, but any risk related to this investment would be immaterial due to the insignificant percentage of the total pension assets that would be invested in Mosaic stock.
Fair Value Measurements of Plan Assets
The following tables provide fair value measurement, by asset class, of the Company’s defined benefit plan assets for both the U.S. and Canadian plans:
______________________________
|
(in millions)
|
December 31, 2018
|
|||||||||||||||
|
Pension Plan Asset Category
|
Total
|
Level 1
|
Level 2
|
Level 3
|
||||||||||||
|
Cash
|
$
|
12.0
|
|
$
|
12.0
|
|
$
|
—
|
|
$
|
—
|
|
||||
|
Equity securities
(a)
|
172.9
|
|
—
|
|
172.9
|
|
—
|
|
||||||||
|
Fixed income
(b)
|
514.3
|
|
—
|
|
514.3
|
|
—
|
|
||||||||
|
Private equity funds
|
2.0
|
|
—
|
|
—
|
|
2.0
|
|
||||||||
|
Total assets at fair value
|
$
|
701.2
|
|
$
|
12.0
|
|
$
|
687.2
|
|
$
|
2.0
|
|
||||
|
(in millions)
|
December 31, 2017
|
|||||||||||||||
|
Pension Plan Asset Category
|
Total
|
Level 1
|
Level 2
|
Level 3
|
||||||||||||
|
Cash
|
$
|
14.7
|
|
$
|
14.7
|
|
$
|
—
|
|
$
|
—
|
|
||||
|
Equity securities
(a)
|
327.7
|
|
—
|
|
327.7
|
|
—
|
|
||||||||
|
Fixed income
(b)
|
447.8
|
|
—
|
|
447.8
|
|
—
|
|
||||||||
|
Private equity funds
|
3.0
|
|
—
|
|
—
|
|
3.0
|
|
||||||||
|
Total assets at fair value
|
$
|
793.2
|
|
$
|
14.7
|
|
$
|
775.5
|
|
$
|
3.0
|
|
||||
|
(a)
|
This class, which includes several funds, was invested approximately
39%
in U.S. equity securities,
18%
in Canadian equity securities, and
43%
in international equity securities as of
December 31, 2018
, and
45%
in U.S. equity securities,
25%
in Canadian equity securities, and
30%
in international equity securities as of
December 31, 2017
.
|
|
(b)
|
This class, which includes several funds, was invested approximately
50%
in corporate debt securities,
44%
in governmental securities in the U.S. and Canada, and
6%
in foreign entity debt securities as of
December 31, 2018
, and
55%
in corporate debt securities,
42%
in governmental securities in the U.S. and Canada, and
3%
in foreign entity debt securities as of
December 31, 2017
.
|
F-74
Rates and Assumptions
The approach used to develop the discount rate for the pension and postretirement plans is commonly referred to as the yield curve approach. Under this approach, we use a hypothetical curve formed by the average yields of available corporate bonds rated AA and above and match it against the projected benefit payment stream. Each category of cash flow of the projected benefit payment stream is discounted back using the respective interest rate on the yield curve. Using the present value of projected benefit payments, a weighted-average discount rate is derived.
The approach used to develop the expected long-term rate of return on plan assets combines an analysis of historical performance, the drivers of investment performance by asset class, and current economic fundamentals. For returns, we utilized a building block approach starting with inflation expectations and added an expected real return to arrive at a long-term nominal expected return for each asset class. Long-term expected real returns are derived from future expectations of the U.S. Treasury real yield curve.
Weighted average assumptions used to determine benefit obligations were as follows:
|
|
Pension Plans
|
|||||||
|
|
Years Ended December 31,
|
|||||||
|
|
2018
|
2017
|
2016
|
|||||
|
Discount rate
|
4.09
|
%
|
3.51
|
%
|
3.97
|
%
|
||
|
Expected return on plan assets
|
5.14
|
%
|
5.54
|
%
|
5.54
|
%
|
||
|
Rate of compensation increase
|
3.50
|
%
|
3.50
|
%
|
3.50
|
%
|
||
Weighted-average assumptions used to determine net benefit cost were as follows:
|
|
Pension Plans
|
|||||||
|
|
Years Ended December 31,
|
|||||||
|
|
2018
|
2017
|
2016
|
|||||
|
Discount rate
|
3.51
|
%
|
3.97
|
%
|
4.17
|
%
|
||
|
Service cost discount rate
(a)
|
3.50
|
%
|
4.02
|
%
|
4.19
|
%
|
||
|
Interest cost discount rate
(a)
|
3.21
|
%
|
3.44
|
%
|
3.45
|
%
|
||
|
Expected return on plan assets
|
5.54
|
%
|
5.54
|
%
|
5.66
|
%
|
||
|
Rate of compensation increase
|
3.50
|
%
|
3.50
|
%
|
3.50
|
%
|
||
______________________________
|
(a)
|
In 2016, we changed the method used to estimate the service and interest cost components of net periodic benefit cost for our defined benefit pension and other postretirement benefit plans by electing a full yield curve approach and applying the specific spot rates along the yield curve used in the determination of the benefit obligation to the relevant projected cash flows. The impact of this change to our earnings and earnings per share was not material.
|
Defined Contribution Plans
Eligible salaried and non-union hourly employees in the U.S. participate in a defined contribution investment plan which permits employees to defer a portion of their compensation through payroll deductions and provides matching contributions. We match
100%
of the first
3%
of the participant’s contributed pay plus
50%
of the next
3%
of the participant’s contributed pay, subject to Internal Revenue Service limits. Participant contributions, matching contributions, and the related earnings immediately vest. Mosaic also provides an annual non-elective employer contribution feature for eligible salaried and non-union hourly employees based on the employee’s age and eligible pay. Participants are generally vested in the non-elective employer contributions after three years of service. In addition, a discretionary feature of the plan allows the Company to make additional contributions to employees. Certain union employees participate in a defined contribution retirement plan based on collective bargaining agreements.
Canadian salaried and non-union hourly employees participate in an employer funded plan with employer contributions similar to the U.S. plan. The plan provides a profit sharing component which is paid each year. We also sponsor one mandatory union plan in Canada. Benefits in these plans vest after two years of consecutive service.
F-75
The expense attributable to defined contribution plans in the U.S. and Canada was
$51.2 million
,
$54.3 million
and
$51.1 million
for
2018
,
2017
and
2016
, respectively.
Postretirement Medical Benefit Plans
We provide certain health care benefit plans for certain retired employees (“
Retiree Health Plans
”) which may be either contributory or non-contributory and contain certain other cost-sharing features such as deductibles and coinsurance.
The North American Retiree Health Plans are unfunded and the projected benefit obligation was
$35.3 million
and
$41.3 million
as of
December 31, 2018
and
2017
, respectively. This liability should continue to decrease due to our limited exposure. The related income statement effects of the Retiree Health Plans are not material to the Company.
The year-end status of the Brazil postretirement medical benefit plans with a discount rate of
9.15%
was as follows:
|
|
Postretirement Medical Benefits
|
||
|
|
Years Ended December 31,
|
||
|
(in millions)
|
2018
|
||
|
Change in accumulated postretirement benefit obligation (“APBO”):
|
|||
|
APBO at beginning of year
|
$
|
69.1
|
|
|
Service cost
|
1.5
|
|
|
|
Interest cost
|
6.8
|
|
|
|
Actuarial loss
|
13.0
|
|
|
|
Currency fluctuations
|
(13.1
|
)
|
|
|
Benefits paid
|
(1.5
|
)
|
|
|
APBO at end of year
|
$
|
75.8
|
|
|
Change in plan assets:
|
|||
|
Company contribution
|
$
|
1.5
|
|
|
Benefits paid
|
(1.5
|
)
|
|
|
Fair value at end of year
|
$
|
—
|
|
|
Unfunded status of the plans as of the end of the year
|
$
|
(75.8
|
)
|
|
Amounts recognized in the consolidated balance sheets:
|
|||
|
Current liabilities
|
$
|
(0.5
|
)
|
|
Noncurrent liabilities
|
(75.3
|
)
|
|
|
Amounts recognized in accumulated other comprehensive (income) loss
|
|||
|
Actuarial loss
|
$
|
23.9
|
|
19
. SHARE REPURCHASES
In May 2015, our Board of Directors authorized a
$1.5 billion
share repurchase program (the “
2015 Repurchase Program
”), allowing Mosaic to repurchase shares of our Common Stock through open market purchases, accelerated share repurchase arrangements, privately negotiated transactions or otherwise. The 2015 Repurchase Program has no set expiration date.
As of
December 31, 2018
,
15,765,025
shares of Common Stock have been repurchased under the 2015 Repurchase Program for an aggregate total of approximately
$650 million
. The remaining amount that could be repurchased under this program was
$850 million
as of December 31, 2018.
The extent to which we repurchase our shares and the timing of any such repurchases depend on a number of factors, including market and business conditions, the price of our shares, and corporate, regulatory and other considerations.
20
. SHARE-BASED PAYMENTS
The Mosaic Company 2014 Stock and Incentive Plan (the “
2014 Stock and Incentive Plan
”) was approved by our shareholders and became effective on May 15, 2014. It permits up to
25 million
shares of common stock to be issued under share-based awards granted under the plan. The 2014 Stock and Incentive Plan provides for grants of stock options,
F-76
restricted stock, restricted stock units, performance units and a variety of other share-based and non-share-based awards. Our employees, officers, directors, consultants, agents, advisors, and independent contractors, as well as other designated individuals, are eligible to participate in the 2014 Stock and Incentive Plan.
The Mosaic Company 2004 Omnibus Stock and Incentive Plan (the “
Omnibus Plan
”), which was approved by our shareholders and became effective in 2004 and subsequently amended, provided for the grant of shares and share options to employees for up to
25 million
shares of common stock. While awards may no longer be made under the Omnibus Plan, it will remain in effect with respect to the awards that had been granted thereunder prior to its termination.
Mosaic settles stock option exercises, restricted stock units, and certain performance units and performance shares with newly issued common shares. The Compensation Committee of the Board of Directors administers the 2014 Stock and Incentive Plan and the Omnibus Plan subject to their respective provisions and applicable law.
Stock Options
Stock options are granted with an exercise price equal to the market price of our stock at the date of grant and have a ten-year contractual term. The fair value of each option award is estimated on the date of the grant using the Black-Scholes option valuation model. Stock options vest in equal annual installments in the first
three years
following the date of grant (graded vesting). Stock options are expensed on a straight-line basis over the required service period, based on the estimated fair value of the award on the date of grant, net of estimated forfeitures.
Valuation Assumptions
Assumptions used to calculate the fair value of stock options in each period are noted in the following table. Expected volatility is based on the simple average of implied and historical volatility using the daily closing prices of the Company’s stock for a period equal to the expected term of the option. The risk-free interest rate is based on the U.S. Treasury rate at the time of the grant for instruments of comparable life. There were no stock options granted or issued in 2018.
|
|
Years Ended December 31,
|
||||
|
|
2017
|
2016
|
|||
|
Weighted average assumptions used in option valuations:
|
|||||
|
Expected volatility
|
35.35
|
%
|
42.54
|
%
|
|
|
Expected dividend yield
|
1.97
|
%
|
3.86
|
%
|
|
|
Expected term (in years)
|
7
|
|
7
|
|
|
|
Risk-free interest rate
|
2.34
|
%
|
1.65
|
%
|
|
A summary of the status of our stock options as of
December 31, 2018
, and activity during
2018
, is as follows:
|
Shares
(in millions)
|
Weighted
Average
Exercise
Price
|
Weighted Average Remaining Contractual Term (Years)
|
Aggregate
Intrinsic
Value
|
|||||||||
|
Outstanding as of December 31, 2017
|
2.6
|
|
$
|
49.20
|
|
|
|
|
||||
|
Granted
|
—
|
|
—
|
|
||||||||
|
Cancelled
|
(0.2
|
)
|
$
|
91.88
|
|
|||||||
|
Outstanding as of December 31, 2018
|
2.4
|
|
$
|
45.50
|
|
4.0
|
$
|
—
|
|
|||
|
Exercisable as of December 31, 2018
|
2.0
|
|
$
|
48.60
|
|
3.4
|
$
|
—
|
|
|||
The weighted-average grant date fair value of options granted during
2017
and
2016
were
$9.91
and
$8.37
, respectively. There were
no
options granted during
2018
and
no
options were exercised during
2018
or
2017
.
Restricted Stock Units
Restricted stock units are issued to various employees, officers and directors at a price equal to the market price of our stock at the date of grant. The fair value of restricted stock units is equal to the market price of our stock at the date of grant.
F-77
Restricted stock units generally cliff vest after
three years
of continuous service and are expensed on a straight-line basis over the required service period, based on the estimated grant date fair value, net of estimated forfeitures.
A summary of the status of our restricted stock units as of
December 31, 2018
, and activity during
2018
, is as follows:
|
Shares
(in millions)
|
Weighted
Average
Grant
Date Fair
Value Per
Share
|
|||||
|
Restricted stock units as of December 31, 2017
|
1.2
|
|
$
|
33.10
|
|
|
|
Granted
|
0.7
|
|
26.73
|
|
||
|
Issued and cancelled
|
(0.3
|
)
|
$
|
43.65
|
|
|
|
Restricted stock units as of December 31, 2018
|
1.6
|
|
$
|
27.27
|
|
|
Performance Units
During the year ended
December 31, 2018
,
401,098
total shareholder return (“
TSR
”) performance units were granted with a fair value of
$28.09
. Final performance units are awarded based on the increase or decrease, subject to certain limitations, in Mosaic’s share price from the grant date to the third anniversary of the award, plus dividends (a measure of total shareholder return or TSR). The beginning and ending stock prices are based on a
30
trading-day average stock price. Holders of the awards must be employed at the end of the performance period in order for any units to vest, except in the event of death, disability or retirement at or after age
60
, certain changes in control, and Committee or Board discretion as provided in the related award agreements.
The fair value of each TSR performance unit is determined using a Monte Carlo simulation. This valuation methodology utilizes assumptions consistent with those of our other share-based awards and a range of ending stock prices; however, the expected term of the awards is
three years
, which impacts the assumptions used to calculate the fair value of performance units as shown in the table below. TSR performance units are considered equity-classified fixed awards measured at grant-date fair value and not subsequently re-measured. TSR performance units cliff vest after
three years
of continuous service and are expensed on a straight-line basis over the required service period, based on the estimated grant date fair value of the award net of estimated forfeitures.
A summary of the assumptions used to estimate the fair value of TSR performance units is as follows:
|
|
Years Ended December 31,
|
|||||||
|
|
2018
|
2017
|
2016
|
|||||
|
Weighted average assumptions used in performance unit valuations:
|
||||||||
|
Expected volatility
|
34.30
|
%
|
34.26
|
%
|
35.67
|
%
|
||
|
Expected dividend yield
|
0.37
|
%
|
1.97
|
%
|
3.86
|
%
|
||
|
Expected term (in years)
|
3
|
|
3
|
|
3
|
|
||
|
Risk-free interest rate
|
2.42
|
%
|
1.60
|
%
|
0.99
|
%
|
||
During the year ended December 31, 2016, approximately
329,599
performance units were granted with vesting based on the cumulative spread between our return on invested capital (ROIC) and our weighted-average cost of capital (WACC) measured over a three-year period. These units are accounted for as share-based payments but are settled in cash, and are therefore accounted for as a liability with changes in value recorded through earnings during the three year service period. Awards are forfeited upon termination of employment, but not for retirement (if the employee has at least five years of service at age 60 or older), death, or disability of the employee. The total grant-date fair value of these awards was equal to the market price of our stock at the date of grant, which was
$28.49
.
F-78
A summary of our performance unit activity during
2018
is as follows:
|
Shares
(in millions)
|
Weighted
Average
Grant
Date Fair
Value Per
Share
|
|||||
|
Outstanding as of December 31, 2017
|
1.1
|
|
$
|
33.26
|
|
|
|
Granted
|
0.4
|
|
28.09
|
|
||
|
Issued and cancelled
|
(0.2
|
)
|
$
|
43.79
|
|
|
|
Outstanding as of December 31, 2018
|
1.3
|
|
$
|
33.26
|
|
|
Performance Based Cost Reduction Incentive Awards
During the year ended December 31, 2014, approximately
627,054
units of one-time, long-term incentive awards were issued to executive officers and other management employees tied to achieving target controllable operating costs savings of
$228 million
from 2013 levels by the end of 2016 (“
measurement period
”). The total grant-date fair value of these awards was equal to the market price of our stock at the date of grant, which was
$49.17
. During 2017, the awards were settled through the issuance of
934,346
shares of Mosaic common stock which was
150%
of target, based on operating cost savings achieved during the measurement period. The market price of our stock was
$31.42
at the date of issuance.
Share-Based Compensation Expense
We recorded share-based compensation expense of
$27.5 million
,
$28.0 million
and
$30.5 million
for
2018
,
2017
and
2016
, respectively. The tax benefit related to share exercises and lapses in the year was
$5.8 million
,
$9.7 million
and
$10.7 million
for
2018
,
2017
and
2016
, respectively.
As of
December 31, 2018
, there was
$16.8 million
of total unrecognized compensation cost related to options, restricted stock units and performance units and shares granted under the 2014 Stock and Incentive Plan and the Omnibus Plan. The unrecognized compensation cost is expected to be recognized over a weighted-average period of
one
year. The total fair value of options vested in
2017
and
2016
was
$4.2 million
and
$4.5 million
, respectively. No options vested in
2018
.
There was
no
cash received from exercises of share-based payment arrangements for
2018
or
2017
. Cash received from exercises of share-based payments was
$3.8 million
in
2016
. In
2018
,
2017
and
2016
, we received a tax benefit for tax deductions from options of
$2.3 million
,
$14.0 million
and
$3.3 million
, respectively.
21
. COMMITMENTS
We lease certain plants, warehouses, terminals, office facilities, railcars and various types of equipment under operating leases, some of which include rent payment escalation clauses, with lease terms ranging from one to ten years. In addition to minimum lease payments, some of our office facility leases require payment of our proportionate share of real estate taxes and building operating expenses.
In 2013, we entered into an ammonia supply agreement with CF (the “
CF Ammonia Supply Agreement
”) that commenced in 2017, under which Mosaic agreed to purchase approximately
545,000
to
725,000
tonnes of ammonia per year during a term that may extend until December 31, 2032 at a price tied to the prevailing price of U.S. natural gas.
We have long-term agreements for the purchase of sulfur, which is used in the production of phosphoric acid, and natural gas, which is a significant raw material, used primarily in the solution mining process in our Potash segment and used in our phosphate concentrates plants. Also, we have agreements for capital expenditures primarily in our Potash segments related to our expansion projects.
F-79
A schedule of future minimum long-term purchase commitments, based on expected market prices as of
December 31, 2018
, and minimum lease payments under non-cancelable operating leases as of
December 31, 2018
is as follows:
|
(in millions)
|
Purchase
Commitments
|
Operating
Leases
|
|||||
|
2019
|
$
|
2,586.5
|
|
$
|
97.5
|
|
|
|
2020
|
588.9
|
|
76.8
|
|
|||
|
2021
|
495.7
|
|
54.7
|
|
|||
|
2022
|
375.5
|
|
36.6
|
|
|||
|
2023
|
261.1
|
|
28.1
|
|
|||
|
Subsequent years
|
1,437.9
|
|
30.9
|
|
|||
|
$
|
5,745.6
|
|
$
|
324.6
|
|
||
Rental expense for
2018
,
2017
and
2016
was
$270.3 million
,
$114.0 million
and
$111.0 million
, respectively. Purchases made under long-term commitments in
2018
,
2017
and
2016
were
$2.0 billion
,
$1.9 billion
and
$1.6 billion
, respectively.
Most of our export sales of potash crop nutrients are marketed through a North American export association, Canpotex, which may fund its operations in part through third-party financing facilities. As a member, Mosaic or our subsidiaries are contractually obligated to reimburse Canpotex for their pro rata share of any operating expenses or other liabilities incurred. The reimbursements are made through reductions to members’ cash receipts from Canpotex.
We incur liabilities for reclamation activities and Gypstack closures in our Florida and Louisiana operations where, in order to obtain necessary permits, we must either pass a test of financial strength or provide credit support, typically in the form of cash deposits, surety bonds or letters of credit. The surety bonds generally expire within one year or less but a substantial portion of these instruments provide financial assurance for continuing obligations and, therefore, in most cases, must be renewed on an annual basis. As of
December 31, 2018
, we had
$497.7 million
in surety bonds outstanding, of which
$203.3 million
is for reclamation obligations, primarily related to mining in Florida. In addition, included in this amount is
$233.7 million
, reflecting our updated closure cost estimates, delivered to EPA as a substitute for the financial assurance provided through the Plant City Trust. The remaining balance in surety bonds outstanding of
$60.7 million
is for other matters.
22
. CONTINGENCIES
We have described below the material judicial and administrative proceedings to which we are subject.
Environmental Matters
We have contingent environmental liabilities that arise principally from three sources: (i) facilities currently or formerly owned by our subsidiaries or their predecessors; (ii) facilities adjacent to currently or formerly owned facilities; and (iii) third-party Superfund or state equivalent sites. At facilities currently or formerly owned by our subsidiaries or their predecessors, the historical use and handling of regulated chemical substances, crop and animal nutrients and additives and by-product or process tailings have resulted in soil, surface water and/or groundwater contamination. Spills or other releases of regulated substances, subsidence from mining operations and other incidents arising out of operations, including accidents, have occurred previously at these facilities, and potentially could occur in the future, possibly requiring us to undertake or fund cleanup or result in monetary damage awards, fines, penalties, other liabilities, injunctions or other court or administrative rulings. In some instances, pursuant to consent orders or agreements with governmental agencies, we are undertaking certain remedial actions or investigations to determine whether remedial action may be required to address contamination. At other locations, we have entered into consent orders or agreements with appropriate governmental agencies to perform required remedial activities that will address identified site conditions. Taking into consideration established accruals of approximately
$58.6 million
and
$35.1 million
, as of
December 31, 2018
and
2017
, respectively, expenditures for these known conditions currently are not expected, individually or in the aggregate, to have a material effect on our business or financial condition. However, material expenditures could be required in the future to remediate the contamination at known sites or at other current or former sites or as a result of other environmental, health and safety matters. Below is a discussion of the more significant environmental matters.
New Wales Water Loss Incident
. In August 2016, a sinkhole developed under one of the two cells of the active Gypstack at our New Wales facility in Polk County, Florida, resulting in process water from the stack draining into the sinkhole. The
F-80
incident was reported to the FDEP and EPA. In October 2016, our subsidiary, Mosaic Fertilizer, entered into a consent order (the “
Order
”) with the FDEP relating to the incident. Under the order, Mosaic Fertilizer agreed to, among other things: implement a remediation plan to close the sinkhole; perform additional monitoring of the groundwater quality and act to assess and remediate in the event monitored off-site water does not comply with applicable standards as a result of the incident; evaluate the risk of potential future sinkhole formation at the New Wales facility and at Mosaic Fertilizer’s active Gypstack operations at the Bartow, Riverview and Plant City facilities with recommendations to address any identified issues; and provide financial assurance of no less than
$40.0 million
, which we have done without the need for any expenditure of corporate funds through satisfaction of a financial strength test and Mosaic parent guarantee. The Order did not require payment of civil penalties relating to the incident.
In 2016, we recorded expenses and related accruals of approximately
$70.0 million
, reflecting our estimated costs related to the sinkhole. At June 30, 2017, we accrued an additional
$14.0 million
, in part due to refinements in our estimates as repairs progressed and because we determined that a portion of the sinkhole was wider than previously estimated. As of December 31, 2018, the sinkhole repairs were substantially complete, with
$79.5 million
spent in remediation and sinkhole-related costs through this date. We estimate remaining costs will be approximately
$1.5 million
. Additional expenditures could be required in the future for additional remediation or other measures in connection with the sinkhole including if, for example, FDEP or EPA were to request additional measures to address risks presented by the Gypstack. These expenditures could be material. In addition, we are unable to predict at this time what, if any, impact the New Wales water loss incident will have on future Florida permitting efforts.
EPA RCRA Initiative
. We have certain financial assurance and other obligations under consent decrees and a separate financial assurance arrangement relating to our facilities in Florida and Louisiana. These obligations are discussed in Note
14
of our Notes to Consolidated Financial Statements.
EPA EPCRA Initiative
. In July 2008, DOJ sent a letter to major U.S. phosphoric acid manufacturers, including us, stating that EPA’s ongoing investigation indicates apparent violations of Section 313 of the Emergency Planning and Community Right-to-Know Act (“
EPCRA
”) at their phosphoric acid manufacturing facilities. Section 313 of EPCRA requires annual reports to be submitted with respect to the use or presence of certain toxic chemicals. DOJ and EPA also stated that they believe that a number of these facilities have violated Section 304 of EPCRA and Section 103 of the Comprehensive Environmental Response, Compensation and Liability Act (“
CERCLA
”) by failing to provide required notifications relating to the release of hydrogen fluoride from the facilities. The letter did not identify any specific violations by us or assert a demand for penalties against us. We cannot predict at this time whether EPA and DOJ will initiate an enforcement action over this matter, what its scope would be, or what the range of outcomes of such a potential enforcement action might be.
Florida Sulfuric Acid Plants
. On April 8, 2010, EPA Region 4 submitted an administrative subpoena to us under Section 114 of the Federal Clean Air Act (the “
CAA
”) regarding compliance of our Florida sulfuric acid plants with the “New Source Review” requirements of the CAA. The request received by Mosaic appears to be part of a broader EPA national enforcement initiative focusing on sulfuric acid plants. On June 16, 2010, EPA issued a notice of violation to CF (the “
CF NOV
”) with respect to “New Source Review” compliance at the Plant City Facility’s sulfuric acid plants and the allegations in the CF NOV were not resolved before our 2014 acquisition of the Plant City Facility. CF has agreed to indemnify us with respect to any penalty EPA may assess as a result of the allegations in the CF NOV. We are negotiating the terms of a settlement with EPA that would resolve both the violations alleged in the CF NOV, and violations which EPA may contend, but have not asserted, exist at the sulfuric acid plants at our other facilities in Florida. Based on the current status of the negotiations, we expect that our commitments will include an agreement to reduce our sulfur dioxide emissions over the next five years to comply with a sulfur dioxide ambient air quality standard enacted by EPA in 2010. We do not expect that any related penalties assessed against us as part of a potential settlement would be material. In the event we are unable to finalize agreement on the terms of the settlement, we cannot predict at this time whether EPA and DOJ will initiate an enforcement action with respect to “New Source Review” compliance at our Florida sulfuric acid plants other than the Plant City Facility or what its scope would be, or what the range of outcomes might be with respect to such a potential enforcement action or with respect to the CF NOV.
Other Environmental Matters
. Superfund and equivalent state statutes impose liability without regard to fault or to the legality of a party’s conduct on certain categories of persons who are considered to have contributed to the release of “hazardous substances” into the environment. Under Superfund, or its various state analogues, one party may, under certain circumstances, be required to bear more than its proportionate share of cleanup costs at a site where it has liability if payments cannot be obtained from other responsible parties. Currently, certain of our subsidiaries are involved or concluding involvement at several Superfund or equivalent state sites. Our remedial liability from these sites, alone or in the aggregate,
F-81
currently is not expected to have a material effect on our business or financial condition. As more information is obtained regarding these sites and the potentially responsible parties involved, this expectation could change.
We believe that, pursuant to several indemnification agreements, our subsidiaries are entitled to at least partial, and in many instances complete, indemnification for the costs that may be expended by us or our subsidiaries to remedy environmental issues at certain facilities. These agreements address issues that resulted from activities occurring prior to our acquisition of facilities or businesses from parties including, but not limited to, ARCO (BP); Beatrice Fund for Environmental Liabilities; Conoco; Conserv; Estech, Inc.; Kaiser Aluminum & Chemical Corporation; Kerr-McGee Inc.; PPG Industries, Inc.; The Williams Companies; CF; and certain other private parties. Our subsidiaries have already received and anticipate receiving amounts pursuant to the indemnification agreements for certain of their expenses incurred to date as well as future anticipated expenditures. We record potential indemnifications as an offset to the established accruals when they are realizable or realized.
Phosphate Mine Permitting in Florida
Denial of the permits sought at any of our mines, issuance of the permits with cost-prohibitive conditions, substantial delays in issuing the permits, legal actions that prevent us from relying on permits or revocation of permits may create challenges for us to mine the phosphate rock required to operate our Florida and Louisiana phosphate plants at desired levels or increase our costs in the future.
The South Pasture Extension
. In November 2016, the Army Corps of Engineers (the “
Corps
”) issued a federal wetlands permit under the Clean Water Act for mining an extension of our South Pasture phosphate rock mine in central Florida. On December 20, 2016, the Center for Biological Diversity, ManaSota-88, People for Protecting Peace River and Suncoast Waterkeeper issued a 60-day notice of intent to sue the Corps and the U.S. Fish and Wildlife Service (the “
Service
”) under the federal Endangered Species Act regarding actions taken by the Corps and the Service in connection with the issuance of the permit. On March 15, 2017, the same group filed a complaint against the Corps, the Service and the U.S. Department of the Interior in the U.S. District Court for the Middle District of Florida, Tampa Division. The complaint alleges that various actions taken by the Corps and the Service in connection with the issuance of the permit, including in connection with the Service’s biological opinion and the Corps’ reliance on that biological opinion, violated substantive and procedural requirements of the federal Clean Water Act (“
CWA
”), the National Environmental Policy Act (“
NEPA
”) and the Endangered Species Act (the “
ESA
”), and were arbitrary, capricious, an abuse of discretion, and otherwise not in accordance with law, in violation of the Administrative Procedure Act (the “
APA
”). As to the Corps, plaintiffs allege in their complaint, among other things, that the Corps failed to conduct an adequate analysis under the CWA of alternatives, failed to fully consider the effects of the South Pasture extension mine, failed to take adequate steps to minimize potential adverse impacts and violated the ESA by relying on the Service’s biological opinion to determine that its permitting decision is not likely to adversely affect certain endangered or rare species. As to the Service, plaintiffs allege in their complaint, among other things, that the Service’s biological opinion fails to meet statutory requirements, that the Service failed to properly consider impacts and adequately assess the cumulative effects on certain species, and that the Service violated the ESA in finding that the South Pasture extension mine is not likely to adversely affect certain endangered or rare species. The plaintiffs are seeking relief including (i) declarations that the Corps’ decision to issue the permit violated the CWA, NEPA, the ESA and the APA and that its NEPA review violated the law; (ii) declarations that the Service’s biological opinion violated applicable law and that the Corps’ reliance on the biological opinion violated the ESA; (iii) orders that the Corps rescind the permit, that the Service withdraw its biological opinion and related analyses and prepare a biological opinion that complies with the ESA; and (iv) that the Corps be preliminarily and permanently enjoined from authorizing any further action under the permit until it complies fully with the requirements of the CWA, NEPA, the ESA and the APA. On March 31, 2017, Mosaic’s motion for intervention was granted with no restrictions. Plaintiffs filed an amended complaint on June 2, 2017, without any new substantive allegations, and on June 28, 2017, Mosaic (as intervenor) and separately, the defendants, filed answers to the amended complaint. On June 30, 2017, the plaintiffs filed a motion for summary judgment, arguing that the permit should not have been issued. On July 15, 2017, Mosaic filed a response in opposition to the plaintiffs’ motion, and on July 28, 2017, Mosaic filed its own motion for summary judgment. On December 14, 2017 the Tampa District Court granted Mosaic’s motion for summary judgment in favor of Mosaic and the government defendants, and denied the plaintiffs’ motion to supplement the administrative record. On February 12, 2018, the plaintiffs filed an appeal with the U.S. Court of Appeals for the Eleventh Circuit of the Tampa District Court decision. A mandatory mediation occurred on March 19, 2018, but no settlement was reached. Briefing by all parties was completed on July 13, 2018.
F-82
We believe the plaintiffs’ claims in this case are without merit and we intend to vigorously defend the Corps’ issuance of the South Pasture extension permit and the Service’s biological opinion. However, if the plaintiffs were to prevail in this case, we would be prohibited from continuing to mine the South Pasture extension, and obtaining new or modified permits could significantly delay our resumption of mining and could result in more onerous mining conditions. This could have a material effect on our future results of operations, reduce future cash flows from operations, and in the longer term, conceivably adversely affect our liquidity and capital resources.
MicroEssentials
®
Patent Lawsuit
On January 9, 2009, John Sanders and Specialty Fertilizer Products, LLC filed a complaint against Mosaic, Mosaic Fertilizer, LLC, Cargill, Incorporated and Cargill Fertilizer, Inc. in the United States District Court for the Western District of Missouri (the “
Missouri District Court
”). The plaintiffs alleged that our production of MicroEssentials
®
value-added ammoniated phosphate crop nutrient products that we produce, infringed on a patent owned by the plaintiffs. Plaintiffs sought to enjoin the alleged infringement and to recover an unspecified amount of damages and attorneys’ fees for past infringement. Through an order entered by the court on September 25, 2014, Cargill was dismissed as a defendant, and the two original plaintiffs were replaced by a single plaintiff, JLSMN LLC, an entity to whom the patent was transferred.
The Missouri District Court stayed the lawsuit pending reexamination of plaintiff’s patent claims by the U.S. Patent and Trademark Office (the “
PTO
”). On September 12, 2012, Shell Oil Company (“
Shell
”) filed an additional reexamination request which in part asserted that the claims as amended and added in connection with the reexamination are unpatentable. On October 4, 2012, the PTO issued a Reexamination Certificate in which certain claims of the plaintiff’s patent were cancelled, disclaimed and amended, and new claims were added. On December 11, 2012, the PTO issued an initial rejection of all of plaintiff’s remaining patent claims but later reversed its decision. Shell appealed the PTO’s decision. On June 7, 2016, the Patent Trial and Appeal Board issued a decision holding that all patent claims initially allowed to the plaintiff should have been found invalid. On November 8, 2017, the Federal Circuit Court of Appeals affirmed the Patent Trial and Appeal Board’s decision. On June 25, 2018, the United States Supreme Court denied plaintiffs petition for writ of certiorari. The case in the Missouri District Court has been dismissed with prejudice, and the matter is now concluded.
Brazil Legal Contingencies
Our Brazilian subsidiaries are engaged in a number of judicial and administrative proceedings regarding labor, environmental and civil claims that allege aggregate damages and/or fines of approximately
$1.08 billion
. We estimate that our probable aggregate loss with respect to these claims is approximately
$47.9 million
, which is included in our accrued liabilities in our Condensed Consolidated Balance Sheets at December 31, 2018.
Approximately
$743.7 million
of the maximum potential loss relates to labor claims, such as in-house and third-party employees' judicial proceedings alleging the right to receive overtime pay, additional payment due to work in hazardous conditions, risk premium, profit sharing, additional payment due to night work, salary parity and wage differences. We estimate that our probable aggregate loss regarding these claims is approximately
$40.7 million
, which is included in accrued liabilities in our Condensed Consolidated Balance Sheets at December 31, 2018. Based on Brazil legislation and the current status of similar labor cases involving unrelated companies, we believe we have recorded adequate loss contingency reserves sufficient to cover our estimate of probable losses. If the status of similar cases involving unrelated companies were to adversely change in the future, our maximum exposure could increase and additional accruals could be required.
F-83
Approximately
$6.7 million
of the above mentioned
$40.7 million
reserves related to a purported class action filed by one of the unions claiming additional payment for occupational hazard due to the alleged exposure of workers at the Company's potash mine at Rosario do Catete, Sergipe, to explosive gases that could be found during the mining process. The matter currently is before the Brazilian Labor Supreme Court.
The environmental and mining judicial and administrative proceedings claims allege aggregate damages and/or fines in excess of
$163.3 million
; however, we estimate that our probable aggregate loss regarding these claims in approximately
$5.6 million
, which has been accrued at December 31, 2018. The majority of the reserves involves a claim filed in 2012 by the State Public Prosecutor Office, alleging that the Company delayed construction of an effluent treatment plant, thereby subjecting it to a fine under the commitment agreement.
Our Brazilian subsidiaries also have certain other civil contingent liabilities with respect to judicial, administrative and arbitration proceedings and claims related to contract disputes, pension plan matters, real state disputes and other civil matters arising in the ordinary course of business. These claims allege aggregate damages in excess of
$172.7 million
. We estimate that the probable aggregate loss with respect to these matters is approximately
$1.6 million
.
Uberaba Judicial Settlement
In 2013, the Federal Public Prosecutor filed a public civil action requesting the Company adopt several measures to mitigate soil and water contamination related to the gypstack at our Uberaba facility, including compensation for the alleged social and environmental damages. In 2014, our predecessor subsidiary in Brazil entered into a judicial settlement with the federal public prosecutor, the State of Minas Gerais public prosecutor and the federal environmental agency. Under this agreement, we agreed to implement remediation measures such as: constructing a liner under the Gypstack water ponds and lagoons, and monitoring the groundwater and soil quality. We also agreed to create a private reserve of natural heritage and to pay compensation in the amount of approximately
$0.3 million
, which was paid in July 2018. We are currently acting in compliance with our obligations under the judicial settlement and expect them to be completed by December 31, 2023.
Uberaba EHS Class Action
In 2013, the State of Minas Gerais public prosecutor filed a class action claiming that our predecessor company in Brazil did not comply with labor safety rules and working hour laws. This claim was based on an inspection conducted by the Labor and Employment Ministry in 2010, following which we were fined for not complying with several labor regulations. We filed our defense, claiming that we complied with these labor regulations and that the assessment carried out by the inspectors in 2010 was abusive. Following the initial hearing, the court ordered an examination to determine whether there has been any non-compliance with labor regulations. The examination is currently pending. The amount involved in the proceeding is
$31.8 million
.
Brazil Tax Contingencies
Our Brazilian subsidiaries are engaged in a number of judicial and administrative proceedings relating to various non-income tax matters. We estimate that our maximum potential liability with respect to these matters is approximately
$414 million
, of which
$228 million
is subject to an indemnification agreement entered into with Vale S.A. in connection with the Acquisition.
Approximately
$256 million
of the maximum potential liability relates to a Brazilian federal value added tax, PIS and Coffins, and tax credit cases, while the majority of the remaining amount relates to various other non-income tax cases such as value-added taxes. The maximum potential liability can increase with new audits. Based on Brazil legislation and the current status of similar tax cases involving unrelated taxpayers, we believe we have recorded adequate loss contingency reserves sufficient to cover our estimate of probable losses, which are immaterial. If the status of similar tax cases involving unrelated taxpayer changes in the future, additional accruals could be required.
Other Claims
We also have certain other contingent liabilities with respect to judicial, administrative and arbitration proceedings and claims of third parties, including tax matters, arising in the ordinary course of business. We do not believe that any of these contingent liabilities will have a material adverse impact on our business or financial condition, results of operations, and cash flows.
F-84
23
. RELATED PARTY TRANSACTIONS
We enter into transactions and agreements with certain of our non-consolidated companies and other related parties from time to time. As of
December 31, 2018
and
2017
, the net amount due from our non-consolidated companies totaled
$95.2 million
and
$45.4 million
, respectively. We also have a long-term indemnification asset of
$30.7 million
from Vale S.A. for reimbursement of pension plan obligations.
The Consolidated Statements of Earnings included the following transactions with our non-consolidated companies:
|
|
Years Ended December 31,
|
|||||||||||
|
|
||||||||||||
|
(in millions)
|
2018
|
2017
|
2016
|
|||||||||
|
Transactions with non-consolidated companies included in net sales
|
$
|
842.4
|
|
$
|
715.3
|
|
$
|
623.1
|
|
|||
|
Transactions with non-consolidated companies included in cost of goods sold
|
1,046.4
|
|
750.2
|
|
552.9
|
|
||||||
As part of the MWSPC joint venture, we market approximately
25%
of the MWSPC production, for which approximately
$6.6 million
and
$1.0 million
, respectively is included in revenue for the years ended December 31, 2018 and 2017.
In November 2015, we agreed to provide funds to finance the purchase and construction of
two
articulated tug and barge units, intended to transport anhydrous ammonia for our operations, through a bridge loan agreement with Gulf Marine Solutions, LLC (
“GMS”
). GMS is a wholly owned subsidiary of Gulf Sulphur Services Ltd., LLLP (“
Gulf Sulphur Services
”), an entity in which we and a joint venture partner, Savage Companies (“
Savage
”), each indirectly own a
50%
equity interest and for which a subsidiary of Savage provides operating and management services. GMS provided these funds through draws on the Mosaic bridge loan, and through additional loans from Gulf Sulphur Services. We determined, beginning in 2015 that we are the primary beneficiary of GMS, a variable interest entity and, at that time, we consolidated GMS’s operations in our Phosphates segment.
On October 24, 2017, a lease financing transaction was completed with respect to the completed tug and barge unit, and; following the application of proceeds from the transaction, all outstanding loans made by Gulf Sulphur Services to GMS, together with accrued interest, were repaid, and the bridge loans related to the first unit’s construction were repaid. At December 31, 2018 and December 31, 2017,
$75.3 million
and
$73.2 million
in bridge loans, respectively, which are eliminated in consolidation, were outstanding, relating to the cancelled second barge and the remaining tug. Reserves against the bridge loan of approximately
$54.2 million
were recorded through December 31, 2017, and no additional charges have been recorded in 2018. The construction of the remaining tug, funded by the bridge loan advances in excess of the reserves, is recorded within construction in-progress within our consolidated balance sheet. Several subsidiaries of Savage operate vessels utilized by Mosaic under time charter arrangements, including the ammonia tug and barge unit.
24
. ACQUISITION OF MOSAIC FERTILIZANTES P&K S.A.
On December 19, 2016, we entered into an agreement with Vale S.A. (“
Vale
”) and Vale Fertilizer Netherlands B.V. (“
Vale Netherlands
” and, together with Vale and certain of its affiliates, the “
Sellers
”) to acquire all of the issued and outstanding capital stock of the now Acquired Business, for a purchase price of (i)
$1.25 billion
in cash (subject to adjustments) and (ii)
42,286,874
shares of our Common Stock. The agreement was amended by a letter agreement dated December 28, 2017 to, among other things, reduce the cash portion of the purchase price to
$1.15 billion
and the number of shares to be issued to
34,176,574
.
On January 8, 2018, we completed the Acquisition. The aggregate consideration paid by Mosaic at closing was
$1.08 billion
in cash (after giving effect to certain adjustments based on matters such as the working capital of the Acquired Business, which were estimated at the time of closing) and
34,176,574
shares of our Common Stock, par value
$0.01
per share (“
Common Stock
”), which was valued at
$26.92
per share at closing. The final purchase price is subject to a fair value determination of potential contingent consideration of up to
$260 million
, of which
$130 million
has expired without payment as of December 31, 2018, and evaluation of other consideration associated with assumed liabilities.
This acquisition allows us to expand our business in the fast-growing Brazilian agricultural market. Following the Acquisition, we are the leading fertilizer production and distribution company in Brazil. The assets we acquired include
five
F-85
Brazilian phosphate rock mines,
four
chemical plants, a potash mine in Brazil, the Sellers’
40%
economic interest in the joint venture which owns the Miski Mayo phosphate rock mine in the Bayovar region of Peru, in which we already held a
35%
economic interest, and a potash project in Kronau, Saskatchewan.
On the closing date, we also entered into an investor agreement (“
Investor Agreement
”) with Vale and Vale Fertilizer Netherlands B.V. that governs certain rights of and restrictions on Vale, Vale Fertilizer Netherlands B.V. and their respective affiliates (the “
Vale Stockholders
”) in connection with the shares of our Common Stock they own as a result of the Acquisition. These include certain rights to designate
two
individuals to our board of directors. In connection with the closing of the Acquisition, our board of directors was increased by one director, with Vale designating a new director for appointment to the board. The Vale Stockholders are also subject to certain transfer and standstill restrictions. In addition, until the later of the third anniversary of the closing and the date on which our board of directors no longer includes any Vale designees, the Vale Stockholders will agree to vote their shares of our stock (i) with respect to the election of directors, in accordance with the recommendation of our board of directors and (ii) with respect to any other proposal or resolution, at their election, either in the same manner as and in the same proportion to all voting securities that are not beneficially held by the Vale Stockholders are voted, or in accordance with the recommendation of our board of directors. Also under the Investor Agreement, the Vale Stockholders will be entitled to certain demand and to customary piggyback registration rights, beginning on the second anniversary of the closing of the transaction.
The following table is the final allocation of the assets acquired and the liabilities we assumed in the Acquisition as of January 8, 2018, the date of the Acquisition:
|
Cash and cash equivalents
|
$
|
86.0
|
|
|
Receivables, net
|
100.3
|
|
|
|
Inventories
|
344.2
|
|
|
|
Other current assets
|
107.6
|
|
|
|
Total current assets acquired
|
638.1
|
|
|
|
Property, plant and equipment, net
|
2,503.2
|
|
|
|
Goodwill
|
96.2
|
|
|
|
Deferred income taxes
|
48.3
|
|
|
|
Other assets
(a)
|
292.2
|
|
|
|
Total assets acquired
|
3,578.0
|
|
|
|
Current maturities of long-term debt
|
6.7
|
|
|
|
Structured accounts payable arrangements
|
98.2
|
|
|
|
Accounts payable and accrued liabilities
|
373.3
|
|
|
|
Total current liabilities assumed
|
478.2
|
|
|
|
Long-term debt, less current maturities
|
64.6
|
|
|
|
Deferred income taxes
|
128.3
|
|
|
|
Asset retirement obligations
|
247.3
|
|
|
|
Other noncurrent liabilities
|
215.3
|
|
|
|
Total liabilities assumed
|
1,133.7
|
|
|
|
Net identifiable assets acquired
|
2,444.3
|
|
|
|
Noncontrolling interest
|
(453.0
|
)
|
|
|
Cash and cash equivalents acquired
|
(86.0
|
)
|
|
|
Total consideration transferred (net of cash acquired and working capital adjustments)
|
$
|
1,905.3
|
|
______________________________
|
(a)
|
Other assets includes a long-term receivable of
$116.3 million
, recoverable taxes of
$101.6 million
and an indemnification asset of
$37.2 million
as of January 8, 2018.
|
Recognized goodwill of
$96.2 million
is attributable to the Miski Mayo portion of the Acquisition, reflected in the Phosphates segment.
F-86
Mosaic gained control of the Miski Mayo mine through the acquisition of the Seller’s
40%
economic interest, for a total ownership interest of
75%
, and began to consolidate the operations of Miski Mayo effective as of the closing date of the Acquisition. This was accounted for as a step acquisition and required us to remeasure the previously owned equity interest to fair value as of the acquisition date. An immaterial gain was recorded as a result of this re-measurement. Their balances are shown in the respective line items above.
As part of the Acquisition, a Brazilian company, Terras Brasil Ltda (“
Brazil Landco
”), was incorporated for the purpose of owning and transferring control of certain property from the Sellers to Mosaic. Brazil Landco is
51%
owned by Vale or one of its subsidiaries and
49%
owned by Mosaic. Mosaic is the primary beneficiary of Brazil Landco, a variable interest entity, and began to consolidate its operations effective as of the closing date of the Acquisition.
We recognized approximately
$45.3 million
and
$26.2 million
of acquisition and integration costs that were expensed during the years ended
December 31, 2018
and
2017
, respectively. These costs are included within other operating expense in the Consolidated Statement of Earnings. In 2018, we recorded other operating expense of
$11.1 million
related to a potential earn-out obligation to Vale, bringing the total obligation in our Consolidated Balance Sheets to
$12.4 million
at December 31, 2018. This earn-out obligation is subject to re-measurement each reporting period. Subsequent changes to the fair value of the liability will be reflected within other operating expense in the Consolidated Statement of Earnings. The cash payment, if any, would be paid in the first half of 2020.
The Acquisition contributed revenues and net earnings of
$1.3 billion
and
$83.6 million
, respectively from January 8, 2018 through
December 31, 2018
, excluding the effects of the acquisition and integration costs described above.
The following unaudited pro forma information presents the combined results of Mosaic and the acquired entities as if Mosaic had completed the Acquisition on January 1, 2017. The unaudited pro forma information for 2018 is immaterial as the Acquisition was completed on January 8, 2018. As required by GAAP, these unaudited pro forma results do not reflect any cost saving synergies from operating efficiencies. Accordingly, these unaudited pro forma results are presented for informational purposes only and are not necessarily indicative of what the actual results of operations of the combined companies would have been had the Acquisition occurred at the beginning of the period being presented, nor are they indicative of future results of operations.
|
Year Ended
|
|||
|
December 31,
|
|||
|
2017
|
|||
|
Net sales
|
$
|
8,605.7
|
|
|
Net earnings attributable to Mosaic
|
$
|
(43.3
|
)
|
|
Basic net earnings per share attributable to Mosaic
|
$
|
(0.11
|
)
|
|
Diluted net earnings per share attributable to Mosaic
|
$
|
(0.11
|
)
|
25
. BUSINESS SEGMENTS
The reportable segments are determined by management based upon factors such as products and services, production processes, technologies, market dynamics, and for which segment financial information is available for our chief operating decision maker.
For a description of our business segments see Note
1
of our Notes to Consolidated Financial Statements. We evaluate performance based on the operating earnings of the respective business segments, which includes certain allocations of corporate selling, general and administrative expenses. The segment results may not represent the actual results that would be expected if they were independent, stand-alone businesses. Intersegment eliminations, including profit on intersegment sales, mark-to-market gains/losses on derivatives, debt expenses, Streamsong Resort® results of operations and the results of the China and India distribution business are included within Corporate, Eliminations and Other.
F-87
Segment information for the years
2018
,
2017
and
2016
is as follows:
|
(in millions)
|
Phosphates
|
Potash
|
Mosaic Fertilizantes
|
Corporate,
Eliminations
and Other (a)
|
Total
|
|||||||||||||||
|
Year Ended December 31, 2018
|
||||||||||||||||||||
|
Net sales to external customers
|
$
|
3,106.3
|
|
$
|
2,154.8
|
|
$
|
3,747.1
|
|
$
|
579.1
|
|
$
|
9,587.3
|
|
|||||
|
Intersegment net sales
|
780.0
|
|
19.1
|
|
—
|
|
(799.1
|
)
|
—
|
|
||||||||||
|
Net sales
|
3,886.3
|
|
2,173.9
|
|
3,747.1
|
|
(220.0
|
)
|
9,587.3
|
|
||||||||||
|
Gross margin
|
581.5
|
|
597.2
|
|
382.9
|
|
(63.2
|
)
|
1,498.4
|
|
||||||||||
|
Canadian resource taxes
|
—
|
|
159.4
|
|
—
|
|
—
|
|
159.4
|
|
||||||||||
|
Gross margin (excluding Canadian resource taxes)
|
581.5
|
|
756.6
|
|
382.9
|
|
(63.2
|
)
|
1,657.8
|
|
||||||||||
|
Operating earnings
|
414.8
|
|
454.1
|
|
227.0
|
|
(167.6
|
)
|
928.3
|
|
||||||||||
|
Capital expenditures
|
393.9
|
|
410.5
|
|
148.2
|
|
1.9
|
|
954.5
|
|
||||||||||
|
Depreciation, depletion and amortization expense
|
403.7
|
|
301.5
|
|
158.5
|
|
20.2
|
|
883.9
|
|
||||||||||
|
Equity in net earnings (loss) of nonconsolidated companies
|
(4.6
|
)
|
—
|
|
—
|
|
0.1
|
|
(4.5
|
)
|
||||||||||
|
Year Ended December 31, 2017
|
—
|
|
||||||||||||||||||
|
Net sales to external customers
|
$
|
2,826.6
|
|
$
|
1,836.5
|
|
$
|
2,220.1
|
|
$
|
526.2
|
|
$
|
7,409.4
|
|
|||||
|
Intersegment net sales
|
762.6
|
|
16.1
|
|
—
|
|
(778.7
|
)
|
—
|
|
||||||||||
|
Net sales
|
3,589.2
|
|
1,852.6
|
|
2,220.1
|
|
(252.5
|
)
|
7,409.4
|
|
||||||||||
|
Gross margin
|
332.2
|
|
391.6
|
|
128.6
|
|
(9.6
|
)
|
842.8
|
|
||||||||||
|
Canadian resource taxes
|
—
|
|
70.1
|
|
—
|
|
—
|
|
70.1
|
|
||||||||||
|
Gross margin (excluding Canadian resource taxes)
|
332.2
|
|
461.7
|
|
128.6
|
|
(9.6
|
)
|
912.9
|
|
||||||||||
|
Operating earnings
|
191.6
|
|
281.3
|
|
63.1
|
|
(70.3
|
)
|
465.7
|
|
||||||||||
|
Capital expenditures
|
401.0
|
|
371.6
|
|
32.7
|
|
14.8
|
|
820.1
|
|
||||||||||
|
Depreciation, depletion and amortization expense
|
338.0
|
|
287.2
|
|
16.9
|
|
23.4
|
|
665.5
|
|
||||||||||
|
Equity in net earnings (loss) of nonconsolidated companies
|
16.0
|
|
—
|
|
—
|
|
0.7
|
|
16.7
|
|
||||||||||
|
Year Ended December 31, 2016
|
||||||||||||||||||||
|
Net sales to external customers
|
$
|
2,928.4
|
|
$
|
1,673.0
|
|
$
|
2,113.9
|
|
$
|
447.5
|
|
$
|
7,162.8
|
|
|||||
|
Intersegment net sales
|
782.5
|
|
12.7
|
|
—
|
|
(795.2
|
)
|
—
|
|
||||||||||
|
Net sales
|
3,710.9
|
|
1,685.7
|
|
2,113.9
|
|
(347.7
|
)
|
7,162.8
|
|
||||||||||
|
Gross margin
|
349.8
|
|
256.6
|
|
125.0
|
|
78.6
|
|
810.0
|
|
||||||||||
|
Canadian resource taxes
|
—
|
|
101.1
|
|
—
|
|
—
|
|
101.1
|
|
||||||||||
|
Gross margin (excluding Canadian resource taxes)
|
349.8
|
|
357.7
|
|
125.0
|
|
78.6
|
|
911.1
|
|
||||||||||
|
Operating earnings
|
47.8
|
|
138.8
|
|
64.8
|
|
67.6
|
|
319.0
|
|
||||||||||
|
Capital expenditures
|
380.0
|
|
416.7
|
|
23.7
|
|
22.7
|
|
843.1
|
|
||||||||||
|
Depreciation, depletion and amortization expense
|
362.4
|
|
308.7
|
|
15.1
|
|
25.0
|
|
711.2
|
|
||||||||||
|
Equity in net earnings (loss) of nonconsolidated companies
|
0.2
|
|
(15.5
|
)
|
(0.1
|
)
|
—
|
|
(15.4
|
)
|
||||||||||
|
Total assets as of December 31, 2018
|
$
|
7,877.3
|
|
$
|
7,763.1
|
|
$
|
3,952.4
|
|
$
|
526.4
|
|
$
|
20,119.2
|
|
|||||
|
Total assets as of December 31, 2017
|
7,700.6
|
|
8,301.7
|
|
1,376.7
|
|
1,254.4
|
|
18,633.4
|
|
||||||||||
|
Total assets as of December 31, 2016
|
7,679.7
|
|
7,777.9
|
|
1,249.7
|
|
133.4
|
|
16,840.7
|
|
||||||||||
______________________________
|
(a)
|
The "Corporate, Eliminations and Other" category includes the results of our ancillary distribution operations in India and China. For the years ended
December 31, 2018
,
2017
and
2016
, distribution operations in India and China had revenues of
$533.9 million
,
$493.2 million
, and
$419.6 million
, respectively and gross margins of
$42.8 million
,
$46.9 million
, and
$21.2 million
, respectively.
|
F-88
Financial information relating to our operations by geographic area is as follows:
|
|
Years Ended December 31,
|
||||||||||
|
(in millions)
|
2018
|
2017
|
2016
|
||||||||
|
Net sales
(a)
:
|
|||||||||||
|
Brazil
|
$
|
3,727.7
|
|
$
|
2,199.0
|
|
$
|
2,127.0
|
|
||
|
Canpotex
(b)
|
820.2
|
|
700.6
|
|
604.5
|
|
|||||
|
Canada
|
639.0
|
|
508.9
|
|
498.2
|
|
|||||
|
India
|
304.4
|
|
305.2
|
|
296.7
|
|
|||||
|
China
|
231.7
|
|
206.4
|
|
171.2
|
|
|||||
|
Australia
|
136.0
|
|
147.0
|
|
121.0
|
|
|||||
|
Mexico
|
133.9
|
|
131.8
|
|
125.0
|
|
|||||
|
Colombia
|
101.5
|
|
86.9
|
|
104.9
|
|
|||||
|
Paraguay
|
100.7
|
|
113.8
|
|
106.6
|
|
|||||
|
Japan
|
92.2
|
|
71.7
|
|
82.7
|
|
|||||
|
Peru
|
82.6
|
|
56.9
|
|
68.3
|
|
|||||
|
Argentina
|
70.5
|
|
53.1
|
|
67.1
|
|
|||||
|
Honduras
|
28.7
|
|
20.6
|
|
25.6
|
|
|||||
|
Thailand
|
28.1
|
|
20.9
|
|
21.2
|
|
|||||
|
Other
|
118.4
|
|
105.6
|
|
65.1
|
|
|||||
|
Total international countries
|
6,615.6
|
|
4,728.4
|
|
4,485.1
|
|
|||||
|
United States
|
2,971.7
|
|
2,681.0
|
|
2,677.7
|
|
|||||
|
Consolidated
|
$
|
9,587.3
|
|
$
|
7,409.4
|
|
$
|
7,162.8
|
|
||
______________________________
|
(a)
|
Revenues are attributed to countries based on location of customer.
|
|
(b)
|
Canpotex is the export association of the Saskatchewan potash producers. Canpotex sells approximately
24%
of its sales volumes to Brazil,
18%
to China,
10%
to India,
10%
to Indonesia and
38%
to the rest of the world.
|
|
December 31,
|
||||||||
|
(in millions)
|
2018
|
2017
|
||||||
|
Long-lived assets:
|
||||||||
|
Canada
|
$
|
4,764.8
|
|
$
|
5,457.1
|
|
||
|
Brazil
|
1,886.0
|
|
326.0
|
|
||||
|
Other
|
123.2
|
|
103.7
|
|
||||
|
Total international countries
|
6,774.0
|
|
5,886.8
|
|
||||
|
United States
|
7,056.9
|
|
6,181.9
|
|
||||
|
Consolidated
|
$
|
13,830.9
|
|
$
|
12,068.7
|
|
||
Excluded from the table above as of
December 31, 2018
and
2017
, are goodwill of
$1,707.5 million
and
$1,693.6 million
and deferred income taxes of
$343.8 million
and
$254.6 million
, respectively.
F-89
Net sales by product type for the years
2018
,
2017
and
2016
are as follows:
|
|
Years Ended December 31,
|
||||||||||
|
(in millions)
|
2018
|
2017
|
2016
|
||||||||
|
Sales by product type:
|
|||||||||||
|
Phosphate Crop Nutrients
|
$
|
2,956.8
|
|
$
|
2,266.7
|
|
$
|
2,369.2
|
|
||
|
Potash Crop Nutrients
|
2,755.9
|
|
2,180.6
|
|
1,889.1
|
|
|||||
|
Crop Nutrient Blends
|
1,418.9
|
|
1,384.2
|
|
1,403.1
|
|
|||||
|
Specialty Products
(a)
|
1,844.8
|
|
1,319.8
|
|
1,266.5
|
|
|||||
|
Phosphate Rock
|
53.0
|
|
—
|
|
—
|
|
|||||
|
Other
(b)
|
557.9
|
|
258.1
|
|
234.9
|
|
|||||
|
$
|
9,587.3
|
|
$
|
7,409.4
|
|
$
|
7,162.8
|
|
|||
______________________________
|
(a)
|
Includes sales of MicroEssentials
®
, K-Mag, Aspire and animal feed ingredients.
|
|
(b)
|
Includes sales of industrial potash.
|
F-90
Quarterly Results (Unaudited)
In millions, except per share amounts and common stock prices
|
|
Quarter
|
||||||||||||||||||
|
|
First
|
Second
|
Third
|
Fourth
|
Year
|
||||||||||||||
|
Year Ended December 31, 2018
|
|||||||||||||||||||
|
Net sales
|
$
|
1,933.7
|
|
$
|
2,205.0
|
|
$
|
2,928.1
|
|
$
|
2,520.5
|
|
$
|
9,587.3
|
|
||||
|
Gross margin
|
242.1
|
|
294.6
|
|
495.5
|
|
466.2
|
|
1,498.4
|
|
|||||||||
|
Operating earnings
|
80.7
|
|
196.3
|
|
393.3
|
|
258.0
|
|
928.3
|
|
|||||||||
|
Net earnings attributable to Mosaic
|
42.3
|
|
67.9
|
|
247.5
|
|
112.3
|
|
470.0
|
|
|||||||||
|
Basic net earnings per share attributable to Mosaic
|
$
|
0.11
|
|
$
|
0.18
|
|
$
|
0.64
|
|
$
|
0.29
|
|
$
|
1.22
|
|
||||
|
Diluted net earnings per share attributable to Mosaic
|
0.11
|
|
0.18
|
|
0.64
|
|
0.29
|
|
1.22
|
|
|||||||||
|
Common stock prices:
|
|||||||||||||||||||
|
High
|
$
|
29.20
|
|
$
|
29.95
|
|
$
|
32.98
|
|
$
|
37.37
|
|
|||||||
|
Low
|
23.43
|
|
22.90
|
|
27.50
|
|
27.52
|
|
|||||||||||
|
Year Ended December 31, 2017
|
|||||||||||||||||||
|
Net sales
|
$
|
1,578.1
|
|
$
|
1,754.6
|
|
$
|
1,984.8
|
|
$
|
2,091.9
|
|
$
|
7,409.4
|
|
||||
|
Gross margin
|
129.6
|
|
192.3
|
|
240.8
|
|
280.1
|
|
842.8
|
|
|||||||||
|
Operating earnings
|
30.1
|
|
94.6
|
|
213.9
|
|
127.1
|
|
465.7
|
|
|||||||||
|
Net earnings attributable to Mosaic
|
(0.9
|
)
|
97.3
|
|
227.5
|
|
(431.1
|
)
|
(107.2
|
)
|
|||||||||
|
Basic net earnings per share attributable to Mosaic
|
$
|
—
|
|
$
|
0.28
|
|
$
|
0.65
|
|
$
|
(1.23
|
)
|
$
|
(0.31
|
)
|
||||
|
Diluted net earnings per share attributable to Mosaic
|
—
|
|
0.28
|
|
0.65
|
|
(1.23
|
)
|
(0.31
|
)
|
|||||||||
|
Common stock prices:
|
|||||||||||||||||||
|
High
|
$
|
34.36
|
|
$
|
29.51
|
|
$
|
24.77
|
|
$
|
26.12
|
|
|||||||
|
Low
|
28.34
|
|
21.79
|
|
19.23
|
|
20.72
|
|
|||||||||||
The number of holders of record of our Common Stock as of
March 1, 2019
was
1,599
.
Dividends have been declared on a quarterly basis during all periods presented. In the second quarter of 2015, we increased our annual dividend to $1.10 per share. In the second quarter of 2017, we decreased our annual dividend to $0.60 per share and in the fourth quarter of 2017, we decreased it to $0.10 per share.
F-91
The following table presents our selected financial data. This information has been derived from our audited consolidated financial statements. This historical data should be read in conjunction with the Consolidated Financial Statements and the related notes and “Management’s Discussion and Analysis of Financial Condition and Results of Operations.”
Five Year Comparison
In millions, except per share amounts
|
|
Years Ended December 31,
|
||||||||||||||||||
|
|
2018
|
2017
|
2016
|
2015
|
2014
|
||||||||||||||
|
Statements of Operations Data:
|
|
||||||||||||||||||
|
Net sales
|
$
|
9,587.3
|
|
$
|
7,409.4
|
|
$
|
7,162.8
|
|
$
|
8,895.3
|
|
$
|
9,055.8
|
|
||||
|
Cost of goods sold
|
8,088.9
|
|
6,566.6
|
|
6,352.8
|
|
7,177.4
|
|
7,129.2
|
|
|||||||||
|
Gross margin
|
1,498.4
|
|
842.8
|
|
810.0
|
|
1,717.9
|
|
1,926.6
|
|
|||||||||
|
Selling, general and administrative expenses
|
341.1
|
|
301.3
|
|
304.2
|
|
361.2
|
|
382.4
|
|
|||||||||
|
Gain on assets sold and to be sold
|
—
|
|
—
|
|
—
|
|
—
|
|
(16.4
|
)
|
|||||||||
|
Carlsbad restructuring expense
(b)
|
—
|
|
—
|
|
—
|
|
—
|
|
125.4
|
|
|||||||||
|
Other operating expenses
|
229.0
|
|
75.8
|
|
186.8
|
|
77.9
|
|
123.4
|
|
|||||||||
|
Operating earnings
|
928.3
|
|
465.7
|
|
319.0
|
|
1,278.8
|
|
1,311.8
|
|
|||||||||
|
Gain in value of share repurchase agreement
|
—
|
|
—
|
|
—
|
|
—
|
|
(60.2
|
)
|
|||||||||
|
Interest (expense) income, net
|
(166.1
|
)
|
(138.1
|
)
|
(112.4
|
)
|
(97.8
|
)
|
(107.6
|
)
|
|||||||||
|
Foreign currency transaction (loss) gain
|
(191.9
|
)
|
49.9
|
|
40.1
|
|
(60.5
|
)
|
79.1
|
|
|||||||||
|
Other expense
|
(18.8
|
)
|
(3.5
|
)
|
(4.3
|
)
|
(17.2
|
)
|
(5.8
|
)
|
|||||||||
|
Earnings from consolidated companies before income taxes
|
551.5
|
|
374.0
|
|
242.4
|
|
1,103.3
|
|
1,217.3
|
|
|||||||||
|
Provision for (benefit from) income taxes
(a)(b)
|
77.1
|
|
494.9
|
|
(74.2
|
)
|
99.1
|
|
184.7
|
|
|||||||||
|
Earnings (loss) from consolidated companies
|
474.4
|
|
(120.9
|
)
|
316.6
|
|
1,004.2
|
|
1,032.6
|
|
|||||||||
|
Equity in net (loss) earnings of nonconsolidated companies
|
(4.5
|
)
|
16.7
|
|
(15.4
|
)
|
(2.4
|
)
|
(2.2
|
)
|
|||||||||
|
Net earnings (loss) including noncontrolling interests
|
469.9
|
|
(104.2
|
)
|
301.2
|
|
1,001.8
|
|
1,030.4
|
|
|||||||||
|
Less: Net (loss) earnings attributable to noncontrolling interests
|
(0.1
|
)
|
3.0
|
|
3.4
|
|
1.4
|
|
1.8
|
|
|||||||||
|
Net earnings (loss) attributable to Mosaic
|
$
|
470.0
|
|
$
|
(107.2
|
)
|
$
|
297.8
|
|
$
|
1,000.4
|
|
$
|
1,028.6
|
|
||||
F-92
|
|
Years Ended December 31,
|
||||||||||||||||||
|
|
2018
|
2017
|
2016
|
2015
|
2014
|
||||||||||||||
|
Earnings per common share attributable to Mosaic:
|
|||||||||||||||||||
|
Basic net earnings (loss) per share attributable to Mosaic
|
$
|
1.22
|
|
$
|
(0.31
|
)
|
$
|
0.85
|
|
$
|
2.79
|
|
$
|
2.69
|
|
||||
|
Basic weighted average number of shares outstanding
|
384.8
|
|
350.9
|
|
350.4
|
|
358.5
|
|
374.1
|
|
|||||||||
|
Diluted net earnings (loss) per share attributable to Mosaic
|
$
|
1.22
|
|
$
|
(0.31
|
)
|
$
|
0.85
|
|
$
|
2.78
|
|
$
|
2.68
|
|
||||
|
Diluted weighted average number of shares outstanding
|
386.4
|
|
350.9
|
|
351.7
|
|
360.3
|
|
375.6
|
|
|||||||||
|
Balance Sheet Data (at period end):
|
|||||||||||||||||||
|
Cash and cash equivalents
|
$
|
847.7
|
|
$
|
2,153.5
|
|
$
|
673.1
|
|
$
|
1,276.3
|
|
$
|
2,374.6
|
|
||||
|
Total assets
|
20,119.2
|
|
18,633.4
|
|
16,840.7
|
|
17,389.5
|
|
18,283.0
|
|
|||||||||
|
Total long-term debt (including current maturities)
|
4,517.5
|
|
5,221.6
|
|
3,818.1
|
|
3,811.2
|
|
3,819.0
|
|
|||||||||
|
Total liabilities
|
9,514.5
|
|
8,994.3
|
|
7,218.2
|
|
7,824.5
|
|
7,562.4
|
|
|||||||||
|
Total equity
|
10,604.7
|
|
9,639.1
|
|
9,622.5
|
|
9,565.0
|
|
10,720.6
|
|
|||||||||
|
Other Financial Data:
|
|||||||||||||||||||
|
Depreciation, depletion and amortization
|
$
|
883.9
|
|
$
|
665.5
|
|
$
|
711.2
|
|
$
|
739.8
|
|
$
|
750.9
|
|
||||
|
Net cash provided by operating activities
|
1,409.8
|
|
935.5
|
|
1,260.2
|
|
2,038.3
|
|
2,122.1
|
|
|||||||||
|
Capital expenditures
|
954.5
|
|
820.1
|
|
843.1
|
|
1,000.3
|
|
929.1
|
|
|||||||||
|
Dividends per share
(c)
|
0.10
|
|
0.35
|
|
1.10
|
|
1.075
|
|
1.00
|
|
|||||||||
______________________________
|
(a)
|
The years ended December 31, 2018 and 2017 include a discrete income tax expense of approximately $1 million and $451 million, respectively. The years ended December 31, 2016 and 2015 include a discrete income tax benefit of approximately $54 million and $47 million, respectively. See further discussion in Note
13
to the Consolidated Financial Statements.
|
|
(b)
|
In 2014, we decided to permanently discontinue production of MOP at our Carlsbad, New Mexico facility. The pre-tax charges were $125.4 million. The year ended December 31, 2014 also includes a discrete income tax benefit of approximately $152 million primarily related to the acquisition of ADM and the sale of our distribution business in Argentina.
|
|
(c)
|
Dividends have been declared on a quarterly basis during all periods presented. In the second quarter of 2015, we increased our annual dividend to $1.10 per share. In the second quarter of 2017, we decreased our annual dividend to $0.60 per share and in the fourth quarter of 2017, we decreased it to $0.10 per share.
|
F-93
SCHEDULE II. VALUATION AND QUALIFYING ACCOUNTS
For the years ended December 31,
2018
,
2017
and
2016
In millions
|
Column A
|
Column B
|
Column C
|
Column D
|
Column E
|
||||||||||
|
|
|
Additions
|
|
|
||||||||||
|
Description
|
Balance
Beginning
of Period
|
Charges or
(Reductions)
to Costs and
Expenses |
Charges or
(Reductions)
to Other
Accounts(b)
|
Deductions
|
Balance at
End of Period
(a)
|
|||||||||
|
Allowance for doubtful accounts, deducted from accounts receivable in the balance sheet:
|
||||||||||||||
|
Year ended December 31, 2016
|
10.4
|
|
(1.4
|
)
|
1.7
|
|
(0.4
|
)
|
10.3
|
|
||||
|
Year ended December 31, 2017
|
10.3
|
|
5.6
|
|
(0.2
|
)
|
(0.2
|
)
|
15.5
|
|
||||
|
Year ended December 31, 2018
|
15.5
|
|
—
|
|
12.0
|
|
(c)
|
(4.1
|
)
|
23.4
|
|
|||
|
Income tax valuation allowance, related to deferred income taxes
|
||||||||||||||
|
Year ended December 31, 2016
|
11.9
|
|
18.7
|
|
—
|
|
—
|
|
30.6
|
|
||||
|
Year ended December 31, 2017
|
30.6
|
|
553.5
|
|
—
|
|
—
|
|
584.1
|
|
||||
|
Year ended December 31, 2018
|
584.1
|
|
946.2
|
|
—
|
|
—
|
|
1,530.3
|
|
||||
______________________________
|
(a)
|
Allowance for doubtful accounts balance includes
$22.1 million
,
$13.2 million
,
$7.6 million
of allowance on long-term receivables recorded in other long term assets for the years ended
December 31, 2018
,
2017
and
2016
, respectively.
|
|
(b)
|
The income tax valuation allowance adjustment was recorded to accumulated other comprehensive income and deferred taxes.
|
|
(c)
|
Amount relates to allowance of
$12.0 million
acquired in the Acquisition.
|
F-94
Management’s Report on Internal Control Over Financial Reporting
The Company’s management is responsible for establishing and maintaining effective internal control over financial reporting, as defined in Rule 13a-15(f) under the Securities Exchange Act of 1934. The Company’s internal control system is a process designed to provide reasonable assurance to our management, Board of Directors and stockholders regarding the reliability of financial reporting and the preparation and fair presentation of our consolidated financial statements for external reporting purposes in accordance with U.S. generally accepted accounting principles (U.S. GAAP), and includes those policies and procedures that:
|
•
|
Pertain to the maintenance of records that, in reasonable detail, accurately and fairly reflect the transactions and dispositions of our assets;
|
|
•
|
Provide reasonable assurance that transactions are recorded as necessary to permit preparation of financial statements in conformity with U.S. GAAP, and that receipts and expenditures are being made only in accordance with authorizations from our management and Board of Directors; and
|
|
•
|
Provide reasonable assurance regarding prevention or timely detection of unauthorized acquisition, use or disposition of our assets that could have a material effect on the financial statements.
|
Because of its inherent limitations, internal control over financial reporting may not prevent or detect misstatements. Also, projections of any evaluation of effectiveness to future periods are subject to the risk that controls may become inadequate because of changes in conditions, or that the degree of compliance with the policies or procedures may deteriorate.
Management assessed the effectiveness of the Company’s internal control over financial reporting as of
December 31, 2018
. In assessing the effectiveness of our internal control over financial reporting as of
December 31, 2018
management used the control criteria framework of the Committee of Sponsoring Organizations (COSO) of the Treadway Commission published in its report entitled
Internal Control—Integrated Framework (2013)
. Based on their evaluation, management concluded that the Company’s internal control over financial reporting was effective as of
December 31, 2018
. KPMG LLP, the independent registered public accounting firm that audited the financial statements included in this annual report, has issued an auditors’ report on the Company’s internal control over financial reporting as of
December 31, 2018
.
F-95
TABLE OF CONTENTS
Part IItem 1. BusinessItem 1A. Risk FactorsItem 1B. Unresolved Staff CommentsItem 2. PropertiesItem 3. Legal ProceedingsItem 4. Mine Safety DisclosuresPart IIItem 5. Market For Registrant S Common Equity, Related Stockholder Matters and Issuer Purchases Of Equity SecuritiesItem 6. Selected Financial DataItem 7. Management S Discussion and Analysis Of Financial Condition and Results Of OperationsItem 7A. Quantitative and Qualitative Disclosures About Market RiskItem 8. Financial Statements and Supplementary DataItem 9. Changes in and Disagreements with Accountants on Accounting and Financial DisclosuresItem 9A. Controls and ProceduresItem 9B. Other InformationPart IIIItem 10. Directors, Executive Officers and Corporate GovernanceItem 11. Executive CompensationItem 12. Security Ownership Of Certain Beneficial Owners and Management and Related Stockholder MattersItem 13. Certain Relationships and Related Transactions, and Director IndependenceItem 14. Principal Accounting Fees and ServicesPart IVItem 15. Exhibits and Financial Statement SchedulesItem 16. Form 10-k Summary