MARATHON PETROLEUM CORP
10-Ks and 10-Qs
|
|
|
|
|
|
|
|
|
|
|
|
|
|
|
|
|
|
|
|
|
|
|
|
|
|
|
|
|
|
|
|
|
|
|
|
|
|
|
|
|
|
|
|
|
|
|
|
|
|
UNITED STATES SECURITIES AND EXCHANGE COMMISSION
Washington, D.C. 20549
FORM 10-K
(Mark One)
|
x
|
ANNUAL REPORT PURSUANT TO SECTION 13 OR 15(d) OF THE SECURITIES EXCHANGE ACT OF 1934
|
For the fiscal year ended
December 31, 2018
OR
|
¨
|
TRANSITION REPORT PURSUANT TO SECTION 13 OR 15(d) OF THE SECURITIES EXCHANGE ACT OF 1934
|
For the transition period from
to
Commission file number 001-35054
Marathon Petroleum Corporation
(Exact name of registrant as specified in its charter)
|
Delaware
|
27-1284632
|
|
|
(State or other jurisdiction of incorporation or organization)
|
(I.R.S. Employer Identification No.)
|
|
539 South Main Street, Findlay, OH 45840-3229
(Address of principal executive offices)
(419) 422-2121
(Registrant’s telephone number, including area code)
Securities registered pursuant to Section 12(b) of the Act
|
Title of Each Class
|
Name of Each Exchange on Which Registered
|
|
|
Common Stock, par value $.01
|
New York Stock Exchange
|
|
Securities registered pursuant to Section 12(g) of the Act:
None
Indicate by check mark if the registrant is a well-known seasoned issuer, as defined in Rule 405 of the Securities Act. Yes
þ
No
¨
Indicate by check mark if the registrant is not required to file reports pursuant to Section 13 or Section 15(d) of the Act. Yes
¨
No
þ
Indicate by check mark whether the registrant (1) has filed all reports required to be filed by Section 13 or 15 (d) of the Securities Exchange Act of 1934 during the preceding 12 months and (2) has been subject to such filing requirements for the past 90 days. Yes
þ
No
¨
Indicate by check mark whether the registrant has submitted electronically every Interactive Data File required to be submitted pursuant to Rule 405 of Regulation S-T (§ 232.405 of this chapter) during the preceding 12 months (or for such shorter period that the registrant was required to submit such files). Yes
þ
No
¨
Indicate by check mark if disclosure of delinquent filers pursuant to Item 405 of Regulation S-K is not contained herein, and will not be contained, to the best of registrant’s knowledge, in definitive proxy or information statements incorporated by reference in Part III of this Form 10-K or any amendment to this Form 10-K.
¨
Indicate by check mark whether the registrant is a large accelerated filer, accelerated filer, a non-accelerated filer, a smaller reporting company, or an emerging growth company. See definition of “large accelerated filer,” “accelerated filer,” “smaller reporting company,” and “emerging growth company” in Rule 12b-2 of the Exchange Act. (Check one):
Large accelerated filer
þ
Accelerated filer
¨
Non-accelerated filer
¨
Smaller reporting company
¨
Emerging growth company
¨
If an emerging growth company, indicate by check mark if the registrant has elected not to use the extended transition period for complying with any new or revised financial accounting standards provided pursuant to Section 13(a) of the Exchange Act.
¨
Indicate by check mark whether the registrant is a shell company (as defined in Rule 12b-2 of the Act). Yes
¨
No
þ
The aggregate market value of Common Stock held by non-affiliates as of June 30,
2018
was approximately
$31.9 billion
. This amount is based on the closing price of the registrant’s Common Stock on the New York Stock Exchange on June 29,
2018
. Shares of Common Stock held by executive officers and directors of the registrant are not included in the computation. The registrant, solely for the purpose of this required presentation, has deemed its directors and executive officers to be affiliates.
There were
673,619,190
shares of Marathon Petroleum Corporation Common Stock outstanding as of
February 15, 2019
.
Documents Incorporated By Reference
Portions of the registrant’s proxy statement relating to its
2019
Annual Meeting of Shareholders, to be filed with the Securities and Exchange Commission pursuant to Regulation 14A under the Securities Exchange Act of 1934, are incorporated by reference to the extent set forth in Part III, Items 10-14 of this Report.
MARATHON PETROLEUM CORPORATION
Unless otherwise stated or the context otherwise indicates, all references in this Annual Report on Form 10-K to “MPC,” “us,” “our,” “we” or “the Company” mean Marathon Petroleum Corporation and its consolidated subsidiaries.
TABLE OF CONTENTS
|
|
Page
|
GLOSSARY OF TERMS
Throughout this report, the following company or industry specific terms and abbreviations are used:
|
ASC
|
Accounting Standards Codification
|
|
ANS
|
Alaskan North Slope crude oil, an oil index benchmark price
|
|
ASU
|
Accounting Standards Update
|
|
ASR
|
Accelerated share repurchase
|
|
ATB
|
Articulated tug barges
|
|
barrel
|
One stock tank barrel, or 42 United States gallons liquid volume, used in reference to crude oil or other liquid hydrocarbons.
|
|
bcf/d
|
One billion cubic feet per day
|
|
CARB
|
California Air Resources Board
|
|
CARBOB
|
California Reformulated Gasoline Blendstock for Oxygenate Blending
|
|
CBOB
|
Conventional Blending for Oxygenate Blending
|
|
DEI
|
Designated Environmental Incidents
|
|
EBITDA (a non-GAAP financial measure)
|
Earnings Before Interest, Tax, Depreciation and Amortization
|
|
EPA
|
United States Environmental Protection Agency
|
|
FASB
|
Financial Accounting Standards Board
|
|
GAAP
|
Accounting principles generally accepted in the United States
|
|
IDR
|
Incentive Distribution Right
|
|
LCM
|
Lower of cost or market
|
|
LIBO Rate
|
London Interbank Offered Rate
|
|
LIFO
|
Last in, first out
|
|
LLS
|
Louisiana Light Sweet crude oil, an oil index benchmark price
|
|
mbpd
|
Thousand barrels per day
|
|
mbpcd
|
Thousand barrels per calender day
|
|
Mcf
|
One thousand cubic feet of natural gas
|
|
mmbpcd
|
Million barrels per calender day
|
|
MMcf/d
|
One million cubic feet of natural gas per day
|
|
MMBtu
|
One million British thermal units per day
|
|
NYMEX
|
New York Mercantile Exchange
|
|
NYSE
|
New York Stock Exchange
|
|
NGL
|
Natural gas liquids, such as ethane, propane, butanes and natural gasoline
|
|
PADD
|
Petroleum Administration for Defense District
|
|
OPEC
|
Organization of Petroleum Exporting Countries
|
|
OSHA
|
United States Occupational Safety and Health Administration
|
|
OTC
|
Over-the-Counter
|
|
ppb
|
Parts per billion
|
|
ppm
|
Parts per million
|
|
RFS2
|
Revised Renewable Fuel Standard program, as required by the Energy Independence and Security Act of 2007
|
|
RIN
|
Renewable Identification Number
|
|
SEC
|
United States Securities and Exchange Commission
|
|
STAR
|
South Texas Asset Repositioning
|
|
TCJA
|
Tax Cuts and Jobs Act of 2017
|
|
ULSD
|
Ultra-low sulfur diesel
|
|
USGC
|
U.S. Gulf Coast
|
|
UST
|
Underground storage tank
|
|
VIE
|
Variable interest entity
|
|
VPP
|
Voluntary Protection Program
|
|
WTI
|
West Texas Intermediate crude oil, an oil index benchmark price
|
1
DISCLOSURES REGARDING FORWARD-LOOKING STATEMENTS
This Annual Report on Form 10-K, particularly Item 1. Business, Item 1A. Risk Factors, Item 3. Legal Proceedings, Item 7. Management’s Discussion and Analysis of Financial Condition and Results of Operations and Item 7A. Quantitative and Qualitative Disclosures about Market Risk, includes forward-looking statements. You can identify our forward-looking statements by words such as “anticipate,” “believe,” “could,” “design,” “estimate,” “expect,” “forecast,” “goal,” “guidance,” “imply,” “intend,” “may,” “objective,” “opportunity,” “outlook,” “plan,” “position,” “potential,” “predict,” “project,” “prospective,” “pursue,” “seek,” “should,” “strategy,” “target,” “will,” “would” or other similar expressions that convey the uncertainty of future events or outcomes. In accordance with “safe harbor” provisions of the Private Securities Litigation Reform Act of 1995, these statements are accompanied by cautionary language identifying important factors, though not necessarily all such factors, that could cause future outcomes to differ materially from those set forth in the forward-looking statements.
Forward-looking statements include, but are not limited to, statements that relate to, or statements that are subject to risks, contingencies or uncertainties that relate to:
|
•
|
the risk that the cost savings and any other synergies from the Andeavor acquisition may not be fully realized or may take longer to realize than expected;
|
|
•
|
disruption from the Andeavor acquisition making it more difficult to maintain relationships with customers, employees or suppliers;
|
|
•
|
risks relating to any unforeseen liabilities of Andeavor;
|
|
•
|
the potential merger, consolidation or combination of MPLX LP with Andeavor Logistics LP;
|
|
•
|
future levels of revenues, refining and marketing margins, operating costs, retail gasoline and distillate margins, merchandise margins, income from operations, net income or earnings per share;
|
|
•
|
the regional, national and worldwide availability and pricing of refined products, crude oil, natural gas, NGLs and other feedstocks;
|
|
•
|
consumer demand for refined products;
|
|
•
|
our ability to manage disruptions in credit markets or changes to our credit rating;
|
|
•
|
future levels of capital, environmental or maintenance expenditures, general and administrative and other expenses;
|
|
•
|
the success or timing of completion of ongoing or anticipated capital or maintenance projects;
|
|
•
|
the reliability of processing units and other equipment;
|
|
•
|
business strategies, growth opportunities and expected investments;
|
|
•
|
share repurchase authorizations, including the timing and amounts of any common stock repurchases;
|
|
•
|
the adequacy of our capital resources and liquidity, including but not limited to, availability of sufficient cash flow to execute our business plan and to effect any share repurchases or dividend increases, including within the expected timeframe;
|
|
•
|
the effect of restructuring or reorganization of business components;
|
|
•
|
the potential effects of judicial or other proceedings on our business, financial condition, results of operations and cash flows;
|
|
•
|
continued or further volatility in and/or degradation of general economic, market, industry or business conditions;
|
|
•
|
compliance with federal and state environmental, economic, health and safety, energy and other policies and regulations, including the cost of compliance with the Renewable Fuel Standard, and/or enforcement actions initiated thereunder; and
|
|
•
|
the anticipated effects of actions of third parties such as competitors, activist investors or federal, foreign, state or local regulatory authorities or plaintiffs in litigation.
|
Our forward-looking statements are not guarantees of future performance, and you should not rely unduly on them, as they involve risks, uncertainties and assumptions that we cannot predict. Material differences between actual results and any future performance suggested in our forward-looking statements could result from a variety of factors, including the following:
|
•
|
volatility or degradation in general economic, market, industry or business conditions;
|
|
•
|
availability and pricing of domestic and foreign supplies of natural gas, NGLs and crude oil and other feedstocks;
|
|
•
|
the ability of the members of the OPEC to agree on and to influence crude oil price and production controls;
|
|
•
|
availability and pricing of domestic and foreign supplies of refined products such as gasoline, diesel fuel, jet fuel, home heating oil and petrochemicals;
|
2
|
•
|
foreign imports and exports of crude oil, refined products, natural gas and NGLs;
|
|
•
|
refining industry overcapacity or under capacity;
|
|
•
|
changes in producer customers’ drilling plans or in volumes of throughput of crude oil, natural gas, NGLs, refined products or other hydrocarbon-based products;
|
|
•
|
changes in the cost or availability of third-party vessels, pipelines, railcars and other means of transportation for crude oil, natural gas, NGLs, feedstocks and refined products;
|
|
•
|
changes to our capital budget, expected construction costs and timing of projects;
|
|
•
|
the price, availability and acceptance of alternative fuels and alternative-fuel vehicles and laws mandating such fuels or vehicles;
|
|
•
|
fluctuations in consumer demand for refined products, natural gas and NGLs, including seasonal fluctuations;
|
|
•
|
political and economic conditions in nations that consume refined products, natural gas and NGLs, including the United States, and in crude oil producing regions, including the Middle East, Africa, Canada and South America;
|
|
•
|
actions taken by our competitors, including pricing adjustments, expansion of retail activities, the expansion and retirement of refining capacity and the expansion and retirement of pipeline capacity, processing, fractionation and treating facilities in response to market conditions;
|
|
•
|
completion of pipeline projects within the United States;
|
|
•
|
changes in fuel and utility costs for our facilities;
|
|
•
|
failure to realize the benefits projected for capital projects, or cost overruns associated with such projects;
|
|
•
|
modifications to MPLX and ANDX earnings and distribution growth objectives;
|
|
•
|
the ability to successfully implement growth opportunities, including strategic initiatives and actions;
|
|
•
|
risks and uncertainties associated with intangible assets, including any future goodwill or intangible assets impairment charges;
|
|
•
|
the ability to realize the strategic benefits of joint venture opportunities;
|
|
•
|
accidents or other unscheduled shutdowns affecting our refineries, machinery, pipelines, processing, fractionation and treating facilities or equipment, or those of our suppliers or customers;
|
|
•
|
unusual weather conditions and natural disasters, which can unforeseeably affect the price or availability of crude oil and other feedstocks and refined products;
|
|
•
|
acts of war, terrorism or civil unrest that could impair our ability to produce refined products, receive feedstocks or to gather, process, fractionate or transport crude oil, natural gas, NGLs or refined products;
|
|
•
|
state and federal environmental, economic, health and safety, energy and other policies and regulations, including the cost of compliance with the renewable fuel standard program;
|
|
•
|
adverse changes in laws including with respect to tax and regulatory matters;
|
|
•
|
rulings, judgments or settlements and related expenses in litigation or other legal, tax or regulatory matters, including unexpected environmental remediation costs, in excess of any reserves or insurance coverage;
|
|
•
|
political pressure and influence of environmental groups upon policies and decisions related to the production, gathering, refining, processing, fractionation, transportation and marketing of crude oil or other feedstocks, refined products, natural gas, NGLs or other hydrocarbon-based products;
|
|
•
|
labor and material shortages;
|
|
•
|
the maintenance of satisfactory relationships with labor unions and joint venture partners;
|
|
•
|
the ability and willingness of parties with whom we have material relationships to perform their obligations to us;
|
|
•
|
the market price of our common stock and its impact on our share repurchase authorizations;
|
|
•
|
changes in the credit ratings assigned to our debt securities and trade credit, changes in the availability of unsecured credit, changes affecting the credit markets generally and our ability to manage such changes;
|
|
•
|
capital market conditions and our ability to raise adequate capital to execute our business plan;
|
|
•
|
the costs, disruption and diversion of management’s attention associated with campaigns commenced by activist investors; and
|
|
•
|
the other factors described in Item 1A. Risk Factors.
|
We undertake no obligation to update any forward-looking statements except to the extent required by applicable law.
3
PART I
ITEM 1. BUSINESS
OVERVIEW
Marathon Petroleum Corporation (“MPC”) has
131
years of experience in the energy business with roots tracing back to the formation of the Ohio Oil Company in 1887. We are a leading, integrated, downstream energy company headquartered in Findlay, Ohio. With the acquisition of Andeavor October 1, 2018 (as described further below), we are the largest independent petroleum product refining, marketing, retail and midstream business in the United States. We operate the nation's largest refining system with more than 3 million barrels per day of crude oil capacity across 16 refineries. MPC's marketing system includes branded locations across the United States. We also own and operate retail convenience stores across the United States. MPC’s midstream operations are primarily conducted through MPLX LP (“MPLX”) and Andeavor Logistics LP (“ANDX”), which own and operate crude oil and light product transportation and logistics infrastructure as well as gathering, processing and fractionation assets. We own the general partner and majority limited partner interests in these two midstream companies.
Our operations consist of three reportable operating segments: Refining & Marketing;
Retail
; and
Midstream
. Each of these segments is organized and managed based upon the nature of the products and services it offers.
|
•
|
Refining & Marketing – refines crude oil and other feedstocks at our
16
refineries
in the West Coast, Gulf Coast and Mid-Continent regions of the United States, purchases refined products and ethanol for resale and distributes refined products largely through transportation, storage, distribution and marketing services provided largely by our Midstream segment. We sell refined products to wholesale marketing customers domestically and internationally, to buyers on the spot market, to our Retail business segment and to independent entrepreneurs who operate primarily Marathon
®
branded outlets.
|
|
•
|
Retail – sells transportation fuels and convenience products in the retail market across the United States through company-owned and operated convenience stores, primarily under the Speedway brand, and long-term fuel supply contracts with direct dealers who operate locations mainly under the ARCO brand.
|
|
•
|
Midstream – transports, stores, distributes and markets crude oil and refined products principally for the Refining & Marketing segment via refining logistics assets, pipelines, terminals, towboats and barges; gathers, processes and transports natural gas; and gathers, transports, fractionates, stores and markets NGLs. The Midstream segment primarily reflects the results of MPLX and ANDX, our sponsored master limited partnerships.
|
Andeavor Acquisition
On October 1, 2018, we completed the Andeavor acquisition. Under the terms of the merger agreement, Andeavor stockholders had the option to choose
1.87
shares of MPC common stock or
$152.27
in cash per share of Andeavor common stock. The merger agreement included election proration provisions that resulted in approximately
22.9 million
shares of Andeavor common stock being converted into cash consideration and the remaining
128.2 million
shares of Andeavor common stock being converted into stock consideration. Andeavor stockholders received in the aggregate approximately
239.8 million
shares of MPC common stock valued at
$19.8 billion
and approximately
$3.5 billion
in cash in connection with the Andeavor acquisition. Through the Andeavor acquisition, we acquired the general partner and 156 million common units of ANDX, which is a publicly traded master limited partnership (“MLP”) that was formed to own, operate, develop and acquire logistics assets.
Andeavor was a highly integrated marketing, logistics and refining company operating primarily in the Western and Mid-Continent United States. Andeavor’s operations included procuring crude oil from its source or from other third parties, transporting the crude oil to one of its 10 refineries, and producing, marketing and distributing refined products. Its marketing system included more than 3,300 stations marketed under multiple well-known fuel brands including ARCO
®
. Also, as noted above, we acquired the general partner and 156 million common units of ANDX, a leading growth-oriented, full service, and diversified midstream company which owns and operates networks of crude oil, refined products and natural gas pipelines, terminals with crude oil and refined products storage capacity, rail loading and offloading facilities, marine terminals including storage, bulk petroleum distribution facilities, a trucking fleet and natural gas processing and fractionation complexes.
This transaction combined two strong, complementary companies to create a leading nationwide U.S. downstream energy company. The acquisition substantially increases our geographic diversification and scale and strengthens each of our operating segments by diversifying our refining portfolio into attractive markets and increasing access to advantaged feedstocks, enhancing our midstream footprint in the Permian Basin, and creating a nationwide retail and marketing portfolio all of which is expected to substantially improve efficiencies and our ability to serve customers. We expect the combination to generate up
4
to approximately $1.4 billion in gross run-rate synergies within the first three years, significantly enhancing our long-term cash flow generation profile.
See Item 8. Financial Statements and Supplementary Data – Note
5
for additional information on other acquisitions and investments in affiliates.
Transactions with MPLX
On February 1, 2018, we completed the dropdown of the remaining identified assets related to our strategic actions to enhance shareholder value announced in January 2017. We contributed our refining logistics assets and fuels distribution services to MPLX in exchange for
$4.1 billion
in cash and approximately 114 million newly issued MPLX common units. Immediately following the dropdown, our IDRs were cancelled and our economic general partner interest was converted into a non-economic general partner interest, all in exchange for 275 million newly issued MPLX common units. MPLX financed the cash portion of the February 1, 2018 dropdown with its
$4.1 billion
364
-day term loan facility, which was entered into on January 2, 2018. On February 8, 2018, MPLX issued
$5.5 billion
in aggregate principal amount of senior notes in a public offering. MPLX used
$4.1 billion
of the net proceeds of the offering to repay the 364-day term-loan facility. The remaining proceeds were used to repay outstanding borrowings under MPLX’s revolving credit facility and intercompany loan agreement with us and for general partnership purposes.
Corporate History and Structure
MPC was incorporated in Delaware on November 9, 2009 in connection with an internal restructuring of Marathon Oil Corporation (“Marathon Oil”). On May 25, 2011, the Marathon Oil board of directors approved the spinoff of its Refining, Marketing & Transportation Business into an independent, publicly traded company, MPC, through the distribution of MPC common stock to the stockholders of Marathon Oil common stock on June 30, 2011. Our common stock trades on the NYSE under the ticker symbol “MPC.”
MPLX is a diversified, large-cap publicly traded MLP formed by us in 2012 that owns and operates midstream energy infrastructure and logistics assets, and provides fuels distribution services. As of
December 31, 2018
, we owned the general partner and
63.6 percent
of the outstanding MPLX common units.
ANDX is a publicly traded MLP that was formed in 2010 to own, operate, develop and acquire logistics assets. As of
December 31, 2018
, we owned the general partner and
63.6 percent
of the outstanding ANDX common units.
OUR BUSINESS STRATEGIES
By following our core values, we aim to achieve our strategic vision outlined below.
Core Values and Operational Excellence
Our core values are the foundation for all we do and include the following:
|
•
|
Health and Safety
: We have the highest regard for the health and safety of our employees, contractors and neighboring communities.
|
|
•
|
Environmental Stewardship
: We are committed to minimizing our environmental impact and continually look for ways to reduce our footprint.
|
|
•
|
Integrity
: We uphold the highest standards of business ethics and integrity, enforcing strict principles of corporate governance. We strive for transparency in all of our operations.
|
|
•
|
Corporate Citizenship
: We work to make a positive difference in the communities where we have the privilege to operate.
|
|
•
|
Inclusive Culture
: We value diversity and strive to provide our employees with a collaborative, supportive, and inclusive work environment where they can maximize their full potential for personal and business success.
|
Maintain Top-Tier Safety and Environmental Performance
We remain committed to operating our assets in a safe and reliable manner and targeting continual improvement in our safety and environmental record across our operations through the use of a rigorous, independently audited management system, RC14001
®
:2015. This management system integrates health, environmental stewardship, safety and security to ensure compliance and continual improvement. Six of our 16 refineries, the Marathon Pipeline organization and the Terminal, Transport and Rail organization are already certified to the RC14001 standard. We expect our natural gas gathering and processing operations will begin to seek RC14001 certification in 2020 and we have begun the process of integrating our newly acquired operations into the RC14004 management system.
5
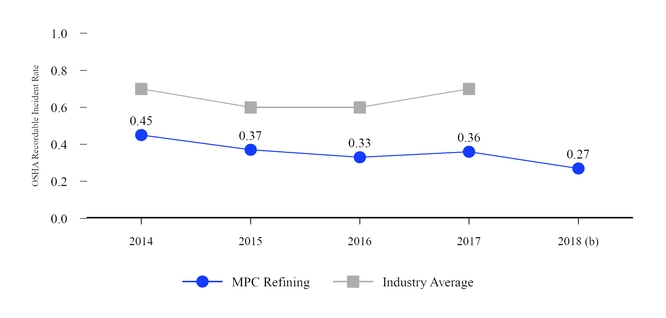
As noted in the graph below, our Refining operations continue to demonstrate solid personal safety performance as compared to similar industry averages.
Safety Performance
(a)
|
(a)
|
Safety performance is based on the OSHA Recordable Incident Rate for the Refining industry. The industry average source is the Bureau of Labor Statistics and data is not yet available for 2018.
|
|
(b)
|
Legacy Andeavor refineries included beginning full year 2018.
|
In addition, our corporate headquarters, four of our 16 refineries and 14 additional facilities have earned designations as an OSHA VPP Star site. This designation recognizes the outstanding efforts of employers and employees who have implemented effective safety and health management systems and achieved exemplary occupational safety and health performance. Three additional sites have completed their OSHA VPP inspections in 2018 and will be eligible for VPP status in 2019.
We proactively address our regulatory requirements and encourage our operations to continually improve their environmental performance through our DEI program, which establishes goals and measures performance. DEI is a metric adopted by MPC to capture several categories simultaneously. It includes three categories of environmental incidents: releases to the environment (air, land or water), environmental permit exceedances and agency enforcement actions. We rank DEIs in terms of their severity, with Tier 4 being the most severe, and Tier 1 being the least. We report and track these as a leading indicator that helps us to identify potential problems before they occur. We continually strive for improvements in our environmental performance. In
2018
, we experienced 23 DEIs, a 62 percent reduction from 2013, and we have already begun to integrate our recently acquired operations into these programs.
In 2018, the EPA recognized Marathon Petroleum Corporation as an ENERGY STAR Partner of the Year, the only oil and gas company to receive such honor. This award recognized the significant energy efficiency gains achieved since we established our “Focus on Energy” program at our refineries nearly a decade ago. Through the implementation of this program, we have earned 75 percent of the total ENERGY STAR certifications awarded to the U.S. refining sector since 2006. Overall, we have realized considerable savings in energy costs and our energy efficiency efforts have enabled us to significantly lower our greenhouse gas intensity.
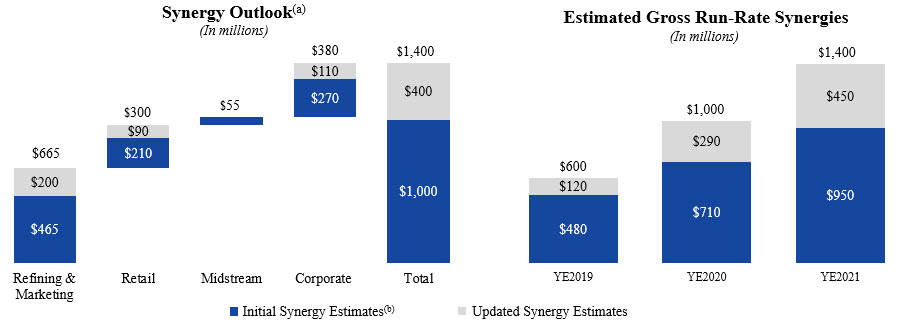
Capture Value and Leverage Integrated Business Model
With the acquisition of Andeavor on October 1, 2018, we believe the enhanced scale and integration of our midstream, retail and refining assets distinguishes us from our competitors. Our nationwide footprint enables connectivity to key supply sources and demand hubs. We have additional access to advantaged feedstocks and our expanded logistics system lowers crude acquisition costs, increases optionality, and increases our speed to market. Our broader market presence creates new product placement options and our nationwide marketing channels create even further optimization opportunities. With operations coast to coast, we intend to leverage and optimize the significant scale of our midstream, retail and refining assets to recognize up to approximately $1.4 billion of gross run-rate synergies by the end of 2021. Further information about our synergy outlook and estimated gross run-rate synergies are included below:
6
|
(a)
|
Procurement synergies allocated 50/50 to Refining & Marketing and Corporate.
|
|
(b)
|
Initial synergy estimates provided April 30, 2018.
|
Strategically Invest in Attractive Long-Term Growth Opportunities
We intend to allocate significant portions of our capital to investments focused on enhancing margins system wide with disciplined allocation to projects with superior returns.
Our Refining & Marketing segment projects are focused on refinery optimization, production of higher value products, increased capacity to upgrade residual fuel oil and expanded export capacity. Investing to enhance margins, we will continue our disciplined high-return investments in resid upgrading capacity and the ability to produce more diesel. We also plan to continue investing in domestic light products supply placement flexibility, as well as increasing our export capacity.
In our Retail segment, projects are focused on high value growth opportunities, real estate and store portfolio optimization and technology enhancements. Our plans include conversion of recently acquired locations to the Speedway brand and systems, growth in existing and new markets, dealer sites, commercial fueling/diesel expansion, food service through store remodels and high quality acquisitions.
In our Midstream segment, projects are focused on meeting market needs in the Permian, Marcellus and Utica basins as well as investments in export opportunities and long-haul pipelines. We plan to invest in gathering systems to create significant growth opportunities in the Permian Basin and in long-haul pipelines to generate stable, fee-based midstream income while helping to lower feedstock costs for our refineries. We also plan to expand our value chain by connecting growing natural gas production to demand from our refineries and global export markets and by connecting growing NGL production and developing new fractionation infrastructure in the Gulf Coast. Export facilities create the ability to generate third party revenue and meet global demand for crude, refined products and NGLs.
Focus on Disciplined Capital Allocation and Shareholder Returns
We intend to maintain our focus on a disciplined and balanced approach to capital allocation, including return of capital to shareholders, in a manner consistent with maintaining an investment-grade credit profile. Since becoming a stand-alone company in June 2011, our dividend has increased by a 24.9 percent compound annual growth rate and our board of directors has authorized share repurchases totaling
$18.0 billion
. Through open market purchases and two ASR programs, we have repurchased
293 million
shares of our common stock for approximately
$13.10 billion
, representing approximately
41
percent of our outstanding common shares when we became a stand-alone company in June 2011. We achieved these shareholder returns while meaningfully investing in the business and maintaining an investment-grade credit profile. As of
December 31, 2018
,
$4.90 billion
of authorization remains available for future share repurchases.
Utilize and Enhance our High Quality Employee Workforce
We utilize our high quality employee workforce by continuously leveraging their commercial skills and business acumen. In addition, we continue to enhance our workforce through active recruitment of the best candidates, including those from diverse backgrounds, and effective training programs on safety, environmental stewardship, diversity and inclusion and other professional and technical skills.
7
OUR OPERATIONS
Our operations consist of three reportable operating segments: Refining & Marketing; Retail; and Midstream.
REFINING & MARKETING
Refineries
We currently own and operate
16
refineries in the Gulf Coast, Mid-Continent and West Coast regions of the United States with an aggregate crude oil refining capacity of
3,021
mbpcd. On October 1, 2018, we acquired 10 refineries as part of the Andeavor acquisition which added approximately
1,117
mbpcd to our total capacity. During
2018
, our refineries processed
2,081
mbpd of crude oil and
193
mbpd of other charge and blendstocks. During
2017
, our refineries processed
1,765
mbpd of crude oil and
179
mbpd of other charge and blendstocks.
Our refineries include crude oil atmospheric and vacuum distillation, fluid catalytic cracking, hydrocracking, catalytic reforming, coking, desulfurization and sulfur recovery units. The refineries process a wide variety of condensate, light and heavy crude oils purchased from various domestic and foreign suppliers. We produce numerous refined products, ranging from transportation fuels, such as reformulated gasolines, blend-grade gasolines intended for blending with ethanol and ULSD fuel, to heavy fuel oil and asphalt. Additionally, we manufacture aromatics, propane, propylene and sulfur. See the Refined Product Marketing section for further information about the products we produce.
Our refineries are integrated with each other via pipelines, terminals and barges to maximize operating efficiency. The transportation links that connect our refineries allow the movement of intermediate products between refineries to optimize operations, produce higher margin products and efficiently utilize our processing capacity. For example, naphtha may be moved from Galveston Bay to Robinson where excess reforming capacity is available. Also, shipping intermediate products between facilities during partial refinery shutdowns allows us to utilize processing capacity that is not directly affected by the shutdown work.
Following is a description of each of our refineries and their capacity by region.
Gulf Coast Region (
1,149
mbpcd)
Galveston Bay, Texas City, Texas Refinery (
585
mbpcd)
. Our Galveston Bay refinery is a world-class refining complex resulting from the combination of our former Texas City refinery and Galveston Bay refinery, which we acquired on February 1, 2013. The refinery is located on the Texas Gulf Coast approximately 30 miles southeast of Houston, Texas and can process a wide variety of crude oils into gasoline, distillates, aromatics, heavy fuel oil, dry gas, fuel-grade coke, refinery-grade propylene, chemical-grade propylene and sulfur. The refinery has access to the export market and multiple options to sell refined products. Our cogeneration facility, which supplies the Galveston Bay refinery, currently has
1,055
megawatts of electrical production capacity and can produce
4.3 million
pounds of steam per hour. Approximately
45 percent
of the power generated in
2018
was used at the refinery, with the remaining electricity being sold into the electricity grid.
Garyville, Louisiana Refinery (
564
mbpcd)
.
Our Garyville, Louisiana refinery is located along the Mississippi River in southeastern Louisiana between New Orleans, Louisiana and Baton Rouge, Louisiana. The Garyville refinery is configured to process a wide variety of crude oils into gasoline, distillates, fuel-grade coke, asphalt, polymer-grade propylene, propane, refinery-grade propylene, dry gas, slurry and sulfur. The refinery has access to the export market and multiple options to sell refined products. A major expansion project was completed in 2009 that increased Garyville’s crude oil refining capacity, making it one of the largest refineries in the U.S. Our Garyville refinery has earned designation as an OSHA VPP Star site.
Mid-Continent Region (
1,161
mbpcd)
Catlettsburg, Kentucky Refinery (
277
mbpcd)
. Our Catlettsburg, Kentucky refinery is located in northeastern Kentucky on the western bank of the Big Sandy River, near the confluence with the Ohio River. The Catlettsburg refinery processes sweet and sour crude oils into gasoline, distillates, asphalt, aromatics, heavy fuel oil and propane. In the second quarter of 2015, we completed construction of a condensate splitter at our Catlettsburg refinery, which increased our capacity to process condensate from the Utica shale region.
Robinson, Illinois Refinery (
245
mbpcd)
. Our Robinson, Illinois refinery is located in southeastern Illinois. The Robinson refinery processes sweet and sour crude oils into gasoline, distillates, propane, anode-grade coke, fuel-grade coke and aromatics. The Robinson refinery has earned designation as an OSHA VPP Star site.
Detroit, Michigan Refinery (
140
mbpcd)
. Our Detroit, Michigan refinery is located in southwest Detroit. It is the only petroleum refinery currently operating in Michigan. The Detroit refinery processes sweet and heavy sour crude oils into gasoline, distillates, asphalt, fuel-grade coke, chemical-grade propylene, propane and slurry. Our Detroit refinery earned designation as an OSHA VPP Star site. In the fourth quarter of 2012, we completed a heavy oil upgrading and expansion project that enabled the refinery to process up to an additional 80 mbpd of heavy sour crude oils, including Canadian crude oils.
8
El Paso, Texas Refinery (
131
mbpcd)
. Our El Paso Refinery is located approximately three miles east of downtown El Paso, Texas. The El Paso refinery processes sweet and sour crudes into gasoline, distillates, heavy fuel oil, asphalt and propane. The refinery has access to the Permian Basin shale region.
St. Paul Park, Minnesota Refinery (
98
mbpcd)
. Our St. Paul Park Refinery is located along the Mississippi River southeast of St. Paul Park, Minnesota and was originally built in 1939. The St. Paul Park refinery primarily processes sweet crude from the Bakken region in North Dakota as well as various grades of Canadian sweet and heavy sour crude and manufactures gasoline, distillates, asphalt, heavy fuel oil, propane and refinery-grade propylene.
Canton, Ohio Refinery (
93
mbpcd)
. Our Canton, Ohio refinery is located approximately 60 miles south of Cleveland, Ohio. The Canton refinery processes sweet and sour crude oils, including production from the nearby Utica Shale, into gasoline, distillates, asphalt, roofing flux, propane, refinery-grade propylene and slurry. In December 2014, we completed construction of a condensate splitter at our Canton refinery, which increased our capacity to process condensate from the Utica shale region. The Canton refinery has earned designation as an OSHA VPP Star site.
Mandan, North Dakota Refinery (
71
mbpcd)
. Our Mandan Refinery began operations in 1954. The Mandan refinery processes primarily sweet domestic crude oil from North Dakota and manufactures gasoline, distillates, propane and heavy fuel oil.
Salt Lake City, Utah Refinery (
61
mbpcd)
. Our Salt Lake City Refinery began operations in 1908 and is now the largest in Utah. The Salt Lake City refinery processes crude oil from Utah, Colorado, Wyoming and Canada to manufacture gasoline, distillates, propane and heavy fuel oil.
Gallup, New Mexico Refinery (
26
mbpcd)
. Our Gallup Refinery is located near Gallup, New Mexico and is the only active refinery in the Four Corners area. The Gallup refinery primarily processes high-quality crude known as Four Corners Sweet into gasoline, distillate, heavy fuel oil and propane.
Dickinson, North Dakota Refinery (
19
mbpcd)
. Our Dickinson Refinery is located four miles west of Dickinson, North Dakota and is the first refinery in the U.S. to be built in over 30 years. The Dickinson refinery primarily processes domestic crude oil from North Dakota and manufactures ultra-low sulfur diesel and gasoline blendstocks. We plan to convert this refinery into a 12 mbpcd, 100 percent renewable diesel facility that will process refined soy oil and other organically derived feedstocks by December 2020.
West Coast Region (
711
mbpcd)
Los Angeles, California Refinery (
363
mbpcd)
. Our Los Angeles Refinery is located in Los Angeles County, near the Los Angeles Harbor. The Los Angeles Refinery is the largest refinery on the West Coast and is a major producer of clean fuels. The Los Angeles refinery processes heavy crude from California’s San Joaquin Valley and Los Angeles Basin as well as crudes from the Alaska North Slope, South America, West Africa and other international sources and manufactures cleaner-burning CARB gasoline and CARB diesel fuel, as well as conventional gasoline, distillates, petroleum coke, anode-grade coke, chemical-grade propylene, fuel-grade coke, heavy fuel oil and propane.
Martinez, California Refinery (
161
mbpcd)
. Our Martinez Refinery is located in Martinez, California. The Martinez refinery processes crude oils from California and other domestic and foreign sources and manufactures cleaner-burning CARB gasoline and CARB diesel fuel, as well as conventional gasoline and distillates, petroleum coke, propane, heavy fuel oil and refinery-grade propylene.
Anacortes, Washington Refinery (
119
mbpcd)
. Our Anacortes Refinery is located about 70 miles north of Seattle on Puget Sound. The Anacortes refinery processes Canadian crude, domestic crude from North Dakota and Alaska North Slope and international crudes to manufacture gasoline, distillates, heavy fuel oil and propane.
Kenai, Alaska Refinery (
68
mbpcd)
. Our Kenai Refinery is located on the Cook Inlet, 60 miles southwest of Anchorage. The Kenai refinery processes mainly Alaska domestic crude along with limited international crude and manufactures gasoline, distillates, heavy fuel oil, asphalt and propane.
Planned maintenance activities, or turnarounds, requiring temporary shutdown of certain refinery operating units, are periodically performed at each refinery. See Item 7. Management’s Discussion and Analysis of Financial Condition and Results of Operations for additional detail.
9
Refined Product Yields
The following table sets forth our refinery production by product group for each of the last three years including production from the refineries acquired in the Andeavor acquisition from October 1, 2018 forward.
|
(
mbpd
)
|
2018
|
2017
|
2016
|
||||||
|
Gasoline
|
1,107
|
|
932
|
|
900
|
|
|||
|
Distillates
|
773
|
|
641
|
|
617
|
|
|||
|
Propane
|
41
|
|
36
|
|
35
|
|
|||
|
Feedstocks and petrochemicals
|
288
|
|
277
|
|
241
|
|
|||
|
Heavy fuel oil
|
38
|
|
37
|
|
32
|
|
|||
|
Asphalt
|
69
|
|
63
|
|
58
|
|
|||
|
Total
|
2,316
|
|
1,986
|
|
1,883
|
|
|||
Crude Oil Supply
We obtain the crude oil we refine through negotiated term contracts and purchases or exchanges on the spot market. Our term contracts generally have market-related pricing provisions. The following table provides information on our sources of crude oil for each of the last three years and includes production from the refineries acquired in the Andeavor acquisition from October 1, 2018 forward. The crude oil sourced outside of North America was acquired from various foreign national oil companies, production companies and trading companies.
|
(
mbpd
)
|
2018
|
2017
|
2016
|
||||||
|
United States
|
1,319
|
|
999
|
|
986
|
|
|||
|
Canada
|
297
|
|
381
|
|
326
|
|
|||
|
Middle East and other international
|
465
|
|
385
|
|
387
|
|
|||
|
Total
|
2,081
|
|
1,765
|
|
1,699
|
|
|||
Our refineries receive crude oil and other feedstocks and distribute our refined products through a variety of channels, including pipelines, trucks, railcars, ships and barges.
Renewable Fuels
We currently own a biofuel production facility in Cincinnati, Ohio that produces biodiesel, glycerin and other by-products. The capacity of the plant is approximately 80 million gallons per year.
We hold ownership interests in ethanol production facilities in Albion, Michigan; Clymers, Indiana and Greenville, Ohio. These plants have a combined ethanol production capacity of approximately
410
million gallons per year (
27
mbpd) and are managed by a co-owner.
Refined Product Marketing
Our refined products are primarily sold to independent retailers, wholesale customers, our brand jobbers, our Retail segment, airlines, transportation companies and utilities. Our Brand footprint expanded by approximately 1,100 branded outlets in the Western and Mid-Continental regions of the U.S. and Mexico through the Andeavor acquisition. As of
December 31, 2018
, there were
6,813
branded outlets in
35
states, the District of Columbia and Mexico where independent entrepreneurs primarily maintain Marathon-branded outlets. We believe we are one of the largest wholesale suppliers of gasoline and distillates to resellers and consumers within our
41
-state market area.
10
The following table sets forth our refined product sales volumes by product group for each of the last three years including sales from the refineries acquired in the Andeavor acquisition from October 1, 2018 forward.
|
(
mbpd
)
|
2018
|
2017
|
2016
|
||||||
|
Gasoline
|
1,416
|
|
1,201
|
|
1,219
|
|
|||
|
Distillates
|
847
|
|
691
|
|
676
|
|
|||
|
Propane
|
44
|
|
37
|
|
35
|
|
|||
|
Feedstocks and petrochemicals
|
289
|
|
265
|
|
231
|
|
|||
|
Heavy fuel oil
|
37
|
|
39
|
|
35
|
|
|||
|
Asphalt
|
70
|
|
68
|
|
63
|
|
|||
|
Total
|
2,703
|
|
2,301
|
|
2,259
|
|
|||
Refined Product Sales Destined for Export
We sell gasoline, distillates and asphalt for export, primarily out of our Garyville, Galveston Bay, Anacortes, Martinez, Los Angeles and Kenai refineries. The following table sets forth our refined product sales destined for export by product group for the past three years including sales from the refineries acquired in the Andeavor acquisition from October 1, 2018 forward.
|
(
mbpd
)
|
2018
|
2017
|
2016
|
||||||
|
Gasoline
|
117
|
|
96
|
|
91
|
|
|||
|
Distillates
|
193
|
|
192
|
|
199
|
|
|||
|
Asphalt and other
|
24
|
|
9
|
|
6
|
|
|||
|
Total
|
334
|
|
297
|
|
296
|
|
|||
Gasoline and Distillates
.
We sell gasoline, gasoline blendstocks and distillates (including No. 1 and No. 2 fuel oils, jet fuel, kerosene and diesel fuel) to wholesale customers, Marathon-branded independent entrepreneurs, our Retail segment, and on the spot market. In addition, we sell diesel fuel and gasoline for export to international customers. The demand for gasoline and distillates is seasonal in many of our markets, with demand typically at its highest levels during the summer months.
Propane
.
We produce propane at all of our refineries except Dickinson. Propane is primarily used for home heating and cooking, as a feedstock within the petrochemical industry, for grain drying and as a fuel for trucks and other vehicles. Our propane sales are split approximately 60 percent and 40 percent between the home heating market and petrochemical consumers, respectively.
Feedstocks and Petrochemicals
.
We are a producer and marketer of feedstocks and petrochemicals. Product availability varies by refinery and includes naptha, raffinate, benzene, butane, alkylate, dry gas, xylene, propylene, cumene, platformate and toluene. We market these products domestically to customers in the chemical, agricultural and fuel-blending industries. In addition, we produce fuel-grade coke at our Garyville, Detroit, Galveston Bay and Los Angeles refineries, which is used for power generation and in miscellaneous industrial applications, and anode-grade coke at our Los Angeles and Robinson refineries, which is used to make carbon anodes for the aluminum smelting industry.
Heavy Fuel Oil
.
We produce and market heavy residual fuel oil or related components, including slurry, at all of our refineries except Dickinson. Heavy residual fuel oil is primarily used in the utility and ship bunkering (fuel) industries, though there are other more specialized uses of the product.
Asphalt
.
We have refinery-based asphalt production capacity of up to
136
mbpcd, which includes asphalt cements, polymer-modified asphalt, emulsified asphalt, industrial asphalts and roofing flux. We have a broad customer base, including asphalt-paving contractors, government entities (states, counties, cities and townships) and asphalt roofing shingle manufacturers. We sell asphalt in the domestic and export wholesale markets via rail, barge and vessel.
Terminals and Transportation
We transport, store and distribute crude oil, feedstocks and refined products through pipelines, terminals and marine fleets owned by MPLX, ANDX and third parties in our market areas.
We own a fleet of transport trucks and trailers for the movement of refined products and crude oil. In addition, we maintain a fleet of leased and owned railcars for the movement and storage of refined products.
11
The locations and detailed information about our Refining & Marketing assets are included under Item 2. Properties and are incorporated herein by reference.
Competition, Market Conditions and Seasonality
The downstream petroleum business is highly competitive, particularly with regard to accessing crude oil and other feedstock supply and the marketing of refined products. We compete with a number of other companies to acquire crude oil for refinery processing and in the distribution and marketing of a full array of refined products. Based upon the “The Oil & Gas Journal 2018 Worldwide Refinery Survey,” we ranked first among U.S. petroleum companies on the basis of U.S. crude oil refining capacity.
We compete in four distinct markets for the sale of refined products—wholesale, spot, branded and retail distribution. Our marketing operations compete with numerous other independent marketers, integrated oil companies and high-volume retailers. We compete with companies in the sale of refined products to wholesale marketing customers, including private-brand marketers and large commercial and industrial consumers; companies in the sale of refined products in the spot market; and refiners or marketers in the supply of refined products to refiner-branded independent entrepreneurs. In addition, we compete with producers and marketers in other industries that supply alternative forms of energy and fuels to satisfy the requirements of our industrial, commercial and retail consumers.
Market conditions in the oil and gas industry are cyclical and subject to global economic and political events and new and changing governmental regulations. Our operating results are affected by price changes in crude oil, natural gas and refined products, as well as changes in competitive conditions in the markets we serve. Price differentials between sweet and sour crude oils, ANS, WTI and LLS crude oils and other market structure differentials also affect our operating results.
Demand for gasoline, diesel fuel and asphalt is higher during the spring and summer months than during the winter months in most of our markets, primarily due to seasonal increases in highway traffic and construction. As a result, the operating results for our Refining & Marketing segment for the first and fourth quarters may be lower than for those in the second and third quarters of each calendar year.
RETAIL
Our Retail segment sells gasoline, diesel and merchandise through convenience stores that it owns and operates, primarily under the Speedway brand, as well as through direct dealer locations. Our company-owned and operated convenience stores offer a wide variety of merchandise, including prepared foods, beverages and non-food items. Speedway’s Speedy Rewards
®
loyalty program has been a highly successful loyalty program since its inception in 2004, with a consistently growing base which averaged approximately
6.2 million
active members in
2018
. Speedway’s ability to capture and analyze member-specific transactional data enables us to offer Speedy Rewards
®
members discounts and promotions specific to their buying behavior. We believe Speedy Rewards
®
is a key reason customers choose Speedway over competitors and it continues to drive significant value for both Speedway and our Speedy Rewards
®
members.
As of
December 31, 2018
, our Retail segment had
3,923
company-owned and operated convenience stores across the United States. We acquired approximately 1,100 company-owned and operated retail convenience stores and fuel only locations as part of the Andeavor acquisition in the Western and Mid-Continental regions of the United States. In addition, we acquired long-term supply contracts for
1,065
direct dealer locations primarily in Southern California, largely under the ARCO
®
brand, which are also included in our Retail segment.
Speedway also owns a 29 percent interest in PFJ Southeast LLC (“PFJ Southeast”), which is a joint venture between Speedway and Pilot Flying J with 127 travel center locations primarily in the Southeast United States as of
December 31, 2018
. We also own SuperMom’s
®
, a high-quality bakery and commissary.
The locations and detailed information about our
Retail
assets are included under Item 2. Properties and are incorporated herein by reference.
Competition, Market Conditions and Seasonality
We face strong competition for sales of retail gasoline, diesel fuel and merchandise. Our competitors include service stations and convenience stores operated by fully integrated major oil companies, independent entrepreneurs and other well-recognized national or regional convenience stores and travel centers, often selling gasoline, diesel fuel and merchandise at competitive prices. Non-traditional retailers, such as supermarkets, club stores and mass merchants, have affected the convenience store industry with their entrance into sales of retail gasoline and diesel fuel. Energy Analysts International, Inc. estimated such retailers had approximately
16
percent of the U.S. gasoline market in mid-
2018
.
12
Demand for gasoline and diesel fuel is higher during the spring and summer months than during the winter months in most of our markets, primarily due to seasonal increases in highway traffic. As a result, the operating results for our Retail segment for the first and fourth quarters may be lower than for those in the second and third quarters of each calendar year. Margins from the sale of merchandise tend to be less volatile than margins from the retail sale of gasoline and diesel fuel.
MIDSTREAM
The
Midstream
segment primarily includes the operations of MPLX and ANDX, our sponsored master limited partnerships, which transport, store, distribute and market crude oil and refined products principally for the Refining & Marketing segment via refining logistics assets, pipelines, terminals, towboats and barges; gather, process and transport natural gas; and gather, transport, fractionate, store and market NGLs. The Midstream segment also includes certain related operations retained by MPC.
MPLX
MPLX owns and operates a network of crude oil, natural gas and product pipelines and has joint ownership interests in other crude oil and products pipelines. MPLX also owns and operates light products terminals, storage assets and maintains a fleet of owned and leased towboats and barges. MPLX’s assets also include natural gas gathering complexes, natural gas processing complexes and NGL fractionation complexes. On February 1, 2018, we contributed our refining logistics assets to MPLX, which include rail and truck loading racks and docks.
ANDX
ANDX owns and operates a network of crude oil, natural gas, product and water pipelines and has joint ownership interests in other crude oil and natural gas pipelines. ANDX owns and operates light products, asphalt and crude terminals, storage assets and barge docks. ANDX’s assets also include natural gas gathering complexes, natural gas processing complexes and NGL fractionation complexes.
MPC-Retained Midstream Assets and Investments
We retained ownership interests in several crude oil and products pipeline systems and pipeline companies and have indirect ownership interests in two ocean vessel joint ventures with Crowley through our investment in Crowley Coastal Partners.
The locations and detailed information about our Midstream assets are included under Item 2. Properties and are incorporated herein by reference.
Competition, Market Conditions and Seasonality
Our
Midstream
operations face competition for natural gas gathering, crude oil transportation and in obtaining natural gas supplies for our processing and related services; in obtaining unprocessed NGLs for gathering and fractionation; and in marketing our products and services. Competition for natural gas supplies is based primarily on the location of gas gathering facilities and gas processing plants, operating efficiency and reliability and the ability to obtain a satisfactory price for products recovered. Competitive factors affecting our fractionation services include availability of capacity, proximity to supply and industry marketing centers and cost efficiency and reliability of service. Competition for customers to purchase our natural gas and NGLs is based primarily on price, delivery capabilities, flexibility and maintenance of high-quality customer relationships. In addition, certain of our
Midstream
operations are highly regulated, which affects the rates that our common carrier pipelines can charge for transportation services and the return we obtain from such pipelines.
Our
Midstream
segment can be affected by seasonal fluctuations in the demand for natural gas and NGLs and the related fluctuations in commodity prices caused by various factors such as changes in transportation and travel patterns and variations in weather patterns from year to year.
ENVIRONMENTAL MATTERS
Our management is responsible for ensuring that our operating organizations maintain environmental compliance systems that support and foster our compliance with applicable laws and regulations, and for reviewing our overall environmental performance. We also have a Corporate Emergency Response Team that oversees our response to any major environmental or other emergency incident involving us or any of our facilities.
We believe it is likely that the scientific and political attention to issues concerning the extent and causes of climate change will continue, with the potential for further regulations that could affect our operations. Currently, legislative and regulatory measures to address greenhouse gases are in various phases of review, discussion or implementation. The cost to comply with these laws and regulations cannot be estimated at this time, but could be significant. For additional information, see Item 1A. Risk Factors. We estimate and publicly report greenhouse gas emissions from our operations and products. Additionally, we continuously strive to improve operational and energy efficiencies through resource and energy conservation where practicable.
13
Our operations are subject to numerous other laws and regulations relating to the protection of the environment. Such laws and regulations include, among others, the Clean Air Act (“CAA”) with respect to air emissions, the Clean Water Act (“CWA”) with respect to water discharges, the Resource Conservation and Recovery Act (“RCRA”) with respect to solid and hazardous waste treatment, storage and disposal, the Comprehensive Environmental Response, Compensation, and Liability Act (“CERCLA”) with respect to releases and remediation of hazardous substances and the Oil Pollution Act of 1990 (“OPA-90”) with respect to oil pollution and response. In addition, many states where we operate have similar laws. New laws are being enacted and regulations are being adopted on a continuing basis, and the costs of compliance with such new laws and regulations are very difficult to estimate until finalized.
For a discussion of environmental capital expenditures and costs of compliance, see Item 7. Management’s Discussion and Analysis of Financial Condition and Results of Operations-Environmental Matters and Compliance Costs.
Air
Greenhouse Gas Emissions
We are subject to many requirements in connection with air emissions from our operations. Internationally and domestically, emphasis has been placed on reducing greenhouse gas emissions. In 2018, the Trump Administration continued its shift in climate-related policy away from the Obama Administration’s policies. One of the major policy shifts is related to the administration’s efforts to repeal and replace the “Clean Power Plan.” On August 21, 2018, the U.S. Environmental Protection Agency (“EPA”) proposed the Affordable Clean Energy (“ACE”) rule, which would establish emission guidelines for states to develop plans to address greenhouse gas emissions from existing coal-fired power plants. The ACE rule would replace the 2015 Clean Power Plan, which had been stayed by the U.S. Supreme Court. President Trump also announced the United States’ intention to withdraw from the 2015 Paris UN Climate Change Conference Agreement, which aims to hold the increase in the global average temperature to well below two degrees Celsius as compared to pre-industrial levels. Many of the policies and regulations rescinded through Executive Order 13783 had been adopted to meet the United States’ pledge under the Agreement. The U.S. climate change strategy and implementation of that strategy through legislation and regulation may change under future administrations; therefore, the impact to our industry and operations due to greenhouse gas regulation is unknown at this time.
In 2009, the EPA issued an “endangerment finding” that greenhouse gas emissions contribute to air pollution that endangers public health and welfare. Related to the endangerment finding, in April 2010, the EPA finalized a greenhouse gas emission standard for mobile sources (cars and other light duty vehicles). The endangerment finding, the mobile source standard and the EPA’s determination that greenhouse gases are subject to regulation under the Clean Air Act resulted in permitting of greenhouse gas emissions at stationary sources. Through a series of legal challenges filed against the EPA, the requirement to control greenhouse gas emissions through Best Available Control Technology has been limited to new and modified large stationary sources, such as refineries, that will also emit a criteria pollutant. Implementing Best Available Control Technology may result in increased costs to our operations.
In the
absence of federal legislation or regulation of greenhouse gas emissions, states are becoming more active in regulating greenhouse gas emissions. These measures may include state actions to develop statewide or regional programs to impose emission reductions. These measures may also include low-carbon fuel standards, such as the California program, or a state carbon tax. These measures could result in increased costs to operate and maintain our facilities, capital expenditures to install new emission controls and costs to administer any carbon trading or tax programs implemented. For example, in California, the state legislature adopted SB 32 in 2016. SB 32 set a cap on emissions of 40% below 1990 levels by 2030 but did not establish a particular mechanism to achieve that target. The legislature also adopted a companion bill, AB 197, that most significantly directs the CARB to prioritize direct emission reductions on large stationary sources. In 2017, the state legislature adopted AB 398 which provides direction and parameters on utilizing cap and trade after 2020 to meet the 40% reduction target from 1990 levels by 2030 specified in SB 32. Compliance with the cap and trade program is demonstrated through a market-based credit system. The compliance costs associated with these California regulations are ultimately passed on to the consumer in the form of higher fuel costs. We cannot currently predict the impact of these regulations on our liquidity, financial position, or results of operations, but we do not believe such impact will be material.
We could also face increased climate-related litigation with respect to our operations or products. Private party litigation seeking damages and injunctive relief is pending against MPC and other oil and gas companies in multiple jurisdictions. Although uncertain, these actions could increase our costs of operations or reduce the demand for the refined products we produce, transport, store and sell.
Private parties have also sued federal and certain state governmental entities seeking additional greenhouse gas emission reductions beyond those currently being undertaken. In sum, requiring reductions in greenhouse gas emissions could result in increased costs to (i) operate and maintain our facilities, (ii) install new emission controls at our facilities and (iii) administer and manage any greenhouse gas emissions programs, including acquiring emission credits or allotments. These requirements
14
may also significantly affect MPC’s refinery operations and may have an indirect effect on our business, financial condition and results of operations. The extent and magnitude of the impact from greenhouse gas regulation or legislation cannot be reasonably estimated due to the uncertainty regarding the additional measures and how they will be implemented.
Regardless of whether legislation or regulation is enacted, given the continuing global demand for oil and gas - even under different hypothetical carbon-constrained scenarios - MPC has taken actions that have resulted in lower greenhouse gas emission intensity and we are positioned to remain a successful company well into the future. We have instituted a program to improve energy efficiency of our refineries and other assets which will continue to pay dividends in reducing our environmental footprint as well as making us more cost-competitive. We believe our mature governance and risk-management processes enable the company to effectively monitor and adjust to any transitional, reputational or physical climate-related risks.
Clean Air Act
In 2015, the EPA finalized a revision to the National Ambient Air Quality Standards (“NAAQS”) for ozone. The EPA lowered the primary ozone NAAQS from 75 ppb to 70 ppb. This revision initiated a multi-year process in which nonattainment designations will be made based on more recent ozone measurements that includes data from 2016. On November 6, 2017, the EPA finalized ozone attainment/unclassifiable designations for certain areas under the new standard. In actions dated April 30, 2018, and July 25, 2018, the EPA finalized nonattainment designations for certain areas under the lower primary ozone standard. In some areas, these nonattainment designations could result in increased costs associated with, or result in cancellation or delay of, capital projects at our facilities. For areas designated nonattainment, states will be required to adopt State Implementation Plans (“SIPs”) for nonattainment areas. These SIPs may include NOx and/or volatile organic compound (“VOC”) reductions that could result in increased costs to our facilities. We cannot predict the effects of the various SIPs requirements at this time.
In California, the Board for the South Coast Air Quality Management District (“SCAQMD”) passed amendments to the Regional Clean Air Incentives Market (“RECLAIM”) that became effective in 2016, requiring a staged reduction of nitrogen oxide emissions through 2022. In 2017, the State of California passed AB 617, which requires each air district that is a nonattainment area for one or more air pollutants to adopt an expedited schedule for implementation of best available retrofit control technology (“BARCT”) on specific facilities. BARCT applies to all facilities subject to RECLAIM. In response to AB 617, the SCAQMD is currently working to “sunset” the existing RECLAIM program and replace it with applicable BARCT regulations.
Water
We maintain numerous discharge permits as required under the National Pollutant Discharge Elimination System program of the CWA and have implemented systems to oversee our compliance with these permits. In addition, we are regulated under OPA-90, which among other things, requires the owner or operator of a tank vessel or a facility to maintain an emergency plan to respond to releases of oil or hazardous substances. OPA-90 also requires the responsible company to pay resulting removal costs and damages and provides for civil penalties and criminal sanctions for violations of its provisions. We operate tank vessels and facilities from which spills of oil and hazardous substances could occur. We have implemented emergency oil response plans for all of our components and facilities covered by OPA-90 and we have established Spill Prevention, Control and Countermeasures plans for all facilities subject to such requirements.
Additionally, OPA-90 requires that new tank vessels entering or operating in U.S. waters be double-hulled and that existing tank vessels that are not double-hulled be retrofitted or removed from U.S. service. All barges used for river transport of our raw materials and refined products meet the double-hulled requirements of OPA-90. Some coastal states in which we operate have passed state laws similar to OPA-90, but with expanded liability provisions, that include provisions for cargo owner responsibility as well as ship owner and operator responsibility.
In June 2015, the EPA and the United States Army Corps of Engineers finalized significant changes to the definition of the term “waters of the United States” used in numerous programs under the CWA. This final rulemaking is referred to as the Clean Water Rule. The Clean Water Rule, as written, expands permitting, planning and reporting obligations and may extend the timing to secure permits for pipeline and fixed asset construction and maintenance activities. The Clean Water Rule has been challenged in multiple federal courts by many states, trade groups, and other interested parties, and in October 2015, a United States Court of Appeals issued a nationwide stay of the Clean Water Rule. On appeal, however, the Supreme Court determined that the court of appeals did not have original jurisdiction to review challenges to the 2015 Rule. As such, legal challenges to the rule will proceed in federal district courts. Three federal district courts have stayed the Clean Water Rule in twenty-eight states. Concurrent with the legal challenges, on February 28, 2017, President Trump signed Executive Order 13778, directing the EPA and the Army Corps of Engineers to review the 2015 Rule for consistency with the policy outlined in the Order, and to issue a proposed rule rescinding or revising the 2015 Rule as appropriate and consistent with law. On December 11, 2018, the
15
EPA and the Army Corps of Engineers announced its proposed new definition of “waters of the United States.” The proposal, once finalized, would replace the 2015 Clean Water Rule.
In 2015, the EPA issued its intent to review the CWA categorical effluent limitation guidelines (“ELG”) for the petroleum refining sector. During 2017, the EPA prepared and issued an information request (“ICR”) requesting significant wastewater and treatment process details from select refineries, seven of which were ours. Responses to the ICR were submitted to the EPA in early 2018. As of late 2018, the EPA is in the process of reviewing the ICR response data submitted and determining the next steps for the ELG review. EPA may also perform sampling of effluent at one or more of our refineries. The EPA has indicated they believe there have been significant changes in the characteristics of waste waters generated within refining operations that warrant the review. Specific targets for the review are the impacts of processing heavier crude oils and the transfer of air pollutants to wastewater when air pollution abatement devices are in use. A similar project, initiated in 2007 for steam electric power generation with similar attributes, resulted in a significant change in the treatment requirements for coal-fired power plants. However, on September 18, 2017, the EPA postponed certain compliance dates while it conducts a rulemaking to revise the ELGs for power plants. The refining sector ELG review has the potential to result in a similar impact. The typical life-cycle for an ELG review from the intent to review to issuance of a final rule that would require upgrades is seven years. The impact of an ELG review cannot be accurately estimated at this time.
Solid Waste
We continue to seek methods to minimize the generation of hazardous wastes in our operations. RCRA establishes standards for the management of solid and hazardous wastes. Besides affecting waste disposal practices, RCRA also addresses the environmental effects of certain past waste disposal operations, the recycling of wastes and the regulation of USTs containing regulated substances.
Pursuant to an order received in 2004 from the San Francisco Bay Regional Water Quality Control Board, we are performing remediation of certain waste management units and completing investigations of the design conditions of certain active wastewater and storm water impoundments at our Martinez refinery. The investigative and remedial costs associated with the 2004 Order could have a material impact on our results of operations. The costs that are estimable and probable at this time have been accrued.
Remediation
We own or operate, or have owned or operated, certain convenience stores and other locations where, during the normal course of operations, releases of refined products from USTs have occurred. Federal and state laws require that contamination caused by such releases at these sites be assessed and remediated to meet applicable standards. Penalties or other sanctions may be imposed for noncompliance. The enforcement of the UST regulations under RCRA has been delegated to the states, which administer their own UST programs. Our obligation to remediate such contamination varies, depending on the extent of the releases and the stringency of the applicable state laws and regulations. A portion of these remediation costs may be recoverable from the appropriate state UST reimbursement funds once the applicable deductibles have been satisfied. We also have ongoing remediation projects at a number of our current and former refinery, terminal and pipeline locations.
Claims under CERCLA and similar state acts have been raised with respect to the clean-up of various waste disposal and other sites. CERCLA is intended to facilitate the clean-up of hazardous substances without regard to fault. Potentially responsible parties for each site include present and former owners and operators of, transporters to and generators of the hazardous substances at the site. Liability is strict and can be joint and several. Because of various factors including the difficulty of identifying the responsible parties for any particular site, the complexity of determining the relative liability among them, the uncertainty as to the most desirable remediation techniques and the amount of damages and clean-up costs and the time period during which such costs may be incurred, we are unable to reasonably estimate our ultimate cost of compliance with CERCLA; however, we do not believe such costs will be material to our business, financial condition, results of operations or cash flows.
Mileage Standards, Renewable Fuels and Other Fuels Requirements
The U.S. Congress passed the Energy Independence and Security Act of 2007 (“EISA”), which, among other things, set a target of 35 miles per gallon for the combined fleet of cars and light trucks in the United States by model year 2020, and contains the RFS2. In August 2012, the EPA and the National Highway Traffic Safety Administration (“NHTSA”) jointly adopted regulations that establish average industry fleet fuel economy standards for passenger cars and light trucks of up to 41 miles per gallon by model year 2021 and average fleet fuel economy standards of up to 49.7 miles per gallon by model year 2025. In 2018, the EPA and the NHTSA jointly proposed the Safer Affordable Fuel-Efficient Vehicles Rules for Model Years 2021-2026, which would propose new Corporate Average Fuel Economy (“CAFE”) standards for model years 2022 through 2026, amend the 2021 model year CAFE standards, amend the EPA’s carbon dioxide emission standards for model years 2021 through 2025, and establish new carbon dioxide emission standards for model year 2026. The EPA’s preferred alternative is to retain the model year 2020 standards for both programs through model year 2026. The standards established by the final regulation may
16
differ. Additionally, California may establish per its Clean Air Act waiver authority different standards that could apply in multiple states. Higher CAFE standards for cars and light trucks have the potential to reduce demand for our transportation fuels. New or alternative transportation fuels such as compressed natural gas could also pose a competitive threat to our operations.
The RFS2 requires the total volume of renewable transportation fuels sold or introduced annually in the U.S. to reach 26.0 billion gallons in 2018, 28.0 billion gallons in 2019, and increase to 36.0 billion gallons by 2022. Within the total volume of renewable fuel, EISA established an advanced biofuel volume of 11.0 billion gallons in 2018, 13.0 billion gallons in 2019, and increasing to 21.0 billion gallons in 2022. Subsets within the advanced biofuel volume include biomass-based diesel, which was set as at least 1.0 billion gallons in 2014 through 2022 (to be determined by the EPA through rulemaking), and cellulosic biofuel, which was set at 7.0 billion gallons in 2018, 8.5 billion gallons in 2019, and increasing to 16.0 billion gallons in 2022.
On November 30, 2015, the EPA finalized the renewable fuel standards for the years of 2014, 2015 and 2016 as well as the biomass-based diesel standard for 2017. In a legal challenge to the 2014-2016 volumes, the court vacated the total renewable volume for 2016 and remanded to the EPA for reconsideration consistent with the court’s opinion. A remanded rule that increases the 2016 total renewable volume could increase our cost of compliance with the Renewable Fuel Standards and be detrimental to the RIN market. The 2017 and 2018 RFS volumes have also been challenged in court.
On November 30, 2018, the EPA finalized RFS volume requirements for the year 2019, and the biomass-based diesel volume requirement for year 2020. The EPA used its cellulosic waiver authority to reduce the volumes for 2019 from the statutory amounts to the following: 19.92 billion gallons total renewable fuel; 4.92 billion gallons advanced biofuel; and 418 million gallons cellulosic biofuel. The EPA set the biomass-based diesel volume requirement for 2020 at 2.43 billion gallons, which is significantly greater than the statutory floor of 1.0 billion gallons.
The RFS2 is satisfied primarily with ethanol blended into gasoline. Vehicle, regulatory and infrastructure constraints limit the blending of significantly more than 10 percent ethanol into gasoline (“E10”). Since 2016, the volume requirements have resulted in the ethanol content of gasoline exceeding the E10 blendwall, which will require obligated parties to either sell E15 or ethanol flex fuel at levels that exceed historical levels or retire carryover RINs.
We have made investments in infrastructure capable of expanding biodiesel blending capability to help comply with the annually-increasing biodiesel RFS2 requirement by buying and blending biodiesel into our refined diesel product, and by buying needed biodiesel RINs in the EPA-created biodiesel RINs market. On April 1, 2014, we purchased a facility in Cincinnati, Ohio, which currently produces biodiesel, glycerin and other by-products. As a producer of biodiesel, we generate RINs, thereby reducing our reliance on the external RIN market.
In November 2017, the EPA finalized its decision to deny petitions requesting that the point of obligation for the RFS2 be moved to the terminal rack. The EPA’s final decision was challenged in court and should the court decide that EPA’s decision was incorrect and move the point of obligation, we could be subject to increased costs and compliance uncertainties.
In addition to federal renewable fuel standards, certain states have, or are considering, promulgation of state renewable or low carbon fuel standards. For example, California began implementing its Low Carbon Fuel Standard (“LCFS”) in January 2011. In September 2015, the CARB approved the re-adoption of the LCFS, which became effective on January 1, 2016, to address procedural deficiencies in the way the original regulation was adopted. The LCFS was amended again in 2018 with the current version targeting a 20 percent reduction in fuel carbon intensity from a 2010 baseline by 2030.
In sum, the RFS2 has required, and may in the future continue to require, additional capital expenditures or expenses by us to accommodate increased renewable fuels use. We may experience a decrease in demand for refined products due to an increase in combined fleet mileage or due to refined products being replaced by renewable fuels. Demand for our refined products also may decrease as a result of low carbon fuel standard programs or electric vehicle mandates.
On March 3, 2014, the EPA signed the final Tier 3 fuel standards. The final Tier 3 fuel standards require, among other things, a lower annual average sulfur level in gasoline to no more than 10 ppm beginning in calendar year 2017. In addition, gasoline refiners and importers may not exceed a maximum per-gallon sulfur standard of 80 ppm while retailers may not exceed a maximum per-gallon sulfur standard of 95 ppm. From 2014 through 2018, we made approximately $490 million in capital expenditures to comply with these standards, and expect to make approximately $260 million in capital expenditures for these standards in 2019.
Tribal Lands
Various federal agencies, including the EPA and the Department of the Interior, along with certain Native American tribes, promulgate and enforce regulations pertaining to oil and gas operations on Native American tribal lands where we operate. These regulations include such matters as lease provisions, drilling and production requirements, and standards to protect
17
environmental quality and cultural resources. For example, the EPA has established a preconstruction permitting program for new and modified minor sources throughout Indian country, and new and modified major sources in nonattainment areas in Indian country. In addition, each Native American tribe is a sovereign nation having the right to enforce certain laws and regulations and to grant approvals independent from federal, state and local statutes and regulations. These laws and regulations may increase our costs of doing business on Native American tribal lands and impact the viability of, or prevent or delay our ability to conduct, our operations on such lands.
TRADEMARKS, PATENTS AND LICENSES
O
ur Marathon trademark is material to the conduct of our refining and marketing operations, and our Speedway and ARCO trademarks are material to the conduct of our retail operations. Additionally, the retail and marketing businesses we acquired in the Andeavor acquisition primarily use the Shell
®
and Mobil
®
brands for fuel sales and ampm
®
and Giant
®
brands for convenience store merchandise. We currently hold a number of U.S. and foreign patents and have various pending patent applications. Although in the aggregate our patents and licenses are important to us, we do not regard any single patent or license or group of related patents or licenses as critical or essential to our business as a whole. In general, we depend on our technological capabilities and the application of know-how rather than patents and licenses in the conduct of our operations.
EMPLOYEES
We had approximately
60,350
regular full-time and part-time employees as of
December 31, 2018
, which includes approximately
40,230
employees of our Retail segment.
Approximately 4,780 of our employees are covered by collective bargaining agreements. Of these employees, approximately 1,465 employees at our Galveston Bay, Mandan and Martinez refineries are covered by collective bargaining agreements which were set to expire on January 31, 2019. The parties continue their negotiations toward a new agreement, and are working under rolling extensions. Approximately 425 employees at our Martinez Chemical Plant, our Los Angeles refinery and our Galveston Bay refinery are covered by collective bargaining agreements expiring over the next several months. Approximately 410 hourly employees at Speedway are represented under collective bargaining agreements. The majority of these employees work at certain retail locations in New York and New Jersey under agreements which expire on March 14, 2019 and June 30, 2019, respectively. The remaining Speedway represented employees are drivers in Minnesota under an agreement which expires in 2021. Approximately 300 employees at our St. Paul Park and Gallup refineries are covered by collective bargaining agreements scheduled to expire in 2020. Approximately 1,620 employees at our Anacortes, Canton, Catlettsburg, Los Angeles, and Salt Lake City refineries are covered by collective bargaining agreements that are due to expire in 2022. The remaining 560 hourly represented employees are covered by collective bargaining agreements with expiration dates ranging from 2021 to 2024.
18
Executive and Corporate Officers of the Registrant
The executive and corporate officers of MPC are as follows:
|
Name
|
Age as of
February 1, 2019
|
Position with MPC
|
||
|
Gary R. Heminger
|
65
|
Chairman and Chief Executive Officer
|
||
|
Gregory J. Goff
|
62
|
Executive Vice Chairman
|
||
|
Molly R. Benson
(a)
|
52
|
Vice President, Chief Securities, Governance & Compliance Officer and Corporate Secretary
|
||
|
Raymond L. Brooks
|
58
|
Executive Vice President, Refining
|
||
|
C. Tracy Case
(a)
|
58
|
Senior Vice President, Western Refining Operations
|
||
|
Suzanne Gagle
|
53
|
General Counsel
|
||
|
Timothy T. Griffith
|
49
|
Senior Vice President and Chief Financial Officer
|
||
|
David R. Heppner
(a)
|
52
|
Vice President, Commercial and Business Development
|
||
|
Richard A. Hernandez
(a)
|
59
|
Senior Vice President, Eastern Refining Operations
|
||
|
Rick D. Hessling
(a)
|
52
|
Senior Vice President, Crude Oil Supply and Logistics
|
||
|
Thomas Kaczynski
|
57
|
Vice President, Finance and Treasurer
|
||
|
Kristina A. Kazarian
(a)
|
36
|
Vice President, Investor Relations
|
||
|
Anthony R. Kenney
|
65
|
President, Speedway LLC
|
||
|
Fiona C. Laird
(a)
|
57
|
Chief Human Resources Officer
|
||
|
D. Rick Linhardt
(a)
|
60
|
Vice President, Tax
|
||
|
Brian K. Partee
(a)
|
45
|
Senior Vice President, Marketing
|
||
|
Glenn M. Plumby
(a)
|
59
|
Senior Vice President and Chief Operating Officer, Speedway LLC
|
||
|
John J. Quaid
|
47
|
Vice President and Controller
|
||
|
David R. Sauber
(a)
|
55
|
Senior Vice President, Labor Relations, Operations, Health and Administrative Services
|
||
|
Donald C. Templin
|
55
|
President, Refining, Marketing and Supply
|
||
|
Karma M. Thomson
(a)
|
51
|
Vice President, Corporate Affairs
|
||
|
Donald W. Wehrly
(a)
|
59
|
Vice President and Chief Information Officer
|
||
|
David L. Whikehart
(a)
|
59
|
Senior Vice President, Light Products, Supply and Logistics
|
||
|
James R. Wilkins
(a)
|
52
|
Vice President, Environment, Safety and Security
|
||
|
(a)
|
Corporate officer.
|
Mr. Heminger is Chairman of the Board and Chief Executive Officer. He has served as the Chairman of the Board since April 2016 and as Chief Executive Officer since June 2011. Mr. Heminger also served as President from July 2011 until June 2017.
Mr. Goff was appointed Executive Vice Chairman effective October 2018. Prior to this appointment, Mr. Goff was President and Chief Executive Officer of Andeavor beginning in May 2010 and Chairman of its Board of Directors beginning in December 2014.
Ms. Benson was appointed Vice President, Chief Compliance Officer and Corporate Secretary in March 2016 and Chief Securities and Governance Officer in May 2018. Prior to her appointment in 2016, Ms. Benson was Assistant General Counsel, Corporate and Finance beginning in April 2012.
Mr. Brooks was appointed Executive Vice President, Refining effective October 2018. Prior to this appointment, Mr. Brooks was Senior Vice President, Refining beginning in March 2016. Previously, Mr. Brooks served as General Manager of the Galveston Bay refinery beginning in February 2013, and General Manager of the Robinson refinery beginning in 2010.
Mr. Case was appointed Senior Vice President, Western Refining Operations effective October 2018. Prior to this appointment, Mr. Case was General Manager of the Garyville refinery beginning in December 2014. Previously, Mr. Case served as General Manager of the Detroit refinery beginning in June 2010.
Ms. Gagle was appointed General Counsel in March 2016. Prior to this appointment, Ms. Gagle was Assistant General Counsel, Litigation and Human Resources beginning in April 2011.
19
Mr. Griffith was appointed Senior Vice President and Chief Financial Officer in March 2015. Prior to this appointment, Mr. Griffith served as Vice President, Finance and Investor Relations, and Treasurer beginning in January 2014. Previously, Mr. Griffith was Vice President of Finance and Treasurer beginning in August 2011.
Mr. Heppner was appointed Vice President, Commercial and Business Development effective October 2018. Prior to this appointment, Mr. Heppner was Senior Vice President of Engineering Services and Corporate Support of Speedway LLC beginning in September 2014. Previously, Mr. Heppner served as Director, Wholesale Marketing beginning in January 2010.
Mr. Hernandez was appointed Senior Vice President, Eastern Refining Operations effective October 2018. Prior to this appointment, Mr. Hernandez was General Manager of the Galveston Bay refinery beginning in February 2016. Previously,
Mr. Hernandez served as the General Manager of the Catlettsburg refinery beginning in June 2013.
Mr. Hessling was appointed Senior Vice President, Crude Oil Supply and Logistics effective October 2018. Prior to this appointment, Mr. Hessling was Manager, Crude Oil & Natural Gas Supply and Trading beginning in September 2014. Previously, Mr. Hessling served as Crude Oil Logistics & Analysis Manager beginning in July 2011.
Mr. Kaczynski was appointed Vice President, Finance and Treasurer in August 2015. Prior to this appointment, Mr. Kaczynski was Vice President and Treasurer of Goodyear Tire and Rubber Company, one of the world’s largest tire manufacturers, beginning in 2014. Previously, Mr. Kaczynski served as Vice President, Investor Relations, of Goodyear Tire and Rubber Company beginning in 2013.
Ms. Kazarian was appointed Vice President, Investor Relations in April 2018. Prior to this appointment, Ms. Kazarian was Managing Director and head of the MLP, Midstream and Refining Equity Research teams at Credit Suisse, a global investment bank and financial services company, beginning in September 2017. Previously, Ms. Kazarian worked at Deutsche Bank, a global investment bank and financial services company, as Managing Director of MLP, Midstream and Natural Gas Equity Research beginning in September 2014, and as an analyst specializing on various energy industry subsectors with Fidelity Management & Research Company, a privately held investment manager, beginning in 2005.
Mr. Kenney has served as President of Speedway LLC since August 2005.
Ms. Laird was appointed Chief Human Resources Officer effective October 2018. Prior to this appointment, Ms. Laird was Chief Human Resources Officer at Andeavor beginning in February 2018. Previously, Ms. Laird was the Chief Human Resources and Communications Officer for Newell Brands, a global consumer goods company, beginning in May 2016 and Executive Vice President, Human Resources for Unilever, a global consumer goods company, beginning in July 2011.
Mr. Linhardt was appointed Vice President, Tax in February 2018. Prior to this appointment, Mr. Linhardt served as Director of Tax beginning in June 2017. Previously, Mr. Linhardt served as Manager of Tax Compliance beginning in May 2013.
Mr. Partee was appointed Senior Vice President, Marketing effective October 2018. Prior to this appointment, Mr. Partee served as Vice President, Business Development beginning in February 2018. Previously, Mr. Partee was Director of Business Development beginning in January 2017, Manager of Crude Oil Logistics beginning in September 2014 and Vice President, Business Development and Franchise at Speedway beginning in November 2012.
Mr. Plumby was named Senior Vice President and Chief Operating Officer, Speedway LLC in January 2018 and was appointed an officer of MPC in February 2019. Previously, Mr. Plumby was Senior Vice President of Operations of Speedway LLC beginning in September 2013 and Vice President of Operations of Speedway LLC beginning in December 2010.
Mr. Quaid was appointed Vice President and Controller in June 2014. Prior to this appointment, Mr. Quaid was Vice President of Iron Ore at United States Steel Corporation (“U.S. Steel”), an integrated steel producer, beginning in January 2014. Previously, Mr. Quaid served as Vice President and Treasurer at U.S. Steel beginning in August 2011.
Mr. Sauber was appointed Senior Vice President, Labor Relations, Operations, Health and Administrative Services effective October 2018. Prior to this appointment, Mr. Sauber was Senior Vice President, Human Resources, Health and Administrative Services beginning in January 2018, and Vice President, Human Resources and Labor Relations beginning February 2017. Previously, Mr. Sauber was Vice President, Human Resources Policy, Benefits and Services of Shell Oil Company, a global energy and petrochemical company, beginning in 2013.
Mr. Templin was appointed President, Refining, Marketing and Supply effective October 2018. Prior to this appointment,
Mr. Templin served as President beginning in July 2017; Executive Vice President beginning in January 2016; Executive Vice President, Supply, Transportation and Marketing beginning in March 2015; and Senior Vice President and Chief Financial Officer beginning in June 2011.
20
Ms. Thomson was appointed Vice President, Corporate Affairs effective October 2018. Prior to this appointment, Ms. Thomson served as Vice President of Andeavor Logistics beginning in June 2017.
Previously
, at Andeavor
, Ms. Thomson served as Vice President, Salt Lake City refinery beginning in October 2012.
Mr. Wehrly was appointed Vice President and Chief Information Officer effective June 2011.
Mr. Whikehart was appointed Senior Vice President, Light Products, Supply and Logistics effective October 2018. Prior to this appointment, Mr. Whikehart served as Vice President, Environment, Safety and Corporate Affairs effective February 2016. Previously, Mr. Whikehart served as Vice President, Corporate Planning, Government & Public Affairs beginning in January 2016, and Director, Product Supply and Optimization beginning in March 2011.
Mr. Wilkins was appointed Vice President, Environment, Safety and Security effective October 2018. Prior to this appointment, Mr. Wilkins was Director, Environment, Safety, Security and Product Quality beginning February 2016. Previously,
Mr. Wilkins served as Director, Refining Environmental, Safety, Security and Process Safety Management beginning in June 2013.
Available Information
General information about MPC, including Corporate Governance Principles and Charters for the Audit Committee, Compensation Committee and Corporate Governance and Nominating Committee, can be found at
www.marathonpetroleum.com
by selecting “Investors” under “Corporate Governance” and “Board of Directors”. In addition, our Code of Business Conduct and Code of Ethics for Senior Financial Officers are also available in this same location. We will post on our website any amendments to, or waivers from, either of our codes requiring disclosure under applicable rules within four business days of the amendment or waiver.
MPC uses its website,
www.marathonpetroleum.com
, as a channel for routine distribution of important information, including news releases, analyst presentations, financial information and market data. Our Annual Report on Form 10-K, Quarterly Reports on Form 10-Q and Current Reports on Form 8-K, as well as any amendments and exhibits to those reports, are available free of charge through our website as soon as reasonably practicable after the reports are filed or furnished with the SEC. These documents are also available in hard copy, free of charge, by contacting our Investor Relations office. In addition, our website allows investors and other interested persons to sign up to automatically receive email alerts when we post news releases and financial information on our website. Information contained on our website is not incorporated into this Annual Report on Form 10-K or other securities filings.
ITEM 1A. RISK FACTORS
You should carefully consider each of the following risks and all of the other information contained in this Annual Report on Form 10-K in evaluating us and our common stock. Some of these risks relate principally to our business and the industry in which we operate, while others relate to the ownership of our common stock.
Our business, financial condition, results of operations or cash flows could be materially and adversely affected by any of these risks, and, as a result, the trading price of our common stock could decline.
RISKS RELATING TO OUR BUSINESS
A substantial or extended decline in refining and marketing margins would reduce our operating results and cash flows and could materially and adversely impact our future rate of growth, the carrying value of our assets and our ability to execute share repurchases and continue the payment of our base dividend.
Our operating results, cash flows, future rate of growth, the carrying value of our assets and our ability to execute share repurchases and continue the payment of our base dividend are highly dependent on the margins we realize on our refined products. Historically, refining and marketing margins have been volatile, and we believe they will continue to be volatile. Our margins from the sale of gasoline and other refined products are influenced by a number of conditions, including the price of crude oil. The price of crude oil and the price at which we can sell our refined products may fluctuate independently due to a variety of regional and global market factors that are beyond our control, including:
|
•
|
worldwide and domestic supplies of and demand for crude oil and refined products;
|
|
•
|
the cost of crude oil and other feedstocks to be manufactured into refined products;
|
|
•
|
the prices realized for refined products;
|
21
|
•
|
transportation infrastructure availability, local market conditions and operation levels of other refineries in our markets;
|
|
•
|
utilization rates of refineries;
|
|
•
|
natural gas and electricity supply costs incurred by refineries;
|
|
•
|
the ability of the members of OPEC to agree to and maintain production controls;
|
|
•
|
political instability, threatened or actual terrorist incidents, armed conflict, or other global political conditions;
|
|
•
|
local weather conditions;
|
|
•
|
seasonality of demand in our marketing area due to increased highway traffic in the spring and summer months;
|
|
•
|
natural disasters such as hurricanes and tornadoes;
|
|
•
|
the price and availability of alternative and competing forms of energy;
|
|
•
|
domestic and foreign governmental regulations and taxes; and
|
|
•
|
local, regional, national and worldwide economic conditions.
|
Some of these factors can vary by region and may change quickly, adding to market volatility, while others may have longer-term effects. The longer-term effects of these and other factors on refining and marketing margins are uncertain. We purchase our crude oil and other refinery feedstocks weeks before we refine them and sell the refined products. Price level changes during the period between purchasing feedstocks and selling the refined products from these feedstocks could have a significant effect on our financial results. We also purchase refined products manufactured by others for resale to our customers. Price changes during the periods between purchasing and reselling those refined products also could have a material and adverse effect on our business, financial condition, results of operations and cash flows.
Lower refining and marketing margins may reduce the amount of refined products we produce, which may reduce our revenues, income from operations and cash flows. Significant reductions in refining and marketing margins could require us to reduce our capital expenditures, impair the carrying value of our assets (such as property, plant and equipment, inventory or goodwill), and decrease or eliminate our share repurchase activity and our base dividend.
Our operations are subject to business interruptions and casualty losses. Failure to manage risks associated with business interruptions could adversely impact our operations, financial condition, results of operations and cash flows.
Our operations are subject to business interruptions such as scheduled refinery turnarounds, unplanned maintenance or unplanned events such as explosions, fires, refinery or pipeline releases or other incidents, power outages, severe weather, labor disputes, or other natural or man-made disasters, such as acts of terrorism. For example, pipelines or railroads provide a nearly-exclusive form of transportation of crude oil to, or refined products from, some of our refineries. In such instances, a prolonged interruption, material reduction or cessation of service of such a pipeline or railway, whether due to private party or governmental action or other reason, could materially and adversely affect the operations, profitability and cash flows of the impacted refinery.
Explosions, fires, refinery or pipeline releases or other incidents involving our assets or operations may result in serious personal injury or loss of human life, significant damage to property and equipment, environmental pollution, impairment of operations and substantial losses to us. Damages resulting from an incident involving any of our assets or operations may result in our being named as a defendant in one or more lawsuits asserting potentially substantial claims or in our being assessed potentially substantial fines by governmental authorities.
In addition, we operate in and adjacent to environmentally sensitive waters where tanker, pipeline, rail car and refined product transportation and storage operations are closely regulated by federal, state and local agencies and monitored by environmental interest groups. Our coastal refineries receive crude oil and other feedstocks by tanker. In addition, our refineries receive crude oil and other feedstocks by rail car, truck and barge. Transportation and storage of crude oil, other feedstocks and refined products over and adjacent to water involves inherent risk and subjects us to the provisions of the OPA-90 and state laws in U.S. coastal and Great Lakes states and states bordering inland waterways on which we operate, as well as international laws in the jurisdictions in which we operate. If we are unable to promptly and adequately contain any accident or discharge involving tankers, pipelines, rail cars or above ground storage tanks transporting or storing crude oil, other feedstocks or refined products, we may be subject to substantial liability. In addition, the service providers we have contracted to aid us in a discharge response may be unavailable due to weather conditions, governmental regulations or other local or global events. International, federal or state rulings could divert our response resources to other global events.
22
We do not insure against all potential losses, and, therefore, our business, financial condition, results of operations and cash flows could be adversely affected by unexpected liabilities and increased costs.
We maintain insurance coverage in amounts we believe to be prudent against many, but not all, potential liabilities arising from operating hazards. Uninsured liabilities arising from operating hazards, including but not limited to, explosions, fires, refinery or pipeline releases, cybersecurity breaches or other incidents involving our assets or operations, could reduce the funds available to us for capital and investment spending and could have a material adverse effect on our business, financial condition, results of operations and cash flows. Marine vessel charter agreements may not provide complete indemnity for oil spills, and any marine charterer’s liability insurance we carry may not cover all losses. Historically, we also have maintained insurance coverage for physical damage and resulting business interruption to our major facilities, with significant self-insured retentions. In the future, we may not be able to maintain insurance of the types and amounts we desire at reasonable rates.
We rely on the performance of our information technology systems, and the interruption or failure of any information technology system, including an interruption or failure due to a cybersecurity breach, could have an adverse effect on our business, financial condition, results of operations and cash flows.
We are heavily dependent on our information technology systems, including our network infrastructure and cloud applications, for the effective operation of our business. We rely on such systems to process, transmit and store electronic information, including financial records and personally identifiable information such as employee, customer, investor and payroll data, and to manage or support a variety of business processes, including our supply chain, pipeline operations, gathering and processing operations, retail sales, credit card payments and authorizations at our retail outlets, financial transactions, banking and numerous other processes and transactions. These information systems involve data network and telecommunications, Internet access and website functionality, and various computer hardware equipment and software applications, including those that are critical to the safe operation of our business. Our systems and infrastructure are subject to damage or interruption from a number of potential sources including natural disasters, software viruses or other malware, power failures, cyber-attacks and other events. We also face various other cybersecurity threats from criminal hackers, state-sponsored intrusion, industrial espionage and employee malfeasance, including threats to gain unauthorized access to sensitive information or to render data or systems unusable.
To protect against such attempts of unauthorized access or attack, we have implemented multiple layers of cybersecurity protections, infrastructure protection technologies, disaster recovery plans and employee training. While we have invested significant amounts in the protection of our technology systems and maintain what we believe are adequate security controls over personally identifiable customer, investor and employee data, there can be no guarantee such plans, to the extent they are in place, will be effective.
Certain vendors have access to sensitive information, including personally identifiable customer, investor and employee data and a breakdown of their technology systems or infrastructure as a result of a cyber-attack or otherwise could result in unauthorized disclosure of such information. Unauthorized disclosure of sensitive or personally identifiable information, including by cyber-attacks or other security breach, could cause loss of data, give rise to remediation or other expenses, expose us to liability under federal and state laws, reduce our customers’ willingness to do business with us, disrupt the services we provide to customers and subject us to litigation and investigations, which could have an adverse effect on our reputation, business, financial condition, results of operations and cash flows. State and federal cybersecurity legislation could also impose new requirements, which could increase our cost of doing business.
Competition in our industry is intense, and very aggressive competition could adversely impact our business.
We compete with a broad range of refining and marketing companies, including certain multinational oil companies. Competitors with integrated operations with exploration and production resources and broader access to resources may be better able to withstand volatile market conditions and to bear the risks inherent in the refining industry. For example, competitors that engage in exploration and production of crude oil may be better positioned to withstand periods of depressed refining margins or feedstock shortages.
We also face strong competition in the market for the sale of retail gasoline, diesel fuel and merchandise. Our competitors include outlets owned or operated by fully integrated major oil companies or their dealers or jobbers, and other well-recognized national or regional retail outlets, often selling gasoline or merchandise at very competitive prices. Several non-traditional retailers such as supermarkets, club stores and mass merchants are in the retail business. These non-traditional gasoline retailers have obtained a significant share of the transportation fuels market and we expect their market share to grow. Because of their diversity, integration of operations, experienced management and greater financial resources, these companies may be better able to withstand volatile market conditions or levels of low or no profitability in the retail segment of the market. In addition, these retailers may use promotional pricing or discounts, both at the pump and in the store, to encourage in-store merchandise sales. These activities by our competitors could pressure us to offer similar discounts, adversely affecting our profit margins.
23
Additionally, the loss of market share by our convenience stores to these and other retailers relating to either gasoline or merchandise could have a material adverse effect on our business, financial condition, results of operations and cash flows.
The development, availability and marketing of alternative and competing fuels in the retail market could adversely impact our business. We compete with other industries that provide alternative means to satisfy the energy and fuel needs of our consumers. Increased competition from these alternatives as a result of governmental regulations, technological advances and consumer demand could have an impact on pricing and demand for our products and our profitability.
We are subject to interruptions of supply and increased costs as a result of our reliance on third-party transportation of crude oil and refined products.
We utilize the services of third parties to transport crude oil and refined products to and from our refineries. In addition to our own operational risks discussed above, we could experience interruptions of supply or increases in costs to deliver refined products to market if the ability of the pipelines, railways or vessels to transport crude oil or refined products is disrupted because of weather events, accidents, governmental regulations or third-party actions. A prolonged disruption of the ability of the trucks, pipelines, railways or vessels to transport crude oil or refined products to or from one or more of our refineries could have a material adverse effect on our business, financial condition, results of operations and cash flows.
Our investments in joint ventures decrease our ability to manage risk.
We conduct some of our operations through joint ventures in which we share control over certain economic and business interests with our joint venture partners. Our joint venture partners may have economic, business or legal interests or goals that are inconsistent with our goals and interests or may be unable to meet their obligations. Failure by us, or an entity in which we have a joint-venture interest, to adequately manage the risks associated with any acquisitions or joint ventures could have a material adverse effect on the financial condition or results of operations of our joint ventures and adversely affect our business, financial condition, results of operations and cash flows.
We may incur losses to our business as a result of our forward-contract activities and derivative transactions.
We currently use commodity derivative instruments, and we expect to enter into these types of transactions in the future. A failure of a futures commission merchant or counterparty to perform would affect these transactions. To the extent the instruments we utilize to manage these exposures are not effective, we may incur losses related to the ineffective portion of the derivative transaction or costs related to moving the derivative positions to another futures commission merchant or counterparty once a failure has occurred.
We have significant debt obligations; therefore, our business, financial condition, results of operations and cash flows could be harmed by a deterioration of our credit profile, a decrease in debt capacity or unsecured commercial credit available to us, or by factors adversely affecting credit markets generally.
At December 31, 2018, our total debt obligations for borrowed money and capital lease obligations were $
27.98 billion
, including
$13.86 billion
of obligations of MPLX and
$5.01 billion
of obligations of ANDX. We may incur substantial additional debt obligations in the future.
Our indebtedness may impose various restrictions and covenants on us that could have material adverse consequences, including:
|
•
|
increasing our vulnerability to changing economic, regulatory and industry conditions;
|
|
•
|
limiting our ability to compete and our flexibility in planning for, or reacting to, changes in our business and the industry;
|
|
•
|
limiting our ability to pay dividends to our stockholders;
|
|
•
|
limiting our ability to borrow additional funds; and
|
|
•
|
requiring us to dedicate a substantial portion of our cash flow from operations to payments on our debt, thereby reducing funds available for working capital, capital expenditures, acquisitions, share repurchases, dividends and other purposes.
|
A decrease in our debt or commercial credit capacity, including unsecured credit extended by third-party suppliers, or a deterioration in our credit profile could increase our costs of borrowing money and/or limit our access to the capital markets and commercial credit. Our credit rating is determined by independent credit rating agencies. We cannot provide assurance that any of our credit ratings will remain in effect for any given period of time or that a rating will not be lowered or withdrawn
24
entirely by a rating agency if, in its judgment, circumstances so warrant. Any changes in our credit capacity or credit profile could materially and adversely affect our business, financial condition, results of operations and cash flows.
We have a trade receivables securitization facility that provides liquidity of up to $750 million depending on the amount of eligible domestic trade accounts receivables. In periods of lower prices, we may not have sufficient eligible accounts receivables to support full availability of this facility.
Historic or current operations could subject us to significant legal liability or restrict our ability to operate.
We currently are defending litigation and anticipate we will be required to defend new litigation in the future. Our operations, including those of MPLX and ANDX, and those of our predecessors and Andeavor’s predecessors could expose us to litigation and civil claims by private plaintiffs for alleged damages related to contamination of the environment or personal injuries caused by releases of hazardous substances from our facilities, products liability, consumer credit or privacy laws, product pricing or antitrust laws or any other laws or regulations that apply to our operations. While an adverse outcome in most litigation matters would not be expected to be material to us, in class-action litigation, large classes of plaintiffs may allege damages relating to extended periods of time or other alleged facts and circumstances that could increase the amount of potential damages. Attorneys general and other government officials may pursue litigation in which they seek to recover civil damages from companies on behalf of a state or its citizens for a variety of claims, including violation of consumer protection and product pricing laws or natural resources damages. We are defending litigation of that type and anticipate that we will be required to defend new litigation of that type in the future. If we are not able to successfully defend such litigation, it may result in liability to our company that could materially and adversely affect our business, financial condition, results of operations and cash flows. We do not have insurance covering all of these potential liabilities. In addition to substantial liability, plaintiffs in litigation may also seek injunctive relief which, if imposed, could have a material adverse effect on our future business, financial condition, results of operations and cash flows.
A portion of our workforce is unionized, and we may face labor disruptions that could materially and adversely affect our business, financial condition, results of operations and cash flows.
Approximately 4,780 of our employees are covered by collective bargaining agreements. Of these employees, approximately 1,465 employees at our Galveston Bay, Mandan and Martinez refineries are covered by collective bargaining agreements which were set to expire on January 31, 2019. The parties continue their negotiations toward a new agreement, and are working under rolling extensions. Approximately 425 employees at our Martinez Chemical Plant, our Los Angeles refinery and our Galveston Bay refinery are covered by collective bargaining agreements expiring over the next several months. Approximately 410 hourly employees at Speedway are represented under collective bargaining agreements. The majority of these employees work at certain retail locations in New York and New Jersey under agreements which expire on March 14, 2019 and June 30, 2019, respectively. The remaining Speedway represented employees are drivers in Minnesota under an agreement which expires in 2021. Approximately 300 employees at our St. Paul Park and Gallup refineries are covered by collective bargaining agreements scheduled to expire in 2020. Approximately 1,620 employees at our Anacortes, Canton, Catlettsburg, Los Angeles, and Salt Lake City refineries are covered by collective bargaining agreements that are due to expire in 2022. The remaining 560 hourly represented employees are covered by collective bargaining agreements with expiration dates ranging from 2021 to 2024. These contracts may be renewed at an increased cost to us. In addition, we have experienced in the past, and may experience in the future, work stoppages as a result of labor disagreements. Any prolonged work stoppages disrupting operations could have a material adverse effect on our business, financial condition, results of operations and cash flows.
In addition, California requires refinery owners to pay prevailing wages to contract craft workers and restricts refiners’ ability to hire qualified employees to a limited pool of applicants. Legislation or changes in regulations could result in labor shortages higher labor costs, and an increased risk that contract employees become joint employees, which could trigger bargaining issues, employment discrimination liability issues as well as wage and benefit consequences, especially during critical maintenance and construction periods.
Two of our subsidiaries act as general partners of publicly traded master limited partnerships, which may involve a greater exposure to certain legal liabilities than existed under our historic business operations.
One of our subsidiaries acts as the general partner of MPLX, a publicly traded MLP. Another of our subsidiaries acts as the general partner of ANDX, a publicly traded MLP. We acquired control of ANDX’s general partner through the Andeavor acquisition. Our control of the general partners of MPLX and ANDX may increase the possibility of claims of breach of fiduciary duties, including claims of conflicts of interest related to MPLX and ANDX. Any liability resulting from such claims could have a material adverse effect on our future business, financial condition, results of operations and cash flows.
25
If foreign investment in us or MPLX exceeds certain levels, MPLX could be prohibited from operating inland river vessels, which could materially and adversely affect our business, financial condition, results of operations and cash flows.
The Shipping Act of 1916 and Merchant Marine Act of 1920, which we refer to collectively as the Maritime Laws, generally require that vessels engaged in U.S. coastwise trade be owned by U.S. citizens. Among other requirements to establish citizenship, entities that own such vessels must be owned at least 75 percent by U.S. citizens. If we fail to maintain compliance with the Maritime Laws, MPLX would be prohibited from operating vessels in the U.S. inland waters. Such a prohibition could materially and adversely affect our business, financial condition, results of operations and cash flows.
We are subject to certain continuing contingent liabilities of Marathon Oil relating to taxes and other matters and to potential liabilities pursuant to the tax sharing agreement and separation and distribution agreement we entered into with Marathon Oil that could materially and adversely affect our business, financial condition, results of operations and cash flows.
Although the Spinoff occurred in mid-2011, certain liabilities of Marathon Oil could become our obligations. For example, under the Internal Revenue Code of 1986 (the “Code”) and related rules and regulations, each corporation that was a member of the Marathon Oil consolidated tax reporting group during any taxable period or portion of any taxable period ending on or before the effective time of the Spinoff is jointly and severally liable for the federal income tax liability of the entire Marathon Oil consolidated tax reporting group for that taxable period. In connection with the Spinoff, we entered into a tax sharing agreement with Marathon Oil that allocates the responsibility for prior period taxes of the Marathon Oil consolidated tax reporting group between us and Marathon Oil. However, if Marathon Oil is unable to pay any prior period taxes for which it is responsible, we could be required to pay the entire amount of such taxes. Other provisions of federal law establish similar liability for other matters, including laws governing tax-qualified pension plans as well as other contingent liabilities.
Also pursuant to the tax sharing agreement, following the Spinoff we are responsible generally for all taxes attributable to us or any of our subsidiaries, whether accruing before, on or after the Spinoff. We also agreed to be responsible for, and indemnify Marathon Oil with respect to, all taxes arising as a result of the Spinoff (or certain internal restructuring transactions) failing to qualify as transactions under Sections 368(a) and 355 of the Code for U.S. federal income tax purposes to the extent such tax liability arises as a result of any breach of any representation, warranty, covenant or other obligation by us or certain affiliates made in connection with the issuance of the private letter ruling relating to the Spinoff or in the tax sharing agreement. In addition, we agreed to indemnify Marathon Oil for specified tax-related liabilities associated with our 2005 acquisition of the minority interest in our refining joint venture from Ashland Inc. Our indemnification obligations to Marathon Oil and its subsidiaries, officers and directors are not limited or subject to any cap. If we are required to indemnify Marathon Oil and its subsidiaries and their respective officers and directors under the tax sharing agreement, we may be subject to substantial liabilities. At this time, we cannot precisely quantify the amount of these liabilities that have been assumed pursuant to the tax sharing agreement, and there can be no assurances as to their final amounts.
Also, in connection with the Spinoff, we entered into a separation and distribution agreement with Marathon Oil that provides for, among other things, the principal corporate transactions that were required to effect the Spinoff, certain conditions to the Spinoff and provisions governing the relationship between our company and Marathon Oil with respect to and resulting from the Spinoff. Among other things, the separation and distribution agreement provides for indemnification obligations designed to make us financially responsible for substantially all liabilities that may exist relating to our downstream business activities, whether incurred prior to or after the Spinoff, as well as certain obligations of Marathon Oil assumed by us. Our obligations to indemnify Marathon Oil under the circumstances set forth in the separation and distribution agreement could subject us to substantial liabilities. Marathon Oil also agreed to indemnify us for certain liabilities. However, third parties could seek to hold us responsible for any of the liabilities retained by Marathon Oil, and there can be no assurance that the indemnity from Marathon Oil will be sufficient to protect us against the full amount of such liabilities, that Marathon Oil will be able to fully satisfy its indemnification obligations or that Marathon Oil’s insurers will cover us for liabilities associated with occurrences prior to the Spinoff. Moreover, even if we ultimately succeed in recovering from Marathon Oil or its insurers any amounts for which we are held liable, we may be temporarily required to bear these losses ourselves. The tax liabilities and underlying liabilities in the event Marathon Oil is unable to satisfy its indemnification obligations described in this paragraph could have a material adverse effect on our business, financial condition, results of operation and cash flows.
Significant acquisitions in the future will involve the integration of new assets or businesses and present substantial risks that could adversely affect our business, financial conditions, results of operations and cash flows.
Significant future transactions involving the addition of new assets or businesses will present potential risks, which may include, among others:
|
•
|
Inaccurate assumptions about future synergies, revenues, capital expenditures and operating costs;
|
26
|
•
|
An inability to successfully integrate assets or businesses we acquire;
|
|
•
|
A decrease in our liquidity resulting from using a portion of our available cash or borrowing capacity under our revolving credit agreement to finance transactions;
|
|
•
|
A significant increase in our interest expense or financial leverage if we incur additional debt to finance transactions;
|
|
•
|
The assumption of unknown environmental and other liabilities, losses or costs for which we are not indemnified or for which our indemnity is inadequate;
|
|
•
|
The diversion of management’s attention from other business concerns; and
|
|
•
|
The incurrence of other significant charges, such as impairment of goodwill or other intangible assets, asset devaluation or restructuring charges.
|
A significant decrease or delay in oil and natural gas production in MPLX’s or ANDX’s areas of operation, whether due to sustained declines in oil, natural gas and NGL prices, natural declines in well production, or otherwise, may adversely affect MPLX’s or ANDX’s business, results of operations and financial condition, and could reduce their ability to make distributions to us.
A significant portion of MPLX’s operations are dependent upon production from oil and natural gas reserves and wells owned by its producer customers, which will naturally decline over time, which means that MPLX’s cash flows associated with these wells will also decline over time. To maintain or increase throughput levels and the utilization rate of MPLX’s facilities, MPLX must continually obtain new oil, natural gas and NGL supplies, which depends in part on the level of successful drilling activity near its facilities. Similarly, ANDX’s operations are dependent in part on the production of crude oil in the Bakken region and the production of natural gas and NGLs in the Green River, Uinta and Williston basins.
We have no control over the level of drilling activity in the areas of MPLX’s or ANDX’s operations, the amount of reserves associated with the wells or the rate at which production from a well will decline. In addition, we have no control over producers or their production decisions, which are affected by, among other things, prevailing and projected energy prices, drilling costs per Mcf or barrel, demand for hydrocarbons, operational challenges, access to downstream markets, the level of reserves, geological considerations, governmental regulations and the availability and cost of capital. Because of these factors, even if new oil or natural gas reserves are discovered in areas served by MPLX or ANDX assets, producers may choose not to develop those reserves. If MPLX and ANDX are not able to obtain new supplies of oil, natural gas or NGLs to replace the natural decline in volumes from existing wells, throughput on their pipelines and the utilization rates of their facilities would decline, which could have a material adverse effect on their business, results of operations and financial condition and could reduce their ability to make distributions to us.
Decreases in energy prices can decrease drilling activity, production rates and investments by third parties in the development of new oil and natural gas reserves. The prices for oil, natural gas and NGLs depend upon factors beyond our control, including global and local demand, production levels, changes in interstate pipeline gas quality specifications, imports and exports, seasonality and weather conditions, economic and political conditions domestically and internationally and governmental regulations. Sustained periods of low prices could result in producers also significantly curtailing or limiting their oil and gas drilling operations which could substantially delay the production and delivery of volumes of oil, natural gas and NGLs to MPLX’s and ANDX’s facilities and adversely affect their revenues and cash available for distribution to us. This impact may also be exacerbated due to the extent of MPLX’s commodity-based contracts, which are more directly impacted by changes in natural gas and NGL prices than its fee-based contracts due to frac spread exposure and may result in operating losses when natural gas becomes more expensive on a Btu equivalent basis than NGL products. In addition, the purchase and resale of natural gas and NGLs in the ordinary course exposes our Midstream operations to volatility in natural gas or NGL prices due to the potential difference in the time of the purchases and sales and the potential difference in the price associated with each transaction, and direct exposure may also occur naturally as a result of production processes. Also, the significant volatility in natural gas, NGL and oil prices could adversely impact MPLX’s or ANDX’s unit price, thereby increasing its distribution yield and cost of capital. Such impacts could adversely impact MPLX’s and ANDX’s ability to execute its long‑term organic growth projects, satisfy obligations to its customers and make distributions to unitholders at intended levels, and may also result in non-cash impairments of long-lived assets or goodwill or other-than-temporary non-cash impairments of our equity method investments.
27
Significant stockholders may attempt to effect changes at our company or acquire control over our company, which could impact the pursuit of business strategies and adversely affect our results of operations and financial condition.
Our stockholders may from time to time engage in proxy solicitations, advance stockholder proposals or otherwise attempt to effect changes or acquire control over our company. Campaigns by stockholders to effect changes at publicly traded companies are sometimes led by investors seeking to increase short-term stockholder value through actions such as financial restructuring, increased debt, special dividends, stock repurchases or sales of assets or the entire company. Responding to proxy contests and other actions by activist stockholders can be costly and time-consuming and could divert the attention of our board of directors and senior management from the management of our operations and the pursuit of our business strategies. As a result, stockholder campaigns could adversely affect our results of operations and financial condition.
We do not own all of the land on which our assets are located, which could disrupt our operations.
We do not own all of the land on which certain of our assets are located, particularly our midstream assets, but rather obtain the rights to construct and operate such assets on land owned by third parties and governmental agencies for a specific period of time. Therefore, we are subject to the possibility of more burdensome terms and increased costs to retain necessary land use if our leases, rights-of-way or other property rights lapse or terminate or it is determined that we do not have valid leases, rights-of-way or other property rights. Our loss of these rights, including loss through our inability to renew leases, right-of-way agreements or permits on satisfactory terms or at all, could have a material adverse effect on our business, financial condition, results of operations and cash flows.
RISKS RELATING TO THE ANDEAVOR ACQUISITION
The Andeavor acquisition may not be accretive, and may be dilutive, to MPC’s earnings per share and cash flow from operations per share, which may negatively affect the market price of shares of MPC common stock.
The Andeavor acquisition may not be accretive, and may be dilutive, to MPC’s earnings per share and cash flow from operations per share. Earnings per share and cash flow from operations per share in the future are based on preliminary estimates that may materially change. In addition, future events and conditions could decrease or delay any accretion, result in dilution or cause greater dilution than is currently expected, including:
|
•
|
adverse changes in energy market conditions;
|
|
•
|
commodity prices for oil, natural gas and natural gas liquids;
|
|
•
|
production levels;
|
|
•
|
operating results;
|
|
•
|
competitive conditions;
|
|
•
|
laws and regulations affecting the energy business;
|
|
•
|
capital expenditure obligations;
|
|
•
|
higher than expected integration costs;
|
|
•
|
lower than expected synergies; and
|
|
•
|
general economic conditions.
|
Any dilution of, or decrease or delay of any accretion to, MPC’s earnings per share or cash flow from operations per share could cause the price of MPC’s common stock to decline.
MPC has incurred and will continue to incur significant costs in connection with the Andeavor acquisition, which may be in excess of those anticipated by MPC.
MPC has incurred substantial expenses in connection with the Andeavor acquisition. MPC expects to continue to incur a number of non-recurring costs associated with combining the operations of the two companies and achieving desired synergies. These fees and costs have been, and will continue to be, substantial.
MPC will also incur transaction fees and costs related to formulating and implementing integration plans, including facilities and systems consolidation costs and employment-related costs. Additional unanticipated costs may be incurred in the integration of the two companies’ businesses. Although MPC expects that the elimination of duplicative costs, as well as the realization of other efficiencies related to the integration of the businesses, should allow MPC to offset integration-related costs
28
over time, this net benefit may not be achieved in the near term, or at all. See the risk factor below entitled “The integration of Andeavor into MPC may not be as successful as anticipated.”
The costs described above, as well as other unanticipated costs and expenses, could materially and adversely affect MPC’s results of operations, financial position and cash flows.
The integration of Andeavor into MPC may not be as successful as anticipated.
The Andeavor acquisition involves numerous operational, strategic, financial, accounting, legal, tax and other risks; potential liabilities associated with the acquired businesses; and uncertainties related to design, operation and integration of Andeavor’s internal control over financial reporting. Difficulties in integrating Andeavor into MPC may result in legacy Andeavor assets performing differently than expected, in operational challenges or in the failure to realize anticipated expense-related efficiencies. Potential difficulties that may be encountered in the integration process include, among other factors:
|
•
|
the inability to successfully integrate the businesses of Andeavor into MPC in a manner that permits MPC to achieve the full revenue and cost savings anticipated from the merger;
|
|
•
|
complexities associated with managing the larger, more complex, integrated business;
|
|
•
|
not realizing anticipated operating synergies or incurring unexpected costs to realize such synergies;
|
|
•
|
integrating personnel from the two companies while maintaining focus on providing consistent, high-quality products and services;
|
|
•
|
potential unknown liabilities and unforeseen expenses, delays or regulatory conditions associated with the merger;
|
|
•
|
loss of key employees;
|
|
•
|
integrating relationships with customers, vendors and business partners;
|
|
•
|
performance shortfalls as a result of the diversion of management’s attention caused by completing the merger and integrating Andeavor’s operations into MPC; and
|
|
•
|
the disruption of, or the loss of momentum in, each company’s ongoing business or inconsistencies in standards, controls, procedures and policies.
|
MPC’s results may suffer if it does not effectively manage its expanded operations following the Andeavor acquisition.
MPC’s success depends, in part, on its ability to manage its expansion following the Andeavor acquisition, which poses numerous risks and uncertainties, including the need to integrate the operations and business of Andeavor into its existing business in an efficient and timely manner, to combine systems and management controls and to integrate relationships with customers, vendors and business partners.
MPC may fail to realize all of the anticipated benefits of the Andeavor acquisition.
The success of the Andeavor acquisition depends, in part, on MPC’s ability to realize the anticipated benefits and cost savings from combining MPC’s and Andeavor’s businesses, including the annual gross, run-rate, commercial and corporate synergies that MPC expects to realize within the first three years after the combination. The anticipated benefits and cost savings of the Andeavor acquisition may not be realized fully or at all, may take longer to realize than expected, may require more non-recurring costs and expenditures to realize than expected or could have other adverse effects. Some of the assumptions that MPC has made, such as with respect to anticipated: operating synergies or the costs associated with realizing such synergies; significant long-term cash flow generation; the benefit from a substantial increase in scale and geographic diversity; complementary growth platforms for both midstream and retail businesses; positioning for potentially significant benefits from the International Maritime Organization change in specifications for marine bunker fuel; the expansion in opportunities for logistics growth in crude oil production basins and regions; further optimization of crude supply; and the continuation of MPC’s investment grade credit profile, may not be realized. The integration process may result in the loss of key employees, the disruption of ongoing businesses or inconsistencies in standards, controls, procedures and policies. There could be potential unknown liabilities and unforeseen expenses associated with the Andeavor acquisition that were not discovered in the course of performing due diligence.
29
We have recorded goodwill and other intangible assets that could become impaired and result in material non-cash charges to our results of operations.
We accounted for the Andeavor and other acquisitions using the acquisition method of accounting, which requires that the assets and liabilities of the acquired business be recorded to our balance sheet at their respective fair values as of the acquisition date. Any excess of the purchase consideration over the fair value of the acquired net assets is recognized as goodwill.
As of December 31, 2018, our balance sheet reflected
$20.2 billion
and
$3.4 billion
of goodwill and other intangible assets, respectively. These amounts include the preliminary estimates of goodwill and other intangible assets of
$16.3 billion
and
$2.8 billion
, respectively, recognized in connection with the Andeavor acquisition. To the extent the value of goodwill or intangible assets becomes impaired, we may be required to incur material non-cash charges relating to such impairment. Our operating results may be significantly impacted from both the impairment and the underlying trends in the business that triggered the impairment.
RISKS RELATED TO OUR INDUSTRY
Meeting the requirements of evolving environmental or other laws or regulations may reduce our refining and marketing margin and may result in substantial capital expenditures and operating costs that could materially and adversely affect our business, financial condition, results of operations and cash flows.
Various laws and regulations are expected to impose increasingly stringent and costly requirements on our operations, which may reduce our refining and marketing margin. Laws and regulations expected to become more stringent relate to the following:
|
•
|
the emission or discharge of materials into the environment,
|
|
•
|
solid and hazardous waste management,
|
|
•
|
pollution prevention,
|
|
•
|
greenhouse gas emissions,
|
|
•
|
climate change,
|
|
•
|
characteristics and composition of gasoline and diesel fuels,
|
|
•
|
public and employee safety and health,
|
|
•
|
inherently safer technology, and
|
|
•
|
facility security.
|
The specific impact of laws and regulations on us and our competitors may vary depending on a number of factors, including the age and location of operating facilities, marketing areas, crude oil and feedstock sources and production processes. We may be required to make expenditures to modify operations, install pollution control equipment, perform site cleanups or curtail operations that could materially and adversely affect our business, financial condition, results of operations and cash flows.
The EPA’s National Ambient Air Quality Standards (“NAAQS”) are among the regulations that impact our operations. In October 2015, the EPA reduced the primary (health) ozone NAAQS to 70 ppb from the prior ozone level of 75 ppb. On November 6, 2017, the EPA finalized ozone attainment/unclassifiable designations under the new standard. In actions dated April 30, 2018, and July 25, 2018, the EPA finalized nonattainment designations for certain areas under the lower primary ozone standard. In some areas, these nonattainment designations could result in increased costs associated with, or result in cancellation or delay of, capital projects at our facilities. States will also be required to adopt SIPs for nonattainment areas. These SIPs may include NOx and/or VOC reductions that could result in increased costs to our facilities. We cannot predict the various SIP requirements at this time. The EPA announced that it plans to review the NAAQS level for particulate matter (“PM”). A reduction in the PM NAAQS and subsequent designation of nonattainment could also result in increased costs associated with, or result in cancellation or delay of, capital projects at our facilities.
The EISA established increases in fuel mileage standards. The Department of Transportation’s National Highway Safety Administration and the EPA work in conjunction to establish CAFE standards and greenhouse gas emission standards for light-duty vehicles that become more stringent over time. In addition, pursuant to a waiver granted by the EPA, California and other states have enacted laws that require vehicle emission reductions. Increases in fuel mileage standards and requirements for zero emission vehicles may reduce demand for refined product.
The EISA also expanded the Renewable Fuel Standard (“RFS”) program administered by the EPA. Governmental regulations encouraging the use of new or alternative fuels could pose a competitive threat to our operations. The EISA required the total
30
volume of renewable transportation fuels sold or introduced annually in the U.S. to reach 36.0 billion gallons by 2022. The RFS presents production and logistics challenges for both the renewable fuels and petroleum refining industries, and may continue to require additional capital expenditures or expenses by us to accommodate increased renewable fuels use. Gasoline consumption has been lower than forecasted by the EPA, which has led to concerns that the renewable fuel volumes may not be met. On November 30, 2018, EPA finalized RFS volume requirements for the year 2019, and the biomass-based diesel volume requirement for year 2020. The EPA used its cellulosic waiver authority to reduce the volumes for 2019 from the statutory amounts to the following: 19.92 billion gallons total renewable fuel; 4.92 billion gallons advanced biofuel; and 418 million gallons cellulosic biofuel. The EPA set the biomass-based diesel volume requirement for 2020 at 2.43 billion gallons, which is significantly greater than the statutory floor of 1.0 billion gallons.
Tax incentives and other subsidies have also made renewable fuels more competitive with refined products than they otherwise would have been, which may further reduce refined product margins. The tax incentives and subsidies are causing uncertainties because they have expired and been reinstituted retroactively. The biodiesel credit, for example, expired at the end of 2016 and was retroactively reinstated in early 2018. It is not certain whether the credit will be reinstituted beyond 2018.
On March 3, 2014, the EPA signed the final Tier 3 fuel standards. The final Tier 3 fuel standards require, among other things, a lower annual average sulfur level in gasoline to no more than 10 ppm beginning in calendar year 2017. In addition, gasoline refiners and importers may not exceed a maximum per-gallon sulfur standard of 80 ppm, while retailers may not exceed a maximum per-gallon sulfur standard of 95 ppm. Since 2014, we have made approximately $490 million in capital expenditures necessary to comply with these standards. For 2019, we expect an additional $260 million of capital expenditures to comply with these standards.
Federal, state and local legislation and regulatory initiatives relating to hydraulic fracturing could delay or impede producer’s gas production or result in reduced volumes available for our midstream assets to gather, process and fractionate. While we do not conduct hydraulic fracturing operations, we do provide gathering, processing and fractionation services with respect to natural gas and natural gas liquids produced by our customers as a result of such operations. If federal, state or local laws or regulations that significantly restrict hydraulic fracturing are adopted, such legal requirements could make it more difficult to complete natural gas wells in shale formations and increase producers’ costs of compliance.
Climate change and greenhouse gas emission regulation could affect our operations, energy consumption patterns and regulatory obligations, any of which could affect our results of operations and financial condition.
Currently, multiple legislative and regulatory measures to address greenhouse gas (including carbon dioxide, methane and nitrous oxides) and other emissions are in various phases of consideration, promulgation or implementation. These include actions to develop international, federal, regional or statewide programs, which could require reductions in our greenhouse gas or other emissions, establish a carbon tax and decrease the demand for our refined products. Requiring reductions in these emissions could result in increased costs to (i) operate and maintain our facilities, (ii) install new emission controls at our facilities and (iii) administer and manage any emissions programs, including acquiring emission credits or allotments.
For example, in California, the state legislature adopted SB 32 in 2016. SB 32 set a cap on emissions of 40% below 1990 levels by 2030 but did not establish a particular mechanism to achieve that target. The legislature also adopted a companion bill, AB 197, that most significantly directs the CARB to prioritize direct emission reductions on large stationary sources. In 2017, the state legislature adopted AB 398 which provides direction and parameters on utilizing cap and trade after 2020 to meet the 40% reduction target from 1990 levels by 2030 specified in SB 32. In 2009, CARB adopted the Low Carbon Fuel Standard (“LCFS”). The LCFS was amended again in 2018 with the current version targeting a 20% reduction in fuel carbon intensity from a 2010 baseline by 2030. Compliance is demonstrated by blending lower carbon intensity biofuels into gasoline and diesel or by purchasing credits. Compliance with each of the cap and trade and LCFS programs is demonstrated through a market-based credit system. Other states are proposing, or have already promulgated, low carbon fuel standards or similar initiatives to reduce emissions from the transportation sector. If we are unable to pass the costs of compliance on to our customers, sufficient credits are unavailable for purchase, we have to pay a significantly higher price for credits, or if we are otherwise unable to meet our compliance obligation, our financial condition and results of operations could be adversely affected.
Regional and state climate change and air emissions goals and regulatory programs are complex, subject to change and considerable uncertainty due to a number of factors including technological feasibility, legal challenges and potential changes in federal policy. Increasing concerns about climate change have also resulted in a number of international and national measures to limit greenhouse gas emissions. Additional stricter measures can be expected in the future and any of these changes may have a material adverse impact on our business or financial condition.
International climate change-related efforts, such as the 2015 United Nations Conference on Climate Change, which led to the creation of the Paris Agreement, may impact the regulatory framework of states whose policies directly influence our present and future operations. Though the United States has announced its intention to withdraw from the Paris Agreement, withdrawal
31
it is not possible until November 2019 at the earliest. If the United States declines to withdraw, the extent of such regulation and the cost associated with compliance cannot be predicted.
We could also face increased climate‐related litigation with respect to our operations or products. Governmental and other entities in California, New York, Maryland and Rhode Island have filed lawsuits against coal, gas, oil and petroleum companies, including the Company. The lawsuits allege damages as a result of climate change and the plaintiffs are seeking unspecified damages and abatement under various tort theories. Similar lawsuits may be filed in other jurisdictions. There remains a high degree of uncertainty regarding the ultimate outcome of these lawsuits, as well as their potential effect on the Company’s business, financial condition, results of operation and cash flows.
Regulatory and other requirements concerning the transportation of crude oil and other commodities by rail may cause increases in transportation costs or limit the amount of crude oil that we can transport by rail.
We rely on a variety of systems to transport crude oil, including rail. Rail transportation is regulated by federal, state and local authorities. New regulations or changes in existing regulations could result in increased compliance expenditures. For example, in 2015 the U.S. Department of Transportation issued new standards and regulations applicable to crude-by-rail transportation (Enhanced Tank Car Standards and Operational Controls for High-Hazard Flammable Trains). These or other regulations that require the reduction of volatile or flammable constituents in crude oil that is transported by rail, change the design or standards for rail cars used to transport the crude oil we purchase, change the routing or scheduling of trains carrying crude oil, or require any other changes that detrimentally affect the economics of delivering North American crude oil by rail could increase the time required to move crude oil from production areas to our refineries, increase the cost of rail transportation and decrease the efficiency of shipments of crude oil by rail within our operations. Any of these outcomes could have a material adverse effect on our business and results of operations.
Severe weather events and other climate conditions may adversely affect our facilities and ongoing operations.
We have mature systems in place to manage potential acute physical risks, such as floods, hurricane-force winds, wildfires and snowstorms, and potential chronic physical risks, such as higher ocean levels. If any such events were to occur, they could have an adverse effect on our assets and operations. Specifically, where appropriate, we are hardening and modernizing assets against weather damage and ensuring we have resiliency measures in place, such as storm-specific readiness plans. We have incurred and will continue to incur additional costs to protect our assets and operations from such physical risks and employ the evolving technologies and processes available to mitigate such risks. To the extent such severe weather events or other climate conditions increase in frequency and severity, we may be required to modify operations and incur costs that could materially and adversely affect our business, financial condition, results of operations and cash flows.
Plans we may have to expand existing assets or construct new assets are subject to risks associated with societal and political pressures and other forms of opposition to the future development, transportation and use of carbon-based fuels. Such risks could adversely impact our business and ability to realize certain growth strategies.
Our anticipated growth and planned expenditures are based upon the assumption that societal sentiment will continue to enable and existing regulations will remain intact to allow for the future development, transportation and use of carbon-based fuels. A portion of our growth strategy is dependent on our ability to expand existing assets and to construct additional assets. However, policy decisions relating to the production, refining, transportation and marketing of carbon-based fuels are subject to political pressures and the influence and protests of environmental and other special interest groups. One of the ways we may grow our business is through the construction of new pipelines or the expansion of existing ones. The construction of a new pipeline or the expansion of an existing pipeline, by adding horsepower or pump stations or by adding additional pipelines along existing pipelines, involves numerous regulatory, environmental, political, and legal uncertainties, most of which are beyond our control. The approval process for storage and transportation projects has become increasingly challenging, due in part to state and local concerns related to pipelines, negative public perception regarding the oil and gas industry, and concerns regarding greenhouse gas emissions downstream of pipeline operations. In addition, government disruptions, such as a U.S. federal government shutdown, may delay or halt the granting and renewal of permits, licenses and other items required by us and our customers to conduct our business. We have experienced construction delays related to these factors as a result of the U.S. federal government’s recent shutdown. Our expansion or construction projects may not be completed on schedule (or at all) or at the budgeted cost. In addition, our revenues may not increase immediately upon the expenditure of funds on a particular project. For instance, if we build a new pipeline, the construction will occur over an extended period of time and we will not receive any material increases in revenues until after completion of the project. Delays or cost increases related to capital spending programs involving engineering, procurement and construction of facilities (including improvements and repairs to our existing facilities) could adversely affect our ability to achieve forecasted internal rates of return and operating results, thereby limiting our ability to grow and generate cash flows.
32
Large capital projects can take many years to complete, and market conditions could deteriorate significantly between the project approval date and the project startup date, negatively impacting project returns. If we are unable to complete capital projects at their expected costs and in a timely manner, or if the market conditions assumed in our project economics deteriorate, our business, financial condition, results of operations and cash flows could be materially and adversely affected.
Delays or cost increases related to capital spending programs involving engineering, procurement and construction of facilities could materially adversely affect our ability to achieve forecasted internal rates of return and operating results. Delays in making required changes or upgrades to our facilities could subject us to fines or penalties as well as affect our ability to supply certain products we produce. Such delays or cost increases may arise as a result of unpredictable factors, many of which are beyond our control, including:
|
•
|
denial of or delay in receiving requisite regulatory approvals and/or permits;
|
|
•
|
unplanned increases in the cost of construction materials or labor;
|
|
•
|
disruptions in transportation of components or construction materials;
|
|
•
|
adverse weather conditions, natural disasters or other events (such as equipment malfunctions, explosions, fires or spills) affecting our facilities, or those of vendors or suppliers;
|
|
•
|
shortages of sufficiently skilled labor, or labor disagreements resulting in unplanned work stoppages;
|
|
•
|
market-related increases in a project’s debt or equity financing costs; and
|
|
•
|
nonperformance by, or disputes with, vendors, suppliers, contractors or subcontractors.
|
Any one or more of these factors could have a significant impact on our ongoing capital projects. If we were unable to make up the delays associated with such factors or to recover the related costs, or if market conditions change, it could materially and adversely affect our business, financial condition, results of operations and cash flows.
The availability of crude oil and increases in crude oil prices may reduce profitability and refining and marketing margins.
The profitability of our operations depends largely on the difference between the cost of crude oil and other feedstocks we refine and the selling prices we obtain for refined products. A portion of our crude oil is purchased from various foreign national oil companies, production companies and trading companies, including suppliers from Canada, the Middle East and various other international locations. The market for crude oil and other feedstocks is largely a world market. We are, therefore, subject to the attendant political, geographic and economic risks of such a market. If one or more major supply sources were temporarily or permanently eliminated, we believe adequate alternative supplies of crude oil would be available, but it is possible we would be unable to find alternative sources of supply. If we are unable to obtain adequate crude oil volumes or are able to obtain such volumes only at unfavorable prices, our operations, sales of refined products and refining and marketing margins could be adversely affected, materially and adversely impacting our business, financial condition, results of operations and cash flows.
We are subject to risks arising from our non-U.S. operations and generally to worldwide political and economic developments.
We have expanded the scope of our non-U.S. operations through the Andeavor acquisition, particularly in Mexico, South America and Asia. Our business, financial condition, results of operations and cash flows could be negatively impacted by disruptions in any of these markets, including economic instability, restrictions on the transfer of funds, duties and tariffs, transportation delays, import and export controls, changes in governmental policies, labor unrest, security issues involving key personnel and changing regulatory and political environments. In addition, if trade relationships deteriorate with these countries, if existing trade agreements are modified or terminated, new economic sanctions relevant to such jurisdictions are passed or if taxes, border adjustments or tariffs make trading with these countries more costly, it could have a material adverse effect on our business, financial condition, results of operations and cash flows.
We are required to comply with U.S. and international laws and regulations, including those involving anti-bribery, anti-corruption and anti-money laundering. For example, the Foreign Corrupt Practices Act and similar laws and regulations prohibit improper payments to foreign officials for the purpose of obtaining or retaining business or gaining any business advantage. Our compliance policies and programs mandate compliance with all applicable anti-corruption laws but may not be completely effective in ensuring our compliance. Our training and compliance program and our internal control policies and procedures may not always protect us from violations committed by our employees or agents. Actual or alleged violations of
33
these laws could disrupt our business and cause us to incur significant legal expenses, and could result in a material adverse effect on our reputation, business, financial condition, results of operations and cash flows.
More broadly, political and economic factors in global markets could impact crude oil and other feedstock supplies and could have a material adverse effect on us in other ways. Hostilities in the Middle East or the occurrence or threat of future terrorist attacks could adversely affect the economies of the U.S. and other developed countries. A lower level of economic activity could result in a decline in energy consumption, which could cause our revenues and margins to decline and limit our future growth prospects. These risks could lead to increased volatility in prices for refined products, NGLs and natural gas. Additionally, these risks could increase instability in the financial and insurance markets and make it more difficult and/or costly for us to access capital and to obtain the insurance coverage that we consider adequate. Additionally, tax policy, legislative or regulatory action and commercial restrictions could reduce our operating profitability. For example, the U.S. government could prevent or restrict exports of refined products, NGLs, natural gas or the conduct of business in or with certain foreign countries. In addition, foreign countries could restrict imports, investments or commercial transactions.
Compliance with and changes in tax laws could materially and adversely impact our financial condition, results of operations and cash flows.
We are subject to extensive tax liabilities, including federal and state income taxes and transactional taxes such as excise, sales and use, payroll, franchise, withholding and property taxes. New tax laws and regulations and changes in existing tax laws and regulations could result in increased expenditures by us for tax liabilities in the future and could materially and adversely impact our financial condition, results of operations and cash flows.
Additionally, many tax liabilities are subject to periodic audits by taxing authorities, and such audits could subject us to interest and penalties.
Terrorist attacks aimed at our facilities or that impact our customers or the markets we serve could adversely affect our business.
The U.S. government has issued warnings that energy assets in general, including the nation’s refining, pipeline and terminal infrastructure, may be future targets of terrorist organizations. The threat of terrorist attacks has subjected our operations to increased risks. Any future terrorist attacks on our facilities, those of our customers and, in some cases, those of other pipelines, could have a material adverse effect on our business. Similarly, any future terrorist attacks that severely disrupt the markets we serve could materially and adversely affect our results of operations, financial position and cash flows.
RISKS RELATING TO OWNERSHIP OF OUR COMMON STOCK
Provisions in our corporate governance documents could operate to delay or prevent a change in control of our company, dilute the voting power or reduce the value of our capital stock or affect its liquidity.
The existence of some provisions within our restated certificate of incorporation and amended and restated bylaws could discourage, delay or prevent a change in control of us that a stockholder may consider favorable. These include provisions:
|
•
|
providing that our board of directors fixes the number of members of the board;
|
|
•
|
providing for the division of our board of directors into three classes with staggered terms;
|
|
•
|
providing that only our board of directors may fill board vacancies;
|
|
•
|
limiting who may call special meetings of stockholders;
|
|
•
|
prohibiting stockholder action by written consent, thereby requiring stockholder action to be taken at a meeting of the stockholders;
|
|
•
|
establishing advance notice requirements for nominations of candidates for election to our board of directors or for proposing matters that can be acted on by stockholders at stockholder meetings;
|
|
•
|
establishing supermajority vote requirements for certain amendments to our restated certificate of incorporation;
|
|
•
|
providing that our directors may only be removed for cause;
|
|
•
|
authorizing a large number of shares of common stock that are not yet issued, which would allow our board of directors to issue shares to persons friendly to current management, thereby protecting the continuity of our management, or which could be used to dilute the stock ownership of persons seeking to obtain control of us; and
|
|
•
|
authorizing the issuance of “blank check” preferred stock, which could be issued by our board of directors to increase the number of outstanding shares and thwart a takeover attempt.
|
34
We believe these provisions protect our stockholders from coercive or otherwise unfair takeover tactics by requiring potential acquirers to negotiate with our board of directors and by providing our board of directors time to assess any acquisition proposal, and are not intended to make us immune from takeovers. However, these provisions apply even if the offer may be considered beneficial by some stockholders and could delay or prevent an acquisition.
Our restated certificate of incorporation also authorizes us to issue, without the approval of our stockholders, one or more classes or series of preferred stock having such designation, powers, preferences and relative, participating, optional and other special rights, including preferences over our common stock respecting dividends and distributions, as our board of directors generally may determine. The terms of one or more classes or series of preferred stock could dilute the voting power or reduce the value of our common stock. For example, we could grant holders of preferred stock the right to elect some number of our board of directors in all events or on the happening of specified events or the right to veto specified transactions. Similarly, the repurchase or redemption rights or liquidation preferences we could assign to holders of preferred stock could affect the residual value of our common stock.
Finally, to facilitate compliance with the Maritime Laws, our restated certificate of incorporation limits the aggregate percentage ownership by non-U.S. citizens of our common stock or any other class of our capital stock to 23 percent of the outstanding shares. We may prohibit transfers that would cause ownership of our common stock or any other class of our capital stock by non-U.S. citizens to exceed 23 percent. Our restated certificate of incorporation also authorizes us to effect any and all measures necessary or desirable to monitor and limit foreign ownership of our common stock or any other class of our capital stock. These limitations could have an adverse impact on the liquidity of the market for our common stock if holders are unable to transfer shares to non-U.S. citizens due to the limitations on ownership by non-U.S. citizens. Any such limitation on the liquidity of the market for our common stock could adversely impact the market price of our common stock.
ITEM 1B. UNRESOLVED STAFF COMMENTS
None.
35
ITEM 2. PROPERTIES
We believe that our properties and facilities are adequate for our operations and that our facilities are adequately maintained. See the following sections for details of our assets by segment.
REFINING & MARKETING
The table below sets forth the location and crude oil refining capacity for each of our refineries as of
December 31, 2018
. Refining throughput can exceed crude oil capacity due to the processing of other charge and blendstocks in addition to crude oil and the timing of planned turnaround and major maintenance activity.
|
Refinery
|
Crude Oil Refining Capacity (
mbpcd
)
|
||
|
Gulf Coast Region
|
|||
|
Galveston Bay, Texas City, Texas
|
585
|
|
|
|
Garyville, Louisiana
|
564
|
|
|
|
Subtotal Gulf Coast region
|
1,149
|
|
|
|
Mid-Continent Region
|
|||
|
Catlettsburg, Kentucky
|
277
|
|
|
|
Robinson, Illinois
|
245
|
|
|
|
Detroit, Michigan
|
140
|
|
|
|
El Paso, Texas
|
131
|
|
|
|
St. Paul Park, Minnesota
|
98
|
|
|
|
Canton, Ohio
|
93
|
|
|
|
Mandan, North Dakota
|
71
|
|
|
|
Salt Lake City, Utah
|
61
|
|
|
|
Gallup, New Mexico
|
26
|
|
|
|
Dickinson, North Dakota
|
19
|
|
|
|
Subtotal Mid-Continent region
|
1,161
|
|
|
|
West Coast Region
|
|||
|
Los Angeles, California
|
363
|
|
|
|
Martinez, California
|
161
|
|
|
|
Anacortes, Washington
|
119
|
|
|
|
Kenai, Alaska
|
68
|
|
|
|
Subtotal West Coast region
|
711
|
|
|
|
3,021
|
|
||
36
The following table sets forth the approximate number of locations by state where independent entrepreneurs maintain branded outlets, primarily marketed under Marathon, Shell, Mobil and other brands, as of
December 31, 2018
.
|
Location
|
Number of
Branded Outlets |
||
|
Alabama
|
366
|
|
|
|
Alaska
|
43
|
|
|
|
Arizona
|
80
|
|
|
|
California
|
75
|
|
|
|
Colorado
|
13
|
|
|
|
District of Columbia
|
2
|
|
|
|
Florida
|
610
|
|
|
|
Georgia
|
298
|
|
|
|
Idaho
|
98
|
|
|
|
Illinois
|
262
|
|
|
|
Indiana
|
642
|
|
|
|
Iowa
|
4
|
|
|
|
Kentucky
|
554
|
|
|
|
Louisiana
|
26
|
|
|
|
Maryland
|
31
|
|
|
|
Mexico
|
114
|
|
|
|
Michigan
|
798
|
|
|
|
Minnesota
|
295
|
|
|
|
Mississippi
|
98
|
|
|
|
Nevada
|
67
|
|
|
|
New Mexico
|
31
|
|
|
|
New York
|
36
|
|
|
|
North Carolina
|
218
|
|
|
|
North Dakota
|
104
|
|
|
|
Ohio
|
842
|
|
|
|
Oregon
|
44
|
|
|
|
Pennsylvania
|
68
|
|
|
|
South Carolina
|
114
|
|
|
|
South Dakota
|
29
|
|
|
|
Tennessee
|
402
|
|
|
|
Texas
|
8
|
|
|
|
Utah
|
91
|
|
|
|
Virginia
|
117
|
|
|
|
Washington
|
61
|
|
|
|
West Virginia
|
110
|
|
|
|
Wisconsin
|
58
|
|
|
|
Wyoming
|
4
|
|
|
|
Total
|
6,813
|
|
|
37
The following table sets forth details about our Refining & Marketing owned and operated terminals as of
December 31, 2018
. See the Midstream - MPLX section for information with respect to MPLX owned and operated terminals. See the Midstream - ANDX section for information with respect to ANDX owned and operated terminals.
|
Owned and Operated Terminals
|
Number of
Terminals
|
Tank Storage
Capacity
(
thousand barrels
)
|
||||
|
Light Products Terminal:
|
||||||
|
Ohio
|
1
|
|
495
|
|
||
|
Asphalt Terminals:
|
||||||
|
Florida
|
1
|
|
263
|
|
||
|
Illinois
|
2
|
|
82
|
|
||
|
Indiana
|
2
|
|
424
|
|
||
|
Kentucky
|
4
|
|
549
|
|
||
|
Louisiana
|
1
|
|
54
|
|
||
|
Michigan
|
1
|
|
12
|
|
||
|
Ohio
|
4
|
|
1,800
|
|
||
|
Pennsylvania
|
1
|
|
452
|
|
||
|
Tennessee
|
2
|
|
483
|
|
||
|
Subtotal asphalt terminals
|
18
|
|
4,119
|
|
||
|
Total owned and operated terminals
|
19
|
|
4,614
|
|
||
38
RETAIL
Our Retail segment sells transportation fuels and merchandise through convenience stores it owns and operates, primarily under the Speedway brand, and sells transportation fuels through direct dealer locations, primarily under the ARCO brand. The following table sets forth the number of company-owned convenience stores by state as of
December 31, 2018
.
|
Location
|
Number of
Convenience Stores
|
||
|
Alaska
|
31
|
|
|
|
Arizona
|
95
|
|
|
|
California
|
492
|
|
|
|
Colorado
|
12
|
|
|
|
Connecticut
|
1
|
|
|
|
Delaware
|
4
|
|
|
|
Florida
|
239
|
|
|
|
Georgia
|
6
|
|
|
|
Idaho
|
7
|
|
|
|
Illinois
|
125
|
|
|
|
Indiana
|
309
|
|
|
|
Kentucky
|
146
|
|
|
|
Massachusetts
|
108
|
|
|
|
Michigan
|
306
|
|
|
|
Minnesota
|
205
|
|
|
|
Nevada
|
9
|
|
|
|
New Hampshire
|
12
|
|
|
|
New Jersey
|
67
|
|
|
|
New Mexico
|
120
|
|
|
|
New York
|
309
|
|
|
|
North Carolina
|
276
|
|
|
|
Ohio
|
491
|
|
|
|
Oregon
|
14
|
|
|
|
Pennsylvania
|
122
|
|
|
|
Rhode Island
|
19
|
|
|
|
South Carolina
|
52
|
|
|
|
South Dakota
|
1
|
|
|
|
Tennessee
|
49
|
|
|
|
Texas
|
31
|
|
|
|
Utah
|
39
|
|
|
|
Virginia
|
62
|
|
|
|
Washington
|
32
|
|
|
|
West Virginia
|
59
|
|
|
|
Wisconsin
|
70
|
|
|
|
Wyoming
|
3
|
|
|
|
Total
|
3,923
|
|
|
39
The following table sets forth the number of direct dealer locations by state as of
December 31, 2018
.
|
Location
|
Number of
Locations
|
||
|
Alaska
|
1
|
|
|
|
Arizona
|
71
|
|
|
|
California
|
930
|
|
|
|
Nevada
|
62
|
|
|
|
Washington
|
1
|
|
|
|
Total
|
1,065
|
|
|
MIDSTREAM - MPLX
The following tables set forth certain information relating to MPLX’s crude and products pipeline systems and storage assets as of
December 31, 2018
.
|
Pipeline System or Storage Asset
|
Origin
|
Destination
|
Diameter
(
inches
)
|
Length
(
miles
)
|
Capacity
(a)
|
Associated MPC refinery
|
||||||||
|
Crude oil pipeline systems (mbpd):
|
||||||||||||||
|
Patoka, IL to Lima, OH crude system
|
Patoka, IL
|
Lima, OH
|
20”-22”
|
302
|
|
267
|
|
Detroit, Canton
|
||||||
|
Lima, OH to Canton, OH crude system
|
Lima, OH
|
Canton, OH
|
12"-16"
|
153
|
|
84
|
|
Canton
|
||||||
|
Catlettsburg, KY and Robinson, IL crude system
|
Patoka, IL
|
Catlettsburg, KY &
Robinson, IL
|
20”-24”
|
484
|
|
515
|
|
Catlettsburg, Robinson
|
||||||
|
Detroit, MI crude system
(b)
|
Samaria &
Romulus, MI
|
Detroit, MI
|
16”
|
61
|
|
197
|
|
Detroit
|
||||||
|
Ozark crude system
|
Cushing, OK
|
Wood River, IL
|
22"
|
433
|
|
360
|
|
All Midwest refineries
|
||||||
|
Wood River, IL to Patoka, IL crude system
(b)
|
Wood River &
Roxana, IL
|
Patoka, IL
|
12”-22”
|
115
|
|
454
|
|
All Midwest refineries
|
||||||
|
St. James, LA to Garyville, LA crude system
|
St James, LA
|
Garyville, LA
|
30"
|
20
|
|
620
|
|
Garyville, LA
|
||||||
|
Inactive pipelines
|
49
|
|
N/A
|
|
||||||||||
|
Total
|
1,617
|
|
2,497
|
|
||||||||||
|
Products pipeline systems (mbpd):
|
||||||||||||||
|
Cornerstone products system
|
Cornerstone
|
Canton, OH
|
8"-16"
|
59
|
|
238
|
|
Canton
|
||||||
|
Garyville, LA products system
|
Garyville, LA
|
Zachary, LA
|
20”-36”
|
72
|
|
389
|
|
Garyville
|
||||||
|
Texas City, TX products system
|
Texas City, TX
|
Pasadena, TX
|
16”-36”
|
43
|
|
215
|
|
Galveston Bay
|
||||||
|
ORPL products system
|
Various
|
Various
|
4”-14”
|
876
|
|
383
|
|
Catlettsburg, Canton
|
||||||
|
Robinson, IL products system
(b)
|
Various
|
Various
|
10”-16”
|
1,131
|
|
513
|
|
Robinson
|
||||||
|
Woodhaven, MI to Detroit, MI
|
Woodhaven, MI
|
Detroit, MI
|
4"
|
26
|
|
12
|
|
N/A
|
||||||
|
Louisville, KY Airport products system
|
Louisville, KY
|
Louisville, KY
|
6”-8”
|
14
|
|
29
|
|
Robinson
|
||||||
|
Tennessee products system
(b)
|
Nashville Bordeaux
|
Nashville 51st
|
8"-12"
|
2
|
|
60
|
|
N/A
|
||||||
|
Inactive pipelines
(b)
|
140
|
|
N/A
|
|
||||||||||
|
Total
|
2,363
|
|
1,839
|
|
||||||||||
|
Wood River Barge Dock (mbpd)
|
78
|
|
Garyville
|
|||||||||||
|
Storage assets (thousand barrels):
|
||||||||||||||
|
Refinery tank storage
(c)
|
55,650
|
|
Various
|
|||||||||||
|
Mt. Airy Terminal
|
3,979
|
|
Garyville
|
|||||||||||
|
Canton Crude Truck Unload
|
3
|
|
Canton
|
|||||||||||
|
Tank Farms
|
20,090
|
|
N/A
|
|||||||||||
|
Caverns
|
4,175
|
|
N/A
|
|||||||||||
|
Total
|
83,897
|
|
||||||||||||
|
(a)
|
All capacities reflect 100 percent of the pipeline systems’ and barge dock’s average capacity in thousands of barrels per day and 100 percent of the available storage capacity of our caverns and tank farms in thousands of barrels.
|
|
(b)
|
Includes pipelines leased from third parties.
|
|
(c)
|
Refining logistics assets also include rail racks, truck racks and docks.
|
40
As of
December 31, 2018
, MPLX had partial ownership interests in the following pipeline companies.
|
Pipeline Company
|
Origin
|
Destination
|
Diameter
(
inches
)
|
Length
(
miles
)
|
Ownership
Interest
|
Operated
by MPL
|
||||||||
|
Crude oil pipeline companies:
|
||||||||||||||
|
Bakken Pipeline system
|
Bakken/Three Forks area, North Dakota
|
Nederland, TX
|
30"
|
1,921
|
|
9.2
|
%
|
No
|
||||||
|
Illinois Extension Pipeline Company LLC
|
Flanagan, IL
|
Patoka, IL
|
24"
|
168
|
|
35
|
%
|
No
|
||||||
|
LOCAP LLC
|
Clovelly, LA
|
St. James, LA
|
48”
|
57
|
|
59
|
%
|
No
|
||||||
|
LOOP LLC (“LOOP”)
(a)
|
Offshore Gulf of
Mexico |
Clovelly, LA
|
48”
|
48
|
|
41
|
%
|
No
|
||||||
|
Total
|
2,194
|
|
||||||||||||
|
Products pipeline companies:
|
||||||||||||||
|
Explorer Pipeline Company
|
Port Arthur, TX
|
Hammond, IN
|
12”-28”
|
1,830
|
|
25
|
%
|
No
|
||||||
|
Louisville, KY to Lexington, KY
|
Louisville, KY
|
Lexington, KY
|
8"
|
87
|
|
65
|
%
|
Yes
|
||||||
|
1,917
|
|
|||||||||||||
(a)
Excludes MPC’s 10% ownership interest in LOOP.
The following table sets forth details about MPLX owned and operated terminals as of
December 31, 2018
. Additionally, MPLX operates one leased terminal and has partial ownership interest in two terminals.
|
Owned and Operated Terminals
|
Number of
Terminals
|
Tank Storage
Capacity
(
thousand barrels
)
|
||||
|
Light Products Terminals:
|
||||||
|
Alabama
|
2
|
|
443
|
|
||
|
Florida
|
4
|
|
3,422
|
|
||
|
Georgia
|
4
|
|
998
|
|
||
|
Illinois
|
4
|
|
1,221
|
|
||
|
Indiana
|
6
|
|
3,229
|
|
||
|
Kentucky
|
6
|
|
2,587
|
|
||
|
Louisiana
|
1
|
|
97
|
|
||
|
Michigan
|
8
|
|
2,440
|
|
||
|
North Carolina
|
4
|
|
1,509
|
|
||
|
Ohio
|
12
|
|
3,218
|
|
||
|
Pennsylvania
|
1
|
|
390
|
|
||
|
South Carolina
|
1
|
|
371
|
|
||
|
Tennessee
|
4
|
|
1,149
|
|
||
|
West Virginia
|
2
|
|
1,587
|
|
||
|
Total light products terminals
|
59
|
|
22,661
|
|
||
41
The following table sets forth details about MPLX barges and towboats as of
December 31, 2018
.
|
Class of Equipment
|
Number
in Class |
Capacity
( thousand barrels ) |
||||
|
Inland tank barges:
(a)
|
||||||
|
Less than 25,000 barrels
|
61
|
|
931
|
|
||
|
25,000 barrels and over
|
195
|
|
5,738
|
|
||
|
Total
|
256
|
|
6,669
|
|
||
|
Inland towboats:
|
||||||
|
Less than 2,000 horsepower
|
2
|
|
||||
|
2,000 horsepower and over
|
21
|
|
||||
|
Total
|
23
|
|
||||
(a)
All of our barges are double-hulled.
The following tables set forth certain information relating to MPLX’s gas processing facilities, fractionation facilities, de-ethanization facilities and natural gas gathering systems as of
December 31, 2018
, and include capacities and throughputs related to operated equity method investments on a 100 percent basis.
|
Gas Processing Complexes
|
Location
|
Design
Throughput Capacity ( MMcf/d ) |
Natural Gas
Throughput ( MMcf/d ) (a) |
Utilization
of Design Capacity (a) |
|||||||
|
Bluestone Complex
|
Butler County, PA
|
410
|
|
392
|
|
96
|
%
|
||||
|
Harmon Creek Complex
|
Washington County, PA
|
200
|
|
12
|
|
75
|
%
|
||||
|
Houston Complex
|
Washington County, PA
|
720
|
|
528
|
|
78
|
%
|
||||
|
Majorsville Complex
|
Marshall County, WV
|
1,270
|
|
1,072
|
|
92
|
%
|
||||
|
Mobley Complex
|
Wetzel County, WV
|
920
|
|
708
|
|
77
|
%
|
||||
|
Sherwood Complex
(b)
|
Doddridge County, WV
|
2,200
|
|
1,736
|
|
94
|
%
|
||||
|
Cadiz Complex
(b)
|
Harrison County, OH
|
525
|
|
472
|
|
90
|
%
|
||||
|
Seneca Complex
(b)
|
Noble County, OH
|
800
|
|
414
|
|
52
|
%
|
||||
|
Kenova Complex
|
Wayne County, WV
|
160
|
|
96
|
|
60
|
%
|
||||
|
Boldman Complex
|
Pike County, KY
|
70
|
|
30
|
|
43
|
%
|
||||
|
Cobb Complex
|
Kanawha County, WV
|
65
|
|
19
|
|
29
|
%
|
||||
|
Kermit Complex
(c)
|
Mingo County, WV
|
32
|
|
N/A
|
|
N/A
|
|
||||
|
Langley Complex
|
Langley, KY
|
325
|
|
102
|
|
31
|
%
|
||||
|
Carthage Complex
|
Panola County, TX
|
600
|
|
423
|
|
71
|
%
|
||||
|
Western Oklahoma Complex
|
Custer and Beckham Counties, OK
|
500
|
|
420
|
|
91
|
%
|
||||
|
Hidalgo System
|
Culberson County, TX
|
200
|
|
199
|
|
100
|
%
|
||||
|
Argo Complex
|
Culberson County, TX
|
200
|
|
39
|
|
21
|
%
|
||||
|
Javelina Complex
|
Corpus Christi, TX
|
142
|
|
107
|
|
75
|
%
|
||||
|
Total
|
9,307
|
|
6,769
|
|
79
|
%
|
|||||
|
(a)
|
Natural gas throughput is a weighted average for days in operation. The utilization of design capacity has been calculated using the weighted average design throughput capacity.
|
|
(b)
|
MPLX accounts for as an equity method investment.
|
|
(c)
|
The Kermit processing plant is operated by a third party solely to prevent liquids from condensing in the gathering and transmission pipelines upstream of our Kenova plant. MPLX does not receive Kermit gas volume information but does receive all of the liquids produced at the Kermit Complex. As such, the design throughput capacity and the natural gas throughput has been excluded from the subtotal.
|
42
|
Fractionation & Condensate Stabilization Complexes
|
Location
|
Design
Throughput Capacity ( mbpd ) |
NGL Throughput (
mbpd
)
(a)
|
Utilization
of Design Capacity (a) |
|||||||
|
Bluestone Complex
|
Butler County, PA
|
47
|
|
22
|
|
47
|
%
|
||||
|
Houston Complex
|
Washington County, PA
|
60
|
|
61
|
|
102
|
%
|
||||
|
Hopedale Complex
|
Harrison County, OH
|
240
|
|
158
|
|
86
|
%
|
||||
|
Ohio Condensate Complex
(b)
|
Harrison County, OH
|
23
|
|
12
|
|
52
|
%
|
||||
|
Siloam Complex
|
South Shore, KY
|
24
|
|
15
|
|
63
|
%
|
||||
|
Javelina Complex
|
Corpus Christi, TX
|
11
|
|
11
|
|
100
|
%
|
||||
|
Total
|
405
|
|
279
|
|
80
|
%
|
|||||
|
(a)
|
NGL throughput is a weighted average for days in operation. The utilization of design capacity has been calculated using the weighted average design throughput capacity.
|
|
(b)
|
MPLX accounts for as an equity method investment.
|
|
De-ethanization Complexes
|
Location
|
Design
Throughput Capacity ( mbpd ) |
NGL Throughput (
mbpd
)
(a)
|
Utilization
of Design Capacity (a) |
|||||||
|
Bluestone Complex
|
Butler County, PA
|
34
|
|
20
|
|
59
|
%
|
||||
|
Harmon Creek Complex
|
Washington County, PA
|
20
|
|
1
|
|
28
|
%
|
||||
|
Houston Complex
|
Washington County, PA
|
40
|
|
37
|
|
93
|
%
|
||||
|
Majorsville Complex
|
Marshall County, WV
|
80
|
|
67
|
|
84
|
%
|
||||
|
Mobley Complex
|
Wetzel County, WV
|
10
|
|
10
|
|
100
|
%
|
||||
|
Sherwood Complex
|
Doddridge County, WV
|
60
|
|
36
|
|
86
|
%
|
||||
|
Cadiz Complex
(b)
|
Harrison County, OH
|
40
|
|
14
|
|
35
|
%
|
||||
|
Javelina Complex
|
Corpus Christi, TX
|
18
|
|
7
|
|
39
|
%
|
||||
|
Total
|
302
|
|
192
|
|
72
|
%
|
|||||
|
(a)
|
NGL throughput is a weighted average for days in operation. The utilization of design capacity has been calculated using the weighted average design throughput capacity.
|
|
(b)
|
MPLX accounts for as an equity method investment.
|
|
Natural Gas Gathering Systems
|
Location
|
Design
Throughput
Capacity (
MMcf/d
)
|
Natural Gas
Throughput (
MMcf/d
)
(a)
|
Utilization
of Design
Capacity
(a)
|
|||||||
|
Bluestone System
|
Butler County, PA
|
227
|
|
183
|
|
81
|
%
|
||||
|
Houston System
|
Washington County, PA
|
1,304
|
|
972
|
|
79
|
%
|
||||
|
Ohio Gathering System
(b)
|
Harrison, Monroe, Belmont, Guernsey and Noble Counties, OH
|
1,123
|
|
764
|
|
68
|
%
|
||||
|
Jefferson Gas System
(b)
|
Jefferson County, OH
|
2,000
|
|
1,045
|
|
75
|
%
|
||||
|
East Texas System
|
Harrison and Panola Counties, TX
|
680
|
|
476
|
|
70
|
%
|
||||
|
Western Oklahoma System
|
Wheeler County, TX and Roger Mills, Ellis, Dewey, Custer, Beckham, Washita, Kingfisher, Canadian, and Blaine Counties, OK
|
585
|
|
455
|
|
78
|
%
|
||||
|
Southeast Oklahoma System
|
Hughes, Pittsburg and Coal Counties, OK
|
755
|
|
585
|
|
77
|
%
|
||||
|
Eagle Ford System
|
Dimmit County, TX
|
45
|
|
42
|
|
93
|
%
|
||||
|
Other Systems
|
Various
|
60
|
|
9
|
|
15
|
%
|
||||
|
Total
|
6,779
|
|
4,531
|
|
74
|
%
|
|||||
|
(a)
|
Natural gas throughput is a weighted average for days in operation. The utilization of design capacity has been calculated using the weighted average design throughput capacity.
|
|
(b)
|
MPLX accounts for as an equity method investment.
|
43
The following tables set forth certain information relating to MPLX’s NGL pipelines as of
December 31, 2018
.
|
NGL Pipelines
|
Location
|
Design
Throughput
Capacity (
mbpd
)
|
NGL
Throughput (
mbpd
)
|
Utilization
of Design
Capacity
|
|||||||
|
Sherwood to Mobley propane and heavier liquids pipeline
|
Doddridge County, WV to Wetzel County, WV
|
75
|
|
71
|
|
95
|
%
|
||||
|
Mobley to Majorsville propane and heavier liquids pipeline
|
Wetzel County, WV to Marshall County, WV
|
105
|
|
97
|
|
92
|
%
|
||||
|
Majorsville to Houston propane and heavier liquids pipeline
|
Marshall County, WV to Washington County, PA
|
45
|
|
30
|
|
67
|
%
|
||||
|
Majorsville to Hopedale propane and heavier liquids pipeline
|
Marshall County, WV to Harrison County, OH
|
140
|
|
124
|
|
89
|
%
|
||||
|
Majorsville to Hopedale propane and heavier liquids pipeline
|
Marshall County, WV to Harrison County, OH
|
422
|
|
143
|
|
34
|
%
|
||||
|
Third party processing plant to Bluestone ethane and heavier liquids pipeline
|
Butler County, PA
|
32
|
|
8
|
|
25
|
%
|
||||
|
Bluestone to Mariner West ethane pipeline
|
Butler County, PA to Beaver County, PA
|
35
|
|
20
|
|
57
|
%
|
||||
|
Sarsen to Bluestone ethane and heavier liquids pipeline
|
Butler County, PA
|
7
|
|
2
|
|
29
|
%
|
||||
|
Houston to Ohio River ethane pipeline
(a)
|
Washington County, PA to Beaver County, PA
|
57
|
|
13
|
|
23
|
%
|
||||
|
Majorsville to Houston ethane pipeline
|
Marshall County, WV to Washington County, PA
|
137
|
|
113
|
|
82
|
%
|
||||
|
Sherwood to Mobley ethane pipeline
|
Doddridge County, WV to Wetzel County, WV
|
47
|
|
35
|
|
74
|
%
|
||||
|
Mobley to Majorsville ethane pipeline
|
Wetzel County, WV to Marshall County, WV
|
57
|
|
45
|
|
79
|
%
|
||||
|
Harmon Creek to Houston propane and heavier liquids pipeline
|
Washington County, PA
|
140
|
|
9
|
|
6
|
%
|
||||
|
Harmon Creek to Mariner West ethane pipeline
|
Washington County, PA
|
110
|
|
6
|
|
5
|
%
|
||||
|
Seneca to Cadiz propane and heavier liquids pipeline
(b)
|
Noble County, OH to Harrison County, OH
|
75
|
|
10
|
|
13
|
%
|
||||
|
Cadiz to Hopedale propane and heavier liquids pipeline
(b)
|
Harrison County, OH
|
90
|
|
32
|
|
36
|
%
|
||||
|
Seneca to Cadiz propane/ethane and heavier liquids pipeline
(b)(c)
|
Noble County, OH to Harrison County, OH
|
69/82
|
|
15
|
|
18
|
%
|
||||
|
Cadiz to Atex ethane pipeline
(b)
|
Harrison County, OH
|
125
|
|
4
|
|
3
|
%
|
||||
|
Cadiz to Utopia ethane pipeline
(b)
|
Harrison County, OH
|
125
|
|
11
|
|
9
|
%
|
||||
|
Langley to Siloam propane and heavier liquids pipeline
|
Langley, KY to South Shore, KY
|
17
|
|
11
|
|
65
|
%
|
||||
|
East Texas liquids pipeline
|
Panola County, TX
|
39
|
|
22
|
|
56
|
%
|
||||
|
(a)
|
This is the section of the Mariner West pipeline that is leased to and operated by Sunoco Logistics Partners LP.
|
|
(b)
|
MPLX accounts for as an equity method investment.
|
|
(c)
|
This is the same pipeline from Seneca to Cadiz and can only be used for either ethane and heavier liquids or propane and heavier liquids at one time. Both throughput capacities are listed above, respectively, with ethane included in the total.
|
44
MIDSTREAM - ANDX
The following tables set forth certain information relating to ANDX’s crude and products pipeline systems and storage assets as of
December 31, 2018
.
|
Pipeline System or Storage Asset
|
Origin
|
Destination
|
Diameter
(
inches
)
|
Length
(
miles
)
|
Capacity
(a)
|
Associated MPC refinery
|
||||||||
|
Crude oil pipeline systems (mbpd):
|
||||||||||||||
|
Belfield crude system
|
Various
|
Fryburg Rail/ Dickinson, ND
|
4" - 8"
|
128
|
|
20
|
|
Dickinson, ND
|
||||||
|
Delaware Basin crude system
|
TexNewMex crude system
|
Various
|
7" - 16"
|
163
|
|
475
|
|
El Paso, TX
|
||||||
|
Four Corners crude system
|
Various
|
Various
|
4" - 10"
|
192
|
|
59
|
|
Galllup, NM
|
||||||
|
Green River crude system
|
Various
|
SLC Core Pipeline System
|
2" - 8"
|
139
|
|
23
|
|
N/A
|
||||||
|
Northern California crude system
|
Martinez, CA
|
Martinez, CA
|
5" - 24"
|
10
|
|
280
|
|
Martinez, CA
|
||||||
|
Salt Lake City Short Haul crude system
|
Salt Lake City, UT
|
Salt Lake City, UT
|
8" - 16"
|
5
|
|
118
|
|
Salt Lake City, UT
|
||||||
|
Southern California crude system
(b)
|
LA Basin, CA
|
LA Basin, CA
|
8" - 42"
|
37
|
|
711
|
|
Los Angeles, CA
|
||||||
|
St. Paul Park Cottage Grove crude system
|
Minneapolis-Saint Paul, MN
|
Minneapolis-Saint Paul, MN
|
12" - 16"
|
5
|
|
107
|
|
St. Paul Park, MN
|
||||||
|
Tesoro High Plains crude system
|
Various
|
Various
|
2" - 16"
|
908
|
|
350
|
|
Mandan, ND
|
||||||
|
TexNewMex crude system
|
Four Corners Crude System
|
Delaware Basin Crude System
|
12" - 16"
|
438
|
|
365
|
|
El Paso, TX
|
||||||
|
Salt Lake City Core crude system
|
Various
|
Various
|
3" - 10"
|
575
|
|
50
|
|
Salt Lake City, UT
|
||||||
|
Inactive Pipelines
|
563
|
|
N/A
|
|
||||||||||
|
Total
|
3,163
|
|
2,558
|
|
||||||||||
|
Products pipeline systems (mbpd):
|
||||||||||||||
|
Tesoro Alaska products system
|
Kenai, AK
|
Anchorage, AK
|
8" - 10"
|
69
|
|
43
|
|
Kenai, AK
|
||||||
|
Northern California products system
|
Martinez, CA
|
Martinez, CA
|
8"- 16"
|
4
|
|
160
|
|
Martinez, CA
|
||||||
|
Northwest Products Pipeline system
|
Salt Lake City, UT
|
Various
|
4" - 8"
|
1,102
|
|
107
|
|
Salt Lake City, UT
|
||||||
|
Salt Lake City Short Haul products system
|
Salt Lake City, UT
|
Northwest Products Pipeline system
|
6" - 10"
|
10
|
|
124
|
|
Salt Lake City, UT
|
||||||
|
Southern California products system
|
LA Basin, CA
|
LA Basin, CA
|
4" - 16"
|
100
|
|
489
|
|
Los Angeles, CA
|
||||||
|
Wingate system
|
McKinley, NM
|
McKinley, NM
|
4"
|
14
|
|
7
|
|
Gallup, NM
|
||||||
|
Inactive Pipelines
|
106
|
|
N/A
|
|
||||||||||
|
Total
|
1,405
|
|
930
|
|
||||||||||
|
Water pipeline systems (mbpd):
|
||||||||||||||
|
Belfield water system
|
Various
|
Various
|
4" - 8"
|
103
|
|
20
|
|
|||||||
|
Green River water system
|
Sublette, WY
|
Sublette, WY
|
3" - 4"
|
11
|
|
15
|
|
|||||||
|
Total
|
114
|
|
35
|
|
||||||||||
|
Barge Docks (mbpd)
(c)
|
2,832
|
|
Various
|
|||||||||||
|
Storage assets (thousand barrels):
|
||||||||||||||
|
Tank Farms
|
48,449
|
|
||||||||||||
|
Caverns
|
450
|
|
||||||||||||
|
Total
|
48,899
|
|
||||||||||||
|
(a)
|
All capacities reflect 100 percent of the pipeline systems’ and barge dock’s average capacity in thousands of barrels per day and 100 percent of the available storage capacity of our caverns and tank farms in thousands of barrels.
|
|
(b)
|
Includes portions leased from third parties.
|
|
(c)
|
Includes a dock leased from a third party.
|
45
As of
December 31, 2018
, ANDX had partial ownership interests in the following pipeline companies.
|
Pipeline Company
|
Origin
|
Destination
|
Diameter
(
inches
)
|
Length
(
miles
)
|
Ownership
Interest
|
Operated
by ANDX
|
||||||||
|
Crude oil pipeline companies:
|
||||||||||||||
|
Rangeland Rio Pipeline LLC
|
Mentone, TX
|
Midland County, TX
|
12"
|
112
|
|
67
|
%
|
Yes
|
||||||
|
Minnesota Pipe Line Company LLC
|
Clearbrook, MN
|
Minneapolis-Saint Paul, MN
|
16"
|
1,073
|
|
17
|
%
|
No
|
||||||
|
Total
|
1,185
|
|
||||||||||||
|
NGL pipeline companies:
|
||||||||||||||
|
Rendezvous Gas Services System
|
Sweetwater County, WY
|
Sweetwater County, WY and Uintah County, WY
|
2" - 30"
|
327
|
|
78
|
%
|
Yes
|
||||||
|
Three Rivers System
|
Duchesne County, UT and Uintah County, UT
|
Uintah County, UT
|
6" - 16"
|
52
|
|
50
|
%
|
Yes
|
||||||
|
Uintah Basin Field Services
|
Uintah County, UT
|
Uintah County, UT
|
8" - 12"
|
90
|
|
38
|
%
|
Yes
|
||||||
|
Total
|
469
|
|
||||||||||||
46
The following table sets forth details about ANDX owned and operated terminals as of
December 31, 2018
. Additionally, ANDX operates one leased terminal and has partial ownership interest in one terminal.
|
Owned and Operated Terminals
|
Number of
Terminals
|
Tank Storage
Capacity
(
thousand barrels
)
|
||||
|
Light Products Terminals:
|
||||||
|
Alaska
|
4
|
|
1,523
|
|
||
|
California
|
9
|
|
5,608
|
|
||
|
Idaho
|
3
|
|
989
|
|
||
|
Minnesota
|
1
|
|
526
|
|
||
|
New Mexico
|
3
|
|
778
|
|
||
|
North Dakota
|
3
|
|
—
|
|
||
|
Utah
|
2
|
|
29
|
|
||
|
Washington
|
5
|
|
1,063
|
|
||
|
Subtotal light products terminals
|
30
|
|
10,516
|
|
||
|
Asphalt Terminals
|
||||||
|
Arizona
|
3
|
|
264
|
|
||
|
California
|
3
|
|
720
|
|
||
|
Minnesota
|
1
|
|
794
|
|
||
|
Nevada
(a)
|
1
|
|
250
|
|
||
|
New Mexico
|
1
|
|
38
|
|
||
|
Texas
|
1
|
|
204
|
|
||
|
Subtotal asphalt terminals
|
10
|
|
2,270
|
|
||
|
Crude Terminals
|
||||||
|
California
|
1
|
|
117
|
|
||
|
New Mexico
|
1
|
|
352
|
|
||
|
North Dakota
|
1
|
|
520
|
|
||
|
Washington
|
1
|
|
—
|
|
||
|
Subtotal crude terminals
|
4
|
|
989
|
|
||
|
Total owned and operated terminals
|
44
|
|
13,775
|
|
||
|
(a)
|
ANDX accounts for as an equity method investment.
|
The following tables set forth certain information relating to ANDX’s gas processing facilities, fractionation facilities and natural gas gathering systems as of
December 31, 2018
, and include capacities and throughputs related to operated equity method investments on a 100 percent basis.
|
Gas Processing Complexes
|
Location
|
Design
Throughput Capacity ( MMcf/d ) |
Natural Gas
Throughput ( MMcf/d ) (a) |
Utilization
of Design Capacity |
|||||||
|
Belfield Complex
|
Stark County, ND
|
40
|
|
18
|
|
46
|
%
|
||||
|
Robinson Lake Complex
|
Mountrail County, ND
|
130
|
|
122
|
|
94
|
%
|
||||
|
24B Plant Complex
|
Uintah County, UT
|
140
|
|
—
|
|
—
|
%
|
||||
|
Emigrant Trail Complex
|
Uintah County, WY
|
55
|
|
29
|
|
53
|
%
|
||||
|
Stagecoach/Iron Horse Complex
|
Uintah County, UT
|
510
|
|
144
|
|
28
|
%
|
||||
|
Blacks Fork Complex
|
Uintah County, WY
|
795
|
|
348
|
|
44
|
%
|
||||
|
Vermillion Complex
|
Sweetwater County, WY
|
57
|
|
49
|
|
85
|
%
|
||||
|
Total
|
1,727
|
|
710
|
|
41
|
%
|
|||||
|
(a)
|
Natural gas throughput is a weighted average for days in operation.
|
47
|
Fractionation & Condensate Stabilization Complexes
|
Location
|
Design
Throughput Capacity ( mbpd ) |
NGL Throughput (
mbpd
)
(a)
|
Utilization
of Design Capacity |
|||||||
|
Blacks Fork Fractionator
|
Uintah County, WY
|
15
|
|
3
|
|
20
|
%
|
||||
|
Robinson Lake Fractionator
|
Mountrail County, ND
|
12
|
|
10
|
|
89
|
%
|
||||
|
Belfield Fractionator
|
Stark County, ND
|
7
|
|
5
|
|
62
|
%
|
||||
|
LaBarge Liquids Complex
|
Lincoln County, WY
|
40
|
|
13
|
|
32
|
%
|
||||
|
Pinedale Liquids Complex
|
Sublette County, WY
|
6
|
|
3
|
|
48
|
%
|
||||
|
80
|
|
34
|
|
43
|
%
|
||||||
|
(a)
|
NGL throughput is a weighted average for days in operation.
|
|
Natural Gas Gathering Systems
|
Location
|
Design
Throughput
Capacity (
MMcf/d
)
|
Natural Gas
Throughput (
MMcf/d
)
(a)
|
Utilization
of Design
Capacity
|
|||||||
|
Belfield System
|
Stark County, ND
|
40
|
|
18
|
|
46
|
%
|
||||
|
Robinson Lake System
|
Mountrail County, ND
|
130
|
|
122
|
|
94
|
%
|
||||
|
Williston Basin System
|
McLean County, ND
|
3
|
|
1
|
|
19
|
%
|
||||
|
Green River System
|
Sublette County, WY and Uintah County, WY
|
737
|
|
399
|
|
54
|
%
|
||||
|
Rendevous Gas Services System
(b)
|
Sweetwater County, WY
|
1,032
|
|
502
|
|
49
|
%
|
||||
|
Rendevous Pipeline
|
Sublette County, WY
|
450
|
|
253
|
|
56
|
%
|
||||
|
Three Rivers System
(b)
|
Duchesne County, UT and Uintah County, UT
|
212
|
|
63
|
|
30
|
%
|
||||
|
Uinta Basin Field Services
(b)
|
Uintah County, UT
|
26
|
|
10
|
|
37
|
%
|
||||
|
Uintah Basin System
|
Uintah County, UT
|
299
|
|
156
|
|
52
|
%
|
||||
|
Vermillion System
|
Daggett County, UT, Sweetwater County, WY and Moffat County, CO
|
212
|
|
94
|
|
44
|
%
|
||||
|
3,141
|
|
1,618
|
|
52
|
%
|
||||||
|
(a)
|
Natural gas throughput is a weighted average for days in operation.
|
|
(b)
|
ANDX accounts for as an equity method investment.
|
The following tables set forth certain information relating to ANDX’s NGL pipelines as of
December 31, 2018
.
|
NGL Pipelines
|
Location
|
Design
Throughput
Capacity (
mbpd
)
|
NGL
Throughput (
mbpd
)
|
Utilization
of Design
Capacity
|
|||||||
|
Ironhorse to Dinosaur 8" NGL
|
Uintah County, UT
|
15
|
|
4
|
|
25
|
%
|
||||
|
Logistics Hub NGL Pipeline
|
McKenzie County, ND
|
20
|
|
0.7
|
|
4
|
%
|
||||
MIDSTREAM - MPC-RETAINED ASSETS AND INVESTMENTS
The following tables set forth certain information related to our crude and products pipeline systems not owned by MPLX or ANDX.
As of
December 31, 2018
, we owned undivided joint interests in the following common carrier crude oil pipeline systems.
|
Pipeline System
|
Origin
|
Destination
|
Diameter
(
inches
)
|
Length
(
miles
)
|
Ownership
Interest
|
Operated
by MPL
|
||||||||
|
Capline
|
St. James, LA
|
Patoka, IL
|
40"
|
644
|
|
33
|
%
|
Yes
|
||||||
|
Maumee
|
Lima, OH
|
Samaria, MI
|
22"
|
95
|
|
26
|
%
|
No
|
||||||
|
Total
|
739
|
|
||||||||||||
48
As of
December 31, 2018
, we had partial ownership interests in the following pipeline companies.
|
Pipeline Company
|
Origin
|
Destination
|
Diameter
(
inches
)
|
Length
(
miles
)
|
Ownership
Interest
|
Operated
by MPL
|
||||||||
|
Crude oil pipeline companies:
|
||||||||||||||
|
LOOP
(a)
|
Offshore Gulf of
Mexico |
Clovelly, LA
|
48”
|
48
|
|
10
|
%
|
No
|
||||||
|
Products pipeline companies:
|
||||||||||||||
|
Ascension Pipeline Company LLC
|
Riverside, LA
|
Garyville, LA
|
16"
|
32
|
|
50
|
%
|
No
|
||||||
|
Centennial Pipeline LLC
(b)
|
Beaumont, TX
|
Bourbon, IL
|
24”-26”
|
796
|
|
50
|
%
|
Yes
|
||||||
|
Muskegon Pipeline LLC
|
Griffith, IN
|
Muskegon, MI
|
10”
|
170
|
|
60
|
%
|
Yes
|
||||||
|
Wolverine Pipe Line Company
|
Chicago, IL
|
Bay City &
Ferrysburg, MI
|
6”-16”
|
796
|
|
6
|
%
|
No
|
||||||
|
Total
|
1,794
|
|
||||||||||||
|
(a)
|
Represents interest retained by MPC and excludes MPLX’s 41% ownership interest in LOOP. Pipeline mileage is excluded from total as it is included with MPLX assets.
|
|
(b)
|
All system pipeline miles are inactive.
|
The following table provides information on private crude oil pipelines and private products pipelines that we own as of
December 31, 2018
.
|
Private Pipeline Systems
|
Diameter
( inches ) |
Length
( miles ) |
Capacity
( mbpd ) |
|||||
|
Crude oil pipeline systems:
|
||||||||
|
Middle Ground Shoals Pipeline
|
12"
|
4
|
|
11
|
|
|||
|
Inactive pipelines
|
9
|
|
N/A
|
|
||||
|
Total
|
13
|
|
11
|
|
||||
|
Products pipeline systems:
|
||||||||
|
Illinois and Indiana pipeline systems
|
4”
|
59
|
|
11
|
|
|||
|
Texas pipeline systems
|
8”
|
103
|
|
45
|
|
|||
|
Inactive pipelines
|
62
|
|
N/A
|
|
||||
|
Total
|
224
|
|
56
|
|
||||
The following table sets forth details about the assets held by two ocean vessel joint ventures in which we hold a 50% interest as of
December 31, 2018
.
|
Class of Equipment
|
Number
in Class |
Capacity
( thousand barrels ) |
||||
|
Jones Act product tankers
(a)
|
4
|
|
1,320
|
|
||
|
750 Series ATB vessels
(b)
|
3
|
|
990
|
|
||
|
(a)
|
Represents ownership through our indirect noncontrolling interest in Crowley Ocean Partners.
|
|
(b)
|
Represents ownership through our indirect noncontrolling interest in Crowley Blue Water Partners.
|
ITEM 3. LEGAL PROCEEDINGS
We are the subject of, or a party to, a number of pending or threatened legal actions, contingencies and commitments involving a variety of matters, including laws and regulations relating to the environment. Some of these matters are discussed below.
Litigation
We are a party to a number of lawsuits and other proceedings and cannot predict the outcome of every such matter with certainty. While it is possible that an adverse result in one or more of the lawsuits or proceedings in which we are a defendant could be material to us, based upon current information and our experience as a defendant in other matters, we believe that these lawsuits and proceedings, individually or in the aggregate, will not have a material adverse effect on our consolidated results of operations, financial position or cash flows.
49
Between June 20 and July 11, 2018, six putative class actions (the “Actions”) were filed against some or all of Andeavor, the directors of Andeavor, and MPC, Mahi Inc. (“Merger Sub 1”) and Mahi LLC (n/k/a Andeavor LLC) (“Merger Sub 2” and, together with MPC and Merger Sub 1, the “MPC Defendants”), relating to the Andeavor merger. Two complaints, Malka Raul v. Andeavor, et al., and Stephen Bushansky v. Andeavor, et al., were filed in the U.S. District Court for the Western District of Texas. Four complaints, captioned The Vladimir Gusinsky Rev. Trust v. Andeavor, et al., Lawrence Zucker v. Andeavor, et al., Mel Gross v. Andeavor, et al., and Hudson v. Andeavor, et al. were filed in the U.S. District Court for the District of Delaware. The Actions generally alleged that Andeavor, the directors of Andeavor and the MPC Defendants disseminated a false or misleading registration statement regarding the merger in violation of Section 14(a) of the Exchange Act and Rule 14a-9 promulgated thereunder. Specifically, the Actions alleged that the registration statement filed by MPC misstated or omitted material information regarding the parties’ financial projections and the analyses performed by Andeavor’s and MPC’s respective financial advisors, and that disclosure of material information was necessary in light of preclusive deal protection provisions in the merger agreement, the financial interests of Andeavor’s officers and directors in completing the deal, and the financial interests of Andeavor’s and MPC’s respective financial advisors. The Actions further alleged that the directors of Andeavor and/or the MPC Defendants were liable for these violations as “controlling persons” of Andeavor under Section 20(a) of the Exchange Act. The Actions sought injunctive relief, including to enjoin and/or rescind the merger, damages in the event the merger was consummated, and an award of attorneys’ fees, in addition to other relief.
On July 5 and July 20, 2018, MPC filed amendments to its Registration Statement on Form S-4, which included certain supplemental disclosures responding to allegations made by the plaintiffs. On August 3, 2018, Andeavor filed its proxy statement, and after that date, the parties had numerous discussions regarding the adequacy of disclosures. The parties ultimately reached an agreement in principle to resolve the Actions in exchange for additional supplemental disclosures. Consistent with that agreement, Andeavor and MPC each filed a Current Report on Form 8-K on September 14, 2018 that included certain additional disclosures in response to plaintiffs’ allegations. Between September 21 and September 28, 2018, all the Actions were dismissed as moot, and the parties reserved their rights in the event of any dispute over attorneys’ fees and expenses. In the fourth quarter of 2018, the Company resolved the remaining disputes over attorneys’ fees for an amount that was not material to the Company.
In May 2015, the Kentucky attorney general filed a lawsuit against our wholly-owned subsidiary, Marathon Petroleum Company LP (“MPC LP”), in the United States District Court for the Western District of Kentucky asserting claims under federal and state antitrust statutes, the Kentucky Consumer Protection Act, and state common law. The complaint, as amended in July 2015, alleges that MPC LP used deed restrictions, supply agreements with customers and exchange agreements with competitors to unreasonably restrain trade in areas within Kentucky and seeks declaratory relief, unspecified damages, civil penalties, restitution and disgorgement of profits. At this stage, the ultimate outcome of this litigation remains uncertain, and neither the likelihood of an unfavorable outcome nor the ultimate liability, if any, can be determined, and we are unable to estimate a reasonably possible loss (or range of loss) for this matter. We intend to vigorously defend ourselves in this matter.
In May 2007, the Kentucky attorney general filed a lawsuit against us and Marathon Oil in state court in Franklin County, Kentucky for alleged violations of Kentucky’s emergency pricing and consumer protection laws following Hurricanes Katrina and Rita in 2005. The lawsuit alleges that we overcharged customers by $89 million during September and October 2005. The complaint seeks disgorgement of these sums, as well as penalties, under Kentucky’s emergency pricing and consumer protection laws. We are vigorously defending this litigation. We believe that this is the first lawsuit for damages and injunctive relief under the Kentucky emergency pricing laws to progress this far and it contains many novel issues. In May 2011, the Kentucky attorney general amended his complaint to include a request for immediate injunctive relief as well as unspecified damages and penalties related to our wholesale gasoline pricing in April and May 2011 under statewide price controls that were activated by the Kentucky governor on April 26, 2011 and which have since expired. The court denied the attorney general’s request for immediate injunctive relief, and the remainder of the 2011 claims likely will be resolved along with those dating from 2005. If the lawsuit is resolved unfavorably in its entirety, it could materially impact our consolidated results of operations, financial position or cash flows. However, management does not believe the ultimate resolution of this litigation will have a material adverse effect on our consolidated financial position, results of operations, or cash flows.
Environmental Proceedings
As previously reported, MarkWest Liberty Midstream, Ohio Fractionation and MarkWest Utica EMG, together with other MarkWest affiliates, agreed to pay a penalty of approximately $0.9 million, undertake certain monitoring and emission reduction projects at certain facilities with an estimated cost of approximately $3.3 million, and implement certain process enhancements for its and its affiliates’ leak detection and repair programs at its gas processing and fractionation sites. On November 1, 2018, the Partnership and 11 of its subsidiaries entered into a Consent Decree with the EPA, the State of Oklahoma, the Pennsylvania Department of Environmental Protection and the State of West Virginia resolving these issues. The Consent Decree was approved by the court on January 8, 2019 and the penalty has been paid.
50
Governmental and other entities in California, New York, Maryland and Rhode Island have filed lawsuits against coal, gas, oil and petroleum companies, including the Company. The lawsuits allege damages as a result of climate change and the plaintiffs are seeking unspecified damages and abatement under various tort theories. Similar lawsuits may be filed in other jurisdictions. At this early stage, the ultimate outcome of these matters remain uncertain, and neither the likelihood of an unfavorable outcome nor the ultimate liability, if any, can be determined.
On February 7, 2019, we received an offer to settle seven NOVs from CARB. The NOVs were issued to the Los Angeles refinery in 2017, alleging violations of the state’s summer RVP limits. While we are negotiating a settlement of the allegations with CARB, we cannot currently estimate the timing of the resolution of this matter.
On February 5, 2019, we received an offer to settle seven NOVs from CARB. The NOVs were issued to the Los Angeles refinery in 2018, alleging the refinery produced fuel which exceeded its reported olefin values. While we are negotiating a settlement of the allegations with CARB, we cannot currently estimate the timing of the resolution of this matter.
On October 19, 2018, Western Refining Southwest, Inc. received an offer from the U.S. EPA to settle alleged violations of the Resource Conservation and Recovery Act regulations. While we are negotiating a settlement of the allegations with the EPA, we cannot currently estimate the timing of the resolution of this matter.
In March 2016, the EPA conducted a Risk Management Program inspection at our Gallup refinery and issued an Inspection Report on April 7, 2016 identifying Areas of Concern. While we are working with the EPA to address the Areas of Concern, we cannot currently estimate the timing of the resolution of this matter.
On March 8, 2018, Tesoro Refining and Marketing LLC (“TRMC”) received an offer to settle allegations by the CARB relating to the state’s Greenhouse Gas Reporting Standards. The CARB allegations relate to the self-disclosure and correction of reported greenhouse gas emissions emitted by the Los Angeles refinery Calciner Unit from May 9, 2014 to June 12, 2017. We have reached an agreement in principle to pay a penalty of $425,000 and undertake a supplemental environmental project at a cost of $425,000. We expect to finalize the agreement in the first quarter of 2019.
On April 6, 2018, TRMC received an offer to settle five Notices of Violation (“NOV”) from the South Coast Air Quality Management District. The NOVs were issued to the Los Angeles refinery between June and October 2017, alleging violations of various federal and district air emission regulations. We have reached an agreement to pay a penalty of $75,000 and undertake certain supplemental environmental projects with an estimated cost of $75,000.
On February 12, 2016, TRMC received an offer to settle 35 NOVs received from the Bay Area Air Quality Management District (“BAAQMD”). The NOVs were issued from May 2011 to November 2015 and allege violations of air quality regulations for ground level monitors located at our Martinez refinery. While we are negotiating a settlement of the allegations with the BAAQMD, we cannot currently estimate the timing of the resolution of this matter.
On July 18, 2016, the U.S. Department of Justice (“DOJ”) lodged a complaint on behalf of the EPA and a Consent Decree with the Western District Court of Texas. Among other things, the Consent Decree required that the Martinez refinery meet certain annual emission limits for NOx by July 1, 2018. In February 2018, TRMC informed the EPA that it would need additional time to satisfy requirements of the Consent Decree. We are currently negotiating a resolution of this matter with the DOJ and the EPA, including the required timing to complete the project.
On June 14, 2018, TRMC received an offer to settle an NOV issued by the CARB in May 2018. The NOV was issued in response to TRMC having reported in December 2017 that certain batches of gasoline produced in December 2017 did not meet California fuel standards. On October 1, 2018, TRMC reached an agreement with CARB to settle this NOV for $157,500.
The naphtha hydrotreater unit at the Washington refinery was involved in a fire in April 2010, which fatally injured seven employees and rendered the unit inoperable. The Washington State Department of Labor & Industries (“L&I”) investigated the incident and issued a citation in October 2010 with an assessed fine of approximately $2 million. Andeavor appealed the citation in January 2011 as it disagreed with L&I’s characterizations of operations at the refinery and believed that many of the agency’s conclusions were mistaken. In separate September 2013, November 2013 and February 2015 orders, the Board of Industrial Insurance Appeals (“BIIA”) granted partial summary judgment in Andeavor’s favor rejecting 33 of the original 44 allegations in the citation as lacking legal or evidentiary support. The hearing on the remaining 11 allegations concluded in July 2016. On June 8, 2017, the BIIA Judge issued a proposed decision and order vacating the entire citation, which L&I and the United Steel Workers (“USW”) appealed. On September 18, 2017, the BIIA granted L&I and USW’s petitions for review of the BIIA judge’s June 8, 2017 proposed decision and order. On January 25, 2018, the BIIA issued an order remanding 12 of the allegations for further proceedings. Proceedings regarding the 12 remanded citations are ongoing.
51
We are involved in a number of other environmental proceedings arising in the ordinary course of business. While the ultimate outcome and impact on us cannot be predicted with certainty, we believe the resolution of these environmental proceedings will not have a material adverse effect on our consolidated results of operations, financial position or cash flows.
ITEM 4. MINE SAFETY DISCLOSURES
Not applicable.
52
PART II
ITEM 5. MARKET FOR REGISTRANT’S COMMON EQUITY, RELATED STOCKHOLDER MATTERS AND ISSUER PURCHASES OF EQUITY SECURITIES
Our common stock is listed on the NYSE and traded under the symbol “MPC.” As of
February 15, 2019
, there were
32,353
registered holders of our common stock.
Issuer Purchases of Equity Securities
The following table sets forth a summary of our purchases during the quarter ended
December 31, 2018
, of equity securities that are registered by MPC pursuant to Section 12 of the Securities Exchange Act of 1934, as amended:
|
Period
|
Total Number
of Shares
Purchased
(a)
|
Average
Price Paid
per Share
(b)
|
Total Number of
Shares Purchased as
Part of Publicly
Announced Plans
or Programs
|
Maximum Dollar
Value of Shares that
May Yet Be Purchased
Under the Plans
or Programs
(c)
|
|||||||||
|
10/01/18-10/31/18
|
36,701
|
|
$
|
82.02
|
|
—
|
|
$
|
5,579,603,383
|
|
|||
|
11/01/18-11/30/18
|
3,145,000
|
|
63.75
|
|
3,138,171
|
|
5,379,603,637
|
|
|||||
|
12/01/18-12/31/18
|
7,812,656
|
|
60.86
|
|
7,804,590
|
|
4,904,604,184
|
|
|||||
|
Total
|
10,994,357
|
|
61.76
|
|
10,942,761
|
|
|
||||||
|
(a)
|
The amounts in this column include
36,701
,
6,829
and 8,066 shares of our common stock delivered by employees to MPC, upon vesting of restricted stock, to satisfy tax withholding requirements in
October
,
November
and December, respectively.
|
|
(b)
|
Amounts in this column reflect the weighted average price paid for shares purchased under our share repurchase authorizations and for shares tendered to us in satisfaction of employee tax withholding obligations upon the vesting of restricted stock granted under our stock plans. The weighted average price includes commissions paid to brokers on shares purchased under our share repurchase authorizations.
|
|
(c)
|
On April 30, 2018, we announced that our board of directors had approved a
$5 billion
share repurchase authorization in addition to the remaining authorization pursuant to the May 31, 2017 announcement. These share purchase authorizations have no expiration date. The share repurchase authorization announced on April 30, 2018, together with prior authorizations, result in a total of $18 billion of share repurchase authorizations since January 1, 2012.
|
53
ITEM 6. SELECTED FINANCIAL DATA
The following table should be read in conjunction with Item 7. Management’s Discussion and Analysis of Financial Condition and Results of Operations and Item 8. Financial Statements and Supplementary Data.
|
|
Year Ended December 31,
|
||||||||||||||||||
|
(In millions, except per share data)
|
2018
(a)
|
2017
(b)
|
2016
|
|
2015
(a)
|
2014
(a)
|
|||||||||||||
|
Statements of Income Data
|
|||||||||||||||||||
|
Sales and other operating revenue
(c)
|
$
|
96,504
|
|
$
|
74,733
|
|
$
|
63,339
|
|
$
|
72,051
|
|
$
|
97,817
|
|
||||
|
Income from operations
|
5,571
|
|
4,018
|
|
2,386
|
|
4,708
|
|
4,149
|
|
|||||||||
|
Net income
|
3,606
|
|
3,804
|
|
1,213
|
|
2,868
|
|
2,555
|
|
|||||||||
|
Net income attributable to MPC
|
2,780
|
|
3,432
|
|
1,174
|
|
2,852
|
|
2,524
|
|
|||||||||
|
Net income attributable to MPC per share:
|
|||||||||||||||||||
|
Basic
|
$
|
5.36
|
|
$
|
6.76
|
|
$
|
2.22
|
|
$
|
5.29
|
|
$
|
4.42
|
|
||||
|
Diluted
|
$
|
5.28
|
|
$
|
6.70
|
|
$
|
2.21
|
|
$
|
5.26
|
|
$
|
4.39
|
|
||||
|
Dividends per share
|
$
|
1.84
|
|
$
|
1.52
|
|
$
|
1.36
|
|
$
|
1.14
|
|
$
|
0.92
|
|
||||
|
Statements of Cash Flows Data
|
|||||||||||||||||||
|
Net cash provided by operating activities
|
$
|
6,158
|
|
$
|
6,612
|
|
$
|
4,017
|
|
$
|
4,076
|
|
$
|
3,130
|
|
||||
|
Acquisitions, net of cash acquired
(a)
|
3,822
|
|
249
|
|
—
|
|
1,218
|
|
2,821
|
|
|||||||||
|
Common stock repurchased
|
3,287
|
|
2,372
|
|
197
|
|
965
|
|
2,131
|
|
|||||||||
|
Dividends paid
|
954
|
|
773
|
|
719
|
|
613
|
|
524
|
|
|||||||||
|
|
December 31,
|
||||||||||||||||||
|
(In millions)
|
2018
(a)
|
2017
|
2016
|
2015
(a)
|
2014
(a)
|
||||||||||||||
|
Balance Sheets Data
|
|||||||||||||||||||
|
Total assets
|
$
|
92,940
|
|
$
|
49,047
|
|
$
|
44,413
|
|
$
|
43,115
|
|
$
|
30,425
|
|
||||
|
Long-term debt, including capitalized leases
(d)
|
27,524
|
|
12,946
|
|
10,572
|
|
11,925
|
|
6,602
|
|
|||||||||
|
(a)
|
On October 1, 2018, we acquired Andeavor. On December 4, 2015, MPLX, our consolidated subsidiary, merged with MarkWest. On September 30, 2014, we acquired Hess’ Retail Operations and Related Assets. The financial results for these operations are included in our consolidated results from the date of acquisition.
|
|
(b)
|
Earnings for 2017 include a tax benefit of approximately $1.5 billion or $2.93 per diluted share as a result of re-measuring certain net deferred tax liabilities using the lower corporate tax rate enacted in the fourth quarter 2017.
|
|
(c)
|
Includes sales to related parties. The 2018 period reflects an election to present certain taxes on a net basis concurrent with our adoption of ASU 2014-09, Revenue - Revenue from Contracts with Customers (“ASC 606”).
|
|
(d)
|
Includes amounts due within one year. During 2018, MPC assumed Andeavor senior notes with an aggregate principal amount of $3.374 billion and MPLX issued $7.75 billion aggregate principal amount of senior notes. MPLX used $4.1 billion of the net proceeds of the offering to repay the 364-day term loan facility drawn on in January to fund the cash portion of the consideration for the February 1, 2018 dropdown and used $750 million of the net proceeds to redeem the 5.500 percent senior notes due February 2023 issued by MPLX and MarkWest. Also included in 2018 are Andeavor Logistics senior notes with an aggregate principal amount of $3.75 billion. During 2017, MPLX issued $2.25 billion aggregate principal amount of senior notes and used the net proceeds to fund the $1.5 billion cash portion of the consideration paid to MPC for the dropdown of assets on March 1, 2017. During 2015, in connection with the MarkWest Merger, MPLX assumed MarkWest Senior Notes with an aggregate principal amount of $4.1 billion and used its credit facility to repay $850 million of the $943 million of borrowings under MarkWest’s credit facility. During 2014, we issued $1.95 billion aggregate principal amount of senior notes and entered into a $700 million term loan agreement to fund a portion of the Hess’ Retail Operations and Related Assets acquisition.
|
54
ITEM 7. MANAGEMENT’S DISCUSSION AND ANALYSIS OF FINANCIAL CONDITION AND RESULTS OF OPERATIONS
All statements in this section, other than statements of historical fact, are forward-looking statements that are inherently uncertain. See “Disclosures Regarding Forward-Looking Statements” and “Risk Factors” for a discussion of the factors that could cause actual results to differ materially from those projected in these statements. The following information concerning our business, results of operations and financial condition should also be read in conjunction with the information included under Item 1. Business, Item 1A. Risk Factors, Item 6. Selected Financial Data and Item 8. Financial Statements and Supplementary Data.
CORPORATE OVERVIEW
We are an independent petroleum refining and marketing, retail and midstream company. We own and operate the nation’s largest refining system through
16
refineries, located in the Gulf Coast, Mid-Continent and West Coast regions of the United States, with an aggregate crude oil refining capacity of approximately
3.0
mmbpcd. Our refineries supply refined products to resellers and consumers across the United States. We distribute refined products to our customers through transportation, storage, distribution and marketing services provided largely by our Midstream segment. We believe we are one of the largest wholesale suppliers of gasoline and distillates to resellers in the United States.
We have three strong brands: Marathon
®
,
Speedway
®
and ARCO
®
. The branded outlets, which primarily include the Marathon brand, are established motor fuel brands across the United States available through approximately
6,800
branded outlets operated by independent entrepreneurs in
35
states, the District of Columbia and Mexico. We believe our Retail segment operates the second largest chain of company-owned and operated retail gasoline and convenience stores in the United States, with approximately
3,920
convenience stores, primarily under the Speedway brand, and
1,065
direct dealer locations, primarily under the ARCO brand, across the United States.
We primarily conduct our midstream operations through our ownership interests in MPLX and ANDX, which own and operate crude oil and light product transportation and logistics infrastructure as well as gathering, processing, and fractionation assets. As of
December 31, 2018
, we owned, leased or had ownership interests in approximately
16,600
miles of crude oil and refined product pipelines to deliver crude oil to our
refineries and other locations and refined products to wholesale and retail market areas. We distribute our refined products through one of the largest terminal operations in the United States and one of the largest private domestic fleets of inland petroleum product barges. Our integrated midstream energy asset network links producers of natural gas and NGLs from some of the largest supply basins in the United States to domestic and international markets. Our midstream gathering and processing operations include: natural gas gathering, processing and transportation; and NGL gathering, transportation, fractionation, storage and marketing. Our assets include approximately
9.9
bcf/d of gathering capacity,
11.0
bcf/d of natural gas processing capacity and
790
mbpd of fractionation capacity as of
December 31, 2018
.
Our operations consist of three reportable operating segments: Refining & Marketing;
Retail
; and Midstream. Each of these segments is organized and managed based upon the nature of the products and services they offer. See Item 1. Business for additional information on our segments.
|
•
|
Refining & Marketing – refines crude oil and other feedstocks at our
16
refineries
in the West Coast, Gulf Coast and Mid-Continent regions of the United States, purchases refined products and ethanol for resale and distributes refined products largely through transportation, storage, distribution and marketing services provided largely by our Midstream segment. We sell refined products to wholesale marketing customers domestically and internationally, to buyers on the spot market, to our Retail business segment and to independent entrepreneurs who operate primarily Marathon
®
branded outlets.
|
|
•
|
Retail – sells transportation fuels and convenience products in the retail market across the United States through company-owned and operated convenience stores, primarily under the Speedway brand, and long-term fuel supply contracts with direct dealers who operate locations mainly under the ARCO brand.
|
|
•
|
Midstream – transports, stores, distributes and markets crude oil and refined products principally for the Refining & Marketing segment via refining logistics assets, pipelines, terminals, towboats and barges; gathers, processes and transports natural gas; and gathers, transports, fractionates, stores and markets NGLs. The Midstream segment primarily reflects the results of MPLX and ANDX, our sponsored master limited partnerships.
|
55
Recent Developments
Andeavor Acquisition
On October 1, 2018, we completed the Andeavor acquisition. Under the terms of the merger agreement, Andeavor stockholders had the option to choose
1.87
shares of MPC common stock or
$152.27
in cash per share of Andeavor common stock. The merger agreement included election proration provisions that resulted in approximately
22.9 million
shares of Andeavor common stock being converted into cash consideration and the remaining
128.2 million
shares of Andeavor common stock being converted into stock consideration. Andeavor stockholders received in the aggregate approximately
239.8 million
shares of MPC common stock valued at
$19.8 billion
and approximately
$3.5 billion
in cash in connection with the Andeavor acquisition. Through the Andeavor acquisition, we acquired the general partner and 156 million common units of ANDX, which is a publicly traded MLP that was formed to own, operate, develop and acquire logistics assets.
Andeavor was a highly integrated marketing, logistics and refining company operating primarily in the Western and Mid-Continent United States. Andeavor’s operations included procuring crude oil from its source or from other third parties, transporting the crude oil to one of its 10 refineries, and producing, marketing and distributing refined products. Its marketing system included more than 3,300 stations marketed under multiple well-known fuel brands including ARCO
®
. Also, as noted above, we acquired the general partner and 156 million common units of ANDX, a leading growth-oriented, full service, and diversified midstream company which owns and operates networks of crude oil, refined products and natural gas pipelines, terminals with crude oil and refined products storage capacity, rail loading and offloading facilities, marine terminals including storage, bulk petroleum distribution facilities, a trucking fleet and natural gas processing and fractionation complexes.
This transaction combined two strong, complementary companies to create a leading nationwide U.S. downstream energy company. The acquisition substantially increases our geographic diversification and scale and strengthens each of our operating segments by diversifying our refining portfolio into attractive markets and increasing access to advantaged feedstocks, enhancing our midstream footprint in the Permian Basin, and creating a nationwide retail and marketing portfolio all of which is expected to substantially improve efficiencies and our ability to serve customers. We expect the combination to generate up to approximately $1.4 billion in gross run-rate synergies within the first three years, significantly enhancing our long-term cash flow generation profile.
See Item 8. Financial Statements and Supplementary Data – Note
5
for additional information on other acquisitions and investments in affiliates.
MPLX Financing Activities
In November 2018, MPLX issued
$2.25 billion
in aggregate principal amount of senior notes in a public offering. In December 2018, a portion of the net proceeds from the offering was used to redeem the
$750 million
in aggregate principal amount of senior notes due February 2023 issued by MPLX and MarkWest. The remaining net proceeds have or will be used to repay borrowings under MPLX’s revolving credit facility and intercompany loan with MPC and for general partnership purposes.
EXECUTIVE SUMMARY
Results
Select results for
2018
and
2017
are reflected in the following table. The
2018
amounts include the results of Andeavor from the October 1, 2018 acquisition date forward.
|
(In millions, except per share data)
|
2018
|
2017
|
||||||
|
Income from operations by segment
|
||||||||
|
Refining & Marketing
|
$
|
2,481
|
|
$
|
2,321
|
|
||
|
Retail
|
1,028
|
|
729
|
|
||||
|
Midstream
|
2,752
|
|
1,339
|
|
||||
|
Items not allocated to segments
|
(690
|
)
|
(371
|
)
|
||||
|
Income from operations
|
$
|
5,571
|
|
$
|
4,018
|
|
||
|
(Benefit) provision for income taxes
|
$
|
962
|
|
$
|
(460
|
)
|
||
|
Net income attributable to MPC
|
$
|
2,780
|
|
$
|
3,432
|
|
||
|
Net income attributable to MPC per diluted share
|
$
|
5.28
|
|
$
|
6.70
|
|
||
Net income attributable to MPC
decreased
$652 million
, or
$1.42
per diluted share, in
2018
compared to
2017
. Increased income from operations was more than offset by the absence of a tax benefit of $1.5 billion resulting from the TCJA in 2017 and increased net income attributable to noncontrolling interests in
2018
. Refer to the Results of Operations section for a discussion of financial results by segment for the three years ended
December 31, 2018
.
56
MPLX and ANDX
On February 1, 2018, we contributed our refining logistics assets and fuels distribution services to MPLX in exchange for
$4.1 billion
in cash and approximately 114 million newly issued MPLX units. Immediately following the dropdown, our IDRs were cancelled and our economic general partner interest was converted into a non-economic general partner interest, all in exchange for 275 million newly issued MPLX common units. MPLX financed the cash portion of the February 1, 2018 dropdown with its
$4.1 billion
364
-day term loan facility, which was entered into on January 2, 2018. On February 8, 2018, MPLX issued
$5.5 billion
in aggregate principal amount of senior notes in a public offering. MPLX used
$4.1 billion
of the net proceeds of the offering to repay the 364-day term-loan facility. The remaining proceeds were used to repay outstanding borrowings under MPLX’s revolving credit facility and intercompany loan agreement with us and for general partnership purposes.
The following table summarizes the cash distributions we received from MPLX during
2018
and
2017
and ANDX distributions received after the October 1, 2018 acquisition of Andeavor.
|
(In millions)
|
2018
|
2017
|
||||||
|
Cash distributions received:
|
||||||||
|
Limited partner distributions - MPLX
|
$
|
1,097
|
|
$
|
197
|
|
||
|
Limited partner distributions - ANDX
|
146
|
|
—
|
|
||||
|
General partner distributions, including IDRs - MPLX
|
—
|
|
301
|
|
||||
|
Total
|
$
|
1,243
|
|
$
|
498
|
|
||
We owned approximately
505 million
MPLX common units at
December 31, 2018
with a market value of
$15.29 billion
based on the
December 31, 2018
closing unit price of
$30.30
. On
January 25, 2019
, MPLX declared a quarterly cash distribution of
$0.6475
per common unit, which was paid
February 14, 2019
. As a result, MPLX made distributions totaling
$514 million
to its common unitholders. MPC’s portion of this distribution was approximately
$327 million
.
We owned approximately
156 million
ANDX common units at
December 31, 2018
with a market value of
$5.07 billion
based on the
December 31, 2018
closing unit price of
$32.49
. On
January 25, 2019
, ANDX declared a quarterly cash distribution of
$1.03
per common unit, which was paid
February 14, 2019
. As a result, ANDX made distributions totaling
$238 million
to its common unitholders. MPC’s portion of this distribution was approximately
$146 million
.
See Item 8. Financial Statements and Supplementary Data – Note
4
for additional information on MPLX and ANDX.
Share Repurchases
During the year ended
December 31, 2018
, we returned
$3.29 billion
to our shareholders through repurchases of
47 million
shares of common stock at an average price per share of
$69.46
. These repurchases were funded primarily by after tax proceeds from the February 1, 2018 dropdown to MPLX.
Since January 1, 2012, our board of directors has approved
$18.0 billion
in total share repurchase authorizations and we have repurchased a total of
$13.10 billion
of our common stock, leaving
$4.9 billion
available for repurchases as of
December 31, 2018
. Under these authorizations, we have acquired
293 million
shares at an average cost per share of
$44.60
.
Liquidity
As of
December 31, 2018
, we had cash and cash equivalents of
$1.61 billion
, excluding MPLX’s and ANDX’s cash and cash equivalents of
$68 million
and
$10 million
, respectively, and no borrowings or letters of credit outstanding under our $6.0 billion bank revolving credit facilities or under our $750 million trade receivables securitization facility (“trade receivables facility”). As of
December 31, 2018
, eligible trade receivables supported borrowings of
$750 million
under the trade receivable facility. As of
December 31, 2018
, MPLX had approximately
$2.25 billion
available under its
$2.25 billion
revolving credit agreement and $1 billion available through its intercompany loan agreement with MPC. As of
December 31, 2018
, ANDX had
$855 million
available under its $2.10 billion revolving credit agreements and $500 million available through its intercompany loan agreement with MPC.
See Item 8. Financial Statements and Supplementary Data – Note
19
for information on our new bank revolving credit facilities.
OVERVIEW OF SEGMENTS
Refining & Marketing
Refining & Marketing segment income from operations depends largely on our Refining & Marketing margin and refinery throughputs. Our total refining capacity was
3,021
mbpcd,
1,881
mbpcd and
1,817
mbpcd as of
December 31, 2018
,
2017
and
57
2016
, respectively. The increase in 2018 was primarily due to the acquisition of Andeavor on October 1, 2018, which added 10 refineries with approximately
1,117
mbpcd of total refining capacity.
Our Refining & Marketing margin is the difference between the prices of refined products sold and the costs of crude oil and other charge and blendstocks refined, including the costs to transport these inputs to our refineries and the costs of products purchased for resale. The crack spread is a measure of the difference between market prices for refined products and crude oil, commonly used by the industry as a proxy for the refining margin. Crack spreads can fluctuate significantly, particularly when prices of refined products do not move in the same relationship as the cost of crude oil. As a performance benchmark and a comparison with other industry participants, we calculate West Coast, Mid-Continent and Gulf Coast crack spreads that we believe most closely track our operations and slate of products. The following will be used for these crack-spread calculations:
|
•
|
The West Coast crack spread uses three barrels of ANS crude producing two barrels of LA CARBOB and one barrel of LA CARB Diesel;
|
|
•
|
The Mid-Continent Crack spread uses three barrels of WTI crude producing two barrels of Chicago CBOB gasoline and one barrel of Chicago ULSD; and
|
|
•
|
The Gulf Coast Crack Spread uses three barrels of LLS crude producing two barrels of USGC CBOB gasoline and one barrel of USGC ULSD.
|
Our refineries can process significant amounts of sour crude oil, which typically can be purchased at a discount to sweet crude oil. The amount of this discount, the sweet/sour differential, can vary significantly, causing our Refining & Marketing margin to differ from crack spreads based on sweet crude oil. In general, a larger sweet/sour differential will enhance our Refining & Marketing margin.
Future crude oil differentials will be dependent on a variety of market and economic factors, as well as U.S. energy policy.
The following table provides sensitivities showing an estimated change in annual net income due to potential changes in market conditions.
|
(In millions, after-tax)
|
|
|||
|
Blended crack spread sensitivity
(a)
(per $1.00/barrel change)
|
$
|
900
|
|
|
|
Sour differential sensitivity
(b)
(per $1.00/barrel change)
|
450
|
|
||
|
Sweet differential sensitivity
(c)
(per $1.00/barrel change)
|
370
|
|
||
|
Natural gas price sensitivity
(d)
(per $1.00/MMBtu)
|
300
|
|
||
|
(a)
|
Crack spread based on
38 percent
WTI,
38 percent
LLS and
24 percent
ANS with Mid-Continent, Gulf Coast and West Coast product pricing, respectively and assumes all other differentials and pricing relationships remain unchanged.
|
|
(b)
|
Sour crude oil basket consists of the following crudes: ANS, ASCI, Maya and Western Canadian Select
|
|
(c)
|
Sweet crude oil basket consists of the following crudes: Bakken, Brent, LLS, WTI-Cushing and WTI-Midland
|
|
(d)
|
This is consumption based exposure for our Refining & Marketing segment and does not include the sales exposure for our Midstream segment.
|
In addition to the market changes indicated by the crack spreads, the sour differential and the sweet differential, our Refining & Marketing margin is impacted by factors such as:
|
•
|
the selling prices realized for refined products;
|
|
•
|
the types of crude oil and other charge and blendstocks processed;
|
|
•
|
our refinery yields;
|
|
•
|
the cost of products purchased for resale;
|
|
•
|
the impact of commodity derivative instruments used to hedge price risk; and
|
|
•
|
the potential impact of LCM adjustments to inventories in periods of declining prices.
|
Inventories are stated at the lower of cost or market. Costs of crude oil, refinery feedstocks and refined products are stated under the LIFO inventory costing method and aggregated on a consolidated basis for purposes of assessing if the cost basis of these inventories may have to be written down to market values. At
December 31, 2018
, market values for refined products exceed their cost basis and, therefore, there is no LCM inventory market valuation reserve at the end of the year. Based on movements of refined product prices, future inventory valuation adjustments could have a negative effect to earnings. Such losses are subject to reversal in subsequent periods if prices recover.
Refining & Marketing segment income from operations is also affected by changes in refinery direct operating costs, which include turnaround and major maintenance, depreciation and amortization and other manufacturing expenses. Changes in
58
manufacturing costs are primarily driven by the cost of energy used by our refineries, including purchased natural gas, and the level of maintenance costs. Planned major maintenance activities, or turnarounds, requiring temporary shutdown of certain refinery operating units, are periodically performed at each refinery. The following table lists the refineries that had significant planned turnaround and major maintenance activities for each of the last three years and only reflects the activity for the acquired refineries after October 1, 2018.
|
Year
|
Refinery
|
|
|
2018
|
Canton, Detroit, Galveston Bay and Martinez
|
|
|
2017
|
Catlettsburg, Galveston Bay and Garyville
|
|
|
2016
|
Galveston Bay, Garyville and Robinson
|
|
We have various long-term, fee-based commercial agreements with MPLX and ANDX. Under these agreements, MPLX and ANDX, which are reported in our Midstream segment, provide transportation, storage, distribution and marketing services to our Refining & Marketing segment. Certain of these agreements include commitments for minimum quarterly throughput and distribution volumes of crude oil and refined products and minimum storage volumes of crude oil, refined products and other products. Certain other agreements include commitments to pay for 100 percent of available capacity for certain marine transportation and refining logistics assets.
Retail
Our Retail fuel margin for gasoline and distillate, which is the price paid by consumers or direct dealers less the cost of refined products, including transportation, consumer excise taxes and bankcard processing fees (where applicable), impacts the
Retail
segment profitability. Gasoline and distillate prices are volatile and are impacted by changes in supply and demand in the regions where we operate. Numerous factors impact gasoline and distillate demand throughout the year, including local competition, seasonal demand fluctuations, the available wholesale supply, the level of economic activity in our marketing areas and weather conditions. According to current estimates, 2018 gasoline demand remained at 9.3 million barrels per day for the third consecutive year. Headwinds from a four-year high in average gasoline prices during 2018 offset the gasoline demand support from continuing economic growth and slowing fleet fuel efficiency gains. Meanwhile, distillate demand was up for the second consecutive year on continuing economic growth in 2018, rising 5.2 percent from 2017 to the highest level since 2007 and the third highest U.S. demand level ever. Truck tonnage posted its largest annual increase since 1998, rising 6.6 percent year over year in 2018, while port container traffic (at the 10 largest U.S. ports), grew 4.5 percent year over year in 2018 (through November). The margin on merchandise sold at our convenience stores historically has been less volatile and has contributed substantially to our Retail segment margin. Almost half of our Retail margin was derived from merchandise sales in
2018
. This percentage decreased from 2017 due to the addition of long-term fuel supply contracts with direct dealers and fuel only locations as part of the Andeavor acquisition. Our Retail convenience stores offer a wide variety of merchandise, including prepared foods, beverages and non-food items.
Inventories are carried at the lower of cost or market value. Costs of refined products and merchandise are stated under the LIFO inventory costing method and aggregated on a consolidated basis for purposes of assessing if the cost basis of these inventories may have to be written down to market values. As of
December 31, 2018
, market values for refined products exceed their cost basis and, therefore, there is no LCM inventory market valuation reserve at the end of the year. Based on movements of refined product prices, future inventory valuation adjustments could have a negative effect to earnings. Such losses are subject to reversal in subsequent periods if prices recover.
Midstream
Our Midstream segment transports, stores, distributes and markets crude oil and refined products, principally for our Refining & Marketing segment. The profitability of our pipeline transportation operations primarily depends on tariff rates and the volumes shipped through the pipelines. The profitability of our marine operations primarily depends on the quantity and availability of our vessels and barges. The profitability of our light product terminal operations primarily depends on the throughput volumes at these terminals. The profitability of our fuels distribution services primarily depends on the sales volumes of certain refined products. The profitability of our refining logistics operations depends on the quantity and availability of our refining logistics assets. A majority of the crude oil and refined product shipments on our pipelines and marine vessels and the refined product throughput at our terminals serve our Refining & Marketing segment and our refining logistics assets and fuels distribution services are used solely by our Refining & Marketing segment. As discussed above in the Refining & Marketing section, MPLX and ANDX, which are reported in our Midstream segment, have various long-term, fee-based commercial agreements related to services provided to our Refining & Marketing segment. Under these agreements, MPLX and ANDX have received various commitments of minimum throughput, storage and distribution volumes as well as commitments to pay for all available capacity of certain assets. The volume of crude oil that we transport is directly affected by the supply of, and refiner demand for, crude oil in the markets served directly by our crude oil pipelines, terminals and marine
59
operations. Key factors in this supply and demand balance are the production levels of crude oil by producers in various regions or fields, the availability and cost of alternative modes of transportation, the volumes of crude oil processed at refineries and refinery and transportation system maintenance levels. The volume of refined products that we transport, store, distribute and market is directly affected by the production levels of, and user demand for, refined products in the markets served by our refined product pipelines and marine operations. In most of our markets, demand for gasoline and distillate peaks during the summer driving season, which extends from May through September of each year, and declines during the fall and winter months. As with crude oil, other transportation alternatives and system maintenance levels influence refined product movements.
NGL and natural gas prices are volatile and are impacted by changes in fundamental supply and demand, as well as market uncertainty, availability of NGL transportation and fractionation capacity and a variety of additional factors that are beyond our control. Our Midstream segment profitability is affected by prevailing commodity prices primarily as a result of processing or conditioning at our own or third‑party processing plants, purchasing and selling or gathering and transporting volumes of natural gas at index‑related prices and the cost of third‑party transportation and fractionation services. To the extent that commodity prices influence the level of natural gas drilling by our producer customers, such prices also affect profitability.
60
RESULTS OF OPERATIONS
The following discussion includes comments and analysis relating to our results of operations for the years ended
December 31, 2018
,
2017
and
2016
. The
2018
amounts include the results of Andeavor from the October 1, 2018 acquisition date forward. This discussion should be read in conjunction with Item 8. Financial Statements and Supplementary Data and is intended to provide investors with a reasonable basis for assessing our historical operations, but should not serve as the only criteria for predicting our future performance.
Consolidated Results of Operations
|
(In millions)
|
2018
|
2017
|
2018 vs. 2017 Variance
|
2016
|
2017 vs. 2016 Variance
|
|||||||||||||||
|
Revenues and other income:
|
||||||||||||||||||||
|
Sales and other operating revenues
(a)
|
$
|
95,750
|
|
$
|
74,104
|
|
$
|
21,646
|
|
$
|
63,277
|
|
$
|
10,827
|
|
|||||
|
Sales to related parties
|
754
|
|
629
|
|
125
|
|
62
|
|
567
|
|
||||||||||
|
Income (loss) from equity method investments
|
373
|
|
306
|
|
67
|
|
(185
|
)
|
491
|
|
||||||||||
|
Net gain on disposal of assets
|
23
|
|
10
|
|
13
|
|
32
|
|
(22
|
)
|
||||||||||
|
Other income
|
202
|
|
320
|
|
(118
|
)
|
178
|
|
142
|
|
||||||||||
|
Total revenues and other income
|
97,102
|
|
75,369
|
|
21,733
|
|
63,364
|
|
12,005
|
|
||||||||||
|
Costs and expenses:
|
||||||||||||||||||||
|
Cost of revenues (excludes items below)
(a)
|
85,456
|
|
66,519
|
|
18,937
|
|
56,676
|
|
9,843
|
|
||||||||||
|
Purchases from related parties
|
610
|
|
570
|
|
40
|
|
509
|
|
61
|
|
||||||||||
|
Inventory market valuation adjustment
|
—
|
|
—
|
|
—
|
|
(370
|
)
|
370
|
|
||||||||||
|
Impairment expense
|
—
|
|
—
|
|
—
|
|
130
|
|
(130
|
)
|
||||||||||
|
Depreciation and amortization
|
2,490
|
|
2,114
|
|
376
|
|
2,001
|
|
113
|
|
||||||||||
|
Selling, general and administrative expenses
|
2,418
|
|
1,694
|
|
724
|
|
1,597
|
|
97
|
|
||||||||||
|
Other taxes
|
557
|
|
454
|
|
103
|
|
435
|
|
19
|
|
||||||||||
|
Total costs and expenses
|
91,531
|
|
71,351
|
|
20,180
|
|
60,978
|
|
10,373
|
|
||||||||||
|
Income from operations
|
5,571
|
|
4,018
|
|
1,553
|
|
2,386
|
|
1,632
|
|
||||||||||
|
Net interest and other financial costs
|
1,003
|
|
674
|
|
329
|
|
564
|
|
110
|
|
||||||||||
|
Income before income taxes
|
4,568
|
|
3,344
|
|
1,224
|
|
1,822
|
|
1,522
|
|
||||||||||
|
(Benefit) provision for in
come taxes
|
962
|
|
(460
|
)
|
1,422
|
|
609
|
|
(1,069
|
)
|
||||||||||
|
Net income
|
3,606
|
|
3,804
|
|
(198
|
)
|
1,213
|
|
2,591
|
|
||||||||||
|
Less net income (loss) attributable to:
|
||||||||||||||||||||
|
Redeemable noncontrolling interest
|
75
|
|
65
|
|
10
|
|
41
|
|
24
|
|
||||||||||
|
Noncontrolling interests
|
751
|
|
307
|
|
444
|
|
(2
|
)
|
309
|
|
||||||||||
|
Net income attributable to MPC
|
$
|
2,780
|
|
$
|
3,432
|
|
$
|
(652
|
)
|
$
|
1,174
|
|
$
|
2,258
|
|
|||||
|
(a)
|
We adopted ASU 2014-09, Revenue - Revenue from Contracts with Customers (“ASC 606”) as of January 1, 2018, and elected to report certain taxes on a net basis. We adopted the standard using the modified retrospective method, and, therefore, comparative information continues to reflect certain taxes on a gross basis. See Item 8. Financial Statements and Supplementary Data - Notes
2
and
3
for further information.
|
2018
Compared to
2017
Net income attributable to MPC
decreased
$652 million
. Increased income from operations was more than offset by a tax benefit of $1.5 billion resulting from the TCJA in 2017 and increased income attributable to noncontrolling interests in
2018
. See Segment Results for additional information.
Total revenues and other income increased
$21.73 billion
in
2018
compared to
2017
primarily due to:
|
•
|
increased
sales and other operating revenues of
$21.65 billion
mainly due to an increase in our Refining & Marketing segment refined product sales volumes, which
increased
402
mbpd, and higher averaged refined product sales prices, which
increased
$0.34
per gallon. The increase in volume is largely due to the Andeavor acquisition on October 1, 2018. These increases were partially offset by our election to present revenues net of certain taxes under ASC 606 prospectively from January 1, 2018, which resulted in a decrease in revenues of
$6.66 billion
for the year. See Item 8.
|
61
Financial Statements and Supplementary Data – Notes
2
and
3
for additional information on recently adopted accounting standards;
|
•
|
increased
sales to related parties of
$125 million
primarily due to higher average refined product prices;
|
|
•
|
increased
income from equity method investments of
$67 million
primarily due to an increase in income from midstream equity affiliates; and
|
|
•
|
decreased
other income of
$118 million
primarily due to a decrease in RIN sales.
|
Total costs and expenses increased
$20.18 billion
in
2018
compared to
2017
primarily due to:
|
•
|
increased
cost of revenues of
$18.94 billion
primarily due to:
|
|
◦
|
an increase in refined product cost of sales of
$24.97 billion
, primarily due to increased operations following the acquisition of Andeavor along with higher raw material costs attributable to an increase in our average crude oil costs of
$13.87
per barrel; and
|
|
◦
|
a decrease in certain taxes of
$6.66 billion
as a result of our election to present revenues net of certain taxes under ASC 606 prospectively from January 1, 2018. For the year, certain taxes continue to be presented on a gross basis and are included in cost of revenues. See Item 8. Financial Statements and Supplementary Data – Notes
2
and
3
for additional information on recently adopted accounting standards;
|
|
•
|
increased
depreciation and amortization of
$376 million
, primarily due to the depreciation of the fair value of the assets acquired in connection with the Andeavor acquisition;
|
|
•
|
increased
selling, general and administrative expenses of
$724 million
primarily due to approximately $197 million of transaction related costs for financial advisors, employee severance and other costs associated with the Andeavor acquisition in addition to increased costs and expenses for the combined company; and
|
|
•
|
increased
other taxes of
$103 million
primarily due to the inclusion of other taxes related to the acquired Andeavor operations.
|
Net interest and other financial costs
increased
$329 million
mainly due to increased MPLX borrowings and debt assumed in the acquisition of Andeavor. In addition, MPLX recognized $60 million of debt extinguishment costs in 2018 in connection with the redemption of its $750 million of senior notes due in 2023. We capitalized interest of
$80 million
in
2018
and
$55 million
in
2017
. See Item 8. Financial Statements and Supplementary Data – Note
19
for further details.
Provision for income taxes
increased
$1.42 billion
primarily due to the absence of a tax benefit of $1.5 billion in
2017
resulting from the TCJA and an increase in our income before income taxes, which
increased
$1.22 billion
. The effective tax rate of
21 percent
in
2018
is consistent with the U.S. statutory rate of
21 percent
, as permanent benefit differences related to income attributable to noncontrolling interest were offset by state and local tax expense. In
2017
, our effective tax rate was impacted by
45
percentage points as a result of the TCJA which decreased our effective tax rate from 31 percent to
(14)
percent. The effective tax rate, excluding the TCJA, of 31 percent in
2017
was slightly less than the U.S. statutory rate of 35 percent primarily due to certain permanent benefit differences, including differences related to net income attributable to noncontrolling interests and the domestic manufacturing deduction, partially offset by state and local tax expense. See Item 8. Financial Statements and Supplementary Data – Note
12
for further details.
Noncontrolling interests increased $454 million due to higher MPLX net income resulting primarily from the February 1, 2018 dropdown transaction, partially offset by the reduced ownership in MPLX held by noncontrolling interests following the GP/IDR Exchange. Noncontrolling ownership in MPLX decreased to 36.4 percent at
December 31, 2018
from 69.6 percent at
December 31, 2017
. In addition, 2018 reflects $68 million of net income attributable to the noncontrolling interest in ANDX of 36.4 percent for the period from October 1, 2018 through the end of the year.
2017
Compared to
2016
Net income attributable to MPC
increased
$2.26 billion
in
2017
compared to
2016
primarily due to a tax benefit of $1.5 billion resulting from the TCJA enacted in the fourth quarter of 2017 and an increase in our Refining & Marketing segment income from operations of $964 million. See Segment Results for additional information.
Total revenues and other income increased
$12.01 billion
in
2017
compared to
2016
primarily due to:
|
•
|
increased
sales and other operating revenues (including consumer excise taxes) of
$10.83 billion
primarily due to higher averaged refined product sales prices, which increased $0.25 per gallon, and an increase in refined product sales volumes, which increased 42 mbpd;
|
|
•
|
increased
sales to related parties of
$567 million
mainly due to sales from our Refining & Marketing segment to PFJ Southeast, a joint venture with Pilot Flying J, which commenced in the fourth quarter of 2016;
|
62
|
•
|
increased
income (loss) from equity method investments of
$491 million
primarily due to the absence of impairment charges related to equity method investments of $356 million recorded in 2016 along with increases in income from new and existing pipeline, natural gas, retail and marine affiliates;
|
|
•
|
increased
other income of
$142 million
primarily due to increased RIN sales; and
|
|
•
|
decreased
net gain on disposal of assets of
$22 million
primarily due to gains on the sale of certain Speedway locations in 2016.
|
Total costs and expenses increased
$10.37 billion
in
2017
compared to
2016
primarily due to:
|
•
|
increased
cost of revenues of
$9.84 billion
primarily due to an increase in refined product cost of sales of $9.18 billion, primarily attributable to an increase in our average crude oil costs of $9.50 per barrel;
|
|
•
|
increased
purchases from related parties of
$61 million
primarily due to:
|
|
◦
|
an increase in transportation services provided by Crowley Ocean Partners of $27 million;
|
|
◦
|
an increase in transportation services provided by Crowley Blue Water Partners of $23 million; and
|
|
◦
|
an increase in volumes purchased from LOOP of $12 million;
|
|
•
|
an inventory market valuation adjustment which decreased costs and expenses by $370 million in
2016
related to the reversal of the LCM inventory valuation reserve due to increased refined product prices;
|
|
•
|
decreased
impairment expense of
$130 million
as the impairment expense in
2016
reflects a $130 million charge recorded by MPLX to impair a portion of the $2.21 billion of goodwill recorded in connection with the MarkWest Merger; and
|
|
•
|
increased
selling, general and administrative expenses of
$97 million
primarily due to increases in employee-related compensation and benefit expenses, higher corporate costs and net litigation settlement expenses of $29 million.
|
Net interest and other financial costs
increased
$110 million
in
2017
compared to
2016
mainly due to the MPLX senior notes issued in February 2017 and a $45 million increase in pension settlement expenses, partially offset by decreased borrowings on the MPC term loan agreement. We capitalized interest of
$55 million
in
2017
and
$63 million
in
2016
. See Item 8. Financial Statements and Supplementary Data – Note
19
for further details.
Provision for income taxes
decreased
$1.07 billion
in
2017
compared to
2016
. The TCJA was signed into law on December 22, 2017 and provided several key changes to U.S. tax law, including a federal corporate tax rate of
21 percent
replacing the
2017
rate applicable to MPC of 35 percent. MPC was required to calculate the effect of the TCJA on its deferred tax balances as of the enactment date. The effect of the federal corporate income tax rate change reduced net deferred tax liabilities by
$1.5 billion
in 2017. This benefit was partially offset by an increase in our income before income taxes, which
increased
$1.52 billion
in 2017 compared to 2016. The TCJA impacted our effective tax rate by
45
percentage points in
2017
, decreasing our effective tax rate from 31 percent to
(14)
percent. The effective tax rates, excluding the TCJA in 2017, of 31 percent in
2017
and
33 percent
in
2016
, are slightly less than the U.S. statutory rate of 35 percent primarily due to certain permanent benefit differences, including differences related to net income attributable to noncontrolling interests and the domestic manufacturing deduction, partially offset by state and local tax expense. See Item 8. Financial Statements and Supplementary Data – Note
12
for further details.
Noncontrolling interests increased $333 million primarily due to increased MPLX net income.
63
Segment Results
Our segment income from operations was approximately
$6.26 billion
,
$4.39 billion
and
$3.14 billion
for the years ended
December 31, 2018
,
2017
and
2016
, respectively. The following shows the percentage of segment income from operations by segment for the last three years.
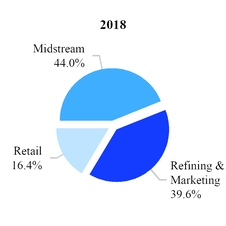
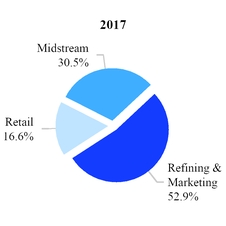
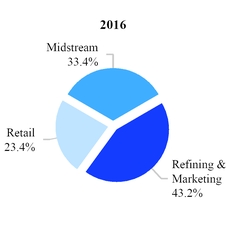
Refining & Marketing
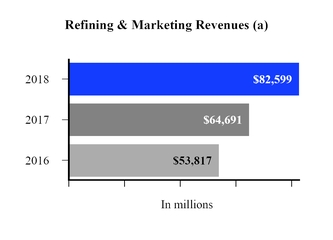
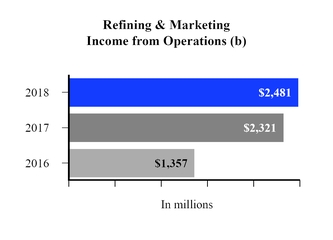
|
(a)
|
We adopted ASC 606 (Revenue from Contracts with Customers), as of January 1, 2018, and elected to report certain taxes on a net basis. We applied the standard using the modified retrospective method, and, therefore, comparative information continues to reflect certain taxes on a gross basis.
|
|
(b)
|
Results related to refining logistics and fuels distribution are presented in the Midstream segment prospectively from February 1, 2018. Prior periods are not adjusted as these entities were not considered a business prior to February 1, 2018.
|
64
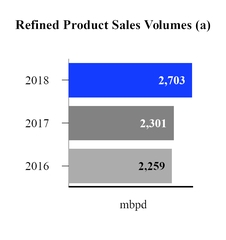
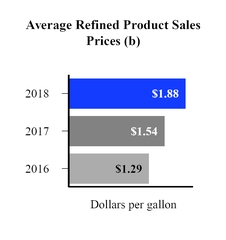
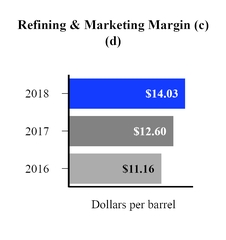
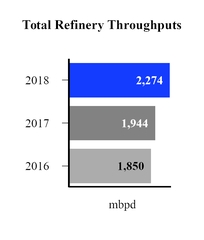
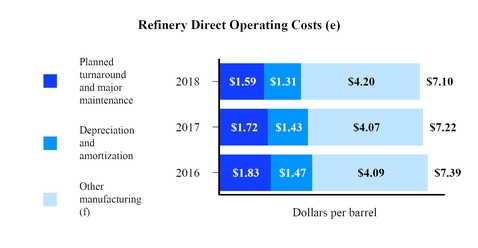
|
(a)
|
Includes intersegment sales and sales destined for export.
|
|
(b)
|
For comparability purposes, these amounts exclude sales taxes for all periods presented. As noted above, Refining & Marketing revenues in 2018 reflect these taxes on a net basis, while 2017 and 2016 Refining & Marketing revenues continue to reflect these taxes on a gross basis. The average refined product sales prices for 2017 and 2016 included excise taxes of $0.18 per gallon before this adjustment.
|
|
(c)
|
Sales revenue less cost of refinery inputs and purchased products, divided by total refinery throughputs. Excludes LCM inventory valuation adjustments.
|
|
(d)
|
See “Non-GAAP Measures” section for reconciliation and further information regarding this non-GAAP measure.
|
|
(e)
|
Per barrel of total refinery throughputs.
|
|
(f)
|
Includes utilities, labor, routine maintenance and other operating costs.
|
65
2018
Compared to
2017
The following table presents certain benchmark prices in our marketing areas and market indicators that we believe are helpful in understanding the results of our Refining & Marketing segment’s business. With the acquisition of Andeavor, we revised our market data to include a West Coast 3-2-1 crack spread. Additionally, the Chicago 6-3-2-1 crack spread was revised to reflect a Mid-Continent 3-2-1 crack spread and the Gulf coast 6-3-2-1 crack spread was also revised to reflect a 3-2-1 crack spread. See the “Overview of Segments” section for further discussion of our revised crack spreads.
|
Benchmark spot prices
(dollars per gallon)
|
2018
|
2017
|
||||||
|
Chicago CBOB unleaded regular gasoline
|
$
|
1.86
|
|
$
|
1.58
|
|
||
|
Chicago ultra-low sulfur diesel
|
2.07
|
|
1.64
|
|
||||
|
USGC CBOB unleaded regular gasoline
|
1.88
|
|
1.60
|
|
||||
|
USGC ultra-low sulfur diesel
|
2.05
|
|
1.62
|
|
||||
|
LA CARBOB
|
2.06
|
|
—
|
|
||||
|
LA CARB diesel
|
2.14
|
|
—
|
|
||||
|
Market Indicators
(dollars per barrel)
|
||||||||
|
LLS
|
$
|
69.93
|
|
$
|
54.00
|
|
||
|
WTI
|
64.10
|
|
50.85
|
|
||||
|
ANS
|
68.46
|
|
54.44
|
|
||||
|
Crack Spreads
|
||||||||
|
Mid-Continent WTI 3-2-1
|
$
|
14.02
|
|
$
|
12.71
|
|
||
|
USGC LLS 3-2-1
|
7.91
|
|
8.55
|
|
||||
|
West Coast ANS 3-2-1
|
11.66
|
|
14.02
|
|
||||
|
Blended 3-2-1
(a)(b)
|
10.62
|
|
10.22
|
|
||||
|
Crude Oil Differentials
|
||||||||
|
Sweet
|
$
|
(3.83
|
)
|
$
|
(1.04
|
)
|
||
|
Sour
|
(7.60
|
)
|
(5.02
|
)
|
||||
|
(a)
|
Blended 3-2-1 WTI/LLS/ANS crack spread
38
/
38
/
24
percent in
2018
, Blended 6-3-2-1 Chicago/USGC crack spread is
40
/
60 percent
for the first nine months of 2018 and in
2017
and
38
/
62 percent
in
2016
. These blends are based on MPC’s refining capacity by region in each period.
|
|
(b)
|
Beginning 4Q 2018, Blended Mid-Con/USGC/West Coast crack spread is weighted 38/38/24 percent based on MPC's refining capacity by PADD. From Q1 2017 through Q3 2018, the blended spread was weighted 40/60 percent Mid-Con/USGC.
|
Refining & Marketing segment revenues
increased
$17.91 billion
primarily due to higher refined product sales volumes, which
increased
402
mbpd, and higher refined product sales prices, which
increased
$0.34
per gallon. The increase in sales volumes is largely due to the acquisition of Andeavor on October 1, 2018. These increases were partially offset by our election to present revenues net of certain taxes under ASC 606 prospectively from January 1, 2018, which resulted in a decrease in Refining & Marketing segment revenues of $4.58 billion in
2018
. See Item 8. Financial Statements and Supplementary Data – Notes
2
and
3
for additional information on recently adopted accounting standards.
Refining & Marketing segment income from operations
increased
$160 million
primarily due to higher throughputs as a result of the Andeavor acquisition as well as wider sour and sweet crude differentials. For comparison purposes, as noted in the Market Indicators table, 2017 indicators have been included which reflect the new indicators we began using subsequent to the acquisition of Andeavor. Based on this, the USGC, Mid-Continent and West Coast blended 3-2-1 crack spread was
$10.62
per barrel in
2018
as compared to
10.22
per barrel in
2017
. These crack spreads are net of RIN crack adjustments of
$1.61
and
$3.57
for
2018
and
2017
, respectively.
66
Based on changes in the market indicators shown above and our refinery throughputs, we estimate a
positive
impact of
$3.40 billion
on Refining & Marketing segment income from operations, of which
$1.81 billion
and
$1.59 billion
are due to the effects of changes in price and volume, respectively. The market indicators use spot market values and an estimated mix of crude purchases and product sales. Differences in our results compared to these market indicators, including product price realizations, the mix of crudes purchased and their costs, the effects of LCM inventory valuation adjustments, the effects of market structure on our crude oil acquisition prices, and other items like refinery yields and other feedstock variances, had an estimated
negative
impact on Refining & Marketing segment income from operations of
$698 million
in 2018 compared to 2017. The significant elements of the negative impact were unfavorable crude acquisition costs and unfavorable product price realizations relative to the market indicators.
The cost of inventories of crude oil and refinery feedstocks, refined products and merchandise is determined primarily under the LIFO method. There were no material liquidations of LIFO inventories in
2018
and we recognized a LIFO charge of $7 million in
2017
.
Refinery direct operating costs
decreased
$0.12
per barrel in
2018
compared to
2017
. The decrease includes a
$0.13
per barrel decrease in planned turnaround and major maintenance costs and a
$0.12
per barrel decrease in depreciation and amortization primarily due to higher refinery throughput resulting from the addition of 10 refineries as part of the acquisition of Andeavor. Total turnaround costs increased due to costs related to these additional refineries as well as higher turnaround costs at our Detroit and Canton refineries, partially offset by lower turnaround costs at our Galveston Bay and Garyville refineries. The increase in other manufacturing costs of
$0.13
per barrel is mainly due to costs associated with the acquired refineries, partially offset by an increase in throughput due to the acquisition of Andeavor. In addition, manufacturing costs and depreciation and amortization costs per barrel decreased due to the dropdown of refining and logistics assets to MPLX on February 1, 2018.
We purchase RINs to satisfy a portion of our RFS2 compliance. Our expenses associated with purchased RINs were $316 million in
2018
compared to $457 million in
2017
. The decrease in
2018
was primarily due to lower weighted average RIN costs which more than offset the increase in our RINs obligation subsequent to the acquisition of Andeavor.
2017
Compared to
2016
The following table presents certain benchmark prices in our marketing areas and market indicators that we believe are helpful in understanding the results of our Refining & Marketing segment’s business.
|
Benchmark spot prices
(dollars per gallon)
|
2017
|
2016
|
||||||
|
Chicago CBOB unleaded regular gasoline
|
$
|
1.58
|
|
$
|
1.33
|
|
||
|
Chicago ultra-low sulfur diesel
|
1.64
|
|
1.34
|
|
||||
|
USGC CBOB unleaded regular gasoline
|
1.60
|
|
1.33
|
|
||||
|
USGC ultra-low sulfur diesel
|
1.62
|
|
1.32
|
|
||||
|
Market Indicators
(dollars per barrel)
|
||||||||
|
LLS
|
$
|
54.00
|
|
$
|
45.01
|
|
||
|
WTI
|
50.85
|
|
43.47
|
|
||||
|
Crack Spreads
|
||||||||
|
Chicago LLS 6-3-2-1
(a)(b)
|
$
|
9.77
|
|
$
|
7.19
|
|
||
|
USGC LLS 6-3-2-1
(a)
|
9.89
|
|
6.80
|
|
||||
|
Blended 6-3-2-1
(a)(c)
|
9.84
|
|
6.96
|
|
||||
|
Crude Oil Differentials
|
||||||||
|
LLS - WTI
(a)
|
$
|
3.15
|
|
$
|
1.55
|
|
||
|
Sweet/Sour
(a)(c)
|
5.94
|
|
6.52
|
|
||||
|
(a)
|
All spreads and differentials are measured against prompt LLS.
|
|
(b)
|
Calculation utilizes USGC three percent residual fuel oil price as a proxy for Chicago three percent residual fuel oil price.
|
|
(c)
|
LLS (prompt) – [delivered cost of sour crude oil: Arab Light, Kuwait, Maya, Western Canadian Select and Mars].
|
Refining & Marketing segment revenues increased
$10.87 billion
in
2017
compared to
2016
primarily due to higher refined product sales prices and volumes.
Refining & Marketing segment income from operations
increased
$964 million
in
2017
compared to
2016
. Segment income in 2016 includes a $345 million non-cash benefit related to the Company’s LCM inventory reserve. Excluding the LCM inventory
67
benefit, the increase in segment results for 2017 primarily resulted from higher LLS crack spreads in both the U.S. Gulf Coast and Chicago markets. The LLS blended crack spread for 2017 increased to
$9.84
per barrel from
$6.96
per barrel in 2016. These favorable effects were partially offset by less favorable product price realizations as compared to the spot market prices used in the LLS blended crack spread.
Based on changes in the market indicators shown above and our refinery throughputs, we estimate a positive impact of $2.33 billion for
2017
compared to
2016
on Refining & Marketing segment income from operations. The market indicators use spot market values and an estimated mix of crude purchases and product sales. Differences in our results compared to these market indicators, including product price realizations, the mix of crudes purchased and their costs, the effects of LCM inventory valuation adjustments, the effects of market structure on our crude oil acquisition prices, and other items like refinery yields and other feedstock variances, had an estimated negative impact on Refining & Marketing segment income from operations of $1.35 billion in
2017
compared to
2016
. The significant elements of the negative impact were unfavorable product price realizations and unfavorable crude acquisition costs relative to the market indicators.
The cost of inventories of crude oil and refinery feedstocks, refined products and merchandise is determined primarily under the LIFO method. In the second quarter of 2016, we had recognized the effects of an interim liquidation of our refined products inventories which we did not expect to reinstate by year end resulting in a pre-tax charge of approximately $54 million to income. Based on year end refined product inventories, which were higher than inventories at the beginning of the year, we had a build in refined product inventories for 2016. Therefore, we recognized the effects of this annual build in our refined products in the fourth quarter of 2016 which had the effect of reversing the second quarter charge. For the full year, we recognized a LIFO charge of $7 million in 2017 and $2 million in 2016.
Refinery direct operating costs decreased $0.17 per barrel in
2017
compared to
2016
. The decrease in 2017 includes an $0.11 per barrel decrease in planned turnaround and major maintenance costs resulting from lower turnaround activity at our Garyville and Robinson refineries partially offset by higher activity at our Catlettsburg refinery.
We purchase RINs to satisfy a portion of our RFS2 compliance. Our expenses associated with purchased RINs were $457 million in
2017
and $288 million in
2016
. The increase in 2017 was primarily due to higher weighted average RIN costs driven by higher market prices for purchased RINs and increases in the number of RINs purchased.
68
Supplemental Refining & Marketing Statistics
|
2018
|
2017
|
2016
|
|||||||||
|
Refining & Marketing Operating Statistics
|
|||||||||||
|
Crude oil capacity utilization percent
(a)
|
96
|
|
97
|
|
95
|
|
|||||
|
Refinery throughputs (
thousands of barrels per day
):
|
|||||||||||
|
Crude oil refined
|
2,081
|
|
1,765
|
|
1,699
|
|
|||||
|
Other charge and blendstocks
|
193
|
|
179
|
|
151
|
|
|||||
|
Total
|
2,274
|
|
1,944
|
|
1,850
|
|
|||||
|
Sour crude oil throughput percent
|
52
|
|
59
|
|
60
|
|
|||||
|
Sweet crude oil throughput percent
|
48
|
|
41
|
|
40
|
|
|||||
|
Refined product yields (mbpd):
(b)
|
|||||||||||
|
Gasoline
|
1,107
|
|
932
|
|
900
|
|
|||||
|
Distillates
|
773
|
|
641
|
|
617
|
|
|||||
|
Propane
|
41
|
|
36
|
|
35
|
|
|||||
|
Feedstocks and petrochemicals
|
288
|
|
277
|
|
241
|
|
|||||
|
Heavy fuel oil
|
38
|
|
37
|
|
32
|
|
|||||
|
Asphalt
|
69
|
|
63
|
|
58
|
|
|||||
|
Total
|
2,316
|
|
1,986
|
|
1,883
|
|
|||||
|
Refining & Marketing Operating Statistics By Region – Gulf Coast
|
|||||||||||
|
Refinery throughputs (mbpd):
(b)
|
|||||||||||
|
Crude oil refined
|
1,135
|
|
1,070
|
|
1,039
|
|
|||||
|
Other charge and blendstocks
|
190
|
|
224
|
|
195
|
|
|||||
|
Total
|
1,325
|
|
1,294
|
|
1,234
|
|
|||||
|
Sour crude oil throughput percent
|
62
|
|
71
|
|
73
|
|
|||||
|
Sweet crude oil throughput percent
|
38
|
|
29
|
|
27
|
|
|||||
|
Refined product yields (mbpd):
(b)
|
|||||||||||
|
Gasoline
|
574
|
|
546
|
|
514
|
|
|||||
|
Distillates
|
432
|
|
405
|
|
399
|
|
|||||
|
Propane
|
25
|
|
26
|
|
26
|
|
|||||
|
Feedstocks and petrochemicals
|
291
|
|
311
|
|
286
|
|
|||||
|
Heavy fuel oil
|
18
|
|
25
|
|
21
|
|
|||||
|
Asphalt
|
19
|
|
17
|
|
15
|
|
|||||
|
Total
|
1,359
|
|
1,330
|
|
1,261
|
|
|||||
|
Refinery direct operating costs (dollars per barrel):
(c)
|
|||||||||||
|
Planned turnaround and major maintenance
|
$
|
1.12
|
|
$
|
1.75
|
|
$
|
2.09
|
|
||
|
Depreciation and amortization
|
1.03
|
|
1.12
|
|
1.14
|
|
|||||
|
Other manufacturing
(d)
|
3.41
|
|
3.74
|
|
3.70
|
|
|||||
|
Total
|
$
|
5.56
|
|
$
|
6.61
|
|
$
|
6.93
|
|
||
69
|
2018
|
2017
|
2016
|
|||||||||
|
Refining & Marketing Operating Statistics By Region – Mid-Continent
|
|||||||||||
|
Refinery throughputs (mbpd):
(b)
|
|||||||||||
|
Crude oil refined
|
792
|
|
695
|
|
660
|
|
|||||
|
Other charge and blendstocks
|
47
|
|
33
|
|
39
|
|
|||||
|
Total
|
839
|
|
728
|
|
699
|
|
|||||
|
Sour crude oil throughput percent
|
33
|
|
40
|
|
40
|
|
|||||
|
Sweet crude oil throughput percent
|
67
|
|
60
|
|
60
|
|
|||||
|
Refined product yields (mbpd):
(b)
|
|||||||||||
|
Gasoline
|
444
|
|
386
|
|
386
|
|
|||||
|
Distillates
|
279
|
|
236
|
|
218
|
|
|||||
|
Propane
|
14
|
|
11
|
|
11
|
|
|||||
|
Feedstocks and petrochemicals
|
43
|
|
42
|
|
35
|
|
|||||
|
Heavy fuel oil
|
14
|
|
13
|
|
12
|
|
|||||
|
Asphalt
|
50
|
|
46
|
|
43
|
|
|||||
|
Total
|
844
|
|
734
|
|
705
|
|
|||||
|
Refinery direct operating costs (dollars per barrel):
(c)
|
|||||||||||
|
Planned turnaround and major maintenance
|
$
|
1.97
|
|
$
|
1.48
|
|
$
|
1.15
|
|
||
|
Depreciation and amortization
|
1.67
|
|
1.81
|
|
1.88
|
|
|||||
|
Other manufacturing
(d)
|
4.34
|
|
4.26
|
|
4.29
|
|
|||||
|
Total
|
$
|
7.98
|
|
$
|
7.55
|
|
$
|
7.32
|
|
||
|
Refining & Marketing Operating Statistics By Region – West Coast
|
|||||||||||
|
Refinery throughputs (mbpd):
(b)
|
|||||||||||
|
Crude oil refined
|
154
|
|
—
|
|
—
|
|
|||||
|
Other charge and blendstocks
|
17
|
|
—
|
|
—
|
|
|||||
|
Total
|
171
|
|
—
|
|
—
|
|
|||||
|
Sour crude oil throughput percent
|
72
|
|
—
|
|
—
|
|
|||||
|
Sweet crude oil throughput percent
|
28
|
|
—
|
|
—
|
|
|||||
|
Refined product yields (mbpd):
(b)
|
|||||||||||
|
Gasoline
|
89
|
|
—
|
|
—
|
|
|||||
|
Distillates
|
62
|
|
—
|
|
—
|
|
|||||
|
Propane
|
2
|
|
—
|
|
—
|
|
|||||
|
Feedstocks and petrochemicals
|
14
|
|
—
|
|
—
|
|
|||||
|
Heavy fuel oil
|
7
|
|
—
|
|
—
|
|
|||||
|
Asphalt
|
—
|
|
—
|
|
—
|
|
|||||
|
Total
|
174
|
|
—
|
|
—
|
|
|||||
|
Refinery direct operating costs (dollars per barrel):
(c)
|
|||||||||||
|
Planned turnaround and major maintenance
|
$
|
2.79
|
|
$
|
—
|
|
$
|
—
|
|
||
|
Depreciation and amortization
|
1.26
|
|
—
|
|
—
|
|
|||||
|
Other manufacturing
(d)
|
8.07
|
|
—
|
|
—
|
|
|||||
|
Total
|
$
|
12.12
|
|
$
|
—
|
|
$
|
—
|
|
||
|
(a)
|
Based on calendar-day capacity, which is an annual average that includes down time for planned maintenance and other normal operating activities.
|
|
(b)
|
Excludes inter-refinery volumes which totaled
61
mbpd,
78
mbpd and
83
mbpd for
2018
,
2017
and
2016
, respectively, for all regions.
|
|
(c)
|
Per barrel of total refinery throughputs.
|
|
(d)
|
Includes utilities, labor, routine maintenance and other operating costs.
|
70
Retail
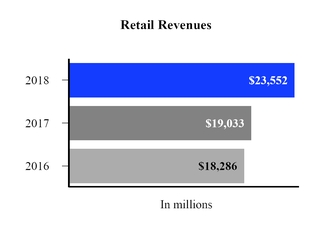
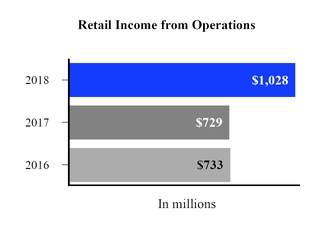
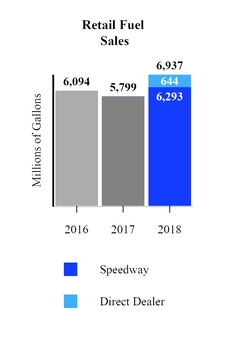
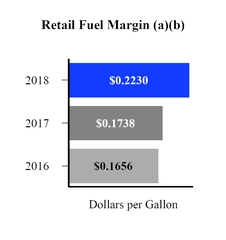
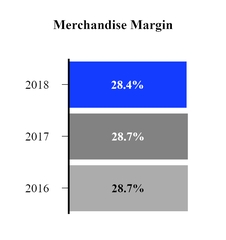
|
(a)
|
The price paid by consumers or direct dealers less the cost of refined products, including transportation, consumer excise taxes and bankcard processing fees (where applicable), divided by gasoline and distillate sales volume. Excludes LCM inventory valuation adjustments.
|
|
(b)
|
See “Non-GAAP Measures” section for reconciliation and further information regarding this non-GAAP measure.
|
|
Key Financial and Operating Data
|
2018
|
2017
|
2016
|
|||||||||
|
Average fuel sales prices (
dollars per gallon
)
|
$
|
2.71
|
|
$
|
2.34
|
|
$
|
2.09
|
|
|||
|
Merchandise sales (
in millions
)
|
$
|
5,232
|
|
$
|
4,893
|
|
$
|
5,007
|
|
|||
|
Merchandise margin (
in millions
)
(a)(b)
|
$
|
1,486
|
|
$
|
1,402
|
|
$
|
1,435
|
|
|||
|
Same store gasoline sales volume (period over period)
(c)
|
(1.5
|
)%
|
(1.3
|
)%
|
(0.4
|
)%
|
||||||
|
Same store merchandise sales (period over period)
(c)(d)
|
4.2
|
%
|
1.2
|
%
|
3.2
|
%
|
||||||
|
Convenience stores at period-end
|
3,923
|
|
2,744
|
|
2,733
|
|
||||||
|
Direct dealer locations at period-end
|
1,065
|
|
N/A
|
|
N/A
|
|
||||||
|
(a)
|
The price paid by the consumers less the cost of merchandise.
|
|
(b)
|
See “Non-GAAP Measures” section for reconciliation and further information regarding this non-GAAP measure.
|
|
(c)
|
Same store comparison includes only locations owned at least 13 months.
|
|
(d)
|
Excludes cigarettes.
|
71
2018
Compared to
2017
Retail
segment revenues
increased
$4.52 billion
. The majority of this increase is due to the acquisition of Andeavor on October 1, 2018, which added company-owned and operated retail locations, which are included in Speedway fuel sales, and direct dealer locations. The existing Retail business also saw a $1.18 billion increase in fuel and merchandise sales. Total fuel sales increased
$5.21 billion
primarily due to an increase in Speedway fuel sales volumes of
494 million
gallons, the addition of direct dealer fuel sales of
644 million
gallons and an increase in average gasoline and distillate selling prices of
$0.37
per gallon. Merchandise sales increased
$339 million
. The increases in Speedway fuel sales and merchandise sales as well as the addition of sales to direct dealers were primarily due to the acquisition of Andeavor. These increases were partially offset by our election to present revenues net of certain taxes under ASC 606 prospectively from January 1, 2018, which resulted in a decrease in Retail segment revenues of $844 million in
2018
. See Item 8. Financial Statements and Supplementary Data – Notes
2
and
3
for additional information on recently adopted accounting standards.
Retail
segment income from operations
increased
$299 million
primarily due to contributions from the Retail operations acquired in the Andeavor acquisition. For locations owned prior to the Andeavor acquisition, increased gasoline and distillate and merchandise margins were more than offset by increased operating expenses.
2017
Compared to
2016
Retail
segment revenues
increased
$747 million
due to an
increase
in fuel sales of $860 million partially offset by a decrease in merchandise sales of $114 million. Average fuel selling prices increased $0.25 per gallon which were partially offset by a decrease in sales volumes in
2017
compared to
2016
. The decreases in fuel sales volumes and merchandise sales are primarily attributable to the contribution of 41 travel centers to PJF Southeast in fourth quarter of 2016.
Retail
segment income from operations decreased $4 million. Segment income in 2016 includes a $25 million non-cash benefit related to the reversal of the Company’s LCM inventory reserve, which was recorded in 2015. Excluding the LCM inventory benefit recognized in 2016, the increase in segment results for 2017 was primarily due to a full year of contributions from Speedway’s travel center joint venture formed in the fourth quarter 2016 and lower operating expense, partially offset by lower merchandise margin and lower gains from asset sales.
72
Midstream
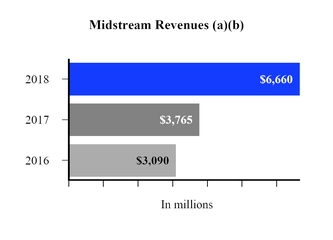
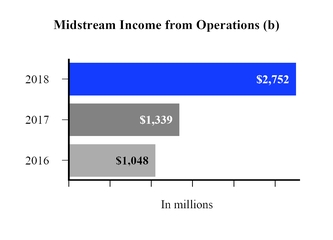
|
(a)
|
We adopted ASC 606 (Revenue from Contracts with Customers), as of January 1, 2018, and elected to report certain taxes on a net basis. We applied the standard using the modified retrospective method, and, therefore, comparative information continues to reflect certain taxes on a gross basis.
|
|
(b)
|
Results related to refining logistics and fuels distribution dropdown into MPLX are presented in the Midstream segment prospectively from February 1, 2018. Prior periods are not adjusted as these entities were not considered a business prior to February 1, 2018.
|
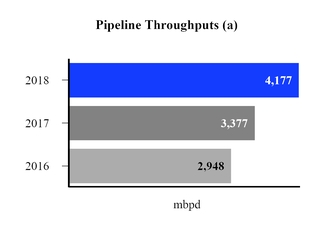
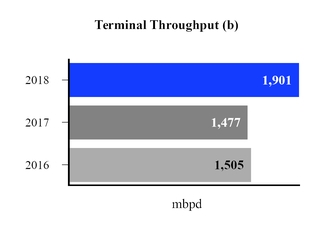
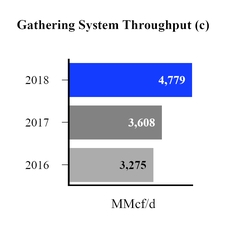
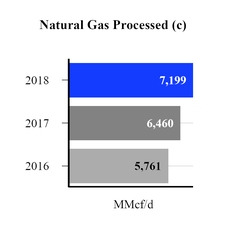
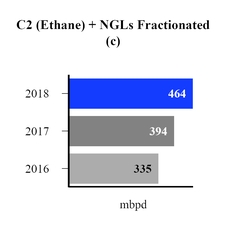
|
(a)
|
On owned common-carrier pipelines, excluding equity method investments.
|
|
(b)
|
Includes the results of the terminal assets beginning on April 1, 2016, the date the assets became a business.
|
|
(c)
|
Includes amounts related to unconsolidated equity method investments on a 100 percent basis.
|
73
|
Benchmark Prices
|
2018
|
2017
|
2016
|
|||||||||
|
Natural Gas NYMEX HH (
$ per MMBtu
)
|
$
|
3.07
|
|
$
|
3.02
|
|
$
|
2.55
|
|
|||
|
C2 + NGL Pricing (
$ per gallon
)
(a)
|
$
|
0.78
|
|
$
|
0.66
|
|
$
|
0.47
|
|
|||
|
(a)
|
C2 + NGL pricing based on Mont Belvieu prices assuming an NGL barrel of approximately 35 percent ethane, 35 percent propane, six percent Iso-Butane, 12 percent normal butane and 12 percent natural gasoline.
|
2018
Compared to
2017
On February 1, 2018, we completed the dropdown of our refining logistics assets and fuels distribution services to MPLX, which is reported in our Midstream segment. Refining logistics contains the integrated tank farm assets that support MPC’s refining operations. Fuels distribution is structured to provide a broad range of scheduling and marketing services as MPC’s agent. These new businesses were reported in the Midstream segment prospectively from February 1, 2018. No effect was given to prior periods as these entities were not considered businesses prior to February 1, 2018.
Midstream
segment revenue and income from operations
increased
$2.90 billion
and
$1.41 billion
, respectively. Revenue increased
$1.94 billion
primarily due to fees charged for fuels distribution and refining logistics services following the February 1, 2018 dropdown to MPLX in addition to services provided by ANDX following the acquisition of Andeavor on October 1, 2018. Revenues also increased by approximately
$502 million
due to ASC 606 gross ups. See Item 8. Financial Statements and Supplementary Data – Note
3
for additional information.
In
2018
, Midstream segment income from operations includes $230 million due to contributions from ANDX and
$874 million
, from the refining logistics assets and fuels distribution services contributed to MPLX on February 1, 2018. Prior period Midstream segment results do not reflect the impact of these new businesses. The incremental $309 million increase in Midstream segment results in
2018
, was driven by record gathered, processed and fractionated volumes and record pipeline throughput volumes for MPLX.
2017
Compared to
2016
Midstream
segment revenue and income from operations increased
$675 million
and
$291 million
, respectively, primarily due to increased revenue from higher natural gas and NGL gathering, processing and fractionation volumes and changes in natural gas and NGL prices. Segment results also benefited from the first quarter 2017 acquisitions of the Ozark pipeline and our ownership interest in the Bakken Pipeline system. The comparison for 2017 and 2016 also reflects the absence of any revenues for the terminal services provided to the Refining & Marketing segment in the first quarter of 2016 versus the inclusion of revenues for these services in the first quarter of 2017. These assets were not considered a business prior to April 1, 2016, and therefore, no financial results for these assets were available from which to recast first quarter 2016 Midstream segment results.
Items not Allocated to Segments
|
Key Financial Information
(in millions)
|
2018
|
2017
|
2016
|
|||||||||
|
Items not allocated to segments:
|
||||||||||||
|
Corporate and other unallocated items
(a)
|
$
|
(502
|
)
|
$
|
(365
|
)
|
$
|
(266
|
)
|
|||
|
Transaction-related costs
|
(197
|
)
|
—
|
|
—
|
|
||||||
|
Litigation
|
—
|
|
(29
|
)
|
—
|
|
||||||
|
Impairment
(b)
|
9
|
|
23
|
|
(486
|
)
|
||||||
|
(a)
|
Corporate and other unallocated items consists primarily of MPC’s corporate administrative expenses and costs related to certain non-operating assets, except for corporate overhead expenses attributable to MPLX and ANDX, which are included in the
Midstream
segment. Corporate overhead expenses are not allocated to the Refining & Marketing and
Retail
segments.
|
|
(b)
|
2018 and 2017 includes MPC’s share of gains from the the sale of assets remaining from the canceled Sandpiper pipeline project. 2016 includes impairments of goodwill and equity method investments. See Item 8. Financial Statements and Supplementary Data – Notes
16
and
17
.
|
2018
Compared to
2017
Corporate and other unallocated expenses
increased
$137 million
in
2018
compared to
2017
largely due to increased costs and expenses for the combined company after the Andeavor acquisition on October 1, 2018.
Other unallocated items in 2018 include $197 million of transaction-related costs for financial advisors, employee severance and other costs associated with the Andeavor acquisition and MPC’s share of gains from the sale of assets remaining from the canceled Sandpiper pipeline project. Other unallocated items in 2017 include an $86 million litigation charge, a litigation benefit of $57 million and a benefit of $23 million related to MPC’s share of gains from the sale of assets remaining from the canceled Sandpiper pipeline project.
74
2017
Compared to
2016
Corporate and other unallocated expenses
increased
$99 million
in
2017
compared to
2016
largely due to higher unallocated corporate costs and increases in employee-related expenses and corporate costs.
Other unallocated items in 2017 include an $86 million litigation charge, a litigation benefit of $57 million and a benefit of $23 million related to MPC’s share of gains from the sale of assets remaining from the canceled Sandpiper pipeline project. Other unallocated items in 2016 include impairment charges of $486 million resulting from non-cash charges of $267 million related to the indefinite deferral of the Sandpiper pipeline project, $130 million related to the goodwill recognized in connection with the MarkWest Merger and $89 million related to an MPLX equity method investment.
Non-GAAP Financial Measures
Management uses certain financial measures to evaluate our operating performance that are calculated and presented on the basis of methodologies other than in accordance with GAAP (“non-GAAP”). We believe these non-GAAP financial measures are useful to investors and analysts to assess our ongoing financial performance because, when reconciled to its most comparable GAAP financial measure, they provide improved comparability between periods through the exclusion of certain items that we believe are not indicative of our core operating performance and that may obscure our underlying business results and trends. These measures should not be considered a substitute for, or superior to, measures of financial performance prepared in accordance with GAAP, and our calculations thereof may not be comparable to similarly titled measures reported by other companies. The non-GAAP financial measures we use are as follows:
Refining & Marketing Margin
Refining margin is defined as sales revenue less the cost of refinery inputs and purchased products and excludes the LCM inventory market adjustment.
|
Reconciliation of Refining & Marketing income from operations to Refining & Marketing margin
(in millions)
|
2018
|
2017
|
2016
|
||||||||||
|
Refining & Marketing income from operations
|
$
|
2,481
|
|
$
|
2,321
|
|
$
|
1,357
|
|
||||
|
Plus (Less):
|
|||||||||||||
|
Refinery direct operating costs
(a)
|
4,801
|
|
4,113
|
|
4,007
|
|
|||||||
|
Refinery depreciation and amortization
|
1,089
|
|
1,013
|
|
994
|
|
|||||||
|
Other:
|
|||||||||||||
|
Operating expenses
(a)(b)
|
3,189
|
|
1,425
|
|
1,475
|
|
|||||||
|
Depreciation and amortization
|
85
|
|
69
|
|
69
|
|
|||||||
|
Inventory market valuation adjustment
|
—
|
|
—
|
|
(345
|
)
|
|||||||
|
Refining & Marketing margin
(c)
|
$
|
11,645
|
|
$
|
8,941
|
|
$
|
7,557
|
|
||||
|
(a)
|
Excludes depreciation and amortization.
|
|
(b)
|
Includes fees paid to MPLX and ANDX for various midstream services. MPLX and ANDX are reported in MPC’s Midstream segment.
|
|
(c)
|
Sales revenue less cost of refinery inputs and purchased products, excluding any LCM inventory market adjustment.
|
Retail Fuel Margin
Retail fuel margin is defined as the price paid by consumers or direct dealers less the cost of refined products, including transportation, consumer excise taxes and bankcard processing fees (where applicable) and excluding any LCM inventory market adjustment.
Retail Merchandise Margin
Retail merchandise margin is defined as the price paid by consumers less the cost of merchandise.
75
|
Reconciliation of Retail income from operations to Retail total margin
(in millions)
|
2018
|
2017
|
2016
|
||||||||||
|
Retail income from operations
|
$
|
1,028
|
|
$
|
729
|
|
$
|
733
|
|
||||
|
Plus (Less):
|
|||||||||||||
|
Operating, selling, general and administrative expenses
(a)
|
1,796
|
|
1,533
|
|
1,555
|
|
|||||||
|
Depreciation and amortization
(a)
|
353
|
|
275
|
|
273
|
|
|||||||
|
Income from equity method investments
|
(74
|
)
|
(69
|
)
|
(5
|
)
|
|||||||
|
Net gain on disposal of assets
|
(17
|
)
|
(14
|
)
|
(30
|
)
|
|||||||
|
Other income
(a)
|
(7
|
)
|
(14
|
)
|
(18
|
)
|
|||||||
|
Inventory market valuation adjustment
|
—
|
|
—
|
|
(25
|
)
|
|||||||
|
Retail total margin
|
$
|
3,079
|
|
$
|
2,440
|
|
$
|
2,483
|
|
||||
|
Retail total margin:
(a)
|
|||||||||||||
|
Fuel margin
(b)
|
$
|
1,547
|
|
$
|
1,008
|
|
$
|
1,009
|
|
||||
|
Merchandise margin
(c)
|
1,486
|
|
1,402
|
|
1,435
|
|
|||||||
|
Other margin
|
46
|
|
30
|
|
39
|
|
|||||||
|
Retail total margin
|
$
|
3,079
|
|
$
|
2,440
|
|
$
|
2,483
|
|
||||
|
(a)
|
2018 and 2017 margins and expenses do not reflect any results from the 41 travel centers contributed to PFJ Southeast, whereas they are reflected in the 2016 information. Our share of the net results from the joint venture is reflected in income from equity method investments.
|
|
(b)
|
The price paid by consumers or direct dealers less the cost of refined products, including transportation, consumer excise taxes and bankcard processing fees (where applicable) and excluding any LCM inventory market adjustment.
|
|
(c)
|
The price paid by the consumers less the cost of merchandise.
|
LIQUIDITY AND CAPITAL RESOURCES
Cash Flows
Our cash and cash equivalents balance was
$1.69 billion
at
December 31, 2018
compared to
$3.01 billion
at
December 31, 2017
. Net cash provided by (used in) operating activities, investing activities and financing activities for the past three years is presented in the following table.
|
(In millions)
|
2018
|
2017
|
2016
|
|||||||||
|
Net cash provided by (used in):
|
||||||||||||
|
Operating activities
|
$
|
6,158
|
|
$
|
6,612
|
|
$
|
4,017
|
|
|||
|
Investing activities
|
(7,670
|
)
|
(3,398
|
)
|
(2,967
|
)
|
||||||
|
Financing activities
|
222
|
|
(1,091
|
)
|
(1,294
|
)
|
||||||
|
Total
|
$
|
(1,290
|
)
|
$
|
2,123
|
|
$
|
(244
|
)
|
|||
Net cash provided by operating activities
decreased
$454 million
in
2018
compared to
2017
, primarily due to
an unfavorable
change in working capital of
$2.28 billion
partially offset by an increase in operating results. Net cash provided by operating activities increased $2.60 billion in 2017 compared to 2016, primarily due to increased operating results and favorable changes in working capital of $1.74 billion compared to 2017. The above changes in working capital exclude changes in short-term debt.
For
2018
, changes in working capital were a net
$340 million
use of cash, primarily due to the effect of decreases in energy commodity prices on working capital. Accounts payable decreased primarily due to lower crude oil payable prices. Inventories decreased primarily due to a decrease in crude and refined product inventories. Current receivables decreased primarily due to lower crude oil receivable prices. All of these effects exclude the working capital acquired in connection with the acquisition of Andeavor.
For 2017, changes in working capital were a net $1.94 billion source of cash, primarily due to the effect of increases in energy commodity prices on working capital. Accounts payable increased primarily due to higher crude oil payable volumes and prices; current receivables increased primarily due to higher crude oil and refined product receivable prices and volumes; and inventories decreased primarily due to lower crude oil inventory volumes.
For 2016, changes in working capital were a net $200 million source of cash, primarily due to the effect of increases in energy commodity prices on working capital. Accounts payable increased primarily due to higher crude oil payable prices; current
76
receivables increased primarily due to higher refined product and crude oil receivable prices; and inventories increased, excluding the change in the Company’s inventory valuation reserve of $370 million, primarily due to higher crude oil and refined product inventory volumes.
Cash flows used in investing activities
increased
$4.27 billion
in
2018
compared to
2017
and increased $431 million in 2017 compared to 2016.
|
•
|
Cash used for additions to property, plant and equipment was primarily due to spending in our Midstream segment. See discussion of capital expenditures and investments under the “Capital Spending” section.
|
|
•
|
Cash used for acquisitions of
$3.82 billion
in
2018
primarily includes cash paid to Andeavor stockholders of
$3.5 billion
in connection with the acquisition of Andeavor on October 1, 2018.
|
|
•
|
Net investments were a use of cash of
$393 million
in
2018
compared to
$743 million
in
2017
and $288 million in 2016. Investments in
2017
primarily include MPLX’s $500 million investment in a partial interest in the Bakken Pipeline system.
|
|
•
|
Cash provided by disposal of assets totaled
$54 million
,
$79 million
and $101 million in
2018
,
2017
and 2016, respectively. Cash provided in 2016 was primarily due to the sale of certain Speedway locations in the normal course of business.
|
The consolidated statements of cash flows exclude changes to the consolidated balance sheets that did not affect cash. A reconciliation of additions to property, plant and equipment to total capital expenditures and investments follows for each of the last three years.
|
(In millions)
|
2018
|
2017
|
2016
|
|||||||||
|
Additions to property, plant and equipment per consolidated statements of cash flows
|
$
|
3,578
|
|
$
|
2,732
|
|
$
|
2,892
|
|
|||
|
Asset retirement expenditures
|
8
|
|
2
|
|
6
|
|
||||||
|
Increase (decrease) in capital accruals
|
309
|
|
67
|
|
(127
|
)
|
||||||
|
Total capital expenditures
|
3,895
|
|
2,801
|
|
2,771
|
|
||||||
|
Investments in equity method investees
(a)
|
409
|
|
305
|
|
288
|
|
||||||
|
Total capital expenditures and investments
|
$
|
4,304
|
|
$
|
3,106
|
|
$
|
3,059
|
|
|||
|
(a)
|
The 2016 amount excludes an adjustment of $143 million to the fair value of equity method investments acquired in connection with the MarkWest Merger.
|
Financing activities were a source of cash of
$222 million
in
2018
and uses of cash of
$1.09 billion
in
2017
and $1.29 billion in 2016.
|
•
|
Long-term debt borrowings and repayments, including debt issuance costs, were a net
$5.36 billion
source
of cash in
2018
compared to a
$2.24 billion
source
of cash in
2017
and a
$1.42 billion
use of cash in
2016
. During 2018, MPLX issued $7.75 billion of senior notes, redeemed $750 million of senior notes, borrowed and repaid $4.1 billion under the MPLX term loan, and borrowed and repaid $1.41 billion and $1.92 billion, respectively, under the MPLX Credit Agreement. In addition, MPC redeemed $600 million of senior notes. During 2017, MPLX issued $2.25 billion of senior notes, borrowed $505 million under the MPLX bank revolving credit agreement, repaid the remaining $250 million under the MPLX term loan agreement and we repaid the remaining $200 million balance under the MPC term loan agreement. During 2016, MPLX used proceeds from its issuance of the MPLX Preferred Units to repay amounts outstanding under the MPLX bank revolving credit facility and MPC chose to prepay $500 million under its term loan. See Item 8. Financial Statements and Supplementary Data – Note
19
for additional information on our long-term debt.
|
|
•
|
Cash used in common stock repurchases totaled
$3.29 billion
in
2018
,
$2.37 billion
in
2017
, and $197 million in 2016 associated with the share repurchase plans authorized by our board of directors. See the “Capital Requirements” section for further discussion of our stock repurchases.
|
|
•
|
Cash used in dividend payments totaled
$954 million
in
2018
,
$773 million
in
2017
and $719 million in 2016. The increase in 2018 was primarily due to an increase in our base dividend in addition to a net increase in the number of shares of our common stock outstanding due to issuances related to the Andeavor acquisition, partially offset by share repurchases. The increase in 2017 was due to an increase in our base dividend, partially offset by a decrease in the number of outstanding shares of our common stock as a result of share repurchases. Dividends per share were
$1.84
in
2018
,
$1.52
in
2017
and $1.36 in 2016.
|
|
•
|
Distributions to noncontrolling interests increased
$209 million
in
2018
compared to
2017
and $152 million in
2017
compared to 2016, primarily due to an increase in MPLX’s distribution per common unit. In
2018
, distributions to
|
77
noncontrolling interests also included ANDX’s distribution per common unit paid in the fourth quarter subsequent to the acquisition of Andeavor on October 1, 2018.
|
•
|
Cash proceeds from the issuance of MPLX common units were $473 million in
2017
and $776 million in 2016. Cash proceeds from the issuance of MPLX Preferred Units was $984 million in 2016. See Item 8. Financial Statements and Supplementary Data – Note
4
for further discussion of MPLX.
|
|
•
|
Cash used in financing activities in
2017
and 2016 included a portion of the payments to the seller of the Galveston Bay refinery under the contingent earnout provisions of the purchase and sale agreement.
|
Derivative Instruments
See Item 7A. Quantitative and Qualitative Disclosures about Market Risk for a discussion of derivative instruments and associated market risk.
Capital Resources
Our liquidity totaled
$8.3 billion
at
December 31, 2018
consisting of:
|
December 31, 2018
|
||||||||||||
|
(In millions)
|
Total Capacity
|
Outstanding Borrowings
|
Available
Capacity
|
|||||||||
|
Bank revolving credit facility
(a)
|
$
|
5,000
|
|
$
|
32
|
|
$
|
4,968
|
|
|||
|
364 day bank revolving credit facility
|
1,000
|
|
—
|
|
1,000
|
|
||||||
|
Trade receivables facility
|
750
|
|
—
|
|
750
|
|
||||||
|
Total
|
$
|
6,750
|
|
$
|
32
|
|
$
|
6,718
|
|
|||
|
Cash and cash equivalents
(b)
|
1,609
|
|
||||||||||
|
Total liquidity
|
$
|
8,327
|
|
|||||||||
|
(a)
|
Outstanding borrowings include
$32 million
in letters of credit outstanding under this facility. Excludes MPLX’s
$2.25 billion
bank revolving credit facility, which had no borrowings and
$3 million
of letters of credit outstanding as of
December 31, 2018
and ANDX’s $2.10 billion bank revolving credit facilities, which had
$1.25 billion
outstanding as of
December 31, 2018
.
|
|
(b)
|
Excludes
$68 million
and
$10 million
of MPLX and ANDX cash and cash equivalents, respectively.
|
Because of the alternatives available to us, including internally generated cash flow and access to capital markets, including a commercial paper program, we believe that our short-term and long-term liquidity is adequate to fund not only our current operations, but also our near-term and long-term funding requirements, including capital spending programs, the repurchase of shares of our common stock, dividend payments, defined benefit plan contributions, repayment of debt maturities and other amounts that may ultimately be paid in connection with contingencies.
On November 15, 2018, MPLX issued
$2.25 billion
in aggregate principal amount of senior notes in a public offering, consisting of
$750 million
aggregate principal amount of
4.800 percent
unsecured senior notes due February 2029 and
$1.5 billion
aggregate principal amount of
5.500 percent
unsecured senior notes due February 2049. On December 10, 2018, a portion of the net proceeds from the offering was used to redeem the
$750 million
in aggregate principal amount of
5.500 percent
unsecured notes due February 2023 issued by MPLX and MarkWest. These notes were redeemed at
101.833 percent
of the principal amount, plus the write off of unamortized deferred financing costs, resulting in a loss on extinguishment of debt of
$60 million
. The remaining net proceeds have or will be used to repay borrowings under MPLX’s revolving credit facility and intercompany loan agreement with MPC and for general partnership purposes.
On February 8, 2018, MPLX issued
$5.5 billion
in aggregate principal amount of senior notes in a public offering, consisting of
$500 million
aggregate principal amount of
3.375 percent
unsecured senior notes due March 2023,
$1.25 billion
aggregate principal amount of
4.000 percent
unsecured senior notes due March 2028,
$1.75 billion
aggregate principal amount of
4.500 percent
unsecured senior notes due April 2038,
$1.5 billion
aggregate principal amount of
4.700 percent
unsecured senior notes due April 2048, and
$500 million
aggregate principal amount of
4.900 percent
unsecured senior notes due April 2058. On February 8, 2018,
$4.1 billion
of the net proceeds were used to repay the 364-day term-loan facility, which was used to finance the cash portion of the consideration for the dropdown of refining logistics assets and distribution services to MPLX. The remaining proceeds were used to repay outstanding borrowings under MPLX’s revolving credit facility and intercompany loan agreement with MPC and for general partnership purposes.
78
Commercial Paper
– We established a commercial paper program that allows us to have a maximum of
$2 billion
in commercial paper outstanding, with maturities up to
397
days from the date of issuance. We do not intend to have outstanding commercial paper borrowings in excess of available capacity under our bank revolving credit facilities. At
December 31, 2018
, we had
no
amounts outstanding under the commercial paper program.
MPC Bank Revolving Credit Facilities
– On August 28, 2018, in connection with the Andeavor acquisition, we entered into credit agreements with a syndicate of lenders to replace MPC’s previous five-year
$2.5 billion
bank revolving credit facility due in 2022 and our previous 364-day
$1 billion
bank revolving agreement that expired in July 2018. The new credit agreements, which became effective October 1, 2018, provide for a
$5 billion
five
-year revolving credit facility that expires in 2023 and a
$1 billion
364
-day revolving credit facility that expires in 2019. The financial covenants and the interest rate terms contained in the new credit agreements are substantially the same as those contained in the previous bank revolving credit facilities. There were no borrowings and approximately
$32 million
of letters of credit outstanding under these facilities at
December 31, 2018
.
Trade receivables facility
– Our trade receivables facility has a borrowing capacity of
$750 million
(depending on the amount of our eligible domestic trade accounts receivable) and a maturity date of
July 19, 2019
. As of
December 31, 2018
, eligible trade receivables supported borrowings of
$750 million
. There were
no
borrowings outstanding at
December 31, 2018
. Availability under our trade receivables facility is primarily a function of refined product selling prices.
MPLX Credit Agreement
– On July 21, 2017, MPLX entered into a credit agreement with a syndicate of lenders to replace the existing
$2 billion
five
-year bank revolving credit facility with a
$2.25 billion
five
-year bank revolving credit facility with a maturity date of
July 2022
(“MPLX credit agreement”). At
December 31, 2018
, MPLX had
no
outstanding borrowings and
$3 million
of letters of credit outstanding under the bank revolving credit facility, resulting in total unused loan availability of approximately
$2.25 billion
.
ANDX credit agreements
- Through the Andeavor acquisition on October 1, 2018, we acquired the general partner and 156 million units of ANDX. ANDX is party to a
$1.1 billion
revolving credit agreement and a
$1.0 billion
dropdown credit agreement both of which expire in January 2021 (together, the “ANDX credit agreements”). As of
December 31, 2018
, ANDX had approximately
$1.25 billion
outstanding borrowings under the ANDX credit agreements, resulting in total unused loan availability of
$855 million
.
See Item 8. Financial Statements and Supplementary Data – Note
19
for further discussion of our debt.
The MPC credit agreements contain representations and warranties, affirmative and negative covenants and events of default that we consider usual and customary for agreements of these types. The financial covenant included in the MPC credit agreements requires us to maintain, as of the last day of each fiscal quarter, a ratio of Consolidated Net Debt to Total Capitalization (as defined in the MPC credit agreements) of no greater than 0.65 to 1.00. Other covenants restrict us and/or certain of our subsidiaries from incurring debt, creating liens on assets and entering into transactions with affiliates. As of
December 31, 2018
, we were in compliance with the covenants contained in the MPC credit agreements, including a ratio of Consolidated Net Debt to Total Capitalization of
0.19
to 1.00, as well as the other covenants contained in the MPC credit agreements.
The MPLX credit agreement contains certain representations and warranties, affirmative and restrictive covenants and events of default that we consider to be usual and customary for an agreement of this type. The MPLX credit agreement includes a financial covenant that requires MPLX to maintain a ratio of Consolidated Total Debt as of the end of each fiscal quarter to Consolidated EBITDA (both as defined in the MPLX credit agreement) for the prior
four
fiscal quarters of no greater than
5.0
to 1.0 (or
5.5
to 1.0 for up to two fiscal quarters following certain acquisitions). Consolidated EBITDA is subject to adjustments for certain acquisitions completed and capital projects undertaken during the relevant period. Other covenants restrict MPLX and/or certain of its subsidiaries from incurring debt, creating liens on assets and entering into transactions with affiliates. As of
December 31, 2018
, MPLX was in compliance with the covenants contained in the MPLX credit agreement, including a ratio of Consolidated Total Debt to Consolidated EBITDA of
3.80
to 1.0.
The ANDX credit agreements contain certain representations and warranties, affirmative and restrictive covenants and events of default that we consider to be usual and customary for an agreement of this type, including a financial covenant that requires ANDX to maintain a Consolidated Leverage Ratio (as defined in the ANDX credit agreements) for the prior four fiscal quarters of no greater than
5.0
to 1.0 for the prior four fiscal quarters (or
5.5
to 1.0 for up to two fiscal quarters following certain acquisitions). Consolidated EBITDA used to calculate the Consolidated Leverage Ratio is subject to adjustments for certain acquisitions completed and capital projects undertaken during the relevant period. The covenants also restrict, among other things, ANDX’s ability and/or the ability of certain of its subsidiaries to incur debt, create liens on assets and enter into transactions with affiliates. As of
December 31, 2018
, ANDX was in compliance with the covenants contained in the ANDX credit agreements, including a Consolidated Leverage Ratio of
3.72
to 1.0.
79
As disclosed in Item 8. Financial Statements and Supplementary Data – Note
3
to our audited consolidated financial statements, we expect the adoption of the lease accounting standard update to result in the recognition of a significant lease obligation. The MPC bank revolving credit facility, the MPLX credit agreement and the ANDX credit agreements contain provisions under which the effects of the new accounting standard are not recognized for purposes of financial covenant calculations.
Our intention is to maintain an investment-grade credit profile. As of February 1, 2019, the credit ratings on our, MPLX’s and ANDX’s senior unsecured debt are as follows.
|
Company
|
Rating Agency
|
Rating
|
|
MPC
|
Moody’s
|
Baa2 (stable outlook)
|
|
Standard & Poor’s
|
BBB (stable outlook)
|
|
|
Fitch
|
BBB (stable outlook)
|
|
|
MPLX
|
Moody’s
|
Baa3 (stable outlook)
|
|
Standard & Poor’s
|
BBB (stable outlook)
|
|
|
Fitch
|
BBB- (positive outlook)
|
|
|
ANDX
|
Moody’s
|
Ba1 (review for upgrade)
|
|
Standard & Poor’s
|
BBB- (positive watch)
|
|
|
Fitch
|
BBB- (stable outlook)
|
|
The ratings reflect the respective views of the rating agencies. Although it is our intention to maintain a credit profile that supports an investment-grade rating, there is no assurance that these ratings will continue for any given period of time. The ratings may be revised or withdrawn entirely by the rating agencies if, in their respective judgments, circumstances so warrant.
None of the MPC credit agreements, the MPLX credit agreement, the ANDX credit agreements or our trade receivables facility contains credit rating triggers that would result in the acceleration of interest, principal or other payments in the event that our credit ratings are downgraded. However, any downgrades of our senior unsecured debt could increase the applicable interest rates, yields and other fees payable under such agreements. In addition, a downgrade of our senior unsecured debt rating to below investment-grade levels could, under certain circumstances, decrease the amount of trade receivables that are eligible to be sold under our trade receivables facility, impact our ability to purchase crude oil on an unsecured basis and could result in us having to post letters of credit under existing transportation services or other agreements.
Capital Requirements
For information about our capital expenditures and investments, see the “Capital Spending” section.
In
2018
, we made pension contributions totaling
$115 million
. We have no required funding for
2019
, but may make voluntary contributions at our discretion.
On
January 28, 2019
, we announced our board of directors approved a
$0.53
per share dividend, payable
March 11, 2019
to shareholders of record at the close of business on
February 20, 2019
.
We may, from time to time, repurchase notes in the open market, in privately-negotiated transactions or otherwise in such volumes, at such prices and upon such other terms as we deem appropriate.
Share Repurchases
Since January 1, 2012, our board of directors has approved
$18.0 billion
in total share repurchase authorizations and we have repurchased a total of
$13.10 billion
of our common stock, leaving
$4.9 billion
available for repurchases as of
December 31, 2018
. Under these authorizations, we have acquired
293 million
shares at an average cost per share of
$44.60
. As part of our strategic actions to enhance shareholder value, for the year ended
December 31, 2018
, cash proceeds received from dropdowns to MPLX during the year were used in part to repurchase
$3.29 billion
of our common stock. The table below summarizes our total share repurchases. See Item 8. Financial Statements and Supplementary Data – Note
9
for further discussion of the share repurchase plans.
|
(In millions, except per share data)
|
2018
|
2017
|
2016
|
||||||||
|
Number of shares repurchased
|
47
|
|
44
|
|
4
|
|
|||||
|
Cash paid for shares repurchased
|
$
|
3,287
|
|
$
|
2,372
|
|
$
|
197
|
|
||
|
Average cost per share
|
$
|
69.46
|
|
$
|
53.85
|
|
$
|
41.84
|
|
||
80
We may utilize various methods to effect the repurchases, which could include open market repurchases, negotiated block transactions, accelerated share repurchases or open market solicitations for shares, some of which may be effected through Rule 10b5-1 plans. The timing and amount of future repurchases, if any, will depend upon several factors, including market and business conditions, and such repurchases may be discontinued at any time.
Contractual Cash Obligations
The table below provides aggregated information on our consolidated obligations to make future payments under existing contracts as of
December 31, 2018
. The contractual obligations detailed below do not include our contractual obligations to MPLX and ANDX under various fee-based commercial agreements as these transactions are eliminated in the consolidated financial statements.
|
(In millions)
|
Total
|
2019
|
2020-2021
|
2022-2023
|
Later Years
|
|||||||||||||||
|
Long-term debt
(a)
|
$
|
44,673
|
|
$
|
1,790
|
|
$
|
4,128
|
|
$
|
5,865
|
|
$
|
32,890
|
|
|||||
|
Capital lease obligations
(b)
|
897
|
|
65
|
|
127
|
|
148
|
|
557
|
|
||||||||||
|
Operating lease obligations
|
3,423
|
|
709
|
|
1,172
|
|
684
|
|
858
|
|
||||||||||
|
Purchase obligations:
(c)
|
||||||||||||||||||||
|
Crude oil, feedstock, refined product and renewable fuel contracts
(d)
|
10,306
|
|
8,881
|
|
1,115
|
|
196
|
|
114
|
|
||||||||||
|
Transportation and related contracts
|
2,556
|
|
550
|
|
760
|
|
661
|
|
585
|
|
||||||||||
|
Contracts to acquire property, plant and equipment
|
1,825
|
|
1,794
|
|
31
|
|
—
|
|
—
|
|
||||||||||
|
Service, materials and other contracts
(e)
|
3,361
|
|
948
|
|
1,009
|
|
574
|
|
830
|
|
||||||||||
|
Total purchase obligations
|
18,048
|
|
12,173
|
|
2,915
|
|
1,431
|
|
1,529
|
|
||||||||||
|
Other long-term liabilities reported in the consolidated balance sheet
(f)
|
2,734
|
|
297
|
|
587
|
|
531
|
|
1,319
|
|
||||||||||
|
Total contractual cash obligations
|
$
|
69,775
|
|
$
|
15,034
|
|
$
|
8,929
|
|
$
|
8,659
|
|
$
|
37,153
|
|
|||||
|
(a)
|
Includes interest payments of $18.42 billion for our senior notes, the MPLX senior notes and the ANDX senior notes in addition to interest on the MPLX credit agreement and ANDX credit agreements, commitment and administrative fees for our credit agreement, the MPLX credit agreement, the ANDX credit agreements and our trade receivables facility.
|
|
(b)
|
Capital lease obligations represent future minimum payments.
|
|
(c)
|
Includes both short- and long-term purchases obligations.
|
|
(d)
|
These contracts include variable price arrangements. For purposes of this disclosure we have estimated prices to be paid primarily based on futures curves for the commodities to the extent available.
|
|
(e)
|
Primarily includes contracts to purchase services such as utilities, supplies and various other maintenance and operating services.
|
|
(f)
|
Primarily includes obligations for pension and other postretirement benefits including medical and life insurance, which we have estimated through
2028
. See Item 8. Financial Statements and Supplementary Data – Note
22
.
|
Capital Spending
The 2019 capital investment plan for MPC, MPLX and ANDX and capital expenditures and investments for each of the last three years are summarized by segment below. MPC’s capital investment plan for
2019
totals approximately
$2.8 billion
for capital projects and investments, excluding MPLX, ANDX, capitalized interest and acquisitions. MPC’s 2019 capital investment plan includes all of the planned capital spending for Refining & Marketing, Retail and Corporate as well as a portion of the planned capital investments in Midstream. The remainder of the planned capital spending for Midstream reflects the capital investment plans for MPLX and ANDX. We continuously evaluate our capital plan and make changes as conditions warrant.
|
(In millions)
|
2019 Plan
|
2018
|
2017
|
2016
|
||||||||||||
|
Capital expenditures and investments:
(a)
|
||||||||||||||||
|
Refining & Marketing
|
$
|
1,750
|
|
$
|
1,057
|
|
$
|
832
|
|
$
|
1,054
|
|
||||
|
Retail
|
500
|
|
460
|
|
381
|
|
303
|
|
||||||||
|
Midstream
|
3,600
|
|
2,630
|
|
1,755
|
|
1,558
|
|
||||||||
|
Corporate and Other
(b)
|
60
|
|
157
|
|
138
|
|
144
|
|
||||||||
|
Total
|
$
|
5,910
|
|
$
|
4,304
|
|
$
|
3,106
|
|
$
|
3,059
|
|
||||
|
(a)
|
Capital expenditures include changes in capital accruals.
|
|
(b)
|
Includes capitalized interest of
$80 million
,
$55 million
and
$63 million
for
2018
,
2017
and
2016
, respectively. The 2019 capital investment plan excludes capitalized interest.
|
81
Refining & Marketing
The Refining & Marketing segment’s forecasted
2019
capital spending and investments is approximately
$1.8 billion
. This amount includes approximately
$1.02 billion
of growth capital focused on refinery optimization, production of higher value products, increased capacity to upgrade residual fuel oil and expanded export capacity. Investing to enhance margins, we will continue our disciplined high-return investments in resid upgrading capacity and the ability to produce more diesel. We also plan to continue investing in domestic light products supply placement flexibility, as well as increasing our export capacity. Sustaining capital is approximately
$730 million
, which includes approximately $260 million related to regulatory spending for Tier 3 gasoline.
Major capital projects completed over the last three years have prepared us to increase our diesel production, process light crude oil, increase our export capabilities and meet the upcoming transportation fuel regulatory mandate (Tier 3 fuel standards). In addition, the STAR investment project intended to transform our Galveston Bay refinery into a world-class refining complex is progressing according to plan and is scheduled to complete in 2022.
Retail
The
Retail
segment’s
2019
capital forecast of approximately
$500 million
is focused on conversion of recently acquired locations to the Speedway brand and systems, growth in existing and new markets, dealer sites, commercial fueling/diesel expansion, food service through store remodels and high quality acquisitions.
Major capital projects over the last three years included building new store locations, remodeling and rebuilding existing locations in core markets and building out our network of commercial fueling lane locations to capitalize on diesel demand growth. We also invested in the conversion, remodel and maintenance of stores acquired in 2014.
Midstream
MPLX’s capital investment plan includes
$2.2 billion
of organic growth capital and approximately
$200 million
of maintenance capital.This growth plan includes the addition of approximately 765 million cubic feet per day of processing capacity at five gas processing plants, two in the Marcellus basin and three in the Southwest, which expands MPLX’s processing capacity in the Permian Basin and the STACK shale play of Oklahoma. The growth plan also includes the addition of approximately 100 mbpd of fractionation capacity in the Marcellus and Utica basins, continued expansion of MPLX’s marine fleet and other projects including the Permian long-haul crude oil, natural gas and NGL pipelines as well as export facility projects which will further enhance our full value chain capture.
Major capital projects over the last three years included investments for the development of natural gas and gas liquids infrastructure to support MPLX’s producer customers, primarily in the Marcellus and Utica shale regions, development of various crude oil and refined petroleum products infrastructure projects, including a build-out of Utica Shale infrastructure in connection with the Cornerstone Pipeline, a butane cavern in Robinson, Illinois, and a tank farm expansion in Texas City, Texas.
ANDX’s capital investment plan includes
$600 million
of organic growth capital and approximately
$100 million
of maintenance capital. The growth plan includes the construction of additional crude storage capacity for unloading of marine vessels, the construction of a crude gathering system to provide connectivity to multiple long-haul pipelines and a pipeline interconnect project designed to provide direct connectivity between certain MPC refineries.
The remaining
Midstream
segment’s forecasted
2019
capital spend, excluding MPLX and ANDX, is approximately
$500 million
which primarily relates to investments in equity affiliate pipelines, including our expected investments in the Gray Oak Pipeline, a new pipeline spanning from the West Texas Permian Basin to the Gulf Coast which is expected to be in service by the end of 2019.
Corporate and Other
The
2019
capital forecast includes approximately
$60 million
to support corporate activities. Major projects over the last three years included an expansion project for our corporate headquarters and upgrades to information technology systems.
Off-Balance Sheet Arrangements
Off-balance sheet arrangements comprise those arrangements that may potentially impact our liquidity, capital resources and results of operations, even though such arrangements are not recorded as liabilities under accounting principles generally accepted in the United States. Our off-balance sheet arrangements are limited to indemnities and guarantees that are described below. Although these arrangements serve a variety of our business purposes, we are not dependent on them to maintain our liquidity and capital resources, and we are not aware of any circumstances that are reasonably likely to cause the off-balance sheet arrangements to have a material adverse effect on liquidity and capital resources.
82
We have provided various guarantees related to equity method investees. In conjunction with the Spinoff, we entered into various indemnities and guarantees to Marathon Oil. These arrangements are described in Item 8. Financial Statements and Supplementary Data – Note
25
.
TRANSACTIONS WITH RELATED PARTIES
We believe that transactions with related parties were conducted on terms comparable to those with unaffiliated parties. See Item 8. Financial Statements and Supplementary Data – Note
7
for discussion of activity with related parties.
ENVIRONMENTAL MATTERS AND COMPLIANCE COSTS
We have incurred and may continue to incur substantial capital, operating and maintenance, and remediation expenditures as a result of environmental laws and regulations. If these expenditures, as with all costs, are not ultimately reflected in the prices of our products and services, our operating results will be adversely affected. We believe that substantially all of our competitors must comply with similar environmental laws and regulations. However, the specific impact on each competitor may vary depending on a number of factors, including the age and location of its operating facilities, marketing areas, production processes and whether it is also engaged in the petrochemical business or the marine transportation of crude oil and refined products.
Legislation and regulations pertaining to fuel specifications, climate change and greenhouse gas emissions have the potential to materially adversely impact our business, financial condition, results of operations and cash flows, including costs of compliance and permitting delays. The extent and magnitude of these adverse impacts cannot be reliably or accurately estimated at this time because specific regulatory and legislative requirements have not been finalized and uncertainty exists with respect to the measures being considered, the costs and the time frames for compliance, and our ability to pass compliance costs on to our customers. For additional information see Item 1A. Risk Factors.
Our environmental expenditures, including non-regulatory expenditures, for each of the last three years were:
|
(In millions)
|
2018
|
2017
|
2016
|
|||||||||
|
Capital
|
$
|
380
|
|
$
|
343
|
|
$
|
302
|
|
|||
|
Compliance:
(a)
|
||||||||||||
|
Operating and maintenance
|
525
|
|
413
|
|
541
|
|
||||||
|
Remediation
(b)
|
52
|
|
36
|
|
40
|
|
||||||
|
Total
|
$
|
957
|
|
$
|
792
|
|
$
|
883
|
|
|||
|
(a)
|
Based on the American Petroleum Institute’s definition of environmental expenditures.
|
|
(b)
|
These amounts include spending charged against remediation reserves, where permissible, but exclude non-cash provisions recorded for environmental remediation.
|
We accrue for environmental remediation activities when the responsibility to remediate is probable and the amount of associated costs can be reasonably estimated. As environmental remediation matters proceed toward ultimate resolution or as additional remediation obligations arise, charges in excess of those previously accrued may be required.
New or expanded environmental requirements, which could increase our environmental costs, may arise in the future. We believe we comply with all legal requirements regarding the environment, but since not all of them are fixed or presently determinable (even under existing legislation) and may be affected by future legislation or regulations, it is not possible to predict all of the ultimate costs of compliance, including remediation costs that may be incurred and penalties that may be imposed.
Our environmental capital expenditures accounted for
ten
percent,
twelve
percent and
eleven
percent of capital expenditures, for
2018
,
2017
and
2016
, respectively, excluding acquisitions. Our environmental capital expenditures are expected to approximate
$420 million
, or
7 percent
, of total planned capital expenditures in
2019
. Actual expenditures may vary as the number and scope of environmental projects are revised as a result of improved technology or changes in regulatory requirements and could increase if additional projects are identified or additional requirements are imposed. The amount of expenditures in
2019
is also dependent upon the resolution of the matters described in Item 3. Legal Proceedings, which may require us to complete additional projects and increase our actual environmental capital and operating expenditures.
For more information on environmental regulations that impact us, or could impact us, see Item 1. Business
–
Environmental Matters, Item 1A. Risk Factors and Item 3. Legal Proceedings.
83
CRITICAL ACCOUNTING ESTIMATES
The preparation of financial statements in accordance with GAAP requires us to make estimates and assumptions that affect the reported amounts of assets and liabilities and the disclosure of contingent assets and liabilities as of the date of the consolidated financial statements and the reported amounts of revenues and expenses during the respective reporting periods. Accounting estimates are considered to be critical if (1) the nature of the estimates and assumptions is material due to the levels of subjectivity and judgment necessary to account for highly uncertain matters or the susceptibility of such matters to change; and (2) the impact of the estimates and assumptions on financial condition or operating performance is material. Actual results could differ from the estimates and assumptions used.
Fair Value Estimates
Fair value is the price that would be received to sell an asset or paid to transfer a liability in an orderly transaction between market participants at the measurement date. There are three approaches for measuring the fair value of assets and liabilities: the market approach, the income approach and the cost approach, each of which includes multiple valuation techniques. The market approach uses prices and other relevant information generated by market transactions involving identical or comparable assets or liabilities. The income approach uses valuation techniques to measure fair value by converting future amounts, such as cash flows or earnings, into a single present value amount using current market expectations about those future amounts. The cost approach is based on the amount that would currently be required to replace the service capacity of an asset. This is often referred to as current replacement cost. The cost approach assumes that the fair value would not exceed what it would cost a market participant to acquire or construct a substitute asset of comparable utility, adjusted for obsolescence.
The fair value accounting standards do not prescribe which valuation technique should be used when measuring fair value and does not prioritize among the techniques. These standards establish a fair value hierarchy that prioritizes the inputs used in applying the various valuation techniques. Inputs broadly refer to the assumptions that market participants use to make pricing decisions, including assumptions about risk. Level 1 inputs are given the highest priority in the fair value hierarchy while Level 3 inputs are given the lowest priority. The three levels of the fair value hierarchy are as follows:
|
•
|
Level 1 – Observable inputs that reflect unadjusted quoted prices for identical assets or liabilities in active markets as of the measurement date. Active markets are those in which transactions for the asset or liability occur in sufficient frequency and volume to provide pricing information on an ongoing basis.
|
|
•
|
Level 2 – Observable market-based inputs or unobservable inputs that are corroborated by market data. These are inputs other than quoted prices in active markets included in Level 1, which are either directly or indirectly observable as of the measurement date.
|
|
•
|
Level 3 – Unobservable inputs that are not corroborated by market data and may be used with internally developed methodologies that result in management’s best estimate of fair value.
|
Valuation techniques that maximize the use of observable inputs are favored. Assets and liabilities are classified in their entirety based on the lowest priority level of input that is significant to the fair value measurement. The assessment of the significance of a particular input to the fair value measurement requires judgment and may affect the placement of assets and liabilities within the levels of the fair value hierarchy. We use an income or market approach for recurring fair value measurements and endeavor to use the best information available. See Item 8. Financial Statements and Supplementary Data – Note
17
for disclosures regarding our fair value measurements.
Significant uses of fair value measurements include:
|
•
|
assessment of impairment of long-lived assets;
|
|
•
|
assessment of impairment of intangible assets:
|
|
•
|
assessment of impairment of goodwill;
|
|
•
|
assessment of impairment of equity method investments;
|
|
•
|
recorded values for assets acquired and liabilities assumed in connection with acquisitions; and
|
|
•
|
recorded values of derivative instruments.
|
84
Impairment Assessments of Long-Lived Assets, Intangible Assets, Goodwill and Equity Method Investments
Fair value calculated for the purpose of testing our long-lived assets, intangible assets, goodwill and equity method investments for impairment is estimated using the expected present value of future cash flows method and comparative market prices when appropriate. Significant judgment is involved in performing these fair value estimates since the results are based on forecasted financial information prepared using significant assumptions including:
|
•
|
Future margins on products produced and sold
. Our estimates of future product margins are based on our analysis of various supply and demand factors, which include, among other things, industry-wide capacity, our planned utilization rate, end-user demand, capital expenditures and economic conditions. Such estimates are consistent with those used in our planning and capital investment reviews.
|
|
•
|
Future volumes.
Our estimates of future refinery, retail, pipeline throughput and natural gas and NGL processing volumes are based on internal forecasts prepared by our Refining & Marketing,
Retail
and
Midstream
segments operations personnel.
|
|
•
|
Discount rate commensurate with the risks involved
. We apply a discount rate to our cash flows based on a variety of factors, including market and economic conditions, operational risk, regulatory risk and political risk. This discount rate is also compared to recent observable market transactions, if possible. A higher discount rate decreases the net present value of cash flows.
|
|
•
|
Future capital requirements
. These are based on authorized spending and internal forecasts.
|
We base our fair value estimates on projected financial information which we believe to be reasonable. However, actual results may differ materially from these projections.
The need to test for impairment can be based on several indicators, including a significant reduction in prices of or demand for products produced, a poor outlook for profitability, a significant reduction in pipeline throughput volumes, a significant reduction in natural gas or NGLs processed, a significant reduction in refining or retail fuel margins, other changes to contracts or changes in the regulatory environment.
Long-lived assets used in operations are assessed for impairment whenever changes in facts and circumstances indicate that the carrying value of the assets may not be recoverable based on the expected undiscounted future cash flow of an asset group. For purposes of impairment evaluation, long-lived assets must be grouped at the lowest level for which independent cash flows can be identified, which generally is the refinery and associated distribution system level for Refining & Marketing segment assets, company-owned convenience store locations for
Retail
segment assets, and the plant level or pipeline system level for
Midstream
segment assets. If the sum of the undiscounted estimated pretax cash flows is less than the carrying value of an asset group, fair value is calculated, and the carrying value is written down if greater than the calculated fair value.
Unlike long-lived assets, goodwill is subject to annual, or more frequent if necessary, impairment testing. At
December 31, 2018
, we had a total of
$20.18 billion
of goodwill recorded on our consolidated balance sheet, including $16.31 billion that was preliminarily recognized as a result of the Andeavor acquisition and remains subject to finalization within one year of the October 1, 2018 acquisition date.
For the reporting units included in our annual impairment testing for 2018, the analysis resulted in the fair value of the reporting units exceeding their carrying value by percentages ranging from approximately 14 percent to 4,608 percent. The reporting unit with fair value exceeding its carrying value by approximately 14 percent has goodwill of $228 million at
December 31, 2018
. An increase of one percentage to the discount rate used to estimate the fair value of the reporting units would not have resulted in a goodwill impairment charge as of November 30, 2018. Significant assumptions used to estimate the reporting units’ fair value included estimates of future cash flows. If estimates for future cash flows, which are impacted by commodity prices and producers’ production plans, were to decline, the overall reporting units’ fair value would decrease, resulting in potential goodwill impairment charges. Fair value determinations require considerable judgment and are sensitive to changes in underlying assumptions and factors. As a result, there can be no assurance that the estimates and assumptions made for purposes of the impairment tests will prove to be an accurate prediction of the future.
Equity method investments are assessed for impairment whenever factors indicate an other than temporary loss in value. Factors providing evidence of such a loss include the fair value of an investment that is less than its carrying value, absence of an ability to recover the carrying value or the investee’s inability to generate income sufficient to justify our carrying value. At
December 31, 2018
, we had
$5.90 billion
of investments in equity method investments recorded on our consolidated balance sheet.
An estimate of the sensitivity to net income resulting from impairment calculations is not practicable, given the numerous assumptions (e.g., pricing, volumes and discount rates) that can materially affect our estimates. That is, unfavorable adjustments to some of the above listed assumptions may be offset by favorable adjustments in other assumptions.
85
See Item 8. Financial Statements and Supplementary Data – Note
14
for additional information on our equity method investments. See Item 8. Financial Statements and Supplementary Data – Note
16
for additional information on our goodwill and intangibles.
Acquisitions
In accounting for business combinations, acquired assets, assumed liabilities and contingent consideration are recorded based on estimated fair values as of the date of acquisition. The excess or shortfall of the purchase price when compared to the fair value of the net tangible and identifiable intangible assets acquired, if any, is recorded as goodwill or a bargain purchase gain, respectively. A significant amount of judgment is involved in estimating the individual fair values of property, plant and equipment, intangible assets, contingent consideration and other assets and liabilities. We use all available information to make these fair value determinations and, for certain acquisitions, engage third-party consultants for valuation assistance.
The fair value of assets and liabilities, including contingent consideration, as of the acquisition date are often estimated using a combination of approaches, including the income approach, which requires us to project future cash flows and apply an appropriate discount rate; the cost approach, which requires estimates of replacement costs and depreciation and obsolescence estimates; and the market approach which uses market data and adjusts for entity-specific differences. The estimates used in determining fair values are based on assumptions believed to be reasonable but which are inherently uncertain. Accordingly, actual results may differ materially from the projected results used to determine fair value.
See Item 8. Financial Statements and Supplementary Data – Note
5
for additional information on our acquisitions. See Item 8. Financial Statements and Supplementary Data – Note
17
for additional information on fair value measurements.
Derivatives
We record all derivative instruments at fair value. Substantially all of our commodity derivatives are cleared through exchanges which provide active trading information for identical derivatives and do not require any assumptions in arriving at fair value. Fair value estimation for all our derivative instruments is discussed in Item 8. Financial Statements and Supplementary Data – Note
17
. Additional information about derivatives and their valuation may be found in Item 7A. Quantitative and Qualitative Disclosures about Market Risk.
Variable Interest Entities
We evaluate all legal entities in which we hold an ownership or other pecuniary interest to determine if the entity is a VIE. Our interests in a VIE are referred to as variable interests. Variable interests can be contractual, ownership or other pecuniary interests in an entity that change with changes in the fair value of the VIE’s assets. When we conclude that we hold an interest in a VIE we must determine if we are the entity’s primary beneficiary. A primary beneficiary is deemed to have a controlling financial interest in a VIE. This controlling financial interest is evidenced by both (a) the power to direct the activities of the VIE that most significantly impact the VIE’s economic performance and (b) the obligation to absorb losses that could potentially be significant to the VIE or the right to receive benefits that could potentially be significant to the VIE. We consolidate any VIE when we determine that we are the primary beneficiary. We must disclose the nature of any interests in a VIE that is not consolidated.
Significant judgment is exercised in determining that a legal entity is a VIE and in evaluating our interest in a VIE. We use primarily a qualitative analysis to determine if an entity is a VIE. We evaluate the entity’s need for continuing financial support; the equity holder’s lack of a controlling financial interest; and/or if an equity holder’s voting interests are disproportionate to its obligation to absorb expected losses or receive residual returns. We evaluate our interests in a VIE to determine whether we are the primary beneficiary. We use a primarily qualitative analysis to determine if we are deemed to have a controlling financial interest in the VIE, either on a standalone basis or as part of a related party group. We continually monitor our interests in legal entities for changes in the design or activities of an entity and changes in our interests, including our status as the primary beneficiary to determine if the changes require us to revise our previous conclusions.
Changes in the design or nature of the activities of a VIE, or our involvement with a VIE, may require us to reconsider our conclusions on the entity’s status as a VIE and/or our status as the primary beneficiary. Such reconsideration requires significant judgment and understanding of the organization. This could result in the deconsolidation or consolidation of the affected subsidiary, which would have a significant impact on our financial statements.
Variable Interest Entities are discussed in Item 8. Financial Statements and Supplementary Data – Note
6
.
Pension and Other Postretirement Benefit Obligations
Accounting for pension and other postretirement benefit obligations involves numerous assumptions, the most significant of which relate to the following:
|
•
|
the discount rate for measuring the present value of future plan obligations;
|
86
|
•
|
the expected long-term return on plan assets;
|
|
•
|
the rate of future increases in compensation levels;
|
|
•
|
health care cost projections; and
|
|
•
|
the mortality table used in determining future plan obligations.
|
We utilize the work of third-party actuaries to assist in the measurement of these obligations. We have selected different discount rates for our funded pension plans and our unfunded retiree health care plans due to the different projected benefit payment patterns. The selected rates are compared to various similar bond indexes for reasonableness. In determining the assumed discount rates, we use our third-party actuaries’ discount rate models. These models calculate an equivalent single discount rate for the projected benefit plan cash flows using yield curves derived from Aa or higher bond yields. The yield curves represent a series of annualized individual spot discount rates from 0.5 to 99 years. The bonds used have an average rating of Aa or higher by a recognized rating agency and generally only non-callable bonds are included. Outlier bonds that have a yield to maturity that deviate significantly from the average yield within each maturity grouping are not included. Each issue is required to have at least $250 million par value outstanding.
Of the assumptions used to measure the year-end obligations and estimated annual net periodic benefit cost, the discount rate has the most significant effect on the periodic benefit cost reported for the plans. Decreasing the discount rates of 4.21 percent for our pension plans and 4.26 percent for our other postretirement benefit plans by 0.25 percent would increase pension obligations and other postretirement benefit plan obligations by $69 million and $31 million, respectively, and would increase defined benefit pension expense and other postretirement benefit plan expense by $8 million and $1 million, respectively.
The long-term asset rate of return assumption considers the asset mix of the plans (currently targeted at approximately 42 percent equity securities and 58 percent fixed income securities for the primary funded pension plan), past performance and other factors. Certain components of the asset mix are modeled with various assumptions regarding inflation and returns. In addition, our long-term asset rate of return assumption is compared to those of other companies and to historical returns for reasonableness. We used the 6.15 percent long-term rate of return to determine our 2018 defined benefit pension expense. After evaluating activity in the capital markets, along with the current and projected plan investments, we did not change the asset rate of return for our primary plan from 6.15 percent effective for 2019. Decreasing the 6.15 percent asset rate of return assumption by 0.25 percent would increase our defined benefit pension expense by $4 million.
Compensation change assumptions are based on historical experience, anticipated future management actions and demographics of the benefit plans.
Health care cost trend assumptions are developed based on historical cost data, the near-term outlook and an assessment of likely long-term trends.
We utilized the 2018 mortality tables from the U.S. Society of Actuaries.
Item 8. Financial Statements and Supplementary Data – Note
22
includes detailed information about the assumptions used to calculate the components of our annual defined benefit pension and other postretirement plan expense, as well as the obligations and accumulated other comprehensive loss reported on the year-end balance sheets.
Contingent Liabilities
We accrue contingent liabilities for legal actions, claims, litigation, environmental remediation, tax deficiencies related to operating taxes and third-party indemnities for specified tax matters when such contingencies are both probable and estimable. We regularly assess these estimates in consultation with legal counsel to consider resolved and new matters, material developments in court proceedings or settlement discussions, new information obtained as a result of ongoing discovery and past experience in defending and settling similar matters. Actual costs can differ from estimates for many reasons. For instance, settlement costs for claims and litigation can vary from estimates based on differing interpretations of laws, opinions on degree of responsibility and assessments of the amount of damages. Similarly, liabilities for environmental remediation may vary from estimates because of changes in laws, regulations and their interpretation, additional information on the extent and nature of site contamination and improvements in technology.
We generally record losses related to these types of contingencies as cost of revenues or selling, general and administrative expenses in the consolidated statements of income, except for tax deficiencies unrelated to income taxes, which are recorded as other taxes. For additional information on contingent liabilities, see Item 7. Management’s Discussion and Analysis of Financial Condition and Results of Operations – Environmental Matters and Compliance Costs.
87
An estimate of the sensitivity to net income if other assumptions had been used in recording these liabilities is not practical because of the number of contingencies that must be assessed, the number of underlying assumptions and the wide range of reasonably possible outcomes, in terms of both the probability of loss and the estimates of such loss.
ACCOUNTING STANDARDS NOT YET ADOPTED
As discussed in Item 8. Financial Statements and Supplementary Data – Note
3
to our audited consolidated financial statements, certain new financial accounting pronouncements will be effective for our financial statements in the future.
88
ITEM 7A. QUANTITATIVE AND QUALITATIVE DISCLOSURES ABOUT MARKET RISK
General
We are exposed to market risks related to the volatility of crude oil and refined product prices. We employ various strategies, including the use of commodity derivative instruments, to hedge the risks related to these price fluctuations. We are also exposed to market risks related to changes in interest rates and foreign currency exchange rates. As of
December 31, 2018
, we did not have any financial derivative instruments to hedge the risks related to interest rate fluctuations; however, we have used them in the past, and we continually monitor the market and our exposure and may enter into these agreements again in the future. We are at risk for changes in fair value of all of our derivative instruments; however, such risk should be mitigated by price or rate changes related to the underlying commodity or financial transaction.
We believe that our use of derivative instruments, along with our risk assessment procedures and internal controls, does not expose us to material adverse consequences. While the use of derivative instruments could materially affect our results of operations in particular quarterly or annual periods, we believe that the use of these instruments will not have a material adverse effect on our financial position or liquidity.
See Item 8. Financial Statements and Supplementary Data – Notes
17
and
18
for more information about the fair value measurement of our derivatives, as well as the amounts recorded in our consolidated balance sheets and statements of income. We do not designate any of our commodity derivative instruments as hedges for accounting purposes.
Commodity Price Risk
Refining & Marketing
Our strategy is to obtain competitive prices for our products and allow operating results to reflect market price movements dictated by supply and demand. We use a variety of commodity derivative instruments, including futures and options, as part of an overall program to hedge commodity price risk. We also authorize the use of the market knowledge gained from these activities to do a limited amount of trading not directly related to our physical transactions.
We use commodity derivative instruments on crude oil and refined product inventories to hedge price risk associated with inventories above or below LIFO inventory targets. We also use derivative instruments related to the acquisition of foreign-sourced crude oil and ethanol blended with refined petroleum products to hedge price risk associated with market volatility between the time we purchase the product and when we use it in the refinery production process or it is blended. In addition, we may use commodity derivative instruments on fixed price contracts for the sale of refined products to hedge risk by converting the refined product sales to market-based prices. The majority of these derivatives are exchange-traded contracts but we also enter into over-the-counter swaps, options and over-the-counter options. We closely monitor and hedge our exposure to market risk on a daily basis in accordance with policies approved by our board of directors. Our positions are monitored daily by a risk control group to ensure compliance with our stated risk management policy.
Midstream
NGL and natural gas prices are volatile and are impacted by changes in fundamental supply and demand, as well as market uncertainty, availability of NGL transportation and fractionation capacity and a variety of additional factors that are beyond MPLX’s and ANDX’s control. A portion of MPLX’s and ANDX’s profitability is directly affected by prevailing commodity prices primarily as a result of processing or conditioning at its own or third‑party processing plants, purchasing and selling or gathering and transporting volumes of natural gas at index‑related prices and the cost of third‑party transportation and fractionation services. To the extent that commodity prices influence the level of natural gas drilling by MPLX’s and ANDX’s producer customers, such prices also indirectly affect profitability. MPLX has a committee comprised of senior management that oversees risk management activities, continually monitors the risk management program and adjusts its strategy as conditions warrant. Derivative contracts utilized for crude oil, natural gas and NGLs are swaps and options traded on the OTC market and fixed price forward contracts. As a result of MPLX’s current derivative positions, it believes that it has mitigated a portion of its expected commodity price risk through the fourth quarter of 2019. MPLX would be exposed to additional commodity risk in certain situations such as if producers under‑deliver or over‑deliver products or if processing facilities are operated in different recovery modes. In the event that MPLX has derivative positions in excess of the product delivered or expected to be delivered, the excess derivative positions may be terminated. ANDX does not hedge its exposure using commodity derivative instruments because of the minimal impact of commodity price risk on its liquidity, financial position and results of operations.
MPLX management conducts a standard credit review on counterparties to derivative contracts, and it has provided the counterparties with a guaranty as credit support for its obligations. A separate agreement with certain counterparties allows MarkWest Liberty Midstream to enter into derivative positions without posting cash collateral. MPLX uses standardized agreements that allow for offset of certain positive and negative exposures in the event of default or other terminating events, including bankruptcy.
89
Open Derivative Positions and Sensitivity Analysis
The following table includes the composition of net losses/gains on our commodity derivative positions for the years ended
December 31, 2018
and
2017
, respectively.
|
(In millions)
|
2018
|
2017
|
||||
|
Realized loss on settled derivative positions
|
(11
|
)
|
(27
|
)
|
||
|
Unrealized gain (loss) on open net derivative positions
|
(35
|
)
|
6
|
|
||
|
Net loss
|
(46
|
)
|
(21
|
)
|
||
See Item 8. Financial Statements and Supplementary Data – Note
18
for additional information on our open derivative positions at
December 31, 2018
.
Sensitivity analysis of the incremental effects on income from operations (“IFO”) of hypothetical 10 percent and 25 percent increases and decreases in commodity prices for open commodity derivative instruments as of
December 31, 2018
is provided in the following table.
|
|
Change in IFO from a
Hypothetical Price Increase of |
Change in IFO from a
Hypothetical Price Decrease of |
|||||||||||||
|
(In millions)
|
10%
|
25%
|
10%
|
25%
|
|||||||||||
|
As of December 31, 2018
|
|||||||||||||||
|
Crude
|
$
|
(22
|
)
|
$
|
(55
|
)
|
$
|
22
|
|
$
|
55
|
|
|||
|
Refined products
|
3
|
|
7
|
|
(3
|
)
|
(7
|
)
|
|||||||
|
Blending products
|
(8
|
)
|
(19
|
)
|
8
|
|
19
|
|
|||||||
|
Embedded derivatives
|
(6
|
)
|
(15
|
)
|
6
|
|
15
|
|
|||||||
We remain at risk for possible changes in the market value of commodity derivative instruments; however, such risk should be mitigated by price changes in the underlying physical commodity. Effects of these offsets are not reflected in the above sensitivity analysis.
We evaluate our portfolio of commodity derivative instruments on an ongoing basis and add or revise strategies in anticipation of changes in market conditions and in risk profiles. Changes to the portfolio after
December 31, 2018
would cause future IFO effects to differ from those presented above.
Interest Rate Risk
Our use of fixed or variable-rate debt directly exposes us to interest rate risk. Fixed rate debt, such as our senior notes, exposes us to changes in the fair value of our debt due to changes in market interest rates. Fixed rate debt also exposes us to the risk that we may need to refinance maturing debt with new debt at higher rates or that our current fixed rate debt may be higher than the current market. Variable-rate debt, such as borrowings under our revolving credit facilities, exposes us to short-term changes in market rates that impact our interest expense. See Item 8. Financial Statements and Supplementary Data – Note
19
for additional information on our debt.
Sensitivity analysis of the effect of a hypothetical 100-basis-point change in interest rates on long-term debt, including the portion classified as current and excluding capital leases, as of
December 31, 2018
is provided in the following table. Fair value of cash and cash equivalents, receivables, accounts payable and accrued interest approximate carrying value and are relatively insensitive to changes in interest rates due to the short-term maturity of the instruments. Accordingly, these instruments are excluded from the table.
90
|
(In millions)
|
Fair
Value (a) |
Change in
Fair Value (b) |
Change in Net Income for the Twelve Months Ended December 31, 2018
(c)
|
|
||||||||
|
Long-term debt
|
||||||||||||
|
Fixed-rate
|
$
|
25,272
|
|
$
|
2,052
|
|
n/a
|
|
||||
|
Variable-rate
|
1,247
|
|
n/a
|
|
5
|
|
||||||
|
(a)
|
Fair value was based on market prices, where available, or current borrowing rates for financings with similar terms and maturities.
|
|
(b)
|
Assumes a 100-basis point decrease in the weighted average yield-to-maturity at
December 31, 2018
.
|
|
(c)
|
Assumes a 100-basis-point change in interest rates. The change in net income was based on the weighted average balance of debt outstanding for the year ended
December 31, 2018
.
|
See Item 8. Financial Statements and Supplementary Data – Note
17
for additional information on the fair value of our debt.
Foreign Currency Exchange Rate Risk
We are impacted by foreign exchange rate fluctuations related to some of our purchases of crude oil denominated in Canadian dollars. We did not utilize derivatives to hedge our market risk exposure to these foreign exchange rate fluctuations in
2018
.
Counterparty Risk
We are subject to risk of loss resulting from nonpayment by our customers to whom we provide services or sell natural gas or NGLs. We believe that certain contracts would allow us to pass those losses through to our customers, thus reducing our risk, when we are selling NGLs and acting as our producer customers’ agent. Our credit exposure related to these customers is represented by the value of our trade receivables. Where exposed to credit risk, we analyze the customer’s financial condition prior to entering into a transaction or agreement, establish credit terms and monitor the appropriateness of these terms on an ongoing basis. In the event of a customer default, we may sustain a loss and our cash receipts could be negatively impacted.
We are subject to risk of loss resulting from nonpayment or nonperformance by counterparties or future commission merchants. Our credit exposure related to commodity derivative instruments is represented by the fair value of contracts with a net positive fair value at the reporting date. These outstanding instruments expose us to credit loss in the event of nonperformance by the counterparties to the agreements. Should the creditworthiness of one or more of our counterparties decline, our ability to mitigate nonperformance risk is limited to a counterparty agreeing to either a voluntary termination and subsequent cash settlement or a novation of the derivative contract to a third party. In the event of a counterparty default, we may sustain a loss and our cash receipts could be negatively impacted. This counterparty credit risk does not apply to our embedded derivative as the overall value is a liability. We regularly review the creditworthiness of counterparties and futures commission merchants and enter into master netting agreements when appropriate.
These quantitative and qualitative disclosures about market risk include forward-looking statements with respect to management’s opinion about risks associated with the use of derivative instruments. These statements are based on certain assumptions with respect to interest rates as well as market prices and industry supply of and demand for crude oil, other refinery feedstocks, refined products, natural gas, NGLs and ethanol. If these assumptions prove to be inaccurate, future outcomes with respect to our use of derivative instruments may differ materially from those discussed in the forward-looking statements.
91
ITEM 8. FINANCIAL STATEMENTS AND SUPPLEMENTARY DATA
Index
|
|
Page
|
|
AUDITED CONSOLIDATED FINANCIAL STATEMENTS:
|
|
92
MANAGEMENT’S RESPONSIBILITIES FOR FINANCIAL STATEMENTS
The accompanying consolidated financial statements of Marathon Petroleum Corporation and its subsidiaries (“MPC”) are the responsibility of management and have been prepared in conformity with accounting principles generally accepted in the United States of America. They necessarily include some amounts that are based on best judgments and estimates. The financial information displayed in other sections of this Annual Report on Form 10-K is consistent with these consolidated financial statements.
MPC seeks to assure the objectivity and integrity of its financial records by careful selection of its managers, by organizational arrangements that provide an appropriate division of responsibility and by communications programs aimed at assuring that its policies and methods are understood throughout the organization.
The board of directors pursues its oversight role in the area of financial reporting and internal control over financial reporting through its Audit Committee. This committee, composed solely of independent directors, regularly meets (jointly and separately) with the independent registered public accounting firm, management and internal auditors to monitor the proper discharge by each of their responsibilities relative to internal accounting controls and the consolidated financial statements.
|
/s/ Gary R. Heminger
|
/s/ Timothy T. Griffith
|
/s/ John J. Quaid
|
||
|
Gary R. Heminger
Chairman of the Board and
Chief Executive Officer
|
Timothy T. Griffith
Senior Vice President and
Chief Financial Officer
|
John J. Quaid
Vice President and
Controller
|
||
MANAGEMENT’S REPORT ON INTERNAL CONTROL OVER FINANCIAL REPORTING
MPC’s management is responsible for establishing and maintaining adequate internal control over financial reporting (as defined in Rules 13a-15(f) under the Securities Exchange Act of 1934). An evaluation of the design and effectiveness of our internal control over financial reporting, based on the framework in
Internal Control
–
Integrated Framework (2013)
issued by the Committee of Sponsoring Organizations of the Treadway Commission, was conducted under the supervision and with the participation of management, including our chief executive officer and chief financial officer. Based on the results of this evaluation, MPC’s management concluded that its internal control over financial reporting was effective as of
December 31, 2018
.
On October 1, 2018, the Company completed its acquisition of Andeavor. Accordingly, the acquired assets and liabilities of Andeavor are included in our consolidated balance sheet as of
December 31, 2018
and the results of its operations and cash flows are reported in our consolidated statements of income and cash flows from October 1, 2018 through December 31, 2018. We have elected to exclude Andeavor from the Company’s assessment of internal control over financial reporting as of
December 31, 2018
. Andeavor represented approximately 27% of consolidated total assets as of
December 31, 2018
and 12% of total revenues and other income for the year ended
December 31, 2018
.
The effectiveness of MPC’s internal control over financial reporting as of
December 31, 2018
has been audited by PricewaterhouseCoopers LLP, an independent registered public accounting firm, as stated in their report which is included herein.
|
/s/ Gary R. Heminger
|
/s/ Timothy T. Griffith
|
|||
|
Gary R. Heminger
Chairman of the Board and
Chief Executive Officer
|
Timothy T. Griffith
Senior Vice President and
Chief Financial Officer
|
|||
93
Report of Independent Registered Public Accounting Firm
To the Board of Directors and Stockholders of Marathon Petroleum Corporation
Opinions on the Financial Statements and Internal Control over Financial Reporting
We have audited the accompanying consolidated balance sheets of Marathon Petroleum Corporation and its subsidiaries (the “Company”) as of December 31, 2018 and 2017, and the related consolidated statements of income, of comprehensive income, of equity and redeemable noncontrolling interest, and of cash flows for each of the three years in the period ended December 31, 2018, including the related notes (collectively referred to as the “consolidated financial statements”). We also have audited the Company's internal control over financial reporting as of December 31, 2018, based on criteria established in
Internal Control - Integrated Framework
(2013) issued by the Committee of Sponsoring Organizations of the Treadway Commission (COSO).
In our opinion, the consolidated financial statements referred to above present fairly, in all material respects, the financial position of the Company as of December 31, 2018 and 2017, and the results of its operations and its cash flows for each of the three years in the period ended December 31, 2018 in conformity with accounting principles generally accepted in the United States of America. Also in our opinion, the Company maintained, in all material respects, effective internal control over financial reporting as of December 31, 2018, based on criteria established in
Internal Control - Integrated Framework
(2013) issued by the COSO.
Basis for Opinions
The Company's management is responsible for these consolidated financial statements, for maintaining effective internal control over financial reporting, and for its assessment of the effectiveness of internal control over financial reporting, included in the accompanying Management’s Report on Internal Control over Financial Reporting. Our responsibility is to express opinions on the Company’s consolidated financial statements and on the Company's internal control over financial reporting based on our audits. We are a public accounting firm registered with the Public Company Accounting Oversight Board (United States) (PCAOB) and are required to be independent with respect to the Company in accordance with the U.S. federal securities laws and the applicable rules and regulations of the Securities and Exchange Commission and the PCAOB.
We conducted our audits in accordance with the standards of the PCAOB. Those standards require that we plan and perform the audits to obtain reasonable assurance about whether the consolidated financial statements are free of material misstatement, whether due to error or fraud, and whether effective internal control over financial reporting was maintained in all material respects.
Our audits of the consolidated financial statements included performing procedures to assess the risks of material misstatement of the consolidated financial statements, whether due to error or fraud, and performing procedures that respond to those risks. Such procedures included examining, on a test basis, evidence regarding the amounts and disclosures in the consolidated financial statements. Our audits also included evaluating the accounting principles used and significant estimates made by management, as well as evaluating the overall presentation of the consolidated financial statements. Our audit of internal control over financial reporting included obtaining an understanding of internal control over financial reporting, assessing the risk that a material weakness exists, and testing and evaluating the design and operating effectiveness of internal control based on the assessed risk. Our audits also included performing such other procedures as we considered necessary in the circumstances. We believe that our audits provide a reasonable basis for our opinions.
As described in Management’s Report on Internal Control over Financial Reporting, management has excluded Andeavor from its assessment of internal control over financial reporting as of December 31, 2018 because it was acquired by the Company in a purchase business combination during 2018. We have also excluded Andeavor from our audit of internal control over financial reporting. Andeavor is a wholly-owned subsidiary whose total assets and total revenues excluded from management’s assessment and our audit of internal control over financial reporting represent 27% and 12%, respectively, of the related consolidated financial statement amounts as of and for the year ended December 31, 2018.
Definition and Limitations of Internal Control over Financial Reporting
A company’s internal control over financial reporting is a process designed to provide reasonable assurance regarding the reliability of financial reporting and the preparation of financial statements for external purposes in accordance with generally accepted accounting principles. A company’s internal control over financial reporting includes those policies and procedures
94
that (i) pertain to the maintenance of records that, in reasonable detail, accurately and fairly reflect the transactions and dispositions of the assets of the company; (ii) provide reasonable assurance that transactions are recorded as necessary to permit preparation of financial statements in accordance with generally accepted accounting principles, and that receipts and expenditures of the company are being made only in accordance with authorizations of management and directors of the company; and (iii) provide reasonable assurance regarding prevention or timely detection of unauthorized acquisition, use, or disposition of the company’s assets that could have a material effect on the financial statements.
Because of its inherent limitations, internal control over financial reporting may not prevent or detect misstatements. Also, projections of any evaluation of effectiveness to future periods are subject to the risk that controls may become inadequate because of changes in conditions, or that the degree of compliance with the policies or procedures may deteriorate.
/s/PricewaterhouseCoopers LLP
Toledo, Ohio
February 28, 2019
We have served as the Company’s auditor since 2010.
95
MARATHON PETROLEUM CORPORATION
CONSOLIDATED STATEMENTS OF INCOME
|
(In millions, except per share data)
|
2018
|
2017
|
2016
|
||||||||
|
Revenues and other income:
|
|||||||||||
|
Sales and other operating revenues
(a)
|
$
|
95,750
|
|
$
|
74,104
|
|
$
|
63,277
|
|
||
|
Sales to related parties
|
754
|
|
629
|
|
62
|
|
|||||
|
Income (loss) from equity method investments
|
373
|
|
306
|
|
(185
|
)
|
|||||
|
Net gain on disposal of assets
|
23
|
|
10
|
|
32
|
|
|||||
|
Other income
|
202
|
|
320
|
|
178
|
|
|||||
|
Total revenues and other income
|
97,102
|
|
75,369
|
|
63,364
|
|
|||||
|
Costs and expenses:
|
|||||||||||
|
Cost of revenues (excludes items below)
(a)
|
85,456
|
|
66,519
|
|
56,676
|
|
|||||
|
Purchases from related parties
|
610
|
|
570
|
|
509
|
|
|||||
|
Inventory market valuation adjustment
|
—
|
|
—
|
|
(370
|
)
|
|||||
|
Impairment expense
|
—
|
|
—
|
|
130
|
|
|||||
|
Depreciation and amortization
|
2,490
|
|
2,114
|
|
2,001
|
|
|||||
|
Selling, general and administrative expenses
|
2,418
|
|
1,694
|
|
1,597
|
|
|||||
|
Other taxes
|
557
|
|
454
|
|
435
|
|
|||||
|
Total costs and expenses
|
91,531
|
|
71,351
|
|
60,978
|
|
|||||
|
Income from operations
|
5,571
|
|
4,018
|
|
2,386
|
|
|||||
|
Net interest and other financial costs
|
1,003
|
|
674
|
|
564
|
|
|||||
|
Income before income taxes
|
4,568
|
|
3,344
|
|
1,822
|
|
|||||
|
(Benefit) provision for in
come taxes
|
962
|
|
(460
|
)
|
609
|
|
|||||
|
Net income
|
3,606
|
|
3,804
|
|
1,213
|
|
|||||
|
Less net income (loss) attributable to:
|
|||||||||||
|
Redeemable noncontrolling interest
|
75
|
|
65
|
|
41
|
|
|||||
|
Noncontrolling interests
|
751
|
|
307
|
|
(2
|
)
|
|||||
|
Net income attributable to MPC
|
$
|
2,780
|
|
$
|
3,432
|
|
$
|
1,174
|
|
||
|
Per Share Data (See Note 8)
|
|||||||||||
|
Basic:
|
|||||||||||
|
Net income attributable to MPC per share
|
$
|
5.36
|
|
$
|
6.76
|
|
$
|
2.22
|
|
||
|
Weighted average shares outstanding
|
518
|
|
507
|
|
528
|
|
|||||
|
Diluted:
|
|||||||||||
|
Net income attributable to MPC per share
|
$
|
5.28
|
|
$
|
6.70
|
|
$
|
2.21
|
|
||
|
Weighted average shares outstanding
|
526
|
|
512
|
|
530
|
|
|||||
|
(a)
|
The 2018 period reflects an election to present certain taxes on a net basis concurrent with our adoption of ASU 2014-09, Revenue - Revenue from Contracts with Customers (“ASC 606”). See Notes
2
and
3
for further information.
|
The accompanying notes are an integral part of these consolidated financial statements.
96
MARATHON PETROLEUM CORPORATION
CONSOLIDATED STATEMENTS OF COMPREHENSIVE INCOME
|
(In millions)
|
2018
|
2017
|
2016
|
||||||||
|
Net income
|
$
|
3,606
|
|
$
|
3,804
|
|
$
|
1,213
|
|
||
|
Other comprehensive income (loss):
|
|||||||||||
|
Defined benefit postretirement and post-employment plans:
|
|||||||||||
|
Actuarial changes, net of tax of $14, $17 and $69, respectively
|
75
|
|
29
|
|
115
|
|
|||||
|
Prior service costs, net of tax of $12, ($16) and ($18), respectively
|
8
|
|
(26
|
)
|
(31
|
)
|
|||||
|
Other, net of tax of $1, $0 and $0, respectively
|
4
|
|
—
|
|
—
|
|
|||||
|
Other comprehensive income
|
87
|
|
3
|
|
84
|
|
|||||
|
Comprehensive income
|
3,693
|
|
3,807
|
|
1,297
|
|
|||||
|
Less comprehensive income (loss) attributable to:
|
|||||||||||
|
Redeemable noncontrolling interest
|
75
|
|
65
|
|
41
|
|
|||||
|
Noncontrolling interests
|
751
|
|
307
|
|
(2
|
)
|
|||||
|
Comprehensive income attributable to MPC
|
$
|
2,867
|
|
$
|
3,435
|
|
$
|
1,258
|
|
||
The accompanying notes are an integral part of these consolidated financial statements.
97
MARATHON PETROLEUM CORPORATION
CONSOLIDATED BALANCE SHEETS
|
|
December 31,
|
||||||
|
(In millions, except share data)
|
2018
|
2017
|
|||||
|
Assets
|
|||||||
|
Current assets:
|
|||||||
|
Cash and cash equivalents
|
$
|
1,687
|
|
$
|
3,011
|
|
|
|
Receivables, less allowance for doubtful accounts of $9 and $11
, respectively
|
5,853
|
|
4,695
|
|
|||
|
Inventories
|
9,837
|
|
5,550
|
|
|||
|
Other current assets
|
646
|
|
145
|
|
|||
|
Total current assets
|
18,023
|
|
13,401
|
|
|||
|
Equity method investments
|
5,898
|
|
4,787
|
|
|||
|
Property, plant and equipment, net
|
45,058
|
|
26,443
|
|
|||
|
Goodwill
|
20,184
|
|
3,586
|
|
|||
|
Other noncurrent assets
|
3,777
|
|
830
|
|
|||
|
Total assets
|
$
|
92,940
|
|
$
|
49,047
|
|
|
|
Liabilities
|
|||||||
|
Current liabilities:
|
|||||||
|
Accounts payable
|
$
|
9,366
|
|
$
|
8,297
|
|
|
|
Payroll and benefits payable
|
1,152
|
|
591
|
|
|||
|
Accrued taxes
|
1,446
|
|
670
|
|
|||
|
Debt due within one year
|
544
|
|
624
|
|
|||
|
Other current liabilities
|
708
|
|
296
|
|
|||
|
Total current liabilities
|
13,216
|
|
10,478
|
|
|||
|
Long-term debt
|
26,980
|
|
12,322
|
|
|||
|
Deferred income taxes
|
4,864
|
|
2,654
|
|
|||
|
Defined benefit postretirement plan obligations
|
1,509
|
|
1,099
|
|
|||
|
Deferred credits and other liabilities
|
1,318
|
|
666
|
|
|||
|
Total liabilities
|
47,887
|
|
27,219
|
|
|||
|
Commitments and contingencies (see Note 25)
|
|
|
|
|
|||
|
Redeemable noncontrolling interest
|
1,004
|
|
1,000
|
|
|||
|
Equity
|
|||||||
|
MPC stockholders’ equity:
|
|||||||
|
Preferred stock, no shares issued and outstanding (par value $0.01 per share, 30 million shares authorized)
|
—
|
|
—
|
|
|||
|
Common stock:
|
|||||||
|
Issued – 975 million and 734 million shares (par value $0.01 per share, 2 billion shares authorize
d)
|
10
|
|
7
|
|
|||
|
Held in treasury, at cost – 295 million and 248 million shar
es
|
(13,175
|
)
|
(9,869
|
)
|
|||
|
Additional paid-in capital
|
33,729
|
|
11,262
|
|
|||
|
Retained earnings
|
14,755
|
|
12,864
|
|
|||
|
Accumulated other comprehensive loss
|
(144
|
)
|
(231
|
)
|
|||
|
Total MPC stockholders’ equity
|
35,175
|
|
14,033
|
|
|||
|
Noncontrolling interests
|
8,874
|
|
6,795
|
|
|||
|
Total equity
|
44,049
|
|
20,828
|
|
|||
|
Total liabilities, redeemable noncontrolling interest and equity
|
$
|
92,940
|
|
$
|
49,047
|
|
|
The accompanying notes are an integral part of these consolidated financial statements.
98
MARATHON PETROLEUM CORPORATION
CONSOLIDATED STATEMENTS OF CASH FLOWS
|
(In millions)
|
2018
|
2017
|
2016
|
||||||||
|
Operating activities:
|
|||||||||||
|
Net income
|
$
|
3,606
|
|
$
|
3,804
|
|
$
|
1,213
|
|
||
|
Adjustments to reconcile net income to net cash provided by operating activities:
|
|||||||||||
|
Amortization of deferred financing costs and debt discount
|
70
|
|
64
|
|
61
|
|
|||||
|
Impairment expense
|
—
|
|
—
|
|
130
|
|
|||||
|
Depreciation and amortization
|
2,490
|
|
2,114
|
|
2,001
|
|
|||||
|
Inventory market valuation adjustment
|
—
|
|
—
|
|
(370
|
)
|
|||||
|
Pension and other postretirement benefits, net
|
90
|
|
47
|
|
9
|
|
|||||
|
Deferred income taxes
|
47
|
|
(1,233
|
)
|
394
|
|
|||||
|
Net gain on disposal of assets
|
(23
|
)
|
(10
|
)
|
(32
|
)
|
|||||
|
(Income) loss from equity method investments
|
(373
|
)
|
(306
|
)
|
185
|
|
|||||
|
Distributions from equity method investments
|
519
|
|
391
|
|
317
|
|
|||||
|
Changes in the fair value of derivative instruments
|
(62
|
)
|
116
|
|
(41
|
)
|
|||||
|
Changes in operating assets and liabilities, net of effects of businesses acquired:
|
|||||||||||
|
Current receivables
|
1,589
|
|
(1,093
|
)
|
(674
|
)
|
|||||
|
Inventories
|
931
|
|
106
|
|
(70
|
)
|
|||||
|
Current accounts payable and accrued liabilities
|
(2,798
|
)
|
2,814
|
|
985
|
|
|||||
|
All other, net
|
72
|
|
(202
|
)
|
(91
|
)
|
|||||
|
Net cash provided by operating activities
|
6,158
|
|
6,612
|
|
4,017
|
|
|||||
|
Investing activities:
|
|||||||||||
|
Additions to property, plant and equipment
|
(3,578
|
)
|
(2,732
|
)
|
(2,892
|
)
|
|||||
|
Acquisitions, net of cash acquired
|
(3,822
|
)
|
(249
|
)
|
—
|
|
|||||
|
Disposal of assets
|
54
|
|
79
|
|
101
|
|
|||||
|
Investments – acquisitions, loans and contributions
|
(409
|
)
|
(805
|
)
|
(288
|
)
|
|||||
|
– redemptions, repayments and return of capital
|
16
|
|
62
|
|
—
|
|
|||||
|
All other, net
|
69
|
|
247
|
|
112
|
|
|||||
|
Net cash used in investing activities
|
(7,670
|
)
|
(3,398
|
)
|
(2,967
|
)
|
|||||
|
Financing activities:
|
|||||||||||
|
Commercial paper – issued
|
—
|
|
300
|
|
1,263
|
|
|||||
|
– repayments
|
—
|
|
(300
|
)
|
(1,263
|
)
|
|||||
|
Long-term debt – borrowings
|
13,476
|
|
2,911
|
|
864
|
|
|||||
|
– repayments
|
(8,032
|
)
|
(642
|
)
|
(2,269
|
)
|
|||||
|
Debt issuance costs
|
(86
|
)
|
(33
|
)
|
(11
|
)
|
|||||
|
Issuance of common stock
|
24
|
|
46
|
|
11
|
|
|||||
|
Common stock repurchased
|
(3,287
|
)
|
(2,372
|
)
|
(197
|
)
|
|||||
|
Dividends paid
|
(954
|
)
|
(773
|
)
|
(719
|
)
|
|||||
|
Issuance of MPLX LP common units
|
—
|
|
473
|
|
776
|
|
|||||
|
Issuance of MPLX LP redeemable preferred units
|
—
|
|
—
|
|
984
|
|
|||||
|
Distributions to noncontrolling interests
|
(903
|
)
|
(694
|
)
|
(542
|
)
|
|||||
|
Contributions from noncontrolling interests
|
12
|
|
129
|
|
6
|
|
|||||
|
Contingent consideration payment
|
—
|
|
(89
|
)
|
(164
|
)
|
|||||
|
All other, net
|
(28
|
)
|
(47
|
)
|
(33
|
)
|
|||||
|
Net cash provided by (used in) financing activities
|
222
|
|
(1,091
|
)
|
(1,294
|
)
|
|||||
|
Net increase (decrease) in cash, cash equivalents and restricted cash
|
(1,290
|
)
|
2,123
|
|
(244
|
)
|
|||||
|
Cash, cash equivalents and restricted cash at beginning of period
|
3,015
|
|
892
|
|
1,136
|
|
|||||
|
Cash, cash equivalents and restricted cash at end of period
|
$
|
1,725
|
|
$
|
3,015
|
|
$
|
892
|
|
||
The accompanying notes are an integral part of these consolidated financial statements.
99
MARATHON PETROLEUM CORPORATION
CONSOLIDATED STATEMENTS OF EQUITY AND REDEEMABLE NONCONTROLLING INTEREST
|
MPC Stockholders’ Equity
|
|
|
|||||||||||||||||||||||||||||||||||
|
Common Stock
|
Treasury Stock
|
Additional Paid-in Capital
|
Retained Earnings
|
Accumulated Other Comprehensive Income (Loss)
|
Non-controlling Interests
|
Total Equity
|
Redeemable Non-controlling Interest
|
||||||||||||||||||||||||||||||
|
(In millions)
|
Shares
|
Amount
|
Shares
|
Amount
|
|||||||||||||||||||||||||||||||||
|
Balance as of December 31, 2015
|
729
|
|
$
|
7
|
|
(198
|
)
|
$
|
(7,275
|
)
|
$
|
11,071
|
|
$
|
9,752
|
|
$
|
(318
|
)
|
$
|
6,438
|
|
$
|
19,675
|
|
$
|
—
|
|
|||||||||
|
Net income (loss)
|
—
|
|
—
|
|
—
|
|
—
|
|
—
|
|
1,174
|
|
—
|
|
(2
|
)
|
1,172
|
|
41
|
|
|||||||||||||||||
|
Dividends declared
on common stock ($1.36 per share)
|
—
|
|
—
|
|
—
|
|
—
|
|
—
|
|
(720
|
)
|
—
|
|
—
|
|
(720
|
)
|
—
|
|
|||||||||||||||||
|
Distributions to noncontrolling interests
|
—
|
|
—
|
|
—
|
|
—
|
|
—
|
|
—
|
|
—
|
|
(517
|
)
|
(517
|
)
|
(25
|
)
|
|||||||||||||||||
|
Contributions from noncontrolling interests
|
—
|
|
—
|
|
—
|
|
—
|
|
—
|
|
—
|
|
—
|
|
6
|
|
6
|
|
—
|
|
|||||||||||||||||
|
Other comprehensive income
|
—
|
|
—
|
|
—
|
|
—
|
|
—
|
|
—
|
|
84
|
|
—
|
|
84
|
|
—
|
|
|||||||||||||||||
|
Shares repurchased
|
—
|
|
—
|
|
(4
|
)
|
(197
|
)
|
—
|
|
—
|
|
—
|
|
—
|
|
(197
|
)
|
—
|
|
|||||||||||||||||
|
Stock-based compensation
|
2
|
|
—
|
|
(1
|
)
|
(10
|
)
|
46
|
|
—
|
|
—
|
|
6
|
|
42
|
|
—
|
|
|||||||||||||||||
|
Impact from equity transactions of MPLX
|
—
|
|
—
|
|
—
|
|
—
|
|
(57
|
)
|
—
|
|
—
|
|
715
|
|
658
|
|
—
|
|
|||||||||||||||||
|
Issuance of MPLX LP redeemable preferred units
|
—
|
|
—
|
|
—
|
|
—
|
|
—
|
|
—
|
|
—
|
|
—
|
|
—
|
|
984
|
|
|||||||||||||||||
|
Balance as of December 31, 2016
|
731
|
|
$
|
7
|
|
(203
|
)
|
$
|
(7,482
|
)
|
$
|
11,060
|
|
$
|
10,206
|
|
$
|
(234
|
)
|
$
|
6,646
|
|
$
|
20,203
|
|
$
|
1,000
|
|
|||||||||
|
Net income
|
—
|
|
—
|
|
—
|
|
—
|
|
—
|
|
3,432
|
|
—
|
|
307
|
|
3,739
|
|
65
|
|
|||||||||||||||||
|
Dividends declared on common stock ($1.52 per share)
|
—
|
|
—
|
|
—
|
|
—
|
|
—
|
|
(774
|
)
|
—
|
|
—
|
|
(774
|
)
|
—
|
|
|||||||||||||||||
|
Distributions to noncontrolling interests
|
—
|
|
—
|
|
—
|
|
—
|
|
—
|
|
—
|
|
—
|
|
(629
|
)
|
(629
|
)
|
(65
|
)
|
|||||||||||||||||
|
Contributions from noncontrolling interests
|
—
|
|
—
|
|
—
|
|
—
|
|
—
|
|
—
|
|
—
|
|
129
|
|
129
|
|
—
|
|
|||||||||||||||||
|
Other comprehensive income
|
—
|
|
—
|
|
—
|
|
—
|
|
—
|
|
—
|
|
3
|
|
—
|
|
3
|
|
—
|
|
|||||||||||||||||
|
Shares repurchased
|
—
|
|
—
|
|
(44
|
)
|
(2,372
|
)
|
—
|
|
—
|
|
—
|
|
—
|
|
(2,372
|
)
|
—
|
|
|||||||||||||||||
|
Stock-based compensation
|
3
|
|
—
|
|
(1
|
)
|
(15
|
)
|
92
|
|
—
|
|
—
|
|
8
|
|
85
|
|
—
|
|
|||||||||||||||||
|
Impact from equity transactions of MPLX
|
—
|
|
—
|
|
—
|
|
—
|
|
110
|
|
—
|
|
—
|
|
334
|
|
444
|
|
—
|
|
|||||||||||||||||
|
Balance as of December 31, 2017
|
734
|
|
$
|
7
|
|
(248
|
)
|
$
|
(9,869
|
)
|
$
|
11,262
|
|
$
|
12,864
|
|
$
|
(231
|
)
|
$
|
6,795
|
|
$
|
20,828
|
|
$
|
1,000
|
|
|||||||||
|
Cumulative effect of adopting new accounting standards
|
—
|
|
—
|
|
—
|
|
—
|
|
—
|
|
66
|
|
—
|
|
2
|
|
68
|
|
—
|
|
|||||||||||||||||
|
Net income
|
|
|
—
|
|
—
|
|
—
|
|
—
|
|
2,780
|
|
—
|
|
751
|
|
3,531
|
|
75
|
|
|||||||||||||||||
|
Dividends declared on common stock ($1.84 per share)
|
—
|
|
—
|
|
—
|
|
—
|
|
—
|
|
(955
|
)
|
—
|
|
—
|
|
(955
|
)
|
—
|
|
|||||||||||||||||
|
Distributions to noncontrolling interests
|
—
|
|
—
|
|
—
|
|
—
|
|
—
|
|
—
|
|
—
|
|
(832
|
)
|
(832
|
)
|
(71
|
)
|
|||||||||||||||||
|
Contributions from noncontrolling interests
|
—
|
|
—
|
|
—
|
|
—
|
|
—
|
|
—
|
|
—
|
|
12
|
|
12
|
|
—
|
|
|||||||||||||||||
|
Other comprehensive income
|
—
|
|
—
|
|
—
|
|
—
|
|
—
|
|
—
|
|
87
|
|
—
|
|
87
|
|
—
|
|
|||||||||||||||||
|
Shares repurchased
|
—
|
|
—
|
|
(47
|
)
|
(3,287
|
)
|
—
|
|
—
|
|
—
|
|
—
|
|
(3,287
|
)
|
—
|
|
|||||||||||||||||
|
Stock based compensation
|
1
|
|
1
|
|
—
|
|
(18
|
)
|
345
|
|
—
|
|
—
|
|
14
|
|
342
|
|
—
|
|
|||||||||||||||||
|
Impact from equity transactions of MPLX & ANDX
|
—
|
|
—
|
|
—
|
|
—
|
|
2,357
|
|
—
|
|
—
|
|
(2,927
|
)
|
(570
|
)
|
—
|
|
|||||||||||||||||
|
Issuance of shares for Andeavor acquisition
|
240
|
|
2
|
|
—
|
|
(1
|
)
|
19,765
|
|
—
|
|
—
|
|
—
|
|
19,766
|
|
—
|
|
|||||||||||||||||
|
Noncontrolling interest acquired from Andeavor
|
—
|
|
—
|
|
—
|
|
—
|
|
—
|
|
—
|
|
—
|
|
5,059
|
|
5,059
|
|
—
|
|
|||||||||||||||||
|
Balance as of December 31, 2018
|
975
|
|
$
|
10
|
|
(295
|
)
|
$
|
(13,175
|
)
|
$
|
33,729
|
|
$
|
14,755
|
|
$
|
(144
|
)
|
$
|
8,874
|
|
$
|
44,049
|
|
$
|
1,004
|
|
|||||||||
The accompanying notes are an integral part of these consolidated financial statements.
100
NOTES TO CONSOLIDATED FINANCIAL STATEMENTS
|
1
.
|
DESCRIPTION OF THE BUSINESS AND BASIS OF PRESENTATION
|
Description of the Business
We are a leading, integrated, downstream energy company headquartered in Findlay, Ohio. We operate the nation's largest refining system with more than
3 million
barrels per day of crude oil capacity across
16
refineries. MPC's marketing system includes branded locations across the United States, which primarily include Marathon branded outlets. We own and operate retail convenience stores across the United States. We also own the general partner and majority limited partner interests in two midstream companies, MPLX LP (“MPLX”) and Andeavor Logistics LP (“ANDX”), which own and operate crude oil and light product transportation and logistics infrastructure as well as gathering, processing, and fractionation assets.
Refer to Note
5
for further information on the Andeavor acquisition, which closed on October 1, 2018, and to Note
10
for additional information about our operations.
Basis of Presentation
Our results of operations and cash flows consist of consolidated MPC activities. All significant intercompany transactions and accounts have been eliminated.
Certain prior period financial statement amounts have been reclassified to conform to current period presentation.
|
2
.
|
SUMMARY OF PRINCIPAL ACCOUNTING POLICIES
|
Principles Applied in Consolidation
These consolidated financial statements include the accounts of our majority-owned, controlled subsidiaries, MPLX and ANDX. Changes in ownership interest in consolidated subsidiaries that do not result in a change in control are recorded as an equity transaction. As of
December 31, 2018
, we owned
63.6 percent
of the outstanding MPLX common units and
63.6 percent
of the outstanding ANDX common units and
100 percent
of the general partner interest for each entity. Due to our ownership of the general partner interest, we have determined that we control MPLX and ANDX and therefore we consolidate MPLX and ANDX and record a noncontrolling interest for the interest owned by the public.
Investments in entities over which we have significant influence, but not control, are accounted for using the equity method of accounting. This includes entities in which we hold majority ownership but the minority shareholders have substantive participating rights. Income from equity method investments represents our proportionate share of net income generated by the equity method investees.
Differences in the basis of the investments and the separate net asset values of the investees, if any, are amortized into net income over the remaining useful lives of the underlying assets and liabilities, except for the excess related to goodwill. Equity method investments are evaluated for impairment whenever changes in the facts and circumstances indicate an other than temporary loss in value has occurred. When the loss is deemed to be other than temporary, the carrying value of the equity method investment is written down to fair value.
Use of Estimates
The preparation of financial statements in accordance with generally accepted accounting principles requires management to make estimates and assumptions that affect the reported amounts of assets and liabilities and the disclosure of contingent assets and liabilities as of the date of the consolidated financial statements and the reported amounts of revenues and expenses during the respective reporting periods.
Revenue Recognition
We recognize revenue based on consideration specified in contracts or agreements with customers when we satisfy our performance obligations by transferring control over products or services to a customer. Concurrent with our adoption of ASU 2014-09, Revenue from Contracts with Customers (“ASC 606”), we made an accounting policy election that all taxes assessed by a governmental authority that are both imposed on and concurrent with a revenue-producing transaction and collected from our customers will be recognized on a net basis within sales and other operating revenues.
The adoption of ASC 606 did not materially change our revenue recognition patterns, which are described below by reportable segment:
|
•
|
Refining & Marketing - The vast majority of our Refining & Marketing contracts contain pricing that is based on the market price for the product at the time of delivery. Our obligations to deliver product volumes are typically satisfied
|
101
and revenue is recognized when control of the product transfers to our customers. Concurrent with the transfer of control, we typically receive the right to payment for the delivered product, the customer accepts the product and the customer has significant risks and rewards of ownership of the product. Payment terms require customers to pay shortly after delivery and do not contain significant financing components.
|
•
|
Retail - Revenue is recognized when our customers receive control of the transportation fuels or merchandise. Payments from customers are received at the time sales occur in cash or by credit or debit card at our company-owned and operated retail locations and shortly after delivery for our direct dealers. Our retail operations offer a loyalty rewards program to its customers. We defer a minor portion of revenue on sales to the loyalty program participants until the participants redeem their rewards. The related contract liability, as defined in ASC 606, is not material to our financial statements.
|
|
•
|
Midstream - Midstream revenue transactions typically are defined by contracts under which we sell a product or provide a service. Revenues from sales of product are recognized when control of the product transfers to the customer. Revenues from sales of services are recognized over time when the performance obligation is satisfied as services are provided in a series. We have elected to use the output measure of progress to recognize revenue based on the units delivered, processed or transported. The transaction prices in our Midstream contracts often have both fixed components, related to minimum volume commitments, and variable components, which are primarily dependent on volumes. Variable consideration will generally not be estimated at contract inception as the transaction price is specifically allocable to the services provided at each period end.
|
Refer to Note
10
for disclosure of our revenue disaggregated by segment and product line, as well as a description of our reportable segment operations.
Crude Oil and Refined Product Exchanges and Matching Buy/Sell Transactions
We enter into exchange contracts and matching buy/sell arrangements whereby we agree to deliver a particular quantity and quality of crude oil or refined products at a specified location and date to a particular counterparty and to receive from the same counterparty the same commodity at a specified location on the same or another specified date. The exchange receipts and deliveries are nonmonetary transactions, with the exception of associated grade or location differentials that are settled in cash. The matching buy/sell purchase and sale transactions are settled in cash. No revenues are recorded for exchange and matching buy/sell transactions as they are accounted for as exchanges of inventory. The exchange transactions are recognized at the carrying amount of the inventory transferred.
Cash and Cash Equivalents
Cash and cash equivalents include cash on hand and on deposit and investments in highly liquid debt instruments with maturities of three months or less.
Restricted Cash
Restricted cash consists of cash and investments that must be maintained as collateral for letters of credit issued to certain third-party producer customers. The balances will be outstanding until certain capital projects are completed and the third party releases the restriction. Restricted cash also consists of cash advances to be used for the operation and maintenance of an operated pipeline system.
Accounts Receivable and Allowance for Doubtful Accounts
Our receivables primarily consist of customer accounts receivable. Customer receivables are recorded at the invoiced amounts and generally do not bear interest. Allowances for doubtful accounts are generally recorded when it becomes probable the receivable will not be collected and are booked to bad debt expense. The allowance for doubtful accounts is the best estimate of the amount of probable credit losses in customer accounts receivable. We review the allowance quarterly and past-due balances over
180 days
are reviewed individually for collectability.
We mitigate credit risk with master netting agreements with companies engaged in the crude oil or refinery feedstock trading and supply business or the petroleum refining industry. A master netting agreement generally provides for a once per month net cash settlement of the accounts receivable from and the accounts payable to a particular counterparty.
Inventories
Inventories are carried at the lower of cost or market value. Cost of inventories is determined primarily under the LIFO method. Costs for crude oil, refinery feedstocks and refined product inventories are aggregated on a consolidated basis for purposes of assessing if the LIFO cost basis of these inventories may have to be written down to market value.
102
Derivative Instruments
We use derivatives to economically hedge a portion of our exposure to commodity price risk and, historically, to interest rate risk. We also have limited authority to use selective derivative instruments that assume market risk. All derivative instruments (including derivative instruments embedded in other contracts) are recorded at fair value. Certain commodity derivatives are reflected on the consolidated balance sheets on a net basis by counterparty as they are governed by master netting agreements. Cash flows related to derivatives used to hedge commodity price risk and interest rate risk are classified in operating activities with the underlying transactions.
Derivatives not designated as accounting hedges
–
Derivatives that are not designated as accounting hedges may include commodity derivatives used to hedge price risk on (1) inventories, (2) fixed price sales of refined products, (3) the acquisition of foreign-sourced crude oil, (4) the acquisition of ethanol for blending with refined products, (5) the sale of NGLs and (6) the purchase of natural gas. Changes in the fair value of derivatives not designated as accounting hedges are recognized immediately in net income.
Concentrations of credit risk
– All of our financial instruments, including derivatives, involve elements of credit and market risk. The most significant portion of our credit risk relates to nonperformance by counterparties. The counterparties to our financial instruments consist primarily of major financial institutions and companies within the energy industry. To manage counterparty risk associated with financial instruments, we select and monitor counterparties based on an assessment of their financial strength and on credit ratings, if available. Additionally, we limit the level of exposure with any single counterparty.
Property, Plant and Equipment
Property, plant and equipment are recorded at cost and depreciated on a straight-line basis over the estimated useful lives of the assets, which range from
three
to
51
years. Such assets are reviewed for impairment whenever events or changes in circumstances indicate that the carrying amount of an asset group may not be recoverable. If the sum of the expected undiscounted future cash flows from the use of the asset group and its eventual disposition is less than the carrying amount of the asset group, an impairment assessment is performed and the excess of the book value over the fair value of the asset group is recorded as an impairment loss.
When items of property, plant and equipment are sold or otherwise disposed of, any gains or losses are reported in net income. Gains on the disposal of property, plant and equipment are recognized when earned, which is generally at the time of closing. If a loss on disposal is expected, such losses are recognized when the assets are classified as held for sale.
Interest expense is capitalized for qualifying assets under construction. Capitalized interest costs are included in property, plant and equipment and are depreciated over the useful life of the related asset.
Goodwill and Intangible Assets
Goodwill represents the excess of the purchase price over the estimated fair value of the net assets acquired in the acquisition of a business. Goodwill is not amortized, but rather is tested for impairment annually and when events or changes in circumstances indicate that the fair value of a reporting unit with goodwill has been reduced below carrying value. The impairment test requires allocating goodwill and other assets and liabilities to reporting units. The fair value of each reporting unit is determined and compared to the carrying value of the reporting unit. The fair value is calculated using the expected present value of future cash flows method. Significant assumptions used in the cash flow forecasts include future net operating margins, future volumes, discount rates, and future capital requirements. If the carrying amount of the reporting unit exceeds its fair value, an impairment loss shall be recognized in an amount equal to that excess, limited to the total amount of goodwill allocated to that reporting unit.
Amortization of intangibles with definite lives is calculated using the straight-line method which is reflective of the benefit pattern in which the estimated economic benefit is expected to be received over the estimated useful life of the intangible asset. Intangibles subject to amortization are reviewed for impairment whenever events or changes in circumstances indicate that the carrying amount of the intangible may not be recoverable. If the sum of the expected undiscounted future cash flows related to the asset is less than the carrying amount of the asset, an impairment loss is recognized based on the fair value of the asset. Intangibles not subject to amortization are tested for impairment annually and when circumstances indicate that the fair value is less than the carrying amount of the intangible. If the fair value is less than the carrying value, an impairment is recorded for the difference.
Major Maintenance Activities
Costs for planned turnaround and other major maintenance activities are expensed in the period incurred. These types of costs include contractor repair services, materials and supplies, equipment rentals and our labor costs.
103
Environmental Costs
Environmental expenditures for additional equipment that mitigates or prevents future contamination or improves environmental safety or efficiency of the existing assets are capitalized. We recognize remediation costs and penalties when the responsibility to remediate is probable and the amount of associated costs can be reasonably estimated. The timing of remediation accruals coincides with completion of a feasibility study or the commitment to a formal plan of action. Remediation liabilities are accrued based on estimates of known environmental exposure and are discounted when the estimated amounts are reasonably fixed and determinable. If recoveries of remediation costs from third parties are probable, a receivable is recorded and is discounted when the estimated amount is reasonably fixed and determinable.
Asset Retirement Obligations
The fair value of asset retirement obligations is recognized in the period in which the obligations are incurred if a reasonable estimate of fair value can be made. The majority of our recognized asset retirement liability relates to conditional asset retirement obligations for removal and disposal of fire-retardant material from certain refining facilities. The remaining recognized asset retirement liability relates to other refining assets, the removal of underground storage tanks at our leased convenience stores, certain pipelines and processing facilities and other related pipeline assets. The fair values recorded for such obligations are based on the most probable current cost projections.
Our short-term asset retirement obligations were
$30 million
and
$6 million
at
December 31, 2018
and
2017
, respectively, which are included in other current liabilities in our consolidated balance sheets. Our long-term asset retirement obligations were
$222 million
and
$121 million
at
December 31, 2018
and
2017
, respectively, which are included in deferred credits and other liabilities in our consolidated balance sheets. The increase in our asset retirement obligation was mainly due to obligations recognized in connection with the purchase accounting for the Andeavor acquisition.
Asset retirement obligations have not been recognized for some assets because the fair value cannot be reasonably estimated since the settlement dates of the obligations are indeterminate. Such obligations will be recognized in the period when sufficient information becomes available to estimate a range of potential settlement dates. The asset retirement obligations principally include the hazardous material disposal and removal or dismantlement requirements associated with the closure of certain refining, terminal, retail, pipeline and processing assets.
Our practice is to keep our assets in good operating condition through routine repair and maintenance of component parts in the ordinary course of business and by continuing to make improvements based on technological advances. As a result, we believe that generally these assets have no expected settlement date for purposes of estimating asset retirement obligations since the dates or ranges of dates upon which we would retire these assets cannot be reasonably estimated at this time.
Income Taxes
Deferred tax assets and liabilities are recognized for the estimated future tax consequences attributable to differences between the financial statement carrying amounts of assets and liabilities and their tax bases. Deferred tax assets are recorded when it is more likely than not that they will be realized. The realization of deferred tax assets is assessed periodically based on several factors, primarily our expectation to generate sufficient future taxable income.
Stock-Based Compensation Arrangements
The fair value of stock options granted to our employees is estimated on the date of grant using the Black-Scholes option pricing model. The model employs various assumptions, based on management’s estimates at the time of grant, which impact the calculation of fair value and ultimately, the amount of expense that is recognized over the vesting period of the stock option award. Of the required assumptions, the expected life of the stock option award and the expected volatility of our stock price have the most significant impact on the fair value calculation. The average expected life is based on our historical employee exercise behavior. The assumption for expected volatility of our stock price reflects a weighting of
50 percent
of our common stock implied volatility and
50 percent
of our common stock historical volatility.
The fair value of restricted stock awards granted to our employees is determined based on the fair market value of our common stock on the date of grant. The fair value of performance unit awards granted to our employees is estimated on the date of grant using a Monte Carlo valuation model.
Our stock-based compensation expense is recognized based on management’s estimate of the awards that are expected to vest, using the straight-line attribution method for all service-based awards with a graded vesting feature. If actual forfeiture results are different than expected, adjustments to recognized compensation expense may be required in future periods. Unearned stock-based compensation is charged to equity when restricted stock awards are granted. Compensation expense is recognized over the vesting period and is adjusted if conditions of the restricted stock award are not met.
104
Business Combinations
We recognize and measure the assets acquired and liabilities assumed in a business combination based on their estimated fair values at the acquisition date. Any excess or surplus of the purchase consideration when compared to the fair value of the net tangible assets acquired, if any, is recorded as goodwill or gain from a bargain purchase. For all material acquisitions, management engages an independent valuation specialist to assist with the determination of fair value of the assets acquired, liabilities assumed, noncontrolling interest, if any, and goodwill, based on recognized business valuation methodologies. An income, market or cost valuation method may be utilized to estimate the fair value of the assets acquired, liabilities assumed, and noncontrolling interest, if any, in a business combination. The income valuation method represents the present value of future cash flows over the life of the asset using: (i) discrete financial forecasts, which rely on management’s estimates of revenue and operating expenses; (ii) long-term growth rates; and (iii) appropriate discount rates. The market valuation method uses prices paid for a reasonably similar asset by other purchasers in the market, with adjustments relating to any differences between the assets. The cost valuation method is based on the replacement cost of a comparable asset at prices at the time of the acquisition reduced for depreciation of the asset. If the initial accounting for the business combination is incomplete by the end of the reporting period in which the acquisition occurs, an estimate will be recorded. Subsequent to the acquisition date, and not later than one year from the acquisition date, we will record any material adjustments to the initial estimate based on new information obtained that would have existed as of the date of the acquisition. Any adjustment that arises from information obtained that did not exist as of the date of the acquisition will be recorded in the period of the adjustment. Acquisition-related costs are expensed as incurred in connection with each business combination.
Environmental Credits and Obligations
In order to comply with certain regulations, specifically the RFS2 requirements implemented by the EPA and the cap-and-trade emission reduction program and low carbon fuel standard implemented by the state of California, we are required to reduce our emissions, blend certain levels of biofuels or obtain allowances or credits to offset the obligations created by our operations. In regard to each program, we record an asset, included in other current or other noncurrent assets on the balance sheet, for allowances or credits owned in excess of our anticipated current period compliance requirements. The asset value is based on the product of the excess allowances or credits as of the balance sheet date, if any, and the weighted average cost of those allowances or credits. We record a liability, included in other current or other noncurrent liabilities on the balance sheet, when we are deficient allowances or credits based on the product of the deficient amount as of the balance sheet date, if any, and the market price of the allowances or credits at the balance sheet date. The cost of allowances or credits used for compliance is reflected in cost of revenues on the income statement.
Any gains or losses on the sale or expiration of allowances or credits are classified as other income on the income statement. Proceeds from offset or credits sales are included in investing activities - all other, net on the cash flow statement.
|
3
.
|
ACCOUNTING STANDARDS
|
Recently Adopted
ASU 2014-09, Revenue - Revenue from Contracts with Customers (ASC 606)
On January 1, 2018, we adopted the new revenue standard, applying the modified retrospective method, whereby a cumulative effect is recorded to opening retained earnings and ASC 606 is applied prospectively. We recorded a net increase of
$4 million
to our retained earnings balance as of January 1, 2018 due to the cumulative effect of applying the new revenue standard.
Impact of Adoption
The adoption of ASC 606 did not materially change our revenue recognition patterns. The most significant impacts of adopting ASC 606 for the period ended
December 31, 2018
are as follows:
|
•
|
a reduction of sales and other operating revenues of
$6.66 billion
for the year ended
December 31, 2018
due to our accounting policy election to present taxes incurred concurrently with revenue producing transactions and collected on behalf of our customers on a net basis. For the year ended
December 31, 2017
, taxes are reflected on a gross basis in sales and other operating revenues and cost of revenues, and include
$5.15 billion
of taxes that are now subject to our net basis accounting policy election.
|
|
•
|
an increase to both sales and other operating revenues and cost of revenues of
$502 million
for the year ended
December 31, 2018
related to certain Midstream contract provisions for third-party reimbursements, non-cash consideration and imbalances that require gross presentation under ASC 606. Comparative information continues to be reported under the accounting standards in effect for those periods.
|
Practical Expedients
We elected the completed contract practical expedient and only applied ASC 606 to contracts that were not completed as of January 1, 2018.
105
We do not disclose information on the future performance obligations for any contract with expected duration of one year or less at inception. As of
December 31, 2018
, we do not have future performance obligations that are material to future periods.
Receivables
On the accompanying consolidated balance sheets, receivables, less allowance for doubtful accounts primarily consists of customer receivables. Significant, non-customer balances included in our receivables at
December 31, 2018
include matching buy/sell receivables of
$1.64 billion
and income taxes receivables of
$88 million
.
ASU 2016-16, Income Taxes - Intra-Entity Transfers of Assets Other Than Inventory
We adopted this ASU in the first quarter of 2018 and recorded a
$62 million
cumulative-effect adjustment as an increase to retained earnings as of January 1, 2018 with the offset recorded as a reduction to deferred income taxes.
We also adopted the following ASUs during 2018, none of which had a material impact to our financial statements or financial statement disclosures:
|
ASU
|
Effective Date
|
||
|
2017-09
|
Stock Compensation - Scope of Modification Accounting
|
January 1, 2018
|
|
|
2017-07
|
Retirement Benefits - Improving the Presentation of Net Periodic Pension Cost and Net Periodic Postretirement Cost
|
January 1, 2018
|
|
|
2017-05
|
Gains and Losses from the Derecognition of Nonfinancial Assets - Clarifying the Scope of Asset Derecognition Guidance
|
January 1, 2018
|
|
|
2017-01
|
Business Combinations - Clarifying the Definition of a Business
|
January 1, 2018
|
|
|
2016-18
|
Statement of Cash Flows - Restricted Cash
|
January 1, 2018
|
|
|
2016-15
|
Statement of Cash Flows - Classification of Certain Cash Receipts and Cash Payments
|
January 1, 2018
|
|
|
2016-01
|
Financial Instruments - Recognition and Measurement of Financial Assets and Liabilities
|
January 1, 2018
|
|
Not Yet Adopted
ASU 2018-02, Reporting Comprehensive Income - Reclassification of Certain Tax Effects from Accumulated Other Comprehensive Income
In February 2018, the FASB issued an ASU allowing an entity the choice to reclassify to retained earnings the tax effects related to the TCJA that are stranded in accumulated other comprehensive income. The amendment was effective January 1, 2019. We do not expect the application of this accounting standard update to have a material impact on our consolidated financial statements.
ASU 2017-12, Derivatives and Hedging - Targeted Improvements to Accounting for Hedging Activities
In August 2017, the FASB issued an ASU to amend the hedge accounting rules to simplify the application of hedge accounting guidance and better portray the economic results of risk management activities in the financial statements. The guidance expands the ability to hedge nonfinancial and financial risk components, reduces complexity in fair value hedges of interest rate risk, eliminates the requirement to separately measure and report hedge ineffectiveness and eases certain hedge effectiveness assessment requirements. The guidance was effective January 1, 2019. We do not expect the application of this accounting standard update to have a material impact on our consolidated financial statements.
ASU 2017-04, Intangibles - Goodwill and Other - Simplifying the Test for Goodwill Impairment
In January 2017, the FASB issued an ASU which simplifies the subsequent measurement of goodwill by eliminating Step 2 from the goodwill impairment test. Under the new guidance, the recognition of an impairment charge is calculated based on the amount by which the carrying amount exceeds the reporting unit’s fair value, which could be different from the amount calculated under the current method using the implied fair value of the goodwill; however, the loss recognized should not exceed the total amount of goodwill allocated to that reporting unit. The guidance should be applied on a prospective basis, and is effective for annual or any interim goodwill impairment tests in fiscal years beginning after December 15, 2019.
ASU 2016-13, Credit Losses - Measurement of Credit Losses on Financial Instruments
In June 2016, the FASB issued an ASU related to the accounting for credit losses on certain financial instruments. The guidance requires that for most financial assets, losses be based on an expected loss approach which includes estimates of losses over the life of exposure that considers historical, current and forecasted information. Expanded disclosures related to the methods used to estimate the losses as well as a specific disaggregation of balances for financial assets are also required. The change is effective for fiscal years beginning after December 15, 2019, and interim periods within those fiscal years, with early adoption
106
permitted for fiscal years beginning after December 15, 2018, and interim periods within those fiscal years. We do not expect application of this ASU to have a material impact on our consolidated financial statements.
ASU 2016-02 Leases
and related updates
In February 2016, the FASB issued an ASU requiring lessees to record virtually all leases on their balance sheets. The ASU also requires expanded disclosures to help financial statement users better understand the amount, timing and uncertainty of cash flows arising from leases. For lessors, this amended guidance modifies the classification criteria and the accounting for sales-type and direct financing leases. The guidance will be effective for fiscal years beginning after December 15, 2018, and interim periods within those years. As of January 1, 2019, we have transitioned to the new guidance.
As part of implementing this standard, we evaluated the impact of this standard on our financial statements, disclosures, internal controls and accounting policies. This evaluation process included reviewing all forms of leases, performing a completeness assessment over the lease population and analyzing the practical expedients in order to determine the best path of implementing changes to existing processes and controls. We have implemented a third-party supported lease accounting information system to account for our lease population in accordance with this new standard and established internal controls over the new system. We expect that adoption of the standard will result in the recognition of right-of-use assets and lease liabilities for operating leases on January 1, 2019 in the range of
$2.5 billion
to
$3.0 billion
. The adoption of ASC 842 will not have a material impact on our consolidated statements of income or cash flows, except for the potential effects from lease modifications where MPLX is the lessor as discussed below.
In addition, based on the changes presented in the standard, MPLX, as a lessor, may be required to re-classify existing operating leases to sales-type leases upon modification and related reassessment of the leases. If such modification were to occur, it may result in a de-recognition of existing assets, recognition of a receivable in the amount of the present value of fixed payments expected to be received by MPLX under the lease, and recognition of a corresponding gain or loss in the period of change.
|
4
.
|
MASTER LIMITED PARTNERSHIPS
|
MPLX
MPLX is a diversified, large-cap publicly traded master limited partnership formed by us to own, operate, develop and acquire midstream energy infrastructure assets. MPLX is engaged in the transportation, storage and distribution of crude oil and refined petroleum products; gathering, processing and transportation of natural gas; and the gathering, transportation, fractionation, storage and marketing of NGLs.As of
December 31, 2018
, we owned
63.6 percent
of the outstanding MPLX common units and we control MPLX through our ownership of the general partner of MPLX.
Private Placement of Preferred Units
On May 13, 2016, MPLX completed the private placement of approximately
30.8 million
6.5 percent
Series A Convertible Preferred Units (the “MPLX Preferred Units”) at a cash price of
$32.50
per unit. The aggregate net proceeds of approximately
$984 million
from the sale of the MPLX Preferred Units were used by MPLX for capital expenditures, repayment of debt and general partnership purposes.
The MPLX Preferred Units rank senior to all MPLX common units with respect to distributions and rights upon liquidation. The holders of the MPLX Preferred Units received cumulative quarterly distributions equal to
$0.528125
per unit for the quarters prior to the second quarter of 2018. Beginning with the second quarter of 2018, the holders of the MPLX Preferred Units are entitled to receive a quarterly distribution equal to the greater of
$0.528125
per unit or the amount of distributions they would have received on an as converted basis. For the income earned in the second through fourth quarters of 2018, the distribution rate declared to MPLX common unitholders was greater than $0.528125 per unit; accordingly, the holders of the MPLX Preferred Units received the common unit rates in lieu of the lower $0.528125 base amount.
The MPLX Preferred Units are considered redeemable securities due to the existence of redemption provisions upon a deemed liquidation event which is considered outside MPLX’s control. Therefore, they are presented as temporary equity in the mezzanine section of the consolidated balance sheets. We have recorded the MPLX Preferred Units at their issuance date fair value, net of issuance costs. Since the MPLX Preferred Units are not currently redeemable and not probable of becoming redeemable in the future, adjustment to the initial carrying amount is not necessary and would only be required if it becomes probable that the security would become redeemable.
107
Dropdowns to MPLX and GP/IDR Exchange
On February 1, 2018, we contributed our refining logistics assets and fuels distribution services to MPLX in exchange for
$4.1 billion
in cash and approximately
112 million
common units and
2 million
general partner units from MPLX. MPLX financed the cash portion of the transaction with its
$4.1 billion
364
-day term loan facility, which was entered into on January 2, 2018. We agreed to waive approximately one-third of the first quarter 2018 distributions on the common units issued in connection with this transaction. The contributions of these assets were accounted for as transactions between entities under common control and we did not record a gain or loss.
Immediately following the February 1, 2018 dropdown to MPLX, our IDRs were cancelled and our economic general partner interest was converted into a non-economic general partner interest, all in exchange for
275 million
newly issued MPLX common units (“GP/IDR Exchange”). As a result of this transaction, the general partner units and IDRs were eliminated, are no longer outstanding and longer participate in distributions of cash from MPLX.
On September 1, 2017, we contributed our joint-interest ownership in certain pipelines and storage facilities to MPLX in exchange for
$420 million
in cash and approximately
19 million
MPLX common units and
378 thousand
general partner units from MPLX. We also agreed to waive approximately two-thirds of the third quarter 2017 common unit distributions, IDRs and general partner distributions with respect to the common units issued in this transaction. The contributions of these assets were accounted for as transactions between entities under common control and we did not record a gain or loss.
On March 1, 2017, we contributed certain terminal, pipeline and storage assets to MPLX in exchange total consideration of
$1.5 billion
in cash and approximately
13 million
common units and
264 thousand
general partner units from MPLX. We also agreed to waive two-thirds of the first quarter 2017 common unit distributions, IDRs and general partner distributions with respect to the common units issued in the transaction. The contributions of these assets were accounted for as transactions between entities under common control and we did not record a gain or loss.
On March 31, 2016, we contributed our inland marine business to MPLX in exchange for
23 million
MPLX common units and
460 thousand
MPLX general partner units. We also agreed to waive first-quarter 2016 common unit distributions, IDRs and general partner distributions with respect to the common units issued in this transaction. The contribution of our inland marine business was accounted for as a transaction between entities under common control and therefore, we did not record a gain or loss.
Agreements
We have various long-term, fee-based commercial agreements with MPLX. Under these agreements, MPLX provides transportation, storage, distribution and marketing services to us. Under certain agreements, we commit to provide MPLX with minimum quarterly throughput and distribution volumes of crude oil and refined products and minimum storage volumes of crude oil, refined products and butane. Under certain other agreements, we commit to pay for 100 percent of available capacity for certain marine transportation and refining logistics assets. We also have agreements with MPLX that establish fees for operational and management services provided between us and MPLX and for executive management services and certain general and administrative services provided by us to MPLX. These transactions are eliminated in consolidation, but are reflected as intersegment transactions between our Refining & Marketing and Midstream segments.
ANDX
Through the Andeavor acquisition, we acquired control of ANDX, which is a publicly traded limited partnership that was formed to own, operate, develop and acquire logistics assets. Its assets are integral to the success of our refining and marketing operations and are used to gather crude oil, natural gas, and water, process natural gas and distribute, transport and store crude oil and refined products. ANDX provides us with various pipeline transportation, trucking, terminal distribution, storage and petroleum-coke handling services under long-term, fee-based commercial agreements. Each of these agreements, with the exception of the storage and transportation services agreement, contain minimum volume commitments.
As of
December 31, 2018
, we owned
63.6 percent
of the outstanding ANDX common units. We also hold
80,000
ANDX TexNew Mex Units and all the outstanding non-economic general partner interests as of
December 31, 2018
.
108
Noncontrolling Interest
As a result of equity transactions of MPLX and ANDX, we are required to adjust non-controlling interest and additional paid-in capital. Changes in MPC’s additional paid-in capital resulting from changes in its ownership interest in MPLX and ANDX were as follows:
|
(In millions)
|
2018
|
2017
|
2016
|
||||||||
|
Increase (decrease) due to the issuance of MPLX & ANDX common units to the public
|
$
|
6
|
|
$
|
25
|
|
$
|
(60
|
)
|
||
|
Increase due to the issuance of MPLX & ANDX common units and general partner units to MPC
|
1,114
|
|
114
|
|
121
|
|
|||||
|
Increase due to GP/IDR Exchange
|
1,808
|
|
—
|
|
—
|
|
|||||
|
Increase in MPC's additional paid-in capital
|
2,928
|
|
139
|
|
61
|
|
|||||
|
Tax impact
|
(571
|
)
|
(29
|
)
|
(118
|
)
|
|||||
|
Increase (decrease) in MPC's additional paid-in capital, net of tax
|
$
|
2,357
|
|
$
|
110
|
|
$
|
(57
|
)
|
||
|
5
.
|
ACQUISITIONS
|
Acquisition of Andeavor
On October 1, 2018, we acquired all the outstanding shares of Andeavor. Under the terms of the merger agreement, Andeavor stockholders had the option to choose
1.87
shares of MPC common stock or
$152.27
in cash per share of Andeavor common stock. The merger agreement included election proration provisions that resulted in approximately
22.9 million
shares of Andeavor common stock being converted into cash consideration and the remaining
128.2 million
shares of Andeavor common stock being converted into stock consideration. Andeavor stockholders received in the aggregate approximately
239.8 million
shares of MPC common stock valued at
$19.8 billion
and approximately
$3.5 billion
in cash in connection with the Andeavor acquisition. The fair value of the MPC shares issued was determined on the basis of the closing market price of MPC’s common shares on the acquisition date. The cash portion of the purchase price was funded using cash on hand.
At the time of the acquisition, all Andeavor equity awards, with the exception of non-employee director units, were converted to MPC equity awards. The converted equity awards will continue to be governed by the same terms and conditions as were applicable to such Andeavor equity awards immediately prior to the acquisition. We recognized
$203 million
of purchase consideration to reflect the portion of the fair value of the time-based converted equity awards attributable to pre-combination service completed by the award holders. The non-employee director units were accelerated in full and cancelled and the holders of such units received an amount of cash equal to the number of shares of Andeavor common stock subject to such non-employee director units multiplied by the cash consideration per share.
Our financial reflect the results of Andeavor from October 1, 2018, the date of the acquisition.
The components of the fair value of consideration transferred are as follows:
|
(In millions)
|
||||
|
Fair value of MPC shares issued
|
$
|
19,766
|
|
|
|
Cash payment to Andeavor stockholders
|
3,486
|
|
||
|
Cash settlement of non-employee director units
|
7
|
|
||
|
Fair value of converted equity awards
|
203
|
|
||
|
Total fair value of consideration transferred
|
$
|
23,462
|
|
|
We accounted for the Andeavor acquisition using the acquisition method of accounting, which requires Andeavor assets and liabilities to be recorded to our balance sheet at fair value as of the acquisition date. We will complete a final determination of the fair value of certain assets and liabilities within the one year measurement period from the date of the acquisition as required by FASB ASC Topic 805, “Business Combinations”. Due to the level of effort required to develop fair value measurements and the proximity of the acquisition date to December 31, 2018, the valuation studies necessary to determine the fair value of assets acquired and liabilities assumed are preliminary, including the underlying cash flows used to determine the fair value of identified intangible assets and economic obsolescence adjustments to property, plant and equipment. The size and the breath of the Andeavor acquisition necessitates the use of the one year measurement period to fully analyze all the factors used in establishing the asset and liability fair values as of the acquisition date, including, but not limited to, property, plant and equipment, intangible assets, real property, leases, environmental and asset retirement obligations and the related tax impacts of any changes made. Any potential adjustments made could be material in relation to the preliminary values presented below.
109
|
(In millions)
|
||||
|
Cash and cash equivalents
|
$
|
382
|
|
|
|
Receivables
|
2,744
|
|
||
|
Inventories
|
5,204
|
|
||
|
Other current assets
|
378
|
|
||
|
Equity method investments
|
865
|
|
||
|
Property, plant and equipment, net
|
16,545
|
|
||
|
Other noncurrent assets
(a)
|
3,086
|
|
||
|
Total assets acquired
|
29,204
|
|
||
|
Accounts payable
|
4,003
|
|
||
|
Payroll and benefits payable
|
348
|
|
||
|
Accrued taxes
|
590
|
|
||
|
Debt due within one year
|
34
|
|
||
|
Other current liabilities
|
392
|
|
||
|
Long-term debt
|
8,875
|
|
||
|
Deferred income taxes
|
1,609
|
|
||
|
Defined benefit postretirement plan obligations
|
432
|
|
||
|
Deferred credit and other liabilities
|
714
|
|
||
|
Noncontrolling interests
|
5,059
|
|
||
|
Total liabilities and noncontrolling interest assumed
|
22,056
|
|
||
|
Net assets acquired excluding goodwill
|
7,148
|
|
||
|
Goodwill
|
16,314
|
|
||
|
Net assets acquired
|
$
|
23,462
|
|
|
|
(a)
|
Includes intangible assets.
|
Details of our valuation methodology and significant inputs for fair value measurements are included by asset class below. The fair value measurements for equity method investments, property, plant and equipment, intangible assets and long-term debt are based on significant inputs that are not observable in the market and, therefore, represent Level 3 measurements.
Goodwill
The preliminary purchase consideration allocation resulted in the recognition of
$16.3 billion
in goodwill, of which
$893 million
is tax deductible due to a carryover basis from Andeavor. Our Refining & Marketing, Midstream and Retail segments recognized
$4.7 billion
,
$7.7 billion
and
$3.9 billion
of preliminary goodwill. The recognized goodwill represents the value expected to be created by further optimization of crude supply, a nationwide retail and marketing platform, diversification of our refining and midstream footprints and optimization of information systems and business processes.
Inventory
The fair value of inventory was determined by recognizing crude oil and feedstocks at market prices as of October 1, 2018 and recognizing refined product inventory at market prices less selling costs and profit margin associated with the remaining distribution process.
Equity Method Investments
The fair value of the equity method investments was determined based on applying income and market approaches. The income approach relied on the discounted cash flow method and the market approach relied on a market multiple approach considering historical and projected financial results. Discount rates for the discounted cash flow models were based on capital structures for similar market participants and included various risk premiums that account for risks associated with the specific investments. For more information about our equity method investments, see Note
14
.
Property, Plant and Equipment
The preliminary fair value of property, plant and equipment is
$16.5 billion
, which is based primarily on the cost approach. Key assumptions in the cost approach include determining the replacement cost by evaluating recent purchases of similar assets or published data, and adjusting replacement cost for economic and functional obsolescence, location, normal useful lives, and capacity (if applicable).
110
Acquired Intangible Assets
The preliminary fair value of the acquired identifiable intangible assets is
$2.8 billion
, which represents the value of various customer contracts and relationships, brand rights and tradenames and other intangible assets. The preliminary fair value of customer contracts and relationships is
$2.5 billion
, which was valued by applying the multi-period excess earnings method, which is an income approach. Key assumptions in the income approach include the underlying contract cash flow estimates, remaining contract term, probability of renewal, growth rates and discount rates. Brand rights and tradenames were valued by applying the relief of royalty method, which is an income approach. The intangible assets are all finite lived and will be amortized over
2
to
10
years.
Debt
The fair value of the Andeavor and ANDX unsecured notes was measured using a market approach, based upon the average of quotes for the acquired debt from major financial institutions and a third-party valuation service. Additionally,
$1.5 billion
of borrowings under revolving credit agreements and other debt of approximately
$200 million
approximated fair value.
Noncontrolling Interest
Through the Andeavor acquisition, we acquired the general partnership interest of ANDX, which is a VIE because the limited partners of ANDX do not have substantive kick-out or substantive participating rights over the general partner. We are the primary beneficiary of ANDX because in addition to our significant economic interest, we also have the ability, through our 100 percent ownership of the general partner, to control the decisions that most significantly impact ANDX. The fair value of the noncontrolling interest in ANDX was based on the share price, shares outstanding and the percent of public unitholders of ANDX on October 1, 2018. The share price of ANDX is a Level 1 measurement.
Acquisition Costs
We recognized
$47 million
in acquisition costs. Additionally, we recognized various other transaction-related costs, including employee-related costs associated with the Andeavor acquisition. All of these costs are reflected in selling, general and administrative expenses for the year ended December 31, 2018. The employee-related costs are primarily due to pre-existing Andeavor change in control and equity award agreements that create obligations and accelerated equity vesting upon MPC notifying employees of significant changes to or elimination of their responsibilities as part of our ongoing integration efforts.
Andeavor Revenues and Income from Operations
Andeavor’s results have been included in MPC’s financial statements for the period subsequent to the date of the acquisition on October 1, 2018. Andeavor contributed revenues of approximately
$11.3 billion
for the period from October 1 through December 31, 2018. We do not believe it is practical to disclose Andeavor’s contribution to earnings for the period from October 1, 2018 through December 31, 2018 as our integration efforts have resulted in the elimination of Andeavor stand-alone discrete financial information due mainly to our inclusion of Andeavor inventory in our consolidated LIFO inventory pools, which does not allow us to objectively distinguish the cost of sales between the two historical reporting entities.
Pro Forma Financial Information
The following unaudited pro forma financial information presents consolidated results assuming the Andeavor acquisition occurred on January 1, 2017.
|
(In millions, except per share data)
|
2018
|
2017
|
||||||
|
Sales and other operating revenues
(a)
|
$
|
131,695
|
|
$
|
117,549
|
|
||
|
Net income attributable to MPC
|
4,371
|
|
4,832
|
|
||||
|
Net income attributable to MPC per share – basic
|
$
|
8.44
|
|
$
|
6.47
|
|
||
|
Net income attributable to MPC per share – diluted
|
8.31
|
|
6.41
|
|
||||
|
(a)
|
The 2018 period reflects an election to present certain taxes on a net basis concurrent with our adoption of ASC 606.
|
The pro forma information includes adjustments to align accounting policies, an adjustment to depreciation expense to reflect the increased fair value of property, plant and equipment, increased amortization expense related to identifiable intangible assets and the related income tax effects. The pro forma information does not reflect the
$727 million
effect on net income attributable to MPC related to purchase accounting related inventory effects and transaction-related costs as these charges do not have a continuing impact on the consolidated results.
111
Acquisition of Express Mart
During the fourth quarter of 2018, Speedway acquired
78
store locations from Petr-All Petroleum Consulting Corporation for total consideration of
$266 million
. These stores are located primarily in the Syracuse, Rochester and Buffalo markets in New York and operate under the Express Mart brand.
Based on the final fair value estimates of assets acquired and liabilities assumed at the acquisition date,
$97 million
of the purchase price was allocated to property, plant and equipment,
$9 million
to inventory,
$2 million
to intangibles and
$158 million
to goodwill. Goodwill is tax deductible and represents the value expected to be created by geographically expanding our retail platform and the assembled workforce.
The amount of revenue and income from operations associated with the acquisition from the acquisition date to December 31, 2018 did not have a material impact on the consolidated financial statements. In addition, assuming the acquisition had occurred on January 1, 2017, the consolidated pro forma results would not have been materially different from the reported results.
Acquisition of Mt. Airy Terminal
On September 26, 2018, MPLX acquired an eastern U.S. Gulf Coast export terminal (“Mt. Airy Terminal”) from Pin Oak Holdings, LLC for total consideration of
$451 million
. The terminal includes
4 million
barrels of third-party leased storage capacity and a
120
mbpd dock. The Mt. Airy Terminal is located on the Mississippi River between New Orleans and Baton Rouge, near several Gulf Coast refineries, including our Garyville Refinery, and numerous rail lines and pipelines. The Mt. Airy Terminal is accounted for within the Midstream segment.
Based on the final fair value estimates of assets acquired and liabilities assumed at the acquisition date,
$336 million
of the purchase price was allocated to property, plant and equipment and
$126 million
to goodwill with the remaining difference being primarily allocated to net assumed liabilities. Goodwill is tax deductible and represents the significant growth potential of the terminal due to the multiple pipelines and rail lines which cross the property, the terminal’s position as an aggregation point for liquids growth in the region for both ocean-going vessels and inland barges, the proximity of the terminal to our Garyville refinery and other refineries in the region as well as the capability to construct an additional dock at the site.
The amount of revenue and income from operations associated with the acquisition from the terminal acquisition date to December 31, 2018 did not have a material impact on the consolidated financial statements. In addition, assuming the terminal acquisition had occurred on January 1, 2017, the consolidated pro forma results would not have been materially different from the reported results.
Acquisition of Ozark Pipeline
On March 1, 2017, MPLX acquired the Ozark pipeline from Enbridge Pipelines (Ozark) LLC for approximately
$219 million
, including purchase price adjustments made in the second quarter of 2017. Based on the fair value of assets acquired and liabilities assumed at the acquisition date, the final purchase price was primarily allocated to property, plant and equipment. The Ozark pipeline is a
433
-mile,
22
-inch crude oil pipeline originating in Cushing, Oklahoma, and terminating in Wood River, Illinois, capable of transporting approximately
230
mbpd. We present the Ozark pipeline within the Midstream segment.
The amount of revenue and income from operations associated with the acquisition from the acquisition date to December 31, 2017 did not have a material impact on the consolidated financial statements. In addition, assuming the acquisition of the Ozark pipeline had occurred on January 1, 2016, the consolidated pro forma results would not have been materially different from reported results.
Investment in Pipeline Company
On February 15, 2017, MPLX acquired a partial, indirect equity interest in the Dakota Access Pipeline (“DAPL”) and Energy Transfer Crude Oil Company Pipeline (“ETCOP”) projects, collectively referred to as the Bakken Pipeline system, through a joint venture with Enbridge Energy Partners L.P. (“Enbridge Energy Partners”). MPLX contributed
$500 million
of the
$2 billion
purchase price paid by the joint venture, MarEn Bakken Company LLC (“MarEn Bakken”), to acquire a
36.75 percent
indirect equity interest in the Bakken Pipeline system from Energy Transfer Partners, L.P. (“ETP”) and Sunoco Logistics Partners, L.P. (“SXL”). MPLX holds, through a subsidiary, a
25 percent
interest in MarEn Bakken, which equates to an approximate
9.2 percent
indirect equity interest in the Bakken Pipeline system. We account for the investment in MarEn Bakken as part of our Midstream segment using the equity method of accounting.
Formation of Gathering and Processing Joint Venture
Effective January 1, 2017, MPLX and Antero Midstream formed a joint venture, Sherwood Midstream LLC (“Sherwood Midstream”), to support the development of Antero Resources Corporation’s Marcellus Shale acreage in West Virginia. MPLX has a
50 percent
ownership interest in Sherwood Midstream. In connection with this transaction, MPLX contributed assets then
112
under construction at the Sherwood Complex with a fair value of approximately
$134 million
and cash of approximately
$20 million
. Antero Midstream made an initial capital contribution of approximately
$154 million
.
Also effective January 1, 2017, MPLX converted all of its ownership interests in MarkWest Ohio Fractionation Company, L.L.C. (“Ohio Fractionation”), a previously wholly-owned subsidiary, to Class A Interests and amended its LLC Agreement to create Class B-3 Interests, which were sold to Sherwood Midstream for
$126 million
in cash. The Class B-3 Interests provide Sherwood Midstream with the right to fractionation revenue and the obligation to pay expenses related to
20
mbpd of capacity in the Hopedale 3 fractionator.
Effective January 1, 2017, MPLX and Sherwood Midstream formed a joint venture, Sherwood Midstream Holdings LLC (“Sherwood Midstream Holdings”), for the purpose of owning, operating and maintaining all of the shared assets for the benefit of and use in the operation of the gas plants and other assets owned by Sherwood Midstream and the gas plants and deethanization facilities owned by MPLX. MPLX contributed certain real property, equipment and facilities with a fair value of approximately
$209 million
to Sherwood Midstream Holdings in exchange for a
79 percent
initial ownership interest. Sherwood Midstream contributed cash of approximately
$44 million
to Sherwood Midstream Holdings in exchange for a
21 percent
initial ownership interest. The net book value of the contributed assets was approximately
$203 million
. The contribution was determined to be an in-substance sale of real estate. As such, MPLX only recognized a gain for the portion attributable to Antero Midstream’s indirect interest of approximately
$2 million
.
We account for our direct interests in Sherwood Midstream and Sherwood Midstream Holdings as part of our Midstream segment using the equity method of accounting. We continue to consolidate Ohio Fractionation and have recognized a noncontrolling interest for Sherwood Midstream’s interest in that entity.
See Note
6
for additional information related to the investments in Sherwood Midstream, Ohio Fractionation and Sherwood Midstream Holdings.
Formation of Travel Plaza Joint Venture
In the fourth quarter of 2016, Speedway and Pilot Flying J finalized the formation of a joint venture consisting of travel plazas, primarily in the Southeast United States. The new entity, PFJ Southeast LLC (“PFJ Southeast”), originally consisted of
41
existing locations contributed by Speedway and
82
locations contributed by Pilot Flying J, all of which carry either the Pilot or Flying J brand and are operated by Pilot Flying J. We did not recognize a gain on the
$273 million
non-cash contribution of our travel plazas to the joint venture since the contribution was that of in-substance real estate. Our non-cash contribution consisted of
$203 million
of property, plant and equipment,
$62 million
of goodwill and
$8 million
of inventory.
|
6
.
|
VARIABLE INTEREST ENTITIES
|
Consolidated VIEs
We control MPLX and ANDX through our ownership of the general partner of both entities. MPLX and ANDX are VIEs because the limited partners do not have substantive kick-out or substantive participating rights over the general partner. We are the primary beneficiary of both MPLX and ANDX because in addition to our significant economic interest, we also have the ability, through our ownership of the general partner, to control the decisions that most significantly impact MPLX and ANDX. We therefore consolidate MPLX and ANDX and record a noncontrolling interest for the interest owned by the public. We also record a redeemable noncontrolling interest related to MPLX’s preferred units.
The creditors of MPLX and ANDX do not have recourse to MPC’s general credit through guarantees or other financial arrangements. MPC has effectively guaranteed certain indebtedness of LOOP LLC (“LOOP”) and LOCAP LLC (“LOCAP”), in which MPLX holds an interest. See Note
25
for more information.
113
The assets of MPLX and ANDX can only be used to settle their own obligations and their creditors have no recourse to our assets. The following table present balance sheet information for the assets and liabilities of MPLX and ANDX, which are included in our balance sheets.
|
December 31,
2018 |
December 31,
2017 |
||||||||||
|
(In millions)
|
MPLX
|
ANDX
(a)
|
MPLX
|
||||||||
|
Assets
|
|||||||||||
|
Cash and cash equivalents
|
$
|
68
|
|
$
|
10
|
|
$
|
5
|
|
||
|
Receivables, less allowance for doubtful accounts
|
425
|
|
199
|
|
299
|
|
|||||
|
Inventories
|
77
|
|
22
|
|
65
|
|
|||||
|
Other current assets
|
45
|
|
57
|
|
29
|
|
|||||
|
Equity method investments
|
4,174
|
|
602
|
|
4,010
|
|
|||||
|
Property, plant and equipment, net
|
14,639
|
|
6,845
|
|
12,187
|
|
|||||
|
Goodwill
|
2,586
|
|
1,051
|
|
2,245
|
|
|||||
|
Other noncurrent assets
|
458
|
|
1,242
|
|
479
|
|
|||||
|
Liabilities
|
|||||||||||
|
Accounts payable
|
$
|
776
|
|
$
|
215
|
|
$
|
621
|
|
||
|
Payroll and benefits payable
|
2
|
|
10
|
|
1
|
|
|||||
|
Accrued taxes
|
48
|
|
23
|
|
38
|
|
|||||
|
Debt due within one year
|
1
|
|
504
|
|
1
|
|
|||||
|
Other current liabilities
|
177
|
|
77
|
|
130
|
|
|||||
|
Long-term debt
|
13,392
|
|
4,469
|
|
6,945
|
|
|||||
|
Deferred income taxes
|
13
|
|
1
|
|
5
|
|
|||||
|
Defined benefit postretirement plan obligations
|
—
|
|
—
|
|
—
|
|
|||||
|
Deferred credits and other liabilities
|
276
|
|
68
|
|
230
|
|
|||||
|
(a)
|
The balances reflected here are ANDX’s historical balances as the preliminary purchase accounting adjustments related to ANDX’s assets and liabilities in connection with the Andeavor acquisition and reflected on our consolidated balance sheet as of December 31, 2018 have not yet been pushed down to this subsidiary.
|
Non-Consolidated VIEs
Crowley Coastal Partners
In May 2016, Crowley Coastal Partners LLC (“Crowley Coastal Partner”) was formed to own an interest in both Crowley Ocean Partners LLC (“Crowley Ocean Partners”) and Crowley Blue Water Partners LLC (“Crowley Blue Water Partners”). We have determined that Crowley Coastal Partners is a VIE based on the terms of the existing financing arrangements for Crowley Blue Water Partners and Crowley Ocean Partners and the associated debt guarantees by MPC and Crowley. Our maximum exposure to loss at
December 31, 2018
was
$481 million
, which includes our equity method investment in Crowley Coastal Partners and the debt guarantees provided to each of the lenders to Crowley Blue Water Partners and Crowley Ocean Partners. We are not the primary beneficiary of this VIE because we do not have the ability to control the activities that significantly influence the economic outcomes of the entity and, therefore, do not consolidate the entity.
MarkWest Utica EMG
On January 1, 2012, MarkWest Utica Operating Company, LLC (“Utica Operating”), a wholly-owned and consolidated subsidiary of MarkWest, and EMG Utica, LLC (“EMG Utica”), executed agreements to form a joint venture, MarkWest Utica EMG LLC (“MarkWest Utica EMG”), to develop significant natural gas gathering, processing and NGL fractionation, transportation and marketing infrastructure in eastern Ohio.
As of
December 31, 2018
, MarkWest had a
56 percent
legal ownership interest in MarkWest Utica EMG. MarkWest Utica EMG's inability to fund its planned activities without subordinated financial support qualify it as a VIE. Utica Operating is not deemed to be the primary beneficiary due to EMG Utica’s voting rights on significant matters. We account for our ownership interest in MarkWest Utica EMG as an equity method investment. Our maximum exposure to loss as a result of our involvement with MarkWest Utica EMG includes our equity investment, any additional capital contribution commitments and any operating expenses incurred by the subsidiary operator in excess of compensation received for the performance of the operating services. Our equity investment in MarkWest Utica EMG at
December 31, 2018
was
$2.0 billion
.
114
Ohio Gathering
Ohio Gathering Company, L.L.C. (“Ohio Gathering”) is a subsidiary of MarkWest Utica EMG and is engaged in providing natural gas gathering services in the Utica Shale in eastern Ohio. Ohio Gathering is a joint venture between MarkWest Utica EMG and Summit Midstream Partners, LLC. As of
December 31, 2018
, we had a
34 percent
indirect ownership interest in Ohio Gathering. As this entity is a subsidiary of MarkWest Utica EMG, which is accounted for as an equity method investment, MPLX reports its portion of Ohio Gathering’s net assets as a component of its investment in MarkWest Utica EMG.
Sherwood Midstream
As described in Note
5
, MPLX and Antero Midstream formed a joint venture, Sherwood Midstream, to support the development of Antero Resources Corporation’s Marcellus Shale acreage in West Virginia. As of
December 31, 2018
, MPLX had a
50 percent
ownership interest in Sherwood Midstream. Sherwood Midstream’s inability to fund its planned activities without additional subordinated financial support qualify it as a VIE. MPLX is not deemed to be the primary beneficiary, due to Antero Midstream’s voting rights on significant matters. We account for our ownership interest in Sherwood Midstream using the equity method of accounting. Our maximum exposure to loss as a result of our involvement with Sherwood Midstream includes our equity investment, any additional capital contribution commitments and any operating expenses incurred by the subsidiary operator in excess of compensation received for the performance of the operating services. Our equity investment in Sherwood Midstream at
December 31, 2018
was
$366 million
.
Ohio Fractionation
As described in Note
5
, MPLX converted all of its ownership interests in Ohio Fractionation to Class A Interests and amended its LLC Agreement to create Class B-3 Interests, which were sold to Sherwood Midstream, providing it with the right to fractionation revenue and the obligation to pay expenses related to
20
mbpd of capacity in the Hopedale 3 fractionator. Ohio Fractionation’s inability to fund its operations without additional subordinated financial support qualify it as a VIE. MPLX has been deemed to be the primary beneficiary of Ohio Fractionation because it has control over decisions that could significantly impact its financial performance, and as a result, consolidates Ohio Fractionation.
Sherwood Midstream Holdings
As described in Note
5
, MPLX and Sherwood Midstream entered into a joint venture, Sherwood Midstream Holdings, for the purpose of owning, operating and maintaining all of the shared assets for the benefit of and use in the operation of the gas plants and other assets owned by Sherwood Midstream and the gas plants and deethanization facilities owned by MPLX. MPLX had an initial
79 percent
direct ownership in Sherwood Midstream Holdings, in addition to an initial
10.5 percent
indirect interest through its ownership in Sherwood Midstream. Sherwood Midstream Holdings’ inability to fund its operations without additional subordinated financial support qualify it as a VIE. We account for our ownership interest in Sherwood Midstream Holdings using the equity method of accounting as Sherwood Midstream is considered to be the general partner and controls all decisions related to Sherwood Midstream Holdings. Our maximum exposure to loss as a result of our involvement with Sherwood Midstream Holdings includes our equity investment, any additional capital contribution commitments and any operating expenses incurred by the subsidiary operator in excess of compensation received for the performance of the operating services. Our equity investment in Sherwood Midstream Holdings at
December 31, 2018
was
$157 million
.
Other Non-Consolidated VIEs
We have a
67 percent
ownership interest in Andeavor Logistics Rio Pipeline LLC (“ALRP”), a recently constructed crude oil pipeline located in the Delaware and Midland basins in west Texas. We are not the primary beneficiary of ALRP because we jointly direct the activities of ALRP that most significantly impact its economic performance with the other minor shareholder. Our equity investment in ALRP at
December 31, 2018
was
$181 million
.
We have a
78 percent
ownership interest in Rendezvous Gas Services, LLC (“RGS”), which owns and operates the infrastructure that transports gas from certain fields to several re-delivery points in southwestern Wyoming, including natural gas processing facilities that are owned by us or a third party. We are not the primary beneficiary of RGS. Our equity investment in RGS at
December 31, 2018
was
$248 million
.
ALRP and RGS are unconsolidated variable interest entities and we use the equity method of accounting with respect to our investments in each entity.
115
|
7
.
|
RELATED PARTY TRANSACTIONS
|
We believe that transactions with related parties were conducted on terms comparable to those with unaffiliated parties.
Transactions with related parties were as follows:
|
(In millions)
|
2018
|
2017
|
2016
|
||||||||
|
Sales to related parties
(a)
|
$
|
754
|
|
$
|
629
|
|
$
|
62
|
|
||
|
Purchases from related parties
(b)
|
610
|
|
570
|
|
509
|
|
|||||
|
(a)
|
Sales to related parties consists primarily of sales of refined products to PFJ Southeast, an equity affiliate which owns and operates travel plazas primarily in the Southeast region of the United States.
|
|
(b)
|
We obtain transportation services and purchase ethanol from certain of our equity affiliates, none of which is individually material.
|
|
8
.
|
INCOME PER COMMON SHARE
|
We compute basic earnings per share by dividing net income attributable to MPC less income allocated to participating securities by the weighted average number of shares of common stock outstanding. Since MPC grants certain incentive compensation awards to employees and non-employee directors that are considered to be participating securities, we have calculated our earnings per share using the two-class method. Diluted income per share assumes exercise of certain stock-based compensation awards, provided the effect is not anti-dilutive.
|
(In millions, except per share data)
|
2018
|
2017
|
2016
|
||||||||
|
Basic earnings per share:
|
|||||||||||
|
Allocation of earnings:
|
|||||||||||
|
Net income attributable to MPC
|
$
|
2,780
|
|
$
|
3,432
|
|
$
|
1,174
|
|
||
|
Income allocated to participating securities
|
1
|
|
2
|
|
1
|
|
|||||
|
Income available to common stockholders – basic
|
$
|
2,779
|
|
$
|
3,430
|
|
$
|
1,173
|
|
||
|
Weighted average common shares outstanding
|
518
|
|
507
|
|
528
|
|
|||||
|
Basic earnings per share
|
$
|
5.36
|
|
$
|
6.76
|
|
$
|
2.22
|
|
||
|
Diluted earnings per share:
|
|||||||||||
|
Allocation of earnings:
|
|||||||||||
|
Net income attributable to MPC
|
$
|
2,780
|
|
$
|
3,432
|
|
$
|
1,174
|
|
||
|
Income allocated to participating securities
|
1
|
|
2
|
|
1
|
|
|||||
|
Income available to common stockholders – diluted
|
$
|
2,779
|
|
$
|
3,430
|
|
$
|
1,173
|
|
||
|
Weighted average common shares outstanding
|
518
|
|
507
|
|
528
|
|
|||||
|
Effect of dilutive securities
|
8
|
|
5
|
|
2
|
|
|||||
|
Weighted average common shares, including dilutive effect
|
526
|
|
512
|
|
530
|
|
|||||
|
Diluted earnings per share
|
$
|
5.28
|
|
$
|
6.70
|
|
$
|
2.21
|
|
||
The following table summarizes the shares that were anti-dilutive, and therefore, were excluded from the diluted share calculation.
|
(In millions)
|
2018
|
2017
|
2016
|
|||||
|
Shares issuable under stock-based compensation plans
|
—
|
|
1
|
|
3
|
|
||
|
9
.
|
EQUITY
|
On October 1, 2018, in connection with the Andeavor acquisition, we amended our certificate of incorporation to increase the number of authorized shares of MPC common stock from
one billion
to
two billion
, as approved by MPC stockholders at MPC’s September 24, 2018 special meeting of stockholders.
As of
December 31, 2018
, we had
$4.90 billion
of remaining share repurchase authorizations from our board of directors. We may utilize various methods to effect the repurchases, which could include open market repurchases, negotiated block transactions, accelerated share repurchases or open market solicitations for shares, some of which may be effected through Rule
116
10b5-1 plans. The timing and amount of future repurchases, if any, will depend upon several factors, including market and business conditions, and such repurchases may be discontinued at any time.
Total share repurchases were as follows for the respective periods:
|
(In millions, except per share data)
|
2018
|
2017
|
2016
|
||||||||
|
Number of shares repurchased
|
47
|
|
44
|
|
4
|
|
|||||
|
Cash paid for shares repurchased
|
$
|
3,287
|
|
$
|
2,372
|
|
$
|
197
|
|
||
|
Average cost per share
|
$
|
69.46
|
|
$
|
53.85
|
|
$
|
41.84
|
|
||
|
10
.
|
SEGMENT INFORMATION
|
We have
three
reportable segments: Refining & Marketing;
Retail
; and
Midstream
. Each of these segments is organized and managed based upon the nature of the products and services it offers.
|
•
|
Refining & Marketing – refines crude oil and other feedstocks at our
16
refineries
in the West Coast, Gulf Coast and Mid-Continent regions of the United States, purchases refined products and ethanol for resale and distributes refined products largely through transportation, storage, distribution and marketing services provided largely by our Midstream segment. We sell refined products to wholesale marketing customers domestically and internationally, to buyers on the spot market, to our Retail business segment and to independent entrepreneurs who operate primarily Marathon
®
branded outlets.
|
|
•
|
Retail – sells transportation fuels and convenience products in the retail market across the United States through company-owned and operated convenience stores, primarily under the Speedway brand, and long-term fuel supply contracts with direct dealers who operate locations mainly under the ARCO brand.
|
|
•
|
Midstream – transports, stores, distributes and markets crude oil and refined products principally for the Refining & Marketing segment via refining logistics assets, pipelines, terminals, towboats and barges; gathers, processes and transports natural gas; and gathers, transports, fractionates, stores and markets NGLs. The Midstream segment primarily reflects the results of MPLX and ANDX, our sponsored master limited partnerships.
|
On October 1, 2018, we acquired Andeavor and its results are included in each of our segments from the date of the acquisition. Also, on February 1, 2018, we contributed certain refining logistics assets and fuels distribution services to MPLX. The results of these new businesses are reported in the Midstream segment prospectively from February 1, 2018, resulting in a net reduction of
$874 million
to Refining & Marketing segment results and a net increase to Midstream segment results of the same amount. No effect was given to prior periods as these entities were not considered businesses prior to February 1, 2018.
Segment income represents income from operations attributable to the reportable segments. Corporate administrative expenses, except for those attributable to MPLX and ANDX, and costs related to certain non-operating assets are not allocated to the reportable segments. In addition, certain items that affect comparability (as determined by the chief operating decision maker) are not allocated to the reportable segments. In the third quarter of 2018, we began reporting segment capital expenditures and investments excluding acquisitions in the current and comparative periods.
|
(In millions)
|
Refining & Marketing
|
Retail
|
Midstream
|
Total
|
|||||||||||
|
Year Ended December 31, 2018
|
|||||||||||||||
|
Revenues:
|
|||||||||||||||
|
Third party
|
$
|
68,939
|
|
$
|
23,538
|
|
$
|
3,273
|
|
$
|
95,750
|
|
|||
|
Intersegment
|
12,914
|
|
6
|
|
3,387
|
|
16,307
|
|
|||||||
|
Related party
|
746
|
|
8
|
|
—
|
|
754
|
|
|||||||
|
Segment revenues
|
$
|
82,599
|
|
$
|
23,552
|
|
$
|
6,660
|
|
$
|
112,811
|
|
|||
|
Segment income from operations
|
$
|
2,481
|
|
$
|
1,028
|
|
$
|
2,752
|
|
$
|
6,261
|
|
|||
|
Income from equity method investments
(b)
|
15
|
|
74
|
|
274
|
|
363
|
|
|||||||
|
Depreciation and amortization
(b)
|
1,174
|
|
353
|
|
885
|
|
2,412
|
|
|||||||
|
Capital expenditures and investments
(c)
|
1,057
|
|
460
|
|
2,630
|
|
4,147
|
|
|||||||
117
|
(In millions)
|
Refining & Marketing
|
Retail
|
Midstream
|
Total
|
|||||||||||
|
Year Ended December 31, 2017
|
|||||||||||||||
|
Revenues:
|
|||||||||||||||
|
Third party
|
$
|
52,761
|
|
$
|
19,021
|
|
$
|
2,322
|
|
$
|
74,104
|
|
|||
|
Intersegment
(a)
|
11,309
|
|
4
|
|
1,443
|
|
12,756
|
|
|||||||
|
Related party
|
621
|
|
8
|
|
—
|
|
629
|
|
|||||||
|
Segment revenues
|
$
|
64,691
|
|
$
|
19,033
|
|
$
|
3,765
|
|
$
|
87,489
|
|
|||
|
Segment income from operations
|
$
|
2,321
|
|
$
|
729
|
|
$
|
1,339
|
|
$
|
4,389
|
|
|||
|
Income from equity method investments
(b)
|
17
|
|
69
|
|
197
|
|
283
|
|
|||||||
|
Depreciation and amortization
(b)
|
1,082
|
|
275
|
|
699
|
|
2,056
|
|
|||||||
|
Capital expenditures and investments
(c)
|
832
|
|
381
|
|
1,755
|
|
2,968
|
|
|||||||
|
(In millions)
|
Refining & Marketing
|
Retail
|
Midstream
|
Total
|
|||||||||||
|
Year Ended December 31, 2016
|
|||||||||||||||
|
Revenues:
|
|||||||||||||||
|
Third party
|
$
|
43,167
|
|
$
|
18,282
|
|
$
|
1,828
|
|
$
|
63,277
|
|
|||
|
Intersegment
(a)
|
10,589
|
|
3
|
|
1,262
|
|
11,854
|
|
|||||||
|
Related party
|
61
|
|
1
|
|
—
|
|
62
|
|
|||||||
|
Segment revenues
|
$
|
53,817
|
|
$
|
18,286
|
|
$
|
3,090
|
|
$
|
75,193
|
|
|||
|
Segment income from operations
(d)
|
$
|
1,357
|
|
$
|
733
|
|
$
|
1,048
|
|
$
|
3,138
|
|
|||
|
Income from equity method investments
(b)
|
24
|
|
5
|
|
142
|
|
171
|
|
|||||||
|
Depreciation and amortization
(b)
|
1,063
|
|
273
|
|
605
|
|
1,941
|
|
|||||||
|
Capital expenditures and investments
(c)
|
1,054
|
|
303
|
|
1,558
|
|
2,915
|
|
|||||||
|
(a)
|
Management believes intersegment transactions were conducted under terms comparable to those with unaffiliated parties.
|
|
(b)
|
Differences between segment totals and MPC totals represent amounts related to unallocated items and are included in “Items not allocated to segments” in the reconciliation below.
|
|
(c)
|
Capital expenditures include changes in capital accruals and investments in affiliates.
|
|
(e)
|
In 2016, the Refining & Marketing and
Retail
segments include an inventory LCM benefit of
$345 million
and
$25 million
, respectively.
|
The following reconciles segment income from operations to income before income taxes as reported in the consolidated statements of income:
|
(In millions)
|
2018
|
2017
|
2016
|
||||||||
|
Segment income from operations
|
$
|
6,261
|
|
$
|
4,389
|
|
$
|
3,138
|
|
||
|
Items not allocated to segments:
|
|||||||||||
|
Corporate and other unallocated items
(a)
|
(502
|
)
|
(365
|
)
|
(266
|
)
|
|||||
|
Transaction-related costs
|
(197
|
)
|
—
|
|
—
|
|
|||||
|
Litigation
|
—
|
|
(29
|
)
|
—
|
|
|||||
|
Impairments
(b)
|
9
|
|
23
|
|
(486
|
)
|
|||||
|
Income from operations
|
5,571
|
|
4,018
|
|
2,386
|
|
|||||
|
Net interest and other financial costs
|
1,003
|
|
674
|
|
564
|
|
|||||
|
Income before income taxes
|
$
|
4,568
|
|
$
|
3,344
|
|
$
|
1,822
|
|
||
|
(a)
|
Corporate and other unallocated items consists primarily of MPC’s corporate administrative expenses and costs related to certain non-operating assets, except for corporate overhead expenses attributable to MPLX and ANDX, which are included in the
Midstream
segment. Corporate overhead expenses are not allocated to the Refining & Marketing and
Retail
segments.
|
|
(b)
|
2018 and 2017 includes MPC’s share of gains from the the sale of assets remaining from the canceled Sandpiper pipeline project. 2016 includes impairments of goodwill and equity method investments. See Note
17
.
|
118
The following reconciles segment capital expenditures and investments to total capital expenditures:
|
(In millions)
|
2018
|
2017
|
2016
|
||||||||
|
Segment capital expenditures and investments
|
$
|
4,147
|
|
$
|
2,968
|
|
$
|
2,915
|
|
||
|
Less investments in equity method investees
|
409
|
|
305
|
|
288
|
|
|||||
|
Plus items not allocated to segments:
|
|||||||||||
|
Corporate
|
77
|
|
83
|
|
81
|
|
|||||
|
Capitalized interest
|
80
|
|
55
|
|
63
|
|
|||||
|
Total capital expenditures
(a)
|
$
|
3,895
|
|
$
|
2,801
|
|
$
|
2,771
|
|
||
|
(a)
|
Capital expenditures include changes in capital accruals. See Note
20
for a reconciliation of total capital expenditures to additions to property, plant and equipment as reported in the consolidated statements of cash flows.
|
Revenues by product line were:
|
(In millions)
|
2018
|
2017
|
2016
|
||||||||
|
Refined products
|
$
|
83,888
|
|
$
|
63,846
|
|
$
|
54,450
|
|
||
|
Merchandise
|
5,332
|
|
5,174
|
|
5,297
|
|
|||||
|
Crude oil and refinery feedstocks
|
4,143
|
|
3,403
|
|
2,038
|
|
|||||
|
Midstream services, transportation and other
|
2,387
|
|
1,681
|
|
1,492
|
|
|||||
|
Sales and other operating revenues
(a)
|
$
|
95,750
|
|
$
|
74,104
|
|
$
|
63,277
|
|
||
|
(a)
|
The 2018 period reflects an election to present certain taxes on a net basis concurrent with our adoption of ASC 606.
|
No single customer accounted for more than
10 percent
of annual revenues for the years ended
December 31, 2018
,
2017
and
2016
.
We do not have significant operations in foreign countries. Therefore, revenues in foreign countries and long-lived assets located in foreign countries, including property, plant and equipment and investments, are not material to our operations.
|
11
.
|
NET INTEREST AND OTHER FINANCIAL COSTS
|
Net interest and other financial costs was:
|
(In millions)
|
2018
|
2017
|
2016
|
||||||||
|
Interest income
|
$
|
(87
|
)
|
$
|
(27
|
)
|
$
|
(6
|
)
|
||
|
Interest expense
|
1,026
|
|
688
|
|
602
|
|
|||||
|
Interest capitalized
|
(80
|
)
|
(63
|
)
|
(64
|
)
|
|||||
|
Pension and other postretirement non-service costs
(a)
|
53
|
|
49
|
|
8
|
|
|||||
|
Loss on extinguishment of debt
|
64
|
|
—
|
|
—
|
|
|||||
|
Other financial costs
|
27
|
|
27
|
|
24
|
|
|||||
|
Net interest and other financial costs
|
$
|
1,003
|
|
$
|
674
|
|
$
|
564
|
|
||
|
(a)
|
See Note
22
.
|
|
12
.
|
INCOME TAXES
|
The TCJA was signed into law on December 22, 2017, providing several significant changes to U.S. tax law, including a reduction in the corporate tax rate from
35 percent
to
21 percent
effective for MPC in 2018. As a result of the rate change, MPC was required to calculate the effect of the TCJA on its deferred tax balances as of the enactment date, which was to reduce net deferred tax liabilities by
$1.5 billion
in 2017.
119
Income tax provisions (benefits) were:
|
|
2018
|
2017
|
2016
|
||||||||||||||||||||||||||||||||
|
(In millions)
|
Current
|
Deferred
|
Total
|
Current
|
Deferred
|
Total
|
Current
|
Deferred
|
Total
|
||||||||||||||||||||||||||
|
Federal
|
$
|
715
|
|
$
|
2
|
|
$
|
717
|
|
$
|
681
|
|
$
|
(1,270
|
)
|
$
|
(589
|
)
|
$
|
189
|
|
$
|
336
|
|
$
|
525
|
|
||||||||
|
State and local
|
178
|
|
61
|
|
239
|
|
98
|
|
33
|
|
131
|
|
27
|
|
57
|
|
84
|
|
|||||||||||||||||
|
Foreign
|
22
|
|
(16
|
)
|
6
|
|
(6
|
)
|
4
|
|
(2
|
)
|
(1
|
)
|
1
|
|
—
|
|
|||||||||||||||||
|
Total
|
$
|
915
|
|
$
|
47
|
|
$
|
962
|
|
$
|
773
|
|
$
|
(1,233
|
)
|
$
|
(460
|
)
|
$
|
215
|
|
$
|
394
|
|
$
|
609
|
|
||||||||
A reconciliation of the federal statutory income tax rate applied to income before income taxes to the provision for income taxes follows:
|
2018
|
2017
|
2016
|
||||||
|
Statutory rate applied to income before income taxes
|
21
|
%
|
35
|
%
|
35
|
%
|
||
|
State and local income taxes, net of federal income tax effects
|
4
|
|
2
|
|
3
|
|
||
|
Domestic manufacturing deduction
|
—
|
|
(1
|
)
|
(1
|
)
|
||
|
Noncontrolling interests
|
(4
|
)
|
(4
|
)
|
(1
|
)
|
||
|
Biodiesel excise tax credit
|
—
|
|
—
|
|
(1
|
)
|
||
|
TCJA legislation
|
—
|
|
(45
|
)
|
—
|
|
||
|
Other
|
—
|
|
(1
|
)
|
(2
|
)
|
||
|
Provision for income taxes
|
21
|
%
|
(14
|
)%
|
33
|
%
|
||
Deferred tax assets and liabilities resulted from the following:
|
December 31,
|
|||||||
|
(In millions)
|
2018
|
2017
|
|||||
|
Deferred tax assets:
|
|||||||
|
Employee benefits
|
$
|
660
|
|
$
|
348
|
|
|
|
Environmental remediation
|
111
|
|
16
|
|
|||
|
Debt financing
|
39
|
|
—
|
|
|||
|
Net operating loss carryforwards
|
17
|
|
12
|
|
|||
|
Foreign currency
|
28
|
|
13
|
|
|||
|
Tax credit carryforwards
|
21
|
|
—
|
|
|||
|
Other
|
88
|
|
31
|
|
|||
|
Total deferred tax assets
|
964
|
|
420
|
|
|||
|
Deferred tax liabilities:
|
|||||||
|
Property, plant and equipment
|
2,830
|
|
1,603
|
|
|||
|
Inventories
|
678
|
|
473
|
|
|||
|
Investments in subsidiaries and affiliates
|
2,130
|
|
912
|
|
|||
|
Intangibles
|
97
|
|
70
|
|
|||
|
Other
|
64
|
|
3
|
|
|||
|
Total deferred tax liabilities
|
5,799
|
|
3,061
|
|
|||
|
Net deferred tax liabilities
|
$
|
4,835
|
|
$
|
2,641
|
|
|
The increase in net deferred tax liabilities is primarily related to the revaluation of MPC’s legacy deferred tax liabilities and the recognition of net deferred tax liabilities both as a result of the Andeavor acquisition.
120
Net deferred tax liabilities were classified in the consolidated balance sheets as follows:
|
December 31,
|
|||||||
|
(In millions)
|
2018
|
2017
|
|||||
|
Assets:
|
|||||||
|
Other noncurrent assets
|
$
|
29
|
|
$
|
13
|
|
|
|
Liabilities:
|
|||||||
|
Deferred income taxes
|
4,864
|
|
2,654
|
|
|||
|
Net deferred tax liabilities
|
$
|
4,835
|
|
$
|
2,641
|
|
|
Tax Carryforwards
At
December 31, 2018
and
2017
, federal operating loss carryforwards were
$7 million
and
$5 million
, respectively, which expire in
2022
through
2037
. As of
December 31, 2018
and
2017
, state and local operating loss carryforwards were
$10 million
and
$8 million
, respectively, which expire in
2017
through
2037
.
Valuation Allowances
As of
December 31, 2018
and
2017
,
$10 million
and
$11 million
of valuation allowances have been recorded against foreign tax credits and state net operating losses due to the expectation that these deferred tax assets are not likely to be realized.
MPC is continuously undergoing examination of its U.S. federal income tax returns by the Internal Revenue Service (“IRS”). Since 2012, we have continued to participate in the Compliance Assurance Process (“CAP”). CAP is a real-time audit of the U.S. Federal income tax return that allows the IRS, working in conjunction with MPC, to determine tax return compliance with the U.S. Federal tax law prior to filing the return. This program provides us with greater certainty about our tax liability for years under examination by the IRS. While Andeavor also undergoes continual IRS examination, it did not participate in the CAP for tax periods prior to the acquisition of Andeavor.
MPC’s IRS audits have been completed through the 2009 tax year. Andeavor and its subsidiaries’ IRS audits have been completed through the 2008 tax year. We believe adequate provision has been established for potential tax in periods not closed to examination. Further, we are routinely involved in U.S. state income tax audits. We believe all other audits will be resolved with the amounts provided for these liabilities. As of
December 31, 2018
, our income tax returns remain subject to examination in the following major tax jurisdictions for the tax years indicated:
|
United States Federal
|
2009
|
-
|
2017
|
|
States
|
2006
|
-
|
2017
|
The following table summarizes the activity in unrecognized tax benefits:
|
(In millions)
|
2018
|
2017
|
2016
|
||||||||
|
January 1 balance
|
$
|
19
|
|
$
|
7
|
|
$
|
12
|
|
||
|
Additions for tax positions of prior years
|
—
|
|
13
|
|
6
|
|
|||||
|
Reductions for tax positions of prior years
|
(5
|
)
|
—
|
|
(10
|
)
|
|||||
|
Settlements
|
—
|
|
(1
|
)
|
(1
|
)
|
|||||
|
Statute of limitations
|
(12
|
)
|
—
|
|
—
|
|
|||||
|
Acquired from Andeavor
|
209
|
|
—
|
|
—
|
|
|||||
|
December 31 balance
|
$
|
211
|
|
$
|
19
|
|
$
|
7
|
|
||
If the unrecognized tax benefits as of
December 31, 2018
were recognized,
$201 million
would affect our effective income tax rate. There were
$15 million
of uncertain tax positions as of
December 31, 2018
for which it is reasonably possible that the amount of unrecognized tax benefits would significantly decrease during the next twelve months. The unrecognized tax benefits acquired from Andeavor arise primarily from a 2009-2010 refund claim related to the federal income tax effects of receiving an excise tax credit on ethanol blending for those years.
Prior to its spinoff on June 30, 2011, Marathon Petroleum Corporation was included in the Marathon Oil Corporation (“Marathon Oil”) U.S. federal income tax returns for all applicable years. During the third quarter of 2017, Marathon Oil received a notice of Final Partnership Administrative Adjustment (“FPAA”) from the IRS for taxable year 2010, relating to certain partnership transactions. Marathon Oil filed a U.S. Tax Court petition disputing these adjustments during the fourth quarter of 2017. We received an FPAA for taxable years 2011-2014 for items resulting from the Marathon Oil IRS dispute
121
discussed above. We filed a U.S. Tax Court petition in the fourth quarter of 2017 for tax years 2011-2014 to dispute these corollary adjustments. We continue to believe that the issue in dispute is more likely than not to be fully sustained and therefore, no liability has been accrued for this matter.
Pursuant to our tax sharing agreement with Marathon Oil, the unrecognized tax benefits related to pre-spinoff operations for which Marathon Oil was the taxpayer remain the responsibility of Marathon Oil and we have indemnified Marathon Oil accordingly. See Note
25
for indemnification information.
Interest and penalties related to income taxes are recorded as part of the provision for income taxes. Such interest and penalties were net expenses (benefits) of
$1 million
,
$3 million
and
($5) million
in
2018
,
2017
and
2016
, respectively. As of
December 31, 2018
and
2017
,
$18 million
and
$17 million
of interest and penalties were accrued related to income taxes.
|
13
.
|
INVENTORIES
|
|
December 31,
|
|||||||
|
(In millions)
|
2018
|
2017
|
|||||
|
Crude oil and refinery feedstocks
|
$
|
3,655
|
|
$
|
2,056
|
|
|
|
Refined products
|
5,234
|
|
2,839
|
|
|||
|
Materials and supplies
|
720
|
|
494
|
|
|||
|
Merchandise
|
228
|
|
161
|
|
|||
|
Total
|
$
|
9,837
|
|
$
|
5,550
|
|
|
The LIFO method accounted for
92 percent
and
90 percent
of total inventory value at
December 31, 2018
and
2017
, respectively. There was
no
excess of replacement or current cost over our stated LIFO cost as of
December 31, 2018
. Current acquisition costs of inventories were estimated to exceed the LIFO inventory value at
December 31, 2017
by
$1.21 billion
.
During 2017, we recorded LIFO liquidations caused primarily by permanently decreased levels in our crude oil inventory. Cost of revenues increased and income from operations decreased by
$7 million
for the year ended December 31, 2017 due to LIFO liquidations. There were no material liquidations of LIFO inventories in 2018 and 2016.
122
|
14
.
|
EQUITY METHOD INVESTMENTS
|
|
Ownership as of
|
Carrying value at
|
||||||||
|
December 31,
|
December 31,
|
||||||||
|
(Dollars in millions)
|
2018
|
2018
|
2017
|
||||||
|
R&M
|
|||||||||
|
Watson Cogeneration Company
|
51%
|
$
|
84
|
|
$
|
—
|
|
||
|
Other
|
121
|
|
104
|
|
|||||
|
R&M Total
|
$
|
205
|
|
$
|
104
|
|
|||
|
Retail
|
|||||||||
|
PFJ Southeast LLC
|
29%
|
$
|
341
|
|
$
|
328
|
|
||
|
Retail Total
|
$
|
341
|
|
$
|
328
|
|
|||
|
Midstream
|
|||||||||
|
Andeavor Logistics Rio Pipeline LLC
|
67%
|
$
|
181
|
|
$
|
—
|
|
||
|
Centrahoma Processing LLC
|
40%
|
160
|
|
121
|
|
||||
|
Crowley Coastal Partners, LLC
|
50%
|
190
|
|
188
|
|
||||
|
Illinois Extension Pipeline Company, L.L.C
|
35%
|
275
|
|
284
|
|
||||
|
LOOP LLC
|
51%
|
282
|
|
282
|
|
||||
|
MarEn Bakken Company LLC
|
25%
|
498
|
|
520
|
|
||||
|
MarkWest EMG Jefferson Dry Gas Gathering Company, L.L.C.
|
67%
|
236
|
|
164
|
|
||||
|
MarkWest Utica EMG
|
56%
|
2,039
|
|
2,139
|
|
||||
|
Minnesota Pipe Line Company, LLC
|
17%
|
197
|
|
—
|
|
||||
|
Rendezvous Gas Services, L.L.C.
|
78%
|
248
|
|
—
|
|
||||
|
Sherwood Midstream Holdings LLC
(a)
|
60%
|
157
|
|
165
|
|
||||
|
Sherwood Midstream LLC
|
50%
|
366
|
|
236
|
|
||||
|
Other
|
523
|
|
256
|
|
|||||
|
Midstream Total
|
$
|
5,352
|
|
$
|
4,355
|
|
|||
|
Total
|
$
|
5,898
|
|
$
|
4,787
|
|
|||
|
(a)
|
Excludes Sherwood Midstream LLC’s investment in Sherwood Midstream Holdings LLC.
|
Summarized financial information for all equity method investments in affiliated companies, combined, was as follows:
|
(In millions)
|
2018
|
2017
|
2016
|
||||||||
|
Income statement data:
|
|||||||||||
|
Revenues and other income
|
$
|
7,726
|
|
$
|
6,235
|
|
$
|
2,421
|
|
||
|
Income (loss) from operations
|
1,375
|
|
1,075
|
|
(116
|
)
|
|||||
|
Net income (loss)
|
1,242
|
|
922
|
|
(250
|
)
|
|||||
|
Balance sheet data – December 31:
|
|||||||||||
|
Current assets
|
$
|
1,443
|
|
$
|
860
|
|
|||||
|
Noncurrent assets
|
12,408
|
|
10,854
|
|
|||||||
|
Current liabilities
|
1,857
|
|
547
|
|
|||||||
|
Noncurrent liabilities
|
1,788
|
|
1,714
|
|
|||||||
As of
December 31, 2018
, the carrying value of our equity method investments was
$1.59 billion
higher than the underlying net assets of investees. This basis difference is being amortized or accreted into net income over the remaining estimated useful lives of the underlying net assets, except for
$721 million
of excess related to goodwill and non-depreciable assets.
123
Dividends and partnership distributions received from equity method investees (excluding distributions that represented a return of capital previously contributed) were
$519 million
,
$391 million
and
$317 million
in
2018
,
2017
and
2016
.
|
15
.
|
PROPERTY, PLANT AND EQUIPMENT
|
|
(In millions)
|
Estimated
Useful Lives
|
December 31,
|
|||||||
|
2018
|
2017
|
||||||||
|
Refining & Marketing
|
4 - 30 years
|
$
|
27,590
|
|
$
|
19,490
|
|
||
|
Retail
|
4 - 25 years
|
6,637
|
|
5,358
|
|
||||
|
Midstream
|
3 - 51 years
|
25,692
|
|
14,898
|
|
||||
|
Corporate and Other
|
4 - 40 years
|
1,294
|
|
792
|
|
||||
|
Total
|
61,213
|
|
40,538
|
|
|||||
|
Less accumulated depreciation
|
16,155
|
|
14,095
|
|
|||||
|
Property, plant and equipment, net
|
$
|
45,058
|
|
$
|
26,443
|
|
|||
Property, plant and equipment includes gross assets acquired under capital leases of
$786 million
and
$602 million
at
December 31, 2018
and
2017
, respectively, with related amounts in accumulated depreciation of
$202 million
and
$248 million
at
December 31, 2018
and
2017
. Property, plant and equipment includes construction in progress of
$3.49 billion
and
$2.20 billion
at
December 31, 2018
and
2017
, respectively, which primarily relates to capital projects at our refineries and midstream facilities.
|
16
.
|
GOODWILL AND INTANGIBLES
|
Goodwill
Goodwill is tested for impairment on an annual basis and when events or changes in circumstances indicate the fair value of a reporting unit with goodwill has been reduced below the carrying value of the net assets of the reporting unit. In
2018
and
2017
, our annual testing did not indicate any impairment of goodwill.
The changes in the carrying amount of goodwill for
2017
and
2018
were as follows:
|
(In millions)
|
Refining & Marketing
|
Retail
|
Midstream
|
Total
|
|||||||||||
|
Balance at January 1, 2017
|
$
|
519
|
|
$
|
792
|
|
$
|
2,276
|
|
$
|
3,587
|
|
|||
|
Disposition
|
—
|
|
(1
|
)
|
—
|
|
(1
|
)
|
|||||||
|
Balance at December 31, 2017
|
$
|
519
|
|
$
|
791
|
|
$
|
2,276
|
|
$
|
3,586
|
|
|||
|
Acquisitions
|
4,717
|
|
4,050
|
|
7,831
|
|
16,598
|
|
|||||||
|
Transfer of assets related to dropdowns
|
(216
|
)
|
—
|
|
216
|
|
—
|
|
|||||||
|
Balance at December 31, 2018
|
$
|
5,020
|
|
$
|
4,841
|
|
$
|
10,323
|
|
$
|
20,184
|
|
|||
The 2018 increase in goodwill resulted mainly from the acquisition of Andeavor. The goodwill represents the value expected to be created by optimization of crude supply, a nationwide retail and marketing platform, diversification of our refining and midstream footprints and optimization of information systems and business processes. As discussed in Note
5
, this goodwill is based on our preliminary determination of the fair value of assets acquired and liabilities assumed in the Andeavor acquisition. We will complete a final determination of the fair value of certain assets and liabilities and an allocation of the resulting goodwill to our reporting units within one year from the acquisition.
124
Intangible Assets
Our finite-lived intangible assets as of
December 31, 2018
and
2017
are as shown below. The increases in 2018 reflect preliminary estimates for customer contracts and relationships as well as brand rights and tradenames acquired in the the Andeavor acquisition.
|
December 31, 2018
|
December 31, 2017
|
||||||||||||||||||||||
|
(In millions)
|
Gross
|
Accumulated Amortization
|
Net
|
Gross
|
Accumulated Amortization
|
Net
|
|||||||||||||||||
|
Customer contracts and relationships
|
$
|
3,184
|
|
$
|
261
|
|
$
|
2,923
|
|
$
|
654
|
|
$
|
139
|
|
$
|
515
|
|
|||||
|
Brand rights and tradenames
|
208
|
|
33
|
|
175
|
|
25
|
|
24
|
|
1
|
|
|||||||||||
|
Royalty agreements
|
129
|
|
70
|
|
59
|
|
129
|
|
63
|
|
66
|
|
|||||||||||
|
Other
|
190
|
|
33
|
|
157
|
|
84
|
|
35
|
|
49
|
|
|||||||||||
|
Total
|
$
|
3,711
|
|
$
|
397
|
|
$
|
3,314
|
|
$
|
892
|
|
$
|
261
|
|
$
|
631
|
|
|||||
At
December 31, 2018
and
2017
, we had indefinite-lived intangible assets of
$94 million
and
$95 million
, respectively, which are primarily emission allowance credits and trademarks.
Amortization expense for
2018
and
2017
was
$134 million
and
$52 million
, respectively. Estimated future amortization expense related to the intangible assets at
December 31, 2018
is as follows:
|
(In millions)
|
||||
|
2019
|
$
|
387
|
|
|
|
2020
|
385
|
|
||
|
2021
|
379
|
|
||
|
2022
|
378
|
|
||
|
2023
|
361
|
|
||
|
17
.
|
FAIR VALUE MEASUREMENTS
|
Fair Values – Recurring
The following tables present assets and liabilities accounted for at fair value on a recurring basis as of
December 31, 2018
and
2017
by fair value hierarchy level. We have elected to offset the fair value amounts recognized for multiple derivative contracts executed with the same counterparty, including any related cash collateral as shown below; however, fair value amounts by hierarchy level are presented on a gross basis in the following tables.
|
December 31, 2018
|
|||||||||||||||||||||||
|
Fair Value Hierarchy
|
|||||||||||||||||||||||
|
(In millions)
|
Level 1
|
Level 2
|
Level 3
|
Netting and Collateral
(a)
|
Net Carrying Value on Balance Sheet
(b)
|
Collateral Pledged Not Offset
|
|||||||||||||||||
|
Commodity derivative instruments, assets
|
$
|
370
|
|
$
|
31
|
|
$
|
—
|
|
$
|
(323
|
)
|
$
|
78
|
|
$
|
2
|
|
|||||
|
Total assets at fair value
|
$
|
370
|
|
$
|
31
|
|
$
|
—
|
|
$
|
(323
|
)
|
$
|
78
|
|
$
|
2
|
|
|||||
|
Commodity derivative instruments, liabilities
|
$
|
255
|
|
$
|
37
|
|
$
|
—
|
|
$
|
(284
|
)
|
$
|
8
|
|
$
|
—
|
|
|||||
|
Embedded derivatives in commodity contracts
|
—
|
|
—
|
|
61
|
|
—
|
|
61
|
|
—
|
|
|||||||||||
|
Total liabilities at fair value
|
$
|
255
|
|
$
|
37
|
|
$
|
61
|
|
$
|
(284
|
)
|
$
|
69
|
|
$
|
—
|
|
|||||
125
|
December 31, 2017
|
|||||||||||||||||||||||
|
Fair Value Hierarchy
|
|||||||||||||||||||||||
|
(In millions)
|
Level 1
|
Level 2
|
Level 3
|
Netting and Collateral
(a)
|
Net Carrying Value on Balance Sheet
(b)
|
Collateral Pledged Not Offset
|
|||||||||||||||||
|
Commodity derivative instruments, assets
|
$
|
127
|
|
$
|
—
|
|
$
|
—
|
|
$
|
(118
|
)
|
$
|
9
|
|
$
|
8
|
|
|||||
|
Other assets
|
3
|
|
—
|
|
—
|
|
N/A
|
|
3
|
|
—
|
|
|||||||||||
|
Total assets at fair value
|
$
|
130
|
|
$
|
—
|
|
$
|
—
|
|
$
|
(118
|
)
|
$
|
12
|
|
$
|
8
|
|
|||||
|
Commodity derivative instruments, liabilities
|
$
|
126
|
|
$
|
—
|
|
$
|
2
|
|
$
|
(126
|
)
|
$
|
2
|
|
$
|
—
|
|
|||||
|
Embedded derivatives in commodity contracts
|
—
|
|
—
|
|
64
|
|
—
|
|
64
|
|
—
|
|
|||||||||||
|
Total liabilities at fair value
|
$
|
126
|
|
$
|
—
|
|
$
|
66
|
|
$
|
(126
|
)
|
$
|
66
|
|
$
|
—
|
|
|||||
|
(a)
|
Represents the impact of netting assets, liabilities and cash collateral when a legal right of offset exists. As of
December 31, 2018
, cash collateral of
$52 million
was netted with mark-to-market derivative assets and
$13 million
was netted with mark-to-market liabilities. As of
December 31, 2017
, cash collateral of
$8 million
was netted with mark-to-market derivative liabilities.
|
|
(b)
|
We have no derivative contracts which are subject to master netting arrangements reflected gross on the balance sheet.
|
Commodity derivatives in Level 1 are exchange-traded contracts for crude oil and refined products measured at fair value with a market approach using the close-of-day settlement prices for the market. Commodity derivatives are covered under master netting agreements with an unconditional right to offset. Collateral deposits in futures commission merchant accounts covered by master netting agreements related to Level 1 commodity derivatives are classified as Level 1 in the fair value hierarchy.
Level 2 instruments are valued based on quoted prices for similar assets and liabilities in active markets, and inputs other than quoted prices, such as liquidity, that are observable for the asset or liability. Commodity derivatives in Level 2 are OTC contracts, which are valued using market quotations from independent price reporting agencies, third-party brokers and commodity exchange price curves that are corroborated with market data.
Level 3 instruments are OTC NGL contracts and embedded derivatives in commodity contracts. The embedded derivative liability relates to a natural gas purchase agreement embedded in a keep‑whole processing agreement. The fair value calculation for these Level 3 instruments at
December 31, 2018
used significant unobservable inputs including: (1) NGL prices interpolated and extrapolated due to inactive markets ranging from
$0.58
to
$1.01
per gallon and (2) the probability of renewal of
90 percent
for the first
five
-year term and
80 percent
for the second
five
-year term of the gas purchase agreement and the related keep-whole processing agreement. For these contracts, increases in forward NGL prices result in a decrease in the fair value of the derivative assets and an increase in the fair value of the derivative liabilities. Increases or decreases in the fractionation spread result in an increase or decrease in the fair value of the embedded derivative liability. An increase in the probability of renewal would result in an increase in the fair value of the related embedded derivative liability.
The following is a reconciliation of the net beginning and ending balances recorded for net liabilities classified as Level 3 in the fair value hierarchy.
|
(In millions)
|
2018
|
2017
|
|||||
|
Beginning balance
|
$
|
66
|
|
$
|
190
|
|
|
|
Contingent consideration payment
|
—
|
|
(131
|
)
|
|||
|
Unrealized and realized losses included in net income
|
3
|
|
25
|
|
|||
|
Settlements of derivative instruments
|
(8
|
)
|
(18
|
)
|
|||
|
Ending balance
|
$
|
61
|
|
$
|
66
|
|
|
|
The amount of total losses for the period included in earnings attributable to the change in unrealized losses relating to assets still held at the end of period:
|
|||||||
|
Derivative instruments
|
$
|
8
|
|
$
|
8
|
|
|
|
Contingent consideration agreement
|
—
|
|
1
|
|
|||
|
Total
|
$
|
8
|
|
$
|
9
|
|
|
See Note
18
for the income statement impacts of our derivative instruments.
126
Fair Values – Nonrecurring
During the third quarter of 2016, Enbridge Energy Partners announced that its affiliate, North Dakota Pipeline, would withdraw certain pending regulatory applications for the Sandpiper pipeline project and that the project would be deferred indefinitely. These decisions were considered to indicate an impairment of the costs capitalized to date on the project. As the operator of North Dakota Pipeline and the entity responsible for maintaining its financial records, Enbridge completed a fixed asset impairment analysis as of August 31, 2016, in accordance with ASC Topic 360. Based on the estimated liquidation value of the fixed assets, an impairment charge was recorded by North Dakota Pipeline. Based on our
37.5 percent
ownership of North Dakota Pipeline, we recognized approximately
$267 million
of this charge in the third quarter of 2016 through income (loss) from equity method investments on the accompanying consolidated statements of income, which impaired virtually all of our
$301 million
investment in the project. Also, in accordance with ASC Topic 323, we completed an assessment to determine any additional equity method impairment charge to be recorded on our consolidated financial statements resulting from an other-than-temporary impairment. The result of this analysis indicated no additional charge was required to be recorded.
The fixed assets of North Dakota Pipeline related to the Sandpiper pipeline project consist primarily of project management and engineering costs, pipe, valves, motors and other equipment, land and easements. The fair value of fixed assets was estimated based on a market approach using the estimated price that would be received to sell pipe, land and other related equipment in its current condition, considering the current market conditions for sale of these assets and length of disposal period. The valuation considered a range of potential selling prices from various alternatives that could be used to dispose of these assets. As such, the fair value of the North Dakota Pipeline equity method investment and its underlying assets represents a Level 3 measurement. As a result, actual results may differ from the estimates and assumptions made for purposes of this impairment analysis. North Dakota Pipeline is in the process of disposing of these assets.
During the second quarter of 2016, forecasts for Ohio Condensate, an equity method investment, were reduced in line with updated forecasts for customer requirements. As the operator of that entity responsible for maintaining its financial records, we completed a fixed asset impairment analysis as of June 30, 2016, in accordance with ASC Topic 360, to determine the potential fixed asset impairment charge. The resulting fixed asset impairment charge recorded within Ohio Condensate’s financial statements was
$96 million
. Based on our
60 percent
ownership of Ohio Condensate, approximately
$58 million
was recorded in the second quarter of 2016 in income (loss) from equity method investments on the accompanying consolidated statements of income.
Our investment in Ohio Condensate, which was established at fair value in connection with the MarkWest Merger, exceeded its proportionate share of the underlying net assets. Therefore, in conjunction with the ASC Topic 360 impairment analysis, we completed an equity method impairment analysis in accordance with ASC Topic 323 to determine the potential additional equity method impairment charge to be recorded on our consolidated financial statements resulting from an other-than-temporary impairment. As a result, an additional impairment charge of approximately
$31 million
was recorded in the second quarter of 2016 in income (loss) from equity method investments on the accompanying consolidated statements of income, which eliminated the basis differential established in connection with the MarkWest Merger.
The fair value of Ohio Condensate and its underlying assets was determined based upon applying the discounted cash flow method, which is an income approach, and the guideline public company method, which is a market approach. The discounted cash flow fair value estimate is based on known or knowable information at the interim measurement date. The significant assumptions that were used to develop the estimate of the fair value under the discounted cash flow method include management’s best estimates of the expected future results using a probability weighted average set of cash flow forecasts and a discount rate of
11.2 percent
. Fair value determinations require considerable judgment and are sensitive to changes in underlying assumptions and factors. As such, the fair value of the Ohio Condensate equity method investment and its underlying assets represents a Level 3 measurement. As a result, actual results may differ from the estimates and assumptions made for purposes of this impairment analysis.
During the first quarter of 2016, MPLX, our consolidated subsidiary, determined that an interim impairment analysis of the goodwill recorded in connection with the MarkWest Merger was necessary based on consideration of a number of first quarter events and circumstances, including i) continued deterioration of near-term commodity prices as well as longer term pricing trends, ii) recent guidance on reductions to forecasted capital spending, the slowing of drilling activity and the resulting reduced production growth forecasts released or communicated by MPLX’s producer customers and iii) increases in the cost of capital. The combination of these factors was considered to be a triggering event requiring an interim impairment test. Based on the first step of the interim goodwill impairment analysis, the fair value for
three
of the reporting units to which goodwill was assigned in connection with the MarkWest Merger was less than their respective carrying value. In step two of the impairment analysis, the implied fair values of the goodwill were compared to the carrying values within those reporting units. Based on this assessment, it was determined that goodwill was impaired in
two
of the reporting units. Accordingly, MPLX recorded an impairment charge of approximately
$129 million
in the first quarter of 2016. In the second quarter of 2016, MPLX completed its purchase price allocation, which resulted in an additional
$1 million
of impairment expense that would have been recorded
127
in the first quarter of 2016 had the purchase price allocation been completed as of that date. This adjustment to the impairment expense was the result of completing an evaluation of the deferred tax liabilities associated with the MarkWest Merger and their impact on the resulting goodwill that was recognized.
The fair value of the reporting units for the 2016 interim goodwill impairment analysis was determined based on applying the discounted cash flow method, which is an income approach, and the guideline public company method, which is a market approach. The discounted cash flow fair value estimate was based on known or knowable information at the interim measurement date. The significant assumptions that were used to develop the estimates of the fair values under the discounted cash flow method include management’s best estimates of the expected future results and discount rates, which ranged from
10.5 percent
to
11.5 percent
. Fair value determinations require considerable judgment and are sensitive to changes in underlying assumptions and factors. As a result, there can be no assurance that the estimates and assumptions made for purposes of the 2016 interim goodwill impairment test will prove to be an accurate prediction of the future.
Fair Values – Reported
We believe the carrying value of our other financial instruments, including cash and cash equivalents, receivables, accounts payable and certain accrued liabilities approximate fair value. Our fair value assessment incorporates a variety of considerations, including the short-term duration of the instruments and the expected insignificance of bad debt expense, which includes an evaluation of counterparty credit risk. The borrowings under our revolving credit facilities, which include variable interest rates, approximate fair value. The fair value of our fixed rate long-term debt is based on prices from recent trade activity and is categorized in level 3 of the fair value hierarchy. The carrying and fair values of our debt were approximately
$27.0 billion
and
$26.5 billion
at
December 31, 2018
, respectively, and approximately
$12.6 billion
and
$13.9 billion
at
December 31, 2017
, respectively. These carrying and fair values of our debt exclude the unamortized issuance costs which are netted against our total debt.
|
18
.
|
DERIVATIVES
|
For further information regarding the fair value measurement of derivative instruments, including any effect of master netting agreements or collateral, see Note
17
. See Note
2
for a discussion of the types of derivatives we use and the reasons for them. We do not designate any of our commodity derivative instruments as hedges for accounting purposes.
The following table presents the fair value of derivative instruments as of
December 31, 2018
and
2017
and the line items in the balance sheets in which the fair values are reflected. The fair value amounts below are presented on a gross basis and do not reflect the netting of asset and liability positions permitted under the terms of our master netting arrangements including cash collateral on deposit with, or received from, brokers. We offset the recognized fair value amounts for multiple derivative instruments executed with the same counterparty in our financial statements when a legal right of offset exists. As a result, the asset and liability amounts below will not agree with the amounts presented in our consolidated balance sheets.
|
(In millions)
|
December 31, 2018
|
||||||
|
Balance Sheet Location
|
Asset
|
Liability
|
|||||
|
Commodity derivatives
|
|||||||
|
Other current assets
|
$
|
400
|
|
$
|
283
|
|
|
|
Other current liabilities
(a)
|
1
|
|
16
|
|
|||
|
Deferred credits and other liabilities
(a)
|
—
|
|
54
|
|
|||
|
(In millions)
|
December 31, 2017
|
||||||
|
Balance Sheet Location
|
Asset
|
Liability
|
|||||
|
Commodity derivatives
|
|||||||
|
Other current assets
|
$
|
127
|
|
$
|
126
|
|
|
|
Other current liabilities
(a)
|
—
|
|
14
|
|
|||
|
Deferred credits and other liabilities
(a)
|
—
|
|
52
|
|
|||
|
(a)
|
Includes embedded derivatives.
|
Derivatives that are not designated as accounting hedges may include commodity derivatives used to hedge price risk on (1) inventories, (2) fixed price sales of refined products, (3) the acquisition of foreign-sourced crude oil, (4) the acquisition of ethanol for blending with refined products, (5) sale of NGLs and (6) the purchase of natural gas.
128
The table below summarizes open commodity derivative contracts for crude oil, refined products and blending products as of
December 31, 2018
.
|
Percentage of contracts that expire next quarter
|
Position
|
||||||
|
(Units in thousands of barrels)
|
Long
|
Short
|
|||||
|
Exchange-traded
(a)
|
|||||||
|
Crude oil
|
71.5%
|
40,257
|
|
44,709
|
|
||
|
Refined products
|
75.9%
|
10,210
|
|
11,149
|
|
||
|
Blending products
|
70.3%
|
5,194
|
|
7,356
|
|
||
|
OTC
|
|||||||
|
Crude oil
|
—%
|
880
|
|
—
|
|
||
|
Blending products
|
24.1%
|
2,480
|
|
2,480
|
|
||
|
(a)
|
Included in exchange-traded are spread contracts in thousands of barrels: Crude oil -
7,470
long and
6,800
short; Refined products -
450
long and
450
short; Blending products -
2,678
long and
2,767
short
|
The following table summarizes the effect of all commodity derivative instruments in our consolidated statements of income:
|
(In millions)
|
Gain (Loss)
|
||||||||||
|
Income Statement Location
|
2018
|
2017
|
2016
|
||||||||
|
Sales and other operating revenues
|
$
|
13
|
|
$
|
5
|
|
$
|
(13
|
)
|
||
|
Cost of revenues
|
(59
|
)
|
(26
|
)
|
(167
|
)
|
|||||
|
Total
|
$
|
(46
|
)
|
$
|
(21
|
)
|
$
|
(180
|
)
|
||
|
19
.
|
DEBT
|
Our outstanding borrowings at
December 31, 2018
and
2017
consisted of the following:
|
|
December 31,
|
||||||
|
(In millions)
|
2018
|
2017
|
|||||
|
Marathon Petroleum Corporation:
|
|||||||
|
Commercial paper
|
$
|
—
|
|
$
|
—
|
|
|
|
364-day bank revolving credit facility due September 2019
|
—
|
|
—
|
|
|||
|
Trade receivables securitization facility due July 2019
|
—
|
|
—
|
|
|||
|
Bank revolving credit facility due October 2023
|
—
|
|
—
|
|
|||
|
Senior notes, 2.700% due December 2018
|
—
|
|
600
|
|
|||
|
Senior notes, 3.400% due December 2020
|
650
|
|
650
|
|
|||
|
Senior notes, 5.125% due March 2021
|
1,000
|
|
1,000
|
|
|||
|
Senior notes, 5.375% due October 2022
|
337
|
|
—
|
|
|||
|
Senior notes, 4.750% due December 2023
|
614
|
|
—
|
|
|||
|
Senior notes, 5.125% due April 2024
|
241
|
|
—
|
|
|||
|
Senior notes, 3.625%, due September 2024
|
750
|
|
750
|
|
|||
|
Senior notes, 5.125% due December 2026
|
719
|
|
—
|
|
|||
|
Senior notes, 3.800% due April 2028
|
496
|
|
—
|
|
|||
|
Senior notes, 6.500% due March 2041
|
1,250
|
|
1,250
|
|
|||
|
Senior notes, 4.750% due September 2044
|
800
|
|
800
|
|
|||
|
Senior notes, 5.850% due December 2045
|
250
|
|
250
|
|
|||
|
Senior notes, 4.500% due April 2048
|
498
|
|
—
|
|
|||
|
Andeavor senior notes, 3.800% - 5.375% due 2022 - 2048
|
469
|
|
—
|
|
|||
|
Senior notes, 5.000%, due September 2054
|
400
|
|
400
|
|
|||
|
Capital lease obligations due 2019-2033
|
629
|
|
356
|
|
|||
129
|
|
December 31,
|
||||||
|
(In millions)
|
2018
|
2017
|
|||||
|
Notes payable
|
11
|
|
—
|
|
|||
|
MPLX LP:
|
|||||||
|
MPLX bank revolving credit facility due 2022
|
—
|
|
505
|
|
|||
|
MPLX senior notes, 5.500% due February 2023
|
—
|
|
710
|
|
|||
|
MPLX senior notes, 3.375% due March 2023
|
500
|
|
—
|
|
|||
|
MPLX senior notes, 4.500% due July 2023
|
989
|
|
989
|
|
|||
|
MPLX senior notes, 4.875% due December 2024
|
1,149
|
|
1,149
|
|
|||
|
MPLX senior notes, 4.000% due February 2025
|
500
|
|
500
|
|
|||
|
MPLX senior notes, 4.875% due June 2025
|
1,189
|
|
1,189
|
|
|||
|
MarkWest senior notes, 4.500% - 5.500% due 2023 - 2025
|
23
|
|
63
|
|
|||
|
MPLX senior notes, 4.125% due March 2027
|
1,250
|
|
1,250
|
|
|||
|
MPLX senior notes, 4.000% due March 2028
|
1,250
|
|
—
|
|
|||
|
MPLX senior notes, 4.800% due February 2029
|
750
|
|
—
|
|
|||
|
MPLX senior notes, 4.500% due April 2038
|
1,750
|
|
—
|
|
|||
|
MPLX senior notes, 5.200% due March 2047
|
1,000
|
|
1,000
|
|
|||
|
MPLX senior notes, 4.700% due April 2048
|
1,500
|
|
—
|
|
|||
|
MPLX senior notes, 5.500% due February 2049
|
1,500
|
|
—
|
|
|||
|
MPLX senior notes, 4.900% due April 2058
|
500
|
|
—
|
|
|||
|
MPLX capital lease obligations due 2020
|
6
|
|
7
|
|
|||
|
ANDX LP:
|
|||||||
|
ANDX revolving and dropdown credit facilities due 2021
|
1,245
|
|
—
|
|
|||
|
ANDX senior notes, 5.500% due October 2019
|
500
|
|
—
|
|
|||
|
ANDX senior notes, 6.250% due October 2022
|
300
|
|
—
|
|
|||
|
ANDX senior notes, 3.500% due December 2022
|
500
|
|
—
|
|
|||
|
ANDX senior notes, 6.375% due May 2024
|
450
|
|
—
|
|
|||
|
ANDX senior notes, 5.250% due January 2025
|
750
|
|
—
|
|
|||
|
ANDX senior notes, 4.250% due December 2027
|
750
|
|
—
|
|
|||
|
ANDX senior notes, 5.200% due December 2047
|
500
|
|
—
|
|
|||
|
ANDX capital lease obligations
|
15
|
|
—
|
|
|||
|
Total
|
27,980
|
|
13,418
|
|
|||
|
Unamortized debt issuance costs
|
(128
|
)
|
(59
|
)
|
|||
|
Unamortized (discount) premium, net
|
(328
|
)
|
(413
|
)
|
|||
|
Amounts due within one year
|
(544
|
)
|
(624
|
)
|
|||
|
Total long-term debt due after one year
|
$
|
26,980
|
|
$
|
12,322
|
|
|
Principal maturities for our debt obligations and capital lease obligations as of
December 31, 2018
for the next five years were as follows:
|
(In millions)
|
|||
|
2019
|
$
|
544
|
|
|
2020
|
695
|
|
|
|
2021
|
2,296
|
|
|
|
2022
|
1,320
|
|
|
|
2023
|
2,403
|
|
|
130
Commercial Paper
On February 26, 2016, we established a commercial paper program that allows us to have a maximum of
$2 billion
in commercial paper outstanding, with maturities up to
397
days from the date of issuance. We do not intend to have outstanding commercial paper borrowings in excess of available capacity under our bank revolving credit facilities. During
2018
, we had
no
borrowings or repayments under the commercial paper program. At
December 31, 2018
, we had
no
amounts outstanding under the commercial paper program.
MPC Revolving Credit Agreements
On August 28, 2018, we entered into credit agreements with a syndicate of lenders to replace MPC’s previous five-year
$2.5 billion
bank revolving credit facility due in 2022 and our previous 364-day
$1 billion
bank revolving agreement that expired in July 2018. The new credit agreements, which became effective October 1, 2018 in connection with the Andeavor acquisition, provide for a
$5 billion
five
-year revolving credit agreement that expires in
2023
(“new MPC five-year credit agreement”) and a
$1 billion
364
-day revolving credit agreement that expires in
2019
(“new MPC 364-day credit agreement” and together with the new MPC five-year credit agreement, the “new MPC credit agreements”).
MPC has an option under the new MPC five-year credit agreement to increase the aggregate commitments by up to an additional
$1 billion
, subject to, among other conditions, the consent of the lenders whose commitments would be increased. In addition, MPC may request up to
two
one
-year extensions of the maturity date of the new MPC five-year credit agreement subject to, among other conditions, the consent of lenders holding a majority of the commitments, provided that the commitments of any non-consenting lenders will terminate on the then-effective maturity date. The new MPC five-year credit agreement includes sub-facilities for swing-line loans of up to
$250 million
and letters of credit of up to
$2.2 billion
(which may be increased to up to
$3 billion
upon receipt of additional letter of credit issuing commitments).
Borrowings under the MPC credit agreements bear interest, at our election,
at either the Adjusted LIBO Rate or the Alternate Base Rate (both as defined in the new MPC credit agreements), plus an applicable margin
. We are charged various fees and expenses under the MPC credit agreements, including administrative agent fees, commitment fees on the unused portion of the commitments and fees related to issued and outstanding letters of credit. The applicable margin to the benchmark interest rates and the commitment fees payable under the MPC credit agreements fluctuate based on changes, if any, to our credit ratings.
The MPC credit agreements contain certain representations and warranties, affirmative and restrictive covenants and events of default that we consider to be usual and customary for arrangements of this type, including a financial covenant that requires us to maintain a ratio of Consolidated Net Debt to Total Capitalization (each as defined in the MPC credit agreements) of no greater than
0.65
to 1.00 as of the last day of each fiscal quarter. The covenants also restrict, among other things, our ability and/or the ability of certain of our subsidiaries to incur debt, create liens on assets or enter into transactions with affiliates. As of
December 31, 2018
, we were in compliance with the covenants contained in the MPC credit agreements.
There were
no
borrowings and
$32 million
of letters of credit outstanding at
December 31, 2018
.
Trade Receivables Securitization Facility
On December 18, 2013, we entered into a trade receivables securitization facility (“trade receivables facility”) with a group of committed purchasers and letter of credit issuers evidenced by a receivables purchase agreement and receivables sales agreement. On July 20, 2016, we amended our trade receivables securitization facility to, among other things, reduce the capacity from
$1 billion
to
$750 million
and to extend the maturity date to
July 19, 2019
. The reduction in capacity reflected the lower refined product price environment.
The trade receivables facility consists of one of our wholly-owned subsidiaries, Marathon Petroleum Company LP (“MPC LP”), selling or contributing on an on-going basis all of its trade receivables (including trade receivables acquired from Marathon Petroleum Trading Canada LLC, a wholly-owned subsidiary of MPC LP), together with all related security and interests in the proceeds thereof, without recourse, to another wholly-owned, bankruptcy-remote special purpose subsidiary, MPC Trade Receivables Company LLC (“TRC”), in exchange for a combination of cash, equity and/or a subordinated note issued by TRC to MPC LP. TRC, in turn, has the ability to sell undivided ownership interests in qualifying trade receivables, together with all related security and interests in the proceeds thereof, without recourse, to the purchasing group in exchange for cash proceeds. The trade receivables facility also provides for the issuance of letters of credit up to
$750 million
, provided that the aggregate credit exposure of the purchasing group, including outstanding letters of credit, may not exceed the lesser of
$750 million
or the balance of qualifying trade receivables at any one time.
131
To the extent that TRC retains an ownership interest in the receivables it has purchased or received from MPC LP, such interest will be included in our consolidated financial statements solely as a result of the consolidation of the financial statements of TRC with those of MPC. The receivables sold or contributed to TRC are available first and foremost to satisfy claims of the creditors of TRC and are not available to satisfy the claims of creditors of MPC. TRC has granted a security interest in all of its assets to the purchasing group to secure its obligations under the Receivables Purchase Agreement.
Proceeds from the sale of undivided percentage ownership interests in qualifying receivables under the trade receivables facility are reflected as debt on our consolidated balance sheet. We remain responsible for servicing the receivables sold to the purchasing group. TRC pays floating-rate interest charges and usage fees on amounts outstanding under the trade receivables facility, if any, unused fees on the portion of unused commitments and certain other fees related to the administration of the facility and letters of credit that are issued and outstanding under the trade receivables facility.
The receivables purchase agreement and receivables sale agreement contain representations and covenants that we consider usual and customary for arrangements of this type. Trade receivables are subject to customary criteria, limits and reserves before being deemed to qualify for sale by TRC pursuant to the trade receivables facility. In addition, further purchases of qualified trade receivables under the trade receivables facility are subject to termination, and TRC may be subject to default fees, upon the occurrence of certain amortization events that are included in the receivables purchase agreement, all of which we consider to be usual and customary for arrangements of this type. As of
December 31, 2018
, we were in compliance with the covenants contained in the receivables purchase agreement and receivables sale agreement.
There were
no
borrowings or letters of credit outstanding under the trade receivables facility as of
December 31, 2018
. As of
December 31, 2018
, qualified trade receivables supported borrowings and letter of credit issuances of
$750 million
.
MPC Senior Notes
As a result of the completion of the Andeavor acquisition, we assumed an aggregate principal amount of
$3.374 billion
senior notes issued by Andeavor. On October 2, 2018, approximately
$2.905 billion
aggregate principal amount of Andeavor’s outstanding senior notes were exchanged for new unsecured senior notes issued by MPC having the same maturity and interest rates as the Andeavor senior notes and cash in an exchange offer and consent solicitation undertaken by MPC and Andeavor.
The new MPC senior notes consist of approximately
$337 million
aggregate principal amount of
5.375 percent
senior notes due October 1, 2022, approximately
$614 million
aggregate principal amount of
4.750 percent
senior notes due December 15, 2023, approximately
$241 million
aggregate principal amount of
5.125 percent
senior notes due April 1, 2024, approximately
$719 million
aggregate principal amount of
5.125 percent
senior notes due December 15, 2026, approximately
$496 million
aggregate principal amount of
3.800 percent
senior notes due April 1, 2028 and approximately
$498 million
aggregate principal amount of
4.500 percent
senior notes due April 1, 2048.
After giving effect to the exchange offer and consent solicitation referred to above, as of December 31, 2018, Andeavor had outstanding approximately
$138 million
aggregate principal amount of
5.375 percent
senior notes due October 1, 2022, approximately
$236 million
aggregate principal amount of
4.750 percent
senior notes due December 15, 2023, approximately
$59 million
aggregate principal amount of
5.125 percent
senior notes due April 1, 2024, approximately
$30 million
aggregate principal amount of
5.125 percent
senior notes due December 15, 2026, approximately
$4 million
aggregate principal amount of
3.800 percent
senior notes due April 1, 2028 and approximately
$2 million
aggregate principal amount of
4.500 percent
senior notes due April 1, 2048.
Interest on each series of senior notes is payable semi-annually in arrears. The MPC senior notes are unsecured and unsubordinated obligations of MPC and rank equally with all of MPC’s other existing and future unsecured and unsubordinated indebtedness. The MPC senior notes are non-recourse and structurally subordinated to the indebtedness of our subsidiaries, including the outstanding indebtedness of Andeavor, MPLX and ANDX. The Andeavor senior notes are unsecured, unsubordinated obligations of Andeavor and are non-recourse to MPC and any of MPC’s subsidiaries other than Andeavor.
On March 15, 2018, we redeemed all of the
$600 million
outstanding aggregate principal amount of our 2.700 percent senior notes due on December 14, 2018. The 2018 senior notes were redeemed at a price equal to par plus a make whole premium, plus accrued and unpaid interest. The make whole premium of
$2.5 million
was calculated based on the market yield of the applicable treasury issue as of the redemption date as determined in accordance with the indenture governing the 2018 senior notes.
MPLX Credit Agreement
On July 21, 2017, MPLX entered into a credit agreement with a syndicate of lenders to replace MPLX’s previous
$2 billion
five
-year bank revolving credit facility with a
$2.25 billion
five
-year bank revolving credit facility that expires in
July 2022
(“MPLX credit agreement”).
132
The MPLX credit agreement includes letter of credit issuing capacity of up to approximately
$222 million
and swingline loan capacity of up to
$100 million
. The revolving borrowing capacity may be increased by up to an additional
$500 million
, subject to certain conditions, including the consent of the lenders whose commitments would increase.
Borrowings under the MPLX credit agreement bear interest, at MPLX’s election, at the
Adjusted LIBO Rate or the Alternate Base Rate (both as defined in the MPLX credit agreement)
plus an applicable margin. MPLX is charged various fees and expenses in connection with the agreement, including administrative agent fees, commitment fees on the unused portion of the commitments and fees with respect to issued and outstanding letters of credit. The applicable margins to the benchmark interest rates and the commitment fees payable under the MPLX credit agreement fluctuate based on changes, if any, to MPLX’s credit ratings.
The MPLX credit agreement contains certain representations and warranties, affirmative and restrictive covenants and events of default that we consider to be usual and customary for an agreement of this type, including a financial covenant that requires MPLX to maintain a ratio of Consolidated Total Debt as of the end of each fiscal quarter to Consolidated EBITDA (both as defined in the MPLX credit agreement) for the prior
four
fiscal quarters of no greater than
5.0
to 1.0 (or
5.5
to 1.0 for up to two fiscal quarters following certain acquisitions). Consolidated EBITDA is subject to adjustments for certain acquisitions completed and capital projects undertaken during the relevant period. The covenants also restrict, among other things, MPLX’s ability and/or the ability of certain of its subsidiaries to incur debt, create liens on assets and enter into transactions with affiliates. As of
December 31, 2018
, MPLX was in compliance with the covenants contained in the MPLX credit agreement.
During
2018
, MPLX borrowed
$1.410 billion
under the bank revolving credit facility, at an average interest rate of
3.464 percent
, per annum, and repaid
$1.915 billion
of these borrowings. As of
December 31, 2018
, MPLX had
no
outstanding borrowings and
$3 million
of letters of credit outstanding under the bank revolving credit facility, resulting in total unused loan availability of
$2.25 billion
.
MPLX Term Loan
On January 2, 2018, MPLX entered into a term loan agreement with a syndicate of lenders providing for a
$4.1 billion
,
364
-day term loan facility. MPLX drew the entire amount of the term loan facility in a single borrowing to fund the cash portion of the consideration for the February 1, 2018 dropdown. On February 8, 2018, MPLX used
$4.1 billion
of the net proceeds from the issuance of MPLX senior notes to repay the
364
-day term-loan facility.
MPLX Senior Notes
On November 15, 2018, MPLX issued
$2.25 billion
in aggregate principal amount of senior notes in a public offering, consisting of
$750 million
aggregate principal amount of
4.800 percent
unsecured senior notes due February 2029 and
$1.5 billion
aggregate principal amount of
5.500 percent
unsecured senior notes due February 2049. On December 10, 2018, a portion of the net proceeds from the offering was used to redeem the
$750 million
in aggregate principal amount of
5.500 percent
unsecured notes due February 2023 issued by MPLX and MarkWest. These notes were redeemed at
101.833 percent
of the principal amount, plus the write off of unamortized deferred financing costs, resulting in a loss on extinguishment of debt of
$60 million
. The remaining net proceeds have or will be used to repay borrowings under MPLX’s revolving credit facility and intercompany loan agreement with MPC and for general partnership purposes.
On February 8, 2018, MPLX issued
$5.5 billion
in aggregate principal amount of senior notes in a public offering, consisting of
$500 million
aggregate principal amount of
3.375 percent
unsecured senior notes due March 2023,
$1.25 billion
aggregate principal amount of
4.000 percent
unsecured senior notes due March 2028,
$1.75 billion
aggregate principal amount of
4.500 percent
unsecured senior notes due April 2038,
$1.5 billion
aggregate principal amount of
4.700 percent
unsecured senior notes due April 2048, and
$500 million
aggregate principal amount of
4.900 percent
unsecured senior notes due April 2058. On February 8, 2018,
$4.1 billion
of the net proceeds were used to repay the 364-day term-loan facility. The remaining proceeds were used to repay outstanding borrowings under MPLX’s revolving credit facility and intercompany loan agreement with MPC and for general partnership purposes.
Interest on each series of MPLX senior notes is payable semi-annually in arrears. The MPLX senior notes are unsecured, unsubordinated obligations of MPLX and are non-recourse to MPC and its subsidiaries other than MPLX and MPLX GP LLC, as the general partner of MPLX.
ANDX Credit Agreements
ANDX is party to a
$1.1 billion
revolving credit facility and a
$1.0 billion
dropdown credit agreement, both of which expire in January 2021 (together, the “ANDX credit agreements”). The ANDX credit agreements are unsecured, but are guaranteed by substantially all of ANDX’s subsidiaries.
133
The ANDX revolving credit facility includes letter of credit issuing capacity of up to
$300 million
and swingline loan capacity of up to
$50 million
. The aggregate borrowing capacity under the ANDX credit agreements may be increased by up to an additional
$500 million
, subject to certain conditions, including the receipt of additional lender commitments.
Borrowings under the ANDX credit agreements bear interest, at ANDX’s election,
at LIBOR or the Base Rate (as defined in the ANDX credit agreements) plus an applicable margin
. ANDX is charged various fees and expenses in connection with the agreement, including administrative agent fees, commitment fees on the unused portion of the commitments and fees with respect to issued and outstanding letters of credit. The applicable margins to the benchmark interest rates and the commitment fees payable under the ANDX credit agreements fluctuate based on changes, if any, to ANDX’s credit ratings.
The ANDX credit agreements contain certain representations and warranties, affirmative and restrictive covenants and events of default that we consider to be usual and customary for an agreement of this type, including a financial covenant that requires ANDX to maintain a Consolidated Leverage Ratio (as defined in the ANDX credit agreements) for the prior
four
fiscal quarters of no greater than
5.0
to 1.0 (or
5.5
to 1.0 for up to two fiscal quarters following certain acquisitions). Consolidated EBITDA used to calculate the Consolidated Leverage Ratio is subject to adjustments for certain acquisitions completed and capital projects undertaken during the relevant period. The covenants also restrict, among other things, ANDX’s ability and/or the ability of certain of its subsidiaries to incur debt, create liens on assets and enter into transactions with affiliates. As of
December 31, 2018
, ANDX was in compliance with the covenants contained in the ANDX credit agreements.
On December 20, 2018, ANDX amended the ANDX credit agreements to, among other things, revise the affirmative and negative covenants and events of default to be commensurate with those customarily contained in investment-grade credit facilities of a similar type and nature. Specifically, among other things, the amendments (i) granted additional flexibility to ANDX and its subsidiaries to create liens and incur indebtedness, subject to the Consolidated Leverage Ratio covenant described above, (ii) remove restrictions on the ability of ANDX and its subsidiaries to make investments and (iii) granted additional flexibility to ANDX and its subsidiaries to enter into acquisitions, sell or dispose of assets and enter into related party transactions. In addition, the amendments made certain legal and technical updates to the ANDX credit agreements, including the removal of collateral and security provisions that are no longer applicable and changes to reflect MPC’s acquisition of Andeavor. The amendments did not impact the borrowing capacity available to ANDX or the interest rates and other fees payable by ANDX under the Credit Agreements.
During the fourth quarter of 2018, ANDX borrowed
$760 million
under the ANDX credit facilities, at an average interest rate of
4.460 percent
and repaid
$635 million
of these borrowings. As of
December 31, 2018
, ANDX had
$1,245 million
outstanding borrowings under the ANDX credit facilities, resulting in total unused loan availability of
$855 million
.
ANDX Senior Notes
As of
December 31, 2018
, ANDX had
$3.750 billion
aggregate principal amount of senior notes outstanding. The ANDX senior notes consist of
$500 million
aggregate principal amount of
5.500 percent
senior notes due October 15, 2019,
$500 million
aggregate principal amount of
3.500 percent
senior notes due December 1, 2022,
$300 million
aggregate principal amount of
6.250 percent
senior notes due October 15, 2022,
$450 million
aggregate principal amount of
6.375 percent
senior notes due May 1, 2024,
$750 million
aggregate principal amount of
5.250 percent
senior notes due January 15, 2025,
$750 million
aggregate principal amount of
4.250 percent
senior notes due December 1, 2027 and
$500 million
aggregate principal amount of
5.200 percent
senior notes due December 1, 2047.
Interest on each series of ANDX senior notes is payable semi-annually in arrears. The ANDX senior notes are unsecured, unsubordinated obligations of ANDX and are non-recourse to MPC and its subsidiaries other than ANDX and Tesoro Logistics GP, LLC, as the general partner of ANDX.
134
|
20
.
|
SUPPLEMENTAL CASH FLOW INFORMATION
|
|
(In millions)
|
2018
|
2017
|
2016
|
||||||||
|
Net cash provided by operating activities included:
|
|||||||||||
|
Interest paid (net of amounts capitalized)
|
$
|
887
|
|
$
|
525
|
|
$
|
478
|
|
||
|
Net income taxes paid to taxing authorities
|
424
|
|
904
|
|
140
|
|
|||||
|
Non-cash investing and financing activities:
|
|||||||||||
|
Capital leases
|
$
|
172
|
|
$
|
71
|
|
$
|
—
|
|
||
|
Contribution of assets to joint venture
(a)
|
—
|
|
337
|
|
273
|
|
|||||
|
Intangible asset acquired
|
—
|
|
45
|
|
—
|
|
|||||
|
Acquisition:
|
|||||||||||
|
Fair value of MPC shares issued
|
19,766
|
|
—
|
|
—
|
|
|||||
|
Fair value of converted equity awards
|
203
|
|
—
|
|
—
|
|
|||||
|
(a)
|
2017 includes MPLX’s contribution of assets to Sherwood Midstream and Sherwood Midstream Holdings.
2016 includes
Speedway’s contribution of travel plaza locations to new joint venture with Pilot Flying J. See Note
5
.
|
|
(In millions)
|
December 31,
2018 |
December 31,
2017 |
|||||
|
Cash and cash equivalents
|
$
|
1,687
|
|
$
|
3,011
|
|
|
|
Restricted cash
(a)
|
38
|
|
4
|
|
|||
|
Cash, cash equivalents and restricted cash
(b)
|
$
|
1,725
|
|
$
|
3,015
|
|
|
|
(a)
|
The restricted cash balance is included within other current assets on the consolidated balance sheets.
|
|
(b)
|
As a result of the adoption of ASU 2016-18, the consolidated statements of cash flows now explain the change during the period of both cash and cash equivalents and restricted cash.
|
The consolidated statements of cash flows exclude changes to the consolidated balance sheets that did not affect cash. The following is a reconciliation of additions to property, plant and equipment to total capital expenditures:
|
(In millions)
|
2018
|
2017
|
2016
|
||||||||
|
Additions to property, plant and equipment per the consolidated statements of cash flows
|
$
|
3,578
|
|
$
|
2,732
|
|
$
|
2,892
|
|
||
|
Asset retirement expenditures
(a)
|
8
|
|
2
|
|
6
|
|
|||||
|
Increase (decrease) in capital accruals
|
309
|
|
67
|
|
(127
|
)
|
|||||
|
Total capital expenditures
|
$
|
3,895
|
|
$
|
2,801
|
|
$
|
2,771
|
|
||
|
(a)
|
Included in All other, net – Operating activities on the consolidated statements of cash flows.
|
135
21
.
ACCUMULATED OTHER COMPREHENSIVE LOSS
The following table shows the changes in accumulated other comprehensive loss by component.
|
(In millions)
|
Pension Benefits
|
Other Benefits
|
Gain on Cash Flow Hedge
|
Workers Compensation
|
Total
|
||||||||||||||
|
Balance as of December 31, 2016
|
$
|
(233
|
)
|
$
|
(7
|
)
|
$
|
4
|
|
$
|
2
|
|
$
|
(234
|
)
|
||||
|
Other comprehensive income (loss) before reclassifications
|
12
|
|
(38
|
)
|
—
|
|
3
|
|
(23
|
)
|
|||||||||
|
Amounts reclassified from accumulated other comprehensive loss:
|
|||||||||||||||||||
|
Amortization – prior service credit
(a)
|
(39
|
)
|
(3
|
)
|
—
|
|
—
|
|
(42
|
)
|
|||||||||
|
– actuarial loss
(a)
|
36
|
|
(2
|
)
|
—
|
|
—
|
|
34
|
|
|||||||||
|
– settlement loss
(a)
|
52
|
|
—
|
|
—
|
|
—
|
|
52
|
|
|||||||||
|
Other
|
—
|
|
—
|
|
—
|
|
(2
|
)
|
(2
|
)
|
|||||||||
|
Tax effect
|
(18
|
)
|
2
|
|
—
|
|
—
|
|
(16
|
)
|
|||||||||
|
Other comprehensive inco
me (loss)
|
43
|
|
(41
|
)
|
—
|
|
1
|
|
3
|
|
|||||||||
|
Balance as of December 31, 2017
|
$
|
(190
|
)
|
$
|
(48
|
)
|
$
|
4
|
|
$
|
3
|
|
$
|
(231
|
)
|
||||
|
(In millions)
|
Pension Benefits
|
Other Benefits
|
Gain on Cash Flow Hedge
|
Workers Compensation
|
Total
|
||||||||||||||
|
Balance as of December 31, 2017
|
$
|
(190
|
)
|
$
|
(48
|
)
|
$
|
4
|
|
$
|
3
|
|
$
|
(231
|
)
|
||||
|
Other comprehensive income (loss) before reclassifications
|
14
|
|
27
|
|
(1
|
)
|
9
|
|
49
|
|
|||||||||
|
Amounts reclassified from accumulated other comprehensive loss:
|
|||||||||||||||||||
|
Amortization – prior service credit
(a)
|
(33
|
)
|
(3
|
)
|
—
|
|
—
|
|
(36
|
)
|
|||||||||
|
– actuarial loss
(a)
|
31
|
|
(1
|
)
|
—
|
|
—
|
|
30
|
|
|||||||||
|
– settlement loss
(a)
|
53
|
|
—
|
|
—
|
|
—
|
|
53
|
|
|||||||||
|
Other
|
—
|
|
—
|
|
(1
|
)
|
(5
|
)
|
(6
|
)
|
|||||||||
|
Tax effect
|
(7
|
)
|
2
|
|
—
|
|
2
|
|
(3
|
)
|
|||||||||
|
Other comprehensive income (loss)
|
58
|
|
25
|
|
(2
|
)
|
6
|
|
87
|
|
|||||||||
|
Balance as of December 31, 2018
|
$
|
(132
|
)
|
$
|
(23
|
)
|
$
|
2
|
|
$
|
9
|
|
$
|
(144
|
)
|
||||
|
(a)
|
These accumulated other comprehensive loss components are included in the computation of net periodic benefit cost. See Note
22
.
|
136
|
22
.
|
DEFINED BENEFIT PENSION AND OTHER POSTRETIREMENT PLANS
|
We have noncontributory defined benefit pension plans covering substantially all employees. Benefits under these plans have been based primarily on age, years of service and final average pensionable earnings. The years of service component of this formula was frozen as of December 31, 2009. Benefits for service beginning January 1, 2010 are based on a cash balance formula with an annual percentage of eligible pay credited based upon age and years of service. Eligible employees in our Retail segment accrue benefits under a defined contribution plan for service years beginning January 1, 2010.
We also have other postretirement benefits covering most employees. Health care benefits are provided through comprehensive hospital, surgical and major medical benefit provisions subject to various cost-sharing features. Retiree life insurance benefits are provided to a closed group of retirees. Other postretirement benefits are not funded in advance.
In connection with the Andeavor acquisition, we assumed a number of additional noncontributory benefit pension plans, covering substantially all former Andeavor employees. Benefits under these plans are determined based on final average compensation and years of service through December 31, 2010 and a cash balance formula for service beginning January 1, 2011. These plans were frozen as of December 31, 2018. We also assumed a number of additional postretirement benefits covering eligible employees. These benefits were merged with our existing benefits beginning January 1, 2019.
Obligations and Funded Status
The accumulated benefit obligation for all defined benefit pension plans was
$2,632 million
and
$2,008 million
as of
December 31, 2018
and
2017
.
The following summarizes our defined benefit pension plans that have accumulated benefit obligations in excess of plan assets.
|
December 31,
|
|||||||
|
(In millions)
|
2018
|
2017
|
|||||
|
Projected benefit obligations
|
$
|
2,779
|
|
$
|
2,164
|
|
|
|
Accumulated benefit obligations
|
2,632
|
|
2,008
|
|
|||
|
Fair value of plan assets
|
2,089
|
|
1,840
|
|
|||
137
The following summarizes the projected benefit obligations and funded status for our defined benefit pension and other postretirement plans:
|
|
Pension Benefits
|
Other Benefits
|
|||||||||||||
|
(In millions)
|
2018
|
2017
|
2018
|
2017
|
|||||||||||
|
Change in benefit obligations:
|
|||||||||||||||
|
Benefit obligations at January 1
|
$
|
2,164
|
|
$
|
2,024
|
|
$
|
826
|
|
$
|
740
|
|
|||
|
Service cost
|
159
|
|
132
|
|
30
|
|
25
|
|
|||||||
|
Interest cost
|
83
|
|
75
|
|
30
|
|
30
|
|
|||||||
|
Actuarial (gain) loss
|
(159
|
)
|
150
|
|
(71
|
)
|
61
|
|
|||||||
|
Benefits paid
|
(273
|
)
|
(217
|
)
|
(36
|
)
|
(30
|
)
|
|||||||
|
Plan amendments
|
(90
|
)
|
—
|
|
34
|
|
—
|
|
|||||||
|
Acquisitions
|
895
|
|
—
|
|
71
|
|
—
|
|
|||||||
|
Benefit obligations at December 31
|
2,779
|
|
2,164
|
|
884
|
|
826
|
|
|||||||
|
Change in plan assets:
|
|||||||||||||||
|
Fair value of plan assets at January 1
|
1,840
|
|
1,659
|
|
—
|
|
—
|
|
|||||||
|
Actual return on plan assets
|
(115
|
)
|
270
|
|
—
|
|
—
|
|
|||||||
|
Employer contributions
|
115
|
|
128
|
|
36
|
|
30
|
|
|||||||
|
Benefits paid from plan assets
|
(273
|
)
|
(217
|
)
|
(36
|
)
|
(30
|
)
|
|||||||
|
Acquisitions
|
522
|
|
—
|
|
—
|
|
—
|
|
|||||||
|
Fair value of plan assets at December 31
|
2,089
|
|
1,840
|
|
—
|
|
—
|
|
|||||||
|
Funded status of plans at December 31
|
$
|
(690
|
)
|
$
|
(324
|
)
|
$
|
(884
|
)
|
$
|
(826
|
)
|
|||
|
Amounts recognized in the consolidated balance sheets:
|
|||||||||||||||
|
Current liabilities
|
$
|
(21
|
)
|
$
|
(18
|
)
|
$
|
(44
|
)
|
$
|
(33
|
)
|
|||
|
Noncurrent liabilities
|
(669
|
)
|
(306
|
)
|
(840
|
)
|
(793
|
)
|
|||||||
|
Accrued benefit cost
|
$
|
(690
|
)
|
$
|
(324
|
)
|
$
|
(884
|
)
|
$
|
(826
|
)
|
|||
|
Pretax amounts recognized in accumulated other comprehensive loss:
(a)
|
|||||||||||||||
|
Net actuarial loss
|
$
|
517
|
|
$
|
537
|
|
$
|
9
|
|
$
|
80
|
|
|||
|
Prior service cost (credit)
|
(295
|
)
|
(238
|
)
|
35
|
|
(3
|
)
|
|||||||
|
(a)
|
Amounts exclude those related to LOOP and Explorer, equity method investees with defined benefit pension and postretirement plans for which net losses of
$18 million
and less than
$1 million
were recorded in accumulated other comprehensive loss in
2018
, reflecting our ownership share.
|
138
Components of Net Periodic Benefit Cost and Other Comprehensive Loss
The following summarizes the net periodic benefit costs and the amounts recognized as other comprehensive loss for our defined benefit pension and other postretirement plans.
|
|
Pension Benefits
|
Other Benefits
|
|||||||||||||||||||||
|
(In millions)
|
2018
|
2017
|
2016
|
2018
|
2017
|
2016
|
|||||||||||||||||
|
Components of net periodic benefit cost:
|
|||||||||||||||||||||||
|
Service cost
|
$
|
159
|
|
$
|
132
|
|
$
|
114
|
|
$
|
30
|
|
$
|
25
|
|
$
|
32
|
|
|||||
|
Interest cost
|
83
|
|
75
|
|
73
|
|
30
|
|
30
|
|
35
|
|
|||||||||||
|
Expected return on plan assets
|
(109
|
)
|
(100
|
)
|
(98
|
)
|
—
|
|
—
|
|
—
|
|
|||||||||||
|
Amortization – prior service credit
|
(33
|
)
|
(39
|
)
|
(46
|
)
|
(3
|
)
|
(3
|
)
|
(3
|
)
|
|||||||||||
|
– actuarial (gain) loss
|
31
|
|
36
|
|
38
|
|
(1
|
)
|
(2
|
)
|
2
|
|
|||||||||||
|
– settlement loss
|
53
|
|
52
|
|
7
|
|
—
|
|
—
|
|
—
|
|
|||||||||||
|
Net periodic benefit cost
(a)
|
$
|
184
|
|
$
|
156
|
|
$
|
88
|
|
$
|
56
|
|
$
|
50
|
|
$
|
66
|
|
|||||
|
Other changes in plan assets and benefit obligations recognized in other comprehensive loss (pretax):
|
|||||||||||||||||||||||
|
Actuarial (gain) loss
|
$
|
64
|
|
$
|
(20
|
)
|
$
|
(33
|
)
|
$
|
(71
|
)
|
$
|
61
|
|
$
|
(101
|
)
|
|||||
|
Prior service cost (credit)
|
(90
|
)
|
—
|
|
—
|
|
34
|
|
—
|
|
—
|
|
|||||||||||
|
Amortization of actuarial gain (loss)
|
(84
|
)
|
(88
|
)
|
(45
|
)
|
1
|
|
2
|
|
(2
|
)
|
|||||||||||
|
Amortization of prior service credit
|
33
|
|
39
|
|
46
|
|
3
|
|
3
|
|
3
|
|
|||||||||||
|
Other
|
—
|
|
—
|
|
—
|
|
—
|
|
—
|
|
—
|
|
|||||||||||
|
Total recognized in other comprehensive loss
|
$
|
(77
|
)
|
$
|
(69
|
)
|
$
|
(32
|
)
|
$
|
(33
|
)
|
$
|
66
|
|
$
|
(100
|
)
|
|||||
|
Total recognized in net periodic benefit cost and other comprehensive loss
|
$
|
107
|
|
$
|
87
|
|
$
|
56
|
|
$
|
23
|
|
$
|
116
|
|
$
|
(34
|
)
|
|||||
|
(a)
|
Net periodic benefit cost reflects a calculated market-related value of plan assets which recognizes changes in fair value over three years.
|
Lump sum payments to employees retiring in
2018
,
2017
and
2016
exceeded the plan’s total service and interest costs expected for those years. Settlement losses are required to be recorded when lump sum payments exceed total service and interest costs. As a result, pension settlement expenses were recorded in
2018
,
2017
and
2016
related to our cumulative lump sum payments made during those years.
The estimated net actuarial loss and prior service credit for our defined benefit pension plans that will be amortized from accumulated other comprehensive loss into net periodic benefit cost in
2019
are
$18 million
and
$45 million
, respectively. The estimated amount that will be amortized from accumulated other comprehensive loss into net periodic benefit cost in
2019
is less than
$1 million
for both the net actuarial gain and prior service credit for our other defined benefit postretirement plans.
Plan Assumptions
The following summarizes the assumptions used to determine the benefit obligations at
December 31,
and net periodic benefit cost for the defined benefit pension and other postretirement plans for
2018
,
2017
and
2016
.
|
|
Pension Benefits
|
Other Benefits
|
|||||||||||||||
|
|
2018
|
2017
|
2016
|
2018
|
2017
|
2016
|
|||||||||||
|
Weighted-average assumptions used to determine benefit obligation:
|
|||||||||||||||||
|
Discount rate
|
4.21
|
%
|
3.55
|
%
|
3.90
|
%
|
4.26
|
%
|
3.70
|
%
|
4.25
|
%
|
|||||
|
Rate of compensation increase
|
5.00
|
%
|
5.00
|
%
|
5.00
|
%
|
5.00
|
%
|
5.00
|
%
|
5.00
|
%
|
|||||
|
Weighted-average assumptions used to determine net periodic benefit cost:
|
|||||||||||||||||
|
Discount rate
|
3.88
|
%
|
3.85
|
%
|
3.80
|
%
|
3.72
|
%
|
4.25
|
%
|
4.50
|
%
|
|||||
|
Expected long-term return on plan assets
|
6.15
|
%
|
6.50
|
%
|
6.50
|
%
|
—
|
%
|
—
|
%
|
—
|
%
|
|||||
|
Rate of compensation increase
|
4.80
|
%
|
5.00
|
%
|
5.00
|
%
|
5.00
|
%
|
5.00
|
%
|
5.00
|
%
|
|||||
139
Expected Long-term Return on Plan Assets
The overall expected long-term return on plan assets assumption is determined based on an asset rate-of-return modeling tool developed by a third-party investment group. The tool utilizes underlying assumptions based on actual returns by asset category and inflation and takes into account our asset allocation to derive an expected long-term rate of return on those assets. Capital market assumptions reflect the long-term capital market outlook. The assumptions for equity and fixed income investments are developed using a building-block approach, reflecting observable inflation information and interest rate information available in the fixed income markets. Long-term assumptions for other asset categories are based on historical results, current market characteristics and the professional judgment of our internal and external investment teams.
Assumed Health Care Cost Trend
The following summarizes the assumed health care cost trend rates.
|
|
December 31,
|
|||||||
|
|
2018
|
2017
|
2016
|
|||||
|
Health care cost trend rate assumed for the following year:
|
||||||||
|
Medical: Pre-65
|
6.80
|
%
|
6.75
|
%
|
7.00
|
%
|
||
|
Prescription drugs
|
9.50
|
%
|
8.75
|
%
|
9.00
|
%
|
||
|
Rate to which the cost trend rate is assumed to decline (the ultimate trend rate):
|
||||||||
|
Medical: Pre-65
|
4.50
|
%
|
4.50
|
%
|
4.50
|
%
|
||
|
Prescription drugs
|
4.50
|
%
|
4.50
|
%
|
4.50
|
%
|
||
|
Year that the rate reaches the ultimate trend rate:
|
||||||||
|
Medical: Pre-65
|
2027
|
|
2026
|
|
2026
|
|
||
|
Prescription drugs
|
2027
|
|
2026
|
|
2026
|
|
||
Increases in the post-65 medical plan premium for the Marathon Petroleum Health Plan and the Marathon Petroleum Retiree Health Plan are the lower of the trend rate or
four percent
.
Assumed health care cost trend rates have a significant effect on the amounts reported for defined benefit retiree health care plans. A one percentage point change in assumed health care cost trend rates would have the following effects:
|
1-Percentage-
|
1-Percentage-
|
||||||
|
(In millions)
|
Point Increase
|
Point Decrease
|
|||||
|
Effect on total of service and interest cost components
|
$
|
5
|
|
$
|
(4
|
)
|
|
|
Effect on other postretirement benefit obligations
|
34
|
|
(30
|
)
|
|||
Plan Investment Policies and Strategies
The investment policies for our pension plan assets reflect the funded status of the plans and expectations regarding our future ability to make further contributions. Long-term investment goals are to: (1) manage the assets in accordance with the legal requirements of all applicable laws; (2) diversify plan investments across asset classes to achieve an optimal balance between risk and return and between income and growth of assets through capital appreciation; and (3) source benefit payments primarily through existing plan assets and anticipated future returns.
The investment goals are implemented to manage the plans’ funded status volatility and minimize future cash contributions. The asset allocation strategy will change over time in response to changes primarily in funded status, which is dictated by current and anticipated market conditions, the independent actions of our investment committee, required cash flows to and from the plans and other factors deemed appropriate. Such changes in asset allocation are intended to allocate additional assets to the fixed income asset class should the funded status improve. The fixed income asset class shall be invested in such a manner that its interest rate sensitivity correlates highly with that of the plans’ liabilities. Other asset classes are intended to provide additional return with associated higher levels of risk. Investment performance and risk is measured and monitored on an ongoing basis through quarterly investment meetings and periodic asset and liability studies. At
December 31, 2018
, the primary plan’s targeted asset allocation was
42 percent
equity, private equity, real estate, and timber securities and
58 percent
fixed income securities.
Fair Value Measurements
Plan assets are measured at fair value. The following provides a description of the valuation techniques employed for each major plan asset category at
December 31, 2018
and
2017
.
140
Cash and cash equivalents
– Cash and cash equivalents include a collective fund serving as the investment vehicle for the cash reserves and cash held by third-party investment managers. The collective fund is valued at net asset value (“NAV”) on a scheduled basis using a cost approach, and is considered a Level 2 asset. Cash and cash equivalents held by third-party investment managers are valued using a cost approach and are considered Level 2.
Equity
– Equity investments includes common stock, mutual and pooled funds. Common stock investments are valued using a market approach, which are priced daily in active markets and are considered Level 1. Mutual and pooled equity funds are well diversified portfolios, representing a mix of strategies in domestic, international and emerging market strategies. Mutual funds are publicly registered, valued at NAV on a daily basis using a market approach and are considered Level 1 assets. Pooled funds are valued at NAV using a market approach and are considered Level 2.
Fixed Income
– Fixed income investments include corporate bonds, U.S. dollar treasury bonds and municipal bonds. These securities are priced on observable inputs using a combination of market, income and cost approaches. These securities are considered Level 2 assets. Fixed income also includes a well diversified bond portfolio structured as a pooled fund. This fund is valued at NAV on a daily basis using a market approach and is considered Level 2. Other investments classified as Level 1 include mutual funds that are publicly registered, valued at NAV on a daily basis using a market approach.
Private Equity
– Private equity investments include interests in limited partnerships which are valued using information provided by external managers for each individual investment held in the fund. These holdings are considered Level 3.
Real Estate
– Real estate investments consist of interests in limited partnerships. These holdings are either appraised or valued using investment manager’s assessment of assets held. These holdings are considered Level 3.
Other
– Other investments include two limited liability companies (“LLCs”) with no public market. The LLCs were formed to acquire timberland in the northwest U.S. These holdings are either appraised or valued using investment manager’s assessment of assets held. These holdings are considered Level 3. Other investments classified as Level 1 include publicly traded depository receipts.
The following tables present the fair values of our defined benefit pension plans’ assets, by level within the fair value hierarchy, as of
December 31, 2018
and
2017
.
|
|
December 31, 2018
|
||||||||||||||
|
(In millions)
|
Level 1
|
Level 2
|
Level 3
|
Total
|
|||||||||||
|
Cash and cash equivalents
|
$
|
—
|
|
$
|
25
|
|
$
|
—
|
|
$
|
25
|
|
|||
|
Equity:
|
|||||||||||||||
|
Common stocks
|
89
|
|
86
|
|
—
|
|
175
|
|
|||||||
|
Mutual funds
|
159
|
|
—
|
|
—
|
|
159
|
|
|||||||
|
Pooled funds
|
—
|
|
297
|
|
—
|
|
297
|
|
|||||||
|
Fixed income:
|
|||||||||||||||
|
Corporate
|
176
|
|
684
|
|
—
|
|
860
|
|
|||||||
|
Government
|
98
|
|
141
|
|
—
|
|
239
|
|
|||||||
|
Pooled funds
|
—
|
|
201
|
|
—
|
|
201
|
|
|||||||
|
Private equity
|
—
|
|
—
|
|
41
|
|
41
|
|
|||||||
|
Real estate
|
—
|
|
—
|
|
29
|
|
29
|
|
|||||||
|
Other
|
45
|
|
—
|
|
18
|
|
63
|
|
|||||||
|
Total investments, at fair value
|
$
|
567
|
|
$
|
1,434
|
|
$
|
88
|
|
$
|
2,089
|
|
|||
141
|
|
December 31, 2017
|
||||||||||||||
|
(In millions)
|
Level 1
|
Level 2
|
Level 3
|
Total
|
|||||||||||
|
Cash and cash equivalents
|
$
|
—
|
|
$
|
14
|
|
$
|
—
|
|
$
|
14
|
|
|||
|
Equity:
|
|||||||||||||||
|
Common stocks
|
36
|
|
—
|
|
—
|
|
36
|
|
|||||||
|
Mutual funds
|
227
|
|
—
|
|
—
|
|
227
|
|
|||||||
|
Pooled funds
|
—
|
|
507
|
|
—
|
|
507
|
|
|||||||
|
Fixed income:
|
|||||||||||||||
|
Corporate
|
—
|
|
673
|
|
1
|
|
674
|
|
|||||||
|
Government
|
—
|
|
98
|
|
—
|
|
98
|
|
|||||||
|
Pooled funds
|
—
|
|
176
|
|
—
|
|
176
|
|
|||||||
|
Private equity
|
—
|
|
—
|
|
51
|
|
51
|
|
|||||||
|
Real estate
|
—
|
|
—
|
|
34
|
|
34
|
|
|||||||
|
Other
|
2
|
|
2
|
|
19
|
|
23
|
|
|||||||
|
Total investments, at fair value
|
$
|
265
|
|
$
|
1,470
|
|
$
|
105
|
|
$
|
1,840
|
|
|||
The following is a reconciliation of the beginning and ending balances recorded for plan assets classified as Level 3 in the fair value hierarchy:
|
|
2018
|
||||||||||||||
|
(In millions)
|
Private Equity
|
Real Estate
|
Other
|
Total
|
|||||||||||
|
Beginning balance
|
$
|
51
|
|
$
|
34
|
|
$
|
20
|
|
$
|
105
|
|
|||
|
Actual return on plan assets:
|
|||||||||||||||
|
Realized
|
9
|
|
2
|
|
—
|
|
11
|
|
|||||||
|
Unrealized
|
2
|
|
(1
|
)
|
—
|
|
1
|
|
|||||||
|
Purchases
|
1
|
|
1
|
|
—
|
|
2
|
|
|||||||
|
Sales
|
(22
|
)
|
(7
|
)
|
(2
|
)
|
(31
|
)
|
|||||||
|
Ending balance
|
$
|
41
|
|
$
|
29
|
|
$
|
18
|
|
$
|
88
|
|
|||
|
|
2017
|
||||||||||||||
|
(In millions)
|
Private Equity
|
Real Estate
|
Other
|
Total
|
|||||||||||
|
Beginning balance
|
$
|
60
|
|
$
|
39
|
|
$
|
19
|
|
$
|
118
|
|
|||
|
Actual return on plan assets:
|
|||||||||||||||
|
Realized
|
11
|
|
3
|
|
—
|
|
14
|
|
|||||||
|
Unrealized
|
(1
|
)
|
—
|
|
1
|
|
—
|
|
|||||||
|
Purchases
|
2
|
|
1
|
|
1
|
|
4
|
|
|||||||
|
Sales
|
(21
|
)
|
(9
|
)
|
(1
|
)
|
(31
|
)
|
|||||||
|
Ending balance
|
$
|
51
|
|
$
|
34
|
|
$
|
20
|
|
$
|
105
|
|
|||
Cash Flows
Contributions to defined benefit plans
–
Our funding policy with respect to the funded pension plans is to contribute amounts necessary to satisfy minimum pension funding requirements, including requirements of the Pension Protection Act of 2006, plus such additional, discretionary, amounts from time to time as determined appropriate by management. In
2018
, we made pension contributions totaling
$115 million
. We have no required funding for
2019
, but may make voluntary contributions at our discretion. Cash contributions to be paid from our general assets for the unfunded pension and postretirement plans are estimated to be approximately
$19 million
and
$44 million
, respectively, in
2019
.
142
Estimated future benefit payments
–
The following gross benefit payments, which reflect expected future service, as appropriate, are expected to be paid in the years indicated.
|
(In millions)
|
Pension Benefits
|
Other Benefits
|
|||||
|
2019
|
$
|
238
|
|
$
|
44
|
|
|
|
2020
|
254
|
|
46
|
|
|||
|
2021
|
219
|
|
48
|
|
|||
|
2022
|
218
|
|
50
|
|
|||
|
2023
|
213
|
|
51
|
|
|||
|
2024 through 2028
|
1,048
|
|
271
|
|
|||
Contributions to defined contribution plans
–
We also contribute to several defined contribution plans for eligible employees. Contributions to these plans totaled
$144 million
,
$116 million
and
$113 million
in
2018
,
2017
and
2016
, respectively.
Multiemployer Pension Plan
We contribute to
one
multiemployer defined benefit pension plan under the terms of a collective-bargaining agreement that covers some of our union-represented employees. The risks of participating in this multiemployer plan are different from single-employer plans in the following aspects:
|
•
|
Assets contributed to the multiemployer plan by one employer may be used to provide benefits to employees of other participating employers.
|
|
•
|
If a participating employer stops contributing to the plan, the unfunded obligations of the plan may be borne by the remaining participating employers.
|
|
•
|
If we choose to stop participating in the multiemployer plan, we may be required to pay that plan an amount based on the underfunded status of the plan, referred to as a withdrawal liability.
|
Our participation in this plan for
2018
,
2017
and
2016
is outlined in the table below. The “EIN” column provides the Employee Identification Number for the plan. The most recent Pension Protection Act zone status available in
2018
and
2017
is for the plan’s year ended
December 31, 2017
and
December 31, 2016
, respectively. The zone status is based on information that we received from the plan and is certified by the plan’s actuary. Among other factors, plans in the red zone are generally less than
65 percent
funded. The “FIP/RP Status Pending/Implemented” column indicates a financial improvement plan or a rehabilitation plan has been implemented. The last column lists the expiration date of the collective-bargaining agreement to which the plan is subject. There have been no significant changes that affect the comparability of
2018
,
2017
and
2016
contributions. Our portion of the contributions does not make up more than
five percent
of total contributions to the plan.
|
|
|
Pension Protection
Act Zone Status
|
FIP/RP Status
Pending/Implemented
|
MPC Contributions
( In millions ) |
Surcharge
Imposed |
Expiration Date of
Collective – Bargaining
Agreement |
||||||||||||||||||
|
Pension Fund
|
EIN
|
2018
|
2017
|
2018
|
2017
|
2016
|
||||||||||||||||||
|
Central States, Southeast and Southwest Areas Pension Plan
(a)
|
366044243
|
Red
|
Red
|
Implemented
|
$
|
4
|
|
$
|
4
|
|
$
|
4
|
|
No
|
January 31, 2024
|
|||||||||
|
(a)
|
This agreement has a minimum contribution requirement of
$328
per week per employee for
2019
. A total of
258
employees participated in the plan as of
December 31, 2018
.
|
Multiemployer Health and Welfare Plan
We contribute to
one
multiemployer health and welfare plan that covers both active employees and retirees. Through the health and welfare plan employees receive medical, dental, vision, prescription and disability coverage. Our contributions to this plan totaled
$6 million
,
$7 million
and
$6 million
for
2018
,
2017
and
2016
, respectively.
143
|
23
.
|
STOCK-BASED COMPENSATION PLANS
|
Description of the Plans
Effective April 26, 2012, our employees and non-employee directors became eligible to receive equity awards under the Amended and Restated Marathon Petroleum Corporation 2012 Incentive Compensation Plan (“MPC 2012 Plan”). The MPC 2012 Plan authorizes the Compensation Committee of our board of directors (“Committee”) to grant non-qualified or incentive stock options, stock appreciation rights, stock awards (including restricted stock and restricted stock unit awards), cash awards and performance awards to our employees and non-employee directors. Under the MPC 2012 Plan, no more than
50 million
shares of our common stock may be delivered and no more than
20 million
shares of our common stock may be the subject of awards that are not stock options or stock appreciation rights. In the sole discretion of the Committee,
20 million
shares of our common stock may be granted as incentive stock options. Shares issued as a result of awards granted under these plans are funded through the issuance of new MPC common shares.
Prior to April 26, 2012, our employees and non-employee directors were eligible to receive equity awards under the Marathon Petroleum Corporation 2011 Second Amended and Restated Incentive Compensation Plan (“MPC 2011 Plan”).
In connection with the Andeavor acquisition, in October of 2018 we converted the outstanding option and equity incentive awards (other than awards held by non-employee directors of Andeavor, which awards were paid out in connection with the acquisition) under the Andeavor Plans to awards that provide for rights to acquire (in the case of options) or be settled in or otherwise determined in reference to shares of MPC common stock in place of shares of Andeavor common stock (in the case of equity incentive awards). As part of that conversion we used an exchange ratio for the respective share prices of Andeavor common stock and MPC common stock to ensure that the award holders’ economic opportunity remained constant, and for converted awards which included a performance component, performance was determined at the time of the conversion and the awards became subject to a time-based vesting only design. The converted awards otherwise continue to be subject to the terms and conditions of their award agreements and the applicable Andeavor Plan under which such awards were granted. The “Andeavor Plans” as to which the award conversions apply are: the Tesoro Corporation 2006 Long-Term Incentive Plan; the Andeavor Amended and Restated 2011 Long-Term Incentive Plan; the Andeavor 2018 Long-Term Incentive Plan; and the Amended and Restated Northern Tier Energy LP 2012 Long-Term Incentive Plan.
Stock-Based Awards under the Plans
We expense all share-based payments to employees and non-employee directors based on the grant date fair value of the awards over the requisite service period, adjusted for estimated forfeitures.
Stock Options
–
We grant stock options to certain officer and non-officer employees. All of the stock options granted in
2018
fell under the MPC 2012 Plan. Stock options awarded under the MPC 2011 Plan and the MPC 2012 Plan represent the right to purchase shares of our common stock at its fair market value, which is the closing price of MPC’s common stock on the date of grant. Stock options have a maximum term of
ten years
from the date they are granted, and vest over a requisite service period of
three years
. We use the Black Scholes option-pricing model to estimate the fair value of stock options granted, which requires the input of subjective assumptions.
Restricted Stock and Restricted Stock Units
– We grant restricted stock and restricted stock units to employees and non-employee directors. In general, restricted stock and restricted stock units granted to employees vest over a requisite service period of
three years
. Restricted stock and restricted stock unit awards granted after 2011 to officers are subject to an additional
one year
holding period after the three-year vesting period. Restricted stock recipients who received grants in 2012 and after have the right to vote such stock; however, dividends are accrued and will be paid upon vesting. Restricted stock units granted to non-employee directors are considered to vest immediately at the time of the grant for accounting purposes, as they are non-forfeitable, but are not issued until the director’s departure from the board of directors. Restricted stock unit recipients do not have the right to vote such shares and receive dividend equivalents payable upon vesting. The non-vested shares are not transferable and are held by our transfer agent. The fair values of restricted stock are equal to the market price of our common stock on the grant date.
Performance Units
– We grant performance unit awards to certain officer employees. Performance units are dollar denominated. The target value of all performance units is
$1.00
, with actual payout up to
$2.00
per unit (up to
200 percent
of target). Performance units issued under the MPC 2012 Plan have a
36
-month requisite service period. The payout value of these awards will be determined by the relative ranking of the total shareholder return (“TSR”
)
of MPC common stock compared to the TSR of a select group of peer companies, as well as the Standard & Poor’s 500 Energy Index fund over an average of four measurement periods. These awards will be settled
25 percent
in MPC common stock and
75 percent
in cash. The number of shares actually distributed will be determined by dividing 25 percent of the final payout by the closing price of MPC common stock on the day the Committee certifies the final TSR rankings, or the next trading day if the certification is made outside of normal trading hours. The performance units paying out in cash are accounted for as liability awards and recorded at fair value
144
with a mark-to-market adjustment made each quarter. The performance units that settle in shares are accounted for as equity awards.
Total Stock-Based Compensation Expense
The following table reflects activity related to our stock-based compensation arrangements, including the converted awards related to the acquisition of Andeavor:
|
(In millions)
|
2018
|
2017
|
2016
|
||||||||
|
Stock-based compensation expense
|
$
|
133
|
|
$
|
51
|
|
$
|
45
|
|
||
|
Tax benefit recognized on stock-based compensation expense
|
32
|
|
19
|
|
17
|
|
|||||
|
Cash received by MPC upon exercise of stock option awards
|
24
|
|
46
|
|
10
|
|
|||||
|
Tax benefit received for tax deductions for stock awards exercised
|
14
|
|
25
|
|
4
|
|
|||||
Stock Option Awards
The Black Scholes option-pricing model values used to value stock option awards granted were determined based on the following weighted average assumptions:
|
2018
|
2017
|
2016
|
|||||||||
|
Weighted average exercise price per share
|
$
|
67.71
|
|
$
|
50.57
|
|
$
|
35.27
|
|
||
|
Expected life in years
|
6.2
|
|
6.3
|
|
6.2
|
|
|||||
|
Expected volatility
|
34
|
%
|
35
|
%
|
38
|
%
|
|||||
|
Expected dividend yield
|
3.0
|
%
|
3.0
|
%
|
3.0
|
%
|
|||||
|
Risk-free interest rate
|
2.7
|
%
|
2.1
|
%
|
1.4
|
%
|
|||||
|
Weighted average grant date fair value of stock option awards granted
|
$
|
17.21
|
|
$
|
13.42
|
|
$
|
9.84
|
|
||
The expected life of stock options granted is based on historical data and represents the period of time that options granted are expected to be held prior to exercise. The
2018
assumption for expected volatility of our stock price reflects a weighting of
50 percent
of our common stock implied volatility and
50 percent
of our common stock historical volatility. The risk-free interest rate for periods within the expected life of the option is based on the U.S. Treasury yield curve in effect at the time of the grant.
The following is a summary of our common stock option activity in
2018
:
|
Number of
of Shares
|
Weighted Average Exercise Price
|
Weighted Average Remaining Contractual Terms (in years)
|
Aggregate Intrinsic Value (in millions)
|
|||||||||
|
Outstanding at December 31, 2017
|
8,465,398
|
|
$
|
33.74
|
|
|||||||
|
Granted
|
903,797
|
|
67.71
|
|
||||||||
|
Converted in acquisition
|
302,403
|
|
7.00
|
|
||||||||
|
Exercised
|
(916,566
|
)
|
26.24
|
|
||||||||
|
Forfeited or expired
|
(30,437
|
)
|
48.96
|
|
||||||||
|
Outstanding at December 31, 2018
|
8,724,595
|
|
37.07
|
|
||||||||
|
Vested and expected to vest at December 31, 2018
|
8,707,148
|
|
37.01
|
|
5.1
|
$
|
199
|
|
||||
|
Exercisable at December 31, 2018
|
6,586,859
|
|
31.42
|
|
4.0
|
182
|
|
|||||
The intrinsic value of options exercised by MPC employees during
2018
,
2017
and
2016
was
$44 million
,
$75 million
and
$14 million
, respectively.
As of
December 31, 2018
, unrecognized compensation cost related to stock option awards was
$10 million
, which is expected to be recognized over a weighted average period of
1.2
years.
145
Restricted Stock Awards
The following is a summary of restricted stock award activity of our common stock in
2018
:
|
|
Shares of Restricted Stock (“RS”)
|
Restricted Stock Units (“RSU”)
|
|||||||||||
|
|
Number of Shares
|
Weighted Average Grant Date Fair Value
|
Number of Units
|
Weighted Average Grant Date Fair Value
|
|||||||||
|
Outstanding at December 31, 2017
|
1,188,662
|
|
$
|
45.07
|
|
285,164
|
|
$
|
29.95
|
|
|||
|
Granted
|
470,951
|
|
71.19
|
|
24,430
|
|
72.43
|
|
|||||
|
Converted in acquisition
|
16,972
|
|
82.43
|
|
4,452,751
|
|
82.43
|
|
|||||
|
RS Vested/RSUs Issued
|
(624,934
|
)
|
45.98
|
|
(526,254
|
)
|
65.34
|
|
|||||
|
Forfeited
|
(60,951
|
)
|
50.27
|
|
(9,235
|
)
|
82.43
|
|
|||||
|
Outstanding at December 31, 2018
|
990,700
|
|
57.23
|
|
4,226,856
|
|
80.96
|
|
|||||
Of the
4,226,856
restricted stock units outstanding,
1,106,740
are vested and have a weighted average grant date fair value of
$76.90
. These vested but unissued units are held by our non-employee directors, certain of our officers and certain former officers and employees of Andeavor, are non-forfeitable and are issuable upon the director’s departure from our board of directors or officers end of employment with the company or, for certain former officers and employees of Andeavor, upon the expiration of a waiting period under Section 409A of the Code.
The following is a summary of the values related to restricted stock and restricted stock unit awards held by MPC employees and non-employee directors:
|
Restricted Stock
|
Restricted Stock Units
|
||||||||||||||
|
Intrinsic Value of Awards Vested During the Period (in millions)
|
Weighted Average Grant Date Fair Value of Awards Granted During the Period
|
Intrinsic Value of Awards Vested During the Period (in millions)
|
Weighted Average Grant Date Fair Value of Awards Granted During the Period
|
||||||||||||
|
2018
|
$
|
49
|
|
|
$
|
71.19
|
|
|
$
|
39
|
|
|
$
|
72.43
|
|
|
2017
|
28
|
|
|
50.25
|
|
|
5
|
|
|
53.19
|
|
||||
|
2016
|
17
|
|
36.17
|
|
8
|
|
40.85
|
|
|||||||
As of
December 31, 2018
, unrecognized compensation cost related to restricted stock awards was
$35 million
, which is expected to be recognized over a weighted average period of
1.2
years. Unrecognized compensation cost related to restricted stock unit awards was
$110 million
, which is expected to be recognized over a weighted average period of
1.10
years.
Performance Unit Awards
The following table presents a summary of the
2018
activity for performance unit awards to be settled in shares:
|
|
Number of Units
|
Weighted Average Grant Date Fair Value
|
||||
|
Outstanding at December 31, 2017
|
6,851,542
|
|
$
|
0.81
|
|
|
|
Granted
|
3,830,000
|
|
0.83
|
|
||
|
Vested
|
(2,052,959
|
)
|
0.95
|
|
||
|
Forfeited
|
(10,000
|
)
|
0.92
|
|
||
|
Outstanding at December 31, 2018
|
8,618,583
|
|
0.79
|
|
||
The number of shares that would be issued upon target vesting, using the closing price of our common stock on
December 31, 2018
would be
146,053
shares.
As of
December 31, 2018
, unrecognized compensation cost related to equity-classified performance unit awards was
$3 million
, which is expected to be recognized over a weighted average period of
1.3
years.
146
Performance units to be settled in MPC shares have a grant date fair value calculated using a Monte Carlo valuation model, which requires the input of subjective assumptions. The following table provides a summary of these assumptions:
|
2018
|
2017
|
2016
|
|||||||||
|
Risk-free interest rate
|
2.3
|
%
|
1.5
|
%
|
1.0
|
%
|
|||||
|
Look-back period (in years)
|
2.8
|
|
2.8
|
|
2.8
|
|
|||||
|
Expected volatility
|
34.0
|
%
|
36.1
|
%
|
34.2
|
%
|
|||||
|
Grant date fair value of performance units granted
|
$
|
0.83
|
|
$
|
0.92
|
|
$
|
0.57
|
|
||
The risk-free interest rate for the remaining performance period as of the grant date is based on the U.S. Treasury yield curve in effect at the time of the grant. The look-back period reflects the remaining performance period at the grant date. The assumption for the expected volatility of our stock price reflects the average MPC common stock historical volatility.
MPLX and ANDX Awards
Compensation expense for awards related to MPLX and ANDX was not material to our consolidated financial statements for 2018.
|
24
.
|
LEASES
|
Lessee
We lease a wide variety of facilities and equipment under operating leases, including land and building space, office equipment, storage facilities and transportation equipment. Most long-term leases include renewal options and, in certain leases, purchase options. Future minimum commitments as of
December 31, 2018
, for capital lease obligations and for operating lease obligations having initial or remaining non-cancellable lease terms in excess of one year are as follows:
|
(In millions)
|
Capital
Lease
Obligations
|
Operating
Lease
Obligations
|
|||||
|
2019
|
$
|
70
|
|
$
|
709
|
|
|
|
2020
|
71
|
|
619
|
|
|||
|
2021
|
66
|
|
553
|
|
|||
|
2022
|
75
|
|
389
|
|
|||
|
2023
|
82
|
|
295
|
|
|||
|
Later years
|
586
|
|
858
|
|
|||
|
Total minimum lease payments
|
950
|
|
$
|
3,423
|
|
||
|
Less imputed interest costs
|
301
|
|
|||||
|
Present value of net minimum lease payments
|
$
|
649
|
|
||||
Operating lease rental expense was:
|
(In millions)
|
2018
|
2017
|
2016
|
||||||||
|
Rental expense
|
$
|
546
|
|
$
|
367
|
|
$
|
370
|
|
||
147
Lessor
MPLX has certain natural gas gathering, transportation and processing agreements in which it is considered to be the lessor under several implicit operating lease arrangements in accordance with GAAP. MPLX’s primary implicit lease operations relate to a natural gas gathering agreement in the Marcellus region for which it earns a fixed-fee for providing gathering services to a single producer using a dedicated gathering system. As the gathering system is expanded, the fixed-fee charged to the producer is adjusted to include the additional gathering assets in the lease. The primary term of the natural gas gathering arrangement expires in 2038 and will continue thereafter on a year-to-year basis until terminated by either party. Other significant implicit leases relate to a natural gas processing agreement in the Marcellus region and a natural gas processing agreement in the Southern Appalachia region for which MPLX earns minimum monthly fees for providing processing services to a single producer using a dedicated processing plant. The primary term of these natural gas processing agreements expire during 2023 and 2033.
Our revenue from implicit lease arrangements, excluding executory costs, totaled approximately
$221 million
,
$218 million
and
$246 million
in
2018
,
2017
and
2016
, respectively. The implicit lease arrangements related to the processing facilities contain contingent rental provisions whereby we receive additional fees if the producer customer exceeds the monthly minimum processed volumes. During the year ended
December 31, 2018
, we received
$10 million
in contingent lease payments and
$9 million
for the year ended
December 31, 2017
. The following is a schedule of minimum future rentals on the non‑cancellable operating leases as of
December 31, 2018
:
|
(In millions)
|
|||
|
2019
|
$
|
160
|
|
|
2020
|
159
|
|
|
|
2021
|
150
|
|
|
|
2022
|
148
|
|
|
|
2023
|
142
|
|
|
|
Later years
|
1,111
|
|
|
|
Total minimum lease payments
|
$
|
1,870
|
|
The following schedule summarizes our investment in assets held for operating lease by major classes as of
December 31, 2018
:
|
(In millions)
|
|||
|
Natural gas gathering and NGL transportation pipelines and facilities
|
$
|
965
|
|
|
Natural gas processing facilities
|
481
|
|
|
|
Terminal and related assets
|
133
|
|
|
|
Land, building, office equipment and other
|
43
|
|
|
|
Construction in progress
|
19
|
|
|
|
Property, plant and equipment
|
1,641
|
|
|
|
Less accumulated depreciation
|
219
|
|
|
|
Total property, plant and equipment
|
$
|
1,422
|
|
|
25
.
|
COMMITMENTS AND CONTINGENCIES
|
We are the subject of, or a party to, a number of pending or threatened legal actions, contingencies and commitments involving a variety of matters, including laws and regulations relating to the environment. Some of these matters are discussed below. For matters for which we have not recorded an accrued liability, we are unable to estimate a range of possible loss because the issues involved have not been fully developed through pleadings and discovery. However, the ultimate resolution of some of these contingencies could, individually or in the aggregate, be material.
Environmental Matters
We are subject to federal, state, local and foreign laws and regulations relating to the environment. These laws generally provide for control of pollutants released into the environment and require responsible parties to undertake remediation of hazardous waste disposal sites and certain other locations including presently or formerly owned or operated retail marketing sites. Penalties may be imposed for noncompliance.
148
At
December 31, 2018
and
2017
, accrued liabilities for remediation totaled
$455 million
and
$114 million
. The increase in accrued liabilities is mainly a result of assuming environmental obligations in connection with the Andeavor acquisition. It is not presently possible to estimate the ultimate amount of all remediation costs that might be incurred or the penalties if any that may be imposed. Receivables for recoverable costs from certain states, under programs to assist companies in clean-up efforts related to underground storage tanks at presently or formerly owned or operated retail marketing sites, were
$35 million
and
$45 million
at
December 31, 2018
and
2017
, respectively.
Governmental and other entities in California, New York, Maryland and Rhode Island have filed lawsuits against coal, gas, oil and petroleum companies, including the Company. The lawsuits allege damages as a result of climate change and the plaintiffs are seeking unspecified damages and abatement under various tort theories. Similar lawsuits may be filed in other jurisdictions. At this early stage, the ultimate outcome of these matters remain uncertain, and neither the likelihood of an unfavorable outcome nor the ultimate liability, if any, can be determined.
We are involved in a number of environmental enforcement matters arising in the ordinary course of business. While the outcome and impact on us cannot be predicted with certainty, management believes the resolution of these environmental matters will not, individually or collectively, have a material adverse effect on our consolidated results of operations, financial position or cash flows.
Litigation Relating to the Acquisition of Andeavor
Between June 20 and July 11, 2018, six putative class actions (the “Actions”) were filed against some or all of Andeavor, the directors of Andeavor, and MPC, Mahi Inc. (“Merger Sub 1”) and Mahi LLC (n/k/a Andeavor LLC) (“Merger Sub 2” and, together with MPC and Merger Sub 1, the “MPC Defendants”), relating to the Andeavor merger. The Actions generally alleged that Andeavor, the directors of Andeavor and the MPC Defendants disseminated a false or misleading registration statement regarding the merger in violation of Section 14(a) of the Securities Exchange Act of 1934 (the “Exchange Act”) and Rule 14a-9 promulgated thereunder. The Actions further alleged that the directors of Andeavor and/or the MPC Defendants were liable for these violations as “controlling persons” of Andeavor under Section 20(a) of the Exchange Act. The Actions sought injunctive relief, including to enjoin and/or rescind the merger, damages in the event the merger is consummated, and an award of attorneys’ fees, in addition to other relief.
The parties ultimately reached an agreement in principle to resolve the Actions in exchange for supplemental disclosures. Consistent with that agreement, Andeavor and MPC each filed a Current Report on Form 8-K on September 14, 2018 that included certain additional disclosures in response to plaintiffs’ allegations. Between September 21 and September 28, 2018, all the Actions were dismissed as moot, and the parties reserved their rights in the event of any dispute over attorneys’ fees and expenses. In the fourth quarter of 2018, the Company resolved the remaining disputes over attorneys’ fees for an amount that was not material to the Company.
Other Lawsuits
In May 2015, the Kentucky attorney general filed a lawsuit against our wholly-owned subsidiary, MPC LP, in the United States District Court for the Western District of Kentucky asserting claims under federal and state antitrust statutes, the Kentucky Consumer Protection Act, and state common law. The complaint, as amended in July 2015, alleges that MPC LP used deed restrictions, supply agreements with customers and exchange agreements with competitors to unreasonably restrain trade in areas within Kentucky and seeks declaratory relief, unspecified damages, civil penalties, restitution and disgorgement of profits. At this stage, the ultimate outcome of this litigation remains uncertain, and neither the likelihood of an unfavorable outcome nor the ultimate liability, if any, can be determined, and we are unable to estimate a reasonably possible loss (or range of loss) for this matter. We intend to vigorously defend ourselves in this matter.
In May 2007, the Kentucky attorney general filed a lawsuit against us and Marathon Oil in state court in Franklin County, Kentucky for alleged violations of Kentucky’s emergency pricing and consumer protection laws following Hurricanes Katrina and Rita in 2005. The lawsuit alleges that we overcharged customers by
$89 million
during September and October 2005
. The complaint seeks disgorgement of these sums, as well as penalties, under Kentucky’s emergency pricing and consumer protection laws. We are vigorously defending this litigation. We believe that this is the first lawsuit for damages and injunctive relief under the Kentucky emergency pricing laws to progress this far and it contains many novel issues. In May 2011, the Kentucky attorney general amended his complaint to include a request for immediate injunctive relief as well as unspecified damages and penalties related to our wholesale gasoline pricing in April and May 2011 under statewide price controls that were activated by the Kentucky governor on April 26, 2011 and which have since expired. The court denied the attorney general’s request for immediate injunctive relief, and the remainder of the 2011 claims likely will be resolved along with those dating from 2005. If the lawsuit is resolved unfavorably in its entirety, it could materially impact our consolidated results of operations, financial position or cash flows. However, management does not believe the ultimate resolution of this litigation will have a material adverse effect on our consolidated financial position, results of operations, or cash flows.
149
We are also a party to a number of other lawsuits and other proceedings arising in the ordinary course of business. While the ultimate outcome and impact to us cannot be predicted with certainty, we believe that the resolution of these other lawsuits and proceedings will not have a material adverse effect on our consolidated financial position, results of operations or cash flows.
Guarantees
We have provided certain guarantees, direct and indirect, of the indebtedness of other companies. Under the terms of most of these guarantee arrangements, we would be required to perform should the guaranteed party fail to fulfill its obligations under the specified arrangements. In addition to these financial guarantees, we also have various performance guarantees related to specific agreements.
Guarantees related to indebtedness of equity method investees
– MPC and MPLX hold interests in an offshore oil port, LOOP, and MPLX holds an interest in a crude oil pipeline system, LOCAP. Both LOOP and LOCAP have secured various project financings with throughput and deficiency agreements. Under the agreements, MPC, as a shipper, is required to advance funds if the investees are unable to service their debt. Any such advances are considered prepayments of future transportation charges. The duration of the agreements vary but tend to follow the terms of the underlying debt, which extend through
2037
. Our maximum potential undiscounted payments under these agreements for the debt principal totaled
$171 million
as of
December 31, 2018
.
In connection with our 50 percent ownership in Crowley Ocean Partners, we have agreed to conditionally guarantee our portion of the obligations of the joint venture and its subsidiaries under a senior secured term loan agreement. The term loan agreement provides for loans of up to
$325 million
to finance the acquisition of four product tankers. MPC’s liability under the guarantee for each vessel is conditioned upon the occurrence of certain events, including if we cease to maintain an investment-grade credit rating or the charter for the relevant product tanker ceases to be in effect and is not replaced by a charter with an investment-grade company on certain defined commercial terms. As of
December 31, 2018
, our maximum potential undiscounted payments under this agreement for debt principal totaled
$163 million
.
In connection with our
50 percent
indirect interest in Crowley Blue Water Partners, we have agreed to provide a conditional guarantee of up to
50 percent
of its outstanding debt balance in the event there is no charter agreement in place with an investment-grade customer for the entity’s three vessels as well as other financial support in certain circumstances. The maximum exposure under these arrangements is
50 percent
of the amount of the debt, which was
$128 million
as of
December 31, 2018
.
Marathon Oil indemnifications
–
In conjunction with the spinoff, we have entered into arrangements with Marathon Oil providing indemnities and guarantees with recorded values of
$2 million
as of
December 31, 2018
, which consist of unrecognized tax benefits related to MPC, its consolidated subsidiaries and the refining, marketing and transportation business operations prior to the spinoff which are not already reflected in the unrecognized tax benefits described in Note
12
, and other contingent liabilities Marathon Oil may incur related to taxes. Furthermore, the separation and distribution agreement and other agreements with Marathon Oil to effect the spinoff provide for cross-indemnities between Marathon Oil and us. In general, Marathon Oil is required to indemnify us for any liabilities relating to Marathon Oil’s historical oil and gas exploration and production operations, oil sands mining operations and integrated gas operations, and we are required to indemnify Marathon Oil for any liabilities relating to Marathon Oil’s historical refining, marketing and transportation operations. The terms of these indemnifications are indefinite and the amounts are not capped.
Other guarantees
– We have entered into other guarantees with maximum potential undiscounted payments totaling
$123 million
as of
December 31, 2018
, which consist primarily of a commitment to contribute cash to an equity method investee for certain catastrophic events in lieu of procuring insurance coverage and leases of assets containing general lease indemnities and guaranteed residual values.
General guarantees associated with dispositions
–
Over the years, we have sold various assets in the normal course of our business. Certain of the related agreements contain performance and general guarantees, including guarantees regarding inaccuracies in representations, warranties, covenants and agreements, and environmental and general indemnifications that require us to perform upon the occurrence of a triggering event or condition. These guarantees and indemnifications are part of the normal course of selling assets. We are typically not able to calculate the maximum potential amount of future payments that could be made under such contractual provisions because of the variability inherent in the guarantees and indemnities. Most often, the nature of the guarantees and indemnities is such that there is no appropriate method for quantifying the exposure because the underlying triggering event has little or no past experience upon which a reasonable prediction of the outcome can be based.
150
Contractual Commitments and Contingencies
At
December 31, 2018
and
2017
, our contractual commitments to acquire property, plant and equipment and advance funds to equity method investees totaled
$1.8 billion
and
$484 million
.
Certain natural gas processing and gathering arrangements require us to construct natural gas processing plants, natural gas gathering pipelines and NGL pipelines and contain certain fees and charges if specified construction milestones are not achieved for reasons other than force majeure. In certain cases, certain producer customers may have the right to cancel the processing arrangements if there are significant delays that are not due to force majeure.
SELECTED QUARTERLY FINANCIAL DATA (UNAUDITED)
|
2018
|
2017
|
||||||||||||||||||||||||||||||
|
(In millions, except per share data)
|
1st Qtr.
|
2nd Qtr.
|
3rd Qtr.
|
4th Qtr.
|
1st Qtr.
|
2nd Qtr.
|
3rd Qtr.
|
4th Qtr.
(a)
|
|||||||||||||||||||||||
|
Sales and other operating revenues
(b)
|
$
|
18,866
|
|
$
|
22,317
|
|
$
|
22,988
|
|
$
|
32,333
|
|
$
|
16,288
|
|
$
|
18,180
|
|
$
|
19,210
|
|
$
|
21,055
|
|
|||||||
|
Income from operations
|
440
|
|
1,711
|
|
1,403
|
|
2,017
|
|
291
|
|
982
|
|
1,577
|
|
1,168
|
|
|||||||||||||||
|
Net income
|
235
|
|
1,235
|
|
941
|
|
1,195
|
|
101
|
|
574
|
|
1,004
|
|
2,125
|
|
|||||||||||||||
|
Net income attributable to MPC
|
37
|
|
1,055
|
|
737
|
|
951
|
|
30
|
|
483
|
|
903
|
|
2,016
|
|
|||||||||||||||
|
Net income attributable to MPC per share
(c)
:
|
|||||||||||||||||||||||||||||||
|
Basic
|
$
|
0.08
|
|
$
|
2.30
|
|
$
|
1.63
|
|
$
|
1.38
|
|
$
|
0.06
|
|
$
|
0.94
|
|
$
|
1.79
|
|
$
|
4.13
|
|
|||||||
|
Diluted
|
0.08
|
|
2.27
|
|
1.62
|
|
1.35
|
|
0.06
|
|
0.93
|
|
1.77
|
|
4.09
|
|
|||||||||||||||
|
(a)
|
During the fourth quarter of 2017, we recorded a tax benefit of approximately
$1.5 billion
as a result of remeasuring certain deferred tax liabilities using the lower corporate tax rate enacted under the TCJA.
|
|
(b)
|
Includes sales to related parties. The 2018 periods reflect an election to present certain taxes on a net basis concurrent with our adoption of ASC 606.
|
|
(c)
|
The sum of the per-share amounts for the four quarters may not always equal the annual per-share amounts due to differences in the average number of shares outstanding during the respective periods.
|
151
ITEM 9. CHANGES IN AND DISAGREEMENTS WITH ACCOUNTANTS ON ACCOUNTING AND FINANCIAL DISCLOSURE
None.
ITEM 9A. CONTROLS AND PROCEDURES
Disclosure Controls and Procedures
An evaluation of the effectiveness of the design and operation of our disclosure controls and procedures (as defined in Rules 13a-15(e) under the Exchange Act was carried out under the supervision and with the participation of our management, including our chief executive officer and chief financial officer. Based upon that evaluation, the chief executive officer and chief financial officer concluded that the design and operation of these disclosure controls and procedures were effective as of
December 31, 2018
, the end of the period covered by this Annual Report on Form 10-K.
Internal Control over Financial Reporting and Changes in Internal Control over Financial Reporting
On October 1, 2018, the Company completed its acquisition of Andeavor. Accordingly, the acquired assets and liabilities of Andeavor are included in our consolidated balance sheet as
December 31, 2018
and the results of its operations and cash flows are reported in our consolidated statements of income and cash flows from October 1, 2018 through December 31, 2018. We have elected to exclude Andeavor from the Company’s assessment of internal control over financial reporting as of
December 31, 2018
. During the quarter ended
December 31, 2018
, there have been no other changes in our internal control over financial reporting that have materially affected, or are reasonably likely to materially affect, our internal control over financial reporting. See Item 8. Financial Statements and Supplementary Data – Management’s Report on Internal Control over Financial Reporting and – Report of Independent Registered Public Accounting Firm, which reports are incorporated herein by reference.
ITEM 9B. OTHER INFORMATION
On February 27, 2019, the Board amended Article IV of the bylaws to clarify the corporate capacities of certain enumerated officers.
152
PART III
ITEM 10. DIRECTORS, EXECUTIVE OFFICERS AND CORPORATE GOVERANCE
Information concerning our executive officers is included in Part I, Item 1 of this Annual Report on Form 10-K. Information concerning our directors is incorporated by reference to “Proposal 1. Election of Directors” in our Proxy Statement for the
2019
Annual Meeting of Shareholders, to be filed with the SEC within 120 days of December 31, 2018 (the “Proxy Statement”).
We have adopted a Code of Ethics for Senior Financial Officers, which applies to our Chief Executive Officer, Chief Financial Officer, Vice President and Controller, Treasurer and other persons performing similar functions. It is available on our website at www.marathonpetroleum.com by selecting “Investors,” then “Corporate Governance,” and clicking on “Code of Ethics for Senior Financial Officers.”
The other information required by this Item is incorporated by reference to “Corporate Governance—Committees of the Board” and “Stock Ownership Information—Section 16(a) Beneficial Ownership Reporting Compliance” in our Proxy Statement.
ITEM 11. EXECUTIVE COMPENSATION
Information required by this Item is incorporated by reference to “Compensation Discussion and Analysis,” “Executive Compensation Tables” and “Director Compensation” in our Proxy Statement.
153
ITEM 12. SECURITY OWNERSHIP OF CERTAIN BENEFICIAL OWNERS AND MANAGEMENT AND RELATED STOCKHOLDER MATTERS
Information concerning security ownership of certain beneficial owners and management required by this Item is incorporated by reference to “Stock Ownership Information” in our Proxy Statement.
Securities Authorized for Issuance Under Equity Compensation Plans
The following table provides information as of
December 31, 2018
with respect to shares of our common stock that may be issued under the MPC 2012 Plan, the MPC 2011 Plan and the Andeavor Plans:
|
Plan category
|
Number of securities to be issued upon exercise of outstanding options, warrants and rights
(a)
|
|
Weighted-average exercise price of outstanding options, warrants and rights
(b)
|
Number of securities remaining available for future issuance under equity compensation
plans (excluding securities reflected in the first column) (c) |
|||||
|
Equity compensation plans approved by stockholders
|
8,868,654
|
|
|
$
|
38.15
|
|
39,931,756
|
|
|
|
Equity compensation plan not approved by stockholders
|
—
|
|
—
|
|
—
|
|
|||
|
Total
|
8,868,654
|
|
N/A
|
|
39,931,756
|
|
|||
(a)
Includes the following:
|
1)
|
8,422,192
stock options granted pursuant to the MPC 2012 Plan and the MPC 2011 Plan and not forfeited, cancelled or expired as of
December 31, 2018
. The amounts in column (a) do not include 302,403 stock options granted under the Andeavor Plans and not forfeited, cancelled or expired as of
December 31, 2018
.
|
|
2)
|
158,423
restricted stock units granted pursuant to the MPC 2012 Plan and the MPC 2011 Plan for shares unissued and not forfeited, cancelled or expired as of
December 31, 2018
. The amounts in column (a) do not include 4,068,433 restricted stock units granted under the Andeavor Plans and not forfeited, cancelled or expired as of
December 31, 2018
.
|
|
3)
|
288,039
shares as the maximum potential number of shares that could be issued in settlement of performance units outstanding as of
December 31, 2018
pursuant to the MPC 2012 Plan, based on the closing price of our common stock on December 31, 2018 of
$59.01
per share. The number of shares reported for this award vehicle may overstate dilution. See Note
23
for more information on performance unit awards granted under the MPC 2012 Plan.
|
|
(b)
|
Restricted stock, restricted stock units and performance units are not taken into account in the weighted-average exercise price as such awards have no exercise price. Further, the outstanding stock options granted under the Andeavor Plans were not taken into account in the weighted-average exercise price.
|
|
(c)
|
Reflects the shares available for issuance pursuant to the MPC 2012 Plan. All granting authority under the MPC 2011 Plan was revoked following the approval of the MPC 2012 Plan by shareholders on April 25, 2012, and all granting power under the Andeavor Plans was revoked at the time of the Andeavor Merger. No more than
16,138,076
of the shares reported in this column may be issued for awards other than stock options or stock appreciation rights. The number of shares reported in this column assumes
288,039
as the maximum potential number of shares that could be issued pursuant to the MPC 2012 Plan in settlement of performance units outstanding as of
December 31, 2018
, based on the closing price of our common stock on December 31, 2018, of
$59.01
per share. The number of shares assumed for this award vehicle may understate the number of shares available for issuance pursuant to the MPC 2012 Plan. See Note
23
for more information on performance unit awards granted pursuant to the MPC 2012 Plan. Shares related to grants made pursuant to the MPC 2012 Plan that are forfeited, cancelled or expire unexercised become immediately available for issuance under the MPC 2012 Plan.
|
ITEM 13. CERTAIN RELATIONSHIPS AND RELATED TRANSACTIONS, AND DIRECTOR INDEPENDENCE
Information required by this Item is incorporated by reference to “Related Party Transactions” and “Corporate Governance—Director Independence” in our Proxy Statement.
ITEM 14. PRINCIPAL ACCOUNTANT FEES AND SERVICES
Information required by this Item is incorporated by reference to “Audit-Related Matters—Audit Fees and Services” in our Proxy Statement.
154
PART IV
ITEM 15. EXHIBITS AND FINANCIAL STATEMENT SCHEDULES
A. Documents Filed as Part of the Report
1. Financial Statements (see Part II, Item 8. of this Annual Report on Form 10-K regarding financial statements)
2. Financial Statement Schedules
Financial statement schedules required under SEC rules but not included in this Annual Report on Form 10-K are omitted because they are not applicable or the required information is contained in the consolidated financial statements or notes thereto.
3. Exhibits:
|
Exhibit
Number
|
Exhibit Description
|
|
Incorporated by Reference
|
Filed
Herewith
|
Furnished
Herewith
|
|||||||||
|
Form
|
Exhibit
|
Filing
Date
|
SEC
File No.
|
|||||||||||
|
2
|
Plan of Acquisition, Reorganization, Arrangement, Liquidation or Succession
|
|||||||||||||
|
2.1
†
|
10
|
2.1
|
5/26/2011
|
001-35054
|
||||||||||
|
2.2
†
|
8-K
|
2.1
|
5/27/2014
|
001-35054
|
||||||||||
|
2.3
†
|
8-K
|
2.2
|
10/6/2014
|
001-35054
|
||||||||||
|
2.4
†
|
8-K
|
2.1
|
7/16/2015
|
001-35054
|
||||||||||
|
8-K
|
2.1
|
11/12/2015
|
001-35054
|
|||||||||||
|
8-K
|
2.1
|
11/17/2015
|
001-35054
|
|||||||||||
|
8-K
|
2.1
|
4/30/2018
|
001-35054
|
|||||||||||
|
S-4/A
|
2.2
|
7/5/2018
|
333-225244
|
|||||||||||
|
8-K
|
2.1
|
9/18/2018
|
001-35054
|
|||||||||||
|
3
|
Articles of Incorporation and Bylaws
|
|||||||||||||
|
8-K
|
3.2
|
10/1/2018
|
001-35054
|
|||||||||||
|
X
|
||||||||||||||
|
4
|
Instruments Defining the Rights of Security Holders, Including Indentures
|
|||||||||||||
|
10
|
4.1
|
3/29/2011
|
001-35054
|
|||||||||||
155
|
Exhibit
Number
|
Exhibit Description
|
|
Incorporated by Reference
|
Filed
Herewith
|
Furnished
Herewith
|
|||||||||
|
Form
|
Exhibit
|
Filing
Date
|
SEC
File No.
|
|||||||||||
|
10
|
4.2
|
3/29/2011
|
001-35054
|
|||||||||||
|
10-Q
|
4.1
|
11/3/2014
|
001-35054
|
|||||||||||
|
8-K
|
4.1
|
12/14/2015
|
001-35054
|
|||||||||||
|
8-K
|
4.1
|
2/12/2015
|
001-35714
|
|||||||||||
|
8-K
|
4.2
|
2/12/2015
|
001-35714
|
|||||||||||
|
8-K
|
4.2
|
12/22/2015
|
001-35714
|
|||||||||||
|
8-K
|
4.3
|
12/22/2015
|
001-35714
|
|||||||||||
|
8-K
|
4.4
|
12/22/2015
|
001-35714
|
|||||||||||
|
8-K
|
4.5
|
12/22/2015
|
001-35714
|
|||||||||||
|
8-K
|
4.1
|
2/10/2017
|
001-35714
|
|||||||||||
|
8-K
|
4.2
|
2/10/2017
|
001-35714
|
|||||||||||
|
8-K
|
4.1
|
2/8/2018
|
001-35714
|
|||||||||||
|
8-K
|
4.2
|
2/8/2018
|
001-35714
|
|||||||||||
|
8-K
|
4.3
|
2/8/2018
|
001-35714
|
|||||||||||
|
8-K
|
4.4
|
2/8/2018
|
001-35714
|
|||||||||||
|
8-K
|
4.5
|
2/8/2018
|
001-35714
|
|||||||||||
|
8-K
|
4.1
|
10/5/2018
|
001-35054
|
|||||||||||
156
|
Exhibit
Number
|
Exhibit Description
|
|
Incorporated by Reference
|
Filed
Herewith
|
Furnished
Herewith
|
|||||||||
|
Form
|
Exhibit
|
Filing
Date
|
SEC
File No.
|
|||||||||||
|
8-K
|
4.2
|
10/5/2018
|
001-35054
|
|||||||||||
|
8-K
|
4.3
|
10/5/2018
|
001-35054
|
|||||||||||
|
8-K
|
4.4
|
10/5/2018
|
001-35054
|
|||||||||||
|
8-K
|
4.5
|
10/5/2018
|
001-35054
|
|||||||||||
|
8-K
|
4.6
|
10/5/2018
|
001-35054
|
|||||||||||
|
8-K
|
4.7
|
10/5/2018
|
001-35054
|
|||||||||||
|
8-K
|
4.1
|
10/2/2012
|
001-03473
(Andeavor)
|
|||||||||||
|
8-K
|
4.1
|
3/18/2014
|
001-03473
(Andeavor)
|
|||||||||||
|
8-K
|
4.1
|
12/22/2016
|
001-03473
(Andeavor)
|
|||||||||||
|
8-K
|
4.1
|
12/21/2017
|
001-03473
(Andeavor)
|
|||||||||||
|
8-K
|
4.2
|
12/21/2017
|
001-03473
(Andeavor)
|
|||||||||||
|
10-Q
|
4.3
|
10/31/2014
|
001-03473
(Andeavor)
|
|||||||||||
|
10-K
|
4.33
|
2/21/2017
|
001-03473
(Andeavor)
|
|||||||||||
|
10-K
|
4.34
|
2/21/2017
|
001-03473
(Andeavor)
|
|||||||||||
157
|
Exhibit
Number
|
Exhibit Description
|
|
Incorporated by Reference
|
Filed
Herewith
|
Furnished
Herewith
|
|||||||||
|
Form
|
Exhibit
|
Filing
Date
|
SEC
File No.
|
|||||||||||
|
Indenture, dated as of November 28, 2017, among Tesoro Logistics LP, Tesoro Logistics Finance Corp., the guarantors named therein and U.S. Bank National Association, as trustee, relating to the 3.500% Senior Notes due 2022, 4.250% Senior Notes due 2027 and 5.200% Senior Notes due 2047
(incorporated by reference to Exhibit 4.1 to Andeavor Logistics’ Current Report on Form 8-K filed on November 28, 2017, File No. 1-35143)
|
||||||||||||||
|
8-K
|
4.1
|
9/14/2018
|
001-03473
(Andeavor)
|
|||||||||||
|
8-K
|
4.2
|
9/14/2018
|
001-03473
(Andeavor)
|
|||||||||||
|
8-K
|
4.3
|
9/14/2018
|
001-03473
(Andeavor)
|
|||||||||||
|
8-K
|
4.4
|
9/14/2018
|
001-03473
(Andeavor)
|
|||||||||||
|
8-K
|
4.1
|
11/15/2018
|
001-35714
|
|||||||||||
|
8-K
|
4.2
|
11/15/2018
|
001-35714
|
|||||||||||
|
10
|
Material Contracts
|
|||||||||||||
|
10
|
10.1
|
5/26/2011
|
001-35054
|
|||||||||||
|
10
|
10.2
|
5/26/2011
|
001-35054
|
|||||||||||
|
8-K
|
10.1
|
7/1/2011
|
001-35054
|
|||||||||||
|
8-K
|
10.1
|
12/23/2013
|
001-35054
|
|||||||||||
|
8-K
|
10.2
|
12/23/2013
|
001-35054
|
|||||||||||
|
8-K
|
10.1
|
11/6/2012
|
001-35054
|
|||||||||||
|
8-K
|
10.2
|
11/6/2012
|
001-35054
|
|||||||||||
158
|
Exhibit
Number
|
Exhibit Description
|
|
Incorporated by Reference
|
Filed
Herewith
|
Furnished
Herewith
|
|||||||||
|
Form
|
Exhibit
|
Filing
Date
|
SEC
File No.
|
|||||||||||
|
10.8
*
|
S-3
|
4.3
|
12/7/2011
|
333-175286
|
||||||||||
|
10.9
*
|
10-K
|
10.10
|
2/29/2012
|
001-35054
|
||||||||||
|
10.10
*
|
10-K
|
10.13
|
2/28/2013
|
001-35054
|
||||||||||
|
10.11
*
|
10-K
|
10.14
|
2/24/2017
|
001-35054
|
||||||||||
|
10.12
*
|
10-K
|
10.13
|
2/29/2012
|
001-35054
|
||||||||||
|
10.13
*
|
10-K
|
10.14
|
2/29/2012
|
001-35054
|
||||||||||
|
10.14
*
|
10-K
|
10.15
|
2/29/2012
|
001-35054
|
||||||||||
|
10.15
*
|
10-K
|
10.16
|
2/29/2012
|
001-35054
|
||||||||||
|
10.16
*
|
8-K
|
10.6
|
7/7/2011
|
001-35054
|
||||||||||
|
10.17
*
|
8-K
|
10.2
|
12/7/2011
|
001-35054
|
||||||||||
|
10.18
*
|
10-K
|
10.22
|
2/29/2012
|
001-35054
|
||||||||||
|
10.19
*
|
10-K
|
10.21
|
2/28/2018
|
001-35054
|
||||||||||
|
10.20
*
|
10-Q
|
10.4
|
5/9/2012
|
001-35054
|
||||||||||
|
10.21
*
|
10-Q
|
10.5
|
5/9/2012
|
001-35054
|
||||||||||
|
10.22
*
|
10-Q
|
10.1
|
5/1/2017
|
001-35054
|
||||||||||
|
10.23
*
|
10-K
|
10.32
|
2/28/2013
|
001-35054
|
||||||||||
|
10.24
*
|
10-Q
|
10.2
|
5/9/2013
|
001-35054
|
||||||||||
|
10.25
*
|
10-Q
|
10.3
|
5/9/2013
|
001-35054
|
||||||||||
|
10.26
*
|
10-Q
|
10.4
|
5/9/2013
|
001-35054
|
||||||||||
|
10.27
*
|
10-Q
|
10.5
|
5/9/2013
|
001-35054
|
||||||||||
|
10.28
*
|
10-Q
|
10.1
|
8/3/2015
|
001-35054
|
||||||||||
|
10.29
*
|
10-Q
|
10.2
|
8/3/2015
|
001-35054
|
||||||||||
|
10.30
*
|
10-K
|
10.33
|
2/28/2018
|
001-35054
|
||||||||||
|
10.31
*
|
10-K
|
10.45
|
2/24/2017
|
001-35054
|
||||||||||
|
8-K
|
10.3
|
7/26/2016
|
001-35054
|
|||||||||||
159
|
Exhibit
Number
|
Exhibit Description
|
|
Incorporated by Reference
|
Filed
Herewith
|
Furnished
Herewith
|
|||||||||
|
Form
|
Exhibit
|
Filing
Date
|
SEC
File No.
|
|||||||||||
|
10.33
*
|
10-Q
|
10.1
|
5/2/2016
|
001-35054
|
||||||||||
|
10.34
*
|
10-Q
|
10.2
|
5/2/2016
|
001-35054
|
||||||||||
|
10.35
*
|
10-Q
|
10.3
|
5/2/2016
|
001-35054
|
||||||||||
|
10.36
*
|
10-Q
|
10.3
|
5/1/2017
|
001-35054
|
||||||||||
|
10.37
*
|
10-Q
|
10.5
|
5/2/2016
|
001-35054
|
||||||||||
|
10.38
*
|
10-Q
|
10.2
|
5/1/2017
|
001-35054
|
||||||||||
|
10.39
*
|
10-Q
|
10.4
|
10/30/2017
|
001-35054
|
||||||||||
|
8-K
|
10.3
|
7/27/2017
|
001-35054
|
|||||||||||
|
8-K
|
10.1
|
12/19/2017
|
001-35054
|
|||||||||||
|
8-K
|
10.1
|
3/5/2018
|
001-35714
|
|||||||||||
|
10-Q
|
10.3
|
4/30/2018
|
001-35054
|
|||||||||||
|
10-Q
|
10.4
|
4/30/2018
|
001-35054
|
|||||||||||
|
10-Q
|
10.5
|
4/30/2018
|
001-35054
|
|||||||||||
|
10-Q
|
10.6
|
4/30/2018
|
001-35054
|
|||||||||||
|
10-Q
|
10.7
|
4/30/2018
|
001-35054
|
|||||||||||
|
10-Q
|
10.8
|
4/30/2018
|
001-35054
|
|||||||||||
|
10-Q
|
10.9
|
4/30/2018
|
001-35054
|
|||||||||||
|
8-K
|
10.1
|
4/30/2018
|
001-35054
|
|||||||||||
160
|
Exhibit
Number
|
Exhibit Description
|
|
Incorporated by Reference
|
Filed
Herewith
|
Furnished
Herewith
|
|||||||||
|
Form
|
Exhibit
|
Filing
Date
|
SEC
File No.
|
|||||||||||
|
8-K
|
10.1
|
8/31/2018
|
001-35054
|
|||||||||||
|
8-K
|
10.2
|
8/31/2018
|
001-35054
|
|||||||||||
|
10.53
*
|
8-K
|
10.1
|
10/1/2018
|
001-35054
|
||||||||||
|
10.54
*
|
8-K
|
10.4
|
12/18/2008
|
001-03473
(Andeavor)
|
||||||||||
|
10.55
*
|
10-K
|
10.68
|
2/21/2018
|
001-03473
(Andeavor)
|
||||||||||
|
10.56
*
|
S-8
|
99.1
|
5/4/2018
|
333-224688
(Andeavor)
|
||||||||||
|
10.57
*
|
S-8
|
99.1
|
6/1/2017
|
333-218424
(Andeavor)
|
||||||||||
|
10.58
*
|
S-8
|
99.2
|
5/11/2011
|
333-174132
(Andeavor)
|
||||||||||
|
10.59
*
|
X
|
|||||||||||||
|
10.60
*
|
8-K
|
10.1
|
1/30/2019
|
001-35054
|
||||||||||
|
10.61
*
|
8-K
|
10.2
|
1/30/2019
|
001-35054
|
||||||||||
|
10.62
*
|
8-K
|
10.4
|
2/3/2016
|
001-03473
(Andeavor)
|
||||||||||
|
10.63
*
|
8-K
|
10.1
|
2/21/2017
|
001-03473
(Andeavor)
|
||||||||||
|
10.64
*
|
8-K
|
10.5
|
2/3/2016
|
001-03473
(Andeavor)
|
||||||||||
|
10.65
*
|
8-K
|
10.3
|
2/21/2017
|
001-03473
(Andeavor)
|
||||||||||
|
10.66
*
|
8-K
|
10.6
|
2/3/2016
|
001-03473
(Andeavor)
|
||||||||||
|
10.67
*
|
8-K
|
10.2
|
2/21/2017
|
001-03473
(Andeavor)
|
||||||||||
|
10.68
*
|
8-K
|
10.7
|
2/3/2016
|
001-03473
(Andeavor)
|
||||||||||
|
10.69
*
|
8-K
|
10.4
|
2/21/2017
|
001-03473
(Andeavor)
|
||||||||||
|
10.70
*
|
8-K
|
10.1
|
2/20/2018
|
001-03473
(Andeavor)
|
||||||||||
161
|
Exhibit
Number
|
Exhibit Description
|
|
Incorporated by Reference
|
Filed
Herewith
|
Furnished
Herewith
|
|||||||||
|
Form
|
Exhibit
|
Filing
Date
|
SEC
File No.
|
|||||||||||
|
10.71
*
|
8-K
|
10.2
|
2/20/2018
|
001-03473
(Andeavor)
|
||||||||||
|
10.72
*
|
8-K
|
10.3
|
2/20/2018
|
001-03473
(Andeavor)
|
||||||||||
|
10.73
*
|
8-K
|
10.4
|
2/20/2018
|
001-03473
(Andeavor)
|
||||||||||
|
8-K
|
10.1
|
1/4/2018
|
001-35054
|
|||||||||||
|
X
|
||||||||||||||
|
10.76
*
|
X
|
|||||||||||||
|
X
|
||||||||||||||
|
8-K
|
10.2
|
10/31/2017
|
001-35143
(ANDX)
|
|||||||||||
|
10-Q
|
10.2
|
11/17/2018
|
001-35143
(ANDX)
|
|||||||||||
|
8-K
|
10.1
|
2/3/2016
|
001-35143
(ANDX)
|
|||||||||||
|
8-K
|
10.2
|
2/3/2016
|
001-35143
(ANDX)
|
|||||||||||
|
8-K
|
10.1
|
1/5/2018
|
001-35143
(ANDX)
|
|||||||||||
|
8-K
|
10.2
|
1/5/2018
|
001-35143
(ANDX)
|
|||||||||||
|
8-K
|
10.1
|
12/27/2018
|
001-35143
(ANDX)
|
|||||||||||
162
|
Exhibit
Number
|
Exhibit Description
|
|
Incorporated by Reference
|
Filed
Herewith
|
Furnished
Herewith
|
|||||||||
|
Form
|
Exhibit
|
Filing
Date
|
SEC
File No.
|
|||||||||||
|
8-K
|
10.2
|
12/27/2018
|
001-35143
(ANDX)
|
|||||||||||
|
X
|
||||||||||||||
|
10.87
*
|
X
|
|||||||||||||
|
10-K
|
14.1
|
2/24/2017
|
||||||||||||
|
X
|
||||||||||||||
|
X
|
||||||||||||||
|
X
|
||||||||||||||
|
X
|
||||||||||||||
|
X
|
||||||||||||||
|
X
|
||||||||||||||
|
X
|
||||||||||||||
|
101.INS
|
XBRL Instance Document.
|
X
|
||||||||||||
|
101.SCH
|
XBRL Taxonomy Extension Schema.
|
X
|
||||||||||||
|
101.PRE
|
XBRL Taxonomy Extension Presentation Linkbase.
|
X
|
||||||||||||
|
101.CAL
|
XBRL Taxonomy Extension Calculation Linkbase.
|
X
|
||||||||||||
|
101.DEF
|
XBRL Taxonomy Extension Definition Linkbase.
|
X
|
||||||||||||
|
101.LAB
|
XBRL Taxonomy Extension Label Linkbase.
|
X
|
||||||||||||
|
†
|
The exhibits and schedules have been omitted pursuant to Item 601(b)(2) of Regulation S-K and will be provided to the Securities and Exchange Commission upon request.
|
|
*
|
Indicates management contract or compensatory plan, contract or arrangement in which one or more directors or executive officers of the Registrant may be participants.
|
163
ITEM 16. FORM 10-K SUMMARY
Not applicable.
164
SIGNATURES
Pursuant to the requirements of Section 13 or 15(d) of the Securities Exchange Act of 1934, the registrant has duly caused this report to be signed on its behalf by the undersigned, thereunto duly authorized.
|
February 28, 2019
|
MARATHON PETROLEUM CORPORATION
|
|
|
By: /s/ John J. Quaid
|
||
|
John J. Quaid
Vice President and Controller
|
||
165
Pursuant to the requirements of the Securities Exchange Act of 1934, this report has been signed below by the following persons on
February 28, 2019
on behalf of the registrant and in the capacities indicated.
|
Signature
|
Title
|
|
|
/s/ Gary R. Heminger
|
Chairman of the Board and Chief Executive Officer
(principal executive officer)
|
|
|
Gary R. Heminger
|
||
|
/s/ Timothy T. Griffith
|
Senior Vice President and Chief Financial Officer
(principal financial officer)
|
|
|
Timothy T. Griffith
|
||
|
/s/ John J. Quaid
|
Vice President and Controller
(principal accounting officer)
|
|
|
John J. Quaid
|
||
|
*
|
Director
|
|
|
Abdulaziz F. Alkhayyal
|
||
|
*
|
Director
|
|
|
Evan Bayh
|
||
|
*
|
Director
|
|
|
Charles E. Bunch
|
||
|
*
|
Director
|
|
|
Steven A. Davis
|
||
|
*
|
Director
|
|
|
Edward G. Galante
|
||
|
*
|
Director
|
|
|
Gregory J. Goff
|
||
|
*
|
Director
|
|
|
James E. Rohr
|
||
|
*
|
Director
|
|
|
Kim K.W. Rucker
|
||
|
*
|
Director
|
|
|
J. Michael Stice
|
||
|
*
|
Director
|
|
|
John P. Surma
|
||
|
*
|
Director
|
|
|
Susan Tomasky
|
||
166
* The undersigned, by signing his name hereto, does sign and execute this report pursuant to the Power of Attorney executed by the above-named directors and officers of the registrant, which is being filed herewith on behalf of such directors and officers.
|
By: /s/ Gary R. Heminger
|
February 28, 2019
|
|
|
Gary R. Heminger
Attorney-in-Fact
|
||
167
TABLE OF CONTENTS
Part IItem 1. BusinessItem 1A. Risk FactorsItem 1B. Unresolved Staff CommentsItem 2. PropertiesItem 3. Legal ProceedingsItem 4. Mine Safety DisclosuresPart IIItem 5. Market For Registrant S Common Equity, Related Stockholder Matters and Issuer Purchases Of Equity SecuritiesItem 6. Selected Financial DataItem 7. Management S Discussion and Analysis Of Financial Condition and Results Of OperationsItem 8. Financial Statements and Supplementary Data NoteItem 7A. Quantitative and Qualitative Disclosures About Market RiskItem 8. Financial Statements and Supplementary DataItem 9. Changes in and Disagreements with Accountants on Accounting and Financial DisclosureItem 9A. Controls and ProceduresItem 9B. Other InformationPart IIIItem 10. Directors, Executive Officers and Corporate GoveranceItem 11. Executive CompensationItem 12. Security Ownership Of Certain Beneficial Owners and Management and Related Stockholder MattersItem 13. Certain Relationships and Related Transactions, and Director IndependenceItem 14. Principal Accountant Fees and ServicesPart IVItem 15. Exhibits and Financial Statement SchedulesItem 16. Form 10-k Summary