UNITED STATES SECURITIES AND EXCHANGE COMMISSION
Washington, D.C. 20549
Form 10-K
ANNUAL REPORT PURSUANT TO SECTION 13 OR 15(d)
OF THE SECURITIES EXCHANGE ACT OF 1934
For the
Fiscal Year Ended December 31, 2013
Commission file number 001-35714
MPLX LP
(Exact name of registrant as specified in its charter)
|
Delaware
|
45-5010536
|
|
|
(State or other jurisdiction of incorporation or organization)
|
(I.R.S. Employer Identification No.)
|
|
200 E. Hardin Street, Findlay, Ohio 45840
(Address of principal executive offices)
(419) 672-6500
(Registrant’s telephone number, including area code)
Securities registered pursuant to Section 12(b) of the Act:
|
Title of each class
|
Name of each exchange on which registered
|
|
|
Common Units Representing Limited Partnership Interests
|
New York Stock Exchange
|
|
Indicate by check mark if the registrant is a well-known seasoned issuer, as defined in Rule 405 of the Securities Act.
Yes
x
No
¨
Indicate by check mark if the registrant is not required to file reports pursuant to Section 13 or Section 15(d) of the Act. Yes
¨
No
x
Indicate by check mark whether the registrant (1) has filed all reports required to be filed by Section 13 or 15(d) of the Securities Exchange Act of 1934 during the preceding 12 months (or for such shorter period that the registrant was required to file such reports), and (2) has been subject to such filing requirements for the past 90 days. Yes
x
No
¨
Indicate by check mark whether the registrant has submitted electronically and posted on its corporate web site, if any, every Interactive Data File required to be submitted and posted pursuant to Rule 405 of Regulation S-T (§232.405 of this chapter) during the preceding 12 months (or for such shorter period that the registrant was required to submit and post such files.) Yes
x
No
¨
Indicate by check mark if disclosure of delinquent filers pursuant to Item 405 of Regulation S-K (§ 229.405 of this chapter) is not contained herein, and will not be contained, to the best of registrant’s knowledge, in definitive proxy or information statements incorporated by reference in Part III of this Form 10-K or any amendment to this Form 10-K.
x
Indicate by check mark whether the registrant is a large accelerated filer, an accelerated filer, a non-accelerated filer or a smaller reporting company. See the definitions of “large accelerated filer,” “accelerated filer” and “smaller reporting company” in Rule 12b-2 of the Exchange Act. (Check one):
Large accelerated filer
þ
Accelerated filer
¨
Non-accelerated filer
¨
Smaller reporting company
¨
Indicate by check mark whether the registrant is a shell company (as defined in Rule 12b-2 of the Exchange Act) Yes
¨
No
x
The aggregate market value of Common Units held by non-affiliates as of June 28, 2013 was approximately
$715.9 million
. Common Units held by executive officers and directors of the registrant and its affiliates are not included in the computation. The registrant, solely for the purpose of this required presentation, has deemed its directors and executive officers and those of its affiliates to be affiliates.
MPLX LP had
36,956,712
common units,
36,951,515
subordinated units and
1,508,331
general partner units outstanding at
February 14, 2014
.
DOCUMENTS INCORPORATED BY REFERENCE:
None
MPLX LP
Unless the context otherwise requires, references in this report to the “Predecessor,” “we,” “our,” “us,” or like terms, when used in periods prior to October 31, 2012, refer to MPLX LP Predecessor, our predecessor for accounting purposes. References in this report to “MPLX LP,” “the Partnership,” “we,” “our,” “us,” or like terms used in the present tense or periods starting on or after October 31, 2012, refer to MPLX LP and its subsidiaries, including MPLX Operations LLC (“MPLX Operations”) and MPLX Terminal and Storage LLC (“MPLX Terminal and Storage”), both wholly-owned subsidiaries, and MPLX Pipe Line Holdings LP (“Pipe Line Holdings”), of which as of
December 31, 2013
MPLX LP owned a
56.0
percent general partner interest. Pipe Line Holdings owns 100 percent of Marathon Pipe Line LLC ("MPL") and Ohio River Pipe Line LLC ("ORPL"). References to “MPC” refer collectively to Marathon Petroleum Corporation and its subsidiaries, other than the Partnership. Prior to June 30, 2011, MPC was a wholly owned subsidiary of Marathon Oil Corporation. Marathon Oil Corporation and all its subsidiaries and equity method investments not spun off with MPC are referred to as “Marathon Oil.”
Table of Contents
|
|
|
Page
|
|
Item 1.
|
||
|
Item 1A.
|
||
|
Item 1B
|
||
|
Item 2.
|
||
|
Item 3.
|
||
|
Item 4.
|
||
|
Item 5.
|
||
|
Item 6.
|
||
|
Item 7.
|
||
|
Item 7A.
|
||
|
Item 8.
|
||
|
Item 9.
|
||
|
Item 9A.
|
||
|
Item 9B.
|
||
|
Item 10.
|
||
|
Item 11.
|
||
|
Item 12.
|
||
|
Item 13.
|
||
|
Item 14.
|
||
|
Item 15.
|
||
Disclosures Regarding Forward-Looking Statements
This Annual Report on Form 10-K, particularly Item 1. Business, Item 1A. Risk Factors, Item 3. Legal Proceedings, Item 7. Management’s Discussion and Analysis of Financial Condition and Results of Operations and Item 7A. Quantitative and Qualitative Disclosures about Market Risk, includes forward-looking statements. You can identify our forward-looking statements by words such as “anticipate,” “believe,” “estimate,” “expect,” “forecast,” “project,” “could,” “may,” “should,” “would,” “will” or other similar expressions that convey the uncertainty of future events or outcomes. In accordance with “safe harbor” provisions of the Private Securities Litigation Reform Act of 1995, these statements are accompanied by cautionary language identifying important factors, though not necessarily all such factors, that could cause future outcomes to differ materially from those set forth in the forward-looking statements.
Forward-looking statements include, but are not limited to, statements that relate to, or statements that are subject to risks, contingencies or uncertainties that relate to:
|
•
|
future levels of revenues and other income, income from operations, net income attributable to MPLX LP, earnings per unit, Adjusted EBITDA or Distributable Cash Flow (please read Item 7. Management’s Discussion and Analysis of Financial Condition and Results of Operations – How We Evaluate Our Operations – Adjusted EBITDA and Distributable Cash Flow for the definitions of Adjusted EBITDA and Distributable Cash Flow);
|
|
•
|
anticipated volumes of throughput of crude oil, refined products or other hydrocarbon-based products;
|
|
•
|
anticipated levels of regional, national and worldwide prices of crude oil and refined products;
|
|
•
|
future levels of capital, environmental or maintenance expenditures, general and administrative and other expenses;
|
|
•
|
the success or timing of completion of ongoing or anticipated capital or maintenance projects;
|
|
•
|
expectations regarding the acquisition or divestiture of assets;
|
|
•
|
the effect of restructuring or reorganization of business components;
|
|
•
|
the potential effects of judicial or other proceedings on our business, financial condition, results of operations and cash flows; and
|
|
•
|
the anticipated effects of actions of third parties such as competitors, or federal, foreign, state or local regulatory authorities, or plaintiffs in litigation.
|
We have based our forward-looking statements on our current expectations, estimates and projections about our industry and our partnership. We caution that these statements are not guarantees of future performance and you should not rely unduly on them, as they involve risks, uncertainties, and assumptions that we cannot predict. In addition, we have based many of these forward-looking statements on assumptions about future events that may prove to be inaccurate. While our management considers these assumptions to be reasonable, they are inherently subject to significant business, economic, competitive, regulatory and other risks, contingencies and uncertainties, most of which are difficult to predict and many of which are beyond our control. Accordingly, our actual results may differ materially from the future performance that we have expressed or forecast in our forward-looking statements. Differences between actual results and any future performance suggested in our forward-looking statements could result from a variety of factors, including the following:
|
•
|
changes in general economic, market or business conditions;
|
|
•
|
domestic and foreign supplies of crude oil and other feedstocks;
|
|
•
|
domestic and foreign supplies of refined products such as gasoline, diesel fuel, jet fuel, home heating oil and petrochemicals;
|
|
•
|
foreign imports of refined products;
|
|
•
|
refining industry overcapacity or undercapacity;
|
|
•
|
changes in the cost or availability of third-party vessels, pipelines and other means of transportation for crude oil, feedstocks and refined products;
|
1
|
•
|
the price, availability and acceptance of alternative fuels and alternative-fuel vehicles and laws mandating such fuels or vehicles;
|
|
•
|
fluctuations in consumer demand for refined products, including seasonal fluctuations;
|
|
•
|
political and economic conditions in nations that consume refined products, including the United States, and in crude oil producing regions, including the Middle East, Africa, Canada and South America;
|
|
•
|
actions taken by our competitors and the expansion and retirement of pipeline capacity in response to market conditions;
|
|
•
|
changes in fuel and utility costs for our facilities;
|
|
•
|
failure to realize the benefits projected for capital projects, or cost overruns associated with such projects;
|
|
•
|
the ability to successfully implement new assets and growth strategies, whether through organic growth or acquisitions;
|
|
•
|
accidents or other unscheduled shutdowns affecting our pipelines or equipment, or those of our suppliers or customers;
|
|
•
|
unusual weather conditions and natural disasters;
|
|
•
|
disruptions due to equipment interruption or failure;
|
|
•
|
acts of war, terrorism or civil unrest that could impair our ability to transport crude oil or refined products;
|
|
•
|
legislative or regulatory action, which may adversely affect our business or operations;
|
|
•
|
rulings, judgments or settlements in litigation or other legal, tax or regulatory matters, including unexpected environmental remediation costs, in excess of any reserves or insurance coverage;
|
|
•
|
labor and material shortages;
|
|
•
|
the ability and willingness of parties with whom we have material relationships to perform their obligations to us;
|
|
•
|
changes in the availability of unsecured credit and changes affecting the credit markets generally; and
|
|
•
|
the other factors described in Item 1A. Risk Factors.
|
We undertake no obligation to update any forward-looking statements except to the extent required by applicable law.
2
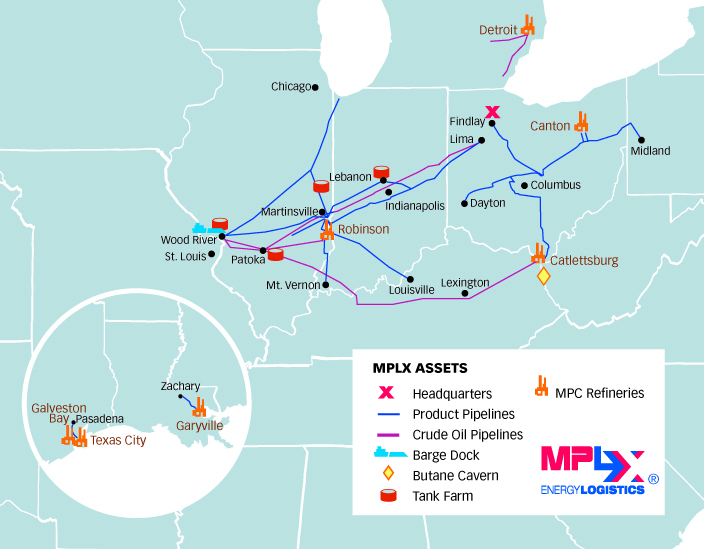
We are a fee-based, growth-oriented master limited partnership formed by MPC to own, operate, develop and acquire pipelines and other midstream assets related to the transportation and storage of crude oil, refined products and other hydrocarbon-based products. At
December 31, 2013
, our assets primarily consisted of a
56.0
percent indirect interest in a network of common carrier crude oil and product pipeline systems and associated storage assets in the Midwest and Gulf Coast regions of the United States. We believe our network of petroleum pipelines is one of the largest in the United States, based on total annual volumes delivered. MPC has retained a
44.0
percent interest in our network of pipeline systems, barge dock and tank farms. We also own a
100
percent interest in a butane cavern in Neal, West Virginia with approximately
1.0
million barrels of storage capacity. Our assets are integral to the success of MPC’s operations.
We generate revenue primarily by charging tariffs for transporting crude oil, refined products and other hydrocarbon-based products through our pipelines and at our barge dock and fees for storing crude oil and products at our storage facilities. We are also the operator of additional crude oil and product pipelines owned by MPC and third parties for which we are paid operating fees. We do not take ownership of the crude oil or products that we transport and store for our customers, and we do not engage in the trading of any commodities. However, we could be required to purchase crude oil volumes in the open market to make up negative imbalances. See Item 7A. Quantitative and Qualitative Disclosures about Market Risk for information on imbalances.
MPC historically has been the source of the substantial majority of our revenues. In connection with the MPLX LP initial public offering (the “Offering”) completed on October 31, 2012, we entered into multiple transportation and storage services agreements with MPC. These agreements are long-term, fee-based agreements with minimum volume commitments under which MPC will continue to be the source of the substantial majority of our revenues for the foreseeable future. We believe these transportation and storage services agreements will promote stable and predictable cash flows.
MPC has stated that it intends for us to be the primary growth vehicle for its midstream business. MPC owns a substantial portfolio of other midstream assets including a
44.0
percent interest in Pipe Line Holdings, which owns our network of pipeline systems, our barge dock and our tank farms. MPC also owns a significant interest in us through its ownership of our general partner, a
71.6
percent limited partner interest in us and all of our incentive distribution rights. Given MPC’s significant ownership interest in us and its stated intent to use us to grow its midstream business, we believe MPC will continue to offer us the opportunity to purchase additional midstream assets that it owns, including additional interests in Pipe Line Holdings. We also may pursue acquisitions cooperatively with MPC. MPC is under no obligation, however, to offer to sell us additional assets or to pursue acquisitions cooperatively with us, and we are under no obligation to buy any such additional assets or pursue any such cooperative acquisitions. We also intend to grow our business by constructing new assets, increasing the utilization of, and revenue generated by, our existing assets and acquiring assets from third parties.
On
February 27, 2014
, we entered into an agreement to acquire an additional
13.0 percent
interest in Pipe Line Holdings from MPC for consideration of
$310.0 million
, effective
March 1, 2014
. Subsequent to this transaction, our ownership in Pipe Line Holdings will be
69.0 percent
. We intend to finance this transaction with $40.0 million of cash on hand and by borrowing $270.0 million on our revolving credit agreement.
Our operations consist of one reportable segment and are all conducted in the United States. All of our assets are located in the United States. See Item 8. Financial Statements and Supplementary Data for financial information on our operations and assets, which is incorporated herein by reference.
3
ORGANIZATIONAL STRUCTURE
The following diagram depicts our organizational structure and MPC’s ownership interests in us as of February 14, 2014.

4
BUSINESS STRATEGIES
Our primary business objectives are to generate stable cash flows and increase our quarterly cash distribution per unit over an extended period of time. We intend to accomplish these objectives by executing the following strategies:
Focus on Fee-Based Businesses.
We are focused on generating stable cash flows by providing fee-based midstream services to MPC and third parties. We also intend to mitigate volatility in cash flows by continuing to minimize our exposure to commodity price fluctuations.
Increase Revenue and Pursue Organic Growth Opportunities.
We intend to increase revenue on our network of pipeline systems by evaluating and capitalizing on organic investment opportunities that may arise from the growth of MPC’s operations and from increased third-party activity in our areas of operations. We will evaluate organic growth projects within our geographic footprint, as well as in new areas, that provide attractive returns and cash flow characteristics.
Grow through Acquisitions.
We plan to pursue acquisitions of complementary assets from MPC as well as third parties. We believe MPC will offer us the opportunity to purchase additional midstream assets that it owns, including its additional interest in Pipe Line Holdings. We also may pursue acquisitions cooperatively with MPC. Our third-party acquisition strategy may include midstream assets both within our existing geographic footprint and in new areas.
Sustain Long-Term Growth.
Our goal is to maintain an attractive distribution growth profile over the long term. During 2013, we increased our distributions every quarter and for the full year our distributions increased 19 percent. We believe our ability to sustain an attractive distribution growth profile is supported by MPC's significant number and variety of midstream assets, which we may potentially acquire, and the organic growth opportunities we plan to pursue.
Maintain Safe and Reliable Operations.
We believe that providing safe, reliable and efficient services is a key component in generating stable cash flows, and we are committed to maintaining and improving the safety, reliability and efficiency of our operations. As part of MPC’s broader corporate programs, we have adopted, and intend to continue to participate in, the Responsible Care
®
initiative, which promotes a higher standard for safety and environmental stewardship. In December 2009, we received third-party certification from Det Norske Veritas of our Responsible Care Management System
®
and we obtained recertification in December 2012.
COMPETITIVE STRENGTHS
We believe we are well positioned to execute our business strategies based on the following competitive strengths:
Multiple Growth Opportunities.
We have organic growth prospects associated with the anticipated growth of MPC’s operations and third-party activity in our areas of operation that will augment expected revenue growth from annual tariff increases under Federal Energy Regulatory Commission ("FERC") indexing methodology and market-based rates and increased throughput volumes on our pipelines. We also plan to pursue acquisitions of complementary assets from or cooperatively with MPC. We believe MPC will continue to offer us the opportunity to purchase additional midstream assets that it owns, including additional interests in Pipe Line Holdings.
Strategic Relationship with MPC.
We have a strategic relationship with MPC, which we believe to be the fourth-largest petroleum products refiner in the United States and the largest petroleum products refiner in the Midwest region of the United States based on crude oil refining capacity. MPC is well-capitalized, with an investment grade credit rating, and owns our general partner, a
71.6
percent limited partner interest in us and all of our incentive distribution rights. MPC also owns other substantial midstream assets that are broadly estimated to generate annual earnings before interest, tax, depreciation and amortization of $800 million. In addition, MPC is pursuing a number of projects that will likely increase the amount of midstream assets it will own and the related earnings and cash flow. For example, MPC recently announced the agreement with Enbridge Energy Partners, L.P. ("Enbridge") to serve as an anchor shipper on the Sandpiper pipeline, which will run from Beaver Lodge, North Dakota to Superior, Wisconsin. MPC also recently announced an agreement with Enbridge Inc. to serve as the anchor shipper on the proposed Southern Access Extension pipeline. We believe that our relationship with MPC will provide us with significant growth opportunities, as well as a stable base of cash flows.
Stable and Predictable Cash Flows.
Our assets primarily consist of common carrier pipeline systems that generate stable revenue from FERC-based tariffs. We generate the substantial majority of our revenue under long-term, fee-based transportation and storage services agreements with MPC that include minimum volume commitments. We believe these agreements enhance cash flow stability and predictability. We also expect that, based on MPC’s historical shipping patterns, MPC will ship volumes on the majority of our pipelines in excess of its minimum volume commitments. For those pipeline systems where MPC does not ship the minimum quarterly volume commitments, we will receive quarterly deficiency payments that support our cash flows.
5
Strategically Located Assets.
Our assets are primarily located in the Midwest and Gulf Coast regions of the United States, which collectively comprised approximately
72
percent of total U.S. crude distillation capacity and approximately
48
percent of total U.S. finished products demand for the year ended December 31, 2012, according to the U.S. Energy Information Administration (“EIA”). MPC owns and operates seven refineries in the Midwest and Gulf Coast regions of the United States, which have an aggregate crude oil refining capacity of approximately
1.7 million
barrels per calendar day. Our assets are integral to the success of MPC’s operations. Our assets are located near several emerging shale plays including the Marcellus, Utica, New Albany, Antrim and Illinois Basin in Pennsylvania, Ohio, Indiana, Michigan and Illinois, respectively. MPC is currently transporting crude oil and condensate from the Utica shale play and is actively evaluating similar growth opportunities in other emerging shale plays.
High-Quality, Well-Maintained Asset Base.
We continually invest in the maintenance and integrity of our assets and have developed various programs to help us efficiently monitor and maintain them. For example, we utilize MPC’s patented integrity management program that employs state-of-the-art mechanical integrity inspection and repair programs to enhance the safety of our pipelines.
Financial Flexibility.
We have an undrawn revolving credit facility of
$500.0 million
. As of December 31, 2013, we also had
$54.1 million
of cash available to fund future expansion capital expenditures related to our assets. We believe that we will have the financial flexibility to execute our growth strategy through our cash reserves, borrowing capacity under our revolving credit facility and access to the debt and equity capital markets.
Experienced Management Team.
Our management team has substantial experience in the management and operation of pipelines, barge docks, storage facilities and other midstream assets. Our management team also has expertise in acquiring and integrating assets as well as executing growth strategies in the midstream sector.
6
OUR ASSETS AND OPERATIONS
As of December 31, 2013, our primary assets consisted of:
|
•
|
a
56.0 percent
general partner interest in Pipe Line Holdings, an entity that owns a
100 percent
interest in MPL and ORPL, which in turn collectively own:
|
|
•
|
a network of pipeline systems that includes approximately
1,004 miles
of common carrier crude oil pipelines and approximately
1,902 miles
of common carrier product pipelines extending across nine states. This network includes approximately
230 miles
of common carrier crude oil and product pipelines that we operate under long-term leases with third parties;
|
|
•
|
a barge dock located on the Mississippi River near Wood River, Illinois with
84
thousand barrels per day (“mbpd”) of crude oil and product throughput capacity; and
|
|
•
|
crude oil and product tank farms located in Patoka, Wood River and Martinsville, Illinois and Lebanon, Indiana.
|
|
•
|
a
100 percent
interest in a butane cavern located in Neal, West Virginia with approximately
1.0 million
barrels of storage capacity that serves MPC’s Catlettsburg, Kentucky refinery.
|
As the sole general partner of Pipe Line Holdings, we control all aspects of the management of Pipe Line Holdings, including its cash distribution policy. The remaining limited partnership interest in Pipe Line Holdings is retained by MPC.
7
Crude Oil Pipeline Systems
The following table sets forth certain information regarding our crude oil pipeline systems, each of which has an associated transportation services agreement with MPC (other than the inactive pipelines):
Crude Oil Pipeline Systems
|
System name
|
Diameter
(inches) |
Length
(miles) |
Capacity
(mbpd) (1) |
Associated MPC refineries
|
||||||
|
Patoka to Lima crude system
|
||||||||||
|
Patoka, IL to Lima, OH
|
20”/22”
|
302
|
|
249
|
|
Detroit, MI; Canton, OH
|
||||
|
Catlettsburg and Robinson crude system
|
||||||||||
|
Patoka, IL to Robinson, IL
|
20”
|
78
|
|
225
|
|
Robinson, IL
|
||||
|
Patoka, IL to Catlettsburg, KY
|
24”/20”
|
406
|
|
270
|
|
Catlettsburg, KY
|
||||
|
Subtotal
|
484
|
|
495
|
|
||||||
|
Detroit crude system
|
||||||||||
|
Samaria, MI to Detroit, MI
|
16”
|
44
|
|
140
|
|
Detroit, MI
|
||||
|
Romulus, MI to Detroit, MI
(2)
|
16”
|
17
|
|
180
|
|
Detroit, MI
|
||||
|
Subtotal
|
61
|
|
320
|
|
||||||
|
Wood River to Patoka crude system
|
||||||||||
|
Wood River, IL to Patoka, IL
|
22”
|
57
|
|
215
|
|
All Midwest refineries
|
||||
|
Roxanna, IL to Patoka, IL
(3)
|
12”
|
58
|
|
99
|
|
All Midwest refineries
|
||||
|
Subtotal
|
115
|
|
314
|
|
||||||
|
Inactive pipelines
|
42
|
|
n/a
|
|
||||||
|
Total crude oil pipelines
|
1,004
|
|
1,378
|
|
||||||
|
(1)
|
Capacity shown is
100 percent
of the capacity of these pipeline systems and based on physical barrels. At December 31, 2013, we owned a
56.0 percent
indirect interest in these pipeline systems through Pipe Line Holdings.
|
|
(2)
|
Includes approximately
16 miles
of pipeline leased from a third party.
|
|
(3)
|
This pipeline is leased from a third party.
|
Our crude oil pipeline systems and related assets are strategically positioned to support diverse and flexible crude oil supply options for MPC’s Midwest refineries, which receive imported and domestic crude oil through a variety of sources. Imported and domestic crude oil is transported to supply hubs in Wood River and Patoka, Illinois from a variety of regions, including: Cushing, Oklahoma on the Ozark pipeline system; Western Canada, Wyoming and North Dakota on the Keystone, Platte, Mustang and Enbridge pipeline systems; and the Gulf Coast on the Capline crude oil pipeline system. Our major crude oil pipeline systems are connected to these supply hubs and transport crude oil to refineries owned by MPC and third parties.
The following are descriptions of each of our crude oil pipeline systems and related assets:
Patoka to Lima crude system
. Our Patoka to Lima crude system is comprised of approximately
76 miles
of
20
-inch pipeline extending from Patoka, Illinois to Martinsville, Illinois, and approximately
226 miles
of
22
-inch pipeline extending from Martinsville to Lima, Ohio. This system also includes associated breakout tankage. Crude oil delivered on this system to MPC’s tank farm in Lima can then be shipped to MPC’s Canton, Ohio refinery through MPC’s Lima to Canton pipeline, to MPC’s Detroit refinery through MPC’s undivided joint interest portion of the Maumee pipeline, and our Samaria to Detroit pipeline, or to other third-party refineries in Lima and Toledo, Ohio. This pipeline system has a capacity of
249
mbpd.
Catlettsburg and Robinson crude system
. Our Catlettsburg and Robinson crude system is comprised of the following pipelines:
|
•
|
Patoka to Robinson
. Our Patoka to Robinson pipeline consists of approximately
78 miles
of
20
-inch pipeline that delivers crude oil from Patoka, Illinois to MPC’s Robinson, Illinois refinery. This pipeline has a capacity of
225
mbpd.
|
8
|
•
|
Patoka to Catlettsburg
. Our Patoka to Catlettsburg pipeline consists of approximately
140 miles
of
20
-inch pipeline extending from Patoka, Illinois to Owensboro, Kentucky, and approximately
266 miles
of
24
-inch pipeline extending from Owensboro to MPC’s Catlettsburg refinery. Crude oil can enter this pipeline at Patoka, and into the Owensboro to Catlettsburg portion of the pipelines at Lebanon Junction, Kentucky, from the third-party Mid-Valley pipeline system. This pipeline has a capacity of
270
mbpd.
|
Detroit crude system
. Our Detroit crude system is comprised of the following pipelines:
|
•
|
Samaria to Detroit
. Our Samaria to Detroit pipeline consists of approximately
44 miles
of
16
-inch pipeline that delivers crude oil from Samaria, Michigan to MPC’s Detroit, Michigan refinery. This pipeline includes a tank farm and crude oil truck offloading facility located at Samaria. This pipeline has a capacity of
140
mbpd.
|
|
•
|
Romulus to Detroit
. Our Romulus to Detroit pipeline consists of approximately
17 miles
of
16
-inch pipeline extending from Romulus, Michigan to MPC’s Detroit refinery. We lease an existing 16-mile portion of this pipeline from a third party under a long-term lease that expires in 2019 and may be renewed for up to four additional five-year terms at our option. We constructed the remaining approximately one mile of this pipeline. This pipeline has a capacity of
180
mbpd and delivers crude oil received from pipeline systems operated by third parties at Romulus to MPC’s Detroit refinery.
|
Wood River to Patoka crude system
. Our Wood River to Patoka crude system is comprised of the following pipelines:
|
•
|
Wood River to Patoka
. Our Wood River to Patoka pipeline consists of approximately
57 miles
of
22
-inch pipeline that delivers crude oil received in Wood River, Illinois from the third-party Platte and Ozark pipeline systems to Patoka, Illinois. This pipeline has a capacity of
215
mbpd.
|
|
•
|
Roxanna to Patoka
. Our Roxanna to Patoka pipeline consists of approximately
58 miles
of
12
-inch pipeline that transports crude oil received in Roxanna, Illinois from the Ozark pipeline system to our tank farm in Patoka, Illinois. We lease this pipeline from a third party under a long-term lease that expires in 2020. This pipeline has a capacity of
99
mbpd.
|
9
Product Pipeline Systems
The following table sets forth certain information regarding our product pipeline systems, each of which has an associated transportation services agreement with MPC (other than our Louisville Airport products system, which currently transports only third-party volumes, and the inactive pipelines):
Product Pipeline Systems
|
System name
|
Diameter
(inches) |
Length
(miles) |
Capacity
(mbpd)
(1)
|
Associated MPC refineries
|
||||||
|
Garyville products system
|
||||||||||
|
Garyville, LA to Zachary, LA
|
20”
|
70
|
|
389
|
|
Garyville, LA
|
||||
|
Zachary, LA to connecting pipelines
(2)
|
36”
|
2
|
|
—
|
|
Garyville, LA
|
||||
|
Subtotal
|
72
|
|
389
|
|
||||||
|
Texas City products system
|
||||||||||
|
Texas City, TX to Pasadena, TX
|
16”
|
39
|
|
215
|
|
Texas City, TX; Galveston Bay, TX
|
||||
|
Pasadena, TX to connecting pipelines
(2)
|
36”/30”
|
3
|
|
—
|
|
Texas City, TX; Galveston Bay, TX
|
||||
|
Subtotal
|
42
|
|
215
|
|
||||||
|
ORPL products system
|
||||||||||
|
Kenova, WV to Columbus, OH
|
14”
|
150
|
|
68
|
|
Catlettsburg, KY
|
||||
|
Canton, OH to East Sparta, OH
(3,4)
|
6”
|
17
|
|
73
|
|
Canton, OH
|
||||
|
East Sparta, OH to Heath, OH
(4)
|
8”
|
81
|
|
29
|
|
Canton, OH
|
||||
|
East Sparta, OH to Midland, PA
(4)
|
8”
|
62
|
|
29
|
|
Canton, OH
|
||||
|
Heath, OH to Dayton, OH
|
6”
|
108
|
|
24
|
|
Catlettsburg, KY; Canton, OH
|
||||
|
Heath, OH to Findlay, OH
|
10”/8”
|
100
|
|
18
|
|
Catlettsburg, KY; Canton, OH
|
||||
|
Subtotal
|
518
|
|
241
|
|
||||||
|
Robinson products system
|
||||||||||
|
Robinson, IL to Lima, OH
|
10”
|
250
|
|
51
|
|
Robinson, IL
|
||||
|
Robinson, IL to Louisville, KY
|
16”
|
129
|
|
92
|
|
Robinson, IL
|
||||
|
Robinson, IL to Mt. Vernon, IN
(5)
|
10”
|
79
|
|
43
|
|
Robinson, IL
|
||||
|
Wood River, IL to Clermont, IN
|
10”
|
319
|
|
48
|
|
Robinson, IL
|
||||
|
Dieterich, IL to Martinsville, IL
|
10”
|
40
|
|
59
|
|
Robinson, IL
|
||||
|
Wabash Pipeline System:
|
||||||||||
|
West leg—Wood River, IL to Champaign, IL
|
12”
|
130
|
|
71
|
|
Robinson, IL
|
||||
|
East leg—Robinson, IL to Champaign, IL
|
12”
|
86
|
|
99
|
|
Robinson, IL
|
||||
|
Champaign, IL to Hammond, IN
|
16”/12”
|
140
|
|
85
|
|
Robinson, IL
|
||||
|
Subtotal
|
1,173
|
|
548
|
|
||||||
|
Louisville Airport products system
|
||||||||||
|
Louisville, KY to Louisville International Airport
|
8”/6”
|
14
|
|
29
|
|
Robinson, IL
|
||||
|
Inactive pipelines
(6)
|
83
|
|
n/a
|
|
||||||
|
Total product pipelines
|
1,902
|
|
1,422
|
|
||||||
|
(1)
|
Capacity shown is
100 percent
of the capacity of these pipeline systems. At December 31, 2013, we owned a
56.0 percent
indirect interest in these pipeline systems through Pipe Line Holdings.
|
|
(2)
|
Capacity not shown, as the pipeline is designed to meet outgoing capacity for connecting third-party pipelines.
|
10
|
(3)
|
Consists of two separate approximately
8.5
-mile pipelines.
|
|
(4)
|
This pipeline is bi-directional.
|
|
(5)
|
This pipeline is leased from a third party.
|
|
(6)
|
Includes
77
miles of pipeline leased from a third party.
|
Our product pipeline systems are strategically positioned to transport products from six of MPC’s refineries to MPC’s marketing operations, as well as those of third parties. These pipeline systems also supply feedstocks to MPC’s Midwest refineries. These product pipeline systems are integrated with MPC’s expansive network of refined product marketing terminals, which support MPC’s integrated midstream business.
The following are descriptions of our Gulf Coast product pipeline systems:
Garyville products system
. Our Garyville products system is comprised of approximately
70 miles
of 20-inch pipeline that delivers refined products from MPC’s Garyville, Louisiana refinery to either the Plantation Pipeline in Baton Rouge, Louisiana or the MPC Zachary breakout tank farm in Zachary, Louisiana, and approximately
two miles
of 36-inch pipeline that delivers refined products from the MPC tank farm to Colonial Pipeline in Zachary. This pipeline system is the Garyville refinery’s primary pathway for pipeline distribution of refined products, and has a capacity of
389
mbpd.
Texas City products system
. Our Texas City products system is comprised of approximately
39 miles
of 16-inch pipeline that delivers refined products from refineries owned by MPC and third parties in Texas City, Texas to MPC’s Pasadena tank farm and third-party terminals in Pasadena, Texas. The system also includes approximately
three miles
of 30- and 36-inch pipeline that delivers refined products from MPC’s Pasadena tank farm to the third-party Enterprise, Colonial and Centennial pipeline systems. This pipeline system has a capacity of
215
mbpd.
The following are descriptions of our Midwest product pipeline systems:
ORPL products system
. Our ORPL products system is comprised of the following pipelines:
|
•
|
Kenova to Columbus
. Our Kenova to Columbus pipeline consists of approximately
150 miles
of 14-inch pipeline that delivers refined products from MPC’s Catlettsburg refinery (through a MPC terminal in Kenova, West Virginia) to MPC’s Columbus, Ohio area terminals. In Columbus, products can be further distributed to Dayton and Heath, Ohio. This pipeline has a capacity of
68
mbpd.
|
|
•
|
Canton to East Sparta
. Our Canton to East Sparta pipeline consists of two parallel pipelines that connect MPC’s Canton refinery with our East Sparta, Ohio breakout tankage and station. The first pipeline consists of approximately
8.5 miles
of six-inch pipeline that delivers products (distillates) from Canton to East Sparta. The second pipeline consists of approximately
8.5 miles
of six-inch bi-directional pipeline that can deliver products (gasoline) from Canton to East Sparta or light petroleum-based feedstocks from East Sparta to Canton. The first pipeline has a capacity of
31
mbpd. The second pipeline has a capacity of
42
mbpd.
|
|
•
|
East Sparta to Heath
. Our East Sparta to Heath pipeline consists of approximately
81 miles
of eight-inch pipeline that delivers products from our East Sparta, Ohio breakout tankage and station to MPC’s terminal in Heath, Ohio, which has a marketing load rack and is able to connect to certain of our other pipelines to deliver products to destinations in Findlay and Columbus, Ohio. This pipeline is bi-directional giving it the capability to also move product from Heath to East Sparta. This pipeline has a capacity of
29
mbpd.
|
|
•
|
East Sparta to Midland
. Our East Sparta to Midland pipeline consists of approximately
62 miles
of eight-inch bi-directional pipeline that can deliver products and light petroleum-based feedstocks between our breakout tankage and station in East Sparta, Ohio and MPC’s terminal in Midland, Pennsylvania. MPC’s Midland terminal has a marketing load rack and is able to connect to other Pittsburgh, Pennsylvania-area terminals through a pipeline owned by a third party and a river loading/unloading dock for products and petroleum feedstocks. This pipeline can also transport products to MPC’s terminals in Steubenville and Youngstown, Ohio through a connection at West Point, Ohio with a pipeline owned by MPC. This pipeline has a capacity of
29
mbpd.
|
|
•
|
Heath to Dayton
. Our Heath to Dayton pipeline consists of approximately
108 miles
of six-inch pipeline that delivers products from MPC’s terminals in Heath and Columbus, Ohio to terminals owned by third parties in Dayton, Ohio. This pipeline is bi-directional between Heath and Columbus for product deliveries. The pipeline extending from Columbus to Dayton was reactivated in December 2011. This pipeline has a capacity of
24
mbpd.
|
|
•
|
Heath to Findlay
. Our Heath to Findlay pipeline consists of approximately
100 miles
of eight- and 10-inch pipeline that delivers products from MPC’s terminal in Heath, Ohio to MPC’s tankage in Findlay, Ohio. From Findlay, products can be further distributed to various Ohio, Michigan, and Indiana destinations through connections with a pipeline owned by third-party pipeline systems. This pipeline has a capacity of
18
mbpd.
|
11
Robinson products system
. Our Robinson products system is comprised of the following pipelines:
|
•
|
Robinson to Lima
. Our Robinson to Lima pipeline consists of approximately
250 miles
of 10-inch pipeline that delivers products from MPC’s Robinson refinery to various MPC terminals in Indianapolis, Indiana, as well as to MPC terminals in Muncie, Indiana and Lima, Ohio. This pipeline has a capacity of
51
mbpd.
|
|
•
|
Robinson to Louisville
. Our Robinson to Louisville pipeline consists of approximately
129 miles
of 16-inch pipeline that delivers products from MPC’s Robinson, Illinois refinery to two MPC and multiple third-party terminals in Louisville, Kentucky. At Louisville, MPC is able to further distribute these products to its river-sourced terminals through barge loading facilities at its Louisville terminal dock and its marine transportation assets. In addition, these products can supply MPC and third-party terminals in Lexington, Kentucky through the Louisville to Lexington pipeline system owned by MPC and a third party. The Robinson to Louisville pipeline has a capacity of
92
mbpd.
|
|
•
|
Robinson to Mt. Vernon
. Our Robinson to Mt. Vernon pipeline consists of approximately
79 miles
of 10-inch pipeline that delivers products from MPC’s Robinson refinery to a MPC terminal located on the Ohio River in Mt. Vernon, Indiana. MPC is able to further distribute these products to its river-sourced terminals through dock loading facilities at its Mt. Vernon terminal and its marine transportation assets. We lease this pipeline from a third party under a long-term lease that expires in 2020. The pipeline has a capacity of
43
mbpd.
|
|
•
|
Wood River to Clermont
. Our Wood River to Clermont pipeline consists of approximately
153 miles
of 10-inch pipeline extending from MPC’s terminal in Wood River, Illinois to Martinsville, Illinois, and approximately
156 miles
of 10-inch pipeline extending from Martinsville, Illinois to Clermont, Indiana. This pipeline also includes approximately 10 miles of pipelines utilized for the local movement of products in and around Wood River, Illinois, and Clermont, Indiana. This pipeline has connecting segments from Martinsville, Illinois to MPC’s Robinson refinery, which allows bi-directional movements. This pipeline has a capacity of
48
mbpd.
|
|
•
|
Dieterich to Martinsville
. Our Dieterich to Martinsville pipeline consists of approximately
40 miles
of 10-inch pipeline that delivers products from the operational termination point of Centennial Pipeline to Martinsville, Illinois. From Martinsville, these products (including refinery feedstocks) can be further distributed to MPC’s Robinson refinery or to other destinations through our other pipeline systems. This pipeline has a capacity of
59
mbpd.
|
|
•
|
Wabash Pipeline System
. Our Wabash Pipeline System consists of three interconnected pipelines: approximately
130 miles
of 12-inch pipeline extending from Wood River, Illinois to Champaign, Illinois (the “West leg”); approximately
86 miles
of 12-inch pipeline extending from MPC’s Robinson refinery to Champaign (the “East leg”); and approximately
140 miles
of 12- and 16-inch pipeline extending from the junction with the East and West legs in Champaign to MPC’s terminals in Griffith and Hammond, Indiana. This pipeline system delivers products to MPC’s tanks at Martinsville, Champaign, Griffith and Hammond. This pipeline system also delivers products to tanks owned by a third party at Ashkum, Illinois. The Wabash Pipeline System connects to other pipeline systems and terminals in the Chicago area through a portion of the system located beyond MPC’s Griffith terminal. Overall, the pipeline system is capable of receiving products from or delivering products to five separate third-party pipeline systems. The West leg has a capacity of
71
mbpd, the East leg has a capacity of
99
mbpd and the remaining pipeline segment has a capacity of
85
mbpd.
|
Louisville Airport products system
. Our Louisville airport products system consists of approximately
14 miles
of eight- and six-inch pipeline that delivers jet fuel from MPC’s Louisville, Kentucky refined product terminals to customers at the Louisville International Airport. This pipeline system currently transports only third-party volumes. This pipeline system has a capacity of
29
mbpd.
12
Other Midstream Assets
The following table sets forth certain information regarding our other midstream assets, each of which currently has an associated transportation services agreement or storage services agreement with MPC:
Other Midstream Assets
|
Asset name
|
Capacity
(1)
|
Associated MPC refineries
|
||
|
Wood River Barge Dock
|
84 mbpd
|
Garyville, LA
|
||
|
Neal Butane Cavern
|
1,000 mbbls
|
Catlettsburg, KY
|
||
|
Patoka Tank Farm
|
1,386 mbbls
|
All Midwest refineries
|
||
|
Wood River Tank Farm
|
419 mbbls
|
All Midwest refineries
|
||
|
Martinsville Tank Farm
|
738 mbbls
|
Detroit, MI; Canton, OH
|
||
|
Lebanon Tank Farm
|
750 mbbls
|
Detroit, MI; Canton, OH
|
||
|
(1)
|
All capacity shown is for
100 percent
of the available storage capacity of our butane cavern and tank farms in thousands of barrels (“mbbls”) and
100 percent
of the barge dock’s average capacity. At December 31, 2013, we owned a
56.0 percent
indirect interest in our tank farms and our barge dock through Pipe Line Holdings. We own a
100 percent
interest in our butane cavern.
|
Wood River Barge Dock
Our barge dock is located on the Mississippi River in Wood River, Illinois and is used both for crude oil barge loading and products barge unloading. The barge dock is connected to our Wood River tank farm by approximately
two miles
of 14-inch pipeline that transfers crude oil from the tank farm to the dock, and two 10-inch pipelines that are each approximately
two miles
long and that transfer products and feedstocks from the dock to the tank farm. This dock generates revenue through a FERC tariff that is collected for the transfer and loading/unloading of crude oil and products. While the capacity of our barge dock and related pipelines can vary by product and other operational factors, based on volumes handled at the facility for the year ended
December 31, 2013
, the capacity of our barge dock and related pipelines was
84 mbpd
.
Neal Butane Cavern
Our butane cavern is located in Neal, West Virginia, across the Big Sandy River from MPC’s Catlettsburg refinery. This storage cavern has approximately
1.0 million
barrels of storage capacity and is connected to MPC’s Catlettsburg refinery. Rail access to the storage cavern is also available through connections with the refinery.
Tank Farms
We also own tank farms located in Patoka, Martinsville and Wood River, Illinois and Lebanon, Indiana that we use for storing both crude oil and products. These storage assets are integral to the operation of our pipeline systems in those areas. We utilize the substantial majority of our capacity at these tank farms as breakout tankage for our crude oil and product pipeline systems. We provide an aggregate of approximately
3.3 million
barrels of available capacity to MPC on a firm basis under our storage services agreements for our tank farms.
13
Volumes Transported
The following table sets forth the average aggregate daily number of barrels of crude oil transported on our pipeline systems and at our barge dock for MPC and for third parties, in physical barrels, for each of the last three years:
Crude Oil Volumes Transported
|
2013
|
2012
|
2011
|
|||||||
|
Crude oil transported for (mbpd)
(1)
:
|
|||||||||
|
MPC
|
841
|
|
827
|
|
811
|
|
|||
|
Third parties
|
222
|
|
202
|
|
182
|
|
|||
|
Total
|
1,063
|
|
1,029
|
|
993
|
|
|||
|
% MPC
|
79
|
%
|
80
|
%
|
82
|
%
|
|||
|
(1)
|
Volumes shown are
100 percent
of the volumes transported on the pipeline systems and barge dock. At December 31, 2013, we owned a
56.0 percent
indirect interest in our pipeline systems and our barge dock through Pipe Line Holdings. Volumes shown for all periods exclude volumes transported on two undivided joint interest crude oil pipeline systems not contributed to MPLX LP at the Offering.
|
The following table sets forth the average aggregate daily number of barrels of products transported on our pipeline systems for MPC and third parties for each of the last three years:
Product Volumes Transported
|
2013
|
2012
|
2011
|
|||||||
|
Products transported for (mbpd)
(1)
:
|
|||||||||
|
MPC
(2)
|
876
|
|
909
|
|
971
|
|
|||
|
Third parties
|
35
|
|
71
|
|
60
|
|
|||
|
Total
|
911
|
|
980
|
|
1,031
|
|
|||
|
% MPC
(2)
|
96
|
%
|
93
|
%
|
94
|
%
|
|||
|
(1)
|
Volumes shown are
100 percent
of the volumes transported on the pipeline systems. At December 31, 2013, we owned a
56.0 percent
indirect interest in the pipeline systems through Pipe Line Holdings.
|
|
(2)
|
Includes volumes shipped by MPC on various pipelines under joint tariffs with third parties. For accounting purposes, revenue attributable to these volumes is classified as third-party revenue because we receive payment from those third parties with respect to volumes shipped under the joint tariffs; however, the volumes associated with this revenue are applied towards MPC’s minimum quarterly volume commitments on the applicable pipelines because MPC is the shipper of record.
|
For a discussion of the effects of seasonality on our business, please read Item 7. Management’s Discussion and Analysis of Financial Condition and Results of Operations – Factors That Impact Our Business – Seasonality, which is incorporated herein by reference.
OUR TRANSPORTATION AND STORAGE SERVICES AGREEMENTS WITH MPC
Our assets are strategically located within, and integral to, MPC’s operations. We have entered into multiple transportation and storage services agreements with MPC. Under these long-term, fee-based agreements, we provide transportation and storage services to MPC, and MPC has committed to provide us with minimum quarterly throughput and storage volumes of crude oil and products and minimum storage volumes of butane. All of our transportation services agreements for our crude oil and product pipeline systems (other than our Wood River to Patoka crude system) include a 10-year term and automatically renew for up to two additional five-year terms unless terminated by either party no later than six months prior to the end of the term. The transportation services agreements for our Wood River to Patoka crude system and our barge dock each include a five-year term and automatically renew for up to four additional two-year terms unless terminated by either party no later than six months prior to the end of the term. Our butane cavern storage services agreement includes a 10-year term but does not automatically renew. Our storage services agreements for our tank farms include a three-year term and automatically renew for additional one-year terms unless terminated by either party no later than six months prior to the end of the term.
14
The following table sets forth additional information regarding our transportation and storage services agreements:
Transportation and Storage Services Agreements
|
Agreement
|
Initial
term (years) |
Weighted
average
tariff/storage
fee ($ per bbl)
(1)
|
MPC minimum
commitment
(2)
|
|||||||
|
Transportation Services (mbpd)
|
||||||||||
|
Crude Systems
|
||||||||||
|
Patoka to Lima crude system
(3)
|
10
|
|
$
|
0.53
|
|
40
|
|
|||
|
Catlettsburg and Robinson crude system
|
10
|
|
0.72
|
|
380
|
|
||||
|
Detroit crude system
|
10
|
|
0.24
|
|
155
|
|
||||
|
Wood River to Patoka crude system
(3)
|
5
|
|
0.23
|
|
130
|
|
||||
|
Wood River Barge Dock
(3)(4)
|
5
|
|
1.33
|
|
40
|
|
||||
|
Total
|
745
|
|
||||||||
|
Products Systems
|
||||||||||
|
Garyville products system
|
10
|
|
||||||||
|
Garyville to Zachary
(5)
|
$
|
0.55
|
|
300
|
|
|||||
|
Zachary to connecting pipelines
|
0.05
|
|
80
|
|
||||||
|
Texas City products system
|
10
|
|
||||||||
|
Texas City to Pasadena
(5)
|
0.27
|
|
81
|
|
||||||
|
Pasadena to connecting pipelines
|
0.07
|
|
61
|
|
||||||
|
ORPL products system
|
10
|
|
1.21
|
|
129
|
|
||||
|
Robinson products system
(5)
|
10
|
|
0.68
|
|
209
|
|
||||
|
Total
|
860
|
|
||||||||
|
Storage Services (mbbls)
|
||||||||||
|
Neal Butane Cavern
|
10
|
|
$
|
1.25
|
|
1,000
|
|
|||
|
Patoka Tank Farm
|
3
|
|
0.48
|
|
1,386
|
|
||||
|
Wood River Tank Farm
|
3
|
|
0.48
|
|
419
|
|
||||
|
Martinsville Tank Farm
|
3
|
|
0.48
|
|
738
|
|
||||
|
Lebanon Tank Farm
|
3
|
|
0.48
|
|
750
|
|
||||
|
Total
|
4,293
|
|
||||||||
|
(1)
|
Based on actual volumes transported or stored for 2013 and applicable tariffs or fees during the period, including general tariff increases on the majority of our pipeline systems in July 2013. Weighted average tariffs shown for transportation services agreements are presented on a per-barrel of throughput basis. Storage fees for our butane cavern and tank farms are shown per barrel of capacity per month.
|
|
(2)
|
Quarterly commitment for our transportation services agreements in thousands of barrels per day and committed storage capacity for our storage services agreements in thousands of barrels. Volumes shown for crude oil transportation services agreements are adjusted for crude viscosities.
|
|
(3)
|
MPC’s minimum commitment represents the lesser of (1) a base commitment and (2) a lesser amount reflecting increased third-party utilization of the applicable asset.
|
|
(4)
|
Historically, we have shipped primarily crude oil volumes; however, our barge dock can handle products as well as crude oil.
|
|
(5)
|
Includes revenue from volumes shipped by MPC on various pipelines under joint tariffs with third parties. For accounting purposes, this revenue is classified as third-party revenue because we receive payment from those third parties with respect to volumes shipped under the joint tariffs; however, the volumes associated with this revenue are applied towards MPC’s minimum volume commitments on the applicable pipelines because MPC is the shipper of record.
|
15
Under our transportation services agreements, if MPC fails to transport its minimum throughput volumes during any quarter, then MPC will pay us a deficiency payment equal to the volume of the deficiency multiplied by the tariff rate then in effect (the “Quarterly Deficiency Payment”). Under each of our transportation services agreements, other than the agreements covering our Wood River to Patoka crude system and our barge dock, the amount of any Quarterly Deficiency Payment paid by MPC may be applied as a credit for any volumes transported on the applicable pipeline system in excess of MPC’s minimum volume commitment during any of the succeeding four quarters, or eight quarters for the transportation services agreements covering our Wood River to Patoka crude system and our barge dock, after which time any unused credits will expire. Upon the expiration or termination of a transportation services agreement, MPC will have the opportunity to apply any such remaining credit amounts until the completion of any such four-quarter or eight-quarter period, as applicable. Unlike during the term of the agreement, any such remaining credits may be used against any volumes shipped by MPC on the applicable pipeline system, without regard to any minimum volume commitment that may have been in place during the term of the agreement.
In order to enable MPC to transport its minimum throughput commitment each quarter, we are obligated to maintain the stated minimum capacity of the pipeline systems. If the minimum capacity of the pipeline falls below the level of MPC’s commitment at any time or if capacity on the pipeline is required to be allocated among shippers because volume nominations exceed available capacity, depending on the cause of the reduction in capacity, MPC’s commitment may be reduced or MPC will receive a credit for its minimum volume commitment for that period. Generally, under our transportation services agreements, we may elect to adjust our tariff rates annually. MPC has agreed not to directly or indirectly take any action that indicates a lack of support for our tariffs for the term of the agreement. In addition to MPC’s minimum volume commitment, MPC is also responsible for any loading, handling, transfer and other charges with respect to volumes we transport for MPC.
Under our transportation services agreements, if we agree to make any capital expenditures at MPC’s request, MPC will reimburse us for, or we will have the right in certain circumstances to file for an increased tariff rate to recover, the actual cost of such capital expenditures. In addition, if new laws or regulations that affect the services that we provide to MPC under these agreements are enacted or promulgated that require us to make substantial and unanticipated capital expenditures, MPC will reimburse us for, or we will have the right to file for an increased tariff rate to cover, MPC’s proportionate share of the costs of complying with these laws or regulations, after we have made efforts to mitigate their effect. We and MPC will negotiate in good faith to agree on the level of the increased tariff rate which shall be sufficient to allow us to recover the costs of the substantial and unanticipated capital expenditures consistent with FERC ratemaking methodology. MPC will also reimburse us for, or we will also have the right to file for an increased tariff rate to recover, the amounts of any taxes (other than income taxes, gross receipt taxes, ad valorem taxes, property taxes and similar taxes) that we incur on MPC’s behalf for the services we provide to MPC under these agreements to the extent permitted by law.
MPC’s obligations under these transportation and storage services agreements will not terminate if MPC no longer controls our general partner.
Our transportation services agreements include provisions that permit MPC to suspend, reduce or terminate its obligations under the applicable agreement if certain events occur. These events include MPC deciding to permanently or indefinitely suspend refining operations at one or more of its refineries for at least twelve consecutive months and certain force majeure events that would prevent us or MPC from performing required services under the applicable agreement. As defined in our transportation and storage services agreements, force majeure events include any acts or occurrences that prevent services from being performed under the applicable agreement, such as:
|
•
|
acts of God, fires, floods or storms;
|
|
•
|
compliance with orders of courts or any governmental authority;
|
|
•
|
explosions, wars, terrorist acts, riots, strikes, lockouts or other industrial disturbances;
|
|
•
|
accidental disruption of service;
|
|
•
|
breakdown of machinery, storage tanks or pipelines and inability to obtain or unavoidable delays in obtaining material or equipment to repair or replace those assets; and
|
|
•
|
similar events or circumstances, so long as such events or circumstances are beyond the party’s reasonable control and could not have been prevented by the service provider’s reasonable due diligence.
|
Under our crude oil transportation services agreements, if MPC experiences a force majeure at one of its refineries that reduces such refinery’s crude oil throughput capacity by at least 50.0 percent for 30 days or more, MPC’s minimum volume commitment under the associated agreement will be reduced by 50.0 percent until such time that capacity is restored at the refinery.
16
Under our storage services agreements, we are obligated to make available to MPC on a firm basis the available storage capacity at our tank farms and butane cavern, and MPC has agreed to pay us a per-barrel fee for such storage capacity, regardless of whether MPC fully utilizes the available capacity. If the available capacity of our storage assets is reduced as a result of testing, repair or maintenance activities, a force majeure event or in order to comply with applicable law, rule or regulation, then MPC is entitled to a proportionate reduction in the amounts payable by MPC under the applicable agreement. We may adjust the per-barrel fees in our storage services agreements based on changes in the Producer Price Index for Finished Goods (“PPI”) in early 2014.
Under our transportation and storage services agreements, each party has agreed to indemnify the other party from any losses or liabilities incurred as a result of, among other things, the indemnifying party’s breach of the applicable transportation and storage services agreement. Additionally, we have agreed to indemnify MPC from any losses or liabilities, including third-party claims, incurred by MPC as a result of our gross negligence, willful misconduct or bad faith in the performance of the applicable transportation and storage services agreement. MPC has agreed to indemnify us from any losses or liabilities incurred for any third-party claims except to the extent resulting from our gross negligence, willful misconduct or bad faith in the provision of services under the applicable transportation and storage services agreement. There is no limit on the amount of the indemnification obligations under the transportation and storage services agreements.
None of these agreements may be assigned by us or MPC without the other party’s prior written consent, except that we or MPC may assign an agreement without the other party’s prior written consent to a successor in interest resulting from any merger, reorganization, consolidation or as part of a sale of all or substantially all of the assigning party’s assets. Upon termination of a transportation services agreement, if not due to a default by MPC or initiated by MPC for reasons of force majeure or the suspension of a refinery’s operations, (i) MPC has the right to require us to enter into a new transportation services agreement on commercial terms that are equal or more favorable to us than terms that would be agreed to with a third party at arm’s length and, (ii) if we propose to enter into a transportation services agreement with a third party, we must provide MPC with a right of first offer to enter into a transportation services agreement with us on terms no less favorable than those offered by the third party, provided that in either case the term of any such new agreement will not extend beyond December 31, 2032 (except with respect to our Wood River barge dock and Wood River to Patoka crude system, the terms of which will not extend beyond December 31, 2017 and December 31, 2025, respectively).
The following sets forth additional information regarding each of our transportation and storage services agreements:
Crude Oil Pipeline Systems
|
•
|
Patoka to Lima Crude System.
Under our Patoka to Lima transportation services agreement, we charge MPC, at the applicable FERC tariff rates, for transporting crude oil from Patoka, Illinois and any new or existing connections, including any injection and truck unloading points, along our Patoka to Lima pipeline system. MPC is obligated to transport on this pipeline system each quarter an average of at least the lesser of: (1)
40
mbpd of light equivalent crude oil and (2) 290 mbpd of light equivalent crude oil minus all third-party shipments of light equivalent crude oil on the system, each quarter on this pipeline system. Under this agreement, we may file with the FERC to adjust our tariff rates annually at a rate equal to the percentage change in any inflationary index promulgated by the FERC, in accordance with the FERC’s indexing methodology. If the FERC terminates its indexing methodology and does not adopt a new methodology, the parties will negotiate in good faith any adjustment to the existing tariff rates. MPC historically has shipped volumes of crude oil on this pipeline system in excess of its minimum throughput commitment, and we expect those excess shipments to continue.
|
|
•
|
Catlettsburg and Robinson Crude System.
Under our Catlettsburg and Robinson transportation services agreement, we charge MPC, at the applicable FERC tariff rates, for transporting crude oil from:
|
|
•
|
Patoka, Illinois and any new or existing connections, including any injection and truck unloading points, along our Patoka to Robinson pipeline extending from Patoka, Illinois to MPC’s Robinson refinery; and
|
|
•
|
Patoka, Illinois and any new or existing connections, including any injection and truck unloading points, along our Patoka to Owensboro to Catlettsburg pipeline extending from Patoka to MPC’s Catlettsburg refinery.
|
MPC is obligated to transport each quarter an average of at least
380
mbpd of light equivalent crude oil from origin points at Patoka, Owensboro or other connections on this pipeline system to MPC’s Robinson or Catlettsburg refineries. Under this agreement, we may file with the FERC to adjust our tariff rates annually at a rate equal to the percentage change in any inflationary index promulgated by the FERC, in accordance with the FERC’s indexing methodology. If the FERC terminates its indexing methodology and does not adopt a new methodology, the parties will negotiate in good faith any adjustment to the existing tariff rates. MPC historically has shipped volumes of crude oil on this pipeline system in excess of its minimum quarterly throughput commitment, and we expect those excess shipments to continue.
17
|
•
|
Detroit Crude System.
Under our Detroit transportation services agreement, we charge MPC, at the applicable FERC tariff rates, for transporting crude oil from:
|
|
•
|
Samaria, Michigan and any new or existing connections, including any injection and truck unloading points, along our Samaria to Detroit pipeline extending from Samaria, Michigan to MPC’s Detroit refinery; and
|
|
•
|
Romulus, Michigan and any new or existing connections, including any injection and truck unloading points, along our Romulus to Detroit pipeline extending from Romulus, Michigan to MPC’s Detroit refinery.
|
MPC is obligated to transport each quarter an average of at least
155
mbpd of light equivalent crude oil from origin points at Samaria, Romulus or other connections on this pipeline system to MPC’s Detroit refinery. Under this agreement, we may file with the FERC to adjust our tariff rates annually at a rate equal to the percentage change in any inflationary index promulgated by the FERC, in accordance with the FERC’s indexing methodology. If the FERC terminates its indexing methodology and does not adopt a new methodology, the parties will negotiate in good faith any adjustment to the existing tariff rates.
|
•
|
Wood River to Patoka Crude System
. Under our Wood River to Patoka transportation services agreement, we charge MPC, at the applicable FERC tariff rates, for transporting crude oil from:
|
|
•
|
Wood River, Illinois and any new or existing connections, including any injection and truck unloading points, along our pipeline extending from Wood River to Patoka, Illinois; and
|
|
•
|
Roxanna, Illinois and any new or existing connections, including any injection and truck unloading points, along our pipeline extending from Roxanna, Illinois to Patoka.
|
MPC is obligated to transport on this pipeline system each quarter an average of at least the lesser of: (1)
130
mbpd of light equivalent crude oil and (2) 279 mbpd light equivalent crude oil minus all third-party shipments of light equivalent crude oil on the system. Under this agreement, we may file with the FERC to adjust our tariff rates annually at a rate equal to the percentage change in any inflationary index promulgated by the FERC, in accordance with the FERC’s indexing methodology. If the FERC terminates its indexing methodology and does not adopt a new methodology, the parties will negotiate in good faith any adjustment to the existing tariff rates.
Product Pipeline Systems
|
•
|
Garyville Products System
.
Under our Garyville transportation services agreement, we charge MPC, at the applicable FERC tariff rates, for transporting products from Garyville, Louisiana and any new or existing connections, including any injection and truck unloading points, on our Garyville pipeline system to Baton Rouge and Zachary, Louisiana. MPC is obligated to transport an average each quarter of at least
300
mbpd of products from MPC’s Garyville refinery to Baton Rouge or Zachary, and an average each quarter of at least
80
mbpd of products from tankage at Zachary to the Colonial Pipeline in Zachary. Our tariff rates on this pipeline system are market-based. Under this agreement, we may file with the FERC to adjust our tariff rates based on the FERC’s order granting us market-based rates.
|
|
•
|
Texas City Products System
. Under our Texas City transportation services agreement, we charge MPC, at the applicable FERC tariff rates, for transporting products on our Texas City pipeline system from Texas City to Pasadena, Texas and from storage tanks at Pasadena to connecting pipeline carriers. MPC is obligated to transport an average each quarter of at least
81
mbpd of products from origin points at Texas City to Pasadena, and an average each quarter of at least
61
mbpd of products from storage tanks at Pasadena to connecting pipeline carriers. Our tariff rates on this pipeline system are market-based. Under this agreement, we may file with the FERC to adjust our tariff rates based on the FERC’s order granting us market-based rates. MPC historically has shipped volumes of products on this pipeline system in excess of the minimum throughput commitment, and we expect those excess shipments to continue.
|
|
•
|
ORPL Products System
. Under our ORPL transportation services agreement, we charge MPC, at the applicable FERC tariff rates, for transporting products from:
|
|
•
|
MPC’s Catlettsburg refinery and any new or existing connections, including any injection and truck unloading points, along our pipeline segment extending from Kenova, West Virginia to Columbus, Ohio;
|
|
•
|
MPC’s Canton refinery and any new or existing connections, including any injection and truck unloading points, along our Canton to Heath pipeline segments extending from MPC’s Canton refinery to East Sparta, Ohio;
|
|
•
|
East Sparta, Ohio and any new or existing connections, including any injection and truck unloading points, along our pipeline segments extending from East Sparta to Heath, Ohio and East Sparta to West Point, Ohio to Midland, Pennsylvania; and
|
|
•
|
Heath, Ohio and any new or existing connections along our pipeline segments extending from Heath to Findlay, Ohio and Heath to Columbus, Ohio to Dayton, Ohio.
|
18
MPC is obligated to transport an average of at least: 48 mbpd of products each quarter on the Kenova to Columbus pipeline segment; 10 mbpd of products each quarter on the Columbus to Dayton pipeline segment; four mbpd of products each quarter on the Heath to Findlay or Findlay to Heath pipeline segment; six mbpd of products each quarter on the Columbus to Heath or Heath to Columbus pipeline segment; 32 mbpd of products each quarter on the Canton to East Sparta or East Sparta to Canton pipeline segment; eight mbpd of products each quarter on the East Sparta to Heath or Heath to East Sparta pipeline segment; 13 mbpd of products each quarter on the East Sparta to Midland or Midland to East Sparta pipeline segment and seven mbpd of products each quarter on the East Sparta to West Point pipeline segment or Midland to West Point pipeline segment. Under this agreement, we may file with the FERC to adjust our tariff rates annually at a rate equal to the percentage change in any inflationary index promulgated by the FERC, in accordance with the FERC’s indexing methodology. If the FERC terminates its indexing methodology and does not adopt a new methodology, the parties will negotiate in good faith any adjustment to the existing tariff rates. Once MPC has satisfied its minimum throughput commitment on any of the pipeline segments for any quarter, all excess volumes shipped by MPC on those segments will be at a reduced incentive tariff rate.
|
•
|
Robinson Products System
. Under our Robinson products system transportation services agreement, we charge MPC, at the applicable FERC tariff rates, for transporting products from:
|
|
•
|
MPC’s Robinson refinery and any new or existing connections, including any injection and truck unloading points, along our pipeline segments extending from Robinson to Lima, Ohio, Robinson to Louisville, Kentucky, Robinson to Champaign to Griffith, Indiana, Robinson to Brownsburg Junction, Indiana and Robinson to Mt. Vernon, Indiana;
|
|
•
|
Wood River, Illinois and any new or existing connections, including any injection and truck unloading points, along our pipeline segments extending from Wood River to Clermont, Indiana and Wood River to Champaign to Griffith; and
|
|
•
|
Martinsville, Illinois to any available destination on the pipeline system for volumes that are delivered to Martinsville from our pipeline segment extending from Dieterich, Illinois to Martinsville.
|
MPC is obligated to transport an average of at least
209
mbpd of products each quarter in the aggregate from origin points at Robinson, Wood River and Martinsville for volumes delivered from the Dieterich to Martinsville pipeline segment, as well as other connection points on this pipeline system. Our tariff rates on this pipeline system are market-based. Under this agreement, we may, but are not required to, file with the FERC to adjust our tariff rates based on the FERC’s indexing methodology or under FERC’s order approving our market-based rates annually.
Other Midstream Assets
|
•
|
Wood River Barge Dock
. Under our Wood River barge dock transportation services agreement, we charge MPC, at the applicable FERC tariff rates, for transporting crude oil or products over our dock at Wood River, Illinois to or from barges supplied by MPC. MPC is obligated to transport an average of at least the lesser of (1)
40
mbpd of crude oil and products and (2) 60 mbpd of crude oil and products minus all third-party shipments of light equivalent crude oil and products handled each quarter at this facility. Under the agreement, as to crude oil we may file with the FERC to adjust our tariff rates at a rate either equal to the percentage change in any inflationary index promulgated by the FERC, in accordance with the FERC’s indexing methodology, or with respect to rates for refined products, we may adopt the tariff rates in a manner consistent with our market-based rates. If the FERC terminates its indexing methodology and does not adopt a new methodology, the parties will negotiate in good faith any adjustment to the existing tariff rates.
|
|
•
|
Neal Butane Cavern
. Under our Neal butane cavern services agreement, MPC paid us a $1.25 per-barrel fee per month in 2013 for storing butane at our Neal, West Virginia butane cavern. MPC’s fees under this agreement are for the use of the available storage capacity of our Neal butane cavern of approximately
1.0 million
barrels for butane regardless of whether MPC fully utilizes all of its contracted capacity. We may adjust the per-barrel fee by a percentage equal to an increase in the PPI in early 2014.
|
|
•
|
Patoka Tank Farm
. Under our Patoka tank farm storage services agreement, MPC paid us a $0.48 per-barrel fee per month in 2013 for storing crude oil at our Patoka, Illinois tank farm. MPC’s fees under this agreement are for the use of the available shell capacity of our Patoka tank farm (
1,386
mbbls for crude oil) regardless of whether MPC fully utilizes all of its contracted capacity. We may adjust the per-barrel fee by a percentage equal to an increase in the PPI in early 2014.
|
|
•
|
Wood River Tank Farm
. Under our Wood River tank farm storage services agreement, MPC paid us a $0.48 per-barrel fee per month in 2013 for storing crude oil and products at our Wood River, Illinois tank farm. MPC’s fees under this agreement are for the use of the available shell capacity of our Wood River tank farm (219 mbbls for crude oil and 200 mbbls for products) regardless of whether MPC fully utilizes all of its contracted capacity. We may adjust the per-barrel fee by a percentage equal to an increase in the PPI in early 2014.
|
19
|
•
|
Martinsville Tank Farm
. Under our Martinsville tank farm storage services agreement, MPC paid us a $0.48 per-barrel fee per month in 2013 for storing crude oil and products at our Martinsville, Illinois tank farm. MPC’s fees under this agreement are for the use of the available shell capacity of our Martinsville tank farm (110 mbbls for crude oil and 628 mbbls for products) regardless of whether MPC fully utilizes all of its contracted capacity. We may adjust the per-barrel fee by a percentage equal to an increase in the PPI in early 2014.
|
|
•
|
Lebanon Tank Farm
. Under our Lebanon tank farm storage services agreement, MPC paid us a $0.48 per-barrel fee per month in 2013 for storing crude oil. MPC’s fees under this agreement are for the use of the available shell capacity of our Lebanon tank farm (
750
mbbls for crude oil) regardless of whether MPC fully utilizes all of its contracted capacity. We may adjust the per-barrel fee by a percentage equal to an increase in the PPI in early 2014.
|
OPERATING AND MANAGEMENT SERVICES AGREEMENTS WITH MPC AND THIRD PARTIES
Operating Agreements
Through MPL, we operate various pipeline systems owned by MPC and third parties under existing operating services agreements that MPL has entered into with MPC and third parties. Under these operating services agreements, MPL receives an operating fee for operating the assets, which include certain MPC wholly-owned or partially-owned crude oil and product pipelines, and for providing various operational services with respect to those assets. MPL is generally reimbursed for all direct and indirect costs associated with operating the assets and providing such operational services. These agreements generally range from one to five years in length and automatically renew. Most of the agreements are indexed for inflation.
At the closing of the Offering, MPL amended and restated its existing operating agreement with Marathon Petroleum Company LP, a wholly-owned subsidiary of MPC, to, among other things, update certain reimbursement, budget, tax and termination provisions. Under this amended and restated operating agreement, MPL receives an annual fee for operating certain Marathon Petroleum Company LP pipeline systems. This fee is currently $11.5 million and will be adjusted annually for inflation. Marathon Petroleum Company LP has agreed to indemnify MPL against any and all damages arising out of the operation of Marathon Petroleum Company LP’s pipeline systems unless such occurrence is due to the gross negligence or willful misconduct of MPL. MPL has agreed to indemnify Marathon Petroleum Company LP against any and all damages arising out of MPL’s gross negligence or willful misconduct in the operation of the pipeline systems. The initial term of this agreement was for one year and automatically renews from year-to-year unless terminated by either party at least six months prior to the end of the term.
Our existing operating services agreements include an operating agreement with Red Butte Pipe Line Company, which is owned by Marathon Oil. Under this agreement, MPL receives an annual $3.3 million operating fee for operating certain pipelines in Wyoming and Montana. The term of this agreement has been extended from December 2013 through December 2018.
Effective February 1, 2013, we entered into an operating agreement with Blanchard Pipe Line Company LLC (“Blanchard Pipe Line”), a wholly-owned subsidiary of MPC, under which we operate various pipeline systems in Texas owned by Blanchard Pipe Line that it acquired in conjunction with MPC’s acquisition of the Galveston Bay refinery. Under the agreement we receive an annual fee of initially $1.0 million, subject to adjustment for inflation, and are reimbursed for specific costs associated with operating the pipeline systems. The term of this agreement is through December 31, 2014, and it is automatically extended from year to year thereafter unless terminated by either party at least three months prior to the end of the term.
Effective October 1, 2013, MPL entered into an operating and maintenance agreement with the owners of the Capline pipeline system. The Capline system is a 635 mile, 40-inch crude oil pipeline running from St. James, Louisiana to Patoka, Illinois. MPC owns a 32.6 percent undivided joint interest in the Capline system. Under the agreement we receive an annual fee of $3.5 million, subject to adjustment for inflation, and in addition are reimbursed for specific costs associated with operating the pipeline system. The initial term of this agreement is until August 31, 2018, and it is automatically extended for successive five year terms thereafter unless terminated by either party at least ten months prior to the end of the term.
Management Services Agreements
Effective September 1, 2012, we entered into a management services agreement with Hardin Street Holdings LLC, a subsidiary of MPC, under which MPL provides certain management services to MPC with respect to certain of MPC’s retained assets owned by Hardin Street Holdings LLC. We receive a fixed monthly fee under the agreement for providing the required management services. The aggregate monthly fees are approximately $0.5 million per year and are indexed for inflation and subject to adjustments for changes in the scope of management services provided.
20
Effective October 10, 2012, we entered into a second management services agreement with MPL Louisiana Holdings LLC, a subsidiary of MPC, under which MPL will continue to provide certain management services to MPC with respect to certain of MPC’s retained pipeline assets owned by MPL Louisiana Holdings LLC. We receive a fixed monthly fee under the agreement for providing the required management services. The aggregate monthly fees are approximately $0.2 million per year and are indexed for inflation and subject to adjustments for changes in the scope of management services provided.
OTHER AGREEMENTS WITH MPC
In connection with the Offering, we entered into the following additional agreements with MPC:
|
•
|
Omnibus Agreement.
As of October 31, 2012, we entered into an omnibus agreement with MPC that addresses our payment of a fixed annual fee to MPC for the provision of executive management services by certain executive officers of our general partner and our reimbursement of MPC for the provision of certain general and administrative services to us, as well as MPC’s indemnification of us for certain matters, including certain pre-closing environmental, title and tax matters. In addition, we will indemnify MPC for certain post-closing matters under this agreement.
|
|
•
|
Employee Services Agreements.
We entered into two employee services agreements with MPC, effective October 1, 2012, under which we agreed to reimburse MPC for the provision of certain operational and management services to us in support of our pipelines, barge dock, butane cavern and tank farms.
|
OUR RELATIONSHIP WITH MPC
One of our principal strengths is our relationship with MPC, which we believe to be the fourth-largest petroleum products refiner in the United States and the largest petroleum products refiner in the Midwest region of the United States based on crude oil refining capacity. MPC owns and operates seven refineries and associated midstream transportation and logistics assets in Petroleum Administration for Defense District (“PADD”) II and PADD III, which consist of states in the Midwest and Gulf Coast regions of the United States, along with an extensive wholesale and retail refined product marketing operation that serves markets primarily in the Midwest, Gulf Coast and Southeast regions of the United States. MPC markets refined products under the Marathon brand through an extensive network of retail locations owned by independent entrepreneurs, and under the Speedway brand through its wholly-owned subsidiary, Speedway LLC, which operates what we believe to be the nation’s fourth-largest chain of company-owned and operated retail gasoline and convenience stores. In addition, MPC sells refined products in the wholesale markets. MPC had consolidated revenues of approximately $100.2 billion in 2013. Marathon Petroleum Corporation’s common stock trades on the New York Stock Exchange (“NYSE”) under the symbol “MPC.”
MPC’s operations necessitate large-scale movements of crude oil and feedstocks to and among its refineries, as well as large-scale movements of refined products from its refineries to various markets. To this end, MPC has an extensive, integrated network of midstream assets. As of December 31, 2013, MPC continued to own, lease or have ownership interests in a substantial portfolio of midstream assets, including:
|
•
|
a 44.0 percent interest in our network of pipeline systems, barge dock and tank farms through Pipe Line Holdings,
of which we will acquire an additional 13.0 percent effective on March 1, 2014;
|
|
•
|
approximately 5,400 miles of additional crude oil and product pipelines;
|
|
•
|
64 owned and operated light product terminals with approximately 21 million barrels of storage capacity and 194 loading lanes;
|
|
•
|
19 owned and operated asphalt terminals with approximately 4 million barrels of storage capacity and 68 loading lanes;
|
|
•
|
one leased and two non-operated, partially-owned light product terminals;
|
|
•
|
one of the largest private inland bulk liquid barge fleets in the United States, consisting of 18 owned or leased inland towboats and 200 owned or leased inland barges.
|
|
•
|
2,165 owned or leased rail cars;
|
|
•
|
59 million barrels of tank storage capacity at its refineries;
|
|
•
|
25 rail and 24 truck loading racks at its refineries; and
|
|
•
|
7 owned and 11 non-owned docks at its refineries.
|
MPC continues to focus resources on growing this portfolio of assets, including announced investments in the Sandpiper and Southern Access Extension pipeline projects.
21
MPC retains a significant interest in us through its ownership of our general partner, a 71.6 percent limited partner interest in us and all of our incentive distribution rights. We believe MPC will promote and support the successful execution of our business strategies given its significant ownership in us and its stated intention to use us to grow its midstream business. As a result, we believe MPC will continue to offer us the opportunity to purchase additional assets from it, including additional interests in Pipe Line Holdings. We also may pursue acquisitions cooperatively with MPC. However, MPC is under no obligation to offer to sell us additional assets or to pursue acquisitions cooperatively with us, and we are under no obligation to buy any such additional assets or pursue any such cooperative acquisitions.
COMPETITION
As a result of our contractual relationship with MPC under our transportation and storage services agreements, and our connections to MPC’s refineries, we believe that our crude oil and product pipelines will not face significant competition from other pipelines for MPC’s crude oil or products transportation requirements.
If MPC’s customers reduced their purchases of products from MPC due to the increased availability of less expensive products from other suppliers or for other reasons, MPC may only ship the minimum volumes through our pipelines (or pay the shortfall payment if it does not ship the minimum volumes), which would cause a decrease in our revenues. MPC competes with integrated petroleum companies, which have their own crude oil supplies and distribution and marketing systems, as well as with independent refiners, many of which also have their own distribution and marketing systems. MPC also competes with other suppliers that purchase refined products for resale. Competition in any particular geographic area is affected significantly by the volume of products produced by refineries in that area and by the availability of products and the cost of transportation to that area from distant refineries.
INSURANCE
Our assets may experience physical damage as a result of an accident or natural disaster. These hazards can also cause personal injury and loss of life, severe damage to and destruction of property and equipment, pollution or environmental damage and suspension of operations. We are insured under MPC’s corporate property and liability insurance policies and subject to the shared deductibles and limits under those policies. We also maintain our own property, business interruption and pollution liability insurance policies separately from MPC and at varying levels of deductibles and limits that we believe are reasonable and prudent under the circumstances to cover our operations and assets. As we continue to grow, we will continue to evaluate our policy limits and retentions as they relate to the overall cost and scope of our insurance program.
PIPELINE CONTROL OPERATIONS
Our pipeline systems are operated from a central control room located in Findlay, Ohio. The control center operates with a SCADA (supervisory control and data acquisition) system equipped with computer systems designed to continuously monitor operational data. Monitored data includes pressures, temperatures, gravities, flow rates and alarm conditions. A “state-of-the-art” real-time transient leak detection system monitors throughput and alarms if pre-established operating parameters are exceeded. The control center operates remote pumps, motors and valves associated with the receipt and delivery of crude oil and products, and provides for the remote-controlled shutdown of pump stations on the pipeline system. A fully functional back-up operations center is also maintained and routinely operated throughout the year to ensure safe and reliable operations.
RATE AND OTHER REGULATION
Tariff Rates
Our pipeline systems are common carriers subject to regulation by various federal, state and local agencies. The FERC regulates interstate transportation on our common carrier pipeline systems under the Interstate Commerce Act (“ICA”), Energy Policy Act of 1992 (“EPAct 1992”) and the rules and regulations promulgated under those laws. The ICA and its implementing regulations require that tariff rates for interstate service on oil pipelines, including interstate pipelines that transport crude oil and products (collectively referred to as “petroleum pipelines”), be just and reasonable and must not be unduly discriminatory or confer any undue preference upon any shipper. The FERC regulations require that interstate petroleum pipeline transportation rates and terms and conditions of service be filed with the FERC and publicly posted. Under the ICA, interested persons may challenge new or changed rates or services. The FERC is authorized to investigate such charges and may suspend the effectiveness of a challenged rate for up to seven months. A successful rate challenge could result in a petroleum pipeline paying refunds together with interest for the period that the rate was in effect. The FERC may also investigate, upon complaint or on its own motion, existing rates and related rules and may order a pipeline to change them prospectively. A shipper may obtain reparations for damages sustained for a period up to two years prior to the filing of a complaint.
22
EPAct 1992 deemed certain interstate petroleum pipeline rates then in effect to be just and reasonable under the ICA. These rates are commonly referred to as “grandfathered rates.” Our rates in effect at the time of the passage of EPAct 1992 for interstate transportation service were deemed just and reasonable and therefore are grandfathered. New rates have since been established after EPAct 1992 for certain pipeline systems, and many of our products rates have subsequently been approved as market-based rates. The FERC may change grandfathered rates upon complaint only after it is shown that:
|
•
|
a substantial change has occurred since enactment in either the economic circumstances or the nature of the services that were a basis for the rate;
|
|
•
|
the complainant was contractually barred from challenging the rate prior to enactment of EPAct 1992 and filed the complaint within 30 days of the expiration of the contractual bar; or
|
|
•
|
a provision of the tariff is unduly discriminatory or preferential.
|
EPAct 1992 required the FERC to establish a simplified and generally applicable ratemaking methodology for interstate petroleum pipelines. As a result, the FERC adopted an indexing rate methodology which, as currently in effect, allows petroleum pipelines to change their rates within prescribed ceiling levels that are tied to changes in the PPI. The FERC’s indexing methodology is subject to review every five years. During the five-year period commencing July 1, 2011 and ending June 30, 2016, petroleum pipelines charging indexed rates are permitted to adjust their indexed ceilings annually by PPI plus 2.65 percent. The indexing methodology is applicable to existing rates, including grandfathered rates, with the exclusion of market-based rates. A pipeline is not required to raise its rates up to the index ceiling, but it is permitted to do so and rate increases made under the index are presumed to be just and reasonable unless a protesting party can demonstrate that the portion of the rate increase resulting from application of the index is substantially in excess of the pipeline’s increase in costs. Under the indexing rate methodology, in any year in which the index is negative, pipelines must file to lower their rates if those rates would otherwise be above the rate ceiling.
While petroleum pipelines often use the indexing methodology to change their rates, petroleum pipelines may elect to support proposed rates by using other methodologies such as cost-of-service ratemaking, market-based rates and settlement rates. A pipeline can follow a cost-of-service approach when seeking to increase its rates above the rate ceiling (or when seeking to avoid lowering rates to the reduced rate ceiling), provided that the pipeline can establish that there is a substantial divergence between the actual costs experienced by the pipeline and the rate resulting from application of the index. A pipeline can charge market-based rates if it establishes that it lacks significant market power in the affected markets. In addition, a pipeline can establish rates under settlement if agreed upon by all current non-affiliated shippers. We have used index rates, settlement rates and market-based rates for our different pipeline systems. The FERC issued a policy statement in May 2005 stating that it would permit interstate oil pipelines, among others, to include an income tax allowance in cost-of-service rates to reflect actual or potential tax liability attributable to a regulated entity’s operating income, regardless of the form of ownership. Under the FERC’s policy, a tax pass-through entity seeking such an income tax allowance must establish that its partners or members have an actual or potential income tax liability on the regulated entity’s income. Whether a pipeline’s owners have such actual or potential income tax liability is subject to review by the FERC on a case-by-case basis. Although this policy is generally favorable for pipelines that are organized as pass-through entities, it still entails rate risk due to the case-by-case review requirement.
Intrastate services provided by certain of our pipeline systems are subject to regulation by state regulatory authorities, such as the Illinois Commerce Commission and the Michigan Public Service Commission. This state regulation uses a complaint-based system, both as to rates and priority of access. The Illinois Commerce Commission and the Michigan Public Service Commission could limit our ability to increase our rates or to set rates based on our costs or could order us to reduce our rates and could require the payment of refunds to shippers.
The FERC and state regulatory agencies generally have not investigated rates on their own initiative when those rates, like ours, have not been the subject of a protest or a complaint by a shipper. MPC has agreed not to contest our tariff rates for the term of our transportation and storage services agreements with MPC. However, the FERC or a state commission could investigate our rates on its own initiative or at the urging of a third party if the third party is either a current shipper or is able to show that it has a substantial economic interest in our tariff rate level.
If our rate levels were investigated, the inquiry could result in a comparison of our rates to those charged by others or to an investigation of our costs, including:
|
•
|
the overall cost of service, including operating costs and overhead;
|
|
•
|
the allocation of overhead and other administrative and general expenses to the regulated entity;
|
|
•
|
the appropriate capital structure to be utilized in calculating rates;
|
|
•
|
the appropriate rate of return on equity and interest rates on debt;
|
23
|
•
|
the rate base, including the proper starting rate base;
|
|
•
|
the throughput underlying the rate; and
|
|
•
|
the proper allowance for federal and state income taxes.
|
If the FERC or a state commission were to determine that our rates were or had become unjust and unreasonable, we could be ordered to reduce rates prospectively and pay refunds and reparations to shippers.
With respect to our pipelines that charge FERC-approved market-based rates, we believe that the transactions related to the Offering will not affect the basis for our market-based rates or result in a requirement that we use another methodology to establish our rates.
Because our pipelines are common carrier pipelines, we may be required to accept new shippers who wish to transport on our pipelines. It is possible that new shippers, current shippers or other interested parties may decide to challenge our tariff rates and any related proration rules.
Pipeline Safety
Our assets are subject to increasingly strict safety laws and regulations. The transportation and storage of crude oil and products involve a risk that hazardous liquids may be released into the environment, potentially causing harm to the public or the environment. In turn, such incidents may result in substantial expenditures for response actions, significant government penalties, liability to government agencies for natural resources damages and significant business interruption. The U.S. Department of Transportation (“DOT”) has adopted safety regulations with respect to the design, construction, operation, maintenance, inspection and management of our assets. These regulations contain requirements for the development and implementation of pipeline integrity management programs, which include the inspection and testing of pipelines and the correction of anomalies. These regulations also require that pipeline operation and maintenance personnel meet certain qualifications and that pipeline operators develop comprehensive spill response plans.
We are subject to regulation by the DOT under the Hazardous Liquid Pipeline Safety Act of 1979, also known as the HLPSA. The HLPSA delegated to the DOT the authority to develop, prescribe and enforce minimum federal safety standards for the transportation of hazardous liquids by pipeline. Congress also enacted the Pipeline Safety Act of 1992, also known as the PSA, which added the environment to the list of statutory factors that must be considered in establishing safety standards for hazardous liquid pipelines, required regulations be issued to define the term “gathering line” and establish safety standards for certain “regulated gathering lines,” and mandated that regulations be issued to establish criteria for operators to use in identifying and inspecting pipelines located in High Consequence Areas (“HCAs”), defined as those areas that are unusually sensitive to environmental damage, that cross a navigable waterway, or that have a high population density. In 1996, Congress enacted the Accountable Pipeline Safety and Partnership Act, also known as the APSPA, which limited the operator identification requirement mandate to pipelines that cross a waterway where a substantial likelihood of commercial navigation exists, required that certain areas where a pipeline rupture would likely cause permanent or long-term environmental damage be considered in determining whether an area is unusually sensitive to environmental damage, and mandated that regulations be issued for the qualification and testing of certain pipeline personnel. In the Pipeline Inspection, Protection, Enforcement, and Safety Act of 2006, also known as the PIPES Act, Congress required mandatory inspections for certain U.S. crude oil and natural gas transmission pipelines in HCAs and mandated that regulations be issued for low-stress hazardous liquid pipelines and pipeline control room management. We are also subject to the Pipeline Safety, Regulatory Certainty and Job Creation Act of 2011, which reauthorized funding for federal pipeline safety programs through 2015, increased penalties for safety violations, established additional safety requirements for newly constructed pipelines and required studies of certain safety issues that could result in the adoption of new regulatory requirements for existing pipelines.
24
The DOT has delegated its authority under these statutes to the Pipeline and Hazardous Materials Safety Administration (“PHMSA”), which administers compliance with these statutes and has promulgated comprehensive safety standards and regulations for the transportation of hazardous liquid by pipeline, including regulations for the design and construction of new pipeline systems or those that have been relocated, replaced or otherwise changed (Subparts C and D of 49, Code of Federal Regulations (“CFR”) Part 195); pressure testing of new pipelines (Subpart E of 49 CFR Part 195); operation and maintenance of pipeline systems, including inspecting and reburying pipelines in the Gulf of Mexico and its inlets, establishing programs for public awareness and damage prevention, managing the integrity of pipelines in HCAs and managing the operation of pipeline control rooms (Subpart F of 49 CFR Part 195); protecting steel pipelines from the adverse effects of internal and external corrosion (Subpart H of 49 CFR Part 195); and integrity management requirements for pipelines in HCAs (49 CFR 195.452). In addition, on October 18, 2010, PHMSA issued an advance notice of proposed rulemaking on a range of topics relating to the safety of crude oil and other hazardous liquids pipelines. Among other items, the advance notice of proposed rulemaking requested comment on whether to extend regulation to certain pipelines currently exempt from federal safety regulations; whether to extend integrity management regulations to additional pipelines or to include additional pipelines in high consequence areas; and whether to require emergency flow-restricting devices and revise valve spacing requirements for new or existing pipelines. PHMSA has not yet taken further action on the issues raised in the advance notice of proposed rulemaking. We do not anticipate that we would be impacted by these regulatory initiatives to any greater degree than other similarly-situated competitors.
We monitor the structural integrity of our pipelines through a program of periodic internal assessments using high resolution internal inspection tools, as well as hydrostatic testing and direct assessment, that conforms to federal standards. We accompany these assessments with a review of the data and repair anomalies, as required, to ensure the integrity of the pipeline. We then utilize sophisticated risk algorithms and a comprehensive data integration effort to ensure that the highest risk pipelines receive the highest priority for scheduling subsequent integrity assessments. We use external coatings and impressed current cathodic protection systems to protect against external corrosion. We conduct all cathodic protection work in accordance with National Association of Corrosion Engineers standards. We continually monitor, test and record the effectiveness of these corrosion inhibiting systems.
Product Quality Standards
Refined products and other hydrocarbon-based products that we transport are generally sold by our customers for consumption by the public. Various federal, state and local agencies have the authority to prescribe product quality specifications for products. Changes in product quality specifications or blending requirements could reduce our throughput volumes, require us to incur additional handling costs or require capital expenditures. For example, different product specifications for different markets affect the fungibility of the products in our system and could require the construction of additional storage. In addition, changes in the product quality of the products we receive on our product pipeline systems could reduce or eliminate our ability to blend products.
Security
Three of our facilities have been preliminarily classified as subject to the Department of Homeland Security Chemical Facility Anti-Terrorism Standards (“CFATS”). In addition, we have two facilities that are subject to the United States Coast Guard’s Maritime Transportation Security Act (“MTSA”), and a number of other facilities that are subject to the Transportation Security Administration’s Pipeline Security Guidelines and are designated as “Critical Facilities.” The Transportation Security Administration Security Guidelines are subject to change without formal regulatory proposal and review. We have an internal inspection program designed to monitor and ensure compliance with all of these requirements. We believe that we are in material compliance with all applicable laws and regulations regarding the security of our facilities.
25
ENVIRONMENTAL REGULATION
General
Our operations are subject to extensive and frequently-changing federal, state and local laws, regulations and ordinances relating to the protection of the environment. Among other things, these laws and regulations govern the emission or discharge of pollutants into or onto the land, air and water, the handling and disposal of solid and hazardous wastes and the remediation of contamination. As with the industry generally, compliance with existing and anticipated environmental laws and regulations increases our overall cost of business, including our capital costs to construct, maintain, operate and upgrade equipment and facilities. While these laws and regulations affect our maintenance capital expenditures and net income, we believe they do not affect our competitive position, as the operations of our competitors are similarly affected. We believe our facilities are in substantial compliance with applicable environmental laws and regulations. However, these laws and regulations are subject to changes, or to changes in the interpretation of such laws and regulations, by regulatory authorities, and continued and future compliance with such laws and regulations may require us to incur significant expenditures. Additionally, violation of environmental laws, regulations and permits can result in the imposition of significant administrative, civil and criminal penalties, injunctions limiting our operations, investigatory or remedial liabilities or construction bans or delays in the construction of additional facilities or equipment. Additionally, a release of hydrocarbons or hazardous substances into the environment could, to the extent the event is not insured, subject us to substantial expenses, including costs to comply with applicable laws and regulations and to resolve claims by third parties for personal injury or property damage, or by the U.S. federal government or state governments for natural resources damages. These impacts could directly and indirectly affect our business. We cannot currently determine the amounts of such future impacts.
Please read Item 7. Management’s Discussion and Analysis of Financial Condition and Results of Operations – Environmental Matters and Compliance Costs for information on our historical and estimated future environmental expenditures, which is incorporated herein by reference.
Under the omnibus agreement, MPC has agreed to indemnify us for all known and certain unknown environmental liabilities that are associated with the ownership or operation of our assets and due to occurrences on or before the closing of the Offering. Indemnification for any unknown environmental liabilities will be limited to liabilities due to occurrences on or before the closing of the Offering and identified prior to the fifth anniversary of the closing of the Offering, and will be subject to an aggregate deductible of $500,000 before we are entitled to indemnification for losses incurred. Any other liabilities for which MPC has agreed to indemnify us are not subject to a deductible before we are entitled to indemnification. There is no limit on the amount for which MPC has agreed to indemnify us under the omnibus agreement once we meet the deductible, if applicable. Neither we nor our general partner have any contractual obligation to investigate or identify any such unknown environmental liabilities. We have agreed to indemnify MPC for events and conditions associated with the ownership or operation of our assets due to occurrences after the closing of the Offering and for environmental liabilities related to our assets to the extent MPC is not required to indemnify us for such liabilities. Pipe Line Holdings has agreed to indemnify MPC for events and conditions associated with the operations of the Pipe Line Holdings assets that occur after the closing of the Offering. Liabilities for which we and Pipe Line Holdings have agreed to indemnify MPC pursuant to the omnibus agreement are not subject to a deductible before MPC is entitled to indemnification. There is no limit on the amount for which we or Pipe Line Holdings has agreed to indemnify MPC under the omnibus agreement.
Air Emissions and Climate Change
Our operations are subject to the Clean Air Act and its regulations and comparable state and local statutes and regulations in connection with air emissions from our operations. Under these laws, permits may be required before construction can commence on a new source of potentially significant air emissions, and operating permits may be required for sources that are already constructed. These permits may require controls on our air emission sources, and we may become subject to more stringent regulations requiring the installation of additional emission control technologies.
Future expenditures may be required to comply with the Clean Air Act and other federal, state and local requirements for our various sites, including our pipeline and storage facilities. The impact of future legislative and regulatory developments, if enacted or adopted, could result in increased compliance costs and additional operating restrictions on our business.
These air emissions requirements also affect MPC’s refineries from which we receive substantially all of our revenues. MPC has been required in the past, and will be required in the future, to incur significant capital expenditures to comply with new legislative and regulatory requirements relating to its operations. To the extent these capital expenditures have a material effect on MPC, they could have a material effect on our business and results of operations.
26
In December 2007, Congress passed the Energy Independence and Security Act that created a second Renewable Fuels Standard (“RFS2”). This standard requires the total volume of renewable transportation fuels (including ethanol and advanced biofuels) sold or introduced annually in the U.S. to reach 16.55 billion gallons in 2013 and rise to 36.0 billion gallons by 2022. The requirements could reduce future demand for petroleum products and thereby have an indirect effect on certain aspects of our business.
Currently, various legislative and regulatory measures to address greenhouse gas emissions (including carbon dioxide, methane and other gases) are in various phases of discussion or implementation. These include requirements effective in January 2010 to report emissions of greenhouse gases to the U.S. Environmental Protection Agency (“EPA”) beginning in 2011, and state actions to develop statewide or regional programs, which require or could require reductions in our greenhouse gas emissions or those of MPC. Requiring reductions in greenhouse gas emissions could result in increased costs to (i) operate and maintain our facilities, (ii) install new emission controls at our facilities and (iii) administer and manage any greenhouse gas emissions programs, including acquiring emission credits or allotments. These requirements may also significantly affect MPC's refinery operations and may have an indirect effect on our business, financial condition and results of operations. At this time, none of our facilities have triggered permitting requirements for greenhouse gas emissions under the New Source Review/Prevention of Significant Deterioration and/or Title V programs of the Clean Air Act. Legal challenges were filed against these EPA actions. The D.C. Circuit Court of Appeals overruled these challenges. In response, several parties sought further review by the U.S. Supreme Court, which granted the parties’ request and heard oral arguments on the challenges in February 2014, with an expected decision by mid-2014. Additionally, refinery-specific New Source Performance Standards for greenhouse gases may be proposed at some time in the future.
In 2013, the Obama administration developed the “social cost of carbon” (“SCC”). The SCC is an estimate to be used by the EPA and other federal agencies in regulatory cost-benefit analyses to take into account alleged broad economic consequences associated with changes in emissions of greenhouse gases. The SCC estimate was first issued in 2010. In 2013, the Obama administration significantly increased the estimate to $36 per ton. In response to critiques of how the SCC was developed, the Office of Management and Budget recently announced an opportunity to comment on the SCC. While the impact of a higher SCC in future regulations is not known at this time, it may result in increased costs to our operations.
In addition, the EPA has proposed and may adopt further regulations under the Clean Air Act addressing greenhouse gases, to which some of our facilities may become subject. Congress may again consider legislation on greenhouse gas emissions, although the ultimate adoption and form of any federal legislation cannot presently be predicted. The impact of future regulatory and legislative developments, if adopted or enacted, including any cap-and-trade or a carbon tax program, is likely to result in increased compliance costs, increased utility costs, additional operating restrictions on our business and an increase in the cost of products generally. Although such costs may impact our business directly or indirectly by impacting MPC’s facilities or operations, the extent and magnitude of that impact cannot be reliably or accurately estimated due to the present uncertainty regarding the additional measures and how they will be implemented.
Waste Management and Related Liabilities
To a large extent, the environmental laws and regulations affecting our operations relate to the release of hazardous substances or solid wastes into soils, groundwater and surface water, and include measures to control pollution of the environment. These laws generally regulate the generation, storage, treatment, transportation and disposal of solid and hazardous waste. They also require corrective action, including investigation and remediation, at a facility where such waste may have been released or disposed.
27
Comprehensive Environmental Response, Compensation, and Liability Act (“CERCLA”).
CERCLA which is also known as Superfund, and comparable state laws impose liability, without regard to fault or to the legality of the original conduct, on certain classes of persons that contributed to the release of a “hazardous substance” into the environment. These persons include the former and present owner or operator of the site where the release occurred and the transporters and generators of the hazardous substances found at the site. Under CERCLA, these persons may be subject to joint and several liability for the costs of cleaning up the hazardous substances that have been released into the environment, for damages to natural resources and for the costs of certain health studies. CERCLA also authorizes the EPA and, in some instances, third parties to act in response to threats to the public health or the environment and to seek to recover from the responsible classes of persons the costs they incur. It is not uncommon for neighboring landowners and other third parties to file claims for personal injury and property damage allegedly caused by hazardous substances or other pollutants released into the environment. In the course of our ordinary operations, we generate waste that falls within CERCLA’s definition of a “hazardous substance” and, as a result, may be jointly and severally liable under CERCLA for all or part of the costs required to clean up sites. Costs for these remedial actions, if any, as well as any related claims are all covered by an indemnity from MPC to the extent occurring or existing before the closing of the Offering. Pursuant to our omnibus agreement, MPC has and will continue to fund all of the costs for our known historical and legacy spills and releases, including all of the expected future costs.
Resource Conservation and Recovery Act (“RCRA”).
We also generate solid wastes, including hazardous wastes, that are subject to the requirements of the federal RCRA and comparable state statutes. From time to time, the EPA considers the adoption of stricter disposal standards for non-hazardous wastes. Hazardous wastes are subject to more rigorous and costly disposal requirements than are non-hazardous wastes. Any changes in the regulations could increase our maintenance capital expenditures and operating expenses. We continue to seek methods to minimize the generation of hazardous wastes in our operations.
Hydrocarbon Wastes
. We currently own and lease, and MPC has in the past owned and leased, properties where hydrocarbons are being or have been handled for many years. Although we have utilized operating and disposal practices that were standard in the industry at the time, hydrocarbons or other waste may have been disposed of or released on or under the properties owned or leased by us or on or under other locations where these wastes have been taken for disposal. In addition, many of these properties have been operated by third parties whose treatment and disposal or release of hydrocarbons or other wastes was not under our control. These properties and wastes disposed thereon may be subject to CERCLA, RCRA and analogous state laws. Under these laws, we could be required to remove or remediate previously disposed wastes (including wastes disposed of or released by prior owners or operators), to clean up contaminated property (including contaminated groundwater), or to perform remedial operations to prevent further contamination.
Water
Our operations can result in the discharge of pollutants, including crude oil and products. Regulations under the Water Pollution Control Act of 1972 (“Clean Water Act”), Oil Pollution Act of 1990 (“OPA-90”) and state laws impose regulatory burdens on our operations. Spill prevention control and countermeasure requirements of federal laws and some state laws require containment to mitigate or prevent contamination of navigable waters in the event of an oil overflow, rupture or leak. For example, the Clean Water Act requires us to maintain Spill Prevention Control and Countermeasure (“SPCC”) plans at many of our facilities. We maintain numerous discharge permits for facilities and vessels as required under the National Pollutant Discharge Elimination System program of the Clean Water Act and have implemented systems to oversee our compliance efforts.
In addition, the transportation and storage of crude oil and products over and adjacent to water involves risk and subjects us to the provisions of OPA-90 and related state requirements. Among other requirements, OPA-90 requires the owner or operator of a tank vessel, a facility or a pipeline to maintain an emergency plan to respond to releases of oil or hazardous substances. Also, in case of any such release, OPA-90 requires the responsible company to pay resulting removal costs and damages. OPA-90 also provides for civil penalties and imposes criminal sanctions for violations of its provisions. We operate facilities at which releases of oil and hazardous substances could occur. We have implemented emergency oil response plans for all of our components and facilities covered by OPA-90 and we have established SPCC plans for facilities subject to Clean Water Act SPCC requirements.
Construction or maintenance of our pipelines, barge dock and storage facilities may impact wetlands, which are also regulated under the Clean Water Act by the EPA, the United States Army Corps of Engineers and state water quality agencies. Regulatory requirements governing wetlands (including associated mitigation projects) may result in the delay of our pipeline projects while we obtain necessary permits and may increase the cost of new projects and maintenance activities.
28
Employee Safety
The affiliates of our general partner that provide employees to conduct services for us are subject to the requirements of the Occupational Safety and Health Act (“OSHA”) and comparable state statutes that regulate the protection of the health and safety of workers. In addition, the OSHA hazard communication standard requires that information be maintained about hazardous materials used or produced in operations and that this information be provided to employees, state and local government authorities and citizens. We believe that our operations are in substantial compliance with OSHA requirements, including general industry standards, record keeping requirements and monitoring of occupational exposure to regulated substances.
Endangered Species Act
The Endangered Species Act restricts activities that may affect endangered species or their habitats. While some of our facilities are in areas that may be designated as habitat for endangered species, we believe that we are in substantial compliance with the Endangered Species Act. However, the discovery of previously unidentified endangered species could cause us to incur additional costs or become subject to operating restrictions or bans in the affected area.
Hazardous Materials Transportation Requirements
The DOT regulations affecting pipeline safety require pipeline operators to implement measures designed to reduce the environmental impact of crude oil and product discharge from onshore crude oil and product pipelines. These regulations require operators to maintain comprehensive spill response plans, including extensive spill response training for pipeline personnel. In addition, the DOT regulations contain detailed specifications for pipeline operation and maintenance. We believe our operations are in substantial compliance with these regulations. The DOT also has a pipeline integrity management rule, with which we are in substantial compliance.
EMPLOYEES
We are managed and operated by the board of directors and executive officers of MPLX GP LLC, our general partner. Neither we nor our subsidiaries have any employees. Our general partner has the sole responsibility for providing the employees and other personnel necessary to conduct our operations. All of the employees that conduct our business are employed by affiliates of our general partner. Our general partner and its affiliates had approximately 670 full-time employees that provided services to us under our employee services agreements as of
December 31, 2013
. We believe that our general partner and its affiliates have a satisfactory relationship with those employees. In connection with the Offering, employees of MPL were transferred to Marathon Petroleum Logistics Services LLC, a wholly-owned subsidiary of MPC. Under our omnibus agreement, Marathon Petroleum Logistics Services LLC has agreed to indemnify us for any liabilities incurred by us in connection with the transfer of such employees.
AVAILABLE INFORMATION
General information about MPLX LP and our general partner, MPLX GP LLC, including Governance Principles, Audit Committee Charter, Conflicts Committee Charter and Certificate of Limited Partnership, can be found at http://www.mplx.com. In addition, our Code of Business Conduct and Code of Ethics for Senior Financial Officers are available in this same location.
MPLX LP uses its website, www.mplx.com, as a channel for routine distribution of important information, including news releases, analyst presentations and financial information. Our Annual Report on Form 10-K, Quarterly Reports on Form 10-Q and Current Reports on Form 8-K, as well as any amendments and exhibits to those reports, are available free of charge through our website as soon as reasonably practicable after the reports are filed or furnished with the Securities and Exchange Commission (“SEC”). These documents are also available in hard copy, free of charge, by contacting our Investor Relations office. In addition, our website allows investors and other interested persons to sign up to automatically receive email alerts when we post news releases and financial information on our website. Information contained on our website is not incorporated into this Annual Report on Form 10-K or other securities filings.
29
You should carefully consider each of the following risks and all of the other information contained in this Annual Report on Form 10-K in evaluating us and our common units. Some of these risks relate principally to our business, the business and operations of MPC and the industry in which we operate, while others relate principally to tax matters, and ownership of our common units and securities markets generally.
Our business, financial condition, results of operations or cash flows could be materially and adversely affected by these risks, and, as a result, the trading price of our common units could decline.
Risks Relating to Our Business
We may not have sufficient cash from operations following the establishment of cash reserves and payment of fees and expenses, including cost reimbursements to our general partner and its affiliates, to enable us to pay the minimum quarterly distribution to our unitholders.
We may not have sufficient available cash from operating surplus each quarter to enable us to pay the minimum quarterly distribution to our unitholders. The amount of cash we can distribute on our units principally depends upon the amount of cash we generate, which will fluctuate from quarter to quarter based on, among other things:
|
•
|
the volume of crude oil, refined products and other hydrocarbon-based products we transport;
|
|
•
|
the tariff rates with respect to volumes that we transport; and
|
|
•
|
prevailing economic conditions.
|
In addition, the actual amount of cash we will have available for distribution will also depend on other factors, some of which are beyond our control, including:
|
•
|
the amount of our operating expenses and general and administrative expenses, including reimbursements to MPC in respect of those expenses;
|
|
•
|
the application by MPC of any remaining credit amounts to any volumes shipped on our pipeline systems after the expiration or termination of our transportation services agreements;
|
|
•
|
the level of capital expenditures we make;
|
|
•
|
the cost of acquisitions, if any;
|
|
•
|
our debt service requirements and other liabilities;
|
|
•
|
fluctuations in our working capital needs;
|
|
•
|
our ability to borrow funds and access capital markets;
|
|
•
|
restrictions contained in our revolving credit facility and other agreements governing our debt;
|
|
•
|
the amount of cash reserves established by our general partner; and
|
|
•
|
other business risks affecting our cash levels.
|
Additionally, the amount of cash we have available for distribution depends primarily upon our cash flow and not solely on profitability, which will be affected by non-cash items. As a result, we may make cash distributions during periods when we record net losses for financial accounting purposes, and we may not make cash distributions during periods when we record net income for financial accounting purposes.
If our tariffs are successfully challenged or adversely impacted by regulatory action, we could be required to reduce our tariff rates, which would reduce our revenues and our ability to make distributions to our unitholders.
MPC has agreed not to challenge, or to cause others to challenge or assist others in challenging, our tariff rates in effect during the term of our transportation services agreements with MPC. This agreement does not prevent other shippers or interested persons from challenging our tariff rates or proration rules; nor does it prevent regulators from reviewing our rates and tariffs on their own initiative. At the end of the term of each of our transportation services agreements, if the agreement is not renewed, MPC will be free to challenge, or to cause other parties to challenge or assist others in challenging, our tariffs in effect at that time.
A number of our pipelines provide interstate service that is subject to regulation by the FERC. The FERC prescribes rate methodologies for developing regulated tariff rates for interstate oil and products pipelines. The FERC’s regulated tariff may not allow us to recover all of our costs of providing services. Changes in the FERC’s approved rate methodologies, or challenges to our application of an approved methodology, could also adversely affect our rates. Additionally, shippers may protest (and the FERC may investigate) the lawfulness of tariff rates. The FERC can require refunds of amounts collected pursuant to rates that are ultimately found to be unlawful and prescribe new rates prospectively.
30
Our pipelines are common carriers and, as a consequence, we may be required to provide service to customers with credit and other performance characteristics with whom we would choose not to do business if permitted to do so. Certain of our pipelines provide intrastate service that is subject to regulation by the Illinois Commerce Commission and the Michigan Public Service Commission. These commissions could limit our ability to increase our rates or to set rates based on our costs or could order us to reduce our rates and could require the payment of refunds to shippers.
In sum, a successful shipper challenge or regulatory action impacting our rates could adversely affect our revenues, results of operations and financial condition.
Our operations and MPC’s refining operations are subject to many risks and operational hazards, some of which may result in business interruptions and shutdowns of our or MPC’s facilities and damages for which we may not be fully covered by insurance. If a significant accident or event occurs that results in business interruption or shutdown for which we are not adequately insured, our operations and financial results could be materially and adversely affected.
Our operations are subject to all of the risks and operational hazards inherent in transporting and storing crude oil and products, including:
|
•
|
damages to pipelines and facilities, related equipment and surrounding properties caused by earthquakes, tornados, hurricanes, floods, fires, severe weather, explosions and other natural disasters;
|
|
•
|
maintenance, repairs, mechanical or structural failures at our facilities or at third-party facilities on which our operations are dependent, including MPC’s facilities;
|
|
•
|
curtailments of operations due to severe seasonal weather;
|
|
•
|
inadvertent damage to pipelines from construction, farm and utility equipment; and
|
|
•
|
other hazards.
|
These risks could result in substantial losses due to personal injury and/or loss of life, severe damage to and destruction of property and equipment and pollution or other environmental damage, as well as business interruptions or shutdowns of our facilities. Any such event or unplanned shutdown could have a material adverse effect on our business, financial condition and results of operations. In addition, MPC’s refining operations, on which our operations are substantially dependent, are subject to similar operational hazards and risks inherent in refining crude oil. A serious accident at our facilities or at MPC’s facilities could result in serious injury or death to our contractors or the employees or contractors of MPC or its affiliates and could expose us to significant liability for personal injury claims and reputational risk. We have no control over the operations at MPC’s refineries and their associated facilities.
We do not maintain insurance coverage against all potential losses and could suffer losses for uninsurable or uninsured risks or in amounts in excess of existing insurance coverage. We carry separate policies for certain property, business interruption and pollution liabilities and are also insured under certain of MPC’s liability policies and are subject to MPC’s policy limits under these policies. The occurrence of an event that is not fully covered by insurance or failure by one or more insurers to honor its coverage commitments for an insured event could have a material and adverse effect on our business, financial condition and results of operations.
We rely on the performance of information technology systems, the failure of which could have an adverse effect on our business and performance.
We are heavily dependent on information technology systems and network infrastructure and maintain and rely upon certain critical information systems for the effective operation of our business. These information systems include data network and telecommunications, internet access and our websites, and various computer hardware equipment and software applications, including those that are critical to the safe operation of our business. These systems and infrastructure are subject to damage or interruption from a number of potential sources including natural disasters, software viruses or other malware, power failures, cyber-attacks and other events. We also face various other cyber-security threats, including threats to gain unauthorized access to sensitive information or to render data or systems unusable. To protect against such attempts of unauthorized access or attack, we have implemented infrastructure protection technologies and disaster recovery plans. There can be no guarantee such plans, to the extent they are in place, will be totally effective.
31
We may be unable to make acquisitions on economically acceptable terms from MPC or third parties, or if completed, our expansion of existing assets and construction of new assets may not result in revenue increases, which could adversely affect our operations and financial condition.
A portion of our strategy to grow our business and increase distributions to unitholders is dependent on our ability to make acquisitions that result in an increase in distributable cash flow per unit. The acquisition component of our growth strategy is based, in large part, on our expectation of ongoing divestitures of transportation and storage assets by industry participants, including MPC. A material decrease in such divestitures would limit our opportunities for future acquisitions and could adversely affect our ability to grow our operations and increase cash distributions to our unitholders. If we are unable to make acquisitions from MPC or third parties, because we are unable to identify attractive acquisition candidates or negotiate acceptable purchase contracts, we are unable to obtain financing for these acquisitions on economically acceptable terms or we are outbid by competitors, our future growth and ability to increase distributions will be limited. Furthermore, even if we do consummate acquisitions that we believe will be accretive, they may in fact result in a decrease in distributable cash flow per unit as a result of incorrect assumptions in our evaluation of such acquisitions or unforeseen consequences or other external events beyond our control.
Additionally, a portion of our strategy to grow and increase distributions to unitholders is dependent on our ability to expand existing assets and to construct additional assets. The construction of a new pipeline or the extension or expansion of an existing pipeline, such as by adding horsepower or pump stations, involves numerous regulatory, environmental, political and legal uncertainties, most of which are beyond our control. If we undertake these projects, they may not be completed on schedule or at all or at the budgeted cost. Moreover, we may not receive sufficient long-term contractual commitments from customers to provide the revenue needed to support such projects and we may be unable to negotiate acceptable interconnection agreements with third-party pipelines to provide destinations for increased throughput. Even if we receive such commitments or make such interconnections, we may not realize an increase in revenue for an extended period of time. For instance, if we build a new pipeline, the construction will occur over an extended period of time, and we will not receive any material increases in revenues until after completion of the project. As a result, new facilities may not be able to attract enough throughput to achieve our expected investment return, which could materially and adversely affect our results of operations and financial condition and our ability in the future to make distributions to our unitholders.
We do not own all of the land on which our pipelines are located, which could result in disruptions to our operations.
We do not own all of the land on which our pipelines are located, and therefore, we are subject to the possibility of more onerous terms and increased costs to retain necessary land use if we do not have valid leases or rights-of-way or if such rights-of-way lapse or terminate. We obtain the rights to construct and operate our pipelines on land owned by third parties and governmental agencies, and some of our agreements may grant us those rights for only a specific period of time. Our loss of these rights, through our inability to renew right-of-way contracts or otherwise, could have a material adverse effect on our business, results of operations, financial condition and ability to make cash distributions to our unitholders.
Debt we incur in the future and restrictions in our revolving credit facility may limit our flexibility to obtain financing and could adversely affect our business, financial condition, results of operations, ability to make cash distributions to our unitholders and the value of our units.
Our future level of debt could have important consequences to us, including the following:
|
•
|
our ability to obtain additional financing, if necessary, for working capital, capital expenditures, acquisitions or other purposes may be impaired, or such financing may not be available on favorable terms;
|
|
•
|
our funds available for operations, future business opportunities and distributions to unitholders will be reduced by that portion of our cash flow required to make interest payments on our debt;
|
|
•
|
we may be more vulnerable to competitive pressures or a downturn in our business or the economy generally; and
|
|
•
|
our flexibility in responding to changing business and economic conditions may be limited.
|
Our ability to service our debt will depend upon, among other things, our future financial and operating performance, which will be affected by prevailing economic conditions and financial, business, regulatory and other factors, some of which are beyond our control. If our operating results are not sufficient to service any future indebtedness, we will be forced to take actions such as reducing distributions, reducing or delaying our business activities, investments or capital expenditures, selling assets or issuing equity, which could materially and adversely affect our financial condition, results of operations, cash flows and ability to make distributions to unitholders, as well as the trading price of our common units. We may not be able to affect any of these actions on satisfactory terms or at all.
32
We are dependent upon the earnings and cash flows generated by our operations in order to meet our debt service obligations and to allow us to make cash distributions to our unitholders. The operating and financial restrictions and covenants in our revolving credit facility and any future financing agreements could restrict our ability to finance our future operations or capital needs or to expand or pursue our business activities, which may, in turn, limit our ability to make cash distributions to our unitholders.
The provisions of our revolving credit facility may affect our ability to obtain future financing and pursue attractive business opportunities and our flexibility in planning for, and reacting to, changes in business conditions. In addition, a failure to comply with the provisions of our revolving credit facility could result in an event of default which would enable our lenders to declare the outstanding principal of that debt, together with accrued interest, to be immediately due and payable. If the payment of our debt is accelerated, defaults under our other debt instruments, if any, may be triggered, and our assets may be insufficient to repay such debt in full, and the holders of our units could experience a partial or total loss of their investment.
Risks Relating to the Business and Operations of MPC
MPC accounts for the substantial majority of our revenues. If MPC changes its business strategy, is unable to satisfy its obligations to us or significantly reduces the volumes transported through our pipelines or stored at our storage assets, our revenues would decline and our financial condition, results of operations, cash flows, and ability to make distributions to our unitholders would be materially and adversely affected.
For the year ended December 31, 2013, excluding revenues attributable to volumes shipped by MPC under joint tariffs with third parties that were treated as third party revenues for accounting purposes, MPC accounted for approximately
82.6 percent
of our revenues and other income. As we expect to continue to derive the substantial majority of our revenues from MPC for the foreseeable future, any event, whether in our areas of operation or elsewhere, that materially and adversely affects MPC’s financial condition, results of operations or cash flows may adversely affect our ability to sustain or increase cash distributions to our unitholders. Accordingly, we are indirectly subject to the operational and business decisions and risks of MPC, the most significant of which include the following:
|
•
|
the timing and extent of changes in commodity prices and demand for MPC’s products, and the availability and costs of crude oil and other refinery feedstocks;
|
|
•
|
a material decrease in the refining margins at MPC's refineries;
|
|
•
|
the risk of contract cancellation, non-renewal or failure to perform by MPC’s customers, and MPC’s inability to replace such contracts and/or customers;
|
|
•
|
disruptions due to equipment interruption or failure at MPC’s facilities or at third-party facilities on which MPC’s business is dependent;
|
|
•
|
any decision by MPC to temporarily or permanently curtail or shut down operations at one or more of its refineries or other facilities and reduce or terminate its obligations under our transportation and storage services agreements;
|
|
•
|
changes to the routing of volumes shipped by MPC on our crude oil and product pipeline systems or the ability of MPC to utilize third-party pipeline connections to access our pipeline systems;
|
|
•
|
MPC’s ability to remain in compliance with the terms of its outstanding indebtedness;
|
|
•
|
changes in the cost or availability of third-party pipelines, terminals and other means of delivering and transporting crude oil, feedstocks, refined products and other hydrocarbon-based products;
|
|
•
|
state and federal environmental, economic, health and safety, energy and other policies and regulations, and any changes in those policies and regulations;
|
|
•
|
environmental incidents and violations and related remediation costs, fines and other liabilities;
|
|
•
|
operational hazards and other incidents at MPC’s refineries and other facilities, such as explosions and fires, that result in temporary or permanent shut downs of those refineries and facilities;
|
|
•
|
changes in crude oil and product inventory levels and carrying costs; and
|
|
•
|
disruptions due to hurricanes, tornadoes or other forces of nature.
|
Additionally, MPC continually considers opportunities presented by third parties with respect to its assets. These opportunities may include offers to purchase and joint venture propositions. MPC may also change its operations by constructing new facilities, suspending or reducing certain operations, modifying or closing facilities or terminating operations. MPC actively manages its assets and operations, and, therefore, changes of some nature, possibly material to its business relationship with us, are likely to occur at some point in the future.
We have no control over MPC’s business decisions and operations, and MPC may elect to pursue a business strategy that does not favor us and our business.
33
MPC may suspend, reduce or terminate its obligations under our transportation and storage services agreements in some circumstances, which would have a material adverse effect on our financial condition, results of operations, cash flows and ability to make distributions to our unitholders.
Our transportation and storage services agreements with MPC include provisions that permit MPC to suspend, reduce or terminate its obligations under the applicable agreement if certain events occur. These events include a material breach of the applicable agreement by us, MPC being prevented from transporting its full minimum volume commitment because of capacity constraints on our pipelines, certain force majeure events that would prevent us from performing some or all of the required services under the applicable agreement and MPC’s determination to suspend refining operations at one of its refineries. MPC has the discretion to make such decisions notwithstanding the fact that they may significantly and adversely affect us. These actions could result in a suspension, reduction or termination of MPC’s obligations under one or more transportation and storage services agreements.
Any such reduction, suspension or termination of MPC’s obligations would have a material adverse effect on our financial condition, results of operations, cash flows and ability to make distributions to our unitholders.
If MPC satisfies only its minimum obligations under, or if we are unable to renew or extend, the transportation and storage services agreements we have with MPC, or if MPC elects to use credits upon the expiration or termination of a transportation services agreement, our ability to make distributions to our unitholders will be materially and adversely affected.
MPC is not obligated to use our services with respect to volumes of crude oil or products in excess of the minimum volume commitments under the transportation services agreements with us. Our ability to make the minimum quarterly distribution on all outstanding units will be materially and adversely affected to the extent that we do not transport volumes in excess of the minimum volume commitments under our transportation services agreements or if MPC’s obligations under our transportation and storage services agreements are suspended, reduced or terminated. In addition, the initial terms of MPC’s obligations under those agreements range from three to 10 years. If MPC fails to use our assets and services after expiration of those agreements and we are unable to generate additional revenues from third parties, our ability to make distributions to unitholders may be materially and adversely affected.
In addition, under our transportation services agreements, MPC must pay us a deficiency payment if it fails to transport its minimum throughput commitment. MPC may then apply the amount of any such deficiency payments as a credit for volumes transported on the applicable pipeline system in excess of its minimum volume commitment during the following four quarters or eight quarters under the terms of the applicable transportation services agreement. However, upon the expiration or termination of a transportation services agreement, MPC may use any remaining credits against any volumes shipped by MPC on the applicable pipeline system for the succeeding four or eight quarters, as applicable, without regard to any minimum volume commitment that may have been in place during the term of the agreement. If that were to occur, we would not receive any cash payments for volumes shipped on the applicable pipeline system until any such remaining credits were fully used or until the expiration of the applicable four or eight quarter-period.
MPC’s level of indebtedness, the terms of its borrowings and its credit ratings could adversely affect our ability to grow our business and our ability to make cash distributions to our unitholders. Our ability to obtain credit in the future may also be adversely affected by MPC’s credit rating.
MPC must devote a portion of its cash flows from operating activities to service its indebtedness, and therefore, cash flows may not be available for use in pursuing its growth strategy. Furthermore, a higher level of indebtedness at MPC in the future increases the risk that it may default on its obligations to us under our transportation and storage services agreements. As of December 31, 2013, MPC had long-term indebtedness of approximately $3.4 billion. The covenants contained in the agreements governing MPC’s outstanding and future indebtedness may limit its ability to borrow additional funds for development and make certain investments and may directly or indirectly impact our operations in a similar manner. Furthermore, if MPC were to default under certain of its debt obligations, there is a risk that MPC’s creditors would attempt to assert claims against our assets during the litigation of their claims against MPC. The defense of any such claims could be costly and could materially impact our financial condition, even absent any adverse determination. If these claims were successful, our ability to meet our obligations to our creditors, make distributions and finance our operations could be materially and adversely affected.
34
MPC’s long-term credit ratings are currently investment grade. If these ratings are lowered in the future, the interest rate and fees MPC pays on its credit facilities may increase. In addition, although we do not have any indebtedness rated by any credit rating agency, we may have rated debt in the future. Credit rating agencies will likely consider MPC’s debt ratings when assigning ours because of MPC’s ownership interest in us, the significant commercial relationships between MPC and us, and our reliance on MPC for the substantial majority of our revenues. If one or more credit rating agencies were to downgrade the outstanding indebtedness of MPC, we could experience an increase in our borrowing costs or difficulty accessing the capital markets. Such a development could adversely affect our ability to grow our business and to make cash distributions to our unitholders.
Risks Relating to Our Industry
Our assets and operations are subject to federal, state, and local laws and regulations relating to environmental protection, pipeline integrity and safety that could require us to make substantial expenditures.
Our assets and operations involve the transportation of crude oil and products, which is subject to increasingly stringent federal, state, and local laws and regulations related to protection of the environment and pipeline integrity that require us to comply with various safety requirements regarding the design, installation, testing, construction, and operational management of our pipeline systems and storage facilities. These regulations have raised operating costs for the crude oil and products industry and compliance with such laws and regulations may cause us and MPC to incur potentially material capital expenditures associated with the construction, maintenance, and upgrading of equipment and facilities. Environmental laws and regulations, in particular, are subject to frequent change, and many of them have become and will continue to become more stringent.
Transportation of crude oil and products involves inherent risks of spills and releases from our facilities, and can subject us to various federal and state laws governing spills and releases, including reporting and remediation obligations. The costs associated with such obligations can be substantial, as can costs associated with related enforcement matters, including possible fines and penalties. Transportation of such products over water or proximate to navigable water bodies involves inherent risks (including risks of spills) and could subject us to the provisions of the Oil Pollution Act of 1990 (the “Oil Pollution Act”) and similar state environmental laws should a spill occur from our pipelines. Among other things, the Oil Pollution Act requires us to prepare a facility response plan identifying the personnel and equipment necessary to remove to the maximum extent practicable a “worst case discharge.” A few of our facilities are required to maintain such facility response plans. To meet this requirement, we and MPC have contracted with various spill response service companies in the areas in which we transport or store crude oil and products. While our plans are designed to mitigate environmental impacts, it may not protect us from all liability associated with the discharge of crude oil or products into navigable waters.
If a release event occurs or is discovered in the future, whether in connection with any of our pipelines or storage facilities, or any other facility to which we send or have sent wastes or by-products for treatment or disposal, we could be liable for all costs and penalties associated with the remediation of such facilities under federal, state and local environmental laws or common law. We may also be liable for personal injury or property damage claims from third parties alleging contamination from spills or releases from our facilities or operations. In addition, we will be subject to an aggregate deductible of $500,000 before we are entitled to indemnification from MPC for certain environmental liabilities under our omnibus agreement. Even if we are insured or indemnified against such risks, we may be responsible for costs or penalties to the extent our insurers or indemnitors do not fulfill their obligations to us. We could incur potentially significant additional expenses should we determine that any of our assets are not in compliance. Our failure to comply with these or any other environmental, pipeline integrity or safety-related regulations could result in the assessment of administrative, civil, or criminal penalties, the imposition of investigatory and remedial liabilities, and the issuance of injunctions that may subject us to additional operational constraints. Any such penalties or liability could have a material adverse effect on our business, financial condition or results of operations.
35
New and evolving environmental laws and regulations on climate change, hydraulic fracturing, fuel efficiency and renewable fuels could adversely affect our financial performance.
Potential additional regulations regarding climate change could affect our operations. Currently, various legislative and regulatory measures to address greenhouse gas emissions (including carbon dioxide, methane and other gases) are in various phases of review, discussion or implementation in the United States. These measures include EPA programs to control greenhouse gas emissions and state actions to develop statewide or regional programs, each of which could impose reductions in greenhouse gas emissions. These actions could result in increased (1) costs to operate and maintain our facilities, (2) capital expenditures to install new emission controls on our facilities and (3) costs to administer and manage any potential greenhouse gas emissions regulations or carbon trading or tax programs. In addition, in 2010, the EPA promulgated a rule establishing greenhouse gas emission standards for new-model passenger cars, light-duty trucks, and medium-duty passenger vehicles. Also in 2010, the EPA promulgated a rule establishing greenhouse gas emission thresholds for the permitting of certain stationary sources, which could require greenhouse gas emission controls for those sources. In 2013, the Obama administration also issued a “Climate Action Plan” that reaffirmed the administration’s goal of reducing greenhouse gas emissions 17% below 2005 levels by 2020 and also directed EPA to complete carbon pollution standards for both new and existing power plants. There was no specific mandate for refineries; however, we anticipate EPA will propose broad standards for refineries in 2014. These developments could have an indirect adverse effect on our business if MPC’s refinery operations are adversely affected due to increased regulation of MPC’s facilities or reduced demand for crude oil and refined products, and a direct adverse effect on our business from increased regulation of our facilities.
Hydraulic fracturing is an important and increasingly common practice that is used to stimulate production of crude oil and/or natural gas from dense subsurface rock formations. Typically regulated by state agencies, the EPA has asserted federal regulatory authority pursuant to the Safe Drinking Water Act, as amended (“SDWA”), over certain hydraulic fracturing activities involving the use of diesel fuel. In addition, legislation has been introduced from time to time in Congress to provide for federal regulation of hydraulic fracturing under the SDWA and to require disclosure of the chemicals used in the hydraulic fracturing process. At the state level, several states have already adopted laws and/or regulations that require disclosure of the chemicals used in hydraulic fracturing, and many states are considering legal requirements that could ban hydraulic fracturing or impose more stringent permitting, disclosure and well construction requirements on oil and/or natural gas drilling activities. The EPA is also moving forward with various related regulatory actions related to hydraulically-fractured wells and certain emission requirements for some midstream equipment. We do not believe these new regulations will have a direct effect on our operations, but because oil and/or natural gas production using hydraulic fracturing is growing rapidly in the United States, in the event that new or more stringent federal, state or local legal restrictions relating to such drilling activities or to the hydraulic fracturing process are adopted in areas where our shippers’ producer customers operate, those producers could incur potentially significant added costs to comply with such requirements and experience delays or curtailment in the pursuit of production or development activities, which could reduce demand for our transportation and logistics services.
Increases in fuel mileage standards and the increased use of renewable fuels could also decrease demand for refined products, which could have an indirect, but material and adverse effect on our business, financial condition and results of operations. For example, in 2007, Congress passed the Energy Independence and Security Act (“EISA”), which, among other things, sets a target of 35 miles per gallon for the combined fleet of cars and light trucks in the United States by model year 2020, and contains a second Renewable Fuel Standard commonly referred to as RFS2. In August 2012, the EPA and the National Highway Traffic Safety Administration jointly adopted regulations that establish average industry fleet fuel economy standards for passenger cars and light trucks of up to 41 miles per gallon by model year 2021 and of up to 49.7 miles per gallon by model year 2025 (the standards from 2022 to 2025 are the government’s current estimate but will require further rulemaking). The RFS2 presents production and logistics challenges for both the renewable fuels and petroleum refining industries. The RFS2 has required, and may in the future continue to require, additional capital expenditures or expenses by MPC to accommodate increased renewable fuels use. MPC may experience a decrease in demand for refined petroleum products due to an increase in combined fleet mileage or due to refined petroleum products being replaced by renewable fuels.
Terrorist attacks aimed at our facilities or that impact our customers or the markets we serve could adversely affect our business.
The U.S. government has issued warnings that energy assets in general, and the nation's pipeline and terminal infrastructure in particular, may be future targets of terrorist organizations. The threat of terrorist attacks has subjected our operations to increased risks. Any future terrorist attack on our facilities, those of our customers and, in some cases, those of other pipelines, could have a material adverse effect on our business. Similarly, any future terrorist attacks that severely disrupt the markets we serve could materially and adversely affect our results of operations, financial position and cash flows.
36
Increases in interest rates could adversely impact our unit price, our ability to issue equity or incur debt for acquisitions or other purposes, and our ability to make cash distributions at our intended levels.
Interest rates may increase in the future. As a result, interest rates on our debt could be higher than current levels, causing our financing costs to increase accordingly. In addition, we may in the future refinance outstanding borrowings under our revolving credit facility with fixed-term indebtedness. Interest rates payable on fixed-term indebtedness typically are higher than the short-term variable interest rates that we will pay on borrowings under our revolving credit facility. Furthermore, as with other yield-oriented securities, our unit price will be impacted by our cash distributions and the implied distribution yield. The distribution yield is often used by investors to compare and rank yield-oriented securities for investment decision-making purposes. Therefore, changes in interest rates, either positive or negative, may affect the yield requirements of investors who invest in our units, and a rising interest rate environment could have an adverse impact on our unit price and our ability to issue equity or incur debt for acquisitions or other purposes and to make cash distributions at our intended levels.
Risks Relating to Tax Matters
Our tax treatment depends on our status as a partnership for federal income tax purposes as well as our not being subject to a material amount of entity level taxation by individual states. If the Internal Revenue Service (“IRS”) were to treat us as a corporation for federal income tax purposes, or we become subject to a material amount of entity level taxation for state tax purposes, it would substantially reduce the amount of cash available for distribution to our unitholders.
The anticipated after-tax economic benefit of an investment in the common units depends largely on our being treated as a partnership for federal income tax purposes. We have not requested, and do not plan to request, a ruling from the IRS on this.
A publicly traded partnership such as us may be treated as a corporation for federal income tax purposes unless it satisfies a “qualifying income” requirement. Based on our current operations, we believe that we are treated as a partnership rather than as a corporation for such purposes; however, a change in our business or a change in current law could cause us to be treated as a corporation for federal income tax purposes. We have requested and received a favorable ruling from the IRS on the treatment of a portion of our “qualifying income”. The IRS may adopt positions that differ from the ones we take. A successful IRS contest of the federal income tax positions we take may impact adversely the market for our common units, and the costs of any IRS contest will reduce our cash available for distribution to unitholders.
If we were treated as a corporation for federal income tax purposes, we would pay federal income tax on our taxable income at the corporate tax rate, which is currently a maximum of 35.0 percent, and likely would pay state and local income tax at varying rates. Distributions to unitholders generally would be taxed again as corporate dividends, and no income, gains, losses, deductions, or credits would flow through to our unitholders. Treatment of us as a corporation would result in a material reduction in the anticipated cash flow and after-tax return to our unitholders, likely causing a substantial reduction in the value of our common units. Changes in current state law may subject us to additional entity-level taxation by individual states. Imposition of any such additional taxes on us will substantially reduce the cash available for distribution to unitholders.
Our partnership agreement provides that, if a law is enacted or an existing law is modified or interpreted in a manner that subjects us to taxation as a corporation or otherwise subjects us to entity-level taxation for federal, state or local income tax purposes, the minimum quarterly distribution amount and the target distribution amounts may be adjusted to reflect the impact of that law on us.
37
The sale or exchange of 50.0 percent or more of our capital and profits interests during any twelve-month period will result in the termination of our partnership for federal income tax purposes.
We will be considered to have technically terminated for federal income tax purposes if there is a sale or exchange of 50.0 percent or more of the total interests in our capital and profits within a twelve-month period. For purposes of determining whether the 50.0 percent threshold has been met, multiple sales of the same interest will be counted only once. Our technical termination would, among other things, result in the closing of our taxable year for all unitholders, which would result in us filing two tax returns (and our unitholders could receive two Schedules K-1) for one calendar year and could result in a significant deferral of depreciation deductions allowable in computing our taxable income. In the case of a unitholder reporting on a taxable year other than a calendar year, the closing of our taxable year may also result in more than twelve months of our taxable income or loss being includable in his taxable income for the year of termination. Our termination currently would not affect our classification as a partnership for federal income tax purposes, but it would result in our being treated as a new partnership for tax purposes. If we were treated as a new partnership, we would be required to make new tax elections and could be subject to penalties if we are unable to determine that a termination occurred. The IRS has announced a relief procedure whereby if a publicly traded partnership that has technically terminated requests and the IRS grants special relief, among other things, the partnership may be permitted to provide only a single Schedule K-1 to unitholders for the tax years in which the termination occurs.
If the IRS contests the federal income tax positions we take, the market for our common units may be adversely impacted and the cost of any IRS contest will reduce our cash available for distribution.
The IRS has made no determination as to our status as a partnership for federal income tax purposes. The IRS may adopt positions that differ from the positions we take. It may be necessary to resort to administrative or court proceedings to sustain some or all the positions we take. A court may not agree with some or all of the positions we take. Any contest with the IRS may materially and adversely impact the market for our common units and the price at which they trade. In addition, our costs of any contest with the IRS will be borne indirectly by our unitholders and our general partner because the costs will reduce our cash available for distribution.
Our unitholders will be required to pay taxes on their share of income even if they do not receive any cash distributions from us.
Because our unitholders will be treated as partners to whom we will allocate taxable income that could be different in amount than the cash we distribute, our unitholders will be required to pay any federal income taxes and, in some cases, state and local income taxes on their share of our taxable income even if they receive no cash distributions from us. Our unitholders may not receive cash distributions from us equal to their share of our taxable income or even equal to the actual tax liability that result from that income.
Tax gain or loss on the disposition of our common units could be more or less than expected.
If our unitholders sell their common units, they will recognize gain or loss equal to the difference between the amount realized and their tax basis in those common units. Because distributions in excess of a unitholder’s allocable share of our net taxable income decrease the unitholder’s tax basis in their common units, the amount, if any, of such prior excess distributions with respect to their units will, in effect, become taxable income to the unitholder if the common units are sold at a price greater than the unitholder’s tax basis in those common units, even if the price the unitholder receives is less than the unitholder’s original cost. Furthermore, a substantial portion of the amount realized, whether or not representing gain, may be taxed as ordinary income due to potential recapture items, including depreciation recapture. In addition, because the amount realized includes a unitholder’s share of our nonrecourse liabilities, if a unitholder sells units, the unitholder may incur a tax liability in excess of the amount of cash received from the sale.
Tax-exempt entities and non-U.S. persons face unique tax issues from owning our common units that may result in adverse tax consequences to them.
Investment in common units by tax-exempt entities, such as employee benefit plans and individual retirement accounts (known as IRAs), and non-U.S. persons raises issues unique to them. For example, virtually all of our income allocated to organizations that are exempt from federal income tax, including IRAs and other retirement plans, will be unrelated business taxable income and will be taxable to them. Distributions to non-U.S. persons will be reduced by withholding taxes at the highest applicable effective tax rate, and non-U.S. persons will be required to file U.S. federal tax returns and pay tax on their share of our taxable income. Non-U.S. persons will also potentially have tax filings and payment obligations in additional jurisdictions. Tax-exempt entities and non-U.S. persons should consult their tax advisor before investing in our common units.
38
We treat each purchaser of common units as having the same tax benefits without regard to the actual units purchased. The IRS may challenge this treatment, which could adversely affect the value of the common units.
To maintain the uniformity of the economic and tax characteristics of common units, we have adopted depreciation and amortization positions that may not conform to all aspects of existing Treasury Regulations. A successful IRS challenge to those positions could adversely affect the amount of tax benefits available to our unitholders. It also could affect the timing of these tax benefits or the amount of gain from the sale of common units and could have a negative impact on the value of our common units or result in audit adjustments to our unitholders’ tax returns.
Our unitholders will likely be subject to state and local taxes and return filing requirements in states where they do not live as a result of investing in our units.
In addition to federal income taxes, our unitholders will likely be subject to other taxes, including state and local taxes, unincorporated business taxes and estate, inheritance or intangible taxes that are imposed by the various jurisdictions in which we do business or own property now or in the future, even if our unitholders do not live in any of those jurisdictions. Our unitholders will likely be required to file state and local income tax returns and pay state and local income taxes in some or all of these various jurisdictions. Further, our unitholders may be subject to penalties for failure to comply with those requirements. We currently conduct business in Illinois, Indiana, Kentucky, Louisiana, Michigan, Ohio, Pennsylvania, Tennessee, Texas and West Virginia. Many of these states currently impose a personal income tax on individuals. As we make acquisitions or expand our business, we may own assets or conduct business in additional states that impose a personal income tax. It is our unitholders’ responsibility to file all U.S. federal, state and local tax returns.
We have adopted certain valuation methodologies that may result in a shift of income, gain, loss and deduction between our general partner and our unitholders. The IRS may challenge this treatment, which could adversely affect the value of the common units.
When we issue additional units or engage in certain other transactions, we will determine the fair market value of our assets and allocate any unrealized gain or loss attributable to our assets to the capital accounts of our unitholders and our general partner. Our methodology may be viewed as understating the value of our assets. In that case, there may be a shift of income, gain, loss and deduction between certain unitholders and the general partner, which may be unfavorable to such unitholders. Moreover, under our valuation methods, subsequent purchasers of common units may have a greater portion of their Internal Revenue Code Section 743(b) adjustment allocated to our tangible assets and a lesser portion allocated to our intangible assets. The IRS may challenge our valuation methods, or our allocation of the Section 743(b) adjustment attributable to our tangible and intangible assets, and allocations of income, gain, loss and deduction between our general partner and certain of our unitholders.
A successful IRS challenge to these methods or allocations could adversely affect the amount of taxable income or loss being allocated to our unitholders. It also could affect the amount of gain from our unitholders’ sale of common units and could have a negative impact on the value of the common units or result in audit adjustments to our unitholders’ tax returns without the benefit of additional deductions.
A unitholder whose common units are loaned to a “short seller” to cover a short sale of common units may be considered as having disposed of those common units. If so, he would no longer be treated for tax purposes as a partner with respect to those common units during the period of the loan and may recognize gain or loss from the disposition.
A unitholder who loans his common units to a “short seller” to cover a short sale of common units (i) may be considered as having disposed of the loaned common units, (ii) may no longer be treated for tax purposes as a partner with respect to those common units during the period of the loan to the short seller and (iii) may recognize gain or loss from such disposition. Moreover, during the period of the loan to the short seller, any of our income, gain, loss or deduction with respect to those common units may not be reportable by the unitholder and any cash distributions received by the unitholder as to those common units could be fully taxable as ordinary income. Unitholders desiring to assure their status as partners and avoid the risk of gain recognition from a loan to a short seller are urged to modify any applicable brokerage account agreements to prohibit their brokers from borrowing their common units.
39
The tax treatment of publicly traded partnerships or an investment in our units could be subject to potential legislative, judicial or administrative changes and differing interpretations, possibly on a retroactive basis.
The present U.S. federal income tax treatment of publicly traded partnerships, including us, or an investment in our common units may be modified by administrative, legislative or judicial interpretation at any time. For example, members of Congress have recently considered substantive changes to the existing federal income tax laws that affect publicly traded partnerships. Any modification to the U.S. federal income tax laws and interpretations thereof may or may not be applied retroactively and could make it more difficult or impossible to meet the exception for certain publicly traded partnerships to be treated as partnerships for U.S. federal income tax purposes. Although the considered legislation does not appear as if it would have affected our treatment as a partnership, we are unable to predict whether any of these changes, or other proposals will be reintroduced or will ultimately be enacted. Any such changes could negatively impact the value of an investment in our units.
We prorate our items of income, gain, loss and deduction between transferors and transferees of our units each month based upon the ownership of our units on the first day of each month, instead of on the basis of the date a particular unit is transferred. The IRS may challenge this treatment, which could change the allocation of items of income, gain, loss and deduction among our unitholders.
We prorate our items of income, gain, loss and deduction between existing unitholders and unitholders who purchase our units based upon the ownership of our units on the first day of each month, instead of on the basis of the date a particular unit is transferred. The use of this proration method may not be permitted under existing Treasury Regulations. The U.S. Treasury Department has issued proposed Treasury Regulations that provide a safe harbor pursuant to which publicly traded partnerships may use a similar monthly simplifying convention to allocate tax items. Nonetheless, the proposed regulations do not specifically authorize the use of the proration method we have adopted. If the IRS were to challenge our proration method or new Treasury Regulations were issued, we may be required to change the allocation of items of income, gain, loss and deduction among our unitholders.
Risks Relating to Ownership of our Common Units
Our general partner and its affiliates, including MPC, have conflicts of interest with us and limited duties to us and our unitholders, and they may favor their own interests to our detriment and that of our unitholders. Additionally, we have no control over MPC’s business decisions and operations, and MPC is under no obligation to adopt a business strategy that favors us.
As of December 31, 2013, MPC owned a 2.0 percent general partner interest and a 71.6 percent limited partner interest in us and owns and controls our general partner. Although our general partner has a duty to manage us in a manner that is not adverse to the best interests of our partnership and our unitholders, the directors and officers of our general partner also have a duty to manage our general partner in a manner that is not adverse to the best interests of its owner, MPC.
Conflicts of interest may arise between MPC and its affiliates, including our general partner, on the one hand, and us and our unitholders, on the other hand. In resolving these conflicts, the general partner may favor its own interests and the interests of its affiliates, including MPC, over the interests of our common unitholders. These conflicts include, among others, the following situations:
|
•
|
neither our partnership agreement nor any other agreement requires MPC to pursue a business strategy that favors us or utilizes our assets, which could involve decisions by MPC to increase or decrease refinery production, shut down or reconfigure a refinery, or pursue and grow particular markets. MPC’s directors and officers have a fiduciary duty to make these decisions in the best interests of the stockholders of MPC;
|
|
•
|
MPC, as our primary customer, has an economic incentive to cause us to not seek higher tariff rates, even if such higher rates or fees would reflect rates and fees that could be obtained in arm’s-length, third-party transactions;
|
|
•
|
MPC may be constrained by the terms of its debt instruments from taking actions, or refraining from taking actions, that may be in our best interests;
|
|
•
|
our partnership agreement replaces the fiduciary duties that would otherwise be owed by our general partner with contractual standards governing its duties, limiting our general partner’s liabilities and restricting the remedies available to our unitholders for actions that, without the limitations, might constitute breaches of fiduciary duty;
|
|
•
|
except in limited circumstances, our general partner has the power and authority to conduct our business without unitholder approval;
|
|
•
|
our general partner will determine the amount and timing of asset purchases and sales, borrowings, issuance of additional partnership securities and the creation, reduction or increase of cash reserves, each of which can affect the amount of cash that is distributed to our unitholders;
|
40
|
•
|
our general partner will determine the amount and timing of many of our cash expenditures and whether a cash expenditure is classified as an expansion capital expenditure, which would not reduce operating surplus, or a maintenance capital expenditure, which would reduce our operating surplus. This determination can affect the amount of cash that is distributed to our unitholders and to our general partner, the amount of adjusted operating surplus generated in any given period and the ability of the subordinated units to convert into common units;
|
|
•
|
our general partner will determine which costs incurred by it are reimbursable by us;
|
|
•
|
our general partner may cause us to borrow funds in order to permit the payment of cash distributions, even if the purpose or effect of the borrowing is to make a distribution on the subordinated units, to make incentive distributions or to accelerate expiration of the subordination period;
|
|
•
|
our partnership agreement permits us to classify up to $60.0 million as operating surplus, even if it is generated from asset sales, non-working capital borrowings or other sources that would otherwise constitute capital surplus. This cash may be used to fund distributions on our subordinated units or to our general partner in respect of the general partner interest or the incentive distribution rights;
|
|
•
|
our partnership agreement does not restrict our general partner from causing us to pay it or its affiliates for any services rendered to us or entering into additional contractual arrangements with any of these entities on our behalf;
|
|
•
|
our general partner intends to limit its liability regarding our contractual and other obligations;
|
|
•
|
our general partner may exercise its right to call and purchase all of the common units not owned by it and its affiliates if it and its affiliates own more than 85.0 percent of the common units;
|
|
•
|
our general partner controls the enforcement of obligations owed to us by our general partner and its affiliates, including our transportation and storage services agreements with MPC;
|
|
•
|
our general partner decides whether to retain separate counsel, accountants or others to perform services for us; and
|
|
•
|
our general partner may elect to cause us to issue common units to it in connection with a resetting of the target distribution levels related to our general partner’s incentive distribution rights without the approval of the conflicts committee of the board of directors of our general partner, which we refer to as our conflicts committee, or our unitholders. This election may result in lower distributions to our common unitholders in certain situations.
|
Under the terms of our partnership agreement, the doctrine of corporate opportunity, or any analogous doctrine, does not apply to our general partner or any of its affiliates, including its executive officers, directors and owners. Any such person or entity that becomes aware of a potential transaction, agreement, arrangement or other matter that may be an opportunity for us will not have any duty to communicate or offer such opportunity to us. Any such person or entity will not be liable to us or to any limited partner for breach of any fiduciary duty or other duty by reason of the fact that such person or entity pursues or acquires such opportunity for itself, directs such opportunity to another person or entity or does not communicate such opportunity or information to us. This may create actual and potential conflicts of interest between us and affiliates of our general partner and result in less than favorable treatment of us and our unitholders.
Our partnership agreement requires that we distribute all of our available cash, which could limit our ability to grow and make acquisitions.
Our partnership agreement requires that we distribute all of our available cash to our unitholders. As a result, we expect to rely primarily upon external financing sources, including commercial bank borrowings and the issuance of debt and equity securities, to fund our acquisitions and expansion capital expenditures. Therefore, to the extent we are unable to finance our growth externally, our cash distribution policy will significantly impair our ability to grow. In addition, because we will distribute all of our available cash, our growth may not be as fast as that of businesses that reinvest their available cash to expand ongoing operations. To the extent we issue additional units in connection with any acquisitions or expansion capital expenditures, the payment of distributions on those additional units may increase the risk that we will be unable to maintain or increase our per unit distribution level. There are no limitations in our partnership agreement or our revolving credit facility on our ability to issue additional units, including units ranking senior to the common units as to distribution or liquidation, and our unitholders will have no preemptive or other rights (solely as a result of their status as unitholders) to purchase any such additional units. The incurrence of additional commercial borrowings or other debt to finance our growth strategy would result in increased interest expense, which, in turn, may reduce the amount of cash available to distribute to our unitholders.
41
Our partnership agreement replaces our general partner’s fiduciary duties to holders of our common units with contractual standards governing its duties and restricts the remedies available to unitholders for actions taken by our general partner.
Our partnership agreement contains provisions that eliminate the fiduciary standards to which our general partner would otherwise be held by state fiduciary duty law and replaces those duties with several different contractual standards. For example, our partnership agreement permits our general partner to make a number of decisions in its individual capacity, as opposed to in its capacity as our general partner, free of any duties to us and our unitholders other than the implied contractual covenant of good faith and fair dealing. Our general partner is entitled to consider only the interests and factors that it desires and is relieved of any duty or obligation to give consideration to any interest of, or factors affecting, us, our affiliates or our limited partners.
Our partnership agreement contains provisions that restrict the remedies available to unitholders for actions taken by our general partner that might otherwise constitute breaches of fiduciary duty under state fiduciary duty law. For example, our partnership agreement:
|
•
|
provides that whenever our general partner makes a determination or takes, or declines to take, any other action in its capacity as our general partner, our general partner is required to make such determination, or take or decline to take such other action, in good faith and will not be subject to any other or different standard imposed by our partnership agreement, Delaware law, or any other law, rule or regulation, or at equity;
|
|
•
|
provides that our general partner will not have any liability to us or our unitholders for decisions made in its capacity as a general partner so long as it acted in good faith;
|
|
•
|
provides that our general partner and its officers and directors will not be liable for monetary damages to us or our limited partners resulting from any act or omission unless there has been a final and non-appealable judgment entered by a court of competent jurisdiction determining that our general partner or its officers and directors, as the case may be, acted in bad faith or engaged in fraud or willful misconduct or, in the case of a criminal matter, acted with knowledge that the conduct was criminal; and
|
|
•
|
provides that our general partner will not be in breach of its obligations under our partnership agreement or its fiduciary duties to us or our limited partners if a transaction with an affiliate or the resolution of a conflict of interest is approved in accordance with, or otherwise meets the standards set forth in, our partnership agreement.
|
In connection with a transaction with an affiliate or a conflict of interest, our partnership agreement provides that any determination by our general partner must be made in good faith, and that our conflicts committee and the board of directors of our general partner are entitled to a presumption that they acted in good faith. In any proceeding brought by or on behalf of any limited partner or the partnership, the person bringing or prosecuting such proceeding will have the burden of overcoming such presumption. By purchasing a common unit, a unitholder is treated as having consented to the provisions in our partnership agreement, including the provisions discussed above.
Unitholders have very limited voting rights and, even if they are dissatisfied, they cannot remove our general partner without its consent.
Unlike the holders of common stock in a corporation, unitholders have only limited voting rights on matters affecting our business and, therefore, limited ability to influence management’s decisions regarding our business. Unitholders did not elect our general partner or the board of directors of our general partner and will have no right to elect our general partner or the board of directors of our general partner on an annual or other continuing basis. The board of directors of our general partner is chosen by the members of our general partner, which are wholly-owned subsidiaries of MPC. Furthermore, if the unitholders are dissatisfied with the performance of our general partner, they will have little ability to remove our general partner. As a result of these limitations, the price at which our common units will trade could be diminished because of the absence or reduction of a takeover premium in the trading price.
42
The unitholders will be unable initially to remove our general partner without its consent because our general partner and its affiliates own sufficient units to be able to prevent its removal. The vote of the holders of at least 66
2
/3 percent of all outstanding common units and subordinated units voting together as a single class is required to remove our general partner. As of December 31, 2013, our general partner and its affiliates owned 73.1 percent of the common units and subordinated units (excluding common units held by officers and directors of our general partner and MPC). Also, if our general partner is removed without cause during the subordination period and common units and subordinated units held by our general partner and its affiliates are not voted in favor of that removal, all remaining subordinated units will automatically be converted into common units, and any existing arrearages on the common units will be extinguished. A removal of our general partner under these circumstances would adversely affect the common units by prematurely eliminating their distribution and liquidation preference over the subordinated units, which would otherwise have continued until we had met certain distribution and performance tests.
Furthermore, unitholders’ voting rights are further restricted by the partnership agreement provision providing that any units held by a person that owns 20.0 percent or more of any class of units then outstanding, other than our general partner, its affiliates, their transferees, and persons who acquired such units with the prior approval of the board of directors of our general partner, cannot vote on any matter.
Our partnership agreement also contains provisions limiting the ability of unitholders to call meetings or to acquire information about our operations, as well as other provisions limiting the unitholders’ ability to influence the manner or direction of management.
If unitholders are not both citizenship-eligible holders and rate-eligible holders, their common units may be subject to redemption.
In order to avoid (1) any material adverse effect on the maximum applicable rates that can be charged to customers by our subsidiaries on assets that are subject to rate regulation by the FERC or analogous regulatory body, and (2) any substantial risk of cancellation or forfeiture of any property, including any governmental permit, endorsement or other authorization, in which we have an interest, we have adopted certain requirements regarding those investors who may own our common units. Citizenship eligible holders are individuals or entities whose nationality, citizenship or other related status does not create a substantial risk of cancellation or forfeiture of any property, including any governmental permit, endorsement or authorization, in which we have an interest, and will generally include individuals and entities who are U.S. citizens. Rate eligible holders are individuals or entities subject to U.S. federal income taxation on the income generated by us or entities not subject to U.S. federal income taxation on the income generated by us, so long as all of the entity’s owners are subject to such taxation. If unitholders are not persons who meet the requirements to be citizenship eligible holders and rate eligible holders, they run the risk of having their units redeemed by us at the market price as of the date three days before the date the notice of redemption is mailed. The redemption price will be paid in cash or by delivery of a promissory note, as determined by our general partner. In addition, if unitholders are not persons who meet the requirements to be citizenship eligible holders, they will not be entitled to voting rights.
Cost reimbursements, which will be determined in our general partner’s sole discretion, and fees due our general partner and its affiliates for services provided will be substantial and will reduce our cash available for distribution.
Under our partnership agreement, we are required to reimburse our general partner and its affiliates for all costs and expenses that they incur on our behalf for managing and controlling our business and operations. Except to the extent specified under our omnibus agreement or our employee services agreements, our general partner determines the amount of these expenses. Under the terms of the omnibus agreement we will be required to reimburse MPC for the provision of certain general and administrative services to us. Under the terms of our employee services agreements, we have agreed to reimburse MPC for the provision of certain operational and management services to us in support of our pipelines, barge dock, storage cavern and tank farms. Our general partner and its affiliates also may provide us other services for which we will be charged fees as determined by our general partner. Payments to our general partner and its affiliates will be substantial and will reduce the amount of cash available for distribution to unitholders.
43
Our general partner interest, the control of our general partner and the incentive distribution rights of our general partner may be transferred to a third party without unitholder consent.
Our general partner may transfer its general partner interest to a third party in a merger or in a sale of all or substantially all of its assets without the consent of the unitholders. Furthermore, there is no restriction in our partnership agreement on the ability of MPC to transfer its membership interest in our general partner to a third party. The new partners of our general partner would then be in a position to replace the board of directors and officers of our general partner with their own choices and to control the decisions taken by the board of directors and officers.
Additionally, our general partner may transfer its incentive distribution rights to a third party at any time without the consent of our unitholders. If our general partner transfers its incentive distribution rights to a third party but retains its general partner interest, our general partner may not have the same incentive to grow our partnership and increase quarterly distributions to unitholders over time as it would if it had retained ownership of its incentive distribution rights. For example, a transfer of incentive distribution rights by our general partner could reduce the likelihood of MPC selling or contributing additional midstream assets to us, as MPC would have less of an economic incentive to grow our business, which in turn would impact our ability to grow our asset base.
We may issue additional units without unitholder approval, which would dilute unitholder interests.
At any time, we may issue an unlimited number of limited partner interests of any type without the approval of our unitholders and our unitholders will have no preemptive or other rights (solely as a result of their status as unitholders) to purchase any such limited partner interests. Further, neither our partnership agreement nor our revolving credit facility prohibits the issuance of equity securities that may effectively rank senior to our common units as to distributions or liquidations. The issuance by us of additional common units or other equity securities of equal or senior rank will have the following effects:
|
•
|
our unitholders’ proportionate ownership interest in us will decrease;
|
|
•
|
the amount of cash available for distribution on each unit may decrease;
|
|
•
|
because a lower percentage of total outstanding units will be subordinated units, the risk that a shortfall in the payment of the minimum quarterly distribution will be borne by our common unitholders will increase;
|
|
•
|
the ratio of taxable income to distributions may increase;
|
|
•
|
the relative voting strength of each previously outstanding unit may be diminished; and
|
|
•
|
the market price of our common units may decline.
|
MPC may sell units in the public or private markets, and such sales could have an adverse impact on the trading price of the common units.
As of December 31, 2013, MPC held 17,056,515 common units and 36,951,515 subordinated units. All of the subordinated units will convert into common units at the end of the subordination period and may convert earlier under certain circumstances. Additionally, we have agreed to provide MPC with certain registration rights. The sale of these units in the public or private markets could have an adverse impact on the price of the common units or on any trading market that may develop.
Our general partner’s discretion in establishing cash reserves may reduce the amount of cash available for distribution to unitholders.
Our partnership agreement requires our general partner to deduct from operating surplus cash reserves that it determines are necessary to fund our future operating expenditures. In addition, the partnership agreement permits the general partner to reduce available cash by establishing cash reserves for the proper conduct of our business, to comply with applicable law or agreements to which we are a party, or to provide funds for future distributions to partners. These cash reserves will affect the amount of cash available for distribution to unitholders.
Affiliates of our general partner, including MPC, may compete with us, and neither our general partner nor its affiliates have any obligation to present business opportunities to us.
Neither our partnership agreement nor our omnibus agreement will prohibit MPC or any other affiliates of our general partner from owning assets or engaging in businesses that compete directly or indirectly with us. In addition, MPC and other affiliates of our general partner may acquire, construct or dispose of additional midstream assets in the future without any obligation to offer us the opportunity to purchase any of those assets. As a result, competition from MPC and other affiliates of our general partner could materially and adversely impact our results of operations and cash available for distribution to unitholders.
44
Our general partner may cause us to borrow funds in order to make cash distributions, even where the purpose or effect of the borrowing benefits the general partner or its affiliates.
In some instances, our general partner may cause us to borrow funds under our revolving credit facility, from MPC or otherwise from third parties in order to permit the payment of cash distributions. These borrowings are permitted even if the purpose and effect of the borrowing is to enable us to make a distribution on the subordinated units, to make incentive distributions or to hasten the expiration of the subordination period.
Our general partner has a limited call right that may require unitholders to sell common units at an undesirable time or price.
If at any time our general partner and its affiliates own more than 85.0 percent of our common units, our general partner will have the right, but not the obligation, which it may assign to any of its affiliates or to us, to acquire all, but not less than all, of the common units held by unaffiliated persons at a price not less than their then current market price. As a result, unitholders may be required to sell their common units at an undesirable time or price and may not receive any return on their investment. Unitholders may also incur a tax liability upon a sale of such units.
A unitholder’s liability may not be limited if a court finds that unitholder action constitutes control of our business.
A general partner of a partnership generally has unlimited liability for the obligations of the partnership, except for those contractual obligations of the partnership that are expressly made non-recourse to the general partner. Our partnership is organized under Delaware law, and we conduct business in a number of other states. The limitations on the liability of holders of limited partner interests for the obligations of a limited partnership have not been clearly established in some jurisdictions. A unitholder could be liable for our obligations as if they were a general partner if a court or government agency were to determine that:
|
•
|
we were conducting business in a state but had not complied with that particular state’s partnership statute; or
|
|
•
|
a unitho
lder’s right to act with other unitholders to remove or replace the general partner, to approve some amendments to our partnership agreement or to take other actions under our partnership agreement constitute “control” of our business.
|
Unitholders may have to repay distributions that were wrongfully distributed to them.
Under certain circumstances, unitholders may have to repay amounts wrongfully distributed to them. Under Section 17-607 of the Delaware Revised Uniform Limited Partnership Act, we may not make a distribution to unitholders if the distribution would cause our liabilities to exceed the fair value of our assets. Delaware law provides that for a period of three years from the date of the impermissible distribution, limited partners who received the distribution and who knew at the time of the distribution that it violated Delaware law will be liable to the limited partnership for the distribution amount. Transferees of common units are liable for the obligations of the transferor to make contributions to the partnership that are known to the transferee at the time of the transfer and for unknown obligations if the liabilities could be determined from our partnership agreement. Liabilities to partners on account of their partnership interest and liabilities that are non-recourse to the partnership are not counted for purposes of determining whether a distribution is permitted.
Our general partner, or any transferee holding incentive distribution rights, may elect to cause us to issue common units and general partner units to it in connection with a resetting of the target distribution levels related to its incentive distribution rights, without the approval of our conflicts committee or the holders of our common units. This could result in lower distributions to holders of our common units.
Our general partner has the right, at any time when there are no subordinated units outstanding and it has received distributions on its incentive distribution rights at the highest level to which it is entitled (48.0 percent, in addition to distributions paid on its 2.0 percent general partner interest, each as of December 31, 2013) for each of the prior four consecutive fiscal quarters, to reset the initial target distribution levels at higher levels based on our distributions at the time of the exercise of the reset election. Following a reset election, the minimum quarterly distribution will be adjusted to equal the reset minimum quarterly distribution, and the target distribution levels will be reset to correspondingly higher levels based on percentage increases above the reset minimum quarterly distribution.
45
If our general partner elects to reset the target distribution levels, it will be entitled to receive a number of common units and general partner units. The number of common units to be issued to our general partner will be equal to that number of common units that would have entitled their holder to an average aggregate quarterly cash distribution in the prior two quarters equal to the average of the distributions to our general partner on the incentive distribution rights in the prior two quarters. Our general partner will also be issued the number of general partner units necessary to maintain our general partner’s interest in us at the level that existed immediately prior to the reset election. We anticipate that our general partner would exercise this reset right in order to facilitate acquisitions or internal growth projects that would not be sufficiently accretive to cash distributions per common unit without such conversion. It is possible, however, that our general partner could exercise this reset election at a time when it is experiencing, or expects to experience, declines in the cash distributions it receives related to its incentive distribution rights and may, therefore, desire to be issued common units rather than retain the right to receive distributions based on the initial target distribution levels. This risk could be elevated if our incentive distribution rights have been transferred to a third party. As a result, a reset election may cause our common unitholders to experience a reduction in the amount of cash distributions that they would have otherwise received had we not issued new common units and general partner units in connection with resetting the target distribution levels. Additionally, our general partner has the right to transfer all or any portion of our incentive distribution rights at any time, and such transferee shall have the same rights as the general partner relative to resetting target distributions if our general partner concurs that the tests for resetting target distributions have been fulfilled.
The NYSE does not require a publicly traded limited partnership like us to comply with certain of its corporate governance requirements.
We list our common units on the NYSE. Because we are a publicly traded limited partnership, the NYSE does not require us to have a majority of independent directors on our general partner’s board of directors or to establish a compensation committee or a nominating and corporate governance committee. Accordingly, unitholders will not have the same protections afforded to certain corporations that are subject to all of the NYSE corporate governance requirements.
46
None
The location and general character of our pipeline systems and other important physical properties have been described under Item 1. Business and are incorporated herein by reference. The facilities have been constructed or acquired over a period of years and vary in age and operating efficiency. In addition, we believe that our properties and facilities are adequate for our operations and that our facilities are adequately maintained. As of
December 31, 2013
, we lease a pipeline, vehicles, building space, pipeline equipment and land under long-term operating leases. Most of these leases include renewal options. We also lease certain pipelines under a capital lease that has a fixed price purchase option in 2020. See Item 8. Financial Statements and Supplementary Data – Note 17, for additional information regarding our leases.
Substantially all of our pipelines are constructed on rights-of-way granted by the apparent record owners of the property and in some instances these rights-of-way are revocable at the election of the grantor. In many instances, lands over which rights-of-way have been obtained are subject to prior liens that have not been subordinated to the right-of-way grants. We have obtained permits from public authorities to cross over or under, or to lay facilities in or along, watercourses, county roads, municipal streets and state highways and, in some instances, these permits are revocable at the election of the grantor. We have also obtained permits from railroad companies to cross over or under lands or rights-of-way, many of which are also revocable at the grantor’s election. In some states and under some circumstances, we have the right of eminent domain to acquire rights-of-way and lands necessary for our common carrier pipelines.
Under the omnibus agreement, MPC indemnifies us for certain title defects and for failures to obtain certain consents and permits necessary to conduct our business. Although title to these properties is subject to encumbrances in some cases, such as customary interests generally retained in connection with acquisition of real property, liens that can be imposed in some jurisdictions for government-initiated action to clean up environmental contamination, liens for current taxes and other burdens, and easements, restrictions and other encumbrances to which the underlying properties were subject at the time of acquisition by our Predecessor or us, we believe that none of these burdens should materially detract from the value of these properties or from our interest in these properties or should materially interfere with their use in the operation of our business.
We are the subject of, or a party to, a number of pending or threatened legal actions, contingencies and commitments involving a variety of matters, including laws and regulations relating to the environment. Some of these matters are discussed below.
Litigation
We are a party to a number of lawsuits and other proceedings and cannot predict the outcome of every such matter with certainty. While it is possible that an adverse result in one or more of the lawsuits or proceedings in which we are a defendant could be material to us, based upon current information and our experience as a defendant in other matters, we believe that these lawsuits and proceedings, individually or in the aggregate, will not have a material adverse effect on our consolidated results of operations, financial position or cash flows.
In 2003, the State of Illinois brought an action against the Premcor Refining Group, Inc. (“Premcor”) and Apex Refining Company (“Apex”) asserting claims for environmental cleanup related to the refinery owned by these entities in the Hartford/Wood River, Illinois area. In 2006, Premcor and Apex filed third-party complaints against numerous owners and operators of petroleum products facilities in the Hartford/Wood River, Illinois area, including MPL. These complaints, which have been amended since filing, assert claims of common law nuisance and contribution under the Illinois Contribution Act and other laws for environmental cleanup costs that may be imposed on Premcor and Apex by the State of Illinois. There are several third-party defendants in the litigation and MPL has asserted cross-claims in contribution against the various third-party defendants. This litigation is currently pending in the Third Judicial Circuit Court, Madison County, Illinois. While the ultimate outcome of these litigated matters remains uncertain, neither the likelihood of an unfavorable outcome nor the ultimate liability, if any, with respect to this matter can be determined at this time and we are unable to estimate a reasonably possible loss (or range of loss) for this litigation. Under our omnibus agreement, MPC will indemnify us for the full cost of any losses should MPL be deemed responsible for any damages in this lawsuit.
47
Environmental Proceedings
In January 2013, the EPA notified MPL of alleged Clean Air Act violations pertaining to a 2011 audit of MPC’s Woodhaven, Michigan facility operated by MPL. We have tentatively agreed to pay a penalty of $23,200 to the EPA and and undertake a Supplemental Safety Project of $87,000. Under our omnibus agreement, MPC will indemnify us for the full cost of any losses incurred for this matter.
We are involved in a number of other environmental enforcement matters arising in the ordinary course of business. While the ultimate outcome and impact to us cannot be predicted with certainty, we believe that the resolution of each of these other matters is not likely to result in a penalty in excess of $100,000 and that collectively, the environmental proceeding described above and these other environmental enforcement matters will not have a material adverse effect on our consolidated results of operations, financial position or cash flows.
Not applicable
48
Our common limited partner units are listed on the NYSE and traded under the symbol “MPLX.” As of
February 14, 2014
, there were three registered holders of 19,900,197 outstanding common units held by the public, including 19,898,397 common units held in street name. In addition, as of
February 14, 2014
, MPC and its affiliates owned 17,056,515 of our common units, 36,951,515 of our subordinated units and 1,508,331 of our general partner units (the 2.0 percent general partner interest), which together constitutes a 73.6 percent ownership interest in us.
The following table reflects intraday high and low sales prices of and cash distributions declared on our common units by quarter since October 26, 2012, the date our units began trading on the NYSE.
|
Trading prices per common unit
|
||||||||||||||||
|
Quarter ended
|
High
|
Low
|
Quarterly cash distribution per unit
(a)
|
Distribution date
|
Record date
|
|||||||||||
|
December 31, 2013
|
$
|
44.97
|
|
$
|
35.72
|
|
$
|
0.3125
|
|
February 14, 2014
|
February 4, 2014
|
|||||
|
September 30, 2013
|
38.54
|
|
34.51
|
|
0.2975
|
|
November 14, 2013
|
November 4, 2013
|
||||||||
|
June 30, 2013
|
39.69
|
|
34.40
|
|
0.2850
|
|
August 14, 2013
|
August 2, 2013
|
||||||||
|
March 31, 2013
|
38.61
|
|
31.48
|
|
0.2725
|
|
May 17, 2013
|
May 10, 2013
|
||||||||
|
December 31, 2012 (from October 26, 2012)
|
34.51
|
|
25.35
|
|
0.1769
|
|
February 14, 2013
|
February 4, 2013
|
||||||||
(a)
Represents cash distributions attributable to the quarter and declared and paid in accordance with our partnership agreement. The distribution for the quarter ended December 31, 2012 reflects the prorated portion of the minimum quarterly distribution per unit of $0.2625.
We intend to pay a minimum quarterly distribution of $0.2625 per unit. Although our partnership agreement requires that we distribute all of our available cash each quarter, we do not have a legal obligation to distribute any particular amount per common unit.
Distributions of Available Cash
Our partnership agreement requires that, within 60 days after the end of each quarter, beginning with the quarter ended December 31, 2012, we distribute all of our available cash to unitholders of record on the applicable record date.
Definition of Available Cash.
Available cash is defined in our partnership agreement, which is an exhibit to this Annual Report Form 10-K. Available cash generally means, for any quarter, all cash and cash equivalents on hand at the end of that quarter:
less, the amount of cash reserves established by our general partner to:
|
•
|
provide for the proper conduct of our business (including reserves for our future capital expenditures, anticipated future debt service requirements and refunds of collected rates reasonably likely to be refunded as a result of a settlement or hearing related to FERC rate proceedings or rate proceedings under applicable law subsequent to that quarter);
|
|
•
|
comply with applicable law, any of our debt instruments or other agreements; or
|
|
•
|
provide funds for distributions to our unitholders and to our general partner for any one or more of the next four quarters (provided that our general partner may not establish cash reserves for distributions if the effect of the establishment of such reserves will prevent us from distributing the minimum quarterly distribution on all common units and any cumulative arrearages on such common units for the current quarter);
|
plus, if our general partner so determines, all or any portion of the cash on hand on the date of determination of available cash for the quarter resulting from working capital borrowings made subsequent to the end of such quarter.
49
Intent to Distribute the Minimum Quarterly Distribution
. Under our current cash distribution policy, we intend to make a minimum quarterly distribution to the holders of our common units and subordinated units of $0.2625 per unit, or $1.05 per unit on an annualized basis, to the extent we have sufficient cash from our operations after the establishment of cash reserves and the payment of costs and expenses, including reimbursements of expenses to our general partner. However, there is no guarantee that we will pay the minimum quarterly distribution on our units in any quarter. The amount of distributions paid under our policy and the decision to make any distribution is determined by our general partner, taking into consideration the terms of our partnership agreement. Please read Item 7. Management’s Discussion and Analysis of Financial Condition and Results of Operations - Liquidity and Capital Resources - Revolving Credit Facility, for a discussion of the restrictions included in our revolving credit facility that may restrict our ability to make distributions.
General Partner Interest and Incentive Distribution Rights
. Our general partner is currently entitled to 2.0 percent of all quarterly distributions that we make prior to our liquidation. Our general partner has the right, but not the obligation, to contribute a proportionate amount of capital to us to maintain its current general partner interest. The general partner’s 2.0 percent interest in these distributions will be reduced if we issue additional units in the future and our general partner does not contribute a proportionate amount of capital to us to maintain its 2.0 percent general partner interest.
Our general partner also currently holds incentive distribution rights that entitle it to receive increasing percentages, up to a maximum of 48.0 percent, of the cash we distribute from operating surplus in excess of $0.301875 per unit per quarter. The maximum distribution of 48.0 percent does not include any distributions that our general partner or its affiliates may receive on common, subordinated or general partner units that they own.
Percentage Allocations of Available Cash.
The following table illustrates the percentage allocations of available cash from operating surplus between the unitholders and our general partner based on the specified target distribution levels. The amounts set forth under “Marginal percentage interest in distributions” are the percentage interests of our general partner and the unitholders in any available cash from operating surplus we distribute up to and including the corresponding amount in the column “Total quarterly distribution per unit target amount.” The percentage interests shown for our unitholders and our general partner for the minimum quarterly distribution are also applicable to quarterly distribution amounts that are less than the minimum quarterly distribution. The percentage interests set forth below for our general partner include its 2.0 percent general partner interest and assume that our general partner has contributed any additional capital necessary to maintain its 2.0 percent general partner interest, our general partner has not transferred its incentive distribution rights and that there are no arrearages on common units.
|
|
|
Marginal percentage interest
in distributions
|
||||||||
|
|
Total quarterly distribution
per unit target amount
|
Unitholders
|
General Partner
|
|||||||
|
Minimum Quarterly Distribution
|
$0.2625
|
98.0
|
%
|
2.0
|
%
|
|||||
|
First Target Distribution
|
above $0.2625
|
up to $0.301875
|
98.0
|
%
|
2.0
|
%
|
||||
|
Second Target Distribution
|
above $0.301875
|
up to $0.328125
|
85.0
|
%
|
15.0
|
%
|
||||
|
Third Target Distribution
|
above $0.328125
|
up to $0.393750
|
75.0
|
%
|
25.0
|
%
|
||||
|
Thereafter
|
above $0.393750
|
50.0
|
%
|
50.0
|
%
|
|||||
Subordination Period
Our partnership agreement provides that, during the subordination period (which we define below), the common units have the right to receive distributions of available cash from operating surplus each quarter in an amount equal to $0.2625 per common unit, which amount is defined in our partnership agreement as the minimum quarterly distribution, plus any arrearages in the payment of the minimum quarterly distribution on the common units from prior quarters, before any distributions of available cash from operating surplus may be made on the subordinated units. These units are deemed “subordinated” because for a period of time, referred to as the subordination period, the subordinated units will not be entitled to receive any distributions until the common units have received the minimum quarterly distribution plus any arrearages from prior quarters. Furthermore, no arrearages will be paid on the subordinated units. The practical effect of the subordinated units is to increase the likelihood that, during the subordination period, there will be available cash to be distributed on the common units.
50
Definition of Subordination Period.
Except as described below, the subordination period began on the closing date of the Offering and extends until the first business day following the distribution of available cash in respect of any quarter beginning after December 31, 2015, that each of the following tests are met:
|
•
|
distributions of available cash from operating surplus on each of the outstanding common units, subordinated units and general partner units equaled or exceeded $1.05 (the annualized minimum quarterly distribution), for each of the three consecutive, non-overlapping four-quarter periods immediately preceding that date;
|
|
•
|
the adjusted operating surplus (as defined below) generated during each of the three consecutive, non-overlapping four-quarter periods immediately preceding that date equaled or exceeded the sum of $1.05 (the annualized minimum quarterly distribution) on all of the outstanding common units, subordinated units and general partner units during those periods on a fully diluted basis; and
|
|
•
|
there are no arrearages in payment of the minimum quarterly distribution on the common units.
|
Early Termination of Subordination Period
. Notwithstanding the foregoing, the subordination period automatically terminates on the first business day following the distribution of available cash in respect of any quarter, beginning with the quarter ending December 31, 2013, that each of the following tests are met:
|
•
|
distributions of available cash from operating surplus on each of the outstanding common units, subordinated units and general partner units equaled or exceeded $1.575 (150 percent of the annualized minimum quarterly distribution) for the four-quarter period immediately preceding that date;
|
|
•
|
the adjusted operating surplus (as defined below) generated during the four-quarter period immediately preceding that date equaled or exceeded the sum of (i) $1.575 (150 percent of the annualized minimum quarterly distribution) on all of the outstanding common units, subordinated units and general partner units during that period on a fully diluted basis and (ii) the corresponding distributions on the incentive distribution rights; and
|
|
•
|
there are no arrearages in payment of the minimum quarterly distributions on the common units.
|
Expiration of the Subordination Period
. When the subordination period ends, each outstanding subordinated unit will convert into one common unit and will thereafter participate pro rata with the other common units in distributions of available cash. In addition, if the unitholders remove our general partner other than for cause:
|
•
|
the subordinated units held by any person will immediately and automatically convert into common units on a one-for-one basis, provided (i) neither such person nor any of its affiliates voted any of its units in favor of the removal and (ii) such person is not an affiliate of the successor general partner;
|
|
•
|
if all of the subordinated units convert pursuant to the foregoing, all cumulative common unit arrearages on the common units will be extinguished and the subordination period will end; and
|
|
•
|
our general partner will have the right to convert its general partner interest and its incentive distribution rights into common units or to receive cash in exchange for those interests.
|
51
The following table shows selected historical consolidated financial data of MPLX LP and our Predecessor as of the dates and for the years indicated. Our Predecessor consisted of a 100 percent interest in all of the assets and operations of MPL and ORPL that MPC contributed to us at the closing of the Offering, as well as minority undivided joint interests in two crude oil pipeline systems, which we refer to as the joint interest assets, that were not contributed to us. In connection with the closing of the Offering, MPC transferred the joint interest assets from our Predecessor to other MPC subsidiaries and then contributed to us a 51.0 percent indirect ownership interest in Pipe Line Holdings, which owns our Predecessor’s assets and operations (other than the joint interest assets), and a 100 percent indirect ownership in our butane cavern. On May 1, 2013, we acquired an additional 5.0 percent interest in Pipe Line Holdings, resulting in a 56.0 percent indirect ownership interest at December 31, 2013. As required by United States generally accepted accounting principles (“GAAP”), we consolidate 100 percent of the assets and operations of Pipe Line Holdings in our financial statements. In addition, we recorded the contribution at historical cost, as it is considered a reorganization of entities under common control.
The selected historical consolidated financial data as of and for the years ended December 31, 2011, 2010 and 2009 were derived from audited combined financial statements of our Predecessor.
The following table also presents the non-GAAP financial measures of Adjusted EBITDA and Distributable Cash Flow, which we use in our business. For the definitions of Adjusted EBITDA and Distributable Cash Flow and a reconciliation to our most directly comparable financial measures calculated and presented in accordance with GAAP, see Non-GAAP Financial Measures below.
|
(In millions, except per unit data)
|
2013
|
2012
|
2011
|
2010
|
2009
|
|||||||||||||||
|
Consolidated statements of income data:
|
||||||||||||||||||||
|
Sales and other operating revenues
|
$
|
78.9
|
|
$
|
74.4
|
|
$
|
62.1
|
|
$
|
49.7
|
|
$
|
43.3
|
|
|||||
|
Sales to related parties
|
384.2
|
|
367.8
|
|
334.8
|
|
346.2
|
|
331.4
|
|
||||||||||
|
Gain (loss) on sale of assets
|
—
|
|
(0.3
|
)
|
—
|
|
—
|
|
0.2
|
|
||||||||||
|
Other income
|
4.4
|
|
6.9
|
|
4.3
|
|
0.4
|
|
1.3
|
|
||||||||||
|
Other income—related parties
|
18.8
|
|
13.1
|
|
9.4
|
|
8.0
|
|
7.3
|
|
||||||||||
|
Total revenues and other income
|
486.3
|
|
461.9
|
|
410.6
|
|
404.3
|
|
383.5
|
|
||||||||||
|
Total costs and expenses
|
339.3
|
|
318.7
|
|
278.6
|
|
300.9
|
|
260.9
|
|
||||||||||
|
Income from operations
|
$
|
147.0
|
|
$
|
143.2
|
|
$
|
132.0
|
|
$
|
103.4
|
|
$
|
122.6
|
|
|||||
|
Net income
|
$
|
146.1
|
|
$
|
144.0
|
|
$
|
134.0
|
|
$
|
103.3
|
|
$
|
122.3
|
|
|||||
|
Net income attributable to MPLX LP
|
77.9
|
|
130.8
|
|
134.0
|
|
103.3
|
|
122.3
|
|
||||||||||
|
Net income attributable to MPLX LP
subsequent to the Offering
|
77.9
|
|
13.1
|
|
||||||||||||||||
|
Limited partners’ interest in net income attributable to MPLX LP subsequent to the Offering
|
76.2
|
|
12.9
|
|
||||||||||||||||
|
Net income attributable to MPLX LP subsequent to the Offering per limited partner unit (basic and diluted):
|
||||||||||||||||||||
|
Common units - basic
|
$
|
1.05
|
|
$
|
0.18
|
|
||||||||||||||
|
Common units - diluted
|
1.05
|
|
0.18
|
|
||||||||||||||||
|
Subordinated units - basic and diluted
|
1.01
|
|
0.17
|
|
||||||||||||||||
|
Cash distribution declared per limited partner common unit
|
$
|
1.1675
|
|
$
|
0.1769
|
|
||||||||||||||
|
Consolidated balance sheets data (at period end):
|
||||||||||||||||||||
|
Property, plant and equipment, net
|
$
|
966.6
|
|
$
|
910.0
|
|
$
|
866.8
|
|
$
|
847.8
|
|
$
|
890.8
|
|
|||||
|
Total assets
|
1,208.5
|
|
1,301.3
|
|
1,303.1
|
|
1,118.0
|
|
1,068.8
|
|
||||||||||
|
Long-term debt
(1)
|
10.5
|
|
11.3
|
|
11.9
|
|
12.5
|
|
13.1
|
|
||||||||||
|
Consolidated statements of cash flows data:
|
||||||||||||||||||||
|
Net cash provided by (used in):
|
||||||||||||||||||||
|
Operating activities
|
$
|
212.2
|
|
$
|
190.6
|
|
$
|
181.9
|
|
$
|
117.3
|
|
$
|
145.1
|
|
|||||
|
Investing activities
|
(113.6
|
)
|
87.4
|
|
(218.7
|
)
|
(64.6
|
)
|
(57.5
|
)
|
||||||||||
|
Financing activities
|
(261.2
|
)
|
(61.4
|
)
|
36.7
|
|
(53.0
|
)
|
(88.3
|
)
|
||||||||||
|
Additions to property, plant and equipment
(2)
|
(106.5
|
)
|
(135.6
|
)
|
(49.8
|
)
|
(13.7
|
)
|
(57.7
|
)
|
||||||||||
|
Other financial data
(3)
:
|
||||||||||||||||||||
|
Adjusted EBITDA attributable to MPLX LP
|
$
|
111.2
|
|
$
|
166.3
|
|
$
|
168.3
|
|
$
|
156.0
|
|
$
|
155.4
|
|
|||||
|
Adjusted EBITDA attributable to MPLX LP subsequent to the Offering
|
111.2
|
|
18.2
|
|
||||||||||||||||
|
Distributable Cash Flow attributable to MPLX LP
|
114.6
|
|
16.7
|
|
||||||||||||||||
|
(1)
|
Consists of one capital lease obligation, including amounts due within one year.
|
|
(2)
|
Represents cash capital expenditures as reflected on consolidated statements of cash flows for the periods indicated, which are included in cash used in investing activities.
|
|
(3)
|
For a discussion of the non-GAAP financial measures of Adjusted EBITDA and Distributable Cash Flow and a reconciliation of Adjusted EBITDA and Distributable Cash Flow to our most directly comparable measures calculated and presented in accordance with GAAP, please read “ Non-GAAP Financial Measures” below.
|
52
NON-GAAP FINANCIAL MEASURES
For the definitions of Adjusted EBITDA and Distributable Cash Flow and a discussion of the uses of these non-GAAP financial measures, see Item 7. Management’s Discussion and Analysis of Financial Condition and Results of Operations – How We Evaluate Our Operations – Adjusted EBITDA and Distributable Cash Flow.
The following table presents a reconciliation of Adjusted EBITDA and Distributable Cash Flow to net income and net cash provided by operating activities, the most directly comparable GAAP financial measures.
|
(In millions)
|
2013
|
2012
|
2011
|
2010
|
2009
|
|||||||||||||||
|
Reconciliation of Adjusted EBITDA attributable to MPLX LP subsequent to the Offering from Net Income:
|
||||||||||||||||||||
|
Net income
|
$
|
146.1
|
|
$
|
144.0
|
|
$
|
134.0
|
|
$
|
103.3
|
|
$
|
122.3
|
|
|||||
|
Less: Net income attributable to MPC-retained interest
|
68.2
|
|
13.2
|
|
—
|
|
—
|
|
—
|
|
||||||||||
|
Net income attributable to MPLX LP
|
77.9
|
|
130.8
|
|
134.0
|
|
103.3
|
|
122.3
|
|
||||||||||
|
Plus: Net income attributable to MPC-retained interest
|
68.2
|
|
13.2
|
|
—
|
|
—
|
|
—
|
|
||||||||||
|
Depreciation
|
48.9
|
|
39.4
|
|
36.3
|
|
52.6
|
|
32.8
|
|
||||||||||
|
Provision (benefit) for income taxes
|
(0.2
|
)
|
0.3
|
|
0.1
|
|
0.3
|
|
0.3
|
|
||||||||||
|
Non-cash equity-based compensation
|
1.4
|
|
0.1
|
|
—
|
|
—
|
|
—
|
|
||||||||||
|
Related party interest and other financial income
|
—
|
|
(1.3
|
)
|
(2.3
|
)
|
(0.2
|
)
|
—
|
|
||||||||||
|
Net interest and other financial costs (income)
|
1.1
|
|
0.2
|
|
0.2
|
|
—
|
|
—
|
|
||||||||||
|
Adjusted EBITDA
|
197.3
|
|
182.7
|
|
168.3
|
|
156.0
|
|
155.4
|
|
||||||||||
|
Adjusted EBITDA attributable to MPC-retained interest
|
86.1
|
|
16.4
|
|
—
|
|
—
|
|
—
|
|
||||||||||
|
Adjusted EBITDA attributable to MPLX LP
|
111.2
|
|
166.3
|
|
$
|
168.3
|
|
$
|
156.0
|
|
$
|
155.4
|
|
|||||||
|
Less: Predecessor Adjusted EBITDA prior to the Offering
|
—
|
|
148.1
|
|
||||||||||||||||
|
Adjusted EBITDA attributable to MPLX LP subsequent to the Offering
|
111.2
|
|
18.2
|
|
||||||||||||||||
|
Plus: Increase in deferred revenue for committed volume deficiencies
|
18.7
|
|
2.1
|
|
||||||||||||||||
|
Less: Cash interest paid, net
|
1.0
|
|
0.2
|
|
||||||||||||||||
|
Income taxes paid
|
0.1
|
|
—
|
|
||||||||||||||||
|
Maintenance capital expenditures paid
|
11.7
|
|
3.4
|
|
||||||||||||||||
|
Used/expired volume deficiency credits
|
2.5
|
|
—
|
|
||||||||||||||||
|
Distributable Cash Flow attributable to MPLX LP
|
$
|
114.6
|
|
$
|
16.7
|
|
||||||||||||||
|
Reconciliation of Adjusted EBITDA attributable to MPLX LP subsequent to the Offering from Net Cash Provided by Operating Activities:
|
||||||||||||||||||||
|
Net cash provided by operating activities
|
$
|
212.2
|
|
$
|
190.6
|
|
$
|
181.9
|
|
$
|
117.3
|
|
$
|
145.1
|
|
|||||
|
Less: Changes in working capital items
|
23.0
|
|
15.9
|
|
11.5
|
|
(38.9
|
)
|
(9.9
|
)
|
||||||||||
|
All other, net
|
2.4
|
|
0.3
|
|
2.3
|
|
1.6
|
|
1.0
|
|
||||||||||
|
Plus: Non-cash equity-based compensation
|
1.4
|
|
0.1
|
|
—
|
|
—
|
|
—
|
|
||||||||||
|
Net gain (loss) on disposal of assets
|
—
|
|
(0.3
|
)
|
—
|
|
—
|
|
0.2
|
|
||||||||||
|
Related party interest and other financial income
|
—
|
|
(1.3
|
)
|
(2.3
|
)
|
(0.2
|
)
|
—
|
|
||||||||||
|
Net interest and other financial costs (income)
|
1.1
|
|
0.2
|
|
0.2
|
|
—
|
|
—
|
|
||||||||||
|
Current income taxes expense
|
(0.3
|
)
|
0.4
|
|
0.3
|
|
0.3
|
|
0.4
|
|
||||||||||
|
Asset retirement expenditures
|
8.3
|
|
9.2
|
|
2.0
|
|
1.3
|
|
0.8
|
|
||||||||||
|
Adjusted EBITDA
|
197.3
|
|
182.7
|
|
168.3
|
|
156.0
|
|
155.4
|
|
||||||||||
|
Adjusted EBITDA attributable to MPC-retained interest
|
86.1
|
|
16.4
|
|
—
|
|
—
|
|
—
|
|
||||||||||
|
Adjusted EBITDA attributable to MPLX LP
|
111.2
|
|
166.3
|
|
$
|
168.3
|
|
$
|
156.0
|
|
$
|
155.4
|
|
|||||||
|
Less: Predecessor Adjusted EBITDA prior to the Offering
|
—
|
|
148.1
|
|
||||||||||||||||
|
Adjusted EBITDA attributable to MPLX LP subsequent to the Offering
|
111.2
|
|
18.2
|
|
||||||||||||||||
|
Plus: Increase in deferred revenue for committed volume deficiencies
|
18.7
|
|
2.1
|
|
||||||||||||||||
|
Less: Cash interest paid, net
|
1.0
|
|
0.2
|
|
||||||||||||||||
|
Income taxes paid
|
0.1
|
|
—
|
|
||||||||||||||||
|
Maintenance capital expenditures paid
|
11.7
|
|
3.4
|
|
||||||||||||||||
|
Used/expired volume deficiency credits
|
2.5
|
|
—
|
|
||||||||||||||||
|
Distributable Cash Flow attributable to MPLX LP
|
$
|
114.6
|
|
|
$
|
16.7
|
|
|||||||||||||
53
Management’s Discussion and Analysis of Financial Condition and Results of Operations should be read in conjunction with the information included under Item 1. Business, Item 1A. Risk Factors, Item 6. Selected Financial Data and Item 8. Financial Statements and Supplementary Data.
Management’s Discussion and Analysis of Financial Condition and Results of Operations includes various forward-looking statements concerning trends or events potentially affecting our business. You can identify our forward-looking statements by words such as “anticipate,” “believe,” “estimate,” “expect,” “forecast,” “project,” “could,” “may,” “should,” “would,” “will,” or other similar expressions that convey the uncertainty of future events or outcomes. In accordance with “safe harbor” provisions of the Private Securities Litigation Reform Act of 1995, these statements are accompanied by cautionary language identifying important factors, though not necessarily all such factors, which could cause future outcomes to differ materially from those set forth in forward-looking statements.
THE INITIAL PUBLIC OFFERING
On
October 26, 2012
, the Partnership’s common units began trading on the NYSE under the ticker symbol “MPLX.” On
October 31, 2012
, MPLX LP closed the Offering of
19,895,000
common units, which included a
2,595,000
common unit over-allotment option that was exercised in full by the underwriters. Unless the context otherwise requires, references to "MPLX LP," the "Partnership," "we," "our," "us," or like terms used in the present tense or for periods starting on or after
October 31, 2012
, refer to MPLX LP and its subsidiaries, including MPLX Operations and MPLX Terminal Storage, both wholly-owned subsidiaries, and Pipe Line Holdings, of which MPLX LP owned a
56.0 percent
general partner interest at
December 31, 2013
. Pipe Line Holdings owns
100 percent
of MPL and ORPL. References to the "Predecessor," "we," "our," "us," or like terms, when used for periods prior to
October 31, 2012
, refer to MPLX LP Predecessor, our predecessor for accounting purposes. For information on the various agreements between the Partnership and MPC see Item 1. Business – Our Transportation and Storage Services Agreements with MPC, – Operating and Management Services Agreements with MPC and Third Parties, and – Other Agreements with MPC.
PARTNERSHIP OVERVIEW
We are a fee-based, growth-oriented master limited partnership formed by MPC to own, operate, develop and acquire pipelines and other midstream assets related to the transportation and storage of crude oil, refined products and other hydrocarbon-based products. We believe our network of petroleum pipelines is one of the largest in the United States, based on total annual volumes delivered. Our assets are integral to the success of MPC’s operations. As of
December 31, 2013
, our primary assets consisted of:
|
•
|
a
56.0 percent
general partner interest in Pipe Line Holdings, an entity that owns a
100 percent
interest in MPL and ORPL, which in turn collectively own:
|
|
•
|
a network of pipeline systems that includes approximately
1,004 miles
of common carrier crude oil pipelines and approximately
1,902 miles
of common carrier product pipelines extending across nine states. This network includes approximately
230 miles
of common carrier crude oil and product pipelines that we operate under long-term leases with third parties;
|
|
•
|
a barge dock located on the Mississippi River near Wood River, Illinois with
84
mbpd of crude oil and product throughput capacity; and
|
|
•
|
crude oil and product tank farms located in Patoka, Wood River and Martinsville, Illinois and Lebanon, Indiana.
|
|
•
|
a
100 percent
interest in a butane cavern located in Neal, West Virginia with approximately
1.0 million
barrels of storage capacity that serves MPC’s Catlettsburg refinery.
|
As the sole general partner of Pipe Line Holdings, we control all aspects of management of Pipe Line Holdings, including its cash distribution policy. On
May 1, 2013
, we acquired an additional
5.0 percent
interest in Pipe Line Holdings from MPC for consideration of
$100.0 million
in cash, increasing our ownership interest to
56.0 percent
. The purchase was financed with cash on hand.
On
February 27, 2014
, we entered into an agreement to acquire an additional
13.0 percent
interest in Pipe Line Holdings from MPC for consideration of
$310.0 million
, effective
March 1, 2014
. Subsequent to this transaction, our ownership in Pipe Line Holdings will be
69.0 percent
. We intend to finance this transaction with $40.0 million of cash on hand and by borrowing $270.0 million on our revolver.
54
HOW WE GENERATE REVENUE
We generate revenue primarily by charging tariffs for transporting crude oil, refined products and other hydrocarbon-based products through our pipelines and at our barge dock and fees for storing crude oil and products at our storage facilities. We are also the operator of additional crude oil and product pipelines owned by MPC and its affiliates and third parties for which we are paid operating fees. We do not take ownership of the crude oil or products that we transport and store for our customers, and we do not engage in the trading of any commodities.
MPC historically has been, and will continue to be for the foreseeable future, the source of the substantial majority of our revenues. On
October 31, 2012
, concurrent with the Offering, we entered into new long-term, fee-based transportation services agreements with MPC with minimum volume commitments. MPC historically has shipped volumes in excess of its minimum throughput commitment for most of our crude oil and product pipeline systems, and we expect those excess shipments to continue. In conjunction with the Offering, on October 1, 2012, we entered into new long-term, fee-based storage services agreements with MPC. We believe these transportation and storage services agreements will promote stable and predictable cash flows.
We continue to seek increased third-party volumes on our crude oil and product pipelines. We believe that the strategic location of our assets and their ability to access attractively-priced crude oil and to supply products to various markets may create opportunities to capture incremental third-party business and facilitate our growth. The substantial majority of our revenues are generated under our transportation and storage services agreements with, and tariffs and fees paid by, MPC. Unless we are successful in attracting third-party customers, our ability to increase volumes will be dependent on MPC and its future growth.
We also plan to pursue acquisitions of complementary assets from MPC as well as third parties. We believe MPC will offer us the opportunity to purchase additional midstream assets that it owns, including additional interests in Pipe Line Holdings. We may pursue acquisitions in coordination with MPC. Our third-party acquisition strategy includes midstream assets both within our existing geographic footprint and in new areas.
Our existing operating services agreements include an operating agreement with Red Butte Pipe Line Company, which is owned by Marathon Oil. Under this agreement, MPL receives an annual $3.3 million operating fee for operating certain pipelines in Wyoming and Montana. The term of this agreement has been extended from December 2013 through December 2018.
Effective February 1, 2013, we entered into an operating agreement with Blanchard Pipe Line, a wholly-owned subsidiary of MPC, under which we operate various pipeline systems in Texas owned by Blanchard Pipe Line that it acquired in conjunction with MPC's acquisition of the Galveston Bay refinery. Under the agreement we receive an annual fee of $1.0 million, subject to adjustment for inflation, and are reimbursed for specific costs associated with operating the pipeline systems. The term of this agreement is until December 31, 2014, and it is automatically extended from year to year thereafter unless terminated by either party at least three months prior to the end of the term.
Effective October 1, 2013, MPL entered into an operating and maintenance agreement with the owners of the Capline pipeline system. The Capline system is a 635 mile, 40-inch crude oil pipeline running from St. James, Louisiana to Patoka, Illinois. MPC owns a 32.6 percent undivided joint interest in the Capline system. Under the agreement we receive an annual fee of $3.5 million, subject to adjustment for inflation, and in addition are reimbursed for specific costs associated with operating the pipeline system. The initial term of this agreement is until August 31, 2018, and it is automatically extended for successive five year terms thereafter unless terminated by either party at least ten months prior to the end of the term.
HOW WE EVALUATE OUR OPERATIONS
Our management uses a variety of financial and operating metrics to analyze our performance. These metrics are significant factors in assessing our operating results and profitability and include: (i) throughput volumes; (ii) income from operations; (iii) Adjusted EBITDA; and (iv) Distributable Cash Flow.
55
Throughput Volumes.
The amount of revenue we generate primarily depends on the volumes of crude oil, refined products and other hydrocarbon-based products that we transport for our customers. The volumes transported on our pipelines are primarily affected by the supply of and demand for crude oil and products in the markets served directly or indirectly by our assets. Although MPC has committed to minimum throughput volumes under the transportation services agreements described above, our results of operations will be impacted by our ability to:
|
•
|
utilize the remaining uncommitted capacity on, or add additional capacity to, our pipeline systems;
|
|
•
|
increase throughput volumes on our pipeline systems by making outlet connections to existing or new third-party pipelines or other facilities, primarily driven by the anticipated supply of and demand for crude oil and products;
|
|
•
|
identify and execute organic expansion projects, and capture incremental MPC and third-party volumes; and
|
|
•
|
increase throughput volumes via acquisitions.
|
Income from Operations.
Income from operations represents our total revenue and other income less our total costs and expenses. Our management seeks to maximize our income from operations by maximizing revenue and managing our expenses. We generate revenue primarily by charging tariffs for transporting crude oil, refined products and other hydrocarbon-based products through our pipelines and at our barge dock and fees for storing crude oil and products at our storage facilities. The FERC regulates the tariffs we can charge on our common carrier pipelines; however, as volumes of crude oil, refined products and other hydrocarbon-based products handled through our pipelines fluctuate, so does our revenue.
Total costs and expenses include cost of revenues, purchases from related parties, depreciation, general and administrative expenses and other taxes. These expenses are primarily comprised of labor expenses, repairs and maintenance expenses, fuel and power costs, lease costs, property taxes and administrative expenses. These expenses generally remain relatively stable across broad ranges of throughput volumes but can fluctuate from period to period depending on the mix of activities performed during that period and the timing of these expenses. We intend to manage our maintenance expenditures on our pipelines and storage assets by scheduling maintenance over time to avoid significant variability in our maintenance expenditures and minimize their impact on our cash flow.
Adjusted EBITDA and Distributable Cash Flow.
We define Adjusted EBITDA as net income before depreciation, provision (benefit) for income taxes, non-cash equity-based compensation and net interest and other financial costs (income). The Partnership also uses Distributable Cash Flow, which we define as Adjusted EBITDA plus the current period deferred revenue for committed volume deficiencies less net cash interest paid, income taxes paid, maintenance capital expenditures paid and used or expired volume deficiency credits. Adjusted EBITDA and Distributable Cash Flow are not presentations made in accordance with U.S. GAAP.
Under our transportation services agreements, if MPC fails to transport its minimum throughput volumes during any quarter, then MPC will pay us a deficiency payment equal to the volume of the deficiency multiplied by the tariff rate then in effect. The deficiency amounts are recorded as an increase in deferred revenue for committed volume deficiencies and included in the calculation of Distributable Cash Flow. The deficiencies are not included in Adjusted EBITDA for the period in which they occur. MPC may then apply the amount of any such deficiency payments as a credit for volumes transported on the applicable pipeline system in excess of its minimum volume commitment during the following four quarters or eight quarters under the terms of the applicable transportation services agreement. We recognize revenues for the deficiency payments at the earlier of when credits are used for volumes transported in excess of minimum quarterly volume commitments, when it becomes impossible to physically transport volumes necessary to utilize the credits or upon the expiration of the applicable four or eight quarter period. When credits are used or expire, the associated revenue is included within Adjusted EBITDA while the use or expiration of the credits is a decrease in the calculation of Distributable Cash Flow.
Adjusted EBITDA and Distributable Cash Flow are non-U.S. GAAP supplemental financial measures that management and external users of our consolidated financial statements, such as industry analysts, investors, lenders and rating agencies, may use to assess:
|
•
|
our operating performance compared to other publicly traded partnerships in our industry, without regard to historical cost basis or, in the case of Adjusted EBITDA, financing methods;
|
|
•
|
the ability of our assets to generate sufficient cash flow to make distributions to our unitholders;
|
|
•
|
our ability to incur and service debt and fund capital expenditures; and
|
|
•
|
the viability of acquisitions and other capital expenditure projects and the returns on investment of various investment opportunities.
|
56
We believe that the presentation of Adjusted EBITDA and Distributable Cash Flow provides useful information to investors in assessing our financial condition and results of operations. The U.S. GAAP measures most directly comparable to Adjusted EBITDA and Distributable Cash Flow are net income and net cash provided by operating activities. Adjusted EBITDA and Distributable Cash Flow should not be considered as alternatives to U.S. GAAP net income or net cash provided by operating activities. Adjusted EBITDA and Distributable Cash Flow have important limitations as analytical tools because they exclude some but not all items that affect net income and net cash provided by operating activities or any other measure of financial performance or liquidity presented in accordance with U.S. GAAP. Adjusted EBITDA and Distributable Cash Flow should not be considered in isolation or as substitutes for analysis of our results as reported under U.S. GAAP. Additionally, because Adjusted EBITDA and Distributable Cash Flow may be defined differently by other companies in our industry, our definitions of Adjusted EBITDA and Distributable Cash Flow may not be comparable to similarly titled measures of other companies, thereby diminishing their utility.
For a reconciliation of Adjusted EBITDA and Distributable Cash Flow to their most comparable measures calculated and presented in accordance with U.S. GAAP, see Item 6. Selected Financial Data – Non-GAAP Financial Measures.
FACTORS AFFECTING THE COMPARABILITY OF OUR FINANCIAL RESULTS
Our results of operations subsequent to the Offering are not comparable to our Predecessor’s historical results of operations for the reasons described below:
Joint Interest Assets.
Our Predecessor’s results of operations historically included revenues and expenses relating to our Predecessor’s minority undivided joint interests in the Capline and Maumee crude oil pipeline systems. We refer to our Predecessor’s minority undivided joint interests in these pipeline systems as the joint interest assets. While third parties operated the joint interest assets, our Predecessor published tariffs and collected revenues from shippers that utilized capacity attributable to our Predecessor’s undivided interest portion of the joint interest assets, and paid the operator of the joint interest assets for our Predecessor’s proportionate share of all costs and expenses related to the operation and maintenance of the joint interest assets. MPC did not contribute the joint interest assets to us in connection with the Offering and our results of operations subsequent to the Offering do not include the joint interest assets.
General Partner Interest in Pipe Line Holdings.
Our Predecessor’s results of operations historically included 100 percent of the revenues and expenses relating to the assets that were contributed to us, as well as the joint interest assets that were not contributed to us. At the closing of the Offering, MPC contributed to us a
51.0 percent
general partner interest in Pipe Line Holdings. For periods subsequent to the Offering through April 30, 2013, we consolidated the results of operations of Pipe Line Holdings and then recorded a
49.0 percent
noncontrolling interest deduction for the limited partner interest in Pipe Line Holdings retained by MPC. On
May 1, 2013
, we acquired an additional
5.0 percent
interest in Pipe Line Holdings from MPC for consideration of $100.0 million in cash. Following the acquisition, we continued to consolidate the results of operations of Pipe Line Holdings and then recorded a
44.0 percent
noncontrolling interest deduction for the limited partner interest in Pipe line Holdings retained by MPC.
Neal Butane Cavern.
Our Predecessor’s results of operations historically have included no revenues or expenses associated with our Neal butane cavern. The cavern was placed into service on August 1, 2012, and was contributed to the Partnership at the closing of the Offering.
Revenues.
Following the Offering, most of our revenues are generated from the transportation and storage services agreements that we entered into with MPC in conjunction with the Offering and under which MPC pays us fees for transporting crude oil and products on our pipeline systems, for handling crude oil and products at our barge dock and for providing storage services at our tank farms and butane cavern. These contracts contain minimum quarterly volume commitments. Historically, our Predecessor did not have long-term transportation and storage arrangements with MPC. In addition, we generate revenue generally not previously recognized by our Predecessor related to the following:
|
•
|
a tariff increase that went into effect in October 2012 on our Patoka, Illinois to Catlettsburg, Kentucky crude oil pipeline related to upgrades on that pipeline;
|
|
•
|
a tariff increase that went into effect in October 2012 on our Robinson, Illinois to Mt. Vernon, Indiana product pipeline to more accurately reflect our costs of operating the pipeline; and
|
|
•
|
general tariff increases that went into effect on a majority of our pipeline systems on July 1, 2013 in accordance with the FERC’s indexing methodology.
|
57
General and Administrative Expenses.
Our Predecessor’s general and administrative expenses included direct charges for the management and operation of our assets and certain overhead and shared services expenses allocated by MPC, as well as certain overhead expenses allocated by Marathon Oil through June 30, 2011, for general and administrative services, such as information technology, engineering, legal, human resources and other financial and administrative services. These expenses were charged or allocated to our Predecessor based on the nature of the expenses and our Predecessor’s proportionate share of utilization, capital employed, wages or headcount. Following the Offering, MPC continues to charge us administrative and operational services, which are higher than those charged to our Predecessor due to MPC’s provision of additional services and a fixed annual fee for the provision of executive management services by certain executive officers of our general partner. We also incur incremental annual general and administrative expenses as a result of being a stand-alone publicly traded partnership.
Financing.
There are differences in the way we finance our operations as compared to the way our Predecessor financed its operations. Historically, our Predecessor’s operations were financed as part of MPC’s integrated operations and our Predecessor did not record any separate costs associated with financing its operations. Additionally, our Predecessor largely relied on internally generated cash flows and capital contributions from MPC to satisfy its capital expenditure requirements. Following the Offering, we intend to make quarterly cash distributions to our unitholders. Based on the terms of our cash distribution policy, we expect that we will distribute to our unitholders and our general partner most of the excess cash generated by our operations. We expect to fund future expansion capital expenditures beyond amounts funded with proceeds retained from the Offering primarily from external sources, including borrowings under our
$500.0 million
revolving credit agreement and potential future issuances of equity and debt securities.
Spinoff from Marathon Oil.
Effective June 30, 2011, Marathon Oil engaged in a spinoff of its refining, marketing and transportation business into an independent, publicly traded company, MPC, through the distribution of MPC common stock to the stockholders of Marathon Oil common stock. MPC’s consolidated financial statements do not include all of the actual expenses that would have been incurred had MPC been a stand-alone company during periods prior to the spinoff and may not reflect MPC’s consolidated results of operations, financial position and cash flows had MPC been a stand-alone company during those periods. Actual costs that would have been incurred if MPC had been a stand-alone company depend upon multiple factors, including organizational structure and strategic decisions made in various areas, including information technology and infrastructure. Subsequent to the spinoff, MPC began performing these functions using internal resources or services provided by third parties, certain of which were provided by Marathon Oil during a transition period pursuant to a transition services agreement. As a result, our Predecessor’s historical financial statements for periods prior to the spinoff do not include all of the actual expenses that would have been allocated to our Predecessor had MPC been a stand-alone company during periods prior to the spinoff.
FACTORS THAT IMPACT OUR BUSINESS
Supply and Demand for Crude Oil and Products.
We generate the substantial majority of our revenues under fee-based contracts with MPC. These contracts are intended to promote cash flow stability and minimize our direct exposure to commodity price fluctuations. Since we do not take ownership of the crude oil or products that we transport and store for our customers, and we do not engage in the trading of any commodities, our direct exposure to commodity price fluctuations is limited to our treatment of volume imbalances on our pipeline systems. However, we also have indirect exposure to commodity price fluctuations to the extent such fluctuations affect the shipping patterns of MPC or our other customers. Our throughput volumes depend primarily on the volume of refined products produced at MPC’s refineries, which in turn is ultimately dependent on MPC’s refining margins. Refining margins depend on the cost of crude oil or other feedstocks and the price of refined products. These prices are affected by numerous factors beyond our or MPC’s control, including the domestic and global supply of and demand for crude oil and refined products. While we believe we have substantially mitigated our indirect exposure to commodity price fluctuations through the minimum volume commitments in our transportation and storage services agreements with MPC during the respective terms of those agreements, our ability to execute our growth strategy in our areas of operation will depend on the availability of attractively priced crude oil in the areas served by our pipelines, which is also affected by the overall supply of and demand for crude oil. Certain measures of commercial activity that are correlated with crude oil and products demand continue to show moderate improvement. Certain measures of commercial activity that are correlated with crude oil and products demand continue to show improvement. We expect strengthening economic growth domestically and globally to support domestic demand for refined products.
58
Changes in Crude Oil Sourcing and Refined Product Demand Dynamics.
One of the strategic advantages of our crude oil pipeline systems is their ability to transport attractively priced crude oil from multiple supply markets. Our crude oil shippers, including MPC, periodically change the relative mix of crude oil grades used at the refineries served by our pipelines depending on the availability and pricing of different grades of crude oil, as well as changes in the pricing and demand dynamics in the various refined product markets that are served by those refineries. Changes in the crude oil sourcing patterns of our crude oil shippers are reflected in changes in the relative volumes of crude oil handled by our various pipeline systems from period to period. While these changes in relative volumes can affect the revenue attributable to specific crude oil pipeline systems due to differences in tariffs and viscosity surcharges, generally our total crude oil transportation revenues are significantly affected only by changes in overall crude oil supply and demand dynamics.
Similarly, our product pipeline systems have the ability to serve multiple end user markets. Our refined products shippers, including MPC, periodically change the relative mix of refined products shipped on our refined products pipelines, as well as the destination points, based on changes in the pricing and demand dynamics in the various refined product markets that our refined products pipelines serve. Changes in the refined products shipping patterns of our shippers are reflected in relative volumes of refined products handled by our various pipeline systems from period to period. While these changes in relative volumes can affect the revenue attributable to specific refined products pipeline systems due to differences in tariffs, generally our total product transportation revenues are significantly affected only by changes in overall refined products supply and demand dynamics.
Acquisition Opportunities.
We plan to pursue acquisitions of complementary assets from MPC as well as third parties. We believe MPC will offer us the opportunity to purchase additional assets from it, including additional interests in our network of pipeline systems, barge dock and tank farms that it has retained through its interest in Pipe Line Holdings. However, MPC is under no obligation to offer to sell us additional assets or to pursue acquisitions cooperatively with us, and we are under no obligation to buy any such additional assets or pursue any such cooperative acquisitions. Our third-party acquisition strategy may include midstream assets both within our existing geographic footprint and in new areas. We believe MPC will promote and support the successful execution of our business strategies given its significant ownership in us following the Offering and its stated intention to use us to grow its midstream business. We believe that we will be well positioned to acquire midstream assets from MPC and third parties should such opportunities arise, and identifying and executing acquisitions will be a key part of our strategy. However, if we do not make acquisitions on economically acceptable terms, our future growth will be limited, and the acquisitions we do make may reduce, rather than increase, our cash available for distribution.
Third-Party Business.
In the future, we plan to seek increased third-party volumes on our crude oil and product pipelines. We believe that the strategic location of our assets and their ability to access attractively priced crude oil and to supply products to attractive markets may create opportunities to capture incremental third-party business and facilitate our growth. The substantial majority of our revenue is generated under our transportation and storage services agreements with, and tariffs and fees paid by, MPC. Unless we are successful in attracting third-party customers, our ability to increase volumes will be dependent on MPC and its future growth.
Seasonality.
The crude oil and products transported on our pipeline systems and at our barge dock and stored at our storage assets is directly affected by the level of supply and demand for crude oil and products in the markets served directly or indirectly by our assets. However, many effects of seasonality on our revenues will be substantially mitigated through the use of our fee-based transportation and storage services agreements with MPC that include minimum volume commitments. We historically have spent approximately two-thirds of both our budgeted maintenance capital expenditures and budgeted pipeline integrity, repair and maintenance expenses during the third and fourth quarter of each calendar year due to our budgeting cycle, weather and safety concerns. In the future, we will seek to manage our maintenance capital expenditures on our pipeline systems and storage assets by scheduling maintenance over time to avoid significant variability in our maintenance expenditures and minimize their impact on our cash flow.
59
RESULTS OF OPERATIONS
The consolidated statements of income in Item 8. Financial Statements and Supplementary Data include the results of operations of our Predecessor for periods prior to
October 31, 2012
, and results of the Partnership subsequent to
October 31, 2012
. Our future results of operations subsequent to the Offering may not be comparable to our Predecessor’s historical results of operations for the reasons discussed above under – Factors Affecting the Comparability of Our Financial Results.
Years Ended
December 31, 2013
and December 31, 2012
|
(In millions, except per barrel data)
|
2013
|
2012
|
Variance
|
|||||||||
|
Revenues and other income:
|
||||||||||||
|
Sales and other operating revenues
|
$
|
78.9
|
|
$
|
74.4
|
|
$
|
4.5
|
|
|||
|
Sales to related parties
|
384.2
|
|
367.8
|
|
16.4
|
|
||||||
|
Loss on sale of assets
|
—
|
|
(0.3
|
)
|
0.3
|
|
||||||
|
Other income
|
4.4
|
|
6.9
|
|
(2.5
|
)
|
||||||
|
Other income - related parties
|
18.8
|
|
13.1
|
|
5.7
|
|
||||||
|
Total revenues and other income
|
486.3
|
|
461.9
|
|
24.4
|
|
||||||
|
Costs and expenses:
|
||||||||||||
|
Cost of revenues (excludes items below)
|
135.9
|
|
173.8
|
|
(37.9
|
)
|
||||||
|
Purchases from related parties
|
94.6
|
|
44.4
|
|
50.2
|
|
||||||
|
Depreciation
|
48.9
|
|
39.4
|
|
9.5
|
|
||||||
|
General and administrative expenses
|
53.7
|
|
49.8
|
|
3.9
|
|
||||||
|
Other taxes
|
6.2
|
|
11.3
|
|
(5.1
|
)
|
||||||
|
Total costs and expenses
|
339.3
|
|
318.7
|
|
20.6
|
|
||||||
|
Income from operations
|
147.0
|
|
143.2
|
|
3.8
|
|
||||||
|
Related party interest and other financial income
|
—
|
|
1.3
|
|
(1.3
|
)
|
||||||
|
Net interest and other financial income (costs)
|
(1.1
|
)
|
(0.2
|
)
|
(0.9
|
)
|
||||||
|
Income before income taxes
|
145.9
|
|
144.3
|
|
1.6
|
|
||||||
|
Provision (benefit) for income taxes
|
(0.2
|
)
|
0.3
|
|
(0.5
|
)
|
||||||
|
Net income
|
146.1
|
|
144.0
|
|
2.1
|
|
||||||
|
Less: Net income attributable to MPC-retained interest
|
68.2
|
|
13.2
|
|
55.0
|
|
||||||
|
Net income attributable to MPLX LP
|
$
|
77.9
|
|
$
|
130.8
|
|
$
|
(52.9
|
)
|
|||
|
Adjusted EBITDA attributable to MPLX LP
(1)
|
$
|
111.2
|
|
$
|
166.3
|
|
$
|
(55.1
|
)
|
|||
|
Distributable Cash Flow attributable to MPLX LP
(1)(2)
|
114.6
|
|
16.7
|
|
97.9
|
|
||||||
|
Pipeline throughput (mbpd):
|
||||||||||||
|
Crude oil pipelines
|
1,063
|
|
1,147
|
|
(84
|
)
|
||||||
|
Product pipelines
|
911
|
|
980
|
|
(69
|
)
|
||||||
|
Total
|
1,974
|
|
2,127
|
|
(153
|
)
|
||||||
|
Average tariff rates ($ per barrel):
(3)
|
||||||||||||
|
Crude oil pipelines
|
$
|
0.61
|
|
$
|
0.57
|
|
$
|
0.04
|
|
|||
|
Product pipelines
|
0.56
|
|
0.51
|
|
0.05
|
|
||||||
|
Total pipelines
|
0.59
|
|
0.54
|
|
0.05
|
|
||||||
|
(1)
|
Non-GAAP financial measure. See Item 6. Selected Financial Data - Non-GAAP Financial Measures for a reconciliation to the most directly comparable GAAP measures.
|
|
(2)
|
For period subsequent to the Offering.
|
|
(3)
|
Average tariff rates calculated using pipeline transportation revenues divided by pipeline throughput barrels.
|
60
Sales and other operating revenues
increased
$4.5 million
in
2013
compared to
2012
. This
increase
was primarily due to a
$4.1 million
increase related to higher average tariffs received on the volumes of crude oil and products shipped and $5.4 million related to higher crude oil volumes shipped, partially offset by a $5.0 million decrease in product volumes shipped.
Sales to related parties
increased
$16.4 million
in
2013
compared to
2012
. This increase was primarily related to
$52.4 million
of higher average tariffs received on the volumes of crude oil and products shipped, due largely to our Patoka to Catlettsburg and other crude oil systems, a
$15.7 million
increase in storage fees and other revenue and the recognition of $4.0 million of deferred revenue from expired volume deficiency credits. The increase was partially offset by a
$55.7 million
decrease primarily related to a
104
mbpd decrease in related party crude oil volumes shipped. The decrease in crude oil volumes shipped was mostly due to the absence of volumes transported on the joint interest assets in 2012.
Other income and other income - related parties
increased
a total of
$3.2 million
in
2013
compared to
2012
. The net increase was primarily due to an increase in fees received for operating MPC’s private pipeline systems.
Cost of revenues
decreased
$37.9 million
in
2013
compared to
2012
. The decrease was primarily due to certain salaries and benefits expenses being classified as related party purchases in
2013
. The decrease was also impacted by the inclusion of
$10.9 million
in expenses related to the joint interest assets in
2012
.
Purchases from related parties
increased
$50.2 million
in
2013
compared to
2012
. The increase was primarily due to salary and benefit costs under the employee services agreements being classified as related party purchases in
2013
rather than cost of revenues in 2012, and the cost of increased services provided under the omnibus agreement after the Offering.
Depreciation
expense
increased
$9.5 million
in
2013
compared to
2012
due to the Neal butane cavern and other capital projects being in service during
2013
and a $0.9 million charge for the cancellation of a portion of a pipeline upgrade project, partially offset by the inclusion of
$5.8 million
in
2012
related to the joint interest assets.
General and administrative expenses
increased
$3.9 million
in
2013
compared to
2012
. The increase in
2013
is due to higher service costs from MPC after the Offering and the increased costs of being a publicly traded partnership, partially offset by $10.1 million of pension settlement expense and $2.6 million of expenses related to the joint interest assets included in
2012
.
Other taxes decreased $5.1 million in 2013 compared to 2012. The decrease is primarily due to payroll taxes under the employee services agreement being classified as related party purchases in 2013 rather than other taxes in 2012.
Related party interest and other financial income
decreased
$1.3 million
in
2013
compared to
2012
. We had interest income on loans receivable from MPC Investment Fund, Inc. (“MPCIF”) in
2012
. This arrangement was terminated prior to the Offering. See Item 8. Financial Statements and Supplementary Data - Note 5 for further discussion of our loans receivable from MPCIF.
During
2013
, MPC did not ship its minimum committed volumes on certain of our pipeline systems. As a result, MPC was obligated to make $34.4 million of deficiency payments, which we have recorded as deferred revenue-related parties on our consolidated balance sheet. During 2013, $4.6 million of deficiency volume credits were used or expired, which we have recorded as revenue. At
December 31, 2013
, the cumulative balance of deferred revenue-related parties on our consolidated balance sheet was
$34.0 million
. The following table presents the future expiration dates of the associated deferred revenue credits:
|
(in millions)
|
||||
|
March 31, 2014
|
$
|
8.9
|
|
|
|
June 30, 2014
|
5.3
|
|
||
|
September 30, 2014
|
8.9
|
|
||
|
December 31, 2014
|
10.9
|
|
||
|
Total
|
$
|
34.0
|
|
|
We will recognize revenue for the deficiency payments in future periods at the earlier of when volumes are transported in excess of the minimum quarterly volume commitments, when it becomes impossible to physically transport volumes necessary to utilize the accumulated credits or upon expiration of the make-up period. However, deficiency payments are included in the determination of Distributable Cash Flow in the period in which a deficiency occurs.
61
Years Ended
December 31, 2012
and December 31, 2011
|
(In millions, except per barrel data)
|
2012
|
2011
|
Variance
|
|||||||||
|
Revenues and other income:
|
||||||||||||
|
Sales and other operating revenues
|
$
|
74.4
|
|
$
|
62.1
|
|
$
|
12.3
|
|
|||
|
Sales to related parties
|
367.8
|
|
334.8
|
|
33.0
|
|
||||||
|
Loss on sale of assets
|
(0.3
|
)
|
—
|
|
(0.3
|
)
|
||||||
|
Other income
|
6.9
|
|
4.3
|
|
2.6
|
|
||||||
|
Other income - related parties
|
13.1
|
|
9.4
|
|
3.7
|
|
||||||
|
Total revenues and other income
|
461.9
|
|
410.6
|
|
51.3
|
|
||||||
|
Costs and expenses:
|
||||||||||||
|
Cost of revenues (excludes items below)
|
173.8
|
|
162.9
|
|
10.9
|
|
||||||
|
Purchases from related parties
|
44.4
|
|
29.0
|
|
15.4
|
|
||||||
|
Depreciation
|
39.4
|
|
36.3
|
|
3.1
|
|
||||||
|
General and administrative expenses
|
49.8
|
|
38.5
|
|
11.3
|
|
||||||
|
Other taxes
|
11.3
|
|
11.9
|
|
(0.6
|
)
|
||||||
|
Total costs and expenses
|
318.7
|
|
278.6
|
|
40.1
|
|
||||||
|
Income from operations
|
143.2
|
|
132.0
|
|
11.2
|
|
||||||
|
Related party interest and other financial income
|
1.3
|
|
2.3
|
|
(1.0
|
)
|
||||||
|
Net interest and other financial income (costs)
|
(0.2
|
)
|
(0.2
|
)
|
—
|
|
||||||
|
Income before income taxes
|
144.3
|
|
134.1
|
|
10.2
|
|
||||||
|
Provision for income taxes
|
0.3
|
|
0.1
|
|
0.2
|
|
||||||
|
Net income
|
144.0
|
|
134.0
|
|
10.0
|
|
||||||
|
Less: Net income attributable to MPC-retained interest
|
13.2
|
|
—
|
|
13.2
|
|
||||||
|
Net income attributable to MPLX LP
|
$
|
130.8
|
|
$
|
134.0
|
|
$
|
(3.2
|
)
|
|||
|
Adjusted EBITDA attributable to MPLX LP
(1)
|
$
|
166.3
|
|
$
|
168.3
|
|
$
|
(2.0
|
)
|
|||
|
Distributable Cash Flow attributable to MPLX LP
(1)(2)
|
16.7
|
|
||||||||||
|
Pipeline throughput (mbpd):
|
||||||||||||
|
Crude oil pipelines
|
1,147
|
|
1,184
|
|
(37
|
)
|
||||||
|
Product pipelines
|
980
|
|
1,031
|
|
(51
|
)
|
||||||
|
Total
|
2,127
|
|
2,215
|
|
(88
|
)
|
||||||
|
Average tariff rates ($ per barrel):
(3)
|
||||||||||||
|
Crude oil pipelines
|
$
|
0.57
|
|
$
|
0.48
|
|
$
|
0.09
|
|
|||
|
Product pipelines
|
0.51
|
|
0.46
|
|
0.05
|
|
||||||
|
Total pipelines
|
0.54
|
|
0.47
|
|
0.07
|
|
||||||
|
(1)
|
Non-GAAP financial measure. See Item 6. Selected Financial Data - Non-GAAP Financial Measures for a reconciliation to the most directly comparable GAAP measures.
|
|
(2)
|
For period subsequent to the Offering.
|
|
(3)
|
Average tariff rates calculated using pipeline transportation revenues divided by pipeline throughput barrels.
|
62
Total sales and other operating revenues, including sales to related parties, increased $45.3 million in 2012 compared to 2011, due to a $33.0 million increase in sales to related parties and a $12.3 million increase in sales and other operating revenues to third parties. The increase in sales to related parties was primarily related to a $50.4 million increase due to higher average tariffs received on the volumes of crude oil and products shipped, primarily due to our Patoka to Catlettsburg and other crude oil systems, partially offset by a $20.4 million decrease related to a 122 mbpd decrease in related party crude oil and products volumes shipped. The decrease in volumes shipped was primarily related to the Capline crude system and the Garyville to Zachary, Louisiana products system. We converted a products pipeline to crude oil service and made improvements to our barge dock, which partially offset a decrease in volumes shipped on the Capline crude system. The increase in sales and other operating revenues was primarily related to a $6.4 million increase due to higher average tariffs received on the volumes of crude oil and products shipped and a $5.7 million increase related to a 34 mbpd increase in third-party crude oil and product volumes shipped.
Other income and other income – related parties increased $6.3 million in 2012 compared to 2011. The increase was primarily due to an increase in fees received for operating MPC’s private pipeline systems, partially offset by a decrease in operating fees received from Marathon Oil. The higher operating fees received from MPC were increased to reflect arm’s-length rates.
Cost of revenues increased $10.9 million in 2012 compared to 2011. The increases were primarily due to higher spending on mechanical integrity work on our pipelines partially offset by salaries and benefits being classified as related party purchases subsequent to October 1, 2012.
Purchases from related parties increased $15.4 million in 2012 compared to 2011. The increase was primarily due to the transfer of employees on October 1, 2012 from our Predecessor to MPC in anticipation of the Offering. Additionally, the cost of services provided under the employee services and omnibus agreements increased after the Offering.
Depreciation increased $3.1 million in 2012 compared to 2011 due to capital projects being placed in service in 2012.
General and administrative expenses increased $11.3 million in 2012 compared to 2011. The increase was primarily due to $10.1 million of pension settlement expenses recorded in 2012. Higher service costs from MPC after the Offering also contributed to the increase.
Related party interest and other financial income decreased $1.0 million in 2012 compared to 2011. We had an increase of $0.9 million in interest income in 2012 from loans receivable from MPCIF, a wholly-owned subsidiary of MPC, compared to $1.9 million of dividend income in 2011 from our investment in preferred stock of MOC Portfolio Delaware, Inc. (“PFD”), a subsidiary of Marathon Oil. See Item 8. Financial Statements and Supplementary Data – Note 5 for further discussion of our loans receivable from MPCIF and our investment in PFD preferred stock.
LIQUIDITY AND CAPITAL RESOURCES
Cash Flows
Our cash and cash equivalents balance was
$54.1 million
at
December 31, 2013
compared to
$216.7 million
at
December 31, 2012
. The change in cash and cash equivalents was due to the factors discussed below. Net cash provided by (used in) operating activities, investing activities and financing activities for the past three years were as follows:
|
(In millions)
|
2013
|
2012
|
2011
|
|||||||||
|
Net cash provided by (used in):
|
||||||||||||
|
Operating activities
|
$
|
212.2
|
|
$
|
190.6
|
|
$
|
181.9
|
|
|||
|
Investing activities
|
(113.6
|
)
|
87.4
|
|
(218.7
|
)
|
||||||
|
Financing activities
|
(261.2
|
)
|
(61.4
|
)
|
36.7
|
|
||||||
|
Total
|
$
|
(162.6
|
)
|
$
|
216.6
|
|
$
|
(0.1
|
)
|
|||
Cash Flows Provided by Operating Activities.
Net cash provided by operating activities
increased
$21.6 million
in
2013
compared to
2012
, primarily due to a $2.1 million increase in net income, a
$7.1 million
favorable impact from changes in working capital and a $11.5 million increase in non-cash adjustments. Net cash provided by operating activities increased $8.7 million in 2012 compared to 2011, primarily due to a $10.0 million increase in net income, a $4.4 million favorable impact from changes in working capital and $1.5 million increase in non-cash adjustments, partially offset by a $7.2 million increase in asset retirement expenditures.
63
For 2013, changes in working capital were a net
$23.0 million
source of cash, primarily due to an increase in net liabilities to related parties and a decrease in third-party receivables. Net liabilities to related parties increased
$18.9 million
from 2012, primarily due to an increase in deferred revenue associated with deficiency payments, partially offset by an increase in receivables from related parties. Third-party receivables decreased
$5.4 million
primarily associated with lower tariff revenue receivables from lower product volumes shipped.
For 2012, changes in working capital were a net
$15.9 million
source of cash, primarily due to an increase in net liabilities to related parties, partially offset by a decrease in accounts payable and accrued liabilities. Net liabilities to related parties increased
$26.9 million
from 2011 due to an increase in payables to MPC for services performed under the employee services and omnibus agreement and a decrease in receivables from MPC due to the initiation of monthly cash settlements in 2012. Accounts payable and accrued liabilities decreased
$8.0 million
from 2011 primarily due to the elimination of payroll and benefits payable following the transfer of our Predecessor's employees to MPC.
For 2011, changes in working capital were a net $11.5 million source of cash, primarily due to an $11.2 million increase in accounts payable and accrued liabilities, primarily related to the timing of project expenditures.
Cash Flows Used in Investing Activities.
Investing activities were a $113.6 million use of cash in 2013 compared to a $87.4 million source of cash in 2012. The $201.0 million change was primarily due to the absence of loan repayments by MPCIF of
$221.7 million
in 2013 and a
$7.3 million
reduction in all other assets, net, partially offset by a
$29.1 million
decrease in additions to property, plant and equipment. Cash used for additions to property, plant and equipment were
$106.5 million
in
2013
and
$135.6 million
in
2012
and were primarily due to expansion capital expenditures, including the major upgrade project on our Patoka to Catlettsburg crude oil pipeline which was completed in 2013.
Investing activities were an $87.4 million source of cash in 2012 compared to a $218.7 million use of cash in 2011. The change was primarily due to a $441.7 million change in cash flows from loans to related parties, partially offset by an $85.8 million increase in additions to property, plant and equipment and a $51.1 million decrease in cash provided by investments in related party debt securities. Loans to related parties consisted of repayments from MPCIF of $221.7 million in 2012 compared to advances to MPCIF of $220.0 million in 2011. We terminated the agreement with MPCIF effective September 28, 2012 in connection with the Offering. See Item 8. Financial Statements and Supplementary Data - Note 5 for information of the loans receivable from MPCIF.
Additions to property, plant and equipment of $135.6 million in 2012 were primarily due to expansion capital expenditures, including the major upgrade project on our Patoka to Catlettsburg crude oil pipeline. Additions to property, plant and equipment of $49.8 million in 2011 were also primarily expansion capital expenditures. Investments in related party debt securities consisted of net redemptions of PFD preferred stock of $51.1 million in 2011 compared to no activity in 2012 since the agreement with PFD was terminated in June 2011.
Cash Flows from Financing Activities.
Financing activities were a use of cash of
$261.2 million
in
2013
, a use of cash of
$61.4 million
in
2012
and a source of cash of $36.7 million in 2011. The use of cash in
2013
was primarily due to distributions to MPC of
$100.0 million
related to the acquisition of the additional 5.0 percent interest in Pipe Line Holdings, quarterly distributions of
$82.7 million
to MPC for its retained noncontrolling interest in Pipe Line Holdings and quarterly distributions of
$77.8 million
to unitholders. Distributions to MPC were $262.7 million in
2012
. Net proceeds from the Offering in
2012
were $407.1 million and $202.7 million of these proceeds were distributed to MPC. We paid debt issuance costs of $2.4 million in 2012. In 2011, we had net contributions from MPC of $37.3 million.
Capital Resources
We expect our ongoing sources of liquidity to include cash generated from operations, borrowings under our revolving credit agreement and issuances of additional debt and equity securities. We believe that cash generated from these sources will be sufficient to meet our short-term working capital requirements and long-term capital expenditure requirements and to make quarterly cash distributions. Following the Offering, MPC manages our cash and cash equivalents on our behalf directly with third-party institutions as part of the treasury services that it provides to us under our omnibus agreement.
On September 14, 2012, MPLX Operations, an affiliate of MPC and a wholly-owned subsidiary of the Partnership, as the borrower, and the Partnership, as the parent guarantor, entered into a five-year revolving credit agreement (“Credit Agreement”) with a syndicate of lenders. The Credit Agreement became effective following the Offering and has an initial borrowing capacity of $500.0 million. MPLX Operations has the right to seek to increase the total amount available under the Credit Agreement to $800.0 million, subject to certain conditions. The Credit Agreement includes letter of credit issuing capacity of up to $250.0 million and swingline loan capacity of up to $50.0 million. The Credit Agreement can be extended for up to two additional one-year periods, subject to certain commitments. There were no borrowings or letters of credit outstanding under the Credit Agreement at
December 31, 2013
and
2012
.
64
The Credit Agreement contains representations and warranties, affirmative and negative covenants and events of default that we consider usual and customary for an agreement of that type, and that could, among other things, limit our ability to pay distributions to our unitholders. The financial covenant requires us to maintain a ratio of Consolidated Total Debt (as defined in the Credit Agreement) as of the end of each fiscal quarter to Consolidated EBITDA (as defined in the Credit Agreement) for the prior four fiscal quarters of not greater than 5.0 to 1.0 (or 5.5 to 1.0 during the six-month period following certain acquisitions). At
December 31, 2013
, we were in compliance with this financial covenant with a ratio of Consolidated Total Debt to Consolidated EBITDA of 0.1 to 1.0, as well as other covenants contained in the Credit Agreement.
Borrowings under the Credit Agreement bear interest at the Adjusted LIBO Rate plus a margin, or the Alternate Base Rate plus a margin (as defined in the Credit Agreement). The Credit Agreement also provides for customary fees, including administrative agent fees, commitment fees ranging from 0.10 percent to 0.35 percent of the unused portion, depending on the Partnership’s ratio of Consolidated Total Debt to Consolidated EBITDA for the prior four fiscal quarters prior to the rating date, or the Partnership’s credit ratings subsequent to the rating date, fronting and issuance fees in respect to letters of credit and other fees.
Capital Requirements
Our operations are capital intensive, requiring investments to expand, upgrade or enhance existing operations and to meet environmental and operational regulations. Our capital requirements consist of maintenance capital expenditures and expansion capital expenditures. Examples of maintenance capital expenditures are those made to replace partially or fully depreciated assets, to maintain the existing operating capacity of our assets and to extend their useful lives, or other capital expenditures that are incurred in maintaining existing system volumes and related cash flows. In contrast, expansion capital expenditures are those incurred for acquisitions or capital improvements that we expect will increase our operating capacity or operating income over the long term. Examples of expansion capital expenditures include the acquisition of equipment or the construction, development or acquisition of additional pipeline or storage capacity.
Our capital expenditures for the past three years are shown in the table below:
|
(In millions)
|
2013
|
2012
|
2011
|
|||||||||
|
Maintenance
|
$
|
21.7
|
|
$
|
24.5
|
|
$
|
14.3
|
|
|||
|
Expansion
(1)
|
87.8
|
|
123.5
|
|
41.6
|
|
||||||
|
Total capital expenditures
|
109.5
|
|
148.0
|
|
55.9
|
|
||||||
|
Less: Increase (decrease) in capital accruals
|
(5.3
|
)
|
3.2
|
|
4.1
|
|
||||||
|
Asset retirement expenditures
|
8.3
|
|
9.2
|
|
2.0
|
|
||||||
|
Additions to property, plant and equipment
|
$
|
106.5
|
|
$
|
135.6
|
|
$
|
49.8
|
|
|||
|
(1)
|
Includes 100 percent of the joint interest assets capital expenditures for periods prior to the Offering.
|
Our capital budget (including retirement expenditures) for 2014 is $148 million, relating primarily to upgrades to replace or enhance our existing facilities and projects for new infrastructure. Included in the budget is $113 million for expansion capital expenditures, $29 million for various connections and new equipment at our Patoka tank farm, $24 million for a capacity expansion on our Mt. Vernon to Robinson Products system, $7 million related to a multi-year SCADA system upgrade project and $6 million on engineering for our recently announced Cornerstone Pipeline project in the Utica Shale area of Ohio, as described below. The budget also includes $35 million for maintenance capital expenditures, primarily related to valve replacement, safety and security expenditures and electrical system maintenance. We continuously evaluate our capital budget and make changes as conditions warrant.
As previously announced, we are planning to construct a $140 million pipeline to connect Utica Shale production in southeastern Ohio to MPC's Canton refinery. The project is named Cornerstone Pipeline and it is anticipated to be operational in 2016.
65
We intend to pay a minimum quarterly distribution of $0.2625 per unit, which equates to $19.8 million per quarter, or $79.2 million per year, based on the number of common, subordinated and general partner units currently outstanding. On
January 23, 2014
, we announced the board of directors of our general partner had declared a distribution of
$0.3125
per unit that was paid on
February 14, 2014
to unitholders of record on
February 4, 2014
. This represents an increase of $0.0150, or 5.0 percent, above the third quarter 2013 distribution of $0.2975 per unit and a 19.0 percent increase over the minimum quarterly distribution. This increase in the distribution is consistent with our intent to maintain an attractive distribution growth profile over the long term. Although our partnership agreement requires that we distribute all of our available cash each quarter, we do not otherwise have a legal obligation to distribute any particular amount per common unit.
Contractual Cash Obligations
The table below provides aggregated information on our consolidated obligations to make future payments under existing contracts as of
December 31, 2013
:
|
(In millions)
|
Total
|
2014
|
2015-2016
|
2017-2018
|
Later Years
|
|||||||||||||||
|
Revolving credit facility
(1)
|
$
|
4.0
|
|
$
|
1.1
|
|
$
|
2.1
|
|
$
|
0.8
|
|
$
|
—
|
|
|||||
|
Capital lease obligations
|
13.4
|
|
1.4
|
|
2.7
|
|
2.7
|
|
6.6
|
|
||||||||||
|
Operating lease obligations
|
51.0
|
|
8.7
|
|
16.8
|
|
14.6
|
|
10.9
|
|
||||||||||
|
Purchase obligations:
|
||||||||||||||||||||
|
Contracts to acquire property, plant & equipment
|
9.6
|
|
8.1
|
|
1.5
|
|
—
|
|
—
|
|
||||||||||
|
Other contracts
|
19.3
|
|
13.0
|
|
1.6
|
|
2.1
|
|
2.6
|
|
||||||||||
|
Total purchase obligations
|
28.9
|
|
21.1
|
|
3.1
|
|
2.1
|
|
2.6
|
|
||||||||||
|
Other liabilities
|
—
|
|
—
|
|
—
|
|
—
|
|
—
|
|
||||||||||
|
Total contractual cash obligations
|
$
|
97.3
|
|
$
|
32.3
|
|
$
|
24.7
|
|
$
|
20.2
|
|
$
|
20.1
|
|
|||||
|
(1)
|
Amounts represent commitment and administrative fees based on fee currently in place if no funds are borrowed.
|
In addition to the obligations included in the table above, in conjunction with the Offering, we entered into an omnibus agreement and an employee services agreement with MPC. The omnibus agreement with MPC addresses our payment of a fixed annual fee to MPC for the provision of executive management services by certain executive officers of our general partner and our reimbursement to MPC for the provision of certain general and administrative services to us. The omnibus agreement remains in full force and effect so long as MPC controls our general partner. Under the omnibus agreement, we pay to MPC in equal monthly installments an annual amount of approximately
$33.3 million
for the provision of certain general and administrative services by MPC. The annual amount includes a fixed annual fee of approximately
$3.5 million
for the provision of certain executive management services by certain officers of our general partner. We also pay MPC additional amounts based on the costs actually incurred by MPC in providing other services, except for the portion of the amount attributable to engineering services, which is based on the amounts actually incurred by MPC and its affiliates plus 6.0 percent of such costs. In addition, we are obligated to reimburse MPC for any out-of-pocket costs and expenses incurred by MPC on our behalf.
The employee services agreement with MPC addresses reimbursement to MPC for the provision of certain operational and management services to us in support of our pipelines, barge dock and tank farms. The employee services agreement has an initial term that extends through September 30, 2017. We pay MPC a monthly fee that reflects the total employee-based salary and wage costs (including accruals) incurred in providing the services during such month, including a monthly allocated portion of estimated employee benefit costs, bonus accrual, MPC stock-based compensation expense and employer payroll taxes, plus an additional $125,000.
66
Off-Balance Sheet Arrangements
As of
December 31, 2013
, we have not entered into any transactions, agreements or other arrangements that would result in off-balance sheet liabilities.
Our opinions concerning liquidity and capital resources and our ability to avail ourselves in the future of the financing options mentioned in the above forward-looking statements are based on currently available information. If this information proves to be inaccurate, future availability of financing may be adversely affected. Factors that affect the availability of financing include our performance (as measured by various factors, including cash provided by operating activities), the state of worldwide debt and equity markets, investor perceptions and expectations of past and future performance, the global financial climate, and, in particular, with respect to borrowings, the levels of our outstanding debt and future credit ratings by rating agencies. The discussion of liquidity and capital resources above also contains forward-looking statements regarding expected capital spending. The forward-looking statements about our capital budget are based on current expectations, estimates and projections and are not guarantees of future performance. Actual results may differ materially from these expectations, estimates and projections and are subject to certain risks, uncertainties and other factors, some of which are beyond our control and are difficult to predict. Some factors that could cause actual results to differ materially include prices of and demand for crude oil and refined products, actions of competitors, delays in obtaining necessary third-party approvals, changes in labor, material and equipment costs and availability, planned and unplanned outages, the delay of, cancellation of or failure to implement planned capital projects, project overruns, disruptions or interruptions of our pipeline operations due to the shortage of skilled labor and unforeseen hazards such as weather conditions, acts of war or terrorist acts and the governmental or military response, and other operating and economic considerations.
TRANSACTIONS WITH RELATED PARTIES
Following completion of the Offering, MPC held a 2.0 percent general partner interest and a 71.6 percent limited partner interest in MPLX LP. See Item 8. Financial Statements and Supplementary Data – Note 4 for further discussion of the Offering.
Excluding revenues attributable to volumes shipped by MPC under joint tariffs with third parties that are treated as third-party revenues for accounting purposes, MPC accounted for
82.6 percent
,
82.2 percent
and
83.1 percent
of our total revenues and other income for
2013
,
2012
and
2011
. We provide crude oil and product pipeline transportation services based on regulated tariff rates and storage services based on contracted rates. MPC accounted for
41.7 percent
,
28.3 percent
and
22.4 percent
of our total costs and expenses for
2013
,
2012
and
2011
. MPC and, with respect to periods prior to June 30, 2011, Marathon Oil performed certain services for us related to information technology, engineering, legal, human resources and other financial and administrative services. We believe that transactions with related parties, other than certain transactions with MPC and Marathon Oil for periods prior to the Offering, related to the provision of administrative services, have been conducted under terms comparable to those with unrelated parties. For further discussion of activity with related parties and MPC see Item 1. Business – Our Transportation and Storage Services Agreements with MPC, – Operating and Management Services Agreements with MPC and Third Parties, – Other Agreements with MPC and Item 8. Financial Statements and Supplementary Data – Note 5.
ENVIRONMENTAL MATTERS AND COMPLIANCE COSTS
We are subject to extensive federal, state and local environmental laws and regulations. These laws, which change frequently, regulate the discharge of materials into the environment or otherwise relate to protection of the environment. Compliance with these laws and regulations may require us to remediate environmental damage from any discharge of petroleum or chemical substances from our facilities or require us to install additional pollution control equipment on our equipment and facilities. Our failure to comply with these or any other environmental or safety-related regulations could result in the assessment of administrative, civil or criminal penalties, the imposition of investigatory and remedial liabilities, and the issuance of injunctions that may subject us to additional operational constraints.
Future expenditures may be required to comply with the Clean Air Act and other federal, state and local requirements for our various sites, including our pipelines and storage assets. The impact of these legislative and regulatory developments, if enacted or adopted, could result in increased compliance costs and additional operating restrictions on our business, each of which could have an adverse impact on our financial position, results of operations and liquidity. MPC will indemnify us for certain of these costs under the omnibus agreement.
67
If these expenditures, as with all costs, are not ultimately reflected in the tariffs and other fees we receive for our services, our operating results will be adversely affected. We believe that substantially all of our competitors must comply with similar environmental laws and regulations. However, the specific impact on each competitor may vary depending on a number of factors, including, but not limited to, the age and location of its operating facilities. Our environmental expenditures for each of the past three years were:
|
(In millions)
|
2013
|
2012
|
2011
|
|||||||||
|
Capital
|
$
|
0.5
|
|
$
|
2.4
|
|
$
|
3.5
|
|
|||
|
Percent of total capital expenditures
|
—
|
%
|
2
|
%
|
6
|
%
|
||||||
|
Compliance:
|
||||||||||||
|
Operating and maintenance
|
$
|
40.5
|
|
$
|
24.7
|
|
$
|
23.2
|
|
|||
|
Remediation
(1)
|
4.7
|
|
2.8
|
|
0.6
|
|
||||||
|
Total
|
$
|
45.2
|
|
$
|
27.5
|
|
$
|
23.8
|
|
|||
|
(1)
|
These amounts include spending charged against remediation reserves, where permissible, but exclude non-cash accruals for environmental remediation.
|
We accrue for environmental remediation activities when the responsibility to remediate is probable and the amount of associated costs can be reasonably estimated. As environmental remediation matters proceed toward ultimate resolution or as additional remediation obligations arise, charges in excess of those previously accrued may be required.
New or expanded environmental requirements, which could increase our environmental costs, may arise in the future. We believe we comply with all legal requirements regarding the environment, but since not all of them are fixed or presently determinable (even under existing legislation) and may be affected by future legislation or regulations, it is not possible to predict all of the ultimate costs of compliance, including remediation costs that may be incurred and penalties that may be imposed.
Our environmental capital expenditures are expected to approximate
$1.2 million
in
2014
and
$1.0 million
in
2015
. Actual expenditures may vary as the number and scope of environmental projects are revised as a result of improved technology or changes in regulatory requirements and could increase if additional projects are identified or additional requirements are imposed.
CRITICAL ACCOUNTING ESTIMATES
The preparation of financial statements in accordance with GAAP requires us to make estimates and assumptions that affect the reported amounts of assets and liabilities and the disclosure of contingent assets and liabilities as of the date of the consolidated financial statements and the reported amounts of revenues and expenses during the respective reporting periods. Accounting estimates are considered to be critical if (1) the nature of the estimates and assumptions is material due to the levels of subjectivity and judgment necessary to account for highly uncertain matters or the susceptibility of such matters to change; and (2) the impact of the estimates and assumptions on financial condition or operating performance is material. Actual results could differ from the estimates and assumptions used.
Fair Value Estimates
Fair value is the price that would be received to sell an asset or paid to transfer a liability in an orderly transaction between market participants at the measurement date. There are three approaches for measuring the fair value of assets and liabilities: the market approach, the income approach and the cost approach, each of which includes multiple valuation techniques. The market approach uses prices and other relevant information generated by market transactions involving identical or comparable assets or liabilities. The income approach uses valuation techniques to measure fair value by converting future amounts, such as cash flows or earnings, into a single present value amount using current market expectations about those future amounts. The cost approach is based on the amount that would currently be required to replace the service capacity of an asset. This is often referred to as current replacement cost. The cost approach assumes that the fair value would not exceed what it would cost a market participant to acquire or construct a substitute asset of comparable utility, adjusted for obsolescence.
Our significant uses of fair value measurements include:
|
•
|
assessment of impairment of long-lived assets; and
|
|
•
|
assessment of impairment of goodwill.
|
68
See Item 8. Financial Statements and Supplementary Data – Note 13 for disclosures regarding our fair value measurements.
Impairment Assessments of Long-Lived Assets and Goodwill
Fair value calculated for the purpose of testing our long-lived assets and goodwill for impairment is estimated using the expected present value of future cash flows method and comparative market prices when appropriate. Significant judgment is involved in performing these fair value estimates since the results are based on forecasted assumptions. Significant assumptions include:
|
•
|
Future revenues on services provided
. Our estimates of future revenues are based on our analysis of various supply and demand factors, which include, among other things, industry-wide capacity, our estimated utilization rate, end-user demand, capital expenditures and economic conditions. Such estimates are consistent with those used in our planning and capital investment reviews.
|
|
•
|
Future volumes
. Our estimates of future pipeline throughput volumes are based on internal forecasts prepared by our general partner’s operations personnel.
|
|
•
|
Discount rate commensurate with the risks involved
. We apply a discount rate to our cash flows based on a variety of factors, including market and economic conditions, operational risk, regulatory risk and political risk. This discount rate is also compared to recent observable market transactions, if possible. A higher discount rate decreases the net present value of cash flows.
|
|
•
|
Future capital requirements
. These are based on authorized spending and internal forecasts.
|
We base our fair value estimates on projected financial information that we believe to be reasonable. However, actual results may differ from these projections.
The need to test for impairment can be based on several indicators, including a significant reduction in demand for products transported, a poor outlook for profitability, a significant reduction in pipeline throughput volumes, a significant reduction in refining margins, other changes to contracts or changes in the regulatory environment in which the asset is located.
Long-lived assets used in operations are assessed for impairment whenever changes in facts and circumstances indicate that the carrying value of the assets may not be recoverable. For purposes of impairment evaluation, long-lived assets must be grouped at the lowest level for which independent cash flows can be identified, which generally is the pipeline system level. If the sum of the undiscounted estimated pretax cash flows is less than the carrying value of an asset group, fair value is calculated, and the carrying value is written down if greater than the calculated fair value.
Unlike long-lived assets, goodwill must be tested for impairment at least annually, or between annual tests if an event occurs or circumstances change that would more likely than not reduce the fair value of a reporting unit below its carrying amount. Goodwill is tested for impairment at the reporting unit level. The fair value of the reporting unit is determined and compared to the book value of the reporting unit. If the fair value of the reporting unit is less than the book value, including goodwill, the implied fair value of goodwill is calculated. The excess, if any, of the book value over the implied fair value of goodwill is charged to net income. At December 31, 2013, we had a total of $104.7 million of goodwill recorded on our consolidated balance sheet. The fair value of our reporting unit exceeded book value appreciably in 2013.
An estimate of the sensitivity to net income resulting from impairment calculations is not practicable, given the numerous assumptions (e.g., tariffs, volumes and discount rates) that can materially affect our estimates. That is, unfavorable adjustments to some of the above listed assumptions may be offset by favorable adjustments in other assumptions.
Contingent Liabilities
We accrue contingent liabilities for legal actions, claims, litigation, environmental remediation and tax deficiencies related to operating taxes. We regularly assess these estimates in consultation with legal counsel to consider resolved and new matters, material developments in court proceedings or settlement discussions, new information obtained as a result of ongoing discovery and past experience in defending and settling similar matters. Actual costs can differ from estimates for many reasons. For instance, settlement costs for claims and litigation can vary from estimates based on differing interpretations of laws, opinions on degree of responsibility and assessments of the amount of damages. Similarly, liabilities for environmental remediation may vary from estimates because of changes in laws, regulations and their interpretation; additional information on the extent and nature of site contamination; and improvements in technology.
69
We generally record losses related to these types of contingencies as cost of revenues or general and administrative expenses in the consolidated statements of income, except for tax deficiencies unrelated to income taxes, which are recorded as other taxes. For additional information on contingent liabilities, see Item 7. Management's Discussion and Analysis of Financial Condition and Results of Operations - Environmental Matters and Compliance Costs.
An estimate of the sensitivity to net income if other assumptions had been used in recording these liabilities is not practical because of the number of contingencies that must be assessed, the number of underlying assumptions and the wide range of reasonably possible outcomes, in terms of both the probability of loss and the estimates of such loss.
ACCOUNTING STANDARDS NOT YET ADOPTED
There are no significant accounting standards applicable to us that have not yet been adopted.
Market risk is the risk of loss arising from adverse changes in market rates and prices. As we do not take ownership of the crude oil or products that we transport and store for our customers, and we do not engage in the trading of any commodities, we have minimal direct exposure to risks associated with fluctuating commodity prices. In addition, our transportation and storage services agreements with MPC are indexed to inflation to mitigate our exposure to increases in the cost of supplies used in our business.
Debt that we incur under our Credit Agreement will bear interest at a variable rate and will expose us to interest rate risk. Unless interest rates increase significantly in the future, our exposure to interest rate risk should be minimal. There have been no borrowings or letters of credit outstanding under our Credit Agreement.
Imbalances
We experience modest volume gains and losses, which we sometimes refer to as imbalances, within our pipelines and storage assets due to pressure and temperature changes, evaporation and variances in meter readings and in other measurement methods. Historically, we used quoted market prices of the applicable commodity as of the relevant reporting date to value amounts related to imbalances. For the three-year period ended December 31, 2013, our imbalances resulted in an average gain of $3.5 million per year. In practice, we settle positive crude oil imbalances each quarter by selling excess volumes at current market prices. While we historically have not had to do so, we could be required to purchase crude oil volumes in the open market to make up negative imbalances. Positive and negative refined product imbalances are settled monthly by cash payments.
70
INDEX
|
|
Page
|
|
Audited Consolidated Financial Statements:
|
|
The information in this report includes periods prior to the completion of MPLX LP’s initial public offering, and prior to the effective dates of the agreements discussed herein. Consequently, the consolidated financial statements and related discussion of financial condition and results of operations contained in this report include periods that pertain to MPLX LP Predecessor, our predecessor for accounting purposes.
Unless the context otherwise requires, references in this report to “MPLX LP,” the "Partnership,” “we,” “our,” “us,” or like terms used in the present tense for periods starting on or after October 31, 2012 refer to MPLX LP and its subsidiaries. References in this report to the “Predecessor,” “we,” “our,” “us,” or like terms, when used in a historical context (periods prior to October 31, 2012), refer to MPLX LP Predecessor, our predecessor for accounting purposes. References to “MPC” refer collectively to Marathon Petroleum Corporation and its subsidiaries, other than the Partnership. Prior to June 30, 2011, MPC was a wholly owned subsidiary of Marathon Oil Corporation. Marathon Oil Corporation and all its subsidiaries and equity method investments not spun off with MPC are referred to as “Marathon Oil.”
71
Management’s Responsibilities for Financial Statements
The accompanying consolidated financial statements of MPLX LP and its subsidiaries (the “Partnership”) are the responsibility of management of the Partnership’s general partner, MPLX GP LLC, and have been prepared in conformity with accounting principles generally accepted in the United States of America. They necessarily include some amounts that are based on best judgments and estimates. The financial information displayed in other sections of this Annual Report on Form 10-K is consistent with these consolidated financial statements.
MPLX GP LLC seeks to assure the objectivity and integrity of the Partnership’s financial records by careful selection of its managers, by organizational arrangements that provide an appropriate division of responsibility and by communications programs aimed at assuring that its policies and methods are understood throughout the organization.
The MPLX GP LLC Board of Directors pursues its oversight role in the area of financial reporting and internal control over financial reporting through its Audit Committee. This committee, composed solely of independent directors, regularly meets (jointly and separately) with the independent registered public accounting firm, management and internal auditors to monitor the proper discharge by each of their responsibilities relative to internal accounting controls and the consolidated financial statements.
|
/s/ Gary R. Heminger
|
/s/ Donald C. Templin
|
/s/ Michael G. Braddock
|
||
|
Gary R. Heminger
Chairman of the Board of Directors
and Chief Executive Officer
of MPLX GP LLC
(the general partner of MPLX LP)
|
Donald C. Templin
Director, Vice President
and Chief Financial Officer
of MPLX GP LLC
(the general partner of MPLX LP)
|
Michael G. Braddock
Vice President and
Chief Accounting Officer
of MPLX GP LLC
(the general partner of MPLX LP)
|
||
Management’s Report on Internal Control over Financial Reporting
MPLX LP’s management is responsible for establishing and maintaining adequate internal control over financial reporting (as defined in Rules 13a-15(f) and 15d-15(f) under the Securities Exchange Act of 1934, as amended). An evaluation of the design and effectiveness of our internal control over financial reporting, based on the framework in
Internal Control—Integrated Framework (1992)
issued by the Committee of Sponsoring Organizations of the Treadway Commission, was conducted under the supervision and with the participation of management, including our chief executive officer and chief financial officer. Based on the results of this evaluation, MPLX LP’s management concluded that its internal control over financial reporting was effective as of December 31, 2013.
The effectiveness of MPLX LP’s internal control over financial reporting as of December 31, 2013 has been audited by PricewaterhouseCoopers LLP, an independent registered public accounting firm, as stated in their report which is included herein.
|
/s/ Gary R. Heminger
|
/s/ Donald C. Templin
|
|||
|
Gary R. Heminger
Chairman of the Board of Directors
and Chief Executive Officer
of MPLX GP LLC
(the general partner of MPLX LP)
|
Donald C. Templin
Director, Vice President
and Chief Financial Officer
of MPLX GP LLC
(the general partner of MPLX LP)
|
|||
72
Report of Independent Registered Public Accounting Firm
To
the Partners of MPLX LP and the Board of Directors of MPLX GP LLC
In our opinion, the accompanying consolidated balance sheets and the related consolidated statements of income, of equity/net investment and of cash flows present fairly, in all material respects, the financial position of MPLX LP and its subsidiaries at December 31, 2013 and 2012, and the results of their operations and their cash flows for each of the three years in the period ended December 31, 2013 in conformity with accounting principles generally accepted in the United States of America. Also in our opinion, the Company maintained, in all material respects, effective internal control over financial reporting as of December 31, 2013, based on criteria established in
Internal Control - Integrated Framework
(1992)
issued by the Committee of Sponsoring Organizations of the Treadway Commission (COSO). The Company's management is responsible for these financial statements, for maintaining effective internal control over financial reporting and for its assessment of the effectiveness of internal control over financial reporting, included in the accompanying Management's Report on Internal Control over Financial Reporting. Our responsibility is to express opinions on these financial statements and on the Company's internal control over financial reporting based on our audits (which was an integrated audit in 2013). We conducted our audits in accordance with the standards of the Public Company Accounting Oversight Board (United States). Those standards require that we plan and perform the audits to obtain reasonable assurance about whether the financial statements are free of material misstatement and whether effective internal control over financial reporting was maintained in all material respects. Our audits of the financial statements included examining, on a test basis, evidence supporting the amounts and disclosures in the financial statements, assessing the accounting principles used and significant estimates made by management, and evaluating the overall financial statement presentation. Our audit of internal control over financial reporting included obtaining an understanding of internal control over financial reporting, assessing the risk that a material weakness exists, and testing and evaluating the design and operating effectiveness of internal control based on the assessed risk. Our audits also included performing such other procedures as we considered necessary in the circumstances. We believe that our audits provide a reasonable basis for our opinions.
A company’s internal control over financial reporting is a process designed to provide reasonable assurance regarding the reliability of financial reporting and the preparation of financial statements for external purposes in accordance with generally accepted accounting principles. A company’s internal control over financial reporting includes those policies and procedures that (i) pertain to the maintenance of records that, in reasonable detail, accurately and fairly reflect the transactions and dispositions of the assets of the company; (ii) provide reasonable assurance that transactions are recorded as necessary to permit preparation of financial statements in accordance with generally accepted accounting principles, and that receipts and expenditures of the company are being made only in accordance with authorizations of management and directors of the company; and (iii) provide reasonable assurance regarding prevention or timely detection of unauthorized acquisition, use, or disposition of the company’s assets that could have a material effect on the financial statements.
Because of its inherent limitations, internal control over financial reporting may not prevent or detect misstatements. Also, projections of any evaluation of effectiveness to future periods are subject to the risk that controls may become inadequate because of changes in conditions, or that the degree of compliance with the policies or procedures may deteriorate.
/s/PricewaterhouseCoopers LLP
Toledo, Ohio
February 28, 2014
73
MPLX LP
|
(In millions, except per-unit data)
|
2013
|
2012
|
2011
|
|||||||||
|
Revenues and other income:
|
||||||||||||
|
Sales and other operating revenues
|
$
|
78.9
|
|
$
|
74.4
|
|
$
|
62.1
|
|
|||
|
Sales to related parties
|
384.2
|
|
367.8
|
|
334.8
|
|
||||||
|
Loss on sale of assets
|
—
|
|
(0.3
|
)
|
—
|
|
||||||
|
Other income
|
4.4
|
|
6.9
|
|
4.3
|
|
||||||
|
Other income - related parties
|
18.8
|
|
13.1
|
|
9.4
|
|
||||||
|
Total revenues and other income
|
486.3
|
|
461.9
|
|
410.6
|
|
||||||
|
Costs and expenses:
|
||||||||||||
|
Cost of revenues (excludes items below)
|
135.9
|
|
173.8
|
|
162.9
|
|
||||||
|
Purchases from related parties
|
94.6
|
|
44.4
|
|
29.0
|
|
||||||
|
Depreciation
|
48.9
|
|
39.4
|
|
36.3
|
|
||||||
|
General and administrative expenses
|
53.7
|
|
49.8
|
|
38.5
|
|
||||||
|
Other taxes
|
6.2
|
|
11.3
|
|
11.9
|
|
||||||
|
Total costs and expenses
|
339.3
|
|
318.7
|
|
278.6
|
|
||||||
|
Income from operations
|
147.0
|
|
143.2
|
|
132.0
|
|
||||||
|
Related party interest and other financial income
|
—
|
|
1.3
|
|
2.3
|
|
||||||
|
Net interest and other financial income (costs)
|
(1.1
|
)
|
(0.2
|
)
|
(0.2
|
)
|
||||||
|
Income before income taxes
|
145.9
|
|
144.3
|
|
134.1
|
|
||||||
|
Provision (benefit) for income taxes
|
(0.2
|
)
|
0.3
|
|
0.1
|
|
||||||
|
Net income
|
146.1
|
|
144.0
|
|
134.0
|
|
||||||
|
Less: Net income attributable to MPC-retained interest
|
68.2
|
|
13.2
|
|
—
|
|
||||||
|
Net income attributable to MPLX LP
|
$
|
77.9
|
|
$
|
130.8
|
|
$
|
134.0
|
|
|||
|
Less: Predecessor income prior to initial public offering on October 31, 2012
|
—
|
|
117.7
|
|
||||||||
|
Net income attributable to MPLX LP subsequent to initial public offering
|
77.9
|
|
13.1
|
|
||||||||
|
Less: General partner’s interest in net income attributable to MPLX LP subsequent to initial public offering
|
1.7
|
|
0.2
|
|
||||||||
|
Limited partners’ interest in net income attributable to MPLX LP
|
$
|
76.2
|
|
$
|
12.9
|
|
||||||
|
Net income attributable to MPLX LP per limited partner unit:
|
||||||||||||
|
Common - basic
|
$
|
1.05
|
|
$
|
0.18
|
|
||||||
|
Common - diluted
|
1.05
|
|
0.18
|
|
||||||||
|
Subordinated - basic and diluted
|
1.01
|
|
0.17
|
|
||||||||
|
Weighted average limited partner units outstanding (basic and diluted):
|
||||||||||||
|
Common units - public
|
19.9
|
|
19.9
|
|
||||||||
|
Common units - MPC
|
17.1
|
|
17.1
|
|
||||||||
|
Subordinated units - MPC
|
37.0
|
|
37.0
|
|
||||||||
|
Cash distributions declared per limited partner common unit
|
$
|
1.1675
|
|
$
|
0.1769
|
|
||||||
The accompanying notes are an integral part of these consolidated financial statements.
74
MPLX LP
|
|
December 31,
|
|||||||
|
(In millions)
|
2013
|
2012
|
||||||
|
Assets
|
||||||||
|
Current assets:
|
||||||||
|
Cash and cash equivalents
|
$
|
54.1
|
|
$
|
216.7
|
|
||
|
Receivables
|
12.2
|
|
17.6
|
|
||||
|
Receivables from related parties
|
48.3
|
|
38.0
|
|
||||
|
Materials and supplies inventories
|
11.6
|
|
8.9
|
|
||||
|
Other current assets
|
8.9
|
|
2.6
|
|
||||
|
Total current assets
|
135.1
|
|
283.8
|
|
||||
|
Property, plant and equipment, net
|
966.6
|
|
910.0
|
|
||||
|
Goodwill
|
104.7
|
|
104.7
|
|
||||
|
Other noncurrent assets
|
2.1
|
|
2.8
|
|
||||
|
Total assets
|
$
|
1,208.5
|
|
$
|
1,301.3
|
|
||
|
Liabilities
|
||||||||
|
Current liabilities:
|
||||||||
|
Accounts payable
|
$
|
30.5
|
|
$
|
39.0
|
|
||
|
Payables to related parties
|
12.8
|
|
13.4
|
|
||||
|
Deferred revenue - related parties
|
34.0
|
|
4.2
|
|
||||
|
Accrued taxes
|
4.0
|
|
3.0
|
|
||||
|
Long-term debt due within one year
|
0.7
|
|
0.7
|
|
||||
|
Other current liabilities
|
1.4
|
|
3.0
|
|
||||
|
Total current liabilities
|
83.4
|
|
63.3
|
|
||||
|
Long-term debt
|
9.8
|
|
10.6
|
|
||||
|
Deferred credits and other liabilities
|
1.2
|
|
0.6
|
|
||||
|
Total liabilities
|
94.4
|
|
74.5
|
|
||||
|
Commitments and contingencies (see Note 18)
|
|
|
||||||
|
Equity
|
||||||||
|
Common unitholders - public (19.9 million units issued and outstanding)
|
412.0
|
|
410.7
|
|
||||
|
Common unitholder - MPC (17.1 million units issued and outstanding)
|
57.4
|
|
57.4
|
|
||||
|
Subordinated unitholder - MPC (37.0 million units issued and outstanding)
|
209.3
|
|
209.3
|
|
||||
|
General partner - MPC (1.5 million units issued and outstanding)
|
(32.5
|
)
|
13.7
|
|
||||
|
Total MPLX LP partners’ capital
|
646.2
|
|
691.1
|
|
||||
|
Noncontrolling interest retained by MPC
|
467.9
|
|
535.7
|
|
||||
|
Total equity
|
1,114.1
|
|
1,226.8
|
|
||||
|
Total liabilities and equity
|
$
|
1,208.5
|
|
$
|
1,301.3
|
|
||
The accompanying notes are an integral part of these consolidated financial statements.
75
MPLX LP
|
(In millions)
|
2013
|
2012
|
2011
|
|||||||||
|
Increase (decrease) in cash and cash equivalents
|
||||||||||||
|
Operating activities:
|
||||||||||||
|
Net income
|
$
|
146.1
|
|
$
|
144.0
|
|
$
|
134.0
|
|
|||
|
Adjustments to reconcile net income to net cash provided by operating activities:
|
||||||||||||
|
Depreciation
|
48.9
|
|
39.4
|
|
36.3
|
|
||||||
|
Deferred income taxes
|
0.1
|
|
(0.1
|
)
|
(0.2
|
)
|
||||||
|
Asset retirement expenditures
|
(8.3
|
)
|
(9.2
|
)
|
(2.0
|
)
|
||||||
|
Net loss on disposal of assets
|
—
|
|
0.3
|
|
—
|
|
||||||
|
Changes in:
|
||||||||||||
|
Current receivables
|
5.4
|
|
(2.0
|
)
|
(1.0
|
)
|
||||||
|
Materials and supplies inventories
|
1.3
|
|
(1.0
|
)
|
(0.2
|
)
|
||||||
|
Current accounts payable and accrued liabilities
|
(2.6
|
)
|
(8.0
|
)
|
11.2
|
|
||||||
|
Receivables from / liabilities to related parties
|
18.9
|
|
26.9
|
|
1.5
|
|
||||||
|
All other, net
|
2.4
|
|
0.3
|
|
2.3
|
|
||||||
|
Net cash provided by operating activities
|
212.2
|
|
190.6
|
|
181.9
|
|
||||||
|
Investing activities:
|
||||||||||||
|
Additions to property, plant and equipment
|
(106.5
|
)
|
(135.6
|
)
|
(49.8
|
)
|
||||||
|
Disposal of assets
|
0.2
|
|
1.3
|
|
—
|
|
||||||
|
Investments in related party debt securities - purchases
|
—
|
|
—
|
|
(260.6
|
)
|
||||||
|
- redemptions
|
—
|
|
—
|
|
311.7
|
|
||||||
|
Investments - loans to a related party
|
—
|
|
—
|
|
(220.0
|
)
|
||||||
|
- repayments of loans receivable from a related party
|
—
|
|
221.7
|
|
—
|
|
||||||
|
All other, net
|
(7.3
|
)
|
—
|
|
—
|
|
||||||
|
Net cash provided by (used in) investing activities
|
(113.6
|
)
|
87.4
|
|
(218.7
|
)
|
||||||
|
Financing activities:
|
||||||||||||
|
Long-term debt - repayments
|
(0.7
|
)
|
(0.7
|
)
|
(0.6
|
)
|
||||||
|
Debt issuance costs
|
—
|
|
(2.4
|
)
|
—
|
|
||||||
|
Net proceeds from initial public offering
|
—
|
|
407.1
|
|
—
|
|
||||||
|
Proceeds from initial public offering distributed to MPC
|
—
|
|
(202.7
|
)
|
—
|
|
||||||
|
Quarterly distributions to unitholders and general partner
|
(77.8
|
)
|
—
|
|
—
|
|
||||||
|
Quarterly distributions to noncontrolling interest retained by MPC
|
(82.7
|
)
|
—
|
|
—
|
|
||||||
|
Distributions related to purchase of additional interest in Pipe Line Holdings
|
(100.0
|
)
|
—
|
|
—
|
|
||||||
|
Contributions from (distributions to) MPC
|
—
|
|
(262.7
|
)
|
37.3
|
|
||||||
|
Net cash provided by (used in) financing activities
|
(261.2
|
)
|
(61.4
|
)
|
36.7
|
|
||||||
|
Net increase (decrease) in cash and cash equivalents
|
(162.6
|
)
|
216.6
|
|
(0.1
|
)
|
||||||
|
Cash and cash equivalents at beginning of period
|
216.7
|
|
0.1
|
|
0.2
|
|
||||||
|
Cash and cash equivalents at end of period
|
$
|
54.1
|
|
$
|
216.7
|
|
$
|
0.1
|
|
|||
The accompanying notes are an integral part of these consolidated financial statements.
76
MPLX LP
Consolidated Statements of Equity/Net Investment
|
|
Partnership
|
|||||||||||||||||||||||||||
|
(In millions)
|
Common
Unitholders Public |
Common
Unitholder MPC |
Subordinated
Unitholder MPC |
General Partner
MPC |
Noncontrolling
Interest Retained by MPC |
Net
Investment |
Total
|
|||||||||||||||||||||
|
Balance at December 31, 2010
|
$
|
—
|
|
$
|
—
|
|
$
|
—
|
|
$
|
—
|
|
$
|
—
|
|
$
|
1,068.2
|
|
$
|
1,068.2
|
|
|||||||
|
Net income
|
—
|
|
—
|
|
—
|
|
—
|
|
—
|
|
134.0
|
|
134.0
|
|
||||||||||||||
|
Contributions from MPC
|
—
|
|
—
|
|
—
|
|
—
|
|
—
|
|
37.0
|
|
37.0
|
|
||||||||||||||
|
Balance at December 31, 2011
|
$
|
—
|
|
$
|
—
|
|
$
|
—
|
|
$
|
—
|
|
$
|
—
|
|
$
|
1,239.2
|
|
$
|
1,239.2
|
|
|||||||
|
Net income through October 30, 2012
|
—
|
|
—
|
|
—
|
|
—
|
|
—
|
|
117.7
|
|
117.7
|
|
||||||||||||||
|
Distributions to MPC
|
—
|
|
—
|
|
—
|
|
—
|
|
—
|
|
(360.9
|
)
|
(360.9
|
)
|
||||||||||||||
|
Allocation of net investment to unitholders
|
—
|
|
192.4
|
|
361.5
|
|
13.5
|
|
428.6
|
|
(996.0
|
)
|
—
|
|
||||||||||||||
|
Net proceeds from initial public offering
|
407.1
|
|
—
|
|
—
|
|
—
|
|
—
|
|
—
|
|
407.1
|
|
||||||||||||||
|
Proceeds from initial public offering distributed to MPC
|
—
|
|
(105.4
|
)
|
(97.3
|
)
|
—
|
|
—
|
|
—
|
|
(202.7
|
)
|
||||||||||||||
|
Allocation of prefunded capital expenditures to noncontrolling interest
|
—
|
|
(32.6
|
)
|
(61.3
|
)
|
—
|
|
93.9
|
|
—
|
|
—
|
|
||||||||||||||
|
Net income October 31 through December 31, 2012
|
3.5
|
|
3.0
|
|
6.4
|
|
0.2
|
|
13.2
|
|
—
|
|
26.3
|
|
||||||||||||||
|
Equity-based compensation
|
0.1
|
|
—
|
|
—
|
|
—
|
|
—
|
|
—
|
|
0.1
|
|
||||||||||||||
|
Balance at December 31, 2012
|
$
|
410.7
|
|
$
|
57.4
|
|
$
|
209.3
|
|
$
|
13.7
|
|
$
|
535.7
|
|
$
|
—
|
|
$
|
1,226.8
|
|
|||||||
|
Purchase of additional interest in Pipe Line Holdings
|
—
|
|
—
|
|
—
|
|
(46.4
|
)
|
(53.6
|
)
|
—
|
|
(100.0
|
)
|
||||||||||||||
|
Net income
|
20.4
|
|
17.6
|
|
38.2
|
|
1.7
|
|
68.2
|
|
—
|
|
146.1
|
|
||||||||||||||
|
Quarterly distributions to unitholders and general partner
|
(20.5
|
)
|
(17.6
|
)
|
(38.2
|
)
|
(1.5
|
)
|
—
|
|
—
|
|
(77.8
|
)
|
||||||||||||||
|
Quarterly distributions to noncontrolling interest retained by MPC
|
—
|
|
—
|
|
—
|
|
—
|
|
(82.7
|
)
|
—
|
|
(82.7
|
)
|
||||||||||||||
|
Non-cash contribution from MPC
|
—
|
|
—
|
|
—
|
|
—
|
|
0.3
|
|
—
|
|
0.3
|
|
||||||||||||||
|
Equity-based compensation
|
1.4
|
|
—
|
|
—
|
|
—
|
|
—
|
|
—
|
|
1.4
|
|
||||||||||||||
|
Balance at December 31, 2013
|
$
|
412.0
|
|
$
|
57.4
|
|
$
|
209.3
|
|
$
|
(32.5
|
)
|
$
|
467.9
|
|
$
|
—
|
|
$
|
1,114.1
|
|
|||||||
The accompanying notes are an integral part of these consolidated financial statements.
77
Notes to Consolidated Financial Statements
1. Description of the Business and Basis of Presentation
Description of the Business
– MPLX LP (the “Partnership”) is a fee-based, growth-oriented master limited partnership formed to own, operate, develop and acquire pipelines and other midstream assets related to the transportation and storage of crude oil, refined products and other hydrocarbon-based products. As of
December 31, 2013
, the Partnership’s assets consisted of a
56.0 percent
indirect interest in a network of common carrier crude oil and product pipeline systems and associated storage assets in the Midwest and Gulf Coast regions of the United States. The Partnership also owns a
100 percent
interest in a butane cavern in Neal, West Virginia with approximately
1.0 million
barrels of storage capacity.
On
October 31, 2012
, the Partnership completed its initial public offering (the “Offering”) of
19,895,000
common units (including
2,595,000
common units issued pursuant to the exercise of the underwriters’ over-allotment option), representing limited partner interests. Unless the context otherwise requires, references in this report to “MPLX LP,” the "Partnership,” “we,” “our,” “us,” or like terms used in the present tense or for periods starting on or after October 31, 2012, refer to MPLX LP and its subsidiaries, including MPLX Operations LLC (“MPLX Operations”) and MPLX Terminal and Storage LLC (“MPLX Terminal and Storage”), both wholly-owned subsidiaries, and MPLX Pipe Line Holdings LP (“Pipe Line Holdings”), of which MPLX LP owned a
56.0 percent
general partner interest at
December 31, 2013
. Pipe Line Holdings owns
100 percent
of Marathon Pipe Line LLC (“MPL”) and Ohio River Pipe Line LLC (“ORPL”). References in this report to the “Predecessor,” “we,” “our,” “us,” or like terms, when used for periods prior to October 31, 2012, refer to MPLX LP Predecessor, our predecessor for accounting purposes. References to “MPC” refer collectively to Marathon Petroleum Corporation and its subsidiaries, other than the Partnership. Prior to June 30, 2011, MPC was a wholly-owned subsidiary of Marathon Oil Corporation. Marathon Oil Corporation and all its subsidiaries and equity method investments not spun off with MPC are referred to as “Marathon Oil.” The Partnership was formed on
March 27, 2012
, as a Delaware limited partnership. See Note 4 for information regarding the closing of the Offering.
MPLX LP Predecessor included the assets, liabilities and results of operations of certain crude oil and product pipeline systems and associated storage assets of MPC operated and held by MPL and ORPL prior to their contribution to the Partnership in connection with the Offering. Prior to the Offering, MPLX LP Predecessor results also included MPL’s minority undivided joint interests in
two
crude oil pipeline systems that were not contributed to the Partnership at the Offering. See Note 5.
Net income attributable to MPLX LP for the period prior to the Offering on October 31, 2012 and the year ended December 31, 2011 included
100 percent
of the net income related to the assets that were contributed to MPLX LP, while net income attributable to MPLX LP for the period in 2012 following the Offering and the year ended
December 31, 2013
reflect the
51.0 percent
general partner interest in Pipe Line Holdings initially contributed to MPLX LP through April 30, 2013 and thereafter the
56.0 percent
general partner interest. For the periods subsequent to the Offering through April 30, 2013, we consolidated the results of operations of Pipe Line Holdings and then recorded a
49.0 percent
noncontrolling interest deduction for the limited partner interest in Pipe Line Holdings retained by MPC. On May 1, 2013, we acquired an additional
5.0 percent
interest in Pipe Line Holdings from MPC for consideration of
$100.0 million
in cash. Following the acquisition, we continued to consolidate the results of operations of Pipe Line Holdings and then recorded a
44.0 percent
noncontrolling interest deduction for the limited partner interest in Pipe Line Holdings retained by MPC. The change in the Pipe Line Holdings general partner ownership interest is discussed in Note 3. The Neal, West Virginia butane cavern financial results are reflected only in the periods following the Offering. Additional differences in revenues and expenses are attributable to changes in agreements and activities, as detailed in Note 5. Due to these factors, our results of operations subsequent to the Offering are not comparable to our Predecessor’s historical results of operations.
Our operations consist of
one
reportable segment.
78
Basis of Presentation
– Prior to the Offering on October 31, 2012, our financial position, results of operations and cash flows consisted of MPLX LP Predecessor, which represented a combined reporting entity. Subsequent to the Offering, our financial position, results of operations and cash flows consist of consolidated MPLX LP activities and balances.
The consolidated statements of income for periods prior to the Offering included expense allocations for certain corporate functions historically performed by MPC and prior to June 30, 2011 by Marathon Oil, including allocations of general corporate expenses related to information technology, engineering, legal, human resources and other financial and administrative services. Those allocations were based primarily on specific identification, capital employed, wages or headcount. Our management believes the assumptions underlying the consolidated financial statements, including the assumptions regarding allocating general corporate expenses from MPC and prior to June 30, 2011 from Marathon Oil, are reasonable. However, these consolidated financial statements do not include all of the actual expenses that would have been incurred had we been a stand-alone publicly traded partnership during the periods presented prior to the Offering. Actual costs that would have been incurred if we had been a stand-alone publicly traded partnership would depend on the level of incremental general and administrative expenses incurred and the cost of services provided by our general partner and its affiliates. Subsequent to the Offering, MPC provides executive management services, certain operational and management services and certain general and administrative services to us pursuant to an omnibus agreement and
two
employee services agreements. See Note 5 for a description of these agreements.
Certain reclassifications of prior periods' data have been made to conform to current classifications. On the December 31, 2012 consolidated balance sheet, deferred revenue-related parties of
$4.2 million
has been reclassified from payables to related parties to a separate line.
2. Summary of Principal Accounting Policies
Use of estimates
– The preparation of financial statements in accordance with generally accepted accounting principles requires management to make estimates and assumptions that affect the reported amounts of assets and liabilities and the disclosure of contingent assets and liabilities as of the date of the consolidated financial statements and the reported amounts of revenues and expenses during the respective reporting periods.
Principles applied in consolidation
– These consolidated financial statements include the accounts of our majority-owned and controlled subsidiaries. All significant intercompany transactions and accounts have been eliminated. We consolidate Pipe Line Holdings, in which we own the
56.0 percent
general partner interest and record a noncontrolling interest for the
44.0 percent
limited partner interest retained by MPC as of December 31, 2013.
Revenue recognition
– Revenues are recognized for crude oil and product pipeline transportation based on the delivery of actual volumes transported at regulated tariff rates. When MPC ships volumes on our pipeline systems under a joint tariff with a third party, those revenues are recorded as sales and other operating revenues, and not as sales to related parties, because we receive payment from the third party. Revenues are recognized for crude oil and refined product storage as performed based on contractual rates. Operating fees received for operating pipeline systems are recognized as a component of other income in the period the service is performed.
Under our transportation services agreements, if MPC fails to transport its minimum throughput volumes during any quarter, then MPC will pay us a deficiency payment equal to the volume of the deficiency multiplied by the tariff rate then in effect. MPC may then apply the amount of any such deficiency payments as a credit for volumes transported on the applicable pipeline system in excess of its minimum volume commitment during the following four quarters or eight quarters under the terms of the applicable transportation services agreement. The deficiency payments are initially recorded as deferred revenue - related parties. We recognize revenues for the deficiency payments at the earlier of when credits are used for volumes transported in excess of minimum volume commitments, when it becomes impossible to physically transport volumes necessary to utilize the credits or upon the expiration of the applicable four or eight quarter period. The use or expiration of the credits is a decrease in deferred revenue - related parties.
Cash and cash equivalents
– Cash and cash equivalents include cash on hand and on deposit and investments in highly liquid debt instruments with maturities generally of three months or less.
Restricted cash -
Restricted cash consists of cash advances to be used for the operation and maintenance of an operated pipeline system. At
December 31, 2013
, the amount of restricted cash included in other current assets on the consolidated balance sheet was
$7.3 million
.
Receivables
– Our receivables primarily consist of customer accounts receivable that are recorded at the invoiced amounts and do not bear interest. Account balances for these customer receivables are charged directly to bad debt expense when it becomes probable the receivable will not be collected.
79
Materials and supplies inventories
– Inventories consist of materials and supplies, and cost is determined primarily under the specific identification method.
Imbalances
– Within our pipelines and storage assets we experience volume gains and losses due to pressure and temperature changes, evaporation and variances in meter readings and other measurement methods. Until settled, positive crude oil imbalances are recorded as other current assets and negative crude oil imbalances are recorded as accounts payable. Positive and negative product imbalances are settled monthly by cash payments.
Property, plant and equipment
– Property, plant and equipment are recorded at cost and depreciated on a straight-line basis for groups of property having similar economic characteristics over the estimated useful lives. Such assets are reviewed for impairment whenever events or changes in circumstances indicate that the carrying amount of an asset may not be recoverable. If the sum of the expected undiscounted future cash flows from the use of the asset and its eventual disposition is less than the carrying amount of the asset, an impairment loss is recognized based on the fair value of the asset.
When items of property, plant and equipment are sold or otherwise disposed of, any gains or losses are reported in the statement of income. Gains on the disposal of property, plant and equipment are recognized when earned, which is generally at the time of closing. If a loss on disposal is expected, such losses are recognized when the assets are classified as held for sale.
Interest expense is capitalized for qualifying assets under construction. Capitalized interest costs are included in property, plant and equipment and are depreciated over the useful life of the related asset.
Goodwill
– Goodwill represents the excess of the purchase price over the estimated fair value of the net assets acquired in the acquisition of a business. Goodwill was allocated to the Predecessor from MPC based on the relative fair market value of the Predecessor’s net property, plant and equipment to the fair market value of MPC Pipeline Transportation reporting unit’s net property, plant and equipment as of June 30, 2005, the date on which the transaction was completed. Such goodwill is not amortized, but rather is tested for impairment annually and when events or changes in circumstances indicate that the fair value of a reporting unit with goodwill has been reduced below carrying value. The fair value of the reporting unit is determined and compared to the book value of the reporting unit. If the fair value is less than the book value, including goodwill, then the recorded goodwill is impaired to its implied fair value with a charge to net income.
Major maintenance activities
– Costs for planned integrity management projects are expensed in the period incurred. These types of costs include in-line inspection services, contractor repair services, materials and supplies, equipment rentals and labor costs.
Other taxes –
Other taxes primarily include payroll taxes for periods prior to October 1, 2012 and real estate taxes.
Environmental costs
– Environmental expenditures are capitalized if the costs mitigate or prevent future contamination or if the costs improve environmental safety or efficiency of the existing assets. We recognize remediation costs and penalties when the responsibility to remediate is probable and the amount of associated costs can be reasonably estimated. The timing of remediation accruals coincides with completion of a feasibility study or the commitment to a formal plan of action. Remediation liabilities are accrued based on estimates of known environmental exposure. A receivable is recorded for environmental costs indemnified by MPC.
Asset retirement obligations
– The fair value of asset retirement obligations is recognized in the period in which the obligations are incurred if a reasonable estimate of fair value can be made. Asset retirement obligations are recorded as long-term liabilities with an offsetting asset retirement cost recorded as an increase to the associated property, plant and equipment. The amounts recorded for such obligations are based on the most probable current cost projections. Asset retirement obligations have not been recognized for our assets because the fair value cannot be reasonably estimated since the settlement dates of the obligations are indeterminate. Such obligations will be recognized in the period when sufficient information becomes available to estimate a range of potential settlement dates. The asset retirement obligations principally include hazardous material disposal and removal or dismantlement requirements associated with the closure of our pipeline system and storage assets.
Income taxes
– Following the Offering, our operations are treated as a partnership for federal and state income tax purposes, with each partner being separately taxed on its share of the taxable income. Prior to the Offering, the Predecessor’s taxable income was included in the consolidated U.S. federal income tax returns of MPC and of Marathon Oil prior to June 30, 2011, and in a number of consolidated state income tax returns. Therefore, we have excluded income taxes from these consolidated financial statements, except for certain state jurisdictions that tax partnerships.
80
Employee benefit plans
– The Partnership has
no
employees and effective October 1, 2012, we entered into
two
employee services agreements with MPC. For periods prior to October 1, 2012, employees of the Predecessor participated in the various employee benefit plans of MPC. These plans included a qualified, non-contributory defined benefit retirement plan, an employee savings plan, employee and retiree medical and life insurance plans, a dental plan and other such benefits. For the purposes of these consolidated financial statements, the Predecessor was considered to be participating in multiemployer benefit plans of MPC. As a participant in multiemployer benefit plans, the Predecessor recognized as expense in each period the required allocation from MPC, and it did not recognize any employee benefit plan liabilities. While the Predecessor was considered to participate in multiemployer plans of MPC, those benefit plans are not technically multiemployer plans. Therefore, we have not included the disclosures required for multiemployer plans.
Equity-based
compensation arrangements
– The fair value of phantom unit awards granted to non-employee directors is based on the fair market value of MPLX LP common units on the date of grant. Our equity-based compensation expense is recognized at the time of grant for phantom units since they vest immediately and are not forfeitable.
Performance units paying out in cash are accounted for as liability awards and recorded at fair value with a mark-to-market adjustment made each quarter. The performance units paying out in units are accounted for as equity awards and have a grant date fair value of
$0.74
per unit, as calculated using a Monte Carlo valuation model.
Net income per limited partner unit
- We use the two-class method when calculating the net income per unit applicable to limited partners, because we have more than one participating security. The classes of participating securities include common units, subordinated units, general partner units, certain equity-based compensation awards and incentive distribution rights. Net income attributable to MPLX LP is allocated to the unitholders differently for preparation of the consolidated statements of equity/net investment and the calculation of net income per limited partner unit. In preparing our consolidated statements of equity/net investment, net income attributable to MPLX LP is allocated to unitholders in accordance with their respective ownership percentages. However, when distributions related to the incentive distribution rights are made, earnings equal to the amount of those distributions are first allocated to the general partner before the remaining earnings are allocated to the unitholders based on their respective ownership percentages.
Net investment
– The net investment represented a net balance reflecting MPC’s initial investment in the Predecessor and subsequent adjustments resulting from the operations of the Predecessor and various transactions between the Predecessor and MPC. Transactions affecting the net investment include general, administrative and overhead allocations incurred by MPC and by Marathon Oil prior to June 30, 2011 that were allocated to the Predecessor. There were no terms of settlement or interest charges associated with the net investment balance.
Comprehensive income
– We have reported
no
comprehensive income due to the absence of items of other comprehensive income in the periods presented.
81
3. Acquisition
On
May 1, 2013
, we acquired an additional
5.0 percent
interest in Pipe Line Holdings from MPC for consideration of
$100.0 million
, which was funded with cash on hand. We recorded the additional
5.0 percent
interest in Pipe Line Holdings at its historical carrying value of
$53.6 million
and the excess cash paid over historical carrying value of
$46.4 million
as a decrease to general partner equity. Prior to this transaction, the
5.0 percent
interest was held by MPC and was reflected as part of the noncontrolling interest retained by MPC in our consolidated financial statements. The acquisition of the additional
5.0 percent
interest was accounted for on a prospective basis as we acquired an additional interest in an already-consolidated entity. The cash flow impact is reflected in financing activities. Beginning May 1, 2013, our consolidated financial statements reflect the
56.0 percent
general partner interest in Pipe Line Holdings owned by MPLX LP, while the
44.0 percent
limited partner interest held by MPC is reflected as a noncontrolling interest. The terms of the acquisition were approved by the conflicts committee of the board of directors of our general partner, which is comprised entirely of independent directors.
Changes in MPLX LP’s equity resulting from changes in its ownership interest in Pipe Line Holdings were as follows:
|
(In millions)
|
2013
|
2012
|
2011
|
||||||||
|
Net income attributable to MPLX LP
|
$
|
77.9
|
|
$
|
130.8
|
|
$
|
134.0
|
|
||
|
Transfer to noncontrolling interest retained by MPC:
|
|||||||||||
|
Decrease in general partner-MPC equity for purchase of additional interest in Pipe Line Holdings
|
(46.4
|
)
|
—
|
|
—
|
|
|||||
|
Change from net income attributable to MPLX LP and transfer to noncontrolling interest retained by MPC
|
$
|
31.5
|
|
$
|
130.8
|
|
$
|
134.0
|
|
||
4. Initial Public Offering
On October 26, 2012, the Partnership’s common units began trading on the New York Stock Exchange under the ticker symbol “MPLX.” On October 31, 2012, we closed our initial public offering of
19,895,000
common units at a price to the public of
$22.00
per unit, which included a
2,595,000
common unit over-allotment option that was exercised in full by the underwriters.
In exchange for MPC’s contribution of assets and liabilities to the Partnership, MPC received:
|
•
|
17,056,515
common units and
36,951,515
subordinated units, representing an aggregate
71.6 percent
limited partner interest in us;
|
|
•
|
all of our incentive distribution rights;
|
|
•
|
1,508,225
general partner units, representing a
2.0 percent
general partner interest; and
|
|
•
|
an aggregate cash distribution of
$202.7 million
.
|
The Partnership received net proceeds of
$407.1 million
from the sale of
19,895,000
common units, after deducting underwriting discounts and commissions, structuring fees and offering expenses (the “Offering Costs”) of
$30.6 million
. The Partnership retained
$191.6 million
of these net proceeds to prefund certain estimated expansion capital expenditures,
$10.4 million
for working capital purposes and paid financing costs of
$2.4 million
before the cash distribution to MPC.
Reconciliation of Cash Proceeds
|
(In millions)
|
|
||
|
Total proceeds from the Offering
|
$
|
437.7
|
|
|
Less: Offering Costs
|
(30.6
|
)
|
|
|
Net proceeds from the Offering
|
407.1
|
|
|
|
Less: Revolving credit facility origination fees
|
(2.4
|
)
|
|
|
Cash retained by MPLX LP
|
(10.4
|
)
|
|
|
Cash contribution to Pipe Line Holdings
|
(191.6
|
)
|
|
|
Net proceeds distributed to MPC from the Offering
|
$
|
202.7
|
|
82
5. Related Party Agreements and Transactions
Our related parties included:
|
•
|
MPC, which refines, markets and transports crude oil and petroleum products, primarily in the Midwest, Gulf Coast and Southeast regions of the United States.
|
|
•
|
Marathon Oil until June 30, 2011.
|
|
•
|
Centennial Pipeline LLC (“Centennial”), in which MPC has a
50.0 percent
interest. Centennial owns a products pipeline and storage facility.
|
|
•
|
Muskegon Pipeline LLC (“Muskegon”), in which MPC has a
60.0 percent
interest. Muskegon owns a common carrier products pipeline.
|
Commercial Agreements
At the closing of the Offering, the Partnership entered into long-term, fee-based transportation services agreements with MPC. On October 1, 2012, MPL entered into long-term, fee-based storage services agreements with MPC. Under these agreements, we provide transportation and storage services to MPC, and MPC has committed to provide us with minimum quarterly throughput and storage volumes of crude oil and products and minimum storage volumes of butane. We believe the terms and conditions under these agreements, as well as our initial agreements with MPC described below, are generally no less favorable to either party than those that could have been negotiated with unaffiliated parties with respect to similar services.
These commercial agreements with MPC include:
|
•
|
three
separate
10
-year transportation services agreements and
one
five
-year transportation services agreement under which MPC pays the Partnership fees for transporting crude oil on each of our crude oil pipeline systems;
|
|
•
|
four
separate
10
-year transportation services agreements under which MPC pays the Partnership fees for transporting products on each of our product pipeline systems;
|
|
•
|
a
five
-year transportation services agreement under which MPC pays the Partnership fees for handling crude oil and products at our Wood River, Illinois barge dock;
|
|
•
|
a
10
-year storage services agreement under which MPC pays the Partnership fees for providing storage services at our Neal, West Virginia butane cavern; and
|
|
•
|
four
separate
three
-year storage services agreements under which MPC pays the Partnership fees for providing storage services at our tank farms.
|
All of our transportation services agreements for our crude oil and product pipeline systems (other than our Wood River, Illinois to Patoka, Illinois crude system) automatically renew for up to
two
additional
five
-year terms unless terminated by either party. The transportation services agreements for our Wood River to Patoka crude system and our barge dock automatically renew for up to
four
additional
two
-year terms unless terminated by either party. Our butane cavern storage services agreement does not automatically renew. Our storage services agreements for our tank farms automatically renew for additional
one
-year terms unless terminated by either party.
Under our transportation services agreements, if MPC fails to transport its minimum throughput volumes during any quarter, then MPC will pay us a deficiency payment equal to the volume of the deficiency multiplied by the tariff rate then in effect. If the minimum capacity of the pipeline falls below the level of MPC’s commitment at any time or if capacity on the pipeline is required to be allocated among shippers because volume nominations exceed available capacity, depending on the cause of the reduction in capacity, MPC’s commitment may be reduced or MPC will receive a credit for its minimum volume commitment for that period. In addition to MPC’s minimum volume commitment, MPC is also responsible for any loading, handling, transfer and other charges with respect to volumes we transport for MPC. If we agree to make any capital expenditures at MPC’s request, MPC will reimburse us for, or we will have the right in certain circumstances, to file for an increased tariff rate to recover the actual cost of such capital expenditures. Our transportation services agreements include provisions that permit MPC to suspend, reduce or terminate its obligations under the applicable agreement if certain events occur. These events include MPC deciding to permanently or indefinitely suspend refining operations at one or more of its refineries for at least twelve consecutive months and certain force majeure events that would prevent us or MPC from performing required services under the applicable agreement.
Under the storage services agreements, we are obligated to make available to MPC on a firm basis the available storage capacity at our tank farms and butane cavern, and MPC pays us a per-barrel fee for such storage capacity, regardless of whether MPC fully utilizes the available capacity. We may adjust the per-barrel fee by a percentage equal to an increase in the PPI in early 2014.
83
Operating Agreements
At the closing of the Offering, the Partnership entered into an operating services agreement with MPC under which we operate various pipeline systems owned by MPC. In addition, under existing operating services agreements that MPL had previously entered into with MPC and third parties, MPL continues to operate various pipeline systems owned by MPC and third parties. Under these operating services agreements, the Partnership receives an operating fee for operating the assets and is reimbursed for all direct and indirect costs associated with operating the assets. Most of these agreements are indexed for inflation. These agreements range from
one
to
five
years in length and automatically renew unless terminated by either party.
Effective February 1, 2013, we entered into an operating agreement with Blanchard Pipe Line Company LLC (“Blanchard Pipe Line”), a wholly-owned subsidiary of MPC, under which we operate various pipeline systems in Texas owned by Blanchard Pipe Line that it acquired in conjunction with MPC’s acquisition of the Galveston Bay refinery. Under the operating agreement, we receive an initial annual fee of
$1.0 million
, subject to adjustment for inflation, and are reimbursed for specific costs associated with operating the pipeline systems. The term of the operating agreement is until December 31, 2014, and it is automatically extended from year to year thereafter unless terminated by either party at least three months prior to the end of the term.
Effective October 1, 2013, MPL entered into an operating and maintenance agreement with the owners of the Capline pipeline system. The Capline system is a
635 mile
,
40-inch
crude oil pipeline running from St. James, Louisiana to Patoka, Illinois. MPC owns a
32.6 percent
undivided joint interest in the Capline system. Under the agreement we receive an annual fee of initially
$1.8 million
, subject to adjustment for inflation, and are reimbursed for specific costs associated with operating the pipeline system. The initial term of this agreement is until August 31, 2018, and it is automatically extended for successive
five
year terms thereafter unless terminated by either party at least ten months prior to the end of the term.
Management Services Agreements
Prior to the closing of the Offering, MPL entered into
two
management services agreements with MPC under which we provide certain management services to MPC with respect to certain of MPC’s retained pipeline assets. We receive fixed annual fees under the agreements for providing the required management services in the amount of
$0.7 million
. We may adjust annually for inflation and based on changes in the scope of management services provided.
Omnibus Agreement
Upon the closing of the Offering, the Partnership entered into an omnibus agreement with MPC that addresses our payment of a fixed annual fee to MPC for the provision of executive management services by certain executive officers of our general partner and our reimbursement of MPC for the provision of certain general and administrative services to us, as well as MPC’s indemnification of us for certain matters, including environmental, title and tax matters.
Employee Services Agreements
Effective October 1, 2012, the Partnership entered into
two
employee services agreements with MPC under which we reimburse MPC for the provision of certain operational and management services to us in support of our pipelines, barge dock, butane cavern and tank farms.
Related Party Transactions
We believe that transactions with related parties, other than certain transactions with MPC and Marathon Oil related to the provision of administrative services for periods prior to the Offering, were conducted on terms comparable to those with unrelated parties. See below for a description of transactions with MPC and Marathon Oil.
Sales to related parties were as follows:
|
(In millions)
|
2013
|
2012
|
2011
|
|||||||||
|
MPC
|
$
|
384.2
|
|
$
|
367.8
|
|
$
|
334.8
|
|
|||
Related party sales to MPC consisted of crude oil and product pipeline transportation services based on regulated tariff rates and storage services based on contracted rates.
84
The fees received for operating pipelines for related parties included in other income - related parties on the consolidated statements of income were as follows:
|
(In millions)
|
2013
|
2012
|
2011
|
|||||||||
|
MPC
|
$
|
17.6
|
|
$
|
12.0
|
|
$
|
6.4
|
|
|||
|
Marathon Oil
|
—
|
|
—
|
|
1.9
|
|
||||||
|
Centennial
|
1.1
|
|
1.0
|
|
1.0
|
|
||||||
|
Muskegon
|
0.1
|
|
0.1
|
|
0.1
|
|
||||||
|
Total
|
$
|
18.8
|
|
$
|
13.1
|
|
$
|
9.4
|
|
|||
Subsequent to the Offering, MPC provides executive management services and certain general and administrative services to us under terms of the omnibus agreement. For periods prior to the Offering, MPC and, prior to June 30, 2011, Marathon Oil performed certain services related to information technology, engineering, legal, human resources and other financial and administrative services. Rates for shared services were negotiated between us and the service providers. Where costs incurred on our behalf could not practically be determined by specific identification, these costs were primarily allocated to us based on capital employed, wages or headcount. Our management believes those allocations were a reasonable reflection of the utilization of services provided. However, those allocations may not have fully reflected the expenses that would have been incurred had we been a stand-alone publicly traded partnership during those periods.
Charges for services included in purchases from related parties primarily relate to services that support our operations and maintenance activities. These charges were as follows:
|
(In millions)
|
2013
|
2012
|
2011
|
|||||||||
|
MPC
|
$
|
18.0
|
|
$
|
13.6
|
|
$
|
14.7
|
|
|||
|
Marathon Oil
|
—
|
|
—
|
|
0.5
|
|
||||||
|
Total
|
$
|
18.0
|
|
$
|
13.6
|
|
$
|
15.2
|
|
|||
Charges for services included in general and administrative expenses primarily relate to services that support our executive management, accounting and human resources activities, and allocations of corporate overhead costs from MPC and Marathon Oil for periods prior to the Offering. These charges were as follows:
|
(In millions)
|
2013
|
2012
|
2011
|
|||||||||
|
MPC
|
$
|
31.4
|
|
$
|
22.6
|
|
$
|
19.2
|
|
|||
|
Marathon Oil
|
—
|
|
—
|
|
1.7
|
|
||||||
|
Total
|
$
|
31.4
|
|
$
|
22.6
|
|
$
|
20.9
|
|
|||
In addition, some service costs related to engineering services are associated with assets under construction. These costs added to property, plant and equipment were as follows:
|
(In millions)
|
2013
|
2012
|
2011
|
|||||||||
|
MPC
|
$
|
8.0
|
|
$
|
5.5
|
|
$
|
3.6
|
|
|||
85
Effective October 1, 2012, MPL’s employees transferred to MPC, and we entered into
two
employee services agreements with MPC for the provision of certain operational and management services. Expenses incurred under the employee services agreements for periods subsequent to October 1, 2012, are shown in the table below by the income statement line where they were recorded. For periods prior to October 1, 2012, MPL employees were considered to participate in multiemployer benefit plans of MPC. Our allocated share of MPC’s employee benefit plan expenses for periods prior to October 1, 2012, including costs related to stock-based compensation plans, is shown in the table below by income statement line and was based upon a percentage of the salaries and wages of employees whose costs were recorded in each income statement line. The costs of personnel directly involved in or supporting operations and maintenance activities are classified as purchases from related parties. The costs of personnel involved in executive management, accounting and human resources activities are classified as general and administrative expenses. Our allocated share of benefit plan expenses recorded in general and administrative expenses for 2012 included
$9.5 million
of pension expenses related to lump sum payments made by MPC for periods prior to the October 1, 2012 employee transfer date. Expenses for employee benefit plans other than stock-based compensation plans were allocated to us primarily as a percentage of headcount. For the stock-based compensation plans, we were charged with the expenses directly attributed to our Predecessor’s employees, which were
$1.1 million
and
$0.6 million
for 2012 and 2011, respectively.
|
(In millions)
|
2013
|
2012
|
2011
|
|||||||||
|
Purchases from related parties
|
$
|
76.6
|
|
$
|
30.8
|
|
$
|
13.8
|
|
|||
|
General and administrative expenses
|
15.7
|
|
23.1
|
|
14.6
|
|
||||||
|
Total
|
$
|
92.3
|
|
$
|
53.9
|
|
$
|
28.4
|
|
|||
Receivables from related parties were as follows:
|
|
December 31,
|
|||||||
|
(In millions)
|
2013
|
2012
|
||||||
|
MPC
|
$
|
47.4
|
|
$
|
37.6
|
|
||
|
Centennial
|
0.6
|
|
0.3
|
|
||||
|
Muskegon
|
0.3
|
|
0.1
|
|
||||
|
Total
|
$
|
48.3
|
|
$
|
38.0
|
|
||
Prepaid assets with related parties included in other current assets on the consolidated balance sheets were as follows:
|
|
December 31,
|
|||||||
|
(In millions)
|
2013
|
2012
|
||||||
|
MPC
|
$
|
0.4
|
|
$
|
—
|
|
||
At
December 31, 2013
and
2012
, we also had long-term receivables of
$0.2 million
and
$0.3 million
from MPC, which were included in other noncurrent assets on the consolidated balance sheets, related to an indemnification provided under the omnibus agreement.
Payables to related parties were as follows:
|
|
December 31,
|
|||||||
|
(In millions)
|
2013
|
2012
|
||||||
|
MPC
|
$
|
12.8
|
|
$
|
13.4
|
|
||
86
Under our transportation services agreements, if MPC fails to transport its minimum throughput volumes during any quarter, then MPC will pay us a deficiency payment equal to the volume of the deficiency multiplied by the tariff rate then in effect. The deficiency amounts are recorded as deferred revenue-related parties. MPC may then apply the amount of any such deficiency payments as a credit for volumes transported on the applicable pipeline system in excess of its minimum volume commitment during the following four or eight quarters under the terms of the applicable transportation services agreement. We recognize revenues for the deficiency payments at the earlier of when credits are used for volumes transported in excess of minimum quarterly volume commitments, when it becomes impossible to physically transport volumes necessary to utilize the credits or upon the expiration of the applicable four or eight quarter period. The use or expiration of the credits is a decrease in deferred revenue-related parties.
During
2013
, and the period October 31, 2012 through December 31, 2012, MPC did not transport its minimum committed volumes on certain pipeline systems. The resulting deficiencies were all related to transportation services agreements which have four quarter make-up periods. The deferred revenue-related parties associated with the minimum volume deficiencies were as follows:
|
December 31,
|
|||||||
|
(In millions)
|
2013
|
2012
|
|||||
|
Minimum volume deficiencies - MPC
|
$
|
34.0
|
|
$
|
4.2
|
|
|
To centralize cash management activities for MPC, MPC Investment Fund, Inc. (“MPCIF”), a wholly-owned subsidiary of MPC, was established and an agreement was executed on
June 21, 2011
, among MPCIF, MPL and ORPL. On a daily basis, we sent our excess cash to MPCIF as an advance or requested cash from MPCIF as a draw. Our net cash balance with MPCIF on the last day of each quarter was classified as loans receivable from related party or as loans payable to related party. The loan balance remained constant until the last day of the next quarter. Loans receivable earned interest at the three-month London Interbank Offered Rate (“LIBOR”) plus 10 basis points. Loans payable bore interest at the three-month LIBOR plus 50 basis points. At the end of each quarter, the net balance of the daily advances and draws and the accrued interest was rolled into the loan balance for the subsequent quarter. The agreement was scheduled to terminate on January 1, 2020, however at any time during the agreement, a loan from MPCIF could be repaid or a demand for repayment could be made for a loan to MPCIF. We could terminate our participation at any time during the agreement. At December 31, 2011, our loans receivable from MPCIF were
$220.4 million
. The agreement was terminated on
September 28, 2012
, in connection with the Offering.
In 2011, we had agreements with MOC Portfolio Delaware, Inc. (“PFD”), a subsidiary of Marathon Oil, to invest our excess cash. Such investments consisted of shares of PFD Redeemable Class A, Series 1 Preferred Stock (“PFD Preferred Stock”). We had the right to redeem all or any portion of the PFD Preferred Stock on any business day at
$2,000
per share. Dividends on PFD Preferred Stock were declared and settled daily. All of our investments in PFD Preferred Stock were redeemed prior to the termination of these agreements on
June 30, 2011
.
Related party interest and other financial income were as follows:
|
(In millions)
|
2013
|
2012
|
2011
|
|||||||||
|
Dividend income:
|
||||||||||||
|
PFD Preferred Stock
|
$
|
—
|
|
$
|
—
|
|
$
|
1.9
|
|
|||
|
Interest income:
|
||||||||||||
|
Loans receivable from MPCIF
|
—
|
|
1.3
|
|
0.4
|
|
||||||
|
Related party interest and other financial income
|
$
|
—
|
|
$
|
1.3
|
|
$
|
2.3
|
|
|||
In 2012, we sold a newly constructed asset to MPC for its
$1.3 million
carrying value.
87
Certain asset transfers between us and MPC and certain expenses, such as stock-based compensation, incurred by MPC on our behalf have been recorded as non-cash capital contributions or distributions. The non-cash contributions from MPC were
$0.3 million
for 2013 and net non-cash distributions to MPC were
$98.2 million
and
$0.3 million
in 2012 and 2011. We recorded property, plant and equipment additions related to capitalized interest incurred by MPC on our behalf of
$0.3 million
,
$0.7 million
and less than
$0.1 million
in 2013, 2012 and 2011, which were reflected as contributions from MPC. Also included in the 2012 net non-cash distribution were several transactions that occurred on October 31, 2012, in conjunction with the Offering. MPL made a
$224.1 million
distribution to MPC of its minority undivided joint interests in
two
crude oil pipeline systems. The revenues, expenses, assets and liabilities attributable to these two pipeline systems were included in the consolidated financial statements for periods prior to the Offering. MPC made a
$121.4 million
contribution to us of its Neal, West Virginia butane cavern. MPC also contributed net assets of
$3.7 million
to us related to the balancing of working capital and the indemnification of environmental liabilities.
6. Net Income Per Limited Partner Unit
Net income per unit applicable to common limited partner units and to subordinated limited partner units is computed by dividing the respective limited partners’ interest in net income attributable to MPLX LP by the weighted average number of common units and subordinated units outstanding. Because we have more than one class of participating securities, we use the two-class method when calculating the net income per unit applicable to limited partners. The classes of participating securities include common units, subordinated units, general partner units, certain equity-based compensation awards and incentive distribution rights.
Net income per limited partner unit is only calculated for the periods subsequent to the Offering as no units were outstanding prior to October 31, 2012. Diluted net income per limited partner unit is the same as basic net income per limited partner unit as there were
no
potentially dilutive common or subordinated units outstanding as of
December 31, 2013
or
2012
.
|
(In millions)
|
2013
|
October 31, 2012 to December 31, 2012
|
|||||
|
Net income attributable to MPLX LP subsequent to initial public offering
|
$
|
77.9
|
|
$
|
13.1
|
|
|
|
Less: General partner’s distributions declared (including IDRs)
(1)
|
1.9
|
|
0.3
|
|
|||
|
Limited partners’ distributions declared on common units
(1)
|
43.2
|
|
6.5
|
|
|||
|
Limited partner’s distributions declared on subordinated units
(1)
|
43.1
|
|
6.5
|
|
|||
|
Distributions in excess of net income attributable to MPLX LP
|
$
|
(10.3
|
)
|
$
|
(0.2
|
)
|
|
|
(1)
|
On
January 23, 2014
, we announced the board of directors of our general partner had declared a quarterly cash distribution of
$0.3125
per unit, totaling
$23.7 million
. This distribution was paid on
February 14, 2014
to unitholders of record on
February 4, 2014
.
|
|
2013
|
||||||||||||||||
|
(In millions, except per-unit data)
|
General
Partner
|
Limited Partners’
Common Units
|
Limited
Partner’s
Subordinated
Units
|
Total
|
||||||||||||
|
Basic and diluted net income attributable to MPLX LP per unit:
|
||||||||||||||||
|
Net income attributable to MPLX LP:
|
||||||||||||||||
|
Distributions declared (including IDRs)
|
$
|
1.9
|
|
$
|
43.2
|
|
$
|
43.1
|
|
$
|
88.2
|
|
||||
|
Distributions in excess of net income attributable to MPLX LP
|
(0.2
|
)
|
(4.4
|
)
|
(5.7
|
)
|
(10.3
|
)
|
||||||||
|
Net income attributable to MPLX LP
|
$
|
1.7
|
|
$
|
38.8
|
|
$
|
37.4
|
|
$
|
77.9
|
|
||||
|
Weighted average units outstanding:
|
||||||||||||||||
|
Basic
|
1.4
|
|
37.0
|
|
37.0
|
|
75.4
|
|
||||||||
|
Diluted
|
1.4
|
|
37.0
|
|
37.0
|
|
75.4
|
|
||||||||
|
Net income attributable to MPLX LP per limited partner unit:
|
||||||||||||||||
|
Basic
|
$
|
1.05
|
|
$
|
1.01
|
|
||||||||||
|
Diluted
|
$
|
1.05
|
|
$
|
1.01
|
|
||||||||||
88
|
October 31, 2012 to December 31, 2012
|
||||||||||||||||
|
(In millions, except per-unit data)
|
General
Partner
|
Limited Partners’
Common Units
|
Limited
Partner’s
Subordinated
Units
|
Total
|
||||||||||||
|
Basic and diluted net income attributable to MPLX LP per unit:
|
||||||||||||||||
|
Net income attributable to MPLX LP subsequent to initial public offering:
|
||||||||||||||||
|
Distribution declared
|
$
|
0.3
|
|
$
|
6.5
|
|
$
|
6.5
|
|
$
|
13.3
|
|
||||
|
Distributions in excess of net income attributable to MPLX LP subsequent to initial public offering
|
(0.1
|
)
|
—
|
|
(0.1
|
)
|
(0.2
|
)
|
||||||||
|
Net income attributable to MPLX LP subsequent to initial public offering
|
$
|
0.2
|
|
$
|
6.5
|
|
$
|
6.4
|
|
$
|
13.1
|
|
||||
|
Weighted average units outstanding:
|
||||||||||||||||
|
Basic
|
1.4
|
|
37.0
|
|
37.0
|
|
75.4
|
|
||||||||
|
Diluted
|
1.4
|
|
37.0
|
|
37.0
|
|
75.4
|
|
||||||||
|
Net income attributable to MPLX LP subsequent to initial public offering per limited partner unit:
|
||||||||||||||||
|
Basic
|
$
|
0.18
|
|
$
|
0.17
|
|
||||||||||
|
Diluted
|
$
|
0.18
|
|
$
|
0.17
|
|
||||||||||
7. Equity
Units Outstanding -
We had
36,951,515
common units outstanding as of
December 31, 2013
. Of that number,
17,056,515
were owned by MPC, which also owned
36,951,515
subordinated units. The
2.0 percent
general partner interest, represented by
1,508,225
general partner units, was owned by MPC.
There were no changes to the number of units outstanding since the Offering, through
December 31, 2013
.
Issuance of Additional Securities -
Our partnership agreement authorizes us to issue an unlimited number of additional partnership securities for the consideration and on the terms and conditions determined by our general partner without the approval of the unitholders.
Incentive Distribution Rights -
The following table illustrates the percentage allocations of available cash from operating surplus between the common and subordinated unitholders and our general partner based on the specified target distribution levels. The amounts set forth under marginal percentage interest in distributions are the percentage interests of our general partner and common and subordinated unitholders in any available cash from operating surplus we distribute up to and including the corresponding amount in the column "Total quarterly distribution per unit target amount." The percentage interests shown for our common and subordinated unitholders and our general partner for the minimum quarterly distribution are also applicable to quarterly distribution amounts that are less than the minimum quarterly distribution. The percentage interests set forth below for our general partner include its
2.0 percent
general partner interest and assume that our general partner has contributed any additional capital necessary to maintain its 2.0 percent general partner interest, our general partner has not transferred its incentive distribution rights and that there are no arrearages on common units.
|
|
|
Marginal percentage interest
in distributions
|
||||||||||
|
|
Total quarterly distribution
per unit target amount
|
Unitholders
|
General Partner
|
|||||||||
|
Minimum quarterly distribution
|
$
|
0.2625
|
|
98.0
|
%
|
2.0
|
%
|
|||||
|
First target distribution
|
above $0.2625
|
|
up to $0.301875
|
98.0
|
%
|
2.0
|
%
|
|||||
|
Second target distribution
|
above $0.301875
|
|
up to $0.328125
|
85.0
|
%
|
15.0
|
%
|
|||||
|
Third target distribution
|
above $0.328125
|
|
up to $0.393750
|
75.0
|
%
|
25.0
|
%
|
|||||
|
Thereafter
|
above $0.393750
|
|
50.0
|
%
|
50.0
|
%
|
||||||
89
Net Income Allocation -
The following table presents the allocation of the general partner’s interest in net income attributable to MPLX LP:
|
(in millions)
|
2013
|
October 31, 2012 to December 31, 2012
|
|||||
|
Net income attributable to MPLX subsequent to initial public offering
|
$
|
77.9
|
|
$
|
13.1
|
|
|
|
Less: Income allocated to incentive distribution rights
|
0.1
|
|
—
|
|
|||
|
Net income attributable to MPLX LP available to general and limited partners
|
$
|
77.8
|
|
$
|
13.1
|
|
|
|
General partner's 2.0% interest in net income attributable to MPLX LP
|
$
|
1.6
|
|
$
|
0.2
|
|
|
|
Income allocated to incentive distribution rights
|
0.1
|
|
—
|
|
|||
|
General partner's interest in net income attributable to MPLX LP subsequent to initial public offering
|
$
|
1.7
|
|
$
|
0.2
|
|
|
Cash distributions -
Our partnership agreement sets forth the calculation to be used to determine the amount and priority of cash distributions that the common and subordinated unitholders and general partner will receive. In accordance with our partnership agreement, on
January 23, 2014
, we declared a quarterly cash distribution, based on the results of the fourth quarter of 2013, totaling
$23.7 million
, or
$0.3125
per unit. This distribution was paid on
February 14, 2014
to unitholders of record on
February 4, 2014
.
The allocation of total quarterly cash distributions to general and limited partners is as follows for the year ended
December 31, 2013
and the period October 31, 2012 to December 31, 2012. Our distributions are declared subsequent to quarter end; therefore, the following table represents total cash distributions applicable to the period in which the distributions were earned.
|
(in millions)
|
2013
|
October 31, 2012 to December 31, 2012
|
|||||
|
General partner's distributions:
|
|||||||
|
General partner's distributions
|
$
|
1.8
|
|
$
|
0.3
|
|
|
|
General partner's incentive distribution rights
|
0.1
|
|
—
|
|
|||
|
Total general partner's distributions
|
$
|
1.9
|
|
$
|
0.3
|
|
|
|
Limited partners' distributions:
|
|||||||
|
Common unitholders
|
$
|
43.2
|
|
$
|
6.5
|
|
|
|
Subordinated unitholders
|
43.1
|
|
6.5
|
|
|||
|
Total limited partners' distributions
|
86.3
|
|
13.0
|
|
|||
|
Total cash distributions declared
|
$
|
88.2
|
|
$
|
13.3
|
|
|
8. Major Customer and Concentration of Credit Risk
MPC accounted for
82.6
percent,
82.2
percent and
83.1
percent of our total revenues and other income for
2013
,
2012
and
2011
, excluding revenues attributable to volumes shipped by MPC under joint tariffs with third parties, which are treated as third-party revenue for accounting purposes. We provide crude oil and product pipeline transportation and storage services to MPC and operate pipelines on behalf of MPC.
We have a concentration of trade receivables due from customers in the same industry, MPC, integrated oil companies, independent refining companies and other pipeline companies. These concentrations of customers may impact our overall exposure to credit risk as they may be similarly affected by changes in economic, regulatory and other factors. We manage our exposure to credit risk through credit analysis, credit limit approvals and monitoring procedures, and for certain transactions, we may request letters of credit, prepayments or guarantees.
90
9. Other Items
Net interest and other financial income (costs) were:
|
(In millions)
|
2013
|
2012
|
2011
|
|||||||||
|
Interest income
|
$
|
0.3
|
|
$
|
0.1
|
|
$
|
—
|
|
|||
|
Interest expense
|
(1.1
|
)
|
(0.8
|
)
|
(0.7
|
)
|
||||||
|
Interest capitalized
|
0.9
|
|
0.7
|
|
0.5
|
|
||||||
|
Other financial costs
|
(1.2
|
)
|
(0.2
|
)
|
—
|
|
||||||
|
Net interest and other financial income (costs)
|
$
|
(1.1
|
)
|
$
|
(0.2
|
)
|
$
|
(0.2
|
)
|
|||
10. Income Taxes
We are not a taxable entity for United States federal income tax purposes or for the majority of states that impose an income tax. Taxes on our net income generally are borne by our partners through the allocation of taxable income. Our income tax provision results from partnership activity in the states of Texas, Tennessee and Kentucky.
Our income tax benefit was
$0.2 million
in
2013
and expense of
$0.3 million
and
$0.1 million
for
2012
and
2011
. Our effective tax rate was
(0.1)
percent,
0.2
percent and
0.1
percent for
2013
,
2012
and
2011
.
The following table summarizes the activity in unrecognized tax benefits for 2013 and 2012. There were
no
unrecognized tax benefits in 2011.
|
(In millions)
|
2013
|
2012
|
|||||
|
January 1 balance
|
$
|
0.2
|
|
$
|
—
|
|
|
|
Additions (reductions) for tax positions of prior years
|
(0.2
|
)
|
0.2
|
|
|||
|
December 31 balance
|
$
|
—
|
|
$
|
0.2
|
|
|
If the unrecognized tax benefits as of
December 31, 2013
were recognized, less than
$0.1 million
would affect our effective income tax rate. There were
no
uncertain tax positions as of
December 31, 2013
for which it is reasonably possible that the amount of unrecognized tax benefits would significantly increase or decrease during the next twelve months.
Any interest and penalties related to income taxes were recorded as a part of the provision for income taxes. Such interest and penalties were net benefits of
$0.1 million
in
2013
, and net expenses of
$0.1 million
in
2012
and less than
$0.1 million
in
2011
. As of
December 31, 2013
and
2012
, less than
$0.1 million
and
$0.1 million
of interest and penalties were accrued related to income taxes. In addition, we have state tax year 2012 open to examination.
In taxable jurisdictions, we recorded deferred income taxes on all temporary differences between the book basis and the tax basis of assets and liabilities. At
December 31, 2013
and
2012
, we had
no
net deferred tax liability.
11. Property, Plant and Equipment
|
|
Estimated
Useful Lives
|
December 31,
|
||||||||
|
(In millions)
|
2013
|
2012
|
||||||||
|
Land
|
$
|
5.3
|
|
$
|
5.3
|
|
||||
|
Pipelines and related assets
|
19 - 42 years
|
1,060.7
|
|
971.7
|
|
|||||
|
Storage and delivery facilities
|
24 - 37 years
|
165.7
|
|
164.8
|
|
|||||
|
Other
|
10 - 25 years
|
22.8
|
|
22.6
|
|
|||||
|
Assets under construction
|
21.9
|
|
21.9
|
|
||||||
|
Total
|
1,276.4
|
|
1,186.3
|
|
||||||
|
Less accumulated depreciation
|
309.8
|
|
276.3
|
|
||||||
|
Property, plant and equipment, net
|
$
|
966.6
|
|
$
|
910.0
|
|
||||
Property, plant and equipment includes gross assets acquired under capital leases of
$24.9 million
at December 31, 2013 and 2012, with related amounts in accumulated depreciation of
$5.7 million
and
$5.0 million
at December 31, 2013 and 2012.
91
12. Goodwill
Goodwill is tested for impairment on an annual basis and when events or changes in circumstances indicate the fair value of our reporting unit has been reduced below carrying value. We have performed our annual impairment tests, and
no
impairment in the carrying value of goodwill has been identified during the periods presented.
The changes in the carrying amount of goodwill for
2013
and
2012
were as follows:
|
(In millions)
|
2013
|
2012
|
||||||
|
Beginning balance
|
$
|
104.7
|
|
$
|
134.2
|
|
||
|
Distribution to MPC
(1)
|
—
|
|
(29.5
|
)
|
||||
|
Ending balance
|
$
|
104.7
|
|
$
|
104.7
|
|
||
|
(1)
|
Associated with the minority undivided joint interests in
two
crude oil pipeline systems distributed on October 31, 2012, in conjunction with the Offering. See Notes 5 and 15.
|
13. Fair Value Measurements
Fair Values – Recurring
There were
no
assets accounted for at fair value on a recurring basis at
December 31, 2013
and
2012
.
Fair Values – Reported
Our primary financial instruments are trade receivables and payables. We believe the carrying values of our current assets and liabilities approximate fair value. Our fair value assessment incorporates a variety of considerations, including (1) the short-term duration of the instruments, (2) MPC’s investment-grade credit rating and (3) our historical incurrence of and expected future insignificance of bad debt expense, which includes an evaluation of counterparty credit risk.
Our outstanding borrowings at
December 31, 2013
and
2012
consisted of the following:
|
|
December 31,
|
|||||||
|
(In millions)
|
2013
|
2012
|
||||||
|
MPL - capital lease obligations due 2020
|
$
|
10.5
|
|
$
|
11.3
|
|
||
|
Amounts due within one year
|
0.7
|
|
0.7
|
|
||||
|
Total long-term debt due after one year
|
$
|
9.8
|
|
$
|
10.6
|
|
||
The following table shows five years of scheduled debt payments.
|
(In millions)
|
|
||
|
2014
|
$
|
0.7
|
|
|
2015
|
0.8
|
|
|
|
2016
|
0.9
|
|
|
|
2017
|
0.9
|
|
|
|
2018
|
1.0
|
|
|
Revolving Credit Agreement
On
September 14, 2012
, MPLX Operations, an affiliate of MPC and a wholly-owned subsidiary of the Partnership, as the borrower, and the Partnership, as the parent guarantor, entered into a
five
-year revolving credit agreement (“Credit Agreement”) with a syndicate of lenders. The Credit Agreement became effective following the Offering and has an initial borrowing capacity of
$500.0 million
. The Credit Agreement includes letter of credit issuing capacity of up to
$250.0 million
and swingline loan capacity of up to
$50.0 million
. There were
no
borrowings or letters of credit outstanding under the Credit Agreement at
December 31, 2013
or
2012
.
92
As defined in the Credit Agreement, the financial covenant requires us to maintain a ratio of Consolidated Total Debt as of the end of each fiscal quarter to Consolidated EBITDA for the prior
four
fiscal quarters of not greater than
5.0
to 1.0 (or
5.5
to 1.0 during the six-month period following certain acquisitions). We were in compliance with this financial covenant at
December 31, 2013
and
2012
as well as other covenants contained in the Credit Agreement.
Borrowings under the Credit Agreement bear interest
at the Adjusted LIBO Rate plus a margin, or the Alternate Base Rate plus a margin (as defined in the Credit Agreement)
. The Credit Agreement also provides for customary fees, including administrative agent fees, commitment fees ranging from
0.10 percent
to
0.35 percent
of the unused portion, depending on the Partnership’s ratio of Consolidated Total Debt to Consolidated EBITDA for the prior
four
fiscal quarters prior to the rating date, or the Partnership’s credit ratings subsequent to the rating date, fronting and issuance fees in respect to letters of credit and other fees.
15. Supplemental Cash Flow Information
|
(In millions)
|
2013
|
2012
|
2011
|
|||||||||
|
Net cash provided by operating activities included:
|
||||||||||||
|
Interest paid (net of amounts capitalized)
|
$
|
—
|
|
$
|
—
|
|
$
|
0.2
|
|
|||
|
Income taxes paid
|
0.1
|
|
0.2
|
|
0.3
|
|
||||||
|
Non-cash investing and financing activities:
|
||||||||||||
|
Net transfers of property, plant and equipment to materials and
supplies inventories
|
$
|
4.0
|
|
$
|
—
|
|
$
|
—
|
|
|||
|
Property, plant and equipment contributed by MPC
|
0.3
|
|
—
|
|
—
|
|
||||||
|
Distribution to MPC in conjunction with the Offering
|
||||||||||||
|
Receivables from related parties
|
—
|
|
(5.7
|
)
|
—
|
|
||||||
|
Materials and supplies inventories
|
—
|
|
(0.3
|
)
|
—
|
|
||||||
|
Property, plant and equipment
|
—
|
|
(187.7
|
)
|
—
|
|
||||||
|
Goodwill
|
—
|
|
(29.5
|
)
|
—
|
|
||||||
|
Other noncurrent assets
|
—
|
|
(2.2
|
)
|
—
|
|
||||||
|
Accounts payable
|
—
|
|
(0.3
|
)
|
—
|
|
||||||
|
Accrued taxes
|
—
|
|
(1.0
|
)
|
—
|
|
||||||
|
Contribution from MPC in conjunction with the Offering
|
||||||||||||
|
Receivables from related parties
|
$
|
—
|
|
$
|
7.4
|
|
$
|
—
|
|
|||
|
Property, plant and equipment
|
—
|
|
121.4
|
|
—
|
|
||||||
|
Other noncurrent assets
|
—
|
|
0.3
|
|
—
|
|
||||||
|
Payables to related parties
|
—
|
|
3.9
|
|
—
|
|
||||||
|
Accrued taxes
|
—
|
|
0.1
|
|
—
|
|
||||||
The consolidated statements of cash flows exclude changes to the consolidated balance sheets that did not affect cash. The following is a reconciliation of additions to property, plant and equipment to total capital expenditures:
|
(In millions)
|
2013
|
2012
|
2011
|
|||||||||
|
Additions to property, plant and equipment
|
$
|
106.5
|
|
$
|
135.6
|
|
$
|
49.8
|
|
|||
|
Plus: Increase (decrease) in capital accruals
|
(5.3
|
)
|
3.2
|
|
4.1
|
|
||||||
|
Asset retirement expenditures
|
8.3
|
|
9.2
|
|
2.0
|
|
||||||
|
Total capital expenditures
|
$
|
109.5
|
|
$
|
148.0
|
|
$
|
55.9
|
|
|||
93
The following is a reconciliation of contributions from (distributions to) MPC:
|
(In millions)
|
2013
|
2012
|
2011
|
|||||||||
|
Contributions from (distributions to) MPC per consolidated statements of cash flows
|
$
|
—
|
|
$
|
(262.7
|
)
|
$
|
37.3
|
|
|||
|
Net non-cash contributions from (distributions to) MPC
|
0.3
|
|
(98.2
|
)
|
(0.3
|
)
|
||||||
|
Contributions from (distributions to) MPC per consolidated statements of equity/net investment
|
$
|
0.3
|
|
$
|
(360.9
|
)
|
$
|
37.0
|
|
|||
See Note 5 for information regarding net non-cash contributions from (distributions to) MPC.
16. Equity-Based Compensation Plan
Description of the Plan
The MPLX LP 2012 Incentive Compensation Plan (“MPLX 2012 Plan”) authorizes the MPLX GP LLC board of directors (the “Board”) to grant unit options, unit appreciation rights, restricted units and phantom units, distribution equivalent rights, unit awards, profits interest units, performance units and other unit-based awards to our or any of our affiliates’ employees, officers and directors, including directors and officers of MPC. No more than
2.75 million
MPLX LP common limited partner units may be delivered under the MPLX 2012 Plan. Units delivered pursuant to an award granted under the MPLX 2012 Plan may be funded through acquisition on the open market, from the partnership or from an affiliate of the partnership, as determined by the Board.
Unit-based awards under the Plan
We expense all unit-based payments to employees and non-employee directors based on the grant date fair value of the awards over the requisite service period, adjusted for estimated forfeitures.
Phantom Units
– We grant phantom units under the MPLX 2012 Plan to non-employee directors of MPLX LP's general partner and MPC. Awards to non-employee directors are accounted for as non-employee awards. Phantom units granted to non-employee directors vest immediately at the time of the grant, as they are non-forfeitable, but are not issued until the director’s departure from the board of directors. Prior to issuance, non-employee directors do not have the right to vote such units and cash distribution equivalents accrue in the form of additional phantom units and will be issued when the director departs from the board of directors.
We grant phantom units under the MPLX 2012 Plan, to certain officers of MPLX LP’s general partner and certain eligible MPC officers who make significant contributions to our business. These grants are accounted for as employee awards. In general, these phantom units will vest over a requisite service period of
three years
. Prior to vesting, these phantom unit recipients will not have the right to vote such units and cash distributions declared will be accrued and paid upon vesting. The accrued distributions at December 31, 2013 were less than
$0.1 million
.
The fair values of phantom units are based on the fair value of MPLX LP common limited partner units on the grant date.
Performance Units
- We grant performance units under the MPLX 2012 Plan to certain officers of MPLX LP’s general partner and certain eligible MPC officers who make significant contributions to our business. These awards are intended to have a per unit payout determined by the total unitholder return of MPLX LP common units as compared to the total unitholder return of a selected group of peer partnerships. The final per-unit payout will be the average of the results of
four
measurement periods during the
36
month requisite service period. These performance units will pay out
75.0 percent
in cash and
25.0 percent
in MPLX LP common units. The performance units paying out in cash are accounted for as liability awards and recorded at fair value with a mark-to-market adjustment made each quarter. The performance units paying out in units are accounted for as equity awards and have a grant date fair value of
$0.74
per unit, as calculated using a Monte Carlo valuation model.
94
Outstanding Phantom Unit Awards
The following is a summary of phantom unit award activity of MPLX LP common limited partner units in 2013:
|
|
Phantom Units
|
||||||||||
|
|
Number
of Units
|
Weighted
Average
Fair Value
|
Aggregate Intrinsic Value (In millions)
|
||||||||
|
Outstanding at December 31, 2012
|
1,951
|
|
$
|
26.69
|
|
||||||
|
Granted
|
75,803
|
|
34.02
|
|
|||||||
|
Outstanding at December 31, 2013
|
77,754
|
|
33.84
|
|
|||||||
|
Vested and expected to vest at December 31, 2013
|
76,515
|
|
33.85
|
|
$
|
3.4
|
|
||||
|
Convertible at December 31, 2013
|
15,072
|
|
34.70
|
|
$
|
0.7
|
|
||||
The
15,072
convertible units are held by our non-employee directors and are non-forfeitable and issuable upon the director’s departure from our board of directors.
As of
December 31, 2013
, unrecognized compensation cost related to phantom unit awards was
$1.3 million
, which is expected to be recognized over a weighted average period of
1.8 years
.
Outstanding Performance Unit Awards
The following is a summary of activity of performance unit awards paying out in MPLX LP common limited partner units in
2013
:
|
Number of Units
|
||
|
Outstanding at December 31, 2012
|
—
|
|
|
Granted
|
436,917
|
|
|
Settled
|
—
|
|
|
Forfeited
|
—
|
|
|
Outstanding at December 31, 2013
|
436,917
|
|
As of
December 31, 2013
, unrecognized compensation cost related to equity-classified performance unit awards was
$0.2 million
, which is expected to be recognized over a weighted average period of
2 years
.
Performance units paying out in units have a grant date fair value calculated using a Monte Carlo valuation model, which requires the input of subjective assumptions. The following table provides a summary of these assumptions:
|
Expected annual distributions per unit
|
$
|
1.05
|
|
|
Risk-free interest rate
|
0.35
|
%
|
|
|
Look-back period
|
2.84 years
|
|
|
|
Expected volatility
|
16.75
|
%
|
|
|
Grant date fair value of performance units granted
|
$
|
0.74
|
|
The assumption for expected volatility of our unit price reflects the average historical volatility for a selected group of peer publicly traded partnerships. The look-back period reflects the remaining performance period at the grant date. The risk-free interest rate for the remaining performance period as of the grant date is based on the U.S. Treasury yield curve in effect at the time of the grant.
Total Unit-Based Compensation Expense
Total unit-based compensation expense for awards settling in MPLX LP limited partner common units was $
1.4 million
in 2013 and $
0.1 million
in
2012
for the period subsequent to the Offering.
95
MPC’s Stock-based Compensation
Certain MPL employees supporting the Predecessor's operations were historically granted long-term incentive compensation awards under MPC’s stock-based compensation programs, which primarily consist of stock options, restricted common stock, and performance units. The Predecessor is allocated expenses for these stock-based compensation costs and these costs are included in general and administrative expenses. For 2011 and for 2012 for the period prior to the transfer of the MPL employees on October 1, 2012, expense allocated to the Predecessor was
$0.6 million
and
$0.9 million
. For the period October 1, 2012 through December 31, 2012 and for 2013,
$0.2 million
and
$1.0 million
, respectively, of stock-based compensation expenses were charged to MPLX under our employee matters agreement with MPC.
17. Leases
We lease a pipeline, vehicles, building space, pipeline equipment and land under long-term operating leases. Most of these leases include renewal options. We also lease certain pipelines under a capital lease that has a fixed price purchase option in 2020. Future minimum commitments as of
December 31, 2013
, for capital lease obligations and for operating lease obligations having initial or remaining non-cancelable lease terms in excess of one year are as follows:
|
(In millions)
|
Capital
Lease
Obligations
|
Operating
Lease
Obligations
|
||||||
|
2014
|
$
|
1.4
|
|
$
|
8.7
|
|
||
|
2015
|
1.3
|
|
8.7
|
|
||||
|
2016
|
1.4
|
|
8.1
|
|
||||
|
2017
|
1.3
|
|
7.3
|
|
||||
|
2018
|
1.4
|
|
7.3
|
|
||||
|
Later years
|
6.6
|
|
10.9
|
|
||||
|
Total minimum lease payments
|
13.4
|
|
$
|
51.0
|
|
|||
|
Less imputed interest costs
|
2.9
|
|
||||||
|
Present value of net minimum lease payments
|
$
|
10.5
|
|
|||||
Operating lease rental expense was:
|
(In millions)
|
2013
|
2012
|
2011
|
|||||||||
|
Minimum rental
|
$
|
9.9
|
|
$
|
7.0
|
|
$
|
2.4
|
|
|||
18. Commitments and Contingencies
We are the subject of, or a party to, a number of pending or threatened legal actions, contingencies and commitments involving a variety of matters, including laws and regulations relating to the environment. Some of these matters are discussed below. For matters for which we have not recorded an accrued liability, we are unable to estimate a range of possible losses for the reasons discussed in more detail below. However, the ultimate resolution of some of these contingencies could, individually or in the aggregate, be material.
Environmental matters
– We are subject to federal, state and local laws and regulations relating to the environment. These laws generally provide for control of pollutants released into the environment and require responsible parties to undertake remediation of hazardous waste disposal sites. Penalties may be imposed for noncompliance.
At
December 31, 2013
and
2012
, accrued liabilities for remediation totaled
$1.1 million
and
$1.5 million
, respectively. At
December 31, 2013
and
2012
, it is reasonably possible that an estimated loss existed of up to
$0.4 million
and
$0.5 million
in excess of the amount accrued for remediation. However, it is not presently possible to estimate the ultimate amount of all remediation costs that might be incurred or the penalties, if any, that may be imposed. Receivables from MPC for indemnification of environmental costs related to incidents occurring prior to the Offering were
$0.3 million
and
$2.0 million
at
December 31, 2013
and
2012
, respectively.
96
Legal Proceedings
– In 2003, the State of Illinois brought an action against the Premcor Refining Group, Inc. (“Premcor”) and Apex Refining Company (“Apex”) asserting claims for environmental cleanup related to the refinery owned by these entities in the Hartford/Wood River, Illinois area. In 2006, Premcor and Apex filed third-party complaints against numerous owners and operators of petroleum products facilities in the Hartford/Wood River, Illinois area, including MPL. These complaints, which have been amended since filing, assert claims of common law nuisance and contribution under the Illinois Contribution Act and other laws for environmental cleanup costs that may be imposed on Premcor and Apex by the State of Illinois. There are several third-party defendants in the litigation and MPL has asserted cross-claims in contribution against the various third-party defendants. This litigation is currently pending in the Third Judicial Circuit Court, Madison County, Illinois. While the ultimate outcome of these litigated matters remains uncertain, neither the likelihood of an unfavorable outcome nor the ultimate liability, if any, with respect to this matter can be determined at this time and we are unable to estimate a reasonably possible loss (or range of loss) for this litigation. Under our omnibus agreement, MPC will indemnify us for the full cost of any losses should MPL be deemed responsible for any damages in this lawsuit.
Guarantees
- We have entered into guarantees with maximum potential undiscounted payments totaling
$1.4 million
as of
December 31, 2013
, which consist of leases of vehicles extending through 2018 that contain general lease indemnities and guaranteed residual values.
Over the years, we have sold various assets in the normal course of our business. Certain of the related agreements contain performance and general guarantees, including guarantees regarding inaccuracies in representations, warranties, covenants and agreements, and environmental and general indemnifications that require us to perform upon the occurrence of a triggering event or condition. These guarantees and indemnifications are part of the normal course of selling assets. We are typically not able to calculate the maximum potential amount of future payments that could be made under such contractual provisions because of the variability inherent in the guarantees and indemnities. Most often, the nature of the guarantees and indemnities is such that there is no appropriate method for quantifying the exposure because the underlying triggering event has little or no past experience upon which a reasonable prediction of the outcome can be based.
Contractual commitments
– At
December 31, 2013
our contractual commitments to acquire property, plant and equipment totaled
$9.6 million
. Our contractual commitments at
December 31, 2013
were primarily related to a multi-year SCADA (supervisory control and data acquisition) system upgrade project.
19. Subsequent Event
On
February 27, 2014
, we entered into an agreement to acquire an additional
13.0 percent
interest in Pipe Line Holdings from MPC for consideration of
$310.0 million
. The transaction will be effective
March 1, 2014
. We intend to finance the transaction with
$40.0 million
cash on hand and by borrowing
$270.0 million
on our revolver. Following the acquisition, our ownership interest in Pipe Line Holdings will be
69.0 percent
.
20. Condensed Consolidating Financial Statements
For purposes of the following footnote, MPLX LP is referred to as "Parent Guarantor" and MPLX Operations is referred to as "Subsidiary Issuer." All other consolidated subsidiaries of the Partnership are collectively referred to as "Non-Guarantor Subsidiaries." The condensed consolidating financial information is provided in connection with the potential issuance of debt securities by the Subsidiary Issuer, which are anticipated to be fully and unconditionally guaranteed by the Parent Guarantor.
The following condensed consolidating financial information reflects the Partnership’s stand-alone accounts, the accounts of the Subsidiary Issuer, the combined accounts of the Non-Guarantor Subsidiaries, consolidating adjustments and the Partnership’s consolidated financial information. The condensed consolidating financial information should be read in conjunction with the Partnership’s accompanying consolidated financial statements and related notes. The Parent Guarantor's and the Subsidiary Issuer’s investment in and equity income from their consolidated subsidiaries are presented in accordance with the equity method of accounting in which the equity income from consolidated subsidiaries includes the results of operations of the Partnership assets for periods including and subsequent to the Offering. For periods prior to the Offering, Non-Guarantor Subsidiaries represent MPLX LP Predecessor.
97
|
Consolidating Statements of Income
|
|||||||||||||||||||
|
Year Ended December 31, 2013
|
|||||||||||||||||||
|
(in millions)
|
Parent Guarantor
|
Subsidiary Issuer
|
Non-Guarantor Subsidiaries
|
Consolidating Adjustments
|
Total
|
||||||||||||||
|
Revenues and other income:
|
|||||||||||||||||||
|
Sales and other operating revenues
|
$
|
—
|
|
$
|
—
|
|
$
|
78.9
|
|
$
|
—
|
|
$
|
78.9
|
|
||||
|
Sales to related parties
|
—
|
|
—
|
|
384.2
|
|
—
|
|
384.2
|
|
|||||||||
|
Other income
|
—
|
|
—
|
|
4.4
|
|
—
|
|
4.4
|
|
|||||||||
|
Other income - related parties
|
—
|
|
—
|
|
18.8
|
|
—
|
|
18.8
|
|
|||||||||
|
Equity in earnings of subsidiaries
|
83.0
|
|
85.3
|
|
—
|
|
(168.3
|
)
|
—
|
|
|||||||||
|
Total revenues and other income
|
83.0
|
|
85.3
|
|
486.3
|
|
(168.3
|
)
|
486.3
|
|
|||||||||
|
Costs and expenses:
|
|||||||||||||||||||
|
Cost of revenues (excludes items below)
|
—
|
|
—
|
|
135.9
|
|
—
|
|
135.9
|
|
|||||||||
|
Purchases from related parties
|
—
|
|
—
|
|
94.6
|
|
—
|
|
94.6
|
|
|||||||||
|
Depreciation
|
—
|
|
—
|
|
48.9
|
|
—
|
|
48.9
|
|
|||||||||
|
General and administrative expenses
|
5.0
|
|
—
|
|
48.7
|
|
—
|
|
53.7
|
|
|||||||||
|
Other taxes
|
0.1
|
|
—
|
|
6.1
|
|
—
|
|
6.2
|
|
|||||||||
|
Total costs and expenses
|
5.1
|
|
—
|
|
334.2
|
|
—
|
|
339.3
|
|
|||||||||
|
Income from operations
|
77.9
|
|
85.3
|
|
152.1
|
|
(168.3
|
)
|
147.0
|
|
|||||||||
|
Net interest and other financial income (costs)
|
—
|
|
(2.3
|
)
|
1.2
|
|
—
|
|
(1.1
|
)
|
|||||||||
|
Income before income taxes
|
77.9
|
|
83.0
|
|
153.3
|
|
(168.3
|
)
|
145.9
|
|
|||||||||
|
Provision (benefit) for income taxes
|
—
|
|
—
|
|
(0.2
|
)
|
—
|
|
(0.2
|
)
|
|||||||||
|
Net income
|
77.9
|
|
83.0
|
|
153.5
|
|
(168.3
|
)
|
146.1
|
|
|||||||||
|
Less: Net income attributable to MPC-retained interest
|
—
|
|
—
|
|
—
|
|
68.2
|
|
68.2
|
|
|||||||||
|
Net income attributable to MPLX LP
|
$
|
77.9
|
|
$
|
83.0
|
|
$
|
153.5
|
|
$
|
(236.5
|
)
|
$
|
77.9
|
|
||||
98
|
Consolidating Statements of Income
|
|||||||||||||||||||
|
Year Ended December 31, 2012
|
|||||||||||||||||||
|
(in millions)
|
Parent Guarantor
|
Subsidiary Issuer
|
Non-Guarantor Subsidiaries
|
Consolidating Adjustments
|
Total
|
||||||||||||||
|
Revenues and other income:
|
|||||||||||||||||||
|
Sales and other operating revenues
|
$
|
—
|
|
$
|
—
|
|
$
|
74.4
|
|
$
|
—
|
|
$
|
74.4
|
|
||||
|
Sales to related parties
|
—
|
|
—
|
|
367.8
|
|
—
|
|
367.8
|
|
|||||||||
|
Loss on sale of assets
|
—
|
|
—
|
|
(0.3
|
)
|
—
|
|
(0.3
|
)
|
|||||||||
|
Other income
|
—
|
|
—
|
|
6.9
|
|
—
|
|
6.9
|
|
|||||||||
|
Other income - related parties
|
—
|
|
—
|
|
13.1
|
|
—
|
|
13.1
|
|
|||||||||
|
Equity in earnings of subsidiaries
|
14.0
|
|
14.2
|
|
—
|
|
(28.2
|
)
|
—
|
|
|||||||||
|
Total revenues and other income
|
14.0
|
|
14.2
|
|
461.9
|
|
(28.2
|
)
|
461.9
|
|
|||||||||
|
Costs and expenses:
|
|||||||||||||||||||
|
Cost of revenues (excludes items below)
|
—
|
|
—
|
|
173.8
|
|
—
|
|
173.8
|
|
|||||||||
|
Purchases from related parties
|
—
|
|
—
|
|
44.4
|
|
—
|
|
44.4
|
|
|||||||||
|
Depreciation
|
—
|
|
—
|
|
39.4
|
|
—
|
|
39.4
|
|
|||||||||
|
General and administrative expenses
|
0.9
|
|
—
|
|
48.9
|
|
—
|
|
49.8
|
|
|||||||||
|
Other taxes
|
—
|
|
—
|
|
11.3
|
|
—
|
|
11.3
|
|
|||||||||
|
Total costs and expenses
|
0.9
|
|
—
|
|
317.8
|
|
—
|
|
318.7
|
|
|||||||||
|
Income from operations
|
13.1
|
|
14.2
|
|
144.1
|
|
(28.2
|
)
|
143.2
|
|
|||||||||
|
Related party interest and other financial income
|
—
|
|
—
|
|
1.3
|
|
—
|
|
1.3
|
|
|||||||||
|
Net interest and other financial income (costs)
|
—
|
|
(0.2
|
)
|
—
|
|
—
|
|
(0.2
|
)
|
|||||||||
|
Income before income taxes
|
13.1
|
|
14.0
|
|
145.4
|
|
(28.2
|
)
|
144.3
|
|
|||||||||
|
Provision for income taxes
|
—
|
|
—
|
|
0.3
|
|
—
|
|
0.3
|
|
|||||||||
|
Net income
|
13.1
|
|
14.0
|
|
145.1
|
|
(28.2
|
)
|
144.0
|
|
|||||||||
|
Less: Net income attributable to MPC-retained interest
|
—
|
|
—
|
|
—
|
|
13.2
|
|
13.2
|
|
|||||||||
|
Net income attributable to MPLX LP
|
13.1
|
|
14.0
|
|
145.1
|
|
(41.4
|
)
|
130.8
|
|
|||||||||
|
Less: Predecessor income prior to initial public offering on October 31, 2012
|
—
|
|
—
|
|
117.7
|
|
—
|
|
117.7
|
|
|||||||||
|
Net income attributable to MPLX LP subsequent to initial public offering
|
$
|
13.1
|
|
$
|
14.0
|
|
$
|
27.4
|
|
$
|
(41.4
|
)
|
$
|
13.1
|
|
||||
99
|
Consolidating Statements of Income
|
|||||||||||||||||||
|
Year Ended December 31, 2011
|
|||||||||||||||||||
|
(in millions)
|
Parent Guarantor
|
Subsidiary Issuer
|
Non-Guarantor Subsidiaries
|
Consolidating Adjustments
|
Total
|
||||||||||||||
|
Revenues and other income:
|
|||||||||||||||||||
|
Sales and other operating revenues
|
$
|
—
|
|
$
|
—
|
|
$
|
62.1
|
|
$
|
—
|
|
$
|
62.1
|
|
||||
|
Sales to related parties
|
—
|
|
—
|
|
334.8
|
|
—
|
|
334.8
|
|
|||||||||
|
Other income
|
—
|
|
—
|
|
4.3
|
|
—
|
|
4.3
|
|
|||||||||
|
Other income - related parties
|
—
|
|
—
|
|
9.4
|
|
—
|
|
9.4
|
|
|||||||||
|
Total revenues and other income
|
—
|
|
—
|
|
410.6
|
|
—
|
|
410.6
|
|
|||||||||
|
Costs and expenses:
|
|||||||||||||||||||
|
Cost of revenues (excludes items below)
|
—
|
|
—
|
|
162.9
|
|
—
|
|
162.9
|
|
|||||||||
|
Purchases from related parties
|
—
|
|
—
|
|
29.0
|
|
—
|
|
29.0
|
|
|||||||||
|
Depreciation
|
—
|
|
—
|
|
36.3
|
|
—
|
|
36.3
|
|
|||||||||
|
General and administrative expenses
|
—
|
|
—
|
|
38.5
|
|
—
|
|
38.5
|
|
|||||||||
|
Other taxes
|
—
|
|
—
|
|
11.9
|
|
—
|
|
11.9
|
|
|||||||||
|
Total costs and expenses
|
—
|
|
—
|
|
278.6
|
|
—
|
|
278.6
|
|
|||||||||
|
Income from operations
|
—
|
|
—
|
|
132.0
|
|
—
|
|
132.0
|
|
|||||||||
|
Related party interest and other financial income
|
—
|
|
—
|
|
2.3
|
|
—
|
|
2.3
|
|
|||||||||
|
Net interest and other financial income (costs)
|
—
|
|
—
|
|
(0.2
|
)
|
—
|
|
(0.2
|
)
|
|||||||||
|
Income before income taxes
|
—
|
|
—
|
|
134.1
|
|
—
|
|
134.1
|
|
|||||||||
|
Provision for income taxes
|
—
|
|
—
|
|
0.1
|
|
—
|
|
0.1
|
|
|||||||||
|
Net income
|
$
|
—
|
|
$
|
—
|
|
$
|
134.0
|
|
$
|
—
|
|
$
|
134.0
|
|
||||
100
|
Consolidating Balance Sheets
|
|||||||||||||||||||
|
December 31, 2013
|
|||||||||||||||||||
|
(in millions)
|
Parent Guarantor
|
Subsidiary Issuer
|
Non-Guarantor Subsidiaries
|
Consolidating Adjustments
|
Total
|
||||||||||||||
|
Assets
|
|||||||||||||||||||
|
Current assets:
|
|
||||||||||||||||||
|
Cash and cash equivalents
|
$
|
—
|
|
$
|
7.2
|
|
$
|
46.9
|
|
$
|
—
|
|
$
|
54.1
|
|
||||
|
Receivables
|
0.4
|
|
—
|
|
11.8
|
|
—
|
|
12.2
|
|
|||||||||
|
Receivables from related parties
|
—
|
|
—
|
|
132.2
|
|
(83.9
|
)
|
48.3
|
|
|||||||||
|
Materials and supplies inventories
|
—
|
|
—
|
|
11.6
|
|
—
|
|
11.6
|
|
|||||||||
|
Other current assets
|
0.3
|
|
—
|
|
8.6
|
|
—
|
|
8.9
|
|
|||||||||
|
Total current assets
|
0.7
|
|
7.2
|
|
211.1
|
|
(83.9
|
)
|
135.1
|
|
|||||||||
|
Property, plant and equipment, net
|
—
|
|
—
|
|
966.6
|
|
—
|
|
966.6
|
|
|||||||||
|
Investment in subsidiaries
|
647.1
|
|
721.6
|
|
—
|
|
(1,368.7
|
)
|
—
|
|
|||||||||
|
Goodwill
|
—
|
|
—
|
|
104.7
|
|
—
|
|
104.7
|
|
|||||||||
|
Other noncurrent assets
|
—
|
|
1.8
|
|
0.3
|
|
—
|
|
2.1
|
|
|||||||||
|
Total assets
|
$
|
647.8
|
|
$
|
730.6
|
|
$
|
1,282.7
|
|
$
|
(1,452.6
|
)
|
$
|
1,208.5
|
|
||||
|
Liabilities
|
|
||||||||||||||||||
|
Current liabilities:
|
|
|
|
|
|
||||||||||||||
|
Accounts payable
|
$
|
0.2
|
|
$
|
0.3
|
|
$
|
30.0
|
|
$
|
—
|
|
$
|
30.5
|
|
||||
|
Payables to related parties
|
0.7
|
|
83.2
|
|
12.8
|
|
(83.9
|
)
|
12.8
|
|
|||||||||
|
Deferred revenue - related parties
|
—
|
|
—
|
|
34.0
|
|
—
|
|
34.0
|
|
|||||||||
|
Accrued taxes
|
0.3
|
|
—
|
|
3.7
|
|
—
|
|
4.0
|
|
|||||||||
|
Long-term debt due within one year
|
—
|
|
—
|
|
0.7
|
|
—
|
|
0.7
|
|
|||||||||
|
Other current liabilities
|
—
|
|
—
|
|
1.4
|
|
—
|
|
1.4
|
|
|||||||||
|
Total current liabilities
|
1.2
|
|
83.5
|
|
82.6
|
|
(83.9
|
)
|
83.4
|
|
|||||||||
|
Long-term debt
|
—
|
|
—
|
|
9.8
|
|
—
|
|
9.8
|
|
|||||||||
|
Deferred credits and other liabilities
|
0.4
|
|
—
|
|
0.8
|
|
—
|
|
1.2
|
|
|||||||||
|
Total liabilities
|
1.6
|
|
83.5
|
|
93.2
|
|
(83.9
|
)
|
94.4
|
|
|||||||||
|
Equity
|
|
|
|
|
|
||||||||||||||
|
MPLX LP partners’ capital
|
646.2
|
|
647.1
|
|
1,189.5
|
|
(1,836.6
|
)
|
646.2
|
|
|||||||||
|
Noncontrolling interest retained by MPC
|
—
|
|
—
|
|
—
|
|
467.9
|
|
467.9
|
|
|||||||||
|
Total equity
|
646.2
|
|
647.1
|
|
1,189.5
|
|
(1,368.7
|
)
|
1,114.1
|
|
|||||||||
|
Total liabilities and equity
|
$
|
647.8
|
|
$
|
730.6
|
|
$
|
1,282.7
|
|
$
|
(1,452.6
|
)
|
$
|
1,208.5
|
|
||||
101
|
Consolidating Balance Sheets
|
|||||||||||||||||||
|
December 31, 2012
|
|||||||||||||||||||
|
(in millions)
|
Parent Guarantor
|
Subsidiary Issuer
|
Non-Guarantor Subsidiaries
|
Consolidating Adjustments
|
Total
|
||||||||||||||
|
Assets
|
|||||||||||||||||||
|
Current assets:
|
|||||||||||||||||||
|
Cash and cash equivalents
|
$
|
1.0
|
|
$
|
9.7
|
|
$
|
206.0
|
|
$
|
—
|
|
$
|
216.7
|
|
||||
|
Receivables
|
—
|
|
—
|
|
17.6
|
|
—
|
|
17.6
|
|
|||||||||
|
Receivables from related parties
|
2.9
|
|
0.2
|
|
37.6
|
|
(2.7
|
)
|
38.0
|
|
|||||||||
|
Materials and supplies inventories
|
—
|
|
—
|
|
8.9
|
|
—
|
|
8.9
|
|
|||||||||
|
Other current assets
|
0.3
|
|
—
|
|
2.3
|
|
—
|
|
2.6
|
|
|||||||||
|
Total current assets
|
4.2
|
|
9.9
|
|
272.4
|
|
(2.7
|
)
|
283.8
|
|
|||||||||
|
Property, plant and equipment, net
|
—
|
|
—
|
|
910.0
|
|
—
|
|
910.0
|
|
|||||||||
|
Investment in subsidiaries
|
689.3
|
|
679.6
|
|
—
|
|
(1,368.9
|
)
|
—
|
|
|||||||||
|
Goodwill
|
—
|
|
—
|
|
104.7
|
|
—
|
|
104.7
|
|
|||||||||
|
Other noncurrent assets
|
—
|
|
2.3
|
|
0.5
|
|
—
|
|
2.8
|
|
|||||||||
|
Total assets
|
$
|
693.5
|
|
$
|
691.8
|
|
$
|
1,287.6
|
|
$
|
(1,371.6
|
)
|
$
|
1,301.3
|
|
||||
|
Liabilities
|
|||||||||||||||||||
|
Current liabilities:
|
|||||||||||||||||||
|
Accounts payable
|
$
|
0.1
|
|
$
|
—
|
|
$
|
38.9
|
|
$
|
—
|
|
$
|
39.0
|
|
||||
|
Payables to related parties
|
2.3
|
|
2.5
|
|
11.3
|
|
(2.7
|
)
|
13.4
|
|
|||||||||
|
Deferred revenue - related parties
|
—
|
|
—
|
|
4.2
|
|
—
|
|
4.2
|
|
|||||||||
|
Accrued taxes
|
—
|
|
—
|
|
3.0
|
|
—
|
|
3.0
|
|
|||||||||
|
Long-term debt due within one year
|
—
|
|
—
|
|
0.7
|
|
—
|
|
0.7
|
|
|||||||||
|
Other current liabilities
|
—
|
|
—
|
|
3.0
|
|
—
|
|
3.0
|
|
|||||||||
|
Total current liabilities
|
2.4
|
|
2.5
|
|
61.1
|
|
(2.7
|
)
|
63.3
|
|
|||||||||
|
Long-term debt
|
—
|
|
—
|
|
10.6
|
|
—
|
|
10.6
|
|
|||||||||
|
Deferred credits and other liabilities
|
—
|
|
—
|
|
0.6
|
|
—
|
|
0.6
|
|
|||||||||
|
Total liabilities
|
2.4
|
|
2.5
|
|
72.3
|
|
(2.7
|
)
|
74.5
|
|
|||||||||
|
Equity
|
|||||||||||||||||||
|
MPLX LP partners’ capital
|
691.1
|
|
689.3
|
|
1,215.3
|
|
(1,904.6
|
)
|
691.1
|
|
|||||||||
|
Noncontrolling interest retained by MPC
|
—
|
|
—
|
|
—
|
|
535.7
|
|
535.7
|
|
|||||||||
|
Total equity
|
691.1
|
|
689.3
|
|
1,215.3
|
|
(1,368.9
|
)
|
1,226.8
|
|
|||||||||
|
Total liabilities and equity
|
$
|
693.5
|
|
$
|
691.8
|
|
$
|
1,287.6
|
|
$
|
(1,371.6
|
)
|
$
|
1,301.3
|
|
||||
102
|
Consolidating Statements of Cash Flow
|
|||||||||||||||||||
|
Year Ended December 31, 2013
|
|||||||||||||||||||
|
(in millions)
|
Parent Guarantor
|
Subsidiary Issuer
|
Non-Guarantor Subsidiaries
|
Consolidating Adjustments
|
Total
|
||||||||||||||
|
Net cash provided by (used in) operating activities
|
$
|
76.8
|
|
$
|
102.5
|
|
$
|
208.8
|
|
$
|
(175.9
|
)
|
$
|
212.2
|
|
||||
|
Investing activities:
|
|||||||||||||||||||
|
Additions to property, plant and equipment
|
—
|
|
(0.2
|
)
|
(106.3
|
)
|
—
|
|
(106.5
|
)
|
|||||||||
|
Investment in Pipe Line Holdings
|
—
|
|
(100.0
|
)
|
—
|
|
100.0
|
|
—
|
|
|||||||||
|
Loans to affiliates
|
—
|
|
—
|
|
(100.0
|
)
|
100.0
|
|
—
|
|
|||||||||
|
Repayments of loans from affiliates
|
—
|
|
—
|
|
26.0
|
|
(26.0
|
)
|
—
|
|
|||||||||
|
Disposal of assets
|
—
|
|
—
|
|
0.2
|
|
—
|
|
0.2
|
|
|||||||||
|
All other, net
|
—
|
|
—
|
|
(7.3
|
)
|
—
|
|
(7.3
|
)
|
|||||||||
|
Net cash provided by (used in) investing activities
|
—
|
|
(100.2
|
)
|
(187.4
|
)
|
174.0
|
|
(113.6
|
)
|
|||||||||
|
Financing activities:
|
|
||||||||||||||||||
|
Proceeds from borrowings from affiliates
|
—
|
|
100.0
|
|
—
|
|
(100.0
|
)
|
—
|
|
|||||||||
|
Payments on borrowings from affiliates
|
—
|
|
(26.0
|
)
|
—
|
|
26.0
|
|
—
|
|
|||||||||
|
Long-term debt - repayments
|
—
|
|
—
|
|
(0.7
|
)
|
—
|
|
(0.7
|
)
|
|||||||||
|
Quarterly distributions
|
(77.8
|
)
|
(78.8
|
)
|
(97.1
|
)
|
175.9
|
|
(77.8
|
)
|
|||||||||
|
Quarterly distributions to noncontrolling interest retained by MPC
|
—
|
|
—
|
|
(82.7
|
)
|
—
|
|
(82.7
|
)
|
|||||||||
|
Distributions related to purchase of additional interest in Pipe Line Holdings
|
—
|
|
—
|
|
—
|
|
(100.0
|
)
|
(100.0
|
)
|
|||||||||
|
Net cash provided by (used in) financing activities
|
(77.8
|
)
|
(4.8
|
)
|
(180.5
|
)
|
1.9
|
|
(261.2
|
)
|
|||||||||
|
Net decrease in cash and cash equivalents
|
(1.0
|
)
|
(2.5
|
)
|
(159.1
|
)
|
—
|
|
(162.6
|
)
|
|||||||||
|
Cash and cash equivalents at beginning of period
|
1.0
|
|
9.7
|
|
206.0
|
|
—
|
|
216.7
|
|
|||||||||
|
Cash and cash equivalents at end of period
|
$
|
—
|
|
$
|
7.2
|
|
$
|
46.9
|
|
$
|
—
|
|
$
|
54.1
|
|
||||
103
|
Consolidating Statements of Cash Flow
|
|||||||||||||||||||
|
Year Ended December 31, 2012
|
|||||||||||||||||||
|
(in millions)
|
Parent Guarantor
|
Subsidiary Issuer
|
Non-Guarantor Subsidiaries
|
Consolidating Adjustments
|
Total
|
||||||||||||||
|
Net cash provided by (used in) operating activities
|
$
|
(1.4
|
)
|
$
|
1.7
|
|
$
|
190.3
|
|
$
|
—
|
|
$
|
190.6
|
|
||||
|
Investing activities:
|
|||||||||||||||||||
|
Additions to property, plant and equipment
|
—
|
|
—
|
|
(135.6
|
)
|
—
|
|
(135.6
|
)
|
|||||||||
|
Distributions from (contributions to) subsidiaries
|
(202.0
|
)
|
10.4
|
|
191.6
|
|
—
|
|
—
|
|
|||||||||
|
Disposal of assets
|
—
|
|
—
|
|
1.3
|
|
—
|
|
1.3
|
|
|||||||||
|
Investments - repayments of loans receivable from a related party
|
—
|
|
—
|
|
221.7
|
|
—
|
|
221.7
|
|
|||||||||
|
Net cash provided by (used in) investing activities
|
(202.0
|
)
|
10.4
|
|
279.0
|
|
—
|
|
87.4
|
|
|||||||||
|
Financing activities:
|
|||||||||||||||||||
|
Long-term debt - repayments
|
—
|
|
—
|
|
(0.7
|
)
|
—
|
|
(0.7
|
)
|
|||||||||
|
Debt issuance costs
|
—
|
|
(2.4
|
)
|
—
|
|
—
|
|
(2.4
|
)
|
|||||||||
|
Net proceeds from initial public offering
|
407.1
|
|
—
|
|
—
|
|
—
|
|
407.1
|
|
|||||||||
|
Proceeds from initial public offering distributed to MPC
|
(202.7
|
)
|
—
|
|
—
|
|
—
|
|
(202.7
|
)
|
|||||||||
|
Distributions to MPC
|
—
|
|
—
|
|
(262.7
|
)
|
—
|
|
(262.7
|
)
|
|||||||||
|
Net cash provided by (used in) financing activities
|
204.4
|
|
(2.4
|
)
|
(263.4
|
)
|
—
|
|
(61.4
|
)
|
|||||||||
|
Net increase in cash and cash equivalents
|
1.0
|
|
9.7
|
|
205.9
|
|
—
|
|
216.6
|
|
|||||||||
|
Cash and cash equivalents at beginning of period
|
—
|
|
—
|
|
0.1
|
|
—
|
|
0.1
|
|
|||||||||
|
Cash and cash equivalents at end of period
|
$
|
1.0
|
|
$
|
9.7
|
|
$
|
206.0
|
|
$
|
—
|
|
$
|
216.7
|
|
||||
|
Consolidating Statements of Cash Flow
|
|||||||||||||||||||
|
Year Ended December 31, 2011
|
|||||||||||||||||||
|
(in millions)
|
Parent Guarantor
|
Subsidiary Issuer
|
Non-Guarantor Subsidiaries
|
Consolidating Adjustments
|
Total
|
||||||||||||||
|
Net cash provided by operating activities
|
$
|
—
|
|
$
|
—
|
|
$
|
181.9
|
|
$
|
—
|
|
$
|
181.9
|
|
||||
|
Investing activities:
|
|||||||||||||||||||
|
Additions to property, plant and equipment
|
—
|
|
—
|
|
(49.8
|
)
|
—
|
|
(49.8
|
)
|
|||||||||
|
Investments in related party debt securities - purchases
|
—
|
|
—
|
|
(260.6
|
)
|
—
|
|
(260.6
|
)
|
|||||||||
|
- redemptions
|
—
|
|
—
|
|
311.7
|
|
—
|
|
311.7
|
|
|||||||||
|
Investments - loans to a related party
|
—
|
|
—
|
|
(220.0
|
)
|
—
|
|
(220.0
|
)
|
|||||||||
|
Net cash used in investing activities
|
—
|
|
—
|
|
(218.7
|
)
|
—
|
|
(218.7
|
)
|
|||||||||
|
Financing activities:
|
|||||||||||||||||||
|
Long-term debt - repayments
|
—
|
|
—
|
|
(0.6
|
)
|
—
|
|
(0.6
|
)
|
|||||||||
|
Contributions from MPC
|
—
|
|
—
|
|
37.3
|
|
—
|
|
37.3
|
|
|||||||||
|
Net cash provided by financing activities
|
—
|
|
—
|
|
36.7
|
|
—
|
|
36.7
|
|
|||||||||
|
Net decrease in cash and cash equivalents
|
—
|
|
—
|
|
(0.1
|
)
|
—
|
|
(0.1
|
)
|
|||||||||
|
Cash and cash equivalents at beginning of period
|
—
|
|
—
|
|
0.2
|
|
—
|
|
0.2
|
|
|||||||||
|
Cash and cash equivalents at end of period
|
$
|
—
|
|
$
|
—
|
|
$
|
0.1
|
|
$
|
—
|
|
$
|
0.1
|
|
||||
104
Select Quarterly Financial Data (Unaudited)
|
|
2013
|
2012
|
||||||||||||||||||||||||||||||
|
(In millions, except per unit data)
|
1st Qtr.
|
2nd Qtr.
|
3rd Qtr.
|
4th Qtr.
|
1st Qtr.
|
2nd Qtr.
|
3rd Qtr.
|
4th Qtr.
|
||||||||||||||||||||||||
|
Revenues
|
$
|
109.9
|
|
$
|
116.1
|
|
$
|
118.2
|
|
$
|
118.9
|
|
$
|
97.5
|
|
$
|
105.6
|
|
$
|
116.2
|
|
$
|
122.9
|
|
||||||||
|
Income from operations
|
35.5
|
|
35.2
|
|
39.8
|
|
36.5
|
|
34.9
|
|
29.5
|
|
36.3
|
|
42.5
|
|
||||||||||||||||
|
Net income
|
35.3
|
|
34.8
|
|
39.2
|
|
36.8
|
|
35.2
|
|
29.8
|
|
36.9
|
|
42.1
|
|
||||||||||||||||
|
Net income attributable to MPLX LP
|
17.6
|
|
18.6
|
|
21.5
|
|
20.2
|
|
35.2
|
|
29.8
|
|
36.9
|
|
28.9
|
|
||||||||||||||||
|
Net income attributable to MPLX LP subsequent to initial public offering on October 31, 2012
|
17.6
|
|
18.6
|
|
21.5
|
|
20.2
|
|
—
|
|
—
|
|
—
|
|
13.1
|
|
||||||||||||||||
|
Net income attributable to MPLX LP subsequent to initial public offering per limited partner unit:
|
||||||||||||||||||||||||||||||||
|
Common - basic
|
$
|
0.26
|
|
$
|
0.26
|
|
$
|
0.29
|
|
$
|
0.27
|
|
$
|
—
|
|
$
|
—
|
|
$
|
—
|
|
$
|
0.18
|
|
||||||||
|
Common - diluted
|
0.26
|
|
0.26
|
|
0.29
|
|
0.27
|
|
—
|
|
—
|
|
—
|
|
0.18
|
|
||||||||||||||||
|
Subordinated
|
0.21
|
|
0.23
|
|
0.29
|
|
0.27
|
|
—
|
|
—
|
|
—
|
|
0.17
|
|
||||||||||||||||
|
Distributions declared per limited partner common unit
|
$
|
0.2725
|
|
$
|
0.2850
|
|
$
|
0.2975
|
|
$
|
0.3125
|
|
$
|
—
|
|
$
|
—
|
|
$
|
—
|
|
$
|
0.1769
|
|
||||||||
|
Distributions declared:
|
||||||||||||||||||||||||||||||||
|
Limited partner units - Public
|
$
|
5.4
|
|
$
|
5.7
|
|
$
|
5.9
|
|
$
|
6.2
|
|
$
|
—
|
|
$
|
—
|
|
$
|
—
|
|
$
|
3.5
|
|
||||||||
|
Limited partner units - MPC
|
14.7
|
|
15.4
|
|
16.1
|
|
16.9
|
|
—
|
|
—
|
|
—
|
|
9.5
|
|
||||||||||||||||
|
General partner units - MPC
|
0.4
|
|
0.4
|
|
0.5
|
|
0.5
|
|
—
|
|
—
|
|
—
|
|
0.3
|
|
||||||||||||||||
|
Incentive distribution rights - MPC
|
—
|
|
—
|
|
—
|
|
0.1
|
|
—
|
|
—
|
|
—
|
|
—
|
|
||||||||||||||||
|
Total distributions declared
|
$
|
20.5
|
|
$
|
21.5
|
|
$
|
22.5
|
|
$
|
23.7
|
|
$
|
—
|
|
$
|
—
|
|
$
|
—
|
|
$
|
13.3
|
|
||||||||
105
None
Disclosure Controls and Procedures
An evaluation of the effectiveness of the design and operation of our disclosure controls and procedures (as defined in Rules 13(a)-15(e) and 15(d)-15(e) under the Securities Exchange Act of 1934, as amended) was carried out under the supervision and with the participation of management, including the chief executive officer and chief financial officer of our general partner. Based upon that evaluation, the chief executive officer and chief financial officer of our general partner concluded that the design and operation of these disclosure controls and procedures were effective as of
December 31, 2013
, the end of the period covered by this Annual Report on Form 10-K.
Internal Control Over Financial Reporting
See Item 8. Financial Statements and Supplementary Data – Management’s Report on Internal Control over Financial Reporting.
Changes in Internal Control Over Financial Reporting
During the quarter ended
December 31, 2013
, there were no changes in our internal control over financial reporting that have materially affected, or are reasonably likely to materially affect, our internal control over financial reporting.
None
106
MANAGEMENT OF MPLX LP
We are managed by the directors and executive officers of our general partner, MPLX GP LLC. Our general partner is not elected by our unitholders and will not be subject to re-election by our unitholders in the future. MPC indirectly owns all of the membership interests in our general partner. Our general partner has a board of directors, and our unitholders are not entitled to elect the directors or directly or indirectly to participate in our management or operations. Our general partner is liable, as general partner, for all of our debts (to the extent not paid from our assets), except for indebtedness or other obligations that are made specifically nonrecourse to it. Whenever possible, we intend to incur indebtedness that is nonrecourse to our general partner.
Our general partner has nine directors. MPC appoints all members to the board of directors of our general partner, which we may refer to as our board. Our board has determined that Christopher A. Helms, David A. Daberko, Dan D. Sandman, John P. Surma and C. Richard Wilson, are independent under the independence standards of the NYSE.
Neither we nor our subsidiaries have any employees. Our general partner has the sole responsibility for providing the employees and other personnel necessary to conduct our operations. All of the employees that conduct our business are employed by affiliates of our general partner, but we sometimes refer to these individuals as our employees.
Director Independence
Although most companies listed on the NYSE are required to have a majority of independent directors serving on the board of directors of the listed company, the NYSE does not require a publicly traded limited partnership like us to have a majority of independent directors on our board or to establish a compensation or a nominating and corporate governance committee. We are, however, required to have an audit committee of at least three members, and all of our audit committee members are required to meet the independence and financial literacy tests established by the NYSE and the Exchange Act.
Committees of the Board of Directors
Our board has an audit committee and a conflicts committee, and may have such other committees as the board shall determine from time to time. The audit committee and the conflicts committee are comprised entirely of independent directors. Additionally, an executive committee of the board, comprised of Gary R. Heminger and Dan D. Sandman, has been established to address matters that may arise between meetings of the board. This executive committee may exercise the powers and authority of the board subject to specific limitations consistent with applicable law.
Each of the standing committees of the board of directors has the composition and responsibilities described below.
Audit Committee
C. Richard Wilson serves as the chairman, and Christopher A. Helms and Dan D. Sandman are members, of our audit committee. Our audit committee assists the board of directors in its oversight of the integrity of our financial statements and our compliance with legal and regulatory requirements and corporate policies and controls. Our audit committee has the sole authority to retain and terminate our independent registered public accounting firm, approve all auditing services and related fees and the terms thereof and pre-approve any non-audit services to be rendered by our independent registered public accounting firm. Our audit committee also is responsible for confirming the independence and objectivity of our independent registered public accounting firm. Our independent registered public accounting firm is given unrestricted access to our audit committee.
Our audit committee has a written charter adopted by the board of directors of our general partner, which is available on our website at http://ir.mplx.com by selecting “Corporate Governance” and clicking on “Board Committees and Charters,” “Audit Committee,” “Audit Committee Charter.” The audit committee charter requires our audit committee to assess and report to the board on the adequacy of the charter on an annual basis. Each of the members of our audit committee is independent as independence is defined in the Exchange Act, as well as the general independence requirements of the NYSE.
Audit Committee Financial Expert
Based on the attributes, education and experience requirements set forth in the rules of the SEC, the board of directors of our general partner has determined that C. Richard Wilson and Christopher A. Helms each qualify as an “Audit Committee Financial Expert.”
107
Mr. Wilson served as the President of Buckeye Partners, L.P. and its general partner, Buckeye GP LLC, and also served as its Chief Operating Officer, Director and Vice Chairman. During the period he was Chief Operating Officer, Mr. Wilson was responsible for all aspects of Buckeye Partners, L.P.’s. operations and administration, including the oversight of accounting and audit functions, and legal and regulatory compliance.
Mr. Helms served in various capacities at NiSource Inc. and its affiliate, NiSource Gas Transmission and Storage, including as Executive Vice President and Group Chief Executive Officer and Group President, Pipeline of NiSource Inc., where he was also a member of the executive council and corporate risk management committee. He also served as Chief Executive Officer and Executive Director of NiSource Gas Transmission and Storage and has extensive experience in the areas of finance, accounting, compliance, strategic planning and risk oversight.
Audit Committee Report
The Audit Committee has reviewed and discussed the Partnership’s audited financial statements for the year ended
December 31, 2013
with the management of MPLX GP LLC, the Partnership’s general partner. The Audit Committee discussed with the independent auditors, PricewaterhouseCoopers LLP, the matters required to be discussed by the Public Company Accounting Oversight Board’s standard, Auditing Standard No. 16. The Committee has received the written disclosures and the letter from PricewaterhouseCoopers LLP required by the applicable requirements of the Public Company Accounting Oversight Board for independent auditor communications with audit committees concerning independence and has discussed with PricewaterhouseCoopers LLP its independence. Based on the review and discussions referred to above, the Audit Committee recommended to the Board that the audited financial statements be included in the Partnership’s Annual Report on Form 10-K for the year ended
December 31, 2013
, for filing with the SEC.
C. Richard Wilson, Chairman
Christopher A. Helms
Dan D. Sandman
Conflicts Committee
Christopher A. Helms serves as the chairman, and Dan D. Sandman and C. Richard Wilson are members, of our conflicts committee. Our conflicts committee reviews specific matters that may involve conflicts of interest in accordance with the terms of our partnership agreement. Any matters approved by our conflicts committee in good faith will be deemed to be approved by all of our partners and not a breach by our general partner of any duties it may owe us or our unitholders. The members of our conflicts committee may not be officers or employees of our general partner or directors, officers or employees of its affiliates, and must meet the independence and experience standards established by the NYSE and the Exchange Act to serve on an audit committee of a board of directors. In addition, the members of our conflicts committee may not own any interest in our general partner or any interest in us or our subsidiaries other than common units or awards under our incentive compensation plan.
Our conflicts committee has a written charter adopted by the board of directors of our general partner, which is available on our website at http://ir.mplx.com by selecting “Corporate Governance” and clicking on “Board Committees and Charters,” “Conflicts Committee,” “Conflicts Committee Charter.” The conflicts committee charter requires our conflicts committee to assess and report to the board on the adequacy of the charter on an annual basis. Each of the members of our conflicts committee is independent as independence is defined in the Exchange Act, as well as the general independence requirements of the NYSE.
108
DIRECTORS AND EXECUTIVE OFFICERS OF MPLX GP LLC
Directors are elected by the sole member of our general partner and hold office until their successors have been elected or qualified or until their earlier death, resignation, removal or disqualification. Executive officers are appointed by, and serve at the discretion of, the board of directors. The following table shows information for the directors and executive officers of MPLX GP LLC.
|
Name
|
Age as of
January 31, 2014
|
Position with MPLX GP LLC
|
|||
|
Gary R. Heminger
|
60
|
|
Chairman of the Board of Directors and Chief Executive Officer
|
||
|
Pamela K.M. Beall
|
57
|
|
Director and President
|
||
|
Donald C. Templin
|
50
|
|
Director, Vice President and Chief Financial Officer
|
||
|
David A. Daberko
|
68
|
|
Director
|
||
|
Christopher A. Helms
|
59
|
|
Director
|
||
|
Garry L. Peiffer
|
62
|
|
Director
|
||
|
Dan D. Sandman
|
65
|
|
Director
|
||
|
John P. Surma
|
59
|
|
Director
|
||
|
C. Richard Wilson
|
69
|
|
Director
|
||
|
George P. Shaffner
|
54
|
|
Vice President and Chief Operating Officer
|
||
|
Michael G. Braddock
|
56
|
|
Vice President and Chief Accounting Officer
|
||
|
Timothy T. Griffith
|
44
|
|
Vice President, Finance and Investor Relations, and Treasurer
|
||
|
J. Michael Wilder
|
61
|
|
Vice President, General Counsel and Secretary
|
||
|
Craig O. Pierson
|
57
|
|
Vice President, Operations
|
||
Gary R. Heminger.
Gary R. Heminger was appointed chief executive officer and elected chairman of the board of directors of our general partner in June 2012. He is also president, chief executive officer and a member of the board of directors of MPC, and a member of the board of directors of Fifth Third Bancorp. Mr. Heminger serves as chairman of the board of trustees of Tiffin University and is a member of the Oxford Institute for Energy Studies and the U.S.-Saudi Arabian Business Council Executive Committee. In 2011, Mr. Heminger was appointed to the board of JobsOhio, a non-profit corporation that leads the state’s job creation and economic development activities. He is also on the boards of directors of the American Petroleum Institute and the American Fuel & Petrochemical Manufacturers, serving on the executive committees of both. Mr. Heminger began his career with Marathon in 1975 and has served in a variety of capacities. In addition to holding various finance and administration roles, he spent three years in London as part of the Brae Project and served in several marketing and commercial positions with Emro Marketing Company, the predecessor of Speedway LLC. He also served as president of Marathon Pipe Line Company. Mr. Heminger was named vice president of Business Development for Marathon Ashland Petroleum LLC upon its formation in 1998, senior vice president in 1999 and executive vice president in 2001. Mr. Heminger was appointed president of Marathon Petroleum Company LLC and executive vice president Marathon Oil Corporation - Downstream in 2001. He assumed his current position with MPC in 2011. Mr. Heminger earned a bachelor's degree in accounting from Tiffin University in 1976 and a master's degree in business administration from the University of Dayton in 1982. He is a graduate of the Wharton School Advanced Management Program at the University of Pennsylvania.
Qualifications:
Mr. Heminger has extensive knowledge of all aspects of our business. As our chief executive officer, he leverages that expertise in advising on the strategic direction of the Partnership and apprising the board on issues of significance to the Partnership and our industry. Mr. Heminger also serves on one outside public company board of directors, which affords him a fresh perspective on management and governance. Mr. Heminger brings to our board energy industry expertise and a breadth of transactional experience.
Other Public Company Directorships:
Marathon Petroleum Corporation (2011 to present); Fifth Third Bancorp (2006 to present)
109
Pamela K. M. Beall
. Pamela K. M. Beall was appointed president and elected a member of the board of directors of our general partner effective January 2014. She is also the senior vice president, Corporate Planning, Government and Public Affairs of MPC. Ms. Beall serves on the board of trustees of The University of Findlay and is a member of The Ohio Society of CPAs. Ms. Beall began her career with Marathon in 1978 as an auditor and held positions with the Corporate Risk and Environmental Affairs and Domestic Funds organizations before transferring to USX Corporation as general manager, Treasury Services in 1985. She also held senior financial positions at NationsRent, Inc. and OHM Corporation, and served on the boards of directors of System One Services, Inc. and Boyle Engineering. Ms. Beall rejoined Marathon in 2002, as manager, Business Development for Marathon Ashland Petroleum LLC. She was named director, Corporate Affairs in 2003 and appointed director, Business Development in 2005. She then served as organizational vice president, Business Development - Downstream for Marathon Petroleum Company LLC in 2006. Ms. Beall was named vice president of Global Procurement for Marathon Oil Company in 2007, vice president of Products, Supply & Optimization for Marathon Petroleum Company LLC in 2010 and vice president, Investor Relations and Government & Public Affairs in 2011. Ms. Beall graduated from The University of Findlay with a bachelor's degree in accounting in 1978. In 1984, she received her master's degree in business administration from Bowling Green State University. Ms. Beall was licensed as a certified public accountant in Ohio in 1984.
Qualifications:
As president of our general partner and senior vice president, Corporate Planning, Government and Public Affairs of MPC, Ms. Beall has extensive energy industry experience, specifically in the areas of finance and accounting, business development, risk management, procurement, investor relations and government affairs. She has also served as a senior executive in the environmental remediation and consumer products sectors, as well as on the boards of directors of other companies. Ms. Beall brings to our board her knowledge of the Partnership’s business and operations, and her perspective on its prospects for growth.
Other Public Company Directorships:
None within the last five years
Donald C. Templin.
Donald C. Templin was appointed vice president, chief financial officer and elected a member of the board of directors of our general partner in June 2012. Mr. Templin is also senior vice president and chief financial officer of MPC, and a member of the board of directors of Calgon Carbon Corporation. Mr. Templin is active in a number of charitable organizations, including the United Way. Prior to joining Marathon Petroleum in 2011, Mr. Templin was the managing partner of the audit practice for PricewaterhouseCoopers LLP (PwC) in Georgia, Alabama and Tennessee. While at PwC, he completed more than 25 years of providing auditing and advisory services to a wide variety of private, public and multinational companies. Mr. Templin joined PwC in Pittsburgh in 1984, where he worked with a number of manufacturing clients. While at PwC, he went on to serve in London, Kazakhstan and Baltimore before assuming his position in Atlanta in 2009. Mr. Templin is a graduate of Grove City College, a certified public accountant and a member of the American Institute of Certified Public Accountants.
Qualifications:
As vice president and chief financial officer of our general partner and senior vice president and chief financial officer of MPC, Mr. Templin has specific expertise in the areas of accounting, audit and financial management. Mr. Templin also has a long and successful background in public accounting for energy sector clients and draws from that experience on matters relating to public company financial reporting requirements. Mr. Templin serves on one outside public company board of directors, which provides him exposure to perspectives on management and governance that may differ from those of our general partner. Mr. Templin brings his extensive energy industry background, particularly his expertise in accounting, financial reporting and strategic planning, to his service on our board.
Other Public Company Directorships:
Calgon Carbon Corporation (2013 to present)
David A. Daberko
. David A. Daberko was elected a member of the board of directors of our general partner effective October 2012. Mr. Daberko is chairman of the board of directors of the general partner of Access Midstream Partners, L.P., and serves on the boards of directors of MPC and RPM International, Inc. He is also a trustee of Case Western Reserve University, University Hospitals of Cleveland and Hawken School. Mr. Daberko joined National City Bank in 1968, and went on to hold a number of management positions with National City. In 1987 Mr. Daberko was elected deputy chairman of the corporation and president of National City Bank in Cleveland. He served as president and chief operating officer from 1993 until 1995, when he was named chairman of the board and chief executive officer. He retired as chief executive officer in June 2007 and as chairman of the board in December 2007. Mr. Daberko holds a bachelor's degree from Denison University and a master's degree in business administration from Case Western Reserve University.
Qualifications:
With nearly forty years of experience in the banking industry, including twelve years as the chairman and chief executive officer of a large financial services corporation, Mr. Daberko has extensive knowledge of the financial services and investment banking sectors. He also has considerable experience from his service as a member of other public company boards of directors, including within the energy industry. Mr. Daberko brings to our board his knowledge of public company financial reporting requirements and an understanding of the energy business.
110
Other Public Company Directorships:
Marathon Petroleum Corporation (2011 to present); Access Midstream Partners, L.P. (2010 to present); RPM International, Inc. (2006 to present); Marathon Oil Corporation (2002 to 2011)
Christopher A. Helms.
Christopher A. Helms was elected a member of the board of directors of our general partner effective October 2012. Mr. Helms is chief executive officer of US Shale Energy Advisors LLC. He is also on the boards of directors of Coskata, Inc. and Questar Corporation. Mr. Helms is the founder of US Shale Energy Advisors, a firm that specializes in providing advisory services to domestic and international clients on issues arising out of the emerging North American shale developments. From 2005 until his retirement in 2011, Mr. Helms served in various capacities with NiSource Inc. and its affiliate, NiSource Gas Transmission and Storage, including as executive vice president and group chief executive officer. He was group president, pipeline of NiSource Inc. from 2005 to 2008, where he was also a member of the Executive Council and the Corporate Risk Management Committee. He served as chief executive officer and executive director of NiSource Gas Transmission and Storage from 2008 to 2011. At NiSource, Mr. Helms was responsible for leading the company’s interstate gas transmission and storage business. Mr. Helms graduated with a bachelor of arts degree from Southern Illinois University at Edwardsville and a juris doctor degree from the Tulane University School of Law.
Qualifications:
As the founder and chief executive of an energy advisory firm and a former senior executive with a natural gas company, Mr. Helms has significant experience in the oil and gas business. His background includes overseeing joint ventures and mergers and acquisitions within the midstream energy sector. He draws upon his prior capacity supervising financial reporting functions in his role as one of our named audit committee financial experts. Through his service on one other public company board of directors, Mr. Helms is exposed to other management styles and governance approaches. Mr. Helms serves as chair of our conflicts committee. He brings his considerable midstream energy expertise, particularly in operations and business combinations, and his skills in the areas of finance, accounting, compliance, strategic planning and risk oversight, to his service on our board.
Other Public Company Directorships:
Questar Corporation (2013 to present)
Garry L. Peiffer.
Garry L. Peiffer was elected a member of the board of directors of our general partner in June 2012. Mr. Peiffer retired as president of our general partner and as executive vice president, Corporate Planning and Investor & Government Relations of MPC, effective January 2014. He is a member of the board of directors of the Fifth Third Bank (Northwestern Ohio). Mr. Peiffer is also a member of the boards of trustees of the Blanchard Valley Health System and the Findlay-Hancock County Community Foundation, and serves on the Blanchard Valley Port Authority Board. Mr. Peiffer began his career with Marathon Oil Company in 1974. During his career, he held a variety of management positions with increasing responsibilities. These responsibilities included supervisor of employee savings and retirement plans, controller of Speedway Petroleum Corporation and numerous other marketing and logistics positions. In 1987, Mr. Peiffer was appointed to the president's Commission on Executive Exchange serving for a year in the Pentagon as special assistant to the Assistant Secretary of Defense for Production and Logistics. In 1988, he returned to Marathon Oil and was named vice president of Finance and Administration for Emro Marketing Company. He served as assistant controller, Refining, Marketing and Transportation beginning in 1992. Mr. Peiffer was named senior vice president of Finance and Commercial Services for Marathon Ashland Petroleum LLC in 1998, executive vice president of MPC in 2011 and president of our general partner in 2012. Mr. Peiffer graduated with a bachelor’s degree in accounting from Bowling Green State University in 1974 and passed the certified public accountant exam in Ohio that same year.
Qualifications:
As the retired president of our general partner and retired executive vice president, Corporate Planning and Investor & Government Relations of MPC, Mr. Peiffer has an extensive energy industry background. His significant career accomplishments include leading finance organizations, successfully realizing several joint ventures and corporate reorganizations and implementing new information technology solutions. As a recognized leader in the industry, Mr. Peiffer led the Partnership through the initial public offering process and in its first year of operations. Mr. Peiffer brings a wealth of knowledge and market expertise to his role on our board.
Other Public Company Directorships:
None within the last five years
111
Dan D. Sandman
. Dan D. Sandman was elected a member of the board of directors of our general partner effective October 2012. Mr. Sandman is an adjunct professor at The Ohio State University Moritz College of Law, where he has taught corporate governance since 2007. He is also on the board of directors of Roppe Corporation. Additionally, Mr. Sandman serves on the boards of directors of the Heinz History Center, the Carnegie Science Center, the Carnegie Hero Commission, the British American Business Council, the Pittsburgh Opera and Grove City College. He has also served as a court-appointed mediator of commercial cases pending in U.S. federal courts and lectured on the law of corporate governance at Oxford University. Mr. Sandman began his career with Marathon in 1973 and served in a series of legal positions of increasing responsibility. In 1986, Mr. Sandman was appointed general counsel and secretary of Marathon Oil Company, and in 1993 he was named general counsel and secretary of USX Corporation. Upon the spinoff of United States Steel Corporation from USX in 2002, Mr. Sandman was named vice chairman of the board of directors and chief legal & administrative officer of United States Steel, where he served until his retirement in 2007. During his time with United States Steel, Mr. Sandman was responsible at various times for management and oversight of aspects of Human Resources, Executive Compensation, Public Relations, Environmental and Government Affairs, as well as the Law Organization and the corporate secretary’s office. Mr. Sandman graduated with a bachelor of arts degree from The Ohio State University in 1970 and a juris doctor degree from The Ohio State University College of Law in 1973. Mr. Sandman attended the Stanford Executive Program in 1989.
Qualifications:
As the former vice chairman and chief legal officer of a large industrial firm, Mr. Sandman has considerable experience in the legal affairs, transactional law, regulatory compliance and corporate governance, ethics and risk management matters that may arise in the context of the Partnership’s business. He has also served as general counsel of a large integrated oil company and thus has an energy industry background. Mr. Sandman teaches corporate governance law as an adjunct professor and serves on the board of directors of a private company engaged in a manufacturing business. Mr. Sandman brings to our board his valuable perspective, specifically on matters of strategic focus, governance and leadership.
Other Public Company Directorships:
None within the last five years
John P. Surma
. John P. Surma was elected a member of the board of directors of our general partner effective October 2012. Mr. Surma is a member of the boards of directors of MPC, Ingersoll-Rand plc and the Federal Reserve Bank of Cleveland. Additionally, Mr. Surma is on the board of directors of the National Safety Council. He was appointed by President Barack Obama to the President's Advisory Committee for Trade Policy and Negotiations and serves as its vice chairman. Mr. Surma retired as the chief executive officer of United States Steel Corporation effective September 1, 2013, and as executive chairman effective December 31, 2013. Prior to joining United States Steel, Mr. Surma served in several executive positions with Marathon. He was named senior vice president, Finance & Accounting of Marathon Oil Company in 1997, president, Speedway SuperAmerica LLC in 1998, senior vice president, Supply & Transportation of Marathon Ashland Petroleum LLC in 2000 and president of Marathon Ashland Petroleum LLC in 2001. Prior to joining Marathon, Mr. Surma worked for Price Waterhouse LLP where he was admitted to the partnership in 1987. In 1983, Mr. Surma participated in the President’s Executive Exchange Program in Washington, D.C., where he served as executive staff assistant to the vice chairman of the Federal Reserve Board. Mr. Surma earned a bachelor of science degree in accounting from Pennsylvania State University in 1976.
Qualifications:
As the retired chairman and chief executive officer of a large industrial firm, Mr. Surma has a broad range of experiences that shape his viewpoint on the strategic direction and operations of the Partnership. Mr. Surma brings to the board his significant experience in public accounting and in executive leadership in the energy and steel industries. His service on other public company boards of directors also affords him a perspective that is particularly valuable to our board.
Other Public Company Directorships:
Marathon Petroleum Corporation (2011 to present); Ingersoll-Rand plc (2012 to present); United States Steel Corporation (2001 to 2013); Bank of New York Mellon (2007 to 2012)
C. Richard Wilson
. C. Richard Wilson was elected a member of the board of directors of our general partner effective October 2012. Mr. Wilson is the owner of Plough Penny Associates, LLC, a consulting firm that offers services in the finance, marketing and general management disciplines. Mr. Wilson also serves on the board of directors of Minsi Trails Council, which is affiliated with the Boy Scouts of America. Mr. Wilson previously served in director and executive officer capacities with Buckeye Partners, L.P. and its general partner, Buckeye GP LLC. During his tenure with Buckeye Partners, Mr. Wilson held the positions of president and chief operating officer. While serving as chief operating officer, he was responsible for all aspects of Buckeye Partners’ operations and administration. In addition to pipeline operations, such responsibilities included finance, mergers and acquisitions, investor relations, legal, regulatory compliance, engineering and human relations. Mr. Wilson was a director of Buckeye GP LLC from 1986 until 2000, holding the role of vice chairman for two years. After Mr. Wilson’s retirement in 2000, he remained as a consultant to Buckeye Partners for an additional five years. Mr. Wilson graduated with a bachelor of arts degree in economics and a master’s degree in business administration, both from Rutgers University.
112
Qualifications:
As a former director and the president and chief operating officer of Buckeye Partners, L.P., Mr. Wilson’s experience with the management and oversight of a master limited partnership dates back to the emergence of this business form in the pipeline industry. Mr. Wilson’s background as an executive in the midstream energy sector includes, at various points in time, his responsibility for pipeline operations, engineering, corporate administration, finance, mergers and acquisitions, investor relations and regulatory compliance. He draws upon his prior capacity supervising financial reporting functions in his role as chair of the audit committee of our board and in serving as one of our named audit committee financial experts. Mr. Wilson brings to our board his wealth of knowledge of the energy business, which makes him a valued contributor.
Other Public Company Directorships:
None within the last five years
George P. Shaffner
. George P. Shaffner was appointed vice president and chief operating officer of our general partner in June 2012. Mr. Shaffner is also senior vice president, Transportation and Logistics of MPC, and serves as chairman of the board of the Louisiana Offshore Oil Port (LOOP). Mr. Shaffner joined Marathon in 1981 as an associate engineer. He has held a number of engineering and managerial positions in the company's pipeline, marketing and refining operations, including as maintenance manager of the Detroit refinery from 1990 until 1992. He was named engineering manager at the Garyville refinery in 1992 and refining reliability manager in 1994. Mr. Shaffner was appointed division manager of MPC’s former St. Paul Park refinery in 2003 and its Detroit refinery in 2006. In his current role, he oversees MPC’s Terminal, Transport & Rail, Marketing & Transportation Engineering and Product Quality Organizations, as well as Marathon Pipe Line LLC operations. Mr. Shaffner graduated from Rose-Hulman Institute of Technology with a bachelor of science degree in mechanical engineering in 1981. He completed the Wharton School Advanced Management Program at the University of Pennsylvania in 2007.
Michael G. Braddock.
Michael G. Braddock was appointed vice president and controller of our general partner in June 2012, and vice president and chief accounting officer in February 2014. Mr. Braddock is also vice president and controller of MPC, and is a member of the American Institute of Certified Public Accountants and The Ohio Society of CPAs. Mr. Braddock began his career with Marathon in 1980 as a joint interest auditor in the Internal Audit organization. In 1982 he accepted a position in Corporate Accounting and later served as the accounting analyst responsible for Marathon’s financial consolidation. In 1987 he transferred to the Tax organization and was appointed tax supervisor in 1988. In 1992 he transferred to USX Corporation as manager, Federal Income Tax Compliance. Mr. Braddock returned to Marathon in 1998 as manager, Income Tax Compliance, with responsibility for both income tax compliance and tax accounting functions. In 2002 he was named manager of Business Development within Marathon’s downstream business unit, with responsibility for a variety of pipeline related matters and projects. In 2005 he was appointed manager, Internal Audit where he led the downstream internal controls group. Mr. Braddock was appointed controller, Marathon Petroleum Company LLC in 2008. Mr. Braddock graduated from Ohio Northern University in 1980 with a bachelor of science degree in accounting and is a certified public accountant.
Timothy T. Griffith
. Timothy T. Griffith was appointed vice president and treasurer of our general partner in September and June of 2012, respectively, and assumed responsibilities as vice president, Investor Relations effective January 2014. Mr. Griffith is also vice president, Finance and Investor Relations, and treasurer of MPC. Prior to joining MPC in 2011, he served as vice president and treasurer of Smurfit-Stone Container Corporation, where he had executive responsibility for the company's investor interface and treasury operations, including capital structure, cash management, insurance and investment oversight. Mr. Griffith has also served as vice president and treasurer of Cooper-Standard Automotive, as assistant treasurer of Lear Corporation, as the capital planning officer for Comerica Incorporated and as a derivatives specialist with Citicorp Securities. Mr. Griffith earned a bachelor’s degree in economics from Michigan State University in 1991 and a master of business administration from the University of Michigan in 1997. He is also a chartered financial analyst, a designation he has held since 1995.
113
J. Michael Wilder.
J. Michael Wilder was appointed vice president, general counsel and secretary of our general partner in June 2012. Mr. Wilder is also vice president, general counsel and secretary of MPC. He has served as secretary-treasurer and president of The Findlay/Hancock County Bar Association, and as chairman of the Owens Community College Foundation Board of Directors and as chairman of the Kentucky Council on Child Abuse Board of Directors. Mr. Wilder joined Ashland Petroleum Company, a division of Ashland Inc., as a staff attorney in 1978 and was promoted to senior attorney in 1984. In 1986 he transferred to Ashland’s Valvoline Oil Company, where he served as senior attorney. In 1988 he was named vice president and general counsel for Ashland’s SuperAmerica convenience store group. In addition to law, his responsibilities with SuperAmerica at various times included real estate, design and construction, environmental, health and safety and marketing functions. He served as regional vice president for SuperAmerica's Northwest Region in 1995, and in 1996 was appointed to lead a reengineering effort for SuperAmerica's store operations. In connection with the formation of Marathon Ashland Petroleum LLC, Mr. Wilder was named general counsel and secretary in 1998. In 2009 he was appointed as deputy general counsel of Marathon Oil Company. He assumed his current position with MPLX GP LLC in 2012. Mr. Wilder received a bachelor's degree in political science from the University of Kentucky in 1975 and a juris doctor degree from the University of Kentucky College of Law in 1978. Mr. Wilder attended Ashland’s Executive Development Program at Indiana University in 1990, the Program for Management Development at Harvard University in 1995 and participated in Leadership Kentucky in 1997.
Craig O. Pierson.
Craig O. Pierson was appointed vice president, Operations of our general partner in June 2012. Mr. Pierson has served as president of Marathon Pipe Line LLC since May 30, 2011. Mr. Pierson serves as an industry representative on the Technical Hazardous Liquid Pipeline Safety Standards Committee, which advises the Pipeline and Hazardous Materials Safety Administration on regulatory matters. Mr. Pierson joined Marathon Pipe Line Company in 1978 as a pipeline engineer. He also served as an internal control auditor for Marathon Oil Company before returning to a series of pipeline engineering and operations positions in Wyoming, Alaska, West Texas and Houston. In 1989 he helped develop a gas pipeline project in Syria. In 1991, Mr. Pierson was named manager of Engineering and Construction Services with responsibilities in the retail marketing sector. He then held operations manager positions for Marathon Pipe Line until 1997, when he joined an upstream development project on Sakhalin Island, Russia. In 2000 Mr. Pierson returned to operations manager positions for Marathon Ashland Pipe Line LLC, with responsibilities over Gulf Coast operations and the commissioning and start-up of Centennial Pipeline. Mr. Pierson graduated from Ohio Northern University with a bachelor of science degree in mechanical engineering in 1978.
GOVERNANCE PRINCIPLES
Our governance principles are available on our website at http://ir.mplx.com by selecting “Corporate Governance” and clicking on “Governance Principles.” In summary, our Governance Principles provide the functional framework of the board of directors of our general partner, including its roles and responsibilities. These principles also address board independence, committee composition, the process for director selection and director qualifications, the board’s performance review, the board’s planning and oversight functions, director compensation and director retirement and resignation.
LEADERSHIP STRUCTURE OF THE BOARD
As provided in our governance principles, our board of directors does not have a policy requiring the roles of chairman of the board and chief executive officer to be filled by separate persons or requiring the chairman of the board to be a non-management director. Mr. Heminger, our general partner’s chief executive officer, serves as chairman of the board. Our board has determined that due to his extensive knowledge of all aspects of the Partnership’s business, as well as the continued relationship between the Partnership and MPC, Mr. Heminger is in the best position to lead the board as its chairman.
Our governance principles also provide that when the role of chairman of the board is filled by the chief executive officer, the board may appoint an independent director as a “lead director” to preside over executive sessions of the board or other board meetings when the chairman is absent. Dan D. Sandman serves as the “lead director” of the board of directors of our general partner.
The leadership structure of our board, with the combined role of chairman and chief executive officer and the independent oversight promoted by our lead director, offers a balanced approach that our board believes serves the Partnership well at this time.
COMMUNICATIONS FROM INTERESTED PARTIES
All interested parties may communicate directly with our independent directors by submitting a communication in an envelope addressed to the “Board of Directors (non-management members)” in care of the secretary of our general partner. Additionally, communications with our audit and conflicts committee chairs may be made by sending an e-mail to: auditchair@mplx.com; or conflictschair@mplx.com.
114
You may communicate with the independent directors, individually or as a group, by sending an e-mail to non-managedirectors@mplx.com.
The secretary of our general partner will forward to the directors all communications that, in the secretary’s judgment, are appropriate for consideration by the directors. Examples of communications that would not be considered appropriate include commercial solicitations.
BENEFICIAL OWNERSHIP REPORTING COMPLIANCE
Section 16(a) of the Exchange Act, as amended, requires the directors and executive officers of our general partner and persons who own more than 10.0 percent of a registered class of our equity securities, to file reports of beneficial ownership on Form 3 and changes in beneficial ownership on Forms 4 or 5 with the SEC. Based solely on our review of the reporting forms and written representations provided to us from the persons required to file reports, we believe that each of the directors and executive officers of our general partner and persons who own more than 10.0 percent of a registered class of our equity securities has complied with the applicable reporting requirements for transactions in our equity securities during the fiscal year ended
December 31, 2013
.
CODE OF BUSINESS CONDUCT
Our code of business conduct is available on our website at http://ir.mplx.com by selecting “Corporate Governance” and clicking on “Code of Business Conduct.”
CODE OF ETHICS FOR SENIOR FINANCIAL OFFICERS
Our code of ethics for senior financial officers is available on the Partnership’s website at http://ir.mplx.com by selecting “Corporate Governance” and clicking on “Code of Ethics for Senior Financial Officers.” This code of ethics applies to our chairman of the board of directors and chief executive officer, chief financial officer, vice president and controller, vice president and treasurer and other persons performing similar functions, as well as to those designated as senior financial officers by our chairman and chief executive officer or our audit committee.
Under this code of ethics, these senior financial officers shall, among other things:
|
•
|
act with honesty and integrity, including the ethical handling of actual or apparent conflicts of interest between personal and professional relationships;
|
|
•
|
provide full, fair, accurate, timely and understandable disclosure in reports and documents filed with, or submitted to, the SEC, and in other public communications;
|
|
•
|
comply with applicable laws, governmental rules and regulations, including insider trading laws; and
|
|
•
|
promote the prompt internal reporting of potential violations or other concerns related to this code of ethics to the chair of the audit committee and to the appropriate person or persons identified in the code of business conduct.
|
115
COMPENSATION COMMITTEE REPORT
The chairman of the board and independent directors of our general partner (the "Committee") have reviewed and discussed the Compensation Discussion and Analysis for
2013
with management and, after such review and discussions, the Committee has recommended to the board of directors of our general partner that the Compensation Discussion and Analysis be included in this Annual Report on Form 10-K for the fiscal year ended
December 31, 2013
.
Gary R. Heminger, Chairman
David A. Daberko
Christopher A. Helms
Dan D. Sandman
John P. Surma
C. Richard Wilson
116
COMPENSATION DISCUSSION AND ANALYSIS
Overview
Neither we, our general partner, nor any of our subsidiaries have employees. MPC has the contractual responsibility for providing the employees and other personnel necessary to conduct our operations. This includes all of our executive officers. For our executive officers who are also providing services to MPC and its affiliates other than us and our general partner, compensation is paid by MPC or its applicable affiliate. We pay MPC a fixed amount each month for the services of our executive officers. The amount we pay to MPC for services provided to us by our executive officers is outlined in the omnibus agreement and serves as the amount we report as “Salary” in our Summary Compensation Table.
Our general partner has adopted the MPLX 2012 Plan on our behalf. Certain eligible officers and non-management directors of our general partner and its affiliates who make significant contributions to our business are eligible to receive awards under the MPLX 2012 Plan. In addition, certain eligible employees of our general partner’s affiliates and other individuals who indirectly support our business may also be granted awards under the MPLX 2012 Plan. Awards under the MPLX 2012 Plan will be approved by our general partner.
We provide no bonus payments, benefit programs or perquisites to our executive officers.
Named Executive Officer Compensation
Our Named Executive Officers (“NEOs”) consist of our principal executive officer (PEO), our principal financial officer (PFO) and the three most highly compensated executive officers of our general partner other than the PEO and PFO who were serving as executive officers at the completion of the year ended December 31, 2013. Their names and titles as of that date were as follows:
|
Name
|
Title
|
|
|
Gary R. Heminger
|
Chairman of the Board and Chief Executive Officer
|
|
|
Donald C. Templin
|
Vice President and Chief Financial Officer
|
|
|
Garry L. Peiffer
|
President
|
|
|
George P. Shaffner
|
Vice President and Chief Operating Officer
|
|
|
Pamela K.M. Beall
|
Vice President, Investor Relations
|
|
Except with respect to awards that may be granted under our MPLX 2012 Plan, all responsibility and authority for compensation-related decisions for our NEOs remain with the compensation committee of the board of directors of MPC, currently composed of six independent directors, and are not subject to any approval by us, the board of directors of our general partner or any committees thereof. Other than awards granted under the MPLX 2012 Plan, MPC has the ultimate decision-making authority with respect to the total compensation of its and its subsidiaries’ executive officers and employees. The fixed amount charged to us for the services of our NEOs is provided for in the omnibus agreement.
All determinations with respect to awards to be made under the MPLX 2012 Plan to executive officers of MPC will be made by the board of directors of our general partner or any committee thereof that may be established for such purpose.
Compensation Consultants
Our general partner does not have a compensation committee, and its board of directors has not hired its own compensation consultant. BDO USA, LLP was engaged to provide compensation consulting services and benchmarking information to the compensation department and executive management of MPC and our general partner, which may have been used by the board of directors in making compensation decisions.
ELEMENTS OF COMPENSATION
Base Compensation
Our NEOs earn a base salary for their services to MPC and to us, which is paid by MPC or its affiliates other than us. We incur only a fixed expense per month with respect to the compensation paid to each of our NEOs, as provided for in the omnibus agreement. As of
December 31, 2013
the annualized fixed fee for each of our NEOs was as follows: Mr. Heminger, $1,175,000; Mr. Templin, $475,000; Mr. Peiffer, $475,000; Mr. Shaffner, $425,000; and Ms. Beall, $225,000.
117
Annual Cash Bonus Payments
Our NEOs are eligible to earn an annual bonus payment under MPC’s Annual Cash Bonus Program. The amount of any annual bonus payments to our NEOs will generally be determined based upon their performance with respect to their services provided to MPC and its subsidiaries, which may, directly or indirectly, include a component that relates to our financial performance or their services with respect to our business. However, any bonus payments made to our NEOs will be determined solely by MPC without input from us or our general partner or its board of directors. No portion of any bonus paid by MPC for our NEOs will be charged back to us under the provisions of the omnibus agreement.
Long-Term Incentive Compensation
In January 2013, the board of directors of our general partner met and approved a long-term incentive (or LTI) design whereby the LTI awards granted to our NEOs will be in the form of performance units (50.0 percent) and phantom units (50.0 percent). Each form of LTI generally rewards performance over a multi-year period to the extent service and partnership performance conditions are achieved. The primary purpose of LTI grants to our NEOs is to achieve our long-term business objectives and strengthen the alignment between the interests of our executive officers and our unitholders. The forms of LTI awards differ as illustrated below:
|
Form of LTI Award
|
Form of Settlement
|
Compensation Realized
|
||
|
Performance Units
|
Settled 25.0 percent in common MPLX LP units and 75.0 percent in cash
|
$0.00 to $2.00 per unit based on our relative ranking among a group of peer companies
|
||
|
Phantom Units
|
Common units
|
Value of common units upon vesting
|
||
Performance Units
The board of directors of our general partner believes that a performance unit program based on MPLX LP’s Total Unitholder Return (“TUR”), relative to a peer group, serves to complement our phantom units because the performance unit program provides an incentive to both increase our unitholder return and outperform our peers.
The performance peer group for 2013, as approved by the board of our general partner, was:
|
- Access Midstream Partners, L.P.
|
- Magellan Midstream Partners, L.P.
|
|
|
- Buckeye Partners, L.P.
|
- Plains All American Pipeline, L.P.
|
|
|
- El Paso Pipeline Partners, L.P.
|
- Sunoco Logistics Partners L.P.
|
|
|
- Genesis Energy, L.P.
|
- Tesoro Logistics LP
|
|
|
- Nustar Energy L.P.
|
- Western Gas Partners, LP
|
|
The performance unit program determines TUR by taking the sum of the unit price appreciation or reduction, plus cumulative cash distributions, for the specified measurement period and dividing that total by the beginning unit price, as shown below.
(Ending Unit Price – Beginning Unit Price) + Cumulative Cash Distribution
Beginning Unit Price
The beginning and ending unit prices used in the TUR calculation are the average of the closing unit prices of MPLX LP units and the units of its peer group members for the 20 trading days immediately preceding the beginning or ending date of the measurement period.
The target value of each performance unit is $1.00, with the actual payout varying from $0.00 to $2.00 (zero to 200.0 percent of target) based on MPLX LP’s relative TUR ranking for the measurement period. For example, a fiftieth percentile TUR ranking would provide for a 100 percent payout at $1.00 per unit.
While these grants measure TUR performance over a 36-month period, final payout will be calculated by averaging the TUR performance percentile rankings of the first 12 months, the second 12 months, the third 12 months and, finally, the entire 36-month period. The following table illustrates the performance unit payout percentage based on our average TUR percentile ranking versus those of performance peer group partnerships.
118
Performance Unit TUR Ranking vs. Payout
|
TUR Performance
Percentile
|
|
Payout
(% of Target)*
|
|
100
th
(Highest)
|
|
200%
|
|
50
th
|
|
100%
|
|
25
th
|
|
50%
|
|
Below 25
th
|
|
0%
|
|
*
|
Payout for performance between percentiles will be determined using linear interpolation.
|
The board of directors of our general partner believes that the performance unit program does not encourage excessive or inappropriate risk-taking, as it caps the maximum payout at $2.00 per unit.
The board of directors of our general partner did not award Mr. Peiffer performance units in February 2013. Given Mr. Peiffer had preliminarily discussed the possibility of retiring at the conclusion of certain key projects, they felt there was an increasing likelihood that he would not remain employed for the majority of the standard 36-month performance period. The board instead awarded Mr. Peiffer’s 2013 LTI entirely in phantom units.
Phantom Units
A phantom unit is a notional unit that entitles our NEOs to receive a common unit upon the vesting of the phantom unit on a deferred basis at specified future dates. Grants of phantom units provide diversification of the mix of LTI awards, promote ownership of actual MPLX LP units and promote retention. Further, phantom unit grants also help our NEOs increase their holdings in MPLX LP common units and achieve established ownership guidelines.
Phantom unit awards vest in equal installments on the first, second and third anniversary of the date of grant. Prior to vesting, recipients have no right to vote the units, and cash distributions accrue and pay in cash upon vesting.
Retirement of Garry L. Peiffer
On November 15, 2013, Mr. Peiffer notified the Partnership of his intention to retire effective January 1, 2014, having provided nearly forty years of service to MPC and its predecessors. In recognition of Mr. Peiffer's leadership and service, including his significant contributions to the Partnership's formation and initial public offering and his service as the president of our general partner, the board of directors of our general partner exercised its discretion under the MPLX 2012 Plan by authorizing the revision of the terms and conditions of Mr. Peiffer’s outstanding MPLX LP phantom unit grant.
Unvested phantom unit grants are typically forfeited if an executive terminates or retires before the first day of the month following the executive’s sixty-fifth birthday. Mr. Peiffer was 62 at the time of his retirement and, therefore, his outstanding phantom unit grant would otherwise have cancelled upon retirement. The vesting terms of his phantom unit grant was modified to provide accelerated vesting at retirement. As a result, Mr. Peiffer vested in 9,706 units on January 2, 2014 at a per unit price of $43.13. The total value of his vested units was $418,619.78.
Appointment of Pamela K. M. Beall
On December 16, 2013, the board of directors of our general partner appointed Pamela K. M. Beall as president of our general partner effective January 1, 2014.
OTHER POLICIES
Benefit Programs and Perquisites
Neither we nor our general partner sponsor any benefit plans, programs or policies such as healthcare, life, income protection or retirement benefits for our executive officers, and neither we nor our general partner provide our executive officers with any perquisites. However, such benefits are generally provided to our executive officers in connection with their employment by MPC or its subsidiaries and are based on the eligibility provisions contained in various plan documents. All determinations with respect to such benefits, both now and in the future, will be made by MPC or its subsidiaries without input from us or our general partner or its board of directors. MPC bears the full cost of any such programs and no portion of these benefits is charged back to us under the provisions of the omnibus agreement.
119
Unit Ownership Guidelines
In January 2013, the board of directors of our general partner met and approved unit ownership guidelines for our executive officers, including our NEOs. The guidelines are intended to align the long-term interests of our executive officers and our unitholders. Under these guidelines, executive officers are expected to hold a specified level of MPLX LP common units. The targeted levels are:
|
•
|
based on the executive’s position and responsibilities, and
|
|
•
|
are expected to be reached within five years.
|
The unit ownership guidelines as approved in January 2013 are as follows:
|
•
|
Chairman of the Board and Chief Executive Officer – 200,000 units;
|
|
•
|
President and Vice President, Chief Financial Officer – 42,500 units;
|
|
•
|
Vice President, General Counsel and Secretary; Vice President and Chief Operating Officer; and Vice President, Investor Relations – 17,000 units;
|
|
•
|
Vice President and Treasurer and Vice President and Chief Accounting Officer – 10,500 units; and
|
|
•
|
Vice President, Operations – 2,300 units.
|
Executive officers are not permitted to sell any units received under the MPLX 2012 Plan unless their guideline ownership levels are met and are maintained after the sale. Additionally, a one-year holding requirement prevents executive officers from selling any phantom or performance units settled in common units for twelve months from the time they are vested or earned. This requirement applies to units net of taxes at the time of vesting or distribution.
Prohibition on Derivatives and Hedging
In order to ensure our executive officers, including our NEOs, bear the full risk of our unit ownership, we maintain a policy that prohibits hedging transactions related to our units, or pledging or creating security interests in our units, including units in excess of a unit ownership guideline requirement.
Severance and Change in Control Arrangements
None of our NEOs has a contract of employment with us, our general partner or MPC. However, our NEOs are eligible to participate in MPC’s Amended and Restated Executive Change in Control Severance Benefits Plan. This plan provides MPC’s senior executives with severance payments and benefits in the event of a qualified termination of employment within two years of the occurrence of a change in control of MPC, which would also likely result in a change in control of us. All determinations with respect to such benefits would be made by MPC without input from us or our general partner or its board of directors. MPC would bear the full cost of any such payments and benefits and no portion of such payments would be charged back to us under the provisions of the omnibus agreement.
Our NEOs do not currently participate in any arrangements that would result in the payment of any amounts or provision of any benefits solely as a result of a change in control of us. However, the board of directors of our general partner approved provisions in our 2013 grant agreements that would provide for accelerated vesting upon a termination from service in connection with a change in control of MPLX.
Recoupment/Claw Back Policy
In addition to any compensation recoupment policies that apply with respect to the compensation our NEOs earn from MPC, the MPLX 2012 Plan provides that all awards granted under the MPLX 2012 Plan will be subject to claw back or recoupment in the case of certain forfeiture events. If the Partnership is required, pursuant to a determination made by the SEC or the audit committee of our general partner, to prepare a material accounting restatement due to our noncompliance with any financial reporting requirement under applicable securities laws as a result of misconduct, the audit committee may determine that a forfeiture event has occurred based on an assessment of whether an executive officer:
|
•
|
knowingly engaged in misconduct;
|
|
•
|
was grossly negligent with respect to misconduct;
|
|
•
|
knowingly failed or was grossly negligent in failing to prevent misconduct; or
|
|
•
|
engaged in fraud, embezzlement or other similar misconduct materially detrimental to us.
|
120
Upon a determination by the audit committee of our general partner that a forfeiture event has occurred, any grants of unvested phantom units and performance units to such executive officer would be subject to immediate forfeiture. If a forfeiture event occurred either while the executive officer is employed or within three years after termination of employment and a payment has previously been made to the executive officer in settlement of performance units, we may recoup an amount in cash or units up to (but not in excess of) the amount paid in settlement of the performance units.
These recoupment provisions are in addition to the requirements in Section 304 of the Sarbanes-Oxley Act of 2002, which provide that the chief executive officer and chief financial officer shall reimburse us for incentive-based or equity-based compensation, as well as any related profits received in the 12-month period prior to the filing of an accounting restatement due to noncompliance with financial reporting requirements as a result of our misconduct.
Additional Compensation Components
In the future, as MPC and/or our general partner formulate and implement the compensation programs for our executive officers, MPC and/or our general partner may provide additional or different compensation components, benefits and/or perquisites to help ensure our executive officers are provided with a balanced, comprehensive and competitive total compensation package. We, MPC and our general partner believe that it is important to maintain flexibility to adapt compensation structures on an ongoing basis to properly attract, motivate, retain and reward the top executive talent for which MPC and our general partner compete with other companies.
COMPENSATION-BASED RISK ASSESSMENT
Annually, the Committee reviews our policies and practices in compensating our service providers (including both executive officers and non-executives, if any) as they relate to our risk management profile.
The Committee completed this review of our 2013 programs in February 2014. As a result of this review, the Committee concluded that any risks arising from our compensation policies and practices were not reasonably likely to have a material adverse effect on our financial statements.
121
2013 Summary Compensation Table
The following table summarizes the total compensation awarded to, earned by or paid to Mr. Heminger, the Chairman of the Board and Chief Executive Officer of our general partner, Mr. Templin, the Vice President and Chief Financial Officer of our general partner, and the other three most highly compensated executive officers serving as officers of our general partner as of
December 31, 2013
, (collectively, our NEOs) for services rendered during 2013 and 2012:
|
|
|
|
|
|
Change in
Pension Value
and Non-qualified
Deferred
Compensation
Earnings
($)
|
|
|
||||||||||
|
Name and Principal Position
|
Year
|
Salary
(1)
($)
|
Bonus
($)
|
Stock
Awards
(2)(3)
($)
|
Option
Awards
($)
|
Non-Equity
Incentive Plan
Compensation
($)
|
All Other
Compensation
($)
|
Total
($)
|
|||||||||
|
Gary R. Heminger
Chairman of the
Board and Chief
Executive Officer
|
2013
|
1,175,000
|
|
—
|
|
1,566,015
|
|
—
|
|
—
|
|
—
|
|
—
|
|
2,741,015
|
|
|
2012
|
195,833
|
|
—
|
|
—
|
|
—
|
|
—
|
|
—
|
|
—
|
|
195,833
|
|
|
|
Donald C. Templin
Vice President and
Chief Financial
Officer
|
2013
|
475,000
|
|
—
|
|
365,419
|
|
—
|
|
—
|
|
—
|
|
—
|
|
840,419
|
|
|
Garry L. Peiffer
President
|
2013
|
475,000
|
|
—
|
|
680,100
|
|
—
|
|
—
|
|
—
|
|
—
|
|
1,155,100
|
|
|
George P. Shaffner
Vice President and
Chief Operating
Officer
|
2013
|
425,000
|
|
—
|
|
104,405
|
|
—
|
|
—
|
|
—
|
|
—
|
|
529,405
|
|
|
Pamela K.M. Beall
Vice President,
Investor Relations
|
2013
|
225,000
|
|
—
|
|
91,371
|
|
—
|
|
—
|
|
—
|
|
—
|
|
316,371
|
|
|
(1)
|
The amounts shown in this column reflect the annualized fixed fee for our NEOs for
2013
. The amount listed for 2012 is a pro-rated portion of the 2012 annualized fixed fee for the period from October 31, 2012 through December 31, 2012.
|
|
(2)
|
The amounts shown in this column reflect the aggregate grant date fair value in accordance with generally accepted accounting principles in the U.S. regarding equity compensation. See Item 8. Financial Statements and Supplementary Data - Note 16 for assumptions used in the calculation of these amounts. The maximum value of the performance units reported in the "Stock Awards" column for the 2013 performance unit grants, assuming the highest level of performance is achieved for each NEO, is as follows: Mr. Heminger, $1,800,000; Mr. Templin $420,000; Mr. Shaffner, $120,000 and Ms. Beall, $105,000.
|
|
(3)
|
Due to Mr. Peiffer's retirement, which was announced on November 15, 2013, the terms and conditions of his outstanding phantom units were modified as previously discussed. Therefore, the incremental fair value of his outstanding phantom units of $360,093 was calculated using the MPLX LP closing unit price on November 18, 2013 of $37.10.
|
122
Grants of Plan-Based Awards in 2013
The following table provides information regarding all plan-based awards, including cash-based incentive awards and equity awards (specifically phantom units and performance units) granted to each of our NEOs in 2013. The awards listed in the table below were granted under the MPLX 2012 Plan.
|
Name
|
Type of Award
|
Grant Date
|
Estimated Future Payouts Under Equity Incentive Plan Awards
(1)
|
All Other Stock Awards: Number of Shares of Stock
(#)
|
Grant Date Fair Value of Stock and Option Awards
(2)
($)
|
|||||||
|
Threshold
($)
|
Target
($)
|
Maximum
($)
|
||||||||||
|
Gary R. Heminger
|
Phantom Units
|
2/27/2013
|
27,298
|
|
900,015
|
|
||||||
|
Performance Units
|
2/27/2013
|
450,000
|
|
900,000
|
|
1,800,000
|
|
666,000
|
|
|||
|
Donald C. Templin
|
Phantom Units
|
2/27/2013
|
6,370
|
|
210,019
|
|
||||||
|
Performance Units
|
2/27/2013
|
105,000
|
|
210,000
|
|
420,000
|
|
155,400
|
|
|||
|
Garry L. Peiffer
|
Phantom Units
|
2/27/2013
|
9,706
|
|
320,007
|
|
||||||
|
Performance Units
|
2/27/2013
|
—
|
|
—
|
|
—
|
|
—
|
|
|||
|
George P. Shaffner
|
Phantom Units
|
2/27/2013
|
1,820
|
|
60,005
|
|
||||||
|
Performance Units
|
2/27/2013
|
30,000
|
|
60,000
|
|
120,000
|
|
44,400
|
|
|||
|
Pamela K.M. Beall
|
Phantom Units
|
2/27/2013
|
1,593
|
|
52,521
|
|
||||||
|
Performance Units
|
2/27/2013
|
26,250
|
|
52,500
|
|
105,000
|
|
38,850
|
|
|||
|
(1)
|
The target amounts shown in this column reflect the number of performance units granted to each of our NEOs, and each unit has a target value of $1.00.
|
|
(2)
|
The amounts shown in this column reflect the total grant date fair value of performance units and phantom units granted in 2013 in accordance with generally accepted accounting principles in the U.S. regarding equity compensation. Performance units are designed to settle 25.0 percent in MPLX LP common units and 75.0 percent in cash. The performance unit awards have a grant date fair value of $0.74 per unit as calculated using a Monte Carlo valuation model. See Item 8. Financial Statements and Supplementary Data - Note 16 for assumptions used in the calculation of these amounts.
|
Performance Units (Equity Incentive Plan Awards):
The board of directors of our general partner granted performance units to our NEOs with a grant date of February 27, 2013. Each performance unit has a target value of $1.00 and is designed to settle 25.0 percent in MPLX LP common units and 75.0 percent in cash. Payout of these units could vary from $0.00 to $2.00 per unit and is tied to our TUR over a thirty-six-month period as compared to the TUR of those in our peer group for the January 1, 2013 through December 31, 2015 performance period. No cash distributions are paid and no voting rights are associated with unvested performance units. If an NEO retires following the completion of one-half of the performance period, the NEO will be eligible to receive, at the discretion of the board of directors of our general partner, a prorated payout based on the actual results of that performance period. In the event of the death of an NEO or a change in control of the partnership, all unvested performance units immediately vest at target levels.
Phantom Units (Other Stock Awards):
The board of directors of our general partner granted phantom unit awards to our NEOs with a grant date of February 27, 2013. The phantom unit awards vest in one-third increments on the first, second and third anniversaries of the grant date. Cash distributions accrue on the phantom unit awards and are paid upon vesting. If an NEO retires under MPC's mandatory retirement policy, unvested phantom units vest and accrued cash distributions are paid upon the mandatory retirement date (the first day of the month following the officer's sixty-fifth birthday.) In the event of the death of an NEO or a change in control of the Partnership, unvested phantom units immediately vest and accrued cash distributions are paid. If an NEO retires or otherwise leaves the Partnership prior to the vesting date, unvested phantom units and unpaid cash distributions are forfeited.
123
Outstanding Equity Awards at 2013 Fiscal Year-End
The following table provides information regarding unvested phantom units and unvested performance units held by each of our NEOs as of
December 31, 2013
:
|
Equity Awards
|
|||||||||
|
Name
|
Grant Date
|
Number of Units That Have Not Vested
(1)
(#)
|
Market Value of Stock That Have Not Vested
(2)
($)
|
Equity Incentive Plan Awards: Number of Unearned Share or Other Rights that Have Not Vested
(3)
(#)
|
Equity Incentive Plan Awards: Market or Payout Value of Unearned Share or Other Rights that Have Not Vested
(4)
($)
|
||||
|
Gary R. Heminger
|
2/27/2013
|
27,298
|
|
1,215,853
|
|
900,000
|
|
450,000
|
|
|
Donald C. Templin
|
2/27/2013
|
6,370
|
|
283,720
|
|
210,000
|
|
105,000
|
|
|
Garry L. Peiffer
|
2/27/2013
|
9,706
|
|
432,305
|
|
—
|
|
—
|
|
|
George P. Shaffner
|
2/27/2013
|
1,820
|
|
81,063
|
|
60,000
|
|
30,000
|
|
|
Pamela K.M. Beall
|
2/27/2013
|
1,593
|
|
70,952
|
|
52,500
|
|
26,250
|
|
|
(1)
|
The amounts shown in this column reflect the number of unvested phantom units held by each of our NEOs on
December 31, 2013
. Phantom unit grants are scheduled to vest in one-third increments on the first, second and third anniversaries of the grant date.
|
|
Name
|
Grant Date
|
Number of Unvested Units
|
Vesting Dates
|
|
|
Gary R. Heminger
|
2/27/2013
|
27,298
|
|
2/27/2014, 2/27/2015, 2/27/2016
|
|
Donald C. Templin
|
2/27/2013
|
6,370
|
|
2/27/2014, 2/27/2015, 2/27/2016
|
|
Garry L. Peiffer
|
2/27/2013
|
9,706
|
|
2/27/2014, 2/27/2015, 2/27/2016
|
|
George P. Shaffner
|
2/27/2013
|
1,820
|
|
2/27/2014, 2/27/2015, 2/27/2016
|
|
Pamela K.M. Beall
|
2/27/2013
|
1,593
|
|
2/27/2014, 2/27/2015, 2/27/2016
|
|
(2)
|
The amounts shown in this column reflect the aggregate
value of all unvested phantom units held by each NEO on
December 31, 2013
, using the MPLX closing unit price of $44.54.
|
|
(3)
|
The amounts shown in this column reflect the number of unvested performance units held by each of our NEOs on
December 31, 2013
. Performance unit grants awarded in 2013 have a thirty-six month performance period and are designed to settle 25.0 percent in MPLX LP common units and 75.0 percent in cash. Each of these performance unit grants has a target value of $1.00 and payout may vary from $0.00 to $2.00 per unit. Payout is tied to our TUR as compared to specified peer groups.
|
|
Name
|
Grant Date
|
Number of Unvested Units
|
Performance Period Ending Date
|
|
|
Gary R. Heminger
|
2/27/2013
|
900,000
|
|
12/31/2015
|
|
Donald C. Templin
|
2/27/2013
|
210,000
|
|
12/31/2015
|
|
George P. Shaffner
|
2/27/2013
|
60,000
|
|
12/31/2015
|
|
Pamela K.M. Beall
|
2/27/2013
|
52,500
|
|
12/31/2015
|
|
(4)
|
The amounts shown in this column reflect the aggregate value of all performance units held by each of our NEOs on
December 31, 2013
assuming the threshold payout of $0.50 per unit.
|
124
Potential Payments Upon a Termination or Change In Control
The only situation in which an NEO would receive compensation due to the accelerated vesting of our performance units and phantom units, without the discretion of the board of directors of our general partner, would be upon a termination from service in connection with the change in control of MPLX LP. The compensation payable to each of our NEOs, assuming such termination occurred on December 31, 2013, based on our closing unit price as of that date and assuming our performance units settled at target, would have been as follows: Mr. Heminger, $2,115,853; Mr. Templin, $493,720; Mr. Peiffer, $432,305; Mr. Shaffner, $141,063; and Ms. Beall, $123,452.
COMPENSATION OF OUR DIRECTORS
The officers or employees of our general partner or of MPC who also serve as directors of our general partner do not receive additional compensation for their service as a director of our general partner. Directors of our general partner who are not officers or employees of our general partner or of MPC receive compensation as “non-management directors.”
Each of our non-management directors receives a compensation package having an annual value equal to $125,000 and payable as follows:
|
•
|
50.0 percent in the form of a cash retainer, payable in equal quarterly installments of $15,625 (at the commencement of each calendar quarter); and
|
|
•
|
50.0 percent in the form of a phantom unit award (granted at the commencement of each calendar quarter) covering a number of units having a value (based on the closing price of our common units on the date of grant) equal to $15,625. The phantom unit awards are not subject to any risk of forfeiture once granted and are automatically deferred until and settled in common units at the time the non-management director separates from service on the board or upon his or her death.
|
Upon their commencement of service with us, each non-management director received a prorated cash payment and a prorated phantom unit award reflecting the period of time remaining in their initial partial quarter of service.
In addition, the chair of each standing committee of the board receives an additional annual retainer. In February 2014, the board of directors of our general partner also approved an annual retainer for our lead director, who also serves on the executive committee of the board. These additional annual retainers are payable in cash (at the commencement of each calendar quarter) as follows:
|
•
|
Audit Committee Chair – $15,000;
|
|
•
|
Conflicts Committee Chair – $15,000;
|
|
•
|
Lead Director & Executive Committee Member - $15,000; and
|
|
•
|
Other Committee Chair – $7,500.
|
Further, each director is indemnified for his or her actions associated with being a director to the fullest extent permitted under Delaware law and is reimbursed for all expenses incurred in attending to his or her duties as a director.
125
2013
Director Compensation Table
Amounts reflected in the table below represent compensation paid for
2013
.
|
Name
|
Fees
Earned or
Paid in
Cash
(1)
($)
|
Stock
Awards
(2)
($)
|
Option
Awards
($)
|
Non-Equity
Incentive Plan
Compensation
($)
|
Change in
Pension Value
and Non-
Qualified
Deferred
Compensation
Earnings
($)
|
All Other
Compensation
($)
|
Total
($)
|
||||||||||||||
|
David A. Daberko
|
62,500
|
|
62,500
|
|
—
|
|
—
|
|
—
|
|
—
|
|
125,000
|
|
|||||||
|
Christopher A. Helms
|
77,500
|
|
62,500
|
|
—
|
|
—
|
|
—
|
|
—
|
|
140,000
|
|
|||||||
|
Dan D. Sandman
|
62,500
|
|
62,500
|
|
—
|
|
—
|
|
—
|
|
—
|
|
125,000
|
|
|||||||
|
John P. Surma
|
62,500
|
|
62,500
|
|
—
|
|
—
|
|
—
|
|
—
|
|
125,000
|
|
|||||||
|
C. Richard Wilson
|
77,500
|
|
62,500
|
|
—
|
|
—
|
|
—
|
|
—
|
|
140,000
|
|
|||||||
|
(1)
|
The amounts shown in this column reflect the director cash retainers and committee chair fees paid for board service from January 1,
2013
through
December 31, 2013
.
|
|
(2)
|
The amounts shown in this column reflect the aggregate grant date fair value, as computed in accordance with generally accepted accounting principles in the United States regarding equity compensation, for phantom unit awards granted to the non-management directors in
2013
. All phantom unit awards are deferred until departure from the board and distribution equivalents in the form of additional phantom unit awards are credited to non-management director deferred accounts as and when distributions are paid on our common units.
|
126
Security Ownership of Certain Beneficial Owners
The following table sets forth information from filings made with the SEC as to each person or group who as of
December 31, 2013
(unless otherwise noted) beneficially owned more than 5.0 percent of our outstanding units or more than 5.0 percent of any class of our outstanding units.
|
Name and Address
of Beneficial Owner
|
Number of
Common
Units
Representing
Limited
Partner
Interests
|
Percent of
Common
Units
Representing
Limited
Partner
Interests
|
Number of
Subordinated
Units
Representing
Limited
Partner
Interests
|
Percent of
Subordinated
Units
Representing
Limited
Partner
Interests
|
Number of
General
Partner
Units
|
Percent of
General
Partner
Units
|
Percent of
Units
Representing
Total
Partnership
Interests
|
||||||||||||||
|
Marathon Petroleum Corporation
(1)
|
17,056,515
|
|
46.2
|
%
|
36,951,515
|
|
100.0
|
%
|
1,508,225
|
|
100.0
|
%
|
73.6
|
%
|
|||||||
|
539 S. Main Street
|
|||||||||||||||||||||
|
Findlay, Ohio 45840
|
|||||||||||||||||||||
|
Tortoise Capital Advisors, L.L.C.
(2)
|
5,383,929
|
|
14.6
|
%
|
—
|
|
—
|
|
—
|
|
—
|
|
7.1
|
%
|
|||||||
|
11550 Ash Street, Suite 300
|
|||||||||||||||||||||
|
Leawood, Kansas 66211
|
|||||||||||||||||||||
|
FMR LLC
(3)
|
2,168,257
|
|
5.9
|
%
|
—
|
|
—
|
|
—
|
|
—
|
|
2.9
|
%
|
|||||||
|
245 Summer Street
|
|||||||||||||||||||||
|
Boston, MA 02210
|
|||||||||||||||||||||
|
(1)
|
The 17,056,515 common units representing limited partner interests (“Common Units”) and 36,951,515 subordinated units representing limited partner interests (“Subordinated Units”) are directly held by MPLX Logistics Holdings LLC. The 1,508,225 general partner units are directly held by MPLX GP LLC and represent its 2.0 percent general partner interest in MPLX LP. Marathon Petroleum Corporation is the ultimate parent company of MPLX GP LLC and MPLX Logistics Holdings LLC and may be deemed to beneficially own the Common Units and Subordinated Units directly held by MPLX Logistics Holdings LLC, and the general partner units directly owned by MPLX GP LLC.
|
|
(2)
|
According to a Schedule 13G/A filed with the SEC on February 11, 2014, Tortoise Capital Advisors, L.L.C. has sole voting or dispositive power over none of our Common Units, shared voting power over 4,917,065 of our Common Units and shared dispositive power over 5,383,929 of our Common Units.
|
|
(3)
|
According to a Schedule 13G filed with the SEC on February 14, 2014, FMR LLC has sole voting power over 28,038 of our Common Units, sole dispositive power over 2,168,257 of our Common Units and shared voting and dispositive power over none of our Common Units.
|
127
Security Ownership of Directors and Executive Officers
The following table sets forth the number of MPLX LP common units beneficially owned as of January 31, 2014, except as otherwise noted, by each director of our general partner, by each named executive officer of our general partner and by all directors and executive officers of our general partner as a group. The address for each person named below is c/o MPLX LP, 200 East Hardin Street, Findlay, Ohio 45840.
|
Name of Beneficial Owner
|
Amount and Nature of
Beneficial Ownership
(1)
|
|
Percent of
Total
Outstanding
|
|
|
Directors / Named Executive Officers
|
||||
|
Gary R. Heminger
|
87,298
|
|
(2)(5)
|
*
|
|
Pamela K.M. Beall
|
11,593
|
|
(2)(5)
|
*
|
|
David A. Daberko
|
13,063
|
|
(2)(3)(4)
|
*
|
|
Christopher A. Helms
|
13,548
|
|
(2)(3)
|
*
|
|
Garry L. Peiffer
|
32,068
|
|
(2)(3)
|
*
|
|
Dan D. Sandman
|
26,548
|
|
(2)(3)
|
*
|
|
George P. Shaffner
|
5,820
|
|
(2)(5)
|
*
|
|
John P. Surma
|
18,063
|
|
(2)(3)(4)(6)
|
*
|
|
Donald C. Templin
|
21,370
|
|
(2)(5)
|
*
|
|
C. Richard Wilson
|
5,548
|
|
(2)(3)
|
*
|
|
All Directors and Executive Officers as a group (14 reporting persons)
|
274,490
|
|
(2)(3)(4)(5)(6)
|
*
|
|
(1)
|
None of the units reported in this column are pledged as security.
|
|
(2)
|
Includes units directly or indirectly held in beneficial form.
|
|
(3)
|
Includes phantom unit awards granted pursuant to the MPLX LP 2012 Incentive Compensation Plan and credited within a deferred account pursuant to the MPLX GP LLC Non-Management Director Compensation Policy and Director Equity Award Terms. The aggregate number of phantom unit awards credited as of January 31, 2014, for the non-management directors of our general partner is as follows: Messrs. Daberko, Helms, Sandman, Surma and Wilson, 2,548 each; and Mr. Peiffer, 371.
|
|
(4)
|
Includes phantom unit awards granted pursuant to the MPLX LP 2012 Incentive Compensation Plan and credited within a deferred account pursuant to the Marathon Petroleum Corporation Deferred Compensation Plan for Non-Employee Directors. The aggregate number of phantom unit awards credited as of January 31, 2014, for each of Messrs. Daberko and Surma is 515.
|
|
(5)
|
Includes phantom unit awards granted pursuant to the MPLX LP 2012 Incentive Compensation Plan, which may be forfeited under certain conditions.
|
|
(6)
|
Mr. Surma disclaims beneficial ownership of 7,500 units, which are held in an account by his son.
|
|
*
|
The percentage of units beneficially owned by each director or each executive officer of our general partner does not exceed 1.0 percent of the common and subordinated units outstanding, and the percentage of units beneficially owned by all directors and executive officers of our general partner as a group does not exceed 1.0 percent of the common and subordinated units outstanding.
|
128
The following table sets forth the number of shares of MPC common stock beneficially owned as of January 31, 2014, except as otherwise noted, by each director of our general partner, by each named executive officer of our general partner and by all directors and executive officers of our general partner as a group. The address for each person named below is c/o MPLX LP, 200 East Hardin Street, Findlay, Ohio 45840.
|
Name of Beneficial Owner
|
Amount and Nature of
Beneficial Ownership
(1)
|
|
Percent of
Total
Outstanding
|
|
|
Directors/Named Executive Officers
|
||||
|
Gary R. Heminger
|
924,406
|
|
(2)(4)(5)(8)(9)
|
*
|
|
Pamela K.M. Beall
|
81,406
|
|
(2)(4)(8)
|
*
|
|
David A. Daberko
|
62,919
|
|
(2)(3)
|
*
|
|
Christopher A. Helms
|
—
|
|
|
*
|
|
Garry L. Peiffer
|
263,161
|
|
(2)(7)(8)
|
*
|
|
Dan D. Sandman
|
—
|
|
|
*
|
|
George P. Shaffner
|
81,745
|
|
(2)(4)(6)(8)
|
*
|
|
John P. Surma
|
13,306
|
|
(3)(7)
|
*
|
|
Donald C. Templin
|
126,521
|
|
(2)(4)(8)
|
*
|
|
C. Richard Wilson
|
—
|
|
|
*
|
|
All Directors and Executive Officers as a group (14 reporting persons)
|
1,756,224
|
|
(2)(3)(4)(5)(6)(7)(8)(9)
|
*
|
|
(1)
|
None of the shares reported in this column are pledged as security.
|
|
(2)
|
Includes shares directly or indirectly held in registered or beneficial form.
|
|
(3)
|
Includes restricted stock unit awards granted pursuant to the Second Amended and Restated Marathon Petroleum Corporation 2011 Incentive Compensation Plan and the Marathon Petroleum Corporation 2012 Incentive Compensation Plan, and credited within a deferred account pursuant to the Marathon Petroleum Corporation Deferred Compensation Plan for Non-Employee Directors. The aggregate number of restricted stock unit awards credited as of January 31, 2014, for each of Messrs. Daberko and Surma are 60,919 and 8,306, respectively.
|
|
(4)
|
Includes shares of restricted stock issued pursuant to the Second Amended and Restated Marathon Petroleum Corporation 2011 Incentive Compensation Plan and the Marathon Petroleum Corporation 2012 Incentive Compensation Plan, which are subject to limits on sale and transfer, and may be forfeited under certain conditions.
|
|
(5)
|
Includes shares held within the Marathon Petroleum Thrift Plan.
|
|
(6)
|
Includes shares held within the Marathon Petroleum Corporation Dividend Reinvestment and Direct Stock Purchase Plan.
|
|
(7)
|
Includes shares indirectly held in trust. The number of shares indirectly held in trust as of January 31, 2014, by each applicable director or named executive officer is as follows: 5,000 shares held by Mr. Surma in the Elizabeth L. Surma Revocable Trust; and 1,825 shares held by Mr. Peiffer in a revocable trust account governed by a Trust Agreement dated April 9, 2010.
|
|
(8)
|
Includes vested options exercisable within sixty days of January 31, 2014. Of vested options exercisable within sixty days of January 31, 2014, 636 options are not in-the-money.
|
|
(9)
|
Includes shares that would have been received as a result of the exercise of vested stock-settled stock appreciation rights based on the fair market value (i.e., closing price) of MPC’s common stock on January 31, 2014, of $87.05.
|
|
*
|
The percentage of shares beneficially owned by each director or each executive officer of our general partner does not exceed 1.0 percent of the common shares outstanding, and the percentage of shares beneficially owned by all directors and executive officers of our general partner as a group does not exceed 1.0 percent of the common shares outstanding.
|
129
Securities Authorized for Issuance Under Equity Compensation Plans
The following table provides information as of
December 31, 2013
with respect to common units that may be issued under the MPLX LP 2012 Incentive Compensation Plan:
|
Plan category
|
Number of
securities to
be issued
upon
exercise of
outstanding
options,
warrants
and rights
(1)
|
Weighted
average
exercise
price of
outstanding
options,
warrants
and
rights
(2)
|
Number of
securities
remaining
available for
future
issuance
under equity
compensation
plans
(3)
|
||||||
|
Equity compensation plans approved by security holders
|
97,373
|
|
N/A
|
|
2,652,627
|
|
|||
|
Equity compensation plans not approved by security holders
|
—
|
|
—
|
|
—
|
|
|||
|
Total
|
97,373
|
|
2,652,627
|
|
|||||
|
(1)
|
Includes the following:
|
|
(a)
|
77,754 phantom unit awards granted pursuant to the MPLX 2012 Plan and not forfeited, cancelled or expired as of
December 31, 2013
.
|
|
(b)
|
19,619 units as the maximum potential number of units that could be issued in settlement of performance units outstanding as of December 31, 2013, pursuant to the MPLX 2012 Plan based on the closing price of our common units on December 31, 2013, of $44.54 per unit. The number of units reported for this award vehicle may overstate dilution. See Item 8. Financial Statements and Supplementary Data - Note 16 for more information on performance unit awards granted under the MPLX 2012 Plan.
|
|
(2)
|
There is no exercise price associated with phantom unit awards.
|
|
(3)
|
Reflects the units available for issuance pursuant to the MPLX 2012 Plan. The number of units reported in this column assumes 19,619 as the maximum potential number of units that could be issued in settlement of performance units outstanding as of December 31, 2013 pursuant to the MPLX 2012 Plan based on the closing price of our common units on December 31, 2013, of $44.54 per unit. The number of units assumed for this award vehicle may understate the number of units available for issuance pursuant to the MPLX 2012 Plan. See Item 8. Financial Statements and Supplementary Data - Note 16 for more information on performance unit awards issued pursuant to the MPLX 2012 Plan.
|
Certain Relationships and Related Party Transactions
Our general partner is an affiliate of MPC. As of February 14, 2014, MPC owned 17,056,515 common units and 36,951,515 subordinated units, representing a 71.6 percent limited partner interest in us. In addition, our general partner owned 1,508,331 general partner units, representing a 2.0 percent general partner interest in us as well as all of our incentive distribution rights. Our general partner manages our operations and activities through its officers and directors. In addition, Ms. Beall and Messrs. Heminger, Templin, Shaffner, Braddock, Griffith and Wilder serve as executive officers of our general partner and MPC. Accordingly, we view transactions between us and MPC as related party transactions.
MPLX Pipe Line Holdings LP
In connection with the closing of our initial public offering we entered into an amended and restated limited partnership agreement of MPLX Pipe Line Holdings LP (or Pipe Line Holdings), pursuant to which we received a 51.0 percent general partner interest and MPC received a 49.0 percent limited partner interest in Pipe Line Holdings. On May 1, 2013, we purchased an additional 5.0 percent interest in Pipe Line Holdings from MPC for $100 million in cash. As a result we increased our general partner interest in Pipe Line Holdings to 56.0 percent and MPC decreased its limited partner interest in Pipe Line Holdings to 44.0 percent.
On
February 27, 2014
, we entered into an agreement to acquire an additional
13.0 percent
interest in Pipe Line Holdings from MPC for consideration of
$310.0 million
, effective
March 1, 2014
. Subsequent to this transaction, our ownership in Pipe Line Holdings will be
69.0 percent
. We intend to finance this transaction with $40.0 million of cash on hand and by borrowing $270.0 million on our revolving credit agreement.
130
Distributions by Pipe Line Holdings
Pursuant to its amended and restated limited partnership agreement, Pipe Line Holdings distributes all of its distributable cash to us and MPC on a pro rata basis as of the end of each quarter. In 2013, Pipe Line Holdings paid MPC $82.7 million in cash distributions.
Distributions by the Partnership
Pursuant to our first amended and restated agreement of limited partnership, we make cash distributions to our unitholders, including MPC as the direct and indirect holder of an aggregate 17,056,515 common units and 36,951,515 subordinated units, as well as a 2.0 percent general partner interest. If distributions exceed the minimum quarterly distribution and target distribution levels, the general partner is entitled to increasing percentages of our distributions, up to 48.0 percent of our distributions above the highest target distribution level. In 2013, we paid MPC $55.8 million in cash distributions with respect to its common and subordinated units and $1.5 million in cash distributions with respect to its general partner interest.
Reimbursements paid to MPC
Pursuant to our first amended and restated agreement of limited partnership, we are required to reimburse our general partner and its affiliates, including MPC, for all costs and expenses that our general partner and its affiliates, including MPC, incur on our behalf for managing and controlling our business and operations. Except to the extent specified under the omnibus agreement (described below), our general partner determines the amount of these expenses and such determinations are required to be made in good faith in accordance with the terms of our first amended and restated agreement of limited partnership. In 2013, we reimbursed our general partner $3.8 million for costs and expenses incurred on our behalf.
Transportation and Storage Services Agreements
We are a party to long-term, fee-based transportation and storage services agreements with MPC. Under these agreements, we provide transportation and storage services to MPC, and MPC provides us with minimum quarterly throughput and storage volumes of crude oil and products, and minimum storage volumes of butane. These commercial agreements with MPC are described in more detail under Item 1. Business - Our Transportation and Storage Services Agreements with MPC and Item 8. Financial Statements and Supplementary Data - Note 5. We recorded aggregate revenues of $384.2 million for 2013 under these transportation and storage services agreements.
Operating Service Agreements
We are a party to an operating services agreement with MPC, under which we operate various pipeline systems owned by MPC. In addition, MPC is a party to operating services agreements with Marathon Pipe Line LLC (or MPL), a wholly-owned subsidiary of Pipe Line Holdings. MPL operates various pipeline systems owned by MPC. Under these operating services agreements, we receive an operating fee for operating the assets and are reimbursed for all direct and indirect costs associated with operating the assets. Most of these agreements are indexed for inflation. These agreements have terms ranging from one to five years and automatically renew unless terminated by either party. The operating service agreements are described in more detail under Item 1. Business - Operating and Management Services Agreements with MPC and Third Parties and Item 8. Financial Statements and Supplementary Data - Note 5. We recorded other income of $16.9 million and were reimbursed for $4.8 million of costs and expenses for 2013 under these operating services agreements.
Management Services Agreements
We are a party to two management services agreements with MPC, under which we provide certain management services to MPC with respect to certain of MPC’s retained pipeline assets. MPC pays us a fixed annual fee under the agreements for providing the management services, as adjusted for inflation and changes in the scope of management services provided. These management services agreements are described in more detail under Item 1. Business - Operating and Management Services Agreements with MPC and Third Parties, and Item 8. Financial Statements and Supplementary Data - Note 5. We recorded other income of $0.7 million in fees for 2013 under these management services agreements.
131
Omnibus Agreement
We are a party to an omnibus agreement with MPC, under which we pay a fixed annual fee to MPC for the provision by MPC of executive management services by certain executive officers of our general partner, as well as certain general and administrative services and marketing and transportation engineering services. The omnibus agreement also requires us to reimburse MPC for any out-of-pocket costs and expenses incurred by MPC in providing these services. Also under the omnibus agreement, MPC has agreed to indemnify us for certain matters, including environmental, title and tax matters. The omnibus agreement is described in more detail under Item 1. Business - Other Agreements with MPC and Item 8. Financial Statements and Supplementary Data - Note 5. We incurred service fees and expenses of $49.4 million and reimbursed MPC for costs and expenses of less than $0.1 million under the omnibus agreement for 2013.
Employee Services Agreements
We are a party to two employee services agreements with MPC, under which we reimburse MPC for the provision of certain operational and management services in support of our pipelines, barge dock, butane cavern and tank farms. The employee services agreements are described in more detail under Item 1. Business - Other Agreements with MPC and Item 8. Financial Statements and Supplementary Data - Note 5. We incurred aggregate expenses of $92.3 million under the employee services agreements for 2013.
Procedures for Review, Approval and Ratification of Related Person Transactions
The board of directors of our general partner has adopted a formal written related person transactions policy. Under the policy, a “related person” includes any director, nominee for director, executive officer, or a known beneficial holder of more than 5.0 percent of any class of the Partnership’s voting securities (other than MPC or its affiliates) or any immediate family member of a director, nominee for director or executive officer or more than 5.0 percent owner. This procedure applies to any transaction, arrangement or relationship or any series of similar transactions, arrangements or relationships in which we are a participant and the amount involved exceeds $120,000 and in which a related person has a direct or indirect interest; provided that the following transactions, arrangements or relationships will be deemed to have standing pre-clearance of the board of directors:
|
•
|
Payment of compensation to an executive officer or director of our general partner if the compensation is otherwise required to be disclosed in our filings with the SEC;
|
•
Any transaction where the related person’s interest arising solely from the ownership of securities; and
|
•
|
Any ongoing employment relationship provided that such employment relationship will be subject to initial review and approval.
|
Any related person transaction that is identified prior to its consummation shall be consummated only if approved by the board of directors of our general partner prior to its consummation. If the related person transaction is identified after it commences, it shall be promptly submitted to the board of directors of our general partner or the chairman for ratification, amendment or rescission. If the transaction has been completed, the board of directors of our general partner or the chairman shall evaluate the transaction to determine if rescission is appropriate.
In determining whether to approve or ratify a related person transaction, the board of directors of our general partner or the chairman will consider all relevant facts and circumstances, including but not limited to:
•
the benefits to the Partnership, including the business justification;
|
•
|
the impact on a director’s independence in the event the related person is a director or an immediate family member of a director;
|
•
the availability of other sources for comparable products or services;
•
the terms of the transaction and the terms available to unrelated third parties or to employees generally; and
•
whether or not the transaction is consistent with our Code of Business Conduct.
The related person transactions policy described above was adopted after the closing of the Offering, and as a result the transactions and arrangements with MPC described above were not reviewed under such policy, but were approved by the board of directors of our general partner.
Director Independence
The information appearing under Item 10. Directors, Executive Officers and Corporate Governance – Director Independence, is incorporated herein by reference.
132
Aggregate fees for professional services rendered for the Partnership by PricewaterhouseCoopers LLP for the years ended
December 31, 2013
and
December 31, 2012
are presented in the following table. The Partnership was formed in March 2012.
|
Fees
(1)
(In millions)
|
2013
|
2012
|
|||||
|
Audit fees
|
$
|
1.0
|
|
$
|
0.5
|
|
|
|
Audit-related fees
|
—
|
|
—
|
|
|||
|
Tax fees
|
—
|
|
—
|
|
|||
|
All other fees
|
—
|
|
—
|
|
|||
|
Total
|
$
|
1.0
|
|
$
|
0.5
|
|
|
|
(1)
|
The Audit Committee of our general partner pre-approves all fees and services paid by the Partnership for
2013
and
2012
. The Audit Committee did not utilize the de minimis exception in the Audit Committee Policy for Pre-Approval of Audit, Audit-Related, Tax and Permissible Non-Audit Services in
2013
or
2012
. The Audit fees for the year ended
December 31, 2013
were for professional services rendered for the audit of financial statements, the review of internal controls over financial reporting and the performance of statutory and regulatory audits. The Audit fees for the year ended
December 31, 2012
were for professional services rendered for the audit of financial statements and the performance of statutory and regulatory audits. Total audit fees incurred prior to the initial public offering of the Partnership in October 2012 were paid for by MPC and amounted to $1.2 million.
|
The Audit Committee of MPLX GP LLC has considered whether PricewaterhouseCoopers LLP is independent for purposes of providing external audit services to the Partnership, and the Audit Committee has determined that it is.
Audit Committee Policy for Pre-Approval of Audit, Audit-Related, Tax and Permissible Non-Audit Services
Among other things, our Pre-Approval of Audit, Audit-Related, Tax and Permissible Non-Audit Services Policy sets forth the procedure for the Audit Committee to pre-approve all audit, audit-related, tax and permissible non-audit services, other than as provided under a de minimis exception.
Under the policy, the Audit Committee may pre-approve any services to be performed by our independent auditor up to twelve months in advance and may approve in advance services by specific categories pursuant to a forecasted budget. Annually, the vice president and chief financial officer of our general partner shall present a forecast of audit, audit-related, tax and permissible non-audit services for the ensuing fiscal year to the Audit Committee for approval in advance. The vice president and chief financial officer of our general partner, in coordination with the independent auditor, shall provide an updated budget to the Audit Committee, as needed, throughout the ensuing fiscal year.
Pursuant to the policy, the Audit Committee has delegated pre-approval authority of up to $250,000 to the Chair of the Audit Committee for unbudgeted items, and the Chair reports the items pre-approved pursuant to this delegation to the full Audit Committee at the next scheduled meeting.
133
A. Documents Filed as Part of the Report
1. Financial Statements (see Part II, Item 8. of this Annual Report on Form 10-K regarding financial statements)
2. Financial Statement Schedules
Financial statement schedules required under SEC rules but not included in this Annual Report on Form 10-K are omitted because they are not applicable or the required information is contained in the consolidated financial statements or notes thereto.
Exhibits:
|
|
Exhibit Description
|
Incorporated by Reference
|
Filed
Herewith
|
Furnished
Herewith
|
||||||||||
|
Exhibit
Number
|
Form
|
Exhibit
|
Filing Date
|
SEC File No.
|
||||||||||
|
3.1
|
Certificate of Limited Partnership of MPLX LP
|
S-1
|
3.1
|
7/2/2012
|
333-182500
|
|||||||||
|
3.2
|
Amendment to the Certificate of Limited Partnership of MPLX LP
|
S-1/A
|
3.2
|
10/9/2012
|
333-182500
|
|||||||||
|
3.3
|
First Amended and Restated Agreement of Limited Partnership of MPLX LP, dated October 31, 2012
|
8-K
|
3.1
|
11/6/2012
|
001-35714
|
|||||||||
|
3.4
|
Amended and Restated Agreement of Limited Partnership of MPLX Pipe Line Holdings LP, dated October 31, 2012
|
8-K
|
3.2
|
11/6/2012
|
001-35714
|
|||||||||
|
10.1
|
Revolving Credit Agreement, dated as of September 14, 2012, by and among MPLX Operations LLC, as borrower, MPLX LP, as parent guarantor, Citibank, N.A., as administrative agent, each of Citigroup Global Markets Inc., J.P. Morgan Securities LLC, Merrill Lynch, Pierce, Fenner & Smith Incorporated, Morgan Stanley Senior Funding, Inc., RBS Securities Inc. and UBS Securities LLC, as joint lead arrangers and joint bookrunners, JP Morgan Chase Bank, National Association, as syndication agent, each of Bank of America, N.A., Morgan Stanley Senior Funding, Inc., The Royal Bank of Scotland PLC and USB AG, Stamford Branch, as co-documentation agents, and the other commercial lending institutions parties thereto
|
S-1/A
|
10.1
|
10/9/2012
|
333-182500
|
|||||||||
|
10.2*
|
MPLX LP 2012 Incentive Compensation Plan
|
S-1/A
|
10.3
|
10/9/2012
|
333-182500
|
|||||||||
|
10.3*
|
MPLX GP LLC Non-Management Director Compensation Policy and Director Equity Award Terms
|
S-1/A
|
10.19
|
10/9/2012
|
333-182500
|
|||||||||
134
|
|
Exhibit Description
|
Incorporated by Reference
|
Filed
Herewith
|
Furnished
Herewith
|
||||||||||
|
Exhibit
Number
|
Form
|
Exhibit
|
Filing Date
|
SEC File No.
|
||||||||||
|
10.4
|
Underwriting Agreement dated as of October 25, 2012 among MPLX LP, MPLX GP LLC, MPC Investment LLC, MPLX Logistics Holdings LLC and MPLX Operations LLC and UBS Securities LLC, Merrill Lynch, Pierce, Fenner & Smith Incorporated and Morgan Stanley & Co. LLC as representatives of the several underwrites named therein
|
8-K
|
1.1
|
10/31/2012
|
001-35714
|
|||||||||
|
10.5
|
Contribution, Conveyance and Assumption Agreement, dated as of October 31, 2012, among MPLX LP, MPLX GP LLC, MPLX Operations LLC, MPC Investment LLC, MPLX Logistics Holdings LLC, Marathon Pipe Line LLC, MPL Investment LLC, MPLX Pipe Line Holdings LP and Ohio River Pipe Line LLC
|
8-K
|
10.1
|
11/6/2012
|
001-35714
|
|||||||||
|
10.6
|
Omnibus Agreement, dated as of October 31, 2012, among Marathon Petroleum Corporation, Marathon Petroleum Company LP, MPL Investment LLC, MPLX Operations LLC, MPLX Terminal and Storage LLC, MPLX Pipe Line Holdings LP, Marathon Pipe Line LLC, Ohio River Pipe Line LLC, MPLX LP and MPLX GP LLC
|
8-K
|
10.2
|
11/6/2012
|
001-35714
|
|||||||||
|
10.7
|
Employee Services Agreement, dated effective as of October 1, 2012, by and among Marathon Petroleum Logistics Services LLC, MPLX GP LLC and Marathon Pipe Line LLC
|
S-1/A
|
10.6
|
10/9/2012
|
333-182500
|
|||||||||
|
10.8
|
Employee Services Agreement, dated effective as of October 1, 2012, by and among Catlettsburg Refining LLC, MPLX GP LLC and MPLX Terminal and Storage LLC
|
S-1/A
|
10.7
|
10/9/2012
|
333-182500
|
|||||||||
|
10.9
|
Management Services Agreement, dated effective as of September 1, 2012, by and between Hardin Street Holdings LLC and Marathon Pipe Line LLC
|
S-1/A
|
10.8
|
9/7/2012
|
333-182500
|
|||||||||
|
10.10
|
Management Services Agreement, dated effective as of October 10, 2012, by and between MPL Louisiana Holdings LLC and Marathon Pipe Line LLC
|
S-1/A
|
10.9
|
10/18/2012
|
333-182500
|
|||||||||
|
10.11
|
Amended and Restated Operating Agreement, dated as of October 31, 2012, between Marathon Petroleum Company LP and Marathon Pipe Line LLC
|
8-K
|
10.3
|
11/6/2012
|
001-35714
|
|||||||||
|
10.12
|
Storage Services Agreement, dated effective as of October 1, 2012, by and between Marathon Pipe Line LLC and Marathon Petroleum Company LP (Patoka tank farm)
|
S-1/A
|
10.13
|
10/9/2012
|
333-182500
|
|||||||||
135
|
|
Exhibit Description
|
Incorporated by Reference
|
Filed
Herewith
|
Furnished
Herewith
|
||||||||||
|
Exhibit
Number
|
Form
|
Exhibit
|
Filing Date
|
SEC File No.
|
||||||||||
|
10.13
|
Storage Services Agreement, dated effective as of October 1, 2012, by and between Marathon Pipe Line LLC and Marathon Petroleum Company LP (Martinsville tank farm)
|
S-1/A
|
10.14
|
10/9/2012
|
333-182500
|
|||||||||
|
10.14
|
Storage Services Agreement, dated effective as of October 1, 2012, by and between Marathon Pipe Line LLC and Marathon Petroleum Company LP (Lebanon tank farm)
|
S-1/A
|
10.15
|
10/9/2012
|
333-182500
|
|||||||||
|
10.15
|
Storage Services Agreement, dated effective as of October 1, 2012, by and between Marathon Pipe Line LLC and Marathon Petroleum Company LP (Wood River tank farm)
|
S-1/A
|
10.16
|
10/9/2012
|
333-182500
|
|||||||||
|
10.16
|
Storage Services Agreement, dated effective as of October 1, 2012, by and between MPLX Terminal and Storage LLC and Marathon Petroleum Company LP (Neal butane cavern)
|
S-1/A
|
10.17
|
10/9/2012
|
333-182500
|
|||||||||
|
10.17
|
Transportation Services Agreement (Patoka to Lima Crude System), dated as of October 31, 2012, between Marathon Petroleum Company LP and Marathon Pipe Line LLC
|
8-K
|
10.4
|
11/6/2012
|
001-35714
|
|||||||||
|
10.18
|
Transportation Services Agreement (Catlettsburg and Robinson Crude System), dated as of October 31, 2012, between Marathon Petroleum Company LP and Marathon Pipe Line LLC
|
8-K
|
10.5
|
11/6/2012
|
001-35714
|
|||||||||
|
10.19
|
Transportation Services Agreement (Detroit Crude System), dated as of October 31, 2012, between Marathon Petroleum Company LP and Marathon Pipe Line LLC
|
8-K
|
10.6
|
11/6/2012
|
001-35714
|
|||||||||
|
10.20
|
Transportation Services Agreement (Wood River to Patoka Crude System), dated as of October 31, 2012, between Marathon Petroleum Company LP and Marathon Pipe Line LLC
|
8-K
|
10.7
|
11/6/2012
|
001-35714
|
|||||||||
|
10.21
|
Transportation Services Agreement (Garyville Products System), dated as of October 31, 2012, between Marathon Petroleum Company LP and Marathon Pipe Line LLC
|
8-K
|
10.8
|
11/6/2012
|
001-35714
|
|||||||||
|
10.22
|
Transportation Services Agreement (Texas City Products System), dated as of October 31, 2012, between Marathon Petroleum Company LP and Marathon Pipe Line LLC
|
8-K
|
10.9
|
11/6/2012
|
001-35714
|
|||||||||
136
|
|
Exhibit Description
|
Incorporated by Reference
|
Filed
Herewith
|
Furnished
Herewith
|
||||||||||
|
Exhibit
Number
|
Form
|
Exhibit
|
Filing Date
|
SEC File No.
|
||||||||||
|
10.23
|
Transportation Services Agreement (ORPL Products System), dated as of October 31, 2012, between Marathon Petroleum Company LP and Ohio River Pipe Line LLC
|
8-K
|
10.10
|
11/6/2012
|
001-35714
|
|||||||||
|
10.24
|
Transportation Services Agreement (Robinson Products System), dated as of October 31, 2012, between Marathon Petroleum Company LP and Marathon Pipe Line LLC
|
8-K
|
10.11
|
11/6/2012
|
001-35714
|
|||||||||
|
10.25
|
Transportation Services Agreement (Wood River Barge Dock), dated as of October 31, 2012, between Marathon Petroleum Company LP and Marathon Pipe Line LLC
|
8-K
|
10.12
|
11/6/2012
|
001-35714
|
|||||||||
|
10.26*
|
MPC Non-Employee Director Phantom Unit Award Policy
|
10-K
|
10.26
|
3/25/2013
|
001-35714
|
|||||||||
|
10.27*
|
Form of MPLX LP Phantom Unit Award Agreement - Officer
|
10-Q
|
10.1
|
5/9/2013
|
001-35714
|
|||||||||
|
10.28*
|
Form of MPLX LP Performance Unit Award Agreement - 2013-2015 Performance Cycle
|
10-Q
|
10.2
|
5/9/2013
|
001-35714
|
|||||||||
|
10.29*
|
MPLX LP - Form of MPC Officer Phantom Unit Agreement
|
10-Q
|
10.3
|
5/9/2013
|
001-35714
|
|||||||||
|
10.30*
|
MPLX LP - Form of MPC Officer Performance Unit Award Agreement - 2013-2015 Performance Cycle
|
10-Q
|
10.4
|
5/9/2013
|
001-35714
|
|||||||||
|
10.31*
|
Amendment to Outstanding Phantom Unit Award Agreement of Garry L. Peiffer
|
X
|
||||||||||||
|
12.1
|
Computation of Ratio of Earnings to Fixed Charges
|
X
|
||||||||||||
|
14.1
|
Code of Ethics for Senior Financial Officers
|
10-K
|
14.1
|
3/25/2013
|
001-35714
|
|||||||||
|
21.1
|
List of Subsidiaries
|
X
|
||||||||||||
|
23.1
|
Consent of Independent Registered Public Accounting Firm
|
X
|
||||||||||||
|
24.1
|
Power of Attorney of Directors and Officers of MPLX GP LLC
|
X
|
||||||||||||
|
31.1
|
Certification of Chief Executive Officer pursuant to Rule 13(a)-14 and 15(d)-14 under the Securities Exchange Act of 1934
|
X
|
||||||||||||
|
31.2
|
Certification of Chief Financial Officer pursuant to Rule 13(a)-14 and 15(d)-14 under the Securities Exchange Act of 1934
|
X
|
||||||||||||
|
32.1
|
Certification of Chief Executive Officer pursuant to 18 U.S.C. Section 1350
|
X
|
||||||||||||
|
32.2
|
Certification of Chief Financial Officer pursuant to 18 U.S.C. Section 1350
|
X
|
||||||||||||
|
101.INS+
|
XBRL Instance Document
|
X
|
||||||||||||
137
|
|
Exhibit Description
|
Incorporated by Reference
|
Filed
Herewith
|
Furnished
Herewith
|
||||||||||
|
Exhibit
Number
|
Form
|
Exhibit
|
Filing Date
|
SEC File No.
|
||||||||||
|
101.SCH+
|
XBRL Taxonomy Extension Schema.
|
X
|
||||||||||||
|
101.PRE+
|
XBRL Taxonomy Extension Presentation Linkbase.
|
X
|
||||||||||||
|
101.CAL+
|
XBRL Taxonomy Extension Calculation Linkbase.
|
X
|
||||||||||||
|
101.DEF+
|
XBRL Taxonomy Extension Definition Linkbase.
|
X
|
||||||||||||
|
101.LAB+
|
XBRL Taxonomy Extension Label Linkbase.
|
X
|
||||||||||||
|
*
|
Indicates management contract or compensatory plan, contract or arrangement in which one or more directors or executive officers of the Registrant may be participants.
|
|
+
|
XBRL (eXtensible Business Reporting Language) information is furnished and not filed or a part of a registration statement or prospectus for purposes of sections 11 or 12 of the Securities Act of 1933, is deemed not filed for purposes of section 18 of the Securities Exchange Act of 1934, and otherwise is not subject to liability under these sections.
|
138
SIGNATURES
Pursuant to the requirements of Section 13 or 15(d) of the Securities Exchange Act of 1934, the registrant has duly caused this report to be signed on its behalf by the undersigned, thereunto duly authorized.
|
February 28, 2014
|
MPLX LP
|
|
|
By:
|
MPLX GP LLC
Its general partner
|
|
|
By:
|
/s/ Michael G. Braddock
|
|
|
Michael G. Braddock
Vice President and Chief Accounting Officer
|
||
Pursuant to the requirements of the Securities Exchange Act of 1934, this report has been signed below by the following persons on
February 28, 2014
on behalf of the registrant and in the capacities indicated.
|
Signature
|
|
Title
|
|
/s/ Gary R. Heminger
|
|
Chairman of the Board of Directors and Chief
Executive Officer (principal executive officer)
|
|
Gary R. Heminger
|
||
|
/s/ Donald C. Templin
|
|
Director, Vice President and Chief Financial Officer
(principal financial officer)
|
|
Donald C. Templin
|
||
|
/s/ Michael G. Braddock
|
|
Vice President and Chief Accounting Officer
(principal accounting officer)
|
|
Michael G. Braddock
|
||
|
*
|
President and Director of MPLX GP LLC
|
|
|
Pamela K.M. Beall
|
||
|
*
|
|
Director
|
|
David A. Daberko
|
||
|
*
|
|
Director
|
|
Christopher A. Helms
|
||
|
*
|
|
Director
|
|
Garry L. Peiffer
|
||
|
*
|
|
Director
|
|
Dan D. Sandman
|
||
|
*
|
|
Director
|
|
John P. Surma
|
||
|
*
|
|
Director
|
|
C. Richard Wilson
|
||
|
*
|
The undersigned, by signing his name hereto, does sign and execute this report pursuant to the Power of Attorney executed by the above-named directors and officers of the general partner of the registrant, which is being filed herewith on behalf of such directors and officers.
|
|
By:
|
/s/ Gary R. Heminger
|
February 28, 2014
|
||
|
Gary R. Heminger
Attorney-in-Fact
|
||||
139
TABLE OF CONTENTS
Part IItem 1. BusinessItem 1A. Risk FactorsItem 1B. Unresolved Staff CommentsItem 2. PropertiesItem 3. Legal ProceedingsItem 4. Mine Safety DisclosuresPart IIItem 5. Market For Registrant S Common Equity, Related Stockholder Matters and Issuer Purchases Of Equity SecuritiesItem 6. Selected Financial DataItem 7. Management S Discussion and Analysis Of Financial Condition and Results Of OperationsItem 7A. Quantitative and Qualitative Disclosures About Market RiskItem 8. Financial Statements and Supplementary DataItem 9. Changes in and Disagreements with Accountants on Accounting and Financial DisclosuresItem 9A. Controls and ProceduresItem 9B. Other InformationPart IIIItem 10. Directors, Executive Officers and Corporate GovernanceItem 11. Executive CompensationItem 12. Security Ownership Of Certain Beneficial Owners and Management and Related Stockholder MattersItem 13. Certain Relationships and Related Transactions, and Director IndependenceItem 14. Principal Accountant Fees and ServicesPart IVItem 15. Exhibits and Financial Statement Schedules