MERCK & CO., INC.
10-Ks and 10-Qs
|
|
|
|
|
|
|
|
|
|
|
|
|
|
|
|
|
|
|
|
|
|
|
|
|
|
|
|
|
|
|
|
|
|
|
|
|
|
|
|
|
|
|
|
|
|
|
|
|
|
|
|
|
|
|
|
|
|
|
As filed with the Securities and Exchange Commission on February 28, 2017
UNITED STATES
SECURITIES AND EXCHANGE COMMISSION
WASHINGTON, D. C. 20549
_________________________________
FORM 10-K
(MARK ONE)
|
|
☒
|
Annual Report Pursuant to Section 13 or 15(d) of the Securities Exchange Act of 1934
|
|
For the Fiscal Year Ended December 31, 2016
|
||
|
or
|
||
|
☐
|
Transition Report Pursuant to Section 13 or 15(d) of the Securities Exchange Act of 1934
|
|
|
For the transition period from
to
|
||
Commission File No. 1-6571
_________________________________
Merck & Co., Inc.
2000 Galloping Hill Road
Kenilworth, N. J. 07033
(908) 740-4000
|
Incorporated in New Jersey
|
|
I.R.S. Employer
Identification No. 22-1918501
|
Securities Registered pursuant to Section 12(b) of the Act:
|
Title of Each Class
|
|
Name of Each Exchange
on which Registered
|
|
Common Stock ($0.50 par value)
|
|
New York Stock Exchange
|
|
1.125% Notes due 2021
|
New York Stock Exchange
|
|
|
0.500% Notes due 2024
|
New York Stock Exchange
|
|
|
1.875% Notes due 2026
|
New York Stock Exchange
|
|
|
2.500% Notes due 2034
|
New York Stock Exchange
|
|
|
1.375% Notes due 2036
|
New York Stock Exchange
|
|
Number of shares of Common Stock ($0.50 par value) outstanding as of January 31, 2017: 2,745,571,067.
Aggregate market value of Common Stock ($0.50 par value) held by non-affiliates on June 30, 2016 based on closing price on June 30, 2016: $159,263,000,000.
Indicate by check mark if the registrant is a well-known seasoned issuer, as defined in Rule 405 of the Securities Act.
Yes
☒
No
☐
Indicate by check mark if the registrant is not required to file reports pursuant to Section 13 or Section 15(d) of the Act.
Yes
☐
No
☒
Indicate by check mark whether the registrant (1) has filed all reports required to be filed by Section 13 or 15(d) of the Securities Exchange Act of 1934 during the preceding 12 months (or for such shorter period that the registrant was required to file such reports), and (2) has been subject to such filing requirements for the past 90 days.
Yes
☒
No
☐
Indicate by check mark whether the registrant has submitted electronically and posted on its corporate Web site, if any, every Interactive Data File required to be submitted and posted pursuant to Rule 405 of Regulation S-T (§ 232.405 of this chapter) during the preceding 12 months (or for such shorter period that the registrant was required to submit and post such files).
Yes
☒
No
☐
Indicate by check mark if disclosure of delinquent filers pursuant to Item 405 of Regulation S-K (§ 229.405) is not contained herein, and will not be contained, to the best of registrant’s knowledge, in definitive proxy or information statements incorporated by reference in Part III of this Form 10-K or any amendment to this Form 10-K.
☐
Indicate by check mark whether the registrant is a large accelerated filer, an accelerated filer, a non-accelerated filer, or a smaller reporting company. See the definitions of “large accelerated filer,” “accelerated filer” and “smaller reporting company” in Rule 12b-2 of the Exchange Act. (Check One):
|
Large accelerated filer
|
☒
|
Accelerated filer
|
☐
|
Non-accelerated filer
|
☐
|
Smaller reporting company
|
☐
|
|
(Do not check if a smaller reporting company)
|
|||||||
Indicate by check mark whether the registrant is a shell company (as defined in Rule 12b-2 of the Exchange Act). Yes
☐
No
☒
Documents Incorporated by Reference:
|
Document
|
|
Part of Form 10-K
|
|
Proxy Statement for the Annual Meeting of Shareholders to be held May 23, 2017,
to be filed with the Securities and Exchange Commission within 120 days after the close of the fiscal year covered by this report
|
|
Part III
|
Table of Contents
|
|
|
|
Page
|
|
Item 1.
|
|||
|
Item 1A.
|
|||
|
Item 1B.
|
|||
|
Item 2.
|
|||
|
Item 3.
|
|||
|
Item 4.
|
|||
|
Item 5.
|
|||
|
Item 6.
|
|||
|
Item 7.
|
|||
|
Item 7A.
|
|||
|
Item 8.
|
|||
|
(a)
|
|||
|
(b)
|
|||
|
Item 9.
|
|||
|
Item 9A.
|
|||
|
Item 9B.
|
|||
|
Item 10.
|
|||
|
Item 11.
|
|||
|
Item 12.
|
|||
|
Item 13.
|
|||
|
Item 14.
|
|||
|
Item 15.
|
|||
|
Item 16.
|
|||
|
Item 1.
|
Business.
|
Merck & Co., Inc. (Merck or the Company) is a global health care company that delivers innovative health solutions through its prescription medicines, vaccines, biologic therapies and animal health products. The Company’s operations are principally managed on a products basis and include four operating segments, which are the Pharmaceutical, Animal Health, Healthcare Services and Alliances segments.
The Pharmaceutical segment is the only reportable segment. The Pharmaceutical segment includes human health pharmaceutical and vaccine products marketed either directly by the Company or through joint ventures. Human health pharmaceutical products consist of therapeutic and preventive agents, generally sold by prescription, for the treatment of human disorders. The Company sells these human health pharmaceutical products primarily to drug wholesalers and retailers, hospitals, government agencies and managed health care providers such as health maintenance organizations, pharmacy benefit managers and other institutions. Vaccine products consist of preventive pediatric, adolescent and adult vaccines, primarily administered at physician offices. The Company sells these human health vaccines primarily to physicians, wholesalers, physician distributors and government entities. Sales of vaccines in most major European markets were marketed through the Company’s Sanofi Pasteur MSD joint venture until its termination on December 31, 2016. Beginning in 2017, Merck will record vaccine sales in the European markets, which were previously part of the joint venture.
The Company also has animal health operations that discover, develop, manufacture and market animal health products, including vaccines, which the Company sells to veterinarians, distributors and animal producers. The Company’s Healthcare Services segment provides services and solutions that focus on engagement, health analytics and clinical services to improve the value of care delivered to patients. Merck’s Alliances segment primarily includes results from the Company’s relationship with AstraZeneca LP until the termination of that relationship on June 30, 2014. On October 1, 2014, the Company divested its Consumer Care segment that developed, manufactured and marketed over-the-counter, foot care and sun care products. The Company was incorporated in New Jersey in 1970.
For financial information and other information about the Company’s segments, see Item 7. “Management’s Discussion and Analysis of Financial Condition and Results of Operations” and Item 8. “Financial Statements and Supplementary Data” below.
All product or service marks appearing in type form different from that of the surrounding text are trademarks or service marks owned, licensed to, promoted or distributed by Merck, its subsidiaries or affiliates, except as noted. All other trademarks or services marks are those of their respective owners.
Product Sales
Total Company sales, including sales of the Company’s top pharmaceutical products, as well as total sales of animal health products, were as follows:
|
($ in millions)
|
2016
|
2015
|
2014
|
||||||||
|
Total Sales
|
$
|
39,807
|
|
$
|
39,498
|
|
$
|
42,237
|
|
||
|
Pharmaceutical
|
35,151
|
|
34,782
|
|
36,042
|
|
|||||
|
Januvia/Janumet
|
6,109
|
|
6,014
|
|
6,002
|
|
|||||
|
Zetia/Vytorin
|
3,701
|
|
3,777
|
|
4,166
|
|
|||||
|
Gardasil/Gardasil
9
|
2,173
|
|
1,908
|
|
1,738
|
|
|||||
|
ProQuad/M-M-R
II
/Varivax
|
1,640
|
|
1,505
|
|
1,394
|
|
|||||
|
Keytruda
|
1,402
|
|
566
|
|
55
|
|
|||||
|
Isentress
|
1,387
|
|
1,511
|
|
1,673
|
|
|||||
|
Remicade
|
1,268
|
|
1,794
|
|
2,372
|
|
|||||
|
Cubicin
|
1,087
|
|
1,127
|
|
25
|
|
|||||
|
Singulair
|
915
|
|
931
|
|
1,092
|
|
|||||
|
Pneumovax
23
|
641
|
|
542
|
|
746
|
|
|||||
|
Animal Health
|
3,478
|
|
3,331
|
|
3,454
|
|
|||||
|
Consumer Care
(1)
|
—
|
|
3
|
|
1,547
|
|
|||||
|
Other Revenues
(2)
|
1,178
|
|
1,382
|
|
1,194
|
|
|||||
|
(1)
|
On October 1, 2014, the Company divested its Consumer Care segment that developed, manufactured and marketed over-the-counter, foot care and sun care products.
|
|
(2)
|
Other revenues are primarily comprised of miscellaneous corporate revenues, including revenue hedging activities, and third-party manufacturing sales.
|
1
Pharmaceutical
The Company’s pharmaceutical products include therapeutic and preventive agents, generally sold by prescription, for the treatment of human disorders. Certain of the products within the Company’s franchises are as follows:
Primary Care and Women’s Health
Cardiovascular:
Zetia
(ezetimibe) (marketed as
Ezetrol
in most countries outside the United States);
Vytorin
(ezetimibe/simvastatin) (marketed as
Inegy
outside the United States); and
Atozet
(ezetimibe and atorvastatin) (marketed in certain countries outside of the United States), cholesterol modifying medicines.
Diabetes:
Januvia
(sitagliptin) and
Janumet
(sitagliptin/metformin HCl) for the treatment of type 2 diabetes.
General Medicine and Women’s Health:
NuvaRing
(etonogestrel/ethinyl estradiol vaginal ring), a vaginal contraceptive product
; Implanon
(etonogestrel implant), a single-rod subdermal contraceptive implant/
Nexplanon
(etonogestrel implant), a single, radiopaque, rod-shaped subdermal contraceptive implant;
Dulera
Inhalation Aerosol (mometasone furoate/formoterol fumarate dihydrate), a combination medicine for the treatment of asthma; and
Follistim AQ
(follitropin beta injection) (marketed as
Puregon
in most countries outside the United States), a fertility treatment.
Hospital and Specialty
Hepatitis:
Zepatier
(elbasvir and grazoprevir) for the treatment of adult patients with chronic hepatitis C virus (HCV) genotype (GT) 1 or GT4 infection, with ribavirin in certain patient populations; and
PegIntron
(peginterferon alpha-2b) and
Victrelis
(boceprevir), medicines for the treatment of chronic HCV.
HIV:
Isentress
(raltegravir), an HIV integrase inhibitor for use in combination with other antiretroviral agents for the treatment of HIV-1 infection.
Hospital Acute Care:
Cubicin (
daptomycin for injection), an I.V. antibiotic for complicated skin and skin structure infections or bacteremia, when caused by designated susceptible organisms;
Noxafil
(posaconazole) for the prevention of invasive fungal infections;
Invanz
(ertapenem sodium) for the treatment of certain infections;
Cancidas
(caspofungin acetate), an anti-fungal product;
Bridion
(sugammadex) Injection, a medication for the reversal of two types of neuromuscular blocking agents used during surgery; and
Primaxin
(imipenem and cilastatin sodium), an anti-bacterial product.
Immunology:
Remicade
(infliximab), a treatment for inflammatory diseases; and
Simponi
(golimumab), a once-monthly subcutaneous treatment for certain inflammatory diseases, which the Company markets in Europe, Russia and Turkey.
Oncology
Keytruda
(pembrolizumab) for the treatment of previously untreated metastatic non-small-cell lung cancer (NSCLC) in patients whose tumors express high levels of PD-L1 (Tumor Proportion Score [TPS] of 50% or more) and previously treated metastatic NSCLC in patients whose tumors express PD-L1 (TPS of 1% or more), as well as advanced melanoma and previously treated recurrent or metastatic head and neck cancer;
Emend
(aprepitant) for the prevention of chemotherapy-induced and post-operative nausea and vomiting; and
Temodar
(temozolomide) (marketed as
Temodal
outside the United States), a treatment for certain types of brain tumors.
Diversified Brands
Respiratory:
Singulair
(montelukast), a medicine indicated for the chronic treatment of asthma and the relief of symptoms of allergic rhinitis; and
Nasonex
(mometasone furoate monohydrate), an inhaled nasal corticosteroid for the treatment of nasal allergy symptoms
.
Other:
Cozaar
(losartan potassium) and
Hyzaar
(losartan potassium and hydrochlorothiazide), treatments for hypertension;
Arcoxia
(etoricoxib) for the treatment of arthritis and pain, which the Company markets outside the United States;
Fosamax
(alendronate sodium) (marketed as
Fosamac
in Japan) for the treatment and prevention of osteoporosis
;
and
Zocor
(simvastatin), a statin for modifying cholesterol.
2
Vaccines
Gardasil
(Human Papillomavirus Quadrivalent [Types 6, 11, 16 and 18] Vaccine, Recombinant)/
Gardasil
9 (Human Papillomavirus 9-valent Vaccine, Recombinant), vaccines to help prevent certain diseases caused by certain types of human papillomavirus (HPV)
; ProQuad
(Measles, Mumps, Rubella and Varicella Virus Vaccine Live), a pediatric combination vaccine to help protect against measles, mumps, rubella and varicella;
M-M-R
II (Measles, Mumps and Rubella Virus Vaccine Live), a vaccine to help prevent measles, mumps and rubella;
Varivax
(Varicella Virus Vaccine Live), a vaccine to help prevent chickenpox (varicella);
Zostavax
(Zoster Vaccine Live), a vaccine to help prevent shingles (herpes zoster)
; RotaTeq
(Rotavirus Vaccine, Live Oral, Pentavalent), a vaccine to help protect against rotavirus gastroenteritis in infants and children; and
Pneumovax
23 (pneumococcal vaccine polyvalent), a vaccine to help prevent pneumococcal disease.
Animal Health
The Animal Health segment discovers, develops, manufactures and markets animal health products, including vaccines. Principal products in this segment include:
Livestock Products:
Nuflor
(Florfenicol) antibiotic range for use in cattle and swine;
Bovilis
/
Vista
vaccine lines for infectious diseases in cattle;
Banamine
(Flunixin meglumine) bovine and swine anti-inflammatory;
Estrumate
(cloprostenol sodium) for the treatment of fertility disorders in cattle;
Matrix
(altrenogest) fertility management for swine;
Resflor
(florfenicol and flunixin meglumine)
,
a combination broad-spectrum antibiotic and non-steroidal anti-inflammatory drug for bovine respiratory disease;
Zuprevo
(Tildipirosin) for bovine respiratory disease;
Zilmax
(zilpaterol hydrochloride) and
Revalor
(trenbolone acetate and estradiol) to improve production efficiencies in beef cattle;
Safe-Guard
(fenbendazole) de-wormer for cattle;
M+Pac
(Mycoplasma Hyopneumoniae Bacterin) swine pneumonia vaccine; and
Porcilis
(Lawsonia intracellularis baterin) and
Circumvent
(Porcine Circovirus Vaccine, Type 2, Killed Baculovirus Vector) vaccine lines for infectious diseases in swine.
Poultry Products:
Nobilis
/
Innovax
(Live Marek’s Disease Vector)
,
vaccine lines for poultry; and
Paracox
and
Coccivac
coccidiosis vaccines.
Companion Animal Products:
Bravecto
(fluralaner), a line of products that kills fleas and ticks in dogs for up to 12 weeks;
Nobivac
vaccine lines for flexible dog and cat vaccination;
Otomax
(Gentamicin sulfate, USP; Betamethasone valerate USP; and Clotrimazole USP ointment)/
Mometamax
(Gentamicin sulfate, USP, Mometasone Furoate Monohydrate and Clotrimazole, USP, Otic Suspension)/
Posatex
(Orbifloxacin, Mometasone Furoate Monohydrate and Posaconazole, Suspension) ear ointments for acute and chronic otitis;
Caninsulin
/
Vetsulin
(porcine insulin zinc suspension) diabetes mellitus treatment for dogs and cats;
Panacur
(fenbendazole)/
Safeguard
(fenbendazole) broad-spectrum anthelmintic (de-wormer) for use in many animals;
Regumate
(altrenogest) fertility management for horses;
Prestige
vaccine line for horses; and
Activyl
(Indoxacrb)
/Scalibor
(Deltamethrin)
/Exspot
for protecting against bites from fleas, ticks, mosquitoes and sandflies.
Aquaculture Products:
Slice
(Emamectin benzoate) parasiticide for sea lice in salmon;
Aquavac
(Avirulent Live Culture)/
Norvax
vaccines against bacterial and viral disease in fish;
Compact PD
vaccine for salmon; and
Aquaflor
(Florfenicol) antibiotic for farm-raised fish.
For a further discussion of sales of the Company’s products, see Item 7. “Management’s Discussion and Analysis of Financial Condition and Results of Operations” below.
Product Approvals
In January 2016, Merck announced that the U.S. Food and Drug Administration (FDA) approved
Zepatier
for the treatment of adult patients with chronic HCV GT1 or GT4 infection, with ribavirin in certain patient populations.
In February 2016, Merck announced that the FDA approved a supplemental new drug application for single-dose
Emend
for injection for the prevention of delayed nausea and vomiting in adults receiving initial and repeat courses of moderately emetogenic chemotherapy.
In May 2016, the Company received marketing approval from the European Medicines Agency (EMA) for
Bravecto
Spot-On Solution for cats and dogs and, in July 2016, the Company received approval in the United States to market the product under the tradename
Bravecto
Topical.
3
In July 2016, the European Commission (EC) approved
Zepatier
, a once-daily, single tablet combination therapy in the treatment of chronic HCV GT1 or GT4 infection, with ribavirin in certain patient populations.
In August 2016, Merck announced that the FDA approved
Keytruda
for the treatment of patients with recurrent or metastatic head and neck cancer with disease progression on or after platinum-containing chemotherapy.
In October 2016, Merck announced that the FDA approved
Keytruda
for the first-line treatment of patients with NSCLC whose tumors have high PD-L1 expression (TPS of 50% or more) as determined by an FDA-approved test, with no EGFR or ALK genomic tumor aberrations.
In addition, in October 2016, Merck announced that the FDA approved
Zinplava
Injection 25 mg/mL.
Zinplava
is indicated to reduce recurrence of
Clostridium difficile
infection (CDI) in patients 18 years of age or older who are receiving antibacterial drug treatment of CDI and are at high risk for CDI recurrence.
On January 3, 2017, Merck announced that the EC has approved
Keytruda
for the first-line treatment of metastatic NSCLC in adults whose tumors have high PD-L1 expression (TPS of 50% or more) with no EGFR or ALK positive tumor mutations.
Joint Ventures
Sanofi Pasteur MSD
On December 31, 2016, Merck and Sanofi Pasteur (Sanofi) terminated the equally-owned joint venture formed by the companies in 1994 to develop and market human vaccines in Europe.
Licenses
In 1998, a subsidiary of Schering-Plough Corporation (Schering-Plough) entered into a licensing agreement with Centocor Ortho Biotech Inc. (Centocor), a Johnson & Johnson (J&J) company, to market
Remicade
, which is prescribed for the treatment of inflammatory diseases. In 2005, Schering-Plough’s subsidiary exercised an option under its contract with Centocor for license rights to develop and commercialize
Simponi
, a fully human monoclonal antibody. The Company has marketing rights to both products throughout Europe, Russia and Turkey.
Remicade
lost market exclusivity in major European markets in February 2015 and the Company no longer has market exclusivity in any of its marketing territories. The Company continues to have market exclusivity for
Simponi
in all of its marketing territories. All profits derived from Merck’s distribution of the two products in these countries are equally divided between Merck and J&J.
Competition and the Health Care Environment
Competition
The markets in which the Company conducts its business and the pharmaceutical industry in general are highly competitive and highly regulated. The Company’s competitors include other worldwide research-based pharmaceutical companies, smaller research companies with more limited therapeutic focus, generic drug manufacturers and animal health care companies. The Company’s operations may be adversely affected by generic and biosimilar competition as the Company’s products mature, as well as technological advances of competitors, industry consolidation, patents granted to competitors, competitive combination products, new products of competitors, the generic availability of competitors’ branded products, and new information from clinical trials of marketed products or post-marketing surveillance. In addition, patent rights are increasingly being challenged by competitors, and the outcome can be highly uncertain. An adverse result in a patent dispute can preclude commercialization of products or negatively affect sales of existing products and could result in the payment of royalties or in the recognition of an impairment charge with respect to intangible assets associated with certain products. Competitive pressures have intensified as pressures in the industry have grown.
Pharmaceutical competition involves a rigorous search for technological innovations and the ability to market these innovations effectively. With its long-standing emphasis on research and development, the Company is well positioned to compete in the search for technological innovations. Additional resources required to meet market challenges include quality control, flexibility to meet customer specifications, an efficient distribution system and a strong technical information service. The Company is active in acquiring and marketing products through external alliances, such as licensing arrangements, and has been refining its sales and marketing efforts to further address
4
changing industry conditions. However, the introduction of new products and processes by competitors may result in price reductions and product displacements, even for products protected by patents. For example, the number of compounds available to treat a particular disease typically increases over time and can result in slowed sales growth or reduced sales for the Company’s products in that therapeutic category.
The highly competitive animal health business is affected by several factors including regulatory and legislative issues, scientific and technological advances, product innovation, the quality and price of the Company’s products, effective promotional efforts and the frequent introduction of generic products by competitors.
Health Care Environment and Government Regulation
Global efforts toward health care cost containment continue to exert pressure on product pricing and market access. In the United States, federal and state governments for many years also have pursued methods to reduce the cost of drugs and vaccines for which they pay. For example, federal laws require the Company to pay specified rebates for medicines reimbursed by Medicaid and to provide discounts for outpatient medicines purchased by certain Public Health Service entities and hospitals serving a disproportionate share of low income or uninsured patients.
Against this backdrop, the United States enacted major health care reform legislation in 2010 (the Patient Protection and Affordable Care Act (ACA)), which began to be implemented in 2010. Various insurance market reforms have advanced and state and federal insurance exchanges were launched in 2014. With respect to the effect of the law on the pharmaceutical industry, the law increased the mandated Medicaid rebate from 15.1% to 23.1%, expanded the rebate to Medicaid managed care utilization, and increased the types of entities eligible for the federal 340B drug discount program. The law also requires pharmaceutical manufacturers to pay a 50% point of service discount to Medicare Part D beneficiaries when they are in the Medicare Part D coverage gap (i.e., the so-called “donut hole”). Approximately $415 million, $550 million and $430 million was recorded by Merck as a reduction to revenue in 2016, 2015 and 2014, respectively, related to the donut hole provision. Also, pharmaceutical manufacturers are now required to pay an annual non-tax deductible health care reform fee. The total annual industry fee was $3.0 billion in 2016 and will increase to $4.0 billion in 2017. The fee is assessed on each company in proportion to its share of prior year branded pharmaceutical sales to certain government programs, such as Medicare and Medicaid. The Company recorded $193 million, $173 million and $390 million of costs within
Marketing and administrative
expenses in 2016, 2015 and 2014, respectively, for the annual health care reform fee. The higher expenses in 2014 reflect final regulations on the annual health care reform fee issued by the Internal Revenue Service (IRS) on July 28, 2014. The final IRS regulations accelerated the recognition criteria for the fee obligation by one year to the year in which the underlying sales used to allocate the fee occurred rather than the year in which the fee was paid. As a result of this change, Merck recorded an additional year of expense of $193 million in 2014. In February 2016, the Centers for Medicare & Medicaid Services (CMS) issued the Medicaid rebate final rule that implements provisions of the ACA effective April 1, 2016. The rule provides comprehensive guidance on the calculation of Average Manufacturer Price and Best Price; two metrics utilized to determine the rebates drug manufacturers are required to pay to state Medicaid programs. The impact of changes resulting from the issuance of the rule is not material to Merck at this time. However, the Company is still awaiting guidance from CMS on two aspects of the rule that were deferred for later implementation. These include a definition of what constitutes a product ‘line extension’ and a delay in the participation of the U.S. Territories in the Medicaid Drug Rebate Program until April 1, 2020. The Company will evaluate the financial impact of these two elements when they become effective.
There is significant uncertainty about the future of the ACA in particular and healthcare laws in general in the United States. The Company is participating in the debate and monitoring how any proposed changes could affect its business. The Company is unable to predict the likelihood of changes to the ACA. Depending on the nature of any repeal and replacement of the ACA, such actions could have a material adverse effect on the Company’s results of operations, financial condition or business.
Also, during 2016, the Vermont legislature passed a pharmaceutical cost transparency law. The law requires manufacturers identified by the Vermont Green Mountain Care Board to report certain product price information to the Vermont Attorney General. The Attorney General is then required to submit a report to the legislature. A number of other states have introduced legislation of this kind and the Company expects that states will continue their focus on pharmaceutical price transparency. The extent to which these proposals will pass into law is unknown at this time.
The Company also faces increasing pricing pressure globally from managed care organizations, government agencies and programs that could negatively affect the Company’s sales and profit margins. In the United States, these
5
include (i) practices of managed care organizations, federal and state exchanges, and institutional and governmental purchasers, and (ii) U.S. federal laws and regulations related to Medicare and Medicaid, including the Medicare Prescription Drug Improvement and Modernization Act of 2003 and the ACA.
Changes to the health care system enacted as part of health care reform in the United States, as well as increased purchasing power of entities that negotiate on behalf of Medicare, Medicaid, and private sector beneficiaries, could result in further pricing pressures. As an example, health care reform is contributing to an increase in the number of patients in the Medicaid program under which sales of pharmaceutical products are subject to substantial rebates.
In addition, in the effort to contain the U.S. federal deficit, the pharmaceutical industry could be considered a potential source of savings via legislative proposals that have been debated but not enacted. These types of revenue generating or cost saving proposals include additional direct price controls in the Medicare prescription drug program (Part D). In addition, Congress may again consider proposals to allow, under certain conditions, the importation of medicines from other countries. It remains very uncertain as to what proposals, if any, may be included as part of future federal budget deficit reduction proposals that would directly or indirectly affect the Company.
In the U.S. private sector, consolidation and integration among healthcare providers is a major factor in the competitive marketplace for pharmaceutical products. Health plans and pharmacy benefit managers have been consolidating into fewer, larger entities, thus enhancing their purchasing strength and importance. Private third-party insurers, as well as governments, increasingly employ formularies to control costs by negotiating discounted prices in exchange for formulary inclusion. Failure to obtain timely or adequate pricing or formulary placement for Merck’s products or obtaining such pricing or placement at unfavorable pricing could adversely impact revenue. In addition to formulary tier co-pay differentials, private health insurance companies and self-insured employers have been raising co-payments required from beneficiaries, particularly for branded pharmaceuticals and biotechnology products. Private health insurance companies also are increasingly imposing utilization management tools, such as clinical protocols, requiring prior authorization for a branded product if a generic product is available or requiring the patient to first fail on one or more generic products before permitting access to a branded medicine. These same utilization management tools are also used in treatment areas in which the payer has taken the position that multiple branded products are therapeutically comparable. As the U.S. payer market concentrates further and as more drugs become available in generic form, pharmaceutical companies may face greater pricing pressure from private third-party payers.
In order to provide information about the Company’s pricing practices, the Company recently posted on its website its first Pricing Action Transparency Report for the United States for the years 2010 - 2016. The report provides the Company’s average annual list price and net price increases across the Company’s U.S. portfolio dating back to 2010. The report shows that the Company’s average annual net price increases (after taking sales deductions such as rebates, discounts and returns into account) across the U.S. human health portfolio have been in the low to mid-single digits since 2010. Additionally, the weighted average annual discount rate has been steadily increasing over time, reflecting the competitive market for branded medicines and the impact of the ACA. In 2016, the Company’s gross U.S. sales were reduced by 40.9% as a result of rebates, discounts and returns.
Efforts toward health care cost containment also remain intense in European countries. The Company faces competitive pricing pressure resulting from generic and biosimilar drugs. In addition, a majority of countries in Europe attempt to contain drug costs by engaging in reference pricing in which authorities examine pre-determined markets for published prices of drugs by brand. The authorities then use price data from those markets to set new local prices for brand-name drugs, including the Company’s. Guidelines for examining reference pricing are usually set in local markets and can be changed pursuant to local regulations.
In addition, in Japan, the pharmaceutical industry is subject to government-mandated biennial price reductions of pharmaceutical products and certain vaccines, which occurred in 2016. Furthermore, the government can order repricings for classes of drugs if it determines that it is appropriate under applicable rules.
Certain markets outside of the United States have also implemented other cost management strategies, such as health technology assessments (HTA), which require additional data, reviews and administrative processes, all of which increase the complexity, timing and costs of obtaining product reimbursement and exert downward pressure on available reimbursement. In the United States, HTAs are also being used by government and private payers.
The Company’s focus on emerging markets has continued. Governments in many emerging markets are also focused on constraining health care costs and have enacted price controls and related measures, such as compulsory
6
licenses, that aim to put pressure on the price of pharmaceuticals and constrain market access. The Company anticipates that pricing pressures and market access challenges will continue in 2017 to varying degrees in the emerging markets.
Beyond pricing and market access challenges, other conditions in emerging market countries can affect the Company’s efforts to continue to grow in these markets, including potential political instability, significant currency fluctuation and controls, financial crises, limited or changing availability of funding for health care, and other developments that may adversely impact the business environment for the Company. Further, the Company may engage third-party agents to assist in operating in emerging market countries, which may affect its ability to realize continued growth and may also increase the Company’s risk exposure.
In addressing cost containment pressures, the Company engages in public policy advocacy with policymakers and continues to work to demonstrate that its medicines provide value to patients and to those who pay for health care. The Company advocates with government policymakers to encourage a long-term approach to sustainable health care financing that ensures access to innovative medicines and does not disproportionately target pharmaceuticals as a source of budget savings. In markets with historically low rates of health care spending, the Company encourages those governments to increase their investments and adopt market reforms in order to improve their citizens’ access to appropriate health care, including medicines.
Operating conditions have become more challenging under the global pressures of competition, industry regulation and cost containment efforts. Although no one can predict the effect of these and other factors on the Company’s business, the Company continually takes measures to evaluate, adapt and improve the organization and its business practices to better meet customer needs and believes that it is well positioned to respond to the evolving health care environment and market forces.
The pharmaceutical industry is also subject to regulation by regional, country, state and local agencies around the world focused on standards and processes for determining drug safety and effectiveness, as well as conditions for sale or reimbursement.
Of particular importance is the FDA in the United States, which administers requirements covering the testing, approval, safety, effectiveness, manufacturing, labeling, and marketing of prescription pharmaceuticals. In some cases, the FDA requirements and practices have increased the amount of time and resources necessary to develop new products and bring them to market in the United States. At the same time, the FDA has committed to expediting the development and review of products bearing the “breakthrough therapy” designation, which has accelerated the regulatory review process for medicines with this designation.
The European Union (EU) has adopted directives and other legislation concerning the classification, labeling, advertising, wholesale distribution, integrity of the supply chain, enhanced pharmacovigilance monitoring and approval for marketing of medicinal products for human use. These provide mandatory standards throughout the EU, which may be supplemented or implemented with additional regulations by the EU member states. The Company’s policies and procedures are already consistent with the substance of these directives; consequently, it is believed that they will not have any material effect on the Company’s business.
The Company believes that it will continue to be able to conduct its operations, including launching new drugs, in this regulatory environment. (See “Research and Development” below for a discussion of the regulatory approval process.)
Access to Medicines
As a global health care company, Merck’s primary role is to discover and develop innovative medicines and vaccines. The Company also recognizes that it has an important role to play in helping to improve access to its products around the world. The Company’s efforts in this regard are wide-ranging and include a set of principles that the Company strives to embed into its operations and business strategies to guide the Company’s worldwide approach to expanding access to health care. In addition, the Company has many far-reaching philanthropic programs. The Merck Patient Assistance Program provides medicines and adult vaccines for free to people in the United States who do not have prescription drug or health insurance coverage and who, without the Company’s assistance, cannot afford their Merck medicine and vaccines. In 2011, Merck launched “Merck for Mothers,” a long-term effort with global health partners to end preventable deaths from complications of pregnancy and childbirth. Merck has also provided funds to the Merck Foundation, an independent organization, which has partnered with a variety of organizations dedicated to improving global health.
7
Privacy and Data Protection
The Company is subject to a significant number of privacy and data protection laws and regulations globally, many of which place restrictions on the Company’s ability to transfer, access and use personal data across its business. The legislative and regulatory landscape for privacy and data protection continues to evolve. There has been increased attention to privacy and data protection issues in both developed and emerging markets with the potential to affect directly the Company’s business, including a new EU General Data Protection Regulation, which will become effective in 2018 and impose penalties up to 4% of global revenue, additional laws and regulations enacted in the United States, Europe, Asia and Latin America, increased enforcement and litigation activity in the United States and other developed markets, and increased regulatory cooperation among privacy authorities globally. The Company has adopted a comprehensive global privacy program to manage these evolving risks which has been certified as compliant with and approved by the Asia Pacific Economic Cooperation Cross-Border Privacy Rules System, the EU-U.S. Privacy Shield Program, and the Binding Corporate Rules in the EU.
Distribution
The Company sells its human health pharmaceutical products primarily to drug wholesalers and retailers, hospitals, government agencies and managed health care providers, such as health maintenance organizations, pharmacy benefit managers and other institutions. Human health vaccines are sold primarily to physicians, wholesalers, physician distributors and government entities. The Company’s professional representatives communicate the effectiveness, safety and value of the Company’s pharmaceutical and vaccine products to health care professionals in private practice, group practices, hospitals and managed care organizations. The Company sells its animal health products to veterinarians, distributors and animal producers.
Raw Materials
Raw materials and supplies, which are generally available from multiple sources, are purchased worldwide and are normally available in quantities adequate to meet the needs of the Company’s business.
Patents, Trademarks and Licenses
Patent protection is considered, in the aggregate, to be of material importance to the Company’s marketing of its products in the United States and in most major foreign markets. Patents may cover products
per se
, pharmaceutical formulations, processes for or intermediates useful in the manufacture of products or the uses of products. Protection for individual products extends for varying periods in accordance with the legal life of patents in the various countries. The protection afforded, which may also vary from country to country, depends upon the type of patent and its scope of coverage.
The Food and Drug Administration Modernization Act includes a Pediatric Exclusivity Provision that may provide an additional six months of market exclusivity in the United States for indications of new or currently marketed drugs if certain agreed upon pediatric studies are completed by the applicant. Current U.S. patent law provides additional patent term for periods when the patented product was under regulatory review by the FDA. The EU also provides an additional six months of pediatric market exclusivity attached to a product’s Supplementary Protection Certificate (SPC). Japan provides the additional term for pediatric studies attached to market exclusivity unrelated to patent rights.
8
Patent portfolios developed for products introduced by the Company normally provide market exclusivity. The Company has the following key patent protection in the United States, the EU and Japan (including the potential for patent term extensions (PTE) and SPCs where indicated) for the following marketed products:
|
Product
|
Year of Expiration (U.S.)
|
Year of Expiration (EU)
(1)
|
Year of Expiration (Japan)
|
|
Invanz
|
2017 (composition)
|
2017
|
N/A
|
|
Arcoxia
|
Not Marketed
|
2017
|
Not Marketed
|
|
Cancidas
|
2017 (formulation)
|
2017
|
2019
|
|
Zostavax
|
Expired
|
2018 (use)
|
N/A
|
|
Dulera
|
2017 (formulation)/
2020 (combination)
|
N/A
|
N/A
|
|
Zetia
(2)
|
2017
|
2018
|
2019
|
|
Vytorin
|
2017
|
2019
|
2019
|
|
Asmanex
|
2018 (formulation)
|
2018 (formulation)
|
2020 (formulation)
|
|
NuvaRing
(3)
|
2018 (delivery system)
|
2018 (delivery system)
|
N/A
|
|
Emend
for Injection
|
2019
(4)
|
2020
(4)
|
2020
|
|
Follistim AQ
|
2019 (formulation)
|
2019 (formulation)
|
2019 (formulation)
|
|
Noxafil
|
2019
|
2019
|
N/A
|
|
RotaTeq
|
2019
|
Expired
|
Expired
|
|
Recombivax
|
2020 (method of making)
|
Expired
|
Expired
|
|
Januvia
|
2022
(4)
|
2022
(4)
|
2025-2026
(5)
|
|
Janumet
|
2022
(4)
|
2023
|
N/A
|
|
Janumet XR
|
2022
(4)
|
N/A
|
N/A
|
|
Isentress
|
2023
(4)
|
2022
(4)
|
2022
|
|
Simponi
|
N/A
(6)
|
2024
|
N/A
(6)
|
|
Bridion
|
2026
(4)
(with pending PTE)
|
2023
|
2024
|
|
Nexplanon
|
2027 (device)
|
2025 (device)
|
Not Marketed
|
|
Bravecto
|
2027 (with pending PTE)
|
2025 (patent), 2029 (SPCs)
|
2029
|
|
Gardasil
|
2028
|
2021
(4)
|
2017
|
|
Gardasil
9
|
2028
|
2025 (patent)
,
2030
(4)
(SPCs)
|
N/A
|
|
Keytruda
|
2028
|
2028 (patent), 2030
(4)
(SPCs)
|
2032 (with pending PTE)
|
|
Zerbaxa
|
2028
(4)
(with pending PTE)
|
2023 (patent), 2028
(4)
(SPCs)
|
N/A
|
|
Sivextro
|
2028
(4)
|
2024 (patent), 2029
(4)
(SPCs)
|
N/A
|
|
Zinplava
|
2028 (with pending PTE)
|
2025
(7)
|
N/A
|
|
Belsomra
|
2029
(4)
|
N/A
|
2031
|
|
Zepatier
|
2031
(4)
|
2030 (patent), 2031
(4)
(SPCs)
|
2030
|
|
N/A:
|
Currently no marketing approval.
|
|
Note:
|
Compound patent unless otherwise noted. Certain of the products listed may be the subject of patent litigation. See Item 8. “Financial Statements and Supplementary Data,” Note 10. “Contingencies and Environmental Liabilities” below.
|
|
(1)
|
The EU date represents the expiration date for the following five countries: France, Germany, Italy, Spain and the UK (Major EU Markets). If an SPC has been granted in some but not all Major EU Markets, both the patent expiry date and the SPC expiry date are listed.
|
|
(2)
|
By agreement, a generic manufacturer launched a generic version of
Zetia
in the United States in December 2016.
|
|
(3)
|
In August 2016, a district court decision found invalid the Company’s patent claiming
NuvaRing
’s delivery system. That decision is currently under appeal.
|
|
(4)
|
Eligible for 6 months Pediatric Exclusivity.
|
|
(5)
|
The PTE system in Japan allows for a patent to be extended more than once provided the later approval is directed to a different indication from that of the previous approval. This may result in multiple PTE approvals for a given patent, each with its own expiration date.
|
|
(6)
|
The Company has no marketing rights in the U.S. and Japan.
|
|
(7)
|
SPC applications to be filed by July 2017. Expected expiry 2030. Eligible for pediatric exclusivity.
|
While the expiration of a product patent normally results in a loss of market exclusivity for the covered pharmaceutical product, commercial benefits may continue to be derived from: (i) later-granted patents on processes and intermediates related to the most economical method of manufacture of the active ingredient of such product; (ii) patents relating to the use of such product; (iii) patents relating to novel compositions and formulations; and (iv) in the United States and certain other countries, market exclusivity that may be available under relevant law. The effect of product patent expiration on pharmaceutical products also depends upon many other factors such as the nature of the market and the position of the product in it, the growth of the market, the complexities and economics of the process for manufacture of the active ingredient of the product and the requirements of new drug provisions of the Federal Food, Drug and Cosmetic Act or similar laws and regulations in other countries.
9
Additions to market exclusivity are sought in the United States and other countries through all relevant laws, including laws increasing patent life. Some of the benefits of increases in patent life have been partially offset by an increase in the number of incentives for and use of generic products. Additionally, improvements in intellectual property laws are sought in the United States and other countries through reform of patent and other relevant laws and implementation of international treaties.
The Company has the following key U.S. patent protection for drug candidates under review in the United States by the FDA. Additional patent term may be provided for these pipeline candidates based on Patent Term Restoration and Pediatric Exclusivity.
|
Under Review (in the U.S.)
|
Currently Anticipated
Year of Expiration (in the U.S.)
|
|
V419 (pediatric hexavalent combination vaccine)
|
2020 (method of making)
|
The Company also has the following key U.S. patent protection for drug candidates in Phase 3 development:
|
Phase 3 Drug Candidate
|
Currently Anticipated
Year of Expiration (in the U.S.)
|
|
V920 (ebola vaccine)
|
2023
|
|
MK-8228 (letermovir)
|
2024
|
|
MK-0859 (anacetrapib)
|
2027
|
|
MK-7655A (relebactam + imipenem/cilastatin)
|
2030
|
|
MK-8931 (verubecestat)
|
2030
|
|
MK-1439 (doravirine)
|
2031
|
|
MK-8835 (ertuglifozin)
|
2030
|
|
MK-8835A (ertuglifozin + sitagliptin)
|
2030
|
|
MK-8835B (ertuglifozin + metformin)
|
2030
|
|
MK-1242 (vericiguat)
|
2031
|
Unless otherwise noted, the patents in the above charts are compound patents. Each patent is subject to any future patent term restoration of up to five years and six month pediatric market exclusivity, either or both of which may be available. In addition, depending on the circumstances surrounding any final regulatory approval of the compound, there may be other listed patents or patent applications pending that could have relevance to the product as finally approved; the relevance of any such application would depend upon the claims that ultimately may be granted and the nature of the final regulatory approval of the product. Also, regulatory exclusivity tied to the protection of clinical data is complementary to patent protection and, in some cases, may provide more effective or longer lasting marketing exclusivity than a compound’s patent estate. In the United States, the data protection generally runs five years from first marketing approval of a new chemical entity, extended to seven years for an orphan drug indication and 12 years from first marketing approval of a biological product.
For further information with respect to the Company’s patents, see Item 1A. “Risk Factors” and Item 8. “Financial Statements and Supplementary Data,” Note 10. “Contingencies and Environmental Liabilities” below.
Worldwide, all of the Company’s important products are sold under trademarks that are considered in the aggregate to be of material importance. Trademark protection continues in some countries as long as used; in other countries, as long as registered. Registration is for fixed terms and can be renewed indefinitely.
Royalty income in 2016 on patent and know-how licenses and other rights amounted to $222 million. Merck also incurred royalty expenses amounting to $1.1 billion in 2016 under patent and know-how licenses it holds.
Research and Development
The Company’s business is characterized by the introduction of new products or new uses for existing products through a strong research and development program. Approximately 12,300 people are employed in the Company’s research activities. Research and development expenses were
$10.1 billion
in
2016
,
$6.7 billion
in
2015
and
$7.2 billion
in
2014
(which included restructuring costs and acquisition and divestiture-related costs in all years). The Company prioritizes its research and development efforts and focuses on candidates that it believes represent breakthrough science that will make a difference for patients and payers.
10
The Company maintains a number of long-term exploratory and fundamental research programs in biology and chemistry as well as research programs directed toward product development. The Company’s research and development model is designed to increase productivity and improve the probability of success by prioritizing the Company’s research and development resources on candidates the Company believes are capable of providing unambiguous, promotable advantages to patients and payers and delivering the maximum value of its approved medicines and vaccines through new indications and new formulations. Merck is pursuing emerging product opportunities independent of therapeutic area or modality (small molecule, biologics and vaccines) and is building its biologics capabilities. The Company is committed to making externally sourced programs a greater component of its pipeline strategy, with a focus on supplementing its internal research with a licensing and external alliance strategy focused on the entire spectrum of collaborations from early research to late-stage compounds, as well as access to new technologies.
The Company also reviews its pipeline to examine candidates which may provide more value through out-licensing. The Company continues to evaluate certain late-stage clinical development and platform technology assets to determine their out-licensing or sale potential.
The Company’s clinical pipeline includes candidates in multiple disease areas, including atherosclerosis, cancer, cardiovascular diseases, diabetes, infectious diseases, inflammatory/autoimmune diseases, neurodegenerative diseases, and respiratory diseases.
In the development of human health products, industry practice and government regulations in the United States and most foreign countries provide for the determination of effectiveness and safety of new chemical compounds through preclinical tests and controlled clinical evaluation. Before a new drug or vaccine may be marketed in the United States, recorded data on preclinical and clinical experience are included in the New Drug Application (NDA) for a drug or the Biologics License Application (BLA) for a vaccine or biologic submitted to the FDA for the required approval.
Once the Company’s scientists discover a new small molecule compound or biologic that they believe has promise to treat a medical condition, the Company commences preclinical testing with that compound. Preclinical testing includes laboratory testing and animal safety studies to gather data on chemistry, pharmacology, immunogenicity and toxicology. Pending acceptable preclinical data, the Company will initiate clinical testing in accordance with established regulatory requirements. The clinical testing begins with Phase 1 studies, which are designed to assess safety, tolerability, pharmacokinetics, and preliminary pharmacodynamic activity of the compound in humans. If favorable, additional, larger Phase 2 studies are initiated to determine the efficacy of the compound in the affected population, define appropriate dosing for the compound, as well as identify any adverse effects that could limit the compound’s usefulness. In some situations, the clinical program incorporates adaptive design methodology to use accumulating data to decide how to modify aspects of the ongoing clinical study as it continues, without undermining the validity and integrity of the trial. One type of adaptive clinical trial is an adaptive Phase 2a/2b trial design, a two-stage trial design consisting of a Phase 2a proof-of-concept stage and a Phase 2b dose-optimization finding stage. If data from the Phase 2 trials are satisfactory, the Company commences large-scale Phase 3 trials to confirm the compound’s efficacy and safety. Another type of adaptive clinical trial is an adaptive Phase 2/3 trial design, a study that includes an interim analysis and an adaptation that changes the trial from having features common in a Phase 2 study (e.g. multiple dose groups) to a design similar to a Phase 3 trial. An adaptive Phase 2/3 trial design reduces timelines by eliminating activities which would be required to start a separate study. Upon completion of Phase 3 trials, if satisfactory, the Company submits regulatory filings with the appropriate regulatory agencies around the world to have the product candidate approved for marketing. There can be no assurance that a compound that is the result of any particular program will obtain the regulatory approvals necessary for it to be marketed.
Vaccine development follows the same general pathway as for drugs. Preclinical testing focuses on the vaccine’s safety and ability to elicit a protective immune response (immunogenicity). Pre-marketing vaccine clinical trials are typically done in three phases. Initial Phase 1 clinical studies are conducted in normal subjects to evaluate the safety, tolerability and immunogenicity of the vaccine candidate. Phase 2 studies are dose-ranging studies. Finally, Phase 3 trials provide the necessary data on effectiveness and safety. If successful, the Company submits regulatory filings with the appropriate regulatory agencies.
In the United States, the FDA review process begins once a complete NDA or BLA is submitted, received and accepted for review by the agency. Within 60 days after receipt, the FDA determines if the application is sufficiently complete to permit a substantive review. The FDA also assesses, at that time, whether the application will be granted
11
a priority review or standard review. Pursuant to the Prescription Drug User Fee Act V (PDUFA), the FDA review period target for NDAs or original BLAs is either six months, for priority review, or ten months, for a standard review, from the time the application is deemed sufficiently complete. Once the review timelines are determined, the FDA will generally act upon the application within those timelines, unless a major amendment has been submitted (either at the Company’s own initiative or the FDA’s request) to the pending application. If this occurs, the FDA may extend the review period to allow for review of the new information, but by no more than three months. Extensions to the review period are communicated to the Company. The FDA can act on an application either by issuing an approval letter or by issuing a Complete Response Letter (CRL) stating that the application will not be approved in its present form and describing all deficiencies that the FDA has identified. Should the Company wish to pursue an application after receiving a CRL, it can resubmit the application with information that addresses the questions or issues identified by the FDA in order to support approval. Resubmissions are subject to review period targets, which vary depending on the underlying submission type and the content of the resubmission.
The FDA has four program designations — Fast Track, Breakthrough Therapy, Accelerated Approval, and Priority Review — to facilitate and expedite development and review of new drugs to address unmet medical needs in the treatment of serious or life-threatening conditions. The Fast Track designation provides pharmaceutical manufacturers with opportunities for frequent interactions with FDA reviewers during the product’s development and the ability for the manufacturer to do a rolling submission of the NDA/BLA. A rolling submission allows completed portions of the application to be submitted and reviewed by the FDA on an ongoing basis. The Breakthrough Therapy designation provides manufacturers with all of the features of the Fast Track designation as well as intensive guidance on implementing an efficient development program for the product and a commitment by the FDA to involve senior managers and experienced staff in the review. The Accelerated Approval designation allows the FDA to approve a product based on an effect on a surrogate or intermediate endpoint that is reasonably likely to predict a product’s clinical benefit and generally requires the manufacturer to conduct required post-approval confirmatory trials to verify the clinical benefit. The Priority Review designation means that the FDA’s goal is to take action on the NDA/BLA within six months, compared to ten months under standard review.
In addition, under the Generating Antibiotic Incentives Now Act, the FDA may grant Qualified Infectious Disease Product (QIDP) status to antibacterial or antifungal drugs intended to treat serious or life threatening infections including those caused by antibiotic or antifungal resistant pathogens, novel or emerging infectious pathogens, or other qualifying pathogens. QIDP designation offers certain incentives for development of qualifying drugs, including Priority Review of the NDA when filed, eligibility for Fast Track designation, and a five-year extension of applicable exclusivity provisions under the Food, Drug and Cosmetic Act.
The primary method the Company uses to obtain marketing authorization of pharmaceutical products in the EU is through the “centralized procedure.” This procedure is compulsory for certain pharmaceutical products, in particular those using biotechnological processes, and is also available for certain new chemical compounds and products. A company seeking to market an innovative pharmaceutical product through the centralized procedure must file a complete set of safety data and efficacy data as part of a Marketing Authorization Application (MAA) with the EMA. After the EMA evaluates the MAA, it provides a recommendation to the EC and the EC then approves or denies the MAA. It is also possible for new chemical products to obtain marketing authorization in the EU through a “mutual recognition procedure” in which an application is made to a single member state and, if the member state approves the pharmaceutical product under a national procedure, the applicant may submit that approval to the mutual recognition procedure of some or all other member states.
Outside of the United States and the EU, the Company submits marketing applications to national regulatory authorities. Examples of such are the Pharmaceuticals and Medical Devices Agency in Japan, Health Canada, Agência Nacional de Vigilância Sanatária in Brazil, Korea Food and Drug Administration in South Korea, Therapeutic Goods Administration in Australia and China Food and Drug Administration. Each country has a separate and independent review process and timeline. In many markets, approval times can be longer as the regulatory authority requires approval in a major market, such as the United States or the EU, and issuance of a Certificate of Pharmaceutical Product from that market before initiating their local review process.
12
Research and Development Update
The Company currently has several candidates under regulatory review in the United States.
Keytruda
is an FDA-approved anti-PD-1 (programmed death receptor-1) therapy in clinical development for expanded indications in different cancer types.
Keytruda
is currently approved for the treatment of NSCLC, melanoma, advanced melanoma, and head and neck cancer.
In February 2017, the FDA accepted for review two supplemental BLAs (sBLA) for
Keytruda
in patients with locally advanced or metastatic urothelial cancer, including most bladder cancers. The application for first-line use was granted Priority Review for the treatment of these patients who are ineligible for cisplatin-containing therapy. The application for second-line use was granted Priority Review for these patients with disease progression on or after platinum-containing chemotherapy. The PDUFA action date for both applications is June 14, 2017. The FDA previously granted Breakthrough Therapy designation to
Keytruda
for the second-line treatment of patients with locally advanced or metastatic urothelial cancer with disease progression on or after platinum-containing chemotherapy.
In January 2017, the FDA accepted for review an sBLA for
Keytruda
plus chemotherapy (pemetrexed plus carboplatin) for the first-line treatment of patients with metastatic or advanced non-squamous NSCLC regardless of PD-L1 expression and with no EGFR or ALK genomic tumor aberrations. This is the first application for regulatory approval of
Keytruda
in combination with another treatment. The FDA granted Priority Review with a PDUFA action date of May 10, 2017. The sBLA will be reviewed under the FDA’s Accelerated Approval program.
In December 2016, the FDA accepted for review an sBLA for
Keytruda
for the treatment of patients with refractory classical Hodgkin lymphoma or for patients who have relapsed after three or more prior lines of therapy. The FDA granted Priority Review with a PDUFA action date of March 15, 2017. The sBLA will be reviewed under the FDA’s Accelerated Approval program.
In November 2016, the FDA accepted for review an sBLA for
Keytruda
, for the treatment of previously treated patients with advanced microsatellite instability-high (MSI-H) cancer. The FDA granted Priority Review with a PDUFA action date of March 8, 2017. The sBLA will be reviewed under the FDA’s Accelerated Approval program. The FDA recently granted Breakthrough Therapy designation to
Keytruda
for unresectable or metastatic MSI-H non-colorectal cancer, and previously granted it for the treatment of patients with unresectable or metastatic MSI-H colorectal cancer.
Additionally,
Keytruda
has also received Breakthrough Therapy designation from the FDA for the treatment of patients with primary mediastinal B-cell lymphoma that is refractory to or has relapsed after two prior lines of therapy.
The
Keytruda
clinical development program consists of more than 400 clinical trials, including more than 200 trials that combine
Keytruda
with other cancer treatments. These studies encompass more than 30 cancer types including: bladder, colorectal, esophageal, gastric, head and neck, hepatocellular, Hodgkin lymphoma, non-Hodgkin lymphoma, melanoma, multiple myeloma, nasopharyngeal, NSCLC, ovarian, prostate, renal and triple-negative breast, many of which are currently in Phase 3 clinical development. Further trials are being planned for other cancers.
MK-1293 is an investigational follow-on biologic insulin glargine candidate for the treatment of patients with type 1 and type 2 diabetes under review by the FDA. MK-1293 was approved in the EU in January 2017. MK-1293 is being developed in collaboration with and partially funded by Samsung Bioepis.
V419 is an investigational pediatric hexavalent combination vaccine, DTaP5-IPV-Hib-HepB, under review with the FDA that is being developed and, if approved, will be commercialized through a partnership between Merck and Sanofi. This vaccine is designed to help protect against six important diseases - diphtheria, tetanus, pertussis (whooping cough), polio (poliovirus types 1, 2, and 3), invasive disease caused by
Haemophilus influenzae
type b (Hib), and hepatitis B. On November 2, 2015, the FDA issued a CRL with respect to the BLA for V419. Both companies are reviewing the CRL and plan to have further communication with the FDA. In February 2016, the EC granted marketing authorization for V419 for prophylaxis against diphtheria, tetanus, pertussis, hepatitis B, poliomyelitis, and invasive disease caused by Hib, in infants and toddlers from the age of 6 weeks. V419 is being marketed as
Vaxelis
in the EU.
In addition to the candidates under regulatory review, the Company has several drug candidates in Phase 3 clinical development in addition to the
Keytruda
programs discussed above.
13
MK-8931, verubecestat, is an investigational small molecule inhibitor of the beta-site amyloid precursor protein cleaving enzyme 1 (BACE1) for the treatment of Alzheimer’s disease. In February 2017, Merck announced that its external Data Monitoring Committee (eDMC) recommended termination of the Phase 2/3 EPOCH study of verubecestat in mild-to-moderate Alzheimer’s disease based on the low probability of success of this study. The same eDMC recommended that a separate Phase 3 study, APECS, evaluating verubecestat for amnestic mild cognitive impairment due to Alzheimer’s disease, also known as prodromal Alzheimer’s disease, continue as planned. Estimated primary completion date for the APECS study, which is fully enrolled, is February 2019.
MK-0859, anacetrapib, is an investigational inhibitor of the cholesteryl ester transfer protein (CETP) in development for raising HDL-C and reducing LDL-C. Anacetrapib is being evaluated in a 30,000 patient, event-driven cardiovascular clinical outcomes trial sponsored by Oxford University, REVEAL (Randomized EValuation of the Effects of Anacetrapib Through Lipid-modification), involving patients with preexisting vascular disease. In November 2015, Merck announced that the Data Monitoring Committee (DMC) of the REVEAL outcomes study completed its planned review of unblinded study data and recommended the study continue with no changes. The DMC reviewed safety and efficacy data from the study, which included an assessment of futility. Merck remains blinded to the actual results of this analysis and to other REVEAL safety and efficacy data. Under the study, the last patient’s last visit occurred in January 2017. The Company anticipates receiving the top-line results from the study mid-year 2017.
MK-7655A is a combination of relebactam, an investigational beta-lactamase inhibitor, and imipenem/cilastatin (an approved carbapenem antibiotic). The FDA has designated this combination a QIDP with designated Fast Track status for the treatment of hospital-acquired bacterial pneumonia, ventilator-associated bacterial pneumonia, complicated intra-abdominal infections and complicated urinary tract infections.
MK-8228, letermovir, is an investigational oral once-daily or an intravenous infusion antiviral candidate for the prevention of clinically-significant cytomegalovirus (CMV) infection. Letermovir has received Orphan Drug Status in the EU and in the United States, where it has also been granted Fast Track designation. In October 2016, Merck announced that the pivotal Phase 3 clinical study of letermovir met its primary endpoint. The global, multicenter, randomized, placebo-controlled study evaluated the efficacy and safety of letermovir in adult (18 years and older) CMV-seropositive recipients of an allogeneic hematopoietic stem cell transplant. Merck plans to submit regulatory applications for the approval of letermovir in the United States and EU in 2017.
MK-8835, ertugliflozin, is an investigational oral SGLT2 inhibitor being evaluated for the treatment of type 2 diabetes in collaboration with Pfizer Inc. (Pfizer). In September 2016, Merck and Pfizer announced that a Phase 3 study (VERTIS SITA2) of ertugliflozin met its primary endpoint. Both 5 mg and 15 mg daily doses of ertugliflozin showed significantly greater reductions in A1C (an average measure of blood glucose over the past two to three months) when added to patients on a background of sitagliptin and metformin. Ertugliflozin is also being studied in combination with
Januvia
(sitagliptin) and metformin. In December 2016, Merck submitted NDAs to the FDA for ertugliflozin and the two fixed-dose combinations: MK-8835A, ertugliflozin plus
Januvia
, and MK-8835B, ertugliflozin plus metformin. The Company anticipates a response from the FDA in the first quarter of 2017. Ertugliflozin and the two fixed-dose combinations are currently under review in the EU.
MK-0431J is an investigational fixed-dose combination of sitagliptin and ipragliflozin under development for commercialization in Japan in collaboration with Astellas Pharma Inc. (Astellas). Ipragliflozin, an SGLT2 inhibitor, co-developed by Astellas and Kotobuki Pharmaceutical Co., Ltd. (Kotobuki), is approved for use in Japan and is being co-promoted with Merck and Kotobuki.
V920 is an investigational rVSV-ZEBOV (Ebola) vaccine candidate being studied in large scale Phase 2/3 clinical trials. In November 2014, Merck and NewLink Genetics announced an exclusive licensing and collaboration agreement for the investigational Ebola vaccine. In December 2015, Merck announced that the application for Emergency Use Assessment and Listing (EUAL) for V920 was accepted for review by the World Health Organization (WHO). According to the WHO, the EUAL process is designed to expedite the availability of vaccines needed for public health emergencies such as another outbreak of Ebola. The decision to grant V920 EUAL status will be based on data regarding quality, safety, and efficacy/effectiveness; as well as a risk/benefit analysis for emergency use. While EUAL designation allows for emergency use, the vaccine remains investigational and has not yet been licensed for commercial distribution. In July 2016, Merck announced that the FDA granted V920 Breakthrough Therapy designation, and that the EMA granted the vaccine candidate PRIME (PRIority MEdicines) status. In December 2016, end of study results from the WHO ring vaccination trial were reported in Lancet supporting the July 2015 interim assessment that
14
V920 offers substantial protection against Ebola virus disease, with no reported cases among vaccinated individuals from 10 days after vaccination in both randomized and non-randomized clusters. Results from other ongoing studies are anticipated in the second half of 2017.
MK-1242, vericiguat, is an investigational treatment for heart failure being studied in a Phase 3 clinical trial in patients suffering from chronic heart failure. The development of vericiguat is part of a worldwide strategic collaboration between Merck and Bayer AG.
V212 is an inactivated varicella zoster virus (VZV) vaccine in development for the prevention of herpes zoster. The Company completed the Phase 3 trial in autologous hematopoietic cell transplant patients and is conducting another Phase 3 trial in patients with solid tumor malignancies undergoing chemotherapy and hematological malignancies. The study in autologous hematopoietic cell transplant patients met its primary endpoints and Merck presented the results from this study at the American Society for Blood and Marrow Transplantation Meetings in February 2017.
MK-1439, doravirine, is an investigational non-nucleoside reverse transcriptase inhibitor being developed by Merck for the treatment of HIV-1 infection. In February 2017, the Company received positive results from a first Phase 3 study showing that doravirine was non-inferior to an alternative regimen in achieving and maintaining HIV-1 suppression in infected adults during 48 weeks of treatment.
In 2016, the Company also divested or discontinued certain drug candidates.
Merck announced that it is discontinuing the development of odanacatib, an investigational cathepsin K inhibitor for osteoporosis, and will not seek regulatory approval for its use. Merck previously reported a numeric imbalance in adjudicated stroke events in the pivotal Phase 3 fracture outcomes study in postmenopausal women. The Company has decided to discontinue development after an independent adjudication and analysis of major adverse cardiovascular events confirmed an increased risk of stroke.
The Company determined that, for business reasons, it would terminate the North America partnership agreement with ALK-Abelló that included MK-8237, an investigational allergy immunotherapy tablet for house dust mite allergy. Merck has given ALK-Abelló six months’ notice that it is terminating the agreement and therefore this compound will be returned to ALK-Abelló. This decision was not due to efficacy or safety concerns.
The Company also decided, for business reasons, to discontinue the clinical development of MK-8342B, referred to as the Next Generation Ring, an investigational combination (etonogestrel and 17ß-estradiol) vaginal ring for contraception and the treatment of dysmenorrhea in women seeking contraception. This decision was not due to efficacy or safety concerns.
Merck announced that, for business reasons, it will not proceed with submitting marketing applications for omarigliptin, an investigational, once-weekly DPP-4 inhibitor, in the United States or Europe. This decision did not result from concerns about the efficacy or safety of omarigliptin.
15
The chart below reflects the Company’s research pipeline as of February 24, 2017. Candidates shown in Phase 3 include specific products and the date such candidate entered into Phase 3 development. Candidates shown in Phase 2 include the most advanced compound with a specific mechanism or, if listed compounds have the same mechanism, they are each currently intended for commercialization in a given therapeutic area. Small molecules and biologics are given MK-number designations and vaccine candidates are given V-number designations. Except as otherwise noted, candidates in Phase 1, additional indications in the same therapeutic area (other than with respect to
Keytruda
) and additional claims, line extensions or formulations for in-line products are not shown.
|
Phase 2
|
Phase 3 (Phase 3 entry date)
|
Under Review
|
|
Asthma
MK-1029
Cancer
MK-3475
Keytruda
PMBCL (Primary Mediastinal
Large B-Cell Lymphoma)
Advanced Solid Tumors
Nasopharyngeal
Ovarian
Prostate
MK-2206
Cough, including cough with IPF
MK-7264
Diabetes Mellitus
MK-8521
Hepatitis C
MK-3682B (MK-3682 (uprifosbuvir)/MK-5172 (grazoprevir)/MK-8408 (ruzasvir))
Pneumoconjugate Vaccine
V114
|
Alzheimer’s Disease
MK-8931 (verubecestat) (December 2013)
Atherosclerosis
MK-0859 (anacetrapib) (May 2008)
Bacterial Infection
MK-7655A (relebactam+imipenem/cilastatin)
(October 2015)
Cancer
MK-3475
Keytruda
Bladder (October 2014) (EU)
Breast (October 2015)
Colorectal (November 2015)
Esophageal (December 2015)
Gastric (May 2015)
Head and Neck (November 2014) (EU)
Hepatocellular (May 2016)
Hodgkin Lymphoma (July 2016) (EU)
Multiple Myeloma (December 2015)
Renal (October 2016)
CMV Prophylaxis in Transplant Patients
MK-8228 (letermovir) (June 2014)
Diabetes Mellitus
MK-8835 (ertugliflozin) (November 2013)
(U.S.)
(1)
MK-8835A (ertugliflozin+sitagliptin)
(September 2015) (U.S.)
(
1)
MK-8835B (ertugliflozin+metformin)
(August 2015) (U.S.)
(1)
MK-0431J (sitagliptin+ipragliflozin)
(October 2015) (Japan)
(1)
Ebola Vaccine
V920 (March 2015)
Heart Failure
MK-1242 (vericiguat) (September 2016)
(1)
Herpes Zoster
V212 (inactivated VZV vaccine) (December 2010)
HIV
MK-1439 (doravirine) (December 2014)
|
New Molecular Entities/Vaccines
Allergy
MK-8237, House Dust Mite (U.S.)
(2)
Diabetes Mellitus
MK-1293 (U.S.)
(1)
MK-8835 (ertugliflozin) (EU)
(1)
MK-8835A (ertugliflozin+sitagliptin) (EU)
(
1)
MK-8835B (ertugliflozin+metformin) (EU)
(1)
Pediatric Hexavalent Combination Vaccine
V419 (U.S.)
(3)
Certain Supplemental Filings
Cancer
Keytruda
• Previously Treated Microsatellite Instability-High Cancer (U.S.)
• Relapsed or Refractory Classical Hodgkin Lymphoma (U.S.)
• Combination with Chemotherapy in first-line non-squamous Non-Small-Cell Lung Cancer (U.S.)
• First Line Cis-ineligible Bladder Cancer (U.S.)
• Second Line Metastatic Bladder Cancer (U.S.)
|
|
Footnotes:
(1)
Being developed in a collaboration.
(2)
MK-8237 was being developed as part of a North America partnership with ALK-Abelló. Merck has given ALK-Abelló six months’ notice that it is terminating the agreement and, therefore, this compound will be returned to ALK-Abelló.
(3)
V419 is an investigational pediatric hexavalent combination vaccine, DTaP5-IPV-Hib-HepB, that is being developed and, if approved, will be commercialized through a partnership of Merck and Sanofi. On November 2, 2015, the FDA issued a CRL with respect to V419. Both companies are reviewing the CRL and plan to have further communication with the FDA.
|
||
Employees
As of December 31, 2016, the Company had approximately 68,000 employees worldwide, with approximately 26,500 employed in the United States, including Puerto Rico. Approximately 29% of worldwide employees of the Company are represented by various collective bargaining groups.
Restructuring Activities
The Company incurs substantial costs for restructuring program activities related to Merck’s productivity and cost reduction initiatives, as well as in connection with the integration of certain acquired businesses. In 2010 and 2013, the Company commenced actions under global restructuring programs designed to streamline its cost structure. The actions under these programs include the elimination of positions in sales, administrative and headquarters organizations, as well as the sale or closure of certain manufacturing and research and development sites and the consolidation of office facilities. The Company also continues to reduce its global real estate footprint and improve the efficiency of its manufacturing and supply network. The non-facility related restructuring actions under these programs are substantially complete; the remaining activities primarily relate to ongoing facility rationalizations. Since inception of the programs through December 31, 2016, Merck has eliminated approximately
40,900
positions comprised of
16
employee separations, as well as the elimination of contractors and vacant positions. The Company expects to substantially complete the remaining actions under these programs by the end of 2017.
Environmental Matters
The Company believes that there are no compliance issues associated with applicable environmental laws and regulations that would have a material adverse effect on the Company. The Company is also remediating environmental contamination resulting from past industrial activity at certain of its sites. Expenditures for remediation and environmental liabilities were
$11 million
in
2016
, and are estimated at
$44 million
in the aggregate for the years
2017
through
2021
. These amounts do not consider potential recoveries from other parties. The Company has taken an active role in identifying and accruing for these costs and, in management’s opinion, the liabilities for all environmental matters that are probable and reasonably estimable have been accrued and totaled
$83 million
and
$109 million
at
December 31, 2016
and
2015
, respectively. Although it is not possible to predict with certainty the outcome of these matters, or the ultimate costs of remediation, management does not believe that any reasonably possible expenditures that may be incurred in excess of the liabilities accrued should exceed
$64 million
in the aggregate. Management also does not believe that these expenditures should have a material adverse effect on the Company’s financial position, results of operations, liquidity or capital resources for any year.
Merck believes that climate change could present risks to its business. Some of the potential impacts of climate change to its business include increased operating costs due to additional regulatory requirements, physical risks to the Company’s facilities, water limitations and disruptions to its supply chain. These potential risks are integrated into the Company’s business planning including investment in reducing energy, water use and greenhouse gas emissions. The Company does not believe these risks are material to its business at this time.
Geographic Area Information
The Company’s operations outside the United States are conducted primarily through subsidiaries. Sales worldwide by subsidiaries outside the United States as a percentage of total Company sales were 54% of sales in 2016, 56% of sales in 2015 and 60% of sales in 2014.
The Company’s worldwide business is subject to risks of currency fluctuations, governmental actions and other governmental proceedings abroad. The Company does not regard these risks as a deterrent to further expansion of its operations abroad. However, the Company closely reviews its methods of operations and adopts strategies responsive to changing economic and political conditions.
Merck has operations in countries located in Latin America, the Middle East, Africa, Eastern Europe and Asia Pacific. Business in these developing areas, while sometimes less stable, offers important opportunities for growth over time.
Financial information about geographic areas of the Company’s business is provided in Item 8. “Financial Statements and Supplementary Data” below.
Available Information
The Company’s Internet website address is
www.merck.com
.
The Company will make available, free of charge at the “Investors” portion of its website, its Annual Report on Form 10-K, Quarterly Reports on Form 10-Q, Current Reports on Form 8-K, and all amendments to those reports filed or furnished pursuant to Section 13(a) or 15(d) of the Securities Exchange Act of 1934, as amended, as soon as reasonably practicable after such reports are electronically filed with, or furnished to, the U.S. Securities and Exchange Commission (SEC). In addition, the Company will provide without charge a copy of its Annual Report on Form 10-K, including financial statements and schedules, upon the written request of any shareholder to Merck Shareholder Services, Merck & Co., Inc., 2000 Galloping Hill Road, K1-3049, Kenilworth, NJ 07033 U.S.A.
The Company’s corporate governance guidelines and the charters of the Board of Directors’ four standing committees are available on the Company’s website at
www.merck.com/about/leadership
and all such information is available in print to any stockholder who requests it from the Company.
17
|
Item 1A.
|
Risk Factors.
|
Investors should carefully consider all of the information set forth in this Form 10-K, including the following risk factors, before deciding to invest in any of the Company’s securities. The risks below are not the only ones the Company faces. Additional risks not currently known to the Company or that the Company presently deems immaterial may also impair its business operations. The Company’s business, financial condition, results of operations or prospects could be materially adversely affected by any of these risks. This Form 10-K also contains forward-looking statements that involve risks and uncertainties. The Company’s results could materially differ from those anticipated in these forward-looking statements as a result of certain factors, including the risks it faces described below and elsewhere. See “Cautionary Factors that May Affect Future Results” below.
The Company is dependent on its patent rights, and if its patent rights are invalidated or circumvented, its business would be adversely affected.
Patent protection is considered, in the aggregate, to be of material importance to the Company’s marketing of human health products in the United States and in most major foreign markets. Patents covering products that it has introduced normally provide market exclusivity, which is important for the successful marketing and sale of its products. The Company seeks patents covering each of its products in each of the markets where it intends to sell the products and where meaningful patent protection is available.
Even if the Company succeeds in obtaining patents covering its products, third parties or government authorities may challenge or seek to invalidate or circumvent its patents and patent applications. It is important for the Company’s business to defend successfully the patent rights that provide market exclusivity for its products. The Company is often involved in patent disputes relating to challenges to its patents or claims by third parties of infringement against the Company. The Company defends its patents both within and outside the United States, including by filing claims of infringement against other parties. See Item 8. “Financial Statements and Supplementary Data,” Note 10. “Contingencies and Environmental Liabilities” below. In particular, manufacturers of generic pharmaceutical products from time to time file Abbreviated NDAs with the FDA seeking to market generic forms of the Company’s products prior to the expiration of relevant patents owned or licensed by the Company. The Company normally responds by defending its patent, including by filing lawsuits alleging patent infringement. Patent litigation and other challenges to the Company’s patents are costly and unpredictable and may deprive the Company of market exclusivity for a patented product or, in some cases, third-party patents may prevent the Company from marketing and selling a product in a particular geographic area.
Additionally, certain foreign governments have indicated that compulsory licenses to patents may be granted in the case of national emergencies or in other circumstances, which could diminish or eliminate sales and profits from those regions and negatively affect the Company’s results of operations. Further, court decisions relating to other companies’ patents, potential legislation relating to patents, as well as regulatory initiatives may result in a more general weakening of intellectual property protection.
If one or more important products lose patent protection in profitable markets, sales of those products are likely to decline significantly as a result of generic versions of those products becoming available and, in the case of certain products, such a loss could result in a material non-cash impairment charge. The Company’s results of operations may be adversely affected by the lost sales unless and until the Company has successfully launched commercially successful replacement products.
A chart listing the patent protection for certain of the Company’s marketed products, and U.S. patent protection for candidates under review and Phase 3 candidates is set forth above in Item 1. “Business — Patents, Trademarks and Licenses.”
As the Company’s products lose market exclusivity, the Company generally experiences a significant and rapid loss of sales from those products.
The Company depends upon patents to provide it with exclusive marketing rights for its products for some period of time. Loss of patent protection for one of the Company’s products typically leads to a significant and rapid loss of sales for that product, as lower priced generic versions of that drug become available. In the case of products that contribute significantly to the Company’s sales, the loss of market exclusivity can have a material adverse effect on the Company’s business, cash flow, results of operations, financial position and prospects. For example, pursuant
18
to an agreement with a generic manufacturer, that manufacturer launched in the United States a generic version of
Zetia
in December 2016. In addition, the Company will lose U.S. patent protection for
Vytorin
in April 2017. The Company expects a significant and rapid loss of sales of
Zetia
and
Vytorin
in the United States in 2017.
Key products generate a significant amount of the Company’s profits and cash flows, and any events that adversely affect the markets for its leading products could have a material and negative impact on results of operations and cash flows.
The Company’s ability to generate profits and operating cash flow depends largely upon the continued profitability of the Company’s key products, such as
Januvia
,
Janumet
,
Keytruda
,
Gardasil/Gardasil
9,
Isentress
and
Zepatier
. As a result of the Company’s dependence on key products, any event that adversely affects any of these products or the markets for any of these products could have a significant adverse impact on results of operations and cash flows. These events could include loss of patent protection, increased costs associated with manufacturing, generic or over-the-counter availability of the Company’s product or a competitive product, the discovery of previously unknown side effects, results of post-approval trials, increased competition from the introduction of new, more effective treatments and discontinuation or removal from the market of the product for any reason. Such events could have a material adverse effect on the sales of any such products.
The Company’s research and development efforts may not succeed in developing commercially successful products and the Company may not be able to acquire commercially successful products in other ways; in consequence, the Company may not be able to replace sales of successful products that have lost patent protection.
Like other major pharmaceutical companies, in order to remain competitive, the Company must continue to launch new products each year. Expected declines in sales of products after the loss of market exclusivity mean that the Company’s future success is dependent on its pipeline of new products, including new products which it may develop through joint ventures and products which it is able to obtain through license or acquisition. To accomplish this, the Company commits substantial effort, funds and other resources to research and development, both through its own dedicated resources and through various collaborations with third parties. There is a high rate of failure inherent in the research and development process for new drugs. As a result, there is a high risk that funds invested by the Company in research programs will not generate financial returns. This risk profile is compounded by the fact that this research has a long investment cycle. To bring a pharmaceutical compound from the discovery phase to market may take a decade or more and failure can occur at any point in the process, including later in the process after significant funds have been invested.
For a description of the research and development process, see Item 1. “Business — Research and Development” above. Each phase of testing is highly regulated and during each phase there is a substantial risk that the Company will encounter serious obstacles or will not achieve its goals, therefore, the Company may abandon a product in which it has invested substantial amounts of time and resources. Some of the risks encountered in the research and development process include the following: pre-clinical testing of a new compound may yield disappointing results; competing products from other manufacturers may reach the market first; clinical trials of a new drug may not be successful; a new drug may not be effective or may have harmful side effects; a new drug may not be approved by the regulators for its intended use; it may not be possible to obtain a patent for a new drug; payers may refuse to cover or reimburse the new product; or sales of a new product may be disappointing.
The Company cannot state with certainty when or whether any of its products now under development will be approved or launched; whether it will be able to develop, license or otherwise acquire compounds, product candidates or products; or whether any products, once launched, will be commercially successful. The Company must maintain a continuous flow of successful new products and successful new indications or brand extensions for existing products sufficient both to cover its substantial research and development costs and to replace sales that are lost as profitable products lose market exclusivity or are displaced by competing products or therapies. Failure to do so in the short term or long term would have a material adverse effect on the Company’s business, results of operations, cash flow, financial position and prospects.
19
The Company’s success is dependent on the successful development and marketing of new products, which are subject to substantial risks.
Products that appear promising in development may fail to reach the market or fail to succeed for numerous reasons, including the following:
|
•
|
findings of ineffectiveness, superior safety or efficacy of competing products, or harmful side effects in clinical or pre-clinical testing;
|
|
•
|
failure to receive the necessary regulatory approvals, including delays in the approval of new products and new indications, and uncertainties about the time required to obtain regulatory approvals and the benefit/risk standards applied by regulatory agencies in determining whether to grant approvals;
|
|
•
|
failure in certain markets to obtain reimbursement commensurate with the level of innovation and clinical benefit presented by the product;
|
|
•
|
lack of economic feasibility due to manufacturing costs or other factors; and
|
|
•
|
preclusion from commercialization by the proprietary rights of others.
|
In the future, if certain pipeline programs are cancelled or if the Company believes that their commercial prospects have been reduced, the Company may recognize material non-cash impairment charges for those programs that were measured at fair value and capitalized in connection with acquisitions.
Failure to successfully develop and market new products in the short term or long term would have a material adverse effect on the Company’s business, results of operations, cash flow, financial position and prospects.
The Company’s products, including products in development, cannot be marketed unless the Company obtains and maintains regulatory approval.
The Company’s activities, including research, preclinical testing, clinical trials and manufacturing and marketing its products, are subject to extensive regulation by numerous federal, state and local governmental authorities in the United States, including the FDA, and by foreign regulatory authorities, including in the EU. In the United States, the FDA is of particular importance to the Company, as it administers requirements covering the testing, approval, safety, effectiveness, manufacturing, labeling and marketing of prescription pharmaceuticals. In many cases, the FDA requirements have increased the amount of time and money necessary to develop new products and bring them to market in the United States. Regulation outside the United States also is primarily focused on drug safety and effectiveness and, in many cases, cost reduction. The FDA and foreign regulatory authorities have substantial discretion to require additional testing, to delay or withhold registration and marketing approval and to otherwise preclude distribution and sale of a product.
Even if the Company is successful in developing new products, it will not be able to market any of those products unless and until it has obtained all required regulatory approvals in each jurisdiction where it proposes to market the new products. Once obtained, the Company must maintain approval as long as it plans to market its new products in each jurisdiction where approval is required. The Company’s failure to obtain approval, significant delays in the approval process, or its failure to maintain approval in any jurisdiction will prevent it from selling the new products in that jurisdiction until approval is obtained, if ever. The Company would not be able to realize revenues for those new products in any jurisdiction where it does not have approval.
Developments following regulatory approval may adversely affect sales of the Company’s products.
Even after a product reaches market, certain developments following regulatory approval, including results in post-approval Phase 4 trials or other studies, may decrease demand for the Company’s products, including the following:
|
•
|
the re-review of products that are already marketed;
|
|
•
|
the recall or loss of marketing approval of products that are already marketed;
|
20
|
•
|
changing government standards or public expectations regarding safety, efficacy or labeling changes; and
|
|
•
|
greater scrutiny in advertising and promotion.
|
In the past several years, clinical trials and post-marketing surveillance of certain marketed drugs of the Company and of competitors within the industry have raised concerns that have led to recalls, withdrawals or adverse labeling of marketed products. Clinical trials and post-marketing surveillance of certain marketed drugs also have raised concerns among some prescribers and patients relating to the safety or efficacy of pharmaceutical products in general that have negatively affected the sales of such products. In addition, increased scrutiny of the outcomes of clinical trials has led to increased volatility in market reaction. Further, these matters often attract litigation and, even where the basis for the litigation is groundless, considerable resources may be needed to respond.
In addition, following the wake of product withdrawals and other significant safety issues, health authorities such as the FDA, the EMA and Japan’s Pharmaceutical and Medical Device Agency have increased their focus on safety when assessing the benefit/risk balance of drugs. Some health authorities appear to have become more cautious when making decisions about approvability of new products or indications and are re-reviewing select products that are already marketed, adding further to the uncertainties in the regulatory processes. There is also greater regulatory scrutiny, especially in the United States, on advertising and promotion and, in particular, direct-to-consumer advertising.
If previously unknown side effects are discovered or if there is an increase in negative publicity regarding known side effects of any of the Company’s products, it could significantly reduce demand for the product or require the Company to take actions that could negatively affect sales, including removing the product from the market, restricting its distribution or applying for labeling changes. Further, in the current environment in which all pharmaceutical companies operate, the Company is at risk for product liability and consumer protection claims and civil and criminal governmental actions related to its products, research and/or marketing activities.
The Company faces intense competition from lower cost-generic products.
In general, the Company faces increasing competition from lower-cost generic products. The patent rights that protect its products are of varying strengths and durations. In addition, in some countries, patent protection is significantly weaker than in the United States or in the EU. In the United States and the EU, political pressure to reduce spending on prescription drugs has led to legislation and other measures which encourages the use of generic and biosimilar products. Although it is the Company’s policy to actively protect its patent rights, generic challenges to the Company’s products can arise at any time, and the Company’s patents may not prevent the emergence of generic competition for its products.
Loss of patent protection for a product typically is followed promptly by generic substitutes, reducing the Company’s sales of that product. Availability of generic substitutes for the Company’s drugs may adversely affect its results of operations and cash flow. In addition, proposals emerge from time to time in the United States and other countries for legislation to further encourage the early and rapid approval of generic drugs. Any such proposal that is enacted into law could worsen this substantial negative effect on the Company’s sales and, potentially, its business, cash flow, results of operations, financial position and prospects.
The Company faces intense competition from competitors’ products which, in addition to other factors, could in certain circumstances lead to non-cash impairment charges.
The Company’s products face intense competition from competitors’ products. This competition may increase as new products enter the market. In such an event, the competitors’ products may be safer or more effective, more convenient to use or more effectively marketed and sold than the Company’s products. Alternatively, in the case of generic competition, including the generic availability of competitors’ branded products, they may be equally safe and effective products that are sold at a substantially lower price than the Company’s products. As a result, if the Company fails to maintain its competitive position, this could have a material adverse effect on its business, cash flow, results of operations, financial position and prospects. In addition, if products that were measured at fair value and capitalized in connection with acquisitions experience difficulties in the market that negatively impact product cash flows, the Company may recognize material non-cash impairment charges with respect to the value of those products.
21
The Company faces pricing pressure with respect to its products.
The Company faces increasing pricing pressure globally and, particularly in mature markets, from managed care organizations, government agencies and programs that could negatively affect the Company’s sales and profit margins. In the United States, these include (i) practices of managed care groups and institutional and governmental purchasers, (ii) U.S. federal laws and regulations related to Medicare and Medicaid, including the Medicare Prescription Drug Improvement and Modernization Act of 2003 and the ACA, and (iii) state activities aimed at increasing price transparency. Changes to the health care system enacted as part of health care reform in the United States, as well as increased purchasing power of entities that negotiate on behalf of Medicare, Medicaid, and private sector beneficiaries, could result in further pricing pressures. In addition, in the U.S., larger customers may, in the future, ask for and receive higher rebates on drugs in certain highly competitive categories. The Company must also compete to be placed on formularies of managed care organizations. Exclusion of a product from a formulary can lead to reduced usage in the managed care organization.
In order to provide information about the Company’s pricing practices, the Company recently posted on its website its first Pricing Action Transparency Report for the United States for the years 2010 - 2016. The report provides the Company’s average annual list price and net price increases across the Company’s U.S. portfolio dating back to 2010. The report shows that the Company’s average annual net price increases (after taking sales deductions such as rebates, discounts and returns into account) across the U.S. human health portfolio have been in the low to mid-single digits since 2010. Additionally, the weighted average annual discount rate has been steadily increasing over time, reflecting the competitive market for branded medicines and the impact of the ACA. In 2016, the Company’s gross U.S. sales were reduced by 40.9% as a result of rebates, discounts and returns.
Outside the United States, numerous major markets, including the EU and Japan, have pervasive government involvement in funding health care and, in that regard, fix the pricing and reimbursement of pharmaceutical and vaccine products. Consequently, in those markets, the Company is subject to government decision making and budgetary actions with respect to its products.
The Company expects pricing pressures to increase in the future.
The health care industry in the United States will continue to be subject to increasing regulation and political action.
The Company believes that the health care industry will continue to be subject to increasing regulation as well as political and legal action, as future proposals to reform the health care system are considered by Congress and state legislatures.
In 2010, the United States enacted major health care reform legislation in the form of the ACA. Various insurance market reforms have advanced and state and federal insurance exchanges were launched in 2014. With respect to the effect of the law on the pharmaceutical industry, the law increased the mandated Medicaid rebate from 15.1% to 23.1%, expanded the rebate to Medicaid managed care utilization, and increased the types of entities eligible for the federal 340B drug discount program.
The law also requires pharmaceutical manufacturers to pay a 50% point of service discount to Medicare Part D beneficiaries when they are in the Medicare Part D coverage gap (i.e., the so-called “donut hole”). Also, pharmaceutical manufacturers are now required to pay an annual non-tax deductible health care reform fee. The total annual industry fee was $3.0 billion in 2016 and will increase to $4.0 billion in 2017. The fee is assessed on each company in proportion to its share of prior year branded pharmaceutical sales to certain government programs, such as Medicare and Medicaid.
On January 21, 2016, the Centers for Medicare & Medicaid Services (CMS) issued the Medicaid rebate final rule that implements provisions of the ACA effective April 1, 2016. The rule provides comprehensive guidance on the calculation of Average Manufacturer Price and Best Price; two metrics utilized to determine the rebates drug manufacturers are required to pay to state Medicaid programs. The impact of changes resulting from the issuance of the rule is not material to Merck, at this time. However, the Company is still awaiting guidance from CMS on two aspects of the rule that were deferred for later implementation. These include a definition of what constitutes a product ‘line extension’ and a delay in the participation of the U.S. Territories in the Medicaid Drug Rebate Program until April 1, 2020. The Company will evaluate the financial impact of these two elements when they become effective.
22
The Company cannot predict the likelihood of future changes in the health care industry in general, or the pharmaceutical industry in particular, or what impact they may have on the Company’s results of operations, financial condition or business.
Changes in laws and regulations could materially adversely affect the Company’s business.
All aspects of the Company’s business, including research and development, manufacturing, marketing, pricing, sales, litigation and intellectual property rights, are subject to extensive legislation and regulation. Changes in applicable federal and state laws and agency regulations could have a material adverse effect on the Company’s business.
In particular, there is significant uncertainty about the future of the ACA and healthcare laws in general in the United States. The Company is participating in the debate and monitoring how any proposed changes could affect its business. The Company is unable to predict the likelihood of changes to the ACA. Depending on the nature of any repeal and replacement of the ACA, such actions could have a material adverse effect on the Company’s results of operations, financial condition or business.
The uncertainty in global economic conditions together with austerity measures being taken by certain governments could negatively affect the Company’s operating results.
The uncertainty in global economic conditions may result in a further slowdown to the global economy that could affect the Company’s business by reducing the prices that drug wholesalers and retailers, hospitals, government agencies and managed health care providers may be able or willing to pay for the Company’s products or by reducing the demand for the Company’s products, which could in turn negatively impact the Company’s sales and result in a material adverse effect on the Company’s business, cash flow, results of operations, financial position and prospects.
Global efforts toward health care cost containment continue to exert pressure on product pricing and market access. In many international markets, government-mandated pricing actions have reduced prices of generic and patented drugs. In addition, other austerity measures negatively affected the Company’s revenue performance in 2016. The Company anticipates these pricing actions and other austerity measures will continue to negatively affect revenue performance in 2017.
If credit and economic conditions worsen, the resulting economic and currency impacts in the affected markets and globally could have a material adverse effect on the Company’s results.
The Company has significant global operations, which expose it to additional risks, and any adverse event could have a material negative impact on the Company’s results of operations.
The extent of the Company’s operations outside the United States is significant. Risks inherent in conducting a global business include:
|
•
|
changes in medical reimbursement policies and programs and pricing restrictions in key markets;
|
|
•
|
multiple regulatory requirements that could restrict the Company’s ability to manufacture and sell its products in key markets;
|
|
•
|
trade protection measures and import or export licensing requirements;
|
|
•
|
foreign exchange fluctuations;
|
|
•
|
diminished protection of intellectual property in some countries; and
|
|
•
|
possible nationalization and expropriation.
|
In addition, there may be changes to the Company’s business and political position if there is instability, disruption or destruction in a significant geographic region, regardless of cause, including war, terrorism, riot, civil insurrection or social unrest; and natural or man-made disasters, including famine, flood, fire, earthquake, storm or disease.
23
Failure to attract and retain highly qualified personnel could affect its ability to successfully develop and commercialize products.
The Company’s success is largely dependent on its continued ability to attract and retain highly qualified scientific, technical and management personnel, as well as personnel with expertise in clinical research and development, governmental regulation and commercialization. Competition for qualified personnel in the pharmaceutical industry is intense. The Company cannot be sure that it will be able to attract and retain quality personnel or that the costs of doing so will not materially increase.
In the past, the Company has experienced difficulties and delays in manufacturing of certain of its products.
Merck has, in the past, experienced difficulties in manufacturing certain of its vaccines and other products. The Company may, in the future, experience difficulties and delays inherent in manufacturing its products, such as (i) failure of the Company or any of its vendors or suppliers to comply with Current Good Manufacturing Practices and other applicable regulations and quality assurance guidelines that could lead to manufacturing shutdowns, product shortages and delays in product manufacturing; (ii) construction delays related to the construction of new facilities or the expansion of existing facilities, including those intended to support future demand for the Company’s products; and (iii) other manufacturing or distribution problems including changes in manufacturing production sites and limits to manufacturing capacity due to regulatory requirements, changes in types of products produced, or physical limitations that could impact continuous supply. Manufacturing difficulties can result in product shortages, leading to lost sales and reputational harm to the Company.
The Company may not be able to realize the expected benefits of its investments in emerging markets.
The Company has been taking steps to increase its sales in emerging markets. However, there is no guarantee that the Company’s efforts to expand sales in these markets will succeed. Some countries within emerging markets may be especially vulnerable to periods of global financial instability or may have very limited resources to spend on health care. In order for the Company to successfully implement its emerging markets strategy, it must attract and retain qualified personnel. The Company may also be required to increase its reliance on third-party agents within less developed markets. In addition, many of these countries have currencies that fluctuate substantially and if such currencies devalue and the Company cannot offset the devaluations, the Company’s financial performance within such countries could be adversely affected.
In addition, in China, commercial and economic conditions may adversely affect the Company’s growth prospects in that market. While the Company continues to believe that China represents an important growth opportunity, these events, coupled with heightened scrutiny of the health care industry, may continue to have an impact on product pricing and market access generally. The Company anticipates that the reported inquiries made by various governmental authorities involving multinational pharmaceutical companies in China may continue.
For all these reasons, sales within emerging markets carry significant risks. However, a failure to maintain the Company’s presence in emerging markets could have a material adverse effect on the business, financial condition or results of the Company’s operations.
The Company is exposed to market risk from fluctuations in currency exchange rates and interest rates.
The Company operates in multiple jurisdictions and virtually all sales are denominated in currencies of the local jurisdiction. Additionally, the Company has entered and will enter into acquisition, licensing, borrowings or other financial transactions that may give rise to currency and interest rate exposure.
Since the Company cannot, with certainty, foresee and mitigate against such adverse fluctuations, fluctuations in currency exchange rates and interest rates could negatively affect the Company’s results of operations, financial position and cash flows as occurred with respect to Venezuela in 2015 and 2016.
In order to mitigate against the adverse impact of these market fluctuations, the Company will from time to time enter into hedging agreements. While hedging agreements, such as currency options and forwards and interest rate swaps, may limit some of the exposure to exchange rate and interest rate fluctuations, such attempts to mitigate these risks may be costly and not always successful.
24
The Company is subject to evolving and complex tax laws, which may result in additional liabilities that may affect results of operations.
The Company is subject to evolving and complex tax laws in the jurisdictions in which it operates. Significant judgment is required for determining the Company’s tax liabilities, and the Company’s tax returns are periodically examined by various tax authorities. The Company believes that its accrual for tax contingencies is adequate for all open years based on past experience, interpretations of tax law, and judgments about potential actions by tax authorities; however, due to the complexity of tax contingencies, the ultimate resolution of any tax matters may result in payments greater or less than amounts accrued.
In addition, the Company may be affected by changes in tax laws, including tax rate changes, changes to the laws related to the remittance of foreign earnings (deferral), or other limitations impacting the U.S. tax treatment of foreign earnings, new tax laws, and revised tax law interpretations in domestic and foreign jurisdictions.
Pharmaceutical products can develop unexpected safety or efficacy concerns.
Unexpected safety or efficacy concerns can arise with respect to marketed products, whether or not scientifically justified, leading to product recalls, withdrawals, or declining sales, as well as product liability, consumer fraud and/or other claims, including potential civil or criminal governmental actions.
Reliance on third party relationships and outsourcing arrangements could adversely affect the Company’s business.
The Company depends on third parties, including suppliers, alliances with other pharmaceutical and biotechnology companies, and third party service providers, for key aspects of its business including development, manufacture and commercialization of its products and support for its information technology systems. Failure of these third parties to meet their contractual, regulatory and other obligations to the Company or the development of factors that materially disrupt the relationships between the Company and these third parties could have a material adverse effect on the Company’s business.
The Company is increasingly dependent on sophisticated software applications and computing infrastructure.
The Company is increasingly dependent on sophisticated software applications and computing infrastructure to conduct critical operations. Disruption, degradation, or manipulation of these applications and systems through intentional or accidental means could impact key business processes. Cyber-attacks against the Company’s applications and systems could result in exposure of confidential information, the modification of critical data, and/or the failure of critical operations. Misuse of these applications and systems could result in the disclosure of sensitive personal information or the theft of trade secrets and other confidential business information. The Company continues to leverage new and innovative technologies across the enterprise to improve the efficacy and efficiency of its business processes; the use of which can create new risks. Although the aggregate impact on the Company’s operations and financial condition has not been material to date, the Company has been the target of events of this nature and expects them to continue. The Company monitors its data, information technology and personnel usage of Company systems to reduce these risks and continues to do so on an ongoing basis for any current or potential threats. There can be no assurance that the Company’s efforts to protect its data and systems will prevent service interruption or the loss of critical or sensitive information from the Company’s or the Company’s third party providers’ databases or systems that could result in financial, legal, business or reputational harm to the Company.
Negative events in the animal health industry could have a negative impact on future results of operations.
Future sales of key animal health products could be adversely affected by a number of risk factors including certain risks that are specific to the animal health business. For example, the outbreak of disease carried by animals, such as Bovine Spongiform Encephalopathy or mad cow disease, could lead to their widespread death and precautionary destruction as well as the reduced consumption and demand for animals, which could adversely impact the Company’s results of operations. Also, the outbreak of any highly contagious diseases near the Company’s main production sites could require the Company to immediately halt production of vaccines at such sites or force the Company to incur substantial expenses in procuring raw materials or vaccines elsewhere. Other risks specific to animal health include
25
epidemics and pandemics, government procurement and pricing practices, weather and global agribusiness economic events. As the Animal Health segment of the Company’s business becomes more significant, the impact of any such events on future results of operations would also become more significant.
Biologics carry unique risks and uncertainties, which could have a negative impact on future results of operations.
The successful development, testing, manufacturing and commercialization of biologics, particularly human and animal health vaccines, is a long, expensive and uncertain process. There are unique risks and uncertainties with biologics, including:
|
•
|
There may be limited access to, and supply of, normal and diseased tissue samples, cell lines, pathogens, bacteria, viral strains and other biological materials. In addition, government regulations in multiple jurisdictions, such as the United States and the EU, could result in restricted access to, or transport or use of, such materials. If the Company loses access to sufficient sources of such materials, or if tighter restrictions are imposed on the use of such materials, the Company may not be able to conduct research activities as planned and may incur additional development costs.
|
|
•
|
The development, manufacturing and marketing of biologics are subject to regulation by the FDA, the EMA and other regulatory bodies. These regulations are often more complex and extensive than the regulations applicable to other pharmaceutical products. For example, in the United States, a BLA, including both preclinical and clinical trial data and extensive data regarding the manufacturing procedures, is required for human vaccine candidates, and FDA approval is required for the release of each manufactured commercial lot.
|
|
•
|
Manufacturing biologics, especially in large quantities, is often complex and may require the use of innovative technologies to handle living micro-organisms. Each lot of an approved biologic must undergo thorough testing for identity, strength, quality, purity and potency. Manufacturing biologics requires facilities specifically designed for and validated for this purpose, and sophisticated quality assurance and quality control procedures are necessary. Slight deviations anywhere in the manufacturing process, including filling, labeling, packaging, storage and shipping and quality control and testing, may result in lot failures, product recalls or spoilage. When changes are made to the manufacturing process, the Company may be required to provide pre-clinical and clinical data showing the comparable identity, strength, quality, purity or potency of the products before and after such changes.
|
|
•
|
Biologics are frequently costly to manufacture because production ingredients are derived from living animal or plant material, and most biologics cannot be made synthetically. In particular, keeping up with the demand for vaccines may be difficult due to the complexity of producing vaccines.
|
|
•
|
The use of biologically derived ingredients can lead to allegations of harm, including infections or allergic reactions, or closure of product facilities due to possible contamination. Any of these events could result in substantial costs.
|
Product liability insurance for products may be limited, cost prohibitive or unavailable.
As a result of a number of factors, product liability insurance has become less available while the cost has increased significantly. With respect to product liability, the Company self-insures substantially all of its risk, as the availability of commercial insurance has become more restrictive. The Company has evaluated its risks and has determined that the cost of obtaining product liability insurance outweighs the likely benefits of the coverage that is available and, as such, has no insurance for certain product liabilities effective August 1, 2004, including liability for legacy Merck products first sold after that date. The Company will continually assess the most efficient means to address its risk; however, there can be no guarantee that insurance coverage will be obtained or, if obtained, will be sufficient to fully cover product liabilities that may arise.
Social media platforms present risks and challenges.
The inappropriate and/or unauthorized use of certain media vehicles could cause brand damage or information leakage or could lead to legal implications, including from the improper collection and/or dissemination of personally identifiable information. In addition, negative or inaccurate posts or comments about the Company on
26
any social networking web site could damage the Company’s reputation, brand image and goodwill. Further, the disclosure of non-public Company-sensitive information by the Company’s workforce or others through external media channels could lead to information loss. Although there is an internal Company Social Media Policy that guides employees on appropriate personal and professional use of social media about the Company, the processes in place may not completely secure and protect information. Identifying new points of entry as social media continues to expand also presents new challenges.
Cautionary Factors that May Affect Future Results
(Cautionary Statements Under the Private Securities Litigation Reform Act of 1995)
This report and other written reports and oral statements made from time to time by the Company may contain so-called “forward-looking statements,” all of which are based on management’s current expectations and are subject to risks and uncertainties which may cause results to differ materially from those set forth in the statements. One can identify these forward-looking statements by their use of words such as “anticipates,” “expects,” “plans,” “will,” “estimates,” “forecasts,” “projects” and other words of similar meaning. One can also identify them by the fact that they do not relate strictly to historical or current facts. These statements are likely to address the Company’s growth strategy, financial results, product development, product approvals, product potential, and development programs. One must carefully consider any such statement and should understand that many factors could cause actual results to differ materially from the Company’s forward-looking statements. These factors include inaccurate assumptions and a broad variety of other risks and uncertainties, including some that are known and some that are not. No forward-looking statement can be guaranteed and actual future results may vary materially. The Company does not assume the obligation to update any forward-looking statement. The Company cautions you not to place undue reliance on these forward-looking statements. Although it is not possible to predict or identify all such factors, they may include the following:
•
Competition from generic and/or biosimilar products as the Company’s products lose patent protection.
•
Increased “brand” competition in therapeutic areas important to the Company’s long-term business performance.
•
The difficulties and uncertainties inherent in new product development. The outcome of the lengthy and complex process of new product development is inherently uncertain. A drug candidate can fail at any stage of the process and one or more late-stage product candidates could fail to receive regulatory approval. New product candidates may appear promising in development but fail to reach the market because of efficacy or safety concerns, the inability to obtain necessary regulatory approvals, the difficulty or excessive cost to manufacture and/or the infringement of patents or intellectual property rights of others. Furthermore, the sales of new products may prove to be disappointing and fail to reach anticipated levels.
•
Pricing pressures, both in the United States and abroad, including rules and practices of managed care groups, judicial decisions and governmental laws and regulations related to Medicare, Medicaid and health care reform, pharmaceutical reimbursement and pricing in general.
•
Changes in government laws and regulations, including laws governing intellectual property, and the enforcement thereof affecting the Company’s business.
•
Efficacy or safety concerns with respect to marketed products, whether or not scientifically justified, leading to product recalls, withdrawals or declining sales.
•
Significant changes in customer relationships or changes in the behavior and spending patterns of purchasers of health care products and services, including delaying medical procedures, rationing prescription medications, reducing the frequency of physician visits and foregoing health care insurance coverage.
•
Legal factors, including product liability claims, antitrust litigation and governmental investigations, including tax disputes, environmental concerns and patent disputes with branded and generic competitors, any of which could preclude commercialization of products or negatively affect the profitability of existing products.
•
Lost market opportunity resulting from delays and uncertainties in the approval process of the FDA and foreign regulatory authorities.
27
•
Increased focus on privacy issues in countries around the world, including the United States and the EU. The legislative and regulatory landscape for privacy and data protection continues to evolve, and there has been an increasing amount of focus on privacy and data protection issues with the potential to affect directly the Company’s business, including recently enacted laws in a majority of states in the United States requiring security breach notification.
•
Changes in tax laws including changes related to the taxation of foreign earnings.
•
Changes in accounting pronouncements promulgated by standard-setting or regulatory bodies, including the Financial Accounting Standards Board and the SEC, that are adverse to the Company.
•
Economic factors over which the Company has no control, including changes in inflation, interest rates and foreign currency exchange rates.
This list should not be considered an exhaustive statement of all potential risks and uncertainties. See “Risk Factors” above.
|
Item 1B.
|
Unresolved Staff Comments.
|
None.
|
Item 2.
|
Properties.
|
The Company’s corporate headquarters is located in Kenilworth, New Jersey. The Company’s U.S. commercial operations are headquartered in Upper Gwynedd, Pennsylvania. The Company’s U.S. pharmaceutical business is conducted through divisional headquarters located in Upper Gwynedd, Pennsylvania and Kenilworth, New Jersey. The Company’s vaccines business is conducted through divisional headquarters located in West Point, Pennsylvania. Merck’s Animal Health global headquarters is located in Madison, New Jersey. Principal U.S. research facilities are located in Rahway and Kenilworth, New Jersey, West Point, Pennsylvania, Palo Alto, California, Boston, Massachusetts, and Elkhorn, Nebraska (Animal Health). Principal research facilities outside the United States are located in Switzerland and China. Merck’s manufacturing operations are headquartered in Whitehouse Station, New Jersey. The Company also has production facilities for human health products at nine locations in the United States and Puerto Rico. Outside the United States, through subsidiaries, the Company owns or has an interest in manufacturing plants or other properties in Japan, Singapore, South Africa, and other countries in Western Europe, Central and South America, and Asia.
Capital expenditures were $1.6 billion in
2016
, $1.3 billion in
2015
and $1.3 billion in
2014
. In the United States, these amounted to $1.0 billion in
2016
, $879 million in
2015
and $873 million in
2014
. Abroad, such expenditures amounted to $594 million in
2016
, $404 million in
2015
and $444 million in
2014
.
The Company and its subsidiaries own their principal facilities and manufacturing plants under titles that they consider to be satisfactory. The Company believes that its properties are in good operating condition and that its machinery and equipment have been well maintained. Plants for the manufacture of products are suitable for their intended purposes and have capacities and projected capacities adequate for current and projected needs for existing Company products. Some capacity of the plants is being converted, with any needed modification, to the requirements of newly introduced and future products.
|
Item 3.
|
Legal Proceedings.
|
The information called for by this Item is incorporated herein by reference to Item 8. “Financial Statements and Supplementary Data,” Note 10. “Contingencies and Environmental Liabilities”.
|
Item 4.
|
Mine Safety Disclosures.
|
Not Applicable.
28
Executive Officers of the Registrant (ages as of February 1, 2017)
All officers listed above serve at the pleasure of the Board of Directors. None of these officers was elected pursuant to any arrangement or understanding between the officer and the Board.
|
Name
|
Age
|
Offices and Business Experience
|
|
Kenneth C. Frazier
|
62
|
Chairman, President and Chief Executive Officer (since December 2011); President and Chief Executive Officer (January 2011-December 2011), President (May 2010-January 2011)
|
|
Adele D. Ambrose
|
60
|
Senior Vice President and Chief Communications Officer (since November 2009)
|
|
Sanat Chattopadhyay
|
57
|
Executive Vice President and President, Merck Manufacturing Division (since March 2016); Senior Vice President, Operations, Merck Manufacturing Division (November 2009-March 2016)
|
|
Robert M. Davis
|
50
|
Executive Vice President, Global Services and Chief Financial Officer (since April 2016); Executive Vice President and Chief Financial Officer (April 2014-April 2016); Corporate Vice President and President, Medical Products, Baxter International, Inc. (2010-March 2014)
|
|
Richard R. DeLuca, Jr.
|
54
|
Executive Vice President and President, Merck Animal Health (since September 2011)
|
|
Julie L. Gerberding
|
61
|
Executive Vice President and Chief Patient Officer, Strategic Communications, Global Public Policy and Population Health (since July 2016); Executive Vice President for Strategic Communications, Global Public Policy and Population Health (January 2015-July 2016); President, Merck Vaccines (January 2010-January 2015)
|
|
Mirian M. Graddick-Weir
|
62
|
Executive Vice President, Human Resources (since November 2009)
|
|
Michael J. Holston
|
54
|
Executive Vice President and General Counsel (since July 2015); Executive Vice President and Chief Ethics and Compliance Officer (June 2012-July 2015); Executive Vice President, General Counsel and Board Secretary, Hewlett-Packard Company (2007-December 2011)
|
|
Rita A. Karachun
|
53
|
Senior Vice President Finance - Global Controller (since March 2014); Assistant Controller (November 2009-March 2014)
|
|
Roger M. Perlmutter, M.D., Ph.D.
|
64
|
Executive Vice President and President, Merck Research Laboratories (since April 2013); Executive Vice President, Research and Development, Amgen Inc. (2001-February 2012)
|
|
Adam H. Schechter
|
52
|
Executive Vice President and President, Global Human Health (since May 2010)
|
29
|
Item 5.
|
Market for Registrant’s Common Equity, Related Stockholder Matters and Issuer Purchases of Equity Securities.
|
The principal market for trading of the Company’s Common Stock is the New York Stock Exchange (NYSE) under the symbol MRK. The Common Stock market price information set forth in the table below is based on historical NYSE market prices.
The following table also sets forth, for the calendar periods indicated, the dividend per share information.
|
Cash Dividends Paid per Common Share
|
||||||||||||||||||||
|
Year
|
|
4th Q
|
|
3rd Q
|
|
2nd Q
|
|
1st Q
|
|
|||||||||||
|
2016
|
$
|
1.84
|
|
$
|
0.46
|
|
$
|
0.46
|
|
$
|
0.46
|
|
$
|
0.46
|
|
|||||
|
2015
|
$
|
1.80
|
|
$
|
0.45
|
|
$
|
0.45
|
|
$
|
0.45
|
|
$
|
0.45
|
|
|||||
|
Common Stock Market Prices
|
||||||||||||||||||||
|
2016
|
4th Q
|
|
3rd Q
|
|
2nd Q
|
|
1st Q
|
|
||||||||||||
|
High
|
$
|
65.46
|
|
$
|
64.00
|
|
$
|
57.87
|
|
$
|
53.60
|
|
||||||||
|
Low
|
$
|
58.29
|
|
$
|
57.18
|
|
$
|
52.44
|
|
$
|
47.97
|
|
||||||||
|
2015
|
||||||||||||||||||||
|
High
|
$
|
55.77
|
|
$
|
60.07
|
|
$
|
61.70
|
|
$
|
63.62
|
|
||||||||
|
Low
|
$
|
48.35
|
|
$
|
45.69
|
|
$
|
56.22
|
|
$
|
55.64
|
|
||||||||
As of January 31, 2017, there were approximately 128,600 shareholders of record.
Issuer purchases of equity securities for the three months ended December 31, 2016 were as follows:
Issuer Purchases of Equity Securities
|
($ in millions)
|
||||||
|
Period
|
Total Number
of Shares
Purchased
(1)
|
Average Price
Paid Per
Share
|
Approximate Dollar Value of Shares
That May Yet Be Purchased
Under the Plans or Programs
(1)
|
|||
|
October 1 — October 31
|
5,451,200
|
$62.17
|
$5,732
|
|||
|
November 1 — November 30
|
5,447,800
|
$61.39
|
$5,397
|
|||
|
December 1 — December 31
|
5,618,000
|
$60.96
|
$5,055
|
|||
|
Total
|
16,517,000
|
$61.50
|
$5,055
|
|||
|
(1)
|
All shares purchased during the period were made as part of a plan approved by the Board of Directors in March 2015 to purchase up to $10 billion in Merck shares. Shares are approximated.
|
30
Performance Graph
The following graph assumes a $100 investment on December 31, 2011, and reinvestment of all dividends, in each of the Company’s Common Shares, the S&P 500 Index, and a composite peer group of the major U.S.-based pharmaceutical companies, which are: AbbVie Inc., Bristol-Myers Squibb Company, Johnson & Johnson, Eli Lilly and Company, and Pfizer Inc.
Comparison of Five-Year Cumulative Total Return
Merck & Co., Inc., Composite Peer Group and S&P 500 Index
|
End of
Period Value
|
2016/2011
CAGR**
|
||
|
MERCK
|
$186
|
13%
|
|
|
PEER GRP.**
|
208
|
16%
|
|
|
S&P 500
|
198
|
15%
|
|
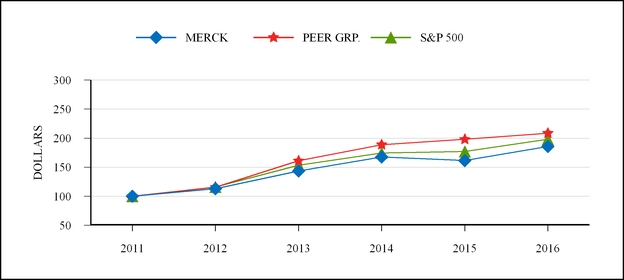
|
2011
|
2012
|
2013
|
2014
|
2015
|
2016
|
|
|
MERCK
|
100.00
|
113.09
|
143.42
|
167.76
|
161.33
|
185.64
|
|
PEER GRP.
|
100.00
|
115.52
|
160.92
|
188.77
|
197.89
|
208.45
|
|
S&P 500
|
100.00
|
115.99
|
153.55
|
174.55
|
176.95
|
198.10
|
|
*
|
Compound Annual Growth Rate
|
|
**
|
Peer group average was calculated on a market cap weighted basis. In addition, AbbVie Inc. replaced Abbott Laboratories in the peer group beginning 2013 following the spin off from Abbott Laboratories.
|
This Performance Graph will not be deemed to be incorporated by reference into any filing under the Securities Act of 1933 or the Securities Exchange Act of 1934, except to the extent that the Company specifically incorporates it by reference. In addition, the Performance Graph will not be deemed to be “soliciting material” or to be “filed” with the SEC or subject to Regulation 14A or 14C, other than as provided in Regulation S-K, or to the liabilities of section 18 of the Securities Exchange Act of 1934, except to the extent that the Company specifically requests that such information be treated as soliciting material or specifically incorporates it by reference into a filing under the Securities Act or the Exchange Act.
31
|
Item 6.
|
Selected Financial Data.
|
The following selected financial data should be read in conjunction with Item 7. “Management’s Discussion and Analysis of Financial Condition and Results of Operations” and consolidated financial statements and notes thereto contained in Item 8. “Financial Statements and Supplementary Data” of this report.
Merck & Co., Inc. and Subsidiaries
($ in millions except per share amounts)
|
2016
(1)
|
2015
(2)
|
2014
(3)
|
2013
|
2012
(4)
|
|||||||||||||||
|
Results for Year:
|
|||||||||||||||||||
|
Sales
|
$
|
39,807
|
|
$
|
39,498
|
|
$
|
42,237
|
|
$
|
44,033
|
|
$
|
47,267
|
|
||||
|
Materials and production
|
13,891
|
|
14,934
|
|
16,768
|
|
16,954
|
|
16,446
|
|
|||||||||
|
Marketing and administrative
|
9,762
|
|
10,313
|
|
11,606
|
|
11,911
|
|
12,776
|
|
|||||||||
|
Research and development
|
10,124
|
|
6,704
|
|
7,180
|
|
7,503
|
|
8,168
|
|
|||||||||
|
Restructuring costs
|
651
|
|
619
|
|
1,013
|
|
1,709
|
|
664
|
|
|||||||||
|
Other (income) expense, net
|
720
|
|
1,527
|
|
(11,613
|
)
|
411
|
|
474
|
|
|||||||||
|
Income before taxes
|
4,659
|
|
5,401
|
|
17,283
|
|
5,545
|
|
8,739
|
|
|||||||||
|
Taxes on income
|
718
|
|
942
|
|
5,349
|
|
1,028
|
|
2,440
|
|
|||||||||
|
Net income
|
3,941
|
|
4,459
|
|
11,934
|
|
4,517
|
|
6,299
|
|
|||||||||
|
Less: Net income attributable to noncontrolling interests
|
21
|
|
17
|
|
14
|
|
113
|
|
131
|
|
|||||||||
|
Net income attributable to Merck & Co., Inc.
|
3,920
|
|
4,442
|
|
11,920
|
|
4,404
|
|
6,168
|
|
|||||||||
|
Basic earnings per common share attributable to Merck & Co., Inc. common shareholders
|
$
|
1.42
|
|
$
|
1.58
|
|
$
|
4.12
|
|
$
|
1.49
|
|
$
|
2.03
|
|
||||
|
Earnings per common share assuming dilution attributable to Merck & Co., Inc. common shareholders
|
$
|
1.41
|
|
$
|
1.56
|
|
$
|
4.07
|
|
$
|
1.47
|
|
$
|
2.00
|
|
||||
|
Cash dividends declared
|
5,135
|
|
5,115
|
|
5,156
|
|
5,132
|
|
5,173
|
|
|||||||||
|
Cash dividends declared per common share
|
$
|
1.85
|
|
$
|
1.81
|
|
$
|
1.77
|
|
$
|
1.73
|
|
$
|
1.69
|
|
||||
|
Capital expenditures
|
1,614
|
|
1,283
|
|
1,317
|
|
1,548
|
|
1,954
|
|
|||||||||
|
Depreciation
|
1,611
|
|
1,593
|
|
2,471
|
|
2,225
|
|
1,999
|
|
|||||||||
|
Average common shares outstanding (millions)
|
2,766
|
|
2,816
|
|
2,894
|
|
2,963
|
|
3,041
|
|
|||||||||
|
Average common shares outstanding assuming dilution (millions)
|
2,787
|
|
2,841
|
|
2,928
|
|
2,996
|
|
3,076
|
|
|||||||||
|
Year-End Position:
|
|||||||||||||||||||
|
Working capital
(5)
|
$
|
13,410
|
|
$
|
10,550
|
|
$
|
14,198
|
|
$
|
17,461
|
|
$
|
15,922
|
|
||||
|
Property, plant and equipment, net
|
12,026
|
|
12,507
|
|
13,136
|
|
14,973
|
|
16,030
|
|
|||||||||
|
Total assets
(5)
|
95,377
|
|
101,677
|
|
98,096
|
|
105,370
|
|
105,876
|
|
|||||||||
|
Long-term debt
(5)
|
24,274
|
|
23,829
|
|
18,629
|
|
20,472
|
|
16,212
|
|
|||||||||
|
Total equity
|
40,308
|
|
44,767
|
|
48,791
|
|
52,326
|
|
55,463
|
|
|||||||||
|
Year-End Statistics:
|
|||||||||||||||||||
|
Number of stockholders of record
|
129,500
|
|
135,500
|
|
142,000
|
|
149,400
|
|
157,400
|
|
|||||||||
|
Number of employees
|
68,000
|
|
68,000
|
|
70,000
|
|
77,000
|
|
83,000
|
|
|||||||||
|
(1)
|
Amounts for 2016 include a charge related to the settlement of worldwide patent litigation related to
Keytruda
.
|
|
(2)
|
Amounts for 2015 include a net charge related to the settlement of
Vioxx
shareholder class action litigation, foreign exchange losses related to Venezuela, gains on the dispositions of businesses and other assets and the favorable benefit of certain tax items.
|
|
(3)
|
Amounts for 2014 reflect the divestiture of Merck’s Consumer Care business on October 1, 2014, including a gain on the sale, as well as a gain recognized on an option exercise by AstraZeneca, gains on the dispositions of other businesses and assets, and a loss on extinguishment of debt.
|
|
(4)
|
Amounts for 2012 include a net charge recorded in connection with the settlement of certain shareholder litigation.
|
|
(5)
|
Amounts have been restated to give effect to the adoption of accounting guidance issued by the Financial Accounting Standards Board. See Note 2 to Item 8(a). “Financial Statements.”
|
32
|
Item 7.
|
Management’s Discussion and Analysis of Financial Condition and Results of Operations.
|
Description of Merck’s Business
Merck & Co., Inc. (Merck or the Company) is a global health care company that delivers innovative health solutions through its prescription medicines, vaccines, biologic therapies and animal health products. The Company’s operations are principally managed on a products basis and include four operating segments, which are the Pharmaceutical, Animal Health, Healthcare Services and Alliances segments. The Pharmaceutical segment is the only reportable segment.
The Pharmaceutical segment includes human health pharmaceutical and vaccine products marketed either directly by the Company or through joint ventures. Human health pharmaceutical products consist of therapeutic and preventive agents, generally sold by prescription, for the treatment of human disorders. The Company sells these human health pharmaceutical products primarily to drug wholesalers and retailers, hospitals, government agencies and managed health care providers such as health maintenance organizations, pharmacy benefit managers and other institutions. Vaccine products consist of preventive pediatric, adolescent and adult vaccines, primarily administered at physician offices. The Company sells these human health vaccines primarily to physicians, wholesalers, physician distributors and government entities. Sales of vaccines in most major European markets were marketed through the Company’s Sanofi Pasteur MSD (SPMSD) joint venture until its termination on December 31, 2016. Beginning in 2017, Merck will record vaccine sales in the European markets that were previously part of the joint venture.
The Company also has animal health operations that discover, develop, manufacture and market animal health products, including vaccines, which the Company sells to veterinarians, distributors and animal producers. The Company’s Healthcare Services segment provides services and solutions that focus on engagement, health analytics and clinical services to improve the value of care delivered to patients. Merck’s Alliances segment primarily includes results from the Company’s relationship with AstraZeneca LP until the termination of that relationship on June 30, 2014. On October 1, 2014, the Company divested its Consumer Care segment that developed, manufactured and marketed over-the-counter, foot care and sun care products.
Overview
During 2016, Merck continued to execute its innovation strategy and the Company’s sustained investment in research yielded a number of recent approvals and regulatory milestones across various therapeutic areas. The Company received several approvals in 2016 that include expanded indications for
Keytruda
, the Company’s anti-PD-1 (programmed death receptor-1) therapy, which was approved by the U.S. Food and Drug Administration (FDA) for the first-line treatment of metastatic non-small-cell lung cancer (NSCLC), as well as for the treatment of head and neck cancer. Additionally, in 2016, both the FDA and the European Commission (EC) approved
Zepatier
, a once-daily, single tablet combination therapy for the treatment of chronic hepatitis C virus (HCV) genotype (GT) 1 or GT4 infection, with ribavirin in certain patient populations.
Worldwide sales were
$39.8 billion
in
2016
, an increase of 1% compared with
2015
, including a 2% unfavorable effect from foreign exchange. Sales growth was driven by oncology, HCV, vaccine, and hospital acute care products, reflecting in part the ongoing launches of
Keytruda
,
Zepatier
and
Bridion
, as well as positive performance from Merck’s Animal Health business. Growth in these areas was largely offset by the effects of generic and biosimilar competition that resulted in declines for products such as
Remicade
and
Nasonex
.
Business development remains an important component of the Company’s overall strategy as Merck seeks to identify the best external innovation to augment its portfolio and pipeline, with a particular focus on early-to-mid-stage pipeline assets. Merck looks for growth opportunities that meet the Company’s strategic criteria. While looking for the best scientific opportunities, Merck remains financially disciplined, pursuing those business opportunities that the Company believes can contribute to long-term growth and sustainable value for shareholders.
In January 2016, Merck acquired IOmet Pharma Ltd (IOmet), a drug discovery company focused on the development of innovative medicines for the treatment of cancer, with a particular emphasis on the fields of cancer immunotherapy and cancer metabolism. In July 2016, Merck acquired Afferent Pharmaceuticals (Afferent), a privately held pharmaceutical company focused on the development of therapeutic candidates targeting the P2X3 receptor for the treatment of common, poorly-managed, neurogenic conditions, such as chronic cough. In addition, in 2016, Merck entered into a strategic collaboration and license agreement with Moderna Therapeutics (Moderna) to develop and commercialize novel messenger RNA (mRNA)-based personalized cancer vaccines.
33
Merck continues to support its in-line portfolio, as well as ongoing and upcoming product launches.
Keytruda
is launching around the world in multiple indications. In 2016, Merck achieved multiple additional regulatory milestones for
Keytruda
including approval from the FDA for the first-line treatment of patients with NSCLC whose tumors have high PD-L1 expression (tumor proportion score [TPS] of 50% or more) as determined by an FDA-approved test, with no EGFR or ALK genomic tumor aberrations and also for the treatment of patients with recurrent or metastatic head and neck squamous cell carcinoma with disease progression on or after platinum-containing chemotherapy. Additionally, in 2016, the EC approved
Keytruda
for the treatment of locally advanced or metastatic NSCLC in patients whose tumors express PD-L1 and who have received at least one prior chemotherapy regimen. In January 2017, the EC approved
Keytruda
for the first-line treatment of metastatic NSCLC in adults whose tumors have high PD-L1 expression (TPS of 50% or more) with no EGFR or ALK positive tumor mutations. Additionally, the Company is continuing its launch of
Zepatier
in the United States and in emerging markets and is now launching in the European Union (EU) and in Japan.
Merck is focusing its research efforts on the therapeutic areas that it believes can have the most impact on human health, such as oncology, diabetes, cardiometabolic disease, resistant microbial infection and Alzheimer’s disease. In addition to the recent regulatory approvals discussed above, the Company has continued to advance other programs in its late-stage pipeline with several regulatory submissions. Merck has five supplemental biologics license applications (sBLA) under Priority Review with the FDA for
Keytruda
including: for use in combination with chemotherapy for the first-line treatment of patients with metastatic or advanced non-squamous NSCLC regardless of PD-L1 expression and with no EGFR or ALK genomic tumor aberrations; for the treatment of patients with classical Hodgkin lymphoma; for the treatment of previously treated patients with advanced microsatellite instability-high cancer; for the first-line treatment of patients with locally advanced or metastatic urothelial cancer, including most bladder cancers; and for the second-line treatment of patients with locally advanced or metastatic urothelial cancer with disease progression on or after platinum-containing chemotherapy. Merck is driving a broad immuno-oncology development program and investing in the long-term potential for
Keytruda
to become foundational in the treatment of a range of cancers. The
Keytruda
clinical development program includes more than 400 clinical trials in more than 30 tumor types; over 200 of these trials combine
Keytruda
with other cancer treatments. MK-1293, an insulin glargine candidate for the treatment of patients with type 1 and type 2 diabetes being developed in a collaboration, is also under review with the FDA.
In addition to Phase 3 programs for
Keytruda
in the therapeutic areas of breast, colorectal, esophageal, gastric, hepatocellular, multiple myeloma, and renal cancers, the Company also has candidates in Phase 3 clinical development in several other therapeutic areas (see “Research and Development” below).
During the past year, the Company continued its focus on productivity improvements, looking for opportunities to reallocate resources across the portfolio to grow its strongest brands and to support the most promising assets in its pipeline.
Marketing and administrative
expenses declined in 2016 as compared with 2015 reflecting in part this continued focus by the Company on prioritizing its resources to the highest growth areas.
Research and development
expenses in 2016 reflect increased clinical development spending as the Company continues to invest in the pipeline.
In November 2016, Merck’s Board of Directors raised the Company’s quarterly dividend to $0.47 per share from $0.46 per share. During 2016, the Company returned
$8.6 billion
to shareholders through dividends and share repurchases.
In January 2017, Merck entered into a settlement and license agreement to resolve worldwide patent infringement litigation related to
Keytruda
. In connection with the settlement, Merck recorded a pretax charge of $625 million in the fourth quarter of 2016 (see Note 10 to the consolidated financial statements).
Earnings per common share assuming dilution attributable to common shareholders (EPS) for
2016
were
$1.41
compared with
$1.56
in
2015
. EPS in both years reflect the impact of acquisition and divestiture-related costs, including a charge in 2016 related to the uprifosbuvir clinical development program, as well as restructuring costs and certain other items. Non-GAAP EPS, which excludes these items, were
$3.78
in
2016
and
$3.59
in
2015
(see “Non-GAAP Income and Non-GAAP EPS” below).
34
Operating Results
Sales
Worldwide sales were $39.8 billion in 2016, an increase of 1% compared with 2015. Foreign exchange unfavorably affected global sales performance by 2% in 2016, which includes a lower benefit from revenue hedging activities as compared with 2015. Revenue growth primarily reflects higher sales in the oncology franchise largely from
Keytruda
, the launch of the HCV treatment
Zepatier,
and growth in vaccine products, including
Gardasil/Gardasil
9,
Varivax
and
Pneumovax
23. Also contributing to sales growth in 2016 were higher sales of hospital acute care products including
Bridion
and
Noxafil
, growth within the diabetes franchise of
Januvia
and
Janumet
, as well as higher sales of Animal Health products, particularly
Bravecto
. These increases were partially offset by sales declines attributable to the ongoing effects of generic and biosimilar competition for certain products, including
Remicade
and
Nasonex
, along with other products within Diversified Brands. Declines in
Isentress
,
PegIntron
and
Dulera
Inhalation Aerosol also partially offset revenue growth in 2016. Sales performance in 2016 reflects a decline of approximately $625 million due to reduced operations by the Company in Venezuela as a result of evolving economic conditions and volatility in that country.
Sales in the United States were
$18.5 billion
in
2016
, an increase of 5% compared with
$17.5 billion
in
2015
. Within the Pharmaceutical segment, sales in the United States grew 5% in 2016 driven primarily by the launches of
Zepatier
and
Bridion
, along with higher sales of
Keytruda
and
Gardasil/Gardasil
9, partially offset by lower sales of
Nasonex
,
Cubicin
,
Dulera
Inhalation Aerosol, and
Isentress
.
International sales were
$21.3 billion
in
2016
, a decline of 3% compared with
$22.0 billion
in
2015
. Foreign exchange unfavorably affected international sales performance by 4% in
2016
. International sales within the Pharmaceutical segment declined 3% in 2016, including a 3% unfavorable effect from foreign exchange, largely reflecting declines in certain emerging markets, offset by an increase in Japan. Sales in emerging markets were $6.7 billion in
2016
, a decline of 9% including a 6% unfavorable effect from foreign exchange, driven primarily by reduced operations in Venezuela, partially offset by growth in other markets. Sales in Japan grew 6% in
2016
, to $2.8 billion, which includes a 10% favorable effect from foreign exchange. Excluding the favorable effect of foreign exchange, the sales decline in Japan was largely driven by the loss of market exclusivity for
Singulair
combined with the ongoing generic erosion for products within Diversified Brands, partially offset by higher sales of
Belsomra
. Sales in Europe were $7.7 billion in
2016
, essentially flat as compared with 2015, including a 2% unfavorable effect from foreign exchange. Excluding the unfavorable effect of foreign exchange, sales performance in Europe primarily reflects volume growth in
Keytruda
,
Cubicin
,
Simponi
, Adempas,
Liptruzet
, and the
Januvia
franchise, partially offset by ongoing biosimilar competition and generic erosion for certain products, particularly
Remicade,
and other pricing pressures in this region. Total international sales represented
54%
and
56%
of total sales in
2016
and
2015
, respectively.
Global efforts toward health care cost containment continue to exert pressure on product pricing and market access worldwide. In the United States, health care reform is contributing to an increase in the number of patients in the Medicaid program under which sales of pharmaceutical products are subject to substantial rebates. In many international markets, government-mandated pricing actions have reduced prices of generic and patented drugs. In addition, other austerity measures negatively affected the Company’s revenue performance in
2016
. The Company anticipates these pricing actions and other austerity measures will continue to negatively affect revenue performance in
2017
.
35
Worldwide sales were $39.5 billion in 2015, a decline of 6% compared with 2014 including a 6% unfavorable effect from foreign exchange. The acquisition of Cubist Pharmaceuticals, Inc. (Cubist) in 2015, the divestiture of Merck’s Consumer Care (MCC) business in 2014, as well as product divestitures and the termination of the Company’s relationship with AstraZeneca LP (AZLP) also in 2014, as discussed below, had a net unfavorable impact to sales of approximately 3%. In addition, sales performance in 2015 reflects declines in
PegIntron
and
Victrelis
,
Remicade
,
Pneumovax
23,
Nasonex
, and
Vytorin
. These declines were partially offset by volume growth in
Keytruda
,
Januvia
and
Janumet
,
Gardasil/Gardasil
9,
Noxafil
,
Simponi
,
Implanon/Nexplanon
,
Invanz
,
Dulera
Inhalation Aerosol, and
Bridion
, as well as volume growth in Animal Health products and higher third-party manufacturing sales.
In January 2015, the Company acquired Cubist, which contributed sales of $1.3 billion to Merck’s revenues in 2015. In 2014, the Company divested certain ophthalmic products in several international markets (most of which closed on July 1, 2014). In addition, on October 1, 2014, the Company divested its MCC business including the prescription rights to Claritin and Afrin. The sales decline in 2015 attributable to these divestitures was approximately $1.9 billion of which $1.5 billion related to the Consumer Care segment and $400 million related to the Pharmaceutical segment. Also, in 2014, the Company sold the U.S. marketing rights to
Saphris
, an antipsychotic indicated for the treatment of schizophrenia and bipolar I disorder in adults, which resulted in revenue of $232 million. Additionally, the Company’s relationship with AZLP terminated on June 30, 2014; therefore, effective July 1, 2014, the Company no longer records supply sales to AZLP. These supply sales were $463 million in 2014 through the termination date and were reflected in the Alliances segment.
36
Sales of the Company’s products were as follows:
|
($ in millions)
|
2016
|
2015
|
2014
|
||||||||
|
Primary Care and Women’s Health
|
|||||||||||
|
Cardiovascular
|
|||||||||||
|
Zetia
|
$
|
2,560
|
|
$
|
2,526
|
|
$
|
2,650
|
|
||
|
Vytorin
|
1,141
|
|
1,251
|
|
1,516
|
|
|||||
|
Diabetes
|
|||||||||||
|
Januvia
|
3,908
|
|
3,863
|
|
3,931
|
|
|||||
|
Janumet
|
2,201
|
|
2,151
|
|
2,071
|
|
|||||
|
General Medicine and Women’s Health
|
|||||||||||
|
NuvaRing
|
777
|
|
732
|
|
723
|
|
|||||
|
Implanon/Nexplanon
|
606
|
|
588
|
|
502
|
|
|||||
|
Dulera
|
436
|
|
536
|
|
460
|
|
|||||
|
Follistim AQ
|
355
|
|
383
|
|
412
|
|
|||||
|
Hospital and Specialty
|
|||||||||||
|
Hepatitis
|
|||||||||||
|
Zepatier
|
555
|
|
—
|
|
—
|
|
|||||
|
HIV
|
|||||||||||
|
Isentress
|
1,387
|
|
1,511
|
|
1,673
|
|
|||||
|
Hospital Acute Care
|
|||||||||||
|
Cubicin
(1)
|
1,087
|
|
1,127
|
|
25
|
|
|||||
|
Noxafil
|
595
|
|
487
|
|
402
|
|
|||||
|
Invanz
|
561
|
|
569
|
|
529
|
|
|||||
|
Cancidas
|
558
|
|
573
|
|
681
|
|
|||||
|
Bridion
|
482
|
|
353
|
|
340
|
|
|||||
|
Primaxin
|
297
|
|
313
|
|
329
|
|
|||||
|
Immunology
|
|||||||||||
|
Remicade
|
1,268
|
|
1,794
|
|
2,372
|
|
|||||
|
Simponi
|
766
|
|
690
|
|
689
|
|
|||||
|
Oncology
|
|||||||||||
|
Keytruda
|
1,402
|
|
566
|
|
55
|
|
|||||
|
Emend
|
549
|
|
535
|
|
553
|
|
|||||
|
Temodar
|
283
|
|
312
|
|
350
|
|
|||||
|
Diversified Brands
|
|||||||||||
|
Respiratory
|
|||||||||||
|
Singulair
|
915
|
|
931
|
|
1,092
|
|
|||||
|
Nasonex
|
537
|
|
858
|
|
1,099
|
|
|||||
|
Other
|
|||||||||||
|
Cozaar/Hyzaar
|
511
|
|
667
|
|
806
|
|
|||||
|
Arcoxia
|
450
|
|
471
|
|
519
|
|
|||||
|
Fosamax
|
284
|
|
359
|
|
470
|
|
|||||
|
Zocor
|
186
|
|
217
|
|
258
|
|
|||||
|
Vaccines
(2)
|
|||||||||||
|
Gardasil/Gardasil
9
|
2,173
|
|
1,908
|
|
1,738
|
|
|||||
|
ProQuad/M-M-R
II
/Varivax
|
1,640
|
|
1,505
|
|
1,394
|
|
|||||
|
Zostavax
|
685
|
|
749
|
|
765
|
|
|||||
|
RotaTeq
|
652
|
|
610
|
|
659
|
|
|||||
|
Pneumovax
23
|
641
|
|
542
|
|
746
|
|
|||||
|
Other pharmaceutical
(3)
|
4,703
|
|
5,105
|
|
6,233
|
|
|||||
|
Total Pharmaceutical segment sales
|
35,151
|
|
34,782
|
|
36,042
|
|
|||||
|
Other segment sales
(4)
|
3,862
|
|
3,667
|
|
5,758
|
|
|||||
|
Total segment sales
|
39,013
|
|
38,449
|
|
41,800
|
|
|||||
|
Other
(5)
|
794
|
|
1,049
|
|
437
|
|
|||||
|
|
$
|
39,807
|
|
$
|
39,498
|
|
$
|
42,237
|
|
||
|
(1)
|
Sales of
Cubicin
in 2015 represent sales subsequent to the Cubist acquisition date. Sales of
Cubicin
in 2014 reflect sales in Japan pursuant to a previously existing licensing agreement.
|
|
(2)
|
These amounts do not reflect sales of vaccines sold in most major European markets through the Company’s joint venture, SPMSD, the results of which are reflected in equity income from affiliates which is included in
Other (income) expense, net
. These amounts do, however, reflect supply sales to SPMSD. On December 31, 2016, Merck and Sanofi Pasteur terminated the SPMSD joint venture (see Note 8 to the consolidated financial statements).
|
|
(3)
|
Other pharmaceutical primarily reflects sales of other human health pharmaceutical products, including products within the franchises not listed separately.
|
|
(4)
|
Represents the non-reportable segments of Animal Health, Healthcare Services and Alliances, as well as Consumer Care until its divestiture on October 1, 2014. The Alliances segment includes revenue from the Company’s relationship with AZLP until termination on June 30, 2014.
|
|
(5)
|
Other is primarily comprised of miscellaneous corporate revenues, including revenue hedging activities, as well as third-party manufacturing sales. Other in 2016 and 2014 also includes approximately $170 million and $232 million, respectively, in connection with the sale of the marketing rights to certain products
.
|
37
Pharmaceutical Segment
Primary Care and Women’s Health
Cardiovascular
Combined global sales of
Zetia
(marketed in most countries outside the United States as
Ezetrol
) and
Vytorin
(marketed outside the United States as
Inegy
), medicines for lowering LDL cholesterol, were $3.7 billion in 2016, a decline of 2% compared with 2015 including a 1% unfavorable effect from foreign exchange. In addition, in 2016, the Company recorded sales of $146 million for
Atozet
, a medicine for lowering LDL cholesterol, which the Company markets in certain countries outside of the United States. Global sales of the ezetimibe family (including
Atozet
) were $3.8 billion in 2016, growth of 1% compared with 2015, reflecting volume growth in Europe and higher pricing in the United States, largely offset by lower sales in Venezuela due to reduced operations in this country and lower volumes in the United States reflecting in part generic competition for
Zetia
. By agreement, a generic manufacturer launched a generic version of
Zetia
in the United States in December 2016 and the Company is experiencing a rapid decline in U.S.
Zetia
sales. The Company anticipates the decline will accelerate in future periods. The U.S. patent and exclusivity periods for
Zetia
and
Vytorin
otherwise expire in April 2017 and the Company anticipates declines in U.S.
Zetia
and
Vytorin
sales thereafter. U.S. sales of
Zetia
and
Vytorin
were $1.6 billion and $473 million, respectively, in 2016. The Company has market exclusivity in major European markets for
Ezetrol
until April 2018 and for
Inegy
until April 2019. Combined worldwide sales of the ezetimibe family were $3.8 billion in 2015, a decline of 9% compared with 2014 including an 8% unfavorable effect from foreign exchange. The sales decline was driven primarily by lower volumes of
Ezetrol
in Canada where it lost market exclusivity in September 2014, as well as by lower volumes in the United States, partially offset by higher pricing in the United States.
Pursuant to a collaboration between Merck and Bayer AG (Bayer) (see Note 3 to the consolidated financial statements), Merck has lead commercial rights for Adempas, a novel cardiovascular drug for the treatment of pulmonary arterial hypertension, in countries outside the Americas while Bayer has lead rights in the Americas, including the United States. In 2016, Merck began promoting and distributing Adempas in Europe. Transition in other Merck territories will continue in 2017. Merck recorded sales for Adempas of $169 million in 2016, which includes sales in Merck’s marketing territories, as well as Merck’s share of profits from the sale of Adempas in Bayer’s marketing territories.
In September 2016, Merck sold the marketing rights for
Zontivity
in the United States and Canada to Aralez Pharmaceuticals Inc. for a $25 million upfront payment and royalties at graduated rates, plus potential future consideration dependent upon the achievement of certain aggregate annual sales-based milestones. Previously, in March 2016, following several business decisions that reduced sales expectations for
Zontivity
in the United States and Europe, the Company lowered its cash flow projections for
Zontivity
. The Company utilized market participant assumptions and considered several different scenarios to determine the fair value of the intangible asset related to
Zontivity
that, when compared with its related carrying value, resulted in an impairment charge of $252 million recorded in
Materials and production
costs in 2016.
Diabetes
Worldwide combined sales of
Januvia
and
Janumet
, medicines that help lower blood sugar levels in adults with type 2 diabetes, were $6.1 billion in 2016, an increase of 2% compared with 2015. Sales growth was driven primarily by higher volumes in the United States, Europe and Canada, partially offset by pricing pressures in the United States and Europe, and lower sales in Venezuela due to the Company’s reduced operations in that country. Combined global sales of
Januvia
and
Janumet
were $6.0 billion in 2015, essentially flat as compared with 2014 including a 7% unfavorable effect from foreign exchange. Sales performance reflects higher volumes and pricing in the United States, as well as volume growth in emerging markets and Europe. Volume declines of co-marketed sitagliptin in Japan due to the timing of sales to the licensee partially offset growth in 2015.
General Medicine and Women’s Health
Worldwide sales of
NuvaRing
, a vaginal contraceptive product, were $777 million in 2016, an increase of 6% compared with 2015, and were $732 million in 2015, an increase of 1% compared with 2014. Foreign exchange unfavorably affected global sales performance by 1% and 7% in 2016 and 2015, respectively. Sales growth in both years largely reflects higher pricing in the United States. Volume declines in Europe partially offset revenue growth in 2016. In August 2016, the U.S. District Court ruled that the Company’s delivery system patent for
NuvaRing
is invalid. The Company is appealing this verdict to the U.S. Court of Appeals for the Federal Circuit. However, given the U.S. District Court’s decision, there may be generic entrants into the U.S. market in advance of the April 2018 patent
38
expiration. If this should occur, the Company anticipates a significant decline in U.S.
NuvaRing
sales thereafter. U.S. sales of
NuvaRing
were $576 million in 2016. As a result of the unfavorable U.S. District Court decision, the Company evaluated the intangible asset related to
NuvaRing
for impairment and concluded that it was not impaired. The intangible asset value for
NuvaRing
was
$319 million
at December 31, 2016.
Worldwide sales of
Implanon/Nexplanon
, single-rod subdermal contraceptive implants, grew to $606 million in 2016, an increase of 3% compared with 2015 including a 3% unfavorable effect from foreign exchange. Sales growth reflects higher demand in the United States, partially offset by declines in certain emerging markets, particularly in Venezuela.
Implanon/Nexplanon
sales rose to $588 million in 2015, a 17% increase compared with 2014 including a 6% unfavorable effect from foreign exchange. The increase was driven primarily by higher demand in the United States and in emerging markets.
Global sales of
Dulera
Inhalation Aerosol, a combination medicine for the treatment of asthma, were $436 million in 2016, a decline of 19% compared with 2015 including a 1% unfavorable effect from foreign exchange. The decline was driven by lower sales in the United Sales reflecting competitive pricing pressures that were partially offset by higher demand. Worldwide sales of
Dulera
Inhalation Aerosol grew 16% in 2015 to $536 million driven primarily by higher demand in the United States.
Global sales of
Follistim AQ
(marketed in most countries outside the United States as
Puregon
), a fertility treatment, were $355 million in 2016, a decline of 7% compared with 2015 including a 2% unfavorable effect from foreign exchange. The sales decline primarily reflects lower volumes in Europe due in part to supply issues and lower demand in certain emerging markets. Worldwide sales of
Follistim AQ
were $383 million in 2015, a decline of 7% compared with 2014, reflecting a 9% unfavorable effect from foreign exchange that was offset by higher pricing in the United States.
In 2016, the Company determined that, for business reasons, it would terminate the North America partnership agreement with ALK-Abelló that included both
Grastek
and
Ragwitek
allergy immunotherapy tablets for sublingual use. This decision was not due to efficacy or safety concerns for the tablets. Merck provided ALK-Abelló with six months’ notice that it is terminating the agreement and therefore these compounds will be returned to ALK-Abelló. In connection with this decision, the Company wrote-off
$95 million
of intangible assets related to these products (see Note 7 to the consolidated financial statements).
Hospital and Specialty
Hepatitis
Global sales of
Zepatier
were $555 million in 2016.
Zepatier
was approved by the FDA in January 2016 for the treatment of adult patients with chronic HCV GT1 or GT4 infection, with ribavirin in certain patient populations.
Zepatier
was approved by the EC in July 2016 and became available in European markets in late November 2016. Launches are expected to continue across the EU in 2017. The Company is also launching
Zepatier
in Japan and in emerging markets.
Worldwide sales of
PegIntron
, a treatment for chronic HCV, declined 65% in 2016 to $63 million and decreased 52% in 2015 to $182 million. The declines were driven by lower volumes in nearly all regions as the availability of newer therapeutic options resulted in continued loss of market share.
Global sales of
Victrelis
, an oral medicine for the treatment of chronic HCV, were $18 million in 2015, a decline of 89% compared with sales of $153 million in 2014, driven by lower volumes in Europe and emerging markets as the availability of newer therapeutic options resulted in continued loss of market share. Sale of
Victrelis
were
de minimis
in 2016.
HIV
Worldwide sales of
Isentress,
an HIV integrase inhibitor for use in combination with other antiretroviral agents for the treatment of HIV-1 infection, were $1.4 billion in 2016, a decline of 8% compared with 2015 including a 2% unfavorable effect from foreign exchange. The sales decline was driven primarily by lower volumes in the United States, as well as lower demand and pricing in Europe due to competitive pressures, partially offset by a favorable adjustment to discount reserves in the United States and higher demand in certain emerging markets. Global sales of
Isentress
were $1.5 billion in 2015, a decline of 10% compared with 2014 including an 8% unfavorable effect from foreign exchange. The decline was driven primarily by lower volumes in the United States and lower demand and
39
pricing in Europe due to competitive pressures, partially offset by higher volumes in Latin America and higher pricing in the United States.
Hospital Acute Care
Global sales of
Cubicin
, an I.V. antibiotic for complicated skin and skin structure infections or bacteremia when caused by designated susceptible organisms, were $1.1 billion in 2016, a decline of 4% compared with 2015. The U.S. composition patent for
Cubicin
expired in June 2016 and the Company is experiencing a significant decline in U.S.
Cubicin
sales and expects the decline to continue. The sales decline in the United States was partially offset by sales of
Cubicin
in certain international markets for which the Company acquired marketing rights in the fourth quarter of 2015 (including Europe, Latin America, Australia, New Zealand, China, South Africa and certain other Asia Pacific countries). The Company anticipates it will lose market exclusivity for
Cubicin
in Europe in 2017.
Worldwide sales of
Noxafil
, for the prevention of invasive fungal infections, grew 22% in 2016 to $595 million driven primarily by higher pricing in the United States, volume growth in Europe reflecting an ongoing positive impact from the approval of new formulations, and higher demand in emerging markets. Global sales of
Noxafil
rose 21% in 2015 to $487 million driven by pricing and higher demand in the United States, as well as volume growth in Europe reflecting a positive impact from the approval of new formulations. Foreign exchange unfavorably affected global sales performance by 3% in 2016 and 12% in 2015.
Global sales of
Invanz
, for the treatment of certain infections, were $561 million in 2016, a decline of 1% compared with 2015 including a 2% unfavorable effect from foreign exchange. Sales performance in 2016 reflects volume growth in certain emerging markets and higher pricing in the United States, largely offset by a decline in Venezuela. Worldwide sales of
Invanz
were $569 million in 2015, an increase of 8% compared with 2014, reflecting higher sales in the United States and volume growth in emerging markets that was partially offset by a 9% unfavorable effect from foreign exchange. The Company will lose U.S. patent protection for
Invanz
in November 2017 and the Company anticipates a significant decline in U.S.
Invanz
sales thereafter. U.S. sales of
Invanz
were $329 million in 2016.
Global sales of
Cancidas
, an anti-fungal product sold primarily outside of the United States, were $558 million in 2016, a decline of 3% compared with 2015, reflecting a 4% unfavorable effect from foreign exchange and pricing declines in Europe that were offset by higher volumes in certain emerging markets, particularly in China. Worldwide sales of
Cancidas
were $573 million in 2015, a decrease of 16% compared with 2014 reflecting a 12% unfavorable effect from foreign exchange and volume declines in certain emerging markets. The EU compound patent for
Cancidas
expires in April 2017 and the Company anticipates a decline in
Cancidas
sales in those European markets thereafter. Sales of
Cancidas
in Europe were $297 million in 2016.
Global sales of
Bridion
, for the reversal of two types of neuromuscular blocking agents used during surgery, were $482 million in 2016, growth of 37% compared with 2015 including a 2% favorable effect from foreign exchange. Sales growth reflects volume growth in most markets, including in the United States where it was approved by the FDA in December 2015, partially offset by a decline in Venezuela due to reduced operations by the Company in this country. Sales of
Bridion
increased 4% in 2015 to $353 million driven by volume growth in international markets. Foreign exchange unfavorably affected global sales performance by 19% in 2015.
In October 2016, Merck announced that the FDA approved
Zinplava
Injection 25 mg/mL.
Zinplava
is indicated to reduce recurrence of
Clostridium difficile
infection (CDI) in patients 18 years of age or older who are receiving antibacterial drug treatment of CDI and are at high risk for CDI recurrence.
Zinplava
became available in the United States in February 2017.
Zinplava
was approved by the EC in January 2017. The Company anticipates
Zinplava
will be available in the EU in March 2017.
Immunology
Sales of
Remicade,
a treatment for inflammatory diseases (marketed by the Company in Europe, Russia and Turkey), were $1.3 billion in 2016, a decline of 29% compared with 2015, and were $1.8 billion in 2015, a decline of 24% compared with 2014. Foreign exchange unfavorably affected sales performance by 1% in 2016 and by 14% in 2015. In February 2015, the Company lost market exclusivity for
Remicade
in major European markets and no longer has market exclusivity in any of its marketing territories. The Company is experiencing pricing and volume declines in these markets as a result of biosimilar competition and expects the declines to continue.
40
Sales of
Simponi
, a once-monthly subcutaneous treatment for certain inflammatory diseases (marketed by the Company in Europe, Russia and Turkey), were $766 million in 2016, an increase of 11% compared with 2015 including a 3% unfavorable effect from foreign exchange. Sales growth was driven primarily by higher volumes in Europe reflecting in part an ongoing positive impact from the ulcerative colitis indication. Sales of
Simponi
were $690 million in 2015, essentially flat as compared with 2014, driven by higher demand in Europe, reflecting in part an ongoing positive impact from the ulcerative colitis indication, which was offset by a 19% unfavorable effect from foreign exchange.
Oncology
Sales of
Keytruda
, an anti-PD-1 therapy, were $1.4 billion in 2016, $566 million in 2015 and $55 million in 2014. The year-over-year increases primarily reflect higher sales in the United States, Europe and in emerging markets as the Company continues to launch
Keytruda
.
In October 2016, Merck announced that the FDA approved
Keytruda
for the first-line treatment of patients with NSCLC whose tumors have high PD-L1 expression (TPS of 50% or more) as determined by an FDA-approved test, with no EGFR or ALK genomic tumor aberrations. With this new indication,
Keytruda
is now the only anti-PD-1 therapy to be approved in the first-line treatment setting for these patients. In addition, the FDA approved a labeling update to include data from KEYNOTE-010 in the second-line or greater treatment setting for patients with metastatic NSCLC whose tumors express PD-L1 (TPS of 1% or more) as determined by an FDA-approved test, with disease progression on or after platinum-containing chemotherapy. Patients with EGFR or ALK genomic tumor aberrations should have disease progression on FDA-approved therapy for these aberrations prior to receiving
Keytruda
. In December 2016,
Keytruda
was approved in Japan for the treatment of certain patients with PD-L1-positive unresectable advanced/recurrent NSCLC in the first- and second-line treatment settings. Additionally, in January 2017, the EC approved
Keytruda
for the first-line treatment of metastatic NSCLC in adults whose tumors have high PD-L1 expression (TPS of 50% or more) with no EGFR or ALK positive tumor mutations.
In August 2016, Merck announced that the FDA approved
Keytruda
for the treatment of patients with recurrent or metastatic head and neck squamous cell carcinoma (HNSCC) with disease progression on or after platinum-containing chemotherapy.
Keytruda
is now approved in the United States and in the EU for the treatment of previously untreated metastatic NSCLC in patients whose tumors express high levels of PD-L1 and previously treated metastatic NSCLC in patients whose tumors express PD-L1, as well as for the treatment of advanced melanoma.
Keytruda
is also approved in the United States for previously treated recurrent or metastatic HNSCC. The Company has launched
Keytruda
in over 50 markets globally.
Merck has five sBLAs under Priority Review with the FDA for
Keytruda
including: for use in combination with chemotherapy for the first-line treatment of patients with metastatic or advanced non-squamous NSCLC regardless of PD-L1 expression and with no EGFR or ALK genomic tumor aberrations; for the treatment of patients with classical Hodgkin lymphoma; for the treatment of previously treated patients with advanced microsatellite instability-high cancer; for the first-line treatment of patients with locally advanced or metastatic urothelial cancer, including most bladder cancers; and for the second-line treatment of patients with locally advanced or metastatic urothelial cancer with disease progression on or after platinum-containing chemotherapy. The Company plans additional regulatory filings in the United States and other countries. The
Keytruda
clinical development program includes studies across a broad range of cancer types (see “Research and Development” below). In January 2017, Merck entered into a settlement and license agreement to resolve worldwide patent infringement litigation related to
Keytruda
(see Note 10 to the consolidated financial statements).
Global sales of
Emend
, for the prevention of chemotherapy-induced and post-operative nausea and vomiting, were $549 million in 2016, an increase of 3% compared with 2015 including a 1% unfavorable effect from foreign exchange, largely reflecting higher pricing in the United States, partially offset by volume declines in Japan. In February 2016, Merck announced that the FDA approved a supplemental new drug application for single-dose
Emend
for injection for the prevention of delayed nausea and vomiting in adults receiving initial and repeat courses of moderately emetogenic chemotherapy. Worldwide sales of
Emend
were $535 million in 2015, a decline of 3% reflecting a 6% unfavorable effect from foreign exchange that was partially offset by higher pricing in the United States and volume growth in Europe.
41
Diversified Brands
Merck’s diversified brands include human health pharmaceutical products that are approaching the expiration of their marketing exclusivity or are no longer protected by patents in developed markets, but continue to be a core part of the Company’s offering in other markets around the world.
Respiratory
Worldwide sales of
Singulair,
a once-a-day oral medicine for the chronic treatment of asthma and for the relief of symptoms of allergic rhinitis, were $915 million in 2016, a decrease of 2% compared with 2015 including a 2% favorable effect from foreign exchange. Sales performance primarily reflects lower volumes in Japan. The patents that provided market exclusivity for
Singulair
in Japan expired in February and October of 2016.
As a result, the Company is experiencing
Singulair
volume declines in Japan and expects the decline to continue.
Singulair
sales in Japan were $455 million in 2016. In years prior to 2016, the Company lost market exclusivity for
Singulair
in the United States and in most major international markets with the exception of Japan. The Company no longer has market exclusivity for
Singulair
in any major market. Global sales of
Singulair
were $931 million in 2015, a decline of 15% compared with 2014 including a 10% unfavorable effect from foreign exchange. The sales decline in 2015 was driven primarily by lower volumes in Japan and lower demand in Europe as a result of generic competition.
Global sales of
Nasonex
, an inhaled nasal corticosteroid for the treatment of nasal allergy symptoms, were $537 million in 2016, a decline of 37% compared with 2015, driven primarily by lower volumes in the United States resulting from generic competition. In March 2016, Apotex launched a generic version of
Nasonex
in the United States pursuant to a June 2012 U.S. District Court for the District of New Jersey ruling (upheld on appeal to the U.S. Court of Appeals for the Federal Circuit) holding that Apotex’s generic version of
Nasonex
does not infringe on the Company’s formulation patent. Accordingly, the Company is experiencing a substantial decline in U.S.
Nasonex
sales and expects the decline to continue. The decline in global
Nasonex
sales in 2016 was also driven by lower volumes and pricing in Europe from ongoing generic erosion and lower sales in Venezuela due to reduced operations by the Company in this country. Worldwide sales of
Nasonex
were $858 million in 2015, a decline of 22% compared with 2014 including a 6% unfavorable effect from foreign exchange. The decline was driven primarily by lower volumes in the United States reflecting competition from alternative generic treatment options, as well as from supply constraints. In addition, lower volumes and pricing in Europe from ongoing generic erosion also contributed to the
Nasonex
sales decline in 2015.
Other
Global sales of
Cozaar
and its companion agent
Hyzaar
(a combination of
Cozaar
and hydrochlorothiazide), treatments for hypertension, declined 23% in 2016 to $511 million and decreased 17% in 2015 to $667 million. Foreign exchange unfavorably affected global sales performance by 3% and 9% in 2016 and 2015, respectively. The patents that provided market exclusivity for
Cozaar
and
Hyzaar
in the United States and in most major international markets have expired. Accordingly, the Company is experiencing declines in
Cozaar
and
Hyzaar
sales and expects the declines to continue.
Vaccines
The following discussion of vaccines does not include sales of vaccines sold in most major European markets through SPMSD, the Company’s joint venture with Sanofi Pasteur (Sanofi), the results of which are reflected in equity income from affiliates included in
Other (income) expense, net
(see “Selected Joint Venture and Affiliate Information” below). Supply sales to SPMSD, however, are included. On December 31, 2016, Merck and Sanofi terminated SPMSD and ended their joint vaccines operations in Europe (see Note 8 to the consolidated financial statements). Beginning in 2017, Merck will record vaccine sales in the European markets that were previously part of the SPMSD joint venture.
Merck’s sales of
Gardasil/Gardasil
9, vaccines to help prevent certain cancers and diseases caused by certain types of HPV, were $2.2 billion in 2016, growth of 14% compared with 2015. Sales growth was driven primarily by higher volumes and pricing in the United States, as well as higher demand in certain emerging markets that was partially offset by a decline in government tenders in Brazil. In October 2016, the FDA approved a 2-dose vaccination regimen for
Gardasil
9, for use in girls and boys 9 through 14 years of age, and the U.S. Centers for Disease Control and Prevention’s Advisory Committee on Immunization Practices voted to recommend the 2-dose vaccination regimen for certain 9 through 14 year olds. The Company anticipates the 2-dose vaccination regimen will have an unfavorable effect on sales of
Gardasil
9 during the period of transition. Merck’s sales of
Gardasil/Gardasil
9 were $1.9 billion in 2015, an increase of 10% compared with 2014 including a 1% unfavorable effect from foreign exchange. Sales growth
42
was driven primarily by higher sales in the United States resulting from higher pricing and increased volumes reflecting the timing of public sector purchases, as well as increased government tenders in the Asia Pacific region, partially offset by declines in Latin America due to both price and volume.
Gardasil
9, Merck’s 9-valent HPV vaccine, was approved by the FDA in December 2014 for use in females 9 through 26 years of age, and males 9 through 15 years of age.
Gardasil
9 includes the greatest number of HPV types in any available HPV vaccine. In December 2015, the FDA approved an expanded age indication for
Gardasil
9, to include use in males 16 through 26 years of age for the prevention of anal cancers, precancerous or dysplastic lesions and genital warts caused by certain HPV types. The Company is a party to certain third-party license agreements with respect to
Gardasil/Gardasil
9 (including a cross-license and settlement agreement with GlaxoSmithKline). As a result of these agreements, the Company pays royalties on worldwide
Gardasil/Gardasil
9 sales of 16% to 24% which vary by country and are included in
Materials and production
costs.
Merck’s sales of
ProQuad
, a pediatric combination vaccine to help protect against measles, mumps, rubella and varicella, were $495 million in 2016, $454 million in 2015 and $395 million in 2014. Sales growth in 2016 as compared with 2015 was driven primarily by higher demand and pricing in the United States. Sales growth in 2015 as compared with 2014 primarily reflects higher sales in the United States reflecting increased volumes, which were driven in part by measles outbreaks in the United States, as well as higher pricing.
Merck’s sales of
M-M-R
II, a vaccine to help protect against measles, mumps and rubella, were $353 million in 2016, $365 million in 2015 and $326 million in 2014. Sales performance in 2015 as compared with 2016 and 2014 was driven by higher demand resulting from measles outbreaks in the United States.
Merck’s sales of
Varivax,
a vaccine to help prevent chickenpox (varicella), were $792 million in 2016, $686 million in 2015 and $672 million in 2014. Sales growth in 2016 as compared with 2015 was driven primarily by higher sales in the United States reflecting the effects of public sector purchasing and higher pricing that were partially offset by lower demand. Volume growth in certain emerging markets reflecting the timing of government tenders also contributed to the sales increase in 2016 as compared with 2015. Sales growth in 2015 as compared with 2014 reflects higher volumes in certain emerging markets and higher pricing in the United States, partially offset by lower volumes in the United States.
Merck’s sales of
Zostavax,
a vaccine to help prevent shingles (herpes zoster) in adults 50 years of age and older, were $685 million in 2016, a decline of 9% compared with 2015 including a 1% unfavorable effect from foreign exchange. The decline was driven primarily by lower volumes in the United States, partially offset by higher pricing in the United States and higher demand in certain emerging markets. Merck’s sales of
Zostavax
were $749 million in 2015, a decline of 2% compared with 2014 including a 2% unfavorable effect from foreign exchange. Sales performance in 2015 as compared with 2014 reflects lower volumes in the United States, partially offset by higher demand in Canada and higher pricing in the United States. The Company is continuing to educate U.S. customers on the broad managed care coverage for
Zostavax
and the process for obtaining reimbursement. Merck is continuing to launch
Zostavax
outside of the United States.
Merck’s sales of
RotaTeq,
a vaccine to help protect against rotavirus gastroenteritis in infants and children, were $652 million in 2016, an increase of 7% compared with 2015, and were $610 million in 2015, a decline of 7% compared with 2014 including a 3% unfavorable effect from foreign exchange. Sales performance in both periods was driven primarily by the effects of public sector purchasing in the United States. Volume growth in certain emerging markets also contributed to sales growth in 2016.
Merck’s sales of
Pneumovax
23, a vaccine to help prevent pneumococcal disease, were $641 million in 2016, an increase of 18% compared with 2015, driven primarily by higher volumes and pricing in the United States and higher demand in certain emerging markets. Merck’s sales of
Pneumovax
23 were $542 million in 2015, a decrease of 27% compared with 2014, driven primarily by lower demand in the United States and sales declines in emerging markets. Foreign exchange favorably affected sales performance by 1% in 2016 and unfavorably affected sales performance by 2% in 2015.
Other Segments
The Company’s other segments are the Animal Health, Healthcare Services and Alliances segments, which are not material for separate reporting. The Alliances segment includes revenue from AZLP until the termination of the Company’s relationship with AZLP on June 30, 2014 (see “Selected Joint Venture and Affiliate Information” below).
43
Prior to its disposition on October 1, 2014, the Company also had a Consumer Care segment which had sales of $1.5 billion in 2014.
Animal Health
Animal Health includes pharmaceutical and vaccine products for the prevention, treatment and control of disease in all major farm and companion animal species. Animal Health sales are affected by competition and the frequent introduction of generic products. Worldwide sales of Animal Health products were $3.5 billion in 2016, $3.3 billion in 2015 and $3.5 billion in 2014. Global sales of Animal Health products increased 4% in 2016 compared with 2015 including a 4% unfavorable effect from foreign exchange. Sales growth primarily reflects volume growth across most species areas, particularly in products for companion animals, driven primarily by higher sales of
Bravecto,
as well as in poultry and swine products. Worldwide sales of Animal Health products declined 4% in 2015 compared with 2014 including a 13% unfavorable effect from foreign exchange. Sales performance in 2015 reflects volume growth in companion animal products, driven primarily by higher sales of
Bravecto,
which began launching in Europe and the United States in 2014, as well as volume growth in swine and aqua products.
In May 2016, the Company received marketing approval from the European Medicines Agency (EMA) for
Bravecto
Spot-On Solution for cats and dogs, and in July 2016, the Company received approval in the United States to market the product under the tradename
Bravecto
Topical.
In July 2016, Merck announced it had executed an agreement to acquire a controlling interest in Vallée, a leading privately held producer of animal health products in Brazil (see Note 3 to the consolidated financial statements).
Costs, Expenses and Other
|
($ in millions)
|
2016
|
Change
|
2015
|
Change
|
2014
|
||||||||||||
|
Materials and production
|
$
|
13,891
|
|
-7
|
%
|
$
|
14,934
|
|
-11
|
%
|
$
|
16,768
|
|
||||
|
Marketing and administrative
|
9,762
|
|
-5
|
%
|
10,313
|
|
-11
|
%
|
11,606
|
|
|||||||
|
Research and development
|
10,124
|
|
51
|
%
|
6,704
|
|
-7
|
%
|
7,180
|
|
|||||||
|
Restructuring costs
|
651
|
|
5
|
%
|
619
|
|
-39
|
%
|
1,013
|
|
|||||||
|
Other (income) expense, net
|
720
|
|
-53
|
%
|
1,527
|
|
*
|
|
(11,613
|
)
|
|||||||
|
|
$
|
35,148
|
|
3
|
%
|
$
|
34,097
|
|
37
|
%
|
$
|
24,954
|
|
||||
* 100% or greater.
Materials and Production
Materials and production costs were
$13.9 billion
in
2016
,
$14.9 billion
in
2015
and
$16.8 billion
in
2014
. Costs include expenses for the amortization of intangible assets recorded in connection with business acquisitions which totaled $3.7 billion in 2016, $4.7 billion in 2015 and $4.2 billion in 2014. Costs in
2016
,
2015
and
2014
also include intangible asset impairment charges of
$347 million
,
$45 million
and
$1.1 billion
, respectively, related to marketed products and other intangibles (see Note 7 to the consolidated financial statements). The Company may recognize additional non-cash impairment charges in the future related to intangible assets that were measured at fair value and capitalized in connection with business acquisitions and such charges could be material. In addition, expenses for 2015 include $105 million of amortization of purchase accounting adjustments to Cubist’s inventories. Also included in materials and production costs are expenses associated with restructuring activities which amounted to
$181 million
,
$361 million
and
$482 million
in
2016
,
2015
and
2014
, respectively, including accelerated depreciation and asset write-offs related to the planned sale or closure of manufacturing facilities. Separation costs associated with manufacturing-related headcount reductions have been incurred and are reflected in
Restructuring costs
as discussed below.
Gross margin was 65.1% in
2016
compared with 62.2% in
2015
and 60.3% in
2014
. The improvement in gross margin in 2016 as compared with 2015 was driven primarily by a lower net impact from the amortization of intangible assets and purchase accounting adjustments to inventories, as well as intangible asset impairment charges and restructuring costs as noted above, which reduced gross margin by 10.6 percentage points in 2016 compared with 13.2 percentage points in 2015. Lower inventory write-offs and the favorable effects of foreign exchange also contributed to the gross margin improvement in 2016 as compared with 2015. The gross margin improvement in 2015 as compared with 2014 was driven primarily by the favorable effects of foreign exchange and lower inventory write-offs, as well
44
as the net impact of acquisitions and divestitures. The amortization of intangible assets and purchase accounting adjustments to inventories, as well as the restructuring and intangible asset impairment charges noted above reduced gross margin by13.6 percentage points in
2014
.
Marketing and Administrative
Marketing and administrative (M&A) expenses were $9.8 billion in 2016, a decline of 5% compared with 2015 driven largely by lower acquisition and divestiture-related costs, the favorable effects of foreign exchange, lower administrative expenses, such as legal defense costs, as well as lower selling costs. Higher promotional spending largely related to product launches and higher restructuring costs partially offset the decline. M&A expenses were $10.3 billion in 2015, a decline of 11% compared with 2014, largely reflecting the favorable effects of foreign exchange, the 2014 divestiture of MCC, additional expenses in 2014 related to the health care reform fee as discussed below, lower restructuring costs, as well as lower selling costs, partially offset by higher promotional spending largely related to product launches, higher costs related to the January acquisition of Cubist, and higher acquisition and divestiture-related costs. M&A expenses include acquisition and divestiture-related costs of $78 million, $436 million and $234 million in 2016, 2015 and 2014, respectively, consisting of integration, transaction, and certain other costs related to business acquisitions, including severance costs which are not part of the Company’s formal restructuring programs, as well as transaction and certain other costs related to divestitures of businesses. Acquisition and divestiture-related costs in 2015 include costs related to the acquisition of Cubist (see Note 3 to the consolidated financial statements). M&A expenses for
2016
,
2015
and
2014
also include restructuring costs of
$95 million
,
$78 million
and
$200 million
, respectively, related primarily to accelerated depreciation for facilities to be closed or divested. Separation costs associated with sales force reductions have been incurred and are reflected in
Restructuring costs
as discussed below.
On July 28, 2014, the Internal Revenue Service (IRS) issued final regulations on the annual non-tax deductible health care reform fee imposed by the Patient Protection and Affordable Care Act that is based on an allocation of a company’s market share of prior year branded pharmaceutical sales to certain government programs. The final IRS regulations accelerated the recognition criteria for the fee obligation by one year to the year in which the underlying sales used to allocate the fee occurred rather than the year in which the fee was paid. As a result of this change, Merck recorded an additional year of expense of $193 million during 2014.
Research and Development
Research and development (R&D) expenses were $10.1 billion in 2016 compared with $6.7 billion in 2015. The increase was driven primarily by higher acquired in-process research and development (IPR&D) impairment charges, increased clinical development spending, higher restructuring and licensing costs, partially offset by a reduction in expenses associated with a decrease in the estimated fair value measurement of liabilities for contingent consideration, as well as by the favorable effects of foreign exchange. R&D expenses were $6.7 billion in 2015, a decline of 7% compared with 2014, driven primarily by the favorable effects of foreign exchange, expenses recognized in 2014 to increase the estimated fair value of liabilities for contingent consideration, lower restructuring costs, a charge in 2014 related to a collaboration with Bayer AG (Bayer), and the 2014 divestiture of MCC, partially offset by the acquisition of Cubist, higher licensing costs and higher clinical development spending in 2015.
R&D expenses are comprised of the costs directly incurred by Merck Research Laboratories (MRL), the Company’s research and development division that focuses on human health-related activities, which were approximately $4.3 billion in 2016, $4.0 billion in 2015 and $3.7 billion in 2014. Also included in R&D expenses are costs incurred by other divisions in support of R&D activities, including depreciation, production and general and administrative, as well as licensing activity, and certain costs from operating segments, including the Pharmaceutical and Animal Health segments, which in the aggregate were $2.5 billion, $2.6 billion and $2.8 billion for 2016, 2015 and 2014, respectively. R&D expenses also include IPR&D impairment charges of
$3.6 billion
,
$63 million
and
$49 million
in
2016
,
2015
and
2014
, respectively (see “Research and Development” below). The Company may recognize additional non-cash impairment charges in the future related to the cancellation or delay of other pipeline programs that were measured at fair value and capitalized in connection with business acquisitions and such charges could be material. In addition, R&D expenses include expense or income related to changes in the estimated fair value measurement of liabilities for contingent consideration recorded in connection with acquisitions. During 2016 and 2015, the Company recorded a reduction in expenses of $402 million and $24 million, respectively, to decrease the estimated fair value of liabilities for contingent consideration related to the discontinuation or delay of certain programs (see Note 3 to the consolidated financial statements). During 2014, the Company recorded a charge of $316 million to
45
increase the estimated fair value of liabilities for contingent consideration. R&D expenses in
2016
,
2015
and
2014
also reflect
$142 million
,
$52 million
and
$283 million
, respectively, of accelerated depreciation and asset abandonment costs associated with restructuring activities.
Restructuring Costs
The Company incurs substantial costs for restructuring program activities related to Merck’s productivity and cost reduction initiatives, as well as in connection with the integration of certain acquired businesses. In 2010 and 2013, the Company commenced actions under global restructuring programs designed to streamline its cost structure. The actions under these programs include the elimination of positions in sales, administrative and headquarters organizations, as well as the sale or closure of certain manufacturing and research and development sites and the consolidation of office facilities. The Company also continues to reduce its global real estate footprint and improve the efficiency of its manufacturing and supply network. The non-facility related restructuring actions under these programs are substantially complete; the remaining activities primarily relate to ongoing facility rationalizations.
Restructuring costs, primarily representing separation and other related costs associated with these restructuring activities, were
$651 million
,
$619 million
and
$1.0 billion
in
2016
,
2015
and
2014
, respectively. In
2016
,
2015
and
2014
, separation costs of
$216 million
,
$208 million
and
$674 million
, respectively, were incurred associated with actual headcount reductions, as well as estimated expenses under existing severance programs for headcount reductions that were probable and could be reasonably estimated. Merck eliminated approximately
2,625
positions in
2016
,
3,770
positions in
2015
and
6,085
positions in
2014
related to these restructuring activities. These position eliminations are comprised of actual headcount reductions, and the elimination of contractors and vacant positions. Also included in restructuring costs are asset abandonment, shut-down and other related costs, as well as employee-related costs such as curtailment, settlement and termination charges associated with pension and other postretirement benefit plans and share-based compensation plan costs. For segment reporting, restructuring costs are unallocated expenses.
Additional costs associated with the Company’s restructuring activities are included in
Materials and production
,
Marketing and administrative
and
Research and development
as discussed above. The Company recorded aggregate pretax costs of
$1.1 billion
in 2016,
$1.1 billion
in 2015 and
$2.0 billion
in 2014 related to restructuring program activities (see Note 4 to the consolidated financial statements). The Company expects to substantially complete the remaining actions under the programs by the end of 2017 and incur approximately
$700 million
of additional pretax costs.
Other (Income) Expense, Net
Other (income) expense, net was
$720 million
of expense in
2016
,
$1.5 billion
of expense in
2015
and
$11.6 billion
of income in
2014
. For details on the components of
Other (income) expense, net
, see Note 14 to the consolidated financial statements.
|
Segment Profits
|
|||||||||||
|
($ in millions)
|
2016
|
2015
|
2014
|
||||||||
|
Pharmaceutical segment profits
|
$
|
22,180
|
|
$
|
21,658
|
|
$
|
22,164
|
|
||
|
Other non-reportable segment profits
|
1,507
|
|
1,573
|
|
2,386
|
|
|||||
|
Other
|
(19,028
|
)
|
(17,830
|
)
|
(7,267
|
)
|
|||||
|
Income before income taxes
|
$
|
4,659
|
|
$
|
5,401
|
|
$
|
17,283
|
|
||
Segment profits are comprised of segment sales less standard costs, certain operating expenses directly incurred by the segment, components of equity income or loss from affiliates and certain depreciation and amortization expenses. For internal management reporting presented to the chief operating decision maker, Merck does not allocate materials and production costs, other than standard costs, the majority of research and development expenses or general and administrative expenses, nor the cost of financing these activities. Separate divisions maintain responsibility for monitoring and managing these costs, including depreciation related to fixed assets utilized by these divisions and, therefore, they are not included in segment profits. Also excluded from the determination of segment profits are acquisition and divestiture-related costs, including the amortization of purchase accounting adjustments and intangible asset impairment charges, restructuring costs, taxes paid at the joint venture level and a portion of equity income. Additionally, segment profits do not reflect other expenses from corporate and manufacturing cost centers and other
46
miscellaneous income or expense. These unallocated items, including a charge related to the settlement of worldwide
Keytruda
patent litigation, gains on divestitures, a net charge related to the settlement of
Vioxx
shareholder class action litigation, the gain on AstraZeneca’s option exercise, foreign exchange losses related to the devaluation of the Company’s net monetary assets in Venezuela, the loss on extinguishment of debt and an additional year of expense related to the health care reform fee, are reflected in “Other” in the above table. Also included in “Other” are miscellaneous corporate profits (losses), as well as operating profits (losses) related to third-party manufacturing sales.
Pharmaceutical segment profits grew 2% in 2016 compared with 2015 primarily reflecting higher sales. Pharmaceutical segment profits declined 2% in 2015 compared with 2014 primarily reflecting the unfavorable effects of foreign exchange.
Taxes on Income
The effective income tax rates of
15.4%
in
2016
,
17.4%
in
2015
and
30.9%
in
2014
reflect the impacts of acquisition and divestiture-related costs, which in 2016 include $3.6 billion of IPR&D impairment charges, as well as restructuring costs and the beneficial impact of foreign earnings. The effective income tax rate for 2015 also reflects the favorable impact of a net benefit of $410 million related to the settlement of certain federal income tax issues, the impact of the net charge related to the settlement of
Vioxx
shareholder class action litigation being fully deductible at combined U.S. federal and state tax rates and the favorable impact of tax legislation enacted in the fourth quarter of 2015, as well as the unfavorable effect of non-tax deductible foreign exchange losses related to Venezuela (see Note 14 to the consolidated financial statements). The effective income tax rate for 2014 reflects the impact of the gain on the divestiture of MCC being taxed at combined U.S. federal and state tax rates. In addition, the effective income tax rate for 2014 includes a net tax benefit of $517 million recorded in connection with AstraZeneca’s option exercise (see Note 8 to the consolidated financial statements) and a benefit of approximately $300 million associated with a capital loss generated in connection with the sale of Sirna (see Note 3 to the consolidated financial statements). The effective income tax rate for 2014 also includes the unfavorable impact of an additional year of expense for the non-tax deductible health care reform fee that the Company recorded in accordance with final regulations issued by the IRS.
The Company is under examination by numerous tax authorities in various jurisdictions globally. The ultimate finalization of the Company’s examinations with relevant taxing authorities can include formal administrative and legal proceedings, which could have a significant impact on the timing of the reversal of unrecognized tax benefits. The Company believes that its reserves for uncertain tax positions are adequate to cover existing risks or exposures. However, there is one item that is currently under discussion with the IRS relating to the 2006 through 2008 examination. The Company has concluded that its position should be sustained upon audit. However, if this item were to result in an unfavorable outcome or settlement, it could have a material adverse impact on the Company’s financial position, liquidity and results of operations.
Net Income and Earnings per Common Share
Net income attributable to Merck & Co., Inc. was
$3.9 billion
in
2016
,
$4.4 billion
in
2015
and
$11.9 billion
in
2014
. EPS was
$1.41
in
2016
,
$1.56
in
2015
and
$4.07
in
2014
.
Non-GAAP Income and Non-GAAP EPS
Non-GAAP income and non-GAAP EPS are alternative views of the Company’s performance that Merck is providing because management believes this information enhances investors’ understanding of the Company’s results as it permits investors to understand how management assesses performance. Non-GAAP income and non-GAAP EPS exclude certain items because of the nature of these items and the impact that they have on the analysis of underlying business performance and trends. The excluded items (which should not be considered non-recurring) consist of acquisition and divestiture-related costs, restructuring costs and certain other items. These excluded items are significant components in understanding and assessing financial performance.
Non-GAAP income and non-GAAP EPS are important internal measures for the Company. Senior management receives a monthly analysis of operating results that includes non-GAAP EPS. Management uses these measures internally for planning and forecasting purposes and to measure the performance of the Company along with other metrics. Senior management’s annual compensation is derived in part using non-GAAP income and non-GAAP EPS. Since non-GAAP income and non-GAAP EPS are not measures determined in accordance with GAAP, they have no standardized meaning prescribed by GAAP and, therefore, may not be comparable to the calculation of
47
similar measures of other companies. The information on non-GAAP income and non-GAAP EPS should be considered in addition to, but not as a substitute for or superior to, net income and EPS prepared in accordance with generally accepted accounting principles in the United States (GAAP).
A reconciliation between GAAP financial measures and non-GAAP financial measures is as follows:
|
($ in millions except per share amounts)
|
2016
|
2015
|
2014
|
||||||||
|
Pretax income as reported under GAAP
|
$
|
4,659
|
|
$
|
5,401
|
|
$
|
17,283
|
|
||
|
Increase (decrease) for excluded items:
|
|||||||||||
|
Acquisition and divestiture-related costs
|
7,312
|
|
5,398
|
|
5,946
|
|
|||||
|
Restructuring costs
|
1,069
|
|
1,110
|
|
1,978
|
|
|||||
|
Other items:
|
|||||||||||
|
Charge related to the settlement of worldwide
Keytruda
patent litigation
|
625
|
|
—
|
|
—
|
|
|||||
|
Foreign currency devaluation related to Venezuela
|
—
|
|
876
|
|
—
|
|
|||||
|
Net charge related to the settlement of
Vioxx
shareholder class action litigation
|
—
|
|
680
|
|
—
|
|
|||||
|
Gain on sale of certain migraine clinical development programs
|
—
|
|
(250
|
)
|
—
|
|
|||||
|
Gain on divestiture of certain ophthalmic products
|
—
|
|
(147
|
)
|
(480
|
)
|
|||||
|
Gain on divestiture of Merck Consumer Care
|
—
|
|
—
|
|
(11,209
|
)
|
|||||
|
Gain on AstraZeneca option exercise
|
—
|
|
—
|
|
(741
|
)
|
|||||
|
Loss on extinguishment of debt
|
—
|
|
—
|
|
628
|
|
|||||
|
Additional year of expense for health care reform fee
|
—
|
|
—
|
|
193
|
|
|||||
|
Other
|
(67
|
)
|
(34
|
)
|
(9
|
)
|
|||||
|
|
13,598
|
|
13,034
|
|
13,589
|
|
|||||
|
Taxes on income as reported under GAAP
|
718
|
|
942
|
|
5,349
|
|
|||||
|
Estimated tax benefit (provision) on excluded items
(1)
|
2,321
|
|
1,470
|
|
(2,345
|
)
|
|||||
|
Net tax benefits from the settlements of federal income tax issues
|
—
|
|
410
|
|
—
|
|
|||||
|
Tax benefits related to sale of Sirna Therapeutics, Inc. subsidiary
|
—
|
|
—
|
|
300
|
|
|||||
|
|
3,039
|
|
2,822
|
|
3,304
|
|
|||||
|
Non-GAAP net income
|
10,559
|
|
10,212
|
|
10,285
|
|
|||||
|
Less: Net income attributable to noncontrolling interests as reported under GAAP
|
21
|
|
17
|
|
14
|
|
|||||
|
Acquisition and divestiture-related costs attributable to non-controlling interests
|
—
|
|
—
|
|
56
|
|
|||||
|
21
|
|
17
|
|
70
|
|
||||||
|
Non-GAAP net income attributable to Merck & Co., Inc.
|
$
|
10,538
|
|
$
|
10,195
|
|
$
|
10,215
|
|
||
|
EPS assuming dilution as reported under GAAP
|
$
|
1.41
|
|
$
|
1.56
|
|
$
|
4.07
|
|
||
|
EPS difference
(2)
|
2.37
|
|
2.03
|
|
(0.58
|
)
|
|||||
|
Non-GAAP EPS assuming dilution
|
$
|
3.78
|
|
$
|
3.59
|
|
$
|
3.49
|
|
||
|
(1)
|
The estimated tax impact on the excluded items is determined by applying the statutory rate of the originating territory of the non-GAAP adjustments. Amount for 2014 includes a net benefit of $517 million recorded in connection with AstraZeneca’s option exercise.
|
|
(2)
|
Represents the difference between calculated GAAP EPS and calculated non-GAAP EPS, which may be different than the amount calculated by dividing the impact of the excluded items by the weighted-average shares for the applicable year
.
|
Acquisition and Divestiture-Related Costs
Non-GAAP income and non-GAAP EPS exclude the impact of certain amounts recorded in connection with business acquisitions and divestitures. These amounts include the amortization of intangible assets and amortization of purchase accounting adjustments to inventories, as well as intangible asset impairment charges and expense or income related to changes in the estimated fair value measurement of contingent consideration. Also excluded are integration, transaction, and certain other costs associated with business acquisitions, including severance costs which are not part
48
of the Company’s formal restructuring programs, as well as transaction and certain other costs associated with divestitures of businesses.
Restructuring Costs
Non-GAAP income and non-GAAP EPS exclude costs related to restructuring actions (see Note 4 to the consolidated financial statements). These amounts include employee separation costs and accelerated depreciation associated with facilities to be closed or divested. Accelerated depreciation costs represent the difference between the depreciation expense to be recognized over the revised useful life of the asset, based upon the anticipated date the site will be closed or divested or the equipment disposed of, and depreciation expense as determined utilizing the useful life prior to the restructuring actions. Restructuring costs also include asset abandonment, shut-down and other related costs, as well as employee-related costs such as curtailment, settlement and termination charges associated with pension and other postretirement benefit plans and share-based compensation costs.
Certain Other Items
Non-GAAP income and non-GAAP EPS exclude certain other items. These items are adjusted for after evaluating them on an individual basis, considering their quantitative and qualitative aspects, and typically consist of items that are unusual in nature, significant to the results of a particular period or not indicative of future operating results. Excluded from non-GAAP income and non-GAAP EPS in 2016 is a charge to settle worldwide patent litigation related to
Keytruda
(see Note 10 to the consolidated financial statements). Excluded from non-GAAP income and non-GAAP EPS in 2015 are foreign exchange losses related to the devaluation of the Company’s net monetary assets in Venezuela (see Note 14 to the consolidated financial statements), a net charge related to the settlement of
Vioxx
shareholder class action litigation (see Note 10 to the consolidated financial statements), a gain on the sale of certain migraine clinical development programs (see Note 3 to the consolidated financial statements), a gain on the divestiture of the Company’s remaining ophthalmics business in international markets (see Note 3 to the consolidated financial statements), as well as a net tax benefit related to the settlement of certain federal income tax issues (see Note 15 to the consolidated financial statements). Excluded from non-GAAP income and non-GAAP EPS in 2014 are certain gains, including a gain on the divestiture of MCC (see Note 3 to the consolidated financial statements), a gain recognized in conjunction with AstraZeneca’s option exercise, including a related net tax benefit on the transaction (see Note 8 to the consolidated financial statements), a gain on the divestiture of certain ophthalmic products in several international markets (see Note 3 to the consolidated financial statements), as well as a loss on extinguishment of debt (see Note 9 to the consolidated financial statements), an additional year of expense related to the health care reform fee as discussed above, and tax benefits from the sale of the Company’s Sirna Therapeutics, Inc. (Sirna) subsidiary (see Note 3 to the consolidated financial statements).
Research and Development
A chart reflecting the Company’s current research pipeline as of February 24, 2017 is set forth in Item 1. “Business
—
Research and Development” above.
Research and Development Update
The Company currently has several candidates under regulatory review in the United States.
Keytruda
is an FDA-approved anti-PD-1 therapy in clinical development for expanded indications in different cancer types.
Keytruda
is currently approved for the treatment of NSCLC, melanoma, advanced melanoma, and head and neck cancer (see “Pharmaceutical Segment” above).
In February 2017, the FDA accepted for review two sBLAs for
Keytruda
in patients with locally advanced or metastatic urothelial cancer, including most bladder cancers. The application for first-line use was granted Priority Review for the treatment of these patients who are ineligible for cisplatin-containing therapy. The application for second-line use was granted Priority Review for these patients with disease progression on or after platinum-containing chemotherapy. The Prescription Drug User Fee Act (PDUFA) action date for both applications is June 14, 2017. The FDA previously granted Breakthrough Therapy designation to
Keytruda
for the second-line treatment of patients with locally advanced or metastatic urothelial cancer with disease progression on or after platinum-containing chemotherapy.
In January 2017, the FDA accepted for review an sBLA for
Keytruda
plus chemotherapy (pemetrexed plus carboplatin) for the first-line treatment of patients with metastatic or advanced non-squamous NSCLC regardless of
49
PD-L1 expression and with no EGFR or ALK genomic tumor aberrations. This is the first application for regulatory approval of
Keytruda
in combination with another treatment. The FDA granted Priority Review with a PDUFA action date of May 10, 2017. The sBLA will be reviewed under the FDA’s Accelerated Approval program.
In December 2016, the FDA accepted for review an sBLA for
Keytruda
for the treatment of patients with refractory classical Hodgkin lymphoma or for patients who have relapsed after three or more prior lines of therapy. The FDA granted Priority Review with a PDUFA action date of March 15, 2017. The sBLA will be reviewed under the FDA’s Accelerated Approval program.
In November 2016, the FDA accepted for review an sBLA for
Keytruda
for the treatment of previously treated patients with advanced microsatellite instability-high (MSI-H) cancer. The FDA granted Priority Review with a PDUFA action date of March 8, 2017. The sBLA will be reviewed under the FDA’s Accelerated Approval program. The FDA recently granted Breakthrough Therapy designation to
Keytruda
for unresectable or metastatic MSI-H non-colorectal cancer, and previously granted it for the treatment of patients with unresectable or metastatic MSI-H colorectal cancer.
Additionally,
Keytruda
has also received Breakthrough Therapy designation from the FDA for the treatment of patients with primary mediastinal B-cell lymphoma that is refractory to or has relapsed after two prior lines of therapy.
The FDA’s Breakthrough Therapy designation is intended to expedite the development and review of a candidate that is planned for use, alone or in combination, to treat a serious or life-threatening disease or condition when preliminary clinical evidence indicates that the drug may demonstrate substantial improvement over existing therapies on one or more clinically significant endpoints.
The
Keytruda
clinical development program consists of more than 400 clinical trials, including more than 200 trials that combine
Keytruda
with other cancer treatments. These studies encompass more than 30 cancer types including: bladder, colorectal, esophageal, gastric, head and neck, hepatocellular, Hodgkin lymphoma, non-Hodgkin lymphoma, melanoma, multiple myeloma, nasopharyngeal, NSCLC, ovarian, prostate, renal and triple-negative breast, many of which are currently in Phase 3 clinical development. Further trials are being planned for other cancers.
MK-1293 is an investigational follow-on biologic insulin glargine candidate for the treatment of patients with type 1 and type 2 diabetes under review by the FDA. MK-1293 was approved in the EU in January 2017. MK-1293 is being developed in collaboration with and partially funded by Samsung Bioepis.
V419 is an investigational pediatric hexavalent combination vaccine, DTaP5-IPV-Hib-HepB, under review with the FDA that is being developed and, if approved, will be commercialized through a partnership between Merck and Sanofi. This vaccine is designed to help protect against six important diseases - diphtheria, tetanus, pertussis (whooping cough), polio (poliovirus types 1, 2, and 3), invasive disease caused by
Haemophilus influenzae
type b (Hib), and hepatitis B. On November 2, 2015, the FDA issued a Complete Response Letter (CRL) with respect to the Biologics License Application for V419. Both companies are reviewing the CRL and plan to have further communication with the FDA. In February 2016, the EC granted marketing authorization for V419 for prophylaxis against diphtheria, tetanus, pertussis, hepatitis B, poliomyelitis, and invasive disease caused by Hib, in infants and toddlers from the age of 6 weeks. V419 is being marketed as
Vaxelis
in the EU.
In addition to the candidates under regulatory review, the Company has several drug candidates in Phase 3 clinical development in addition to the
Keytruda
programs discussed above.
MK-8931, verubecestat, is an investigational small molecule inhibitor of the beta-site amyloid precursor protein cleaving enzyme 1 (BACE1) for the treatment of Alzheimer’s disease. In February 2017, Merck announced that its external Data Monitoring Committee (eDMC) recommended termination of the Phase 2/3 EPOCH study of verubecestat in mild-to-moderate Alzheimer’s disease based on the low probability of success of this study. The same eDMC recommended that a separate Phase 3 study, APECS, evaluating verubecestat for amnestic mild cognitive impairment due to Alzheimer’s disease, also known as prodromal Alzheimer’s disease, continue as planned. Estimated primary completion date for the APECS study, which is fully enrolled, is February 2019.
MK-0859, anacetrapib, is an investigational inhibitor of the cholesteryl ester transfer protein (CETP) in development for raising HDL-C and reducing LDL-C. Anacetrapib is being evaluated in a 30,000 patient, event-driven cardiovascular clinical outcomes trial sponsored by Oxford University, REVEAL (Randomized EValuation of the Effects of Anacetrapib Through Lipid-modification), involving patients with preexisting vascular disease. In November
50
2015, Merck announced that the Data Monitoring Committee (DMC) of the REVEAL outcomes study completed its planned review of unblinded study data and recommended the study continue with no changes. The DMC reviewed safety and efficacy data from the study, which included an assessment of futility. Merck remains blinded to the actual results of this analysis and to other REVEAL safety and efficacy data. Under the study, the last patient’s last visit occurred in January 2017. The Company anticipates receiving the top-line results from the study mid-year 2017.
MK-7655A is a combination of relebactam, an investigational beta-lactamase inhibitor, and imipenem/cilastatin (an approved carbapenem antibiotic). The FDA has designated this combination a Qualified Infectious Disease Product with designated Fast Track status for the treatment of hospital-acquired bacterial pneumonia, ventilator-associated bacterial pneumonia, complicated intra-abdominal infections and complicated urinary tract infections.
MK-8228, letermovir, is an investigational oral once-daily or an intravenous infusion antiviral candidate for the prevention of clinically-significant cytomegalovirus (CMV) infection. Letermovir has received Orphan Drug Status in the EU and in the United States, where it has also been granted Fast Track designation. In October 2016, Merck announced that the pivotal Phase 3 clinical study of letermovir met its primary endpoint. The global, multicenter, randomized, placebo-controlled study evaluated the efficacy and safety of letermovir in adult (18 years and older) CMV-seropositive recipients of an allogeneic hematopoietic stem cell transplant. Merck plans to submit regulatory applications for the approval of letermovir in the United States and EU in 2017.
MK-8835, ertugliflozin, is an investigational oral SGLT2 inhibitor being evaluated for the treatment of type 2 diabetes in collaboration with Pfizer Inc. (Pfizer). In September 2016, Merck and Pfizer announced that a Phase 3 study (VERTIS SITA2) of ertugliflozin met its primary endpoint. Both 5 mg and 15 mg daily doses of ertugliflozin showed significantly greater reductions in A1C (an average measure of blood glucose over the past two to three months) when added to patients on a background of sitagliptin and metformin. Ertugliflozin is also being studied in combination with
Januvia
(sitagliptin) and metformin. In December 2016, Merck submitted New Drug Applications to the FDA for ertugliflozin and the two fixed-dose combinations: MK-8835A, ertugliflozin plus
Januvia
, and MK-8835B, ertugliflozin plus metformin. The Company anticipates a response from the FDA in the first quarter of 2017. Ertugliflozin and the two fixed-dose combinations are currently under review in the EU. Under the terms of the collaboration agreement with Pfizer, Merck will make a $90 million milestone payment to Pfizer in 2017.
MK-0431J is an investigational fixed-dose combination of sitagliptin and ipragliflozin under development for commercialization in Japan in collaboration with Astellas Pharma Inc. (Astellas). Ipragliflozin, an SGLT2 inhibitor, co-developed by Astellas and Kotobuki Pharmaceutical Co., Ltd. (Kotobuki), is approved for use in Japan and is being co-promoted with Merck and Kotobuki.
V920 is an investigational rVSV-ZEBOV (Ebola) vaccine candidate being studied in large scale Phase 2/3 clinical trials. In November 2014, Merck and NewLink Genetics announced an exclusive licensing and collaboration agreement for the investigational Ebola vaccine. In December 2015, Merck announced that the application for Emergency Use Assessment and Listing (EUAL) for V920 was accepted for review by the World Health Organization (WHO). According to the WHO, the EUAL process is designed to expedite the availability of vaccines needed for public health emergencies such as another outbreak of Ebola. The decision to grant V920 EUAL status will be based on data regarding quality, safety, and efficacy/effectiveness; as well as a risk/benefit analysis for emergency use. While EUAL designation allows for emergency use, the vaccine remains investigational and has not yet been licensed for commercial distribution. In July 2016, Merck announced that the FDA granted V920 Breakthrough Therapy designation, and that the EMA granted the vaccine candidate PRIME (PRIority MEdicines) status. In December 2016, end of study results from the WHO ring vaccination trial were reported in Lancet supporting the July 2015 interim assessment that V920 offers substantial protection against Ebola virus disease, with no reported cases among vaccinated individuals from 10 days after vaccination in both randomized and non-randomized clusters. Results from other ongoing studies are anticipated in the second half of 2017.
MK-1242, vericiguat, is an investigational treatment for heart failure being studied in a Phase 3 clinical trial in patients suffering from chronic heart failure. The development of vericiguat is part of a worldwide strategic collaboration between Merck and Bayer (see Note 3 to the consolidated financial statements).
V212 is an inactivated varicella zoster virus vaccine in development for the prevention of herpes zoster. The Company completed the Phase 3 trial in autologous hematopoietic cell transplant patients and is conducting another Phase 3 trial in patients with solid tumor malignancies undergoing chemotherapy and hematological malignancies. The
51
study in autologous hematopoietic cell transplant patients met its primary endpoints and Merck presented the results from this study at the American Society for Blood and Marrow Transplantation Meetings in February 2017.
MK-1439, doravirine, is an investigational non-nucleoside reverse transcriptase inhibitor being developed by Merck for the treatment of HIV-1 infection. In February 2017, the Company received positive results from a first Phase 3 study showing that doravirine was non-inferior to an alternative regimen in achieving and maintaining HIV-1 suppression in infected adults during 48 weeks of treatment.
In 2016, the Company also divested or discontinued certain drug candidates.
Merck announced that it is discontinuing the development of odanacatib, an investigational cathepsin K inhibitor for osteoporosis, and will not seek regulatory approval for its use. Merck previously reported a numeric imbalance in adjudicated stroke events in the pivotal Phase 3 fracture outcomes study in postmenopausal women. The Company has decided to discontinue development after an independent adjudication and analysis of major adverse cardiovascular events confirmed an increased risk of stroke.
The Company determined that, for business reasons, it would terminate the North America partnership agreement with ALK-Abelló that included MK-8237, an investigational allergy immunotherapy tablet for house dust mite allergy. Merck has given ALK-Abelló six months’ notice that it is terminating the agreement and therefore this compound will be returned to ALK-Abelló. This decision was not due to efficacy or safety concerns. In connection with the decision, the Company recorded an IPR&D impairment charge (see Note 7 to the consolidated financial statements).
The Company also decided, for business reasons, to discontinue the clinical development of MK-8342B, referred to as the Next Generation Ring, an investigational combination (etonogestrel and 17ß-estradiol) vaginal ring for contraception and the treatment of dysmenorrhea in women seeking contraception. This decision was not due to efficacy or safety concerns. As a result of this decision, the Company recorded an IPR&D impairment charge (see Note 7 to the consolidated financial statements).
Merck announced that, for business reasons, it will not proceed with submitting marketing applications for omarigliptin, an investigational, once-weekly DPP-4 inhibitor, in the United States or Europe. This decision did not result from concerns about the efficacy or safety of omarigliptin.
The Company maintains a number of long-term exploratory and fundamental research programs in biology and chemistry as well as research programs directed toward product development. The Company’s research and development model is designed to increase productivity and improve the probability of success by prioritizing the Company’s research and development resources on candidates the Company believes are capable of providing unambiguous, promotable advantages to patients and payers and delivering the maximum value of its approved medicines and vaccines through new indications and new formulations. Merck is pursuing emerging product opportunities independent of therapeutic area or modality (small molecule, biologics and vaccines) and is building its biologics capabilities. The Company is committed to making externally sourced programs a greater component of its pipeline strategy, with a focus on supplementing its internal research with a licensing and external alliance strategy focused on the entire spectrum of collaborations from early research to late-stage compounds, as well as access to new technologies.
The Company also reviews its pipeline to examine candidates which may provide more value through out-licensing. The Company continues to evaluate certain late-stage clinical development and platform technology assets to determine their out-licensing or sale potential.
The Company’s clinical pipeline includes candidates in multiple disease areas, including atherosclerosis, cancer, cardiovascular diseases, diabetes, infectious diseases, inflammatory/autoimmune diseases, neurodegenerative diseases, and respiratory diseases.
Acquired In-Process Research and Development
In connection with business acquisitions, the Company has recorded the fair value of in-process research projects which, at the time of acquisition, had not yet reached technological feasibility. At
December 31, 2016
, the balance of IPR&D was
$1.7 billion
. During 2016, the Company recorded IPR&D for projects obtained in connection with the acquisitions of Afferent and IOmet as discussed below.
52
During
2016
,
2015
and
2014
,
$8 million
,
$280 million
and
$654 million
, respectively, of IPR&D projects received marketing approval in a major market and the Company began amortizing these assets based on their estimated useful lives.
All of the IPR&D projects that remain in development are subject to the inherent risks and uncertainties in drug development and it is possible that the Company will not be able to successfully develop and complete the IPR&D programs and profitably commercialize the underlying product candidates. The time periods to receive approvals from the FDA and other regulatory agencies are subject to uncertainty. Significant delays in the approval process, or the Company’s failure to obtain approval at all, would delay or prevent the Company from realizing revenues from these products. Additionally, if certain of the IPR&D programs fail or are abandoned during development, then the Company will not realize the future cash flows it has estimated and recorded as IPR&D as of the acquisition date, and the Company may also not recover the research and development expenditures made since the acquisition to further develop such program. If such circumstances were to occur, the Company’s future operating results could be adversely affected and the Company may recognize impairment charges and such charges could be material.
During 2016, the Company recorded
$3.6 billion
of IPR&D impairment charges within
Research and development
expenses. Of this amount,
$2.9 billion
relates to the clinical development program for uprifosbuvir, a nucleotide prodrug in clinical development being evaluated for the treatment of HCV. The Company determined that recent changes to the product profile, as well as changes to Merck’s expectations for pricing and the market opportunity, taken together constituted a triggering event that required the Company to evaluate the uprifosbuvir intangible asset for impairment. Utilizing market participant assumptions, and considering different scenarios, the Company concluded that its best estimate of the current fair value of the intangible asset related to uprifosbuvir was $240 million, resulting in the recognition of the pretax impairment charge noted above. The IPR&D impairment charges in 2016 also include charges of
$180 million
and
$143 million
related to the discontinuation of programs obtained in connection with the acquisitions of cCAM Biotherapeutics Ltd. and OncoEthix, respectively, resulting from unfavorable efficacy data. An additional
$72 million
relates to programs obtained in connection with the SmartCells acquisition following a decision to terminate the lead compound due to a lack of efficacy and to pursue a back-up compound which reduced projected future cash flows. The IPR&D impairment charges in 2016 also include
$112 million
related to an in-licensed program for house dust mite allergies that, for business reasons, will be returned to the licensor. The remaining IPR&D impairment charges for 2016 primarily relate to deprioritized pipeline programs that were deemed to have no alternative use during the period, including a
$79 million
impairment charge for an investigational candidate for contraception. The discontinuation or delay of certain of these clinical development programs resulted in a reduction of the related liabilities for contingent consideration (see Note 3 to the consolidated financial statements).
During 2015, the Company recorded $63 million of IPR&D impairment charges, of which $50 million related to the surotomycin clinical development program. During 2015, the Company received unfavorable efficacy data from a clinical trial for surotomycin. The evaluation of this data, combined with an assessment of the commercial opportunity for surotomycin, resulted in the discontinuation of the program and the IPR&D impairment charge noted above.
During 2014, the Company recorded $49 million of IPR&D impairment charges primarily as a result of changes in cash flow assumptions for certain compounds obtained in connection with the Company’s joint venture with Supera Farma Laboratorios S.A., as well as for the discontinuation of certain Animal Health programs.
Additional research and development will be required before any of the remaining programs reach technological feasibility. The costs to complete the research projects will depend on whether the projects are brought to their final stages of development and are ultimately submitted to the FDA or other regulatory agencies for approval. As of
December 31, 2016
, the estimated costs to complete projects acquired in connection with acquisitions in Phase 3 development for human health were approximately $290 million.
Acquisitions, Research Collaborations and License Agreements
Merck continues to remain focused on pursuing opportunities that have the potential to drive both near- and long-term growth. Certain of the more recent significant transactions are described below. Merck is actively monitoring the landscape for growth opportunities that meet the Company’s strategic criteria.
In July 2016, Merck acquired Afferent, a privately held pharmaceutical company focused on the development of therapeutic candidates targeting the P2X3 receptor for the treatment of common, poorly-managed, neurogenic
53
conditions. Afferent’s lead investigational candidate, MK-7264 (formerly AF-219), is a selective, non-narcotic, orally-administered P2X3 antagonist being evaluated in a Phase 2b clinical trial for the treatment of refractory, chronic cough as well as in a Phase 2 clinical trial in idiopathic pulmonary fibrosis with cough. Total consideration transferred of $510 million included cash paid for outstanding Afferent shares of
$487 million
, as well as share-based compensation payments to settle equity awards attributable to precombination service and cash paid for transaction costs on behalf of Afferent. In addition, former Afferent shareholders are eligible to receive a total of up to an additional
$750 million
contingent upon the attainment of certain clinical development and commercial milestones for multiple indications and candidates, including MK-7264. This transaction was accounted for as an acquisition of a business; accordingly, the assets acquired and liabilities assumed were recorded at their respective fair values as of the acquisition date. The Company determined the fair value of the contingent consideration was
$223 million
at the acquisition date utilizing a probability-weighted estimated cash flow stream adjusted for the expected timing of each payment using an appropriate discount rate dependent on the nature and timing of the milestone payment. Merck recognized an intangible asset for IPR&D of
$832 million
, net deferred tax liabilities of
$258 million
, and other net assets of
$29 million
(primarily consisting of cash acquired). The excess of the consideration transferred over the fair value of net assets acquired of
$130 million
was recorded as goodwill that was allocated to the Pharmaceutical segment and is not deductible for tax purposes. The fair value of the identifiable intangible asset related to IPR&D was determined using an income approach, through which fair value is estimated based upon the asset’s probability-adjusted future net cash flows, which reflects the stage of development of the project and the associated probability of successful completion. The net cash flows were then discounted to present value using a discount rate of
11.5%
. Actual cash flows are likely to be different than those assumed.
In June 2016, Merck and Moderna entered into a strategic collaboration and license agreement to develop and commercialize novel mRNA-based personalized cancer vaccines. The development program will entail multiple studies in several types of cancer and include the evaluation of mRNA-based personalized cancer vaccines in combination with Merck’s
Keytruda
. Pursuant to the terms of the agreement, Merck made an upfront cash payment to Moderna of
$200 million
, which was recorded in
Research and development
expenses. Following human proof of concept studies, Merck has the right to elect to make an additional payment to Moderna. If Merck exercises this right, the two companies will then equally share cost and profits under a worldwide collaboration for the development of personalized cancer vaccines. Moderna will have the right to elect to co-promote the personalized cancer vaccines in the United States. The agreement entails exclusivity around combinations with
Keytruda
. Moderna and Merck will each have the ability to combine mRNA-based personalized cancer vaccines with other (non-PD-1) agents.
In January 2016, Merck acquired IOmet, a privately held UK-based drug discovery company focused on the development of innovative medicines for the treatment of cancer, with a particular emphasis on the fields of cancer immunotherapy and cancer metabolism. The acquisition provides Merck with IOmet’s preclinical pipeline of IDO (indoleamine-2,3-dioxygenase 1), TDO (tryptophan-2,3-dioxygenase), and dual-acting IDO/TDO inhibitors. The transaction was accounted for as an acquisition of a business. Total purchase consideration in the transaction included a cash payment of
$150 million
and future additional milestone payments of up to
$250 million
that are contingent upon certain clinical and regulatory milestones being achieved. The Company determined the fair value of the contingent consideration was
$94 million
at the acquisition date utilizing a probability-weighted estimated cash flow stream adjusted for the expected timing of each payment utilizing a discount rate of
10.5%
. Merck recognized intangible assets for IPR&D of
$155 million
and net deferred tax assets of
$32 million
. The excess of the consideration transferred over the fair value of net assets acquired of
$57 million
was recorded as goodwill that was allocated to the Pharmaceutical segment and is not deductible for tax purposes. The fair values of the identifiable intangible assets related to IPR&D were determined using an income approach. The assets’ probability-adjusted future net cash flows were then discounted to present value also using a discount rate of
10.5%
. Actual cash flows are likely to be different than those assumed.
Selected Joint Venture and Affiliate Information
Sanofi Pasteur MSD
On December 31, 2016, Merck and Sanofi terminated the equally-owned joint venture formed in 1994 to develop and market vaccines in Europe (see Note 8 to the consolidated financial statements).
54
Sales of joint venture products (prior to termination) were as follows:
|
($ in millions)
|
2016
|
2015
|
2014
|
||||||||
|
Gardasil/Gardasil
9
|
$
|
216
|
|
$
|
184
|
|
$
|
248
|
|
||
|
Influenza vaccines
|
106
|
|
128
|
|
159
|
|
|||||
|
Other viral vaccines
|
95
|
|
77
|
|
87
|
|
|||||
|
RotaTeq
|
56
|
|
56
|
|
65
|
|
|||||
|
Zostavax
|
52
|
|
87
|
|
103
|
|
|||||
|
Hepatitis vaccines
|
48
|
|
62
|
|
38
|
|
|||||
|
Other vaccines
|
435
|
|
329
|
|
430
|
|
|||||
|
|
$
|
1,008
|
|
$
|
923
|
|
$
|
1,130
|
|
||
AstraZeneca LP
On June 30, 2014, AstraZeneca exercised an option that resulted in the redemption of Merck’s remaining interest in AstraZeneca LP (AZLP), the partnership between Merck and AstraZeneca, for $419 million in cash (see Note 8 to the consolidated financial statements). Of this amount, $327 million reflected an estimate of the fair value of Merck’s interest in Nexium and Prilosec (products sold by AZLP). This portion of the exercise price, which is subject to a true-up in 2018 based on actual sales from closing in 2014 to June 2018, was deferred and recognized as income of
$5 million
,
$182 million
and
$140 million
, during 2016, 2015, and 2014, respectively, in
Other (income) expense, net
as the contingency was eliminated as sales occurred. Once the deferred income amount was fully amortized, in the first quarter of 2016, the Company began recognizing income and a corresponding receivable for amounts that will be due to Merck from AstraZeneca based on the sales performance of Nexium and Prilosec subject to the true-up in June 2018. The Company recognized
$93 million
of such income in 2016 included in
Other (income) expense, net
.
The remaining exercise price of $91 million primarily represents a multiple of ten times Merck’s average 1% annual profit allocation in the partnership for the three years prior to exercise. Merck recognized the $91 million as a gain in 2014 within
Other (income) expense, net
. The Company also recognized a non-cash gain of approximately $650 million in 2014 within
Other (income) expense, net
resulting from the retirement of $2.4 billion of preferred stock, the elimination of the Company’s $1.4 billion investment in AZLP and a $340 million reduction of goodwill. This transaction resulted in a net tax benefit of $517 million in 2014 primarily reflecting the reversal of deferred taxes on the AZLP investment balance.
In 2014, prior to termination, Merck recorded revenue from AZLP of $463 million and earned partnership returns of $192 million, which were recorded in equity income from affiliates included in
Other (income) expense, net
.
Capital Expenditures
Capital expenditures were
$1.6 billion
in
2016
,
$1.3 billion
in
2015
and
$1.3 billion
in
2014
. Expenditures in the United States were $1.0 billion in
2016
, $879 million in
2015
and $873 million in
2014
.
Depreciation expense was $1.6 billion in
2016
, $1.6 billion in
2015
and $2.5 billion in
2014
of which $1.0 billion, $1.1 billion and $2.0 billion, respectively, applied to locations in the United States. Total depreciation expense in
2016
,
2015
and
2014
included accelerated depreciation of
$227 million
,
$174 million
and
$900 million
, respectively, associated with restructuring activities (see Note 4 to the consolidated financial statements).
Analysis of Liquidity and Capital Resources
Merck’s strong financial profile enables it to fund research and development, focus on external alliances, support in-line products and maximize upcoming launches while providing significant cash returns to shareholders.
|
Selected Data
|
|||||||||||
|
($ in millions)
|
2016
|
2015
|
2014
|
||||||||
|
Working capital
|
$
|
13,410
|
|
$
|
10,550
|
|
$
|
14,198
|
|
||
|
Total debt to total liabilities and equity
|
26.0
|
%
|
26.0
|
%
|
21.7
|
%
|
|||||
|
Cash provided by operations to total debt
|
0.4:1
|
|
0.5:1
|
|
0.4:1
|
|
|||||
Cash provided by operating activities was
$10.4 billion
in
2016
,
$12.5 billion
in
2015
and
$8.0 billion
in
2014
. Cash provided by operating activities in 2016 reflects a net payment of approximately $680 million to fund the
55
Vioxx
shareholder class action litigation settlement not covered by insurance proceeds (see Note 10 to the consolidated financial statements). Cash provided by operating activities in 2014 reflects approximately $5.0 billion of taxes paid on the divestiture of MCC. Cash provided by operating activities continues to be the Company’s primary source of funds to finance operating needs, capital expenditures, a portion of treasury stock purchases and dividends paid to shareholders.
Cash used in investing activities was
$3.2 billion
in 2016 compared with
$4.8 billion
in 2015. The lower use of cash in 2016 was driven primarily by cash used in 2015 for the acquisition of Cubist, as well as lower purchases of securities and other investments in 2016, partially offset by lower proceeds from the sales of securities and other investments in 2016 and the use of cash in 2016 for the acquisitions of Afferent and StayWell. Cash used in investing activities was
$4.8 billion
in 2015 compared with
$374 million
in 2014 primarily reflecting cash received in 2014 from the divestiture of MCC, higher cash received in 2014 from other dispositions of businesses and in connection with AstraZeneca’s option exercise, as well as cash used for the acquisition of Cubist in 2015, partially offset by lower purchases of securities and other investments, higher proceeds from the sales of securities and other investments, cash used in 2014 for the acquisition of Idenix, and a cash payment made in 2014 upon the formation of the collaboration with Bayer.
Cash used in financing activities was
$9.0 billion
in 2016 compared with
$5.4 billion
in 2015 driven primarily by lower proceeds from the issuance of debt, partially offset by a decrease in short-term borrowings in the prior year, lower payments on debt, lower purchases of treasury stock and higher proceeds from the exercise of stock options. Cash used in financing activities was
$5.4 billion
in 2015 compared with
$15.2 billion
in 2014 driven primarily by higher proceeds from the issuance of debt, lower payments on debt and lower purchases of treasury stock, partially offset by lower proceeds from the exercise of stock options and a decrease in short-term borrowings.
During 2015, the Company recorded charges of $876 million related to the devaluation of its net monetary assets in Venezuela, the large majority of which was cash (see Note 14 to the consolidated financial statements).
At
December 31, 2016
, the total of worldwide cash and investments was
$25.8 billion
, including
$14.3 billion
of cash, cash equivalents and short-term investments, and
$11.4 billion
of long-term investments. Generally 80%-90% of cash and investments are held by foreign subsidiaries and would be subject to significant tax payments if such cash and investments were repatriated in the form of dividends. The Company records U.S. deferred tax liabilities for certain unremitted earnings, but when amounts earned overseas are expected to be indefinitely reinvested outside of the United States, no accrual for U.S. taxes is provided. The amount of cash and investments held by U.S. and foreign subsidiaries fluctuates due to a variety of factors including the timing and receipt of payments in the normal course of business. Cash provided by operating activities in the United States continues to be the Company’s primary source of funds to finance domestic operating needs, capital expenditures, a portion of treasury stock purchases and dividends paid to shareholders.
The Company’s contractual obligations as of
December 31, 2016
are as follows:
|
Payments Due by Period
|
|||||||||||||||||||
|
($ in millions)
|
Total
|
2017
|
2018—2019
|
2020—2021
|
Thereafter
|
||||||||||||||
|
Purchase obligations
(1)
|
$
|
2,131
|
|
$
|
655
|
|
$
|
744
|
|
$
|
435
|
|
$
|
297
|
|
||||
|
Loans payable and current portion of long-term debt
(2)
|
570
|
|
570
|
|
—
|
|
—
|
|
—
|
|
|||||||||
|
Long-term debt
|
24,266
|
|
—
|
|
4,277
|
|
4,156
|
|
15,833
|
|
|||||||||
|
Interest related to debt obligations
|
9,189
|
|
683
|
|
1,276
|
|
1,101
|
|
6,129
|
|
|||||||||
|
Keytruda
patent litigation settlement
|
625
|
|
625
|
|
—
|
|
—
|
|
—
|
|
|||||||||
|
Unrecognized tax benefits
(3)
|
2,014
|
|
2,014
|
|
—
|
|
—
|
|
—
|
|
|||||||||
|
Operating leases
|
754
|
|
200
|
|
263
|
|
151
|
|
140
|
|
|||||||||
|
|
$
|
39,549
|
|
$
|
4,747
|
|
$
|
6,560
|
|
$
|
5,843
|
|
$
|
22,399
|
|
||||
|
(1)
|
Includes future inventory purchases the Company has committed to in connection with certain divestitures.
|
|
(2)
|
In February 2017, $300 million of floating rate notes matured and were repaid.
|
|
(3)
|
As of
December 31, 2016
, the Company’s Consolidated Balance Sheet reflects liabilities for unrecognized tax benefits, interest and penalties of
$4.4 billion
, including
$2.0 billion
reflected as a current liability. Due to the high degree of uncertainty regarding the timing of future cash outflows of liabilities for unrecognized tax benefits beyond one year, a reasonable estimate of the period of cash settlement for years beyond
2017
cannot be made.
|
56
Purchase obligations are enforceable and legally binding obligations for purchases of goods and services including minimum inventory contracts, research and development and advertising. Amounts reflected for research and development obligations do not include contingent milestone payments. In 2017, the Company will make a $90 million milestone payment in connection with a clinical program being developed in a collaboration (see “Research and Development” above). Also excluded from research and development obligations are potential future funding commitments of up to approximately $90 million for investments in research venture capital funds. Loans payable and current portion of long-term debt reflects
$267 million
of long-dated notes that are subject to repayment at the option of the holders. Required funding obligations for
2017
relating to the Company’s pension and other postretirement benefit plans are not expected to be material. However, the Company currently anticipates contributing approximately
$50 million
to its U.S. pension plans,
$160 million
to its international pension plans and
$25 million
to its other postretirement benefit plans during
2017
.
In November 2016, the Company issued
€1.0 billion
principal amount of senior unsecured notes consisting of
€500 million
principal amount of
0.50%
notes due 2024 and
€500 million
principal amount of
1.375%
notes due 2036. The Company intends to use the net proceeds of the offering of
$1.1 billion
for general corporate purposes, including without limitation, the repayment of outstanding commercial paper borrowings and other indebtedness with upcoming maturities.
In June 2016, the Company terminated its existing credit facility and entered into a new $6.0 billion, five-year credit facility that matures in June 2021. The facility provides backup liquidity for the Company’s commercial paper borrowing facility and is to be used for general corporate purposes. The Company has not drawn funding from this facility.
In December 2015, the Company filed a securities registration statement with the U.S. Securities and Exchange Commission (SEC) under the automatic shelf registration process available to “well-known seasoned issuers” which is effective for three years.
In February 2015, Merck issued $8.0 billion aggregate principal amount of senior unsecured notes. The Company used a portion of the net proceeds of the offering of $7.9 billion to repay commercial paper issued to substantially finance the Company’s acquisition of Cubist. The remaining net proceeds were used for general corporate purposes, including for repurchases of the Company’s common stock, and the repayment of outstanding commercial paper borrowings and debt maturities.
Also in February 2015, the Company redeemed $1.9 billion of legacy Cubist debt acquired in the acquisition (see Note 3 to the consolidated financial statements).
In October 2014, the Company issued
€2.5 billion
principal amount of senior unsecured notes. The net proceeds of the offering of
$3.1 billion
were used in part to repay debt that was validly tendered in connection with tender offers launched by the Company for certain outstanding notes and debentures. The Company paid
$2.5 billion
in aggregate consideration (applicable purchase price together with accrued interest) to redeem
$1.8 billion
principal amount of debt. In November 2014, Merck redeemed an additional
$2.0 billion
principal amount of senior unsecured notes.
Effective as of November 3, 2009, the Company executed a full and unconditional guarantee of the then existing debt of its subsidiary Merck Sharp & Dohme Corp. (MSD) and MSD executed a full and unconditional guarantee of the then existing debt of the Company (excluding commercial paper), including for payments of principal and interest. These guarantees do not extend to debt issued subsequent to that date.
The Company continues to maintain a conservative financial profile. The Company places its cash and investments in instruments that meet high credit quality standards, as specified in its investment policy guidelines. These guidelines also limit the amount of credit exposure to any one issuer. The Company does not participate in any off-balance sheet arrangements involving unconsolidated subsidiaries that provide financing or potentially expose the Company to unrecorded financial obligations.
In November 2016, the Board of Directors declared a quarterly dividend of $0.47 per share on the Company’s common stock payable in January 2017.
In March 2015, Merck’s board of directors authorized additional purchases of up to $10 billion of Merck’s common stock for its treasury. The treasury stock purchase authorization has no time limit and will be made over time
57
in open-market transactions, block transactions, on or off an exchange, or in privately negotiated transactions. The Company purchased
$3.4 billion
of its common stock (
60 million
shares) for its treasury during
2016
. The Company has approximately $5.1 billion remaining under the March share repurchase program. The Company purchased
$4.2 billion
and
$7.7 billion
of its common stock during
2015
and
2014
, respectively, under this and previously authorized share repurchase programs.
Financial Instruments Market Risk Disclosures
The Company manages the impact of foreign exchange rate movements and interest rate movements on its earnings, cash flows and fair values of assets and liabilities through operational means and through the use of various financial instruments, including derivative instruments.
A significant portion of the Company’s revenues and earnings in foreign affiliates is exposed to changes in foreign exchange rates. The objectives and accounting related to the Company’s foreign currency risk management program, as well as its interest rate risk management activities are discussed below.
Foreign Currency Risk Management
The Company has established revenue hedging, balance sheet risk management, and net investment hedging programs to protect against volatility of future foreign currency cash flows and changes in fair value caused by volatility in foreign exchange rates.
The objective of the revenue hedging program is to reduce the variability caused by changes in foreign exchange rates that would affect the U.S. dollar value of future cash flows derived from foreign currency denominated sales, primarily the euro and Japanese yen. To achieve this objective, the Company will hedge a portion of its forecasted foreign currency denominated third-party and intercompany distributor entity sales (forecasted sales) that are expected to occur over its planning cycle, typically no more than two years into the future. The Company will layer in hedges over time, increasing the portion of forecasted sales hedged as it gets closer to the expected date of the forecasted foreign currency denominated sales. The portion of forecasted sales hedged is based on assessments of cost-benefit profiles that consider natural offsetting exposures, revenue and exchange rate volatilities and correlations, and the cost of hedging instruments. The Company manages its anticipated transaction exposure principally with purchased local currency put options, forward contracts, and purchased collar options.
Because Merck principally sells foreign currency in its revenue hedging program, a uniform weakening of the U.S. dollar would yield the largest overall potential loss in the market value of these hedge instruments. The market value of Merck’s hedges would have declined by an estimated $538 million and $502 million at
December 31, 2016
and
2015
, respectively, from a uniform 10% weakening of the U.S. dollar. The market value was determined using a foreign exchange option pricing model and holding all factors except exchange rates constant. Although not predictive in nature, the Company believes that a 10% threshold reflects reasonably possible near-term changes in Merck’s major foreign currency exposures relative to the U.S. dollar. The cash flows from these contracts are reported as operating activities in the Consolidated Statement of Cash Flows.
The Company manages operating activities and net asset positions at the local level in order to mitigate the effect of exchange on monetary assets and liabilities. The Company also uses a balance sheet risk management program to mitigate the exposure of net monetary assets that are denominated in a currency other than a subsidiary’s functional currency from the effects of volatility in foreign exchange. In these instances, Merck principally utilizes forward exchange contracts to offset the effects of exchange on exposures denominated in developed country currencies, primarily the euro and Japanese yen. For exposures in developing country currencies, the Company will enter into forward contracts to partially offset the effects of exchange on exposures when it is deemed economical to do so based on a cost-benefit analysis that considers the magnitude of the exposure, the volatility of the exchange rate and the cost of the hedging instrument. The cash flows from these contracts are reported as operating activities in the Consolidated Statements of Cash Flows.
A sensitivity analysis to changes in the value of the U.S. dollar on foreign currency denominated derivatives, investments and monetary assets and liabilities indicated that if the U.S. dollar uniformly weakened by 10% against all currency exposures of the Company at
December 31, 2016
,
Income before taxes
would have declined by approximately $26 million in
2016
. Because the Company was in a net short (payable) position relative to its major foreign currencies after consideration of forward contracts, a uniform weakening of the U.S. dollar will yield the largest overall potential net loss in earnings due to exchange. At December 31, 2015, the Company was in a net long (receivable)
58
position relative to its major foreign currencies after consideration of forward contracts, therefore a uniform 10% strengthening of the U.S. dollar would have reduced
Income before taxes
by approximately $45 million. This measurement assumes that a change in one foreign currency relative to the U.S. dollar would not affect other foreign currencies relative to the U.S. dollar. Although not predictive in nature, the Company believes that a 10% threshold reflects reasonably possible near-term changes in Merck’s major foreign currency exposures relative to the U.S. dollar. The cash flows from these contracts are reported as operating activities in the Consolidated Statement of Cash Flows.
Since January 2010, Venezuela has been designated hyperinflationary and, as a result, local foreign operations are remeasured in U.S. dollars with the impact recorded in results of operations. In 2015, the Venezuelan government identified multiple exchange rates, which included the CENCOEX rate (6.3 VEF per U.S. dollar) and the SIMADI rate. While the Venezuelan government had indicated that essential goods, including food and medicine, would remain at the CENCOEX rate, during the second quarter of 2015, upon evaluation of evolving economic conditions in Venezuela and volatility in the country, combined with a decline in transactions that were settled at the CENCOEX rate, the Company determined it was unlikely that all outstanding net monetary assets would be settled at the CENCOEX rate. Accordingly, during the second quarter of 2015, the Company recorded a charge of $715 million within
Other (income) expense, net
to devalue its net monetary assets in Venezuela to an amount that represented the Company’s estimate of the U.S. dollar amount that would ultimately be collected. During the third quarter of 2015, the Company recorded additional exchange losses of $138 million in the aggregate reflecting the ongoing effect of translating transactions and net monetary assets consistent with the second quarter. As a result of the further deterioration of economic conditions in Venezuela and continued declines in transactions which were settled at the CENCOEX rate (subsequently replaced by the DIPRO rate), in the fourth quarter of 2015, the Company began using the SIMADI rate, which was 198.70 VEF per U.S. at December 31, 2015, to report its Venezuelan operations. The Company also revalued its remaining net monetary assets at the SIMADI rate (subsequently replaced with the DICOM rate), which resulted in an additional charge in the fourth quarter of 2015 of $161 million.
The Company may also use forward exchange contracts to hedge its net investment in foreign operations against movements in exchange rates. The forward contracts are designated as hedges of the net investment in a foreign operation. The Company hedges a portion of the net investment in certain of its foreign operations and measures ineffectiveness based upon changes in spot foreign exchange rates that are recorded in
Other (income) expense, net
. The effective portion of the unrealized gains or losses on these contracts is recorded in foreign currency translation adjustment within
Other Comprehensive
Income
(
OCI
), and remains in
Accumulated Other Comprehensive Income
(
AOCI)
until either the sale or complete or substantially complete liquidation of the subsidiary. The cash flows from these contracts are reported as investing activities in the Consolidated Statement of Cash Flows.
Foreign exchange risk is also managed through the use of foreign currency debt. The Company’s senior unsecured euro-denominated notes have been designated as, and are effective as, economic hedges of the net investment in a foreign operation. Accordingly, foreign currency transaction gains or losses due to spot rate fluctuations on the euro-denominated debt instruments are included in foreign currency translation adjustment within
OCI
.
Interest Rate Risk Management
The Company may use interest rate swap contracts on certain investing and borrowing transactions to manage its net exposure to interest rate changes and to reduce its overall cost of borrowing. The Company does not use leveraged swaps and, in general, does not leverage any of its investment activities that would put principal capital at risk.
In May 2016, four interest rate swaps with notional amounts of $250 million each matured. These swaps effectively converted the Company’s $1.0 billion, 0.70% fixed-rate notes due 2016 to variable rate debt. At
December 31, 2016
, the Company was a party to
26
pay-floating, receive-fixed interest rate swap contracts designated as fair value hedges of fixed-rate notes in which the notional amounts match the amount of the hedged fixed-rate notes as detailed in the table below.
59
|
($ in millions)
|
2016
|
|||||||
|
Debt Instrument
|
Par Value of Debt
|
Number of Interest Rate Swaps Held
|
Total Swap Notional Amount
|
|||||
|
1.30% notes due 2018
|
1,000
|
|
4
|
|
1,000
|
|
||
|
5.00% notes due 2019
|
1,250
|
|
3
|
|
550
|
|
||
|
1.85% notes due 2020
|
1,250
|
|
5
|
|
1,250
|
|
||
|
3.875% notes due 2021
|
1,150
|
|
5
|
|
1,150
|
|
||
|
2.40% notes due 2022
|
1,000
|
|
4
|
|
1,000
|
|
||
|
2.35% notes due 2022
|
1,250
|
|
5
|
|
1,250
|
|
||
The interest rate swap contracts are designated hedges of the fair value changes in the notes attributable to changes in the benchmark London Interbank Offered Rate (LIBOR) swap rate. The fair value changes in the notes attributable to changes in the LIBOR swap rate are recorded in interest expense and offset by the fair value changes in the swap contracts. The cash flows from these contracts are reported as operating activities in the Consolidated Statement of Cash Flows.
The Company’s investment portfolio includes cash equivalents and short-term investments, the market values of which are not significantly affected by changes in interest rates. The market value of the Company’s medium- to long-term fixed-rate investments is modestly affected by changes in U.S. interest rates. Changes in medium- to long-term U.S. interest rates have a more significant impact on the market value of the Company’s fixed-rate borrowings, which generally have longer maturities. A sensitivity analysis to measure potential changes in the market value of Merck’s investments and debt from a change in interest rates indicated that a one percentage point increase in interest rates at
December 31, 2016
and
2015
would have positively affected the net aggregate market value of these instruments by $1.3 billion and $1.2 billion, respectively. A one percentage point decrease at
December 31, 2016
and
2015
would have negatively affected the net aggregate market value by $1.6 billion and $1.5 billion, respectively. The fair value of Merck’s debt was determined using pricing models reflecting one percentage point shifts in the appropriate yield curves. The fair values of Merck’s investments were determined using a combination of pricing and duration models.
Critical Accounting Policies
The Company’s consolidated financial statements are prepared in conformity with GAAP and, accordingly, include certain amounts that are based on management’s best estimates and judgments. Estimates are used when accounting for amounts recorded in connection with acquisitions, including initial fair value determinations of assets and liabilities, primarily IPR&D, other intangible assets and contingent consideration, as well as subsequent fair value measurements. Additionally, estimates are used in determining such items as provisions for sales discounts and returns, depreciable and amortizable lives, recoverability of inventories, including those produced in preparation for product launches, amounts recorded for contingencies, environmental liabilities and other reserves, pension and other postretirement benefit plan assumptions, share-based compensation assumptions, restructuring costs, impairments of long-lived assets (including intangible assets and goodwill) and investments, and taxes on income. Because of the uncertainty inherent in such estimates, actual results may differ from these estimates. Application of the following accounting policies result in accounting estimates having the potential for the most significant impact on the financial statements.
Acquisitions
To determine whether acquisitions qualify as business combinations or asset acquisitions, the Company makes certain judgments, which include assessment of the inputs, processes, and outputs associated with the acquired set of activities. On October 1, 2016, the Company adopted new accounting guidance intended to clarify whether transactions should be accounted for as acquisitions (or disposals) of assets or businesses. If the Company determines that substantially all of the fair value of gross assets included in a transaction is concentrated in a single asset (or a group of similar assets), the assets would not represent a business. To be considered a business, the assets in a transaction need to include an input and a substantive process that together significantly contribute to the ability to create outputs. Prior to the adoption of the new guidance, the Company would consider an acquisition or disposition a business if there were inputs, as well as processes that when applied to those inputs had the ability to create outputs.
In a business combination, the acquisition method of accounting requires that the assets acquired and liabilities assumed be recorded as of the date of the acquisition at their respective fair values with limited exceptions.
60
Assets acquired and liabilities assumed in a business combination that arise from contingencies are recognized at fair value if fair value can reasonably be estimated. If the acquisition date fair value of an asset acquired or liability assumed that arises from a contingency cannot be determined, the asset or liability is recognized if probable and reasonably estimable; if these criteria are not met, no asset or liability is recognized. Fair value is defined as the exchange price that would be received for an asset or paid to transfer a liability (an exit price) in the principal or most advantageous market for the asset or liability in an orderly transaction between market participants on the measurement date. Accordingly, the Company may be required to value assets at fair value measures that do not reflect the Company’s intended use of those assets. Any excess of the purchase price (consideration transferred) over the estimated fair values of net assets acquired is recorded as goodwill. Transaction costs and costs to restructure the acquired company are expensed as incurred. The operating results of the acquired business are reflected in the Company’s consolidated financial statements after the date of the acquisition. The fair values of intangible assets, including acquired IPR&D, are determined utilizing information available near the acquisition date based on expectations and assumptions that are deemed reasonable by management. Given the considerable judgment involved in determining fair values, the Company typically obtains assistance from third-party valuation specialists for significant items. Amounts allocated to acquired IPR&D are capitalized and accounted for as indefinite-lived intangible assets, subject to impairment testing until completion or abandonment of the projects. Upon successful completion of each project, Merck will make a separate determination as to the then useful life of the asset, generally determined by the period in which the substantial majority of the cash flows are expected to be generated, and begin amortization. Certain of the Company’s business acquisitions involve the potential for future payment of consideration that is contingent upon the achievement of performance milestones, including product development milestones and royalty payments on future product sales. The fair value of contingent consideration liabilities is determined at the acquisition date using unobservable inputs. These inputs include the estimated amount and timing of projected cash flows, the probability of success (achievement of the contingent event) and the risk-adjusted discount rate used to present value the probability-weighted cash flows. Subsequent to the acquisition date, at each reporting period, the contingent consideration liability is remeasured at current fair value with changes (either expense or income) recorded in earnings. Changes in any of the inputs may result in a significantly different fair value adjustment.
The judgments made in determining estimated fair values assigned to assets acquired and liabilities assumed in a business combination, as well as asset lives, can materially affect the Company’s results of operations.
If the Company determines the transaction will not be accounted for as an acquisition of a business, the transaction will be accounted for as an acquisition of assets rather than a business combination and, therefore, no goodwill will be recorded. In an asset acquisition, acquired IPR&D with no alternative future use is charged to expense at the acquisition date.
The fair values of identifiable intangible assets related to currently marketed products and product rights are primarily determined by using an income approach through which fair value is estimated based on each asset’s discounted projected net cash flows. The Company’s estimates of market participant net cash flows consider historical and projected pricing, margins and expense levels; the performance of competing products where applicable; relevant industry and therapeutic area growth drivers and factors; current and expected trends in technology and product life cycles; the time and investment that will be required to develop products and technologies; the ability to obtain marketing and regulatory approvals; the ability to manufacture and commercialize the products; the extent and timing of potential new product introductions by the Company’s competitors; and the life of each asset’s underlying patent, if any. The net cash flows are then probability-adjusted where appropriate to consider the uncertainties associated with the underlying assumptions, as well as the risk profile of the net cash flows utilized in the valuation. The probability-adjusted future net cash flows of each product are then discounted to present value utilizing an appropriate discount rate.
The fair values of identifiable intangible assets related to IPR&D are also determined using an income approach, through which fair value is estimated based on each asset’s probability-adjusted future net cash flows, which reflect the different stages of development of each product and the associated probability of successful completion. The net cash flows are then discounted to present value using an appropriate discount rate.
Revenue Recognition
Revenues from sales of products are recognized when title and risk of loss passes to the customer, typically at time of delivery. Recognition of revenue also requires reasonable assurance of collection of sales proceeds and
61
completion of all performance obligations. Domestically, sales discounts are issued to customers as direct discounts at the point-of-sale, indirectly through an intermediary wholesaler, known as chargebacks, or indirectly in the form of rebates. Additionally, sales are generally made with a limited right of return under certain conditions. Revenues are recorded net of provisions for sales discounts and returns, which are established at the time of sale. In addition, revenues are recorded net of time value of money discounts for customers for which collection of accounts receivable is expected to be in excess of one year.
The provision for aggregate indirect customer discounts covers chargebacks and rebates. Chargebacks are discounts that occur when a contracted customer purchases directly through an intermediary wholesaler. The contracted customer generally purchases product at its contracted price plus a mark-up from the wholesaler. The wholesaler, in turn, charges the Company back for the difference between the price initially paid by the wholesaler and the contract price paid to the wholesaler by the customer. The provision for chargebacks is based on expected sell-through levels by the Company’s wholesale customers to contracted customers, as well as estimated wholesaler inventory levels. Rebates are amounts owed based upon definitive contractual agreements or legal requirements with private sector and public sector (Medicaid and Medicare Part D) benefit providers, after the final dispensing of the product by a pharmacy to a benefit plan participant. The provision is based on expected payments, which are driven by patient usage and contract performance by the benefit provider customers.
The Company uses historical customer segment mix, adjusted for other known events, in order to estimate the expected provision. Amounts accrued for aggregate indirect customer discounts are evaluated on a quarterly basis through comparison of information provided by the wholesalers, health maintenance organizations, pharmacy benefit managers and other customers to the amounts accrued. Adjustments are recorded when trends or significant events indicate that a change in the estimated provision is appropriate.
The Company continually monitors its provision for aggregate indirect customer discounts. There were no material adjustments to estimates associated with the aggregate indirect customer discount provision in
2016
,
2015
or
2014
.
Summarized information about changes in the aggregate indirect customer discount accrual related to U.S. sales is as follows:
|
($ in millions)
|
2016
|
2015
|
|||||
|
Balance January 1
|
$
|
2,798
|
|
$
|
2,154
|
|
|
|
Current provision
|
9,831
|
|
8,068
|
|
|||
|
Adjustments to prior years
|
(169
|
)
|
(77
|
)
|
|||
|
Payments
|
(9,515
|
)
|
(7,347
|
)
|
|||
|
Balance December 31
|
$
|
2,945
|
|
$
|
2,798
|
|
|
Accruals for chargebacks are reflected as a direct reduction to accounts receivable and accruals for rebates as current liabilities. The accrued balances relative to these provisions included in
Accounts receivable
and
Accrued and other current liabilities
were
$196 million
and
$2.7 billion
, respectively, at
December 31, 2016
and were
$145 million
and
$2.7 billion
, respectively, at
December 31, 2015
.
The Company maintains a returns policy that allows its U.S. pharmaceutical customers to return product within a specified period prior to and subsequent to the expiration date (generally, three to six months before and 12 months after product expiration). The estimate of the provision for returns is based upon historical experience with actual returns. Additionally, the Company considers factors such as levels of inventory in the distribution channel, product dating and expiration period, whether products have been discontinued, entrance in the market of additional generic competition, changes in formularies or launch of over-the-counter products, among others. The product returns provision for U.S. pharmaceutical sales as a percentage of U.S. net pharmaceutical sales was 1.4% in
2016
, 1.5% in
2015
and 1.7% in
2014
.
Through its distribution programs with U.S. wholesalers, the Company encourages wholesalers to align purchases with underlying demand and maintain inventories below specified levels. The terms of the programs allow the wholesalers to earn fees upon providing visibility into their inventory levels, as well as by achieving certain performance parameters such as inventory management, customer service levels, reducing shortage claims and reducing product returns. Information provided through the wholesaler distribution programs includes items such as sales trends, inventory on-hand, on-order quantity and product returns.
62
Wholesalers generally provide only the above mentioned data to the Company, as there is no regulatory requirement to report lot level information to manufacturers, which is the level of information needed to determine the remaining shelf life and original sale date of inventory. Given current wholesaler inventory levels, which are generally less than a month, the Company believes that collection of order lot information across all wholesale customers would have limited use in estimating sales discounts and returns.
Inventories Produced in Preparation for Product Launches
The Company capitalizes inventories produced in preparation for product launches sufficient to support estimated initial market demand. Typically, capitalization of such inventory does not begin until the related product candidates are in Phase 3 clinical trials and are considered to have a high probability of regulatory approval. The Company monitors the status of each respective product within the regulatory approval process; however, the Company generally does not disclose specific timing for regulatory approval. If the Company is aware of any specific risks or contingencies other than the normal regulatory approval process or if there are any specific issues identified during the research process relating to safety, efficacy, manufacturing, marketing or labeling, the related inventory would generally not be capitalized. Expiry dates of the inventory are affected by the stage of completion. The Company manages the levels of inventory at each stage to optimize the shelf life of the inventory in relation to anticipated market demand in order to avoid product expiry issues. For inventories that are capitalized, anticipated future sales and shelf lives support the realization of the inventory value as the inventory shelf life is sufficient to meet initial product launch requirements. Inventories produced in preparation for product launches capitalized at
December 31, 2016
and
2015
were
$80 million
and
$63 million
, respectively.
Contingencies and Environmental Liabilities
The Company is involved in various claims and legal proceedings of a nature considered normal to its business, including product liability, intellectual property and commercial litigation, as well as certain additional matters (see Note 10 to the consolidated financial statements.) The Company records accruals for contingencies when it is probable that a liability has been incurred and the amount can be reasonably estimated. These accruals are adjusted periodically as assessments change or additional information becomes available. For product liability claims, a portion of the overall accrual is actuarially determined and considers such factors as past experience, number of claims reported and estimates of claims incurred but not yet reported. Individually significant contingent losses are accrued when probable and reasonably estimable.
Legal defense costs expected to be incurred in connection with a loss contingency are accrued when probable and reasonably estimable. Some of the significant factors considered in the review of these legal defense reserves are as follows: the actual costs incurred by the Company; the development of the Company’s legal defense strategy and structure in light of the scope of its litigation; the number of cases being brought against the Company; the costs and outcomes of completed trials and the most current information regarding anticipated timing, progression, and related costs of pre-trial activities and trials in the associated litigation. The amount of legal defense reserves as of
December 31, 2016
and
2015
of approximately
$185 million
and
$245 million
, respectively, represents the Company’s best estimate of the minimum amount of defense costs to be incurred in connection with its outstanding litigation; however, events such as additional trials and other events that could arise in the course of its litigation could affect the ultimate amount of legal defense costs to be incurred by the Company. The Company will continue to monitor its legal defense costs and review the adequacy of the associated reserves and may determine to increase the reserves at any time in the future if, based upon the factors set forth, it believes it would be appropriate to do so.
The Company and its subsidiaries are parties to a number of proceedings brought under the Comprehensive Environmental Response, Compensation and Liability Act, commonly known as Superfund, and other federal and state equivalents. When a legitimate claim for contribution is asserted, a liability is initially accrued based upon the estimated transaction costs to manage the site. Accruals are adjusted as site investigations, feasibility studies and related cost assessments of remedial techniques are completed, and as the extent to which other potentially responsible parties who may be jointly and severally liable can be expected to contribute is determined.
The Company is also remediating environmental contamination resulting from past industrial activity at certain of its sites and takes an active role in identifying and accruing for these costs. In the past, Merck performed a worldwide survey to assess all sites for potential contamination resulting from past industrial activities. Where assessment indicated that physical investigation was warranted, such investigation was performed, providing a better evaluation of the need for remedial action. Where such need was identified, remedial action was then initiated. As
63
definitive information became available during the course of investigations and/or remedial efforts at each site, estimates were refined and accruals were established or adjusted accordingly. These estimates and related accruals continue to be refined annually.
The Company believes that there are no compliance issues associated with applicable environmental laws and regulations that would have a material adverse effect on the Company. Expenditures for remediation and environmental liabilities were
$11 million
in
2016
, and are estimated at
$44 million
in the aggregate for the years
2017
through
2021
. In management’s opinion, the liabilities for all environmental matters that are probable and reasonably estimable have been accrued and totaled
$83 million
and
$109 million
at
December 31, 2016
and
2015
, respectively. These liabilities are undiscounted, do not consider potential recoveries from other parties and will be paid out over the periods of remediation for the applicable sites, which are expected to occur primarily over the next
15
years. Although it is not possible to predict with certainty the outcome of these matters, or the ultimate costs of remediation, management does not believe that any reasonably possible expenditures that may be incurred in excess of the liabilities accrued should exceed
$64 million
in the aggregate. Management also does not believe that these expenditures should result in a material adverse effect on the Company’s financial position, results of operations, liquidity or capital resources for any year.
Share-Based Compensation
The Company expenses all share-based payment awards to employees, including grants of stock options, over the requisite service period based on the grant date fair value of the awards. The Company determines the fair value of certain share-based awards using the Black-Scholes option-pricing model which uses both historical and current market data to estimate the fair value. This method incorporates various assumptions such as the risk-free interest rate, expected volatility, expected dividend yield and expected life of the options. Total pretax share-based compensation expense was
$300 million
in
2016
,
$299 million
in
2015
and
$278 million
in
2014
. At
December 31, 2016
, there was
$443 million
of total pretax unrecognized compensation expense related to nonvested stock option, restricted stock unit and performance share unit awards which will be recognized over a weighted average period of
1.9
years. For segment reporting, share-based compensation costs are unallocated expenses.
Pensions and Other Postretirement Benefit Plans
Net periodic benefit cost for pension and other postretirement benefit plans totaled
$56 million
in
2016
,
$253 million
in
2015
and
$169 million
in
2014
. Pension and other postretirement benefit plan information for financial reporting purposes is calculated using actuarial assumptions including a discount rate for plan benefit obligations and an expected rate of return on plan assets. The changes in net periodic benefit cost year over year for pension plans are largely attributable to changes in the discount rate affecting net amortization. The decrease in net periodic benefit cost for other postretirement benefit plans in 2016 as compared with 2015 is largely attributable to changes in retiree medical benefits approved by the Company in December 2015.
The Company reassesses its benefit plan assumptions on a regular basis. For both the pension and other postretirement benefit plans, the discount rate is evaluated on measurement dates and modified to reflect the prevailing market rate of a portfolio of high-quality fixed-income debt instruments that would provide the future cash flows needed to pay the benefits included in the benefit obligation as they come due. The discount rates for the Company’s U.S. pension and other postretirement benefit plans ranged from 3.40% to 4.30% at December 31, 2016, compared with a range of 3.80% to 4.80% at
December 31, 2015
.
The expected rate of return for both the pension and other postretirement benefit plans represents the average rate of return to be earned on plan assets over the period the benefits included in the benefit obligation are to be paid. In developing the expected rate of return, the Company considers long-term compound annualized returns of historical market data as well as actual returns on the Company’s plan assets. Using this reference information, the Company develops forward-looking return expectations for each asset category and a weighted-average expected long-term rate of return for a target portfolio allocated across these investment categories. The expected portfolio performance reflects the contribution of active management as appropriate. For
2017
, the expected rate of return for the Company’s U.S. pension and other postretirement benefit plans will range from
8.00%
to
8.75%
, as compared to a range of 7.30% to 8.75% in
2016
.
The Company has established investment guidelines for its U.S. pension and other postretirement plans to create an asset allocation that is expected to deliver a rate of return sufficient to meet the long-term obligation of each plan, given an acceptable level of risk. The target investment portfolio of the Company’s U.S. pension and other
64
postretirement benefit plans is allocated
40%
to
60%
in U.S. equities,
20%
to
40%
in international equities,
15%
to
25%
in fixed-income investments, and up to
5%
in cash and other investments. The portfolio’s equity weighting is consistent with the long-term nature of the plans’ benefit obligations. The expected annual standard deviation of returns of the target portfolio, which approximates
13%
, reflects both the equity allocation and the diversification benefits among the asset classes in which the portfolio invests. For non-U.S. pension plans, the targeted investment portfolio varies based on the duration of pension liabilities and local government rules and regulations. Although a significant percentage of plan assets are invested in U.S. equities, concentration risk is mitigated through the use of strategies that are diversified within management guidelines.
Actuarial assumptions are based upon management’s best estimates and judgment. A reasonably possible change of plus (minus) 25 basis points in the discount rate assumption, with other assumptions held constant, would have an estimated $81 million favorable (unfavorable) impact on the Company’s current year net periodic benefit cost. A reasonably possible change of plus (minus) 25 basis points in the expected rate of return assumption, with other assumptions held constant, would have an estimated $46 million favorable (unfavorable) impact on Merck’s current year net periodic benefit cost. Required funding obligations for
2017
relating to the Company’s pension and other postretirement benefit plans are not expected to be material. The preceding hypothetical changes in the discount rate and expected rate of return assumptions would not impact the Company’s funding requirements.
Net loss amounts, which reflect experience differentials primarily relating to differences between expected and actual returns on plan assets as well as the effects of changes in actuarial assumptions, are recorded as a component of
AOCI
. Expected returns for pension plans are based on a calculated market-related value of assets. Under this methodology, asset gains/losses resulting from actual returns that differ from the Company’s expected returns are recognized in the market-related value of assets ratably over a five-year period. Also, net loss amounts in
AOCI
in excess of certain thresholds are amortized into net periodic benefit cost over the average remaining service life of employees.
Restructuring Costs
Restructuring costs have been recorded in connection with restructuring programs designed to streamline the Company’s cost structure. As a result, the Company has made estimates and judgments regarding its future plans, including future termination benefits and other exit costs to be incurred when the restructuring actions take place. When accruing these costs, the Company will recognize the amount within a range of costs that is the best estimate within the range. When no amount within the range is a better estimate than any other amount, the Company recognizes the minimum amount within the range. In connection with these actions, management also assesses the recoverability of long-lived assets employed in the business. In certain instances, asset lives have been shortened based on changes in the expected useful lives of the affected assets. Severance and other related costs are reflected within
Restructuring costs
. Asset-related charges are reflected within
Materials and production
costs,
Marketing and administrative
expenses and
Research and development
expenses depending upon the nature of the asset.
Impairments of Long-Lived Assets
The Company assesses changes in economic, regulatory and legal conditions and makes assumptions regarding estimated future cash flows in evaluating the value of the Company’s property, plant and equipment, goodwill and other intangible assets.
The Company periodically evaluates whether current facts or circumstances indicate that the carrying values of its long-lived assets to be held and used may not be recoverable. If such circumstances are determined to exist, an estimate of the undiscounted future cash flows of these assets, or appropriate asset groupings, is compared to the carrying value to determine whether an impairment exists. If the asset is determined to be impaired, the loss is measured based on the difference between the asset’s fair value and its carrying value. If quoted market prices are not available, the Company will estimate fair value using a discounted value of estimated future cash flows approach.
Goodwill represents the excess of the consideration transferred over the fair value of net assets of businesses acquired and is assigned to reporting units. The Company tests its goodwill for impairment on at least an annual basis, or more frequently if impairment indicators exist, by first assessing qualitative factors to determine whether it is more likely than not that the fair value of a reporting unit is less than its carrying amount. Some of the factors considered in the assessment include general macroeconomic conditions, conditions specific to the industry and market, cost factors which could have a significant effect on earnings or cash flows, the overall financial performance of the reporting unit, and whether there have been sustained declines in the Company’s share price. Additionally, the Company evaluates
65
the extent to which the fair value exceeded the carrying value of the reporting unit at the last date a valuation was performed. If the Company concludes it is more likely than not that the fair value of a reporting unit is less than its carrying amount, a quantitative fair value test is performed.
Other acquired intangible assets (excluding IPR&D) are recorded at fair value, assigned an estimated useful life, and are amortized primarily on a straight-line basis over their estimated useful lives. When events or circumstances warrant a review, the Company will assess recoverability from future operations using pretax undiscounted cash flows derived from the lowest appropriate asset groupings. Impairments are recognized in operating results to the extent that the carrying value of the intangible asset exceeds its fair value, which is determined based on the net present value of estimated future cash flows.
IPR&D that the Company acquires through business combinations represents the fair value assigned to incomplete research projects which, at the time of acquisition, have not reached technological feasibility. The amounts are capitalized and accounted for as indefinite-lived intangible assets, subject to impairment testing until completion or abandonment of the project. The Company tests IPR&D for impairment at least annually, or more frequently if impairment indicators exist, by first assessing qualitative factors to determine whether it is more likely than not that the fair value of the IPR&D intangible asset is less than its carrying amount. If the Company concludes it is more likely than not that the fair value is less than the carrying amount, a quantitative test that compares the fair value of the IPR&D intangible asset with its carrying value is performed. For impairment testing purposes, the Company may combine separately recorded IPR&D intangible assets into one unit of account based on the relevant facts and circumstances. Generally, the Company will combine IPR&D intangible assets for testing purposes if they operate as a single asset and are essentially inseparable. If the fair value is less than the carrying amount, an impairment loss is recognized within the Company’s operating results.
The judgments made in evaluating impairment of long-lived intangibles can materially affect the Company’s results of operations.
Impairments of Investments
The Company reviews its investments for impairments based on the determination of whether the decline in market value of the investment below the carrying value is other-than-temporary. The Company considers available evidence in evaluating potential impairments of its investments, including the duration and extent to which fair value is less than cost and, for equity securities, the Company’s ability and intent to hold the investments. For debt securities, an other-than-temporary impairment has occurred if the Company does not expect to recover the entire amortized cost basis of the debt security. If the Company does not intend to sell the impaired debt security, and it is not more likely than not it will be required to sell the debt security before the recovery of its amortized cost basis, the amount of the other-than-temporary impairment recognized in earnings is limited to the portion attributed to credit loss. The remaining portion of the other-than-temporary impairment related to other factors is recognized in
OCI
.
Taxes on Income
The Company’s effective tax rate is based on pretax income, statutory tax rates and tax planning opportunities available in the various jurisdictions in which the Company operates. An estimated effective tax rate for a year is applied to the Company’s quarterly operating results. In the event that there is a significant unusual or one-time item recognized, or expected to be recognized, in the Company’s quarterly operating results, the tax attributable to that item would be separately calculated and recorded at the same time as the unusual or one-time item. The Company considers the resolution of prior year tax matters to be such items. Significant judgment is required in determining the Company’s tax provision and in evaluating its tax positions. The recognition and measurement of a tax position is based on management’s best judgment given the facts, circumstances and information available at the reporting date. The Company evaluates tax positions to determine whether the benefits of tax positions are more likely than not of being sustained upon audit based on the technical merits of the tax position. For tax positions that are more likely than not of being sustained upon audit, the Company recognizes the largest amount of the benefit that is greater than 50% likely of being realized upon ultimate settlement in the financial statements. For tax positions that are not more likely than not of being sustained upon audit, the Company does not recognize any portion of the benefit in the financial statements. If the more likely than not threshold is not met in the period for which a tax position is taken, the Company may subsequently recognize the benefit of that tax position if the tax matter is effectively settled, the statute of limitations expires, or if the more likely than not threshold is met in a subsequent period (see Note 15 to the consolidated financial statements.)
66
Tax regulations require items to be included in the tax return at different times than the items are reflected in the financial statements. Timing differences create deferred tax assets and liabilities. Deferred tax assets generally represent items that can be used as a tax deduction or credit in the tax return in future years for which the Company has already recorded the tax benefit in the financial statements. The Company establishes valuation allowances for its deferred tax assets when the amount of expected future taxable income is not likely to support the use of the deduction or credit. Deferred tax liabilities generally represent tax expense recognized in the financial statements for which payment has been deferred or expense for which the Company has already taken a deduction on the tax return, but has not yet recognized as expense in the financial statements. At
December 31, 2016
, foreign earnings of
$63.1 billion
have been retained indefinitely by subsidiary companies for reinvestment; therefore, no provision has been made for income taxes that would be payable upon the distribution of such earnings and it would not be practicable to determine the amount of the related unrecognized deferred income tax liability.
Recently Issued Accounting Standards
In May 2014, the Financial Accounting Standards Board (FASB) issued amended accounting guidance on revenue recognition that will be applied to all contracts with customers. The objective of the new guidance is to improve comparability of revenue recognition practices across entities and to provide more useful information to users of financial statements through improved disclosure requirements. In August 2015, the FASB approved a one-year deferral of the effective date making this guidance effective for interim and annual periods beginning in 2018. The new standard permits two methods of adoption: retrospectively to each prior reporting period presented (full retrospective method), or retrospectively with the cumulative effect of adopting the guidance being recognized at the date of initial application (modified retrospective method). The Company will adopt the new standard on January 1, 2018 and currently plans to use the modified retrospective method. The majority of the Company’s business is ship and bill and, on that primary revenue stream, Merck does not expect significant differences. However, the Company’s analysis is preliminary and subject to change. Merck has not completed its assessment of multiple element arrangements and certain discount and trade promotion programs.
In January 2016, the FASB issued revised guidance for the accounting and reporting of financial instruments. The new guidance requires that equity investments with readily determinable fair values currently classified as available for sale be measured at fair value with changes in fair value recognized in net income. The new guidance also simplifies the impairment testing of equity investments without readily determinable fair values and changes certain disclosure requirements. This guidance is effective for interim and annual periods beginning in 2018. Early adoption is not permitted. The Company is currently assessing the impact of adoption on its consolidated financial statements.
In February 2016, the FASB issued new accounting guidance for the accounting and reporting of leases. The new guidance requires that lessees recognize a right-of-use asset and a lease liability recorded on the balance sheet for each of its leases (other than leases that meet the definition of a short-term lease). Leases will be classified as either operating or finance. Operating leases will result in straight-line expense in the income statement (similar to current operating leases) while finance leases will result in more expense being recognized in the earlier years of the lease term (similar to current capital leases). The new guidance will be effective for interim and annual periods beginning in 2019. Early adoption is permitted. The Company is currently evaluating the impact of adoption on its consolidated financial statements.
In June 2016, the FASB issued amended guidance on the accounting for credit losses on financial instruments within its scope. The guidance introduces an expected loss model for estimating credit losses, replacing the incurred loss model. The new guidance also changes the impairment model for available-for-sale debt securities, requiring the use of an allowance to record estimated credit losses (and subsequent recoveries). The new guidance is effective for interim and annual periods beginning in 2020, with earlier application permitted in 2019. The Company is currently evaluating the impact of adoption on its consolidated financial statements.
In August 2016, the FASB issued guidance on the classification of certain cash receipts and payments in the statement of cash flows intended to reduce diversity in practice. The guidance is effective for interim and annual periods beginning in 2018. Early adoption is permitted. The guidance is to be applied retrospectively to all periods presented but may be applied prospectively if retrospective application would be impracticable. The Company is currently evaluating the effect of the standard on its Consolidated Statement of Cash Flows.
67
In October 2016, the FASB issued guidance on the accounting for the income tax consequences of intra-entity transfers of assets other than inventory. Under existing guidance, the recognition of current and deferred income taxes for an intra-entity asset transfer is prohibited until the asset has been sold to a third party. The new guidance will require the recognition of the income tax consequences of an intra-entity transfer of an asset (with the exception of inventory) when the intra-entity transfer occurs. The guidance is effective for interim and annual periods beginning in 2018. Early adoption is permitted. The new guidance is to be applied on a modified retrospective basis through a cumulative-effect adjustment directly to retained earnings in the beginning of the period of adoption. The Company does not anticipate the adoption of the new guidance will have a material effect on its consolidated financial statements.
In November 2016, the FASB issued guidance requiring that amounts generally described as restricted cash and restricted cash equivalents be included with cash and cash equivalents when reconciling the beginning-of-period and end-of-period total amounts shown on the statement of cash flows. The guidance is effective for interim and annual periods beginning in 2018 and should be applied using a retrospective transition method to each period presented. Early adoption is permitted. The Company is currently evaluating the effect of the standard on its Consolidated Statement of Cash Flows.
In January 2017, the FASB issued guidance that provides for the elimination of Step 2 from the goodwill impairment test. If impairment charges are recognized, the amount recorded will be the amount by which the carrying amount exceeds the reporting unit’s fair value with certain limitations. The new guidance is effective for interim and annual periods in 2021. The Company does not anticipate the adoption of the new guidance will have a material effect on its consolidated financial statements.
Cautionary Factors That May Affect Future Results
This report and other written reports and oral statements made from time to time by the Company may contain so-called “forward-looking statements,” all of which are based on management’s current expectations and are subject to risks and uncertainties which may cause results to differ materially from those set forth in the statements. One can identify these forward-looking statements by their use of words such as “anticipates,” “expects,” “plans,” “will,” “estimates,” “forecasts,” “projects” and other words of similar meaning. One can also identify them by the fact that they do not relate strictly to historical or current facts. These statements are likely to address the Company’s growth strategy, financial results, product development, product approvals, product potential and development programs. One must carefully consider any such statement and should understand that many factors could cause actual results to differ materially from the Company’s forward-looking statements. These factors include inaccurate assumptions and a broad variety of other risks and uncertainties, including some that are known and some that are not. No forward-looking statement can be guaranteed and actual future results may vary materially.
The Company does not assume the obligation to update any forward-looking statement. One should carefully evaluate such statements in light of factors, including risk factors, described in the Company’s filings with the Securities and Exchange Commission, especially on this Form 10-K and Forms 10-Q and 8-K. In Item 1A. “Risk Factors” of this annual report on Form 10-K the Company discusses in more detail various important risk factors that could cause actual results to differ from expected or historic results. The Company notes these factors for investors as permitted by the Private Securities Litigation Reform Act of 1995. One should understand that it is not possible to predict or identify all such factors. Consequently, the reader should not consider any such list to be a complete statement of all potential risks or uncertainties.
|
Item 7a.
|
Quantitative and Qualitative Disclosures about Market Risk.
|
The information required by this Item is incorporated by reference to the discussion under “Financial Instruments Market Risk Disclosures” in Item 7. “Management’s Discussion and Analysis of Financial Condition and Results of Operations.”
68
|
Item 8.
|
Financial Statements and Supplementary Data.
|
|
(a)
|
Financial Statements
|
The consolidated balance sheet of Merck & Co., Inc. and subsidiaries as of
December 31, 2016
and
2015
, and the related consolidated statements of income, of comprehensive income, of equity and of cash flows for each of the three years in the period ended
December 31, 2016
, the notes to consolidated financial statements, and the report dated February 28,
2017
of PricewaterhouseCoopers LLP, independent registered public accounting firm, are as follows:
Merck & Co., Inc. and Subsidiaries
Years Ended December 31
($ in millions except per share amounts)
|
2016
|
2015
|
2014
|
|||||||||
|
Sales
|
$
|
39,807
|
|
$
|
39,498
|
|
$
|
42,237
|
|
||
|
Costs, Expenses and Other
|
|||||||||||
|
Materials and production
|
13,891
|
|
14,934
|
|
16,768
|
|
|||||
|
Marketing and administrative
|
9,762
|
|
10,313
|
|
11,606
|
|
|||||
|
Research and development
|
10,124
|
|
6,704
|
|
7,180
|
|
|||||
|
Restructuring costs
|
651
|
|
619
|
|
1,013
|
|
|||||
|
Other (income) expense, net
|
720
|
|
1,527
|
|
(11,613
|
)
|
|||||
|
|
35,148
|
|
34,097
|
|
24,954
|
|
|||||
|
Income Before Taxes
|
4,659
|
|
5,401
|
|
17,283
|
|
|||||
|
Taxes on Income
|
718
|
|
942
|
|
5,349
|
|
|||||
|
Net Income
|
3,941
|
|
4,459
|
|
11,934
|
|
|||||
|
Less: Net Income Attributable to Noncontrolling Interests
|
21
|
|
17
|
|
14
|
|
|||||
|
Net Income Attributable to Merck & Co., Inc.
|
$
|
3,920
|
|
$
|
4,442
|
|
$
|
11,920
|
|
||
|
Basic Earnings per Common Share Attributable to Merck & Co., Inc. Common Shareholders
|
$
|
1.42
|
|
$
|
1.58
|
|
$
|
4.12
|
|
||
|
Earnings per Common Share Assuming Dilution Attributable to Merck & Co., Inc. Common Shareholders
|
$
|
1.41
|
|
$
|
1.56
|
|
$
|
4.07
|
|
||
Consolidated Statement of Comprehensive Income
Merck & Co., Inc. and Subsidiaries
Years Ended December 31
($ in millions)
|
2016
|
2015
|
2014
|
|||||||||
|
Net Income Attributable to Merck & Co., Inc.
|
$
|
3,920
|
|
$
|
4,442
|
|
$
|
11,920
|
|
||
|
Other Comprehensive Income (Loss) Net of Taxes:
|
|||||||||||
|
Net unrealized (loss) gain on derivatives, net of reclassifications
|
(66
|
)
|
(126
|
)
|
398
|
|
|||||
|
Net unrealized (loss) gain on investments, net of reclassifications
|
(44
|
)
|
(70
|
)
|
57
|
|
|||||
|
Benefit plan net (loss) gain and prior service (cost) credit, net of amortization
|
(799
|
)
|
579
|
|
(2,077
|
)
|
|||||
|
Cumulative translation adjustment
|
(169
|
)
|
(208
|
)
|
(504
|
)
|
|||||
|
|
(1,078
|
)
|
175
|
|
(2,126
|
)
|
|||||
|
Comprehensive Income Attributable to Merck & Co., Inc.
|
$
|
2,842
|
|
$
|
4,617
|
|
$
|
9,794
|
|
||
The accompanying notes are an integral part of these consolidated financial statements.
69
Merck & Co., Inc. and Subsidiaries
December 31
($ in millions except per share amounts)
|
2016
|
2015
|
||||||
|
Assets
|
|||||||
|
Current Assets
|
|||||||
|
Cash and cash equivalents
|
$
|
6,515
|
|
$
|
8,524
|
|
|
|
Short-term investments
|
7,826
|
|
4,903
|
|
|||
|
Accounts receivable (net of allowance for doubtful accounts of $195 in 2016
and $165 in 2015) (excludes accounts receivable of $10 in 2015
classified in Other assets)
|
7,018
|
|
6,484
|
|
|||
|
Inventories (excludes inventories of $1,117 in 2016 and $1,569
in 2015 classified in Other assets - see Note 6)
|
4,866
|
|
4,700
|
|
|||
|
Other current assets
|
4,389
|
|
5,140
|
|
|||
|
Total current assets
|
30,614
|
|
29,751
|
|
|||
|
Investments
|
11,416
|
|
13,039
|
|
|||
|
Property, Plant and Equipment (at cost)
|
|||||||
|
Land
|
412
|
|
490
|
|
|||
|
Buildings
|
11,439
|
|
12,154
|
|
|||
|
Machinery, equipment and office furnishings
|
14,053
|
|
14,261
|
|
|||
|
Construction in progress
|
1,871
|
|
1,525
|
|
|||
|
27,775
|
|
28,430
|
|
||||
|
Less: accumulated depreciation
|
15,749
|
|
15,923
|
|
|||
|
|
12,026
|
|
12,507
|
|
|||
|
Goodwill
|
18,162
|
|
17,723
|
|
|||
|
Other Intangibles, Net
|
17,305
|
|
22,602
|
|
|||
|
Other Assets
|
5,854
|
|
6,055
|
|
|||
|
|
$
|
95,377
|
|
$
|
101,677
|
|
|
|
Liabilities and Equity
|
|||||||
|
Current Liabilities
|
|||||||
|
Loans payable and current portion of long-term debt
|
$
|
568
|
|
$
|
2,583
|
|
|
|
Trade accounts payable
|
2,807
|
|
2,533
|
|
|||
|
Accrued and other current liabilities
|
10,274
|
|
11,216
|
|
|||
|
Income taxes payable
|
2,239
|
|
1,560
|
|
|||
|
Dividends payable
|
1,316
|
|
1,309
|
|
|||
|
Total current liabilities
|
17,204
|
|
19,201
|
|
|||
|
Long-Term Debt
|
24,274
|
|
23,829
|
|
|||
|
Deferred Income Taxes
|
5,077
|
|
6,535
|
|
|||
|
Other Noncurrent Liabilities
|
8,514
|
|
7,345
|
|
|||
|
Merck & Co., Inc. Stockholders’ Equity
|
|||||||
|
Common stock, $0.50 par value
Authorized - 6,500,000,000 shares
Issued - 3,577,103,522 shares in 2016 and 2015
|
1,788
|
|
1,788
|
|
|||
|
Other paid-in capital
|
39,939
|
|
40,222
|
|
|||
|
Retained earnings
|
44,133
|
|
45,348
|
|
|||
|
Accumulated other comprehensive loss
|
(5,226
|
)
|
(4,148
|
)
|
|||
|
80,634
|
|
83,210
|
|
||||
|
Less treasury stock, at cost:
828,372,200 shares in 2016 and 795,975,449 shares in 2015
|
40,546
|
|
38,534
|
|
|||
|
Total Merck & Co., Inc. stockholders’ equity
|
40,088
|
|
44,676
|
|
|||
|
Noncontrolling Interests
|
220
|
|
91
|
|
|||
|
Total equity
|
40,308
|
|
44,767
|
|
|||
|
|
$
|
95,377
|
|
$
|
101,677
|
|
|
The accompanying notes are an integral part of this consolidated financial statement.
70
Consolidated Statement of Equity
Merck & Co., Inc. and Subsidiaries
Years Ended December 31
($ in millions except per share amounts)
|
Common
Stock
|
Other
Paid-In
Capital
|
Retained
Earnings
|
Accumulated
Other
Comprehensive
Loss
|
Treasury
Stock
|
Non-
controlling
Interests
|
Total
|
|||||||||||||||||||||
|
Balance January 1, 2014
|
|
$1,788
|
|
$
|
40,508
|
|
$
|
39,257
|
|
$
|
(2,197
|
)
|
$
|
(29,591
|
)
|
$
|
2,561
|
|
$
|
52,326
|
|
||||||
|
Net income attributable to Merck & Co., Inc.
|
—
|
|
—
|
|
11,920
|
|
—
|
|
—
|
|
—
|
|
11,920
|
|
|||||||||||||
|
Other comprehensive loss, net of tax
|
—
|
|
—
|
|
—
|
|
(2,126
|
)
|
—
|
|
—
|
|
(2,126
|
)
|
|||||||||||||
|
Cash dividends declared on common stock ($1.77 per share)
|
—
|
|
—
|
|
(5,156
|
)
|
—
|
|
—
|
|
—
|
|
(5,156
|
)
|
|||||||||||||
|
Treasury stock shares purchased
|
—
|
|
—
|
|
—
|
|
—
|
|
(7,703
|
)
|
—
|
|
(7,703
|
)
|
|||||||||||||
|
AstraZeneca option exercise
|
—
|
|
—
|
|
—
|
|
—
|
|
—
|
|
(2,400
|
)
|
(2,400
|
)
|
|||||||||||||
|
Net income attributable to noncontrolling interests
|
—
|
|
—
|
|
—
|
|
—
|
|
—
|
|
14
|
|
14
|
|
|||||||||||||
|
Distributions attributable to noncontrolling interests
|
—
|
|
—
|
|
—
|
|
—
|
|
—
|
|
(77
|
)
|
(77
|
)
|
|||||||||||||
|
Share-based compensation plans and other
|
—
|
|
(85
|
)
|
—
|
|
—
|
|
2,032
|
|
46
|
|
1,993
|
|
|||||||||||||
|
Balance December 31, 2014
|
1,788
|
|
40,423
|
|
46,021
|
|
(4,323
|
)
|
(35,262
|
)
|
144
|
|
48,791
|
|
|||||||||||||
|
Net income attributable to Merck & Co., Inc.
|
—
|
|
—
|
|
4,442
|
|
—
|
|
—
|
|
—
|
|
4,442
|
|
|||||||||||||
|
Other comprehensive income, net of tax
|
—
|
|
—
|
|
—
|
|
175
|
|
—
|
|
—
|
|
175
|
|
|||||||||||||
|
Cash dividends declared on common stock ($1.81 per share)
|
—
|
|
—
|
|
(5,115
|
)
|
—
|
|
—
|
|
—
|
|
(5,115
|
)
|
|||||||||||||
|
Treasury stock shares purchased
|
—
|
|
—
|
|
—
|
|
—
|
|
(4,186
|
)
|
—
|
|
(4,186
|
)
|
|||||||||||||
|
Changes in noncontrolling ownership interests
|
—
|
|
(20
|
)
|
—
|
|
—
|
|
—
|
|
(55
|
)
|
(75
|
)
|
|||||||||||||
|
Net income attributable to noncontrolling interests
|
—
|
|
—
|
|
—
|
|
—
|
|
—
|
|
17
|
|
17
|
|
|||||||||||||
|
Distributions attributable to noncontrolling interests
|
—
|
|
—
|
|
—
|
|
—
|
|
—
|
|
(15
|
)
|
(15
|
)
|
|||||||||||||
|
Share-based compensation plans and other
|
—
|
|
(181
|
)
|
—
|
|
—
|
|
914
|
|
—
|
|
733
|
|
|||||||||||||
|
Balance December 31, 2015
|
1,788
|
|
40,222
|
|
45,348
|
|
(4,148
|
)
|
(38,534
|
)
|
91
|
|
44,767
|
|
|||||||||||||
|
Net income attributable to Merck & Co., Inc.
|
—
|
|
—
|
|
3,920
|
|
—
|
|
—
|
|
—
|
|
3,920
|
|
|||||||||||||
|
Other comprehensive loss, net of tax
|
—
|
|
—
|
|
—
|
|
(1,078
|
)
|
—
|
|
—
|
|
(1,078
|
)
|
|||||||||||||
|
Cash dividends declared on common stock ($1.85 per share)
|
—
|
|
—
|
|
(5,135
|
)
|
—
|
|
—
|
|
—
|
|
(5,135
|
)
|
|||||||||||||
|
Treasury stock shares purchased
|
—
|
|
—
|
|
—
|
|
—
|
|
(3,434
|
)
|
—
|
|
(3,434
|
)
|
|||||||||||||
|
Changes in noncontrolling ownership interests
|
—
|
|
—
|
|
—
|
|
—
|
|
—
|
|
124
|
|
124
|
|
|||||||||||||
|
Net income attributable to noncontrolling interests
|
—
|
|
—
|
|
—
|
|
—
|
|
—
|
|
21
|
|
21
|
|
|||||||||||||
|
Distributions attributable to noncontrolling interests
|
—
|
|
—
|
|
—
|
|
—
|
|
—
|
|
(16
|
)
|
(16
|
)
|
|||||||||||||
|
Share-based compensation plans and other
|
—
|
|
(283
|
)
|
—
|
|
—
|
|
1,422
|
|
—
|
|
1,139
|
|
|||||||||||||
|
Balance December 31, 2016
|
$
|
1,788
|
|
$
|
39,939
|
|
$
|
44,133
|
|
$
|
(5,226
|
)
|
$
|
(40,546
|
)
|
$
|
220
|
|
$
|
40,308
|
|
||||||
The accompanying notes are an integral part of this consolidated financial statement.
71
Merck & Co., Inc. and Subsidiaries
Years Ended December 31
($ in millions)
|
2016
|
2015
|
2014
|
|||||||||
|
Cash Flows from Operating Activities
|
|||||||||||
|
Net income
|
$
|
3,941
|
|
$
|
4,459
|
|
$
|
11,934
|
|
||
|
Adjustments to reconcile net income to net cash provided by operating activities:
|
|||||||||||
|
Depreciation and amortization
|
5,441
|
|
6,375
|
|
6,691
|
|
|||||
|
Intangible asset impairment charges
|
3,948
|
|
162
|
|
1,222
|
|
|||||
|
Charge related to the settlement of worldwide
Keytruda
patent litigation
|
625
|
|
—
|
|
—
|
|
|||||
|
Foreign currency devaluation related to Venezuela
|
—
|
|
876
|
|
—
|
|
|||||
|
Net charge related to the settlement of
Vioxx
shareholder class action litigation
|
—
|
|
680
|
|
—
|
|
|||||
|
Gain on divestiture of Merck Consumer Care business
|
—
|
|
—
|
|
(11,209
|
)
|
|||||
|
Gain on AstraZeneca option exercise
|
—
|
|
—
|
|
(741
|
)
|
|||||
|
Loss on extinguishment of debt
|
—
|
|
—
|
|
628
|
|
|||||
|
Equity income from affiliates
|
(86
|
)
|
(205
|
)
|
(257
|
)
|
|||||
|
Dividends and distributions from equity method affiliates
|
16
|
|
50
|
|
185
|
|
|||||
|
Deferred income taxes
|
(1,521
|
)
|
(764
|
)
|
(2,600
|
)
|
|||||
|
Share-based compensation
|
300
|
|
299
|
|
278
|
|
|||||
|
Other
|
313
|
|
874
|
|
34
|
|
|||||
|
Net changes in assets and liabilities:
|
|||||||||||
|
Accounts receivable
|
(619
|
)
|
(480
|
)
|
(554
|
)
|
|||||
|
Inventories
|
206
|
|
805
|
|
79
|
|
|||||
|
Trade accounts payable
|
278
|
|
(37
|
)
|
593
|
|
|||||
|
Accrued and other current liabilities
|
(2,018
|
)
|
(8
|
)
|
1,635
|
|
|||||
|
Income taxes payable
|
124
|
|
(266
|
)
|
(21
|
)
|
|||||
|
Noncurrent liabilities
|
(809
|
)
|
(277
|
)
|
190
|
|
|||||
|
Other
|
237
|
|
(5
|
)
|
(98
|
)
|
|||||
|
Net Cash Provided by Operating Activities
|
10,376
|
|
12,538
|
|
7,989
|
|
|||||
|
Cash Flows from Investing Activities
|
|||||||||||
|
Capital expenditures
|
(1,614
|
)
|
(1,283
|
)
|
(1,317
|
)
|
|||||
|
Purchases of securities and other investments
|
(15,651
|
)
|
(16,681
|
)
|
(24,944
|
)
|
|||||
|
Proceeds from sales of securities and other investments
|
14,353
|
|
20,413
|
|
15,114
|
|
|||||
|
Divestiture of Merck Consumer Care business, net of cash divested
|
—
|
|
—
|
|
13,951
|
|
|||||
|
Dispositions of other businesses, net of cash divested
|
—
|
|
316
|
|
1,169
|
|
|||||
|
Proceeds from AstraZeneca option exercise
|
—
|
|
—
|
|
419
|
|
|||||
|
Acquisition of Cubist Pharmaceuticals, Inc., net of cash acquired
|
—
|
|
(7,598
|
)
|
—
|
|
|||||
|
Acquisition of Idenix Pharmaceuticals, Inc., net of cash acquired
|
—
|
|
—
|
|
(3,700
|
)
|
|||||
|
Acquisitions of other businesses, net of cash acquired
|
(780
|
)
|
(146
|
)
|
(181
|
)
|
|||||
|
Acquisition of Bayer AG collaboration rights
|
—
|
|
—
|
|
(1,000
|
)
|
|||||
|
Cash inflows from net investment hedges
|
29
|
|
139
|
|
195
|
|
|||||
|
Other
|
453
|
|
82
|
|
(80
|
)
|
|||||
|
Net Cash Used in Investing Activities
|
(3,210
|
)
|
(4,758
|
)
|
(374
|
)
|
|||||
|
Cash Flows from Financing Activities
|
|||||||||||
|
Net change in short-term borrowings
|
—
|
|
(1,540
|
)
|
(460
|
)
|
|||||
|
Payments on debt
|
(2,386
|
)
|
(2,906
|
)
|
(6,617
|
)
|
|||||
|
Proceeds from issuance of debt
|
1,079
|
|
7,938
|
|
3,146
|
|
|||||
|
Purchases of treasury stock
|
(3,434
|
)
|
(4,186
|
)
|
(7,703
|
)
|
|||||
|
Dividends paid to stockholders
|
(5,124
|
)
|
(5,117
|
)
|
(5,170
|
)
|
|||||
|
Other dividends paid
|
—
|
|
—
|
|
(77
|
)
|
|||||
|
Proceeds from exercise of stock options
|
939
|
|
485
|
|
1,560
|
|
|||||
|
Other
|
(118
|
)
|
(61
|
)
|
79
|
|
|||||
|
Net Cash Used in Financing Activities
|
(9,044
|
)
|
(5,387
|
)
|
(15,242
|
)
|
|||||
|
Effect of Exchange Rate Changes on Cash and Cash Equivalents
|
(131
|
)
|
(1,310
|
)
|
(553
|
)
|
|||||
|
Net (Decrease) Increase in Cash and Cash Equivalents
|
(2,009
|
)
|
1,083
|
|
(8,180
|
)
|
|||||
|
Cash and Cash Equivalents at Beginning of Year
|
8,524
|
|
7,441
|
|
15,621
|
|
|||||
|
Cash and Cash Equivalents at End of Year
|
$
|
6,515
|
|
$
|
8,524
|
|
$
|
7,441
|
|
||
The accompanying notes are an integral part of this consolidated financial statement.
72
Notes to Consolidated Financial Statements
Merck & Co., Inc. and Subsidiaries
($ in millions except per share amounts)
1. Nature of Operations
Merck & Co., Inc. (Merck or the Company) is a global health care company that delivers innovative health solutions through its prescription medicines, vaccines, biologic therapies and animal health products. The Company’s operations are principally managed on a products basis and include
four
operating segments, which are the Pharmaceutical, Animal Health, Healthcare Services and Alliances segments. The Pharmaceutical segment is the only reportable segment.
The Pharmaceutical segment includes human health pharmaceutical and vaccine products marketed either directly by the Company or through joint ventures. Human health pharmaceutical products consist of therapeutic and preventive agents, generally sold by prescription, for the treatment of human disorders. The Company sells these human health pharmaceutical products primarily to drug wholesalers and retailers, hospitals, government agencies and managed health care providers such as health maintenance organizations, pharmacy benefit managers and other institutions. Vaccine products consist of preventive pediatric, adolescent and adult vaccines, primarily administered at physician offices. The Company sells these human health vaccines primarily to physicians, wholesalers, physician distributors and government entities. Sales of vaccines in most major European markets were marketed through the Company’s Sanofi Pasteur MSD (SPMSD) joint venture until its termination on December 31, 2016. Beginning in 2017, Merck will record vaccine sales in the European markets that were previously part of the joint venture.
The Company also has animal health operations that discover, develop, manufacture and market animal health products, including vaccines, which the Company sells to veterinarians, distributors and animal producers. The Company’s Healthcare Services segment provides services and solutions that focus on engagement, health analytics and clinical services to improve the value of care delivered to patients. Merck’s Alliances segment primarily includes results from the Company’s relationship with AstraZeneca LP until the termination of that relationship on June 30, 2014 (see Note 8). On October 1, 2014, the Company divested its Consumer Care segment that developed, manufactured and marketed over-the-counter, foot care and sun care products (see Note 3).
2. Summary of Accounting Policies
Principles of Consolidation —
The consolidated financial statements include the accounts of the Company and all of its subsidiaries in which a controlling interest is maintained. Intercompany balances and transactions are eliminated. Controlling interest is determined by majority ownership interest and the absence of substantive third-party participating rights or, in the case of variable interest entities, by majority exposure to expected losses, residual returns or both. For those consolidated subsidiaries where Merck ownership is less than 100%, the outside shareholders’ interests are shown as
Noncontrolling interests
in equity. Investments in affiliates over which the Company has significant influence but not a controlling interest, such as interests in entities owned equally by the Company and a third party that are under shared control, are carried on the equity basis.
Acquisitions —
In a business combination, the acquisition method of accounting requires that the assets acquired and liabilities assumed be recorded as of the date of the acquisition at their respective fair values with limited exceptions. Assets acquired and liabilities assumed in a business combination that arise from contingencies are recognized at fair value if fair value can reasonably be estimated. If the acquisition date fair value of an asset acquired or liability assumed that arises from a contingency cannot be determined, the asset or liability is recognized if probable and reasonably estimable; if these criteria are not met, no asset or liability is recognized. Fair value is defined as the exchange price that would be received for an asset or paid to transfer a liability (an exit price) in the principal or most advantageous market for the asset or liability in an orderly transaction between market participants on the measurement date. Accordingly, the Company may be required to value assets at fair value measures that do not reflect the Company’s intended use of those assets. Any excess of the purchase price (consideration transferred) over the estimated fair values of net assets acquired is recorded as goodwill. Transaction costs and costs to restructure the acquired company are expensed as incurred. The operating results of the acquired business are reflected in the Company’s consolidated financial statements after the date of the acquisition. If the Company determines the assets acquired do not meet the
73
definition of a business under the acquisition method of accounting, the transaction will be accounted for as an acquisition of assets rather than a business combination and, therefore, no goodwill will be recorded.
Foreign Currency Translation —
The net assets of international subsidiaries where the local currencies have been determined to be the functional currencies are translated into U.S. dollars using current exchange rates. The U.S. dollar effects that arise from translating the net assets of these subsidiaries at changing rates are recorded in the foreign currency translation account, which is included in
Accumulated other comprehensive income (loss)
(
AOCI
) and reflected as a separate component of equity. For those subsidiaries that operate in highly inflationary economies and for those subsidiaries where the U.S. dollar has been determined to be the functional currency, non-monetary foreign currency assets and liabilities are translated using historical rates, while monetary assets and liabilities are translated at current rates, with the U.S. dollar effects of rate changes included in
Other (income) expense, net
.
Cash Equivalents —
Cash equivalents are comprised of certain highly liquid investments with original maturities of less than three months.
Inventories —
Inventories are valued at the lower of cost or market. The cost of a substantial majority of domestic pharmaceutical and vaccine inventories is determined using the last-in, first-out (LIFO) method for both financial reporting and tax purposes. The cost of all other inventories is determined using the first-in, first-out (FIFO) method. Inventories consist of currently marketed products, as well as certain inventories produced in preparation for product launches that are considered to have a high probability of regulatory approval. In evaluating the recoverability of inventories produced in preparation for product launches, the Company considers the likelihood that revenue will be obtained from the future sale of the related inventory together with the status of the product within the regulatory approval process.
Investments
— Investments in marketable debt and equity securities classified as available-for-sale are reported at fair value. Fair values of the Company’s investments are determined using quoted market prices in active markets for identical assets or liabilities or quoted prices for similar assets or liabilities or other inputs that are observable or can be corroborated by observable market data for substantially the full term of the assets or liabilities. Changes in fair value that are considered temporary are reported net of tax in
Other Comprehensive Income
(
OCI
). For declines in the fair value of equity securities that are considered other-than-temporary, impairment losses are charged to
Other (income) expense, net
. The Company considers available evidence in evaluating potential impairments of its investments, including the duration and extent to which fair value is less than cost and, for equity securities, the Company’s ability and intent to hold the investments. For debt securities, an other-than-temporary impairment has occurred if the Company does not expect to recover the entire amortized cost basis of the debt security. If the Company does not intend to sell the impaired debt security, and it is not more likely than not it will be required to sell the debt security before the recovery of its amortized cost basis, the amount of the other-than-temporary impairment recognized in earnings, recorded in
Other (income) expense, net
, is limited to the portion attributed to credit loss. The remaining portion of the other-than-temporary impairment related to other factors is recognized in
OCI
. Realized gains and losses for both debt and equity securities are included in
Other (income) expense, net
.
Revenue Recognition —
Revenues from sales of products are recognized when title and risk of loss passes to the customer, typically upon delivery. Recognition of revenue also requires reasonable assurance of collection of sales proceeds and completion of all performance obligations. Domestically, sales discounts are issued to customers as direct discounts at the point-of-sale, indirectly through an intermediary wholesaler, known as chargebacks, or indirectly in the form of rebates. Additionally, sales are generally made with a limited right of return under certain conditions. Revenues are recorded net of provisions for sales discounts and returns, which are established at the time of sale. In addition, revenues are recorded net of time value of money discounts if collection of accounts receivable is expected to be in excess of one year. Accruals for chargebacks are reflected as a direct reduction to accounts receivable and accruals for rebates are recorded as current liabilities. The accrued balances relative to the provisions for chargebacks and rebates included in
Accounts receivable
and
Accrued and other current liabilities
were
$196 million
and
$2.7 billion
, respectively, at
December 31, 2016
and
$145 million
and
$2.7 billion
, respectively, at
December 31, 2015
.
74
The Company recognizes revenue from the sales of vaccines to the Federal government for placement into vaccine stockpiles in accordance with Securities and Exchange Commission (SEC) Interpretation
, Commission Guidance Regarding Accounting for Sales of Vaccines and BioTerror Countermeasures to the Federal Government for Placement into the Pediatric Vaccine Stockpile or the Strategic National Stockpile
.
Depreciation —
Depreciation is provided over the estimated useful lives of the assets, principally using the straight-line method. For tax purposes, accelerated tax methods are used. The estimated useful lives primarily range from
25
to
45
years for
Buildings
, and from
3
to
15
years for
Machinery, equipment and office furnishings
. Depreciation expense was
$1.6 billion
in
2016
,
$1.6 billion
in
2015
and
$2.5 billion
in
2014
.
Advertising and Promotion Costs —
Advertising and promotion costs are expensed as incurred. The Company recorded advertising and promotion expenses of
$2.1 billion
,
$2.1 billion
and
$2.3 billion
in
2016
,
2015
and
2014
, respectively.
Software Capitalization —
The Company capitalizes certain costs incurred in connection with obtaining or developing internal-use software including external direct costs of material and services, and payroll costs for employees directly involved with the software development. Capitalized software costs are included in
Property, plant and equipment
and amortized beginning when the software project is substantially complete and the asset is ready for its intended use. Capitalized software costs associated with projects that are being amortized over
6
to
10
years (including the Company’s on-going multi-year implementation of an enterprise-wide resource planning system) were
$452 million
and
$421 million
, net of accumulated amortization at
December 31, 2016
and
2015
, respectively. All other capitalized software costs are being amortized over periods ranging from
3
to
5
years. Costs incurred during the preliminary project stage and post-implementation stage, as well as maintenance and training costs, are expensed as incurred.
Goodwill —
Goodwill represents the excess of the consideration transferred over the fair value of net assets of businesses acquired. Goodwill is assigned to reporting units and evaluated for impairment on at least an annual basis, or more frequently if impairment indicators exist, by first assessing qualitative factors to determine whether it is more likely than not that the fair value of a reporting unit is less than its carrying amount. If the Company concludes it is more likely than not that the fair value of a reporting unit is less than its carrying amount, a quantitative fair value test is performed.
Acquired Intangibles —
Acquired intangibles include products and product rights, tradenames and patents, which are recorded at fair value, assigned an estimated useful life, and are amortized primarily on a straight-line basis over their estimated useful lives ranging from
2
to
20
years (see Note 7). The Company periodically evaluates whether current facts or circumstances indicate that the carrying values of its acquired intangibles may not be recoverable. If such circumstances are determined to exist, an estimate of the undiscounted future cash flows of these assets, or appropriate asset groupings, is compared to the carrying value to determine whether an impairment exists. If the asset is determined to be impaired, the loss is measured based on the difference between the carrying value of the intangible asset and its fair value, which is determined based on the net present value of estimated future cash flows.
Acquired In-Process Research and Development —
Acquired in-process research and development (IPR&D) that the Company acquires through business combinations represents the fair value assigned to incomplete research projects which, at the time of acquisition, have not reached technological feasibility. The amounts are capitalized and are accounted for as indefinite-lived intangible assets, subject to impairment testing until completion or abandonment of the projects. Upon successful completion of each project, Merck will make a determination as to the then useful life of the intangible asset, generally determined by the period in which the substantial majority of the cash flows are expected to be generated, and begin amortization. The Company tests IPR&D for impairment at least annually, or more frequently if impairment indicators exist, by first assessing qualitative factors to determine whether it is more likely than not that the fair value of the IPR&D intangible asset is less than its carrying amount. If the Company concludes it is more likely than not that the fair value is less than the carrying amount, a quantitative test that compares the fair value of the IPR&D intangible asset with its carrying value is performed. If the fair value is less than the carrying amount, an impairment loss is recognized in operating results.
75
Contingent Consideration —
Certain of the Company’s business acquisitions involve the potential for future payment of consideration that is contingent upon the achievement of performance milestones, including product development milestones and royalty payments on future product sales. The fair value of contingent consideration liabilities is determined at the acquisition date using unobservable inputs. These inputs include the estimated amount and timing of projected cash flows, the probability of success (achievement of the contingent event) and the risk-adjusted discount rate used to present value the probability-weighted cash flows. Subsequent to the acquisition date, at each reporting period, the contingent consideration liability is remeasured at current fair value with changes (either expense or income) recorded in earnings. Changes in any of the inputs may result in a significantly different fair value adjustment.
Research and Development —
Research and development is expensed as incurred. Upfront and milestone payments due to third parties in connection with research and development collaborations prior to regulatory approval are expensed as incurred. Payments due to third parties upon or subsequent to regulatory approval are capitalized and amortized over the shorter of the remaining license or product patent life. Amounts due from collaborative partners related to development activities are generally reflected as a reduction of research and development expenses when the specific milestone has been achieved. Nonrefundable advance payments for goods and services that will be used in future research and development activities are expensed when the activity has been performed or when the goods have been received rather than when the payment is made. Research and development expenses include restructuring costs and IPR&D impairment charges in all periods. In addition, research and development expenses include expense or income related to changes in the estimated fair value measurement of liabilities for contingent consideration.
Share-Based Compensation —
The Company expenses all share-based payments to employees over the requisite service period based on the grant-date fair value of the awards.
Restructuring Costs —
The Company records liabilities for costs associated with exit or disposal activities in the period in which the liability is incurred. In accordance with existing benefit arrangements, employee termination costs are accrued when the restructuring actions are probable and estimable. When accruing these costs, the Company will recognize the amount within a range of costs that is the best estimate within the range. When no amount within the range is a better estimate than any other amount, the Company recognizes the minimum amount within the range. Costs for one-time termination benefits in which the employee is required to render service until termination in order to receive the benefits are recognized ratably over the future service period.
Contingencies and Legal Defense Costs —
The Company records accruals for contingencies and legal defense costs expected to be incurred in connection with a loss contingency when it is probable that a liability has been incurred and the amount can be reasonably estimated.
Taxes on Income —
Deferred taxes are recognized for the future tax effects of temporary differences between financial and income tax reporting based on enacted tax laws and rates. The Company evaluates tax positions to determine whether the benefits of tax positions are more likely than not of being sustained upon audit based on the technical merits of the tax position. For tax positions that are more likely than not of being sustained upon audit, the Company recognizes the largest amount of the benefit that is greater than 50% likely of being realized upon ultimate settlement in the financial statements. For tax positions that are not more likely than not of being sustained upon audit, the Company does not recognize any portion of the benefit in the financial statements. The Company recognizes interest and penalties associated with uncertain tax positions as a component of
Taxes on income
in the Consolidated Statement of Income.
Use of Estimates —
The consolidated financial statements are prepared in conformity with accounting principles generally accepted in the United States (GAAP) and, accordingly, include certain amounts that are based on management’s best estimates and judgments. Estimates are used when accounting for amounts recorded in connection with acquisitions, including initial fair value determinations of assets and liabilities, primarily IPR&D, other intangible assets and contingent consideration, as well as subsequent fair value measurements. Additionally, estimates are used in determining such items as provisions for sales discounts and returns, depreciable and amortizable lives, recoverability of inventories, including those produced in preparation for product launches, amounts recorded for contingencies, environmental liabilities and other reserves, pension and other postretirement benefit plan assumptions, share-based compensation assumptions, restructuring costs, impairments of long-lived assets (including intangible assets and
76
goodwill) and investments, and taxes on income. Because of the uncertainty inherent in such estimates, actual results may differ from these estimates.
Reclassifications —
Certain reclassifications have been made to prior year amounts to conform to the current year presentation.
Recently Adopted Accounting Standards —
In the first quarter of 2016, the Company adopted accounting guidance issued by the Financial Accounting Standards Board (FASB) in April of 2015, which requires debt issuance costs to be presented as a direct deduction from the carrying amount of that debt on the balance sheet as opposed to being presented as a deferred charge. Approximately
$100 million
of debt issuance costs were reclassified in the first quarter of 2016 as a result of the adoption of the new standard. Prior period amounts have been recast to conform to the new presentation.
In the second quarter of 2016, the Company elected to early adopt an accounting standards update issued by the FASB in March of 2016 intended to simplify the accounting and reporting for employee share-based payment transactions. Among other provisions, the new standard requires that excess tax benefits and deficiencies that arise upon vesting or exercise of share-based payments be recognized in the income statement (as opposed to previous guidance under which tax effects were recorded to
Other paid-in-capital
in certain instances). This aspect of the new guidance, which was required to be adopted prospectively, resulted in the recognition of
$79 million
of excess tax benefits in
Taxes on income
in 2016 arising from share-based payments. The new guidance also amended the presentation of certain share-based payment items in the statement of cash flows. Cash flows related to excess income tax benefits are now classified as an operating activity (formerly included as a financing activity). The Company elected to adopt this aspect of the new guidance prospectively. The standard also clarified that cash payments made to taxing authorities on the employees’ behalf for shares withheld should be presented as a financing activity. This aspect of the guidance was adopted retrospectively; accordingly, the Company reclassified
$117 million
and
$129 million
of such payments from operating activities to financing activities in the Consolidated Statement of Cash Flows for the years ended December 31, 2015 and 2014, respectively, to conform to the current presentation. The Company has elected to continue to estimate the impact of forfeitures when determining the amount of compensation cost to be recognized each period rather than account for them as they occur.
In the fourth quarter of 2016, the Company elected to early adopt an accounting standards update issued by the FASB on January 5, 2017 intended to clarify the definition of a business with the objective of adding guidance to assist entities with evaluating whether transactions should be accounted for as acquisitions (or disposals) of assets or businesses. If substantially all of the fair value of gross assets included in a transaction is concentrated in a single asset (or a group of similar assets), the assets would not represent a business. To be considered a business, the assets in the transaction need to include an input and a substantive process that together significantly contribute to the ability to create outputs. Prior to the adoption of the new guidance, an acquisition or disposition would be considered a business if there were inputs, as well as processes that when applied to those inputs had the ability to create outputs. Entities are permitted to apply the updated guidance to transactions occurring before the guidance was issued as long as the applicable financial statements have not been issued. Accordingly, the Company elected to adopt this guidance prospectively as of October 1, 2016.
Recently Issued Accounting Standards —
In May 2014, the FASB issued amended accounting guidance on revenue recognition that will be applied to all contracts with customers. The objective of the new guidance is to improve comparability of revenue recognition practices across entities and to provide more useful information to users of financial statements through improved disclosure requirements. In August 2015, the FASB approved a one-year deferral of the effective date making this guidance effective for interim and annual periods beginning in 2018. The new standard permits two methods of adoption: retrospectively to each prior reporting period presented (full retrospective method), or retrospectively with the cumulative effect of adopting the guidance being recognized at the date of initial application (modified retrospective method). The Company will adopt the new standard on January 1, 2018 and currently plans to use the modified retrospective method. The majority of the Company’s business is ship and bill and, on that primary revenue stream, Merck does not expect significant differences. However, the Company’s analysis is preliminary and subject to change. Merck has not completed its assessment of multiple element arrangements and certain discount and trade promotion programs.
77
In January 2016, the FASB issued revised guidance for the accounting and reporting of financial instruments. The new guidance requires that equity investments with readily determinable fair values currently classified as available for sale be measured at fair value with changes in fair value recognized in net income. The new guidance also simplifies the impairment testing of equity investments without readily determinable fair values and changes certain disclosure requirements. This guidance is effective for interim and annual periods beginning in 2018. Early adoption is not permitted. The Company is currently assessing the impact of adoption on its consolidated financial statements.
In February 2016, the FASB issued new accounting guidance for the accounting and reporting of leases. The new guidance requires that lessees recognize a right-of-use asset and a lease liability recorded on the balance sheet for each of its leases (other than leases that meet the definition of a short-term lease). Leases will be classified as either operating or finance. Operating leases will result in straight-line expense in the income statement (similar to current operating leases) while finance leases will result in more expense being recognized in the earlier years of the lease term (similar to current capital leases). The new guidance will be effective for interim and annual periods beginning in 2019. Early adoption is permitted. The Company is currently evaluating the impact of adoption on its consolidated financial statements.
In June 2016, the FASB issued amended guidance on the accounting for credit losses on financial instruments within its scope. The guidance introduces an expected loss model for estimating credit losses, replacing the incurred loss model. The new guidance also changes the impairment model for available-for-sale debt securities, requiring the use of an allowance to record estimated credit losses (and subsequent recoveries). The new guidance is effective for interim and annual periods beginning in 2020, with earlier application permitted in 2019. The Company is currently evaluating the impact of adoption on its consolidated financial statements.
In August 2016, the FASB issued guidance on the classification of certain cash receipts and payments in the statement of cash flows intended to reduce diversity in practice. The guidance is effective for interim and annual periods beginning in 2018. Early adoption is permitted. The guidance is to be applied retrospectively to all periods presented but may be applied prospectively if retrospective application would be impracticable. The Company is currently evaluating the effect of the standard on its Consolidated Statement of Cash Flows.
In October 2016, the FASB issued guidance on the accounting for the income tax consequences of intra-entity transfers of assets other than inventory. Under existing guidance, the recognition of current and deferred income taxes for an intra-entity asset transfer is prohibited until the asset has been sold to a third party. The new guidance will require the recognition of the income tax consequences of an intra-entity transfer of an asset (with the exception of inventory) when the intra-entity transfer occurs. The guidance is effective for interim and annual periods beginning in 2018. Early adoption is permitted. The new guidance is to be applied on a modified retrospective basis through a cumulative-effect adjustment directly to retained earnings in the beginning of the period of adoption. The Company does not anticipate the adoption of the new guidance will have a material effect on its consolidated financial statements.
In November 2016, the FASB issued guidance requiring that amounts generally described as restricted cash and restricted cash equivalents be included with cash and cash equivalents when reconciling the beginning-of-period and end-of-period total amounts shown on the statement of cash flows. The guidance is effective for interim and annual periods beginning in 2018 and should be applied using a retrospective transition method to each period presented. Early adoption is permitted. The Company is currently evaluating the effect of the standard on its Consolidated Statement of Cash Flows.
In January 2017, the FASB issued guidance that provides for the elimination of Step 2 from the goodwill impairment test. If impairment charges are recognized, the amount recorded will be the amount by which the carrying amount exceeds the reporting unit’s fair value with certain limitations. The new guidance is effective for interim and annual periods in 2021. The Company does not anticipate the adoption of the new guidance will have a material effect on its consolidated financial statements.
78
3. Acquisitions, Divestitures, Research Collaborations and License Agreements
The Company continues to acquire businesses and establish external alliances such as research collaborations and licensing agreements to complement its internal research capabilities. These arrangements often include upfront payments, as well as expense reimbursements or payments to the third party, and milestone, royalty or profit share payments, contingent upon the occurrence of certain future events linked to the success of the asset in development. The Company also reviews its marketed products and pipeline to examine candidates which may provide more value through out-licensing and, as part of its portfolio assessment process, may also divest certain assets. Pro forma financial information for acquired businesses is not presented if the historical financial results of the acquired entity are not significant when compared with the Company’s financial results.
2016 Transactions
In July 2016, Merck acquired Afferent Pharmaceuticals (Afferent), a privately held pharmaceutical company focused on the development of therapeutic candidates targeting the P2X3 receptor for the treatment of common, poorly-managed, neurogenic conditions. Afferent’s lead investigational candidate, MK-7264 (formerly AF-219), is a selective, non-narcotic, orally-administered P2X3 antagonist being evaluated in a Phase 2b clinical trial for the treatment of refractory, chronic cough as well as in a Phase 2 clinical trial in idiopathic pulmonary fibrosis with cough. Total consideration transferred of
$510 million
included cash paid for outstanding Afferent shares of
$487 million
, as well as share-based compensation payments to settle equity awards attributable to precombination service and cash paid for transaction costs on behalf of Afferent. In addition, former Afferent shareholders are eligible to receive a total of up to an additional
$750 million
contingent upon the attainment of certain clinical development and commercial milestones for multiple indications and candidates, including MK-7264. This transaction was accounted for as an acquisition of a business; accordingly, the assets acquired and liabilities assumed were recorded at their respective fair values as of the acquisition date. The Company determined the fair value of the contingent consideration was
$223 million
at the acquisition date utilizing a probability-weighted estimated cash flow stream adjusted for the expected timing of each payment using an appropriate discount rate dependent on the nature and timing of the milestone payment. Merck recognized an intangible asset for in-process research and development (IPR&D) of
$832 million
, net deferred tax liabilities of
$258 million
, and other net assets of
$29 million
(primarily consisting of cash acquired). The excess of the consideration transferred over the fair value of net assets acquired of
$130 million
was recorded as goodwill that was allocated to the Pharmaceutical segment and is not deductible for tax purposes. The fair value of the identifiable intangible asset related to IPR&D was determined using an income approach, through which fair value is estimated based upon the asset’s probability-adjusted future net cash flows, which reflects the stage of development of the project and the associated probability of successful completion. The net cash flows were then discounted to present value using a discount rate of
11.5%
. Actual cash flows are likely to be different than those assumed.
Also in July 2016, Merck, through its wholly owned subsidiary Healthcare Services & Solutions, LLC, acquired a majority ownership interest in The StayWell Company LLC (StayWell), a portfolio company of Vestar Capital Partners (Vestar). StayWell is a health engagement company that helps its clients engage and educate people to improve health and business results. Under the terms of the transaction, Merck paid
$150 million
for a majority ownership interest. Additionally, Merck provided StayWell with a
$150 million
intercompany loan to pay down preexisting third-party debt. Merck has an option to buy, and Vestar has an option to require Merck to buy, some or all of Vestar’s remaining ownership interest at fair value beginning
three
years from the acquisition date. This transaction was accounted for as an acquisition of a business. Merck recognized intangible assets of
$238 million
, deferred tax liabilities of
$84 million
, other net liabilities of
$5 million
and noncontrolling interest of
$124 million
. The excess of the consideration transferred over the fair value of net assets acquired of
$275 million
was recorded as goodwill and is largely attributable to anticipated synergies expected to arise after the acquisition. The goodwill was allocated to the Healthcare Services segment and is not deductible for tax purposes. The intangible assets recognized primarily relate to customer relationships, which are being amortized over a
10
-year useful life, and medical information and solutions content, which are being amortized over a
five
-year useful life.
Additionally, in July 2016, Merck announced it had executed an agreement to acquire a controlling interest in Vallée S.A. (Vallée), a leading privately held producer of animal health products in Brazil. Vallée has an extensive portfolio of products spanning parasiticides, anti-infectives and vaccines that include products for livestock, horses, and companion animals. Under the terms of the agreement, Merck will acquire approximately
93%
of the shares of Vallée for approximately
$400 million
, based on exchange rates at the time of the announcement. This agreement is subject to regulatory review and certain closing conditions.
79
In June 2016, Merck and Moderna Therapeutics (Moderna) entered into a strategic collaboration and license agreement to develop and commercialize novel messenger RNA (mRNA)-based personalized cancer vaccines. The development program will entail multiple studies in several types of cancer and include the evaluation of mRNA-based personalized cancer vaccines in combination with Merck’s
Keytruda
. Pursuant to the terms of the agreement, Merck made an upfront cash payment to Moderna of
$200 million
, which was recorded in
Research and development
expenses. Following human proof of concept studies, Merck has the right to elect to make an additional payment to Moderna. If Merck exercises this right, the two companies will then equally share cost and profits under a worldwide collaboration for the development of personalized cancer vaccines. Moderna will have the right to elect to co-promote the personalized cancer vaccines in the United States. The agreement entails exclusivity around combinations with
Keytruda
. Moderna and Merck will each have the ability to combine mRNA-based personalized cancer vaccines with other (non-PD-1) agents.
In January 2016, Merck acquired IOmet Pharma Ltd (IOmet), a privately held UK-based drug discovery company focused on the development of innovative medicines for the treatment of cancer, with a particular emphasis on the fields of cancer immunotherapy and cancer metabolism. The acquisition provides Merck with IOmet’s preclinical pipeline of IDO (indoleamine-2,3-dioxygenase 1), TDO (tryptophan-2,3-dioxygenase), and dual-acting IDO/TDO inhibitors. The transaction was accounted for as an acquisition of a business. Total purchase consideration in the transaction included a cash payment of
$150 million
and future additional milestone payments of up to
$250 million
that are contingent upon certain clinical and regulatory milestones being achieved. The Company determined the fair value of the contingent consideration was
$94 million
at the acquisition date utilizing a probability-weighted estimated cash flow stream adjusted for the expected timing of each payment utilizing a discount rate of
10.5%
. Merck recognized intangible assets for IPR&D of
$155 million
and net deferred tax assets of
$32 million
. The excess of the consideration transferred over the fair value of net assets acquired of
$57 million
was recorded as goodwill that was allocated to the Pharmaceutical segment and is not deductible for tax purposes. The fair values of the identifiable intangible assets related to IPR&D were determined using an income approach. The assets’ probability-adjusted future net cash flows were then discounted to present value also using a discount rate of
10.5%
. Actual cash flows are likely to be different than those assumed.
2015 Transactions
In December 2015, the Company divested its remaining ophthalmics portfolio in international markets to Mundipharma Ophthalmology Products Limited. Merck received consideration of approximately
$170 million
and recognized a gain of
$147 million
recorded in
Other (income) expense, net
in 2015.
In July 2015, Merck acquired cCAM Biotherapeutics Ltd. (cCAM), a privately held biopharmaceutical company focused on the discovery and development of novel cancer immunotherapies. Total purchase consideration in the transaction included an upfront payment of
$96 million
in cash and future additional payments of up to
$510 million
associated with the attainment of certain clinical development, regulatory and commercial milestones. The transaction was accounted for as an acquisition of a business. Merck recognized an intangible asset for IPR&D of
$180 million
related to CM-24, a monoclonal antibody, as well as a liability for contingent consideration of
$105 million
, goodwill of
$14 million
and other net assets of
$7 million
. During 2016, as a result of unfavorable efficacy data, the Company determined that it would discontinue development of the pipeline program. Accordingly, the Company recorded an IPR&D impairment charge of
$180 million
related to CM-24 and reversed the related liability for contingent consideration, which had a fair value of
$116 million
at the time of program discontinuation. Both the IPR&D impairment charge and the income related to the reduction in the liability for contingent consideration were recorded in
Research and development
expenses in 2016.
Also in July 2015, Merck and Allergan plc (Allergan) entered into an agreement pursuant to which Allergan acquired the exclusive worldwide rights to MK-1602 and MK-8031, Merck’s investigational small molecule oral calcitonin gene-related peptide (CGRP) receptor antagonists, which are being developed for the treatment and prevention of migraine. Under the terms of the agreement, Allergan acquired these rights for upfront payments of
$250 million
, of which
$125 million
was paid in August 2015 upon closing of the transaction and the remaining
$125 million
was paid in April of 2016. The Company recorded a gain of
$250 million
within
Other (income) expense, net
in 2015 related to the transaction. Allergan is fully responsible for development of the CGRP programs, as well as manufacturing and commercialization upon approval and launch of the products. Under the agreement, Merck is entitled to receive potential development and commercial milestone payments and royalties at tiered double-digit rates based on commercialization
80
of the programs. During 2016, Merck recognized gains of
$100 million
within
Other (income) expense, net
resulting from payments by Allergan for the achievement of research and development milestones.
In February 2015, Merck and NGM Biopharmaceuticals, Inc. (NGM), a privately held biotechnology company, entered into a multi-year collaboration to research, discover, develop and commercialize novel biologic therapies across a wide range of therapeutic areas. Under the terms of the agreement, Merck made an upfront payment to NGM of
$94 million
, which was included in
Research and development
expenses, and purchased a
15%
equity stake in NGM for
$106 million
. Merck committed up to
$250 million
to fund all of NGM’s efforts under the initial
five
-year term of the collaboration, with the potential for additional funding if certain conditions are met. Prior to Merck initiating a Phase 3 study for a licensed program, NGM may elect to either receive milestone and royalty payments or, in certain cases, to co-fund development and participate in a global cost and revenue share arrangement of up to
50%
. The agreement also provides NGM with the option to participate in the co-promotion of any co-funded program in the United States. Merck has the option to extend the research agreement for
two
additional
two
-year terms.
In January 2015, Merck acquired Cubist Pharmaceuticals, Inc. (Cubist), a leader in the development of therapies to treat serious infections caused by a broad range of bacteria. Total consideration transferred of
$8.3 billion
included cash paid for outstanding Cubist shares of
$7.8 billion
, as well as share-based compensation payments to settle equity awards attributable to precombination service and cash paid for transaction costs on behalf of Cubist. Share-based compensation payments to settle non-vested equity awards attributable to postcombination service were recognized as transaction expense in 2015. In addition, the Company assumed all of the outstanding convertible debt of Cubist, which had a fair value of approximately
$1.9 billion
at the acquisition date. Merck redeemed this debt in February 2015. The transaction was accounted for as an acquisition of a business.
The estimated fair value of assets acquired and liabilities assumed from Cubist is as follows:
|
Estimated fair value at January 21, 2015
|
|||
|
Cash and cash equivalents
|
$
|
733
|
|
|
Accounts receivable
|
123
|
|
|
|
Inventories
|
216
|
|
|
|
Other current assets
|
55
|
|
|
|
Property, plant and equipment
|
151
|
|
|
|
Identifiable intangible assets:
|
|||
|
Products and product rights (11 year weighted-average useful life)
|
6,923
|
|
|
|
IPR&D
|
50
|
|
|
|
Other noncurrent assets
|
184
|
|
|
|
Current liabilities
(1)
|
(233
|
)
|
|
|
Deferred income tax liabilities
|
(2,519
|
)
|
|
|
Long-term debt
|
(1,900
|
)
|
|
|
Other noncurrent liabilities
(1)
|
(122
|
)
|
|
|
Total identifiable net assets
|
3,661
|
|
|
|
Goodwill
(2)
|
4,670
|
|
|
|
Consideration transferred
|
$
|
8,331
|
|
|
(1)
|
Included in current liabilities and other noncurrent liabilities is contingent consideration of
$73 million
and
$50 million
, respectively.
|
|
(2)
|
The goodwill recognized is largely attributable to anticipated synergies expected to arise after the acquisition and was allocated to the Pharmaceutical segment. The goodwill is not deductible for tax purposes.
|
The estimated fair values of identifiable intangible assets related to currently marketed products were determined using an income approach through which fair value is estimated based on market participant expectations of each asset’s discounted projected net cash flows. The Company’s estimates of projected net cash flows considered historical and projected pricing, margins and expense levels; the performance of competing products where applicable; relevant industry and therapeutic area growth drivers and factors; current and expected trends in technology and product life cycles; the extent and timing of potential new product introductions by the Company’s competitors; and the life of
81
each asset’s underlying patent. The net cash flows were then probability-adjusted where appropriate to consider the uncertainties associated with the underlying assumptions, as well as the risk profile of the net cash flows utilized in the valuation. The probability-adjusted future net cash flows of each product were then discounted to present value utilizing a discount rate of
8%
. Actual cash flows are likely to be different than those assumed.
The Company recorded the fair value of incomplete research project surotomycin (MK-4261) which, at the time of acquisition, had not reached technological feasibility and had no alternative future use. During the second quarter of 2015, the Company received unfavorable efficacy data from a clinical trial for surotomycin. The evaluation of this data, combined with an assessment of the commercial opportunity for surotomycin, resulted in the discontinuation of the program and an IPR&D impairment charge (see Note 7).
In connection with the Cubist acquisition, liabilities were recorded for potential future consideration that is contingent upon the achievement of future sales-based milestones. The fair value of contingent consideration liabilities was determined at the acquisition date using unobservable inputs. These inputs include the estimated amount and timing of projected cash flows, the probability of success (achievement of the contingent event) and a risk-adjusted discount rate of
8%
used to present value the probability-weighted cash flows. Changes in the inputs could result in a different fair value measurement.
This transaction closed on January 21, 2015; accordingly, the results of operations of the acquired business have been included in the Company’s results of operations beginning after that date. During 2015, the Company incurred
$324 million
of transaction costs directly related to the acquisition of Cubist including share-based compensation costs, severance costs, and legal and advisory fees which are reflected in
Marketing and administrative
expenses.
The following unaudited supplemental pro forma data presents consolidated information as if the acquisition of Cubist had been completed on January 1, 2014:
|
Years Ended December 31
|
2015
|
2014
|
|||||
|
Sales
|
$
|
39,584
|
|
$
|
43,437
|
|
|
|
Net income attributable to Merck & Co., Inc.
|
4,640
|
|
10,887
|
|
|||
|
Basic earnings per common share attributable to Merck & Co., Inc. common shareholders
|
1.65
|
|
3.76
|
|
|||
|
Earnings per common share assuming dilution attributable to Merck & Co., Inc. common shareholders
|
1.63
|
|
3.72
|
|
|||
The unaudited supplemental pro forma data reflects the historical information of Merck and Cubist adjusted to include additional amortization expense based on the fair value of assets acquired, additional interest expense that would have been incurred on borrowings used to fund the acquisition, transaction costs associated with the acquisition, and the related tax effects of these adjustments. The pro forma data should not be considered indicative of the results that would have occurred if the acquisition had been consummated on January 1, 2014, nor are they indicative of future results.
2014 Transactions
In December 2014, Merck acquired OncoEthix, a privately held biotechnology company specializing in oncology drug development. Total purchase consideration in the transaction included an upfront cash payment of
$110 million
and future additional milestone payments of up to
$265 million
that were contingent upon certain clinical and regulatory milestones being achieved. The transaction was accounted for as an acquisition of a business. Merck recognized an intangible asset for IPR&D of
$143 million
related to MK-8628 (formerly OTX015), an investigational, novel oral BET (bromodomain) inhibitor, as well as a liability for contingent consideration of
$43 million
and other net assets of
$10 million
. During 2016, as a result of unfavorable efficacy data, the Company determined that it would discontinue the development of MK-8628. Accordingly, the Company recorded an IPR&D impairment charge of
$143 million
related to MK-8628 and reversed the related liability for contingent consideration, which had a fair value of
$40 million
at the time of program discontinuation. Both the IPR&D impairment charge and the income related to the reduction in the liability for contingent consideration were recorded in
Research and development
expenses in 2016.
On October 1, 2014, the Company completed the sale of its Merck Consumer Care (MCC) business to Bayer AG (Bayer) for
$14.2 billion
(
$14.0 billion
net of cash divested), less customary closing adjustments as well as certain contingent amounts held back that were payable upon the manufacturing site transfer in Canada and regulatory approval
82
in Korea. Under the terms of the agreement, Bayer acquired Merck’s existing over-the-counter business, including the global trademark and prescription rights for Claritin and Afrin. The Company recognized a pretax gain from the sale of MCC of
$11.2 billion
recorded in
Other (income) expense, net
in 2014.
Also on October 1, 2014, the Company entered into a worldwide clinical development collaboration with Bayer AG (Bayer) to market and develop soluble guanylate cyclase (sGC) modulators including Bayer’s Adempas (riociguat), which is approved to treat pulmonary arterial hypertension and chronic thromboembolic pulmonary hypertension. The two companies will equally share costs and profits from the collaboration and implement a joint development and commercialization strategy. The collaboration also includes clinical development of Bayer’s vericiguat, which is in Phase 3 trials for worsening heart failure, as well as opt-in rights for other early-stage sGC compounds in development at Bayer. Merck in turn made available its early-stage sGC compounds under similar terms. In return for these broad collaboration rights, Merck made an upfront payment to Bayer of
$1.0 billion
with the potential for additional milestone payments of up to
$1.1 billion
upon the achievement of agreed-upon sales goals. Under the agreement, Bayer will lead commercialization of Adempas in the Americas, while Merck will lead commercialization in the rest of the world. For vericiguat and other potential opt-in products, Bayer will lead in the rest of world and Merck will lead in the Americas. For all products and candidates included in the agreement, both companies will share in development costs and profits on sales and will have the right to co-promote in territories where they are not the lead. The Company determined that Merck’s payment to access Bayer’s compounds constituted an acquisition of an asset. Of the $1.0 billion consideration paid by Merck,
$915 million
of fair value related to Adempas and was capitalized as an intangible asset subject to amortization over its estimated useful life of
12 years
, and the remaining
$85 million
of fair value related to the vericiguat compound in clinical development and was expensed within
Research and development
expenses. The fair values of Adempas and vericiguat were determined using an income approach. The probability-adjusted future net cash flows were then discounted to present value using a discount rate of
10.0%
for Adempas and
10.5%
for vericiguat. During the second quarter of 2016, the Company determined it was probable that, in 2017, Adempas sales would exceed the threshold triggering a
$350 million
milestone payment from Merck to Bayer. Accordingly, in the second quarter of 2016, the Company recorded a
$350 million
liability and a corresponding intangible asset and also recognized
$50 million
of cumulative amortization expense within
Materials and production
costs. The remaining intangible asset at June 30, 2016 of
$300 million
is being amortized over its then-remaining estimated useful life of
10.5
years as supported by projected future cash flows, subject to impairment testing. The remaining potential future milestone payments of
$775 million
have not yet been accrued as they are not deemed by the Company to be probable at this time.
In August 2014, Merck completed the acquisition of Idenix Pharmaceuticals, Inc. (Idenix) for approximately
$3.9 billion
in cash (
$3.7 billion
net of cash acquired). Idenix was a biopharmaceutical company engaged in the discovery and development of medicines for the treatment of human viral diseases, whose primary focus was on the development of next-generation oral antiviral therapeutics to treat hepatitis C virus (HCV) infection. The transaction was accounted for as an acquisition of a business. Merck recognized an intangible asset for IPR&D of
$3.2 billion
related to MK-3682 (formerly IDX21437), uprifosbuvir, as well as net deferred tax liabilities of
$951 million
and other net liabilities of
$12 million
. Uprifosbuvir is a nucleotide prodrug in clinical development being evaluated for the treatment of HCV infection. The excess of the consideration transferred over the fair value of net assets acquired of
$1.5 billion
was recorded as goodwill that was allocated to the Pharmaceutical segment and is not deductible for tax purposes. The fair value of the identifiable intangible asset related to IPR&D was determined using an income approach. The asset’s probability-adjusted future net cash flows were then discounted to present value using a discount rate of
11.5%
. During 2016, the Company recorded a $
2.9 billion
IPR&D impairment charge related to uprifosbuvir that resulted from recent changes to the product profile taken together with changes to the Company’s expectations for pricing and the market opportunity (see Note 7).
In May 2014, Merck entered into an agreement to sell certain ophthalmic products to Santen Pharmaceutical Co., Ltd. (Santen) in Japan and markets in Europe and Asia Pacific. The agreement provided for upfront payments from Santen and additional payments based on defined sales milestones. Santen will also purchase supply of ophthalmology products covered by the agreement for a
two
- to
five
-year period. The transaction closed in most markets on July 1, 2014 and in the remaining markets on October 1, 2014. The Company received
$565 million
of upfront payments from Santen, net of certain adjustments, and recognized gains of
$480 million
on the transactions in 2014 included in
Other (income) expense, net
.
83
In March 2014, Merck sold its Sirna Therapeutics, Inc. (Sirna) subsidiary to Alnylam Pharmaceuticals, Inc. (Alnylam) for consideration of
$25 million
and
2,520,044
shares of Alnylam common stock. Merck is eligible to receive future payments associated with the achievement of certain regulatory and commercial milestones, as well as royalties on future sales. Merck recorded a gain of
$204 million
in
Other (income) expense, net
in 2014 related to this transaction. The excess of Merck’s tax basis in its investment in Sirna over the value received resulted in an approximate
$300 million
tax benefit recorded in 2014.
In January 2014, Merck sold the U.S. marketing rights to
Saphris
, an antipsychotic indicated for the treatment of schizophrenia and bipolar I disorder in adults to Forest Laboratories, Inc. (Forest). Under the terms of the agreement, Forest made upfront payments of
$232 million
, which were recorded in
Sales
in 2014, and will make additional payments to Merck based on defined sales milestones. In addition, as part of this transaction, Merck agreed to supply product to Forest (subsequently acquired by Allergan) until patent expiry.
Remicade/Simponi
In 1998, a subsidiary of Schering-Plough entered into a licensing agreement with Centocor Ortho Biotech Inc. (Centocor), a Johnson & Johnson (J&J) company, to market
Remicade,
which is prescribed for the treatment of inflammatory diseases. In 2005, Schering-Plough’s subsidiary exercised an option under its contract with Centocor for license rights to develop and commercialize
Simponi
, a fully human monoclonal antibody. The Company has marketing rights to both products throughout Europe, Russia and Turkey.
Remicade
lost market exclusivity in major European markets in February 2015 and the Company no longer has market exclusivity in any of its marketing territories
. The Company continues to have market exclusivity for
Simponi
in all of its marketing territories.
All profits derived from Merck’s distribution of the two products in these countries are equally divided between Merck and J&J.
4. Restructuring
The Company incurs substantial costs for restructuring program activities related to Merck’s productivity and cost reduction initiatives, as well as in connection with the integration of certain acquired businesses. In 2010 and 2013, the Company commenced actions under global restructuring programs designed to streamline its cost structure. The actions under these programs include the elimination of positions in sales, administrative and headquarters organizations, as well as the sale or closure of certain manufacturing and research and development sites and the consolidation of office facilities. The Company also continues to reduce its global real estate footprint and improve the efficiency of its manufacturing and supply network. The non-facility related restructuring actions under these programs are substantially complete; the remaining activities primarily relate to ongoing facility rationalizations.
The Company recorded total pretax costs of
$1.1 billion
in
2016
,
$1.1 billion
in
2015
and
$2.0 billion
in
2014
related to restructuring program activities. Since inception of the programs through
December 31, 2016
, Merck has recorded total pretax accumulated costs of approximately
$12.6 billion
and eliminated approximately
40,900
positions comprised of employee separations, as well as the elimination of contractors and vacant positions. The Company expects to substantially complete the remaining actions under these programs by the end of 2017 and incur approximately
$700 million
of additional pretax costs. The Company estimates that approximately
two-thirds
of the cumulative pretax costs will result in cash outlays, primarily related to employee separation expense. Approximately
one-third
of the cumulative pretax costs are non-cash, relating primarily to the accelerated depreciation of facilities to be closed or divested.
For segment reporting, restructuring charges are unallocated expenses.
84
The following table summarizes the charges related to restructuring program activities by type of cost:
|
Separation
Costs
|
Accelerated
Depreciation
|
Other
|
Total
|
||||||||||||
|
Year Ended December 31, 2016
|
|||||||||||||||
|
Materials and production
|
$
|
—
|
|
$
|
77
|
|
$
|
104
|
|
$
|
181
|
|
|||
|
Marketing and administrative
|
—
|
|
8
|
|
87
|
|
95
|
|
|||||||
|
Research and development
|
—
|
|
142
|
|
—
|
|
142
|
|
|||||||
|
Restructuring costs
|
216
|
|
—
|
|
435
|
|
651
|
|
|||||||
|
|
$
|
216
|
|
$
|
227
|
|
$
|
626
|
|
$
|
1,069
|
|
|||
|
Year Ended December 31, 2015
|
|
|
|
|
|||||||||||
|
Materials and production
|
$
|
—
|
|
$
|
78
|
|
$
|
283
|
|
$
|
361
|
|
|||
|
Marketing and administrative
|
—
|
|
59
|
|
19
|
|
78
|
|
|||||||
|
Research and development
|
—
|
|
37
|
|
15
|
|
52
|
|
|||||||
|
Restructuring costs
|
208
|
|
—
|
|
411
|
|
619
|
|
|||||||
|
|
$
|
208
|
|
|
$
|
174
|
|
|
$
|
728
|
|
|
$
|
1,110
|
|
|
Year Ended December 31, 2014
|
|
|
|
|
|||||||||||
|
Materials and production
|
$
|
—
|
|
$
|
429
|
|
$
|
53
|
|
$
|
482
|
|
|||
|
Marketing and administrative
|
—
|
|
198
|
|
2
|
|
200
|
|
|||||||
|
Research and development
|
—
|
|
273
|
|
10
|
|
283
|
|
|||||||
|
Restructuring costs
|
674
|
|
—
|
|
339
|
|
1,013
|
|
|||||||
|
|
$
|
674
|
|
|
$
|
900
|
|
|
$
|
404
|
|
|
$
|
1,978
|
|
Separation costs are associated with actual headcount reductions, as well as those headcount reductions which were probable and could be reasonably estimated. Positions eliminated under restructuring program activities were approximately
2,625
in
2016
,
3,770
in
2015
and
6,085
in
2014
. These position eliminations were comprised of actual headcount reductions and the elimination of contractors and vacant positions.
Accelerated depreciation costs primarily relate to manufacturing, research and administrative facilities and equipment to be sold or closed as part of the programs. Accelerated depreciation costs represent the difference between the depreciation expense to be recognized over the revised useful life of the asset, based upon the anticipated date the site will be closed or divested or the equipment disposed of, and depreciation expense as determined utilizing the useful life prior to the restructuring actions. All of the sites have and will continue to operate up through the respective closure dates and, since future undiscounted cash flows were sufficient to recover the respective book values, Merck recorded accelerated depreciation of the site assets. Anticipated site closure dates, particularly related to manufacturing locations, have been and may continue to be adjusted to reflect changes resulting from regulatory or other factors.
Other activity in
2016
,
2015
and
2014
includes
$409 million
,
$550 million
and
$240 million
, respectively, of asset abandonment, shut-down and other related costs. Additionally, other activity includes certain employee-related costs associated with pension and other postretirement benefit plans (see Note 13) and share-based compensation. Other activity also reflects net pretax losses resulting from sales of facilities and related assets of
$151 million
in
2016
,
$117 million
in
2015
and
$133 million
in
2014
.
85
The following table summarizes the charges and spending relating to restructuring program activities:
|
Separation
Costs
|
Accelerated
Depreciation
|
Other
|
Total
|
||||||||||||
|
Restructuring reserves January 1, 2015
|
$
|
1,031
|
|
$
|
—
|
|
$
|
20
|
|
$
|
1,051
|
|
|||
|
Expenses
|
208
|
|
174
|
|
728
|
|
1,110
|
|
|||||||
|
(Payments) receipts, net
|
(647
|
)
|
—
|
|
(435
|
)
|
(1,082
|
)
|
|||||||
|
Non-cash activity
|
—
|
|
(174
|
)
|
(260
|
)
|
(434
|
)
|
|||||||
|
Restructuring reserves December 31, 2015
|
592
|
|
—
|
|
53
|
|
645
|
|
|||||||
|
Expenses
|
216
|
|
227
|
|
626
|
|
1,069
|
|
|||||||
|
(Payments) receipts, net
|
(413
|
)
|
—
|
|
(347
|
)
|
(760
|
)
|
|||||||
|
Non-cash activity
|
—
|
|
(227
|
)
|
(186
|
)
|
(413
|
)
|
|||||||
|
Restructuring reserves December 31, 2016
(1)
|
$
|
395
|
|
$
|
—
|
|
$
|
146
|
|
$
|
541
|
|
|||
|
(1)
|
The remaining cash outlays are expected to be substantially completed by the end of 2017.
|
5. Financial Instruments
Derivative Instruments and Hedging Activities
The Company manages the impact of foreign exchange rate movements and interest rate movements on its earnings, cash flows and fair values of assets and liabilities through operational means and through the use of various financial instruments, including derivative instruments.
A significant portion of the Company’s revenues and earnings in foreign affiliates is exposed to changes in foreign exchange rates. The objectives and accounting related to the Company’s foreign currency risk management program, as well as its interest rate risk management activities are discussed below.
Foreign Currency Risk Management
The Company has established revenue hedging, balance sheet risk management and net investment hedging programs to protect against volatility of future foreign currency cash flows and changes in fair value caused by volatility in foreign exchange rates.
The objective of the revenue hedging program is to reduce the variability caused by changes in foreign exchange rates that would affect the U.S. dollar value of future cash flows derived from foreign currency denominated sales, primarily the euro and Japanese yen. To achieve this objective, the Company will hedge a portion of its forecasted foreign currency denominated third-party and intercompany distributor entity sales (forecasted sales) that are expected to occur over its planning cycle, typically no more than
two
years into the future. The Company will layer in hedges over time, increasing the portion of forecasted sales hedged as it gets closer to the expected date of the forecasted foreign currency denominated sales. The portion of forecasted sales hedged is based on assessments of cost-benefit profiles that consider natural offsetting exposures, revenue and exchange rate volatilities and correlations, and the cost of hedging instruments. The Company manages its anticipated transaction exposure principally with purchased local currency put options, forward contracts, and purchased collar options.
The fair values of these derivative contracts are recorded as either assets (gain positions) or liabilities (loss positions) in the Consolidated Balance Sheet. Changes in the fair value of derivative contracts are recorded each period in either current earnings or
OCI
, depending on whether the derivative is designated as part of a hedge transaction and, if so, the type of hedge transaction. For derivatives that are designated as cash flow hedges, the effective portion of the unrealized gains or losses on these contracts is recorded in
AOCI
and reclassified into
Sales
when the hedged anticipated revenue is recognized. The hedge relationship is highly effective and hedge ineffectiveness has been
de minimis
. For those derivatives which are not designated as cash flow hedges, but serve as economic hedges of forecasted sales, unrealized gains or losses are recorded in
Sales
each period. The cash flows from both designated and non-designated contracts are reported as operating activities in the Consolidated Statement of Cash Flows. The Company does not enter into derivatives for trading or speculative purposes.
86
The Company manages operating activities and net asset positions at the local level in order to mitigate the effect of exchange on monetary assets and liabilities. The Company also uses a balance sheet risk management program to mitigate the exposure of net monetary assets that are denominated in a currency other than a subsidiary’s functional currency from the effects of volatility in foreign exchange. In these instances, Merck principally utilizes forward exchange contracts to offset the effects of exchange on exposures denominated in developed country currencies, primarily the euro and Japanese yen. For exposures in developing country currencies, the Company will enter into forward contracts to partially offset the effects of exchange on exposures when it is deemed economical to do so based on a cost-benefit analysis that considers the magnitude of the exposure, the volatility of the exchange rate and the cost of the hedging instrument. The cash flows from these contracts are reported as operating activities in the Consolidated Statement of Cash Flows.
Monetary assets and liabilities denominated in a currency other than the functional currency of a given subsidiary are remeasured at spot rates in effect on the balance sheet date with the effects of changes in spot rates reported in
Other (income) expense, net
. The forward contracts are not designated as hedges and are marked to market through
Other (income) expense, net
. Accordingly, fair value changes in the forward contracts help mitigate the changes in the value of the remeasured assets and liabilities attributable to changes in foreign currency exchange rates, except to the extent of the spot-forward differences. These differences are not significant due to the short-term nature of the contracts, which typically have average maturities at inception of less than one year.
The Company may also use forward exchange contracts to hedge its net investment in foreign operations against movements in exchange rates. The forward contracts are designated as hedges of the net investment in a foreign operation. The Company hedges a portion of the net investment in certain of its foreign operations and measures ineffectiveness based upon changes in spot foreign exchange rates that are recorded in
Other (income) expense, net
. The effective portion of the unrealized gains or losses on these contracts is recorded in foreign currency translation adjustment within
OCI
, and remains in
AOCI
until either the sale or complete or substantially complete liquidation of the subsidiary. The cash flows from these contracts are reported as investing activities in the Consolidated Statement of Cash Flows.
Foreign exchange risk is also managed through the use of foreign currency debt. The Company’s senior unsecured euro-denominated notes have been designated as, and are effective as, economic hedges of the net investment in a foreign operation. Accordingly, foreign currency transaction gains or losses due to spot rate fluctuations on the euro-denominated debt instruments are included in foreign currency translation adjustment within
OCI
. Included in the cumulative translation adjustment are pretax gains of
$193 million
in
2016
,
$304 million
in
2015
and
$294 million
in
2014
from the euro-denominated notes.
Interest Rate Risk Management
The Company may use interest rate swap contracts on certain investing and borrowing transactions to manage its net exposure to interest rate changes and to reduce its overall cost of borrowing. The Company does not use leveraged swaps and, in general, does not leverage any of its investment activities that would put principal capital at risk.
In May 2016,
four
interest rate swaps with notional amounts of
$250 million
each matured. These swaps effectively converted the Company’s
$1.0 billion
,
0.70%
fixed-rate notes due 2016 to variable rate debt. At
December 31, 2016
, the Company was a party to
26
pay-floating, receive-fixed interest rate swap contracts designated as fair value hedges of fixed-rate notes in which the notional amounts match the amount of the hedged fixed-rate notes as detailed in the table below.
|
2016
|
||||||||
|
Debt Instrument
|
Par Value of Debt
|
Number of Interest Rate Swaps Held
|
Total Swap Notional Amount
|
|||||
|
1.30% notes due 2018
|
1,000
|
|
4
|
|
1,000
|
|
||
|
5.00% notes due 2019
|
1,250
|
|
3
|
|
550
|
|
||
|
1.85% notes due 2020
|
1,250
|
|
5
|
|
1,250
|
|
||
|
3.875% notes due 2021
|
1,150
|
|
5
|
|
1,150
|
|
||
|
2.40% notes due 2022
|
1,000
|
|
4
|
|
1,000
|
|
||
|
2.35% notes due 2022
|
1,250
|
|
5
|
|
1,250
|
|
||
87
The interest rate swap contracts are designated hedges of the fair value changes in the notes attributable to changes in the benchmark London Interbank Offered Rate (LIBOR) swap rate. The fair value changes in the notes attributable to changes in the LIBOR swap rate are recorded in interest expense and offset by the fair value changes in the swap contracts. The cash flows from these contracts are reported as operating activities in the Consolidated Statement of Cash Flows.
Presented in the table below is the fair value of derivatives on a gross basis segregated between those derivatives that are designated as hedging instruments and those that are not designated as hedging instruments as of December 31:
|
|
|
2016
|
2015
|
||||||||||||||||||||||
|
|
|
Fair Value of
Derivative
|
U.S. Dollar
Notional
|
Fair Value of
Derivative
|
U.S. Dollar
Notional
|
||||||||||||||||||||
|
|
Balance Sheet Caption
|
Asset
|
Liability
|
Asset
|
Liability
|
||||||||||||||||||||
|
Derivatives Designated as Hedging Instruments
|
|
|
|
|
|
|
|
||||||||||||||||||
|
Interest rate swap contracts
|
Other assets
|
$
|
20
|
|
$
|
—
|
|
$
|
2,700
|
|
$
|
42
|
|
$
|
—
|
|
$
|
2,700
|
|
||||||
|
Interest rate swap contracts
|
Accrued and other current liabilities
|
—
|
|
—
|
|
—
|
|
—
|
|
1
|
|
1,000
|
|
||||||||||||
|
Interest rate swap contracts
|
Other noncurrent liabilities
|
—
|
|
29
|
|
3,500
|
|
—
|
|
23
|
|
3,500
|
|
||||||||||||
|
Foreign exchange contracts
|
Other current assets
|
616
|
|
—
|
|
6,063
|
|
579
|
|
—
|
|
4,171
|
|
||||||||||||
|
Foreign exchange contracts
|
Other assets
|
129
|
|
—
|
|
2,075
|
|
386
|
|
—
|
|
4,136
|
|
||||||||||||
|
Foreign exchange contracts
|
Accrued and other current liabilities
|
—
|
|
1
|
|
48
|
|
—
|
|
1
|
|
77
|
|
||||||||||||
|
Foreign exchange contracts
|
Other noncurrent liabilities
|
—
|
|
1
|
|
12
|
|
—
|
|
—
|
|
—
|
|
||||||||||||
|
|
|
$
|
765
|
|
|
$
|
31
|
|
|
$
|
14,398
|
|
|
$
|
1,007
|
|
|
$
|
25
|
|
|
$
|
15,584
|
|
|
|
Derivatives Not Designated as Hedging Instruments
|
|
|
|
|
|
|
|
||||||||||||||||||
|
Foreign exchange contracts
|
Other current assets
|
$
|
230
|
|
$
|
—
|
|
$
|
8,210
|
|
$
|
212
|
|
$
|
—
|
|
$
|
8,783
|
|
||||||
|
Foreign exchange contracts
|
Other assets
|
—
|
|
—
|
|
—
|
|
18
|
|
—
|
|
179
|
|
||||||||||||
|
Foreign exchange contracts
|
Accrued and other current liabilities
|
—
|
|
103
|
|
2,931
|
|
—
|
|
37
|
|
2,508
|
|
||||||||||||
|
Foreign exchange contracts
|
Other noncurrent liabilities
|
—
|
|
—
|
|
—
|
|
—
|
|
1
|
|
6
|
|
||||||||||||
|
|
|
$
|
230
|
|
$
|
103
|
|
$
|
11,141
|
|
$
|
230
|
|
$
|
38
|
|
$
|
11,476
|
|
||||||
|
|
|
$
|
995
|
|
$
|
134
|
|
$
|
25,539
|
|
$
|
1,237
|
|
$
|
63
|
|
$
|
27,060
|
|
||||||
88
As noted above, the Company records its derivatives on a gross basis in the Consolidated Balance Sheet. The Company has master netting agreements with several of its financial institution counterparties (see
Concentrations of Credit Risk
below). The following table provides information on the Company’s derivative positions subject to these master netting arrangements as if they were presented on a net basis, allowing for the right of offset by counterparty and cash collateral exchanged per the master agreements and related credit support annexes at December 31:
|
2016
|
2015
|
||||||||||||||
|
Asset
|
Liability
|
Asset
|
Liability
|
||||||||||||
|
Gross amounts recognized in the consolidated balance sheet
|
$
|
995
|
|
$
|
134
|
|
$
|
1,237
|
|
$
|
63
|
|
|||
|
Gross amount subject to offset in master netting arrangements not offset in the consolidated balance sheet
|
(131
|
)
|
(131
|
)
|
(59
|
)
|
(59
|
)
|
|||||||
|
Cash collateral (received) posted
|
(529
|
)
|
—
|
|
(862
|
)
|
—
|
|
|||||||
|
Net amounts
|
$
|
335
|
|
$
|
3
|
|
$
|
316
|
|
$
|
4
|
|
|||
The table below provides information on the location and pretax gain or loss amounts for derivatives that are: (i) designated in a fair value hedging relationship, (ii) designated in a foreign currency cash flow hedging relationship, (iii) designated in a foreign currency net investment hedging relationship and (iv) not designated in a hedging relationship:
|
Years Ended December 31
|
2016
|
2015
|
2014
|
||||||||
|
Derivatives designated in a fair value hedging relationship
|
|||||||||||
|
Interest rate swap contracts
|
|||||||||||
|
Amount of loss (gain) recognized in
Other (income) expense, net
on derivatives
(1)
|
$
|
28
|
|
$
|
(14
|
)
|
$
|
(17
|
)
|
||
|
Amount of (gain) loss recognized in
Other (income) expense, net
on hedged item
(1)
|
(29
|
)
|
7
|
|
14
|
|
|||||
|
Derivatives designated in foreign currency cash flow hedging relationships
|
|||||||||||
|
Foreign exchange contracts
|
|||||||||||
|
Amount of gain reclassified from
AOCI
to
Sales
|
(311
|
)
|
(724
|
)
|
(143
|
)
|
|||||
|
Amount of gain recognized in
OCI
on derivatives
|
(210
|
)
|
(526
|
)
|
(775
|
)
|
|||||
|
Derivatives designated in foreign currency net investment hedging relationships
|
|||||||||||
|
Foreign exchange contracts
|
|||||||||||
|
Amount of gain recognized in
Other (income) expense, net
on derivatives
(2)
|
(1
|
)
|
(4
|
)
|
(6
|
)
|
|||||
|
Amount of loss (gain) recognized in
OCI
on derivatives
|
2
|
|
(10
|
)
|
(192
|
)
|
|||||
|
Derivatives not designated in a hedging relationship
|
|||||||||||
|
Foreign exchange contracts
|
|||||||||||
|
Amount of loss (gain) recognized in
Other (income) expense, net
on derivatives
(3)
|
132
|
|
(461
|
)
|
(516
|
)
|
|||||
|
Amount of (gain) loss recognized in
Sales
|
—
|
|
(1
|
)
|
15
|
|
|||||
|
(1)
|
There was
$1 million
,
$7 million
and
$3 million
of ineffectiveness on the hedge during
2016
,
2015
and
2014
, respectively.
|
|
(2)
|
There was no ineffectiveness on the hedge. Represents the amount excluded from hedge effectiveness testing.
|
|
(3)
|
These derivative contracts mitigate changes in the value of remeasured foreign currency denominated monetary assets and liabilities attributable to changes in foreign currency exchange rates.
|
At
December 31, 2016
, the Company estimates
$462 million
of pretax net unrealized gains on derivatives maturing within the next 12 months that hedge foreign currency denominated sales over that same period will be reclassified from
AOCI
to
Sales
. The amount ultimately reclassified to
Sales
may differ as foreign exchange rates change. Realized gains and losses are ultimately determined by actual exchange rates at maturity.
89
Information on investments in debt and equity securities at December 31 is as follows:
|
|
2016
|
2015
|
|||||||||||||||||||||||||||||
|
|
Fair
Value
|
Amortized
Cost
|
Gross Unrealized
|
Fair
Value
|
Amortized
Cost
|
Gross Unrealized
|
|||||||||||||||||||||||||
|
|
Gains
|
Losses
|
Gains
|
Losses
|
|||||||||||||||||||||||||||
|
Corporate notes and bonds
|
$
|
10,577
|
|
$
|
10,601
|
|
$
|
15
|
|
$
|
(39
|
)
|
$
|
10,259
|
|
$
|
10,299
|
|
$
|
7
|
|
$
|
(47
|
)
|
|||||||
|
Commercial paper
|
4,330
|
|
4,330
|
|
—
|
|
—
|
|
2,977
|
|
2,977
|
|
—
|
|
—
|
|
|||||||||||||||
|
U.S. government and agency securities
|
2,232
|
|
2,244
|
|
1
|
|
(13
|
)
|
1,761
|
|
1,767
|
|
—
|
|
(6
|
)
|
|||||||||||||||
|
Asset-backed securities
|
1,376
|
|
1,380
|
|
1
|
|
(5
|
)
|
1,284
|
|
1,290
|
|
—
|
|
(6
|
)
|
|||||||||||||||
|
Mortgage-backed securities
|
796
|
|
801
|
|
1
|
|
(6
|
)
|
694
|
|
697
|
|
1
|
|
(4
|
)
|
|||||||||||||||
|
Foreign government bonds
|
519
|
|
521
|
|
—
|
|
(2
|
)
|
607
|
|
586
|
|
22
|
|
(1
|
)
|
|||||||||||||||
|
Equity securities
|
349
|
|
281
|
|
71
|
|
(3
|
)
|
534
|
|
409
|
|
125
|
|
—
|
|
|||||||||||||||
|
|
$
|
20,179
|
|
$
|
20,158
|
|
$
|
89
|
|
$
|
(68
|
)
|
$
|
18,116
|
|
$
|
18,025
|
|
$
|
155
|
|
$
|
(64
|
)
|
|||||||
Available-for-sale debt securities included in
Short-term investments
totaled
$7.8 billion
at
December 31, 2016
. Of the remaining debt securities,
$10.2 billion
mature within five years. At
December 31, 2016
and
2015
, there were no debt securities pledged as collateral.
Fair Value Measurements
Fair value is defined as the exchange price that would be received for an asset or paid to transfer a liability (an exit price) in the principal or most advantageous market for the asset or liability in an orderly transaction between market participants on the measurement date. The Company uses a fair value hierarchy which maximizes the use of observable inputs and minimizes the use of unobservable inputs when measuring fair value. There are three levels of inputs used to measure fair value with Level 1 having the highest priority and Level 3 having the lowest:
Level 1
— Quoted prices (unadjusted) in active markets for identical assets or liabilities.
Level 2
— Observable inputs other than Level 1 prices, such as quoted prices for similar assets or liabilities, or other inputs that are observable or can be corroborated by observable market data for substantially the full term of the assets or liabilities.
Level 3
— Unobservable inputs that are supported by little or no market activity. Level 3 assets or liabilities are those whose values are determined using pricing models, discounted cash flow methodologies, or similar techniques with significant unobservable inputs, as well as assets or liabilities for which the determination of fair value requires significant judgment or estimation.
If the inputs used to measure the financial assets and liabilities fall within more than one level described above, the categorization is based on the lowest level input that is significant to the fair value measurement of the instrument.
90
Financial Assets and Liabilities Measured at Fair Value on a Recurring Basis
Financial assets and liabilities measured at fair value on a recurring basis at December 31 are summarized below:
|
|
Fair Value Measurements Using
|
Fair Value Measurements Using
|
|||||||||||||||||||||||||||||
|
|
Quoted Prices
In Active
Markets for
Identical Assets
(Level 1)
|
Significant
Other
Observable
Inputs
(Level 2)
|
Significant
Unobservable
Inputs
(Level 3)
|
Total
|
Quoted Prices
In Active
Markets for
Identical Assets
(Level 1)
|
Significant
Other
Observable
Inputs
(Level 2)
|
Significant
Unobservable
Inputs
(Level 3)
|
Total
|
|||||||||||||||||||||||
|
|
2016
|
2015
|
|||||||||||||||||||||||||||||
|
Assets
|
|||||||||||||||||||||||||||||||
|
Investments
|
|||||||||||||||||||||||||||||||
|
Corporate notes and bonds
|
$
|
—
|
|
$
|
10,389
|
|
$
|
—
|
|
$
|
10,389
|
|
$
|
—
|
|
$
|
10,259
|
|
$
|
—
|
|
$
|
10,259
|
|
|||||||
|
Commercial paper
|
—
|
|
4,330
|
|
—
|
|
4,330
|
|
—
|
|
2,977
|
|
—
|
|
2,977
|
|
|||||||||||||||
|
U.S. government and agency securities
|
29
|
|
1,890
|
|
—
|
|
1,919
|
|
—
|
|
1,761
|
|
—
|
|
1,761
|
|
|||||||||||||||
|
Asset-backed securities
(1)
|
—
|
|
1,257
|
|
—
|
|
1,257
|
|
—
|
|
1,284
|
|
—
|
|
1,284
|
|
|||||||||||||||
|
Mortgage-backed securities
(1)
|
—
|
|
628
|
|
—
|
|
628
|
|
—
|
|
694
|
|
—
|
|
694
|
|
|||||||||||||||
|
Foreign government bonds
|
—
|
|
518
|
|
—
|
|
518
|
|
—
|
|
607
|
|
—
|
|
607
|
|
|||||||||||||||
|
Equity securities
|
201
|
|
—
|
|
—
|
|
201
|
|
360
|
|
—
|
|
—
|
|
360
|
|
|||||||||||||||
|
|
230
|
|
19,012
|
|
—
|
|
19,242
|
|
360
|
|
17,582
|
|
—
|
|
17,942
|
|
|||||||||||||||
|
Other assets
(2)
|
|||||||||||||||||||||||||||||||
|
U.S. government and agency securities
|
—
|
|
313
|
|
—
|
|
313
|
|
—
|
|
—
|
|
—
|
|
—
|
|
|||||||||||||||
|
Corporate notes and bonds
|
—
|
|
188
|
|
—
|
|
188
|
|
—
|
|
—
|
|
—
|
|
—
|
|
|||||||||||||||
|
Mortgage-backed securities
(1)
|
—
|
|
168
|
|
—
|
|
168
|
|
—
|
|
—
|
|
—
|
|
—
|
|
|||||||||||||||
|
Asset-backed securities
(1)
|
—
|
|
119
|
|
—
|
|
119
|
|
—
|
|
—
|
|
—
|
|
—
|
|
|||||||||||||||
|
Foreign government bonds
|
—
|
|
1
|
|
—
|
|
1
|
|
—
|
|
—
|
|
—
|
|
—
|
|
|||||||||||||||
|
Equity securities
|
148
|
|
—
|
|
—
|
|
148
|
|
155
|
|
19
|
|
—
|
|
174
|
|
|||||||||||||||
|
148
|
|
|
789
|
|
|
—
|
|
|
937
|
|
|
155
|
|
|
19
|
|
|
—
|
|
|
174
|
|
|||||||||
|
Derivative assets
(3)
|
|||||||||||||||||||||||||||||||
|
Purchased currency options
|
—
|
|
644
|
|
—
|
|
644
|
|
—
|
|
1,041
|
|
—
|
|
1,041
|
|
|||||||||||||||
|
Forward exchange contracts
|
—
|
|
331
|
|
—
|
|
331
|
|
—
|
|
154
|
|
—
|
|
154
|
|
|||||||||||||||
|
Interest rate swaps
|
—
|
|
20
|
|
—
|
|
20
|
|
—
|
|
42
|
|
—
|
|
42
|
|
|||||||||||||||
|
|
—
|
|
995
|
|
—
|
|
995
|
|
—
|
|
1,237
|
|
—
|
|
1,237
|
|
|||||||||||||||
|
Total assets
|
$
|
378
|
|
|
$
|
20,796
|
|
|
$
|
—
|
|
|
$
|
21,174
|
|
|
$
|
515
|
|
|
$
|
18,838
|
|
|
$
|
—
|
|
|
$
|
19,353
|
|
|
Liabilities
|
|||||||||||||||||||||||||||||||
|
Other liabilities
|
|||||||||||||||||||||||||||||||
|
Contingent consideration
|
$
|
—
|
|
$
|
—
|
|
$
|
891
|
|
$
|
891
|
|
$
|
—
|
|
$
|
—
|
|
$
|
590
|
|
$
|
590
|
|
|||||||
|
Derivative liabilities
(2)
|
|||||||||||||||||||||||||||||||
|
Forward exchange contracts
|
—
|
|
93
|
|
—
|
|
93
|
|
—
|
|
38
|
|
—
|
|
38
|
|
|||||||||||||||
|
Interest rate swaps
|
—
|
|
29
|
|
—
|
|
29
|
|
—
|
|
24
|
|
—
|
|
24
|
|
|||||||||||||||
|
Written currency options
|
—
|
|
12
|
|
—
|
|
12
|
|
—
|
|
1
|
|
—
|
|
1
|
|
|||||||||||||||
|
—
|
|
134
|
|
—
|
|
134
|
|
—
|
|
63
|
|
—
|
|
63
|
|
||||||||||||||||
|
Total liabilities
|
$
|
—
|
|
$
|
134
|
|
$
|
891
|
|
$
|
1,025
|
|
$
|
—
|
|
$
|
63
|
|
$
|
590
|
|
$
|
653
|
|
|||||||
|
(1)
|
Primarily all of the asset-backed securities are highly-rated (Standard & Poor’s rating of AAA and Moody’s Investors Service rating of Aaa), secured primarily by auto loan, credit card and student loan receivables, with weighted-average lives of primarily
5
years or less. Mortgage-backed securities represent AAA-rated securities issued or unconditionally guaranteed as to payment of principal and interest by U.S. government agencies.
|
|
(2)
|
The increase in investments included in
Other assets
reflects certain assets previously restricted for retiree benefits that became available to fund certain other health and welfare benefits during 2016 (see Note 13).
|
|
(3)
|
The fair value determination of derivatives includes the impact of the credit risk of counterparties to the derivatives and the Company’s own credit risk, the effects of which were not significant.
|
There were no transfers between Level 1 and Level 2 during
2016
. As of
December 31, 2016
,
Cash and cash equivalents
of
$6.5 billion
included
$5.4 billion
of cash equivalents (considered Level 2 in the fair value hierarchy).
91
Contingent Consideration
Summarized information about the changes in liabilities for contingent consideration is as follows:
|
2016
|
2015
|
||||||
|
Fair value January 1
|
$
|
590
|
|
$
|
428
|
|
|
|
Changes in fair value
(1)
|
(407
|
)
|
(16
|
)
|
|||
|
Additions
|
733
|
|
228
|
|
|||
|
Payments
|
(25
|
)
|
(50
|
)
|
|||
|
Fair value December 31
|
$
|
891
|
|
$
|
590
|
|
|
(1)
Recorded in
Research and development
expenses and
Materials and production
costs.
The changes in fair value in 2016 were largely attributable to the reversal of liabilities related to programs obtained in connection with the acquisitions of cCAM, OncoEthix and SmartCells (see Note 7). The additions to contingent consideration in 2016 relate to the termination of the SPMSD joint venture (see Note 8) and the acquisitions of IOmet and Afferent (see Note 3). The additions to contingent consideration in 2015 relate to the acquisitions of Cubist and cCAM (see Note 3). The payments of contingent consideration in 2016 relate to the first commercial sale of
Zerbaxa
in the European Union and in 2015 relate to the first commercial sale of
Zerbaxa
in the United States.
Other Fair Value Measurements
Some of the Company’s financial instruments, such as cash and cash equivalents, receivables and payables, are reflected in the balance sheet at carrying value, which approximates fair value due to their short-term nature.
The estimated fair value of loans payable and long-term debt (including current portion) at
December 31, 2016
, was
$25.7 billion
compared with a carrying value of
$24.8 billion
and at
December 31, 2015
, was
$27.0 billion
compared with a carrying value of
$26.4 billion
. Fair value was estimated using recent observable market prices and would be considered Level 2 in the fair value hierarchy.
Concentrations of Credit Risk
On an ongoing basis, the Company monitors concentrations of credit risk associated with corporate and government issuers of securities and financial institutions with which it conducts business. Credit exposure limits are established to limit a concentration with any single issuer or institution. Cash and investments are placed in instruments that meet high credit quality standards, as specified in the Company’s investment policy guidelines.
The majority of the Company’s accounts receivable arise from product sales in the United States and Europe and are primarily due from drug wholesalers and retailers, hospitals, government agencies, managed health care providers and pharmacy benefit managers. The Company monitors the financial performance and creditworthiness of its customers so that it can properly assess and respond to changes in their credit profile. The Company also continues to monitor economic conditions, including the volatility associated with international sovereign economies, and associated impacts on the financial markets and its business, taking into consideration global economic conditions and the ongoing sovereign debt issues in certain European countries. As of
December 31, 2016
, the Company’s total net accounts receivable outstanding for more than one year were approximately
$140 million
. The Company does not expect to have write-offs or adjustments to accounts receivable which would have a material adverse effect on its financial position, liquidity or results of operations.
The Company’s customers with the largest accounts receivable balances are: McKesson Corporation, AmerisourceBergen Corporation, Cardinal Health, Inc., Zuellig Pharma Ltd. (Asia Pacific), and AAH Pharmaceuticals Ltd (UK) which represented, in aggregate, approximately
40%
of total accounts receivable at
December 31, 2016
. The Company monitors the creditworthiness of its customers to which it grants credit terms in the normal course of business. Bad debts have been minimal. The Company does not normally require collateral or other security to support credit sales.
Derivative financial instruments are executed under International Swaps and Derivatives Association master agreements. The master agreements with several of the Company’s financial institution counterparties also include credit support annexes. These annexes contain provisions that require collateral to be exchanged depending on the value of the derivative assets and liabilities, the Company’s credit rating, and the credit rating of the counterparty. As
92
of
December 31, 2016
and
2015
, the Company had received cash collateral of
$529 million
and
$862 million
, respectively, from various counterparties and the obligation to return such collateral is recorded in
Accrued and other current liabilities
. The Company had not advanced any cash collateral to counterparties as of
December 31, 2016
or
2015
.
6. Inventories
Inventories at December 31 consisted of:
|
2016
|
2015
|
||||||
|
Finished goods
|
$
|
1,304
|
|
$
|
1,343
|
|
|
|
Raw materials and work in process
|
4,222
|
|
4,374
|
|
|||
|
Supplies
|
155
|
|
168
|
|
|||
|
Total (approximates current cost)
|
5,681
|
|
5,885
|
|
|||
|
Increase to LIFO costs
|
302
|
|
384
|
|
|||
|
|
$
|
5,983
|
|
$
|
6,269
|
|
|
|
Recognized as:
|
|||||||
|
Inventories
|
$
|
4,866
|
|
$
|
4,700
|
|
|
|
Other assets
|
1,117
|
|
1,569
|
|
|||
Inventories valued under the LIFO method comprised approximately
$2.3 billion
and
$2.4 billion
of inventories at
December 31, 2016
and
2015
, respectively. Amounts recognized as
Other assets
are comprised almost entirely of raw materials and work in process inventories. At
December 31, 2016
and
2015
, these amounts included
$1.0 billion
and
$1.5 billion
, respectively, of inventories not expected to be sold within one year. In addition, these amounts included
$80 million
and
$63 million
at
December 31, 2016
and
2015
, respectively, of inventories produced in preparation for product launches.
7. Goodwill and Other Intangibles
The following table summarizes goodwill activity by segment:
|
Pharmaceutical
|
|
All Other
|
|
Total
|
|
||||||
|
Balance January 1, 2015
|
$
|
11,108
|
|
$
|
1,884
|
|
$
|
12,992
|
|
||
|
Acquisitions
|
4,684
|
|
29
|
|
4,713
|
|
|||||
|
Divestitures
|
(18
|
)
|
—
|
|
(18
|
)
|
|||||
|
Impairments
|
—
|
|
(47
|
)
|
(47
|
)
|
|||||
|
Other
(1)
|
88
|
|
(5
|
)
|
83
|
|
|||||
|
Balance December 31, 2015
(2)
|
15,862
|
|
1,861
|
|
17,723
|
|
|||||
|
Acquisitions
|
207
|
|
275
|
|
482
|
|
|||||
|
Impairments
|
—
|
|
(47
|
)
|
(47
|
)
|
|||||
|
Other
(1)
|
6
|
|
(2
|
)
|
4
|
|
|||||
|
Balance December 31, 2016
(2)
|
$
|
16,075
|
|
$
|
2,087
|
|
$
|
18,162
|
|
||
(1)
Other includes cumulative translation adjustments on goodwill balances and certain other adjustments.
(2)
Accumulated goodwill impairment losses at
December 31, 2016
and
2015
were
$187 million
and
$140 million
, respectively.
In 2016, the additions to goodwill in the Pharmaceutical segment resulted primarily from the acquisitions of Afferent and IOmet (see Note 3), as well as from the termination of the SPMSD joint venture, which was treated as a step-acquisition for accounting purposes (see Note 8). The addition to goodwill within other non-reportable segments in 2016 relates to the acquisition of StayWell, which is part of the Healthcare Services segment (see Note 3). In 2015, the additions to goodwill in the Pharmaceutical segment resulted primarily from the acquisition of Cubist and the reductions resulted from the divestiture of the Company’s remaining ophthalmics business in international markets (see Note 3). The impairments of goodwill within other non-reportable segments in 2016 and 2015 relate to certain businesses within the Healthcare Services segment.
93
Other intangibles at December 31 consisted of:
|
|
2016
|
2015
|
|||||||||||||||||||||
|
|
Gross
Carrying
Amount
|
Accumulated
Amortization
|
Net
|
Gross
Carrying
Amount
|
Accumulated
Amortization
|
Net
|
|||||||||||||||||
|
Products and product rights
|
$
|
46,269
|
|
$
|
31,919
|
|
$
|
14,350
|
|
$
|
45,949
|
|
$
|
28,514
|
|
$
|
17,435
|
|
|||||
|
IPR&D
|
1,653
|
|
—
|
|
1,653
|
|
4,226
|
|
—
|
|
4,226
|
|
|||||||||||
|
Tradenames
|
215
|
|
89
|
|
126
|
|
198
|
|
79
|
|
119
|
|
|||||||||||
|
Other
|
1,947
|
|
771
|
|
1,176
|
|
1,418
|
|
596
|
|
822
|
|
|||||||||||
|
|
$
|
50,084
|
|
$
|
32,779
|
|
$
|
17,305
|
|
$
|
51,791
|
|
$
|
29,189
|
|
$
|
22,602
|
|
|||||
Acquired intangibles include products and product rights, tradenames and patents, which are recorded at fair value, assigned an estimated useful life, and are amortized primarily on a straight-line basis over their estimated useful lives. The increase in intangible assets for products and product rights in 2016 primarily relates to the recognition of intangible assets in connection with the termination of the SPMSD joint venture (see Note 8). Some of the Company’s more significant acquired intangibles related to marketed products (included in product and product rights above) at
December 31, 2016
include
Zerbaxa
,
$3.3 billion
;
Zetia
,
$1.5 billion
;
Sivextro
,
$955 million
;
Vytorin
,
$938 million
;
Implanon/Nexplanon
$587 million
;
Dificid
,
$561 million
;
Gardasil/Gardasil
9,
$468 million
; NuvaRing
,
$319 million
; and
Nasonex
,
$308 million
. The Company recognized an intangible asset related to Adempas as a result of the formation of a collaboration with Bayer in 2014 (see Note 3) that had a carrying value of
$872 million
at
December 31, 2016
reflected in “Other” in the table above.
During
2016
,
2015
and
2014
, the Company recorded impairment charges related to marketed products and other intangibles of
$347 million
,
$45 million
and
$1.1 billion
, respectively, within
Material and production
costs. In 2016, the Company lowered its cash flow projections for
Zontivity,
a product for the reduction of thrombotic cardiovascular events in patients with a history of myocardial infarction or with peripheral arterial disease, following several business decisions that reduced sales expectations for
Zontivity
in the United States and Europe. The Company utilized market participant assumptions and considered several different scenarios to determine the fair value of the intangible asset related to
Zontivity
that, when compared with its related carrying value, resulted in an impairment charge of
$252 million
. Also during 2016, the Company wrote-off
$95 million
that had been capitalized in connection with in-licensed products
Grastek
and
Ragwitek
, allergy immunotherapy tablets that, for business reasons, the Company has determined it will return to the licensor. The charges in 2015 primarily relate to the impairment of customer relationship and tradename intangibles for certain businesses within in the Healthcare Services segment. Of the amount recorded in 2014,
$793 million
related to
PegIntron,
$244 million
related to
Victrelis
and
$35 million
related to
Rebetol
, all of which are products for the treatment of chronic HCV infection. During 2014, developments in the competitive HCV treatment market led to market share losses that were greater than the Company had predicted causing changes in cash flow projections for
PegIntron
,
Victrelis
and
Rebetol
that indicated the intangible asset values were not recoverable on an undiscounted cash flows basis. The Company utilized market participant assumptions to determine its best estimate of the fair values of the intangible assets related to
PegIntron
,
Victrelis
and
Rebetol
that, when compared with their related carrying values, resulted in the impairment charges noted above.
IPR&D that the Company acquires through business combinations represents the fair value assigned to incomplete research projects which, at the time of acquisition, have not reached technological feasibility. Amounts capitalized as IPR&D are accounted for as indefinite-lived intangible assets, subject to impairment testing until completion or abandonment of the projects. Upon successful completion of each project, the Company will make a separate determination as to the then useful life of the asset and begin amortization. During
2016
,
2015
and
2014
,
$8 million
,
$280 million
and
$654 million
, respectively, of IPR&D was reclassified to products and product rights upon receipt of marketing approval in a major market.
During 2016, the Company recorded
$3.6 billion
of IPR&D impairment charges within
Research and development
expenses. Of this amount,
$2.9 billion
relates to the clinical development program for uprifosbuvir, a nucleotide prodrug in clinical development being evaluated for the treatment of HCV. The Company determined that recent changes to the product profile, as well as changes to Merck’s expectations for pricing and the market opportunity, taken together constituted a triggering event that required the Company to evaluate the uprifosbuvir intangible asset for impairment. Utilizing market participant assumptions, and considering different scenarios, the Company concluded
94
that its best estimate of the current fair value of the intangible asset related to uprifosbuvir was
$240 million
, resulting in the recognition of the pretax impairment charge noted above. The IPR&D impairment charges in 2016 also include charges of
$180 million
and
$143 million
related to the discontinuation of programs obtained in connection with the acquisitions of cCAM and OncoEthix, respectively, resulting from unfavorable efficacy data. An additional
$72 million
relates to programs obtained in connection with the SmartCells acquisition following a decision to terminate the lead compound due to a lack of efficacy and to pursue a back-up compound which reduced projected future cash flows. The IPR&D impairment charges in 2016 also include
$112 million
related to an in-licensed program for house dust mite allergies that, for business reasons, will be returned to the licensor. The remaining IPR&D impairment charges for 2016 primarily relate to deprioritized pipeline programs that were deemed to have no alternative use during the period, including a
$79 million
impairment charge for an investigational candidate for contraception. The discontinuation or delay of certain of these clinical development programs resulted in a reduction of the related liabilities for contingent consideration (see Note 3).
During 2015, the Company recorded
$63 million
of IPR&D impairment charges, of which
$50 million
related to the surotomycin clinical development program. During 2015, the Company received unfavorable efficacy data from a clinical trial for surotomycin. The evaluation of this data, combined with an assessment of the commercial opportunity for surotomycin, resulted in the discontinuation of the program and the IPR&D impairment charge noted above.
During 2014, the Company recorded
$49 million
of IPR&D impairment charges primarily as a result of changes in cash flow assumptions for certain compounds obtained in connection with the Company’s joint venture with Supera Farma Laboratorios S.A. (Supera), as well as for the discontinuation of certain Animal Health programs.
All of the IPR&D projects that remain in development are subject to the inherent risks and uncertainties in drug development and it is possible that the Company will not be able to successfully develop and complete the IPR&D programs and profitably commercialize the underlying product candidates.
The Company may recognize additional non-cash impairment charges in the future related to other marketed products or pipeline programs and such charges could be material.
Aggregate amortization expense primarily recorded within
Materials and production
costs was
$3.8 billion
in
2016
,
$4.8 billion
in
2015
and
$4.2 billion
in
2014
. The estimated aggregate amortization expense for each of the next five years is as follows:
2017
,
$3.2 billion
;
2018
,
$2.8 billion
;
2019
,
$1.4 billion
;
2020
,
$1.2 billion
;
2021
,
$1.1 billion
.
8. Joint Ventures and Other Equity Method Affiliates
Equity income from affiliates reflects the performance of the Company’s joint ventures and other equity method affiliates including SPMSD (until termination on December 31, 2016), certain investment funds, as well as AZLP (until the termination of the Company’s relationship with AZLP on June 30, 2014). Equity income from affiliates was
$86 million
in
2016
,
$205 million
in
2015
and
$257 million
in
2014
and is included in
Other (income) expense, net
(see Note 14).
Investments in affiliates accounted for using the equity method totaled
$715 million
at
December 31, 2016
and
$702 million
at
December 31, 2015
. These amounts are reported in
Other assets
. Amounts due from the above joint ventures included in
Other current assets
were
$1 million
at
December 31, 2016
and
$34 million
at
December 31, 2015
.
Sanofi Pasteur MSD
In 1994, Merck and Pasteur Mérieux Connaught (now Sanofi Pasteur S.A.) established an equally-owned joint venture (SPMSD) to market vaccines in Europe and to collaborate in the development of combination vaccines for distribution in Europe. Joint venture vaccine sales were
$1.0 billion
for
2016
,
$923 million
for
2015
and
$1.1 billion
for
2014
.
On December 31, 2016, Merck and Sanofi Pasteur (Sanofi) terminated SPMSD and ended their joint vaccines operations in Europe. Under the terms of the termination, Merck acquired Sanofi’s
50%
interest in SPMSD in exchange for consideration of
$657 million
comprised of cash, as well as future royalties of
11.5%
on net sales of all Merck products through December 31, 2024, which the Company determined had a fair value of
$416 million
on the date of
95
termination. The Company accounted for this transaction as a step acquisition, which required that Merck remeasure its ownership interest (previously accounted for as an equity method investment) to fair value at the acquisition date. Merck in turn sold to Sanofi its intellectual property rights held by SPMSD in exchange for consideration of
$596 million
comprised of cash and future royalties of
11.5%
on net sales of all Sanofi products through December 31, 2024, which the Company determined had a fair value of
$302 million
on the date of termination. Excluded from this arrangement are potential future sales of
Vaxelis
(a jointly developed investigational pediatric hexavalent combination vaccine that was approved by the European Commission in February 2016). The European marketing rights for
Vaxelis
were transferred to a separate equally-owned joint venture between Sanofi and Merck (MCM).
The net impact of the termination of the SPMSD joint venture is as follows:
|
Products and product rights (8 year useful life)
|
$
|
936
|
|
|
Accounts receivable
|
133
|
|
|
|
Income taxes payable
|
(221
|
)
|
|
|
Deferred income tax liabilities
|
(175
|
)
|
|
|
Other, net
|
34
|
|
|
|
Goodwill
(1)
|
20
|
|
|
|
Net assets acquired
|
727
|
|
|
|
Consideration payable to Sanofi, net
|
(378
|
)
|
|
|
Derecognition of Merck’s previously held equity investment in SPMSD
|
(183
|
)
|
|
|
Increase in net assets
|
166
|
|
|
|
Merck’s share of restructuring costs related to the termination
|
(77
|
)
|
|
|
Net gain on termination of SPMSD joint venture
(2)
|
$
|
89
|
|
(1)
The goodwill was allocated to the Pharmaceutical segment and is not deductible for tax purposes.
(2)
Recorded in
Other (income) expense, net
.
The estimated fair values of identifiable intangible assets related to products and product rights were determined using an income approach through which fair value is estimated based on market participant expectations of each asset’s projected net cash flows. The projected net cash flows were then discounted to present value utilizing a discount rate of
11.5%
. Actual cash flows are likely to be different than those assumed. Of the amount recorded for products and product rights,
$468 million
relates to
Gardasil/Gardasil
9.
The fair value of liabilities for contingent consideration related to Merck’s future royalty payments to Sanofi of
$416 million
(reflected in the consideration payable to Sanofi, net, in the table above) was determined at the acquisition date using unobservable inputs. These inputs include the estimated amount and timing of projected cash flows and a risk-adjusted discount rate of
8%
used to present value the cash flows. Changes in the inputs could result in a different fair value measurement.
Based on an existing accounting policy election, Merck has not recorded the
$302 million
estimated fair value of contingent future royalties to be received from Sanofi on the sale of Sanofi products, but rather will recognize such amounts in future periods as sales occur and the royalties are earned.
The Company incurred
$24 million
of transaction costs related to the termination of SPMSD included in
Marketing and administrative
expenses in 2016.
Pro forma financial information for this transaction has not been presented as the results are not significant when compared with the Company’s financial results.
AstraZeneca LP
In 1982, Merck entered into an agreement with Astra AB (Astra) to develop and market Astra products under a royalty-bearing license. In 1993, Merck’s total sales of Astra products reached a level that triggered the first step in the establishment of a joint venture business carried on by Astra Merck Inc. (AMI), in which Merck and Astra each owned a
50%
share. This joint venture, formed in 1994, developed and marketed most of Astra’s new prescription medicines in the United States. In 1998, Merck and Astra completed a restructuring of the ownership and operations of the joint venture whereby Merck acquired Astra’s interest in AMI, renamed KBI Inc. (KBI), and contributed KBI’s
96
operating assets to a new U.S. limited partnership, Astra Pharmaceuticals L.P. (the Partnership), in exchange for a
1%
limited partner interest. Astra contributed the net assets of its wholly owned subsidiary, Astra USA, Inc., to the Partnership in exchange for a
99%
general partner interest. The Partnership, renamed AstraZeneca LP (AZLP) upon Astra’s 1999 merger with Zeneca Group Plc, became the exclusive distributor of the products for which KBI retained rights. In connection with the 1998 restructuring of AMI, Merck assumed
$2.4 billion
par value preferred stock with a dividend rate of
5%
per annum, which was carried by KBI and included in
Noncontrolling interests
.
Merck earned revenue based on sales of KBI products and such revenue was
$463 million
in 2014 primarily relating to sales of Nexium, as well as Prilosec. In addition, Merck earned certain Partnership returns from AZLP of
$192 million
in 2014, which were recorded in equity income from affiliates.
On June 30, 2014, AstraZeneca exercised its option to purchase Merck’s interest in KBI for
$419 million
in cash. Of this amount,
$327 million
reflected an estimate of the fair value of Merck’s interest in Nexium and Prilosec. This portion of the exercise price, which is subject to a true-up in 2018 based on actual sales from closing in 2014 to June 2018, was deferred and recognized as income of
$5 million
,
$182 million
and
$140 million
, during 2016, 2015 and 2014, respectively, in
Other (income) expense, net
as the contingency was eliminated as sales occurred. Once the deferred income amount was fully amortized, in the first quarter of 2016, the Company began recognizing income and a corresponding receivable for amounts that will be due to Merck from AstraZeneca based on the sales performance of Nexium and Prilosec subject to the true-up in June 2018. The Company recognized
$93 million
of such income in 2016 included in
Other (income) expense, net
.
The remaining exercise price of
$91 million
primarily represents a multiple of
ten
times Merck’s average
1%
annual profit allocation in the partnership for the
three
years prior to exercise. Merck recognized the
$91 million
as a gain in 2014 within
Other (income) expense, net
. As a result of AstraZeneca’s option exercise, the Company’s remaining interest in AZLP was redeemed. Accordingly, the Company also recognized a non-cash gain of approximately
$650 million
in 2014 within
Other (income) expense, net
resulting from the retirement of the
$2.4 billion
of KBI preferred stock, the elimination of the Company’s
$1.4 billion
investment in AZLP and a
$340 million
reduction of goodwill. This transaction resulted in a net tax benefit of
$517 million
in 2014 primarily reflecting the reversal of deferred taxes on the AZLP investment balance.
As a result of AstraZeneca exercising its option, as of July 1, 2014, the Company no longer records equity income from AZLP and supply sales to AZLP have terminated.
Summarized financial information for AZLP is as follows:
|
Year Ended December 31
|
2014
(1)
|
||
|
Sales
|
$
|
2,205
|
|
|
Materials and production costs
|
1,044
|
|
|
|
Other expense, net
|
604
|
|
|
|
Income before taxes
(2)
|
557
|
|
|
(1)
Includes results through the June 30, 2014 termination date.
(2)
Merck’s partnership returns from AZLP were generally contractually determined as noted above and were not based on a percentage of income from AZLP, other than with respect to Merck’s
1%
limited partnership interest.
9. Loans Payable, Long-Term Debt and Other Commitments
Loans payable at
December 31, 2016
included
$300 million
of notes due in
2017
and
$267 million
of long-dated notes that are subject to repayment at the option of the holder. Loans payable at
December 31, 2015
included
$2.3 billion
of notes due in
2016
,
$10 million
of short-term foreign borrowings and
$225 million
of long-dated notes that are subject to repayment at the option of the holders. The weighted-average interest rate of commercial paper borrowings was
0.40%
and
0.07%
for the years ended
December 31, 2016
and
2015
, respectively.
97
Long-term debt at December 31 consisted of:
|
2016
|
2015
|
||||||
|
2.75% notes due 2025
|
$
|
2,487
|
|
$
|
2,485
|
|
|
|
3.70% notes due 2045
|
1,972
|
|
1,971
|
|
|||
|
2.80% notes due 2023
|
1,743
|
|
1,742
|
|
|||
|
5.00% notes due 2019
|
1,273
|
|
1,283
|
|
|||
|
1.85% notes due 2020
|
1,238
|
|
1,239
|
|
|||
|
4.15% notes due 2043
|
1,236
|
|
1,236
|
|
|||
|
2.35% notes due 2022
|
1,228
|
|
1,233
|
|
|||
|
3.875% notes due 2021
|
1,152
|
|
1,158
|
|
|||
|
1.125% euro-denominated notes due 2021
|
1,035
|
|
1,091
|
|
|||
|
1.875% euro-denominated notes due 2026
|
1,028
|
|
1,084
|
|
|||
|
2.40% notes due 2022
|
1,003
|
|
1,011
|
|
|||
|
Floating-rate borrowing due 2018
|
999
|
|
998
|
|
|||
|
1.10% notes due 2018
|
999
|
|
998
|
|
|||
|
1.30% notes due 2018
|
985
|
|
985
|
|
|||
|
6.50% notes due 2033
|
806
|
|
809
|
|
|||
|
Floating-rate notes due 2020
|
698
|
|
698
|
|
|||
|
6.55% notes due 2037
|
594
|
|
596
|
|
|||
|
0.50% euro-denominated notes due 2024
|
516
|
|
—
|
|
|||
|
1.375% euro-denominated notes due 2036
|
512
|
|
—
|
|
|||
|
2.50% euro-denominated notes due 2034
|
511
|
|
538
|
|
|||
|
3.60% notes due 2042
|
489
|
|
489
|
|
|||
|
5.85% notes due 2039
|
415
|
|
415
|
|
|||
|
5.75% notes due 2036
|
369
|
|
369
|
|
|||
|
5.95% debentures due 2028
|
355
|
|
354
|
|
|||
|
6.40% debentures due 2028
|
325
|
|
325
|
|
|||
|
6.30% debentures due 2026
|
152
|
|
152
|
|
|||
|
Floating-rate notes due 2017
|
—
|
|
300
|
|
|||
|
Other
|
154
|
|
270
|
|
|||
|
|
$
|
24,274
|
|
$
|
23,829
|
|
|
Other (as presented in the table above) included
$147 million
and
$223 million
at
December 31, 2016
and
2015
, respectively, of borrowings at variable rates that resulted in effective interest rates of
0.89%
and
zero
for
2016
and
2015
, respectively. Other also included foreign borrowings of
$43 million
at December 31, 2015 at varying rates up to
4.75%
.
With the exception of the
6.30%
debentures due 2026, the notes listed in the table above are redeemable in whole or in part, at Merck’s option at any time, at varying redemption prices.
In November 2016, the Company issued
€1.0 billion
principal amount of senior unsecured notes consisting of
€500 million
principal amount of
0.50%
notes due 2024 and
€500 million
principal amount of
1.375%
notes due 2036. The Company intends to use the net proceeds of the offering of
$1.1 billion
for general corporate purposes, including without limitation, the repayment of outstanding commercial paper borrowings and other indebtedness with upcoming maturities.
In October 2014, the Company issued
€2.5 billion
principal amount of senior unsecured notes. The net proceeds of the offering of
$3.1 billion
were used in part to repay debt that was validly tendered in connection with tender offers launched by the Company for certain outstanding notes and debentures. The Company paid
$2.5 billion
in aggregate consideration (applicable purchase price together with accrued interest) to redeem
$1.8 billion
principal
98
amount of debt. In November 2014, Merck redeemed an additional
$2.0 billion
principal amount of senior unsecured notes. The Company recorded a pretax loss of
$628 million
in 2014 in connection with these transactions.
Effective as of November 3, 2009, the Company executed a full and unconditional guarantee of the then existing debt of its subsidiary Merck Sharp & Dohme Corp. (MSD) and MSD executed a full and unconditional guarantee of the then existing debt of the Company (excluding commercial paper), including for payments of principal and interest. These guarantees do not extend to debt issued subsequent to that date.
Certain of the Company’s borrowings require that Merck comply with financial covenants including a requirement that the Total Debt to Capitalization Ratio (as defined in the applicable agreements) not exceed
60%
. At
December 31, 2016
, the Company was in compliance with these covenants.
The aggregate maturities of long-term debt for each of the next five years are as follows:
2017
,
$301 million
;
2018
,
$3.0 billion
;
2019
,
$1.3 billion
;
2020
,
$1.9 billion
;
2021
,
$2.2 billion
.
In June 2016, the Company terminated its existing credit facility and entered into a new
$6.0 billion
,
five
-year credit facility that matures in June 2021. The facility provides backup liquidity for the Company’s commercial paper borrowing facility and is to be used for general corporate purposes. The Company has not drawn funding from this facility.
Rental expense under operating leases, net of sublease income, was
$292 million
in
2016
,
$303 million
in
2015
and
$350 million
in
2014
. The minimum aggregate rental commitments under noncancellable leases are as follows:
2017
,
$200 million
;
2018
,
$141 million
;
2019
,
$122 million
;
2020
,
$88 million
;
2021
,
$63 million
and thereafter,
$140 million
. The Company has no significant capital leases.
10. Contingencies and Environmental Liabilities
The Company is involved in various claims and legal proceedings of a nature considered normal to its business, including product liability, intellectual property, and commercial litigation, as well as certain additional matters including environmental matters. In the opinion of the Company, it is unlikely that the resolution of these matters will be material to the Company’s financial position, results of operations or cash flows.
Given the nature of the litigation discussed below and the complexities involved in these matters, the Company is unable to reasonably estimate a possible loss or range of possible loss for such matters until the Company knows, among other factors, (i) what claims, if any, will survive dispositive motion practice, (ii) the extent of the claims, including the size of any potential class, particularly when damages are not specified or are indeterminate, (iii) how the discovery process will affect the litigation, (iv) the settlement posture of the other parties to the litigation and (v) any other factors that may have a material effect on the litigation.
The Company records accruals for contingencies when it is probable that a liability has been incurred and the amount can be reasonably estimated. These accruals are adjusted periodically as assessments change or additional information becomes available. For product liability claims, a portion of the overall accrual is actuarially determined and considers such factors as past experience, number of claims reported and estimates of claims incurred but not yet reported. Individually significant contingent losses are accrued when probable and reasonably estimable. Legal defense costs expected to be incurred in connection with a loss contingency are accrued when probable and reasonably estimable.
The Company’s decision to obtain insurance coverage is dependent on market conditions, including cost and availability, existing at the time such decisions are made. The Company has evaluated its risks and has determined that the cost of obtaining product liability insurance outweighs the likely benefits of the coverage that is available and, as such, has no insurance for most product liabilities effective August 1, 2004.
Vioxx
Litigation
Product Liability Lawsuits
As previously disclosed, Merck was a defendant in a number of putative class action lawsuits alleging economic injury as a result of the purchase of
Vioxx
, all but
one
of which have been settled. Under the settlement, Merck agreed to pay up to
$23 million
to resolve all properly documented claims submitted by class members, approved attorneys’ fees and expenses, and approved settlement notice costs and certain other administrative expenses. The claims
99
review process has been completed with the Company paying approximately
$700,000
. The amount of attorneys’ fees to be paid is yet to be determined.
Merck is also a defendant in a lawsuit (together with the above-referenced lawsuits, the
Vioxx
Product Liability Lawsuits) brought by the Attorney General of Utah. The lawsuit is pending in Utah state court. Utah alleges that Merck misrepresented the safety of
Vioxx
and seeks damages and penalties under the Utah False Claims Act. No trial date has been set. Merck recently reached agreements with the Attorneys General in Alaska and Montana to settle their state consumer protection act cases against the Company for
$15.25 million
and
$16.7 million
, respectively. As a result, Alaska’s action was dismissed with prejudice on September 30, 2016, and Montana’s action was dismissed with prejudice on October 6, 2016.
Shareholder Lawsuits
As previously disclosed, in addition to the
Vioxx
Product Liability Lawsuits, various putative class actions and individual lawsuits were filed against Merck and certain former employees alleging that the defendants violated federal securities laws by making alleged material misstatements and omissions with respect to the cardiovascular safety of
Vioxx
(
Vioxx
Securities Lawsuits). The
Vioxx
Securities Lawsuits were coordinated in a multidistrict litigation in the U.S. District Court for the District of New Jersey before Judge Stanley R. Chesler. As previously disclosed, Merck reached a resolution of the
Vioxx
securities class action for which a reserve was recorded in 2015 and under which Merck created a settlement fund in 2016 of
$830 million
(the Settlement Class Fund) and agreed to pay an additional amount for approved attorneys’ fees and expenses up to
$232 million
(the Fee/Expense Fund). On June 28, 2016, the court approved the settlement and awarded attorneys’ fees and expenses in the amount of
$222 million
; the remaining amount of the Fee/Expense Fund will be added to the Settlement Class Fund. The Company paid the total settlement amount into escrow in April 2016. After available funds under certain insurance policies, Merck’s net cash payment for the settlement and fees was approximately
$680 million
. The settlement covers all claims relating to
Vioxx
by settlement class members who purchased Merck securities between May 21, 1999, and October 29, 2004. The settlement is not an admission of wrongdoing and, as part of the settlement agreement, defendants continue to deny the allegations.
In addition, Merck reached a resolution of the above referenced individual securities lawsuits filed by foreign and domestic institutional investors, which were also consolidated with the
Vioxx
Securities Lawsuits.
Insurance
As a result of the previously disclosed insurance arbitration, the Company’s insurers paid insurance proceeds of approximately
$380 million
in connection with the settlement of the class action. The Company also has Directors and Officers insurance coverage applicable to the
Vioxx
Securities Lawsuits with remaining stated upper limits of approximately
$145 million
, which the Company has not received. There are disputes with the insurers about the availability of the Company’s Directors and Officers insurance coverage for these claims. The amounts actually recovered under the Directors and Officers policies discussed in this paragraph may be less than the stated upper limits.
International Lawsuits
As previously disclosed, in addition to the lawsuits discussed above, Merck has been named as a defendant in litigation relating to
Vioxx
in Brazil and Europe (collectively, the
Vioxx
International Lawsuits). The litigation in these jurisdictions is generally in procedural stages and Merck expects that the litigation may continue for a number of years.
Reserves
The Company has an immaterial reserve with respect to certain
Vioxx
Product Liability Lawsuits. The Company has established no other liability reserves for, and believes that it has meritorious defenses to, the remaining
Vioxx
Product Liability Lawsuits and
Vioxx
International Lawsuits and will defend against them.
Other Product Liability Litigation
Fosamax
As previously disclosed, Merck is a defendant in product liability lawsuits in the United States involving
Fosamax
(
Fosamax
Litigation). As of
December 31, 2016
, approximately
4,230
cases are filed and pending against
100
Merck in either federal or state court. In approximately
20
of these actions, plaintiffs allege, among other things, that they have suffered osteonecrosis of the jaw (ONJ), generally subsequent to invasive dental procedures, such as tooth extraction or dental implants and/or delayed healing, in association with the use of
Fosamax
. In addition, plaintiffs in approximately
4,210
of these actions generally allege that they sustained femur fractures and/or other bone injuries (Femur Fractures) in association with the use of
Fosamax
.
Cases Alleging ONJ and/or Other Jaw Related Injuries
In August 2006, the Judicial Panel on Multidistrict Litigation (JPML) ordered that certain
Fosamax
product liability cases pending in federal courts nationwide should be transferred and consolidated into one multidistrict litigation (
Fosamax
ONJ MDL) for coordinated pre-trial proceedings.
In December 2013, Merck reached an agreement in principle with the Plaintiffs’ Steering Committee (PSC) in the
Fosamax
ONJ MDL to resolve pending ONJ cases not on appeal in the
Fosamax
ONJ MDL and in the state courts for an aggregate amount of
$27.7 million
. Merck and the PSC subsequently formalized the terms of this agreement in a Master Settlement Agreement (ONJ Master Settlement Agreement) that was executed in April 2014 and included over
1,200
plaintiffs. In July 2014, Merck elected to proceed with the ONJ Master Settlement Agreement at a reduced funding level of
$27.3 million
since the participation level was approximately
95%
. Merck has fully funded the ONJ Master Settlement Agreement and the escrow agent under the agreement has been making settlement payments to qualifying plaintiffs. The ONJ Master Settlement Agreement has no effect on the cases alleging Femur Fractures discussed below.
Discovery is currently ongoing in some of the approximately
20
remaining ONJ cases that are pending in various federal and state courts and the Company intends to defend against these lawsuits.
Cases Alleging Femur Fractures
In March 2011, Merck submitted a Motion to Transfer to the JPML seeking to have all federal cases alleging Femur Fractures consolidated into one multidistrict litigation for coordinated pre-trial proceedings. The Motion to Transfer was granted in May 2011, and all federal cases involving allegations of Femur Fracture have been or will be transferred to a multidistrict litigation in the District of New Jersey (Femur Fracture MDL). In the only bellwether case tried to date in the Femur Fracture MDL,
Glynn v. Merck
, the jury returned a verdict in Merck’s favor. In addition, in June 2013, the Femur Fracture MDL court granted Merck’s motion for judgment as a matter of law in the
Glynn
case and held that the plaintiff’s failure to warn claim was preempted by federal law.
In August 2013, the Femur Fracture MDL court entered an order requiring plaintiffs in the Femur Fracture MDL to show cause why those cases asserting claims for a femur fracture injury that took place prior to September 14, 2010, should not be dismissed based on the court’s preemption decision in the
Glynn
case. Pursuant to the show cause order, in March 2014, the Femur Fracture MDL court dismissed with prejudice approximately
650
cases on preemption grounds. Plaintiffs in approximately
515
of those cases are appealing that decision to the U.S. Court of Appeals for the Third Circuit (Third Circuit). The Femur Fracture MDL court has since dismissed without prejudice another approximately
540
cases pending plaintiffs’ appeal of the preemption ruling to the Third Circuit. On June 30, 2016, the Third Circuit heard oral argument on plaintiffs’ appeal of the preemption ruling and the parties are awaiting the decision.
In addition, in June 2014, the Femur Fracture MDL court granted Merck summary judgment in the
Gaynor
v. Merck
case and found that Merck’s updates in January 2011 to the
Fosamax
label regarding atypical femur fractures were adequate as a matter of law and that Merck adequately communicated those changes. The plaintiffs in
Gaynor
have appealed the court’s decision to the Third Circuit. In August 2014, Merck filed a motion requesting that the court enter a further order requiring all plaintiffs in the Femur Fracture MDL who claim that the 2011
Fosamax
label is inadequate and the proximate cause of their alleged injuries to show cause why their cases should not be dismissed based on the court’s preemption decision and its ruling in the
Gaynor
case. In November 2014, the court granted Merck’s motion and entered the requested show cause order.
As of
December 31, 2016
,
seven
cases were pending in the Femur Fracture MDL, excluding the
515
cases dismissed with prejudice on preemption grounds that are pending appeal and the
540
cases dismissed without prejudice that are also pending the aforementioned appeal.
101
As of
December 31, 2016
, approximately
2,860
cases alleging Femur Fractures have been filed in New Jersey state court and are pending before Judge Jessica Mayer in Middlesex County. The parties selected an initial group of
30
cases to be reviewed through fact discovery. Two additional groups of
50
cases each to be reviewed through fact discovery were selected in November 2013 and March 2014, respectively. A further group of
25
cases to be reviewed through fact discovery was selected by Merck in July 2015, and Merck has continued to select additional cases to be reviewed through fact discovery during 2016.
As of
December 31, 2016
, approximately
280
cases alleging Femur Fractures have been filed and are pending in California state court. A petition was filed seeking to coordinate all Femur Fracture cases filed in California state court before a single judge in Orange County, California. The petition was granted and Judge Thierry Colaw is currently presiding over the coordinated proceedings. In March 2014, the court directed that a group of
10
discovery pool cases be reviewed through fact discovery and subsequently scheduled the
Galper v. Merck
case, which plaintiffs selected, as the first trial. The
Galper
trial began in February 2015 and the jury returned a verdict in Merck’s favor in April 2015, and plaintiff has appealed that verdict to the California appellate court. Oral argument on plaintiff’s appeal in
Galper
was held on November 17, 2016 and the parties are awaiting a decision. The next Femur Fracture trial in California that was scheduled to begin in April 2016 was stayed at plaintiffs’ request and a new trial date has not been set.
Additionally, there are
five
Femur Fracture cases pending in other state courts.
Discovery is ongoing in the Femur Fracture MDL and in state courts where Femur Fracture cases are pending and the Company intends to defend against these lawsuits.
Januvia/Janumet
As previously disclosed, Merck is a defendant in product liability lawsuits in the United States involving
Januvia
and/or
Janumet
. As of
December 31, 2016
, approximately
1,195
product user claims have been served on Merck alleging generally that use of
Januvia
and/or
Janumet
caused the development of pancreatic cancer and other injuries. These complaints were filed in several different state and federal courts.
Most of the claims were filed in a consolidated multidistrict litigation proceeding in the U.S. District Court for the Southern District of California called “In re Incretin-Based Therapies Products Liability Litigation” (MDL). The MDL includes federal lawsuits alleging pancreatic cancer due to use of the following medicines:
Januvia, Janumet
, Byetta and Victoza, the latter two of which are products manufactured by other pharmaceutical companies. The majority of claims not filed in the MDL were filed in the Superior Court of California, County of Los Angeles (California State Court). As of December 31, 2016,
eight
product users have claims pending against Merck in state courts other than the California State Court.
In November 2015, the MDL and California State Court - in separate opinions - granted summary judgment to defendants on grounds of preemption. Of the approximately
1,195
served product user claims, these rulings resulted in the dismissal of approximately
1,100
product user claims.
Plaintiffs are appealing the MDL and California State Court preemption rulings.
In addition to the claims noted above, the Company has agreed, as of
December 31, 2016
, to toll the statute of limitations for approximately
50
additional claims. The Company intends to continue defending against these lawsuits.
Propecia/Proscar
As previously disclosed, Merck is a defendant in product liability lawsuits in the United States involving
Propecia
and/or
Proscar
. As of
December 31, 2016
, approximately
1,330
lawsuits have been filed by plaintiffs who allege that they have experienced persistent sexual side effects following cessation of treatment with
Propecia
and/or
Proscar
. Approximately
50
of the plaintiffs also allege that
Propecia
or
Proscar
has caused or can cause prostate cancer, testicular cancer or male breast cancer. The lawsuits have been filed in various federal courts and in state court in New Jersey. The federal lawsuits have been consolidated for pretrial purposes in a federal multidistrict litigation before Judge Brian Cogan of the Eastern District of New York. The matters pending in state court in New Jersey have been consolidated before Judge Jessica Mayer in Middlesex County. In addition, there is
one
matter pending in state court in California,
one
matter pending in state court in New York, and
one
matter pending in state court in Ohio. The Company intends to defend against these lawsuits.
102
Governmental Proceedings
As previously disclosed, the Company has received a civil investigative demand from the U.S. Attorney’s Office for the Southern District of New York that requests information relating to the Company’s contracts with, services from and payments to pharmacy benefit managers with respect to
Maxalt
and Levitra from January 1, 2006 to the present. The Company is cooperating with the investigation.
As previously disclosed, the Company has received a subpoena from the Office of Inspector General of the U.S. Department of Health and Human Services on behalf of the U.S. Attorney’s Office for the District of Maryland and the Civil Division of the U.S. Department of Justice (DOJ) that requests information relating to the Company’s marketing of
Singulair
and
Dulera
Inhalation Aerosol and certain of its other marketing activities from January 1, 2006 to the present. The Company is cooperating with the investigation.
As previously disclosed, the Company had received a civil investigative demand from the U.S. Attorney’s Office, Eastern District of Pennsylvania that requested information relating to the Company’s contracting and pricing of
Dulera
Inhalation Aerosol with certain pharmacy benefit managers and Medicare Part D plans. The Company cooperated with the investigation and, in August 2016, the Company learned that the underlying
qui tam
complaint had been unsealed and voluntarily dismissed with prejudice as to the relator and without prejudice as to the government. The DOJ informed the Company that the matter is inactive and that there is no current investigation.
As previously disclosed, the Company has received letters from the DOJ and the SEC that seek information about activities in a number of countries and reference the Foreign Corrupt Practices Act. The Company has cooperated with the agencies in their requests and believes that this inquiry is part of a broader review of pharmaceutical industry practices in foreign countries. As previously disclosed, the Company has been advised by the DOJ that, based on the information that it has received, it has closed its inquiry into this matter as it relates to the Company. The Company has also recently been advised by the SEC that it has closed its inquiry into this matter as it relates to the Company.
As previously disclosed, the Company’s subsidiaries in China have received and may continue to receive inquiries regarding their operations from various Chinese governmental agencies. Some of these inquiries may be related to matters involving other multinational pharmaceutical companies, as well as Chinese entities doing business with such companies. The Company’s policy is to cooperate with these authorities and to provide responses as appropriate.
From time to time, the Company receives inquiries and is the subject of preliminary investigation activities from Competition Authorities in various markets outside the United States. Certain of these inquiries or activities may lead to the commencement of formal proceedings. Should those proceedings be determined adversely to the Company, monetary fines and/or remedial undertakings may be required.
Commercial and Other Litigation
K-DUR Antitrust Litigation
As previously disclosed, in June 1997 and January 1998, Schering-Plough Corporation (Schering-Plough) settled patent litigation with Upsher-Smith, Inc. (Upsher-Smith) and ESI Lederle, Inc. (Lederle), respectively, relating to generic versions of Schering-Plough’s long-acting potassium chloride product supplement used by cardiac patients, for which Lederle and Upsher-Smith had filed Abbreviated New Drug Applications (ANDAs). Following the commencement of an administrative proceeding by the U.S. Federal Trade Commission in 2001 alleging anti-competitive effects from those settlements (which was resolved in Schering-Plough’s favor), putative class and non-class action suits were filed on behalf of direct and indirect purchasers of K-DUR against Schering-Plough, Upsher-Smith and Lederle and were consolidated in a multidistrict litigation in the U.S. District Court for the District of New Jersey. These suits claimed violations of federal and state antitrust laws, as well as other state statutory and common law causes of action, and sought unspecified damages. In April 2008, the indirect purchasers voluntarily dismissed their case. In February 2016, the District Court denied the Company’s motion for summary judgment relating to all of the direct purchasers’ claims concerning the settlement with Upsher-Smith and granted the Company’s motion for summary judgment relating to all of the direct purchasers’ claims concerning the settlement with Lederle. In anticipation of trial, the parties filed motions to exclude certain expert opinions and other evidence, and defendants filed a motion for summary judgment.
103
In February 2017, Merck and Upsher-Smith reached a settlement in principle with the class of direct purchasers and the opt-outs to the class. Merck will contribute approximately
$80 million
in the aggregate towards the overall settlement. Formal settlement agreements with the class and the opt-outs have yet to be executed and the settlement with the class is subject to approval by the District Court.
Sales Force Litigation
As previously disclosed, in May 2013, Ms. Kelli Smith filed a complaint against the Company in the U.S. District Court for the District of New Jersey on behalf of herself and a putative class of female sales representatives and a putative sub-class of female sales representatives with children, claiming (a) discriminatory policies and practices in selection, promotion and advancement, (b) disparate pay, (c) differential treatment, (d) hostile work environment and (e) retaliation under federal and state discrimination laws. Plaintiffs sought and were granted leave to file an amended complaint. In January 2014, plaintiffs filed an amended complaint adding
four
additional named plaintiffs. In October 2014, the court denied the Company’s motion to dismiss or strike the class claims as premature. In September 2015, plaintiffs filed additional motions, including a motion for conditional certification under the Equal Pay Act; a motion to amend the pleadings seeking to add ERISA and constructive discharge claims and a Company subsidiary as a named defendant; and a motion for equitable relief. Merck filed papers in opposition to the motions. On April 27, 2016, the court granted plaintiff’s motion for conditional certification but denied plaintiffs’ motions to extend the liability period for their Equal Pay Act claims back to June 2009. As a result, the liability period will date back to April 2012, at the earliest. On April 29, 2016, the Magistrate Judge granted plaintiffs’ request to amend the complaint to add the following: (i) a Company subsidiary as a corporate defendant; (ii) an ERISA claim and (iii) an individual constructive discharge claim for
one
of the named plaintiffs. Approximately
700
individuals have opted-in to this action; the opt-in period has closed.
Qui Tam Litigation
As previously disclosed, on June 21, 2012, the U.S. District Court for the Eastern District of Pennsylvania unsealed a complaint that has been filed against the Company under the federal False Claims Act by
two
former employees alleging, among other things, that the Company defrauded the U.S. government by falsifying data in connection with a clinical study conducted on the mumps component of the Company’s
M-M-R
II vaccine. The complaint alleges the fraud took place between 1999 and 2001. The U.S. government had the right to participate in and take over the prosecution of this lawsuit, but notified the court that it declined to exercise that right. The
two
former employees are pursuing the lawsuit without the involvement of the U.S. government. In addition, as previously disclosed,
two
putative class action lawsuits on behalf of direct purchasers of the
M‑M‑R
II vaccine, which charge that the Company misrepresented the efficacy of the
M-M-R
II vaccine in violation of federal antitrust laws and various state consumer protection laws, are pending in the Eastern District of Pennsylvania. In September 2014, the court denied Merck’s motion to dismiss the False Claims Act suit and granted in part and denied in part its motion to dismiss the then-pending antitrust suit. As a result, both the False Claims Act suit and the antitrust suits have proceeded into discovery. The Company intends to defend against these lawsuits.
Merck KGaA Litigation
In January 2016, to protect its long-established brand rights in the United States, the Company filed a lawsuit against Merck KGaA, Darmstadt, Germany (KGaA), operating as the EMD Group in the United States, alleging it improperly uses the name “Merck” in the United States. KGaA has filed suit against the Company in France, the United Kingdom (UK), Germany, Switzerland, Mexico, and India alleging breach of the parties’ co-existence agreement, unfair competition and/or trademark infringement. In December 2015, the Paris Court of First Instance issued a judgment finding that certain activities by the Company directed towards France did not constitute trademark infringement and unfair competition while other activities were found to infringe. The Company and KGaA have both appealed the decision, and the appeal is scheduled to be heard in May 2017. In January 2016, the UK High Court issued a judgment finding that the Company had breached the co-existence agreement and infringed KGaA’s trademark rights as a result of certain activities directed towards the UK based on use of the word MERCK on promotional and information activity. As noted in the UK decision, this finding was not based on the Company’s use of the sign MERCK in connection with the sale of products or any material pharmaceutical business transacted in the UK. The Company and KGaA have both appealed this decision, and the appeal is scheduled to be heard in June 2017.
104
Patent Litigation
From time to time, generic manufacturers of pharmaceutical products file ANDAs with the U.S. Food and Drug Administration (FDA) seeking to market generic forms of the Company’s products prior to the expiration of relevant patents owned by the Company. To protect its patent rights, the Company may file patent infringement lawsuits against such generic companies. Certain products of the Company (or products marketed via agreements with other companies) currently involved in such patent infringement litigation in the United States include:
Cancidas
,
Invanz
,
Nasonex
,
Noxafil
, and
NuvaRing
. Similar lawsuits defending the Company’s patent rights may exist in other countries. The Company intends to vigorously defend its patents, which it believes are valid, against infringement by companies attempting to market products prior to the expiration of such patents. As with any litigation, there can be no assurance of the outcomes, which, if adverse, could result in significantly shortened periods of exclusivity for these products and, with respect to products acquired through acquisitions, potentially significant intangible asset impairment charges.
Cancidas
— In February 2014, a patent infringement lawsuit was filed in the United States against Xellia Pharmaceuticals ApS (Xellia) with respect to Xellia’s application to the FDA seeking pre-patent expiry approval to market a generic version of
Cancidas
. In June 2015, the district court found that Xellia infringed the Company’s patent and ordered that Xellia’s application not be approved until the patent expires in September 2017 (including pediatric exclusivity). Xellia appealed this decision, and the appeal was heard in March 2016. In May 2016, the parties reached a settlement whereby Xellia can launch its generic version in August 2017, or earlier under certain conditions. In August 2014, a patent infringement lawsuit was filed in the United States against Fresenius Kabi USA, LLC (Fresenius) in respect of Fresenius’s application to the FDA seeking pre-patent expiry approval to market a generic version of
Cancidas
. In December 2016, the parties reached a settlement whereby Fresenius can launch its generic version in August 2017, or earlier under certain conditions.
Invanz
— In July 2014, a patent infringement lawsuit was filed in the United States against Hospira in respect of Hospira’s application to the FDA seeking pre-patent expiry approval to market a generic version of
Invanz
. The trial in this matter was held in April 2016 and, in October 2016, the district court ruled that the patent is valid and infringed. In August 2015, a patent infringement lawsuit was filed in the United States against Savior Lifetec Corporation (Savior) in respect of Savior’s application to the FDA seeking pre-patent expiry approval to market a generic version of
Invanz
. The lawsuit automatically stays FDA approval of Savior’s application until November 2017 or until an adverse court decision, if any, whichever may occur earlier.
Nasonex
— In July 2014, a patent infringement lawsuit was filed in the United States against Teva Pharmaceuticals USA, Inc. (Teva Pharma) in respect of Teva Pharma’s application to the FDA seeking pre-patent expiry approval to market a generic version of
Nasonex
. The trial in this matter was held in June 2016. In November 2016, the district court ruled that the patent was valid but not infringed. The Company has appealed this decision. In March 2015, a patent infringement lawsuit was filed in the United States against Amneal Pharmaceuticals LLC (Amneal) in respect of Amneal’s application to the FDA seeking pre-patent expiry approval to market a generic version of
Nasonex
. The trial in this matter was held in June 2016. In January 2017, the district court ruled that the patent was valid but not infringed. The Company has appealed this decision.
A previous decision, issued in June 2013, held that the Merck patent in the Teva Pharma and Amneal lawsuits covering mometasone furoate monohydrate was valid, but that it was not infringed by Apotex Corp.’s proposed product. In April 2015, a patent infringement lawsuit was filed against Apotex Inc. and Apotex Corp. (Apotex) in respect of Apotex’s now-launched product that the Company believes differs from the generic version in the previous lawsuit.
Noxafil
— In August 2015, the Company filed a lawsuit against Actavis Laboratories Fl, Inc. (Actavis) in the United States in respect of that company’s application to the FDA seeking pre-patent expiry approval to sell a generic version of
Noxafil
. The lawsuit automatically stays FDA approval of Actavis’s application until December 2017 or until an adverse court decision, if any, whichever may occur earlier. The trial in this matter is currently scheduled to begin in July 2017. In March 2016, the Company filed a lawsuit against Roxane Laboratories, Inc. (Roxane) in the United States in respect of that company’s application to the FDA seeking pre-patent expiry approval to sell a generic version of
Noxafil
. The lawsuit automatically stays FDA approval of Roxane’s application until August 2018 or until an adverse court decision, if any, whichever may occur earlier. In February 2016, the Company filed a lawsuit against Par Sterile Products LLC, Par Pharmaceutical, Inc., Par Pharmaceutical Companies, Inc. and Par Pharmaceutical Holdings, Inc. (collectively, Par) in the United States in respect of that company’s application to the FDA seeking pre-
105
patent expiry approval to sell a generic version of
Noxafil
. In October 2016, the parties reached a settlement whereby Par can launch its generic version in January 2023, or earlier under certain conditions.
NuvaRing
— In December 2013, the Company filed a lawsuit against a subsidiary of Allergan plc in the United States in respect of that company’s application to the FDA seeking pre-patent expiry approval to sell a generic version of
NuvaRing
. The trial in this matter was held in January 2016. In August 2016, the district court ruled that the patent was invalid and the Company has appealed this decision. In September 2015, the Company filed a lawsuit against Teva Pharma in the United States in respect of that company’s application to the FDA seeking pre-patent expiry approval to sell a generic version of
NuvaRing
. Based on its ruling in the Allergan plc matter, the district court dismissed the Company’s lawsuit in December 2016. The Company has appealed this decision.
The Company had been involved in ongoing litigation in Canada with Apotex concerning the Company’s patents related to lovastatin, alendronate, and norfloxacin. All of the litigation has now been either settled or concluded. As a consequence of the conclusion of all of this litigation, in 2016, the Company recorded a net gain of
$117 million
included in
Other (income) expense, net
(see Note 14).
Anti-PD-1 Antibody Patent Oppositions and Litigation
As previously disclosed, Ono Pharmaceutical Co. (Ono) has a European patent (EP 1 537 878) (’878) that broadly claims the use of an anti-PD-1 antibody, such as the Company’s immunotherapy,
Keytruda
, for the treatment of cancer. Ono has previously licensed its commercial rights to an anti-PD-1 antibody to Bristol-Myers Squibb (BMS) in certain markets. BMS and Ono also own European Patent EP 2 161 336 (’336) that, as granted, broadly claimed anti-PD-1 antibodies that could include
Keytruda
.
As previously disclosed, the Company and BMS and Ono were engaged in worldwide litigation, including in the United States, over the validity and infringement of the ‘878 patent, the ‘336 patent and their equivalents.
In January 2017, the Company announced that it had entered into a settlement and license agreement with BMS and Ono resolving the worldwide patent infringement litigation related to the use of an anti-PD-1 antibody for the treatment of cancer, such as
Keytruda
. Under the settlement and license agreement, the Company made a one-time payment of
$625 million
(which was recorded as an expense in the Company’s 2016 financial results) to BMS and will pay royalties on the worldwide sales of
Keytruda
for a non-exclusive license to market
Keytruda
in any market in which it is approved. For global net sales of
Keytruda
, the Company will pay royalties as follows:
•
6.5%
of net sales occurring from January 1, 2017 through and including December 31, 2023; and
•
2.5%
of net sales occurring from January 1, 2024 through and including December 31, 2026.
The parties also agreed to dismiss all claims worldwide in the relevant legal proceedings.
In October 2015, PDL Biopharma (PDL) filed a lawsuit in the United States against the Company alleging that the manufacture of
Keytruda
infringed US Patent No. 5,693,761 (’761 patent), which expired in December 2014. This patent claims platform technology used in the creation and manufacture of recombinant antibodies and PDL is seeking damages for pre-expiry infringement of the ’761 patent.
In July 2016, the Company filed a declaratory judgment action in the United States against Genentech and City of Hope seeking a ruling that US Patent No. 7,923,221 (the Cabilly III patent), which claims platform technology used in the creation and manufacture of recombinant antibodies, is invalid and that
Keytruda
and bezlotoxumab do not infringe the Cabilly III patent. In July 2016, the Company also filed a petition in the USPTO for
Inter Partes
Review (IPR) of certain claims of US Patent No. 6,331,415 (the Cabilly II patent), which claims platform technology used in the creation and manufacture of recombinant antibodies and is also owned by Genentech and City of Hope, as being invalid. In December 2016, the USPTO denied the petition but allowed the Company to join an IPR filed previously by another party.
Gilead Patent Litigation and Opposition
In August 2013, Gilead Sciences, Inc. (Gilead) filed a lawsuit in the U.S. District Court for the Northern District of California seeking a declaration that two Company patents were invalid and not infringed by the sale of their two sofosbuvir containing products, Solvadi and Harvoni. The Company filed a counterclaim that the sale of these
106
products did infringe these two patents and sought a reasonable royalty for the past, present and future sales of these products. In March 2016, at the conclusion of a jury trial, the patents were found to be not invalid and infringed. The jury awarded the Company
$200 million
as a royalty for sales of these products up to December 2015. After the conclusion of the jury trial, the court held a bench trial on the equitable defenses raised by Gilead. In June 2016, the court found for Gilead and determined that Merck could not collect the jury award and that the patents were unenforceable with respect to Gilead. The Company has appealed the court’s decision. Gilead has also asked the court to overturn the jury’s decision on validity. The court held a hearing on Gilead’s motion in August 2016, and the court subsequently rejected Gilead’s request. The Company will pay
20%
, net of legal fees, of damages or royalties, if any, that it receives to Ionis Pharmaceuticals, Inc.
The Company, through its Idenix Pharmaceuticals, Inc. subsidiary, has pending litigation against Gilead in the United States, the UK, Norway, Canada, Germany, France, and Australia based on different patent estates that would also be infringed by Gilead’s sales of these two products. Gilead has opposed the European patent at the EPO. Trial in the United States was held in December 2016 and the jury returned a verdict for the Company, awarding damages of
$2.54 billion
. The Company is currently briefing post-trial motions, including on the issues of enhanced damages and future royalties. Gilead is briefing post-trial motions for judgment as a matter of law. In the UK, Australia and Canada, the Company was initially unsuccessful and those cases are currently under appeal. In Norway, the patent was held invalid and no further appeal was filed. The EPO opposition division revoked the European patent, and the Company has appealed this decision. The cases in France and Germany have been stayed pending the final decision of the EPO.
Other Litigation
There are various other pending legal proceedings involving the Company, principally product liability and intellectual property lawsuits. While it is not feasible to predict the outcome of such proceedings, in the opinion of the Company, either the likelihood of loss is remote or any reasonably possible loss associated with the resolution of such proceedings is not expected to be material to the Company’s financial position, results of operations or cash flows either individually or in the aggregate.
Legal Defense Reserves
Legal defense costs expected to be incurred in connection with a loss contingency are accrued when probable and reasonably estimable. Some of the significant factors considered in the review of these legal defense reserves are as follows: the actual costs incurred by the Company; the development of the Company’s legal defense strategy and structure in light of the scope of its litigation; the number of cases being brought against the Company; the costs and outcomes of completed trials and the most current information regarding anticipated timing, progression, and related costs of pre-trial activities and trials in the associated litigation. The amount of legal defense reserves as of
December 31, 2016
and
December 31, 2015
of approximately
$185 million
and
$245 million
, respectively, represents the Company’s best estimate of the minimum amount of defense costs to be incurred in connection with its outstanding litigation; however, events such as additional trials and other events that could arise in the course of its litigation could affect the ultimate amount of legal defense costs to be incurred by the Company. The Company will continue to monitor its legal defense costs and review the adequacy of the associated reserves and may determine to increase the reserves at any time in the future if, based upon the factors set forth, it believes it would be appropriate to do so.
Environmental Matters
As previously disclosed, Merck’s facilities in Oss, the Netherlands, were inspected by the Province of Brabant (the Province) pursuant to the Dutch Hazards of Major Accidents Decree and the sites’ environmental permits. The Province issued penalties for alleged violations of regulations governing preventing and managing accidents with hazardous substances, and the government also issued a fine for alleged environmental violations at one of the Oss facilities, which together totaled
$235 thousand
. The Company was subsequently advised that a criminal investigation had been initiated based upon certain of the issues that formed the basis of the administrative enforcement action by the Province. The Company intends to defend itself against any enforcement action that may result from this investigation.
In May 2015, the Environmental Protection Agency conducted an air compliance evaluation of the Company’s pharmaceutical manufacturing facility in Elkton, Virginia. As a result of the investigation, the Company
107
was recently issued a Notice of Noncompliance and Show Cause Notification relating to certain federally enforceable requirements applicable to the Elkton facility. The Company is attempting to resolve these alleged violations by way of settlement but will defend itself if settlement cannot be reached.
The Company and its subsidiaries are parties to a number of proceedings brought under the Comprehensive Environmental Response, Compensation and Liability Act, commonly known as Superfund, and other federal and state equivalents. These proceedings seek to require the operators of hazardous waste disposal facilities, transporters of waste to the sites and generators of hazardous waste disposed of at the sites to clean up the sites or to reimburse the government for cleanup costs. The Company has been made a party to these proceedings as an alleged generator of waste disposed of at the sites. In each case, the government alleges that the defendants are jointly and severally liable for the cleanup costs. Although joint and several liability is alleged, these proceedings are frequently resolved so that the allocation of cleanup costs among the parties more nearly reflects the relative contributions of the parties to the site situation. The Company’s potential liability varies greatly from site to site. For some sites the potential liability is
de minimis
and for others the final costs of cleanup have not yet been determined. While it is not feasible to predict the outcome of many of these proceedings brought by federal or state agencies or private litigants, in the opinion of the Company, such proceedings should not ultimately result in any liability which would have a material adverse effect on the financial position, results of operations, liquidity or capital resources of the Company. The Company has taken an active role in identifying and accruing for these costs and such amounts do not include any reduction for anticipated recoveries of cleanup costs from former site owners or operators or other recalcitrant potentially responsible parties.
In management’s opinion, the liabilities for all environmental matters that are probable and reasonably estimable have been accrued and totaled
$83 million
and
$109 million
at
December 31, 2016
and
2015
, respectively. These liabilities are undiscounted, do not consider potential recoveries from other parties and will be paid out over the periods of remediation for the applicable sites, which are expected to occur primarily over the next
15
years. Although it is not possible to predict with certainty the outcome of these matters, or the ultimate costs of remediation, management does not believe that any reasonably possible expenditures that may be incurred in excess of the liabilities accrued should exceed
$64 million
in the aggregate. Management also does not believe that these expenditures should result in a material adverse effect on the Company’s financial position, results of operations, liquidity or capital resources for any year.
11. Equity
The Merck certificate of incorporation authorizes
6,500,000,000
shares of common stock and
20,000,000
shares of preferred stock.
Capital Stock
A summary of common stock and treasury stock transactions (shares in millions) is as follows:
|
|
2016
|
2015
|
2014
|
||||||||||||||
|
|
Common
Stock
|
Treasury
Stock
|
Common
Stock
|
Treasury
Stock
|
Common
Stock
|
Treasury
Stock
|
|||||||||||
|
Balance January 1
|
3,577
|
|
796
|
|
3,577
|
|
739
|
|
3,577
|
|
650
|
|
|||||
|
Purchases of treasury stock
|
—
|
|
60
|
|
—
|
|
75
|
|
—
|
|
134
|
|
|||||
|
Issuances
(1)
|
—
|
|
(28
|
)
|
—
|
|
(18
|
)
|
—
|
|
(45
|
)
|
|||||
|
Balance December 31
|
3,577
|
|
828
|
|
3,577
|
|
796
|
|
3,577
|
|
739
|
|
|||||
|
(1)
|
Issuances primarily reflect activity under share-based compensation plans.
|
12. Share-Based Compensation Plans
The Company has share-based compensation plans under which the Company grants restricted stock units (RSUs) and performance share units (PSUs) to certain management level employees. The Company also issues RSUs to employees of certain of the Company’s equity method investees. In addition, employees and non-employee directors may be granted options to purchase shares of Company common stock at the fair market value at the time of grant. These plans were approved by the Company’s shareholders.
108
At
December 31, 2016
,
125 million
shares collectively were authorized for future grants under the Company’s share-based compensation plans. These awards are settled primarily with treasury shares.
Employee stock options are granted to purchase shares of Company stock at the fair market value at the time of grant. These awards generally vest
one-third
each year over a
three
-year period, with a contractual term of
7
-
10
years. RSUs are stock awards that are granted to employees and entitle the holder to shares of common stock as the awards vest. The fair value of the stock option and RSU awards is determined and fixed on the grant date based on the Company’s stock price. PSUs are stock awards where the ultimate number of shares issued will be contingent on the Company’s performance against a pre-set objective or set of objectives. The fair value of each PSU is determined on the date of grant based on the Company’s stock price. For RSUs and PSUs, dividends declared during the vesting period are payable to the employees only upon vesting. Over the PSU performance period, the number of shares of stock that are expected to be issued will be adjusted based on the probability of achievement of a performance target and final compensation expense will be recognized based on the ultimate number of shares issued. RSU and PSU distributions will be in shares of Company stock after the end of the vesting or performance period, generally
three
years, subject to the terms applicable to such awards.
Total pretax share-based compensation cost recorded in
2016
,
2015
and
2014
was
$300 million
,
$299 million
and
$278 million
, respectively, with related income tax benefits of
$92 million
,
$93 million
and
$86 million
, respectively.
The Company uses the Black-Scholes option pricing model for determining the fair value of option grants. In applying this model, the Company uses both historical data and current market data to estimate the fair value of its options. The Black-Scholes model requires several assumptions including expected dividend yield, risk-free interest rate, volatility, and term of the options. The expected dividend yield is based on historical patterns of dividend payments. The risk-free rate is based on the rate at grant date of zero-coupon U.S. Treasury Notes with a term equal to the expected term of the option. Expected volatility is estimated using a blend of historical and implied volatility. The historical component is based on historical monthly price changes. The implied volatility is obtained from market data on the Company’s traded options. The expected life represents the amount of time that options granted are expected to be outstanding, based on historical and forecasted exercise behavior.
The weighted average exercise price of options granted in
2016
,
2015
and
2014
was
$54.63
,
$59.73
and
$58.14
per option, respectively. The weighted average fair value of options granted in
2016
,
2015
and
2014
was
$5.89
,
$6.46
and
$6.79
per option, respectively, and were determined using the following assumptions:
|
Years Ended December 31
|
2016
|
2015
|
2014
|
|||||
|
Expected dividend yield
|
3.8
|
%
|
4.1
|
%
|
4.3
|
%
|
||
|
Risk-free interest rate
|
1.4
|
%
|
1.7
|
%
|
2.0
|
%
|
||
|
Expected volatility
|
19.6
|
%
|
19.9
|
%
|
22.0
|
%
|
||
|
Expected life (years)
|
6.2
|
|
6.2
|
|
6.4
|
|
||
Summarized information relative to stock option plan activity (options in thousands) is as follows:
|
Number
of Options
|
Weighted
Average
Exercise
Price
|
Weighted
Average
Remaining
Contractual
Term (Years)
|
Aggregate
Intrinsic
Value
|
|||||||||
|
Outstanding January 1, 2016
|
64,668
|
|
$
|
41.64
|
|
|||||||
|
Granted
|
6,220
|
|
54.63
|
|
||||||||
|
Exercised
|
(23,846
|
)
|
39.39
|
|
||||||||
|
Forfeited
|
(1,951
|
)
|
45.14
|
|
|
|
||||||
|
Outstanding December 31, 2016
|
45,091
|
|
$
|
44.47
|
|
4.42
|
$
|
654
|
|
|||
|
Exercisable December 31, 2016
|
34,311
|
|
$
|
40.87
|
|
3.12
|
$
|
619
|
|
|||
109
Additional information pertaining to stock option plans is provided in the table below:
|
Years Ended December 31
|
2016
|
2015
|
2014
|
||||||||
|
Total intrinsic value of stock options exercised
|
$
|
444
|
|
$
|
332
|
|
$
|
626
|
|
||
|
Fair value of stock options vested
|
28
|
|
30
|
|
35
|
|
|||||
|
Cash received from the exercise of stock options
|
939
|
|
485
|
|
1,560
|
|
|||||
A summary of nonvested RSU and PSU activity (shares in thousands) is as follows:
|
|
RSUs
|
PSUs
|
||||||||||||
|
|
Number
of Shares
|
Weighted
Average
Grant Date
Fair Value
|
Number
of Shares
|
Weighted
Average
Grant Date
Fair Value
|
||||||||||
|
Nonvested January 1, 2016
|
13,400
|
|
$
|
53.73
|
|
1,884
|
|
$
|
55.33
|
|
||||
|
Granted
|
5,617
|
|
54.67
|
|
733
|
|
57.38
|
|
||||||
|
Vested
|
(4,956
|
)
|
45.06
|
|
(786
|
)
|
48.18
|
|
||||||
|
Forfeited
|
(795
|
)
|
56.65
|
|
(87
|
)
|
58.82
|
|
||||||
|
Nonvested December 31, 2016
|
13,266
|
|
$
|
57.19
|
|
1,744
|
|
$
|
59.24
|
|
||||
At
December 31, 2016
, there was
$443 million
of total pretax unrecognized compensation expense related to nonvested stock options, RSU and PSU awards which will be recognized over a weighted average period of
1.9
years. For segment reporting, share-based compensation costs are unallocated expenses.
13. Pension and Other Postretirement Benefit Plans
The Company has defined benefit pension plans covering eligible employees in the United States and in certain of its international subsidiaries. In addition, the Company provides medical benefits, principally to its eligible U.S. retirees and their dependents, through its other postretirement benefit plans. The Company uses December 31 as the year-end measurement date for all of its pension plans and other postretirement benefit plans.
Net Periodic Benefit Cost
The net periodic benefit cost for pension and other postretirement benefit plans consisted of the following components:
|
Pension Benefits
|
|||||||||||||||||||||||||||||||||||
|
U.S.
|
International
|
Other Postretirement Benefits
|
|||||||||||||||||||||||||||||||||
|
Years Ended December 31
|
2016
|
2015
|
2014
|
2016
|
2015
|
2014
|
2016
|
2015
|
2014
|
||||||||||||||||||||||||||
|
Service cost
|
$
|
282
|
|
$
|
307
|
|
$
|
300
|
|
$
|
238
|
|
$
|
251
|
|
$
|
266
|
|
$
|
54
|
|
$
|
80
|
|
$
|
78
|
|
||||||||
|
Interest cost
|
456
|
|
434
|
|
425
|
|
204
|
|
206
|
|
269
|
|
82
|
|
110
|
|
115
|
|
|||||||||||||||||
|
Expected return on plan assets
|
(831
|
)
|
(819
|
)
|
(782
|
)
|
(382
|
)
|
(379
|
)
|
(416
|
)
|
(107
|
)
|
(143
|
)
|
(139
|
)
|
|||||||||||||||||
|
Net amortization
|
64
|
|
158
|
|
74
|
|
76
|
|
104
|
|
59
|
|
(103
|
)
|
(59
|
)
|
(71
|
)
|
|||||||||||||||||
|
Termination benefits
|
23
|
|
22
|
|
53
|
|
4
|
|
1
|
|
11
|
|
4
|
|
7
|
|
22
|
|
|||||||||||||||||
|
Curtailments
|
5
|
|
(12
|
)
|
(69
|
)
|
(1
|
)
|
(9
|
)
|
(4
|
)
|
(18
|
)
|
(19
|
)
|
(39
|
)
|
|||||||||||||||||
|
Settlements
|
—
|
|
1
|
|
11
|
|
6
|
|
12
|
|
6
|
|
—
|
|
—
|
|
—
|
|
|||||||||||||||||
|
Net periodic benefit (credit) cost
|
$
|
(1
|
)
|
$
|
91
|
|
$
|
12
|
|
$
|
145
|
|
$
|
186
|
|
$
|
191
|
|
$
|
(88
|
)
|
$
|
(24
|
)
|
$
|
(34
|
)
|
||||||||
The changes in net periodic benefit (credit) cost year over year for pension plans are largely attributable to changes in the discount rate affecting net amortization. The decrease in net periodic benefit cost for other postretirement benefit plans in 2016 as compared with 2015 is largely attributable to changes in retiree medical benefits approved by the Company in December 2015.
In connection with restructuring actions (see Note 4), termination charges were recorded in
2016
,
2015
and
2014
on pension and other postretirement benefit plans related to expanded eligibility for certain employees exiting Merck. Also, in connection with these restructuring activities, curtailments were recorded on pension and other
110
postretirement benefit plans and settlements were recorded on certain U.S. and international pension plans as reflected in the table above.
Obligations and Funded Status
Summarized information about the changes in plan assets and benefit obligations, the funded status and the amounts recorded at December 31 is as follows:
|
|
Pension Benefits
|
Other
Postretirement
Benefits
|
|||||||||||||||||||||
|
U.S.
|
International
|
||||||||||||||||||||||
|
|
2016
|
2015
|
2016
|
2015
|
2016
|
2015
|
|||||||||||||||||
|
Fair value of plan assets January 1
|
$
|
9,266
|
|
$
|
9,984
|
|
$
|
7,204
|
|
$
|
7,724
|
|
$
|
1,913
|
|
$
|
1,984
|
|
|||||
|
Actual return on plan assets
|
941
|
|
(226
|
)
|
898
|
|
138
|
|
138
|
|
(34
|
)
|
|||||||||||
|
Company contributions
|
63
|
|
66
|
|
424
|
|
163
|
|
68
|
|
63
|
|
|||||||||||
|
Effects of exchange rate changes
|
—
|
|
—
|
|
(546
|
)
|
(568
|
)
|
—
|
|
(1
|
)
|
|||||||||||
|
Benefits paid
|
(504
|
)
|
(523
|
)
|
(193
|
)
|
(196
|
)
|
(108
|
)
|
(99
|
)
|
|||||||||||
|
Settlements
|
—
|
|
(35
|
)
|
(21
|
)
|
(66
|
)
|
—
|
|
—
|
|
|||||||||||
|
Assets no longer restricted to the payment of postretirement benefits
(1)
|
—
|
|
—
|
|
—
|
|
—
|
|
(992
|
)
|
—
|
|
|||||||||||
|
Other
|
—
|
|
—
|
|
28
|
|
9
|
|
—
|
|
—
|
|
|||||||||||
|
Fair value of plan assets December 31
|
$
|
9,766
|
|
$
|
9,266
|
|
$
|
7,794
|
|
$
|
7,204
|
|
$
|
1,019
|
|
$
|
1,913
|
|
|||||
|
Benefit obligation January 1
|
$
|
9,723
|
|
$
|
10,632
|
|
$
|
7,733
|
|
$
|
8,331
|
|
$
|
1,810
|
|
$
|
2,638
|
|
|||||
|
Service cost
|
282
|
|
307
|
|
238
|
|
251
|
|
54
|
|
80
|
|
|||||||||||
|
Interest cost
|
456
|
|
434
|
|
204
|
|
206
|
|
82
|
|
110
|
|
|||||||||||
|
Actuarial losses (gains)
(2)
|
854
|
|
(1,102
|
)
|
938
|
|
(127
|
)
|
77
|
|
(384
|
)
|
|||||||||||
|
Benefits paid
|
(504
|
)
|
(523
|
)
|
(193
|
)
|
(196
|
)
|
(108
|
)
|
(99
|
)
|
|||||||||||
|
Effects of exchange rate changes
|
—
|
|
—
|
|
(576
|
)
|
(647
|
)
|
2
|
|
(11
|
)
|
|||||||||||
|
Plan amendments
(3)
|
—
|
|
—
|
|
—
|
|
(1
|
)
|
—
|
|
(531
|
)
|
|||||||||||
|
Curtailments
|
15
|
|
(14
|
)
|
(15
|
)
|
(15
|
)
|
1
|
|
(3
|
)
|
|||||||||||
|
Termination benefits
|
23
|
|
22
|
|
4
|
|
1
|
|
4
|
|
7
|
|
|||||||||||
|
Settlements
|
—
|
|
(35
|
)
|
(21
|
)
|
(66
|
)
|
—
|
|
—
|
|
|||||||||||
|
Other
|
—
|
|
2
|
|
60
|
|
(4
|
)
|
—
|
|
3
|
|
|||||||||||
|
Benefit obligation December 31
|
$
|
10,849
|
|
$
|
9,723
|
|
$
|
8,372
|
|
$
|
7,733
|
|
$
|
1,922
|
|
$
|
1,810
|
|
|||||
|
Funded status December 31
|
$
|
(1,083
|
)
|
$
|
(457
|
)
|
$
|
(578
|
)
|
$
|
(529
|
)
|
$
|
(903
|
)
|
$
|
103
|
|
|||||
|
Recognized as:
|
|||||||||||||||||||||||
|
Other assets
|
$
|
—
|
|
$
|
179
|
|
$
|
451
|
|
$
|
567
|
|
$
|
—
|
|
$
|
359
|
|
|||||
|
Accrued and other current liabilities
|
(50
|
)
|
(48
|
)
|
(7
|
)
|
(7
|
)
|
(11
|
)
|
(10
|
)
|
|||||||||||
|
Other noncurrent liabilities
|
(1,033
|
)
|
(588
|
)
|
(1,022
|
)
|
(1,089
|
)
|
(892
|
)
|
(246
|
)
|
|||||||||||
(1)
As a result of certain allowable administrative actions that occurred in June 2016,
$992 million
of plan assets previously restricted for the payment of other postretirement benefits became available to fund certain other health and welfare benefits.
(2)
Actuarial losses in 2016 and actuarial gains in 2015 primarily reflect changes in discount rates.
(3)
The decline in other postretirement benefit obligations in 2015 resulting from plan amendments primarily reflects changes to Merck’s retiree medical benefits approved by the Company in December 2015. The changes provide that, beginning in 2017, Merck will provide access to retiree health insurance coverage that supplements government-sponsored Medicare through a private insurance marketplace.
At
December 31, 2016
and
2015
, the accumulated benefit obligation was
$18.4 billion
and
$16.7 billion
, respectively, for all pension plans, of which
$10.5 billion
and
$9.4 billion
, respectively, related to U.S. pension plans.
111
Information related to the funded status of selected pension plans at December 31 is as follows:
|
U.S.
|
International
|
||||||||||||||
|
2016
|
2015
|
2016
|
2015
|
||||||||||||
|
Pension plans with a projected benefit obligation in excess of plan assets
|
|||||||||||||||
|
Projected benefit obligation
|
$
|
10,849
|
|
$
|
1,310
|
|
$
|
5,486
|
|
$
|
5,093
|
|
|||
|
Fair value of plan assets
|
9,766
|
|
674
|
|
4,457
|
|
3,996
|
|
|||||||
|
Pension plans with an accumulated benefit obligation in excess of plan assets
|
|||||||||||||||
|
Accumulated benefit obligation
|
$
|
9,807
|
|
$
|
611
|
|
$
|
2,692
|
|
$
|
4,812
|
|
|||
|
Fair value of plan assets
|
9,057
|
|
—
|
|
1,898
|
|
3,964
|
|
|||||||
Plan Assets
Entities are required to use a fair value hierarchy which maximizes the use of observable inputs and minimizes the use of unobservable inputs when measuring fair value. There are three levels of inputs used to measure fair value with Level 1 having the highest priority and Level 3 having the lowest:
Level 1
— Quoted prices (unadjusted) in active markets for identical assets or liabilities.
Level 2
— Observable inputs other than Level 1 prices, such as quoted prices for similar assets or liabilities, or other inputs that are observable or can be corroborated by observable market data for substantially the full term of the assets or liabilities.
Level 3
— Unobservable inputs that are supported by little or no market activity. The Level 3 assets are those whose values are determined using pricing models, discounted cash flow methodologies, or similar techniques with significant unobservable inputs, as well as instruments for which the determination of fair value requires significant judgment or estimation. At
December 31, 2016
and
2015
,
$435 million
and
$423 million
, respectively, or approximately
2%
and
3%
, respectively, of the Company’s pension investments were categorized as Level 3 assets.
If the inputs used to measure the financial assets fall within more than one level described above, the categorization is based on the lowest level input that is significant to the fair value measurement of the instrument.
112
The fair values of the Company’s pension plan assets at December 31 by asset category are as follows:
|
|
Fair Value Measurements Using
|
Fair Value Measurements Using
|
|||||||||||||||||||||||||||||
|
|
Quoted Prices
In Active
Markets for
Identical Assets
(Level 1)
|
Significant
Other
Observable
Inputs
(Level 2)
|
Significant
Unobservable
Inputs
(Level 3)
|
Total
|
Quoted Prices
In Active
Markets for
Identical Assets
(Level 1)
|
Significant
Other
Observable
Inputs
(Level 2)
|
Significant
Unobservable
Inputs
(Level 3)
|
Total
|
|||||||||||||||||||||||
|
|
2016
|
|
2015
|
|
|||||||||||||||||||||||||||
|
U.S. Pension Plans
|
|||||||||||||||||||||||||||||||
|
Assets
|
|
|
|
|
|
|
|
|
|||||||||||||||||||||||
|
Cash and cash equivalents
|
$
|
2
|
|
$
|
2
|
|
$
|
—
|
|
$
|
4
|
|
$
|
—
|
|
$
|
—
|
|
$
|
—
|
|
$
|
—
|
|
|||||||
|
Investment funds
|
|||||||||||||||||||||||||||||||
|
Developed markets equities
|
521
|
|
—
|
|
—
|
|
521
|
|
566
|
|
—
|
|
—
|
|
566
|
|
|||||||||||||||
|
Emerging markets equities
|
104
|
|
—
|
|
—
|
|
104
|
|
87
|
|
—
|
|
—
|
|
87
|
|
|||||||||||||||
|
Equity securities
|
|||||||||||||||||||||||||||||||
|
Developed markets
|
2,521
|
|
—
|
|
—
|
|
2,521
|
|
2,444
|
|
—
|
|
—
|
|
2,444
|
|
|||||||||||||||
|
Fixed income securities
|
|||||||||||||||||||||||||||||||
|
Government and agency obligations
|
—
|
|
475
|
|
—
|
|
475
|
|
—
|
|
391
|
|
—
|
|
391
|
|
|||||||||||||||
|
Corporate obligations
|
—
|
|
660
|
|
—
|
|
660
|
|
—
|
|
679
|
|
—
|
|
679
|
|
|||||||||||||||
|
Mortgage and asset-backed securities
|
—
|
|
239
|
|
—
|
|
239
|
|
—
|
|
236
|
|
—
|
|
236
|
|
|||||||||||||||
|
Other investments
|
—
|
|
—
|
|
18
|
|
18
|
|
—
|
|
—
|
|
23
|
|
23
|
|
|||||||||||||||
|
Net assets in fair value hierarchy
|
$
|
3,148
|
|
$
|
1,376
|
|
|
$
|
18
|
|
|
$
|
4,542
|
|
|
$
|
3,097
|
|
|
$
|
1,306
|
|
|
$
|
23
|
|
|
$
|
4,426
|
|
|
|
Investments measured at NAV practical expedient
(1)
|
5,224
|
|
4,840
|
|
|||||||||||||||||||||||||||
|
Plan assets at fair value
|
$
|
9,766
|
|
$
|
9,266
|
|
|||||||||||||||||||||||||
|
International Pension Plans
|
|||||||||||||||||||||||||||||||
|
Assets
|
|
|
|
|
|
|
|
|
|||||||||||||||||||||||
|
Cash and cash equivalents
|
$
|
42
|
|
$
|
11
|
|
$
|
—
|
|
$
|
53
|
|
$
|
63
|
|
$
|
4
|
|
$
|
—
|
|
$
|
67
|
|
|||||||
|
Investment funds
|
|
|
|||||||||||||||||||||||||||||
|
Developed markets equities
|
187
|
|
2,846
|
|
—
|
|
3,033
|
|
184
|
|
2,738
|
|
—
|
|
2,922
|
|
|||||||||||||||
|
Emerging markets equities
|
24
|
|
148
|
|
—
|
|
172
|
|
21
|
|
137
|
|
—
|
|
158
|
|
|||||||||||||||
|
Government and agency obligations
|
123
|
|
1,904
|
|
—
|
|
2,027
|
|
305
|
|
1,115
|
|
—
|
|
1,420
|
|
|||||||||||||||
|
Corporate obligations
|
2
|
|
282
|
|
—
|
|
284
|
|
173
|
|
103
|
|
—
|
|
276
|
|
|||||||||||||||
|
Fixed income obligations
|
6
|
|
3
|
|
—
|
|
9
|
|
8
|
|
3
|
|
—
|
|
11
|
|
|||||||||||||||
|
Real estate
(2)
|
—
|
|
3
|
|
4
|
|
7
|
|
—
|
|
3
|
|
5
|
|
8
|
|
|||||||||||||||
|
Equity securities
|
|
|
|||||||||||||||||||||||||||||
|
Developed markets
|
565
|
|
—
|
|
—
|
|
565
|
|
496
|
|
—
|
|
—
|
|
496
|
|
|||||||||||||||
|
Fixed income securities
|
|
|
|||||||||||||||||||||||||||||
|
Government and agency obligations
|
2
|
|
235
|
|
—
|
|
237
|
|
2
|
|
465
|
|
—
|
|
467
|
|
|||||||||||||||
|
Corporate obligations
|
—
|
|
92
|
|
—
|
|
92
|
|
—
|
|
161
|
|
—
|
|
161
|
|
|||||||||||||||
|
Mortgage and asset-backed securities
|
—
|
|
50
|
|
—
|
|
50
|
|
—
|
|
68
|
|
—
|
|
68
|
|
|||||||||||||||
|
Other investments
|
|
|
|||||||||||||||||||||||||||||
|
Insurance contracts
(3)
|
—
|
|
59
|
|
412
|
|
471
|
|
—
|
|
57
|
|
393
|
|
450
|
|
|||||||||||||||
|
Other
|
1
|
|
4
|
|
1
|
|
6
|
|
—
|
|
3
|
|
2
|
|
5
|
|
|||||||||||||||
|
Net assets in fair value hierarchy
|
$
|
952
|
|
$
|
5,637
|
|
$
|
417
|
|
$
|
7,006
|
|
$
|
1,252
|
|
$
|
4,857
|
|
$
|
400
|
|
$
|
6,509
|
|
|||||||
|
Investments measured at NAV practical expedient
(1)
|
788
|
|
695
|
|
|||||||||||||||||||||||||||
|
Plan assets at fair value
|
$
|
7,794
|
|
$
|
7,204
|
|
|||||||||||||||||||||||||
|
(1)
|
Certain investments that were measured at net asset value (NAV) per share or its equivalent have not been classified in the fair value hierarchy. The fair value amounts presented in this table are intended to permit reconciliation of the fair value hierarchy to the fair value of plan assets at December 31, 2016 and 2015.
|
|
(2)
|
The plans’ Level 3 investments in real estate funds are generally valued by market appraisals of the underlying investments in the funds.
|
|
(3)
|
The plans’ Level 3 investments in insurance contracts are generally valued using a crediting rate that approximates market returns and invest in underlying securities whose market values are unobservable and determined using pricing models, discounted cash flow methodologies, or similar techniques.
|
113
The table below provides a summary of the changes in fair value, including transfers in and/or out, of all financial assets measured at fair value using significant unobservable inputs (Level 3) for the Company’s pension plan assets:
|
|
2016
|
2015
|
|||||||||||||||||||||||||||||
|
|
Insurance
Contracts
|
Real
Estate
|
Other
|
Total
|
Insurance
Contracts
|
Real
Estate
|
Other
|
Total
|
|||||||||||||||||||||||
|
U.S. Pension Plans
|
|||||||||||||||||||||||||||||||
|
Balance January 1
|
$
|
—
|
|
$
|
—
|
|
$
|
23
|
|
$
|
23
|
|
$
|
—
|
|
$
|
—
|
|
$
|
28
|
|
$
|
28
|
|
|||||||
|
Actual return on plan assets:
|
|||||||||||||||||||||||||||||||
|
Relating to assets still held at December 31
|
—
|
|
—
|
|
(3
|
)
|
(3
|
)
|
—
|
|
—
|
|
(3
|
)
|
(3
|
)
|
|||||||||||||||
|
Relating to assets sold during the year
|
—
|
|
—
|
|
4
|
|
4
|
|
—
|
|
—
|
|
5
|
|
5
|
|
|||||||||||||||
|
Purchases and sales, net
|
—
|
|
—
|
|
(6
|
)
|
(6
|
)
|
—
|
|
—
|
|
(7
|
)
|
(7
|
)
|
|||||||||||||||
|
Balance December 31
|
$
|
—
|
|
|
$
|
—
|
|
|
$
|
18
|
|
|
$
|
18
|
|
|
$
|
—
|
|
|
$
|
—
|
|
|
$
|
23
|
|
|
$
|
23
|
|
|
International Pension Plans
|
|||||||||||||||||||||||||||||||
|
Balance January 1
|
$
|
393
|
|
$
|
5
|
|
$
|
2
|
|
$
|
400
|
|
$
|
394
|
|
$
|
23
|
|
$
|
2
|
|
$
|
419
|
|
|||||||
|
Actual return on plan assets:
|
|||||||||||||||||||||||||||||||
|
Relating to assets still held at December 31
|
(9
|
)
|
1
|
|
—
|
|
(8
|
)
|
(28
|
)
|
(2
|
)
|
—
|
|
(30
|
)
|
|||||||||||||||
|
Purchases and sales, net
|
2
|
|
(2
|
)
|
(1
|
)
|
(1
|
)
|
2
|
|
(16
|
)
|
—
|
|
(14
|
)
|
|||||||||||||||
|
Transfers into Level 3
|
26
|
|
—
|
|
—
|
|
26
|
|
25
|
|
—
|
|
—
|
|
25
|
|
|||||||||||||||
|
Balance December 31
|
$
|
412
|
|
|
$
|
4
|
|
|
$
|
1
|
|
|
$
|
417
|
|
|
$
|
393
|
|
|
$
|
5
|
|
|
$
|
2
|
|
|
$
|
400
|
|
The fair values of the Company’s other postretirement benefit plan assets at December 31 by asset category are as follows:
|
|
Fair Value Measurements Using
|
Fair Value Measurements Using
|
|||||||||||||||||||||||||||||
|
|
Quoted Prices
In Active
Markets for
Identical Assets
(Level 1)
|
Significant
Other
Observable
Inputs
(Level 2)
|
Significant
Unobservable
Inputs
(Level 3)
|
Total
|
Quoted Prices
In Active
Markets for
Identical Assets
(Level 1)
|
Significant
Other
Observable
Inputs
(Level 2)
|
Significant
Unobservable
Inputs
(Level 3)
|
Total
|
|||||||||||||||||||||||
|
|
2016
|
|
2015
|
|
|||||||||||||||||||||||||||
|
Assets
|
|||||||||||||||||||||||||||||||
|
Cash and cash equivalents
|
$
|
125
|
|
$
|
—
|
|
$
|
—
|
|
$
|
125
|
|
$
|
65
|
|
$
|
—
|
|
$
|
—
|
|
$
|
65
|
|
|||||||
|
Investment funds
|
|||||||||||||||||||||||||||||||
|
Developed markets equities
|
48
|
|
—
|
|
—
|
|
48
|
|
53
|
|
—
|
|
—
|
|
53
|
|
|||||||||||||||
|
Emerging markets equities
|
10
|
|
—
|
|
—
|
|
10
|
|
29
|
|
—
|
|
—
|
|
29
|
|
|||||||||||||||
|
Government and agency obligations
|
1
|
|
—
|
|
—
|
|
1
|
|
2
|
|
—
|
|
—
|
|
2
|
|
|||||||||||||||
|
Equity securities
|
|||||||||||||||||||||||||||||||
|
Developed markets
|
231
|
|
—
|
|
—
|
|
231
|
|
229
|
|
—
|
|
—
|
|
229
|
|
|||||||||||||||
|
Fixed income securities
|
|||||||||||||||||||||||||||||||
|
Government and agency obligations
|
—
|
|
43
|
|
—
|
|
43
|
|
—
|
|
339
|
|
—
|
|
339
|
|
|||||||||||||||
|
Corporate obligations
|
—
|
|
60
|
|
—
|
|
60
|
|
—
|
|
311
|
|
—
|
|
311
|
|
|||||||||||||||
|
Mortgage and asset-backed securities
|
—
|
|
22
|
|
—
|
|
22
|
|
—
|
|
218
|
|
—
|
|
218
|
|
|||||||||||||||
|
Net assets in fair value hierarchy
|
$
|
415
|
|
$
|
125
|
|
$
|
—
|
|
$
|
540
|
|
$
|
378
|
|
$
|
868
|
|
$
|
—
|
|
$
|
1,246
|
|
|||||||
|
Investments measured at NAV practical expedient
(1)
|
479
|
|
667
|
|
|||||||||||||||||||||||||||
|
Plan assets at fair value
|
$
|
1,019
|
|
$
|
1,913
|
|
|||||||||||||||||||||||||
|
(1)
|
Certain investments that were measured at net asset value (NAV) per share or its equivalent have not been classified in the fair value hierarchy. The fair value amounts presented in this table are intended to permit reconciliation of the fair value hierarchy to the fair value of plan assets at December 31, 2016 and 2015.
|
The Company has established investment guidelines for its U.S. pension and other postretirement plans to create an asset allocation that is expected to deliver a rate of return sufficient to meet the long-term obligation of each
114
plan, given an acceptable level of risk. The target investment portfolio of the Company’s U.S. pension and other postretirement benefit plans is allocated
40%
to
60%
in U.S. equities,
20%
to
40%
in international equities,
15%
to
25%
in fixed-income investments, and up to
5%
in cash and other investments. The portfolio’s equity weighting is consistent with the long-term nature of the plans’ benefit obligations. The expected annual standard deviation of returns of the target portfolio, which approximates
13%
, reflects both the equity allocation and the diversification benefits among the asset classes in which the portfolio invests. For international pension plans, the targeted investment portfolio varies based on the duration of pension liabilities and local government rules and regulations. Although a significant percentage of plan assets are invested in U.S. equities, concentration risk is mitigated through the use of strategies that are diversified within management guidelines.
Expected Contributions
Expected contributions during
2017
are approximately
$50 million
for U.S. pension plans, approximately
$160 million
for international pension plans and approximately
$25 million
for other postretirement benefit plans.
Expected Benefit Payments
Expected benefit payments are as follows:
|
U.S. Pension Benefits
|
International Pension
Benefits
|
Other
Postretirement
Benefits
|
|||||||||
|
2017
|
$
|
561
|
|
$
|
186
|
|
$
|
101
|
|
||
|
2018
|
588
|
|
179
|
|
104
|
|
|||||
|
2019
|
629
|
|
195
|
|
106
|
|
|||||
|
2020
|
638
|
|
202
|
|
111
|
|
|||||
|
2021
|
655
|
|
201
|
|
115
|
|
|||||
|
2022 — 2026
|
3,596
|
|
1,168
|
|
641
|
|
|||||
Expected benefit payments are based on the same assumptions used to measure the benefit obligations and include estimated future employee service.
Amounts Recognized in Other Comprehensive Income
Net loss amounts reflect experience differentials primarily relating to differences between expected and actual returns on plan assets as well as the effects of changes in actuarial assumptions. Net loss amounts in excess of certain thresholds are amortized into net periodic benefit cost over the average remaining service life of employees. The following amounts were reflected as components of
OCI
:
|
|
Pension Plans
|
Other Postretirement
Benefit Plans
|
|||||||||||||||||||||||||||||||||
|
U.S.
|
International
|
||||||||||||||||||||||||||||||||||
|
Years Ended December 31
|
2016
|
2015
|
2014
|
2016
|
2015
|
2014
|
2016
|
2015
|
2014
|
||||||||||||||||||||||||||
|
Net (loss) gain arising during the period
|
$
|
(743
|
)
|
$
|
73
|
|
$
|
(2,085
|
)
|
$
|
(380
|
)
|
$
|
(66
|
)
|
$
|
(779
|
)
|
$
|
(45
|
)
|
$
|
209
|
|
$
|
(223
|
)
|
||||||||
|
Prior service (cost) credit arising during the period
|
(10
|
)
|
(13
|
)
|
(59
|
)
|
(2
|
)
|
(4
|
)
|
(8
|
)
|
(19
|
)
|
511
|
|
(42
|
)
|
|||||||||||||||||
|
|
$
|
(753
|
)
|
$
|
60
|
|
$
|
(2,144
|
)
|
$
|
(382
|
)
|
$
|
(70
|
)
|
$
|
(787
|
)
|
$
|
(64
|
)
|
$
|
720
|
|
$
|
(265
|
)
|
||||||||
|
Net loss amortization included in benefit cost
|
$
|
119
|
|
$
|
214
|
|
$
|
135
|
|
$
|
87
|
|
$
|
118
|
|
$
|
74
|
|
$
|
3
|
|
$
|
5
|
|
$
|
1
|
|
||||||||
|
Prior service (credit) cost amortization included in benefit cost
|
(55
|
)
|
(56
|
)
|
(61
|
)
|
(11
|
)
|
(14
|
)
|
(15
|
)
|
(106
|
)
|
(64
|
)
|
(72
|
)
|
|||||||||||||||||
|
|
$
|
64
|
|
$
|
158
|
|
$
|
74
|
|
$
|
76
|
|
$
|
104
|
|
$
|
59
|
|
$
|
(103
|
)
|
$
|
(59
|
)
|
$
|
(71
|
)
|
||||||||
The estimated net loss (gain) and prior service cost (credit) amounts that will be amortized from
AOCI
into net periodic benefit cost during
2017
are
$270 million
and
$(64) million
, respectively, for pension plans (of which
$178 million
and
$(53) million
, respectively, relates to U.S. pension plans) and
$1 million
and
$(99) million
, respectively, for other postretirement benefit plans.
115
Actuarial Assumptions
The Company reassesses its benefit plan assumptions on a regular basis. The weighted average assumptions used in determining U.S. pension and other postretirement benefit plan and international pension plan information are as follows:
|
|
U.S. Pension and Other
Postretirement Benefit Plans
|
International Pension Plans
|
|||||||||||||||
|
December 31
|
2016
|
|
2015
|
|
2014
|
|
2016
|
|
2015
|
|
2014
|
|
|||||
|
Net periodic benefit cost
|
|
|
|
|
|
|
|||||||||||
|
Discount rate
|
4.70
|
%
|
4.20
|
%
|
4.90
|
%
|
2.80
|
%
|
2.70
|
%
|
3.80
|
%
|
|||||
|
Expected rate of return on plan assets
|
8.60
|
%
|
8.50
|
%
|
8.50
|
%
|
5.60
|
%
|
5.70
|
%
|
6.00
|
%
|
|||||
|
Salary growth rate
|
4.30
|
%
|
4.40
|
%
|
4.50
|
%
|
2.90
|
%
|
2.90
|
%
|
3.10
|
%
|
|||||
|
Benefit obligation
|
|
|
|
|
|
|
|||||||||||
|
Discount rate
|
4.30
|
%
|
4.80
|
%
|
4.20
|
%
|
2.20
|
%
|
2.80
|
%
|
2.70
|
%
|
|||||
|
Salary growth rate
|
4.30
|
%
|
4.30
|
%
|
4.40
|
%
|
2.90
|
%
|
2.90
|
%
|
2.90
|
%
|
|||||
For both the pension and other postretirement benefit plans, the discount rate is evaluated on measurement dates and modified to reflect the prevailing market rate of a portfolio of high-quality fixed-income debt instruments that would provide the future cash flows needed to pay the benefits included in the benefit obligation as they come due. The expected rate of return for both the pension and other postretirement benefit plans represents the average rate of return to be earned on plan assets over the period the benefits included in the benefit obligation are to be paid and is determined on a plan basis. In developing the expected rate of return within each plan, long-term historical returns data are considered as well as actual returns on the plan assets and other capital markets experience. Using this reference information, the long-term return expectations for each asset category and a weighted average expected return for each plan’s target portfolio is developed, according to the allocation among those investment categories. The expected portfolio performance reflects the contribution of active management as appropriate. For
2017
, the expected rate of return for the Company’s U.S. pension and other postretirement benefit plans will range from
8.00%
to
8.75%
, as compared to a range of
7.30%
to
8.75%
in
2016
.
The health care cost trend rate assumptions for other postretirement benefit plans are as follows:
|
December 31
|
2016
|
2015
|
|||
|
Health care cost trend rate assumed for next year
|
7.4
|
%
|
6.8
|
%
|
|
|
Rate to which the cost trend rate is assumed to decline
|
4.5
|
%
|
4.5
|
%
|
|
|
Year that the trend rate reaches the ultimate trend rate
|
2032
|
|
2027
|
|
|
A one percentage point change in the health care cost trend rate would have had the following effects:
|
|
One Percentage Point
|
||||||
|
|
Increase
|
Decrease
|
|||||
|
Effect on total service and interest cost components
|
$
|
12
|
|
$
|
(12
|
)
|
|
|
Effect on benefit obligation
|
138
|
|
(114
|
)
|
|||
Savings Plans
The Company also maintains defined contribution savings plans in the United States. The Company matches a percentage of each employee’s contributions consistent with the provisions of the plan for which the employee is eligible. Total employer contributions to these plans in
2016
,
2015
and
2014
were
$126 million
,
$125 million
and
$124 million
, respectively.
116
14. Other (Income) Expense, Net
Other (income) expense, net, consisted of:
|
Years Ended December 31
|
2016
|
2015
|
2014
|
||||||||
|
Interest income
|
$
|
(328
|
)
|
$
|
(289
|
)
|
$
|
(266
|
)
|
||
|
Interest expense
|
693
|
|
672
|
|
732
|
|
|||||
|
Exchange losses
|
174
|
|
1,277
|
|
180
|
|
|||||
|
Equity income from affiliates
|
(86
|
)
|
(205
|
)
|
(257
|
)
|
|||||
|
Other, net
|
267
|
|
72
|
|
(12,002
|
)
|
|||||
|
|
$
|
720
|
|
$
|
1,527
|
|
$
|
(11,613
|
)
|
||
The higher exchange losses in 2015 as compared with 2016 and 2014 were related primarily to the Venezuelan Bolívar. During the second quarter of 2015, upon evaluation of evolving economic conditions in Venezuela and volatility in the country, combined with a decline in transactions that were settled at the then official (CENCOEX) rate of
6.30
VEF (Bolívar Fuertes) per U.S. dollar, the Company determined it was unlikely that all outstanding net monetary assets would be settled at the CENCOEX rate. Accordingly, during the second quarter of 2015, the Company recorded a charge of
$715 million
to devalue its net monetary assets in Venezuela to an amount that represented the Company’s estimate of the U.S. dollar amount that would ultimately be collected. During the third quarter of 2015, the Company recorded additional exchange losses of
$138 million
in the aggregate reflecting the ongoing effect of translating transactions and net monetary assets consistent with the second quarter. In the fourth quarter of 2015, as a result of the further deterioration of economic conditions in Venezuela, and continued declines in transactions which were settled at the official rate, the Company began using the SIMADI rate to report its Venezuelan operations. The Company also revalued its remaining net monetary assets at the SIMADI rate (subsequently replaced with the DICOM rate), which resulted in an additional charge in the fourth quarter of 2015 of
$161 million
. Since January 2010, Venezuela has been designated hyperinflationary and, as a result, local foreign operations are remeasured in U.S. dollars with the impact recorded in results of operations.
The decline in equity income from affiliates in 2016 as compared with 2015 was driven primarily by lower equity income from certain research investment funds.
Other, net (as presented in the table above) in 2016 includes a charge of
$625 million
to settle worldwide patent litigation related to
Keytruda
(see Note 10), a gain of
$117 million
related to the settlement of other patent litigation (see Note 10), gains of
$100 million
resulting from the receipt of milestone payments for out-licensed migraine clinical development programs (see Note 3) and
$98 million
of income related to AstraZeneca’s option exercise (see Note 8).
Other, net in 2015 includes a
$680 million
net charge related to the settlement of
Vioxx
shareholder class action litigation (see Note 10) and an expense of
$78 million
for a contribution of investments in equity securities to the Merck Foundation, partially offset by a
$250 million
gain on the sale of certain migraine clinical development programs (see Note 3), a
$147 million
gain on the divestiture of Merck’s remaining ophthalmics business in international markets (see Note 3), and the recognition of
$182 million
of deferred income related to AstraZeneca’s option exercise.
Other, net in 2014 includes an
$11.2 billion
gain on the divestiture of MCC (see Note 3), a gain of
$741 million
related to AstraZeneca’s option exercise, a
$480 million
gain on the divestiture of certain ophthalmic products in several international markets (see Note 3), a gain of
$204 million
related to the sale of Sirna (see Note 3) and the recognition of
$140 million
of deferred income related to AstraZeneca’s option exercise, partially offset by a
$628 million
loss on extinguishment of debt (see Note 9) and a
$93 million
goodwill impairment charge related to the Company’s joint venture with Supera.
Interest paid was
$686 million
in
2016
,
$653 million
in
2015
and
$852 million
in
2014
.
117
15. Taxes on Income
A reconciliation between the effective tax rate and the U.S. statutory rate is as follows:
|
|
2016
|
2015
|
2014
|
|||||||||||||||||
|
|
Amount
|
Tax Rate
|
Amount
|
Tax Rate
|
Amount
|
Tax Rate
|
||||||||||||||
|
U.S. statutory rate applied to income before taxes
|
$
|
1,631
|
|
35.0
|
%
|
$
|
1,890
|
|
35.0
|
%
|
$
|
6,049
|
|
35.0
|
%
|
|||||
|
Differential arising from:
|
||||||||||||||||||||
|
Foreign earnings
|
(1,593
|
)
|
(34.2
|
)
|
(2,105
|
)
|
(39.0
|
)
|
(1,367
|
)
|
(7.9
|
)
|
||||||||
|
Unremitted foreign earnings
|
(30
|
)
|
(0.6
|
)
|
260
|
|
4.8
|
|
(209
|
)
|
(1.2
|
)
|
||||||||
|
Tax settlements
|
—
|
|
—
|
|
(417
|
)
|
(7.7
|
)
|
(89
|
)
|
(0.5
|
)
|
||||||||
|
AstraZeneca option exercise
|
—
|
|
—
|
|
—
|
|
—
|
|
(774
|
)
|
(4.5
|
)
|
||||||||
|
Sale of Sirna Therapeutics, Inc.
|
—
|
|
—
|
|
—
|
|
—
|
|
(357
|
)
|
(2.1
|
)
|
||||||||
|
Impact of purchase accounting adjustments, including amortization
|
623
|
|
13.4
|
|
797
|
|
14.8
|
|
1,013
|
|
5.9
|
|
||||||||
|
Foreign currency devaluation related to Venezuela
|
—
|
|
—
|
|
321
|
|
5.9
|
|
—
|
|
—
|
|
||||||||
|
State taxes
|
173
|
|
3.7
|
|
159
|
|
2.9
|
|
7
|
|
—
|
|
||||||||
|
Restructuring
|
145
|
|
3.1
|
|
167
|
|
3.1
|
|
289
|
|
1.7
|
|
||||||||
|
U.S. health care reform legislation
|
68
|
|
1.4
|
|
66
|
|
1.2
|
|
134
|
|
0.8
|
|
||||||||
|
Divestiture of Merck Consumer Care
|
—
|
|
—
|
|
—
|
|
—
|
|
440
|
|
2.5
|
|
||||||||
|
Other
(1)
|
(299
|
)
|
(6.4
|
)
|
(196
|
)
|
(3.6
|
)
|
213
|
|
1.2
|
|
||||||||
|
|
$
|
718
|
|
15.4
|
%
|
$
|
942
|
|
17.4
|
%
|
$
|
5,349
|
|
30.9
|
%
|
|||||
|
(1)
|
Other includes the tax effect of contingency reserves, research credits, and miscellaneous items.
|
The foreign earnings tax rate differentials in the tax rate reconciliation above primarily reflect the impacts of operations in jurisdictions with different tax rates than the United States, particularly Ireland and Switzerland, as well as Singapore and Puerto Rico which operate under tax incentive grants, where the earnings have been indefinitely reinvested, thereby yielding a favorable impact on the effective tax rate as compared with the
35.0%
U.S. statutory rate. The foreign earnings tax rate differentials do not include the impact of intangible asset impairment charges, amortization of purchase accounting adjustments or restructuring costs. These items are presented separately as they each represent a significant, separately disclosed pretax cost or charge, and a substantial portion of each of these items relates to jurisdictions with lower tax rates than the United States. Therefore, the impact of recording these expense items in lower tax rate jurisdictions is an unfavorable impact on the effective tax rate as compared to the
35.0%
U.S. statutory rate.
The Company’s 2015 effective tax rate reflects the impact of the Protecting Americans From Tax Hikes Act, which was signed into law on December 18, 2015, extending the research credit permanently and the controlled foreign corporation look-through provisions for five years. The Company’s 2014 effective tax rate reflects the impact of the Tax Increase Prevention Act, which was signed into law on December 19, 2014, extending the research credit and the controlled foreign corporation look-through provisions for one year only.
Income before taxes consisted of:
|
Years Ended December 31
|
2016
|
2015
|
2014
|
||||||||
|
Domestic
|
$
|
518
|
|
$
|
2,247
|
|
$
|
15,730
|
|
||
|
Foreign
|
4,141
|
|
3,154
|
|
1,553
|
|
|||||
|
|
$
|
4,659
|
|
$
|
5,401
|
|
$
|
17,283
|
|
||
118
Taxes on income consisted of:
|
Years Ended December 31
|
2016
|
2015
|
2014
|
||||||||
|
Current provision
|
|||||||||||
|
Federal
|
$
|
1,166
|
|
$
|
732
|
|
$
|
7,136
|
|
||
|
Foreign
|
916
|
|
844
|
|
438
|
|
|||||
|
State
|
157
|
|
130
|
|
375
|
|
|||||
|
|
2,239
|
|
1,706
|
|
7,949
|
|
|||||
|
Deferred provision
|
|||||||||||
|
Federal
|
(1,255
|
)
|
(552
|
)
|
(2,162
|
)
|
|||||
|
Foreign
|
(225
|
)
|
(163
|
)
|
(201
|
)
|
|||||
|
State
|
(41
|
)
|
(49
|
)
|
(237
|
)
|
|||||
|
|
(1,521
|
)
|
(764
|
)
|
(2,600
|
)
|
|||||
|
|
$
|
718
|
|
$
|
942
|
|
$
|
5,349
|
|
||
Deferred income taxes at December 31 consisted of:
|
|
2016
|
2015
|
|||||||||||||
|
|
Assets
|
Liabilities
|
Assets
|
Liabilities
|
|||||||||||
|
Intangibles
|
$
|
86
|
|
$
|
3,734
|
|
$
|
—
|
|
$
|
4,962
|
|
|||
|
Inventory related
|
30
|
|
660
|
|
49
|
|
752
|
|
|||||||
|
Accelerated depreciation
|
28
|
|
927
|
|
43
|
|
910
|
|
|||||||
|
Unremitted foreign earnings
|
—
|
|
2,044
|
|
—
|
|
2,124
|
|
|||||||
|
Pensions and other postretirement benefits
|
727
|
|
109
|
|
435
|
|
131
|
|
|||||||
|
Compensation related
|
438
|
|
—
|
|
535
|
|
—
|
|
|||||||
|
Unrecognized tax benefits
|
383
|
|
—
|
|
412
|
|
—
|
|
|||||||
|
Net operating losses and other tax credit carryforwards
|
437
|
|
—
|
|
565
|
|
—
|
|
|||||||
|
Other
|
1,128
|
|
46
|
|
1,217
|
|
—
|
|
|||||||
|
Subtotal
|
3,257
|
|
7,520
|
|
3,256
|
|
8,879
|
|
|||||||
|
Valuation allowance
|
(268
|
)
|
|
(304
|
)
|
|
|||||||||
|
Total deferred taxes
|
$
|
2,989
|
|
$
|
7,520
|
|
$
|
2,952
|
|
$
|
8,879
|
|
|||
|
Net deferred income taxes
|
|
$
|
4,531
|
|
|
$
|
5,927
|
|
|||||||
|
Recognized as:
|
|||||||||||||||
|
Other assets
|
$
|
546
|
|
$
|
608
|
|
|||||||||
|
Deferred income taxes
|
|
$
|
5,077
|
|
|
$
|
6,535
|
|
|||||||
The Company has net operating loss (NOL) carryforwards in several jurisdictions. As of
December 31, 2016
,
$243 million
of deferred taxes on NOL carryforwards relate to foreign jurisdictions, none of which are individually significant. Valuation allowances of
$268 million
have been established on these foreign NOL carryforwards and other foreign deferred tax assets. In addition, the Company has
$194 million
of deferred tax assets relating to various U.S. tax credit carryforwards and NOL carryforwards, all of which are expected to be fully utilized prior to expiry.
Income taxes paid in
2016
,
2015
and
2014
were
$1.8 billion
,
$1.8 billion
and
$7.9 billion
, respectively. Income taxes paid in 2014 reflects approximately
$5.0 billion
of taxes paid on the divestiture of MCC. Tax benefits relating to stock option exercises were
$147 million
in
2016
,
$109 million
in
2015
and
$202 million
in
2014
.
119
A reconciliation of the beginning and ending amount of unrecognized tax benefits is as follows:
|
2016
|
2015
|
2014
|
|||||||||
|
Balance January 1
|
$
|
3,448
|
|
$
|
3,534
|
|
$
|
3,503
|
|
||
|
Additions related to current year positions
|
196
|
|
198
|
|
389
|
|
|||||
|
Additions related to prior year positions
|
75
|
|
53
|
|
23
|
|
|||||
|
Reductions for tax positions of prior years
(1)
|
(90
|
)
|
(59
|
)
|
(156
|
)
|
|||||
|
Settlements
(1)
|
(92
|
)
|
(184
|
)
|
(161
|
)
|
|||||
|
Lapse of statute of limitations
|
(43
|
)
|
(94
|
)
|
(64
|
)
|
|||||
|
Balance December 31
|
$
|
3,494
|
|
$
|
3,448
|
|
$
|
3,534
|
|
||
|
(1)
|
Amounts reflect the settlements with the IRS as discussed below.
|
If the Company were to recognize the unrecognized tax benefits of
$3.5 billion
at
December 31, 2016
, the income tax provision would reflect a favorable net impact of
$3.3 billion
.
The Company is under examination by numerous tax authorities in various jurisdictions globally. The Company believes that it is reasonably possible that the total amount of unrecognized tax benefits as of
December 31, 2016
could decrease by up to
$1.7 billion
in the next
12
months as a result of various audit closures, settlements or the expiration of the statute of limitations. The ultimate finalization of the Company’s examinations with relevant taxing authorities can include formal administrative and legal proceedings, which could have a significant impact on the timing of the reversal of unrecognized tax benefits. The Company believes that its reserves for uncertain tax positions are adequate to cover existing risks or exposures. However, there is one item that is currently under discussion with the Internal Revenue Service (IRS) relating to the 2006 through 2008 examination. The Company has concluded that its position should be sustained upon audit. However, if this item were to result in an unfavorable outcome or settlement, it could have a material adverse impact on the Company’s financial position, liquidity and results of operations.
Expenses for interest and penalties associated with uncertain tax positions amounted to
$134 million
in
2016
,
$102 million
in
2015
and
$9 million
in
2014
. These amounts reflect the beneficial impacts of various tax settlements, including those discussed below. Liabilities for accrued interest and penalties were
$886 million
and
$766 million
as of
December 31, 2016
and
2015
, respectively.
The IRS is currently conducting examinations of the Company’s tax returns for the years 2006 through 2008, as well as 2010 and 2011. Although the IRS’s examination of the Company’s 2002-2005 federal tax returns was concluded prior to 2015, one issue relating to a refund claim remained open. During 2015, this issue was resolved and the Company received a refund of approximately
$715 million
, which exceeded the receivable previously recorded by the Company, resulting in a tax benefit of
$410 million
.
In addition, various state and foreign tax examinations are in progress. For most of its other significant tax jurisdictions (both U.S. state and foreign), the Company’s income tax returns are open for examination for the period 2003 through 2016.
At
December 31, 2016
, foreign earnings of
$63.1 billion
have been retained indefinitely by subsidiary companies for reinvestment; therefore, no provision has been made for income taxes that would be payable upon the distribution of such earnings and it would not be practicable to determine the amount of the related unrecognized deferred income tax liability. In addition, the Company has subsidiaries operating in Puerto Rico and Singapore under tax incentive grants that begin to expire in 2022.
120
16. Earnings per Share
The calculations of earnings per share (shares in millions) are as follows:
|
Years Ended December 31
|
2016
|
2015
|
2014
|
||||||||
|
Net income attributable to Merck & Co., Inc.
|
$
|
3,920
|
|
$
|
4,442
|
|
$
|
11,920
|
|
||
|
Average common shares outstanding
|
2,766
|
|
2,816
|
|
2,894
|
|
|||||
|
Common shares issuable
(1)
|
21
|
|
25
|
|
34
|
|
|||||
|
Average common shares outstanding assuming dilution
|
2,787
|
|
2,841
|
|
2,928
|
|
|||||
|
Basic earnings per common share attributable to Merck & Co., Inc. common shareholders
|
$
|
1.42
|
|
$
|
1.58
|
|
$
|
4.12
|
|
||
|
Earnings per common share assuming dilution attributable to Merck & Co., Inc. common shareholders
|
$
|
1.41
|
|
$
|
1.56
|
|
$
|
4.07
|
|
||
|
(1)
|
Issuable primarily under share-based compensation plans.
|
In
2016
,
2015
and
2014
,
13 million
,
9 million
and
4 million
, respectively, of common shares issuable under share-based compensation plans were excluded from the computation of earnings per common share assuming dilution because the effect would have been antidilutive.
17. Other Comprehensive Income (Loss)
Changes in
AOCI
by component are as follows:
|
Derivatives
|
Investments
|
Employee
Benefit
Plans
|
Cumulative
Translation
Adjustment
|
Accumulated Other
Comprehensive
Income (Loss)
|
|||||||||||||||
|
Balance January 1, 2014, net of taxes
|
$
|
132
|
|
$
|
54
|
|
$
|
(909
|
)
|
$
|
(1,474
|
)
|
$
|
(2,197
|
)
|
||||
|
Other comprehensive income (loss) before reclassification adjustments, pretax
|
778
|
|
48
|
|
(3,196
|
)
|
(412
|
)
|
(2,782
|
)
|
|||||||||
|
Tax
|
(285
|
)
|
(17
|
)
|
1,067
|
|
(92
|
)
|
673
|
|
|||||||||
|
Other comprehensive income (loss) before reclassification adjustments, net of taxes
|
493
|
|
31
|
|
(2,129
|
)
|
(504
|
)
|
(2,109
|
)
|
|||||||||
|
Reclassification adjustments, pretax
|
(146
|
)
|
(1)
|
43
|
|
(2)
|
62
|
|
(3)
|
—
|
|
(41
|
)
|
||||||
|
Tax
|
51
|
|
(17
|
)
|
(10
|
)
|
—
|
|
24
|
|
|||||||||
|
Reclassification adjustments, net of taxes
|
(95
|
)
|
26
|
|
52
|
|
—
|
|
(17
|
)
|
|||||||||
|
Other comprehensive income (loss), net of taxes
|
398
|
|
57
|
|
(2,077
|
)
|
(504
|
)
|
(2,126
|
)
|
|||||||||
|
Balance December 31, 2014, net of taxes
|
530
|
|
111
|
|
(2,986
|
)
|
(1,978
|
)
|
(4,323
|
)
|
|||||||||
|
Other comprehensive income (loss) before reclassification adjustments, pretax
|
526
|
|
(9
|
)
|
710
|
|
(158
|
)
|
1,069
|
|
|||||||||
|
Tax
|
(177
|
)
|
(13
|
)
|
(272
|
)
|
(28
|
)
|
(490
|
)
|
|||||||||
|
Other comprehensive income (loss) before reclassification adjustments, net of taxes
|
349
|
|
(22
|
)
|
438
|
|
(186
|
)
|
579
|
|
|||||||||
|
Reclassification adjustments, pretax
|
(731
|
)
|
(1)
|
(73
|
)
|
(2)
|
203
|
|
(3)
|
(22
|
)
|
(623
|
)
|
||||||
|
Tax
|
256
|
|
25
|
|
(62
|
)
|
—
|
|
219
|
|
|||||||||
|
Reclassification adjustments, net of taxes
|
(475
|
)
|
(48
|
)
|
141
|
|
(22
|
)
|
(404
|
)
|
|||||||||
|
Other comprehensive income (loss), net of taxes
|
(126
|
)
|
(70
|
)
|
579
|
|
(208
|
)
|
175
|
|
|||||||||
|
Balance December 31, 2015, net of taxes
|
404
|
|
41
|
|
(2,407
|
)
|
(4)
|
(2,186
|
)
|
(4,148
|
)
|
||||||||
|
Other comprehensive income (loss) before reclassification adjustments, pretax
|
210
|
|
(38
|
)
|
(1,199
|
)
|
(150
|
)
|
(1,177
|
)
|
|||||||||
|
Tax
|
(72
|
)
|
16
|
|
363
|
|
(19
|
)
|
288
|
|
|||||||||
|
Other comprehensive income (loss) before reclassification adjustments, net of taxes
|
138
|
|
(22
|
)
|
(836
|
)
|
(169
|
)
|
(889
|
)
|
|||||||||
|
Reclassification adjustments, pretax
|
(314
|
)
|
(1)
|
(31
|
)
|
(2)
|
37
|
|
(3)
|
—
|
|
(308
|
)
|
||||||
|
Tax
|
110
|
|
9
|
|
—
|
|
—
|
|
119
|
|
|||||||||
|
Reclassification adjustments, net of taxes
|
(204
|
)
|
(22
|
)
|
37
|
|
—
|
|
(189
|
)
|
|||||||||
|
Other comprehensive income (loss), net of taxes
|
(66
|
)
|
(44
|
)
|
(799
|
)
|
(169
|
)
|
(1,078
|
)
|
|||||||||
|
Balance December 31, 2016, net of taxes
|
$
|
338
|
|
$
|
(3
|
)
|
$
|
(3,206
|
)
|
(4)
|
$
|
(2,355
|
)
|
$
|
(5,226
|
)
|
|||
|
(1)
|
Relates to foreign currency cash flow hedges that were reclassified from
AOCI
to
Sales
.
|
|
(2)
|
Represents net realized (gains) losses on the sales of available-for-sale investments that were reclassified from
AOCI
to
Other (income) expense, net
.
|
|
(3)
|
Includes net amortization of prior service cost and actuarial gains and losses included in net periodic benefit cost (see Note 13).
|
|
(4)
|
Includes pension plan net loss of $
3.9 billion
and
$3.3 billion
at December 31,
2016
and
2015
, respectively, and other postretirement benefit plan net loss of
$115 million
and
$86 million
at December 31,
2016
and in
2015
, respectively, as well as pension plan prior service credit of
$361 million
and
$414 million
at December 31,
2016
and
2015
, respectively, and other postretirement benefit plan prior service credit of
$466 million
and
$547 million
at December 31,
2016
and
2015
, respectively.
|
121
18. Segment Reporting
The Company’s operations are principally managed on a products basis and are comprised of
four
operating segments – Pharmaceutical, Animal Health, Healthcare Services and Alliances. The Animal Health, Healthcare Services and Alliances segments are not material for separate reporting.
The Pharmaceutical segment includes human health pharmaceutical and vaccine products. Human health pharmaceutical products consist of therapeutic and preventive agents, generally sold by prescription, for the treatment of human disorders. The Company sells these human health pharmaceutical products primarily to drug wholesalers and retailers, hospitals, government agencies and managed health care providers such as health maintenance organizations, pharmacy benefit managers and other institutions. Vaccine products consist of preventive pediatric, adolescent and adult vaccines, primarily administered at physician offices. The Company sells these human health vaccines primarily to physicians, wholesalers, physician distributors and government entities. A large component of pediatric and adolescent vaccine sales are made to the U.S. Centers for Disease Control and Prevention Vaccines for Children program, which is funded by the U.S. government. Additionally, the Company sells vaccines to the Federal government for placement into vaccine stockpiles. Sales of vaccines in most major European markets were marketed through the Company’s SPMSD joint venture until its termination on December 31, 2016 (see Note 8).
The Company also has animal health operations that discover, develop, manufacture and market animal health products, including vaccines, which the Company sells to veterinarians, distributors and animal producers. During 2016, the Company made changes to the composition of the Animal Health segment that resulted in the inclusion of certain revenues and costs that were previously included in non-segment revenues and profits. Prior periods have been recast to reflect these changes on a comparable basis. The Company’s Healthcare Services segment provides services and solutions that focus on engagement, health analytics and clinical services to improve the value of care delivered to patients. Merck’s Alliances segment primarily includes results from the Company’s relationship with AZLP until the termination of that relationship on June 30, 2014 (see Note 8). On October 1, 2014, the Company divested its Consumer Care segment that developed, manufactured and marketed over-the-counter, foot care and sun care products (see Note 3).
122
Sales of the Company’s products were as follows:
|
Years Ended December 31
|
2016
|
2015
|
2014
|
||||||||
|
Primary Care and Women’s Health
|
|||||||||||
|
Cardiovascular
|
|||||||||||
|
Zetia
|
$
|
2,560
|
|
$
|
2,526
|
|
$
|
2,650
|
|
||
|
Vytorin
|
1,141
|
|
1,251
|
|
1,516
|
|
|||||
|
Diabetes
|
|||||||||||
|
Januvia
|
3,908
|
|
3,863
|
|
3,931
|
|
|||||
|
Janumet
|
2,201
|
|
2,151
|
|
2,071
|
|
|||||
|
General Medicine and Women’s Health
|
|||||||||||
|
NuvaRing
|
777
|
|
732
|
|
723
|
|
|||||
|
Implanon/Nexplanon
|
606
|
|
588
|
|
502
|
|
|||||
|
Dulera
|
436
|
|
536
|
|
460
|
|
|||||
|
Follistim AQ
|
355
|
|
383
|
|
412
|
|
|||||
|
Hospital and Specialty
|
|||||||||||
|
Hepatitis
|
|||||||||||
|
Zepatier
|
555
|
|
—
|
|
—
|
|
|||||
|
HIV
|
|||||||||||
|
Isentress
|
1,387
|
|
1,511
|
|
1,673
|
|
|||||
|
Hospital Acute Care
|
|||||||||||
|
Cubicin
(1)
|
1,087
|
|
1,127
|
|
25
|
|
|||||
|
Noxafil
|
595
|
|
487
|
|
402
|
|
|||||
|
Invanz
|
561
|
|
569
|
|
529
|
|
|||||
|
Cancidas
|
558
|
|
573
|
|
681
|
|
|||||
|
Bridion
|
482
|
|
353
|
|
340
|
|
|||||
|
Primaxin
|
297
|
|
313
|
|
329
|
|
|||||
|
Immunology
|
|||||||||||
|
Remicade
|
1,268
|
|
1,794
|
|
2,372
|
|
|||||
|
Simponi
|
766
|
|
690
|
|
689
|
|
|||||
|
Oncology
|
|||||||||||
|
Keytruda
|
1,402
|
|
566
|
|
55
|
|
|||||
|
Emend
|
549
|
|
535
|
|
553
|
|
|||||
|
Temodar
|
283
|
|
312
|
|
350
|
|
|||||
|
Diversified Brands
|
|||||||||||
|
Respiratory
|
|||||||||||
|
Singulair
|
915
|
|
931
|
|
1,092
|
|
|||||
|
Nasonex
|
537
|
|
858
|
|
1,099
|
|
|||||
|
Other
|
|||||||||||
|
Cozaar/Hyzaar
|
511
|
|
667
|
|
806
|
|
|||||
|
Arcoxia
|
450
|
|
471
|
|
519
|
|
|||||
|
Fosamax
|
284
|
|
359
|
|
470
|
|
|||||
|
Zocor
|
186
|
|
217
|
|
258
|
|
|||||
|
Vaccines
(2)
|
|||||||||||
|
Gardasil/Gardasil
9
|
2,173
|
|
1,908
|
|
1,738
|
|
|||||
|
ProQuad/M-M-R II/Varivax
|
1,640
|
|
1,505
|
|
1,394
|
|
|||||
|
Zostavax
|
685
|
|
749
|
|
765
|
|
|||||
|
RotaTeq
|
652
|
|
610
|
|
659
|
|
|||||
|
Pneumovax 23
|
641
|
|
542
|
|
746
|
|
|||||
|
Other pharmaceutical
(3)
|
4,703
|
|
5,105
|
|
6,233
|
|
|||||
|
Total Pharmaceutical segment sales
|
35,151
|
|
34,782
|
|
36,042
|
|
|||||
|
Other segment sales
(4)
|
3,862
|
|
3,667
|
|
5,758
|
|
|||||
|
Total segment sales
|
39,013
|
|
38,449
|
|
41,800
|
|
|||||
|
Other
(5)
|
794
|
|
1,049
|
|
437
|
|
|||||
|
|
$
|
39,807
|
|
$
|
39,498
|
|
$
|
42,237
|
|
||
|
(1)
|
Sales of
Cubicin
in 2015 represent sales subsequent to the Cubist acquisition date. Sales of
Cubicin
in 2014 reflect sales in Japan pursuant to a previously existing licensing agreement.
|
|
(2)
|
These amounts do not reflect sales of vaccines sold in most major European markets through the Company’s joint venture, SPMSD, the results of which are reflected in equity income from affiliates which is included in
Other (income) expense, net
. These amounts do, however, reflect supply sales to SPMSD. On December 31, 2016, Merck and Sanofi terminated the SPMSD joint venture (see Note 8).
|
|
(3)
|
Other pharmaceutical primarily reflects sales of other human health pharmaceutical products, including products within the franchises not listed separately.
|
|
(4)
|
Represents the non-reportable segments of Animal Health, Healthcare Services and Alliances, as well as Consumer Care until its divestiture on October 1, 2014 (see Note 3). The Alliances segment includes revenue from the Company’s relationship with AZLP until termination on June 30, 2014 (see Note 8).
|
|
(5)
|
Other is primarily comprised of miscellaneous corporate revenues, including revenue hedging activities, as well as third-party manufacturing sales. Other in 2016 and 2014 also includes approximately
$170 million
and
$232 million
, respectively, in connection with the sale of the marketing rights to certain products.
|
123
Consolidated revenues by geographic area where derived are as follows:
|
Years Ended December 31
|
2016
|
2015
|
2014
|
||||||||
|
United States
|
$
|
18,478
|
|
$
|
17,519
|
|
$
|
17,071
|
|
||
|
Europe, Middle East and Africa
|
10,953
|
|
10,677
|
|
13,174
|
|
|||||
|
Asia Pacific
|
3,918
|
|
3,825
|
|
3,952
|
|
|||||
|
Japan
|
2,846
|
|
2,673
|
|
3,471
|
|
|||||
|
Latin America
|
2,155
|
|
2,825
|
|
3,151
|
|
|||||
|
Other
|
1,457
|
|
1,979
|
|
1,418
|
|
|||||
|
|
$
|
39,807
|
|
$
|
39,498
|
|
$
|
42,237
|
|
||
A reconciliation of total segment profits to consolidated
Income before taxes
is as follows:
|
Years Ended December 31
|
2016
|
2015
|
2014
|
||||||||
|
Segment profits:
|
|||||||||||
|
Pharmaceutical segment
|
$
|
22,180
|
|
$
|
21,658
|
|
$
|
22,164
|
|
||
|
Other segments
|
1,507
|
|
1,573
|
|
2,386
|
|
|||||
|
Total segment profits
|
23,687
|
|
23,231
|
|
24,550
|
|
|||||
|
Other profits
|
481
|
|
810
|
|
627
|
|
|||||
|
Unallocated:
|
|||||||||||
|
Interest income
|
328
|
|
289
|
|
266
|
|
|||||
|
Interest expense
|
(693
|
)
|
(672
|
)
|
(732
|
)
|
|||||
|
Equity income from affiliates
|
(19
|
)
|
135
|
|
59
|
|
|||||
|
Depreciation and amortization
|
(1,585
|
)
|
(1,573
|
)
|
(2,452
|
)
|
|||||
|
Research and development
|
(9,084
|
)
|
(5,871
|
)
|
(5,823
|
)
|
|||||
|
Amortization of purchase accounting adjustments
|
(3,692
|
)
|
(4,816
|
)
|
(4,182
|
)
|
|||||
|
Restructuring costs
|
(651
|
)
|
(619
|
)
|
(1,013
|
)
|
|||||
|
Gain on sale of certain migraine clinical development programs
|
100
|
|
250
|
|
—
|
|
|||||
|
Charge related to the settlement of worldwide
Keytruda
patent litigation
|
(625
|
)
|
—
|
|
—
|
|
|||||
|
Gain on divestiture of certain ophthalmic products
|
—
|
|
147
|
|
480
|
|
|||||
|
Foreign currency devaluation related to Venezuela
|
—
|
|
(876
|
)
|
—
|
|
|||||
|
Net charge related to the settlement of
Vioxx
shareholder class action litigation
|
—
|
|
(680
|
)
|
—
|
|
|||||
|
Gain on divestiture of Merck Consumer Care
|
—
|
|
—
|
|
11,209
|
|
|||||
|
Gain on AstraZeneca option exercise
|
—
|
|
—
|
|
741
|
|
|||||
|
Loss on extinguishment of debt
|
—
|
|
—
|
|
(628
|
)
|
|||||
|
Other unallocated, net
|
(3,588
|
)
|
(4,354
|
)
|
(5,819
|
)
|
|||||
|
|
$
|
4,659
|
|
$
|
5,401
|
|
$
|
17,283
|
|
||
Segment profits are comprised of segment sales less standard costs and certain operating expenses directly incurred by the segments. For internal management reporting presented to the chief operating decision maker, Merck does not allocate materials and production costs, other than standard costs, the majority of research and development expenses or general and administrative expenses, nor the cost of financing these activities. Separate divisions maintain responsibility for monitoring and managing these costs, including depreciation related to fixed assets utilized by these divisions and, therefore, they are not included in segment profits. In addition, costs related to restructuring activities, as well as the amortization of purchase accounting adjustments are not allocated to segments.
Other profits are primarily comprised of miscellaneous corporate profits, as well as operating profits related to third-party manufacturing sales.
Other unallocated, net includes expenses from corporate and manufacturing cost centers, goodwill and other intangible asset impairment charges, gains or losses on sales of businesses, expense or income related to changes in the estimated fair value of contingent consideration, and other miscellaneous income or expense items.
124
Equity income from affiliates and depreciation and amortization included in segment profits is as follows:
|
Pharmaceutical
|
All Other
|
Total
|
|||||||||
|
Year Ended December 31, 2016
|
|
|
|
||||||||
|
Included in segment profits:
|
|||||||||||
|
Equity income from affiliates
|
$
|
105
|
|
$
|
—
|
|
$
|
105
|
|
||
|
Depreciation and amortization
|
(160
|
)
|
(23
|
)
|
(183
|
)
|
|||||
|
Year Ended December 31, 2015
|
|
|
|
||||||||
|
Included in segment profits:
|
|||||||||||
|
Equity income from affiliates
|
$
|
70
|
|
$
|
—
|
|
$
|
70
|
|
||
|
Depreciation and amortization
|
(82
|
)
|
(18
|
)
|
(100
|
)
|
|||||
|
Year Ended December 31, 2014
|
|
|
|
||||||||
|
Included in segment profits:
|
|||||||||||
|
Equity income from affiliates
|
$
|
90
|
|
$
|
108
|
|
$
|
198
|
|
||
|
Depreciation and amortization
|
(39
|
)
|
(18
|
)
|
(57
|
)
|
|||||
Property, plant and equipment, net by geographic area where located is as follows:
|
December 31
|
2016
|
2015
|
2014
|
||||||||
|
United States
|
$
|
8,114
|
|
$
|
8,467
|
|
$
|
8,727
|
|
||
|
Europe, Middle East and Africa
|
2,732
|
|
2,844
|
|
3,120
|
|
|||||
|
Asia Pacific
|
775
|
|
842
|
|
897
|
|
|||||
|
Latin America
|
234
|
|
182
|
|
207
|
|
|||||
|
Japan
|
164
|
|
164
|
|
172
|
|
|||||
|
Other
|
7
|
|
8
|
|
13
|
|
|||||
|
|
$
|
12,026
|
|
$
|
12,507
|
|
$
|
13,136
|
|
||
The Company does not disaggregate assets on a products and services basis for internal management reporting and, therefore, such information is not presented.
125
Report of Independent Registered Public Accounting Firm
To the Board of Directors and Shareholders of Merck & Co., Inc.:
In our opinion, the accompanying consolidated balance sheets and the related consolidated statements of income, comprehensive income, equity and cash flows present fairly, in all material respects, the financial position of Merck & Co., Inc. and its subsidiaries at December 31, 2016
and December 31, 2015, and the results of their operations and their cash flows for each of the three years in the period ended December 31, 2016 in conformity with accounting principles generally accepted in the United States of America. Also in our opinion, the Company maintained, in all material respects, effective internal control over financial reporting as of December 31, 2016 , based on criteria established in
Internal Control - Integrated Framework
(2013)
issued by the Committee of Sponsoring Organizations of the Treadway Commission (COSO). The Company's management is responsible for these financial statements, for maintaining effective internal control over financial reporting and for its assessment of the effectiveness of internal control over financial reporting, included in Management's Report under Item 9a. Our responsibility is to express opinions on these financial statements and on the Company's internal control over financial reporting based on our integrated audits. We conducted our audits in accordance with the standards of the Public Company Accounting Oversight Board (United States). Those standards require that we plan and perform the audits to obtain reasonable assurance about whether the financial statements are free of material misstatement and whether effective internal control over financial reporting was maintained in all material respects. Our audits of the financial statements included examining, on a test basis, evidence supporting the amounts and disclosures in the financial statements, assessing the accounting principles used and significant estimates made by management, and evaluating the overall financial statement presentation. Our audit of internal control over financial reporting included obtaining an understanding of internal control over financial reporting, assessing the risk that a material weakness exists, and testing and evaluating the design and operating effectiveness of internal control based on the assessed risk. Our audits also included performing such other procedures as we considered necessary in the circumstances. We believe that our audits provide a reasonable basis for our opinions.
A company’s internal control over financial reporting is a process designed to provide reasonable assurance regarding the reliability of financial reporting and the preparation of financial statements for external purposes in accordance with generally accepted accounting principles. A company’s internal control over financial reporting includes those policies and procedures that (i) pertain to the maintenance of records that, in reasonable detail, accurately and fairly reflect the transactions and dispositions of the assets of the company; (ii) provide reasonable assurance that transactions are recorded as necessary to permit preparation of financial statements in accordance with generally accepted accounting principles, and that receipts and expenditures of the company are being made only in accordance with authorizations of management and directors of the company; and (iii) provide reasonable assurance regarding prevention or timely detection of unauthorized acquisition, use, or disposition of the company’s assets that could have a material effect on the financial statements.
Because of its inherent limitations, internal control over financial reporting may not prevent or detect misstatements. Also, projections of any evaluation of effectiveness to future periods are subject to the risk that controls may become inadequate because of changes in conditions, or that the degree of compliance with the policies or procedures may deteriorate.

PricewaterhouseCoopers LLP
Florham Park, New Jersey
February 28, 2017
126
|
(b)
|
Supplementary Data
|
Selected quarterly financial data for
2016
and
2015
are contained in the Condensed Interim Financial Data table below.
Condensed Interim Financial Data (Unaudited)
|
($ in millions except per share amounts)
|
4th Q
(1)
|
3rd Q
(2)
|
2nd Q
(3)
|
1st Q
|
|||||||||||
|
2016
(4)
|
|
|
|
|
|||||||||||
|
Sales
|
$
|
10,115
|
|
$
|
10,536
|
|
$
|
9,844
|
|
$
|
9,312
|
|
|||
|
Materials and production
|
3,332
|
|
3,409
|
|
3,578
|
|
3,572
|
|
|||||||
|
Marketing and administrative
|
2,593
|
|
2,393
|
|
2,458
|
|
2,318
|
|
|||||||
|
Research and development
|
4,650
|
|
1,664
|
|
2,151
|
|
1,659
|
|
|||||||
|
Restructuring costs
|
265
|
|
161
|
|
134
|
|
91
|
|
|||||||
|
Other (income) expense, net
|
631
|
|
22
|
|
19
|
|
48
|
|
|||||||
|
(Loss) income before taxes
|
(1,356
|
)
|
2,887
|
|
1,504
|
|
1,624
|
|
|||||||
|
Net (loss) income attributable to Merck & Co., Inc.
|
(594
|
)
|
2,184
|
|
1,205
|
|
1,125
|
|
|||||||
|
Basic (loss) earnings per common share attributable to Merck & Co., Inc. common shareholders
|
$
|
(0.22
|
)
|
$
|
0.79
|
|
$
|
0.44
|
|
$
|
0.41
|
|
|||
|
(Loss) earnings per common share assuming dilution attributable to Merck & Co., Inc. common shareholders
|
$
|
(0.22
|
)
|
$
|
0.78
|
|
$
|
0.43
|
|
$
|
0.40
|
|
|||
|
2015
(4)
|
|
|
|
|
|||||||||||
|
Sales
|
$
|
10,215
|
|
$
|
10,073
|
|
$
|
9,785
|
|
$
|
9,425
|
|
|||
|
Materials and production
|
3,850
|
|
3,761
|
|
3,754
|
|
3,569
|
|
|||||||
|
Marketing and administrative
|
2,615
|
|
2,472
|
|
2,624
|
|
2,601
|
|
|||||||
|
Research and development
|
1,797
|
|
1,500
|
|
1,670
|
|
1,737
|
|
|||||||
|
Restructuring costs
|
233
|
|
113
|
|
191
|
|
82
|
|
|||||||
|
Other (income) expense, net
|
905
|
|
(170
|
)
|
739
|
|
55
|
|
|||||||
|
Income before taxes
|
815
|
|
2,397
|
|
807
|
|
1,381
|
|
|||||||
|
Net income attributable to Merck & Co., Inc.
|
976
|
|
1,826
|
|
687
|
|
953
|
|
|||||||
|
Basic earnings per common share attributable to Merck & Co., Inc. common shareholders
|
$
|
0.35
|
|
$
|
0.65
|
|
$
|
0.24
|
|
$
|
0.34
|
|
|||
|
Earnings per common share assuming dilution attributable to Merck & Co., Inc. common shareholders
|
$
|
0.35
|
|
$
|
0.64
|
|
$
|
0.24
|
|
$
|
0.33
|
|
|||
|
(1)
|
Amounts for 2016 include a charge to settle worldwide patent litigation related to Keytruda (see Note 10). Amounts for 2015 reflect a net charge related to the settlement of
Vioxx
shareholder class action litigation (see Note 10), foreign exchange losses related to Venezuela (see Note 14) and a gain on the sale of the Company’s remaining ophthalmics business in international markets (see Note 3).
|
|
(2)
|
Amounts for 2015 include a gain on the sale of certain migraine clinical development programs (see Note 3).
|
(3)
Amounts for 2015 include foreign exchange losses related to the devaluation of the Company’s net monetary assets in Venezuela (see Note 14).
|
(4)
|
Amounts for 2016 and 2015 reflect acquisition and divestiture-related costs (see Note 7) and the impact of restructuring actions (see Note 4).
|
127
Not applicable.
|
Item 9A.
|
Controls and Procedures.
|
Management of the Company, with the participation of its Chief Executive Officer and Chief Financial Officer, evaluated the effectiveness of the Company’s disclosure controls and procedures. Based on their evaluation, as of the end of the period covered by this Form 10-K, the Company’s Chief Executive Officer and Chief Financial Officer have concluded that the Company’s disclosure controls and procedures (as defined in Rules 13a-15(e) or 15d-15(e) under the Securities Exchange Act of 1934, as amended (the Act)) are effective.
Management is responsible for establishing and maintaining adequate internal control over financial reporting, as such term is defined in Rule 13a-15(f) of the Act. Management conducted an evaluation of the effectiveness of internal control over financial reporting based on the framework in
Internal Control — Integrated Framework
issued in 2013 by the Committee of Sponsoring Organizations of the Treadway Commission. Based on this evaluation, management concluded that internal control over financial reporting was effective as of
December 31, 2016
. PricewaterhouseCoopers LLP, an independent registered public accounting firm, has performed its own assessment of the effectiveness of the Company’s internal control over financial reporting and its attestation report is included in this Form 10-K filing.
Management’s Report
Management’s Responsibility for Financial Statements
Responsibility for the integrity and objectivity of the Company’s financial statements rests with management. The financial statements report on management’s stewardship of Company assets. These statements are prepared in conformity with generally accepted accounting principles and, accordingly, include amounts that are based on management’s best estimates and judgments. Nonfinancial information included in the Annual Report on Form 10-K has also been prepared by management and is consistent with the financial statements.
To assure that financial information is reliable and assets are safeguarded, management maintains an effective system of internal controls and procedures, important elements of which include: careful selection, training and development of operating and financial managers; an organization that provides appropriate division of responsibility; and communications aimed at assuring that Company policies and procedures are understood throughout the organization. A staff of internal auditors regularly monitors the adequacy and application of internal controls on a worldwide basis.
To ensure that personnel continue to understand the system of internal controls and procedures, and policies concerning good and prudent business practices, annually all employees of the Company are required to complete Code of Conduct training, which includes financial stewardship. This training reinforces the importance and understanding of internal controls by reviewing key corporate policies, procedures and systems. In addition, the Company has compliance programs, including an ethical business practices program to reinforce the Company’s long-standing commitment to high ethical standards in the conduct of its business.
The financial statements and other financial information included in the Annual Report on Form 10-K fairly present, in all material respects, the Company’s financial condition, results of operations and cash flows. Our formal certification to the Securities and Exchange Commission is included in this Form 10-K filing.
Management’s Report on Internal Control Over Financial Reporting
Management is responsible for establishing and maintaining adequate internal control over financial reporting, as such term is defined in Rule 13a-15(f) under the Securities Exchange Act of 1934. The Company’s internal control over financial reporting is designed to provide reasonable assurance regarding the reliability of financial reporting and the preparation of financial statements for external purposes in accordance with generally accepted accounting principles in the United States of America. Management conducted an evaluation of the effectiveness of internal control over financial reporting based on the framework in
Internal Control — Integrated Framework
issued in 2013 by the Committee of Sponsoring Organizations of the Treadway Commission. Based on this evaluation, management concluded that internal control over financial reporting was effective as of
December 31, 2016
.
128
Because of its inherent limitations, internal control over financial reporting may not prevent or detect misstatements. Projections of any evaluation of effectiveness to future periods are subject to the risk that controls may become inadequate because of changes in conditions, or that the degree of compliance with the policies or procedures may deteriorate.
The effectiveness of the Company’s internal control over financial reporting as of
December 31, 2016
, has been audited by PricewaterhouseCoopers LLP, an independent registered public accounting firm, as stated in their report which appears herein.

|
||

|
||
|
Kenneth C. Frazier
|
|
Robert M. Davis
|
|
Chairman, President
and Chief Executive Officer
|
|
Executive Vice President, Global Services and Chief Financial Officer
|
|
Item 9B.
|
Other Information.
|
None.
129
|
Item 10.
|
Directors, Executive Officers and Corporate Governance.
|
The required information on directors and nominees is incorporated by reference from the discussion under Proposal 1. Election of Directors of the Company’s Proxy Statement for the Annual Meeting of Shareholders to be held May 23, 2017. Information on executive officers is set forth in Part I of this document on page 29.
The required information on compliance with Section 16(a) of the Securities Exchange Act of 1934 is incorporated by reference from the discussion under the heading “Section 16(a) Beneficial Ownership Reporting Compliance” of the Company’s Proxy Statement for the Annual Meeting of Shareholders to be held May 23, 2017.
The Company has a Code of Conduct —
Our Values and Standards
applicable to all employees, including the principal executive officer, principal financial officer, principal accounting officer and Controller. The Code of Conduct is available on the Company’s website at
www.merck.com/about/code_of_conduct.pdf
. The Company intends to disclose future amendments to certain provisions of the Code of Conduct, and waivers of the Code of Conduct granted to executive officers and directors, if any, on the website within four business days following the date of any amendment or waiver. Every Merck employee is responsible for adhering to business practices that are in accordance with the law and with ethical principles that reflect the highest standards of corporate and individual behavior. A printed copy will be sent, without charge, to any shareholder who requests it by writing to the Chief Ethics and Compliance Officer of Merck & Co., Inc., 2000 Galloping Hill Road, Kenilworth, NJ 07033.
The required information on the identification of the audit committee and the audit committee financial expert is incorporated by reference from the discussion under the heading “Board Meetings and Committees” of the Company’s Proxy Statement for the Annual Meeting of Shareholders to be held May 23, 2017.
|
Item 11.
|
Executive Compensation.
|
The information required on executive compensation is incorporated by reference from the discussion under the headings “Compensation Discussion and Analysis”, “Summary Compensation Table”, “All Other Compensation” table, “Grants of Plan-Based Awards” table, “Outstanding Equity Awards” table, “Option Exercises and Stock Vested” table, “Pension Benefits” table, “Nonqualified Deferred Compensation” table, Potential Payments Upon Termination or a Change in Control, including the discussion under the subheadings “Separation” and “Change in Control”, as well as all footnote information to the various tables, of the Company’s Proxy Statement for the Annual Meeting of Shareholders to be held May 23, 2017.
The required information on director compensation is incorporated by reference from the discussion under the heading “Director Compensation” and related “Director Compensation” table and “Schedule of Director Fees” table of the Company’s Proxy Statement for the Annual Meeting of Shareholders to be held May 23, 2017.
The required information under the headings “Compensation and Benefits Committee Interlocks and Insider Participation” and “Compensation and Benefits Committee Report” is incorporated by reference from the Company’s Proxy Statement for the Annual Meeting of Shareholders to be held May 23, 2017.
130
|
Item 12.
|
Security Ownership of Certain Beneficial Owners and Management and Related Stockholder Matters.
|
Information with respect to security ownership of certain beneficial owners and management is incorporated by reference from the discussion under the heading “Stock Ownership Information” of the Company’s Proxy Statement for the Annual Meeting of Shareholders to be held May 23, 2017.
Equity Compensation Plan Information
The following table summarizes information about the options, warrants and rights and other equity compensation under the Company’s equity compensation plans as of the close of business on December 31, 2016. The table does not include information about tax qualified plans such as the Merck U.S. Savings Plan.
|
Plan Category
|
Number of
securities to be
issued upon
exercise of
outstanding
options, warrants
and rights
(a)
|
Weighted-average
exercise price of
outstanding
options, warrants
and rights
(b)
|
Number of
securities remaining
available for future
issuance under equity
compensation plans
(excluding
securities
reflected in column (a))
(c)
|
|||||||
|
Equity compensation plans approved by security holders
(1)
|
45,050,279
(2)
|
|
$
|
44.47
|
|
124,902,265
|
|
|||
|
Equity compensation plans not approved by security holders
|
—
|
|
—
|
|
—
|
|
||||
|
Total
|
45,050,279
|
|
$
|
44.47
|
|
124,902,265
|
|
|||
|
(1)
|
Includes options to purchase shares of Company Common Stock and other rights under the following shareholder-approved plans: the Merck Sharp & Dohme 2004, 2007 and 2010 Incentive Stock Plans, the Merck & Co., Inc. 2006 and 2010 Non-Employee Directors Stock Option Plans, and the Merck & Co., Inc. Schering-Plough 2002 and 2006 Stock Incentive Plans.
|
|
(2)
|
Excludes approximately 13,265,959 shares of restricted stock units and 1,743,587 performance share units (assuming maximum payouts) under the Merck Sharp & Dohme 2004, 2007 and 2010 Incentive Stock Plans. Also excludes 244,119 shares of phantom stock deferred under the MSD Employee Deferral Program and 561,846 shares of phantom stock deferred under the Merck & Co., Inc. Plan for Deferred Payment of Directors’ Compensation.
|
|
Item 13.
|
Certain Relationships and Related Transactions, and Director Independence.
|
The required information on transactions with related persons is incorporated by reference from the discussion under the heading “Related Person Transactions” of the Company’s Proxy Statement for the Annual Meeting of Shareholders to be held May 23, 2017.
The required information on director independence is incorporated by reference from the discussion under the heading “Independence of Directors” of the Company’s Proxy Statement for the Annual Meeting of Shareholders to be held May 23, 2017.
|
Item 14.
|
Principal Accountant Fees and Services.
|
The information required for this item is incorporated by reference from the discussion under Proposal 4. Ratification of Appointment of Independent Registered Public Accounting Firm for 2017 beginning with the caption “Pre-Approval Policy for Services of Independent Registered Public Accounting Firm” through “Fees for Services Provided by Independent Registered Public Accounting Firm” of the Company’s Proxy Statement for the Annual Meeting of Shareholders to be held May 23, 2017.
131
|
Item 15.
|
Exhibits and Financial Statement Schedules.
|
(a) The following documents are filed as part of this Form 10-K
1. Financial Statements
Consolidated statement of income for the years ended
December 31, 2016
,
2015
and
2014
Consolidated statement of comprehensive income for the years ended
December 31, 2016
,
2015
and
2014
Consolidated balance sheet as of
December 31, 2016
and
2015
Consolidated statement of equity for the years ended
December 31, 2016
,
2015
and
2014
Consolidated statement of cash flows for the years ended
December 31, 2016
,
2015
and
2014
Notes to consolidated financial statements
Report of PricewaterhouseCoopers LLP, independent registered public accounting firm
2. Financial Statement Schedules
Schedules are omitted because they are either not required or not applicable.
Financial statements of affiliates carried on the equity basis have been omitted because, considered individually or in the aggregate, such affiliates do not constitute a significant subsidiary.
3. Exhibits
|
Exhibit
Number
|
|
Description
|
||
|
3.1
|
—
|
Restated Certificate of Incorporation of Merck & Co., Inc. (November 3, 2009) — Incorporated by reference to Merck & Co., Inc.’s Current Report on Form 8-K filed November 4, 2009 (No. 1-6571)
|
||
|
3.2
|
—
|
By-Laws of Merck & Co., Inc. (effective July 22, 2015) — Incorporated by reference to Merck & Co., Inc.’s Current Report on Form 8-K filed July 28, 2015 (No. 1-6571)
|
||
|
4.1
|
—
|
Indenture, dated as of April 1, 1991, between Merck Sharp & Dohme Corp. (f/k/a Schering Corporation) and U.S. Bank Trust National Association (as successor to Morgan Guaranty Trust Company of New York), as Trustee (the 1991 Indenture) — Incorporated by reference to Exhibit 4 to MSD’s Registration Statement on Form S-3 (No. 33-39349)
|
||
|
4.2
|
—
|
First Supplemental Indenture to the 1991 Indenture, dated as of October 1, 1997 — Incorporated by reference to Exhibit 4(b) to MSD’s Registration Statement on Form S-3 (No. 333-36383)
|
||
|
4.3
|
—
|
Second Supplemental Indenture to the 1991 Indenture, dated November 3, 2009 — Incorporated by reference to Exhibit 4.3 to Merck & Co., Inc.’s Current Report on Form 8-K filed November 4, 2009 (No.1-6571)
|
||
|
4.4
|
—
|
Third Supplemental Indenture to the 1991 Indenture, dated May 1, 2012 —Incorporated by reference to Merck & Co., Inc.’s Form 10-Q Quarterly Report for the quarter year ended March 31, 2012 (No. 1-6571)
|
||
|
4.5
|
—
|
Indenture, dated November 26, 2003, between Merck & Co., Inc. (f/k/a Schering-Plough Corporation) and The Bank of New York as Trustee (the 2003 Indenture) — Incorporated by reference to Exhibit 4.1 to Schering-Plough’s Current Report on Form 8‑K filed November 28, 2003 (No. 1-6571)
|
||
|
4.6
|
—
|
Second Supplemental Indenture to the 2003 Indenture (including Form of Note), dated November 26, 2003 —Incorporated by reference to Exhibit 4.3 to Schering-Plough’s Current Report on Form 8‑K filed November 28, 2003 (No. 1-6571)
|
||
|
4.7
|
—
|
Third Supplemental Indenture to the 2003 Indenture (including Form of Note), dated September 17, 2007 — Incorporated by reference to Exhibit 4.1 to Schering-Plough’s Current Report on Form 8‑K filed September 17, 2007 (No. 1-6571)
|
||
132
|
Exhibit
Number
|
|
Description
|
||
|
4.8
|
—
|
Fifth Supplemental Indenture to the 2003 Indenture, dated November 3, 2009 — Incorporated by reference to Exhibit 4.4 to Merck & Co., Inc.’s Current Report on Form 8-K filed November 4, 2009 (No. 1-6571)
|
||
|
4.9
|
—
|
Indenture, dated as of January 6, 2010, between Merck & Co., Inc. and U.S. Bank Trust National Association, as Trustee — Incorporated by reference to Exhibit 4.1 to Merck & Co., Inc.’s Current Report on Form 8-K filed December 10, 2010 (No. 1-6571)
|
||
|
4.10
|
—
|
Long-term debt instruments under which the total amount of securities authorized does not exceed 10% of Merck & Co., Inc.’s total consolidated assets are not filed as exhibits to this report. Merck & Co., Inc. will furnish a copy of these agreements to the Securities and Exchange Commission on request.
|
||
|
*10.1
|
—
|
Merck & Co., Inc. Executive Incentive Plan (as amended and restated effective June 1, 2015) — Incorporated by reference to Merck & Co., Inc.’s Schedule 14A filed April 13, 2015 (No. 1-6571)
|
||
|
*10.2
|
—
|
Merck & Co., Inc. Deferral Program Including the Base Salary Deferral Plan (Amended and Restated effective December 1, 2015)
|
||
|
*10.3
|
—
|
Merck Sharp & Dohme Corp. 2004 Incentive Stock Plan (amended and restated as of November 3, 2009) — Incorporated by reference to Exhibit 10.8 to Merck & Co., Inc.’s Current Report on Form 8‑K filed November 4, 2009 (No. 1-6571)
|
||
|
*10.4
|
—
|
Merck Sharp & Dohme Corp. 2007 Incentive Stock Plan (effective as amended and restated as of November 3, 2009) — Incorporated by reference to Exhibit 10.7 to Merck & Co., Inc.’s Current Report on Form 8-K filed November 4, 2009 (No. 1-6571)
|
||
|
*10.5
|
—
|
Amendment One to the Merck Sharp & Dohme Corp. 2007 Incentive Stock Plan (effective February 15, 2010) — Incorporated by reference to Exhibit 10.2 to Merck & Co., Inc.’s Current Report on Form 8-K filed February 18, 2010 (No. 1-6571)
|
||
|
*10.6
|
—
|
Merck & Co., Inc. 2010 Incentive Stock Plan (as amended and restated June 1, 2015) — Incorporated by reference to Merck & Co., Inc.’s Schedule 14A filed April 13, 2015 (No. 1-6571)
|
||
|
*10.7
|
—
|
Form of stock option terms for a non-qualified stock option under the Merck Sharp & Dohme Corp. 2007 Incentive Stock Plan and the Schering-Plough 2006 Stock Incentive Plan — Incorporated by reference to Exhibit 10.3 to Merck & Co., Inc.’s Current Report on Form 8-K filed February 15, 2010 (No. 1-6571)
|
||
|
*10.8
|
—
|
Form of stock option terms for 2011 quarterly and annual non-qualified option grants under the Merck & Co., Inc. 2010 Incentive Stock Plan — Incorporated by reference to Merck & Co., Inc.’s Form 10‑Q Quarterly Report for the period ended March 31, 2011 (No. 1-6571)
|
||
|
*10.9
|
—
|
Form of performance share unit terms for 2012 grants under the Merck & Co., Inc. 2010 Incentive Stock Plan — Incorporated by reference to Merck & Co., Inc.’s Form 10-Q Quarterly Report for the period ended March 31, 2012 (No. 1-6571)
|
||
|
*10.10
|
—
|
Form of stock option terms for 2013 quarterly and annual non-qualified option grants under the Merck & Co., Inc. 2010 Incentive Stock Plan — Incorporated by reference to Merck & Co., Inc.’s Form 10-K Annual Report for the fiscal year ended December 31, 2012 (No. 1-6571)
|
||
|
*10.11
|
—
|
Form of restricted stock unit terms for 2013 quarterly and annual grants under the Merck & Co., Inc. 2010 Incentive Stock Plan — Incorporated by reference to Merck & Co., Inc.’s Form 10-K Annual Report for the fiscal year ended December 31, 2012 (No. 1-6571)
|
||
|
*10.12
|
—
|
Form of performance share unit terms for 2013 grants under the Merck & Co., Inc. 2010 Incentive Stock Plan — Incorporated by reference to Merck & Co., Inc.’s Form 10-K Annual Report for the fiscal year ended December 31, 2014 (No. 1-6571)
|
||
|
*10.13
|
—
|
Form of stock option terms for 2014 quarterly and annual non-qualified option grants under the Merck & Co., Inc. 2010 Incentive Stock Plan — Incorporated by reference to Merck & Co., Inc.’s Form 10-K Annual Report for the fiscal year ended December 31, 2014 (No. 1-6571)
|
||
|
*10.14
|
—
|
Form of restricted stock unit terms for 2014 quarterly and annual grants under the Merck & Co., Inc. 2010 Incentive Stock Plan — Incorporated by reference to Merck & Co., Inc.’s Form 10-K Annual Report for the fiscal year ended December 31, 2014 (No. 1-6571)
|
||
133
|
Exhibit
Number
|
|
Description
|
||
|
*10.15
|
—
|
Form of performance share unit terms for 2014 grants under the Merck & Co., Inc. 2010 Stock Incentive Plan — Incorporated by reference to Merck & Co., Inc.’s Form 10-K Annual Report for the fiscal year ended December 31, 2014 (No. 1-6571)
|
||
|
*10.16
|
—
|
Form of stock option terms for 2015 quarterly and annual non-qualified option grants under the Merck & Co., Inc. 2010 Incentive Stock Plan — Incorporated by reference to Merck & Co., Inc.’s Form 10-K Annual Report for the fiscal year ended December 31, 2015 (No. 1-6571)
|
||
|
*10.17
|
—
|
Form of restricted stock unit terms for 2015 quarterly and annual grants under the Merck & Co., Inc. 2010 Incentive Stock Plan — Incorporated by reference to Merck & Co., Inc.’s Form 10-K Annual Report for the fiscal year ended December 31, 2015 (No. 1-6571)
|
||
|
*10.18
|
—
|
Form of performance share unit terms for 2015 grants under the Merck & Co., Inc. 2010 Stock Incentive Plan — Incorporated by reference to Merck & Co., Inc.’s Form 10-K Annual Report for the fiscal year ended December 31, 2015 (No. 1-6571)
|
||
|
*10.19
|
—
|
Form of stock option terms for 2016 quarterly and annual non-qualified option grants under the Merck & Co., Inc. 2010 Incentive Stock Plan
|
||
|
*10.20
|
—
|
Form of restricted stock unit terms for 2016 quarterly and annual grants under the Merck & Co., Inc. 2010 Incentive Stock Plan
|
||
|
*10.21
|
—
|
Form of performance share unit terms for 2016 grants under the Merck & Co., Inc. 2010 Stock Incentive Plan
|
||
|
*10.22
|
—
|
Merck & Co., Inc. Change in Control Separation Benefits Plan (Effective as Amended and Restated, as of January 1, 2013) — Incorporated by reference to Merck & Co., Inc.’s Current Report on Form 8‑K dated November 29, 2012 (No. 1-6571)
|
||
|
*10.23
|
—
|
Merck & Co., Inc. U.S. Separation Benefits Plan (amended and restated effective as of November 15, 2014) — Incorporated by reference to Merck & Co., Inc.’s Form 10-K Annual Report for the fiscal year ended December 31, 2014 (No. 1-6571)
|
||
|
*10.24
|
—
|
Merck & Co., Inc. U.S. Separation Benefits Plan (amended and restated effective as of January 1, 2017)
|
||
|
*10.25
|
—
|
Merck & Co., Inc. 2006 Non-Employee Directors Stock Option Plan (amended and restated as of November 3, 2009) — Incorporated by reference to Exhibit 10.5 to Merck & Co., Inc.’s Current Report on Form 8-K filed November 4, 2009 (No. 1-6571)
|
||
|
*10.26
|
—
|
Merck & Co., Inc. 2010 Non-Employee Directors Stock Option Plan (amended and restated as of December 1, 2010) — Incorporated by reference to Merck & Co., Inc.’s Form 10-K Annual Report for the fiscal year ended December 31, 2010 (No. 1-6571)
|
||
|
*10.27
|
—
|
Retirement Plan for the Directors of Merck & Co., Inc. (amended and restated June 21, 1996) —Incorporated by reference to MSD’s Form 10-Q Quarterly Report for the period ended June 30, 1996 (No. 1-3305)
|
||
|
*10.28
|
—
|
Merck & Co., Inc. Plan for Deferred Payment of Directors’ Compensation (effective as amended and restated as of December 1, 2010) — Incorporated by reference to Merck & Co., Inc.’s Form 10-K Annual Report for the fiscal year ended December 31, 2010 (No. 1-6571)
|
||
|
10.29
|
—
|
Distribution agreement between Schering-Plough and Centocor, Inc., dated April 3, 1998 — Incorporated by reference to Exhibit 10(u) to Schering-Plough’s Amended 10-K for the year ended December 31, 2003, filed May 3, 2004 (No. 1-6571)†
|
||
|
10.30
|
—
|
Amendment Agreement to the Distribution Agreement between Centocor, Inc., CAN Development, LLC, and Schering-Plough (Ireland) Company — Incorporated by reference to Exhibit 10.1 to Schering-Plough’s Current Report on Form 8-K filed December 21, 2007 (No. 1-6571)†
|
||
|
10.31
|
—
|
Accelerated Share Purchase Agreement between Merck & Co., Inc. and Goldman, Sachs & Co., dated May 20, 2013 — Incorporated by reference to Merck & Co., Inc.’s Form 10-Q Quarterly Report for the period ended June 30, 2013 (No. 1-6571)
|
||
134
|
Exhibit
Number
|
|
Description
|
||
|
12
|
—
|
Computation of Ratios of Earnings to Fixed Charges
|
||
|
21
|
—
|
Subsidiaries of Merck & Co., Inc.
|
||
|
23
|
—
|
Consent of Independent Registered Public Accounting Firm
|
||
|
24.1
|
—
|
Power of Attorney
|
||
|
24.2
|
—
|
Certified Resolution of Board of Directors
|
||
|
31.1
|
—
|
Rule 13a-14(a)/15d-14(a) Certification of Chief Executive Officer
|
||
|
31.2
|
—
|
Rule 13a-14(a)/15d-14(a) Certification of Chief Financial Officer
|
||
|
32.1
|
—
|
Section 1350 Certification of Chief Executive Officer
|
||
|
32.2
|
—
|
Section 1350 Certification of Chief Financial Officer
|
||
|
101
|
—
|
The following materials from Merck & Co., Inc.’s Annual Report on Form 10-K for the fiscal year ended December 31, 2016, formatted in XBRL (Extensible Business Reporting Language): (i) the Consolidated Statement of Income, (ii) the Consolidated Statement of Comprehensive Income, (iii) the Consolidated Balance Sheet, (iv) the Consolidated Statement of Equity, (v) the Consolidated Statement of Cash Flows, and (vi) Notes to Consolidated Financial Statements.
|
||
|
*
|
Management contract or compensatory plan or arrangement.
|
|
†
|
Certain portions of the exhibit have been omitted pursuant to a request for confidential treatment. The non-public information has been filed separately with the Securities and Exchange Commission pursuant to rule 24b-2 under the Securities Exchange Act of 1934, as amended.
|
Not applicable.
135
SIGNATURES
Pursuant to the requirements of Section 13 or 15(d) of the Securities Exchange Act of 1934, the registrant has duly caused this report to be signed on its behalf by the undersigned, thereunto duly authorized.
Dated: February 28, 2017
|
MERCK & CO., INC.
|
||
|
By:
|
KENNETH C. FRAZIER
|
|
|
(Chairman, President and Chief Executive Officer)
|
||
|
By:
|
/S/ MICHAEL J. HOLSTON
|
|
|
Michael J. Holston
|
||
|
(Attorney-in-Fact)
|
||
Pursuant to the requirements of the Securities Exchange Act of 1934, this report has been signed below by the following persons on behalf of the Registrant and in the capacities and on the dates indicated.
|
Signatures
|
Title
|
Date
|
||
|
KENNETH C. FRAZIER
|
Chairman, President and Chief Executive Officer;
Principal Executive Officer; Director
|
February 28, 2017
|
||
|
ROBERT M. DAVIS
|
Executive Vice President, Global Services and
Chief Financial Officer; Principal Financial Officer
|
February 28, 2017
|
||
|
RITA A. KARACHUN
|
Senior Vice President Finance-Global Controller;
Principal Accounting Officer
|
February 28, 2017
|
||
|
LESLIE A. BRUN
|
Director
|
February 28, 2017
|
||
|
THOMAS R. CECH
|
Director
|
February 28, 2017
|
||
|
PAMELA J. CRAIG
|
Director
|
February 28, 2017
|
||
|
THOMAS H. GLOCER
|
Director
|
February 28, 2017
|
||
|
C. ROBERT KIDDER
|
Director
|
February 28, 2017
|
||
|
ROCHELLE B. LAZARUS
|
Director
|
February 28, 2017
|
||
|
CARLOS E. REPRESAS
|
Director
|
February 28, 2017
|
||
|
PAUL B. ROTHMAN
|
Director
|
February 28, 2017
|
||
|
PATRICIA F. RUSSO
|
Director
|
February 28, 2017
|
||
|
CRAIG B. THOMPSON
|
Director
|
February 28, 2017
|
||
|
WENDELL P. WEEKS
|
Director
|
February 28, 2017
|
||
|
PETER C. WENDELL
|
Director
|
February 28, 2017
|
||
Michael J. Holston, by signing his name hereto, does hereby sign this document pursuant to powers of attorney duly executed by the persons named, filed with the Securities and Exchange Commission as an exhibit to this document, on behalf of such persons, all in the capacities and on the date stated, such persons including a majority of the directors of the Company.
|
By:
|
/S/ MICHAEL J. HOLSTON
|
|
|
Michael J. Holston
|
||
|
(Attorney-in-Fact)
|
||
136
EXHIBIT INDEX
|
Exhibit
Number
|
|
Description
|
||
|
3.1
|
—
|
Restated Certificate of Incorporation of Merck & Co., Inc. (November 3, 2009) — Incorporated by reference to Merck & Co., Inc.’s Current Report on Form 8-K filed November 4, 2009 (No. 1-6571)
|
||
|
3.2
|
—
|
By-Laws of Merck & Co., Inc. (effective July 22, 2015) — Incorporated by reference to Merck & Co., Inc.’s Current Report on Form 8-K filed July 28, 2015 (No. 1-6571)
|
||
|
4.1
|
—
|
Indenture, dated as of April 1, 1991, between Merck Sharp & Dohme Corp. (f/k/a Schering Corporation) and U.S. Bank Trust National Association (as successor to Morgan Guaranty Trust Company of New York), as Trustee (the 1991 Indenture) — Incorporated by reference to Exhibit 4 to MSD’s Registration Statement on Form S-3 (No. 33-39349)
|
||
|
4.2
|
—
|
First Supplemental Indenture to the 1991 Indenture, dated as of October 1, 1997 — Incorporated by reference to Exhibit 4(b) to MSD’s Registration Statement on Form S-3 (No. 333-36383)
|
||
|
4.3
|
—
|
Second Supplemental Indenture to the 1991 Indenture, dated November 3, 2009 — Incorporated by reference to Exhibit 4.3 to Merck & Co., Inc.’s Current Report on Form 8-K filed November 4, 2009 (No.1-6571)
|
||
|
4.4
|
—
|
Third Supplemental Indenture to the 1991 Indenture, dated May 1, 2012 —Incorporated by reference to Merck & Co., Inc.’s Form 10-Q Quarterly Report for the quarter year ended March 31, 2012 (No. 1-6571)
|
||
|
4.5
|
—
|
Indenture, dated November 26, 2003, between Merck & Co., Inc. (f/k/a Schering-Plough Corporation) and The Bank of New York as Trustee (the 2003 Indenture) — Incorporated by reference to Exhibit 4.1 to Schering-Plough’s Current Report on Form 8‑K filed November 28, 2003 (No. 1-6571)
|
||
|
4.6
|
—
|
Second Supplemental Indenture to the 2003 Indenture (including Form of Note), dated November 26, 2003 —Incorporated by reference to Exhibit 4.3 to Schering-Plough’s Current Report on Form 8‑K filed November 28, 2003 (No. 1-6571)
|
||
|
4.7
|
—
|
Third Supplemental Indenture to the 2003 Indenture (including Form of Note), dated September 17, 2007 — Incorporated by reference to Exhibit 4.1 to Schering-Plough’s Current Report on Form 8‑K filed September 17, 2007 (No. 1-6571)
|
||
|
4.8
|
—
|
Fifth Supplemental Indenture to the 2003 Indenture, dated November 3, 2009 — Incorporated by reference to Exhibit 4.4 to Merck & Co., Inc.’s Current Report on Form 8-K filed November 4, 2009 (No. 1-6571)
|
||
|
4.9
|
—
|
Indenture, dated as of January 6, 2010, between Merck & Co., Inc. and U.S. Bank Trust National Association, as Trustee — Incorporated by reference to Exhibit 4.1 to Merck & Co., Inc.’s Current Report on Form 8-K filed December 10, 2010 (No. 1-6571)
|
||
|
4.10
|
—
|
Long-term debt instruments under which the total amount of securities authorized does not exceed 10% of Merck & Co., Inc.’s total consolidated assets are not filed as exhibits to this report. Merck & Co., Inc. will furnish a copy of these agreements to the Securities and Exchange Commission on request.
|
||
|
*10.1
|
—
|
Merck & Co., Inc. Executive Incentive Plan (as amended and restated effective June 1, 2015) — Incorporated by reference to Merck & Co., Inc.’s Schedule 14A filed April 13, 2015 (No. 1-6571)
|
||
|
*10.2
|
—
|
Merck & Co., Inc. Deferral Program Including the Base Salary Deferral Plan (Amended and Restated effective December 1, 2015
|
||
|
*10.3
|
—
|
Merck Sharp & Dohme Corp. 2004 Incentive Stock Plan (amended and restated as of November 3, 2009) — Incorporated by reference to Exhibit 10.8 to Merck & Co., Inc.’s Current Report on Form 8‑K filed November 4, 2009 (No. 1-6571)
|
||
|
*10.4
|
—
|
Merck Sharp & Dohme Corp. 2007 Incentive Stock Plan (effective as amended and restated as of November 3, 2009) — Incorporated by reference to Exhibit 10.7 to Merck & Co., Inc.’s Current Report on Form 8-K filed November 4, 2009 (No. 1-6571)
|
||
|
*10.5
|
—
|
Amendment One to the Merck Sharp & Dohme Corp. 2007 Incentive Stock Plan (effective February 15, 2010) — Incorporated by reference to Exhibit 10.2 to Merck & Co., Inc.’s Current Report on Form 8-K filed February 18, 2010 (No. 1-6571)
|
||
137
|
Exhibit
Number
|
|
Description
|
||
|
*10.6
|
—
|
Merck & Co., Inc. 2010 Incentive Stock Plan (as amended and restated June 1, 2015) — Incorporated by reference to Merck & Co., Inc.’s Schedule 14A filed April 13, 2015 (No. 1-6571)
|
||
|
*10.7
|
—
|
Form of stock option terms for a non-qualified stock option under the Merck Sharp & Dohme Corp. 2007 Incentive Stock Plan and the Schering-Plough 2006 Stock Incentive Plan — Incorporated by reference to Exhibit 10.3 to Merck & Co., Inc.’s Current Report on Form 8-K filed February 15, 2010 (No. 1-6571)
|
||
|
*10.8
|
—
|
Form of stock option terms for 2011 quarterly and annual non-qualified option grants under the Merck & Co., Inc. 2010 Incentive Stock Plan — Incorporated by reference to Merck & Co., Inc.’s Form 10‑Q Quarterly Report for the period ended March 31, 2011 (No. 1-6571)
|
||
|
*10.9
|
—
|
Form of stock option terms for 2012 quarterly and annual non-qualified option grants under the Merck & Co., Inc. 2010 Incentive Stock Plan — Incorporated by reference to Merck & Co., Inc.’s Form 10‑K Annual Report for the fiscal year ended December 31, 2011 (No. 1-6571)
|
||
|
*10.10
|
—
|
Form of stock option terms for 2013 quarterly and annual non-qualified option grants under the Merck & Co., Inc. 2010 Incentive Stock Plan — Incorporated by reference to Merck & Co., Inc.’s Form 10-K Annual Report for the fiscal year ended December 31, 2012 (No. 1-6571)
|
||
|
*10.11
|
—
|
Form of restricted stock unit terms for 2013 quarterly and annual grants under the Merck & Co., Inc. 2010 Incentive Stock Plan — Incorporated by reference to Merck & Co., Inc.’s Form 10-K Annual Report for the fiscal year ended December 31, 2012 (No. 1-6571)
|
||
|
*10.12
|
—
|
Form of performance share unit terms for 2013 grants under the Merck & Co., Inc. 2010 Incentive Stock Plan — Incorporated by reference to Merck & Co., Inc.’s Form 10-K Annual Report for the fiscal year ended December 31, 2014 (No. 1-6571)
|
||
|
*10.13
|
—
|
Form of stock option terms for 2014 quarterly and annual non-qualified option grants under the Merck & Co., Inc. 2010 Incentive Stock Plan — Incorporated by reference to Merck & Co., Inc.’s Form 10-K Annual Report for the fiscal year ended December 31, 2014 (No. 1-6571)
|
||
|
*10.14
|
—
|
Form of restricted stock unit terms for 2014 quarterly and annual grants under the Merck & Co., Inc. 2010 Incentive Stock Plan — Incorporated by reference to Merck & Co., Inc.’s Form 10-K Annual Report for the fiscal year ended December 31, 2014 (No. 1-6571)
|
||
|
*10.15
|
—
|
Form of performance share unit terms for 2014 grants under the Merck & Co., Inc. 2010 Stock Incentive Plan — Incorporated by reference to Merck & Co., Inc.’s Form 10-K Annual Report for the fiscal year ended December 31, 2014 (No. 1-6571)
|
||
|
*10.16
|
—
|
Form of stock option terms for 2015 quarterly and annual non-qualified option grants under the Merck & Co., Inc. 2010 Incentive Stock Plan — Incorporated by reference to Merck & Co., Inc.’s Form 10-K Annual Report for the fiscal year ended December 31, 2015 (No. 1-6571)
|
||
|
*10.17
|
—
|
Form of restricted stock unit terms for 2015 quarterly and annual grants under the Merck & Co., Inc. 2010 Incentive Stock Plan — Incorporated by reference to Merck & Co., Inc.’s Form 10-K Annual Report for the fiscal year ended December 31, 2015 (No. 1-6571)
|
||
|
*10.18
|
—
|
Form of performance share unit terms for 2015 grants under the Merck & Co., Inc. 2010 Stock Incentive Plan — Incorporated by reference to Merck & Co., Inc.’s Form 10-K Annual Report for the fiscal year ended December 31, 2015 (No. 1-6571)
|
||
|
*10.19
|
—
|
Form of stock option terms for 2016 quarterly and annual non-qualified option grants under the Merck & Co., Inc. 2010 Incentive Stock Plan
|
||
|
*10.20
|
—
|
Form of restricted stock unit terms for 2016 quarterly and annual grants under the Merck & Co., Inc. 2010 Incentive Stock Plan
|
||
|
*10.21
|
—
|
Form of performance share unit terms for 2016 grants under the Merck & Co., Inc. 2010 Stock Incentive Plan
|
||
|
*10.22
|
—
|
Merck & Co., Inc. Change in Control Separation Benefits Plan (Effective as Amended and Restated, as of January 1, 2013) — Incorporated by reference to Merck & Co., Inc.’s Current Report on Form 8‑K dated November 29, 2012 (No. 1-6571)
|
||
|
*10.23
|
—
|
Merck & Co., Inc. U.S. Separation Benefits Plan (amended and restated effective as of November 15, 2014) — Incorporated by reference to Merck & Co., Inc.’s Form 10-K Annual Report for the fiscal year ended December 31, 2014 (No. 1-6571)
|
||
138
|
Exhibit
Number
|
|
Description
|
||
|
*10.24
|
Merck & Co., Inc. U.S. Separation Benefits Plan (amended and restated effective as of January 1, 2017)
|
|||
|
*10.25
|
—
|
Merck & Co., Inc. 2006 Non-Employee Directors Stock Option Plan (amended and restated as of November 3, 2009) — Incorporated by reference to Exhibit 10.5 to Merck & Co., Inc.’s Current Report on Form 8-K filed November 4, 2009 (No. 1-6571)
|
||
|
*10.26
|
—
|
Merck & Co., Inc. 2010 Non-Employee Directors Stock Option Plan (amended and restated as of December 1, 2010) — Incorporated by reference to Merck & Co., Inc.’s Form 10-K Annual Report for the fiscal year ended December 31, 2010 (No. 1-6571)
|
||
|
*10.27
|
—
|
Retirement Plan for the Directors of Merck & Co., Inc. (amended and restated June 21, 1996) —Incorporated by reference to MSD’s Form 10-Q Quarterly Report for the period ended June 30, 1996 (No. 1-3305)
|
||
|
*10.28
|
—
|
Merck & Co., Inc. Plan for Deferred Payment of Directors’ Compensation (effective as amended and restated as of December 1, 2010) — Incorporated by reference to Merck & Co., Inc.’s Form 10-K Annual Report for the fiscal year ended December 31, 2010 (No. 1-6571)
|
||
|
10.29
|
—
|
Distribution agreement between Schering-Plough and Centocor, Inc., dated April 3, 1998 — Incorporated by reference to Exhibit 10(u) to Schering-Plough’s Amended 10-K for the year ended December 31, 2003, filed May 3, 2004 (No. 1-6571)†
|
||
|
10.30
|
—
|
Amendment Agreement to the Distribution Agreement between Centocor, Inc., CAN Development, LLC, and Schering-Plough (Ireland) Company — Incorporated by reference to Exhibit 10.1 to Schering-Plough’s Current Report on Form 8-K filed December 21, 2007 (No. 1-6571)†
|
||
|
10.31
|
—
|
Accelerated Share Purchase Agreement between Merck & Co., Inc. and Goldman, Sachs & Co., dated May 20, 2013 — Incorporated by reference to Merck & Co., Inc.’s Form 10-Q Quarterly Report for the period ended June 30, 2013 (No. 1-6571)
|
||
|
12
|
—
|
Computation of Ratios of Earnings to Fixed Charges
|
||
|
21
|
—
|
Subsidiaries of Merck & Co., Inc.
|
||
|
23
|
—
|
Consent of Independent Registered Public Accounting Firm
|
||
|
24.1
|
—
|
Power of Attorney
|
||
|
24.2
|
—
|
Certified Resolution of Board of Directors
|
||
|
31.1
|
—
|
Rule 13a-14(a)/15d-14(a) Certification of Chief Executive Officer
|
||
|
31.2
|
—
|
Rule 13a-14(a)/15d-14(a) Certification of Chief Financial Officer
|
||
|
32.1
|
—
|
Section 1350 Certification of Chief Executive Officer
|
||
|
32.2
|
—
|
Section 1350 Certification of Chief Financial Officer
|
||
|
101
|
—
|
The following materials from Merck & Co., Inc.’s Annual Report on Form 10-K for the fiscal year ended December 31, 2016, formatted in XBRL (Extensible Business Reporting Language): (i) the Consolidated Statement of Income, (ii) the Consolidated Statement of Comprehensive Income, (iii) the Consolidated Balance Sheet, (iv) the Consolidated Statement of Equity, (v) the Consolidated Statement of Cash Flows, and (vi) Notes to Consolidated Financial Statements.
|
||
|
*
|
Management contract or compensatory plan or arrangement.
|
|
†
|
Certain portions of the exhibit have been omitted pursuant to a request for confidential treatment. The non-public information has been filed separately with the Securities and Exchange Commission pursuant to rule 24b-2 under the Securities Exchange Act of 1934, as amended.
|
139
TABLE OF CONTENTS
Part IItem 1. BusinessItem 1A. Risk FactorsItem 1B. Unresolved Staff CommentsItem 2. PropertiesItem 3. Legal ProceedingsItem 4. Mine Safety DisclosuresPart IIItem 5. Market For Registrant S Common Equity, Related Stockholder Matters and Issuer Purchases Of Equity SecuritiesItem 6. Selected Financial DataItem 7. Management S Discussion and Analysis Of Financial Condition and Results Of OperationsItem 7A. Quantitative and Qualitative Disclosures About Market RiskItem 8. Financial Statements and Supplementary DataItem 9. Changes in and Disagreements with Accountants on Accounting and Financial DisclosureItem 9A. Controls and ProceduresItem 9B. Other InformationPart IIIItem 10. Directors, Executive Officers and Corporate GovernanceItem 11. Executive CompensationItem 12. Security Ownership Of Certain Beneficial Owners and Management and Related Stockholder MattersItem 13. Certain Relationships and Related Transactions, and Director IndependenceItem 14. Principal Accountant Fees and ServicesPart IVItem 15. Exhibits and Financial Statement SchedulesItem 16. Form 10-k Summary