UNITED STATES
SECURITIES AND EXCHANGE COMMISSION
Washington, DC 20549
|
FORM 10-Q
|
(Mark One)
x
QUARTERLY REPORT PURSUANT TO SECTION 13 OR 15(d) OF THE SECURITIES EXCHANGE ACT OF 1934
For the quarterly period ended March 31, 2019
OR
o
TRANSITION REPORT PURSUANT TO SECTION 13 OR 15(d) OF THE SECURITIES EXCHANGE ACT OF 1934
For the transition period from _ to _
Commission File Number: 001-38753

Moderna, Inc.
(Exact Name of Registrant as Specified in Its Charter)
|
Delaware
|
81-3467528
|
|
|
(State or Other Jurisdiction of Incorporation or Organization)
|
(IRS Employer Identification No.)
|
|
|
200 Technology Square
Cambridge, Massachusetts
|
02139
|
|
|
(Address of Principal Executive Offices)
|
(Zip Code)
|
|
(617) 714-6500
(Registrant’s Telephone Number, Including Area Code)
Indicate by check mark whether the registrant (1) has filed all reports required to be filed by Section 13 or 15(d) of the Securities Exchange Act of 1934 during the preceding 12 months (or for such shorter period that the registrant was required to file such reports), and (2) has been subject to such filing requirements for the past 90 days.
Yes
x
No
o
Indicate by check mark whether the registrant has submitted electronically every Interactive Data File required to be submitted pursuant to Rule 405 of Regulation S-T (§ 232.405 of this chapter) during the preceding 12 months (or for such shorter period that the registrant was required to submit such files).
Yes
x
No
o
Indicate by check mark whether the registrant is a large accelerated filer, an accelerated filer, a non-accelerated filer, a smaller reporting company, or an emerging growth company. See the definitions of “large accelerated filer”, “accelerated filer”, “smaller reporting company”, and “emerging growth company” in Rule 12b-2 of the Exchange Act.
|
Large accelerated filer
o
|
Accelerated filer
o
|
Non-accelerated filer
x
|
Smaller reporting company
o
|
|||
|
Emerging growth company
x
|
||||||
If an emerging growth company, indicate by check mark if the registrant has elected not to use the extended transition period for complying with any new or revised financial accounting standards provided pursuant to Section 13(a) of the Exchange Act.
o
Indicate by check mark whether the registrant is a shell company (as defined in Rule 12b-2 of the Act).
Yes ☐ No
x
Securities registered pursuant to Section 12(b) of the Act:
|
Title of each class
|
Trading symbol(s)
|
Name of each exchange on which registered
|
|
Common stock, par value $0.0001 per share
|
MRNA
|
The NASDAQ Stock Market LLC
|
As of April 29, 2019, there were 329,003,270 shares of the registrant’s common stock, par value $0.0001 per share, outstanding.
SPECIAL NOTE REGARDING FORWARD-LOOKING STATEMENTS
This Quarterly Report on Form 10-Q ("Form 10-Q"), including the section entitled “Management’s Discussion and Analysis of Financial Condition and Results of Operations,” contains express or implied forward-looking statements that are based on our management’s belief and assumptions and on information currently available to our management. Although we believe that the expectations reflected in these forward-looking statements are reasonable, these statements relate to future events or our future operational or financial performance, and involve known and unknown risks, uncertainties, and other factors that may cause our actual results, performance, or achievements to be materially different from any future results, performance, or achievements expressed or implied by these forward-looking statements. Forward-looking statements in this Form 10-Q include, but are not limited to, statements about:
|
•
|
the initiation, timing, progress, results, and cost of our research and development programs and our current and future preclinical studies and clinical trials, including statements regarding the timing of initiation and completion of studies or trials and related preparatory work, the period during which the results of the trials will become available, and our research and development programs;
|
|
•
|
our ability to identify research priorities and apply a risk-mitigated strategy to efficiently discover and develop development candidates and investigational medicines, including by applying learnings from one program to our other programs and from one modality to our other modalities;
|
|
•
|
our ability and the potential to successfully manufacture our drug substances, delivery vehicles, development candidates, and investigational medicines for preclinical use, for clinical trials and on a larger scale for commercial use, if approved;
|
|
•
|
the ability and willingness of our third-party strategic collaborators to continue research and development activities relating to our development candidates and investigational medicines;
|
|
•
|
our ability to obtain funding for our operations necessary to complete further development and commercialization of our investigational medicines;
|
|
•
|
our ability to obtain and maintain regulatory approval of our investigational medicines;
|
|
•
|
our ability to commercialize our products, if approved;
|
|
•
|
the pricing and reimbursement of our investigational medicines, if approved;
|
|
•
|
the implementation of our business model, and strategic plans for our business, investigational medicines, and technology;
|
|
•
|
the scope of protection we are able to establish and maintain for intellectual property rights covering our investigational medicines and technology;
|
|
•
|
estimates of our future expenses, revenues, capital requirements, and our needs for additional financing;
|
|
•
|
the potential benefits of strategic collaboration agreements, our ability to enter into strategic collaborations or arrangements, and our ability to attract collaborators with development, regulatory, and commercialization expertise;
|
|
•
|
future agreements with third parties in connection with the commercialization of our investigational medicines, if approved;
|
|
•
|
the size and growth potential of the markets for our investigational medicines, and our ability to serve those markets;
|
|
•
|
our financial performance;
|
|
•
|
the rate and degree of market acceptance of our investigational medicines;
|
|
•
|
regulatory developments in the United States and foreign countries;
|
|
•
|
our ability to contract with third-party suppliers and manufacturers and their ability to perform adequately;
|
|
•
|
our ability to produce our products or investigational medicines with advantages in turnaround times or manufacturing cost;
|
|
•
|
the success of competing therapies that are or may become available;
|
|
•
|
our ability to attract and retain key scientific or management personnel;
|
|
•
|
the impact of laws and regulations;
|
|
•
|
developments relating to our competitors and our industry; and
|
|
•
|
other risks and uncertainties, including those discussed in Part II, Item 1A - Risk Factors in this Form 10-Q.
|
In some cases, forward-looking statements can be identified by terminology such as “may,” “should,” “expects,” “intends,” “plans,” “anticipates,” “believes,” “estimates,” “predicts,” “potential,” “continue,” or the negative of these terms or other comparable terminology. These statements are only predictions. You should not place undue reliance on forward-looking statements because they involve known and unknown risks, uncertainties, and other factors, which are, in some cases, beyond our control and which could materially affect results. Factors that may cause actual results to differ materially from current expectations include, among other things, those listed under the section entitled “Risk Factors” and elsewhere in this Form 10-Q. If one or more of these risks or uncertainties occur, or if our underlying assumptions prove to be incorrect, actual events or results may vary significantly from those expressed or implied by the forward-looking statements. No forward-looking statement is a guarantee of future performance.
The forward-looking statements in this Form 10-Q represent our views as of the date of this Form 10-Q. We anticipate that subsequent events and developments will cause our views to change. However, while we may elect to update these forward-looking statements at some point in the future, we have no current intention of doing so except to the extent required by applicable law. You should therefore not rely on these forward-looking statements as representing our views as of any date subsequent to the date of this Form 10-Q.
This Form 10-Q includes statistical and other industry and market data that we obtained from industry publications and research, surveys, and studies conducted by third parties. Industry publications and third-party research, surveys, and studies generally indicate that their information has been obtained from sources believed to be reliable, although they do not guarantee the accuracy or completeness of such information. We have not independently verified the information contained in such sources.
NOTE REGARDING COMPANY REFERENCES
Unless the context otherwise requires, the terms “Moderna,” “the Company,” “we,” “us,” and “our” in this Form 10-Q refer to Moderna, Inc. and its consolidated subsidiaries.
Table of Contents
|
PART I
.
|
Page
|
|
|
Item 1.
|
||
|
Item 2.
|
||
|
Item 3.
|
||
|
Item 4.
|
||
|
PART II
.
|
||
|
Item 1.
|
||
|
Item 1A.
|
||
|
Item 2
|
||
|
Item 6.
|
||
Item 1. Financial Statements
MODERNA, INC.
CONDENSED CONSOLIDATED BALANCE SHEETS
(Unaudited, in thousands, except share and per share data)
|
March 31,
|
December 31,
|
||||||
|
2019
|
2018
|
||||||
|
Assets
|
|||||||
|
Current assets:
|
|||||||
|
Cash and cash equivalents
|
$
|
502,934
|
|
$
|
658,364
|
|
|
|
Investments
|
605,990
|
|
863,063
|
|
|||
|
Accounts receivable
|
5,646
|
|
11,686
|
|
|||
|
Accounts receivable from related party
|
965
|
|
899
|
|
|||
|
Prepaid expenses and other current assets
|
25,292
|
|
28,399
|
|
|||
|
Restricted cash
|
—
|
|
595
|
|
|||
|
Total current assets
|
1,140,827
|
|
1,563,006
|
|
|||
|
Investments, non-current
|
437,659
|
|
172,990
|
|
|||
|
Property and equipment, net
|
213,460
|
|
211,977
|
|
|||
|
Restricted cash, non-current
|
11,823
|
|
11,532
|
|
|||
|
Other non-current assets
|
2,438
|
|
2,644
|
|
|||
|
Total assets
|
$
|
1,806,207
|
|
$
|
1,962,149
|
|
|
|
Liabilities and Stockholders’ Equity
|
|||||||
|
Current liabilities:
|
|||||||
|
Accounts payable
|
$
|
38,509
|
|
$
|
31,210
|
|
|
|
Accrued liabilities
|
42,183
|
|
79,073
|
|
|||
|
Deferred revenue
|
73,958
|
|
109,056
|
|
|||
|
Other current liabilities
|
4,509
|
|
3,464
|
|
|||
|
Total current liabilities
|
159,159
|
|
222,803
|
|
|||
|
Deferred revenue, non-current
|
156,862
|
|
165,352
|
|
|||
|
Deferred lease obligation, non-current
|
10,556
|
|
10,006
|
|
|||
|
Lease financing obligation
|
33,384
|
|
33,489
|
|
|||
|
Other non-current liabilities
|
213
|
|
258
|
|
|||
|
Total liabilities
|
360,174
|
|
431,908
|
|
|||
|
Commitments and contingencies (Note 7)
|
|
|
|||||
|
Stockholders’ equity:
|
|||||||
|
Preferred stock, par value $0.0001; 162,000,000 shares authorized as of March 31, 2019
and December 31, 2018; no shares issued or outstanding at March 31, 2019 and
December 31, 2018
|
—
|
|
—
|
|
|||
|
Common stock, par value $0.0001; 1,600,000,000 shares authorized as of March 31, 2019 and December 31, 2018; 328,853,340 and 328,798,904 shares issued and outstanding as of March 31, 2019 and December 31, 2018, respectively
|
33
|
|
33
|
|
|||
|
Additional paid-in capital
|
2,556,709
|
|
2,538,155
|
|
|||
|
Accumulated other comprehensive income (loss)
|
591
|
|
(1,320
|
)
|
|||
|
Accumulated deficit
|
(1,111,300
|
)
|
(1,006,627
|
)
|
|||
|
Total stockholders’ equity
|
1,446,033
|
|
1,530,241
|
|
|||
|
Total liabilities and stockholders’ equity
|
$
|
1,806,207
|
|
$
|
1,962,149
|
|
|
The accompanying notes are an integral part of these unaudited condensed consolidated financial statements.
5
MODERNA, INC.
CONDENSED CONSOLIDATED STATEMENTS OF OPERATIONS
(Unaudited, in thousands, except share and per share data)
|
Three Months Ended March 31,
|
|||||||
|
2019
|
2018
|
||||||
|
Revenue:
|
|||||||
|
Collaboration revenue
|
$
|
13,301
|
|
$
|
20,110
|
|
|
|
Collaboration revenue from related party
|
814
|
|
7,350
|
|
|||
|
Grant revenue
|
1,910
|
|
1,579
|
|
|||
|
Total revenue
|
16,025
|
|
29,039
|
|
|||
|
Operating expenses:
|
|||||||
|
Research and development
|
130,575
|
|
90,124
|
|
|||
|
General and administrative
|
27,283
|
|
16,317
|
|
|||
|
Total operating expenses
|
157,858
|
|
106,441
|
|
|||
|
Loss from operations
|
(141,833
|
)
|
(77,402
|
)
|
|||
|
Interest income
|
10,972
|
|
5,209
|
|
|||
|
Other expense, net
|
(1,820
|
)
|
(183
|
)
|
|||
|
Loss before benefit from income taxes
|
(132,681
|
)
|
(72,376
|
)
|
|||
|
Benefit from income taxes
|
(24
|
)
|
—
|
|
|||
|
Net loss
|
$
|
(132,657
|
)
|
$
|
(72,376
|
)
|
|
|
Net loss attributable to common stockholders (Note 11)
|
$
|
(132,657
|
)
|
$
|
(75,857
|
)
|
|
|
Net loss per share attributable to common stockholders, basic and diluted
|
$
|
(0.40
|
)
|
$
|
(1.16
|
)
|
|
|
Weighted average common shares used in net loss per share attributable to common stockholders, basic and diluted
|
328,809,986
|
|
65,430,835
|
|
|||
The accompanying notes are an integral part of these unaudited condensed consolidated financial statements.
6
MODERNA, INC.
CONDENSED CONSOLIDATED STATEMENTS OF COMPREHENSIVE LOSS
(Unaudited, in thousands)
|
Three Months Ended March 31,
|
|||||||
|
2019
|
2018
|
||||||
|
Net loss
|
$
|
(132,657
|
)
|
$
|
(72,376
|
)
|
|
|
Other comprehensive income (loss):
|
|||||||
|
Unrealized gain (loss) on available-for-sale debt securities, net of tax, $540 and $0
|
1,908
|
|
(1,999
|
)
|
|||
|
Less: Amounts recognized for net realized loss included in net loss
|
3
|
|
6
|
|
|||
|
Total other comprehensive income (loss)
|
1,911
|
|
(1,993
|
)
|
|||
|
Comprehensive loss
|
$
|
(130,746
|
)
|
$
|
(74,369
|
)
|
|
The accompanying notes are an integral part of these unaudited condensed consolidated financial statements.
7
MODERNA, INC.
CONDENSED CONSOLIDATED STATEMENTS OF SHAREHOLDERS' EQUITY (DEFICIT)
(Unaudited, in thousands)
|
Redeemable Convertible
Preferred Stock
|
Common Stock
|
Additional
Paid-In
Capital
|
Accumulated
Other
Comprehensive
(Loss) Income
|
Accumulated
Deficit
|
Total
Stockholders’
Equity
|
|||||||||||||||||||||||||||
|
Shares
|
Amount
|
Shares
|
Amount
|
|||||||||||||||||||||||||||||
|
Balance at December 31, 2018
|
—
|
|
$
|
—
|
|
328,798,904
|
|
$
|
33
|
|
$
|
2,538,155
|
|
$
|
(1,320
|
)
|
$
|
(1,006,627
|
)
|
$
|
1,530,241
|
|
||||||||||
|
Transition adjustment from adoption of ASU Topic 606 (Note 2)
|
—
|
|
—
|
|
—
|
|
—
|
|
27,984
|
|
27,984
|
|
||||||||||||||||||||
|
Vesting of restricted common stock
|
—
|
|
—
|
|
48,911
|
|
—
|
|
—
|
|
—
|
|
—
|
|
—
|
|
||||||||||||||||
|
Exercise of options to purchase common stock, net
|
—
|
|
—
|
|
5,525
|
|
—
|
|
57
|
|
—
|
|
—
|
|
57
|
|
||||||||||||||||
|
Stock-based compensation
|
—
|
|
—
|
|
—
|
|
—
|
|
18,497
|
|
—
|
|
—
|
|
18,497
|
|
||||||||||||||||
|
Unrealized gain on marketable securities
|
—
|
|
—
|
|
—
|
|
—
|
|
—
|
|
1,911
|
|
—
|
|
1,911
|
|
||||||||||||||||
|
Net loss
|
—
|
|
—
|
|
—
|
|
—
|
|
—
|
|
—
|
|
(132,657
|
)
|
(132,657
|
)
|
||||||||||||||||
|
Balance at March 31, 2019
|
—
|
|
$
|
—
|
|
328,853,340
|
|
$
|
33
|
|
$
|
2,556,709
|
|
$
|
591
|
|
$
|
(1,111,300
|
)
|
$
|
1,446,033
|
|
||||||||||
|
Redeemable Convertible
Preferred Stock
|
Common Stock
|
Additional
Paid-In
Capital
|
Accumulated
Other
Comprehensive
Loss
|
Accumulated
Deficit
|
Total
Stockholders’
Deficit
|
|||||||||||||||||||||||||||
|
Shares
|
Amount
|
Shares
|
Amount
|
|||||||||||||||||||||||||||||
|
Balance at December 31, 2017
|
448,686,791
|
|
$
|
1,176,661
|
|
65,206,999
|
|
$
|
6
|
|
$
|
71,679
|
|
$
|
(1,157
|
)
|
$
|
(621,893
|
)
|
$
|
(551,365
|
)
|
||||||||||
|
Vesting of restricted common stock
|
—
|
|
—
|
|
335,053
|
|
—
|
|
—
|
|
—
|
|
—
|
|
—
|
|
||||||||||||||||
|
Issuance of Series G redeemable convertible preferred stock, net of issuance costs of $10,517
|
55,666,004
|
|
549,413
|
|
—
|
|
—
|
|
152
|
|
—
|
|
—
|
|
152
|
|
||||||||||||||||
|
Exercise of options to purchase common stock, net
|
—
|
|
—
|
|
1,789
|
|
—
|
|
22
|
|
—
|
|
—
|
|
22
|
|
||||||||||||||||
|
Stock-based compensation
|
—
|
|
—
|
|
—
|
|
—
|
|
11,851
|
|
—
|
|
—
|
|
11,851
|
|
||||||||||||||||
|
Unrealized loss on marketable securities
|
—
|
|
—
|
|
—
|
|
—
|
|
—
|
|
(1,993
|
)
|
—
|
|
(1,993
|
)
|
||||||||||||||||
|
Net loss
|
—
|
|
—
|
|
—
|
|
—
|
|
—
|
|
—
|
|
(72,376
|
)
|
(72,376
|
)
|
||||||||||||||||
|
Balance at March 31, 2018
|
504,352.795
|
|
$
|
1,726,074
|
|
65,543,841
|
|
$
|
6
|
|
$
|
83,704
|
|
$
|
(3,150
|
)
|
$
|
(694,269
|
)
|
$
|
(613,709
|
)
|
||||||||||
8
MODERNA, INC.
CONDENSED CONSOLIDATED STATEMENTS OF CASH FLOWS
(Unaudited, in thousands)
|
Three Months Ended March 31,
|
|||||||
|
2019
|
2018
|
||||||
|
Operating activities
|
|||||||
|
Net loss
|
$
|
(132,657
|
)
|
$
|
(72,376
|
)
|
|
|
Adjustments to reconcile net loss to net cash (used in) operating activities:
|
|||||||
|
Stock-based compensation
|
18,497
|
|
11,851
|
|
|||
|
Depreciation and amortization
|
7,328
|
|
5,153
|
|
|||
|
Amortization of investment premiums
|
(1,005
|
)
|
(83
|
)
|
|||
|
Loss on disposal of property and equipment
|
19
|
|
—
|
|
|||
|
Changes in assets and liabilities:
|
|||||||
|
Accounts receivable
|
6,040
|
|
3,876
|
|
|||
|
Accounts receivable from related party
|
(66
|
)
|
(28,529
|
)
|
|||
|
Prepaid expenses and other assets
|
3,313
|
|
(2,241
|
)
|
|||
|
Accounts payable
|
1,731
|
|
1,467
|
|
|||
|
Accrued liabilities
|
(32,557
|
)
|
(37,031
|
)
|
|||
|
Deferred revenue
|
(15,604
|
)
|
6,193
|
|
|||
|
Deferred lease obligation
|
550
|
|
152
|
|
|||
|
Other liabilities
|
484
|
|
183
|
|
|||
|
Net cash used in operating activities
|
(143,927
|
)
|
(111,385
|
)
|
|||
|
Investing activities
|
|||||||
|
Purchases of marketable securities
|
(429,517
|
)
|
(660,239
|
)
|
|||
|
Proceeds from maturities of marketable securities
|
403,940
|
|
189,814
|
|
|||
|
Proceeds from sales of marketable securities
|
21,413
|
|
18,630
|
|
|||
|
Purchases of property and equipment
|
(7,595
|
)
|
(31,909
|
)
|
|||
|
Net cash used in investing activities
|
(11,759
|
)
|
(483,704
|
)
|
|||
|
Financing activities
|
|||||||
|
Proceeds from issuance of redeemable convertible preferred stock, net of issuance costs
|
—
|
|
549,531
|
|
|||
|
Proceeds from issuance of common stock through equity plans
|
57
|
|
22
|
|
|||
|
Reimbursement of assets under lease financing obligation
|
—
|
|
1,727
|
|
|||
|
Payments on financing lease obligation
|
(105
|
)
|
(1,285
|
)
|
|||
|
Net cash (used in) provided by financing activities
|
(48
|
)
|
549,995
|
|
|||
|
Net decrease in cash, cash equivalents and restricted cash
|
(155,734
|
)
|
(45,094
|
)
|
|||
|
Cash, cash equivalents and restricted cash, beginning of year
|
670,491
|
|
147,608
|
|
|||
|
Cash, cash equivalents and restricted cash, end of period
|
$
|
514,757
|
|
$
|
102,514
|
|
|
|
Non-cash investing and financing activities
|
|||||||
|
Issuance costs included in accounts payable and accrued liabilities
|
$
|
796
|
|
$
|
—
|
|
|
|
Purchases of property and equipment included in accounts payable and accrued liabilities
|
$
|
14,127
|
|
$
|
28,527
|
|
|
|
Leasehold improvements included in prepaid and other current assets
|
$
|
10,089
|
|
$
|
9,889
|
|
|
|
Lease financing obligation
|
$
|
10,089
|
|
$
|
9,889
|
|
|
The accompanying notes are an integral part of these unaudited condensed consolidated financial statements.
9
MODERNA, INC.
NOTES TO CONDENSED CONSOLIDATED FINANCIAL STATEMENTS
(Unaudited)
1. Description of the Business
Moderna, Inc. is a Delaware Corporation, incorporated under the laws of the State of Delaware on July 22, 2016 (collectively, with its consolidated subsidiaries, any of Moderna, Company, we, us or our). In August 2018, we changed our name from Moderna Therapeutics, Inc. to Moderna, Inc. We are the successor in interest to Moderna LLC, a limited liability company formed under the laws of the State of Delaware in 2013. We are creating a new generation of potentially transformative medicines based on messenger RNA (mRNA), to improve the lives of patients. Since inception, we have incurred significant net losses. We expect to continue to incur significant expenses and operating losses for the foreseeable future. In addition, we anticipate that our expenses will increase significantly in connection with our ongoing activities to support our platform research, drug discovery and clinical development, infrastructure and Research Engine and Early Development engine, digital infrastructure, creation of a portfolio of intellectual property, and administrative support.
We do not expect to generate significant revenue from sales of potential mRNA medicines unless and until we successfully complete clinical development and obtain regulatory approval for one or more of our investigational medicines. If we seek to obtain regulatory approval for any of our investigational medicines, we expect to incur significant commercialization expenses.
As a result, we will need substantial additional funding to support our continued operations and pursue our growth strategy. Until we can generate significant revenue from potential mRNA medicines, if ever, we expect to finance our operations through a combination of public or private equity offerings and debt financings, government funding arrangements, strategic alliances and marketing, distribution and licensing arrangements. We may be unable to raise additional funds or enter into such other agreements on favorable terms, or at all. If we fail to raise capital or enter into such agreements as, and when, needed, we may have to significantly delay, scale back or discontinue the development and commercialization of one or more of our programs. We believe that our cash, cash equivalents, and investments as of March 31, 2019 will be sufficient to enable us to fund our projected operations through at least the next 12 months from the issuance of these financial statements.
Because of the numerous risks and uncertainties associated with pharmaceutical development, we are unable to predict the timing or amount of increased expenses or when or if we will be able to achieve or maintain profitability. Even if we are able to generate revenues from the sale of our medicines, we may not become profitable. If we fail to become profitable or are unable to sustain profitability on a continuing basis, then we may be unable to continue our operations at planned levels and be forced to reduce our operations.
2. Summary of Basis of Presentation and Recent Accounting Standards
Basis of Presentation and Principles of Consolidation
The accompanying unaudited condensed consolidated financial statements that accompany these notes have been prepared in conformity with U.S. generally accepted accounting principles (GAAP) and applicable rules and regulations of the Securities and Exchange Commission (SEC) for interim financial reporting, consistent in all material respects with those applied in our Annual Report on Form 10-K for the year ended December 31, 2018 (2018 Form 10-K), except for changes associated with recent accounting standards for revenue recognition as detailed in "Note 2 - Recent Accounting Standards and Accounting Policies." This report should be read in conjunction with the consolidated financial statements in our 2018 Form 10-K.
We have made estimates and judgments affecting the amounts reported in our condensed consolidated financial statements and the accompanying notes. On an ongoing basis, we evaluate our estimates, including critical accounting policies or estimates related to revenue recognition, income tax provisions, stock-based compensation, and useful lives of long-lived assets. We base our estimates on historical experience and on various relevant assumptions that we believe to be reasonable under the circumstances, the results of which form the basis for making judgments about the carrying values of assets and liabilities that are not readily apparent from other sources. The actual results that we experience may differ materially from our estimates. The condensed consolidated financial statements reflect all normal recurring adjustments necessary to present fairly the financial position, results of operations, and cash flows for the interim periods, but are not necessarily indicative of the results of operations to be anticipated for the full year ending December 31, 2019.
10
Recent Accounting Standards and Accounting Policies
Revenue Recognition
On January 1, 2019, we adopted Accounting Standards Codification (ASC) Topic 606,
Revenue from Contracts with Customers
(ASC 606), using the modified retrospective transition method applied to those contracts which were not completed as of January 1, 2019. We recognized the cumulative effect of the adoption as an adjustment to the opening balance of accumulated deficit in the current period condensed consolidated balance sheet. Results for reporting periods beginning after January 1, 2019 are presented under ASC 606, while prior period amounts have not been adjusted and continue to be reported in accordance with our historic accounting under ASC Topic 605,
Revenue Recognition
(ASC 605). ASC 606 applies to all contracts with customers, except for contracts that are within the scope of other standards, such as leases, insurance, collaboration arrangements and financial instruments.
Our revenue is primarily generated through collaboration arrangements and grants from government-sponsored and private organizations. Our collaboration arrangements typically contain multiple promises, including licenses to our intellectual property, options to obtain development and commercialization rights, research and development services, and obligations to develop and manufacture preclinical and clinical material. Such arrangements provide for various types of payments to us, including upfront payments, funding of research and development activities, funding for the purchase of preclinical and clinical material, development, regulatory and commercial milestone payments, licensing fees, option exercise payments, and royalties based on product sales. We have received grants from various government-sponsored and private organizations for research and related activities that provide for payments for reimbursed costs, which may include overhead and general and administrative costs as well as a related profit margin.
We analyze our collaboration arrangements to assess whether they are within the scope of ASC Topic 808,
Collaborative Arrangements
(ASC 808) to determine whether such arrangements involve joint operating activities performed by parties that are both active participants in the activities and exposed to significant risks and rewards that are dependent on the commercial success of such activities. To the extent the arrangement is within the scope of ASC 808, we assess whether aspects of the arrangement between us and our collaboration partner are within the scope of other accounting literature. If we conclude that some or all aspects of the arrangement represent a transaction with a customer, we account for those aspects of the arrangement within the scope of ASC 606
.
If we conclude that some or all aspects of the arrangement are within the scope of ASC 808 and do not represent a transaction with a customer, we recognize our allocation of the shared costs incurred with respect to the jointly conducted activities as a component of the related expense in the period incurred. Pursuant to ASC 606, a customer is a party that has contracted with an entity to obtain goods or services that are an output of the entity’s ordinary activities in exchange for consideration. Under ASC 606, an entity recognizes revenue when its customer obtains control of promised goods or services, in an amount that reflects the consideration which the entity expects to receive in exchange for those goods or services. If we conclude a counter-party to a transaction is not a customer or otherwise not within the scope of ASC 606 or ASC 808, we consider the guidance in other accounting literature as applicable or by analogy to account for such transaction. We also consider the guidance in ASC 606 with respect to principal versus agent considerations, in determining the appropriate treatment for the transactions between us and the strategic collaborator and the transactions between us and other third parties. The classification of transactions under our arrangements is determined based on the nature and contractual terms of the arrangement along with the nature of the operations of the participants. Any consideration related to activities in which we are considered the principal, which includes being in control of the good or service before such good or service is transferred to the customer, are accounted for as gross revenue.
We receive payments from our customers based on billing schedules established in each contract. Upfront payments and fees are recorded as contract liabilities upon receipt or when due and may require deferral of revenue recognition to a future period when we perform our obligations under the arrangement. Amounts expected to be recognized as revenue within the 12 months following the balance sheet date are classified as current liabilities on our condensed consolidated balance sheets. Amounts not expected to be recognized as revenue within the 12 months following the balance sheet date are classified as non-current liabilities on our condensed consolidated balance sheets. Amounts payable to us are recorded as accounts receivable when our right to consideration is unconditional. We expense incremental costs of obtaining a contract as and when incurred if the expected amortization period of the asset that we would have recognized is one year or less or the amount is immaterial. As of
March 31, 2019
, we had not capitalized any costs to obtain any of our contracts.
Collaboration Revenue
To determine the appropriate amount of revenue to be recognized for arrangements that we determine are within the scope of ASC 606, we perform the following steps: (i) identify the contract(s) with the customer; (ii) identify the performance obligations in the
11
contract; (iii) determine the transaction price; (iv) allocate the transaction price to the performance obligations in the contract; and (v) recognize revenue when (or as) each performance obligation is satisfied.
We account for a contract with a customer that is within the scope of ASC 606 when all of the following criteria are met: (i) the arrangement has been approved by the parties and the parties are committed to perform their respective obligations; (ii) each party’s rights regarding the goods and/or services to be transferred can be identified; (iii) the payment terms for the goods and/or services to be transferred can be identified; (iv) the arrangement has commercial substance; and (v) collection of substantially all of the consideration to which we will be entitled in exchange for the goods and/or services that will be transferred to the customer is probable. We also determine the term of the contract based on the period in which we and our customer have present and enforceable rights and obligations for purposes of identifying the performance obligations and determining the transaction price.
We evaluate contracts that contain multiple promises to determine which promises are distinct. Promises are considered to be distinct and therefore, accounted for as separate performance obligations, provided that: (i) the customer can benefit from the good or service either on its own or together with other resources that are readily available to the customer and (ii) the promise to transfer the good or service to the customer is separately identifiable from other promises in the contract. In assessing whether a promise is distinct, we consider factors such as whether: (i) we provide a significant service of integrating goods and/or services with other goods and/or services promised in the contract; (ii) one or more of the goods and/or services significantly modifies or customizes, or are significantly modified or customized by one or more of the other goods and/or services promised in the contract; and (iii) the goods and/or services are highly interdependent or highly interrelated.
Individual goods or services (or bundles of goods and/or services) that meet both criteria for being distinct are accounted for as separate performance obligations. Promises that are not distinct at contract inception are combined and accounted for as a single performance obligation. Options to acquire additional goods and/or services are evaluated to determine if such option provides a material right to the customer that it would not have received without entering into the contract. If so, the option is accounted for as a separate performance obligation. If not, the option is considered a marketing offer which would be accounted for as a separate contract upon the customer’s election.
The transaction price is generally comprised of an upfront payment due at contract inception and variable consideration in the form of payments for our services and materials and milestone payments due upon the achievement of specified events. Other payments the Company could be entitled to include tiered royalties earned when customers recognize net sales of licensed products. We consider the existence of any significant financing component within our arrangements and have determined that a significant financing component does not exist in our arrangements as substantive business purposes exist to support the payment structure other than to provide a significant benefit of financing. We measure the transaction price based on the amount of consideration we expect to be entitled in exchange for transferring the promised goods and/or services to the customer. We utilize either the expected value method or the most likely amount method to estimate the amount of variable consideration, depending on which method is expected to better predict the amount of consideration to which we will be entitled. Amounts of variable consideration are included in the transaction price to the extent that it is probable that a significant reversal in the amount of cumulative revenue recognized will not occur when the uncertainty associated with the variable consideration is subsequently resolved.
With respect to arrangements that include payments for a development or regulatory milestone payment, we evaluate whether the associated event is considered probable of achievement and estimate the amount to be included in the transaction price using the most likely amount method. Milestone payments that are not within our control or the licensee, such as those dependent upon receipt of regulatory approval, are not considered to be probable of achievement until the triggering event occurs. At the end of each reporting period, we re-evaluate the probability of achievement of each milestone and any related constraint, and if necessary, adjust our estimate of the overall transaction price. Any such adjustments are recorded on a cumulative catch-up basis, which would affect revenue and net loss in the period of adjustment. For arrangements that include sales-based royalties, including milestone payments based upon the achievement of a certain level of product sales, wherein the license is deemed to be the sole or predominant item to which the payments relate, we recognize revenue upon the later of: (i) when the related sales occur or (ii) when the performance obligation to which some or all of the payment has been allocated has been satisfied (or partially satisfied). Consideration that would be received for optional goods and/or services is excluded from the transaction price at contract inception.
We generally allocate the transaction price to each performance obligation based on a relative standalone selling price basis. We develop assumptions that require judgment to determine the standalone selling price for each performance obligation in consideration of applicable market conditions and relevant entity-specific factors, including factors that were contemplated in negotiating the agreement with the customer and estimated research and development costs. However, in certain instances, we allocate variable consideration entirely to one or more performance obligation if the terms of the variable consideration relate to the satisfaction of the respective performance obligation and the amount allocated is consistent with the amount we would expect to receive for the satisfaction of the respective performance obligation.
12
We recognize revenue based on the amount of the transaction price that is allocated to each respective performance obligation when or as the performance obligation is satisfied by transferring a promised good or service to the customer. For performance obligations that are satisfied at a point in time, we recognize revenue when control of the goods and/or services is transferred to the customer. For performance obligations that are satisfied over time, we recognize revenue by measuring the progress toward complete satisfaction of the performance obligation using a single method of measuring progress which depicts the performance in transferring control of the associated goods and/or services to the customer. We generally use input methods to measure the progress toward the complete satisfaction of performance obligations satisfied over time. With respect to arrangements containing a license to our intellectual property that is determined to be distinct from the other performance obligations identified in the arrangement, we recognize revenue from amounts allocated to the license when the license is transferred to the licensee and the licensee is able to use and benefit from the license. For licenses that are bundled with other promises, we utilize judgment to assess the nature of the combined performance obligation to determine whether the combined performance obligation is satisfied over time or at a point in time and, if over time, the appropriate method of measuring progress for purposes of recognizing revenue. Significant management judgment is required in determining the level of effort required under an arrangement and the period over which we are expected to complete our performance obligations under an arrangement. We evaluate the measure of progress each reporting period and, if necessary, adjust the measure of performance and related revenue recognition. Any such adjustments are recorded on a cumulative catch-up basis, which would affect revenue and net loss in the period of adjustment.
Grant Revenue
We have contracts with the U.S. government’s Defense Advanced Research Projects Agency (DARPA), Biomedical Advanced Research (BARDA), and the Bill & Melinda Gates Foundation (Gates Foundation). We recognize revenue from these contracts as we perform services under these arrangements when the funding is committed. Revenues and related expenses are presented gross in the condensed consolidated statements of operations as we have determined we are the primary obligor under the arrangements relative to the research and development services we perform as lead technical expert.
Comprehensive Loss
Comprehensive loss includes net loss and other comprehensive income (loss) for the period. Other comprehensive income (loss) consists of unrealized gains and losses on our investments. Total comprehensive loss for all periods presented has been disclosed in the condensed consolidated statements of comprehensive loss.
The components of accumulated other comprehensive loss for
the three months ended
March 31, 2019
are as follows (in thousands):
|
Unrealized Gain on Available-for-Sale Debt Securities
|
|||
|
Accumulated other comprehensive loss, balance at December 31, 2018
|
$
|
(1,320
|
)
|
|
Other comprehensive income
|
1,911
|
|
|
|
Accumulated other comprehensive loss, balance at March 31, 2019
|
$
|
591
|
|
Emerging Growth Company Status
We are an “emerging growth company,” (EGC) as defined in the Jumpstart Our Business Startups Act, (JOBS Act), and may take advantage of certain exemptions from various reporting requirements that are applicable to other public companies that are not EGCs. We may take advantage of these exemptions until we are no longer an EGC under Section 107 of the JOBS Act, which provides that an EGC can take advantage of the extended transition period afforded by the JOBS Act for the implementation of new or revised accounting standards. We have elected to use the extended transition period for complying with new or revised accounting standards, and as a result of this election, our condensed consolidated financial statements may not be comparable to companies that comply with public company FASB standards’ effective dates. We may take advantage of these exemptions up until the last day of the fiscal year following the fifth anniversary of our initial public offering (IPO) or such earlier time that we are no longer an EGC.
13
Recently Adopted Accounting Standards
ASU No. 2014-09, Revenue from Contracts with Customers
In May 2014, the FASB issued ASU No. 2014-09,
Revenue from Contracts with Customers (Topic 606)
, which supersedes all existing revenue recognition requirements in ASC 605 and most industry specific guidance. ASC 606 provides a single comprehensive model for use in accounting for revenue arising from contracts with customers. We adopted the new revenue standard on January 1, 2019 using the modified retrospective transition method applied to those contracts which were not completed as of January 1, 2019. We recognized the cumulative effect of the adoption as an adjustment to the opening balance of accumulated deficit in the first quarter of 2019. We have elected to use the practical expedient to aggregate the impact of all contract modifications that occurred prior to the ASC 606 adoption with respect to (i) identification of the satisfied and unsatisfied performance obligations, (ii) determination of the transaction price and (iii) allocation of the transaction price to the satisfied and unsatisfied performance obligations.
ASC 606 requires significant judgment and estimates and results in changes to, but not limited to: (i) the determination of the transaction price, including estimates of variable consideration, (ii) the allocation of the transaction price, including the determination of estimated selling price, and (iii) the pattern of recognition, including the application of proportional performance as a measure of progress on service-related promises and application of point-in-time recognition for supply-related promises. We recorded the cumulative-effect adjustment of
$28.0 million
to the opening balance of accumulated deficit as of January 1, 2019 with a corresponding decrease to deferred revenue. The effect of the adoption of ASC 606 on our condensed consolidated balance sheet is as follows (in thousands):
|
Condensed Consolidated Balance Sheet
|
Balance at December 31, 2018
|
Adjustments
|
Balance at
January 1, 2019
|
|||||||||
|
Deferred revenue, current
|
$
|
109,056
|
|
$
|
(27,281
|
)
|
$
|
81,775
|
|
|||
|
Deferred revenue, non-current
|
165,352
|
|
(3,441
|
)
|
161,911
|
|
||||||
|
Accounts receivable
|
11,686
|
|
(2,738
|
)
|
8,948
|
|
||||||
|
Accumulated deficit
|
(1,006,627
|
)
|
27,984
|
|
(978,643
|
)
|
||||||
The cumulative-effect adjustment is primarily due to the application of ASC 606 to our strategic collaboration agreements, particularly our Combined 2018 AZ Agreements, 2016 VEGF Exercise and Merck PCV/SAV Agreement (see Note 3). In addition, as a result of the cumulative decrease in deferred revenue, our corresponding deferred tax asset was decreased by
$8.4 million
, which was offset by a corresponding decrease to our valuation allowance.
A substantial portion of the
$28.0 million
cumulative-effect adjustment is the result of the application of ASC 606 regarding the allocation of the transaction price and the measurement of progress in satisfying performance obligations. In particular, for the Combined 2018 AZ Agreements, the adoption of ASC 606 resulted in the decrease of previously deferred revenue of
$39.9 million
. For the Merck PCV/SAV Agreement, the adoption of ASC 606 resulted in a reversal of previously recognized revenue and an increase in deferred revenue of
$13.9 million
. These adjustments are due to the change in the way we allocate the transaction price to each performance obligation and measure our performance under each agreement from a straight-line method to a proportional performance model. In addition, the adoption of ASC 606 resulted in the decrease of
$4.3 million
of previously deferred revenue relating to the 2016 VEGF Exercise. Under ASC 605, the product option fee and the clinical milestone payment we received pursuant to the VEGF Exercise were deferred until the consideration pertaining to the clinical supply of mRNA can be reasonably estimated. Under ASC 606, we are required to estimate the total variable consideration to determine the total consideration and recognize the revenue as clinical supply is shipped to the customer based on the proportionate amount of the transaction price. As a result, the balance of remaining deferred revenues at January 1, 2019 was
$75.7 million
,
$37.1 million
and
$125.2 million
related to the Combined 2018 AZ Agreements, 2016 VEGF Exercise and the Merck PCV/SAV Agreement, respectively.
14
The following tables summarize the effects of adopting ASC 606 on our condensed consolidated financial statements at March 31, 2019, and for the three months ended March 31, 2019 (in thousands, except per share data):
|
March 31, 2019
|
||||||||||||
|
Condensed Consolidated Balance Sheet
|
As reported under ASC 606
|
Adjustments
|
Balance without adoption of ASC 606
|
|||||||||
|
Deferred revenue, current
|
$
|
73,958
|
|
$
|
36,452
|
|
$
|
110,410
|
|
|||
|
Deferred revenue, non-current
|
156,862
|
|
(29,840
|
)
|
127,022
|
|
||||||
|
Accumulated deficit
|
(1,111,300
|
)
|
(6,077
|
)
|
(1,117,377
|
)
|
||||||
|
Three Months Ended March 31, 2019
|
||||||||||||
|
Condensed Consolidated Statement of Operations
|
As reported under ASC 606
|
Adjustments
|
Amount without adoption of ASC 606
|
|||||||||
|
Revenue:
|
||||||||||||
|
Collaboration revenue
|
$
|
13,301
|
|
$
|
(1,786
|
)
|
$
|
11,515
|
|
|||
|
Collaboration revenue from related party
|
814
|
|
24,377
|
|
25,191
|
|
||||||
|
Total revenue
|
16,025
|
|
21,907
|
|
37,932
|
|
||||||
|
Loss from operations
|
(141,833
|
)
|
21,907
|
|
(119,926
|
)
|
||||||
|
Loss before benefit from income taxes
|
(132,681
|
)
|
21,907
|
|
(110,774
|
)
|
||||||
|
Net (loss) income
|
(132,657
|
)
|
21,907
|
|
(110,750
|
)
|
||||||
|
Net loss per share - basic and diluted
|
(0.40
|
)
|
0.06
|
|
(0.34
|
)
|
||||||
ASU No. 2016-18, Statement of Cash Flows: Restricted Cash
In November 2016, the FASB issued ASU No. 2016-18,
Statement of Cash Flows (Topic 230):
Restricted Cash
, which requires the statement of cash flows to explain the change during the period in the total of cash, cash equivalents and restricted cash. When cash, cash equivalents and restricted cash are presented in more than one line item on the balance sheet, the new standard requires a reconciliation of the totals in the statement of cash flows to the related captions in the balance sheet. This reconciliation can be presented either on the face of the statement of cash flows or in the notes to the financial statements. The new standard became effective for us on January 1, 2019. As a result of adopting this new standard using a retrospective transition method for each period presented, we include our restricted cash balance in the cash, cash equivalents and restricted cash reconciliation of operating, investing and financing activities in the condensed statements of cash flows.
The following table provides a reconciliation of cash, cash equivalents and restricted cash in the condensed consolidated balance sheets that sum to the total of the same such amounts shown in the condensed statements of cash flows (in thousands):
|
As of March 31,
|
||||||||
|
2019
|
2018
|
|||||||
|
Cash and cash equivalents
|
$
|
502,934
|
|
$
|
90,479
|
|
||
|
Restricted cash
|
—
|
|
237
|
|
||||
|
Restricted cash, non-current
|
11,823
|
|
11,798
|
|
||||
|
Total cash, cash equivalents and restricted cash shown in the condensed consolidated
statements of cash flows
|
$
|
514,757
|
|
$
|
102,514
|
|
||
15
ASU No. 2018-07, Compensation - Stock Compensation: Improvements to Nonemployee Share-Based Payment Accounting
In June 2018, the FASB issued ASU 2018-07,
Compensation—Stock Compensation (Topic 718): Improvements to Nonemployee Share-Based Payment Accounting,
which is intended to simplify aspects of share-based compensation issued to non-employees by making the guidance generally consistent with the accounting for employee share-based compensation. The new standard will be effective for us on January 1, 2020, with early adoption permitted. We early adopted this standard in the first quarter of 2019. The adoption of this standard did not have a material impact on our condensed consolidated financial statements and disclosure.
ASU No. 2018-18, Collaborative Arrangements: Clarifying the Interaction between Topic 808 and Topic 606
In November 2018, the FASB issued ASU 2018-18,
Collaborative Arrangements (Topic 808)
:
Clarifying the Interaction between Topic 808 and Topic 606,
which clarifies the interaction between Topic 808 and Topic 606,
Revenue from Contracts with Customers
. Currently, Topic 808 does not provide comprehensive recognition or measurement guidance for collaborative arrangements, and the accounting for those arrangements is often based on an analogy to other accounting literature or an accounting policy election. Similarly, aspects of Topic 606 have resulted in diversity in practice on the effect of the revenue standard on the accounting for collaborative arrangements. The standard will become effective for us beginning on January 1, 2021, with early adoption permitted. We early adopted this standard in connection with the adoption of ASC 606 in the first quarter of 2019. The adoption of this standard did not have a material impact on our condensed consolidated financial statements and disclosure.
Recently Issued Accounting Standards
From time to time, new accounting pronouncements are issued by the FASB or other standard setting bodies and adopted by us as of the specified effective date. Unless otherwise discussed, we believe that the impact of recently issued standards that are not yet effective will not have a material impact on our condensed consolidated financial statements and disclosures.
In February 2016, the FASB issued ASU No. 2016-02,
Leases
(Topic 842), which supersedes all existing lease guidance. This guidance offers specific accounting guidance for a lessee, a lessor and sale and leaseback transactions. The new standard requires lessees to recognize an operating lease with a term greater than one year on their balance sheets as a right-of-use asset and corresponding lease liability, measured at the present value of the lease payments. Lessees are required to classify leases as either finance or operating leases. If the lease is effectively a financed-purchase by the lessee, it is classified as a financing lease, otherwise it is classified as an operating lease. This classification will determine whether lease expense is recognized based on an effective interest method or on a straight-line basis over the term of the lease. ASC 842 provides accounting guidance for transactions that meet specific criteria for a leaseback transaction. If the criteria are not met, the transaction is considered a “failed sale” and the transaction must be accounted for as a financing arrangement. The new standard will be effective for us on January 1, 2020, assuming we continue to qualify as an EGC.. Upon adoption, the new standard, as amended, allows lessees to apply the transition requirements either (1) retrospectively to each prior reporting period presented in the financial statements with the cumulative effect of applying the new rules recognized at the beginning of the earliest comparative period presented, or (2) retrospectively at the beginning of the period of adoption with the cumulative effect of applying the new rules recognized then. We are currently evaluating the potential impact ASU 2016-02 may have on our financial position and results of operations. Our assessment will include, but is not limited to, evaluating the impact this standard has on the lease of our corporate headquarters at 200 Technology Square in Cambridge, MA, the lease of our office and laboratory space at 500 Technology Square, Cambridge, MA and our manufacturing and additional facilities in Norwood, MA, (see Note 7), and the identification of any embedded leases.
In June 2016, the FASB issued ASU No. 2016-13,
Measurement of Credit Losses on Financial Instruments
(ASU 2016-13). ASU 2016-13 will change how companies account for credit losses for most financial assets and certain other instruments. For trade receivables, loans and held-to-maturity debt securities, companies will be required to recognize an allowance for credit losses rather than reducing the carrying value of the asset. Assuming we continue to qualify as an EGC, ASU 2016-13 will be effective for us for fiscal years beginning after December 15, 2020, , including interim periods within those fiscal years. Early adoption is permitted. The Company is currently evaluating the potential impact that the adoption of ASU 2016-13 will have on the Company’s financial position and results of operations.
In August 2018, the FASB issued ASU 2018-15,
Intangibles—Goodwill and Other—Internal-Use Software (Topic 350): Customer’s Accounting for Implementation Costs Incurred in a Cloud Computing Arrangement That Is a Service Contract.
This standard requires capitalizing implementation costs incurred to develop or obtain internal-use software (and hosting arrangements that include an internal-use software license). This standard should be applied either retrospectively or prospectively, and will be effective for us in January 2021, assuming we continue to qualify as an EGC, with early adoption permitted. We are currently evaluating the potential impact this standard may have on our condensed consolidated financial statements and results of operations upon adoption.
16
3. Collaboration Agreements
The following table summarizes our total consolidated net revenues from our strategic collaborators for the periods presented (in thousands):
|
Three Months Ended
|
||||||||||||
|
Collaboration Revenue by Strategic Collaborator:
|
March 31, 2019
as reported
(under ASU 606)
|
March 31, 2019
without adoption of 606
(under ASC 605)
|
March 31, 2018
as reported
(under ASC 605)
|
|||||||||
|
Merck
|
$
|
10,687
|
|
$
|
11,515
|
|
$
|
15,967
|
|
|||
|
AstraZeneca
|
814
|
|
25,191
|
|
7,350
|
|
||||||
|
Vertex
|
2,614
|
|
—
|
|
4,143
|
|
||||||
|
Total collaborative revenue
|
$
|
14,115
|
|
$
|
36,706
|
|
$
|
27,460
|
|
|||
The following table presents changes in the balances of our receivables and contract liabilities related to our strategic collaboration agreements during the three months ended
March 31, 2019
(in thousands):
|
January 1, 2019
|
Additions
|
Deductions
|
March 31, 2019
|
|||||||||||||
|
Contract Assets:
|
||||||||||||||||
|
Accounts receivable
|
$
|
4,612
|
|
$
|
2,735
|
|
$
|
(3,747
|
)
|
$
|
3,600
|
|
||||
|
Contract Liabilities:
|
||||||||||||||||
|
Deferred revenue
|
$
|
240,924
|
|
$
|
1,137
|
|
$
|
(13,582
|
)
|
$
|
228,479
|
|
||||
During the three months ended
March 31, 2019
, we recognized the following revenues as a result of the change in the contract liability balances related to our collaboration agreements (in thousands):
|
Revenue recognized in the period from:
|
Three Months Ended March 31, 2019
|
|||
|
Amounts included in contract liabilities at the beginning of the period
(1)
|
$
|
13,582
|
|
|
(1)
We first allocate revenue to the individual contract liability balance outstanding at the beginning of the period until the revenue exceeds that balance. If additional consideration is received on those contracts in subsequent periods, we assume all revenue recognized in the reporting period first applies to the beginning contract liability.
As of
March 31, 2019
, the aggregated amount of the transaction price allocated to performance obligations that are unsatisfied or partially unsatisfied was
$279.5 million
.
17
AstraZeneca – Strategic Alliances in Cardiovascular and Oncology
2013 Option Agreement and Services and Collaboration Agreement
In March 2013, we entered into an Option Agreement, the AZ Option Agreement, and a related Services and Collaboration Agreement, the AZ Services Agreement, with AstraZeneca, which were amended and restated in June 2018. We refer to these agreements in the forms that existed prior to the 2018 amendment and restatement as the 2013 AZ Agreements. Under the 2013 AZ Agreements, we granted AstraZeneca certain exclusive rights and licenses, and options to obtain exclusive rights to develop and commercialize potential therapeutic mRNA medicines directed at certain targets for the treatment of cardiovascular and cardiometabolic diseases and cancer, and agreed to provide related services to AstraZeneca. Pursuant to the 2013 AZ Agreements, AstraZeneca was responsible for all research, development and commercialization activities, while we provided specified research and manufacturing services during a research and evaluation period, as described below, to further AstraZeneca’s activities pursuant to an agreed upon services plan. Under the 2013 AZ Agreements, AstraZeneca could have requested we provide additional services, at AstraZeneca’s expense. Subject to customary “back-up” supply rights granted to AstraZeneca, we exclusively manufactured (or had manufactured) mRNA for all research, development and commercialization purposes under the 2013 AZ Agreements until, on a product-by-product basis, the expiration of the time period for which we are entitled to receive earn-out payments with respect to such product pursuant to the 2013 AZ Agreements.
As of the effective date of the 2013 AZ Agreements, AstraZeneca acquired
forty
options that it may exercise to obtain exclusive rights to clinically develop and commercialize identified development candidates (and related back-up candidates) directed to specified targets that arise during the research and evaluation period. During the research and evaluation period for research candidates under the 2013 AZ Agreements, AstraZeneca could have elected to designate a limited number of research candidates as development candidates in order to continue preclinical development on such development candidates (and related back-up candidates). From such pool of development candidates designated by AstraZeneca, during a specified option exercise period, AstraZeneca could have then exercised one of its options to obtain exclusive rights to clinically develop and commercialize an identified development candidate (and related back-up candidates). If AstraZeneca did not exercise one of its options to acquire exclusive rights to clinically develop and commercialize a particular development candidate during the defined option exercise period for such development candidate, AstraZeneca’s rights to exercise an option and other rights granted under the 2013 AZ Agreements with respect to such development candidate (and related back-up candidates) would terminate, all rights to exploit such development candidate (and related back-up candidates) would be returned to us and all data and results generated by AstraZeneca with respect to such development candidate (and related back-up candidates) would be either assigned or licensed to us. Upon the earlier of termination of the 2013 AZ Agreements for any reason and a specified anniversary of the effective date of the 2013 AZ Agreements, all unexercised options, and the right to exercise any and all options if not previously exercised by AstraZeneca, would automatically terminate. On a target-by-target basis, we and AstraZeneca agreed to certain defined exclusivity obligations under the 2013 AZ Agreements with respect to the research, development and commercialization of mRNA medicines for such target.
As of the effective date of the 2013 AZ Agreements, AstraZeneca made upfront cash payments to us totaling
$240.0 million
. Under the 2013 AZ Agreements, we were entitled to receive payments that are not related to any specific program of up to
$180.0 million
in the aggregate for the achievement of
three
technical milestones relating to toxicity, delivery, and competition criteria. We achieved the toxicity and competition milestones in the year ended December 31, 2015. The delivery milestone has expired. Under the 2013 AZ Agreements, AstraZeneca was obligated to pay us a
$10.0 million
option exercise fee with respect to each development candidate (and related back-up candidates) for which it exercised an option. In addition, upon AstraZeneca’s exercise of each option, we were eligible to receive certain payments contingent upon the achievement of specified clinical, regulatory, and commercial events. For any product candidate optioned by AstraZeneca, we were eligible to receive, per product candidate, up to
$100.0 million
in payments for achievement of development milestones, up to
$100.0 million
payments for achievement of regulatory milestones, and up to
$200.0 million
payments for achievement of commercial milestones. Additionally, under the 2013 AZ Agreements, we were entitled to receive, on a product-by-product basis, earn-out payments on worldwide net sales of products ranging from a high-single digit percentage to
12%
, subject to certain reductions, with an aggregate minimum floor.
We received from AstraZeneca under the 2013 AZ Agreements an option exercise payment of
$10.0 million
in the year ended December 31, 2016, and a clinical milestone payment of
$30.0 million
with respect to AstraZeneca’s VEGF-A product (AZD8601) during the year ended December 31, 2018, that is currently being developed in a Phase 2 clinical trial in certain fields.
Unless earlier terminated, the 2013 AZ Agreements would have continued until the expiration of AstraZeneca’s earn-out and contingent option exercise payment obligations for optioned product candidates. Either party had the right to terminate the 2013 AZ Agreements upon the other party’s material breach, either in its entirety or in certain circumstances, with respect to relevant candidates, subject to a defined materiality threshold and specified notice and cure provisions. If AstraZeneca had the right to terminate the 2013 AZ Agreements for our material breach, then AstraZeneca could have elected, in lieu of terminating the 2013 AZ
18
Agreements, in their entirety or with respect to such candidates, to have the 2013 AZ Agreements remain in effect, subject to reductions in certain payments we were eligible to receive and certain adjustments to AstraZeneca’s obligations under the 2013 AZ Agreements. AstraZeneca had the right to terminate the 2013 AZ Agreements in full, without cause, upon
90
-days’ prior notice to us.
2016 Strategic Alliance with AstraZeneca
–
IL12
In January 2016, we entered into a new Strategic Drug Development Collaboration and License Agreement, which we refer to as the 2016 AZ Agreement, with AstraZeneca to discover, develop and commercialize potential mRNA medicines for the treatment of a range of cancers.
Under the terms of the 2016 AZ Agreement, we and AstraZeneca have agreed to work together on an immuno-oncology program focused on the intratumoral delivery of a potential mRNA medicine to make the IL12 protein.
The 2016 AZ Agreement initially included research activities with respect to a second discovery program. During a limited period of time, each party had an opportunity to propose additional discovery programs to be conducted under the 2016 AZ Agreement. We are responsible for conducting and funding all discovery and preclinical development activities under the 2016 AZ Agreement in accordance with an agreed upon discovery program plan for the IL12 program and any other discovery program the parties agree to conduct under the 2016 AZ Agreement. For the IL12 program and any other discovery program the parties agree to conduct under the 2016 AZ Agreement, during a defined election period that commenced as of the effective date of the 2016 AZ Agreement (for the IL12 program) and otherwise will commence on initiation of any such new discovery program, AstraZeneca may elect to participate in the clinical development of a development candidate arising under the 2016 AZ Agreement from such program. If AstraZeneca so elects (as it has for the IL12 program), AstraZeneca will lead clinical development activities worldwide and we will be responsible for certain activities, including being solely responsible for manufacturing activities, all in accordance with an agreed upon development plan. AstraZeneca will be responsible for funding all Phase 1 clinical development activities (including costs associated with our manufacture of clinical materials in accordance with the development plan), and Phase 2 clinical development activities (including costs associated with our manufacture of clinical materials in accordance with the development plan) up to a defined dollar threshold. We and AstraZeneca will equally share the costs of Phase 2 clinical development activities in excess of such dollar threshold, all Phase 3 clinical development activities and certain other costs of late-stage clinical development activities, unless we elect not to participate in further development and commercialization activities and instead receive tiered royalties, as described below.
We and AstraZeneca will co-commercialize products in the U.S. in accordance with an agreed upon commercialization plan and budget, and on a product-by-product basis will equally share the U.S. profits or losses arising from such commercialization. Notwithstanding, on a product-by-product basis, prior to a specified stage of development of a given product, we have the right to elect not to participate in the further development and commercialization activities for such product. If we make such election, instead of participating in the U.S. profits and losses share with respect to such product, we are obligated to discuss future financial terms with AstraZeneca. If we are unable to agree on future financial terms within a short, defined period of time, we are entitled to receive tiered royalties at default rates set forth in the 2016 AZ Agreement, ranging from percentages in the mid-single digits to
20%
on worldwide net sales of products, subject to certain reductions with an aggregate minimum floor. AstraZeneca has sole and exclusive responsibility for all ex-U.S. commercialization efforts. Unless we have elected to not to participate in further development (in which case royalties on ex-U.S. net sales will be at the default rates as described above, unless otherwise agreed by the parties), we are entitled to tiered royalties at rates ranging from
10%
to
30%
on ex-U.S. net sales of the products, subject to certain reductions with an aggregate minimum floor. Subject to customary “back-up” supply rights granted to AstraZeneca, we exclusively manufacture (or have manufactured) products for all development and commercialization purposes. We and AstraZeneca have agreed to certain defined exclusivity obligations with each other under the 2016 AZ Agreement with respect to the development and commercialization of mRNA medicines for IL12.
Unless earlier terminated, our strategic alliance under the 2016 AZ Agreement will continue on a product-by-product basis (i) until both parties cease developing and commercializing such product without the intention to resume, if we have not elected our right not to participate in further development and commercialization of such product or (ii) on a country-by-country basis, until the end of the applicable royalty term for such product in such country, if we have elected our right not to participate in further development and commercialization of such product.
Either party may terminate the 2016 AZ Agreement upon the other party’s material breach, subject to specified notice and cure provisions. Each party may also terminate the 2016 AZ Agreement in the event the other party challenges such party’s patent rights, subject to certain defined exceptions. AstraZeneca has the right to terminate the 2016 AZ Agreement in full or with respect to any program for scientific, technical, regulatory or commercial reasons at any time upon
90
days’ prior written notice to us. On a product-by-product basis, we have the right to terminate the 2016 AZ Agreement in certain cases if AstraZeneca has suspended or is no longer proceeding with the development or commercialization of such product for a period of
twelve
consecutive months, subject to specified
19
exceptions, including tolling for events outside of AstraZeneca’s control. On a product-by-product basis, if the 2016 AZ Agreement is terminated with respect to a given product, AstraZeneca’s rights in such product will terminate and, to the extent we terminated for AstraZeneca’s breach, patent challenge or cessation of development or AstraZeneca terminated in its discretion, AstraZeneca will grant us reversion licenses and take certain other actions so as to enable us to continue developing and commercializing such product in the oncology field.
If we continue developing and commercializing a given product following termination of the 2016 AZ Agreement by AstraZeneca in its discretion with respect to such product, AstraZeneca is entitled to receive a mid-single digit royalty on our worldwide net sales of such product and a high-single digit percentage of the amounts received by us from a third party in consideration of a license to such third party to exploit such product, in each case, until AstraZeneca recovers an amount equal to specified development costs incurred by AstraZeneca under the 2016 AZ Agreement with respect to such product prior to such termination. Such percentages increase by a low to mid-single digit amount to the extent such termination occurs after such product achieves a specified stage of development.
2017 Strategic Alliance with AstraZeneca – Relaxin
In October 2017, we entered a new Collaboration and License Agreement, which we refer to as the 2017 AZ Agreement, under which AstraZeneca may clinically develop and commercialize a development candidate, now known as AZD7970, which is comprised of an mRNA construct for the relaxin protein designed by us and encapsulated in one of our proprietary lipid nanoparticles ("LNP"). We discovered and performed preclinical development activities for AZD7970 prior to the initiation of the strategic alliance with AstraZeneca under the 2017 AZ Agreement.
Under the terms of the 2017 AZ Agreement, we will fund and be responsible for conducting preclinical development activities for AZD7970 through completion of IND-enabling GLP toxicology studies and AstraZeneca will lead pharmacological studies, each in accordance with an agreed upon discovery program plan. During a defined election period that commences as of the effective date of the 2017 AZ Agreement, AstraZeneca may elect to participate in further development and commercialization of AZD7970. Upon such election, AstraZeneca will lead clinical development activities for AZD7970 worldwide and we will be responsible for manufacturing AZD7970, certain regulatory matters and any other development activities that we agree to perform and that are set forth in an agreed upon development plan. AstraZeneca will be responsible for funding Phase 1 clinical development activities (including costs associated with our manufacture of clinical materials in accordance with the development plan, up to a cap above which such costs are shared), and Phase 2 clinical development activities (including costs associated with our manufacture of clinical materials in accordance with the development plan, up to a cap above which such costs are shared) up to a defined dollar threshold. Thereafter, we and AstraZeneca will equally share the costs of Phase 2 clinical development activities in excess of such defined dollar threshold, all Phase 3 clinical development activities and certain other costs of late-stage clinical development activities, unless we elect not to participate in further development and co-commercialization activities and instead receive tiered royalties as described below. If the development candidate is determined to be IND-ready, and AstraZeneca does not timely elect to participate in the clinical development of AZD7970, AstraZeneca is obligated to reimburse us for certain costs we incurred in the manufacture and development of AZD7970, since execution of the 2017 AZ Agreement.
We and AstraZeneca will co-commercialize AZD7970 in the United States in accordance with an agreed upon commercialization plan and budget, and will equally share U.S. profits or losses arising from such commercialization. Notwithstanding, prior to a specified stage of development of AZD7970, we have the right to elect not to participate in the further development and commercialization activities for AZD7970. If we make such election, instead of participating in the U.S. profits and losses share with respect to AZD7970, we are obligated to discuss future financial terms with AstraZeneca. If we are unable to agree on future financial terms within a short, defined period of time, we are entitled to receive tiered royalties at default rates set forth in the 2017 AZ Agreement, ranging from percentages in the mid-single digits to the low 20s on worldwide net sales by AstraZeneca of AZD7970, subject to certain reductions, with an aggregate minimum floor. AstraZeneca has sole and exclusive responsibility for all ex-U.S. commercialization efforts. Unless we have elected not to participate in further development (in which case royalties on ex-U.S. net sales will be at the default rates as described above, unless otherwise agreed by the parties), we are entitled to receive tiered royalties at rates ranging from
10%
to
30%
on annual ex-U.S. net sales of AZD7970, subject to certain reductions with an aggregate minimum floor. Subject to customary “back-up” supply rights granted to AstraZeneca, we exclusively manufacture (or have manufactured) products for all development and commercialization purposes. Additionally, we and AstraZeneca have agreed to certain defined exclusivity obligations under the 2017 AZ Agreement with respect to the development and commercialization of mRNA medicines for Relaxin.
Unless earlier terminated, our strategic alliance under the 2017 AZ Agreement will continue (i) until the expiration of AstraZeneca’s election period, if it does not elect to participate in the clinical development of AZD7970, (ii) until both parties cease developing and commercializing AZD7970 without the intention to resume, if we have not elected our right not to participate in further development
20
and commercialization of AZD7970, (iii) on a country-by-country basis, until the end of the applicable royalty term for AZD7970 in such country, if we have elected our right not to participate in further development and commercialization of AZD7970 or (iv) following completion of IND-enabling studies with respect to AZD7970, if we provide AstraZeneca with written notice that we do not reasonably believe that the product is IND-ready.
Either party may terminate the 2017 AZ Agreement upon the other party’s material breach, subject to specified notice and cure provisions. Each party may also terminate the 2017 AZ Agreement in the event the other party challenges the validity or enforceability of such party’s patent rights, subject to certain defined exceptions. AstraZeneca has the right to terminate the 2017 AZ Agreement in full for scientific, technical, regulatory or commercial reasons at any time upon
90
days’ prior written notice to us. We have the right to terminate the 2017 AZ Agreement in certain cases if AstraZeneca has suspended or is no longer proceeding with the development or commercialization of AZD7970 for a period of
twelve
consecutive months, subject to specified exceptions, including tolling for events outside of AstraZeneca’s control. If AstraZeneca does not timely elect to participate in clinical development of AZD7970, or the Agreement is terminated, AstraZeneca’s rights in AZD7970 will terminate and, to the extent we terminated for AstraZeneca’s breach, patent challenge or cessation of development or AstraZeneca terminated in its discretion, AstraZeneca will grant us reversion licenses and take certain other actions so as to enable us to continue developing and commercializing AZD7970 in the cardiovascular and cardiometabolic fields.
If we continue developing and commercializing AZD7970 following a termination of the 2017 AZ Agreement by AstraZeneca in its discretion, AstraZeneca is entitled to receive a mid-single digit royalty on our worldwide net sales of AZD7970 and a high-single digit percentage of the amounts received by us from a third party in consideration for a license to such third party to exploit AZD7970, in each case until AstraZeneca recovers an amount equal to specified development costs incurred by AstraZeneca under the 2017 AZ Agreement with respect to AZD7970 prior to such termination. Such percentages increase by a low to mid-single digit amount to the extent such termination occurs after such product achieves a specified stage of development.
2013 Agreements with AstraZeneca, amended and restated in 2018
In June 2018, we entered into an Amended and Restated Option Agreement and a related Amended and Restated Services and Collaboration Agreement with AstraZeneca, or the 2018 A&R Agreements, which amended and restated the 2013 AZ Agreements. Under the 2018 A&R Agreements, we granted AstraZeneca certain exclusive rights and licenses to research, develop and commercialize potential therapeutic mRNA medicines directed at certain targets for the treatment of cardiovascular and cardiometabolic diseases and cancer, and agreed to provide related services to AstraZeneca. The activities to be performed by the parties under the 2018 A&R Agreements are limited to defined biological targets in the cardiovascular and cardiometabolic fields and one defined target in the cancer field.
Pursuant to the 2018 A&R Agreements, AstraZeneca is responsible for all research, development and commercialization activities and associated costs, while we provide specified research and manufacturing services during a research and evaluation period, as described below, to further AstraZeneca’s activities conducted pursuant to an agreed upon services plan. During this research and evaluation period, these research services, and manufacturing services in excess of a specified threshold, are provided at AstraZeneca’s expense, and manufacturing services below the specified threshold are provided at no additional expense to AstraZeneca. AstraZeneca may request we provide additional research and manufacturing services, at AstraZeneca’s expense, following the end of the research and evaluation period. Subject to customary “back-up” supply rights granted to AstraZeneca, we exclusively manufacture (or have manufactured) mRNA for all research, development and commercialization purposes under the 2018 A&R Agreements until, on a product-by-product basis, the expiration of the time period for which we are entitled to receive earn-out payments with respect to such product pursuant to the 2018 A&R Agreements.
As of the effective date of the 2013 AZ Agreements, and as further reflected in the 2018 A&R Agreements, AstraZeneca acquired
forty
options that it may exercise to obtain exclusive rights to clinically develop and commercialize identified development candidates (and related back-up candidates) directed to specified targets that arise during the research and evaluation period. During the research and evaluation period for research candidates, AstraZeneca may elect to designate a limited number of research candidates as development candidates in order to continue preclinical development on such development candidates (and related back-up candidates). From such pool of development candidates designated by AstraZeneca, during a specified option exercise period, AstraZeneca may then exercise one of its options to obtain exclusive rights to clinically develop and commercialize an identified development candidate (and related back-up candidates) in certain fields. If AstraZeneca does not exercise one of its options to acquire exclusive rights to clinically develop and commercialize a particular development candidate during the defined option exercise period for such development candidate, AstraZeneca’s rights to exercise an option and other rights granted under the 2018 A&R Agreements with respect to such development candidate (and related back-up candidates) will terminate, all rights to exploit such development candidate (and related back-up candidates) will be returned to us and all data and results generated by AstraZeneca with respect to such development
21
candidate (and related back-up candidates) will be either assigned or licensed to us. Upon the earlier of termination of the 2018 A&R Agreements for any reason and a specified anniversary of the effective date of the 2013 AZ Agreements, all unexercised options, and the right to exercise any and all options if not previously exercised by AstraZeneca, will automatically terminate.
On a target-by-target basis, we and AstraZeneca have agreed to certain defined exclusivity obligations under the 2018 A&R Agreements with respect to the research, development and commercialization of mRNA medicines for such target in certain fields. In addition, we and AstraZeneca have agreed to certain defined exclusivity obligations with respect to the research, development and commercialization of mRNA medicines coding for the same polypeptide as any development candidate being developed under the 2018 A&R Agreements.
Unless earlier terminated, the 2018 A&R Agreements will continue until the expiration of AstraZeneca’s earn-out and contingent option exercise payment obligations for optioned product candidates. Either party may terminate the 2018 A&R Agreements upon the other party’s material breach, either in its entirety or in certain circumstances, with respect to relevant candidates, subject to a defined materiality threshold and specified notice and cure provisions. If AstraZeneca has the right to terminate the 2018 A&R Agreements for our material breach, then AstraZeneca may elect, in lieu of terminating the 2018 A&R Agreements, in their entirety or with respect to such candidates, to have the 2018 A&R Agreements remain in effect, subject to reductions in certain payments we are eligible to receive and certain adjustments to AstraZeneca’s obligations under the 2018 A&R Agreements. AstraZeneca may terminate the 2018 A&R Agreements in full, without cause, upon
90
days’ prior notice to us.
Accounting Treatment
For periods prior to January 1, 2019, we applied the provisions of ASC 605 in accounting for these arrangements, except for the 2017 AZ Agreement which was accounted for under ASC 808. In August 2016, AstraZeneca exercised a product option available pursuant to the 2013 AZ Agreements to obtain exclusive rights to clinically develop and commercialize the VEGF-A product (AZD8601). This option exercise is referred to as the 2016 VEGF Exercise. Consistent with our conclusions under ASC 605 and pursuant to ASC 606, we determined that the 2016 VEGF Exercise and the 2017 AZ Agreement should be accounted for as separate transactions as the agreements are not interrelated or interdependent. Conversely, the 2013 Agreements, as amended by the 2018 A&R Agreements, and the 2016 AZ Agreement, were combined for accounting purposes and treated as a single agreement, as these agreements were negotiated in contemplation of each other. As of the date of our initial application of ASC 606, we applied the practical expedient to include the aggregate effect of all modifications to the arrangement that occurred before January 1, 2019 with respect to (i) identification of the satisfied and unsatisfied performance obligations, (ii) determination of the transaction price and (iii) allocation of the transaction price to the satisfied and unsatisfied performance obligations. Therefore, we aggregated effects of all the modifications prior to January 1, 2019 to the 2013 Agreements, including the effects of the 2018 A&R Agreements, and the 2016 AZ Agreement were combined into one transaction for accounting purposes. We will refer to this combined transaction as the Combined 2018 AZ Agreements. We determined that all aspects of Combined 2018 AZ Agreements and the 2016 VEGF Exercise represent a transaction with a customer and therefore is accounted for in accordance with ASC 606 as of the date of the initial application.
Combined 2018 AZ Agreements
We identified the following performance obligations in the Combined 2018 AZ Agreements: (i) a combined performance obligation that includes a research license, research and development pool services, and manufacturing obligations related to the 2013 AZ Agreements, as amended by the 2018 A&R Agreements, collectively referred to as the Combined 2018 AZ Agreement Performance Obligation, (ii) preclinical development services for IL12, (iii) preclinical development services for an oncology development target, (iv) a combined performance obligation for a development and commercialization license and manufacturing obligations for IL12, and (v) a material right to receive development and commercialization rights and manufacturing services for an oncology development target.
We concluded that the research license is not distinct from the research and development pool services or the manufacturing obligations related to the 2018 A&R Agreements, as AstraZeneca cannot fully exploit the value of the research license without receipt of such services and supply. Our services and supply involve specialized expertise, particularly as it relates to mRNA technology that is not available in the marketplace. Any supply requested by AstraZeneca in excess of the minimum quantities specified in the agreement are considered customer options and treated as separate contracts for accounting purposes. Further, we concluded that AstraZeneca cannot exploit the value of the development and commercialization license for IL12 without receipt of supply as the development and commercialization license does not convey to AstraZeneca the right to manufacture and therefore combined the development and commercialization license and the manufacturing obligations for IL12 into one performance obligation.
22
As of January 1, 2019, the date of initial adoption of ASC 606, the total transaction price was determined to be
$400.0
million comprised of the
$240.0 million
in upfront payments pertaining to the 2013 AZ Agreements and
$160.0
million of variable consideration comprised of
$40.0
million of estimated reimbursement for IL12 manufacturing obligations and
$120.0 million
of milestone payments (
$60.0 million
toxicity milestone and
$60.0 million
competition milestone), received prior to the adoption date of ASC 606. We utilize the most likely amount method to determine the amount of reimbursement for IL12 manufacturing obligations to be received. We determined that any sales-based royalties related to IL12 will be recognized when the related sales occur as they were determined to relate predominately to the license granted and therefore have been excluded from the transaction price. In addition, we are eligible to receive future milestones and royalties on future commercial sales for optioned product candidates under the 2018 A&R Agreements and future royalties under the 2016 Agreement; however, these amounts are not considered variable consideration under the Combined 2018 Agreements as we are only eligible to receive such amounts if AstraZeneca exercises its options (including certain options that are deemed to be material rights). We have concluded that the exercise of an optioned product candidate represents a separate transaction under ASC 606. We will re-evaluate the transaction price at the end of each reporting period. There was a $
0.3
million increase to the transaction price resulting from a change in estimate of the variable consideration during the three months ended
March 31, 2019
.
The transaction price was allocated to the performance obligations based on the relative estimated standalone selling prices of each performance obligation. We developed the estimated standalone selling price for the licenses included in the Combined 2018 AZ Agreement Performance Obligation and the combined performance obligation for a development and commercialization license and manufacturing obligations for IL12 primarily based on the probability-weighted present value of expected future cash flows associated with each license related to each specific program. In developing such estimate, we also considered applicable market conditions and relevant entity-specific factors, including those factors contemplated in negotiating the agreement, probability of success and the time needed to commercialize a product candidate pursuant to the associated license. We developed the estimated standalone selling price for the services and/or manufacturing and supply included in each of the performance obligation, as applicable, primarily based on the nature of the services to be performed and/or goods to be manufactured and estimates of the associated costs, adjusted for a reasonable profit margin that would be expected to be realized under similar contracts. The estimated standalone selling price of the material right to receive development and commercialization rights and manufacturing services for an oncology development target was developed by estimating the amount of discount that AstraZeneca would receive when exercising the option and adjusting such amount by the likelihood that the option will be exercised.
The transaction price allocated to each performance obligation was as follows: (i)
$292.4 million
to the Combined 2018 AZ Agreement Performance Obligation, (ii)
$8.1 million
to the preclinical development services for IL12 performance obligation, (iii)
$8.1 million
to the preclinical development services for an oncology development target performance obligation, (iv)
$89.8 million
to the combined performance obligation for a development and commercialization license and manufacturing obligations for IL12, and (v)
$1.6 million
to the material right to receive development and commercialization rights and manufacturing services for an oncology development target. As part of the allocation of the transaction price to each of the performance obligations, we concluded that the
$60.0 million
toxicology milestone and the estimated reimbursement for IL12 manufacturing costs can be allocated entirely to specific performance obligations because the variable payment relates specifically to our effort to satisfy the performance obligation and such allocation is consistent with the allocation objectives of ASC 606.
We measure proportional performance over time using an input method based on cost incurred relative to the total estimated costs for the Combined 2018 AZ Agreement Performance Obligation and the preclinical development services for IL12 and the other oncology target performance obligations. We recognize revenue related to the amounts allocated to the combined performance obligation for a development and commercialization license and manufacturing obligations for IL12 based on the point in time upon which control of supply is transferred to AstraZeneca for each delivery of the associated supply.
We recognize revenue for the Combined 2018 AZ Agreement Performance Obligation, on a quarterly basis, by determining the proportion of effort incurred as a percentage of total effort we expect to expend. This ratio is applied to the transaction price allocated to this combined performance obligation. We also estimate the development plan, including expected demand from AstraZeneca, and the associated costs for this combined performance obligation, as we will satisfy this combined performance obligation as the manufacturing services are performed. Management has applied significant judgment in the process of developing our budget estimates. Any changes to these estimates will be recognized in the period in which they change as a cumulative catch up.
For the three months ended
March 31, 2019
and
2018
, we recognized collaboration revenue of
$0.8 million
and
$7.4 million
, respectively, from the Combined 2018 AZ Agreements. The revenue recognized for the three months ended
March 31, 2019
includes the amortization of deferred revenue due to the satisfaction of our performance obligation during the period. As of
March 31, 2019
, the aggregate amount of the transaction price allocated to the remaining performance obligations that are unsatisfied is
$112.5 million
.
$102.8 million
is expected to be recognized as revenue through December 31, 2027 and
$9.7 million
is expected to be recognized as
23
revenue at the earlier of expiration or modification of the Combined 2018 AZ Agreement. We had deferred revenue of
$75.5 million
and
$115.6 million
as of
March 31, 2019
and
December 31, 2018
, respectively, from the Combined 2018 AZ Agreements, which is classified as current or non-current in the condensed consolidated balance sheets based on the period the services are expected to be performed or control of the supply is expected to be transferred.
2016 VEGF Exercise
We concluded that the 2016 VEGF Exercise should be treated as a separate transaction for accounting purposes. We identified one performance obligation in this arrangement which is comprised of the exclusive license to develop and commercialize VEGF and the manufacturing of clinical supply. We concluded that the VEGF license is not distinct from the manufacturing obligations because AstraZeneca cannot fully exploit the value of the license without receipt of such supply. This is due to limitations inherent in the licenses conveyed wherein AstraZeneca does not have the contractual right to manufacture during the term of the agreement.
As of January 1, 2019, the date of initial adoption of ASC 606, the total transaction price was determined to be
$55.1 million
comprised of the
$40.0 million
in fixed payments pertaining to a
$10.0 million
option exercise fee and a
$30.0 million
milestone achieved prior to the adoption of ASC 606 and
$15.1 million
of variable consideration related to the estimated reimbursement for clinical supply. We are eligible to receive future milestones and royalties on future commercial sales under this arrangement. We utilize the most likely amount method to estimate any development and regulatory milestone payments to be received and the amount of estimated reimbursement for clinical supply. As of January 1, 2019, there were no milestones that had not been achieved included in the transaction price. We considered the stage of development and the risks associated with the remaining development required to achieve each milestone, as well as whether the achievement of the milestone is outside of our or AstraZeneca’s control. The outstanding milestone payments were fully constrained, as a result of the uncertainty whether any of the milestones would be achieved. We determined that any commercial milestones and sales-based royalties will be recognized when the related sales occur as they were determined to relate predominantly to the license granted and therefore have also been excluded from the transaction price. We will re-evaluate the transaction price at the end of each reporting period and as uncertain events are resolved or other changes in circumstances occur. When a milestone payment is included in the transaction price in the future, it will be recognized as revenue based on the relative completion of the underlying performance obligation. There were
no
changes to the transaction price during the three months ended
March 31, 2019
.
We recognize revenue related to the amount of the transaction price allocated to the VEGF Exercise performance obligation based on the point in time upon which control of supply is transferred to AstraZeneca for each delivery of the associated supply.
For the three months ended
March 31, 2019
and
2018
, we did
not
recognize any collaboration revenue from the 2016 VEGF Exercise. As of
March 31, 2019
, the aggregate amount of the transaction price allocated to the remaining performance obligation that is unsatisfied is
$51.0 million
, which is expected to be recognized as revenue through December 31, 2023. We had deferred revenue of
$37.1 million
and
$41.2 million
as of
March 31, 2019
and
December 31, 2018
, respectively, from the 2016 VEGF Exercise, which is classified as current or non-current in the condensed consolidated balance sheets based on the period the control of the supply is expected to be transferred.
2017 AZ Agreement
We concluded the 2017 AZ Agreement is under the scope of ASC 808 as we and AstraZeneca are both active participants in the development, manufacturing and commercialization activities and are exposed to significant risks and rewards that are dependent on commercial success of the activities of the arrangement. Additionally, we determined the development, manufacturing and commercialization activities are not deliverables under ASC 606. As a result, the activities conducted pursuant to the development, manufacturing and commercialization activities are accounted for as a component of the related expense in the period incurred. We considered the guidance in ASC 606 by analogy in determining the appropriate treatment for the transactions between us and AstraZeneca and concluded that reimbursement for transactions in which we are considered to be principal because we control a promised good or service before transferring that good or service to the customer, are accounted for as gross revenue.
We did
not
recognize any revenue from the 2017 AZ Agreement for the three months ended
March 31, 2019
and
2018
, respectively.
24
Merck – Strategic Alliances in Infectious Diseases and Cancer Vaccines
2015 Strategic Alliance with Merck – Infectious Disease
In January 2015, we entered into a Master Collaboration and License Agreement with Merck, which was amended in January 2016, June 2016, and May 2019, and which we refer to, as amended, as the 2015 Merck Agreement. Pursuant to the 2015 Merck Agreement, we and Merck have agreed to research, develop, and commercialize potential mRNA medicines for the prevention of infections by RSV. Pursuant to the 2015 Merck Agreement, Merck is primarily responsible for research, development, and commercialization activities and associated costs of such research and commercialization. We are responsible for designing and manufacturing all mRNA constructs for preclinical and Phase 1 and Phase 2 clinical development purposes, and Merck pays us for such manufacture, and we are responsible for certain costs associated with the conduct of a Phase 1 clinical trial for a RSV vaccine product candidate (mRNA-1172). Responsibility for manufacturing mRNA constructs for late stage clinical development and commercialization purposes is to be determined.
The 2015 Merck Agreement includes a
three
-year period, expected to end on January 12, 2022, during which Merck may continue to preclinically and clinically develop RSV vaccine product candidates that arose during an initial
four
-year research period which terminated in January 2019. Merck may, prior to the end of this
three
-year period, elect to exclusively develop and commercialize up to
five
RSV vaccine product candidates.
We and Merck have agreed to certain defined exclusivity obligations during the term of the 2015 Merck Agreement with respect to potential mRNA medicines against RSV infection. As part of the May 2019 amendment of the 2015 Merck Agreement, these exclusivity obligations do not restrict Moderna from researching, developing, and commercializing a potential mRNA medicine for the prevention of a specific set of respiratory infections, including RSV, for the pediatric population.
Under the terms of the 2015 Merck Agreement, we received a
$50.0 million
upfront payment. We are eligible to receive, on a product-by-product basis, up to
$300.0 million
in aggregate milestone payments upon the achievement of certain development, regulatory, and commercial milestone events. To date, we have received from Merck a clinical milestone payment of
$5.0 million
with respect to the initiation of a Phase 1 clinical trial for a Merck RSV vaccine product candidate. In addition, under the terms of the 2015 Merck Agreement, we are eligible to receive an additional milestone payment unless Merck elects not to continue with further clinical development of mRNA-1172. On a product-by-product basis, we are also entitled to receive royalties on Merck’s net sales of products at rates ranging from the mid-single digits to low teens, subject to certain reductions, with an aggregate minimum floor. Additionally, concurrent with entering into the 2015 Merck Agreement in 2015, Merck made a
$50.0 million
equity investment in us, and concurrent with amending the 2015 Merck Agreement in January 2016, we received an upfront payment of
$10.0 million
from Merck.
Unless earlier terminated, the 2015 Merck Agreement will continue on a product-by-product and country-by-country basis for so long as royalties are payable by Merck on a given product in a given country. Either party may terminate the 2015 Merck Agreement upon the other party’s material breach, either in its entirety or with respect to a particular program, product candidate, product or country, subject to specified notice and cure provisions. Merck may terminate the 2015 Merck Agreement in full or with respect to a particular product candidate or product upon certain advance notice to us for any reason, or earlier if Merck determines the alliance or product is no longer commercially practicable. If Merck has the right to terminate the 2015 Merck Agreement, in its entirety or with respect to a program, product candidate or product, for our material breach, then Merck may elect, in lieu of terminating the 2015 Merck Agreement, to have the 2015 Merck Agreement remain in effect, subject to reductions in certain payments we are eligible to receive with respect to the terminable rights. Upon a termination of the 2015 Merck Agreement with respect to a program, all licenses and other rights granted to Merck with respect to such program will terminate and the continued development and commercialization of product candidates and products will revert to us. If the 2015 Merck Agreement is terminated with respect to a given product candidate or product, all licenses and other rights granted to Merck with respect to such product candidate or product will terminate and, to the extent we terminated for Merck’s breach, Merck will grant us licenses under select Merck technology for our continued development and commercialization of such product candidate or product. As a part of the May 2019 amendment of the 2015 Merck Agreement, we and Merck agreed to and conclude the collaboration as it relates to development of potential mRNA medicines for other viruses, including mRNA-1278 for the prevention of VZV infection.
Accounting Treatment
For periods prior to January 1, 2019, we applied the provisions of ASC 605 in accounting for this arrangement. As of the date of our initial application of ASC 606, we applied the practical expedient to include the aggregate effect of all modifications to the arrangement that occurred before January 1, 2019 with respect to (i) identification of the satisfied and unsatisfied performance obligations, (ii) determination of the transaction price and (iii) allocation of the transaction price to the satisfied and unsatisfied
25
performance obligations. Additionally, we determined that all aspects of amended 2015 Merck Agreement represent a transaction with a customer and therefore the amended 2015 Merck Agreement is accounted for in accordance with ASC 606 as of the date of the initial application. As of the date of initial adoption of ASC 606, the
four
-year research period was substantially complete and we concluded there were no unsatisfied performance obligations pertaining to the amended 2015 Merck Agreement. Additionally, we concluded the following customer options are marketing offers as such options did not provide any discounts or other rights that would be considered a material right in the arrangement: (i) research services during the
three
-year period following the initial
four
-year research period during which Merck may continue to preclinically and clinically develop product candidates and (ii) clinical mRNA supply for Phase 1 and Phase 2 and/or non-cGMP mRNA supply beyond the initial
four
-year research period. Therefore, such options will be accounted for as a separate contract upon the customer’s election. After completion of the initial
four
-year research period and as a part of the May 2019 amendment of the 2015 Merck Agreement, Merck elected to establish a new RSV vaccine product candidate and to conduct a Phase 1 clinical trial. We and Merck agreed to focus the collaboration activities on RSV and discontinue the collaboration as it relates to the development of development candidates for other viruses.
As of the date of initial application of ASC 606, the total transaction price of
$65.0 million
comprised of the
$60.0 million
in aggregate upfront payments, including
$50.0 million
related to research and development funding plus a
$10.0 million
funding from the 2016 amendment of the 2015 Merck Agreement, and a
$5.0 million
payment pertaining to achievement of a development milestone during the year ended December 31, 2017, which had been allocated entirely to the satisfied performance obligation and recognized in full. We utilize the most likely amount method to estimate any development and regulatory milestone payments to be received. As of January 1, 2019, there were no milestones that had not been achieved included in the transaction price. We considered the stage of development and the risks associated with the remaining development required to achieve each milestone, as well as whether the achievement of the milestone is outside of our or Merck’s control. The outstanding milestone payments were fully constrained, as a result of the uncertainty whether any of the milestones would be achieved. We determined that any commercial milestones and sales-based royalties will be recognized when the related sales occur as they were determined to relate predominantly to the license granted and therefore have also been excluded from the transaction price. We will re-evaluate the transaction price at the end of each reporting period and as uncertain events are resolved or other changes in circumstances occur. When a milestone payment is included in the transaction price in the future, it will be recognized as revenue based on the relative completion of the underlying performance obligation. There were
no
changes to the transaction price during the three months ended
March 31, 2019
.
We had
no
deferred revenue as of
March 31, 2019
or
December 31, 2018
from the amended Merck 2015 Agreement as all performance obligations under the amended 2015 Merck Agreement were completed. For the three months ended March 31,
2018
, we recognized collaboration revenue of
$2.0 million
from the amended 2015 Merck Agreement.
Additionally, we recognized collaboration revenue of
$0.5 million
for the three months ended March 31, 2019, pursuant to separate agreements with Merck related to the exercise of customer options to purchase clinical mRNA supply to further develop a product candidate after the initial
four
-year research period. Clinical mRNA supply is recognized as collaboration revenue at a point in time upon which control of supply is transferred to Merck for each delivery of the associated supply.
We are currently evaluating the accounting related to the May 2019 amendment of the 2015 Merck Agreement.
2016 Cancer Vaccine Strategic Alliance—Personalized mRNA Cancer Vaccines
In June 2016, we entered into a personalized mRNA cancer vaccines (PCV) Collaboration and License Agreement with Merck Sharp & Dohme Corp., or Merck, which we refer to as the PCV Agreement, to develop and commercialize PCVs for individual patients using our mRNA vaccine and formulation technology. Under the strategic alliance, we identify genetic mutations present in a particular patient’s tumor cells, synthesize mRNA for these mutations, encapsulate the mRNA in one of our proprietary LNPs and administer to each patient a unique mRNA cancer vaccine designed to specifically activate the patient’s immune system against her or his own cancer cells.
Pursuant to the PCV Agreement, we are responsible for designing and researching PCVs, providing manufacturing capacity and manufacturing PCVs, and conducting Phase 1 and Phase 2 clinical trials for PCVs, alone and in combination with KEYTRUDA (pembrolizumab), Merck’s anti-PD-1 therapy, all in accordance with an agreed upon development plan and budget and under the oversight of a committee comprised of equal representatives of each party. The parties have entered into a clinical quality agreement with respect to Moderna’s manufacture and supply activities. We received an upfront payment of
$200.0 million
from Merck. In November 2017, we and Merck announced the achievement of a key milestone for the first-in-human dosing of a PCV (mRNA-4157) as a part of the alliance. The Phase 1 open-label, dose escalation, multicenter clinical trial in the United States (KEYNOTE-603) is
26
designed to assess the safety, tolerability and immunogenicity of mRNA-4157 alone in subjects with resected solid tumors and in combination with KEYTRUDA, in subjects with unresectable solid tumors.
Until the expiration of a defined period of time following our completion of Phase 1 and Phase 2 clinical trials for PCVs under the PCV Agreement and delivery of an associated data package to Merck, Merck has the right to elect to participate in future development and commercialization of PCVs by making a
$250.0 million
participation payment to us. If Merck exercises its election and pays the participation payment, then the parties will equally co-fund subsequent clinical development of PCVs, with Merck primarily responsible for conducting clinical development activities under a jointly agreed development plan and budget. Each party may also conduct additional clinical trials for PCVs that are not included in the jointly agreed development plan and budget, in which case the non-conducting party will reimburse the conducting party for half of the total costs for such trials, plus interest, from its share of future profits resulting from sales of such PCVs, if any. Merck will lead worldwide commercialization of PCVs, subject to Moderna’s option to co-promote PCVs in the United States, and the parties will equally share the profits or losses arising from worldwide commercialization. Until a PCV becomes profitable, we may elect to defer payment of our share of the commercialization and related manufacturing costs and instead reimburse Merck for such costs, plus interest, from our share of future profits resulting from sales of such PCV, if any. Subject to customary “back-up” supply rights granted to Merck, we will manufacture (or have manufactured) PCVs for preclinical and clinical purposes. Manufacture of PCVs for commercial purposes will be determined by the parties in accordance with the terms of the PCV Agreement. Under the PCV Agreement, we grant certain licenses to Merck to perform its collaboration activities.
If Merck does not exercise its right to participate in future development and commercialization of PCVs, then Moderna will retain the exclusive right to develop and commercialize PCVs developed during the strategic alliance, subject to Merck’s rights to receive a percentage in the high teens to the low 20s, subject to reductions of our net profits on sales of such PCVs. During a limited period following such non-exercise, Merck has the right to perform clinical studies of such PCVs in combination with KEYTRUDA, for which we agree to use reasonable efforts to supply such PCVs. During such limited period, we also have the right to perform clinical studies of PCVs in combination with KEYTRUDA, for which Merck agrees to use reasonable efforts to supply KEYTRUDA. In addition, following its non-exercise, Merck is also entitled to receive a percentage in the high teens to the low 20s, subject to reductions, of our net profits on sales of certain PCVs first developed by us following such non-exercise and reaching a specified development stage within a defined period of time.
We and Merck have agreed to certain defined, limited exclusivity obligations with respect to the development and commercialization of PCVs.
2018 Expansion of the Cancer Vaccine Strategic Alliance—Shared Neoepitope Cancer Vaccines
In April 2018, we and Merck agreed to expand our cancer vaccine strategic alliance to include the development and commercialization of our KRAS vaccine development candidate, mRNA-5671, and potentially other shared neoantigen mRNA cancer vaccines (SAVs). We preclinically developed mRNA-5671 prior to its inclusion in the cancer vaccine strategic alliance and it is comprised of a novel mRNA construct designed by us and encapsulated in one of our proprietary LNPs. The PCV Agreement was amended and restated to include the new SAV strategic alliance (PCV/SAV Agreement).
We have granted Merck certain licenses and we and Merck have agreed to certain exclusivity obligations with respect to SAVs and particular SAV programs, which obligations are subject to termination or expiration upon certain triggering events.
Under the PCV/SAV Agreement, Merck will be responsible for conducting Phase 1 and Phase 2 clinical trials for mRNA-5671 and for all costs associated with such activities, in accordance with a jointly agreed development plan and budget, and we will be responsible for manufacturing and supplying all mRNA-5671 required to conduct such trials and for all costs and expenses associated with such manufacture and supply. Under the PCV/SAV Agreement, our budgeted commitment for PCVs increased to
$243.0 million
. Until the expiration of a defined period of time following the completion of Phase 1 and Phase 2 clinical trials for mRNA-5671 under the PCV/SAV Agreement and our delivery of an associated data package to Merck, Merck has the right to elect to participate in future development and commercialization of mRNA-5671 by making a participation payment to us. If Merck exercises its participation rights, then the parties will equally co-fund subsequent clinical development of mRNA-5671, with Merck primarily responsible for conducting clinical development activities under a jointly agreed development plan and budget. If Merck declines to participate in future development and commercialization activities following the initial Phase 1 and Phase 2 clinical trials for mRNA-5671, then we will retain the rights to develop and commercialize mRNA-5671. If Merck elects to participate in future development and commercialization of mRNA-5671, Merck may also conduct additional clinical trials for mRNA-5671 that are not included in the jointly agreed development plan and budget, in which case we will reimburse Merck for half of the total development costs for such clinical trials, plus interest, from our share of future profits resulting from sales of mRNA-5671, if any. If Merck does conduct additional clinical trials for mRNA-5671, we will be responsible for manufacturing and supplying all mRNA-5671 required to conduct
27
such trials. Merck will lead worldwide commercialization of mRNA-5671, subject to our option to co-promote mRNA-5671 in the United States, and the parties will equally share the operating profits or losses arising from worldwide commercialization. Until mRNA-5671 becomes profitable, we may elect to defer payment of our share of the commercialization and related manufacturing costs and instead reimburse Merck for such costs, plus interest, from our share of future profits resulting from sales of mRNA-5671, if any. Subject to “back-up” supply rights granted to Merck, we will manufacture (or have manufactured) mRNA-5671 and other SAVs for preclinical and clinical purposes. After Merck exercises its right to participate in future development and commercialization of mRNA-5671 and other SAVs, we will grant the applicable development and commercialization licenses and the parties are obligated to discuss responsibility for future manufacturing, giving consideration to applicable criteria.
Pursuant to the PCV/SAV Agreement, for a defined period of time, either party may propose that the parties conduct additional programs for the research and development of SAVs directed to different shared neoantigens. If the parties agree to conduct any such programs, then we will be responsible for conducting and funding preclinical discovery and research activities for such SAVs, and otherwise the programs would be conducted on substantially the same terms as mRNA-5671 program. If we or Merck propose a new SAV program and the other party does not agree to conduct such program, then the PCV/SAV Agreement includes provisions allowing the proposing party to proceed with such development, at the proposing party’s expense. If Merck is the proposing party, we will be responsible for manufacturing and supplying material for such program at Merck’s expense. In such case, the non-proposing party will have the right to opt-in to such SAV program any time before the proposing party commits to performing Good Laboratory Practice (GLP)-toxicity studies. Until the expiration of a defined period of time following our completion of Phase 1 and Phase 2 clinical trials for any SAV program mutually agreed by the parties under the PCV/SAV Agreement and our delivery of an associated data package to Merck, Merck has the right to elect to participate in future development and commercialization of such SAV by making a participation payment to us.
Unless earlier terminated, the PCV/SAV Agreement will continue on a program-by-program basis until Merck terminates its participation in such program. Following any such termination, we will retain the exclusive right to develop and commercialize PCVs or SAVs developed as a part of such program, subject to restrictions and certain limited rights retained by Merck.
In connection with the amendment of the PCV Agreement to include the development and commercialization of mRNA-5671 and potentially other SAVs, Merck made a contemporaneous equity investment in our Series H redeemable convertible preferred stock, resulting in gross proceeds of
$125.0 million
, of which
$13.0 million
is determined to be a premium and recorded to deferred revenue.
Accounting Treatment
We determined that the PCV/SAV Agreement should be accounted for separately from the amended 2015 Merck Agreement, as the agreements were not negotiated in contemplation of one another and the elements within each of the agreements are not closely interrelated or interdependent on each other.
For periods prior to January 1, 2019, we applied the provisions of ASC 605 in accounting for this arrangement. As of the date of our initial application of ASC 606, we applied the practical expedient to include the aggregate effect of all modifications to the arrangement that occurred before January 1, 2019 with respect to: (i) identification of the satisfied and unsatisfied performance obligations, (ii) determination of the transaction price and (iii) allocation of the transaction price to the satisfied and unsatisfied performance obligations. Additionally, we determined that all aspects of the PCV/SAV Agreement represent a transaction with a customer and therefore the PCV/SAV Agreement is accounted for in accordance with ASC 606 as of the date of the initial application. Further, the equity investment in our Series H redeemable convertible preferred stock was considered together with the PCV/SAV Agreement as the transactions were executed contemporaneously in contemplation of one another. Further, the purchase price paid by Merck with respect to the investment in the Series H redeemable convertible preferred stock was not representative of fair value on the date of such purchase. As such, the incremental proceeds received in excess of the fair value of the underlying stock related to the equity investment were included in the transaction price related to the PCV/SAV Agreement and the shares of Series H redeemable convertible preferred stock purchased by Merck were recorded at their respective fair value on the date of issuance.
We identified the following performance obligations in the PCV/SAV Agreement: (i) a research license and research and development services, including manufacturing and supply of PCVs, during the proof of concept (POC) term for the PCV program, referred to as the PCV Performance Obligation, and (ii) research license and manufacturing and supply of mRNA-5671 during the POC term for the KRAS program, referred to as the KRAS Performance Obligation. We concluded that the research license is not distinct from the research and development services, including manufacturing and supply of PCVs, during the POC term for the PCV program, as Merck cannot fully exploit the value of the license without receipt of such services and supply. Our services and supply involve specialized expertise, particularly as it relates to mRNA technology that is not available in the marketplace. Therefore, the research license has been combined with the research and development services, including manufacturing and supply
28
of PCVs, during the POC term for the PCV program, into a single performance obligation. Similarly, we concluded that the research license is not distinct from the manufacturing and supply of mRNA-5671 during the POC term for the KRAS program, as Merck cannot fully exploit the value of the license without receipt of such supply which must be provided by us. This is due to limitations inherent in the licenses conveyed wherein Merck does not have the contractual right to manufacture during the POC term. Therefore, the research license has been combined with the manufacturing and supply of mRNA-5671, during the POC term for the KRAS program, into a single performance obligation. Conversely, we concluded that the PCV Performance Obligation and the KRAS Performance Obligation are distinct from each other because Merck can fully exploit the value of each program for its intended purpose without the promises associated with the other program. Additionally, we concluded the following customer options are marketing offers as such options did not provide any discounts or other rights that would be considered a material right in the arrangement: (i) Merck participation election license related to future joint development and commercialization on a program-by-program basis, (ii) manufacturing and supply in support of certain SAV programs and/or the PCV program upon Merck election to not participate in future development and commercialization of that program and (iii) research and development services associated with certain SAV programs. Therefore, such options will be accounted for as a separate contract upon the customer’s election.
As of January 1, 2019, the date of initial application of ASC 606, the total transaction price was determined to be
$213.0 million
comprised of the
$200.0 million
upfront payment pertaining to the PCV Agreement and the premium associated with the contemporaneous sale of Series H redeemable convertible preferred stock of
$13.0 million
. We determined there are no components of variable consideration that should be included in the transaction price as of the date of initial application, as additional consideration to which we could be entitled is subject to Merck’s election to exercise a customer option that was deemed to be a marketing offer. We will re-evaluate the transaction price at the end of each reporting period. There were
no
changes to the transaction price during the three months ended
March 31, 2019
.
The transaction price was allocated to the performance obligations based on the relative estimated standalone selling price of each performance obligation. We developed the estimated standalone selling price for the license included in each of the PCV Performance Obligation and the KRAS Performance Obligation primarily based on the probability-weighted present value of expected future cash flows associated with each license related to each specific program. In developing such estimate, we also considered applicable market conditions and relevant entity-specific factors, including those factors contemplated in negotiating the agreement, probability of success and the time needed to commercialize a product candidate pursuant to the associated license. We developed the estimated standalone selling price for the services and/or manufacturing and supply included in each of the PCV Performance Obligation and the KRAS Performance Obligation, as applicable, primarily based on the nature of the services to be performed and/or goods to be manufactured and estimates of the associated cost, adjusted for a reasonable profit margin that would be expected to be realized under similar contracts.
The transaction price allocated to each performance obligation was as follows: (i)
$206.3 million
to the PCV Performance Obligation and (ii)
$6.7 million
allocated to the KRAS Performance Obligation. We will recognize revenue related to amounts allocated to the PCV Performance Obligation over time as the underlying services are performed using a proportional performance model. We measure proportional performance using an input method based on the costs incurred relative to the total estimated costs of research and development efforts. We recognize revenue related to the amounts allocated to the KRAS Performance Obligation based on the point in time upon which control of supply is transferred to Merck for each delivery of the associated supply.
For the three months ended
March 31, 2019
and
2018
, we recognized collaboration revenue of
$10.2 million
and
$14.0 million
, respectively, in the condensed consolidated statements of operations, from the Merck PCV/SAV Agreement. The revenue recognized during the three months ended March 31, 2019 includes
$10.2 million
related to the amortization of deferred revenue due to the satisfaction of our performance during the period. As of
March 31, 2019
, the aggregate amount of the transaction price allocated to the remaining performance obligations that are unsatisfied is
$115.0 million
, which is expected to be recognized as revenue through December 31, 2021. We had deferred revenue of
$115.0 million
and
$111.3 million
, as of March 31, 2019 and December 31, 2018, respectively, from the Merck PCV/SAV Agreement, which is classified as current or non-current in the condensed consolidated balance sheets based on the period the services are expected to be performed or control of the supply is expected to be transferred.
Vertex – 2016 Strategic Alliance in Cystic Fibrosis
In July 2016, we entered into a Strategic Collaboration and License Agreement, with Vertex Pharmaceuticals Incorporated, and Vertex Pharmaceuticals (Europe) Limited, together, Vertex, which we refer to as the Vertex Agreement. The Vertex Agreement is aimed at the discovery and development of potential mRNA medicines for the treatment of cystic fibrosis (CF) by enabling cells in the lungs of people with CF to produce functional CFTR proteins.
29
Pursuant to the Vertex Agreement, we lead discovery efforts during a
three
-year research period, leveraging our Platform technology and mRNA delivery expertise along with Vertex’s scientific experience in CF biology and the functional understanding of CFTR. Vertex is responsible for conducting development and commercialization activities for candidates and products that arise from the strategic alliance, including the costs associated with such activities. Subject to customary “back-up” supply rights granted to Vertex, we exclusively manufacture (or have manufactured) mRNA for preclinical, clinical and commercialization purposes. The parties established a joint steering committee to oversee and coordinate activities under the Vertex Agreement. We and Vertex have granted each other certain licenses under the Vertex Agreement.
Under the terms of the Vertex Agreement, we received a
$20.0 million
upfront payment from Vertex. Vertex has the right to extend the initial
three
-year research period by
one
additional year by making an additional payment to us. We are eligible to receive up to
$55.0 million
in payments for achievement of development milestones, up to
$220.0 million
in payments for achievement of regulatory milestones and potentially could receive an additional
$3.0 million
milestone payment for achievement of a regulatory milestone for second and each subsequent product under the Vertex Agreement. Vertex will also pay us tiered royalties at rates ranging from the low- to high-teens on worldwide net sales of products arising from the strategic alliance, subject to certain reductions, with an aggregate minimum floor. In connection with the strategic alliance, Vertex also made a
$20.0 million
equity investment in our Series F redeemable convertible preferred stock. During the term of the Vertex Agreement, we and Vertex have agreed to certain defined exclusivity obligations under the Vertex Agreement with respect to the development and commercialization of certain mRNA medicines.
Unless earlier terminated, the Vertex Agreement will continue until the expiration of all royalty terms. Vertex may terminate the Vertex Agreement for convenience upon
90
days’ prior written notice, except if termination relates to a product in a country where Vertex has received marketing approval, which, in such case, Vertex must provide
180
days’ prior written notice. Either party may terminate the Vertex Agreement upon the other party’s material breach, subject to specified notice and cure provisions. Each party may also terminate the Vertex Agreement in the event that the other party challenges the validity or enforceability of such party’s patent rights, subject to certain exceptions, or if the other party becomes insolvent.
Accounting Treatment
For periods prior to January 1, 2019, we applied the provisions of ASC 605 in accounting for this arrangement. As of the date of the initial application of ASC 606, we determined that all aspects of the arrangement with Vertex represent a transaction with a customer and therefore should be accounted for in accordance with ASC 606. We identified one performance obligation comprised of: (i) a research, development and commercialization license and (ii) research and development services, including manufacturing and supply of non-cGMP mRNA, during the initial
three
-year research period. We concluded that the license is not distinct from the research and development services, including manufacturing and supply of non-cGMP mRNA, during the initial
three
-year research period, as Vertex cannot fully exploit the value of the license without receipt of such services and supply. Our services and supply involve specialized expertise, particularly as it relates to mRNA technology that is not available in the marketplace. Therefore, the license has been combined with the research and development services, including manufacturing and supply of non-cGMP supply, into a single performance obligation. Additionally, we concluded the following customer options are marketing offers as such options did not provide any discounts or other rights that would be considered a material right in the arrangement: (i) Vertex’s right to extend the research period for an additional year and (ii) clinical mRNA supply and/or non-cGMP mRNA supply beyond the initial
three
-year research period. Therefore, such options will be accounted for as a separate contract upon the customer’s election.
As of January 1, 2019, the date of initial application of ASC 606, the total transaction price was determined to be
$24.4 million
, comprised of the
$20.0 million
upfront payment and
$4.4 million
in research and development funding related to the research and development services and supply of non-cGMP mRNA. We utilize the most likely amount method to determine the amount of research and development funding to be received. We also utilize the most likely amount method to estimate any development and regulatory milestone payments to be received. As of January 1, 2019, there were no milestones included in the transaction price. We considered the stage of development and the risks associated with the remaining development required to achieve each milestone, as well as whether the achievement of the milestone is outside of our or Vertex’s control. The outstanding milestone payments were fully constrained, as a result of the uncertainty whether any of the milestones would be achieved. We determined that any sales-based royalties will be recognized when the related sales occur as they were determined to relate predominantly to the license granted and therefore have also been excluded from the transaction price. We will re-evaluate the transaction price at the end of each reporting period and as uncertain events are resolved or other changes in circumstances occur. There were
no
changes to the transaction price during the three months ended
March 31, 2019
.
The transaction price was allocated entirely to the single performance obligation. We recognize revenue related to amounts allocated to the single performance obligation over time as the underlying services are performed using a proportional performance model. We
30
measure proportional performance using an input method based on the costs incurred relative to the total estimated costs of the research and development efforts.
For the three months ended
March 31, 2019
and
2018
, we recognized collaboration revenue of
$2.6 million
and
$4.1 million
, respectively, in the condensed consolidated statements of operations, from Vertex. The revenue recognized during the three months ended
March 31, 2019
includes
$2.6 million
related to the amortization of the deferred revenue due to the satisfaction of our performance during the period. As of
March 31, 2019
, the aggregate amount of the transaction price allocated to the remaining performance obligation that is unsatisfied is
$1.1 million
, which is expected to be recognized as revenue through June 30, 2019. We had deferred revenue of
$0.8 million
and
$3.3 million
, as of March 31, 2019 and December 31, 2018, respectively, from Vertex, which is classified as current in the condensed consolidated balance sheets based on the period the services are expected to be performed.
4. Grants
Biomedical Advanced Research and Development Authority (BARDA)
In September 2016, we received an award of up to
$125.8 million
under Agreement No. HHSO100201600029C from BARDA, a component of the Office of the Assistant Secretary for Preparedness and Response, or ASPR within the U.S. Department of Health and Human Services, or HHS, to help fund our Zika vaccine program. Under the terms of the agreement with BARDA, an initial base award of
$8.2 million
supported toxicology studies, a Phase 1 clinical trial, and associated manufacturing activities. Contract options were available, for
$117.6 million
to support an additional Phase 1 study of an improved Zika vaccine candidate, Phase 2 and Phase 3 clinical studies, as well as large-scale manufacturing for the Zika vaccine.
As of
March 31, 2019
,
three
of the
four
contract options had been exercised resulting in
$117.3 million
of available funding with an additional
$8.5 million
available if the final contract option is exercised. For
the three months ended
March 31, 2019
and
2018
, we recognized revenue of
$1.5 million
and
$1.0 million
, respectively, relating to the BARDA Agreement.
The Bill & Melinda Gates Foundation (Gates Foundation)
In January 2016, we entered a global health project framework agreement with the Gates Foundation to advance mRNA-based development projects for various infectious diseases. The Gates Foundation has committed up to
$20.0 million
in grant funding to support our initial project related to the evaluation of antibody combinations in a preclinical setting as well as the conduct of a first-in-human Phase 1 clinical trial of a potential mRNA medicine to help prevent human immunodeficiency virus, or HIV, infections. Follow-on projects which could bring total potential funding under the framework agreement up to
$100.0 million
(including the HIV antibody project) to support the development of additional mRNA-based projects for various infectious diseases can be proposed and approved until the sixth anniversary of the framework agreement, subject to the terms of the framework agreement, including our obligation to grant to the Gates Foundation certain non-exclusive licenses. In March 2019, the Gates Foundation provided an
additional funding commitment up to
$1.1 million
to support a follow-on project.
As of
March 31, 2019
, up to
$21.1 million
has been committed for funding with up to an additional
$80 million
available, if additional follow-on projects are approved. For
the three months ended
March 31, 2019
and
2018
, we recognized
$0.3 million
for each period, relating to the Gates Foundation agreement. Deferred revenue of
$0.6 million
and
$0.8 million
was recorded for both
March 31, 2019
, and
December 31, 2018
, respectively, related to the Gates Foundation agreement.
Defense Advanced Research Projects Agency (DARPA)
In October 2013, DARPA awarded us up to
$24.6 million
under Agreement No. W911NF-13-1-0417, which was subsequently adjusted to
$19.7 million
, to research and develop potential mRNA medicines as a part of DARPA’s Autonomous Diagnostics to Enable Prevention and Therapeutics, or ADEPT, program, which is focused on assisting with the development of technologies to rapidly identify and respond to threats posed by natural and engineered diseases and toxins. The DARPA awards have been deployed primarily in support of our vaccine and antibody programs to protect against chikungunya infection.
As of
March 31, 2019
and December 31,
2018
,
$19.7 million
has been committed by DARPA. There was
no
revenue recognized for
the three months ended
March 31, 2019
, related to the DARPA agreement. We recognized revenue of
$0.2 million
for
the three months ended
March 31,
2018
, related to the DARPA agreement.
31
5. Financial Instruments
Cash and Cash Equivalents and Investments
The following tables summarize our cash and available-for-sale securities by significant investment category at
March 31, 2019
and
December 31, 2018
(in thousands):
|
March 31, 2019
|
||||||||||||||||||||||||||||
|
Amortized
Cost
|
Unrealized
Gains
|
Unrealized
Losses
|
Fair Value
|
Cash and
Cash
Equivalents
|
Current
Marketable
Securities
|
Non-
Current
Marketable
Securities
|
||||||||||||||||||||||
|
Cash and cash equivalents
|
$
|
502,935
|
|
$
|
—
|
|
$
|
(1
|
)
|
$
|
502,934
|
|
$
|
502,934
|
|
$
|
—
|
|
$
|
—
|
|
|||||||
|
Available-for-sale:
|
||||||||||||||||||||||||||||
|
Level 2:
|
||||||||||||||||||||||||||||
|
Certificates of deposit
|
84,114
|
|
72
|
|
(1
|
)
|
84,185
|
|
—
|
|
80,483
|
|
3,702
|
|
||||||||||||||
|
U.S. treasury securities
|
119,347
|
|
155
|
|
(4
|
)
|
119,498
|
|
—
|
|
79,475
|
|
40,023
|
|
||||||||||||||
|
Debt securities of U.S. government agencies and corporate entities
|
839,055
|
|
1,129
|
|
(218
|
)
|
839,966
|
|
—
|
|
446,032
|
|
393,934
|
|
||||||||||||||
|
$
|
1,545,451
|
|
$
|
1,356
|
|
$
|
(224
|
)
|
$
|
1,546,583
|
|
$
|
502,934
|
|
$
|
605,990
|
|
$
|
437,659
|
|
||||||||
|
December 31, 2018
|
||||||||||||||||||||||||||||
|
Amortized
Cost
|
Unrealized
Gains
|
Unrealized
Losses
|
Fair Value
|
Cash and
Cash
Equivalents
|
Current
Marketable
Securities
|
Non-
Current
Marketable
Securities
|
||||||||||||||||||||||
|
Cash and cash equivalents
|
$
|
658,365
|
|
$
|
20
|
|
$
|
(21
|
)
|
$
|
658,364
|
|
$
|
658,364
|
|
$
|
—
|
|
$
|
—
|
|
|||||||
|
Available-for-sale:
|
||||||||||||||||||||||||||||
|
Level 2:
|
||||||||||||||||||||||||||||
|
Certificates of deposit
|
173,102
|
|
42
|
|
(36
|
)
|
173,108
|
|
—
|
|
157,920
|
|
15,188
|
|
||||||||||||||
|
U.S. treasury securities
|
152,205
|
|
18
|
|
(48
|
)
|
152,175
|
|
—
|
|
152,175
|
|
—
|
|
||||||||||||||
|
Debt securities of U.S. government agencies and corporate entities
|
712,065
|
|
40
|
|
(1,335
|
)
|
710,770
|
|
—
|
|
552,968
|
|
157,802
|
|
||||||||||||||
|
$
|
1,695,737
|
|
$
|
120
|
|
$
|
(1,440
|
)
|
$
|
1,694,417
|
|
$
|
658,364
|
|
$
|
863,063
|
|
$
|
172,990
|
|
||||||||
32
The amortized cost and estimated fair value of marketable securities, by contractual maturity at
March 31, 2019
and
December 31, 2018
are as follows (in thousands):
|
March 31, 2019
|
||||||||
|
Amortized
Cost
|
Estimated
Fair Value
|
|||||||
|
Due in one year or less
|
$
|
605,687
|
|
$
|
605,990
|
|
||
|
Due after one year through five years
|
436,829
|
|
437,659
|
|
||||
|
Total
|
$
|
1,042,516
|
|
$
|
1,043,649
|
|
||
|
December 31, 2018
|
||||||||
|
Amortized
Cost
|
Estimated
Fair Value
|
|||||||
|
Due in one year or less
|
$
|
864,003
|
|
$
|
863,063
|
|
||
|
Due after one year through five years
|
173,369
|
|
172,990
|
|
||||
|
Total
|
$
|
1,037,372
|
|
$
|
1,036,053
|
|
||
At
March 31, 2019
, we held
32
available-for-sale securities, or an estimated fair value of
$135.8 million
, out of our total investment portfolio that were in a continuous unrealized loss position for more than 12 months with a gross unrealized loss of
$0.2 million
. At December 31, 2018, we held
25
available-for-sale securities, or an estimated fair value of
$82.8 million
, out of our total investment portfolio that were in a continuous unrealized loss position for more than 12 months with a gross unrealized loss of
$0.4 million
. We concluded that the net declines in market value of our available-for-sale securities investment portfolio were temporary in nature and did not consider any of our investments to be other-than-temporarily impaired. In accordance with our investment policy, we place investments in investment grade securities with high credit quality issuers, and generally limit the amount of credit exposure to any one issuer. We evaluate securities for other-than-temporary impairment at the end of each reporting period. Impairment is evaluated considering numerous factors, and their relative significance varies depending on the situation. Factors considered include the length of time and extent to which fair value has been less than the cost basis, the financial condition and near-term prospects of the issuer, and our intent and ability to hold the investment to allow for an anticipated recovery in fair value. Furthermore, the aggregate of individual unrealized losses that had been outstanding for 12 months or less was not significant as of
March 31, 2019
and
December 31, 2018
. We neither intend to sell these investments nor conclude that we are more-likely-than-not that we will have to sell them before recovery of their carrying values. We also believe that we will be able to collect both principal and interest amounts due to us at maturity.
6. Balance Sheet Components
Prepaid Expenses and Other Current Assets
Prepaid expenses and other current assets, as of
March 31, 2019
and
December 31, 2018
consists of the following (in thousands):
|
March 31,
|
December 31,
|
|||||||
|
2019
|
2018
|
|||||||
|
Prepaid expenses
|
$
|
7,895
|
|
$
|
10,401
|
|
||
|
Tenant incentives receivables
|
11,336
|
|
10,089
|
|
||||
|
Interest receivable on marketable securities
|
6,061
|
|
7,909
|
|
||||
|
Prepaid expenses and other current assets
|
$
|
25,292
|
|
$
|
28,399
|
|
||
33
Property and Equipment, Net
Property and equipment, net as of
March 31, 2019
and
December 31, 2018
consists of the following (in thousands):
|
March 31,
|
December 31,
|
|||||||
|
2019
|
2018
|
|||||||
|
Building
|
$
|
140,442
|
|
$
|
140,442
|
|
||
|
Laboratory equipment
|
98,891
|
|
96,907
|
|
||||
|
Leasehold improvements
|
15,861
|
|
13,741
|
|
||||
|
Furniture, fixtures and other
|
2,122
|
|
2,122
|
|
||||
|
Computer equipment and software
|
9,456
|
|
11,513
|
|
||||
|
Internally developed software
|
7,020
|
|
7,020
|
|
||||
|
Construction in progress
|
11,403
|
|
4,688
|
|
||||
|
285,195
|
|
276,433
|
|
|||||
|
Less: Accumulated depreciation
|
(71,735
|
)
|
(64,456
|
)
|
||||
|
Property and equipment, net
|
$
|
213,460
|
|
$
|
211,977
|
|
||
Depreciation and amortization expense for
the three months ended
March 31, 2019
and
2018
was
$7.3 million
and
$5.2 million
, respectively.
Accrued Liabilities
Accrued liabilities, as of
March 31, 2019
and
December 31, 2018
consists of the following (in thousands):
|
March 31,
|
December 31,
|
|||||||
|
2019
|
2018
|
|||||||
|
In-licenses
|
$
|
—
|
|
$
|
22,000
|
|
||
|
Property and equipment
|
7,756
|
|
12,089
|
|
||||
|
Compensation-related
|
11,577
|
|
23,406
|
|
||||
|
External goods and services
|
22,850
|
|
21,578
|
|
||||
|
Accrued liabilities
|
$
|
42,183
|
|
$
|
79,073
|
|
||
7. Commitments and Contingencies
Lease Obligations
We have entered into various long-term non-cancelable operating lease arrangements for our facilities and equipment expiring at various times through 2032. Certain of these arrangements have free rent periods or escalating rent payment provisions, which we recognize rent expense under such arrangements on a straight-line basis over the life of the leases. We have
two
campuses in Massachusetts. We occupy a multi-building campus in Technology Square in Cambridge, MA with a mix of offices and research laboratory space totaling approximately
200,000
square feet. Our Cambridge facility leases have expiry ranges from 2020 to 2027. We have approximately
200,000
square feet of a manufacturing facility in Norwood, MA. This facility is leased through 2032.
In February 2019, we entered into a new lease agreement for office and laboratory space of approximately
200,000
square feet, located in Norwood, MA. The lease will commence in the second quarter of 2019, and expires in early 2031. We have the option to extend the lease for up to
four
additional
five
-year terms.
34
Total rent expense, for
the three months ended
March 31, 2019
and
2018
was
$4.8 million
and
$5.2 million
, respectively. Future minimum lease payments under non-cancelable operating lease agreements at
March 31, 2019
, are as follows (in thousands):
|
Fiscal Year
|
Minimum Lease Payments
|
|||
|
2019
|
(remainder of the year)
|
$
|
15,190
|
|
|
2020
|
22,874
|
|
||
|
2021
|
24,105
|
|
||
|
2022
|
23,455
|
|
||
|
2023
|
20,498
|
|
||
|
Thereafter
|
140,384
|
|
||
|
Total
|
$
|
246,506
|
|
|
Strategic Collaborations
Under our strategic collaboration agreements, we are committed to perform certain research, development, and manufacturing activities. As part of our PCV Agreement and PCV/SAV Agreement with Merck, we are committed to perform certain research, development and manufacturing activities related to PCV products through an initial Phase 2 clinical trial up to a budgeted amount of
$243.0 million
for both periods as of
March 31, 2019
and December 31,
2018
(see Note 3).
Legal Proceedings
We are not currently a party to any material legal proceedings.
8. Shareholders' Equity
On February 28, 2018 and May 7, 2018, the Board of Directors approved an amendment to our Certificate of Incorporation resulting in a total of
775,000,000
shares of common stock and a total of
509,352,795
shares of redeemable convertible preferred stock being authorized, respectively. Upon completion of our IPO, our authorized capital stock consists of
1,600,000,000
shares of common stock, par value
$0.0001
per share, and
162,000,000
shares of preferred stock, par value
$0.0001
per share, all of which shares of preferred stock are undesignated.
On December 11, 2018, we completed our IPO, whereby we sold
26,275,993
shares of common stock at a price of
$23.00
per share. The aggregate net proceeds received by us from the IPO were
$563.0 million
, net of underwriting discounts and commissions of
$33.2 million
and offering expenses of
$8.1 million
payable by us. Upon the closing of the IPO, all of the outstanding shares of our redeemable convertible preferred stock were converted into
236,012,913
shares of the common stock.
9. Stock-Based Compensation
Equity Plans
In connection with the IPO, we adopted the 2018 Stock Option and Incentive Plan (the 2018 Equity Plan) in November 2018. The 2018 Equity Plan became effective on the date immediately prior to the effective date of the IPO and replaced our 2016 Stock Option and Grant Plan (the 2016 Equity Plan). The number of shares of common stock available for issuance under the 2018 Equity Plan was increased by
13.2 million
shares as a result of the automatic increase provision of the 2018 Equity Plan. As of
March 31, 2019
, we had a total of
72.4 million
shares reserved for future issuance under our Equity Plans, of which
17.9 million
shares were available for future grants.
35
Options
We have granted options generally through the 2018 Equity Plan and 2016 Equity Plan. The following table summarizes our option activity as of
March 31, 2019
:
|
Number of
Options
|
Weighted-
Average
Exercise
Price per
Share
|
Weighted-
Average
Grant
Date Fair
Value per
Share
|
Weighted-
Average
Remaining
Contractual
Term
|
Aggregate
Intrinsic
Value
(1)
(in thousands)
|
||||||||||
|
Outstanding at December 31, 2018
|
50,821,132
|
|
12.16
|
|
6.59
|
|
7.1 years
|
220,434
|
|
|||||
|
Granted
|
5,443,286
|
|
20.59
|
|
12.16
|
|
||||||||
|
Exercised
|
(5,525
|
)
|
9.62
|
|
5.62
|
|
||||||||
|
Canceled/forfeited
|
(2,987,612
|
)
|
14.29
|
|
8.48
|
|
||||||||
|
Outstanding at March 31, 2019
|
53,271,281
|
|
12.92
|
|
6.99
|
|
7.5 years
|
412,480
|
|
|||||
|
Exercisable at March 31, 2019
|
24,769,502
|
|
8.54
|
|
4.05
|
|
5.7 years
|
292,602
|
|
|||||
|
Vested and expected to vest at March 31, 2019
|
28,501,493
|
|
16.73
|
|
9.55
|
|
9.0 years
|
119,876
|
|
|||||
_______
(1)
Aggregate intrinsic value is calculated as the difference between the exercise price of the underlying options and the fair value of common stock for those options in the money as of
March 31, 2019
.
For
the three months ended
March 31, 2019
,
5,525
stock options were exercised. The total intrinsic value of options exercised was
$0.1 million
. The aggregate intrinsic value represents the difference between the exercise price and the selling price received by option holders upon the exercise of stock options during the period. The total consideration recorded as a result of stock option exercises was approximately
$0.1 million
for
the three months ended
March 31, 2019
.
Stock-based compensation for options granted is determined using the Black-Scholes option pricing model. The weighted-average assumptions used to estimate the fair value of the options granted for
the three months ended
March 31, 2019
and
2018
are as follows:
|
Weighted Average
|
||||||||
|
Three Months Ended March 31,
|
||||||||
|
2019
|
2018
|
|||||||
|
Risk-free interest rate
|
2.48
|
%
|
2.71
|
%
|
||||
|
Expected term
|
6.12 years
|
|
6.06 years
|
|
||||
|
Expected volatility
|
62
|
%
|
63
|
%
|
||||
|
Expected dividends
|
—
|
%
|
—
|
%
|
||||
|
Weighted average fair value per share
|
$
|
12.16
|
|
$
|
8.48
|
|
||
36
Restricted Common Stock
We have granted restricted stock awards generally through the 2016 Equity Plan. The following table summarizes our restricted stock activity during
the three months ended
March 31, 2019
:
|
Number of
Shares |
Weighted
Average
Grant Date
per Share
|
|||||
|
Outstanding, non-vested at December 31, 2018
|
198,597
|
|
$
|
12.15
|
|
|
|
Issued
|
—
|
|
—
|
|
||
|
Vested
|
(48,911
|
)
|
12.15
|
|
||
|
Canceled, forfeited and adjustments, net
|
711
|
|
12.15
|
|
||
|
Outstanding, non-vested at March 31, 2019
|
150,397
|
|
12.15
|
|
||
Restricted Common Stock Units
We have granted restricted stock awards generally through the 2018 Equity Plan and 2016 Equity Plan. The following table summarizes our restricted stock unit activity during
the three months ended
March 31, 2019
:
|
Units
|
Weighted-Average
Grant Date
per Unit
|
|||||
|
Outstanding, non-vested at December 31, 2018
|
458,715
|
|
$
|
11.93
|
|
|
|
Issued
|
558,208
|
|
20.77
|
|
||
|
Vested
(1)
|
14,334
|
|
11.93
|
|
||
|
Canceled/forfeited
|
(5,440
|
)
|
20.93
|
|
||
|
Pending settlement
(1)
|
(14,334
|
)
|
11.93
|
|
||
|
Outstanding, non-vested at March 31, 2019
|
1,011,483
|
|
16.76
|
|
||
_________
(1)
The vested restricted stock units will be settled for common stock on the date which is
360 days
after the consummation of the IPO.
Stock-Based Compensation Expense
The following table presents the components and classification of stock-based compensation expense for
the three months ended
March 31, 2019
and
2018
as follows (in thousands):
|
Three Months Ended
March 31, |
|||||||
|
2019
|
2018
|
||||||
|
Options
|
$
|
17,487
|
|
$
|
10,048
|
|
|
|
Restricted common stock and units
|
1,010
|
|
1,803
|
|
|||
|
Total
|
$
|
18,497
|
|
$
|
11,851
|
|
|
|
Research and development
|
$
|
10,783
|
|
$
|
7,356
|
|
|
|
General and administrative
|
7,714
|
|
4,495
|
|
|||
|
Total
|
$
|
18,497
|
|
$
|
11,851
|
|
|
37
As of
March 31, 2019
, there were
$253.1 million
of total unrecognized compensation cost related to unvested stock-based compensation with respect to options and restricted stock granted. That cost is expected to be recognized over a weighted-average period of
3.5 years
at
March 31, 2019
.
2018 Employee Stock Purchase Plan
In November 2018, we adopted the 2018 Employee Stock Purchase Plan (the ESPP), which became effective on December 5, 2018. The ESPP initially reserves and authorizes the issuance of up to a total of
810,000
shares of common stock to participating employees. We had not made any offerings as of
March 31, 2019
.
10. Income Taxes
We recognize deferred tax assets and liabilities for the expected future tax consequences of temporary differences between the financial reporting and tax bases of assets and liabilities. These differences are measured using the enacted statutory tax rates that are expected to be in effect for the years in which differences are expected to reverse. Valuation allowances are provided when the expected realization of deferred tax assets does not meet a “more likely than not” criterion. Realization of our deferred tax assets is dependent upon the generation of future taxable income, the amount and timing of which are uncertain. We continued to maintain a full valuation allowance against all of our deferred tax assets based on management’s evaluation of all available evidence.
There were no significant income tax provisions or benefits for the three months ended March 31, 2019 and 2018.
Upon adoption of ASC 606 (see Note 2), we recorded a cumulative-effect adjustment of
$28.0 million
to the opening balance of accumulated deficit as of January 1, 2019 with a decrease in deferred revenue of
$30.7 million
and a decrease in accounts receivable of
$2.7 million
. As a result of the cumulative decrease in deferred revenue, our corresponding deferred tax asset decreased by
$8.4 million
, which was offset by a corresponding decrease to our valuation allowance.
11. Net Loss per Share
Net Loss per Share Attributable to Common Stockholders
Basic and diluted net loss per share attributable to common stockholders for
the three months ended
March 31, 2019
and
2018
are calculated as follows (in thousands, except share and per share data):
|
Three Months Ended March 31,
|
|||||||
|
2019
|
2018
|
||||||
|
Numerator:
|
|||||||
|
Net loss
|
$
|
(132,657
|
)
|
$
|
(72,376
|
)
|
|
|
Cumulative dividends on redeemable convertible preferred stock
|
—
|
|
(3,481
|
)
|
|||
|
Net loss attributable to common stockholders
|
$
|
(132,657
|
)
|
$
|
(75,857
|
)
|
|
|
Denominator:
|
|||||||
|
Weighted average common shares used in net loss per share attributable to common stockholders, basic and diluted
|
328,809,986
|
|
65,430,835
|
|
|||
|
Net loss per share attributable to common stockholders, basic and diluted
|
$
|
(0.40
|
)
|
$
|
(1.16
|
)
|
|
38
The following common stock equivalents, presented based on amounts outstanding as of
March 31, 2019
and 2018 were excluded from the calculation of diluted net loss per share attributable to common stockholders for the periods indicated because their inclusion would have been anti-dilutive:
|
March 31,
|
|||||
|
2019
|
2018
|
||||
|
Redeemable convertible preferred stock
|
—
|
|
260,817,303
|
|
|
|
Stock options
|
53,271,281
|
|
43,135,998
|
|
|
|
Restricted common stock
|
150,397
|
|
729,877
|
|
|
|
Restricted common stock units
|
1,011,483
|
|
458,715
|
|
|
|
54,433,161
|
|
305,141,893
|
|
||
Item 2. MANAGEMENT’S DISCUSSION AND ANALYSIS OF FINANCIAL CONDITION AND RESULTS OF OPERATIONS
You should read the following discussion and analysis of our financial condition and results of operations together with our unaudited financial information and related notes included in this Form 10-Q and our consolidated financial statements and related notes and other financial information in our Annual Report on Form 10-K for the year ended December 31, 2018, which was filed with the SEC on March 13, 2019 and amended by Amendment No. 1 to our Annual Report on Form 10-K/A, which was filed with the SEC on April 25, 2019 (as amended, the "2018 Form 10-K"). Some of the information contained in this discussion and analysis or set forth elsewhere in this Form 10-Q, including information with respect to our plans and strategy for our business, includes forward-looking statements that involve risks and uncertainties. As a result of many factors, including those factors set forth in Part II, Item 1A - Risk Factors in this Form 10-Q, our actual results could differ materially from the results described in or implied by the forward-looking statements contained in the following discussion and analysis.
Overview
We are a clinical stage biotechnology company pioneering messenger RNA (mRNA) therapeutics and vaccines to create a new generation of potentially transformative medicines to improve the lives of patients. mRNA medicines are designed to direct the body’s cells to produce intracellular, membrane or secreted proteins that have a therapeutic or preventive benefit with the potential to address a broad spectrum of diseases. Our platform builds on continuous advances in basic and applied mRNA science, delivery technology and manufacturing, providing us the capability to pursue in parallel a robust pipeline of new development candidates. We are developing therapeutics and vaccines for infectious diseases, immuno-oncology, rare diseases, and cardiovascular diseases, independently and with our strategic collaborators. As we unlock the inherent advantages of mRNA, we aim to address as many diseases and impact as many patients as our technology, talent, and capital permit
We have a diverse development pipeline of
21
development candidates. Of these
21
development candidates,
11
are in various early stage clinical studies. The broad potential applications of mRNA medicines have led us to raise significant capital and adopt a long-term approach to capital allocation that balances near-term risks and long-term value creation. As of
March 31, 2019
, we had cash, cash equivalents, and investments of approximately
$1.5 billion
. We use this capital to fund operations and investing activities for technology creation, drug discovery and clinical development programs, infrastructure and capabilities to enable our research engine and early development engine (which includes our manufacturing facility in Norwood), our digital infrastructure, creation of our portfolio of intellectual property, and administrative support.
Since our inception, we have incurred significant operating losses. Our net losses were $384.7 million and $255.9 million for the years ended December 31, 2018 and 2017, respectively. Our net loss was
$132.7 million
for
the three months ended
March 31, 2019
. As of
March 31, 2019
, our accumulated deficit was
$1.1 billion
. We expect to continue to incur significant expenses and operating losses for the foreseeable future.
In addition, we anticipate that our expenses will increase significantly in connection with our ongoing activities, as we:
|
•
|
continue our platform research and drug discovery and development efforts;
|
|
•
|
conduct clinical studies for our investigational medicines;
|
|
•
|
manufacture clinical study materials and develop large-scale manufacturing capabilities;
|
39
|
•
|
seek regulatory approval for our investigational medicines;
|
|
•
|
maintain, expand, and protect our intellectual property;
|
|
•
|
hire additional personnel to support our program development effort to obtain regulatory approval and secure additional facilities for operations; and
|
|
•
|
operate as a public company.
|
We do not expect to generate revenue from the sale of potential mRNA medicines unless and until we successfully complete clinical development and obtain regulatory approval for one or more of our investigational medicines. If we seek to obtain regulatory approval for and commercialize any of our investigational medicines, we expect to incur significant commercialization expenses.
As a result, we will need substantial additional funding to support our continued operations and pursue our growth strategy. Until we can generate significant revenue from sales of our medicines, if ever, we expect to finance our operations through a combination of public or private equity offerings and debt financings, government funding arrangements, strategic alliances and marketing, distribution, and licensing arrangements. We may be unable to raise additional funds or enter into such other agreements on favorable terms, or at all. If we fail to raise capital or enter into such agreements as, and when, needed, we may have to significantly delay, scale back, or discontinue the development and commercialization of one or more of our programs.
Because of the numerous risks and uncertainties associated with pharmaceutical development, we are unable to predict the timing or amount of increased expenses or when or if we will be able to achieve or maintain profitability. Even if we are able to generate revenues from the sale of our medicines, we may not become profitable. If we fail to become profitable or are unable to sustain profitability on a continuing basis, then we may be unable to continue our operations at planned levels and be forced to reduce our operations.
Our Pipeline
This section describes the pipeline that has emerged thus far from the combination of our strategy, our platform, our infrastructure, and the resources we have amassed.
We have
21
development candidates in our pipeline, with
11
in various early stage clinical studies on three different continents. Over 1,000 subjects have been enrolled in our clinical trials since December 2015. Our diverse pipeline comprises programs across six modalities and a broad range of therapeutic areas. A modality is a group of potential mRNA medicines with shared product features, and the associated combination of mRNA technologies, delivery technologies, and manufacturing processes. Aspects of our pipeline have been supported through strategic alliances, including with AstraZeneca, Merck, and Vertex, and government-sponsored organizations and private foundations focused on global health initiatives, including BARDA, DARPA, and the Bill & Melinda Gates Foundation.
Our pipeline is shown below in two formats, with a cell map illustrating the diversity of biology addressed by our mRNA pipeline programs, and a traditional format that shows the current stages of development of our pipeline programs. We believe the
21
programs in our pipeline represent only an initial wave of potential development candidates, and that our platform over time may yield both multiple new programs within our existing modalities and the potential for multiple programs in new modalities.
40

41
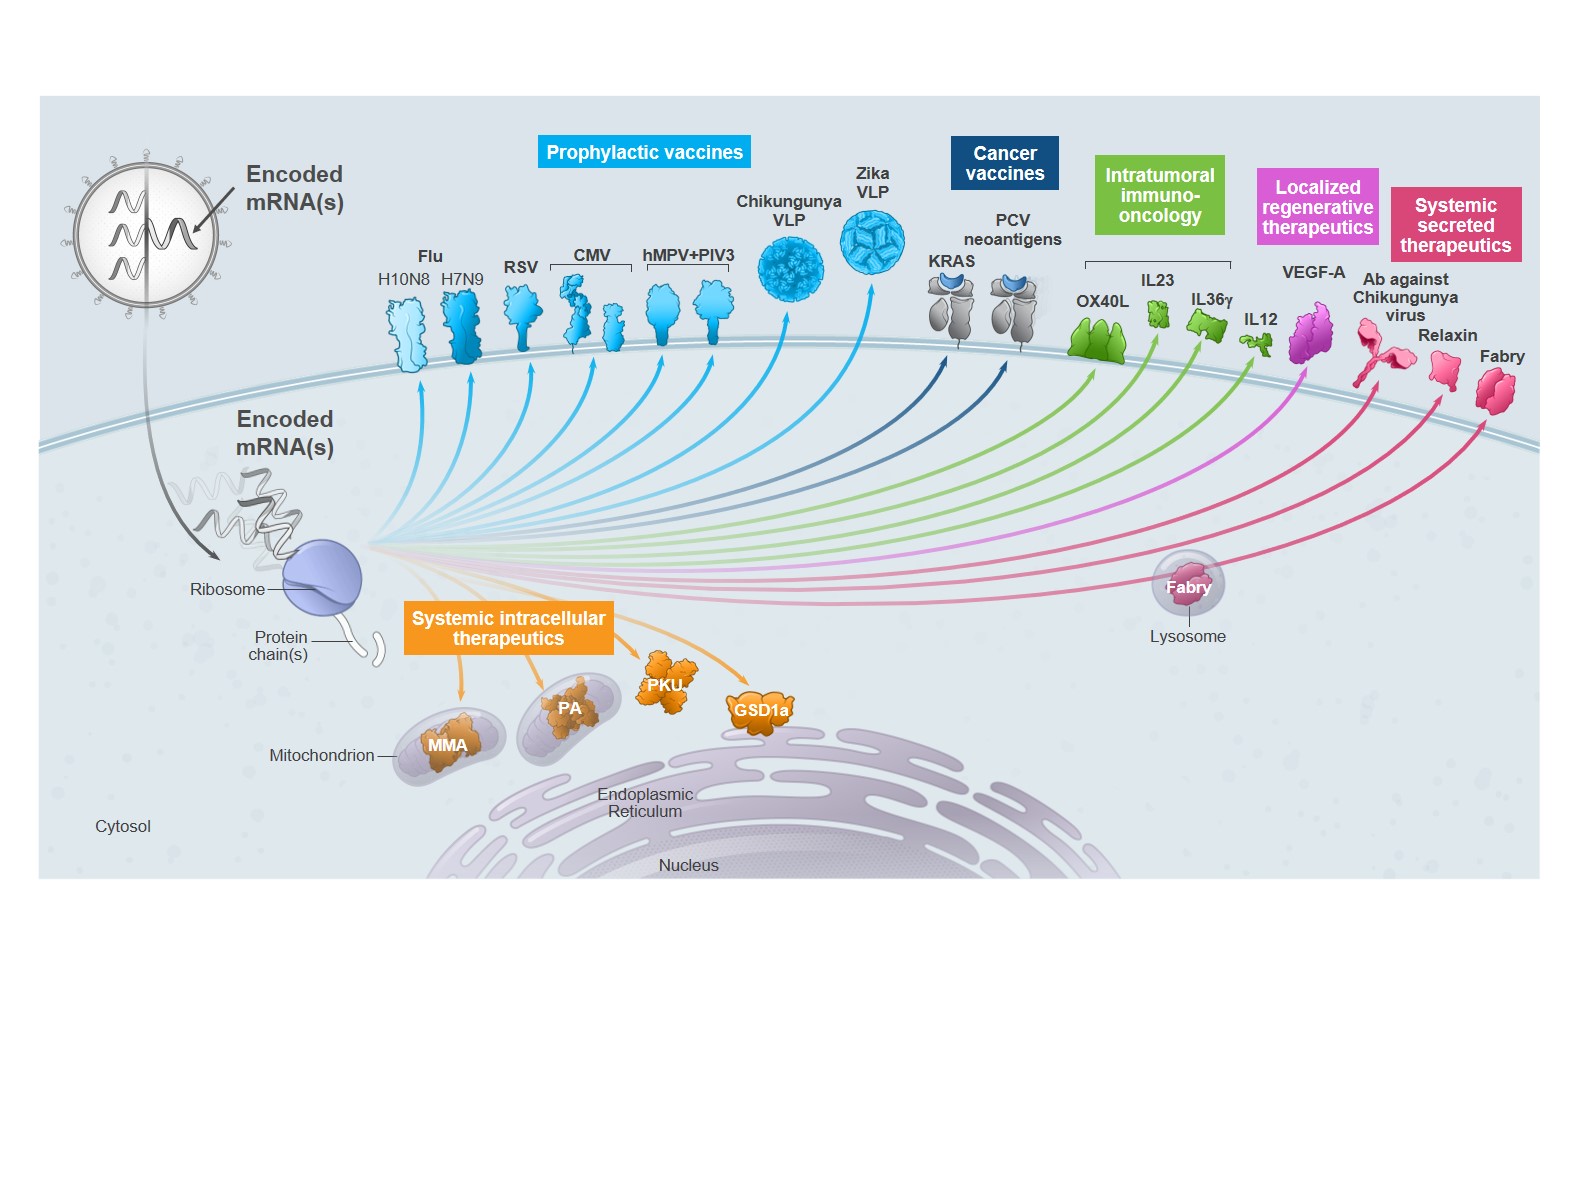
We have developed six modalities. We have
11
programs that have reached clinical trials and a total of
21
development candidates, summarized by modality as follows:
|
•
|
Prophylactic vaccines
included eight development candidates: RSV vaccine (mRNA-1777 and mRNA-1172), CMV vaccine (mRNA-1647), hMPV+PIV3 vaccine (mRNA-1653), H10N8 vaccine (mRNA-1440), H7N9 vaccine (mRNA-1851), Zika vaccine (mRNA-1893), and Chikungunya vaccine (mRNA-1388). We currently have six programs for which the Phase 1 trial is either ongoing or has been completed;
|
|
•
|
Cancer vaccines
included two development candidates: Personalized cancer vaccine, or PCV, (mRNA-4157) and KRAS vaccine (mRNA-5671). We are collaborating with Merck on both programs. PCV is in a Phase 1 clinical trial and we and Merck have submitted a protocol to the U.S. Food and Drug Administration (FDA) for a randomized Phase 2 clinical trial of mRNA-4157, and the KRAS vaccine has an open investigational new drug application (IND) ;
|
|
•
|
Intratumoral immuno-oncology
included three development candidates: OX40L (mRNA-2416), OX40L+IL23+IL36γ (Triplet) (mRNA-2752), and IL12 (MEDI1191). The OX40L and OX40L+IL23+IL36γ programs are currently in Phase 1 clinical trials and the IND for a Phase 1 clinical trial of IL12 is open;
|
|
•
|
Localized regenerative therapeutics
included one development candidate, VEGF-A (AZD8601). The program is being led by AstraZeneca through clinical development and is in a Phase 2a clinical trial;
|
|
•
|
Systemic secreted therapeutics
included three development candidates: antibody against Chikungunya virus (mRNA-1944), Relaxin (AZD7970), and Fabry disease (mRNA-3630). The antibody against Chikungunya virus
|
42
development candidate is in collaboration with DARPA and the program is in a Phase 1 clinical trial. The Relaxin program in collaboration with AstraZeneca and the Fabry disease program are both in preclinical development; and
|
•
|
Systemic intracellular therapeutics
included four development candidates: MMA (mRNA-3704), PA (mRNA-3927), PKU (mRNA-3283), and GSD1a (mRNA-3745). The MMA program has an open IND, and the PA, PKU, and GSD1a programs are in preclinical development.
|
Since reporting on the quarter ended December 31, 2018, we reported the following updates for our development candidates:
|
•
|
RSV vaccine (mRNA-1777 and mRNA-1172):
Merck has filed an IND with the FDA and plans to run a Phase 1 study for a follow-on development candidate (mRNA-1172), a vaccine for RSV which has shown enhanced potency in preclinical studies and uses a Merck proprietary formulation. As a result, further development of mRNA-1777 has been paused and next steps will be determined based on data from the new mRNA-1172 Phase 1 study.
|
|
•
|
CMV vaccine (mRNA-1647):
The first three dose levels in our ongoing study of mRNA-1647 are fully enrolled, and the study is currently enrolling subjects into the fourth (300 µg) dose cohort. The Phase 1 study is randomized, observer-blind and placebo-controlled with the goal of evaluating the safety and immunogenicity of mRNA-1647, a vaccine against the pentamer and gB complexes of CMV.
|
|
•
|
VZV vaccine (mRNA-1278):
Merck has discontinued preclinical development of mRNA-1278, an investigational vaccine for VZV (the virus that causes shingles). Merck has returned rights to us, and we will not continue development at this time
|
|
•
|
Antibody against Chikungunya virus (mRNA-1944):
We completed enrollment of the second dose level cohort (0.3 mg/kg, 8 subjects) in the Phase 1 trial of mRNA-1944 in healthy adults.
|
|
•
|
Propionic acidemia (PA) (mRNA-3927):
The European Commission has adopted the recommendation from the Committee for Orphan Medicinal Products for orphan drug designation for mRNA-3927, a development candidate for propionic acidemia (PA).
|
|
•
|
Glycogen storage disease type 1a (GSD1a) (mRNA-3745):
We designated mRNA-3745 as a new development candidate for the rare inherited metabolic disease GSD1a. Please refer to the section of this Form 10-Q entitled “Overview-New Development Candidate in our Systemic Intracellular Therapeutics Modality” for the program description for mRNA-3745.
|
Update to a Development Candidate in our Prophylactic Vaccines Modality
RSV vaccine (mRNA-1777 and mRNA-1172): Summary
Our strategic collaborator Merck has determined to pursue a Phase 1 study with an improved RSV antigen and a proprietary Merck
formulation before conducting a Phase 2a study
Respiratory syncytial virus ("RSV") is one of the most common causes of respiratory disease in infants and the elderly. More than 86,000 children and about 177,000 older adults are hospitalized due to RSV associated respiratory infections each year in the United States. To date, no effective vaccine to prevent RSV has been approved, and the only approved prophylaxis treatment is limited to the monoclonal antibody palivizumab, marketed as Synagis in the United States for pediatric patients at high risk for RSV infection. In collaboration with Merck, we designed mRNA-1777 to encode a membrane-anchored version of stabilized prefusion F protein, the main target of potently neutralizing and protective antibodies. This vaccine is administered as a single dose with no boost. The Phase 1 trial is currently ongoing in Australia, for which we are the sponsor.
Our strategic collaborator, Merck, has submitted an IND for a Phase 1 trial of a second mRNA vaccine (mRNA-1172). In preclinical models, the new development candidate, which uses a proprietary Merck formulation, demonstrated enhanced potency over mRNA-1777. Following the first Phase 1 study with mRNA-1172, we and Merck will determine whether to pursue further clinical development.
RSV vaccine (mRNA-1777 and mRNA-1172): Disease overview
RSV impacts young children and older adults, and no approved vaccine exists today
RSV causes upper and lower respiratory tract illness worldwide and is transmitted primarily via contamination of environmental surfaces with infectious secretions, or possibly also via aerosolized droplets from an infected person. Following introduction of RSV into the nose or upper respiratory tract, the virus replicates primarily in the ciliated cells of the respiratory epithelium. Upper respiratory symptoms typically begin within several days of exposure. In healthy adults, the infection may remain confined to the
43
upper respiratory tract. However, in those with compromised immune systems, such as premature infants, the elderly, or individuals with underlying respiratory disease, lower respiratory tract infections commonly occur and may manifest as wheezing, bronchiolitis, pneumonia, hospitalization or even death. Infections with RSV follow a seasonal pattern, occurring primarily in the Northern hemisphere between the months of November and April, and in the Southern hemisphere primarily between March and October.
More than 86,000 children are hospitalized due to RSV infection each year in the United States. About 177,000 older adults are hospitalized each year in the United States due to RSV-associated respiratory infections, with approximately 14,000 deaths as a result. RSV infection is common in adults over the age of 60 years, occurring in an average of 5.5% of older adults every season and resulting in physician’s visits for 17% of infected older adults. The cost of RSV disease to society can be considerable.
RSV vaccine (mRNA-1777 and mRNA-1172): Our product concept
Prevent RSV infections with an improved RSV antigen using a single vaccine dose
Our RSV development candidates, mRNA-1777 and mRNA-1172, include an mRNA encoding an engineered form of the RSV fusion (F) glycoprotein stabilized in the prefusion conformation in an LNP. The F protein is present as a homotrimer on the surface of RSV. The prefusion conformation of the F protein interacts with a host cell membrane, and the conformational change from prefusion to postfusion drives virus fusion with a host cell. The majority of RSV-specific neutralizing antibodies in convalescent people are directed to epitopes present only on the prefusion conformation of the F protein. The prefusion state of the F protein elicits a superior neutralizing antibody response compared to the postfusion state in animal studies conducted by others. A schematic of the prefusion F protein on the surface of a host cell, with sites recognized by neutralizing antibodies, is depicted in the figure below; the inset on the left of the figure shows the intended design of the mRNA formulated in LNP, and the inset on the right shows the intended prefusion F protein on the surface of the cell. We believe that neutralizing antibodies elicited by our RSV development candidates may lead to an efficacious RSV vaccine.
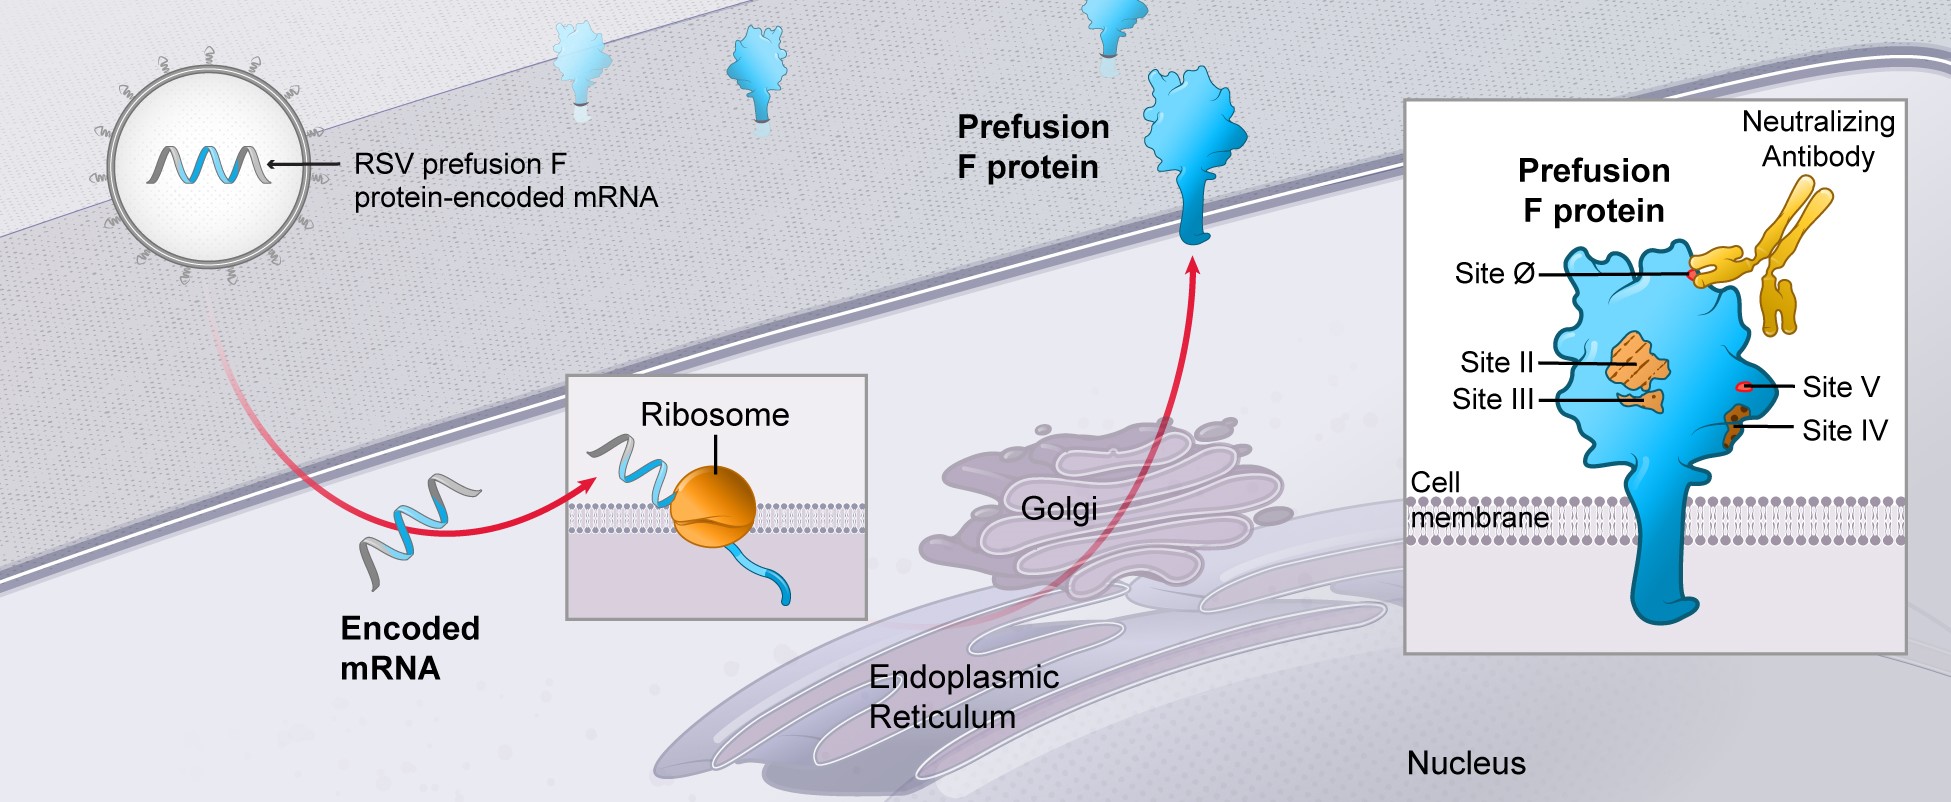
RSV vaccine (mRNA-1777 and mRNA-1172): Preclinical information
mRNA vaccines encoding different versions of the prefusion F protein have been evaluated in mice, cotton rats, and African green monkeys ("AGM"). These studies demonstrate that mRNA vaccines encoding the prefusion F protein induce robust neutralizing antibody titers in preclinical species tested, do not lead to vaccine-enhanced respiratory disease (evaluated in cotton rats), and are protective against RSV challenge (evaluated in cotton rats and AGM). The data for a study in AGM are shown in the figure below. In this study, one group of AGM (4 per group) was vaccinated intramuscularly with vaccine, a second group was infected with 5.5 log
10
plaque forming units, or pfu, of RSV strain A2 intranasally as a positive control, and a third group received no vaccine as a negative control, each on weeks 0, 4, and 8. Serum neutralizing antibody titers, or SN titers, were measured on the indicated weeks and are shown in panel A. All animals were challenged intranasally and intratracheally on study week 10. On multiple time points after the challenge, virus present in bronchoalveolar lavage, or BAL, fluid was quantified by plaque assay as shown in panel B. In this study, we observed an increase in serum neutralizing titers with each vaccine dose. The animals that received mRNA-1777 showed complete protection (no virus detected) in lungs, similar to the control group immunized with RSV A2. These results are shown in the figures below.
44
Serum neutralizing titers for mRNA-1777 in non-human primate study
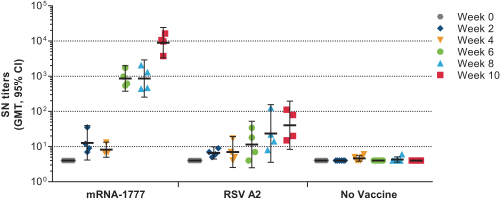
Panel (A)
Lung viremia detected post challenge in non-human primate study with mRNA-1777
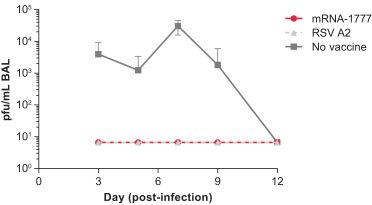
Panel (B)
Recent studies in cotton rats and AGM demonstrate immunogenicity of mRNA-1172. The data for a study in AGM are shown below. In this study, two groups of AGM (4 per group) were vaccinated intramuscularly with the same dose level (µg) of vaccine, a fifth group was infected with 5.5 log
10
plaque forming units, or pfu, of RSV strain A2 intranasally as a positive control, and a sixth group received no vaccine as a naïve control, each on weeks 0, 4, and 8. Serum neutralizing antibody titers were measured on the indicated weeks and are shown in panel C. In this study, mRNA-1172 was shown to be significantly more potent than mRNA-1777.
45
Serum neutralizing titers for mRNA-1172 and mRNA-1777 in non-human primate study
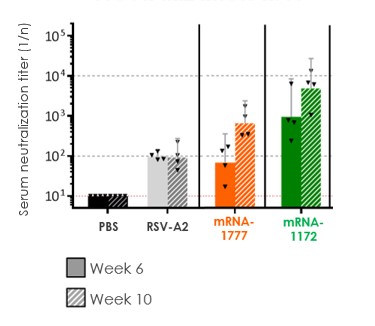
Panel (C)
RSV vaccine (mRNA-1777 and mRNA-1172): Clinical data
Merck has submitted an IND for mRNA-1172 and plans to conduct a Phase 1 trial for mRNA-1172, data from which will be used to inform planning of a Phase 2a trial for our RSV vaccine
The Phase 1 trial for mRNA-1777 has met its objectives of assessing its safety and tolerability profile versus placebo including capturing solicited and unsolicited local and systemic adverse events. The Phase 1 trial for mRNA-1777 has also demonstrated immunogenicity and we have observed a humoral immune response as measured by neutralizing antibody titers against RSV A for dose levels one, two, and three of mRNA-1777. Based on the interim data and other considerations, Merck will not advance mRNA-1777 into Phase 2a at this time.
The mRNA-1777 Phase 1 study is a randomized, partially double-blind, placebo-controlled, dose-escalation first-in-human study to describe the safety, tolerability, and immunogenicity in healthy adult subjects in Australia. We are the sponsor for this trial. The study evaluated three dose levels in healthy younger adults, and 4 dose levels in healthy older adults. All subjects were given a single intramuscular injection. The key objectives of the study included:
|
•
|
assess the safety and tolerability of mRNA-1777 versus placebo; and
|
|
•
|
determine the immunogenicity of mRNA-1777 by measuring serum neutralizing antibody titers against RSV.
|
The key endpoints for the study included safety and tolerability of mRNA-1777.
The study is being conducted in two parts. Part A evaluates healthy younger subjects (ages
>
18 and
<
49 years) and Part B evaluates healthy older subjects (ages
>
60 and
<
79 years). There are four dose levels, where the highest dose, or dose four, is twelve times the lowest dose, or dose one, and dose three, the second highest dose, is eight times the lowest dose. In Part A, dose levels one, two, and three are being evaluated. In Part B, all four dose levels are being evaluated. The first sentinel dose cohort was triggered after review of the first sentinel dose level cohort in Part A. For both Parts A and B, the safety data from the sentinel safety group for each dose level cohort was reviewed before permitting enrollment of the expansion group within that dose level cohort and the safety data of each expansion group was reviewed before permitting dose escalation/enrollment of the sentinel safety group at the next dose level. Part B includes the highest dose level, dose four, which was enrolled after review of the available safety and immunogenicity data of the preceding Part B dose level cohorts. Expansion groups in Part A and B were both randomized 3:1 mRNA-1777: placebo.
This 200-subject study is fully enrolled and all subjects have been dosed. As of April 9, 2018, we have the majority of data through three months (90 days) post-vaccination for younger subjects in dose levels one and two, and for older subjects in dose levels one, two, and three. Based on the interim data as of April 2018, dose levels one, two, and three of mRNA-1777 were observed to elicit a humoral immune response as measured by neutralizing antibody titers against RSV A, neutralizing antibody titers against RSV B (dose level three only, dose levels one and two have yet to be assayed), absolute serum antibody titers to RSV prefusion F protein and
46
RSV postfusion F protein, and competing antibody titers to RSV prefusion F protein in a dose-dependent manner up to dose level two in both younger and older subjects. The immune response measured by neutralizing antibody titers against RSV A in older adults that received dose level three of mRNA-1777 was not higher than that of the subjects that received dose level two. We have observed an increase in neutralizing antibody titers relative to placebo in younger adult subjects in panel A and older adult subjects in panel B who received our RSV vaccine, as shown in the figure below. In the figure, geometric mean titer and 95% confidence interval are depicted by time for neutralizing antibody titers against RSV A for older and younger subjects. At day ninety, between 10 and 19 healthy younger subjects and between 11 and 27 healthy older subjects were tested at each dose level.
Neutralizing antibody titers in healthy younger subjects
[Ages
>
18 and
<
49 years] in Phase 1 trial for mRNA-1777 per protocol set
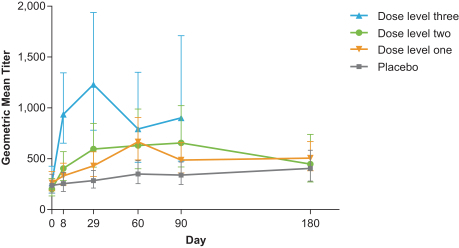
Panel (A)
Neutralizing antibody titers in healthy older subjects
[Ages
>
60 and
<
79 years] in Phase 1 trial for mRNA-1777 per protocol set
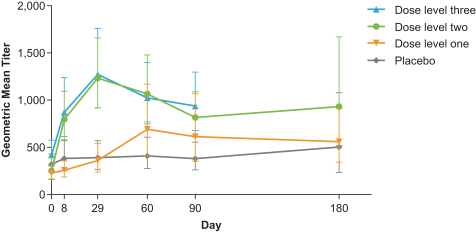
Panel (B)
In addition, based on interim data as of April 2018, we observed an increase in T cell response relative to baseline at day 15 and day 60 in both healthy younger and healthy older adult subjects vaccinated with dose levels two and three of mRNA-1777.
Based on interim safety data as of April 9, 2018, mRNA-1777 was well tolerated with no dose limiting toxicities at dose levels one, two, and three in both the younger and older adults. As of September 2018, the highest dose level, which was evaluated in older subjects only, dose level four, was not as well tolerated as the lower dose levels. However, across all treatment arms, there were no treatment-related serious adverse events, or SAEs, treatment emergent adverse events, or TEAEs, leading to withdrawals, adverse events, or AEs of special interest, or new onset of chronic illnesses or autoimmune disorders in either of the age cohorts. There were no patterns in clinically significant laboratory abnormalities.
47
As of September 19, 2018, we have observed 15 SAEs in nine subjects, all of which were deemed unrelated to study product. These SAEs occurred approximately one to ten months from receipt of study product and included aortic aneurysm repair, paralytic ileus, spinal decompression, death from pre-existing cardiomyopathy, hernia, transient ischemic attack, peripheral vascular disorder, vasovagal syncope, diagnosis of non-small cell lung cancer, anterior cruciate ligament tear, left knee tendon tear, right knee tendon tear, left patella dislocation, right patella dislocation, and bilateral patella tendon repair.
The trial is ongoing and, consistent with the study protocol, we remain blinded to treatment at the individual subject level and continue to collect safety, tolerability, and immunogenicity data through day 365 of the study. In parallel, Merck plans to conduct a Phase 1 trial for mRNA-1172, data from which will be used to inform planning of a possible Phase 2a trial for the RSV vaccine. Merck submitted the IND for mRNA-1172 in May 2019.
New Development Candidate in our Systemic Intracellular Therapeutics Modality
Glycogen storage disease type 1a (mRNA-3745): Summary
Our approach to glycogen storage disease type 1a using an mRNA encoding for intracellular human glucose 6-phosphatase
Glycogen storage disease type 1a ("GSD1a") is an inherited metabolic disease caused by the deficiency in the catalytic activity of glucose 6-phosphatase (“G6Pase”), which is encoded by the glucose 6-phosphatase gene (“G6PC”). The G6Pase enzyme is involved in the metabolic pathways of glycogenolysis and gluconeogenesis which allow the liver and kidney to release glucose into the blood. Those affected by GSD1a present with life-threatening hypoglycemia and a wide range of severe metabolic derangements and long-term complications such as hyperlipidemia, lactic acidemia, hepatomegaly, hepatocellular adenomas, and end-stage renal disease. The standard of care consists of strict diet control. Enzyme replacement therapy (“ERT”) is not an option for these patients due to challenges associated with delivering an enzyme inside the cell. Strict diet control via the frequent consumption of uncooked cornstarch is effective in improving hypoglycemia. However, the underlying pathologies continue and its efficacy in preventing the long-term metabolic complications has yet to be established. With our mRNA platform, cells in the liver may be instructed to produce functional G6Pase, with the goal of restoring the homeostasis of glycogenolysis and gluconeogenesis pathways and correcting the underlying pathologies. We are developing an intravenously administered mRNA which encodes for G6Pase and is encapsulated in our proprietary lipid nanoparticle ("LNP"). We have demonstrated activity in mouse models in the form of reduction in both liver and serum biomarkers and improvements in liver morphology. We plan to conduct a Phase 1 clinical trial for mRNA-3745.
Glycogen storage disease type 1a (mRNA-3745): Disease overview
There are no approved therapies for GSD1a that address the enzymatic deficiency
GSD1a is an inherited metabolic disorder caused by a deficiency in the catalytic activity of G6Pase, an enzyme encoded by G6PC gene and involved in two metabolic pathways associated with glucose homeostasis. G6Pase catalyzes the hydrolysis of glucose-6-phosphate to glucose and inorganic phosphate, the final step of glycogenolysis and gluconeogenesis that mainly takes place in liver and kidney. GSD1a patients suffer from severe fasting hypoglycemia, hepatomegaly, nephromegaly, lactic acidemia, hypertriglyceridemia, hyperuricemia, hypercholesterolemia, hepatic steatosis, and growth retardation. In addition, hepatocellular adenomas occur in 70% to 80% of GSD1a patients by their third decade of life and carries risk of transformation into hepatocellular carcinomas. Proteinuria has been observed in over half of patients above 25 years of age.
GSD1a occurs in approximately 1:100,000 live births in the United States and European Union but is more common in Ashkenazi Jews where the incidence is reported to be 1:20,000 live births. There are an estimated 2,500 people in the United States and over 4,000 people in the European Union with GSD1a. Although strict diet therapy, including frequent feeding with uncooked cornstarch, allows GSD1a patients to live into adulthood by preventing hypoglycemia, the underlying pathological processes remain uncorrected resulting in the development of many long-term complications including liver adenomas and hepatocellular carcinoma.
One option for GSD1a patients may be treatment with gene therapy. We believe there are potential advantages for mRNA therapeutics for this disorder over gene therapy.
Glycogen storage disease type 1a (mRNA-3745): Our product concept
We intend to utilize the cells in the human body to produce G6Pase intracellularly
We believe that our platform can address GSD1a with its ability to instruct cells in the human body to produce complex functional intracellular membrane proteins such as G6Pase. Our program, mRNA-3745, consists of an mRNA encoding for modified human G6Pase encapsulated in our proprietary LNPs. The human G6Pase sequence is modified for improved protein production and G6Pase
48
activity. mRNA-3745 is designed to be administered intravenously and encodes G6Pase protein to restore this deficient or defective enzyme as illustrated in the figure below.
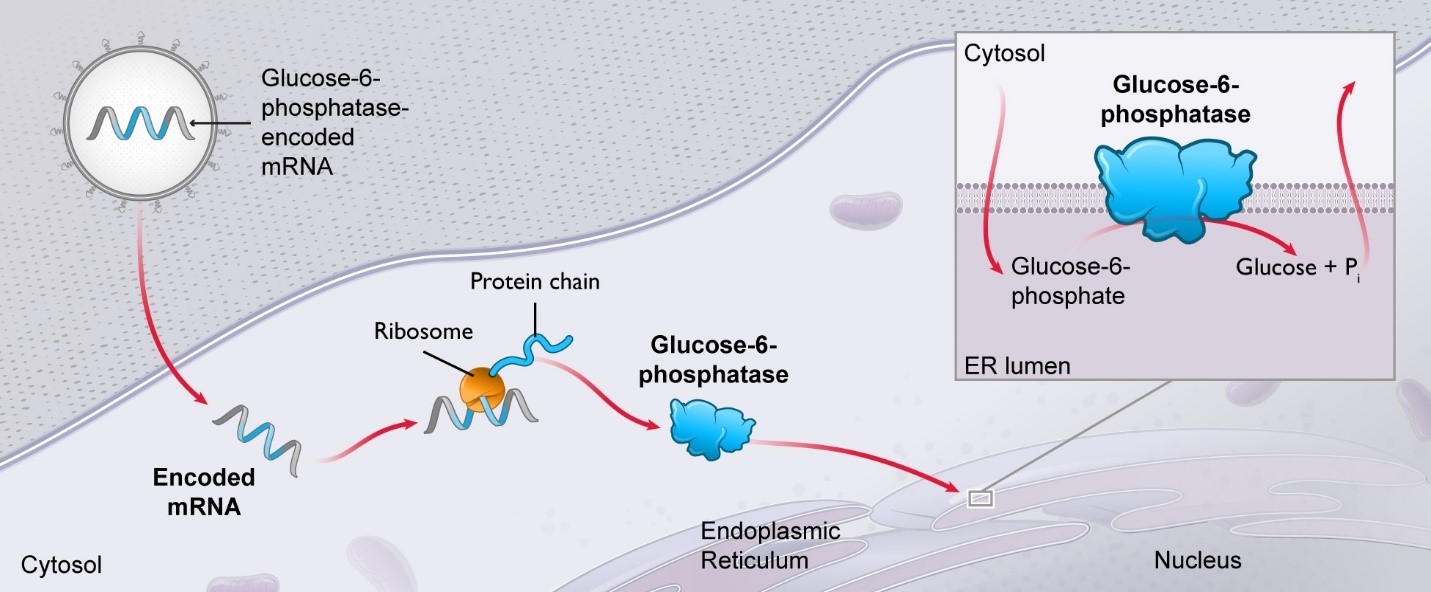
Glycogen storage disease type 1a (mRNA-3745): Preclinical information
We have demonstrated the ability to improve hypoglycemia and other metabolic abnormalities associated with GSD1a in a mouse model
We have conducted several in vitro and in vivo pharmacology studies to demonstrate preclinical proof-of-concept for GSD1a therapy. mRNA encoding for G6Pase introduced in human cells resulted in robust production of active G6Pase with subcellular localization into endoplasmic reticulum. We have examined the activity of mRNA encoding for human G6Pase in a liver-specific G6Pase -/- mouse model (G6PC.LKO). Like GSD1a patients, the G6PC.LKO mice are unable to produce endogenous glucose, leading to severe hypoglycemia during the fasting state.
In a dose-response study performed in G6PC.LKO mice, we treated the mice with three different doses of 0.2, 0.5, and 1 mg/kg of G6Pase mRNA encapsulated in our proprietary LNP and examined fasting glucose, serum triglycerides, and liver enzymes (n=5-8). Of note, mice treated with G6Pase mRNA showed a dose-dependent improvement in fasting glycemia and a reduction in serum triglycerides, without a significant increase in liver enzymes (e.g. alanine transaminase – ALT). Fasting blood glucose and triglycerides are shown in the figure below. Each bar represents the mean ± standard deviation. Single and double asterisk denotes p < 0.05 and p < 0.0001, respectively, by one-way ANOVA, followed by Dunnett’s post-hoc test for multiple comparisons.
Serum biomarkers after single dose of G6Pase mRNA in G6PC.LKO mice
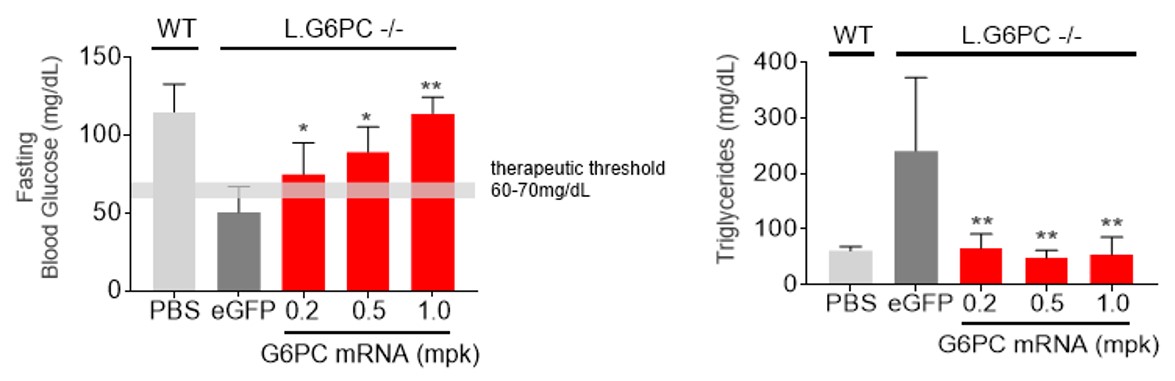
49
In the same study, a reduction in liver weight compared to the control-treated group was observed after 24 hours of administration of G6Pase encoded mRNA in LNP. The reduction in liver weight was associated with significant improvement in liver morphology presumably due to reduction in liver glucose 6-phosphate, glycogen, and triglycerides.
Reduction in liver weight 24 hours after IV administration of G6Pase mRNA in G6PC.LKO mice
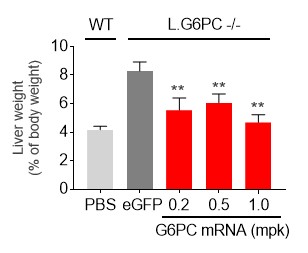
In addition, data for a 7-week repeat-dose study in G6PC.LKO mice receiving G6Pase mRNA in LNP at 0.25 mg/kg IV every other week have shown a pronounced improvement in fasting glycemia, in comparison with the G6PC.LKO mice receiving a control mRNA treatment as shown below (n=7-9).
Restoration of blood glucose above therapeutic threshold with repeat dosing of G6Pase mRNA in G6PC.LKO mice
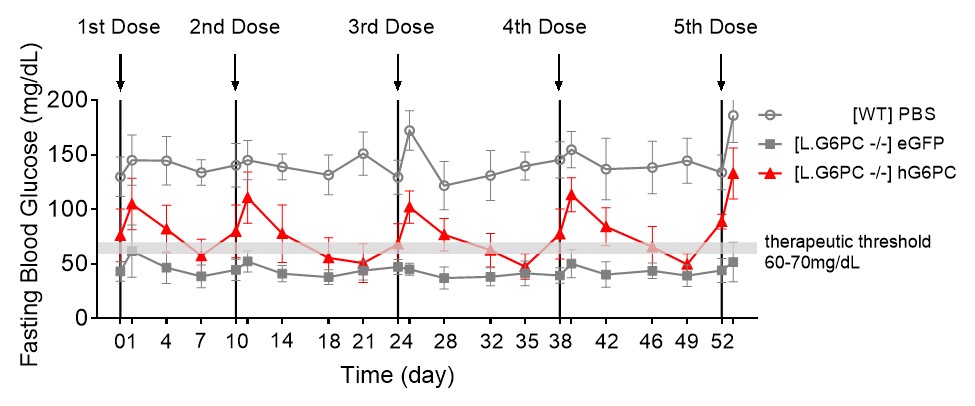
Glycogen storage disease type 1a (mRNA-3745): Clinical plan
We are planning a Phase 1 clinical trial
We plan to conduct an open-label, dose escalation Phase 1 study of mRNA-3745 in adolescent and adult patients with GSD1a in the United States. The objectives of this study are to evaluate the safety and tolerability of mRNA-3745, to assess the pharmacodynamic response through changes in maintenance of euglycemia, and to characterize the pharmacokinetic profile of mRNA-3745.
50
Third-Party Strategic Alliances
Merck (NYSE: MRK)—Strategic Alliances in Infectious Diseases
We have established a multi-faceted relationship with Merck that includes distinct strategic alliances directed to the research, development, and commercialization of mRNA medicines for the prevention of viral infections and for the treatment of cancer.
2015 Strategic Alliance with Merck-Infectious Disease
In January 2015, we entered into a Master Collaboration and License Agreement with Merck, which was amended in January 2016, June 2016, and May 2019, and which we refer to, as amended, as the 2015 Merck Agreement. Pursuant to the 2015 Merck Agreement, we and Merck have agreed to research, develop, and commercialize potential mRNA medicines for the prevention of infections by RSV. Pursuant to the 2015 Merck Agreement, Merck is primarily responsible for research, development, and commercialization activities and associated costs of such research and commercialization. We are responsible for designing and manufacturing all mRNA constructs for preclinical and Phase 1 and Phase 2 clinical development purposes, and Merck pays us for such manufacture, and we are responsible for certain costs associated with the conduct of a Phase 1 clinical trial for an RSV vaccine product candidate (mRNA-1172). Responsibility for manufacturing mRNA constructs for late stage clinical development and commercialization purposes is to be determined.
The 2015 Merck Agreement includes a three-year period, expected to end on January 12, 2022, during which Merck may continue to preclinically and clinically develop RSV vaccine product candidates that arose during an initial four-year research period which terminated in January 2019. Merck may, prior to the end of this three-year period, elect to exclusively develop and commercialize up to five RSV vaccine product candidates.
We and Merck have agreed to certain defined exclusivity obligations during the term of the 2015 Merck Agreement with respect to potential mRNA medicines against RSV infection. As part of the May 2019 amendment of the 2015 Merck Agreement, these exclusivity obligations do not restrict Moderna from researching, developing, and commercializing a potential mRNA medicine for the prevention of a specific set of respiratory infections, including RSV, for the pediatric population.
Under the terms of the 2015 Merck Agreement, we received a $50.0 million upfront payment. We are eligible to receive, on a product-by-product basis, up to $300.0 million in aggregate milestone payments upon the achievement of certain development, regulatory, and commercial milestone events. To date, we have received from Merck a clinical milestone payment of $5.0 million with respect to the initiation of a Phase 1 clinical trial for a Merck RSV vaccine product candidate. In addition, under the terms of the 2015 Merck Agreement, we are eligible to receive an additional milestone payment unless Merck elects not to continue with further clinical development of mRNA-1172. On a product-by-product basis, we are also entitled to receive royalties on Merck’s net sales of products at rates ranging from the mid-single digits to low teens, subject to certain reductions, with an aggregate minimum floor. Additionally, concurrent with entering into the 2015 Merck Agreement in 2015, Merck made a $50.0 million equity investment in us, and concurrent with amending the 2015 Merck Agreement in January 2016, we received an upfront payment of $10.0 million from Merck.
Unless earlier terminated, the 2015 Merck Agreement will continue on a product-by-product and country-by-country basis for so long as royalties are payable by Merck on a given product in a given country. Either party may terminate the 2015 Merck Agreement upon the other party’s material breach, either in its entirety or with respect to a particular program, product candidate, product or country, subject to specified notice and cure provisions. Merck may terminate the 2015 Merck Agreement in full or with respect to a particular product candidate or product upon certain advance notice to us for any reason, or earlier if Merck determines the alliance or product is no longer commercially practicable. If Merck has the right to terminate the 2015 Merck Agreement, in its entirety or with respect to a program, product candidate or product, for our material breach, then Merck may elect, in lieu of terminating the 2015 Merck Agreement, to have the 2015 Merck Agreement remain in effect, subject to reductions in certain payments we are eligible to receive with respect to the terminable rights. Upon a termination of the 2015 Merck Agreement with respect to a program, all licenses and other rights granted to Merck with respect to such program will terminate and the continued development and commercialization of product candidates and products will revert to us. If the 2015 Merck Agreement is terminated with respect to a given product candidate or product, all licenses and other rights granted to Merck with respect to such product candidate or product will terminate and, to the extent we terminated for Merck’s breach, Merck will grant us licenses under select Merck technology for our continued development and commercialization of such product candidate or product. As a part of the May 2019 amendment of the 2015 Merck Agreement, we and Merck agreed to and conclude the collaboration as it relates to development of potential mRNA medicines for other viruses, including mRNA-1278 for the prevention of VZV infection.
51
Financial Operations Overview
Revenue
To date, we have not generated any revenue from the sale of potential mRNA medicines. Our revenue has been primarily derived from strategic alliances with Merck, Vertex and AstraZeneca, and from contracts with government-sponsored and private organizations including DARPA, BARDA, and the Bill & Melinda Gates Foundation, to discover, develop, and commercialize potential mRNA medicines. On January 1, 2019, we adopted Accounting Standards Codification (ASC) Topic 606,
Revenue from Contracts with Customers
(ASC 606), using the modified retrospective transition method applied to those contracts which were not completed as of January 1, 2019. We recorded the cumulative-effect adjustment of
$28.0 million
to the opening balance of accumulated deficit as of January 1, 2019 with a corresponding decrease to deferred revenue.
Total revenue for
the three months ended
March 31, 2019
and
2018
was
$16.0 million
and
$29.0 million
, respectively, and is primarily comprised of collaboration revenue from our strategic alliances as follows (in thousands):
|
Three Months Ended March 31,
|
|||||||
|
2019
|
2018
|
||||||
|
Collaboration revenue:
|
|||||||
|
Merck
|
$
|
10,687
|
|
$
|
15,967
|
|
|
|
Vertex
|
2,614
|
|
4,143
|
|
|||
|
AstraZeneca
|
814
|
|
7,350
|
|
|||
|
Total collaboration revenue
|
$
|
14,115
|
|
$
|
27,460
|
|
|
Cash received from strategic alliances was
$4.8 million
and $10.6 million for the three months ended
March 31, 2019
and
2018
, respectively. The timing of revenue recognition is not directly correlated to the timing of cash receipts. Total deferred revenue related to our strategic alliances as of
March 31, 2019
and
December 31, 2018
was
$230.8 million
and
$274.4 million
, respectively.
For further information on our adoption of ASC 606 and our revenue recognition policies, see Note 2 to our condensed consolidated financial statements “Recent Accounting Standards and Accounting Policies”. Our ability to generate revenue from sales of mRNA medicines and become profitable depends upon our ability to successfully develop and commercialize mRNA medicines. For the foreseeable future, we do not expect to generate revenue from product sales. To the extent that existing or potential future strategic alliances generate revenue, our revenue may vary due to many uncertainties in the development of our mRNA medicines under these strategic alliances and other factors. We expect to incur losses for the foreseeable future, and we expect these losses to increase as we continue our research and development efforts. We expect our programs to mature and advance to later stage clinical development, and we expect expenses to increase as we seek regulatory approvals for our investigational medicines and begin to commercialize any approved mRNA medicines.
Research and development expenses
The nature of our business and primary focus of our activities generate a significant amount of research and development costs.
Research and development expenses represent costs incurred by us for the following:
|
•
|
cost to develop our platform;
|
|
•
|
discovery efforts leading to development candidates;
|
|
•
|
preclinical, nonclinical, and clinical development costs for our programs;
|
|
•
|
cost to develop our manufacturing technology and infrastructure; and
|
|
•
|
digital infrastructure costs.
|
The costs above comprise the following categories:
|
•
|
personnel-related expenses, including salaries, benefits, and stock-based compensation expense;
|
|
•
|
expenses incurred under agreements with third parties, such as consultants, investigative sites, contract research organizations, or CROs, that conduct our preclinical and clinical studies, and in-licensing arrangements;
|
52
|
•
|
costs of acquiring, developing, and manufacturing materials for preclinical and clinical studies, including both internal manufacturing and third-party contract manufacturing organizations, or CMOs;
|
|
•
|
expenses incurred for the procurement of materials, laboratory supplies, and non-capital equipment used in the research and development process; and
|
|
•
|
facilities, depreciation, and amortization, and other direct and allocated expenses incurred as a result of research and development activities.
|
We use our employee and infrastructure resources for the advancement of our platform, and for discovering and developing programs. Due to the number of ongoing programs and our ability to use resources across several projects, indirect or shared operating costs incurred for our research and development programs are not recorded or maintained on a program- or modality-specific basis.
The following table reflects our research and development expenses, including direct program specific expenses summarized by modality and indirect or shared operating costs summarized under other research and development expenses during
the three months ended
March 31, 2019
and
2018
(in thousands):
|
Three Months Ended March 31,
|
|||||||
|
2019
|
2018
|
||||||
|
Program expenses by modality:
|
|||||||
|
Prophylactic vaccines
|
$
|
20,262
|
|
$
|
5,591
|
|
|
|
Cancer vaccines
|
10,086
|
|
7,848
|
|
|||
|
Intratumoral immuno-oncology
|
4,418
|
|
5,489
|
|
|||
|
Localized regenerative therapeutics
|
8
|
|
75
|
|
|||
|
Systemic secreted therapeutics
|
4,633
|
|
5,349
|
|
|||
|
Systemic intracellular therapeutics
|
6,743
|
|
8,150
|
|
|||
|
Total program-specific expenses by modality
(1)
|
46,150
|
|
32,502
|
|
|||
|
Other research and development expenses:
|
|||||||
|
Discovery programs
|
12,915
|
|
9,146
|
|
|||
|
Platform research
|
24,497
|
|
21,135
|
|
|||
|
Technical development and unallocated manufacturing expenses
|
21,347
|
|
13,129
|
|
|||
|
Shared discovery and development expenses
|
14,883
|
|
6,856
|
|
|||
|
Stock-based compensation
|
10,783
|
|
7,356
|
|
|||
|
Total research and development expenses
|
$
|
130,575
|
|
$
|
90,124
|
|
|
__________
|
(1)
|
Includes a total of 20 and 18 development candidates at
March 31, 2019
and
2018
, respectively. Program-specific expenses include external costs and allocated manufacturing costs of mRNA supply and consumables, and reflect these expenses beginning in the period the program was internally advanced to development or these expenses ending in the period the program was ceased.
|
A
“modality”
refers to a group of programs with common product features and the associated combination of enabling mRNA technologies, delivery technologies, and manufacturing processes. The program-specific expenses by modality summarized in the table above include expenses we directly attribute to our programs, which consist primarily of external costs, such as fees paid to outside consultants, central laboratories, investigative sites, and CROs in connection with our preclinical studies and clinical trials, and allocated manufacturing costs of mRNA supply and consumables. Costs to acquire and manufacture mRNA supply for preclinical studies and clinical trials are recognized and included in unallocated manufacturing expenses when incurred, and subsequently allocated to program-specific manufacturing costs after completion of the program-specific production. The timing of allocating manufacturing costs to the specific program varies depending on the program development and production schedule. We do not allocate personnel-related costs, including stock-based compensation, costs associated with our general platform research, technical development, and other shared costs on a program-specific basis. These costs were therefore excluded from the summary of program-specific expenses by modality.
Discovery program expenses are costs associated with research activities for our programs in the preclinical discovery stage, and primarily consist of external costs for CROs and lab services, and allocated manufacturing cost of preclinical mRNA supply and consumables.
Platform research expenses are mainly costs to develop technical advances in mRNA science, delivery science, and manufacturing process design. These costs include personnel-related costs, computer equipment, facilities, preclinical mRNA supply and
53
consumables, and other administrative costs to support our platform research. Technology development and unallocated manufacturing expenses are primarily related to non-program-specific manufacturing process development and manufacturing costs.
Shared discovery and development expenses are research and development costs such as personnel-related costs and other costs, which are not otherwise included in development programs, discovery programs, platform research, technical development and unallocated manufacturing expenses, stock-based compensation, and other expenses.
The largest component of our total operating expenses has historically been our investment in research and development activities, including development of our platform, mRNA technologies, and manufacturing technologies. We expense research and development costs as incurred and cannot reasonably estimate the nature, timing, and estimated costs required to complete the development of the development candidates and investigational medicines we are currently developing or may develop in the future. There are numerous risks and uncertainties associated with the research and development of such development candidates and investigational medicines, including, but not limited to:
|
•
|
scope, progress, and expense of developing ongoing and future development candidates and investigational medicines;
|
|
•
|
entry in and completion of related preclinical studies;
|
|
•
|
enrollment in and completion of subsequent clinical trials;
|
|
•
|
safety and efficacy of investigational medicines resulting from these clinical trials;
|
|
•
|
changes in laws or regulations relevant to the investigational medicines in development;
|
|
•
|
receipt of the required regulatory approvals; and
|
|
•
|
commercialization, including establishing manufacturing and marketing capabilities.
|
A change in expectations or outcomes of any of the known or unknown risks and uncertainties may materially impact our expected research and development expenditures. Continued research and development is central to the ongoing activities of our business. Investigational medicines in later stages of clinical development generally have higher development costs than those in earlier stages of clinical development, primarily due to the increased size and duration of later-stage clinical trials. We expect our costs to continue to increase in the future as our investigational medicines progress through the development phases and as we identify and develop additional programs. However, we do not believe that it is possible at this time to accurately project total program-specific expenses through commercialization. There are numerous factors associated with the successful commercialization of any of our investigational medicines, including future trial design and various regulatory requirements, many of which cannot be determined with accuracy at this time due to the early stage of development of our investigational medicines. Additionally, future commercial and regulatory factors beyond our control will impact our clinical development programs and plans.
General and administrative expenses
General and administrative expenses consist primarily of personnel-related costs, including stock-based compensation, for executives, finance, legal, human resources, business development and other administrative and operational functions, professional fees, accounting and legal services, information technology and facility-related costs, and expenses associated with obtaining and maintaining intellectual property, or IP. These costs relate to the operation of the business, unrelated to the research and development function, or any individual program.
We anticipate general and administrative expenses will increase as research and development expands. These increases will likely relate to additional personnel and increased costs related to finance, legal and IP-related matters along with increased expenses related to operating as a publicly traded company, such as fees related to audit, legal, and tax services, regulatory compliance programs, and investor relations. In addition, if we obtain regulatory approval for any of our investigational medicines and do not enter into a third-party commercialization collaboration, we expect to incur significant expenses related to building a sales and marketing team to support medicine sales, marketing, and distribution activities.
We have a broad IP portfolio covering our development and commercialization of mRNA vaccine and therapeutic programs, including those related to mRNA design, formulation, and manufacturing platform technologies. We regularly file patent applications to protect innovations arising from our research and development. We also hold trademarks and trademark applications in the United States and foreign jurisdictions. Costs to secure and defend our IP are expensed as incurred, and are classified as general and administrative expenses.
General and administrative expenses, including IP-related expenses, totaled
$27.3 million
and $16.3 for
the three months ended
March 31, 2019
and
2018
, respectively. IP-related expenses, including our internal personnel-related costs, were $2.8 million and
54
$2.1 million, for the three months ended March 31, 2019 and 2018, respectively. We did not incur litigation expenses related to our IP during
the three months ended
March 31, 2019
and
2018
.
Other income (expense), net
Interest income
Interest income consists of interest generated from our investments in cash and cash equivalents, money market funds, and high-quality fixed income securities.
Other income (expense)
Other income (expense), net consists of gains (losses) from the sale of investments in marketable securities, interest expense, and other income and expense unrelated to our core operations. Interest expense is primarily derived from our lease financing obligation related to our Norwood manufacturing facility.
Critical accounting policies and significant judgments and estimates
Our management’s discussion and analysis of our financial condition and results of operations is based on our condensed consolidated financial statements, which have been prepared in accordance with U.S. generally accepted accounting principles. The preparation of these condensed consolidated financial statements requires us to make judgments and estimates that affect the reported amounts of assets, liabilities, revenues, and expenses and the disclosure of contingent assets and liabilities in our condensed consolidated financial statements. We base our estimates on historical experience, known trends and events, and various other factors that we believe to be reasonable under the circumstances, the results of which form the basis for making judgments about the carrying values of assets and liabilities that are not readily apparent from other sources. Actual results may differ from these estimates under different assumptions or conditions. On an ongoing basis, we evaluate our judgments and estimates in light of changes in circumstances, facts, and experience. The effects of material revisions in estimates, if any, are reflected in the condensed consolidated financial statements prospectively from the date of change in estimates.
On January 1, 2019, we adopted ASC 606,
Revenue from Contracts with Customers
, using the modified retrospective transition method applied to those contracts which were not completed as of January 1, 2019. We recognized the cumulative effect of the adoption as an adjustment to the opening balance of accumulated deficit in the current period's condensed consolidated balance sheet. Results for reporting periods beginning after January 1, 2019, are presented under ASC 606. Prior period amounts have not been adjusted and continue to be reported in accordance with our historic accounting under ASC Topic 605,
Revenue Recognition
(ASC 605). ASC 606 applies to all contracts with customers, except for contracts that are within the scope of other standards, such as leases, insurance, collaboration arrangements and financial instruments.
Other than our adoption of ASC 606, there have been no material changes in our critical accounting policies and estimates in the preparation of our condensed consolidated financial statements during
the three months ended
March 31, 2019
compared to those disclosed in our Annual Report on Form 10-K for the year ended December 31, 2018, as amended.
Recently issued accounting pronouncements
We have reviewed all recently issued standards and have determined that, other than as disclosed in Note 2 to our condensed consolidated financial statements, such standards will not have a material impact on our financial statements or do not otherwise apply to our operations.
55
Results of operations
The following table summarizes our condensed consolidated statements of operations for each period presented (in thousands):
|
Three Months Ended March 31,
|
Change 2019 vs. 2018
|
|||||||||||||
|
2019
|
2018
|
$
|
%
|
|||||||||||
|
Revenue:
|
||||||||||||||
|
Collaboration revenue
|
$
|
14,115
|
|
$
|
27,460
|
|
$
|
(13,345
|
)
|
(49
|
)%
|
|||
|
Grant revenue
|
1,910
|
|
1,579
|
|
331
|
|
21
|
%
|
||||||
|
Total revenue
|
16,025
|
|
29,039
|
|
(13,014
|
)
|
(45
|
)%
|
||||||
|
Operating Expenses:
|
|
|||||||||||||
|
Research and development
|
130,575
|
|
90,124
|
|
40,451
|
|
45
|
%
|
||||||
|
General and administrative
|
27,283
|
|
16,317
|
|
10,966
|
|
67
|
%
|
||||||
|
Total operating expenses
|
157,858
|
|
106,441
|
|
51,417
|
|
48
|
%
|
||||||
|
Loss from operations
|
(141,833
|
)
|
(77,402
|
)
|
(64,431
|
)
|
83
|
%
|
||||||
|
Other income, net
|
9,152
|
|
5,026
|
|
4,126
|
|
82
|
%
|
||||||
|
Loss before benefit from income taxes
|
(132,681
|
)
|
(72,376
|
)
|
(60,305
|
)
|
83
|
%
|
||||||
|
Benefit from income taxes
|
(24
|
)
|
—
|
|
(24
|
)
|
|
|||||||
|
Net loss
|
$
|
(132,657
|
)
|
$
|
(72,376
|
)
|
$
|
(60,281
|
)
|
83
|
%
|
|||
Revenue
Total revenue decreased by
$13.0 million
, or
45%
in 2019, due to a decrease in collaboration revenue across all our strategic alliances, particularly AstraZeneca and Merck, largely driven by our adoption of ASC 606. See Note 2 to our condensed consolidated financial statements for further information on our adoption of ASC 606.
Operating expenses
Research and development expenses
Research and development expenses increased by
$40.5 million
, or
45%
in 2019, primarily attributable to an increase in personnel related costs of
$12.1 million
and an increase in stock-based compensation of
$3.4 million
, an increase in clinical trial and manufacturing costs of
$10.7 million
, an increase in lab supplies and materials of
$6.7 million
, and an increase in consulting and outside services of
$5.0 million
. The increases in personnel related costs and stock-based compensation were largely driven by an increase in the number of employees supporting our research and development programs.
General and administrative expenses
General and administrative expenses increased by
$11.0 million
, or
67%
in 2019, primarily due to an increase in personnel related costs of
$2.0 million
and an increase in stock-based compensation of
$3.2 million
, an increase in consulting and outside services of
$2.4 million
, and an increase in information technology, facility and insurance related costs of $2.4 million. These increases were primarily driven by an increase in the number of employees and increased costs related to operating as a publicly traded company.
Other income, net
The following table summarizes other income, net for each period presented (in thousands):
|
Three Months Ended March 31,
|
Change 2019 vs. 2018
|
|||||||||||||
|
2019
|
2018
|
$
|
%
|
|||||||||||
|
Interest income
|
$
|
10,972
|
|
$
|
5,209
|
|
$
|
5,763
|
|
111
|
%
|
|||
|
(Loss) gain on investment
|
(3
|
)
|
58
|
|
(61
|
)
|
(105
|
)%
|
||||||
|
Interest expense
|
(1,533
|
)
|
(27
|
)
|
(1,506
|
)
|
5,578
|
%
|
||||||
|
Other expense, net
|
(284
|
)
|
(214
|
)
|
(70
|
)
|
33
|
%
|
||||||
|
Total other income, net
|
$
|
9,152
|
|
$
|
5,026
|
|
$
|
4,126
|
|
82
|
%
|
|||
56
Other income, net increased by
$4.1 million
, or
82%
in 2019, primarily due to an increase of
$5.8 million
in interest income from our investments in marketable securities, mainly driven by a higher weighted average balance of cash and investments and market performance. This increase was partially offset by higher interest expense of
$1.5 million
related to our Norwood lease financing obligation. We began recording interest expense upon the completion of our Norwood manufacturing facility in July 2018.
Liquidity and capital resources
We have historically funded our operations primarily from the sale of equity instruments and from proceeds from certain strategic alliance arrangements and grant agreements. As of
March 31, 2019
, we had cash, cash equivalents and investments of
$1.5 billion
. Cash and cash equivalents and investments are invested in accordance with our investment policy, primarily with a view to liquidity and capital preservation. Investments, consisting primarily of government and corporate debt securities are stated at fair value. As of
March 31, 2019
, we had current and non-current investments of approximately
$606.0 million
and
$437.7 million
, respectively.
We began construction of our Norwood manufacturing facility, or Norwood, in the second half of 2016. Our capital expenditures related to Norwood were $3.6 million and $38.1 million for the three months ended
March 31, 2019
and
2018
, respectively. Cash disbursements related to Norwood were $5.7 million and $29.6 million for the three months ended
March 31, 2019
and
2018
.
On January 30, 2018 and February 15, 2018, we issued Series G preferred stock for total gross proceeds of $560.0 million. On May 7, 2018, we issued Series H preferred stock for gross proceeds of $125.0 million of which $13.0 million is determined to be a premium and recorded to deferred revenue as part of the Merck PCV/SAV agreement executed contemporaneously with our Series H redeemable convertible preferred stock issuance. Please refer to Note 3 to our condensed consolidated financial statements.
On December 11, 2018, we closed our IPO, whereby we sold 26,275,993 shares of common stock at a price of $23.00 per share. The shares began trading on the Nasdaq Global Select Market on December 7, 2018. The aggregate net proceeds received by us from the IPO were $563.0 million, net of underwriting discounts, commissions and offering expenses payable by us.
Cash flow
The following table summarizes the primary sources and uses of cash for each period presented (in thousands):
|
Three Months Ended March 31,
|
|||||||
|
2019
|
2018
|
||||||
|
Net cash (used in) provided by:
|
|||||||
|
Operating activities
|
$
|
(143,927
|
)
|
$
|
(111,385
|
)
|
|
|
Investing activities
|
(11,759
|
)
|
(483,704
|
)
|
|||
|
Financing activities
|
(48
|
)
|
549,995
|
|
|||
|
Net decrease in cash and cash equivalents
|
$
|
(155,734
|
)
|
$
|
(45,094
|
)
|
|
Operating activities
We derive cash flows from operations primarily from cash collected from certain strategic alliances. Our cash flows from operating activities are significantly influenced by our use of cash for operating expenses and working capital to support the business. We have historically experienced negative cash flows from operating activities as we have invested early in our mRNA technologies, digital infrastructure, manufacturing technology, and infrastructure.
Net cash used in operating activities for
the three months ended
March 31, 2019
was
$143.9 million
and consisted of net loss of
$132.7 million
less non-cash adjustments of
$24.8 million
, plus a net change in assets and liabilities of
$36.1 million
. Non-cash items primarily included stock-based compensation of
$18.5 million
, depreciation and amortization of
$7.3 million
, and amortization of investment premium and discount of $1.0 million. The net change in assets and liabilities was primarily due to a
decrease
in accrued liabilities of
$32.6 million
, and a
decrease
in deferred revenue of
$15.6 million
, partially offset by a
decrease
in accounts receivable of
$6.0 million
, a decrease in prepaid expenses and other assets of
$3.3 million
and an
increase
in accounts payable of
$1.7 million
.
Net cash used in operating activities for
the three months ended
March 31, 2018
was
$111.4 million
and consisted of net loss of
$72.4 million
less non-cash adjustments of
$16.9 million
, plus a net change in assets and liabilities of
$55.9 million
. Non-cash items primarily included stock-based compensation of
$11.9 million
and depreciation and amortization of
$5.2 million
. The net change in assets and liabilities was primarily due to a decrease in accrued liabilities of
$37.0 million
, an increase in accounts receivable of
$24.7 million
and an increase in prepaid expense and other assets of
$2.2 million
, partially offset by an increase in deferred revenue of
$6.2 million
.
57
Investing activities
Our primary investing activities consist of purchases, sales, and maturities of our investments and capital expenditures for manufacturing, laboratory, computer equipment and software.
Net cash used in investing activities for
the three months ended
March 31, 2019
was
$11.8 million
, which included purchases of marketable securities of
$429.5 million
and capital expenditures of
$7.6 million
, partially offset by proceeds from maturities of marketable securities of
$403.9 million
and proceeds from sales of marketable securities of
$21.4 million
.
Net cash used in investing activities for
the three months ended
March 31, 2018
was
$483.7 million
, which included purchases of marketable securities of
$660.2 million
and capital expenditures of
$31.9 million
, partially offset by proceeds from maturities of marketable securities of
$189.8 million
and proceeds from sales of marketable securities of
$18.6 million
.
Financing activities
We did not generate significant cash from financing activities for
the three months ended
March 31, 2019
.
We generated cash from financing activities of
$550.0 million
for
the three months ended
March 31, 2018
, primarily from net proceeds from the issuance of redeemable convertible preferred stock of
$549.5 million
.
Operation and funding requirements
Since our inception, we have incurred significant losses and negative cash flows from operations due to our significant research and development expenses. We have an accumulated deficit of
$1.1 billion
as of
March 31, 2019
. We expect to continue to incur significant losses in the foreseeable future and expect our expenses to increase in connection with our ongoing activities, particularly as we continue research and development of our development candidates and clinical activities for our investigational medicines. In addition, we expect to incur additional costs associated with operating as a public company.
We are subject to all the risks related to the development and commercialization of novel medicines, and we may encounter unforeseen expenses, difficulties, complications, delays, and other unknown factors that may adversely affect our business. Our forecast of the period of time through which our financial resources will be adequate to support our operations is a forward-looking statement and involves risks and uncertainties, and actual results could vary as a result of a number of factors. We have based this estimate on assumptions that may prove to be wrong, and we could utilize our available capital resources sooner than we currently expect. We believe that our cash, cash equivalents, and investments as of
March 31, 2019
, will be sufficient to enable us to fund our projected operations through at least the next 12 months from the issuance of these financial statements.
Until we can generate a sufficient amount of revenue from our programs, we expect to finance future cash needs through public or private equity or debt offerings and potential future strategic alliances from which we receive upfront fees, milestone payments, and other forms of consideration. Additional capital may not be available on reasonable terms, if at all. If we are unable to raise additional capital in sufficient amounts or on terms acceptable to us, we may have to significantly delay, scale back, or discontinue the development or commercialization of one or more of our investigational medicines, or slow down or cease work on one or more of our programs. If we raise additional funds through the issuance of additional equity or debt securities, it could result in dilution to our existing stockholders or increased fixed payment obligations, and any such securities may have rights senior to those of our common stock. If we incur indebtedness, we could become subject to covenants that would restrict our operations and potentially impair our competitiveness, such as limitations on our ability to incur additional debt, limitations on our ability to acquire, sell or license intellectual property rights and other operating restrictions that could adversely impact our ability to conduct our business. If we raise funds through strategic alliances or marketing, distribution, or licensing arrangements with third parties, we may have to relinquish valuable rights to our technologies, future revenue streams, research programs, or investigational medicines or grant licenses on terms that may not be favorable to us. Any of these events could significantly harm our business, financial condition, and prospects.
Contractual Obligations
As of
March 31, 2019
there have been no material changes to our contractual obligations and commitments from those described under “Management’s Discussion and Analysis of Financial Condition and Results of Operations” included in the Annual Report on Form 10-K for the year ended December 31, 2018.
Off balance sheet arrangements
As of
March 31, 2019
, we did not have any off-balance sheet arrangements, as defined in Item 303(a)(4)(ii) of Regulation S-K.
58
JOBS Act and emerging growth company status
In April 2012, the JOBS Act was enacted. As an "emerging growth company," or EGC under the JOBS Act, we may delay the adoption of certain accounting standards until such time as those standards apply to private companies. Other exemptions and reduced reporting requirements under the JOBS Act for EGCs include an exemption from the requirement to provide an auditor’s report on internal controls over financial reporting pursuant to Section 404(b) of the Sarbanes-Oxley Act of 2002, an exemption from any requirement that may be adopted by the Public Company Accounting Oversight Board regarding mandatory audit firm rotation, and less extensive disclosure about our executive compensation arrangements. Additionally, the JOBS Act provides that an EGC can take advantage of an extended transition period for complying with new or revised accounting standards. This allows an EGC to delay the adoption of certain accounting standards until those standards would otherwise apply to private companies. We have elected to avail ourselves of this exemption and, therefore, while we are an EGC we will not be subject to new or revised accounting standards at the same time that they become applicable to other public companies that are not EGCs.
We will remain classified as an EGC until the earlier of (i) the last day of our first fiscal year in which we have total annual gross revenues of $1.07 billion or more, (ii) December 31, 2023, being the last day of the fiscal year following the fifth anniversary of the completion of our IPO, (iii) the date on which we have issued more than $1.0 billion of non-convertible debt instruments during the previous three fiscal years, or (iv) the date on which we are deemed a “large accelerated filer” under the rules of the SEC.
Item 3. Quantitative and Qualitative Disclosures about Market Risk
Our primary exposure to market risk relates to changes in interest rates. As of
March 31, 2019
and
December 31, 2018
, we had cash, cash equivalents, restricted cash, and investments in marketable securities of
$1.5 billion
and
$1.7 billion
, respectively. Our investment portfolio is comprised of money market funds and marketable debt securities (including U.S. Treasury securities, debt securities of U.S. government agencies and corporate entities, and commercial paper). Our primary investment objectives are the preservation of capital and the maintenance of liquidity and our investment policy defines allowable investments based on quality of the institutions and financial instruments designed to minimize risk exposure. Our exposure to interest rate sensitivity is affected by changes in the general level of U.S. interest rates. Our available for sale securities are subject to interest rate risk and will fall in value if market interest rates increase.
We generally hold investments in marketable debt securities to maturity to limit our exposure to interest rate risk. Due to the short-term maturities and low risk profiles of our investments, we do not anticipate a significant exposure to interest rate risk. If market interest rates were to increase immediately and uniformly by 100 basis points, or one percentage point, from levels at
March 31, 2019
, the net fair value of our interest sensitive marketable securities would not experience a material change in fair market value.
We currently do not have significant exposure to foreign currencies as we hold no foreign exchange contracts, option contracts, or other foreign hedging arrangements. Further, our operations and revenue generating activities are denominated in U.S. dollars. Our operations may be subject to fluctuations in foreign currency exchange rates in the future.
Inflation generally affects us by increasing our cost of labor. We do not believe that inflation had a material effect on our business, financial condition, or results of operations during
the three months ended
March 31, 2019
and
2018
.
Item 4. Controls and Procedures
Disclosure Controls and Procedures
We maintain disclosure controls and procedures designed to ensure that information required to be disclosed in the reports that the Company files or submits under the Exchange Act is recorded, processed, summarized and reported within the time periods specified in the SEC’s rules and forms and is accumulated and communicated to management, including the principal executive officer (our Chief Executive Officer) and principal financial officer (our Chief Financial Officer), to allow timely decisions regarding required disclosure.
Our management, under the supervision and with the participation of our Chief Executive Officer and Chief Financial Officer, has evaluated the effectiveness of our disclosure controls and procedures (as defined in Rules 13a-15(e) and 15d-15(e) under the Exchange Act) as of the end of the period covered by this Form 10-Q. Management recognizes that any disclosure controls and procedures, no matter how well designed and operated, can provide only reasonable assurance of achieving their objectives. Our disclosure controls and procedures have been designed to provide reasonable assurance of achieving their objectives. Based on such evaluation, our Chief Executive Officer and Chief Financial Officer concluded that our disclosure controls and procedures were effective at the reasonable assurance level as of March 31, 2019.
59
Changes in Internal Control over Financial Reporting
During the three months ended March 31, 2019, we implemented certain internal controls in connection with our adoption of ASC 606 on January 1, 2019. There were no other changes in our internal control over financial reporting (as defined in Rules 13a-15(f) and 15d-15(f) under the Exchange Act) during the three months ended
March 31, 2019
that have materially affected, or is reasonably likely to materially affect, our internal control over financial reporting.
PART II
Item 1. Legal Proceedings
We are not currently a party to any material legal proceedings.
Item 1A. Risk Factors
In addition to the other information set forth in this Form 10-Q, including under the heading “Special Note Regarding Forward-Looking Statements”, the risks and uncertainties that we believe are most important for you to consider are discussed in “Part I, Item 1A—Risk Factors” of our 2018 Form 10-K, which could adversely affect our business, financial condition, or results of operations. The risks described in our 2018 Form 10-K are not the only risks facing our Company. Additional risks and uncertainties not currently known to us or that we currently deem to be immaterial also may adversely affect our business, financial condition, or results of operations. There are no material changes to the Risk Factors described in our 2018 Form 10-K.
Item 2. Unregistered Sales of Equity Securities and Use of Proceeds.
Recent Sales of Unregistered Securities
None.
Use of Proceeds from Public Offering of Common Stock
There has been no material change in the planned use of proceeds from our initial public offering as described in our final prospectus filed with the SEC pursuant to Rule 424(b) of the Securities Act. We are holding the balance of the net proceeds in cash, cash equivalents, and investments. We invested the funds received in short-term, interest-bearing investment-grade securities and government securities.
Item 6. Exhibits
The Exhibits listed below are filed or incorporated by reference as part of this Form 10-Q.
|
Exhibit No.
|
Exhibit Index
|
|
|
10.1#
|
||
|
31.1
|
||
|
31.2
|
||
|
32.1+
|
||
|
101.INS
|
XBRL Instance Document
|
|
|
101.SCH
|
XBRL Taxonomy Extension Schema Document
|
|
|
101.CAL
|
XBRL Taxonomy Extension Calculation Document
|
|
|
101.DEF
|
XBRL Taxonomy Extension Definition Linkbase Document
|
|
|
101.LAB
|
XBRL Taxonomy Extension Labels Linkbase Document
|
|
|
101.PRE
|
XBRL Taxonomy Extension Presentation Link Document
|
|
60
|
+
|
The certification furnished in Exhibit 32.1 hereto is deemed to accompany this Form 10-Q and will not be deemed “filed” for purposes of Section 18 of the Securities Exchange Act of 1934, as amended. Such certification will not be deemed to be incorporated by reference into any filings under the Securities Act of 1933, as amended, or the Securities Exchange Act of 1934, as amended, except to the extent that the Registrant specifically incorporates it by reference.
|
|
#
|
Indicates a management contract or any compensatory plan, contract or arrangement.
|
61
SIGNATURES
Pursuant to the requirements of the Section 13 or 15(d) of the Securities Exchange Act of 1934, the Registrant has duly caused this report to be signed on its behalf by the undersigned, thereunto duly authorized.
|
MODERNA, INC.
|
|||
|
Date:
|
By:
|
/s/ Stéphane Bancel
|
|
|
May 9, 2019
|
|||
|
Stéphane Bancel
|
|||
|
Chief Executive Officer and Director
|
|||
|
(
Principal Executive Officer)
|
|||
|
Date:
|
By:
|
/s/ Lorence Kim, M.D.
|
|
|
May 9, 2019
|
|||
|
Lorence Kim, M.D.
|
|||
|
Chief Financial Officer
|
|||
|
(
Principal Financial Officer)
|
|||
62
TABLE OF CONTENTS
Item 1. Financial StatementsItem 2. Management S Discussion and Analysis Of Financial Condition and Results Of OperationsItem 3. Quantitative and Qualitative Disclosures About Market RiskItem 4. Controls and ProceduresPart IIItem 1. Legal ProceedingsItem 1A. Risk FactorsItem 2. Unregistered Sales Of Equity Securities and Use Of ProceedsItem 6. Exhibits