MARATHON OIL CORP
10-Ks and 10-Qs
|
|
|
|
|
|
|
|
|
|
|
|
|
|
|
|
|
|
|
|
|
|
|
|
|
|
|
|
|
|
|
|
|
|
|
|
|
|
|
|
|
|
|
|
|
|
|
UNITED STATES
SECURITIES AND EXCHANGE COMMISSION
Washington, D.C. 20549
FORM 10-K
ANNUAL REPORT PURSUANT TO SECTION 13 OR 15(d)
OF THE SECURITIES EXCHANGE ACT OF 1934
For the Fiscal Year Ended
December 31, 2018
Commission file number 1-5153

Marathon Oil Corporation
(Exact name of registrant as specified in its charter)
|
Delaware
|
|
25-0996816
|
|
(State or other jurisdiction of incorporation or organization)
|
|
(I.R.S. Employer Identification No.)
|
5555 San Felipe Street, Houston, TX 77056-2723
(Address of principal executive offices)
(713) 629-6600
(Registrant’s telephone number, including area code)
Securities registered pursuant to Section 12(b) of the Act:
|
Title of each class
|
|
Name of each exchange on which registered
|
|
Common Stock, par value $1.00
|
|
New York Stock Exchange
|
Securities registered pursuant to Section 12(g) of the Act:
None
Indicate by check mark if the registrant is a well-known seasoned issuer, as defined in Rule 405 of the Securities Act. Yes
þ
No
o
Indicate by check mark if the registrant is not required to file reports pursuant to Section 13 or Section 15(d) of the Act. Yes
o
No
þ
Indicate by check mark whether the registrant (1) has filed all reports required to be filed by Section 13 or 15 (d) of the Securities Exchange Act of 1934 during the preceding 12 months and (2) has been subject to such filing requirements for the past 90 days. Yes
þ
No
o
Indicate by check mark whether the registrant has submitted electronically every Interactive Data File required to be submitted pursuant to Rule 405 of Regulation S-T (§ 232.405 of this chapter) during the preceding 12 months (or for such shorter period that the registrant was required to submit such files). Yes
þ
No
o
Indicate by check mark if disclosure of delinquent filers pursuant to Item 405 of Regulation S-K is not contained herein, and will not be contained, to the best of registrant’s knowledge, in definitive proxy or information statements incorporated by reference in Part III of this Form 10-K or any amendment to this Form 10-K.
þ
Indicate by check mark whether the registrant is a large accelerated filer, an accelerated filer, a non-accelerated filer, smaller reporting company, or an emerging growth company. See the definitions of "large accelerated filer," "accelerated filer", "smaller reporting company," and "emerging growth company" in Rule 12b-2 of the Exchange Act.
|
Large accelerated filer
þ
|
Accelerated filer
o
|
Non-accelerated filer
o
|
|||
|
Smaller reporting company
o
|
Emerging growth company
o
|
||||
If an emerging growth company, indicate by check mark if the registrant has elected not to use the extended transition period for complying with any new or revised financial accounting standards provided pursuant to Section 13(a) of the Exchange Act.
o
Indicate by check mark whether the registrant is a shell company (as defined in Rule 12b-2 of the Act). Yes
o
No
þ
The aggregate market value of Common Stock held by non-affiliates as of
June 30, 2018
:
$17,781 million
. This amount is based on the closing price of the registrant’s Common Stock on the New York Stock Exchange on that date. Shares of Common Stock held by executive officers and directors of the registrant are not included in the computation. The registrant, solely for the purpose of this required presentation, has deemed its directors and executive officers to be affiliates.
There were
818,504,459
shares of Marathon Oil Corporation Common Stock outstanding
as of February 14, 2019
.
Documents Incorporated By Reference:
Portions of the registrant’s proxy statement relating to its
2019
Annual Meeting of Stockholders, to be filed with the Securities and Exchange Commission pursuant to Regulation 14A under the Securities Exchange Act of 1934, are incorporated by reference to the extent set forth in Part III, Items 10-14 of this report.
MARATHON OIL CORPORATION
Unless the context otherwise indicates, references to "Marathon Oil," "we," "our" or "us" in this Annual Report on Form 10-K are references to Marathon Oil Corporation, including its wholly owned and majority-owned subsidiaries, and its ownership interests in equity method investees (corporate entities, partnerships, limited liability companies and other ventures over which Marathon Oil exerts significant influence by virtue of its ownership interest).
|
Table of Contents
|
|||
|
|
|||
Definitions
Throughout this report, the following company or industry specific terms and abbreviations are used.
AMPCO
– Atlantic Methanol Production Company LLC, a company located in Equatorial Guinea in which we own a 45% equity interest.
AOSP –
Athabasca Oil Sands Project, an oil sands mining, transportation and upgrading joint venture located in Alberta, Canada, in which we held a 20% non-operated working interest.
bbl
– One stock tank barrel, which is 42 United States gallons liquid volume.
bcf
– Billion cubic feet.
boe
– Barrels of oil equivalent.
btu
– British thermal unit, an energy equivalence measure.
Capital Budget
– Includes capital expenditures, cash investments in equity method investees and other investments, exploration costs that are expensed as incurred rather than capitalized, such as geological and geophysical costs and certain staff costs, and other miscellaneous investment expenditures.
Development Capital Budget
– Includes expenditures, investments and costs associated with the Capital Budget excluding
resource play leasing and exploration ("REx").
DD&A
– Depreciation, depletion and amortization.
Development well
– A well drilled within the proved area of an oil or natural gas reservoir to the depth of a stratigraphic horizon known to be productive.
Dry well
– A well found to be incapable of producing either oil or natural gas in sufficient quantities to justify completion as an oil or gas well.
E.G.
– Equatorial Guinea.
EGHoldings
– Equatorial Guinea LNG Holdings Limited, a liquefied natural gas production company located in E.G. in which we own a 60% equity interest.
EPA
– United States Environmental Protection Agency.
E&P
– Exploration and production.
Exploratory well
– A well drilled to find oil or natural gas in an unproved area or find a new reservoir in a field previously found to be productive in another reservoir.
FASB
– Financial Accounting Standards Board.
Henry Hub price
– a natural gas benchmark price quoted at settlement date average.
IRS
– United States Internal Revenue Service.
Kurdistan
– Kurdistan Region of Iraq
LNG
– Liquefied natural gas.
LPG
– Liquefied petroleum gas.
Liquid hydrocarbons or liquids
– Collectively, crude oil, condensate and natural gas liquids.
LLS
– Louisiana Light Sweet crude oil, an oil index benchmark price as per Bloomberg Finance LLP: LLS St. James.
Marathon Oil
– Marathon Oil Corporation, including wholly owned and majority-owned subsidiaries, and ownership interests in equity method investees (corporate entities, partnerships, limited liability companies and other ventures over which Marathon Oil exerts significant influence by virtue of its ownership interest). The company as it exists following the June 30, 2011 spin-off of the refining, marketing and transportation operations.
mbbld
– Thousand barrels per day.
mboed
– Thousand barrels of oil equivalent per day.
mcf
– Thousand cubic feet.
mmbbl
– Million barrels.
1
mmboe
– Million barrels of oil equivalent. Natural gas is converted on the basis of six mcf of gas per one barrel of crude oil equivalent.
mmbtu
– Million British thermal units.
mmcfd
– Million stabilized cubic feet per day.
mmta
– Million metric tonnes per annum.
MPC
–
Marathon Petroleum Corporation
– the separate independent company, which owns and operates the refining, marketing and transportation operations.
mt
– metric tonnes
mtd
– metric tonnes per day.
Net acres or Net wells
– The sum of the fractional working interests owned by us in gross acres or gross wells.
NGL or NGLs
– Natural gas liquid or natural gas liquids, which are naturally occurring substances found in natural gas, including ethane, butane, isobutane, propane and natural gasoline, which can be collectively removed from produced natural gas, separated into these substances and sold.
NYMEX
– New York Mercantile Exchange.
OECD
– Organization for Economic Cooperation and Development.
OPEC
– Organization of Petroleum Exporting Countries.
Operational availability
–
A term used to measure the ability of an asset to produce to its maximum capacity over a specified period of time, after consideration of internal losses.
Productive well
– A well that is not a dry well. Productive wells include producing wells and wells that are mechanically capable of production.
Proved developed reserves
– Proved reserves that can be expected to be recovered through existing wells with existing equipment and operating methods or for which the cost of the required equipment is relatively minor compared to the cost of a new well.
Proved reserves
– Proved crude oil and condensate, NGLs, natural gas and our historical synthetic crude oil reserves are those quantities of crude oil and condensate, NGLs, natural gas and synthetic crude oil, which, by analysis of geoscience and engineering data, can be estimated with reasonable certainty to be economically producible from a given date forward, from known reservoirs, and under existing economic conditions, operating methods, and government regulations-prior to the time at which contracts providing the right to operate expire, unless evidence indicates that renewal is reasonably certain, regardless of whether deterministic or probabilistic methods are used for the estimation. The project to extract the hydrocarbons must have commenced or the operator must be reasonably certain that it will commence the project within a reasonable time.
Proved undeveloped reserves
– Proved reserves that are expected to be recovered from new wells on undrilled acreage, or from existing wells where a relatively major expenditure is required for recompletion. Undrilled locations can be classified as having proved undeveloped reserves if a development plan has been adopted indicating that they are scheduled to be drilled within five years, unless the specific circumstances justify a longer time. Reserves on undrilled acreage shall be limited to those directly offsetting development spacing areas that are reasonably certain of production when drilled, unless evidence using reliable technology exists that establishes reasonable certainty of economic viability at greater distances.
Reserve replacement ratio
– A ratio which measures the amount of proved reserves added to our reserve base during the year relative to the amount of liquid hydrocarbons and natural gas produced.
Royalty interest
– An interest in an oil or natural gas property entitling the owner to a share of oil or natural gas production free of costs of production.
SAR or SARs
– Stock appreciation right or stock appreciation rights.
SCOOP
– South Central Oklahoma Oil Province.
SEC
– United States Securities and Exchange Commission.
Seismic
– An exploration method of sending energy waves or sound waves into the earth and recording the wave reflections to indicate the type, size, shape and depth of subsurface rock formation (3-D seismic provides three-dimensional pictures and 4-D factors in changes that occurred over time).
STACK
– Sooner Trend, Anadarko (basin), Canadian (and) Kingfisher (counties).
2
TD
–
Total depth
or the bottom of a drilled hole.
Total proved reserves
– The summation of proved developed reserves and proved undeveloped reserves.
U.K.
– United Kingdom.
U.S.
– United States of America.
U.S. resource plays
– Consists of our unconventional properties in the Oklahoma, Eagle Ford, Bakken and Northern Delaware.
U.S. GAAP
– U.S. Generally Accepted Accounting Principles.
Working interest
– The interest in a mineral property, which gives the owner that share of production from the property. A working interest owner bears that share of the costs of exploration, development and production in return for a share of production. Working interests are sometimes burdened by overriding royalty interests or other interests.
WTI
– West Texas Intermediate crude oil, an oil index benchmark price as quoted by NYMEX.
3
Disclosures Regarding Forward-Looking Statements
This Annual Report on Form 10-K contains forward-looking statements within the meaning of Section 27A of the Securities Act of 1933 and Section 21E of the Securities Exchange Act of 1934. These are statements, other than statements of historical fact, that give current expectations or forecasts of future events, including without limitation: our operational, financial and growth strategies, including drilling plans and projects, planned wells, rig count, inventory, seismic, exploration plans, maintenance activities, drilling and completion improvements, cost reductions, non-core asset sales, and financial flexibility; our ability to successfully effect those strategies and the expected timing and results thereof; our 2019 Capital Budget and the planned allocation thereof; planned capital expenditures and the impact thereof; expectations regarding future economic and market conditions and their effects on us; our financial and operational outlook, and ability to fulfill that outlook; our financial position, balance sheet, liquidity and capital resources, and the benefits thereof; resource and asset potential; reserve estimates; growth expectations; and future production and sales expectations, and the drivers thereof. In addition, many forward-looking statements may be identified by the use of forward-looking terminology such as “anticipates,” “believes,” “estimates,” “expects,” “targets,” “plans,” “projects,” “could,” “may,” “should,” “would” or similar words indicating that future outcomes are uncertain. While we believe that our assumptions concerning future events are reasonable, these expectations may not prove to be correct. A number of factors could cause results to differ materially from those indicated by such forward-looking statements including, but not limited to:
|
•
|
conditions in the oil and gas industry, including supply and demand levels for crude oil and condensate, NGLs and natural gas and the resulting impact on price;
|
|
•
|
changes in expected reserve or production levels;
|
|
•
|
changes in political or economic conditions in the jurisdictions in which we operate, including changes in foreign currency exchange rates, interest rates, inflation rates, and global and domestic market conditions;
|
|
•
|
risks related to our hedging activities;
|
|
•
|
liability resulting from litigation;
|
|
•
|
capital available for exploration and development;
|
|
•
|
the inability of any party to satisfy closing conditions or delays in execution with respect to our asset acquisitions and dispositions;
|
|
•
|
drilling and operating risks;
|
|
•
|
lack of, or disruption in, access to pipelines or other transportation methods;
|
|
•
|
well production timing;
|
|
•
|
availability of drilling rigs, materials and labor, including the costs associated therewith;
|
|
•
|
difficulty in obtaining necessary approvals and permits;
|
|
•
|
non-performance by third parties of their contractual obligations;
|
|
•
|
unforeseen hazards such as weather conditions, acts of war or terrorist acts and the governmental or military response thereto;
|
|
•
|
cyber-attacks;
|
|
•
|
changes in safety, health, environmental, tax and other regulations;
|
|
•
|
other geological, operating and economic considerations; and
|
|
•
|
other factors discussed in Item 1. Business, Item 1A. Risk Factors, Item 7. Management’s Discussion and Analysis of Financial Condition and Results of Operations, Item 7A. Quantitative and Qualitative Disclosures About Market Risk, and elsewhere in this report.
|
All forward-looking statements included in this report are based on information available to us on the date of this report. Except as required by law, we undertake no obligation to revise or update any forward-looking statements as a result of new information, future events or otherwise. All subsequent written and oral forward-looking statements attributable to us or persons acting on our behalf are expressly qualified in their entirety by the cautionary statements contained throughout this report.
4
PART I
Item 1. Business
General
Marathon Oil Corporation (NYSE: MRO) is an independent exploration and production company based in Houston, Texas, focused on U.S. resource plays with operations in the United States, Europe and Africa. Our corporate headquarters is located at 5555 San Felipe Street, Houston, Texas 77056-2723 and our telephone number is (713) 629-6600. Each of our two reportable operating segments are organized by geographic location and managed according to the nature of the products and services offered. The two segments are:
|
•
|
United States – explores for, produces and markets crude oil and condensate, NGLs and natural gas in the United States;
|
|
•
|
International – explores for, produces and markets crude oil and condensate, NGLs and natural gas outside of the United States and produces and markets products manufactured from natural gas, such as LNG and methanol, in E.G.
|
We were incorporated in 2001. On July 1, 2011 we became an Independent E&P after we completed the spin-off of our refining, marketing and transportation business, creating two independent energy companies: Marathon Oil and MPC.
Our strategy is to deliver competitive and improving corporate level returns by focusing our capital investment in the lower cost, higher margin U.S. resource plays while maintaining a peer-leading balance sheet, prioritizing sustainable cash flow generation at conservative oil prices, and returning capital to shareholders. See
Item 7. Management's Discussion and Analysis of Financial Condition and Results of Operations
, for a more detailed discussion of our operating results, cash flows and liquidity.
Our portfolio is concentrated in our core operations in the U.S. resource plays and E.G. The map below shows the locations of our core operations:
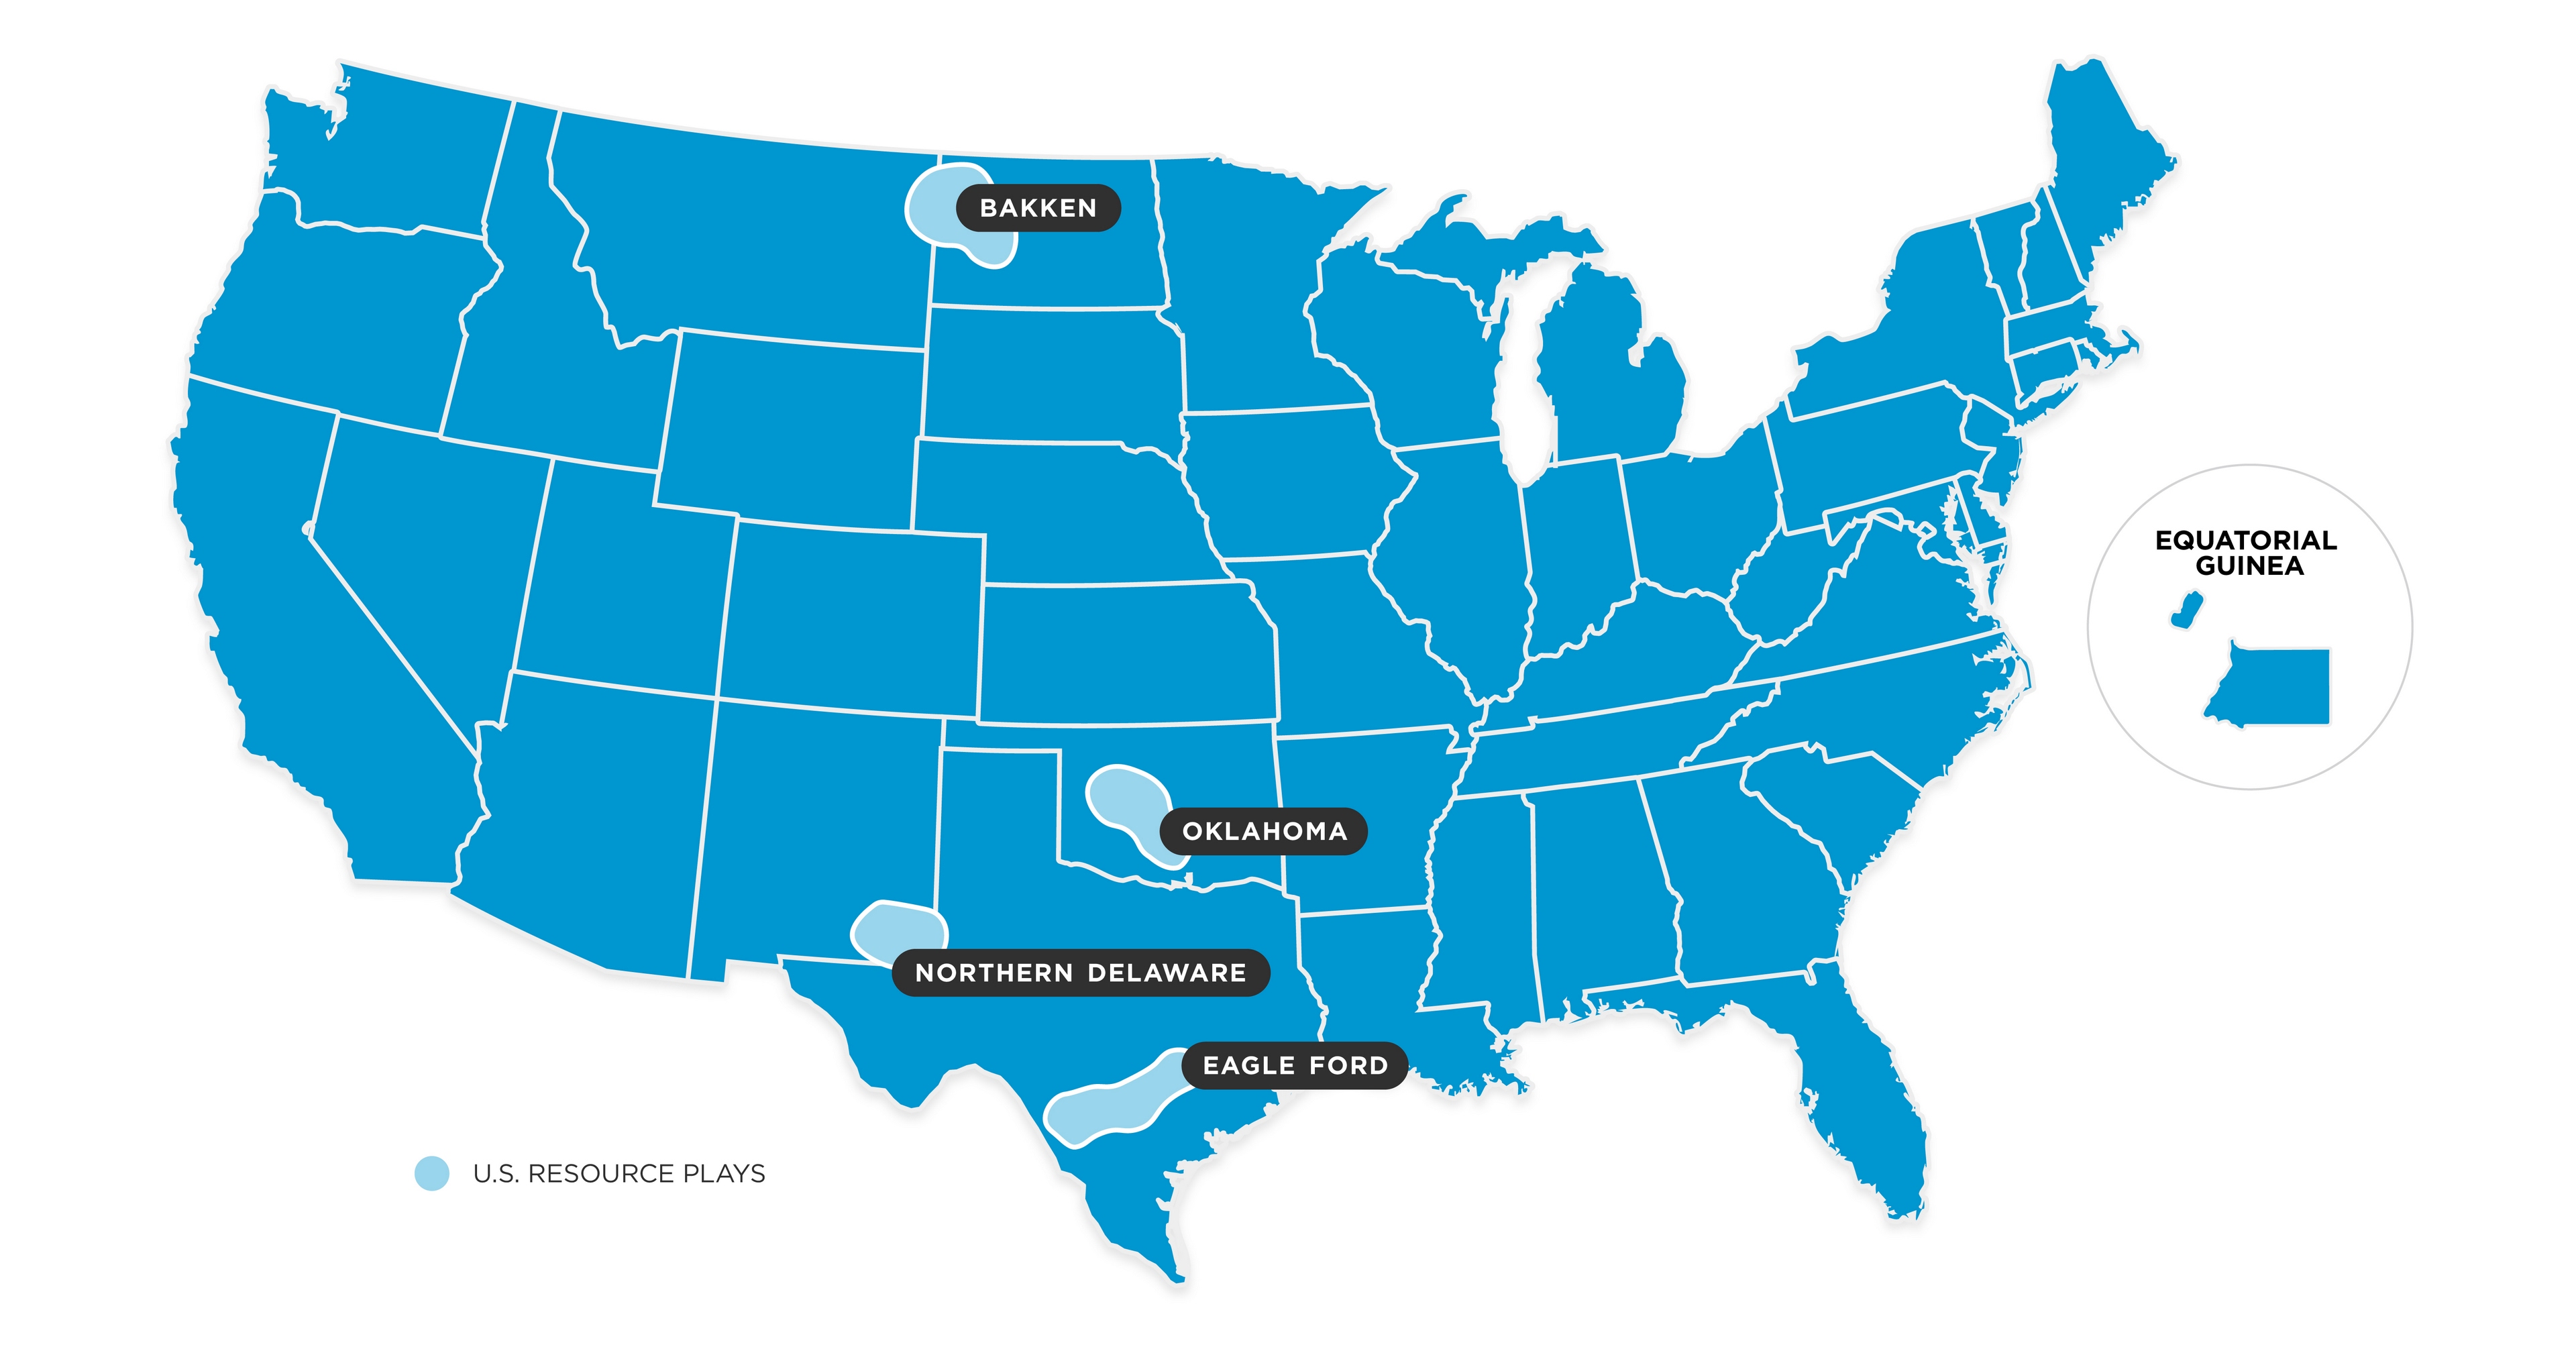
*
Our additional locations include the U.K, the Kurdistan Region of Iraq (executed a sales agreement in 2018) and other United States locations.
Segment Information
In the following discussion regarding our United States and International segments, references to net wells, acres, sales or investment indicate our ownership interest or share, as the context requires. During the year, we renamed our United States E&P and International E&P segments to the United States and International segments. The characteristics and composition of these segments remained unchanged and there was no effect on previously reported segment information. See
Note 1
for further information.
5
United States Segment
We are engaged in oil and gas exploration, development and production activities in the U.S. Our primary focus in the United States segment is concentrated within our four high quality resource plays. See
Item 7. Management's Discussion and Analysis of Financial Condition and Results of Operations
for further detail on current year results.
United States – U.S. Resource Plays
Eagle Ford
– We have been operating in the South Texas Eagle Ford play since 2011, where roughly two thirds of our acreage is located in Karnes and Atascosa Counties. Our focus is capital efficient development with a goal of maximizing returns and cash flow generation while extending our core acreage. We operate 32 central gathering and treating facilities across the play that support more than 1,600 producing wells. We also own and operate the Sugarloaf gathering system, a 42-mile natural gas pipeline through the heart of our acreage in Karnes and Atascosa Counties.
Bakken
– We have been operating in the Williston Basin since 2006. The majority of our core acreage is within McKenzie, Mountrail, and Dunn Counties in North Dakota targeting the Middle Bakken and Three Forks reservoirs. We continue focusing our investment in our high-return Myrmidon and Hector areas, while also delineating our position across the rest of our acreage.
Oklahoma
– With a history in Oklahoma that dates back more than 100 years, our primary focus has recently been the transition to early infill development in the STACK Meramec and SCOOP Woodford, while progressing delineation of other plays across our footprint. We primarily hold net acreage with rights to the Woodford, Springer, Meramec, Osage and other prospect intervals, with a majority of this in the SCOOP and STACK.
Northern Delaware
– We have been operating in the Northern Delaware basin, which is located within the greater Permian area, since we closed on two major acquisitions in 2017. These acquisitions gave us a strong foundational footprint in the region where we have the majority of our acreage in Eddy and Lea counties primarily in the Wolfcamp and Bone Spring New Mexico plays. Our focus since entering the play has been to strategically advance our position and prepare for future development by further coring up our footprint, progressing early delineation of our acreage, improving our cost structure and securing midstream solutions. See Item 8. Financial Statements and Supplementary Data –
Note 4
to the consolidated financial statements for further detail.
Other United States
Our remaining properties in the United States primarily consist of our newly acquired acreage in the emerging Louisiana Austin Chalk play and outside operated assets in the Gulf of Mexico, including our 3.5% overriding royalty interest in the Ursa fields. During 2018 we acquired approximately 260,000 net acres in the Louisiana Austin Chalk play at a cost of less than $850 per acre. Additionally, in the fourth quarter 2018, we entered into an agreement to sell our working interest in the Droshky field, in the Gulf of Mexico, and as a result it is classified as held for sale in the consolidated balance sheet at
December 31, 2018
. This transaction closed in the first quarter of 2019.
During 2018 we closed on the sale of several non-core conventional properties, see Item 8. Financial Statements and Supplementary Data –
Note 5
to the consolidated financial statements for further detail.
International Segment
We are engaged in oil and gas development and production across our international locations primarily in E.G. and U.K. We include the results of our LPG processing plant, gas liquefaction operations and methanol production operations in E.G. in our International segment.
International
Equatorial Guinea
– We own a 63% operated working interest under a production sharing contract in the Alba field and an 80% operated working interest in Block D, both of which are offshore E.G. Operational availability from our company-operated facilities averaged approximately 97% in
2018
.
Equatorial Guinea – Gas Processing
–
We own a
52%
interest in Alba Plant LLC, accounted for as an equity method investment, which operates an onshore LPG processing plant located on Bioko Island. Alba field natural gas, under a long-term contract at a fixed price per btu, is processed by the LPG plant. The LPG plant extracts secondary condensate and LPG from the natural gas stream and uses some of the remaining dry natural gas in its operations.
We also own
60%
of EGHoldings and
45%
of AMPCO, both accounted for as equity method investments. EGHoldings operates a 3.7 mmta LNG production facility and AMPCO operates a methanol plant, both located on Bioko Island. These facilities allow us to further monetize natural gas production from the Alba field. The LNG production facility sells LNG under a 3.4 mmta sales and purchase agreement. Under the agreement, which runs through 2023, the purchaser takes delivery of the LNG on Bioko Island, with pricing linked principally to the Henry Hub index. Gross sales of LNG from this production facility
6
totaled approximately 3.5 mmta in
2018
. AMPCO had gross sales totaling approximately 1,000 mt in
2018
. Methanol production is sold to customers in Europe and the U.S.
United Kingdom
– Our operated assets in the U.K. sector of the North Sea are the Brae area complex where we have a 42% working interest in the South, Central, North and West Brae fields, a 39% working interest in the East Brae field, and a 28% working interest in the nearby Braemar field. We own non-operated working interests in the Foinaven area complex, consisting of a 28% working interest in the main Foinaven field, a 47% working interest in East Foinaven and a 20% working interest in the T35 and T25 fields.
Libya
– In the first quarter of
2018
, we closed on the sale of our subsidiary, Marathon Oil Libya Limited, which held our
16.33%
non-operated interest in the Waha concessions in Libya. See Item 8. Financial Statements and Supplementary Data –
Note 5
to the consolidated financial statements for further detail.
Other International
Kurdistan Region of Iraq
– We have a non-operated 15% working interest in the Atrush block located north-northwest of Erbil. During the fourth quarter of 2018, we entered into an agreement to sell our Kurdistan subsidiary, Marathon Oil KDV B.V., and as a result it is classified as held for sale in the consolidated balance sheet at
December 31, 2018
. We expect this transaction to close in the first half of 2019 which will complete our full country exit from Kurdistan.
Additionally during 2018, we entered into separate agreements to sell certain non-core properties in our International segment. See Item 8. Financial Statements and Supplementary Data -
Note 5
to the consolidated financial statements for information about these dispositions.
Reserves
Proved reserves are required to be disclosed by continent and by country if the proved reserves related to any geographic area, on an oil equivalent barrel basis, represent 15% or more of our total proved reserves. A geographic area can be an individual country, group of countries within a continent or a continent. Other International ("Other Int’l"), includes the U.K. and the Kurdistan Region of Iraq. Approximately
86%
of our proved reserves are located in OECD countries, with
84%
located within the U.S.
The following tables set forth estimated quantities of our total proved crude oil and condensate, NGLs and natural gas reserves based upon SEC pricing for period ended December 31,
2018
.
|
|
|
||||||||||
|
December 31, 2018
|
U.S.
|
E.G.
|
Other Int'l
|
Total
|
|||||||
|
Proved Developed Reserves
|
|||||||||||
|
Crude oil and condensate
(mmbbl)
|
287
|
|
36
|
|
22
|
|
345
|
|
|||
|
Natural gas liquids
(mmbbl)
|
119
|
|
22
|
|
—
|
|
141
|
|
|||
|
Natural gas
(bcf)
|
869
|
|
715
|
|
7
|
|
1,591
|
|
|||
|
Total proved developed reserves
(mmboe)
|
552
|
|
176
|
|
24
|
|
752
|
|
|||
|
Proved Undeveloped Reserves
|
|
|
|||||||||
|
Crude oil and condensate (
mmbbl
)
|
308
|
|
—
|
|
3
|
|
311
|
|
|||
|
Natural gas liquids (
mmbbl
)
|
105
|
|
—
|
|
—
|
|
105
|
|
|||
|
Natural gas (
bcf
)
|
684
|
|
—
|
|
—
|
|
684
|
|
|||
|
Total proved undeveloped reserves (
mmboe
)
|
526
|
|
—
|
|
3
|
|
529
|
|
|||
|
Total Proved Reserves
|
|
|
|||||||||
|
Crude oil and condensate (
mmbbl
)
|
595
|
|
36
|
|
25
|
|
656
|
|
|||
|
Natural gas liquids (
mmbbl
)
|
224
|
|
22
|
|
—
|
|
246
|
|
|||
|
Natural gas (
bcf
)
|
1,553
|
|
715
|
|
7
|
|
2,275
|
|
|||
|
Total proved reserves (
mmboe
)
|
1,078
|
|
176
|
|
27
|
|
1,281
|
|
|||
Of the total estimated proved reserves, approximately
51%
was crude oil and condensate. As of December 31,
2018
, our estimated proved developed reserves totaled
752
mmboe or
59%
and estimated proved undeveloped reserves totaling
529
mmboe or
41%
of our total proved reserves. For additional detail on reserves, see Item 8. Financial Statements and Supplementary Data -
Supplementary Information on Oil and Gas Producing Activities
.
7
Productive and Drilling Wells
For our United States and International segments, the following table sets forth gross and net productive wells, service wells and drilling wells as of December 31 for the years presented.
|
|
Productive Wells
|
|
|
|
|
||||||||||||||||||
|
|
Oil
|
Natural Gas
|
Service Wells
|
Drilling Wells
|
|||||||||||||||||||
|
|
Gross
|
Net
|
Gross
|
Net
|
Gross
|
Net
|
Gross
|
Net
|
|||||||||||||||
|
2018
|
|||||||||||||||||||||||
|
U.S.
(a)
|
4,630
|
|
2,056
|
|
1,703
|
|
655
|
|
209
|
|
21
|
|
43
|
|
18
|
|
|||||||
|
E.G.
|
—
|
|
—
|
|
19
|
|
12
|
|
—
|
|
—
|
|
—
|
|
—
|
|
|||||||
|
Other International
|
62
|
|
22
|
|
11
|
|
4
|
|
24
|
|
8
|
|
—
|
|
—
|
|
|||||||
|
Total
|
4,692
|
|
2,078
|
|
1,733
|
|
671
|
|
233
|
|
29
|
|
43
|
|
18
|
|
|||||||
|
2017
|
|
||||||||||||||||||||||
|
U.S.
|
5,132
|
|
1,905
|
|
1,690
|
|
676
|
|
799
|
|
70
|
|
|||||||||||
|
E.G.
|
—
|
|
—
|
|
19
|
|
12
|
|
—
|
|
—
|
|
|||||||||||
|
Libya
(b)
|
1,071
|
|
175
|
|
7
|
|
2
|
|
94
|
|
16
|
|
|||||||||||
|
Total Africa
|
1,071
|
|
175
|
|
26
|
|
14
|
|
94
|
|
16
|
|
|||||||||||
|
Other International
|
61
|
|
22
|
|
19
|
|
7
|
|
23
|
|
8
|
|
|||||||||||
|
Total
|
6,264
|
|
2,102
|
|
1,735
|
|
697
|
|
916
|
|
94
|
|
|||||||||||
|
2016
|
|||||||||||||||||||||||
|
U.S.
|
4,533
|
|
1,650
|
|
1,830
|
|
708
|
|
821
|
|
85
|
|
|||||||||||
|
E.G.
|
—
|
|
—
|
|
17
|
|
11
|
|
2
|
|
1
|
|
|||||||||||
|
Libya
|
1,071
|
|
175
|
|
7
|
|
1
|
|
94
|
|
16
|
|
|||||||||||
|
Total Africa
|
1,071
|
|
175
|
|
24
|
|
12
|
|
96
|
|
17
|
|
|||||||||||
|
Other International
|
62
|
|
23
|
|
35
|
|
14
|
|
23
|
|
8
|
|
|||||||||||
|
Total
|
5,666
|
|
1,848
|
|
1,889
|
|
734
|
|
940
|
|
110
|
|
|||||||||||
|
(a)
|
The 2018 decrease in gross productive oil wells and gross service wells is a result of the sale of non-core, non-operated conventional properties in the United States segment during the third quarter of 2018. See Item 8. Financial Statements and Supplementary Data -
Note 5
to the consolidated financial statements for information about these dispositions.
|
|
(b)
|
Libya was removed from 2018 due to the sale of our subsidiary in Libya, see Item 8. Financial Statements and Supplementary Data -
Note 5
to the consolidated financial statements for further information.
|
8
Drilling Activity
For our United States and International segments, the table below sets forth, by geographic area, the number of net productive and dry development and exploratory wells completed as of December 31 for the years represented.
|
|
Development
|
Exploratory
|
||||||||||||||||||||||||
|
|
Oil
|
Natural
Gas
|
Dry
|
Total
|
Oil
|
Natural
Gas
|
Dry
|
Total
|
Total
|
|||||||||||||||||
|
2018
|
||||||||||||||||||||||||||
|
U.S.
|
171
|
|
25
|
|
—
|
|
196
|
|
66
|
|
36
|
|
2
|
|
104
|
|
300
|
|
||||||||
|
E.G.
|
—
|
|
—
|
|
—
|
|
—
|
|
—
|
|
—
|
|
1
|
|
1
|
|
1
|
|
||||||||
|
Other International
|
—
|
|
—
|
|
—
|
|
—
|
|
—
|
|
—
|
|
—
|
|
—
|
|
—
|
|
||||||||
|
Total
|
171
|
|
25
|
|
—
|
|
196
|
|
66
|
|
36
|
|
3
|
|
105
|
|
301
|
|
||||||||
|
2017
|
||||||||||||||||||||||||||
|
U.S.
|
107
|
|
27
|
|
—
|
|
134
|
|
88
|
|
16
|
|
—
|
|
104
|
|
238
|
|
||||||||
|
E.G.
|
—
|
|
—
|
|
—
|
|
—
|
|
—
|
|
—
|
|
—
|
|
—
|
|
—
|
|
||||||||
|
Libya
|
—
|
|
—
|
|
—
|
|
—
|
|
—
|
|
—
|
|
—
|
|
—
|
|
—
|
|
||||||||
|
Total Africa
|
—
|
|
—
|
|
—
|
|
—
|
|
—
|
|
—
|
|
—
|
|
—
|
|
—
|
|
||||||||
|
Other International
|
—
|
|
—
|
|
—
|
|
—
|
|
—
|
|
—
|
|
2
|
|
2
|
|
2
|
|
||||||||
|
Total
|
107
|
|
27
|
|
—
|
|
134
|
|
88
|
|
16
|
|
2
|
|
106
|
|
240
|
|
||||||||
|
2016
|
||||||||||||||||||||||||||
|
U.S.
|
64
|
|
12
|
|
—
|
|
76
|
|
70
|
|
27
|
|
3
|
|
100
|
|
176
|
|
||||||||
|
E.G.
|
—
|
|
—
|
|
—
|
|
—
|
|
—
|
|
—
|
|
—
|
|
—
|
|
—
|
|
||||||||
|
Libya
|
—
|
|
—
|
|
—
|
|
—
|
|
—
|
|
—
|
|
1
|
|
—
|
|
—
|
|
||||||||
|
Total Africa
|
—
|
|
—
|
|
—
|
|
—
|
|
—
|
|
—
|
|
1
|
|
1
|
|
1
|
|
||||||||
|
Other International
|
—
|
|
—
|
|
—
|
|
—
|
|
—
|
|
—
|
|
—
|
|
—
|
|
—
|
|
||||||||
|
Total
|
64
|
|
12
|
|
—
|
|
76
|
|
70
|
|
27
|
|
4
|
|
101
|
|
177
|
|
||||||||
Acreage
We believe we have satisfactory title to our United States and International properties in accordance with standards generally accepted in the industry; nevertheless, we can be involved in title disputes from time to time which may result in litigation. In the case of undeveloped properties, an investigation of record title is made at the time of acquisition. Drilling title opinions are usually prepared before commencement of drilling operations. Our title to properties may be subject to burdens such as royalty, overriding royalty, carried, net profits, working and other similar interests and contractual arrangements customary in the industry. In addition, our interests may be subject to obligations or duties under applicable laws or burdens such as net profits interests, liens related to operating agreements, development obligations or capital commitments under international production sharing contracts or exploration licenses.
The following table sets forth, by geographic area, the gross and net developed and undeveloped acreage held in our United States and International segments as of
December 31, 2018
.
|
|
Developed
|
Undeveloped
|
Developed and
Undeveloped
|
||||||||||||||
|
(In thousands)
|
Gross
|
Net
|
Gross
|
Net
|
Gross
|
Net
|
|||||||||||
|
U.S.
|
1,352
|
|
1,004
|
|
484
|
|
356
|
|
1,836
|
|
1,360
|
|
|||||
|
E.G.
|
82
|
|
67
|
|
54
|
|
36
|
|
136
|
|
103
|
|
|||||
|
Other International
|
82
|
|
29
|
|
71
|
|
12
|
|
153
|
|
41
|
|
|||||
|
Total
|
1,516
|
|
1,100
|
|
609
|
|
404
|
|
2,125
|
|
1,504
|
|
|||||
9
In the ordinary course of business, based on our evaluations of certain geologic trends and prospective economics, we have allowed certain lease acreage to expire and may allow additional acreage to expire in the future. If production is not established or we take no other action to extend the terms of the leases, licenses or concessions, undeveloped acreage listed in the table below will expire over the next three years. We plan to continue the terms of certain of these licenses and concession areas or retain leases through operational or administrative actions.
|
Net Undeveloped Acres Expiring
|
||||||||
|
Year Ended December 31,
|
||||||||
|
(In thousands)
|
2019
|
2020
|
2021
|
|||||
|
U.S.
|
31
|
|
64
|
|
134
|
|
||
|
E.G.
(a)
|
36
|
|
—
|
|
—
|
|
||
|
Total
|
67
|
|
64
|
|
134
|
|
||
|
(a)
|
This relates to the conclusion of our evaluation of drilling opportunities on the Rodo well in Alba Block Sub Area B, offshore E.G. and in 2018 determined that we would not pursue further activity.
|
Net Sales Volumes
|
|
|
Africa
|
|
|
||||||||||||||||
|
|
U.S.
|
E.G.
|
Libya
|
Other Int'l
|
Cont Ops
|
Disc Ops
|
Total |
|||||||||||||
|
Year Ended December 31,
|
||||||||||||||||||||
|
2018
|
||||||||||||||||||||
|
Crude and condensate
(mbbld)
(a)
|
171
|
|
17
|
|
7
|
|
15
|
|
210
|
|
—
|
|
210
|
|
||||||
|
Natural gas liquids
(mbbld)
|
55
|
|
11
|
|
—
|
|
—
|
|
66
|
|
—
|
|
66
|
|
||||||
|
Natural gas
(mmcfd)
(b)
|
429
|
|
416
|
|
5
|
|
14
|
|
864
|
|
—
|
|
864
|
|
||||||
|
Total sales volumes
(mboed)
|
298
|
|
97
|
|
8
|
|
17
|
|
420
|
|
—
|
|
420
|
|
||||||
|
2017
|
|
|
||||||||||||||||||
|
Crude and condensate
(mbbld)
(a)
|
133
|
|
21
|
|
19
|
|
12
|
|
185
|
|
—
|
|
185
|
|
||||||
|
Natural gas liquids
(mbbld)
|
43
|
|
11
|
|
—
|
|
1
|
|
55
|
|
—
|
|
55
|
|
||||||
|
Natural gas
(mmcfd)
(b)
|
348
|
|
459
|
|
4
|
|
22
|
|
833
|
|
—
|
|
833
|
|
||||||
|
Synthetic crude oil
(mbbld)
(c)
|
—
|
|
—
|
|
—
|
|
—
|
|
—
|
|
18
|
|
18
|
|
||||||
|
Total sales volumes
(mboed)
|
234
|
|
109
|
|
20
|
|
16
|
|
379
|
|
18
|
|
397
|
|
||||||
|
2016
|
|
|
||||||||||||||||||
|
Crude and condensate
(mbbld)
(a)
|
131
|
|
20
|
|
3
|
|
12
|
|
166
|
|
—
|
|
166
|
|
||||||
|
Natural gas liquids
(mbbld)
|
40
|
|
11
|
|
—
|
|
—
|
|
51
|
|
—
|
|
51
|
|
||||||
|
Natural gas
(mmcfd)
(b)
|
314
|
|
425
|
|
—
|
|
28
|
|
767
|
|
—
|
|
767
|
|
||||||
|
Synthetic crude oil
(mbbld)
(c)
|
—
|
|
—
|
|
—
|
|
—
|
|
—
|
|
48
|
|
48
|
|
||||||
|
Total sales volumes
(mboed)
|
223
|
|
102
|
|
3
|
|
17
|
|
345
|
|
48
|
|
393
|
|
||||||
|
(a)
|
The amounts correspond with the basis for fiscal settlements with governments, representing equity tanker liftings and direct deliveries of liquid hydrocarbons.
|
|
(b)
|
Includes natural gas acquired for injection and subsequent resale.
|
|
(c)
|
Upgraded bitumen excluding blendstocks.
|
Average Production Cost per Unit
(a)
|
|
Africa
|
|
|||||||||||||||||||||||||
|
(Dollars per boe)
|
U.S.
|
E.G.
|
Libya
|
Other Int'l
|
Cont Ops
|
Disc Ops
|
Total
|
||||||||||||||||||||
|
2018
|
$
|
9.83
|
|
$
|
1.91
|
|
$
|
4.35
|
|
$
|
30.02
|
|
$
|
8.68
|
|
$
|
—
|
|
$
|
8.68
|
|
||||||
|
2017
|
9.49
|
|
2.12
|
|
6.08
|
|
26.61
|
|
7.90
|
|
29.72
|
|
9.23
|
|
|||||||||||||
|
2016
|
9.84
|
|
2.17
|
|
N.M.
|
|
23.13
|
|
8.41
|
|
29.36
|
|
11.02
|
|
|||||||||||||
|
(a)
|
Production, severance and property taxes are excluded; however, shipping and handling as well as other operating expenses are included in the production costs used in this calculation. See Item 8. Financial Statements and Supplementary Data –
Supplementary Information on Oil and Gas Producing Activities
- Results of Operations for Oil and Gas Production Activities for more information regarding production costs.
|
N.M.
Not meaningful information due to limited sales.
10
Average Sales Price per Unit
(a)
|
|
|
Africa
|
|
|
|||||||||||||||||||||||
|
(Dollars per unit)
|
U.S.
|
E.G.
|
Libya
|
Total
|
Other Int'l
|
Disc Ops
|
Total |
||||||||||||||||||||
|
2018
|
|||||||||||||||||||||||||||
|
Crude and condensate
(bbl)
|
$
|
63.11
|
|
$
|
55.28
|
|
$
|
73.75
|
|
$
|
60.65
|
|
$
|
70.39
|
|
$
|
—
|
|
$
|
63.32
|
|
||||||
|
Natural gas liquids
(bbl)
|
24.54
|
|
1.00
|
|
(b)
|
—
|
|
1.00
|
|
41.66
|
|
—
|
|
20.85
|
|
||||||||||||
|
Natural gas
(mcf)
|
2.65
|
|
0.24
|
|
(b)
|
4.57
|
|
0.30
|
|
8.03
|
|
—
|
|
1.58
|
|
||||||||||||
|
2017
|
|||||||||||||||||||||||||||
|
Crude and condensate
(bbl)
|
$
|
49.35
|
|
$
|
46.02
|
|
$
|
60.72
|
|
$
|
53.11
|
|
$
|
52.66
|
|
$
|
—
|
|
$
|
50.38
|
|
||||||
|
Natural gas liquids
(bbl)
|
20.55
|
|
1.00
|
|
(b)
|
—
|
|
1.00
|
|
39.65
|
|
—
|
|
16.65
|
|
||||||||||||
|
Natural gas
(mcf)
|
2.84
|
|
0.24
|
|
(b)
|
5.03
|
|
0.28
|
|
6.28
|
|
—
|
|
1.51
|
|
||||||||||||
|
Synthetic crude oil
(bbl)
|
—
|
|
—
|
|
—
|
|
—
|
|
—
|
|
47.39
|
|
47.39
|
|
|||||||||||||
|
2016
|
|||||||||||||||||||||||||||
|
Crude and condensate
(bbl)
|
$
|
38.57
|
|
$
|
38.85
|
|
$
|
57.69
|
|
$
|
40.95
|
|
$
|
43.21
|
|
$
|
—
|
|
$
|
39.23
|
|
||||||
|
Natural gas liquids
(bbl)
|
13.15
|
|
1.00
|
|
(b)
|
—
|
|
1.00
|
|
26.41
|
|
—
|
|
10.68
|
|
||||||||||||
|
Natural gas
(mcf)
|
2.38
|
|
0.24
|
|
(b)
|
—
|
|
0.24
|
|
4.80
|
|
—
|
|
1.26
|
|
||||||||||||
|
Synthetic crude oil
(bbl)
|
—
|
|
—
|
|
—
|
|
—
|
|
—
|
|
37.57
|
|
37.57
|
|
|||||||||||||
|
(a)
|
Excludes gains or losses on commodity derivative instruments.
|
|
(b)
|
Primarily represents fixed prices under long-term contracts with Alba Plant LLC, AMPCO and/or EGHoldings, which are equity method investees. We include our share of income from each of these equity method investees in our International Segment.
|
Marketing
Our reportable operating segments include activities related to the marketing and transportation of substantially all of our crude oil and condensate, NGLs and natural gas. These activities include the transportation of production to market centers, the sale of commodities to third parties and the storage of production. We balance our various sales, storage and transportation positions in order to aggregate volumes to satisfy transportation commitments and to achieve flexibility within product types and delivery points. Such activities can include the purchase of commodities from third parties for resale.
Gross Delivery Commitments
We have committed to deliver gross quantities of crude oil and condensate, NGLs and natural gas to customers under a variety of contracts. As of
December 31, 2018
, the contracts for fixed and determinable quantities were at variable, market-based pricing and related primarily to the following commitments:
|
2019
|
2020
|
2021
|
Thereafter
|
Commitment Period Through
|
|||||||||
|
Eagle Ford
|
|||||||||||||
|
Crude and condensate
(mbbld)
|
65
|
|
51
|
|
—
|
|
—
|
2020
|
|||||
|
Natural gas liquids
(mbbld)
|
1
|
|
—
|
|
—
|
|
—
|
2020
|
|||||
|
Natural gas
(mmcfd)
|
120
|
|
120
|
|
56
|
|
36
|
2022
|
|||||
|
Bakken
|
|||||||||||||
|
Crude and condensate
(mbbld)
|
10
|
|
10
|
|
10
|
|
5 - 10
|
2027
|
|||||
|
Natural gas
(mmcfd)
|
3
|
|
3
|
|
3
|
|
3 - 25
|
2028
|
|||||
|
Northern Delaware
|
|||||||||||||
|
Crude and condensate
(mbbld)
|
21
|
|
19
|
|
—
|
|
—
|
2020
|
|||||
All of these contracts provide the options of delivering third-party volumes or paying a monetary shortfall penalty if production is inadequate to satisfy our commitment. In addition to the contracts discussed above, we have entered into numerous agreements for transportation and processing of our equity production. Some of these contracts have volumetric requirements which could require monetary shortfall penalties if our production is inadequate to meet the terms.
11
Competition
Competition exists in all sectors of the oil and gas industry and we compete with major integrated and independent oil and gas companies, as well as national oil companies. We compete, in particular, in the exploration for and development of new reserves, acquisition of oil and natural gas leases and other properties, the marketing and delivery of our production into worldwide commodity markets and for the labor and equipment required for exploration and development of those properties. Principal methods of competing include geological, geophysical, and engineering research and technology, experience and expertise, economic analysis in connection with portfolio management, and safely operating oil and gas producing properties. See Item 1A. Risk Factors for discussion of specific areas in which we compete and related risks.
Environmental, Health and Safety Matters
The Health, Environmental, Safety and Corporate Responsibility Committee of our Board of Directors is responsible for overseeing our position on public issues, including environmental, health and safety matters. Our Corporate Health, Environment, Safety and Security organization has the responsibility to ensure that our operating organizations maintain environmental compliance systems that support and foster our compliance with applicable laws and regulations. Committees comprised of certain of our officers review our overall performance associated with various environmental compliance programs. We also have a Corporate Emergency Response Team which oversees our response to any major environmental or other emergency incident involving us or any of our properties.
Our businesses are subject to numerous laws and regulations relating to the protection of the environment, health and safety at the national, state and local levels. These laws and their implementing regulations and other similar state and local laws and rules can impose certain operational controls for minimization of pollution or recordkeeping, monitoring and reporting requirements or other operational or siting constraints on our business, result in costs to remediate releases of regulated substances, including crude oil, into the environment, or require costs to remediate sites to which we sent regulated substances for disposal. In some cases, these laws can impose strict liability for the entire cost of clean-up on any responsible party without regard to negligence or fault and impose liability on us for the conduct of others (such as prior owners or operators of our assets) or conditions others have caused, or for our acts that complied with all applicable requirements when we performed them. We have incurred and will continue to incur capital, operating and maintenance, and remediation expenditures as a result of environmental laws and regulations.
New laws have been enacted and regulations are being adopted by various regulatory agencies on a continuing basis and the costs of compliance with these new laws and regulations can only be broadly appraised until their implementation becomes more defined.
For a discussion of environmental capital expenditures and costs of compliance for air, water, solid waste and remediation, see
Item 3. Legal Proceedings
and
Item 7. Management’s Discussion and Analysis of Financial Condition and Results of Operations – Management’s Discussion and Analysis of Environmental Matters, Litigation and Contingencies
.
Air and Climate Change
Environmental advocacy groups and regulatory agencies in the United States and other countries have focused considerable attention on the emissions of carbon dioxide, methane and other greenhouse gases and their potential role in climate change. Developments in greenhouse gas initiatives may affect us and other similarly situated companies operating in the oil and gas industry. As part of our commitment to environmental stewardship, we estimate and publicly report greenhouse gas emissions from our operations. We are working to continuously improve the accuracy and completeness of these estimates. In addition, we continuously strive to improve operational and energy efficiencies through resource and energy conservation where practicable and cost effective.
Government entities and other groups have filed lawsuits in several states and other jurisdictions seeking to hold a wide variety of companies that produce fossil fuels liable for the alleged impacts of the greenhouse gas emissions attributable to those fuels. The lawsuits allege damages as a result of global warming and the plaintiffs are seeking unspecified damages and abatement under various tort theories. Marathon Oil has been named as a defendant in several of these lawsuits, along with numerous other companies. Similar lawsuits may be filed in other jurisdictions. While the ultimate outcome and impact to us cannot be predicted with certainty, we believe that the claims made against us are without merit and will not have a material adverse effect on our consolidated financial position, results of operations or cash flow.
The EPA finalized a more stringent National Ambient Air Quality Standard (“NAAQS”) for ozone in October 2015. States that contain any areas designated as non-attainment, and any tribes that choose to do so, will be required to complete development of implementation plans in the 2020-2021 time frame. The EPA may in the future designate additional areas as non-attainment, including areas in which we operate, which may result in an increase in costs for emission controls and requirements for additional monitoring and testing, as well as a more cumbersome permitting process. Although there may be
12
an adverse financial impact (including compliance costs, potential permitting delays and increased regulatory requirements) associated with this revised regulation, the extent and magnitude of that impact cannot be reliably or accurately estimated due to the present uncertainty regarding any additional measures and how they will be implemented. The EPA's final rule has been judicially challenged by both industry and other interested parties, and the outcome of this litigation may also impact implementation and revisions to the rule.
In November 2016, the Bureau of Land Management (“BLM”) issued a final rule to further restrict venting and/or flaring of gas from facilities subject to BLM jurisdiction, and to modify certain royalty requirements. BLM issued a two-year stay of these requirements in December 2017. In September 2018, BLM published a final rule to rescind substantial portions of the rule. The rescission was challenged by multiple parties in the U.S. District Court for the Northern District of California. If the judicial challenges to the rule are successful and the rule were to come back into effect, the requirements would result in additional costs of compliance as well as increased monitoring, recordkeeping and recording for some of our facilities.
Hydraulic Fracturing
Hydraulic fracturing is a commonly used process that involves injecting water, sand and small volumes of chemicals into the wellbore to fracture the hydrocarbon-bearing rock thousands of feet below the surface to facilitate higher flow of hydrocarbons into the wellbore. Our business uses this technique extensively throughout our operations. Hydraulic fracturing has been regulated at the state and local level through permitting and compliance requirements. Various state and local-level initiatives in regions with substantial shale resources have been or may be proposed or implemented to further regulate hydraulic fracturing practices, limit water withdrawals and water use, require disclosure of fracturing fluid constituents, restrict which additives may be used, or implement temporary or permanent bans on hydraulic fracturing.
Water
In 2014, the EPA and the U.S. Army Corps of Engineers published proposed regulations which expand the surface waters that are regulated under the federal Clean Water Act (“CWA”) and its various programs. While these regulations were finalized largely as proposed in 2015, the rule has been stayed by the courts pending a substantive decision on the merits. In December 2018, EPA and the Army Corps of Engineers issued a proposed rule that, if finalized, would amend the 2015 regulations to narrow the scope of federal CWA jurisdiction. If the new proposed rule is not finalized and the 2015 rule is ultimately implemented, the expansion of CWA jurisdiction will result in additional costs of compliance as well as increased monitoring, recordkeeping and recording for some of our facilities.
For additional information, see
Item 1A. Risk Factors
.
Concentrations of Credit Risk
We are exposed to credit risk in the event of nonpayment by counterparties, a significant portion of which are concentrated in energy-related industries. The creditworthiness of customers and other counterparties is subject to continuing review, including the use of master netting agreements, where appropriate. In
2018
, sales to Valero Marketing and Supply and Flint Hills Resources and each of their respective affiliates, each accounted for approximately
11%
of our total revenues. In
2017
, sales to Vitol and each of their respective affiliates accounted for approximately
10%
of our total revenues. In
2016
, sales to Valero Marketing and Supply, Tesoro Petroleum, and Flint Hills Resources and each of their respective affiliates accounted for approximately
13%
,
11%
and
10%
of our total revenues.
Trademarks, Patents and Licenses
We currently hold U.S. and foreign patents. Although in the aggregate our trademarks and patents are important to us, we do not regard any single trademark, patent, or group of related trademarks or patents as critical or essential to our business as a whole.
Employees
We had approximately
2,400
active, full-time employees as of
December 31, 2018
.
13
Executive Officers of the Registrant
The executive officers of Marathon Oil and their ages as of February 1,
2019
, are as follows:
|
Lee M. Tillman
|
57
|
Chairman, President and Chief Executive Officer
|
||
|
Dane E. Whitehead
|
57
|
Executive Vice President and Chief Financial Officer
|
||
|
T. Mitch Little
|
55
|
Executive Vice President—Operations
|
||
|
Reginald D. Hedgebeth
|
51
|
Senior Vice President, General Counsel and Secretary
|
||
|
Patrick J. Wagner
|
54
|
Executive Vice President—Corporate Development and Strategy
|
||
|
Gary E. Wilson
|
57
|
Vice President, Controller and Chief Accounting Officer
|
||
Mr. Tillman was appointed by the board of directors as chairman of the board effective February 1, 2019. In August 2013 he was appointed as president and chief executive officer. Prior to this appointment, Mr. Tillman served as vice president of engineering for ExxonMobil Development Company (a project design and execution company), where he was responsible for all global engineering staff engaged in major project concept selection, front-end design and engineering. Between 2007 and 2010, Mr. Tillman served as North Sea production manager and lead country manager for subsidiaries of ExxonMobil in Stavanger, Norway. Mr. Tillman began his career in the oil and gas industry at Exxon Corporation in 1989 as a research engineer and has extensive operations management and leadership experience.
Mr. Whitehead was appointed executive vice president and chief financial officer in March 2017. Prior to this appointment, Mr. Whitehead served as executive vice president and chief financial officer of both EP Energy Corp. and EP Energy LLC (oil and natural gas producer) since May 2012. Between 2009 and 2012 Mr. Whitehead served as senior vice president of strategy and enterprise business development and a member of El Paso Corporation's executive committee. He joined El Paso Exploration & Production Company as senior vice president and chief financial officer in 2006. Before joining El Paso Mr. Whitehead was vice president, controller and chief accounting officer of Burlington Resources Inc. (oil and natural gas producer), and formerly senior vice president and CFO of Burlington Resources Canada.
Mr. Little was appointed executive vice president of operations in August 2016 after having served as vice president, conventional since December 2015, vice president international and offshore exploration and production operations since September 2013, and as vice president, international production operations since September 2012. Prior to that, Mr. Little was resident manager of our Norway operations and served as general manager, worldwide drilling and completions. Mr. Little joined Marathon Oil in 1986 and has since held a number of engineering and management positions of increasing responsibility.
Mr. Hedgebeth was appointed senior vice president, general counsel and secretary in April 2017. Between 2009 and 2017 Mr. Hedgebeth served as general counsel, corporate secretary and chief compliance officer for Spectra Energy Corp (oil and natural gas pipeline company) and general counsel for Spectra Energy Partners, LP. Before joining Spectra Energy Mr. Hedgebeth served as senior vice president, general counsel and secretary with Circuit City Stores, Inc. (consumer electronics retail company), and vice president of legal for The Home Depot, Inc. (home improvement retail company).
Mr. Wagner was appointed executive vice president of corporate development and strategy in November 2017 after having served as senior vice president of corporate development and strategy since March 2017, vice president of corporate development and interim chief financial officer since August 2016 and vice president of corporate development since April 2014. Prior to this appointment, he served as senior vice president, western business unit, for QR Energy LP (an oil and natural gas producer) and the affiliated Quantum Resources Management, which he joined in early 2012 as vice president, exploration. Prior to that, Mr. Wagner was managing director in Houston for Scotia Waterous, the oil and gas arm of Scotiabank (an international banking services provider), from 2010 to 2012. Before joining Scotia, Mr. Wagner was vice president, Gulf of Mexico, for Devon Energy Corp. (an oil and natural gas producer), having joined Devon in 2003 as manager, international exploitation.
Mr. Wilson was appointed vice president, controller and chief accounting officer in October 2014. Prior to joining Marathon Oil, he served in various finance and accounting positions of increasing responsibility at Noble Energy, Inc. (a global exploration and production company) since 2001, including as director corporate accounting from February 2014 through September 2014, director global operations services finance from October 2012 through February 2014, director controls and reporting from April 2011 through September 2012, and international finance manager from September 2009 through March 2011.
14
Available Information
Our website is www.marathonoil.com. Our Annual Reports on Form 10-K, Quarterly Reports on Form 10-Q and Current Reports on Form 8-K and other reports and filings with the SEC are available free of charge on our website as soon as reasonably practicable after the reports are filed or furnished with the SEC. Information contained on our website is not incorporated into this Annual Report on Form 10-K or our other securities filings. Our filings are also available in hard copy, free of charge, by contacting our Investor Relations office. Additionally, the SEC maintains a website (www.sec.gov) that contains reports, proxy and information statements and other information regarding issuers that file electronically with the SEC.
Additionally, we make available free of charge on our website:
|
•
|
our Code of Business Conduct and Code of Ethics for Senior Financial Officers;
|
|
•
|
our Corporate Governance Principles; and
|
|
•
|
the charters of our Audit and Finance Committee, Compensation Committee, Corporate Governance and Nominating Committee and Health, Environmental, Safety and Corporate Responsibility Committee.
|
Item 1A. Risk Factors
We are subject to various risks and uncertainties in the course of our business. The following summarizes significant risks and uncertainties that may adversely affect our business, financial condition or results of operations. When considering an investment in our securities, you should carefully consider the risk factors included below as well as those matters referenced in the foregoing pages under "Disclosures Regarding Forward-Looking Statements" and other information included and incorporated by reference into this Annual Report on Form 10-K.
A substantial decline in crude oil and condensate, NGLs and natural gas prices would reduce our operating results and cash flows and could adversely impact our future rate of growth and the carrying value of our assets.
The markets for crude oil and condensate, NGLs and natural gas have been volatile and are likely to continue to be volatile in the future, causing prices to fluctuate widely. Our revenues, operating results and future rate of growth are highly dependent on the prices we receive for our crude oil and condensate, NGLs and natural gas. Many of the factors influencing prices of crude oil and condensate, NGLs and natural gas are beyond our control. These factors include:
|
•
|
worldwide and domestic supplies of and demand for crude oil and condensate, NGLs and natural gas;
|
|
•
|
the cost of exploring for, developing and producing crude oil and condensate, NGLs and natural gas;
|
|
•
|
the ability of the members of OPEC and certain non-OPEC members, such as Russia, to agree to and maintain production controls;
|
|
•
|
the production levels of non-OPEC countries, including production levels in the shale plays in the United States;
|
|
•
|
the level of drilling, completion and production activities by other exploration and production companies, and variability therein, in response to market conditions;
|
|
•
|
political instability or armed conflict in oil and natural gas producing regions;
|
|
•
|
changes in weather patterns and climate;
|
|
•
|
natural disasters such as hurricanes and tornadoes;
|
|
•
|
the price and availability of alternative and competing forms of energy;
|
|
•
|
the effect of conservation efforts;
|
|
•
|
epidemics or pandemics;
|
|
•
|
technological advances affecting energy consumption and energy supply;
|
|
•
|
domestic and foreign governmental regulations and taxes; and
|
|
•
|
general economic conditions worldwide.
|
The long-term effects of these and other factors on the prices of crude oil and condensate, NGLs and natural gas are uncertain. Historical declines in commodity prices have adversely affected our business by:
|
•
|
reducing the amount of crude oil and condensate, NGLs and natural gas that we can produce economically;
|
|
•
|
reducing our revenues, operating income and cash flows;
|
|
•
|
causing us to reduce our capital expenditures, and delay or postpone some of our capital projects;
|
15
|
•
|
requiring us to impair the carrying value of our assets;
|
|
•
|
reducing the standardized measure of discounted future net cash flows relating to crude oil and condensate, NGLs and natural gas; and
|
|
•
|
increasing the costs of obtaining capital, such as equity and short- and long-term debt.
|
Estimates of crude oil and condensate, NGLs and natural gas reserves depend on many factors and assumptions, including various assumptions that are based on conditions in existence as of the dates of the estimates. Any material changes in those conditions or other factors affecting those assumptions could impair the quantity and value of our reserves.
The proved reserve information included in this Annual Report on Form 10-K has been derived from engineering and geoscience estimates. Estimates of crude oil and condensate, NGLs, natural gas and our historical synthetic crude oil reserves were prepared, in accordance with SEC regulations, by our in-house teams of reservoir engineers and geoscience professionals and were reviewed and approved by our Corporate Reserves Group and third-party consultants. Reserves were valued based on SEC pricing for the periods ended
December 31, 2018
,
2017
and
2016
, as well as other conditions in existence at those dates. The table below provides the
2018
SEC pricing for certain benchmark prices:
|
2018 SEC Pricing
|
|||
|
WTI Crude oil (per bbl)
|
$
|
65.56
|
|
|
Henry Hub natural gas (per mmbtu)
|
$
|
3.05
|
|
|
Brent crude oil (per bbl)
|
$
|
72.70
|
|
|
Mont Belvieu NGLs (per bbl)
|
$
|
26.63
|
|
If annual SEC crude oil benchmark prices (see table above) were to decrease to approximately
$45
per bbl, or 30% below average prices used to estimate
2018
proved reserves, we would not expect price related reserve revisions to have a material impact on proved reserve volumes. Future reserve revisions could also result from changes in capital funding, drilling plans and governmental regulation, among other things.
Reserve estimation is a subjective process that involves estimating volumes to be recovered from underground accumulations of crude oil and condensate, NGLs and natural gas that cannot be directly measured. Estimates of economically producible reserves and of future net cash flows depend on a number of variable factors and assumptions, including:
|
•
|
location, size and shape of the accumulation as well as fluid, rock and producing characteristics of the accumulation;
|
|
•
|
historical production from the area, compared with production from other analogous producing areas;
|
|
•
|
the assumed impacts of regulation by governmental agencies;
|
|
•
|
assumptions concerning future operating costs, taxes, development costs and workover and repair costs; and
|
|
•
|
industry economic conditions, levels of cash flows from operations and other operating considerations.
|
As a result, different petroleum engineers and geoscientists, each using industry-accepted geologic and engineering practices and scientific methods, may produce different estimates of proved reserves and future net cash flows based on the same available data. Because of the subjective nature of such reserve estimates, each of the following items may differ materially from the estimated amounts:
|
•
|
the amount and timing of production;
|
|
•
|
the revenues and costs associated with that production; and
|
|
•
|
the amount and timing of future development expenditures.
|
16
If we are unsuccessful in acquiring or finding additional reserves, our future crude oil and condensate, NGLs and natural gas production would decline, thereby reducing our cash flows and results of operations and impairing our financial condition.
The rate of production from crude oil and condensate, NGLs and natural gas properties generally declines as reserves are depleted. Except to the extent we acquire interests in additional properties containing proved reserves, conduct successful exploration and development activities or, through engineering studies, optimize production performance or identify additional reservoirs not currently producing or secondary recovery reserves, our proved reserves will decline materially as crude oil and condensate, NGLs and natural gas are produced. Accordingly, to the extent we are not successful in replacing the crude oil and condensate, NGLs and natural gas we produce, our future revenues will decline. Creating and maintaining an inventory of prospects for future production depends on many factors, including:
|
•
|
obtaining rights to explore for, develop and produce crude oil and condensate, NGLs and natural gas in promising areas;
|
|
•
|
drilling success;
|
|
•
|
the ability to complete projects timely and cost effectively;
|
|
•
|
the ability to find or acquire additional proved reserves at acceptable costs; and
|
|
•
|
the ability to fund such activity.
|
Future exploration and drilling results are uncertain and involve substantial costs.
Drilling for crude oil and condensate, NGLs and natural gas involves numerous risks, including the risk that we may not encounter commercially productive reservoirs. The costs of drilling, completing and operating wells are often uncertain, and drilling operations may be curtailed, delayed or canceled as a result of a variety of factors, including:
|
•
|
unexpected drilling conditions;
|
|
•
|
title problems;
|
|
•
|
pressure or irregularities in formations;
|
|
•
|
equipment failures or accidents;
|
|
•
|
inflation in exploration and drilling costs;
|
|
•
|
fires, explosions, blowouts or surface cratering;
|
|
•
|
lack of, or disruption in, access to pipelines or other transportation methods; and
|
|
•
|
shortages or delays in the availability of services or delivery of equipment.
|
If crude oil and condensate, NGLs and natural gas prices decrease, it could adversely affect the abilities of our counterparties to perform their obligations to us, including abandonment obligations, which could negatively impact our financial results.
We often enter into arrangements to conduct certain business operations, such as oil and gas exploration and production, or transportation of crude oil and condensate, NGLs and natural gas, with partners, co-working interest owners, and other counterparties in order to share risks associated with those operations. In addition, we market our products to a variety of purchasers. If commodity prices decrease, some of our counterparties may experience liquidity problems and may not be able to meet their financial and other obligations, including abandonment obligations, to us. The inability of our joint venture partners or co-working interest owners to fund their portion of the costs under our joint venture agreements and joint operating agreements, or the nonperformance by purchasers, contractors or other counterparties of their obligations to us, could negatively impact our operating results and cash flows.
If we are unable to complete capital projects at their expected costs and in a timely manner, or if the market conditions assumed in our project economics deteriorate, our business, financial condition, results of operations and cash flows could be materially and adversely affected.
Delays or cost increases related to capital spending programs involving drilling and completion activities, engineering, procurement and construction of facilities (including improvements and repairs to our existing facilities) could adversely affect our ability to achieve forecasted internal rates of return and operating results. Delays in making required changes or upgrades to our facilities could subject us to fines or penalties as well as affect our ability to supply certain products we produce. Such delays or cost increases may arise as a result of unpredictable factors, many of which are beyond our control, including:
|
•
|
denial of or delay in receiving requisite regulatory approvals and/or permits;
|
17
|
•
|
unplanned increases in the cost of construction materials or labor;
|
|
•
|
disruptions in transportation of components or construction materials;
|
|
•
|
increased costs or operational delays resulting from shortages of water;
|
|
•
|
adverse weather conditions, natural disasters or other events (such as equipment malfunctions, explosions, fires or spills) affecting our facilities, or those of vendors or suppliers;
|
|
•
|
shortages of sufficiently skilled labor, or labor disagreements resulting in unplanned work stoppages;
|
|
•
|
market-related increases in a project’s debt or equity financing costs; and
|
|
•
|
nonperformance by, or disputes with, vendors, suppliers, contractors or subcontractors.
|
Any one or more of these factors could have a significant impact on our capital projects.
Our offshore operations involve special risks that could negatively impact us.
Offshore operations present technological challenges and operating risks because of the marine environment. Activities in offshore operations may pose risks because of the physical distance to oilfield service infrastructure and service providers. Environmental remediation and other costs resulting from spills or releases may result in substantial liabilities.
We may incur substantial capital expenditures and operating costs as a result of compliance with and changes in environmental, health, safety and security laws and regulations, and, as a result, our business, financial condition, results of operations and cash flows could be materially and adversely affected.
Our businesses are subject to numerous laws, regulations and other requirements relating to the protection of the environment, including those relating to the discharge of materials into the environment such as the flaring of natural gas, waste management, pollution prevention, greenhouse gas emissions and the protection of endangered species as well as laws, regulations, and other requirements relating to public and employee safety and health and to facility security. We have incurred and may continue to incur capital, operating and maintenance, and remediation expenditures as a result of these laws, regulations, and other requirements. To the extent these expenditures, as with all costs, are not ultimately reflected in the prices of our products, our operating results will be adversely affected. The specific impact of these laws, regulations, and other requirements may vary depending on a number of factors, including the age and location of operating facilities and production processes. We may also be required to make material expenditures to modify operations, install pollution control equipment, perform site clean-ups or curtail operations that could materially and adversely affect our business, financial condition, results of operations and cash flows. We may become subject to liabilities that we currently do not anticipate in connection with new, amended or more stringent requirements, stricter interpretations of existing requirements or the future discovery of contamination. In addition, any failure by us to comply with existing or future laws, regulations, and other requirements could result in civil penalties or criminal fines and other enforcement actions against us.
We believe it is likely that the scientific and political attention to issues concerning the extent, causes of and responsibility for climate change will continue, with the potential for further regulations that could affect our operations. Our operations result in greenhouse gas emissions. Currently, various legislative or regulatory measures to address greenhouse gas emissions (including carbon dioxide, methane and nitrous oxides) are in various phases of review, discussion or implementation in countries where we operate, including the U.S. and the European Union. Internationally, the United Nations Framework Convention on Climate Change finalized an agreement among 195 nations at the 21st Conference of the Parties in Paris with an overarching goal of preventing global temperatures from rising more than 2 degrees Celsius. The agreement includes provisions that every country take some action to lower emissions, but there is no legal requirement for how or by what amount emissions should be lowered. The EPA has also finalized regulations targeting new sources of methane emissions from the oil and gas industry. Finalization of new legislation, regulations or international agreements in the future could result in increased costs to operate and maintain our facilities, capital expenditures to install new emission controls at our facilities, and costs to administer and manage any potential greenhouse gas emissions or carbon trading or tax programs. These costs and capital expenditures could be material. Although uncertain, these developments could increase our costs, reduce the demand for crude oil and condensate, NGLs and natural gas, and create delays in our obtaining air pollution permits for new or modified facilities.
The potential adoption of federal, state and local legislative and regulatory initiatives related to hydraulic fracturing could result in increased compliance costs, operating restrictions or delays in the completion of oil and gas wells.
Hydraulic fracturing is a commonly used process that involves injecting water, sand, and small volumes of chemicals into the wellbore to fracture the hydrocarbon-bearing rock thousands of feet below the surface to facilitate higher flow of hydrocarbons into the wellbore. Our business uses this technique extensively throughout our U.S. operations. Hydraulic fracturing has been regulated at the state and local level through permitting and compliance requirements. Various state and local-level initiatives in regions with substantial shale resources have been or may be proposed or implemented to further
18
regulate hydraulic fracturing practices, limit water withdrawals and water use, require disclosure of fracturing fluid constituents, restrict which additives may be used, or implement temporary or permanent bans on hydraulic fracturing. In 2015 the BLM issued a rule governing certain hydraulic fracturing practices on lands within their jurisdiction; however, this rule was rescinded in December 2017. This rescission is being judicially challenged before the U.S. District Court for the Northern District of California.
Increased regulation and attention given to the hydraulic fracturing process could lead to greater opposition, including litigation, to oil and gas activities using hydraulic fracturing techniques. Additional legislation or regulation could also lead to operational delays or increased operating costs in the production of crude oil and condensate, NGLs and natural gas, including from the shale plays, or could make it more difficult to perform hydraulic fracturing. The adoption of any federal, state or local laws or the implementation of regulations regarding hydraulic fracturing could potentially cause a decrease in the completion of new oil and gas wells and increased compliance costs which could increase costs of our operations and cause considerable delays in acquiring regulatory approvals to drill and complete wells.
The potential adoption of federal, state and local legislative and regulatory initiatives intended to address potential induced seismic activity in the areas in which we operate could result in increased compliance costs, operating restrictions or delays in the completion of oil and gas wells.
State and federal regulatory agencies have focused on a possible connection between the operation of injection wells used for oil and gas waste disposal and seismic activity. When caused by human activity, such events are called induced seismicity. Separate and apart from the referenced potential connection between injection wells and seismicity, concerns have been raised that hydraulic fracturing activities may be correlated to anomalous seismic events. Marathon uses hydraulic fracturing techniques throughout its U.S. operations.
While the scientific community and regulatory agencies at all levels are continuing to study the possible linkage between oil and gas activity and induced seismicity, some state regulatory agencies have modified their regulations or guidance to mitigate potential causes of induced seismicity. For example, Oklahoma has taken numerous regulatory actions in response to concerns related to the operation of produced water disposal wells and induced seismicity, and has issued guidelines to operators in certain areas of the State curtailing injection of produced water due to seismic concerns. Marathon does not currently own or operate injection wells or contract for such services in these areas. Further, Oklahoma issued guidelines to operators for management of anomalous seismicity that may be related to hydraulic fracturing activities in the SCOOP/STACK area. In addition, a number of lawsuits have been filed in Oklahoma alleging damage from seismicity relating to disposal well operations. Marathon has not been named in any of those lawsuits.
Increased seismicity in Oklahoma or other areas could result in additional regulation and restrictions on our operations and could lead to operational delays or increased operating costs. Additional regulation and attention given to induced seismicity could also lead to greater opposition, including litigation, to oil and gas activities.
Our business could be negatively impacted by cyberattacks targeting our computer and telecommunications systems and infrastructure, or targeting those of our third-party service providers.
Our business, like other companies in the oil and gas industry, has become increasingly dependent on digital technologies, including technologies that are managed by third-party service providers on whom we rely to help us collect, host or process information. Such technologies are integrated into our business operations and used as a part of our production and distribution systems in the U.S. and abroad, including those systems used to transport production to market, to enable communications, and to provide a host of other support services for our business. Use of the internet and other public networks for communications, services, and storage, including "cloud" computing, exposes all users (including our business) to cybersecurity risks.
While we and our third-party service providers commit resources to the design, implementation, and monitoring of our information systems, there is no guarantee that our security measures will provide absolute security. Despite these security measures, we may not be able to anticipate, detect, or prevent cyberattacks, particularly because the methodologies used by attackers change frequently or may not be recognized until launched, and because attackers are increasingly using techniques designed to circumvent controls and avoid detection. We and our third-party service providers may therefore be vulnerable to security events that are beyond our control, and we may be the target of cyber-attacks, as well as physical attacks, which could result in information security breaches and significant disruption to our business. Our information systems and related infrastructure have experienced attempted and actual minor breaches of our cybersecurity in the past, but we have not suffered any losses or breaches which had a material effect on our business, operations or reputation relating to such attacks; however, there is no assurance that we will not suffer such losses or breaches in the future.
As cyberattacks continue to evolve, we may be required to expend significant additional resources to respond to cyberattacks, to continue to modify or enhance our protective measures, or to investigate and remediate any information
19
systems and related infrastructure security vulnerabilities. We may also be subject to regulatory investigations or litigation relating from cybersecurity issues.
Our level of indebtedness may limit our liquidity and financial flexibility.
As of December 31,
2018
, our total debt was
$5.5 billion
, with our next debt maturity in the amount of
$600 million
due in 2020. Our indebtedness could have important consequences to our business, including, but not limited to, the following:
|
•
|
we may be more vulnerable to general adverse economic and industry conditions;
|
|
•
|
a portion of our cash flows from operating activities must be used to service our indebtedness and is not available for other purposes;
|
|
•
|
our flexibility in planning for, or reacting to, changes in our industry may be limited;
|
|
•
|
a financial covenant in our Credit Agreement stipulates that our total debt to capitalization ratio will not exceed 65% as of the last day of any fiscal quarter, and if exceeded, may make additional borrowings more expensive and affect our ability to plan for and react to changes in the economy and our industry;
|
|
•
|
we may be at a competitive disadvantage as compared to similar companies that have less debt; and
|
|
•
|
additional financing in the future for working capital, capital expenditures, acquisitions or development activities, general corporate or other purposes may have higher costs and more restrictive covenants.
|
We may incur additional debt in order to fund our capital expenditures, acquisitions or development activities, or for general corporate or other purposes. A higher level of indebtedness increases the risk that our financial flexibility may deteriorate. Our ability to meet our debt obligations and service our debt depends on future performance. General economic conditions, crude oil and condensate, NGLs and natural gas prices, and financial, business and other factors will affect our operations and our future performance. Many of these factors are beyond our control and we may not be able to generate sufficient cash flow to pay the interest on our debt, and future working capital, borrowings and equity financing may not be available to pay or refinance such debt. See Item 8. Financial Statements and Supplementary Data –
Note 16
to the consolidated financial statements for a discussion of debt obligations.
A downgrade in our credit rating could negatively impact our cost of and ability to access capital, which could adversely affect our business.
We receive debt ratings from the major credit rating agencies in the United States. Due to the volatility in crude oil and U.S. natural gas prices in recent years, credit rating agencies review companies in the energy industry periodically, including us. At
December 31, 2018
, our corporate credit ratings were: Standard & Poor's Global Ratings Services BBB- (positive); Fitch Ratings BBB (stable); and Moody's Investor Services, Inc. Ba1 (positive). The credit rating process is contingent upon a number of factors, many of which are beyond our control. A downgrade of our credit ratings could negatively impact our cost of capital and our ability to access the capital markets, increase the interest rate and fees we pay on our revolving credit facility, and may limit or reduce credit lines with our bank counterparties. We could also be required to post letters of credit or other forms of collateral for certain contractual obligations, which could increase our costs and decrease our liquidity or letter of credit capacity under our unsecured revolving credit facility. Limitations on our ability to access capital could adversely impact the level of our capital spending budget, our ability to manage our debt maturities, or our flexibility to react to changing economic and business conditions.
Our commodity price risk management activities may prevent us from fully benefiting from commodity price increases and may expose us to other risks, including counterparty risk.
Global commodity prices are volatile. In order to mitigate commodity price volatility and increase the predictability of cash flows related to the marketing of our crude oil and natural gas, we, from time to time, enter into crude oil and natural gas hedging arrangements with respect to a portion of our expected production. While hedging arrangements are intended to mitigate commodity price volatility, we may be prevented from fully realizing the benefits of price increases above the price levels of the derivative instruments used to manage price risk. In addition, our hedging arrangements may expose us to the risk of financial loss in certain circumstances, including instances in which the counterparties to our hedging contracts fail to perform under the contracts. See
Item 7A. Quantitative and Qualitative Disclosures about Market Risk
.
Worldwide political and economic developments and changes in law or policy could adversely affect our operations and materially reduce our profitability and cash flows.
Local political and economic factors in global markets could have a material adverse effect on us. A total of
29%
of our crude oil and condensate, NGLs and natural gas related to continuing operations in
2018
was derived from production outside the U.S. and
16%
of our proved reserves of crude oil and condensate, NGLs and natural gas as of
December 31, 2018
were located outside the U.S. We are, therefore, subject to the political, geographic and economic risks and possible terrorist
20
activities or other armed conflict attendant to doing business within or outside of the U.S. There are many risks associated with operations in countries such as E.G., and the Kurdistan Region of Iraq including:
|
•
|
changes in governmental policies relating to crude oil and condensate, NGLs or natural gas and taxation;
|
|
•
|
other political, economic or diplomatic developments and international monetary fluctuations;
|
|
•
|
political and economic instability, war, acts of terrorism, armed conflict and civil disturbances;
|
|
•
|
the possibility that a government may seize our property with or without compensation, may attempt to renegotiate or revoke existing contractual arrangements or may impose additional taxes or royalty burdens; and
|
|
•
|
fluctuating currency values, hard currency shortages and currency controls.
|
Changes in the U.S. or global political and economic environment or any U.S. or global hostility or the occurrence or threat of future terrorist attacks, or other armed conflict, could adversely affect the economies of the U.S. and other developed countries. A lower level of economic activity could result in a decline in energy consumption, which could cause our revenues and margins to decline and limit our future growth prospects. These risks could lead to increased volatility in prices for crude oil and condensate, NGLs and natural gas. In addition, these risks could increase instability in the financial and insurance markets and make it more difficult for us to access capital and to obtain the insurance coverage that we consider adequate. These risks could also cause damage to, or the inability to access production facilities or other operating assets and could limit our service and equipment providers from delivering items necessary for us to conduct our operations.
Actions of governments through tax legislation or interpretations of tax law, and other changes in law, executive order and commercial restrictions could reduce our operating profitability, both in the U.S. and abroad. The U.S. government can prevent or restrict us from doing business in foreign countries. These restrictions and those of foreign governments have in the past limited our ability to operate in, or gain access to, opportunities in various countries and will continue to do so in the future. Changes in law could also adversely affect our results, including new regulations resulting in higher costs to transport our production by pipeline, rail car, truck or vessel or the adoption of government payment transparency regulations that could require us to disclose competitively sensitive commercial information or that could cause us to violate the non-disclosure laws of other countries.
Our operations may be adversely affected by pipeline, rail and other transportation capacity constraints.
The marketability of our production depends in part on the availability, proximity, and capacity of pipeline facilities, rail cars, trucks and vessels. If any pipelines, rail cars, trucks or vessels become unavailable, we would, to the extent possible, be required to find a suitable alternative to transport our crude oil and condensate, NGLs and natural gas, which could increase the costs and/or reduce the revenues we might obtain from the sale of our production. Both the cost and availability of pipelines, rail cars, trucks, or vessels to transport our crude oil could be adversely impacted by new and expected state or federal regulations relating to transportation of crude oil.
If we acquire crude oil and natural gas properties, our failure to fully identify existing and potential problems, to accurately estimate reserves, production rates or costs, or to effectively integrate the acquired properties into our operations could materially and adversely affect our business, financial condition and results of operations.
We typically seek the acquisition of crude oil and natural gas properties and leases. Although we perform reviews of properties to be acquired in a manner that we believe is diligent and consistent with industry practices, reviews of records and properties may not necessarily reveal existing or potential problems, nor may they permit us to become sufficiently familiar with the properties in order to fully assess possible deficiencies and potential problems. Even when problems with a property are identified, we often assume environmental and other risks and liabilities in connection with acquired properties pursuant to the acquisition agreements. Moreover, there are numerous uncertainties inherent in estimating quantities of crude oil and natural gas (as previously discussed), actual future production rates and associated costs with respect to acquired properties. Actual reserves, production rates and costs may vary substantially from those assumed in our estimates. In addition, an acquisition may have a material and adverse effect on our business and results of operations, particularly during the periods in which the operations of the acquired properties are being integrated into our ongoing operations or if we are unable to effectively integrate the acquired properties into our ongoing operations.
We operate in a highly competitive industry, and many of our competitors are larger and have available resources in excess of our own.
The oil and gas industry is highly competitive, and many competitors, including major integrated and independent oil and gas companies, as well as national oil companies, are larger and have substantially greater resources at their disposal than we do. We compete with these companies for the acquisition of oil and natural gas leases and other properties. We also compete with these companies for equipment and personnel, including petroleum engineers, geologists, geophysicists and other specialists, required to develop and operate those properties and in the marketing of crude oil and condensate, NGLs and natural
21
gas to end-users. Such competition can significantly increase costs and affect the availability of resources, which could provide our larger competitors a competitive advantage when acquiring equipment, leases and other properties. They may also be able to use their greater resources to attract and retain experienced personnel.
Many of our major projects and operations are conducted jointly with other parties, which may decrease our ability to manage risk.
We often enter into arrangements to conduct certain business operations, such as oil and gas exploration and production with other parties in order to share risks associated with those operations. However, these arrangements also may decrease our ability to manage risks and costs, particularly where we are not the operator. We could have limited influence over and control of the behaviors and performance of these operations. In addition, misconduct, fraud, noncompliance with applicable laws and regulations or improper activities by or on behalf of one or more of our partners or co-working interest owners could have a significant negative impact on our business and reputation.
Our operations are subject to business interruptions and casualty losses. We do not insure against all potential losses and therefore we could be seriously harmed by unexpected liabilities and increased costs.
Our United States and International operations are subject to unplanned occurrences, including blowouts, explosions, fires, loss of well control, spills, tornadoes, hurricanes and other adverse weather, tsunamis, earthquakes, volcanic eruptions or nuclear or other disasters, labor disputes and accidents. These same risks can be applied to the third-parties which transport our products from our facilities. A prolonged disruption in the ability of any pipelines, rail cars, trucks, or vessels to transport our production could contribute to a business interruption or increase costs.
Our operations are also subject to the additional hazards of pollution, releases of toxic gas and other environmental hazards and risks. These hazards could result in serious personal injury or loss of human life, significant damage to property and equipment, environmental pollution, impairment of operations and substantial losses to us. Various hazards have adversely affected us in the past, and damages resulting from a catastrophic occurrence in the future involving us or any of our assets or operations may result in our being named as a defendant in one or more lawsuits asserting potentially large claims or in our being assessed potentially substantial fines by governmental authorities. We maintain insurance against many, but not all, potential losses or liabilities arising from operating hazards in amounts that we believe to be prudent. Uninsured losses and liabilities arising from operating hazards could reduce the funds available to us for capital, exploration and investment spending and could have a material adverse effect on our business, financial condition, results of operations and cash flows. Historically, we have maintained insurance coverage for physical damage including at times resulting business interruption to our major onshore and offshore facilities, with significant self-insured retentions. In the future, we may not be able to maintain or obtain insurance of the type and amount we desire at reasonable rates. As a result of market conditions, premiums and deductibles for our insurance policies will change over time and could escalate. In some instances, certain insurance could become unavailable or available only for reduced amounts of coverage. For example, due to historical hurricane activity, the availability of insurance coverage for windstorms has changed and, in some instances, it is uneconomical. As a result, our exposure to losses from future windstorm activity has increased.
Litigation by private plaintiffs or government officials or entities could adversely affect our performance.
We currently are defending litigation and anticipate that we will be required to defend new litigation in the future. The subject matter of such litigation may include releases of hazardous substances from our facilities, privacy laws, contract disputes, royalty disputes or any other laws or regulations that apply to our operations. In some cases the plaintiff or plaintiffs seek alleged damages involving large classes of potential litigants, and may allege damages relating to extended periods of time or other alleged facts and circumstances. If we are not able to successfully defend such claims, they may result in substantial liability. We do not have insurance covering all of these potential liabilities. In addition to substantial liability, litigation may also seek injunctive relief which could have an adverse effect on our future operations.
For instance, government entities and other groups have filed lawsuits in several states seeking to hold a wide variety of companies that produce fossil fuels liable for the alleged impacts of the greenhouse gas emissions attributable to those fuels. The lawsuits allege damages as a result of global warming and the plaintiffs are seeking unspecified damages and abatement under various tort theories. Marathon Oil has been named as a defendant in several of these lawsuits, along with numerous other companies. Similar lawsuits may be filed in other jurisdictions. The ultimate outcome and impact to us cannot be predicted with certainty, and we could incur substantial legal costs associated with defending these and similar lawsuits in the future.
In connection with our separation from MPC, MPC agreed to indemnify us for certain liabilities. However, there can be no assurance that the indemnity will be sufficient to protect us against the full amount of such liabilities, or that MPC’s ability to satisfy its indemnification obligations will not be impaired in the future.
22
Pursuant to the Separation and Distribution Agreement and the Tax Sharing Agreement we entered into with MPC in connection with the spin-off, MPC agreed to indemnify us for certain liabilities. However, third parties could seek to hold us responsible for any of the liabilities that MPC agreed to retain or assume, and there can be no assurance that the indemnification from MPC will be sufficient to protect us against the full amount of such liabilities, or that MPC will be able to fully satisfy its indemnification obligations. In addition, even if we ultimately succeed in recovering from MPC any amounts for which we are held liable, we may be temporarily required to bear these losses ourselves.
The spin-off could result in substantial tax liability.
We obtained a private letter ruling from the IRS substantially to the effect that the distribution of shares of MPC common stock in the spin-off qualified as tax free to MPC, us and our stockholders for U.S. federal income tax purposes under Sections 355 and 368 and related provisions of the U.S. Internal Revenue Code of 1986, as amended (the "Code"). If the factual assumptions or representations made in the request for the private letter ruling prove to have been inaccurate or incomplete in any material respect, then we will not be able to rely on the ruling. Furthermore, the IRS does not rule on whether a distribution such as the spin-off satisfies certain requirements necessary to obtain tax-free treatment under Section 355 of the Code. Rather, the private letter ruling was based on representations by us that those requirements were satisfied, and any inaccuracy in those representations could invalidate the ruling. In connection with the spin-off, we also obtained an opinion of outside counsel, substantially to the effect that, the distribution of shares of MPC common stock in the spin-off qualified as tax free to MPC, us and our stockholders for U.S. federal income tax purposes under Sections 355 and 368 and related provisions of the Code. The opinion relied on, among other things, the continuing validity of the private letter ruling and various assumptions and representations as to factual matters made by MPC and us which, if inaccurate or incomplete in any material respect, would jeopardize the conclusions reached by such counsel in its opinion. The opinion is not binding on the IRS or the courts, and there can be no assurance that the IRS or the courts would not challenge the conclusions stated in the opinion or that any such challenge would not prevail.
If, notwithstanding receipt of the private letter ruling and opinion of counsel, the spin-off were determined not to qualify under Section 355 of the Code, each U.S. holder of our common stock who received shares of MPC common stock in the spin-off would generally be treated as receiving a taxable distribution of property in an amount equal to the fair market value of the shares of MPC common stock received. That distribution would be taxable to each such stockholder as a dividend to the extent of our accumulated earnings and profits as of the effective date of the spin-off. For each such stockholder, any amount that exceeded those earnings and profits would be treated first as a non-taxable return of capital to the extent of such stockholder’s tax basis in its shares of our common stock with any remaining amount being taxed as a capital gain. We would be subject to tax as if we had sold all the outstanding shares of MPC common stock in a taxable sale for their fair market value and would recognize taxable gain in an amount equal to the excess of the fair market value of such shares over our tax basis in such shares.
Under the terms of the Tax Sharing Agreement we entered into with MPC in connection with the spin-off, MPC is generally responsible for any taxes imposed on MPC or us and our subsidiaries in the event that the spin-off and/or certain related transactions were to fail to qualify for tax-free treatment as a result of actions taken, or breaches of representations and warranties made in the Tax Sharing Agreement, by MPC or any of its affiliates. However, if the spin-off and/or certain related transactions were to fail to qualify for tax-free treatment because of actions or failures to act by us or any of our affiliates, we would be responsible for all such taxes.
We may issue preferred stock whose terms could dilute the voting power or reduce the value of Marathon Oil common stock.
Our restated certificate of incorporation authorizes us to issue, without the approval of our stockholders, one or more classes or series of preferred stock having such preferences, powers and relative, participating, optional and other rights, including preferences over Marathon Oil common stock respecting dividends and distributions, as our Board of Directors generally may determine. The terms of one or more classes or series of preferred stock could dilute the voting power or reduce the value of Marathon Oil common stock. For example, we could grant holders of preferred stock the right to elect some number of our directors in all events or on the happening of specified events or the right to veto specified transactions. Similarly, the repurchase or redemption rights or liquidation preferences we could assign to holders of preferred stock could affect the residual value of the common stock.
Item 1B. Unresolved Staff Comments
None.
Item 2. Properties
The location and general character of our principal crude oil and condensate, NGLs and natural gas properties and facilities, and other important physical properties have been described by segment under
Item 1. Business
.
23
Estimated net proved crude oil and condensate, NGLs and natural gas reserves and the basis for estimating these reserves are set forth in
Item 8. Financial Statements and Supplementary Data – Supplementary Information on Oil and Gas Producing Activities
.
Item 3. Legal Proceedings
We are a defendant in a number of legal and administrative proceedings arising in the ordinary course of business, including, but not limited to, royalty claims, contract claims, tax disputes and environmental claims. While the ultimate outcome and impact to us cannot be predicted with certainty, we believe the resolution of these proceedings will not have a material adverse effect on our consolidated financial position, results of operations or cash flows.
See Item 8. Financial Statements and Supplementary Data –
Note 25
to the consolidated financial statements for a description of such legal and administrative proceedings.
Environmental Proceedings
The following is a summary of certain proceedings involving us that were pending or contemplated as of
December 31, 2018
, under federal and state environmental laws.
Government entities have filed lawsuits in several states seeking to hold a wide variety of companies that produce fossil fuels liable for the alleged impacts of the greenhouse gas emissions attributable to those fuels. The lawsuits allege damages as a result of global warming and the plaintiffs are seeking unspecified damages and abatement under various tort theories. Marathon Oil has been named as a defendant in several of these lawsuits, along with numerous other companies. Similar lawsuits may be filed in other jurisdictions. While the ultimate outcome and impact to us cannot be predicted with certainty, we believe that the claims made against us are without merit and will not have a material adverse effect on our consolidated financial position, results of operations or cash flow.
As of
December 31, 2018
, we have sites across the country where remediation is being sought under environmental statutes, both federal and state, or where private parties are seeking remediation through discussions or litigation. Based on currently available information the accrued amount to address the clean-up and remediation costs connected with these sites is not material.
If our assumptions relating to these costs prove to be inaccurate, future expenditures may exceed our accrued amounts.
Item 4. Mine Safety Disclosures
Not applicable.
24
PART II
Item 5. Market for Registrant’s Common Equity, Related Stockholder Matters and Issuer Purchases of Equity Securities
The principal market on which Marathon Oil common stock is traded is the New York Stock Exchange ("NYSE"), and is traded under the trading symbol 'MRO'. As of January 31, 2019, there were 29,960 registered holders of Marathon Oil common stock.
Dividends
– Our Board of Directors intends to declare and pay dividends on Marathon Oil common stock based on our financial condition and results of operations, although it has no obligation under Delaware law or the Restated Certificate of Incorporation to do so. In determining our dividend policy, the Board will rely on our consolidated financial statements. Dividends on Marathon Oil common stock are limited to our legally available funds.
The following table provides information about purchases by Marathon Oil and its affiliated purchaser, during the quarter ended
December 31, 2018
, of equity securities that are registered by Marathon Oil pursuant to Section 12 of the Securities Exchange Act of 1934:
|
Period
|
Total Number of
Shares
Purchased
(a)
|
Average
Price Paid
per Share
|
Total Number of
Shares Purchased
as Part of Publicly
Announced Plans
or Programs
(b)
|
Approximate
Dollar Value of
Shares that May
Yet Be Purchased
Under the Plans
or Programs
(b)
|
|||||||||
|
10/01/18 – 10/31/18
|
7,151,077
|
|
$
|
21.52
|
|
7,110,719
|
|
$
|
1,009,043,095
|
|
|||
|
11/01/18 – 11/30/18
|
6,260,834
|
|
$
|
16.74
|
|
6,256,479
|
|
$
|
904,286,215
|
|
|||
|
12/01/18 – 12/31/18
|
6,593,370
|
|
$
|
15.78
|
|
6,592,195
|
|
$
|
800,286,037
|
|
|||
|
Total
|
20,005,281
|
|
$
|
18.13
|
|
19,959,393
|
|
||||||
|
(a)
|
45,888
shares of restricted stock were delivered by employees to Marathon Oil, upon vesting, to satisfy tax withholding requirements.
|
|
(b)
|
In January 2006, we announced a $2.0 billion share repurchase program. Our Board of Directors subsequently increased the authorization for repurchases under the program by $500 million in January 2007, by $500 million in May 2007, by $2.0 billion in July 2007, and by $1.2 billion in December 2013, for a total authorized amount of $6.2 billion.
|
As of
December 31, 2018
, we have repurchased
157 million
common shares at a cost of approximately
$5.4 billion
, excluding transaction fees and commissions. Of this total, approximately
20 million
shares were acquired at a cost of approximately
$362 million
during the fourth quarter of 2018. The remaining share repurchase authorization as of December 31, 2018 is approximately
$800 million
. Purchases under the program are made at our discretion and may be in either open market transactions, including block purchases, or in privately negotiated transactions using cash on hand, cash generated from operations, proceeds from potential asset sales or cash from available borrowings to acquire shares. This program may be changed based upon our financial condition or changes in market conditions and is subject to termination prior to completion. Shares repurchased as of
December 31, 2018
were held as treasury stock.
25
Item 6. Selected Financial Data
|
Year Ended December 31,
|
|||||||||||||||||||
|
(In millions, except per share data)
|
2018
|
2017
|
2016
|
2015
|
2014
|
||||||||||||||
|
Statement of Income Data
(a)(b)(c)
|
|
||||||||||||||||||
|
Total revenues and other income
|
$
|
6,582
|
|
$
|
4,765
|
|
$
|
3,787
|
|
$
|
4,953
|
|
$
|
9,646
|
|
||||
|
Income (loss) from continuing operations
|
1,096
|
|
(830
|
)
|
(2,087
|
)
|
(1,701
|
)
|
710
|
|
|||||||||
|
Discontinued operations
|
—
|
|
(4,893
|
)
|
(53
|
)
|
(503
|
)
|
2,336
|
|
|||||||||
|
Net income (loss)
|
1,096
|
|
(5,723
|
)
|
(2,140
|
)
|
(2,204
|
)
|
3,046
|
|
|||||||||
|
Per Share Data
(a)(b)(c)
|
|||||||||||||||||||
|
Basic:
|
|||||||||||||||||||
|
Income (loss) from continuing operations
|
$
|
1.30
|
|
$
|
(0.97
|
)
|
$
|
(2.55
|
)
|
$
|
(2.51
|
)
|
$
|
1.04
|
|
||||
|
Discontinued operations
|
$
|
—
|
|
$
|
(5.76
|
)
|
$
|
(0.06
|
)
|
$
|
(0.75
|
)
|
$
|
3.44
|
|
||||
|
Net income (loss)
|
$
|
1.30
|
|
$
|
(6.73
|
)
|
$
|
(2.61
|
)
|
$
|
(3.26
|
)
|
$
|
4.48
|
|
||||
|
Diluted:
|
|||||||||||||||||||
|
Income (loss) from continuing operations
|
$
|
1.29
|
|
$
|
(0.97
|
)
|
$
|
(2.55
|
)
|
$
|
(2.51
|
)
|
$
|
1.04
|
|
||||
|
Discontinued operations
|
$
|
—
|
|
$
|
(5.76
|
)
|
$
|
(0.06
|
)
|
$
|
(0.75
|
)
|
$
|
3.42
|
|
||||
|
Net income (loss)
|
$
|
1.29
|
|
$
|
(6.73
|
)
|
$
|
(2.61
|
)
|
$
|
(3.26
|
)
|
$
|
4.46
|
|
||||
|
Statement of Cash Flows Data
(b)
|
|||||||||||||||||||
|
Additions to property, plant and equipment related to continuing operations
|
$
|
(2,753
|
)
|
$
|
(1,974
|
)
|
$
|
(1,204
|
)
|
$
|
(3,485
|
)
|
$
|
(4,937
|
)
|
||||
|
Dividends paid
|
169
|
|
170
|
|
162
|
|
460
|
|
543
|
|
|||||||||
|
Dividends per share
|
$
|
0.20
|
|
$
|
0.20
|
|
$
|
0.20
|
|
$
|
0.68
|
|
$
|
0.80
|
|
||||
|
Balance Sheet Data at December 31
|
|||||||||||||||||||
|
Total assets
|
$
|
21,321
|
|
$
|
22,012
|
|
$
|
31,094
|
|
$
|
32,311
|
|
$
|
35,983
|
|
||||
|
Total long-term debt, including capitalized leases
|
5,499
|
|
5,494
|
|
6,581
|
|
7,268
|
|
5,285
|
|
|||||||||
|
(a)
|
Includes impairments to producing properties of
$75 million
,
$229 million
,
$67 million
,
$381 million
and
$132 million
in
2018
,
2017
,
2016
,
2015
and
2014
and impairments to unproved properties of
$208 million
,
$246 million
,
$195 million
,
$655 million
and
$306 million
in
2018
,
2017
,
2016
,
2015
and
2014
(see Item 8. Financial Statements and Supplementary Data –
Note 11
to the consolidated financial statements). Includes a goodwill impairment of
$340 million
in 2015 related to the U.S. reporting unit.
|
|
(b)
|
We closed on the sale of our Canada business in 2017 which resulted in an after-tax non-cash impairment charge of $4.96 billion and our Angola assets and Norway business in 2014 (see Item 8. Financial Statements and Supplementary Data –
Note 5
to the consolidated financial statements). The applicable periods have been recast to reflect as discontinued operations.
|
|
(c)
|
December 31, 2016 includes the increase of a valuation allowance on certain of our deferred tax assets for $1,346 million.
|
26
Item 7. Management’s Discussion and Analysis of Financial Condition and Results of Operations
The following discussion and analysis of our financial condition and results of operations should be read in conjunction with the information under Item 8. Financial Statements and Supplementary Data and the other financial information found elsewhere in this Form 10-K. The following discussion includes forward-looking statements that involve certain risks and uncertainties. See "Disclosures Regarding Forward-Looking Statements" (immediately prior to Part I) and
Item 1A. Risk Factors
.
Each of our two reportable operating segments are organized by geographic location and managed according to the nature of the products and services offered.
|
•
|
United States – explores for, produces and markets crude oil and condensate, NGLs and natural gas in the United States;
|
|
•
|
International – explores for, produces and markets crude oil and condensate, NGLs and natural gas outside of the United States and produces and markets products manufactured from natural gas, such as LNG and methanol, in E.G.
|
Executive Overview
During
2018
, we continued our outstanding operational execution and capital efficiency across our multi-basin U.S. portfolio, maintained a strong balance sheet and delivered solid financial results. Total proved reserves were
1.3 billion
boe and total assets were
$21.3 billion
at December 31, 2018. Additionally in
2018
, we closed on the sale of our subsidiary, Marathon Oil Libya Limited and entered into agreements to complete a full country exit in Kurdistan. Our 2018 financial and operating results highlighted below reflect our ongoing commitment to our core strategy of continuous corporate returns improvement, sustainable cash flow generation at conservative oil prices and the return of capital to shareholders.
Key highlights include the following:
Simplifying and concentrating our portfolio
|
•
|
Early in 2018 we closed on the sale of our Libya subsidiary for proceeds of approximately
$450 million
resulting in a gain of
$255 million
and received
$750 million
in remaining proceeds from the sale of our Canadian business.
|
|
•
|
During 2018 we entered into agreements for the sale of our interest in the non-operated Sarsang and Atrush blocks which will complete our full country exit from Kurdistan. We expect the remaining transaction for our subsidiary Marathon Oil KDV B.V., which holds our non-operated interest in the Atrush block, to close in the first half of 2019.
|
|
•
|
In July 2018 we closed on the sale of non-core, non-operated conventional assets in the U.S. segment for a pre-tax gain of $32 million, including three in the Gulf of Mexico, further concentrating and simplifying our portfolio.
|
|
•
|
In Northern Delaware we acquired 1,800 net acres in New Mexico for $105 million from the Bureau of Land Management lease sale, which is synergistic with our existing footprint in the resource play.
|
|
•
|
Captured approximately 260,000 net acres in the emerging Louisiana Austin Chalk play at a cost of less than $850 per acre.
|
Strengthened balance sheet and liquidity
|
•
|
Returned additional capital to shareholders in 2018 by acquiring
36 million
of common shares at a cost of
$700 million
, with
$800 million
of repurchase authorization remaining.
|
|
•
|
Reduced estimated costs of our asset retirement obligations by
$338 million
primarily through accelerating our U.K. abandonment timing to capture favorable market conditions and through the disposition of Gulf of Mexico assets.
|
|
•
|
Cash and cash equivalents increased approximately $900 million as a result of the sale of our Libya subsidiary and the receipt of the remaining proceeds from the sale of our Canadian business.
|
|
•
|
Cash provided by operating activities from continuing operations increased by
63%
, compared to the same period last year, to $
3,234 million
primarily as a result of increased price realizations and net sales volumes in our U.S. resource plays.
|
Financial and operational results
|
•
|
Total net sales volumes for the year were
420
mboed, including
298
mboed in the U.S. Our U.S. net sales volumes increased 64 mboed and our wells to sales increased 18% compared to 2017.
|
|
•
|
Added proved reserves of
186
mmboe for a reserve replacement ratio from continuing operations of
125%
.
|
|
•
|
Our net income per share from continuing operations was
$1.30
in
2018
as compared to a net loss per share of
$0.97
last year. Included in the 2018 net income are:
|
27
|
◦
|
An increase in revenues of approximately
39%
compared to 2017, as a result of increased price realizations of
28%
and a
27%
increase in net sales volumes in the United States.
|
|
◦
|
Our net gain on disposal of assets increased in 2018 to $
319 million
due to the sale of our Libya subsidiary for
$255 million
.
|
|
◦
|
Production expense, taxes other than income and shipping, handling and other increased
18%
, 63% and 33%, during 2018 as a result of an increase in net sales volumes across our U.S. resource plays.
|
|
◦
|
Exploration and impairment expenses decreased by
$274 million
to
$364 million
, year over year, primarily due to non-cash impairment charges on proved and unproved properties in 2017. See Item 8. Financial Statements and Supplementary Data -
Note 11
to the consolidated financial statements for further detail.
|
Outlook
Capital Budget
On February 13, 2019 we announced our total
2019
Capital Budget of
$2.6 billion
, which includes approximately
$2.4 billion
of development capital and approximately
$200 million
to fund resource play leasing and exploration ("REx"). Our
$2.4 billion
development capital budget is 95% dedicated to the four U.S. resource plays with approximately 60% allocated to the Eagle Ford and Bakken and approximately 40% allocated to Oklahoma and the Northern Delaware.
Our
2019
Capital Budget is broken down by reportable segment in the table below:
|
(In millions)
|
Capital Budget
|
||
|
United States
(a)
|
$
|
2,525
|
|
|
International and corporate other
(b)
|
75
|
|
|
|
Total Capital Budget
|
$
|
2,600
|
|
(a)
Includes approximately
$200 million
of spend to fund REx.
(b)
International and corporate other includes our International segment and other corporate items.
Operations
Our net sales volumes increased
11%
in 2018 primarily as a result of new wells to sales across all U.S. resource plays.
The following table presents a summary of our sales volumes for each of our segments. Refer to the Results of Operations section for a price-volume analysis for each of the segments.
|
Net Sales Volumes
|
2018
|
Increase
(Decrease) |
2017
|
Increase
(Decrease) |
2016
|
||||||
|
United States
(mboed)
|
298
|
27
|
%
|
234
|
5
|
%
|
223
|
||||
|
International
(mboed)
(a)
|
122
|
(16
|
)%
|
145
|
19
|
%
|
122
|
||||
|
Total continuing operations
(mboed)
|
420
|
11
|
%
|
379
|
10
|
%
|
345
|
||||
|
(a)
|
We closed on the sale of our Libya subsidiary in the first quarter of 2018. Years ended December 31,
2018
,
2017
and
2016
includes net sales volumes relating to Libya of 8 mboed, 20 mboed and 3 mboed.
|
United States
Net sales volumes in the segment were higher during the year ended December 31,
2018
primarily as a result of new wells to sales across all U.S. resource plays. The following tables provide additional details regarding net sales volumes, sales mix and operational drilling activity for our significant operations within this segment:
|
Net Sales Volumes
|
2018
|
Increase
(Decrease) |
2017
|
Increase
(Decrease) |
2016
|
||||
|
Equivalent Barrels
(mboed)
|
|||||||||
|
Eagle Ford
|
108
|
7%
|
101
|
(4)%
|
105
|
||||
|
Bakken
|
84
|
50%
|
56
|
4%
|
54
|
||||
|
Oklahoma
|
74
|
37%
|
54
|
54%
|
35
|
||||
|
Northern Delaware
|
20
|
233%
|
6
|
100%
|
—
|
||||
|
Other United States
(a)
|
12
|
(29)%
|
17
|
(41)%
|
29
|
||||
|
Total United States (mboed)
|
298
|
27%
|
234
|
5%
|
223
|
||||
(a)
Year ended
December 31, 2018
includes decreases of 5 mboed, relating primarily to the disposition of certain assets in the Gulf of Mexico and conventional assets in Oklahoma in July 2018 and September 2017 and Colorado in October 2017. Additionally, year ended December 31, 2017 includes decreases of
14
mboed, consisting of the disposition of Wyoming and certain non-operated CO2 and waterflood assets in West Texas and New Mexico in 2016. See Item 8. Financial Statements and Supplementary Data -
Note 5
to the consolidated financial statements for information about these dispositions.
28
|
Sales Mix - U.S. Resource Plays - 2018
|
Eagle Ford
|
Bakken
|
Oklahoma
|
Northern Delaware
|
Total
|
|||||
|
Crude oil and condensate
|
59%
|
85%
|
25%
|
58%
|
57%
|
|||||
|
Natural gas liquids
|
21%
|
8%
|
28%
|
20%
|
20%
|
|||||
|
Natural gas
|
20%
|
7%
|
47%
|
22%
|
23%
|
|||||
|
Drilling Activity - U.S. Resource Plays
|
2018
|
2017
|
2016
|
||
|
Gross Operated
|
|||||
|
Eagle Ford:
|
|||||
|
Wells drilled to total depth
|
123
|
182
|
168
|
||
|
Wells brought to sales
|
149
|
157
|
168
|
||
|
Bakken:
|
|||||
|
Wells drilled to total depth
|
78
|
90
|
3
|
||
|
Wells brought to sales
|
80
|
39
|
13
|
||
|
Oklahoma:
|
|||||
|
Wells drilled to total depth
|
55
|
86
|
33
|
||
|
Wells brought to sales
|
57
|
73
|
28
|
||
|
Northern Delaware:
|
|||||
|
Wells drilled to total depth
|
69
|
27
|
—
|
||
|
Wells brought to sales
|
52
|
18
|
—
|
||
|
•
|
Eagle Ford
– Our net sales volumes were
108
mboed in
2018
, which was
7%
higher compared to
2017
. We brought
149
gross company-operated wells to sales in
2018
.
In Atascosa County, we brought online 40 wells during 2018 with strong well results, demonstrating the strength of the extended core. During 2018, we generated significant cash flow, improved well productivity with annual oil growth of 7%, despite 5% fewer gross company-operated wells to sales.
|
|
•
|
Bakken
– Our net sales volumes of
84
mboed in
2018
represented a
50%
increase over the prior year of
56
mboed. We brought
80
gross company-operated wells to sales in
2018
with continued impressive well results.
During 2018, we delivered best-in-basin well performance, significant cash flow, capital efficient annual oil growth of 53%, and successful core extension tests in the Ajax, Southern Hector and Elk Creek areas. During the fourth quarter we conducted a successful core extension test in the Ajax area of Dunn County, as the four-well Gloria pad achieved strong results at an average completed well cost of approximately $5 million.
|
|
•
|
Oklahoma
– Our net sales volumes in
2018
increased by
37%
from
2017
, with net sales volumes of
74
mboed. We brought
57
gross company-operated wells to sales in 2018. In 2018, we successfully transitioned to infill development in the over-pressured STACK Meramec and SCOOP Woodford, delivering competitive returns and predictable results at various spacing designs.
|
|
•
|
Northern Delaware
– Our net sales volumes were
20
mboed in
2018
while bringing
52
gross company-operated wells to sales. We continue to make significant progress in improving efficiencies and midstream access for all products to protect and enhance margins. During the fourth quarter, we executed a comprehensive water management agreement covering the entire Red Hills prospect area, complementing a previously announced agreement in Eddy County.
|
29
International
Net sales volumes in the segment were lower during the year ended December 31, 2018 primarily due to the sale of our subsidiary in Libya, planned maintenance activities and natural declines in E.G. The following table provides details regarding net sales volumes for our significant operations within this segment:
|
Net Sales Volumes
|
2018
|
Increase
(Decrease) |
2017
|
Increase
(Decrease) |
2016
|
||||
|
Equivalent Barrels
(mboed)
|
|||||||||
|
Equatorial Guinea
|
97
|
(11)%
|
109
|
7%
|
102
|
||||
|
United Kingdom
(a)
|
13
|
(7)%
|
14
|
(18)%
|
17
|
||||
|
Libya
|
8
|
(60)%
|
20
|
567%
|
3
|
||||
|
Other International
|
4
|
100%
|
2
|
100%
|
—
|
||||
|
Total International
|
122
|
(16)%
|
145
|
19%
|
122
|
||||
|
Equity Method Investees
|
|
|
|||||||
|
LNG
(mtd)
|
5,805
|
(10)%
|
6,423
|
9%
|
5,874
|
||||
|
Methanol
(mtd)
|
1,241
|
(10)%
|
1,374
|
1%
|
1,358
|
||||
|
Condensate and LPG
(boed)
|
13,034
|
(10)%
|
14,501
|
8%
|
13,430
|
||||
(a)
Includes natural gas acquired for injection and subsequent resale.
|
•
|
Equatorial Guinea
– Net sales volumes in
2018
were lower than
2017
as a result of timing of liftings, natural field decline and planned maintenance activities during the year.
|
|
•
|
United Kingdom
– Net sales volumes in
2018
were slightly lower than
2017
primarily due to unscheduled downtime at the non-operated Foinaven complex in the fourth quarter 2018.
|
|
•
|
Libya
– During the first quarter of 2018 we closed on the sale of our subsidiary in Libya. See
Note 5
to the consolidated financial statements for further information.
|
Market Conditions
Crude oil and condensate and NGLs benchmarks increased in
2018
as compared to the same period in
2017
. As a result, we experienced increased price realizations associated with those benchmarks. We continue to expect crude oil and condensate, NGLs and natural gas benchmark prices to remain volatile based on global supply and demand, which will result in increases or decreases in our price realizations during 2019. See
Item 1A. Risk Factors
and
Item 7. Management’s Discussion and Analysis of Financial Condition – Critical Accounting Estimates
for further discussion of how declines in commodity prices could impact us. Additional detail on market conditions, including our average price realizations and benchmarks for crude oil and condensate, NGLs and natural gas relative to our operating segments, follows.
30
United States
The following table presents our average price realizations and the related benchmarks for crude oil and condensate, NGLs and natural gas for
2018
,
2017
and
2016
.
|
2018
|
Increase (Decrease)
|
2017
|
Increase (Decrease)
|
2016
|
||||||||||||||
|
Average Price Realizations
(a)
|
||||||||||||||||||
|
Crude oil and condensate
(per bbl)
(b)
|
$
|
63.11
|
|
28
|
%
|
$
|
49.35
|
|
28
|
%
|
$
|
38.57
|
|
|||||
|
Natural gas liquids
(per bbl)
|
24.54
|
|
19
|
%
|
20.55
|
|
56
|
%
|
13.15
|
|
||||||||
|
Natural gas
(per mcf)
(c)
|
2.65
|
|
(7
|
)%
|
2.84
|
|
19
|
%
|
2.38
|
|
||||||||
|
Benchmarks
|
|
|
|
|
||||||||||||||
|
WTI crude oil average of daily prices
(per bbl)
|
$
|
64.90
|
|
28
|
%
|
$
|
50.85
|
|
17
|
%
|
$
|
43.47
|
|
|||||
|
LLS crude oil average of daily prices
(per bbl)
|
70.04
|
|
30
|
%
|
54.04
|
|
20
|
%
|
45.02
|
|
||||||||
|
Mont Belvieu NGLs
(per bbl)
(d)
|
28.63
|
|
20
|
%
|
23.76
|
|
37
|
%
|
17.40
|
|
||||||||
|
Henry Hub natural gas settlement date average (per
mmbtu)
|
3.09
|
|
(1
|
)%
|
3.11
|
|
26
|
%
|
2.46
|
|
||||||||
|
(a)
|
Excludes gains or losses on commodity derivative instruments.
|
|
(b)
|
Inclusion of realized gains (losses) would have impacted average price realizations by
$(4.60)
per bbl,
$0.75
per bbl, and
$0.92
per bbl for
2018
,
2017
, and
2016
.
|
|
(c)
|
Inclusion of realized gains (losses) on natural gas derivative instruments would have a minimal impact on average price realizations for the periods presented.
|
|
(d)
|
Bloomberg Finance LLP: Y-grade Mix NGL of 50% ethane, 25% propane, 10% butane, 5% isobutane and 10% natural gasoline.
|
Crude oil and condensate
– Price realizations may differ from benchmarks due to the quality and location of the product.
Natural gas liquids
– The majority of our sales volumes are at reference to Mont Belvieu prices.
Natural gas
–
A significant portion of volumes are sold at bid-week prices, or first-of-month indices relative to our producing areas.
International
The following table presents our average price realizations and the related benchmark for crude oil for
2018
,
2017
and
2016
.
|
2018
|
Increase (Decrease)
|
2017
|
Increase (Decrease)
|
2016
|
|||||||||||||
|
Average Price Realizations
|
|||||||||||||||||
|
Crude oil and condensate
(per bbl)
|
$
|
64.25
|
|
21
|
%
|
$
|
53.05
|
|
27
|
%
|
$
|
41.70
|
|
||||
|
Natural gas liquids
(per bbl)
|
2.27
|
|
(28
|
)%
|
3.15
|
|
49
|
%
|
2.11
|
|
|||||||
|
Natural gas
(per mcf)
|
0.54
|
|
(2
|
)%
|
0.55
|
|
6
|
%
|
0.52
|
|
|||||||
|
Benchmark
|
|
|
|
|
|||||||||||||
|
Brent (Europe) crude oil
(per bbl)
(a)
|
$
|
71.06
|
|
31
|
%
|
$
|
54.25
|
|
25
|
%
|
$
|
43.55
|
|
||||
|
(a)
|
Average of monthly prices obtained from the United States Energy Information Agency website.
|
United Kingdom
Crude oil and condensate
–
Generally sold in relation to the Brent crude benchmark.
Equatorial Guinea
Crude oil and condensate
–
Alba Field liquids production is primarily condensate and generally sold in relation to the Brent crude benchmark. Alba Plant LLC processes the rich hydrocarbon gas which is supplied by the Alba Field under a fixed price long term contract. Alba Plant LLC extracts NGL’s and secondary condensate which is then sold by Alba Plant LLC at market prices, with our share of the revenue reflected in income from equity method investments on the consolidated statements of income.
Natural gas liquids
–
Wet gas is sold to Alba Plant LLC at a fixed-price term contract resulting in realized prices not fully tracking market price. Alba Plant LLC extracts NGLs, which are sold at market price, with our share of income from Alba Plant LLC being reflected in the income from equity method investments on the consolidated statements of income.
31
Natural gas -
Dry natural gas is sold to EGHoldings and AMPCO at fixed-price long term contracts resulting in realized prices not fully tracking market price. We derive additional value from the equity investment in our downstream gas processing units EG LNG and AMPCO that market LNG and methanol at market prices.
Consolidated Results of Operations:
2018
compared to
2017
Revenues from contracts with customers
are presented by segment in the table below:
|
Year Ended December 31,
|
||||||
|
(In millions)
|
2018
|
2017
|
||||
|
Revenues from contracts with customers
|
||||||
|
United States
|
$
|
4,886
|
|
$
|
3,093
|
|
|
International
|
1,016
|
|
1,154
|
|
||
|
Segment revenues from contracts with customers
|
$
|
5,902
|
|
$
|
4,247
|
|
Below is a price/volume analysis for each segment. Refer to the preceding
Operations
and
Market Conditions
sections for additional detail related to our net sales volumes and average price realizations.
|
Increase (Decrease) Related to
|
||||||||||||||||
|
(In millions)
|
Year Ended December 31, 2017
|
Price Realizations
|
Net Sales Volumes
|
Year Ended December 31, 2018
|
||||||||||||
|
United States Price/Volume Analysis
|
||||||||||||||||
|
Crude oil and condensate
|
$
|
2,402
|
|
$
|
861
|
|
$
|
684
|
|
$
|
3,947
|
|
||||
|
Natural gas liquids
|
324
|
|
80
|
|
91
|
|
495
|
|
||||||||
|
Natural gas
|
361
|
|
(30
|
)
|
82
|
|
413
|
|
||||||||
|
Other sales
|
6
|
|
31
|
|
||||||||||||
|
Total
|
$
|
3,093
|
|
$
|
4,886
|
|
||||||||||
|
International Price/Volume Analysis
|
||||||||||||||||
|
Crude oil and condensate
|
$
|
1,000
|
|
$
|
155
|
|
$
|
(267
|
)
|
$
|
888
|
|
||||
|
Natural gas liquids
|
15
|
|
(4
|
)
|
(2
|
)
|
9
|
|
||||||||
|
Natural gas
|
97
|
|
(2
|
)
|
(9
|
)
|
86
|
|
||||||||
|
Other sales
|
42
|
|
33
|
|
||||||||||||
|
Total
|
$
|
1,154
|
|
$
|
1,016
|
|
||||||||||
Net loss on commodity derivatives
decreased
$22 million
in 2018 from 2017. We have multiple crude oil and natural gas derivative contracts indexed to NYMEX WTI and Henry Hub. We record commodity derivative gains/losses as the index pricing and forward curves change each period. See
Note 14
to the consolidated financial statements for further information.
Marketing revenues
decreased
$162 million
in
2018
from
2017
. This decrease is the result of adopting the new revenue standard, ASC Topic 606, Revenue from Contracts with Customers during the first quarter of 2018. As a result of this standard, we have changed our presentation of marketing revenues and marketing expenses from the historical gross presentation to a net presentation. See
Note 2
to the consolidated financial statements for further information.
Income from equity method investments
decreased
$31 million
primarily due to higher production costs and lower volumes and pricing at our E.G. LNG production facility. Our higher production costs and lower volumes were primarily driven by planned maintenance activities during the first quarter 2018.
Net gain on disposal of assets
increased
$261 million
in
2018
from
2017
. This increase was primarily related to the 2018 sale of our Libya subsidiary for a pre-tax gain of
$255 million
; and also includes the sale of non-core assets in the Gulf of Mexico and our International segment during the current year. See Item 8. Financial Statements and Supplementary Data -
Note 5
to the consolidated financial statements for information about these dispositions.
Other income
increased
$72 million
in 2018 from 2017 primarily a result of the reduction of our U.K. asset retirement obligation during 2018. See Item 8. Financial Statements and Supplementary Data -
Note 12
to the consolidated financial statements for detail about our asset retirement obligation.
Production expenses
increased
$126 million
during 2018 from 2017 primarily due to higher sales volumes across our United States segment. Our United States segment
increased
$149 million
primarily due to higher costs as a result of increased
32
sales volumes and new wells to sales in our developing Northern Delaware asset. International segment
decreased
$24 million
primarily due to the sale of our subsidiary in Libya in the first quarter 2018.
The following table provides production expense and production expense rates for each segment:
|
(in millions/$ per boe)
|
2018
|
2017
|
||||||||||
|
Production Expense and Production Expense Rate
|
Expense
|
Rate
|
Expense
|
Rate
|
||||||||
|
United States
|
$
|
625
|
|
$
|
5.75
|
|
$
|
476
|
|
$
|
5.57
|
|
|
International
|
$
|
215
|
|
$
|
4.86
|
|
$
|
239
|
|
$
|
4.51
|
|
Marketing costs
decreased
$168 million
in
2018
from
2017
. This decrease is the result of adopting the new revenue standard, ASC Topic 606, Revenue from Contracts with Customers during the first quarter of 2018. As a result of this standard, we have changed our presentation of marketing revenues and marketing expenses from the historical gross presentation to a net presentation. See
Note 2
to the consolidated financial statements for further information.
Shipping, handling and other operating expenses
increased
$144 million
in
2018
from
2017
primarily as a result of increased sales volumes in our United States segment.
Exploration expenses
decreased
$120 million
during
2018
versus the comparable
2017
. The decrease was primarily due to lower unproved property impairments and dry well costs in certain non-core international properties in 2018 versus 2017. See Item 8. Financial Statements and Supplementary Data -
Note 11
to the consolidated financial statements for details of these items.
The following table summarizes the components of exploration expenses:
|
Year Ended December 31,
|
||||||
|
(In millions)
|
2018
|
2017
|
||||
|
Exploration Expenses
|
||||||
|
Unproved property impairments
|
$
|
208
|
|
$
|
246
|
|
|
Dry well costs
|
47
|
|
77
|
|
||
|
Geological and geophysical
|
21
|
|
25
|
|
||
|
Other
|
13
|
|
61
|
|
||
|
Total exploration expenses
|
$
|
289
|
|
$
|
409
|
|
Depreciation, depletion and amortization
increased
$69 million
in
2018
from
2017
primarily as a result of an
increase
of
$206 million
in the
United States
segment primarily due to higher sales volumes across all U.S. resource plays. Offsetting this higher expense was a
decrease
of
$131 million
in our International segment primarily due to the reduction of our estimated U.K. asset retirement costs. Additionally, lower sales volumes in E.G., asset sales in Libya and Kurdistan all contributed to the lower expense during 2018. Our segments apply the units-of-production method to the majority of their assets, including capitalized asset retirement costs; therefore, volumes have an impact on DD&A expense.
The DD&A rate (expense per boe), which is impacted by field-level changes in reserves, capitalized costs and sales volumes, can also impact our DD&A expense. Our
United States
DD&A rate decreased in
2018
primarily due to increased proved developed reserves in our U.S. resource plays in late 2017; as well as reduced capitalized costs relating to the Gulf of Mexico impairment charge in 2017 and the subsequent sale of these assets in
2018
. The DD&A rate for International decreased with the reduction of our estimated U.K. asset retirement costs in the second half of 2018 and 2017.
The following table provides DD&A rates for each segment:
|
($ per boe)
|
2018
|
2017
|
||||
|
DD&A Rate
|
|
|
||||
|
United States
|
$
|
20.39
|
|
$
|
23.51
|
|
|
International
|
$
|
4.44
|
|
$
|
6.19
|
|
Impairments
decreased
$154 million
in
2018
from
2017
.
This decrease was primarily the result of the proved property impairments in the third quarter 2017 in certain non-core international properties and certain properties in the Gulf of Mexico. See Item 8. Financial Statements and Supplementary Data -
Note 11
to the consolidated financial statement for detail of proved property impairments each year.
Taxes other than income
tend to increase or decrease in relation to revenue and sales volumes, primarily in the U.S. As U.S. sales volumes and revenues increased during 2018, this resulted in an increase of
$116 million
compared to 2017. Additionally, the State of Oklahoma approved an increase to the gross production tax from 2% to 5% on all existing and new wells for the first thirty-six months, effective July 1, 2018. The following table summarizes the components of taxes other than
33
income:
|
Year Ended December 31,
|
||||||
|
(In millions)
|
2018
|
2017
|
||||
|
Taxes other than income
|
||||||
|
Production and severance
|
$
|
208
|
|
$
|
121
|
|
|
Ad valorem
|
23
|
|
13
|
|
||
|
Other
|
68
|
|
49
|
|
||
|
Total taxes other than income
|
$
|
299
|
|
$
|
183
|
|
General and administrative expenses
increased
$23 million
in
2018
compared to
2017
. This was primarily the result of officer and non-officer compensation, including improved performance of stock-based performance units.
Net interest and other
decreased
$44 million
during
2018
compared to
2017
. This decrease was primarily due the redemption of
$1.76 billion
of debt during 2017, partially offset by the termination of our forward starting interest rate swaps in 2017, which resulted in a gain of
$46 million
. The components of net interest and other are detailed in Item 8. Financial Statements and Supplementary Data -
Note 21
to the consolidated financial statements.
Loss on early extinguishment of debt
decreased
$51 million
in
2018
compared to
2017
primarily due to make-whole call provisions paid upon redemption of
$1.76 billion
in senior unsecured notes in
2017
. See Item 8. Financial Statements and Supplementary Data -
Note 16
to the consolidated financial statements for further detail.
Provision (benefit) for income taxes
reflects an effective tax rate from continuing operations of
23%
and
83%
for
2018
and
2017
. See Item 8. Financial Statements and Supplementary Data -
Note 8
to the consolidated financial statements for a discussion of the effective income tax rate.
Discontinued operations
are presented net of tax. See Item 8. Financial Statements and Supplementary Data -
Note 5
to the consolidated financial statements for financial information concerning our discontinued operations.
Segment Results:
2018
compared to
2017
Segment Income (Loss)
Segment income (loss) represents income (loss) from continuing operations excluding certain items not allocated to operating segments, net of income taxes. A portion of our corporate and operations general and administrative support costs are not allocated to the operating segments. Gains or losses on dispositions, certain impairments, unrealized gains or losses on commodity derivative instruments, pension settlement losses, or other items (as determined by the CODM) are not allocated to operating segments.
The following table reconciles segment income (loss) to net income (loss):
|
Year Ended December 31,
|
|||||||
|
(In millions)
|
2018
|
2017
|
|||||
|
United States
|
$
|
608
|
|
$
|
(148
|
)
|
|
|
International
|
473
|
|
374
|
|
|||
|
Segment income (loss)
|
1,081
|
|
226
|
|
|||
|
Items not allocated to segments, net of income taxes
(a)
|
15
|
|
(1,056
|
)
|
|||
|
Income (loss) from continuing operations
|
1,096
|
|
(830
|
)
|
|||
|
Income (loss) from discontinued operations
(b)
|
—
|
|
(4,893
|
)
|
|||
|
Net income (loss)
|
$
|
1,096
|
|
$
|
(5,723
|
)
|
|
(a)
See Item 8. Financial Statements and Supplementary Data -
Note 7
to the consolidated financial statements for further detail about items not allocated to segments.
(b)
We sold our Canadian business in the second quarter of 2017. The Canadian business is reflected as discontinued operations in
2017
.
United States segment income
increased
$756 million
after-tax
in
2018
compared to
2017
primarily due to higher price realizations and an increase in net sales volumes, which resulted in increased revenues. This increase in revenue was partially offset by an increase in our net loss on commodity derivatives. Additionally, our increase in net sales volumes resulted in a corresponding increase to production expenses, DD&A, taxes other than income, and shipping, handling and other operating expenses which partially offset the increase to revenues.
International segment
income
increased
$99 million
after-tax in
2018
compared to
2017
as a result of increased income in Other International and the U.K. primarily as a result of increased price realizations and an increase in Other International sales
volumes. Lower expenses in 2018 were primarily driven by lower DD&A expense as a result of the decrease in estimated U.K. asset retirement costs, lower E.G. sales volumes and the sale of certain Other International properties. This was partially offset by lower income in Libya due to the 2018 sale of our Libya subsidiary (see
Note 5
to the consolidated financial statements for further information).
Consolidated Results of Operations:
2017
compared to
2016
Revenues from contracts with customers
are presented by segment in the table below:
|
Year Ended December 31,
|
||||||
|
(In millions)
|
2017
|
2016
|
||||
|
Revenues from contracts with customers
|
||||||
|
United States
|
$
|
3,093
|
|
$
|
2,331
|
|
|
International
|
1,154
|
|
665
|
|
||
|
Segment revenues from contracts with customers
|
$
|
4,247
|
|
$
|
2,996
|
|
Below is a price/volume analysis for each segment. Refer to the preceding
Operations
and
Market Conditions
sections for additional detail related to our net sales volumes and average price realizations.
|
Increase (Decrease) Related to
|
||||||||||||||||
|
(In millions)
|
Year Ended December 31, 2016
|
Price Realizations
|
Net Sales Volumes
|
Year Ended December 31, 2017
|
||||||||||||
|
United States Price/Volume Analysis
(a)
|
||||||||||||||||
|
Crude oil and condensate
|
$
|
1,852
|
|
$
|
525
|
|
$
|
25
|
|
$
|
2,402
|
|
||||
|
Natural gas liquids
|
189
|
|
117
|
|
18
|
|
324
|
|
||||||||
|
Natural gas
|
274
|
|
58
|
|
29
|
|
361
|
|
||||||||
|
Other sales
|
16
|
|
6
|
|
||||||||||||
|
Total
|
$
|
2,331
|
|
$
|
3,093
|
|
||||||||||
|
International Price/Volume Analysis
|
||||||||||||||||
|
Crude oil and condensate
|
$
|
537
|
|
$
|
214
|
|
$
|
249
|
|
$
|
1,000
|
|
||||
|
Natural gas liquids
|
9
|
|
5
|
|
1
|
|
15
|
|
||||||||
|
Natural gas
|
87
|
|
4
|
|
6
|
|
97
|
|
||||||||
|
Other sales
|
32
|
|
42
|
|
||||||||||||
|
Total
|
$
|
665
|
|
$
|
1,154
|
|
||||||||||
(a)
Year ended December 31, 2016 includes sales volumes of 14 mboed on an annualized basis relating to assets sold when compared to 2017, primarily consisting of the disposition of Wyoming and certain non-operated CO2 and waterflood assets in West Texas and New Mexico in 2016.
Net gain (loss) on commodity derivatives
decreased
$30 million
in 2017 from 2016. We have multiple crude oil and natural gas derivative contracts indexed to NYMEX WTI and Henry Hub. We record commodity derivative gains/losses as the index pricing and forward curves change each period. See
Note 14
to the consolidated financial statements for further information.
Marketing revenues
decreased
$78 million
in
2017
from
2016
, primarily as a result of lower marketed volumes in the United States segment due to non-core asset dispositions. Marketing activities include the purchase of commodities from third parties for resale and serve to aggregate volumes in order to satisfy transportation commitments as well as to achieve flexibility within product types and delivery points. Since the volume of marketing activity is based on market dynamics, it can fluctuate from period to period.
Income from equity method investments
increased
$81 million
primarily due to higher price realizations from LPG at our Alba plant and methanol at our AMPCO methanol facility. Also contributing to the increase was improvement in net sales volumes primarily driven by the completion of the Alba field compression project in E.G. during the second half of 2016.
Net gain on disposal of assets
decreased
$331 million
in
2017
from
2016
. This decrease was primarily related to the sale of non-core assets in the first half of 2016 in Wyoming, West Texas and New Mexico, and the Gulf of Mexico. See Item 8. Financial Statements and Supplementary Data -
Note 5
to the consolidated financial statements for information about these dispositions.
Other income
increased
$25 million
in 2017 from 2016. This increase was primarily a result of a downward revision in U.K. estimated asset retirement costs as well as timing of abandonment activities in the U.K. See Item 8. Financial Statements and Supplementary Data -
Note 12
to the consolidated financial statements for detail about our asset retirement obligation.
34
Production expenses
remained nearly flat during 2017 while our sales volumes from continuing operations increased. During 2017, our production expense rate (expense per boe) for
United States
was lower primarily due to the disposition of higher cost non-core assets in Wyoming. The International expense rate decreased in the
year
of 2017 primarily due to an increase in sales volumes in E.G. and Libya, combined with lower maintenance costs in E.G.
|
($ per boe)
|
2017
|
2016
|
||||||||||
|
Production Expense Rate
|
Expense
|
Rate
|
Expense
|
Rate
|
||||||||
|
United States
|
$
|
476
|
|
$
|
5.57
|
|
$
|
486
|
|
$
|
5.96
|
|
|
International
|
$
|
239
|
|
$
|
4.51
|
|
$
|
234
|
|
$
|
5.26
|
|
Marketing costs
decreased
$77 million
in
2017
from the prior year, consistent with the decrease in marketing revenues discussed above.
Shipping, handling, and other operating expenses
decreased
$53 million
compared to 2016 which included the termination payment of our Gulf of Mexico deepwater drilling commitment in 2016.
Exploration expenses
increased
$86 million
in
2017
versus the comparable
2016
period, due primarily to charges taken as a result of lower forecasted long-term commodity prices and the anticipated sales of certain non-core properties in our International segment. In 2017, we recorded non-cash charges of
$159 million
comprised of
$95 million
in unproved property impairments in our International segment and
$64 million
dry well costs related to our Diaba License G4-223 in the Republic of Gabon. Additionally, our decision not to develop the Tchicuate offshore Block in the Republic of Gabon resulted in an increase to exploration expenses of
$43 million
during 2017. Unproved property impairments during 2016 primarily consist of non-cash charges related to our decision to not drill our remaining Gulf of Mexico leases.
The following table summarizes the components of exploration expenses:
|
Year Ended December 31,
|
||||||
|
(In millions)
|
2017
|
2016
|
||||
|
Exploration Expenses
|
||||||
|
Unproved property impairments
|
$
|
246
|
|
$
|
195
|
|
|
Dry well costs
|
77
|
|
25
|
|
||
|
Geological and geophysical
|
25
|
|
5
|
|
||
|
Other
|
61
|
|
98
|
|
||
|
Total exploration expenses
|
$
|
409
|
|
$
|
323
|
|
Exploration expense are also discussed in Item 8. Financial Statements and Supplementary Data -
Note 11
to the consolidated financial statements.
Depreciation, depletion and amortization
increased
$216 million
in
2017
from the prior year primarily as a result of an increase of
$176 million
in the
United States
due to a
5%
increase in net sales volumes, and an increase in the DD&A rates within our U.S. resource plays.
Also contributing to this higher expense was an
increase
of
$52 million
in our International segment resulting from increased sales volumes due to the completion and start-up of our E.G. Alba field compression project in mid-2016, and the resumption of sales volumes and production in Libya. Our segments apply the units-of-production method to the majority of their assets, including capitalized asset retirement costs; therefore, volumes have an impact on DD&A expense.
The DD&A rate (expense per boe), which is impacted by field-level changes in sales volumes, reserves and capitalized costs, can also cause changes to our DD&A. The DD&A rate for
United States
increased primarily due to the sales volume mix between our U.S. resource plays, and the outside-operated Gunflint field achieving first production in mid-2016. Also contributing to the increase was a reduction to the Eagle Ford proved developed reserve base in the fourth quarter of 2016. The DD&A rate for our International segment remained relatively consistent with the 2016 rate. The following table provides DD&A rates for each segment.
|
($ per boe)
|
2017
|
2016
|
||||
|
DD&A Rate
|
|
|
||||
|
United States
|
$
|
23.51
|
|
$
|
22.49
|
|
|
International
|
$
|
6.19
|
|
$
|
6.21
|
|
35
Impairments
increased
$162 million
in
2017
from the comparable
2016
period. This increase was primarily consisting of $136 million of proved property impairments in certain non-core properties in our International segment as a result of our anticipated sales and lower forecasted long-term commodity prices. Additionally, included in proved property impairments was $89 million in
2017
and
$67 million
in
2016
, both relating to lower forecasted commodity prices in conventional properties in Oklahoma and the Gulf of Mexico. See Item 8. Financial Statements and Supplementary Data -
Note 11
to the consolidated financial statement for additional detail.
Taxes other than income
includes production, severance and ad valorem taxes, primarily in the U.S., which tend to increase or decrease in relation to revenue and sales volumes. Taxes other than income increased
$32 million
in the current year as a result of increased revenue and sales volumes, and due to a reserve being established for non-income tax examinations relating to open tax years.
The following table summarizes the components of taxes other than income:
|
Year Ended December 31,
|
||||||
|
(In millions)
|
2017
|
2016
|
||||
|
Taxes other than income
|
||||||
|
Production and severance
|
$
|
121
|
|
$
|
91
|
|
|
Ad valorem
|
13
|
|
23
|
|
||
|
Other
|
49
|
|
37
|
|
||
|
Total taxes other than income
|
$
|
183
|
|
$
|
151
|
|
Net interest and other
decreased
$62 million
during 2017 primarily as a result of the termination of our forward starting interest rate swaps, which resulted in a gain of
$46 million
. Additionally, during 2017 we reduced total long-term debt by approximately $1.75 billion which resulted in a reduction to our net interest and other. The components of net interest and other are detailed in Item 8. Financial Statements and Supplementary Data -
Note 16
to the consolidated financial statements.
Loss on early extinguishment of debt
increased
$51 million
in 2017 primarily due to make-whole call provisions of
$46 million
paid upon the redemption of
$1.76 billion
in senior unsecured notes. See Item 8. Financial Statements and Supplementary Data -
Note 16
to the consolidated financial statements for further detail.
Other net periodic benefit costs
decreased
$
83 million
primarily due to reduced pension settlement charges of
$32 million
in
2017
compared to
$103 million
in
2016
.
Provision (benefit) for income taxes
reflects an effective tax rate from continuing operations of
83%
and
79%
for
2017
and
2016
. In 2017, our tax expense was primarily a result of our full valuation allowance on our net federal deferred tax assets throughout 2017 and the effects of our foreign operations. See Item 8. Financial Statements and Supplementary Data -
Note 8
to the consolidated financial statements for a discussion of the effective income tax rate.
Discontinued operations
are presented net of tax. See Item 8. Financial Statements and Supplementary Data -
Note 5
to the consolidated financial statements for financial information concerning our discontinued operations.
36
Segment Results:
2017
compared to
2016
Segment Income (Loss)
Segment income (loss) represents income (loss) from continuing operations excluding certain items not allocated to operating segments, net of income taxes. A portion of our corporate and operations general and administrative support costs are not allocated to the operating segments. Gains or losses on dispositions, certain impairments, unrealized gains or losses on commodity derivative instruments, pension settlement losses, or other items (as determined by the CODM) are not allocated to operating segments.
The following table reconciles segment income (loss) to net income (loss):
|
Year Ended December 31,
|
|||||||
|
(In millions)
|
2017
|
2016
|
|||||
|
United States
|
$
|
(148
|
)
|
$
|
(415
|
)
|
|
|
International
|
374
|
|
228
|
|
|||
|
Segment income (loss)
|
226
|
|
(187
|
)
|
|||
|
Items not allocated to segments, net of income taxes
(a)
|
(1,056
|
)
|
(1,900
|
)
|
|||
|
Income (loss) from continuing operations
|
(830
|
)
|
(2,087
|
)
|
|||
|
Income (loss) from discontinued operations
(b)
|
(4,893
|
)
|
(53
|
)
|
|||
|
Net income (loss)
|
$
|
(5,723
|
)
|
$
|
(2,140
|
)
|
|
(a)
See Item 8. Financial Statements and Supplementary Data -
Note 7
to the consolidated financial statements for further detail about items not allocated to segments.
(b)
We sold our Canadian business in the second quarter of 2017. The Canadian business is reflected as discontinued operations in all periods presented.
United States segment
loss
decreased
$267 million
in 2017 compared to 2016 primarily due to higher price realizations and higher sales volumes. Partially offsetting this revenue increase was an increase in DD&A and a decrease in the income tax benefit, as we did not realize a tax benefit on any net federal deferred tax assets generated in 2017 due to the full valuation allowance on net federal deferred tax assets in the prior year.
International segment
income
increased
$146 million
in 2017 compared to 2016 primarily due to higher price realizations, and an increase in sales volumes in E.G. and Libya. This was partially offset by an increase in DD&A and income tax expense as a result of the increase in sales volumes.
Management’s Discussion and Analysis of Financial Condition, Cash Flows and Liquidity
Commodity prices are the most significant factor impacting our operating cash flows and the amount of capital available to reinvest into the business. In 2018, we experienced an increase in operating cash flows primarily due to improvements in the commodity price environment with increased consolidated average crude oil and condensate price realizations of over
25%
to
$63.32
, and an increase to net sales volumes of
11%
to
420
mboed.
During
2018
we continued our cash flow growth with highlights that include:
|
•
|
Cash and cash equivalents increased approximately $900 million to
$1.5 billion
at December 31,
2018
.
|
|
•
|
Cash provided by operating activities from continuing operations increased by
63%
, compared to the same period last year, to $
3,234 million
.
|
|
•
|
Used this additional cash provided by operating activities to return capital to shareholders by executing
$700 million
of share repurchases.
|
|
•
|
Received
$750 million
in remaining proceeds from the sale of our Canadian business and
$450 million
in proceeds from the sale of our Libya subsidiary.
|
|
•
|
Additionally these divestiture proceeds were used to capture additional acreage in our resource play leasing and exploration program of
$369 million
.
|
At December 31,
2018
, we had approximately
$4.9 billion
of liquidity consisting of
$1.5 billion
in cash and cash equivalents and
$3.4 billion
available under our revolving credit facility. Additionally, during 2018 we extended the maturity date of our Credit Facility from May 28, 2021, to May 28, 2022. As previously discussed in our Outlook section, we are targeting a
$2.6 billion
Capital Budget for
2019
. We believe our current liquidity level, cash flow from operations and ability to access the capital markets provides us with the flexibility to fund our business throughout the different commodity price cycles. We will continue to evaluate the commodity price environment and our spending throughout
2019
.
37
Cash Flows
The following table presents sources and uses of cash and cash equivalents from continuing operations for
2018
,
2017
and
2016
:
|
Year Ended December 31,
|
|||||||||||
|
(In millions)
|
2018
|
2017
|
2016
|
||||||||
|
Sources of cash and cash equivalents
|
|
|
|
|
|||||||
|
Operating activities - continuing operations
|
$
|
3,234
|
|
$
|
1,988
|
|
$
|
901
|
|
||
|
Disposal of assets, net of cash transferred to the buyer
|
1,264
|
|
1,787
|
|
1,219
|
|
|||||
|
Common stock issuance
|
—
|
|
—
|
|
1,236
|
|
|||||
|
Borrowings
|
—
|
|
988
|
|
—
|
|
|||||
|
Other
|
93
|
|
68
|
|
56
|
|
|||||
|
Total sources of cash and cash equivalents
|
$
|
4,591
|
|
$
|
4,831
|
|
$
|
3,412
|
|
||
|
Uses of cash and cash equivalents
|
|||||||||||
|
Additions to property, plant and equipment
|
$
|
(2,753
|
)
|
$
|
(1,974
|
)
|
$
|
(1,204
|
)
|
||
|
Additions to other assets
|
(26
|
)
|
(25
|
)
|
—
|
|
|||||
|
Acquisitions, net of cash acquired
|
(25
|
)
|
(1,891
|
)
|
(902
|
)
|
|||||
|
Purchases of common stock
|
(713
|
)
|
(11
|
)
|
(6
|
)
|
|||||
|
Debt repayments
|
—
|
|
(2,764
|
)
|
(1
|
)
|
|||||
|
Debt extinguishment costs
|
—
|
|
(46
|
)
|
—
|
|
|||||
|
Dividends paid
|
(169
|
)
|
(170
|
)
|
(162
|
)
|
|||||
|
Other
|
(6
|
)
|
(5
|
)
|
(6
|
)
|
|||||
|
Total uses of cash and cash equivalents
|
$
|
(3,692
|
)
|
$
|
(6,886
|
)
|
$
|
(2,281
|
)
|
||
Cash flows generated from operating activities in
2018
were
63%
higher as both commodity price realizations and net sales volumes improved compared to
2017
. Consolidated average crude oil and condensate price realizations increased by over
25%
and net sales volumes increased
11%
during
2018
as compared to
2017
.
Proceeds from the disposals of assets for 2018 are primarily related to our non-operated interest in Libya as well as the remaining proceeds from the sale of our Canadian business. Proceeds from the disposals of assets for 2017 is primarily the result of the disposal of our Canadian business, and in 2016 are primarily from the sale of our Wyoming upstream and midstream assets, as well as the sale of certain other non-operated CO2 and waterflood assets in West Texas and New Mexico. Disposition transactions are discussed in further detail in Item 8. Financial Statements and Supplementary Data –
Note 5
to the consolidated financial statements.
Issuance of common stock reflects net proceeds received in 2016 from our public sale of common stock.
Borrowings in 2017 are a result of the issuance of
$1 billion
of 4.4% senior unsecured notes due in 2027. Financing transactions are discussed in further detail in Item 8. Financial Statements and Supplementary Data –
Note 16
to the consolidated financial statements for additional information.
Additions to property, plant and equipment reflect a significant use of cash and cash equivalents. The following table shows capital expenditures related to continuing operations by segment and reconciles to additions to property, plant and equipment as presented in the consolidated statements of cash flows:
|
Year Ended December 31,
|
|||||||||||
|
(In millions)
|
2018
|
2017
|
2016
|
||||||||
|
United States
(a)
|
$
|
2,620
|
|
$
|
2,081
|
|
$
|
936
|
|
||
|
International
|
39
|
|
42
|
|
82
|
|
|||||
|
Corporate
|
26
|
|
27
|
|
18
|
|
|||||
|
Total capital expenditures
|
2,685
|
|
2,150
|
|
1,036
|
|
|||||
|
Change in capital expenditure accrual
|
68
|
|
(176
|
)
|
168
|
|
|||||
|
Total use of cash and cash equivalents for property, plant and equipment
|
$
|
2,753
|
|
$
|
1,974
|
|
$
|
1,204
|
|
||
(a)
2018 capital expenditures includes 1,800 net acres in New Mexico for $105 million acquired from the Bureau of Land Management lease sale.
38
Additions to other assets relates to deposits on our resource play leasing and exploration program. During 2018 our resource play leasing and exploration capital expenditures totaled
$369 million
, largely including costs within property, plant and equipment, other assets and acquisitions. These expenditures were more than fully funded through the divestiture proceeds received in 2018.
During 2017, we closed on multiple Permian basin acquisitions for approximately $1.9 billion with cash on hand. Additionally, during 2016, we closed the Oklahoma STACK acquisition for a purchase price of
$904 million
, net of cash acquired. See Item 8. Financial Statements and Supplementary Data –
Note 4
to the consolidated financial statements for further information concerning acquisitions.
In 2018, we acquired
36 million
common shares at a cost of
$700 million
, excluding transaction fees and commissions, under our share repurchase program. Shares purchased were held as treasury stock. See
Note 23
to the consolidated financial statements for additional information.
In December 2017, we redeemed
$1 billion
of
5.125%
municipal revenue bonds due in 2037 in a refunding transaction. Additionally, during the third quarter of 2017, we used the net proceeds of the borrowing disclosed above plus existing cash on hand to redeem
$1.76 billion
in senior unsecured notes resulting in a recognized loss on early extinguishment of debt of
$46 million
, primarily due to make-whole call provisions. Financing transactions are discussed in further detail in Item 8. Financial Statements and Supplementary Data –
Note 16
to the consolidated financial statements for additional information.
During
2018
, 2017 and 2016, the Board of Directors approved a $0.05 per share quarterly dividend. See Capital Requirements below for additional information about the fourth quarter 2018 dividend.
Liquidity and Capital Resources
In October 2018, we extended the maturity date of our Credit Facility from May 28, 2021, to May 28, 2022. Fees on the unused commitment to the lenders, as well as the borrowing options under the Credit Facility, remain unaffected by the term extension. We retain the ability to request two one-year extensions and an option to increase the commitment amount by up to an additional
$107 million
, subject to the consent of any increasing lenders. The sub-facilities for swing-line loans and letters of credit remain unchanged allowing up to an aggregate amount of $100 million and $500 million, respectively.
Our main sources of liquidity are cash and cash equivalents, internally generated cash flow from operations, sales of non-core assets, capital market transactions, and our revolving Credit Facility. At
December 31, 2018
, we had approximately
$4.9 billion
of liquidity consisting of
$1.5 billion
in cash and cash equivalents and
$3.4 billion
available under our revolving Credit Facility. Our working capital requirements are supported by these sources and we may draw on our revolving Credit Facility to meet short-term cash requirements, or issue debt or equity securities through the shelf registration statement discussed below as part of our longer-term liquidity and capital management program. Because of the alternatives available to us as discussed above, we believe that our short-term and long-term liquidity are adequate to fund not only our current operations, but also our near-term and long-term funding requirements including our capital spending budgets, dividend payments, defined benefit plan contributions, repayment of debt maturities, and other amounts that may ultimately be paid in connection with contingencies.
General economic conditions, commodity prices, and financial, business and other factors could affect our operations and our ability to access the capital markets. Our corporate credit ratings as of
December 31, 2018
are: Standard & Poor's Ratings Services BBB- (positive); Fitch Ratings BBB (stable); and Moody's Investor Services, Inc. Ba1 (positive).
A downgrade in our credit ratings could increase our future cost of financing or limit our ability to access capital, and result in additional collateral requirements. See Item 1A. Risk Factors for a discussion of how a further downgrade in our credit ratings could affect us.
Additionally, in December of 2017, we redeemed $1 billion of 5.125% municipal revenue bonds due in 2037 in a refunding transaction that preserved our ability to remarket up to $1 billion of tax-exempt municipal bonds prior to 2037. We may incur additional debt in order to fund our capital expenditures, acquisitions or development activities, or for general corporate or other purposes. A higher level of indebtedness could increase the risk that our liquidity and financial flexibility deteriorates. See Item 1A. Risk Factors for a further discussion of how our level of indebtedness could affect us.
Capital Resources
Credit Arrangements and Borrowings
At
December 31, 2018
, we had no borrowings against our revolving credit facility.
At
December 31, 2018
, we had
$5.5 billion
in long-term debt outstanding, with our next debt maturity in the amount of $600 million due in 2020. We do not have any triggers on any of our corporate debt that would cause an event of default in the case of a downgrade of our credit ratings.
39
Shelf Registration
We have a universal shelf registration statement filed with the SEC under which we, as a "well-known seasoned issuer" for purposes of SEC rules, have the ability to issue and sell an indeterminate amount of various types of debt and equity securities.
Asset Disposals
We entered into an agreement to sell our subsidiary, Marathon Oil KDV B.V., which holds our 15% non-operated interest in the Atrush block in Kurdistan for proceeds of
$63 million
, before closing adjustments. Disposition transactions are discussed in further detail in Item 8. Financial Statements and Supplementary Data –
Note 5
to the consolidated financial statements.
Debt-To-Capital Ratio
The Credit Facility includes a covenant requiring that our ratio of total debt to total capitalization not exceed
65%
as of the last day of each fiscal quarter. Our debt-to-capital ratio was
31%
at
December 31, 2018
and
32%
at
December 31, 2017
.
|
(In millions)
|
2018
|
2017
|
|||||
|
Long-term debt due within one year
|
$
|
—
|
|
$
|
—
|
|
|
|
Long-term debt
|
5,499
|
|
5,494
|
|
|||
|
Total debt
|
$
|
5,499
|
|
$
|
5,494
|
|
|
|
Equity
|
$
|
12,128
|
|
$
|
11,708
|
|
|
|
Calculation
|
|||||||
|
Total debt
|
$
|
5,499
|
|
$
|
5,494
|
|
|
|
Total debt plus equity (total capitalization)
|
$
|
17,627
|
|
|
$
|
17,202
|
|
|
Debt-to-capital ratio
|
31
|
%
|
32
|
%
|
|||
Capital Requirements
Capital Spending
Our approved Capital Budget for
2019
is
$2.6 billion
. Additional details were previously discussed in
Outlook
.
Share Repurchase Program
In 2018, we acquired
36 million
common shares at a cost of
$700 million
under our share repurchase program. The remaining share repurchase authorization as of
December 31, 2018
is
$800 million
.
Other Expected Cash Outflows
On January 30, 2019, our Board of Directors approved a dividend of $0.05 per share for the fourth quarter of
2018
. The dividend is payable on March 11, 2019 to shareholders of record on February 20, 2019.
We plan to make contributions of up to
$50 million
to our funded pension plans during
2019
. Cash contributions to be paid from our general assets for the unfunded pension and postretirement plans are expected to be approximately
$5 million
and
$18 million
in
2019
.
40
Contractual Cash Obligations
The table below provides aggregated information on our consolidated obligations to make future payments under existing contracts as of
December 31, 2018
.
|
(In millions)
|
Total
|
2019
|
2020-
2021
|
2022-
2023
|
Later
Years
|
||||||||||||||
|
Short and long-term debt (includes interest)
(a)
|
$
|
8,521
|
|
$
|
256
|
|
$
|
1,087
|
|
$
|
1,680
|
|
$
|
5,498
|
|
||||
|
Lease obligations
|
217
|
|
62
|
|
89
|
|
17
|
|
49
|
|
|||||||||
|
Purchase obligations:
|
|
|
|
|
|||||||||||||||
|
Oil and gas activities
(b)
|
69
|
|
58
|
|
1
|
|
1
|
|
9
|
|
|||||||||
|
Service and materials contracts
(c)
|
122
|
|
83
|
|
39
|
|
—
|
|
—
|
|
|||||||||
|
Transportation and related contracts
|
1,355
|
|
327
|
|
330
|
|
229
|
|
469
|
|
|||||||||
|
Other
(d)
|
39
|
|
18
|
|
21
|
|
—
|
|
—
|
|
|||||||||
|
Total purchase obligations
|
1,585
|
|
486
|
|
391
|
|
230
|
|
478
|
|
|||||||||
|
Other long-term liabilities reported in the consolidated balance sheet
(e)
|
548
|
|
149
|
|
65
|
|
56
|
|
278
|
|
|||||||||
|
Total contractual cash obligations
(f)
|
$
|
10,871
|
|
$
|
953
|
|
$
|
1,632
|
|
$
|
1,983
|
|
$
|
6,303
|
|
||||
|
(a)
|
Includes anticipated cash payments for interest of
$256 million
for
2019
,
$487 million
for
2020
-
2021
,
$443 million
for
2022
-
2023
and
$1,798 million
for the remaining years for a total of
$2,984 million
.
|
|
(b)
|
Oil and gas activities include contracts to acquire property, plant and equipment and commitments for oil and gas exploration such as costs related to contractually obligated exploratory work programs that are expensed immediately.
|
|
(c)
|
Service and materials contracts include contracts to purchase services such as utilities, supplies and various other maintenance and operating services.
|
|
(d)
|
Includes any drilling rigs and fracturing crews that are not considered lease obligations.
|
|
(e)
|
Primarily includes obligations for pension and other postretirement benefits including medical and life insurance. We have estimated projected funding requirements through 2027. Although unrecognized tax benefits are not a contractual obligation, they are presented in this table because they represent potential demands on our liquidity.
|
|
(f)
|
This table does not include the estimated discounted liability for dismantlement, abandonment and restoration costs of oil and gas properties of
$1,145 million
. See Item 8. Financial Statements and Supplementary Data –
Note 12
to the consolidated financial statements.
|
Transactions with Related Parties
We own a 63% working interest in the Alba field offshore E.G. Onshore E.G., we own a 52% interest in an LPG processing plant, a 60% interest in an LNG production facility and a 45% interest in a methanol production plant, each through equity method investees. We sell our natural gas from the Alba field to these equity method investees as the feedstock for their production processes.
Off-Balance Sheet Arrangements
Off-balance sheet arrangements comprise those arrangements that may potentially impact our liquidity, capital resources and results of operations, even though such arrangements are not recorded as liabilities under accounting principles generally accepted in the U.S. Although off-balance sheet arrangements serve a variety of our business purposes, we are not dependent on these arrangements to maintain our liquidity and capital resources, and we are not aware of any circumstances that are reasonably likely to cause the off-balance sheet arrangements to have a material adverse effect on liquidity and capital resources.
We will issue stand-alone letters of credit when required by a business partner. Such letters of credit outstanding at
December 31, 2018
,
2017
and
2016
aggregated
$52 million
,
$89 million
and
$166 million
. Most of the letters of credit are in support of obligations recorded in the consolidated balance sheet. For example, they are issued to counterparties to support firm transportation agreements and future abandonment liabilities.
In 2018, we signed an agreement with a lessor to construct and lease a new build-to-suit office building in Houston, Texas. The new Houston office location is expected to be completed in 2021. The lessor and other participants are providing financing for up to $380 million, to fund the estimated project costs. As of December 31, 2018 project costs incurred totaled $45 million, primarily for land acquisition costs. The five-year lease term will commence once construction is substantially complete and the new Houston office is able to be occupied. At the end of the initial lease term, we can extend the term of the lease for an additional five years, subject to the approval of the participants; purchase the property subject to certain terms and conditions; remarket the property to an unrelated third party. As of December 31, 2018 we have recorded this agreement as an operating lease, see Item 8. Financial Statements and Supplementary Data –
Note 24
to the consolidated financial statements for further information on operating leases.
41
Management’s Discussion and Analysis of Environmental Matters, Litigation and Contingencies
We have incurred and may continue to incur substantial capital, operating and maintenance and remediation expenditures as a result of environmental laws and regulations. If these expenditures, as with all costs, are not ultimately reflected in the prices of our products and services, our operating results will be adversely affected. We believe that substantially all of our competitors must comply with similar environmental laws and regulations. However, the specific impact on each competitor may vary depending on a number of factors, including the age and location of its operating facilities, marketing areas and production processes.
We accrue for environmental remediation activities when the responsibility to remediate is probable and the amount of associated costs can be reasonably estimated. As environmental remediation matters proceed toward ultimate resolution or as additional remediation obligations arise, charges in excess of those previously accrued may be required.
New or expanded environmental requirements, which could increase our environmental costs, may arise in the future. We strive to comply with all legal requirements regarding the environment, but as not all costs are fixed or presently determinable (even under existing legislation) and may be affected by future legislation or regulations, it is not possible to predict all of the ultimate costs of compliance, including remediation costs that may be incurred and penalties that may be imposed.
For more information on environmental regulations that impact us, or could impact us, see
Item 1. Business – Environmental, Health and Safety Matters
,
Item 1A. Risk Factors
and
Item 3. Legal Proceedings
.
Critical Accounting Estimates
The preparation of financial statements in accordance with accounting principles generally accepted in the U.S. requires us to make estimates and assumptions that affect the reported amounts of assets and liabilities and the disclosure of contingent assets and liabilities as of the date of the consolidated financial statements and the reported amounts of revenues and expenses during the respective reporting periods. Accounting estimates are considered to be critical if (1) the nature of the estimates and assumptions is material due to the levels of subjectivity and judgment necessary to account for highly uncertain matters or the susceptibility of such matters to change, and (2) the impact of the estimates and assumptions on financial condition or operating performance is material. Actual results could differ from the estimates and assumptions used.
Estimated Quantities of Net Reserves
We use the successful efforts method of accounting for our oil and gas producing activities. The successful efforts method inherently relies on the estimation of proved crude oil and condensate, NGLs and natural gas reserves. The amount of estimated proved reserve volumes affect, among other things, whether certain costs are capitalized or expensed, the amount and timing of costs depreciated, depleted or amortized into net income and the presentation of supplemental information on oil and gas producing activities. In addition, the expected future cash flows to be generated by producing properties are used for testing impairment and the expected future taxable income available to realize deferred tax assets, also in part, rely on estimates of quantities of net reserves. Refer to the applicable sections below for further discussion of these accounting estimates.
The estimation of quantities of net reserves is a highly technical process performed by our engineers and geoscientists for crude oil and condensate, NGLs and natural gas, which is based upon several underlying assumptions. The reserve estimates may change as additional information becomes available and as contractual, operational, economic and political conditions change. We evaluate our reserves using drilling results, reservoir performance, seismic interpretation and future plans to develop acreage. Technologies used in proved reserves estimation includes statistical analysis of production performance, decline curve analysis, pressure and rate transient analysis, pressure gradient analysis, reservoir simulation and volumetric analysis. The observed statistical nature of production performance coupled with highly certain reservoir continuity or quality within the reliable technology areas and sufficient proved developed locations establish the reasonable certainty criteria required for booking proved reserves. The data for a given reservoir may also change over time as a result of numerous factors including, but not limited to, additional development activity, production history and continual reassessment of the viability of production under varying economic conditions.
42
Reserve estimates are based on an unweighted arithmetic average of commodity prices during the 12-month period, using the closing prices on the first day of each month, as defined by the SEC. The table below provides the
2018
SEC pricing for certain benchmark prices:
|
2018 SEC Pricing
|
|||
|
WTI Crude oil (per bbl)
|
$
|
65.56
|
|
|
Henry Hub natural gas (per mmbtu)
|
$
|
3.05
|
|
|
Brent crude oil (per bbl)
|
$
|
72.70
|
|
|
Mont Belvieu NGLs (per bbl)
|
$
|
26.63
|
|
When determining the
December 31, 2018
proved reserves for each property, the benchmark prices listed above were adjusted using price differentials that account for property-specific quality and location differences.
Estimates of future cash flows associated with proved reserves are based on actual costs of developing and producing proved reserves at the end of the year. If annual SEC crude oil benchmark prices (see table above) were to decrease to approximately
$45
per bbl, or 30% below average prices used to estimate
2018
proved reserves, we would not expect price related reserve revisions to have a material impact on proved reserve volumes. For further discussion of risks associated with our estimation of proved reserves, see Part I.
Item 1A Risk Factors
.
Depreciation and depletion of crude oil and condensate, NGLs and natural gas producing properties is determined by the units-of-production method and could change with revisions to estimated proved reserves. While revisions of previous reserve estimates have not historically been significant to the depreciation and depletion rates of our segments, any reduction in proved reserves, could result in an acceleration of future DD&A expense. The following table illustrates, on average, the sensitivity of each segment's units-of-production DD&A per boe and pretax income to a hypothetical 10% change in
2018
proved reserves based on
2018
production.
|
Impact of a 10% Increase in Proved Reserves
|
Impact of a 10% Decrease in Proved Reserves
|
||||||||||||||
|
(In millions, except per boe)
|
DD&A per boe
|
Pretax Income
|
DD&A per boe
|
Pretax Income
|
|||||||||||
|
United States
|
$
|
(1.85
|
)
|
$
|
202
|
|
$
|
2.27
|
|
$
|
(246
|
)
|
|||
|
International
|
$
|
(0.40
|
)
|
$
|
18
|
|
$
|
0.49
|
|
$
|
(22
|
)
|
|||
Asset Retirement Obligations
We have material legal, regulatory and contractual obligations to remove and dismantle long-lived assets and to restore land or seabed at the end of oil and gas production operations. A liability equal to the fair value of such obligations and a corresponding capitalized asset retirement cost are recognized on the balance sheet in the period in which the legal obligation is incurred and a reasonable estimate of fair value can be made. The capitalized asset retirement cost is depreciated using the units-of-production method or the straight line method (dependent on the underlying asset) and the discounted liability is accreted over the period until the obligation is satisfied, the impacts of which are recognized as DD&A in the consolidated statements of income. In many cases, the satisfaction and subsequent discharge of these liabilities is projected to occur many years, or even decades, into the future. Furthermore, the legal, regulatory and contractual requirements often do not provide specific guidance regarding removal practices and the criteria that must be fulfilled when the removal and/or restoration event actually occurs.
Estimates of retirement costs are developed for each property based on numerous factors, such as the scope of the dismantlement, timing of settlement, interpretation of legal, regulatory and contractual requirements, type of production and processing structures, depth of water (if applicable), reservoir characteristics, depth of the reservoir, market demand for equipment, currently available dismantlement and restoration procedures and consultations with construction and engineering professionals. Currency exchange rates, inflation rates and credit-adjusted-risk-free interest rates are then applied to estimate the fair values of the obligations. To the extent these or other assumptions change after initial recognition of the liability, the fair value estimate is revised and the recognized liability adjusted, with a corresponding adjustment made to the related asset balance or income statement, as appropriate. Changes in estimated asset retirement obligations for late life assets could result in impairment or in the recognition of income. During 2018 we made revisions to these estimates and reduced our recognized liability by
$204 million
. This downward revision was primarily due to the acceleration of our U.K. abandonment activities to capture favorable market conditions and lower estimated abandonment costs. See Item 8. Financial Statements and Supplementary Data –
Note 12
to the consolidated financial statements for disclosures regarding our asset retirement obligation estimates.
43
An estimate of the sensitivity to net income if other assumptions had been used in recording these liabilities is not practical because of the number of obligations that must be assessed, the number of underlying assumptions and the wide range of possible assumptions.
Fair Value Estimates
Fair value is the price that would be received to sell an asset or paid to transfer a liability in an orderly transaction between market participants at the measurement date. There are three approaches for measuring the fair value of assets and liabilities: the market approach, the income approach and the cost approach, each of which includes multiple valuation techniques. The market approach uses prices and other relevant information generated by market transactions involving identical or comparable assets or liabilities. The income approach uses valuation techniques to measure fair value by converting future amounts, such as cash flows or earnings, into a single present value, or range of present values, using current market expectations about those future amounts. The cost approach is based on the amount that would currently be required to replace the service capacity of an asset. This is often referred to as current replacement cost. The cost approach assumes that the fair value would not exceed what it would cost a market participant to acquire or construct a substitute asset of comparable utility, adjusted for obsolescence.
The fair value accounting standards do not prescribe which valuation technique should be used when measuring fair value and do not prioritize among the techniques. These standards establish a fair value hierarchy that prioritizes the inputs used in applying the various valuation techniques. Inputs broadly refer to the assumptions that market participants use to make pricing decisions, including assumptions about risk. Level 1 inputs are given the highest priority in the fair value hierarchy while Level 3 inputs are given the lowest priority. The three levels of the fair value hierarchy are as follows:
|
•
|
Level 1 – Observable inputs that reflect unadjusted quoted prices for identical assets or liabilities in active markets as of the measurement date. Active markets are those in which transactions for the asset or liability occur in sufficient frequency and volume to provide pricing information on an ongoing basis.
|
|
•
|
Level 2 – Observable market-based inputs or unobservable inputs that are corroborated by market data. These are inputs other than quoted prices in active markets included in Level 1, which are either directly or indirectly observable as of the measurement date.
|
|
•
|
Level 3 – Unobservable inputs that are not corroborated by market data and may be used with internally developed methodologies that result in management’s best estimate of fair value.
|
Valuation techniques that maximize the use of observable inputs are favored. Assets and liabilities are classified in their entirety based on the lowest priority level of input that is significant to the fair value measurement. The assessment of the significance of a particular input to the fair value measurement requires judgment and may affect the placement of assets and liabilities within the levels of the fair value hierarchy. See Item 8. Financial Statements and Supplementary Data –
Note 15
to the consolidated financial statements for disclosures regarding our fair value measurements.
Significant uses of fair value measurements include:
|
•
|
impairment assessments of long-lived assets;
|
|
•
|
impairment assessments of goodwill; and
|
|
•
|
recorded value of derivative instruments.
|
The need to test long-lived assets and goodwill for impairment can be based on several indicators, including a significant reduction in prices of crude oil and condensate, NGLs and natural gas, sustained declines in our common stock, reductions to our Capital Budget, unfavorable adjustments to reserves, significant changes in the expected timing of production, other changes to contracts or changes in the regulatory environment in which the property is located.
Impairment Assessments of Long-Lived Assets
Long-lived assets in use are assessed for impairment whenever changes in facts and circumstances indicate that the carrying value of the assets may not be recoverable. For purposes of an impairment evaluation, long-lived assets must be grouped at the lowest level for which independent cash flows can be identified, which generally is field-by-field or, in certain instances, by logical grouping of assets if there is significant shared infrastructure or contractual terms that cause economic interdependency amongst separate, discrete fields. If the sum of the undiscounted estimated cash flows from the use of the asset group and its eventual disposition is less than the carrying value of an asset group, the carrying value is written down to the estimated fair value. During 2018 the anticipated sales of certain non-core proved properties in our International and United States segments triggered an assessment of certain of our long-lived assets related to oil and gas producing properties for impairment. We estimated the fair values using a market approach, based upon anticipated sales proceeds less costs to sell, and recognized impairments. As of
December 31, 2018
our estimated undiscounted cash flows relating to our remaining long-lived assets significantly exceeded their carrying values in our core assets. Long-lived assets most at risk for future impairment had
44
an estimated carrying value of less than $50 million. See Item 8. Financial Statements and Supplementary Data
Note 11
and
Note 15
to the consolidated financial statements for discussion of impairments recorded in
2018
,
2017
and
2016
and the related fair value measurements.
Fair value calculated for the purpose of testing our long-lived assets for impairment is estimated using the present value of expected future cash flows method and comparative market prices when appropriate. Significant judgment is involved in performing these fair value estimates since the results are based on forecasted assumptions. Significant assumptions include:
|
•
|
Future crude oil and condensate, NGLs and natural gas prices.
Our estimates of future prices are based on our analysis of market supply and demand and consideration of market price indicators. Although these commodity prices may experience extreme volatility in any given year, we believe long-term industry prices are driven by global market supply and demand. To estimate supply, we consider numerous factors, including the worldwide resource base, depletion rates and OPEC production policies. We believe demand is largely driven by global economic factors, such as population and income growth, governmental policies and vehicle stocks. The prices we use in our fair value estimates are consistent with those used in our planning and capital investment reviews. There has been significant volatility in crude oil and condensate, NGLs and natural gas prices and estimates of such future prices are inherently imprecise. See Item 1A. Risk Factors for further discussion on commodity prices.
|
|
•
|
Estimated quantities of crude oil and condensate, NGLs and natural gas.
Such quantities are based on a combination of proved reserves and risk-weighted probable reserves and resources such that the combined volumes represent the most likely expectation of recovery. See Item 1A. Risk Factors for further discussion on reserves.
|
|
•
|
Expected timing of production.
Production forecasts are the outcome of engineering studies which estimate reserves, as well as expected capital programs. The actual timing of the production could be different than the projection. Cash flows realized later in the projection period are less valuable than those realized earlier due to the time value of money. The expected timing of production that we use in our fair value estimates is consistent with that used in our planning and capital investment reviews.
|
|
•
|
Discount rate commensurate with the risks involved.
We apply a discount rate to our expected cash flows based on a variety of factors, including market and economic conditions, operational risk, regulatory risk and political risk. A higher discount rate decreases the net present value of cash flows.
|
|
•
|
Future capital requirements.
Our estimates of future capital requirements are based upon a combination of authorized spending and internal forecasts.
|
We base our fair value estimates on projected financial information which we believe to be reasonably likely to occur. An estimate of the sensitivity to changes in assumptions in our undiscounted cash flow calculations is not practicable, given the numerous assumptions (e.g. reserves, pace and timing of development plans, commodity prices, capital expenditures, operating costs, drilling and development costs, inflation and discount rates) that can materially affect our estimates. Unfavorable adjustments to some of the above listed assumptions would likely be offset by favorable adjustments in other assumptions. For example, the impact of sustained reduced commodity prices on future undiscounted cash flows would likely be partially offset by lower costs.
Impairment Assessments of Goodwill
Goodwill is tested for impairment on an annual basis, or between annual tests when events or changes in circumstances indicate the fair value may have been reduced below its carrying value. Goodwill is tested for impairment at the reporting unit level. Our reporting units are the same as our reporting segments, of which only International includes goodwill. As of
December 31, 2018
, our consolidated balance sheet included goodwill of $
97 million
. Determining the fair value of a reporting unit requires judgment and the use of significant estimates and assumptions. We first assess the qualitative factors in order to determine whether the fair value of our International reporting unit is more likely than not less than its carrying amount. Certain qualitative factors used in our evaluation include, among other things, the results of the most recent quantitative assessment of the goodwill impairment test, macroeconomic conditions; industry and market conditions (including commodity prices and cost factors); overall financial performance; and other relevant entity-specific events. If, after considering these events and circumstances we determined that it is more likely than not that the fair value of the International reporting unit is less than its carrying amount, a quantitative goodwill test is performed. The quantitative goodwill test is performed using a combination of market and income approaches. The market approach references observable inputs specific to us and our industry, such as the price of our common equity, our enterprise value, and valuation multiples of us and our peers from the investor analyst community. The income approach utilizes discounted cash flows, which are based on forecasted assumptions. Key assumptions to the income approach are the same as those described above regarding our impairment assessment of long lived assets and are consistent with those that management uses to make business decisions.
45
During the second quarter of 2018, we performed our annual impairment test of goodwill using the qualitative assessment. Our qualitative assessment considered the significant excess fair value over carrying value in our most recent step 1 test (second quarter 2017) and noted a general improvement in the qualitative factors above. After assessing the totality of the qualitative factors which could have a positive or negative impact on goodwill, our assessment did not indicate that it is more likely than not that the fair value is less than its carrying value. As a result, we concluded that no impairment to goodwill was required for our International reporting unit. We believe the estimates and assumptions used in our impairment assessments are reasonable and based on available market information, but variations in such assumptions could result in materially different calculations of fair value and determinations of whether or not an impairment is indicated. See Item 8. Financial Statements and Supplementary Data
Note 13
to the consolidated financial statements for additional discussion of goodwill.
Derivatives
We record all derivative instruments at fair value. Fair value measurements for all our derivative instruments are based on observable market-based inputs that are corroborated by market data and are discussed in Item 8. Financial Statements and Supplementary Data –
Note 14
to the consolidated financial statements. Additional information about derivatives and their valuation may be found in
Item 7A. Quantitative and Qualitative Disclosures About Market Risk
.
Income Taxes
We are subject to income taxes in numerous taxing jurisdictions worldwide. Estimates of income taxes to be recorded involve interpretation of complex tax laws and assessment of the effects of foreign taxes on our U.S. federal income taxes.
Uncertainty exists regarding tax positions taken in previously filed tax returns which remain subject to examination, along with positions expected to be taken in future returns. We provide for unrecognized tax benefits, based on the technical merits, when it is more likely than not that an uncertain tax position will not be sustained upon examination. Adjustments are made to the uncertain tax positions when facts and circumstances change, such as the closing of a tax audit; court proceedings; changes in applicable tax laws, including tax case rulings and legislative guidance; or expiration of the applicable statute of limitations.
We have recorded deferred tax assets and liabilities, measured at enacted tax rates, for temporary differences between book basis and tax basis, tax credit carryforwards and operating loss carryforwards. In accordance with U.S. GAAP accounting standards, we routinely assess the realizability of our deferred tax assets and reduce such assets, to the expected realizable amount, by a valuation allowance if it is more likely than not that some portion or all of the deferred tax assets will not be realized. In assessing the need for additional or adjustments to existing valuation allowances, we consider all available positive and negative evidence. Positive evidence includes reversals of temporary differences, forecasts of future taxable income, assessment of future business assumptions and applicable tax planning strategies that are prudent and feasible. Negative evidence includes losses in recent years as well as the forecasts of future income (loss) in the realizable period. In making our assessment regarding valuation allowances, we weight the evidence based on objectivity.
We base our future taxable income estimates on projected financial information which we believe to be reasonably likely to occur. Numerous judgments and assumptions are inherent in the estimation of future taxable income, including factors such as future operating conditions and the assessment of the effects of foreign taxes on our U.S. federal income taxes. Future operating conditions can be affected by numerous factors, including (i) future crude oil and condensate, NGLs and natural gas prices, (ii) estimated quantities of crude oil and condensate, NGLs and natural gas, (iii) expected timing of production, and (iv) future capital requirements. These assumptions are described in further detail above regarding our impairment assessment of long-lived assets. An estimate of the sensitivity to changes in assumptions resulting in future taxable income calculations is not practicable, given the numerous assumptions that can materially affect our estimates. Unfavorable adjustments to some of the above listed assumptions would likely be offset by favorable adjustments in other assumptions. For example, the impact of sustained reduced commodity prices on future taxable income would likely be partially offset by lower capital expenditures.
Based on the assumptions and judgments described above, as of
December 31, 2018
, we reflect a valuation allowance in our consolidated balance sheet of
$749 million
against our gross deferred tax assets of $
2.0 billion
in various jurisdictions in which we operate. Our gross deferred tax assets consist primarily of federal U.S. operating loss carryforwards of
$655 million
, which will expire in 2035 - 2037, and
$472 million
in 2018 which can be carried forward indefinitely. Since December 31, 2016, we have maintained a full valuation allowance on our net federal deferred tax assets. If objective negative evidence in the form of cumulative losses are no longer present and additional weight is given to subjective evidence such as forecasted projections of taxable income in future years, we would adjust the amount of the federal deferred tax assets considered realizable and reduce the provision for income taxes in the period of adjustment. See Item 8. Financial Statements and Supplementary Data –
Note 8
to the consolidated financial statements for further detail.
46
Pension and Other Postretirement Benefit Obligations
Accounting for pension and other postretirement benefit obligations involves numerous assumptions, the most significant of which relate to the following:
|
•
|
the discount rate for measuring the present value of future plan obligations;
|
|
•
|
the expected long-term return on plan assets;
|
|
•
|
the rate of future increases in compensation levels; and
|
We develop our demographics and utilize the work of third-party actuaries to assist in the measurement of these obligations. We have selected different discount rates for our U.S. pension plans and our other U.S. postretirement benefit plans due to the different projected benefit payment patterns. In determining the assumed discount rates, our methods include a review of market yields on high-quality corporate debt and use of our third-party actuary's discount rate model. This model calculates an equivalent single discount rate for the projected benefit plan cash flows using a yield curve derived from bond yields. The yield curve represents a series of annualized individual spot discount rates from 0.5 to 99 years. The bonds used are rated AA or higher by a recognized rating agency, only non-callable bonds are included and outlier bonds (bonds that have a yield to maturity that significantly deviates from the average yield within each maturity grouping) are removed. Each issue is required to have at least $300 million par value outstanding. The constructed yield curve is based on those bonds representing the 50% highest yielding issuances within each defined maturity group.
Of the assumptions used to measure obligations and estimated annual net periodic benefit cost as of
December 31, 2018
the discount rate has the most significant effect on the periodic benefit cost reported for the plans. The hypothetical impacts of a 0.25% change in the discount rates of
4.26%
for our U.S. pension plans and
4.09%
for our other U.S. postretirement benefit plans is summarized in the table below:
|
Impact of a 0.25% Increase in Discount Rate
|
Impact of a 0.25% Decrease in Discount Rate
|
||||||||||||||
|
(In millions)
|
Obligation
|
Expense
|
Obligation
|
Expense
|
|||||||||||
|
U.S. pension plans
|
$
|
(3
|
)
|
$
|
—
|
|
$
|
3
|
|
$
|
—
|
|
|||
|
Other U.S. postretirement benefit plans
|
$
|
(1
|
)
|
$
|
—
|
|
$
|
1
|
|
$
|
—
|
|
|||
The asset rate of return assumption for the funded U.S. plan considers the plan's asset mix (currently targeted at approximately
55%
equity and
45%
other fixed income securities), past performance and other factors. Certain components of the asset mix are modeled with various assumptions regarding inflation, debt returns and stock yields. Decreasing the
6.50%
asset rate of return assumption by 0.25% would not have a significant impact on our defined benefit pension expense.
Compensation change assumptions are based on historical experience, anticipated future management actions and demographics of the benefit plans. Health care cost trend assumptions are developed based on historical cost data, the near-term outlook and an assessment of likely long-term trends.
Item 8. Financial Statements and Supplementary Data –
Note 18
to the consolidated financial statements includes detailed information about the assumptions used to calculate the components of our annual defined benefit pension and other postretirement plan expense, as well as the obligations and accumulated other comprehensive income reported on the consolidated balance sheets.
Contingent Liabilities
We accrue contingent liabilities for environmental remediation, tax deficiencies related to operating taxes, as well as tax disputes and litigation claims when such contingencies are probable and estimable. Actual costs can differ from estimates for many reasons. For instance, settlement costs for claims and litigation can vary from estimates based on differing interpretations of laws, opinions on responsibility and assessments of the amount of damages. Similarly, liabilities for environmental remediation may vary from estimates because of changes in laws, regulations and their interpretation, additional information on the extent and nature of site contamination and improvements in technology. Our in-house legal counsel regularly assesses these contingent liabilities. In certain circumstances outside legal counsel is utilized.
We generally record losses related to these types of contingencies as other operating expense or general and administrative expense in the consolidated statements of income, except for tax contingencies unrelated to income taxes, which are recorded as taxes other than income. For additional information on contingent liabilities, see
Item 7. Management’s Discussion and Analysis of Financial Condition and Results of Operations – Management’s Discussion and Analysis of Environmental Matters, Litigation and Contingencies
.
47
An estimate of the sensitivity to net income if other assumptions had been used in recording these liabilities is not practical because of the number of contingencies that must be assessed, the number of underlying assumptions and the wide range of reasonably possible outcomes, in terms of both the probability of loss and the estimates of such loss.
Accounting Standards Not Yet Adopted
See Item 8. Financial Statements and Supplementary Data –
Note 2
to the consolidated financial statements.
48
Item 7A. Quantitative and Qualitative Disclosures About Market Risk
We are exposed to market risks related to the volatility of crude oil and condensate, NGLs, and natural gas prices as the volatility of these prices continues to impact our industry. We expect commodity prices to remain volatile and unpredictable in the future, we are also exposed to market risks related to changes in interest rates. We employ various strategies, including the use of financial derivative instruments, to manage the risks related to commodity price fluctuations. We are at risk for changes in the fair value of all of our derivative instruments; however, such risk should be mitigated by price changes related to the underlying commodity or financial transaction. While the use of derivative instruments could materially affect our results of operations in particular quarterly or annual periods, we believe that the use of these instruments will not have a material adverse effect on our financial position or liquidity.
See Item 8. Financial Statements and Supplementary Data –
Note 14
and
Note 15
to the consolidated financial statements for more information about the fair value measurement of our derivatives, the amounts recorded in our consolidated balance sheets and statements of income and the related notional amounts.
Commodity Price Risk
Our strategy is to obtain competitive prices for our products and allow operating results to reflect market price movements dictated by supply and demand. However, management will periodically protect prices on forecasted sales to support cash flow and liquidity, as deemed appropriate. We may use a variety of commodity derivative instruments, including futures, forwards, swaps and combinations of options, as part of an overall program to manage commodity price risk in our business. Our consolidated results for
2018
,
2017
and 2016 were impacted by crude oil and natural gas derivatives related to a portion of our forecasted United States sales.
As of
December 31, 2018
, we had various open commodity derivatives related to crude oil and natural gas with a net asset position of
$127 million
. Based on the
December 31, 2018
, published NYMEX WTI and Henry Hub futures prices, a hypothetical 10% change (per bbl for crude oil and per MMBtu for natural gas) increases (decreases) the fair values of our net commodity derivative open positions as follows:
|
(In millions)
|
Hypothetical Price Increase of 10%
|
Hypothetical Price Decrease of 10%
|
||||
|
Crude oil derivatives
|
$
|
(30
|
)
|
$
|
19
|
|
|
Natural gas derivatives
|
(1
|
)
|
1
|
|
||
|
Total
|
$
|
(31
|
)
|
$
|
20
|
|
Interest Rate Risk
At
December 31, 2018
, our portfolio of long-term debt is comprised of fixed-rate instruments with an outstanding balance of $
5.5 billion
. Our sensitivity to interest rate movements and corresponding changes in the fair value of our fixed-rate debt portfolio affects our results of operations and cash flows only when we elect to repurchase or otherwise retire fixed-rate debt at prices different than carrying value.
Counterparty Risk
We are also exposed to financial risk in the event of nonperformance by counterparties. If commodity prices fall below current levels, some of our counterparties may experience liquidity problems and may not be able to meet their financial obligations to us. We review the creditworthiness of counterparties and use master netting agreements when appropriate.
49
Item 8. Financial Statements and Supplementary Data
Index
|
|
Page
|
50
Management’s Responsibilities for Financial Statements
To the Stockholders of Marathon Oil Corporation:
The accompanying consolidated financial statements of Marathon Oil Corporation and its consolidated subsidiaries ("Marathon Oil") are the responsibility of management and have been prepared in conformity with accounting principles generally accepted in the United States. They necessarily include some amounts that are based on best judgments and estimates. The financial information displayed in other sections of this Annual Report on Form 10-K is consistent with these consolidated financial statements.
Marathon Oil seeks to assure the objectivity and integrity of its financial records by careful selection of its managers, by organization arrangements that provide an appropriate division of responsibility and by communications programs aimed at assuring that its policies and methods are understood throughout the organization.
The Board of Directors pursues its oversight role in the area of financial reporting and internal control over financial reporting through its Audit and Finance Committee. This Committee, composed solely of independent directors, regularly meets (jointly and separately) with the independent registered public accounting firm, management and internal auditors to monitor the proper discharge by each of their responsibilities relative to internal accounting controls and the consolidated financial statements.
|
/s/ Lee M. Tillman
|
|
/s/ Dane E. Whitehead
|
|
|
|
Chairman, President and Chief Executive Officer
|
|
Executive Vice President and Chief Financial Officer
|
|
|
Management’s Report on Internal Control over Financial Reporting
To the Stockholders of Marathon Oil Corporation:
Marathon Oil’s management is responsible for establishing and maintaining adequate internal control over financial reporting (as defined in Rules 13(a) – 15(f) under the Securities Exchange Act of 1934). Our internal control over financial reporting is designed to provide reasonable assurance regarding the reliability of financial reporting and the preparation of the consolidated financial statements.
Because of its inherent limitations, internal control over financial reporting may not prevent or detect misstatements and even when determined to be effective, can only provide reasonable assurance with respect to financial statement preparation and presentation. Also, projections of any evaluation of effectiveness to future periods are subject to the risk that controls may become inadequate because of changes in conditions or that the degree of compliance with the policies or procedures may deteriorate.
An evaluation of the design and effectiveness of our internal control over financial reporting, based on the 2013 framework in
Internal Control – Integrated Framework
issued by the Committee of Sponsoring Organizations of the Treadway Commission, was conducted under the supervision and with the participation of management, including our Chief Executive Officer and Chief Financial Officer. Based on the results of this evaluation, Marathon Oil’s management concluded that its internal control over financial reporting was effective as of
December 31, 2018
.
The effectiveness of Marathon Oil’s internal control over financial reporting as of
December 31, 2018
has been audited by PricewaterhouseCoopers LLP, an independent registered public accounting firm, as stated in their report which is included herein.
|
/s/ Lee M. Tillman
|
|
/s/ Dane E. Whitehead
|
|
|
Chairman, President and Chief Executive Officer
|
|
Executive Vice President and Chief Financial Officer
|
|
51
Report of Independent Registered Public Accounting Firm
To the Board of Directors and Stockholders of Marathon Oil Corporation:
Opinions on the Financial Statements and Internal Control over Financial Reporting
We have audited the accompanying consolidated balance sheets of Marathon Oil Corporation and its subsidiaries (the "Company") as of December 31,
2018
and
2017
, and the related consolidated statements of income, comprehensive income, cash flows and stockholders’ equity for each of the three years in the period ended December 31,
2018
, including the related notes (collectively referred to as the “consolidated financial statements”). We also have audited the Company's internal control over financial reporting as of December 31,
2018
, based on criteria established in
Internal Control - Integrated Framework
(2013) issued by the Committee of Sponsoring Organizations of the Treadway Commission (COSO).
In our opinion, the consolidated financial statements referred to above present fairly, in all material respects, the financial position of the Company as of December 31,
2018
and
2017
, and the results of its operations and its cash flows for each of the three years in the period ended December 31,
2018
in conformity with accounting principles generally accepted in the United States of America. Also in our opinion, the Company maintained, in all material respects, effective internal control over financial reporting as of December 31,
2018
, based on criteria established in
Internal Control - Integrated Framework
(2013) issued by the COSO.
Basis for Opinions
The Company's management is responsible for these consolidated financial statements, for maintaining effective internal control over financial reporting, and for its assessment of the effectiveness of internal control over financial reporting, included in the accompanying Management's Report on Internal Control over Financial Reporting. Our responsibility is to express opinions on the Company’s consolidated financial statements and on the Company's internal control over financial reporting based on our audits. We are a public accounting firm registered with the Public Company Accounting Oversight Board (United States) (PCAOB) and are required to be independent with respect to the Company in accordance with the U.S. federal securities laws and the applicable rules and regulations of the Securities and Exchange Commission and the PCAOB.
We conducted our audits in accordance with the standards of the PCAOB. Those standards require that we plan and perform the audits to obtain reasonable assurance about whether the consolidated financial statements are free of material misstatement, whether due to error or fraud, and whether effective internal control over financial reporting was maintained in all material respects.
Our audits of the consolidated financial statements included performing procedures to assess the risks of material misstatement of the consolidated financial statements, whether due to error or fraud, and performing procedures that respond to those risks. Such procedures included examining, on a test basis, evidence regarding the amounts and disclosures in the consolidated financial statements. Our audits also included evaluating the accounting principles used and significant estimates made by management, as well as evaluating the overall presentation of the consolidated financial statements. Our audit of internal control over financial reporting included obtaining an understanding of internal control over financial reporting, assessing the risk that a material weakness exists, and testing and evaluating the design and operating effectiveness of internal control based on the assessed risk. Our audits also included performing such other procedures as we considered necessary in the circumstances. We believe that our audits provide a reasonable basis for our opinions.
52
Definition and Limitations of Internal Control over Financial Reporting
A company’s internal control over financial reporting is a process designed to provide reasonable assurance regarding the reliability of financial reporting and the preparation of financial statements for external purposes in accordance with generally accepted accounting principles. A company’s internal control over financial reporting includes those policies and procedures that (i) pertain to the maintenance of records that, in reasonable detail, accurately and fairly reflect the transactions and dispositions of the assets of the company; (ii) provide reasonable assurance that transactions are recorded as necessary to permit preparation of financial statements in accordance with generally accepted accounting principles, and that receipts and expenditures of the company are being made only in accordance with authorizations of management and directors of the company; and (iii) provide reasonable assurance regarding prevention or timely detection of unauthorized acquisition, use, or disposition of the company’s assets that could have a material effect on the financial statements.
Because of its inherent limitations, internal control over financial reporting may not prevent or detect misstatements. Also, projections of any evaluation of effectiveness to future periods are subject to the risk that controls may become inadequate because of changes in conditions, or that the degree of compliance with the policies or procedures may deteriorate.
/s/PricewaterhouseCoopers LLP
Houston, Texas
February 21, 2019
We have served as the Company’s auditor since 1982.
53
MARATHON OIL CORPORATION
Consolidated Statements of Income
|
Year Ended December 31,
|
|||||||||||
|
(In millions, except per share data)
|
2018
|
2017
|
2016
|
||||||||
|
Revenues and other income:
|
|||||||||||
|
Revenues from contracts with customers
|
$
|
5,902
|
|
$
|
4,247
|
|
$
|
2,996
|
|
||
|
Net gain (loss) on commodity derivatives
|
(14
|
)
|
(36
|
)
|
(66
|
)
|
|||||
|
Marketing revenues
|
—
|
|
162
|
|
240
|
|
|||||
|
Income from equity method investments
|
225
|
|
256
|
|
175
|
|
|||||
|
Net gain (loss) on disposal of assets
|
319
|
|
58
|
|
389
|
|
|||||
|
Other income
|
150
|
|
78
|
|
53
|
|
|||||
|
Total revenues and other income
|
6,582
|
|
4,765
|
|
3,787
|
|
|||||
|
Costs and expenses:
|
|
||||||||||
|
Production
|
842
|
|
716
|
|
720
|
|
|||||
|
Marketing, including purchases from related parties
|
—
|
|
168
|
|
245
|
|
|||||
|
Shipping, handling and other operating
|
575
|
|
431
|
|
484
|
|
|||||
|
Exploration
|
289
|
|
409
|
|
323
|
|
|||||
|
Depreciation, depletion and amortization
|
2,441
|
|
2,372
|
|
2,156
|
|
|||||
|
Impairments
|
75
|
|
229
|
|
67
|
|
|||||
|
Taxes other than income
|
299
|
|
183
|
|
151
|
|
|||||
|
General and administrative
|
394
|
|
371
|
|
371
|
|
|||||
|
Total costs and expenses
|
4,915
|
|
4,879
|
|
4,517
|
|
|||||
|
Income (loss) from operations
|
1,667
|
|
(114
|
)
|
(730
|
)
|
|||||
|
Net interest and other
|
(226
|
)
|
(270
|
)
|
(332
|
)
|
|||||
|
Other net periodic benefit costs
|
(14
|
)
|
(19
|
)
|
(102
|
)
|
|||||
|
Loss on early extinguishment of debt
|
—
|
|
(51
|
)
|
—
|
|
|||||
|
Income (loss) from continuing operations before income taxes
|
1,427
|
|
(454
|
)
|
(1,164
|
)
|
|||||
|
Provision (benefit) for income taxes
|
331
|
|
376
|
|
923
|
|
|||||
|
Income (loss) from continuing operations
|
1,096
|
|
(830
|
)
|
(2,087
|
)
|
|||||
|
Income (loss) from discontinued operations
|
—
|
|
(4,893
|
)
|
(53
|
)
|
|||||
|
Net income (loss)
|
$
|
1,096
|
|
$
|
(5,723
|
)
|
$
|
(2,140
|
)
|
||
|
Per basic share:
|
|||||||||||
|
Income (loss) from continuing operations
|
$
|
1.30
|
|
$
|
(0.97
|
)
|
$
|
(2.55
|
)
|
||
|
Income (loss) from discontinued operations
|
$
|
—
|
|
$
|
(5.76
|
)
|
$
|
(0.06
|
)
|
||
|
Net income (loss)
|
$
|
1.30
|
|
$
|
(6.73
|
)
|
$
|
(2.61
|
)
|
||
|
Per diluted share:
|
|||||||||||
|
Income (loss) from continuing operations
|
$
|
1.29
|
|
$
|
(0.97
|
)
|
$
|
(2.55
|
)
|
||
|
Income (loss) from discontinued operations
|
$
|
—
|
|
$
|
(5.76
|
)
|
$
|
(0.06
|
)
|
||
|
Net income (loss)
|
$
|
1.29
|
|
$
|
(6.73
|
)
|
$
|
(2.61
|
)
|
||
|
Weighted average common shares outstanding:
|
|||||||||||
|
Basic
|
846
|
|
850
|
|
819
|
|
|||||
|
Diluted
|
847
|
|
850
|
|
819
|
|
|||||
The accompanying notes are an integral part of these consolidated financial statements.
54
MARATHON OIL CORPORATION
Consolidated Statements of Comprehensive Income
|
Year Ended December 31,
|
|||||||||||
|
(In millions)
|
2018
|
2017
|
2016
|
||||||||
|
Net income (loss)
|
$
|
1,096
|
|
$
|
(5,723
|
)
|
$
|
(2,140
|
)
|
||
|
Other comprehensive income (loss)
|
|
||||||||||
|
Postretirement and postemployment plans:
|
|
||||||||||
|
Change in actuarial loss and other
|
117
|
|
21
|
|
16
|
|
|||||
|
Income tax provision (benefit)
|
4
|
|
7
|
|
(4
|
)
|
|||||
|
Postretirement and postemployment plans, net of tax
|
121
|
|
28
|
|
12
|
|
|||||
|
Derivative hedges:
|
|||||||||||
|
Net unrecognized gain (loss)
|
—
|
|
(13
|
)
|
61
|
|
|||||
|
Reclassification of gains on terminated derivative hedges
|
—
|
|
(47
|
)
|
—
|
|
|||||
|
Income tax provision (benefit)
|
—
|
|
21
|
|
(22
|
)
|
|||||
|
Derivative hedges, net of tax
|
—
|
|
(39
|
)
|
39
|
|
|||||
|
Foreign currency hedges:
|
|||||||||||
|
Net recognized loss reclassified to discontinued operations
|
—
|
|
34
|
|
—
|
|
|||||
|
Income tax provision (benefit)
|
—
|
|
(4
|
)
|
—
|
|
|||||
|
Foreign currency hedges, net of tax
|
—
|
|
30
|
|
—
|
|
|||||
|
Other, net of tax
|
4
|
|
2
|
|
1
|
|
|||||
|
Other comprehensive income (loss)
|
125
|
|
21
|
|
52
|
|
|||||
|
Comprehensive income (loss)
|
$
|
1,221
|
|
$
|
(5,702
|
)
|
$
|
(2,088
|
)
|
||
The accompanying notes are an integral part of these consolidated financial statements.
55
MARATHON OIL CORPORATION
Consolidated Balance Sheets
|
December 31,
|
|||||||
|
(In millions, except par values and share amounts)
|
2018
|
2017
|
|||||
|
Assets
|
|||||||
|
Current assets:
|
|||||||
|
Cash and cash equivalents
|
$
|
1,462
|
|
$
|
563
|
|
|
|
Receivables, less reserve of $11 and $12
|
1,079
|
|
1,082
|
|
|||
|
Notes receivable
|
—
|
|
748
|
|
|||
|
Inventories
|
96
|
|
126
|
|
|||
|
Other current assets
|
257
|
|
36
|
|
|||
|
Current assets held for sale
|
27
|
|
11
|
|
|||
|
Total current assets
|
2,921
|
|
2,566
|
|
|||
|
Equity method investments
|
745
|
|
847
|
|
|||
|
Property, plant and equipment, less accumulated depreciation, depletion and amortization of $21,830 and $21,564
|
16,804
|
|
17,665
|
|
|||
|
Goodwill
|
97
|
|
115
|
|
|||
|
Other noncurrent assets
|
723
|
|
764
|
|
|||
|
Noncurrent assets held for sale
|
31
|
|
55
|
|
|||
|
Total assets
|
$
|
21,321
|
|
$
|
22,012
|
|
|
|
Liabilities
|
|||||||
|
Current liabilities:
|
|||||||
|
Accounts payable
|
$
|
1,320
|
|
$
|
1,395
|
|
|
|
Payroll and benefits payable
|
154
|
|
108
|
|
|||
|
Accrued taxes
|
181
|
|
177
|
|
|||
|
Other current liabilities
|
170
|
|
288
|
|
|||
|
Current liabilities held for sale
|
7
|
|
—
|
|
|||
|
Total current liabilities
|
1,832
|
|
1,968
|
|
|||
|
Long-term debt
|
5,499
|
|
5,494
|
|
|||
|
Deferred tax liabilities
|
199
|
|
833
|
|
|||
|
Defined benefit postretirement plan obligations
|
195
|
|
362
|
|
|||
|
Asset retirement obligations
|
1,081
|
|
1,428
|
|
|||
|
Deferred credits and other liabilities
|
279
|
|
217
|
|
|||
|
Noncurrent liabilities held for sale
|
108
|
|
2
|
|
|||
|
Total liabilities
|
9,193
|
|
10,304
|
|
|||
|
Commitments and contingencies
|
|
|
|
||||
|
Stockholders’ Equity
|
|||||||
|
Preferred stock - no shares issued or outstanding (no par value, 26 million shares authorized)
|
—
|
|
—
|
|
|||
|
Common stock:
|
|
|
|||||
|
Issued – 937 million shares and 937 million shares (par value $1 per share, 1.925 billion shares authorized at December 31, 2018 and 1.1 billion shares authorized at December 31, 2017)
|
937
|
|
937
|
|
|||
|
Held in treasury, at cost – 118 million shares and 87 million shares
|
(3,816
|
)
|
(3,325
|
)
|
|||
|
Additional paid-in capital
|
7,238
|
|
7,379
|
|
|||
|
Retained earnings
|
7,706
|
|
6,779
|
|
|||
|
Accumulated other comprehensive income (loss)
|
63
|
|
(62
|
)
|
|||
|
Total stockholders' equity
|
12,128
|
|
11,708
|
|
|||
|
Total liabilities and stockholders' equity
|
$
|
21,321
|
|
$
|
22,012
|
|
|
The accompanying notes are an integral part of these consolidated financial statements.
56
MARATHON OIL CORPORATION
Consolidated Statements of Cash Flows
|
Year Ended December 31,
|
|||||||||||
|
(In millions)
|
2018
|
2017
|
2016
|
||||||||
|
Increase (decrease) in cash and cash equivalents
|
|
|
|||||||||
|
Operating activities:
|
|
|
|
||||||||
|
Net income (loss)
|
$
|
1,096
|
|
$
|
(5,723
|
)
|
$
|
(2,140
|
)
|
||
|
Adjustments to reconcile net income (loss) to net cash provided by operating activities:
|
|
|
|||||||||
|
Discontinued operations
|
—
|
|
4,893
|
|
53
|
|
|||||
|
Depreciation, depletion and amortization
|
2,441
|
|
2,372
|
|
2,156
|
|
|||||
|
Impairments
|
75
|
|
229
|
|
67
|
|
|||||
|
Exploratory dry well costs and unproved property impairments
|
255
|
|
323
|
|
220
|
|
|||||
|
Net (gain) loss on disposal of assets
|
(319
|
)
|
(58
|
)
|
(389
|
)
|
|||||
|
Deferred income taxes
|
52
|
|
(61
|
)
|
828
|
|
|||||
|
Net (gain) loss on derivative instruments
|
14
|
|
36
|
|
66
|
|
|||||
|
Net settlements of derivative instruments
|
(281
|
)
|
45
|
|
44
|
|
|||||
|
Pension and other post retirement benefits, net
|
(65
|
)
|
(46
|
)
|
(3
|
)
|
|||||
|
Stock-based compensation
|
53
|
|
49
|
|
51
|
|
|||||
|
Equity method investments, net
|
45
|
|
20
|
|
17
|
|
|||||
|
Changes in:
|
|||||||||||
|
Current receivables
|
(133
|
)
|
(334
|
)
|
67
|
|
|||||
|
Inventories
|
(1
|
)
|
10
|
|
64
|
|
|||||
|
Current accounts payable and accrued liabilities
|
179
|
|
297
|
|
(137
|
)
|
|||||
|
Other current assets and liabilities
|
(22
|
)
|
1
|
|
33
|
|
|||||
|
All other operating, net
|
(155
|
)
|
(65
|
)
|
(96
|
)
|
|||||
|
Net cash provided by operating activities from continuing operations
|
3,234
|
|
1,988
|
|
901
|
|
|||||
|
Investing activities:
|
|||||||||||
|
Additions to property, plant and equipment
|
(2,753
|
)
|
(1,974
|
)
|
(1,204
|
)
|
|||||
|
Additions to other assets
|
(26
|
)
|
(25
|
)
|
—
|
|
|||||
|
Acquisitions, net of cash acquired
|
(25
|
)
|
(1,891
|
)
|
(902
|
)
|
|||||
|
Disposal of assets, net of cash transferred to the buyer
|
1,264
|
|
1,787
|
|
1,219
|
|
|||||
|
Equity method investments - return of capital
|
57
|
|
64
|
|
55
|
|
|||||
|
All other investing, net
|
13
|
|
(5
|
)
|
(1
|
)
|
|||||
|
Net cash used in investing activities from continuing operations
|
(1,470
|
)
|
(2,044
|
)
|
(833
|
)
|
|||||
|
Financing activities:
|
|||||||||||
|
Borrowings
|
—
|
|
988
|
|
—
|
|
|||||
|
Debt repayments
|
—
|
|
(2,764
|
)
|
(1
|
)
|
|||||
|
Debt extinguishment costs
|
—
|
|
(46
|
)
|
—
|
|
|||||
|
Common stock issuance
|
—
|
|
—
|
|
1,236
|
|
|||||
|
Purchases of common stock
|
(713
|
)
|
(11
|
)
|
(6
|
)
|
|||||
|
Dividends paid
|
(169
|
)
|
(170
|
)
|
(162
|
)
|
|||||
|
All other financing, net
|
23
|
|
—
|
|
1
|
|
|||||
|
Net cash provided by (used in) financing activities
|
(859
|
)
|
(2,003
|
)
|
1,068
|
|
|||||
|
Net increase in cash and cash equivalents of discontinued operations (Note 5)
|
—
|
|
130
|
|
238
|
|
|||||
|
Effect of exchange rate on cash and cash equivalents
|
(2
|
)
|
4
|
|
(3
|
)
|
|||||
|
Cash held for sale
|
(4
|
)
|
—
|
|
(2
|
)
|
|||||
|
Net increase (decrease) in cash and cash equivalents
|
899
|
|
(1,925
|
)
|
1,369
|
|
|||||
|
Cash and cash equivalents at beginning of period
|
563
|
|
2,488
|
|
1,119
|
|
|||||
|
Cash and cash equivalents at end of period
|
$
|
1,462
|
|
$
|
563
|
|
$
|
2,488
|
|
||
The accompanying notes are an integral part of these consolidated financial statements.
57
MARATHON OIL CORPORATION
Consolidated Statements of Stockholders’ Equity
|
|
Total Equity of Marathon Oil Stockholders
|
|
|||||||||||||||||||||||||
|
(In millions)
|
Preferred
Stock
|
Common
Stock
|
Treasury
Stock
|
Additional
Paid-in
Capital
|
Retained
Earnings
|
Accumulated
Other
Comprehensive
Income (Loss)
|
Total
Equity
|
||||||||||||||||||||
|
December 31, 2015 Balance
|
$
|
—
|
|
$
|
770
|
|
$
|
(3,554
|
)
|
$
|
6,498
|
|
$
|
14,974
|
|
$
|
(135
|
)
|
$
|
18,553
|
|
||||||
|
Shares issued - stock-based
compensation
|
—
|
|
—
|
|
128
|
|
(86
|
)
|
—
|
|
—
|
|
42
|
|
|||||||||||||
|
Shares repurchased
|
—
|
|
—
|
|
(5
|
)
|
—
|
|
—
|
|
—
|
|
(5
|
)
|
|||||||||||||
|
Stock-based compensation
|
—
|
|
—
|
|
—
|
|
(35
|
)
|
—
|
|
—
|
|
(35
|
)
|
|||||||||||||
|
Net loss
|
—
|
|
—
|
|
—
|
|
—
|
|
(2,140
|
)
|
—
|
|
(2,140
|
)
|
|||||||||||||
|
Other comprehensive income
|
—
|
|
—
|
|
—
|
|
—
|
|
—
|
|
52
|
|
52
|
|
|||||||||||||
|
Dividends paid ($0.20 per share)
|
—
|
|
—
|
|
—
|
|
—
|
|
(162
|
)
|
—
|
|
(162
|
)
|
|||||||||||||
|
Common stock issuance
|
—
|
|
167
|
|
—
|
|
1,069
|
|
—
|
|
—
|
|
1,236
|
|
|||||||||||||
|
December 31, 2016 Balance
|
$
|
—
|
|
$
|
937
|
|
$
|
(3,431
|
)
|
$
|
7,446
|
|
$
|
12,672
|
|
$
|
(83
|
)
|
$
|
17,541
|
|
||||||
|
Shares issued - stock-based
compensation
|
—
|
|
—
|
|
117
|
|
(50
|
)
|
—
|
|
—
|
|
67
|
|
|||||||||||||
|
Shares repurchased
|
—
|
|
—
|
|
(11
|
)
|
—
|
|
—
|
|
—
|
|
(11
|
)
|
|||||||||||||
|
Stock-based compensation
|
—
|
|
—
|
|
—
|
|
(17
|
)
|
—
|
|
—
|
|
(17
|
)
|
|||||||||||||
|
Net loss
|
—
|
|
—
|
|
—
|
|
—
|
|
(5,723
|
)
|
—
|
|
(5,723
|
)
|
|||||||||||||
|
Other comprehensive income
|
—
|
|
—
|
|
—
|
|
—
|
|
—
|
|
21
|
|
21
|
|
|||||||||||||
|
Dividends paid ($0.20 per share)
|
—
|
|
—
|
|
—
|
|
—
|
|
(170
|
)
|
—
|
|
(170
|
)
|
|||||||||||||
|
Common stock issuance
|
—
|
|
—
|
|
—
|
|
—
|
|
—
|
|
—
|
|
—
|
|
|||||||||||||
|
December 31, 2017 Balance
|
$
|
—
|
|
$
|
937
|
|
$
|
(3,325
|
)
|
$
|
7,379
|
|
$
|
6,779
|
|
$
|
(62
|
)
|
$
|
11,708
|
|
||||||
|
Shares issued - stock-based
compensation
|
—
|
|
—
|
|
221
|
|
(109
|
)
|
—
|
|
—
|
|
112
|
|
|||||||||||||
|
Shares repurchased
|
—
|
|
—
|
|
(712
|
)
|
—
|
|
—
|
|
—
|
|
(712
|
)
|
|||||||||||||
|
Stock-based compensation
|
—
|
|
—
|
|
—
|
|
(32
|
)
|
—
|
|
—
|
|
(32
|
)
|
|||||||||||||
|
Net income
|
—
|
|
—
|
|
—
|
|
—
|
|
1,096
|
|
—
|
|
1,096
|
|
|||||||||||||
|
Other comprehensive income
|
—
|
|
—
|
|
—
|
|
—
|
|
—
|
|
125
|
|
125
|
|
|||||||||||||
|
Dividends paid ($0.20 per share)
|
—
|
|
—
|
|
—
|
|
—
|
|
(169
|
)
|
—
|
|
(169
|
)
|
|||||||||||||
|
December 31, 2018 Balance
|
$
|
—
|
|
$
|
937
|
|
$
|
(3,816
|
)
|
$
|
7,238
|
|
$
|
7,706
|
|
$
|
63
|
|
$
|
12,128
|
|
||||||
|
(Shares in millions)
|
Preferred
Stock
|
Common
Stock
|
Treasury
Stock
|
|
|
|
|
||||||||||||||||||||
|
December 31, 2015 Balance
|
—
|
|
770
|
|
93
|
|
|||||||||||||||||||||
|
Shares issued - stock-based
compensation
|
—
|
|
—
|
|
(3
|
)
|
|||||||||||||||||||||
|
Common stock issuance
|
—
|
|
167
|
|
—
|
|
|||||||||||||||||||||
|
December 31, 2016 Balance
|
—
|
|
937
|
|
90
|
|
|||||||||||||||||||||
|
Shares issued - stock-based
compensation
|
—
|
|
—
|
|
(3
|
)
|
|||||||||||||||||||||
|
December 31, 2017 Balance
|
—
|
|
937
|
|
87
|
|
|||||||||||||||||||||
|
Shares issued - stock-based
compensation
|
—
|
|
—
|
|
(6
|
)
|
|||||||||||||||||||||
|
Shares repurchased
|
—
|
|
—
|
|
37
|
|
|||||||||||||||||||||
|
December 31, 2018 Balance
|
—
|
|
937
|
|
118
|
|
|
|
|
|
|||||||||||||||||
The accompanying notes are an integral part of these consolidated financial statements.
58
MARATHON OIL CORPORATION
Notes to Consolidated Financial Statements
1
. Summary of Principal Accounting Policies
We are an independent exploration and production company engaged in exploration, production and marketing of crude oil and condensate, NGLs and natural gas; as well as production and marketing of products manufactured from natural gas, such as LNG and methanol, in E.G.
Basis of presentation and principles applied in consolidation
– These consolidated financial statements, including notes have been prepared in accordance with U.S. GAAP. These consolidated financial statements include the accounts of our controlled subsidiaries. Investments in unincorporated joint ventures and undivided interests in certain operating assets are consolidated on a pro rata basis.
During the year, we renamed our United States E&P and International E&P segments to the United States and International segments. The characteristics and composition of these segments remained unchanged and there was no effect on previously reported segment information. See
Note 7
for further information on our reportable segments.
Equity method investments
– Investments in entities over which we have significant influence, but not control, are accounted for using the equity method of accounting. This includes entities in which we hold majority ownership but the minority stockholders have substantive participating rights in the investee. Income from equity method investments represents our proportionate share of net income generated by the equity method investees and is reflected in revenue and other income in our consolidated statements of income. Equity method investments are included as noncurrent assets on the consolidated balance sheet.
Equity method investments are assessed for impairment whenever changes in the facts and circumstances indicate a loss in value may have occurred. When a loss is deemed to have occurred and is other than temporary, the carrying value of the equity method investment is written down to fair value, and the amount of the write-down is included in income. Differences in the basis of the investments and the separate net asset value of the investees, if any, are amortized into income over the remaining useful lives of the underlying assets, except for the excess related to goodwill.
Reclassifications
– In the first quarter of 2018 we adopted the new Accounting Standards Codification ("ASC") Topic 606, Revenue from Contracts with Customers using the modified retrospective method. To conform the historical presentation to our current presentation, we reclassified gains/losses arising from our commodity derivatives out of the revenues from contracts with customers line into a separate line, net gain (loss) on commodity derivatives, on the consolidated statements of income. Additionally, in the first quarter of 2018 we adopted the new pension accounting standards update on a retrospective basis, and reclassified the required cost elements from general and administrative expense into production expense, exploration expense, and other net periodic benefit costs. See
Note 2
for further discussion of the adoption of these accounting standards.
Additionally, we have reclassified certain prior year amounts between operating cash flow categories to present it on a basis comparable with the current year's presentation with no impact on net cash provided by operating activities.
Discontinued operations
– As a result of the sale of our Canadian business in 2017, we reflected this business as discontinued operations in all historical periods presented. Disclosures in this report related to results of operations and cash flows are presented on the basis of continuing operations unless otherwise stated. Assets and liabilities are presented as held for sale in the historical periods in the consolidated balance sheets. See
Note 5
for discussion of the divestiture in further detail.
Use of estimates
– The preparation of financial statements in accordance with U.S. GAAP requires management to make estimates and assumptions that affect the reported amounts of assets and liabilities and the disclosure of contingent assets and liabilities as of the date of the consolidated financial statements and the reported amounts of revenues and expenses during the respective reporting periods.
Estimated quantities of crude oil and condensate, NGLs and natural gas reserves is a significant estimate that requires judgment. All of the reserve data included in this Form 10-K are estimates. Reservoir engineering is a subjective process of estimating underground accumulations of crude oil and condensate, NGLs and natural gas. There are numerous uncertainties inherent in estimating quantities of proved crude oil and condensate, NGLs and natural gas reserves. The accuracy of any reserves estimate is a function of the quality of available data and of engineering and geological interpretation and judgment. As a result, reserve estimates may be different from the quantities of crude oil and condensate, NGLs and natural gas that are ultimately recovered. See Supplementary Data -
Supplementary Information on Oil and Gas Producing Activities
for further detail.
Other items subject to estimates and assumptions include the carrying amounts of property, plant and equipment, asset retirement obligations, goodwill, valuation of derivative instruments and valuation allowances for deferred income tax assets, among others. Although we believe these estimates are reasonable, actual results could differ from these estimates.
59
MARATHON OIL CORPORATION
Notes to Consolidated Financial Statements
Foreign currency transactions
– The U.S. dollar is the functional currency of our foreign operating subsidiaries. Foreign currency transaction gains and losses are included in net income.
Revenue recognition
– We recognize revenue at an amount that reflects the consideration to which we believe we are entitled in exchange for transferring goods and/or services to a customer. In the lower 48 states of the U.S., production volumes of crude oil and condensate, NGLs and natural gas are generally sold immediately and transported to market. In international locations, liquid hydrocarbon production volumes may be stored as inventory and sold at a later time.
See
Note 6
for further discussion of the revenue recognition accounting policies.
Cash and cash equivalents
– Cash and cash equivalents include cash on hand and on deposit and investments in highly liquid debt instruments with original maturities of three months or less.
Accounts receivable
– The majority of our receivables are from joint interest owners in properties we operate or from purchasers of commodities, both of which are recorded at invoiced amounts and do not bear interest. We often have the ability to withhold future revenue disbursements to recover any non-payment of joint interest billings. We conduct credit reviews of commodity purchasers prior to making commodity sales to new customers or increasing credit for existing customers. Based on these reviews, we may require a standby letter of credit or a financial guarantee. We routinely assess the collectability of receivable balances to determine if the amount of the reserve in allowance for doubtful accounts is sufficient.
Notes receivable
– At closing of the sale of our Canadian business in 2017 we received two notes receivable for a combined
$750 million
, we received these proceeds in the first quarter of 2018. Both notes receivable were initially recorded at fair value and were reported at amortized cost. These notes receivable were evaluated for collectability on an individual basis each reporting period, based on the financial condition of the debtor. See
Note 5
for additional discussion.
Inventories
– Crude oil and natural gas are recorded at weighted average cost and carried at the lower of cost or net realizable value. Supplies and other items consist principally of tubular goods and equipment which are valued at weighted average cost and reviewed periodically for obsol
escence or impairment when market conditions indicate
.
We may enter into a contract to sell a particular quantity and quality of crude oil at a specified location and date to a particular counterparty, and simultaneously agree to buy a particular quantity and quality of the same commodity at a specified location on the same or another specified date from the same counterparty. We account for such matching buy/sell arrangements as exchanges of inventory.
Derivative instruments
– We may use derivatives to manage a portion of our exposure to commodity price risk, commodity locational risk, foreign currency risk and interest rate risk. All derivative instruments are recorded at fair value. Commodity derivatives and interest rate swaps are reflected on our consolidated balance sheet on a net basis by counterparty, as they are governed by master netting agreements. Cash flows related to derivatives used to manage commodity price risk, foreign currency risk and interest rate risk are classified in operating activities. Our derivative instruments contain no significant contingent credit features.
Fair value hedges
– We may use interest rate swaps to manage our exposure to interest rate risk associated with fixed interest rate debt in our portfolio. Changes in the fair values of both the hedged item and the related derivative are recognized immediately in net income with an offsetting effect included in the basis of the hedged item. The net effect is to report in net income the extent to which the hedge is not effective in achieving offsetting changes in fair value.
Cash flow hedges
– We may use interest rate derivative instruments to manage the risk of interest rate changes during the period prior to anticipated borrowings and designate them as cash flow hedges. Derivative instruments designated as cash flow hedges are linked to specific assets and liabilities or to specific firm commitments or forecasted transactions. The effective portion of changes in the fair value of a qualifying cash flow hedge are recorded in other comprehensive income until the hedged item is reclassified to net income when the underlying forecasted transaction is recognized in net income. Ineffective portions of a cash flow hedge’s change in fair value are recognized currently within net interest and other on the consolidated statements of income. However, if it is determined that the likelihood of the original forecasted transaction occurring is no longer probable, the entire accumulated gain or loss recognized in other comprehensive income is immediately reclassified into net income.
Derivatives not designated as hedges
– Derivatives that are not designated as hedges may include commodity derivatives used primarily to manage price and locational risks on the forecasted sale of crude oil and natural gas that we produce. Changes in the fair value of derivatives not designated as hedges are recognized immediately in net income.
Concentrations of credit risk
– All of our financial instruments, including derivatives, involve elements of credit and market risk. The most significant portion of our credit risk relates to nonperformance by counterparties. The counterparties to our financial instruments consist primarily of major financial institutions and companies within the energy industry. To manage
60
MARATHON OIL CORPORATION
Notes to Consolidated Financial Statements
counterparty risk associated with financial instruments, we select and monitor counterparties based on our assessment of their financial strength and on credit ratings, if available. Additionally, we limit the level of exposure with any single counterparty.
Fair value transfer
– We recognize transfers between levels of the fair value hierarchy as of the end of the reporting period. If significant transfers occur, they would be disclosed in
Note 15
to the consolidated financial statements.
Property, plant and equipment
– We use the successful efforts method of accounting for oil and gas producing activities.
Property acquisition costs
– Costs to acquire mineral interests in oil and natural gas properties, to drill exploratory wells in progress and those that find proved reserves, and to drill development wells are capitalized. Costs to drill exploratory wells that do not find proved reserves, geological and geophysical costs and costs of carrying and retaining unproved properties are expensed. Costs incurred for exploratory wells that find reserves but cannot yet be classified as proved are capitalized if (1) the well has found a sufficient quantity of reserves to justify its completion as a producing well and (2) we are making sufficient progress assessing the reserves and the economic and operating viability of the project. The status of suspended exploratory well costs is monitored continuously and reviewed at least quarterly.
Depreciation, depletion and amortization
– Capitalized costs to acquire oil and natural gas properties are depreciated and depleted on a units-of-production basis based on estimated proved reserves. Capitalized costs of exploratory wells and development costs are depreciated and depleted on a units-of-production basis based on estimated proved developed reserves. Support equipment and other property, plant and equipment related to oil and gas producing activities, as well as property, plant and equipment unrelated to oil and gas producing activities, are recorded at cost and depreciated on a straight-line basis over the estimated useful lives of the assets as summarized below.
|
Type of Asset
|
Range of Useful Lives
|
|
|
Office furniture, equipment and computer hardware
|
4 to 15 years
|
|
|
Pipelines
|
10 to 40 years
|
|
|
Plants, facilities and infrastructure
|
3 to 40 years
|
|
Impairments
– We evaluate our oil and gas producing properties, including capitalized costs of exploratory wells and development costs, for impairment of value whenever events or changes in circumstances indicate that the carrying amount of an asset may not be recoverable. If the sum of the expected undiscounted future cash flows from the use of the asset and its eventual disposition is less than the carrying amount of the asset, an impairment loss is recognized based on the fair value of the asset. Oil and gas producing properties are reviewed for impairment on a field-by-field basis or, in certain instances, by logical grouping of assets if there is significant shared infrastructure or contractual terms that cause economic interdependency amongst separate, discrete fields. Oil and gas producing properties deemed to be impaired are written down to their fair value, as determined by discounted future net cash flows or, if available, comparable market value. We evaluate our unproved property investment and record impairment based on time or geologic factors. Information such as drilling results, reservoir performance, seismic interpretation or future plans to develop acreage is also considered. When unproved property investments are deemed to be impaired, this amount is reported in exploration expenses in our consolidated statements of income.
Dispositions
– When property, plant and equipment depreciated on an individual basis is sold or otherwise disposed of, any gains or losses are reflected in net gain (loss) on disposal of assets in our consolidated statements of income. Gains on the disposal of property, plant and equipment are recognized when earned, which is generally at the time of closing. If a loss on disposal is expected, such losses are recognized either when the assets are classified as held for sale, or are measured using a probability weighted income approach based on both the anticipated sales price and a held-for-use model depending on timing of the sale. Proceeds from the disposal of property, plant and equipment depreciated on a group basis are credited to accumulated depreciation, depletion and amortization with no immediate effect on net income until net book value is reduced to zero.
Goodwill
– Goodwill represents the excess of the purchase price over the estimated fair value of the net assets acquired in the acquisition of a business. Such goodwill is not amortized, but rather is tested for impairment annually and when events or changes in circumstances indicate that the fair value of a reporting unit with goodwill has been reduced below carrying value. The impairment test requires allocating goodwill and other assets and liabilities to a reporting unit. The fair value of a reporting unit is determined and compared to the book value of the reporting unit. If the fair value of the reporting unit is less than the book value, including goodwill, then the recorded goodwill is impaired to its implied fair value with a charge to impairments.
Major maintenance activities
– Costs for planned major maintenance are expensed in the period incurred and can include the costs of contractor repair services, materials and supplies, equipment rentals and our labor costs.
61
MARATHON OIL CORPORATION
Notes to Consolidated Financial Statements
Environmental costs
– We provide for remediation costs and penalties when the responsibility to remediate is probable and the amount of associated costs can be reasonably estimated. The timing of remediation accruals coincides with completion of a feasibility study or the commitment to a formal plan of action. Remediation liabilities are accrued based on estimates of known environmental exposure and are discounted when the estimated amounts are reasonably fixed or reliably determinable. Environmental expenditures are capitalized only if the costs mitigate or prevent future contamination or if the costs improve the environmental safety or efficiency of the existing assets.
Asset retirement obligations
– The fair value of asset retirement obligations is recognized in the period in which the obligations are incurred if a reasonable estimate of fair value can be made. Our asset retirement obligations primarily relate to the abandonment of oil and gas producing facilities. Asset retirement obligations for such facilities include costs to dismantle and relocate or dispose of production platforms, gathering systems, wells and related structures and restoration costs of land and seabed, including those leased. Estimates of these costs are developed for each property based on the type of production facilities and equipment, depth of water, reservoir characteristics, depth of the reservoir, market demand for equipment, currently available procedures and consultations with construction and engineering professionals.
Inflation rates and credit-adjusted-risk-free interest rates are used to estimate the fair value of asset retirement obligations. Depreciation of capitalized asset retirement costs and accretion of asset retirement obligations are recorded over time. Depreciation is generally determined on a units-of-production basis based on estimated proved developed reserves for oil and gas production facilities, while accretion of the liability occurs over the useful lives of the assets.
Deferred income taxes
– Deferred tax assets and liabilities, measured at enacted tax rates, are recognized for the estimated future tax consequences attributable to differences between the financial statement carrying amounts of assets and liabilities and their tax bases as reported in our filings with the respective taxing authorities. We routinely assess the realizability of our deferred tax assets based on several interrelated factors and reduce such assets by a valuation allowance if it is more likely than not that some portion or all of the deferred tax assets will not be realized. These factors include whether we are in a cumulative loss position in recent years, our reversal of temporary differences, and our expectation to generate sufficient future taxable income. We use the liability method in determining our provision and liabilities for our income taxes, under which current and deferred tax liabilities and assets are recorded in accordance with enacted tax laws and rates.
Stock-based compensation arrangements
– The fair value of stock options is estimated on the date of grant using the Black-Scholes option pricing model. The model employs various assumptions, based on management’s best estimates at the time of grant, which impact the calculation of fair value and ultimately, the amount of expense that is recognized over the life of the stock option award. Of the required assumptions, the expected volatility of our stock price and the stock price in relation to the strike price have the most significant impact on the fair value calculation. We have utilized historical data and analyzed current information which reasonably support these assumptions.
The fair value of our restricted stock awards and common stock units is determined based on the market value of our common stock on the date of grant. Unearned stock-based compensation is charged to stockholders’ equity when restricted stock awards are granted.
The fair value of our stock-based performance units is estimated using the Monte Carlo simulation method. Since these awards are settled in cash at the end of a defined performance period, they are classified as a liability and are re-measured quarterly until settlement.
Our stock-based compensation expense is recognized based on management’s best estimate of the awards that are expected to vest, using the straight-line attribution method for all service-based awards with a graded vesting feature. If actual forfeiture results are different than expected, adjustments to recognized compensation expense may be required in future periods.
2
. Accounting Standards
Not Yet Adopted
Lease accounting standard
In February 2016, the FASB issued a new lease accounting standard, which requires lessees to recognize most leases, including operating leases, on the balance sheet as a right of use asset and lease liability. Short-term leases can continue being accounted for off balance sheet based on a policy election. This standard does not apply to leases to explore for or use minerals, oil, natural gas and similar non-regenerative resources, including the intangible right to explore for those natural resources and rights to use the land in which those natural resources are contained. This standard is effective for us in the first quarter of 2019 and shall be applied using a modified retrospective approach at the beginning of the earliest period presented in the financial statements. Early adoption is permitted.
62
MARATHON OIL CORPORATION
Notes to Consolidated Financial Statements
In July 2018, the FASB issued a new transition option that allows entities to adopt the new lease accounting standard using the modified retrospective transition method by recognizing a cumulative-effect adjustment to the opening balance of retained earnings in the period of adoption rather than in the earliest period presented. We elected this new transition option and continue to apply the legacy guidance in ASC 840, Leases, including its disclosure requirements, in the comparative periods presented in the year of adoption.
We will adopt the new standard in the first quarter of 2019 and will recognize a right of use asset and lease liability on the adoption date. We will apply practical expedients provided in the standard that allow, among others, not to reassess contracts that commenced or expired prior to the effective date. We also elected a policy not to recognize right of use assets and lease liabilities related to short-term leases.
To facilitate the adoption of this standard, we completed the installation and configuration of a software system in January 2019. While we continue to evaluate our contracts and associated data for compliance with the new standard, we believe the adoption of this standard as of January 1, 2019 will result in the recognition of a right of use asset and related lease liability, on our consolidated balance sheet, between
$160 million
to
$210 million
.
Hedge accounting standard
In August 2017, the FASB issued a new accounting standards update that amends the hedge accounting model to enable entities to hedge certain financial and nonfinancial risk attributes previously not allowed. The amendment also reduces the overall complexity of documenting, assessing and measuring hedge effectiveness. This standard is effective for us in the first quarter of 2019. The amendment mandates modified retrospective adoption when accounting for hedge relationships in effect as of the adoption date. None of our derivative instruments are currently designated as hedges; as a result we do not expect the adoption of this standard to have a significant impact on our consolidated results of operations, financial position or cash flows.
Goodwill standard
In January 2017, the FASB issued a new accounting standards update that eliminates the requirement to calculate the implied fair value of the goodwill (Step 2 of goodwill impairment test under the current guidance) to measure a goodwill impairment charge. We anticipate the standard to require entities to record an impairment charge based on the excess of a reporting unit’s carrying amount over its fair value (measure the charge based on Step 1 under the current guidance). This standard is effective for us in the first quarter of 2020 and shall be applied on a prospective basis. Early adoption is permitted for interim or annual goodwill impairment tests performed on testing dates after January 1, 2017. We plan to adopt the standard on a prospective basis, and do not expect a material impact on our consolidated results of operations, financial position or cash flows for prior periods.
Financial instruments - credit losses
In June 2016, the FASB issued a new accounting standards update that changes the impairment model for trade receivables, net investments in leases, debt securities, loans and certain other instruments. The standard requires the use of a forward-looking “expected loss” model as opposed to the current “incurred loss” model. This standard is effective for us in the first quarter of 2020 and will be adopted on a modified retrospective basis through a cumulative-effect adjustment to retained earnings as of the beginning of the adoption period. Early adoption is permitted starting January 2019. We are evaluating the provisions of this accounting standards update and assessing the impact, if any, it may have on our consolidated results of operations, financial position or cash flows.
Recently Adopted
Revenue recognition standard
On January 1, 2018, we adopted the new ASC Topic 606, Revenue from Contracts with Customers and all the related amendments ("new revenue standard") using the modified retrospective method. We evaluated the effect of transition by applying the provisions of the new revenue standard to contracts with remaining obligations as of January 1, 2018. No cumulative adjustment to retained earnings was necessary as a result of adopting this standard.
Results for reporting periods beginning after January 1, 2018 are presented under the new revenue standard, while prior period amounts are not adjusted and continue to be reported in accordance with our historic accounting policies. The primary change relates to the presentation of marketing revenues and marketing expenses from the historical gross presentation to the current net presentation, included within revenues from contracts with customers, for a portion of our international contracts.
63
MARATHON OIL CORPORATION
Notes to Consolidated Financial Statements
We concluded that the adoption of the new revenue standard did not result in any significant changes to our consolidated balance sheet or statement of cash flows. The following tables summarize the impacts of adopting the new revenue standard on our consolidated income statement for the year ended
December 31, 2018
.
|
Year Ended December 31, 2018
|
|||||||||
|
(In millions)
|
As reported
|
Adjustments
|
Presentation without adoption of ASC Topic 606
|
||||||
|
Revenues and other income:
|
|
|
|
||||||
|
Revenues from contracts with customers
|
$
|
5,902
|
|
$
|
(12
|
)
|
$
|
5,890
|
|
|
Marketing revenues
|
—
|
|
159
|
|
159
|
|
|||
|
Other income
|
150
|
|
(5
|
)
|
145
|
|
|||
|
Costs and expenses:
|
|||||||||
|
Marketing, including purchases from related parties
|
$
|
—
|
|
$
|
158
|
|
$
|
158
|
|
|
Shipping, handling and other operating
|
575
|
|
(16
|
)
|
559
|
|
|||
Pension accounting standard
In the first quarter of 2018, we adopted the new accounting standards update that changes how employers that sponsor defined pension and/or other postretirement benefit plans present the net periodic benefit cost in the income statement. As a result, employers are required to present the service cost component of net periodic benefit cost in the same income statement line item(s) as other employee compensation costs arising from services rendered during the period. We adopted this standard on a retrospective basis, and reclassified the required cost elements from general and administrative expense into production expense, exploration expense, and other net periodic benefit costs. The adoption of this standard did not have a significant impact on our consolidated balance sheet or statement of cash flows. The following tables summarize the impacts of adopting this standard on our historical consolidated income statement for the years ended
December 31, 2017
and
2016
.
|
Year Ended December 31, 2017
|
|||||||||
|
(In millions)
|
Previously Reported
|
As reclassified
|
Effect of Change Higher/(Lower)
|
||||||
|
Production
|
$
|
706
|
|
$
|
716
|
|
$
|
10
|
|
|
Exploration
|
409
|
|
409
|
|
—
|
|
|||
|
General and administrative
|
400
|
|
371
|
|
(29
|
)
|
|||
|
Income (loss) from operations
|
(133
|
)
|
(114
|
)
|
19
|
|
|||
|
Other net periodic benefit costs
(a)
|
—
|
|
(19
|
)
|
(19
|
)
|
|||
|
Year Ended December 31, 2016
|
|||||||||
|
(In millions)
|
Previously Reported
|
As reclassified
|
Effect of Change Higher/(Lower)
|
||||||
|
Production
|
$
|
712
|
|
$
|
720
|
|
$
|
8
|
|
|
Exploration
|
323
|
|
323
|
|
—
|
|
|||
|
General and administrative
|
481
|
|
371
|
|
(110
|
)
|
|||
|
Income (loss) from operations
|
(832
|
)
|
(730
|
)
|
102
|
|
|||
|
Other net periodic benefit costs
(a)
|
—
|
|
(102
|
)
|
(102
|
)
|
|||
(a)
Includes net settlement loss and other net periodic benefit costs, excluding service costs (See
Note 18
).
64
MARATHON OIL CORPORATION
Notes to Consolidated Financial Statements
Classification in the statement of cash flows
In August 2016, the FASB issued a new accounting standards update which seeks to reduce the existing diversity in practice in how certain transactions are classified in the statement of cash flows. This standard was effective for us in the first quarter of 2018, and was applied retrospectively. Adoption of this standard did not have a significant impact on our consolidated statements of cash flows.
Presentation of restricted cash in the statement of cash flows
In November 2016, the FASB issued a new accounting standards update that requires entities to show the changes in the total of cash, cash equivalents and restricted cash in the statement of cash flows. As a result, we no longer present transfers between cash and cash equivalents and restricted cash in the statement of cash flows. When cash, cash equivalents, and restricted cash are presented in more than one line item on the balance sheet, the standard requires a reconciliation of the totals in the statement of cash flows to the related captions in the balance sheet. This reconciliation can be presented either on the face of the statement of cash flows or in the notes to the financial statements. This standard was effective for us in the first quarter of 2018, and was applied retrospectively. Adoption of this standard did not have a significant impact on our consolidated statements of cash flows.
Accounting for sale or transfer of nonfinancial assets
In February 2017, the FASB issued a new accounting standards update that clarifies the accounting for the sale or transfer of nonfinancial assets and in substance nonfinancial assets to noncustomers, including partial sales. The standard also clarifies that the derecognition of all businesses (except those related to conveyances of oil and gas mineral rights or contracts with customers) should be accounted for in accordance with the derecognition and deconsolidation guidance in Subtopic 810-10. This standard was effective for us in the first quarter of 2018, and was applied using the modified retrospective approach. Adoption of this standard did not have a significant impact on our consolidated results of operations, financial position or cash flows.
Definition of a business
In January 2017, the FASB issued a new accounting standards update that changes the definition of a business to assist entities with evaluating when a set of transferred assets and activities constitutes a business. The guidance requires us to evaluate if substantially all of the fair value of the gross assets acquired is concentrated in a single identifiable asset or a group of similar identifiable assets; if so, the set of transferred assets and activities would not represent a business. The guidance also requires a business to include at least one substantive process and narrows the definition of outputs by more closely aligning it with how outputs are described in the new revenue guidance. This standard was effective for us in the first quarter of 2018, and was applied prospectively. Adoption of this standard did not have a significant impact on our consolidated results of operations, financial position or cash flows.
Financial instruments updates
In January 2016, the FASB issued an accounting standards update that addresses certain aspects of recognition, measurement, presentation, and disclosure of financial instruments. We adopted this standard in the first quarter of 2018. Adoption of this standard did not have a significant impact on our consolidated results of operations, financial position or cash flows.
65
MARATHON OIL CORPORATION
Notes to Consolidated Financial Statements
3
. Income (Loss) and Dividends per Common Share
Basic income (loss) per share is based on the weighted average number of common shares outstanding. Diluted income per share assumes exercise of stock options in all periods, provided the effect is not antidilutive. The per share calculations below exclude
6 million
,
11 million
and
13 million
stock options in
2018
,
2017
and
2016
that were antidilutive.
|
Year Ended December 31,
|
|||||||||||
|
(In millions, except per share data)
|
2018
|
2017
|
2016
|
||||||||
|
Income (loss) from continuing operations
|
$
|
1,096
|
|
$
|
(830
|
)
|
$
|
(2,087
|
)
|
||
|
Income (loss) from discontinued operations
|
—
|
|
(4,893
|
)
|
(53
|
)
|
|||||
|
Net income (loss)
|
$
|
1,096
|
|
$
|
(5,723
|
)
|
$
|
(2,140
|
)
|
||
|
Weighted average common shares outstanding
|
846
|
|
850
|
|
819
|
|
|||||
|
Effect of dilutive securities
|
1
|
|
—
|
|
—
|
|
|||||
|
Weighted average common shares, diluted
|
847
|
|
850
|
|
819
|
|
|||||
|
Per basic share:
|
|
|
|
|
|||||||
|
Income (loss) from continuing operations
|
$
|
1.30
|
|
$
|
(0.97
|
)
|
$
|
(2.55
|
)
|
||
|
Income (loss) from discontinued operations
|
$
|
—
|
|
$
|
(5.76
|
)
|
$
|
(0.06
|
)
|
||
|
Net income (loss)
|
$
|
1.30
|
|
$
|
(6.73
|
)
|
$
|
(2.61
|
)
|
||
|
Per diluted share:
|
|||||||||||
|
Income (loss) from continuing operations
|
$
|
1.29
|
|
$
|
(0.97
|
)
|
$
|
(2.55
|
)
|
||
|
Income (loss) from discontinued operations
|
$
|
—
|
|
$
|
(5.76
|
)
|
$
|
(0.06
|
)
|
||
|
Net income (loss)
|
$
|
1.29
|
|
$
|
(6.73
|
)
|
$
|
(2.61
|
)
|
||
|
Dividends per share
|
$
|
0.20
|
|
$
|
0.20
|
|
$
|
0.20
|
|
||
4
. Acquisitions
2017 -
United States
Segment
In the fourth quarter of 2017, we closed on our acquisition of additional acreage in the Northern Delaware basin of New Mexico from a private seller for
$63 million
in cash, subject to post-closing adjustments. We accounted for this transaction as an asset acquisition, allocating the purchase price to unproved property within property, plant and equipment.
In the second quarter of 2017, we closed on two acquisitions which included approximately
91,000
net acres in the Permian basin of New Mexico. The first acquisition with BC Operating, Inc. and other entities closed for approximately
$1.1 billion
in cash and the second acquisition with Black Mountain Oil & Gas and other private sellers closed for approximately
$700 million
in cash. These acquisitions were paid with cash on hand and accounted for as asset acquisitions, with substantially all of the purchase price allocated to unproved property within property, plant and equipment.
2016 -
United States
Segment
On August 1, 2016, we closed on our acquisition of PayRock Energy Holdings, LLC (“PayRock”), a portfolio company of EnCap Investments, including approximately
61,000
net surface acres in the oil window of the Anadarko Basin STACK play in Oklahoma. The purchase price of
$904 million
, subject to closing adjustments, was paid with cash on hand. We accounted for this transaction as an asset acquisition, with a majority of the purchase price allocated to unproved property within property, plant and equipment.
66
MARATHON OIL CORPORATION
Notes to Consolidated Financial Statements
5
. Dispositions
United States Segment
In the third quarter of 2018, we closed on the sale of non-core, non-operated conventional properties, primarily in the Gulf of Mexico, for combined net proceeds of
$16 million
, before closing adjustments. A pre-tax gain of
$32 million
was recognized in the third quarter of 2018.
In the third quarter of 2017, we closed on the sale of certain conventional assets in Oklahoma for proceeds of
$25 million
, subject to closing adjustments, and recognized a pre-tax gain of
$21 million
.
In the third quarter of 2016, we entered into an agreement to sell certain non-operated CO2 and waterflood assets in West Texas and New Mexico. This sale closed during the fourth quarter for proceeds of
$235 million
, and a pre-tax gain of
$63 million
. During the third quarter 2016, we sold certain non-operated assets primarily in West Texas and New Mexico to multiple purchasers for combined proceeds of approximately
$67 million
, and recognized a total pre-tax gain of
$55 million
.
During the second quarter of 2016, we received proceeds of approximately
$690 million
related to sale of our Wyoming upstream and midstream assets and recorded a pre-tax gain of
$266 million
; with the remaining Wyoming asset sales closing in fourth quarter of 2016 for proceeds of
$155 million
, excluding closing adjustments and a pre-tax gain of
$38 million
.
In March and April 2016, we entered into separate agreements to sell our
10%
working interest in the outside-operated Shenandoah discovery in the Gulf of Mexico, operated natural gas assets in the Piceance basin in Colorado and certain undeveloped acreage in West Texas for a combined total of approximately
$80 million
in proceeds. We closed on certain of the asset sales and recognized a net pre-tax loss on sale of
$48 million
in 2016, the remaining asset closed in 2017 with a net pre-tax gain on sale of
$32 million
.
International Segment
In the fourth quarter of 2018, we entered into an agreement to sell our subsidiary, Marathon Oil KDV B.V., which holds our
15%
non-operated interest in the Atrush block in Kurdistan for proceeds of
$63 million
, before closing adjustments. This property is classified as held for sale in the consolidated balance sheet at
December 31, 2018
, with total assets of
$58 million
, total liabilities of $
17 million
. We expect the transaction to close in the first half of 2019.
In the first quarter of
2018
, we closed on the sale of our subsidiary, Marathon Oil Libya Limited, which held our
16.33%
non-operated interest in the Waha concessions in Libya, to a subsidiary of Total S.A. (Elf Aquitaine SAS) for proceeds of approximately
$450 million
, excluding closing adjustments, and recognized a pre-tax gain of
$255 million
.
In the third quarter of
2017
, we entered into separate agreements to sell certain non-core properties for combined proceeds of
$53 million
, before closing adjustments. We closed on one of the asset sales in the fourth quarter of 2017 and recognized no pre-tax gain or loss on sale. We closed on the remaining asset sale during the third quarter of 2018 for a pre-tax loss of
$18 million
.
Canadian Business - Discontinued Operations
On May 31, 2017 we closed on the sale of our Canadian business, which included our
20%
non-operated interest in the AOSP to Shell and Canadian Natural Resources Limited for
$2.5 billion
, excluding closing adjustments. Under the terms of the agreement,
$1.8 billion
was paid to us upon closing. At closing we received
two
notes receivable for a combined
$750 million
for the remaining proceeds, which was received in the first quarter of 2018. In the first quarter of 2017, we recorded a non-cash impairment charge of
$6.6 billion
(after-tax of
$4.96 billion
) primarily related to the property, plant and equipment of our Canadian business. This impairment was recorded for excess net book value over anticipated sales proceeds less costs to sell. Fair values of assets held for sale were determined based upon the anticipated sales proceeds less costs to sell, which resulted in a level 2 classification. As the effective date of the transaction was January 1, 2017, we recorded a loss on sale of
$43 million
during the second quarter of 2017 due to results of operations from our Canadian business that were transferred to the buyer upon closing.
67
MARATHON OIL CORPORATION
Notes to Consolidated Financial Statements
Our Canadian business is reflected as discontinued operations in the consolidated statements of income and the consolidated statements of cash flows for all periods presented. The following table contains select amounts reported in our historical consolidated statements of income and consolidated statements of cash flows as discontinued operations:
|
Year Ended December 31,
|
||||||||||||
|
(In millions)
|
2018
|
2017
|
2016
|
|||||||||
|
Total revenue and other income
|
$
|
—
|
|
$
|
431
|
|
$
|
863
|
|
|||
|
Net gain (loss) on disposal of assets
|
—
|
|
(43
|
)
|
—
|
|
||||||
|
Total revenues and other income
|
—
|
|
388
|
|
863
|
|
||||||
|
Costs and expenses:
|
||||||||||||
|
Production
|
—
|
|
254
|
|
601
|
|
||||||
|
Exploration
|
—
|
|
—
|
|
7
|
|
||||||
|
Depreciation, depletion and amortization
|
—
|
|
40
|
|
239
|
|
||||||
|
Impairments
|
—
|
|
6,636
|
|
—
|
|
||||||
|
Other
|
—
|
|
25
|
|
87
|
|
||||||
|
Total costs and expenses
|
—
|
|
6,955
|
|
934
|
|
||||||
|
Pretax income (loss) from discontinued operations
|
—
|
|
(6,567
|
)
|
(71
|
)
|
||||||
|
Provision (benefit) for income taxes
|
—
|
|
(1,674
|
)
|
(18
|
)
|
||||||
|
Income (loss) from discontinued operations
|
$
|
—
|
|
$
|
(4,893
|
)
|
$
|
(53
|
)
|
|||
|
Year Ended December 31,
|
||||||||||||
|
(In millions)
|
2018
|
2017
|
2016
|
|||||||||
|
Cash flow from discontinued operations:
|
||||||||||||
|
Operating activities
|
$
|
—
|
|
$
|
141
|
|
$
|
177
|
|
|||
|
Investing activities
|
—
|
|
(13
|
)
|
(41
|
)
|
||||||
|
Changes in cash included in current assets held for sale
|
—
|
|
2
|
|
100
|
|
||||||
|
Net increase in cash and cash equivalents of discontinued operations
|
$
|
—
|
|
$
|
130
|
|
$
|
236
|
|
|||
6
. Revenues
The majority of our revenues are derived from the sale of crude oil and condensate, NGLs and natural gas under spot and term agreements with our customers in the U.S. and various international locations.
The following tables present our revenues from contracts with customers disaggregated by product type and geographic areas.
|
Year Ended December 31, 2018
|
||||||||||||||||||
|
United States
|
Northern
|
|||||||||||||||||
|
(In millions)
|
Eagle Ford
|
Bakken
|
Oklahoma
|
Delaware
|
Other U.S.
|
Total
|
||||||||||||
|
Crude oil and condensate
|
$
|
1,554
|
|
$
|
1,568
|
|
$
|
426
|
|
$
|
235
|
|
$
|
164
|
|
$
|
3,947
|
|
|
Natural gas liquids
|
205
|
|
62
|
|
181
|
|
38
|
|
9
|
|
495
|
|
||||||
|
Natural gas
|
145
|
|
38
|
|
184
|
|
20
|
|
26
|
|
413
|
|
||||||
|
Other
|
8
|
|
—
|
|
—
|
|
—
|
|
23
|
|
31
|
|
||||||
|
Revenues from contracts with customers
|
$
|
1,912
|
|
$
|
1,668
|
|
$
|
791
|
|
$
|
293
|
|
$
|
222
|
|
$
|
4,886
|
|
68
MARATHON OIL CORPORATION
Notes to Consolidated Financial Statements
|
Year Ended December 31, 2018
|
|||||||||||||||
|
International
|
Other
|
||||||||||||||
|
(In millions)
|
E.G.
|
U.K.
|
Libya
|
International
|
Total
|
||||||||||
|
Crude oil and condensate
|
$
|
342
|
|
$
|
282
|
|
$
|
187
|
|
$
|
77
|
|
$
|
888
|
|
|
Natural gas liquids
|
4
|
|
5
|
|
—
|
|
—
|
|
9
|
|
|||||
|
Natural gas
|
37
|
|
40
|
|
9
|
|
—
|
|
86
|
|
|||||
|
Other
|
1
|
|
32
|
|
—
|
|
—
|
|
33
|
|
|||||
|
Revenues from contracts with customers
|
$
|
384
|
|
$
|
359
|
|
$
|
196
|
|
$
|
77
|
|
$
|
1,016
|
|
The pricing in our hydrocarbon sales agreements are variable, determined using various published benchmarks which are adjusted for negotiated quality and location differentials. As a result, revenue collected under our agreements with customers is highly dependent on the market conditions and may fluctuate considerably as the hydrocarbon market prices rise or fall. Typically, our customers pay us monthly, within a short period of time after we deliver the hydrocarbon products. As such, we do not have any financing element associated with our contracts. We do not have any issues related to returns or refunds, as product specifications are standardized for the industry and are typically measured when transferred to a common carrier or midstream entity, and other contractual mechanisms (e.g., price adjustments) are used when products do not meet those specifications.
In limited cases, we may also collect advance payments from customers as stipulated in our agreements; payments in excess of recognized revenue are recorded as contract liabilities on our consolidated balance sheet.
Under our hydrocarbon sales agreements, the entire consideration amount is variable either due to pricing and/or volumes. We recognize revenue in the amount of variable consideration allocated to distinct units of hydrocarbons transferred to a customer. Such allocation reflects the amount of total consideration we expect to collect for completed deliveries of hydrocarbons and the terms of variable payment relate specifically to our efforts to satisfy the performance obligations under these contracts. Our performance obligations under our hydrocarbon sales agreements are to deliver either the entire production from the dedicated wells or specified contractual volumes of hydrocarbons.
We often serve as the operator for jointly owned oil and gas properties. As part of this role, we perform activities to explore, develop and produce oil and gas properties in accordance with the joint operating arrangement and collective decisions of the joint parties. Other working interest owners reimburse us for costs incurred based on our agreements. We determined that these activities are not performed as part of customer relationships, in accordance with the new revenue standard, and such reimbursements will continue to not be recorded as revenues within the scope of the new revenue standard.
In addition, we commonly market the share of production belonging to other working interest owners as the operator of jointly owned oil and gas properties. We concluded that those marketing activities are carried out as part of the collaborative arrangement, and we do not purchase or otherwise obtain control of other working interest owners’ share of production. Therefore, we act as a principal only in regards to the sale of our share of production and recognize revenue for the volumes associated with our net production.
Crude oil and condensate
For the crude sales agreements, we satisfy our performance obligations and recognize revenue once customers take control of the crude at the designated delivery points, which include pipelines, trucks or vessels.
Natural gas and NGLs
When selling natural gas and NGLs, we engage midstream entities to process our production stream by separating natural gas from the NGLs. Frequently, these midstream entities also purchase our natural gas and NGLs under the same agreements. In these situations, we determined the performance obligation is complete and satisfied at the tailgate of the processing plant when the natural gas and NGLs become identifiable and measurable products. We determined the plant tailgate is the point in time where control, as defined in the new revenue standard, is transferred to midstream entities and they are entitled to significant risks and rewards of ownership of the natural gas and NGLs.
The amounts due to midstream entities for gathering and processing services are recognized as shipping and handling cost, since we make those payments in exchange for distinct services. Under some of our natural gas processing agreements, we have an option to take the processed natural gas and NGLs in-kind and sell to customers other than the processing company. In those circumstances, our performance obligations are complete after delivering the processed hydrocarbons to the customer at the designated delivery points, which may be the tailgate of the processing plant or an alternative delivery point requested by the customer.
69
MARATHON OIL CORPORATION
Notes to Consolidated Financial Statements
We have “percentage-of-proceeds” arrangements with some midstream entities where they retain a percentage of the proceeds collected for selling our processed natural gas and NGLs as compensation for their processing and marketing services. We recognize revenue for the gross sales volumes and recognize the proceeds retained by midstream companies as shipping and handling cost.
Contract receivables and liabilities
The following table provides information about receivables and contract assets (liabilities) from contracts with customers.
|
(In millions)
|
December 31, 2018
|
January 1, 2018
|
||||
|
Receivables from contracts with customers, which are included in receivables, less reserves
|
$
|
714
|
|
$
|
811
|
|
|
Contract asset (liability)
|
$
|
(1
|
)
|
$
|
—
|
|
The contract liability primarily relates to the advance consideration received from customers for crude oil sales and processing services in the U.K. A contract asset would represent crude oil delivered in the U.K. to a customer for which payment will be collected over time as it becomes due under the pricing terms stipulated in the sales agreement. As a practical expedient, when the balance of this U.K. customer is a contract asset, we do not adjust revenue for the effects of a significant financing element as the period between when crude oil is delivered to the customer and when payment is expected to be received is one year or less at contract inception.
Significant changes in the contract asset (liability) balance during the period are as follows.
|
(In millions)
|
Year Ended December 31, 2018
|
||
|
Contract asset balance as of January 1, 2018
|
$
|
—
|
|
|
Revenue recognized as performance obligations are satisfied
|
109
|
|
|
|
Amounts invoiced to customers
|
(110
|
)
|
|
|
Contract asset (liability) balance as of December 31, 2018
|
$
|
(1
|
)
|
7
. Segment Information
We have
two
reportable operating segments. Each of our two reportable operating segments are organized by geographic location and managed according to the nature of the products and services offered.
|
•
|
United States ("U.S.") – explores for, produces and markets crude oil and condensate, NGLs and natural gas in the United States
|
|
•
|
International ("Int'l") – explores for, produces and markets crude oil and condensate, NGLs and natural gas outside of the United States and produces and markets products manufactured from natural gas, such as LNG and methanol, in E.G.
|
Information regarding assets by segment is not presented because it is not reviewed by the chief operating decision maker (“CODM”). Segment income (loss) represents income (loss) which excludes certain items not allocated to our operating segments, net of income taxes. A portion of our corporate and operations general and administrative support costs are not allocated to the operating segments. These unallocated costs primarily consist of employment costs (including pension effects), professional services, facilities and other costs associated with corporate and operations support activities. Additionally, items which affect comparability such as: gains or losses on dispositions, proved property impairments, certain exploration expenses relating to a strategic decision to exit conventional exploration, change in tax expense associated with a tax rate change, changes in our valuation allowance, unrealized gains or losses on commodity derivative instruments, pension settlement losses or other items (as determined by the CODM) are not allocated to operating segments.
As discussed in
Note 5
, we closed on the sale of our Canadian business, which includes our Oil Sands Mining segment and exploration stage in-situ leases, in the second quarter of 2017. The Canadian business is reflected as discontinued operations and is excluded from segment information in all historical periods presented.
During the year, we renamed our United States E&P and International E&P segments to the United States and International segments. See
Note 1
for further information.
70
MARATHON OIL CORPORATION
Notes to Consolidated Financial Statements
|
Year Ended December 31, 2018
|
|||||||||||||||
|
Not Allocated
|
|||||||||||||||
|
(In millions)
|
U.S.
|
Int'l
|
to Segments
|
Total
|
|||||||||||
|
Revenues from contracts with customers
|
$
|
4,886
|
|
$
|
1,016
|
|
$
|
—
|
|
$
|
5,902
|
|
|||
|
Net gain (loss) on commodity derivatives
|
(281
|
)
|
—
|
|
267
|
|
(b)
|
(14
|
)
|
||||||
|
Income from equity method investments
|
—
|
|
225
|
|
—
|
|
225
|
|
|||||||
|
Net gain (loss) on disposal of assets
|
—
|
|
—
|
|
319
|
|
(c)
|
319
|
|
||||||
|
Other income
|
16
|
|
12
|
|
122
|
|
(d)
|
150
|
|
||||||
|
Less costs and expenses:
|
|||||||||||||||
|
Production
|
625
|
|
215
|
|
2
|
|
842
|
|
|||||||
|
Shipping, handling and other operating
|
499
|
|
70
|
|
6
|
|
575
|
|
|||||||
|
Exploration
|
246
|
|
3
|
|
40
|
|
(e)
|
289
|
|
||||||
|
Depreciation, depletion and amortization
|
2,217
|
|
197
|
|
27
|
|
2,441
|
|
|||||||
|
Impairments
|
—
|
|
—
|
|
75
|
|
(f)
|
75
|
|
||||||
|
Taxes other than income
|
301
|
|
—
|
|
(2
|
)
|
299
|
|
|||||||
|
General and administrative
|
146
|
|
32
|
|
216
|
|
394
|
|
|||||||
|
Net interest and other
|
—
|
|
—
|
|
226
|
|
226
|
|
|||||||
|
Other net periodic benefit costs
|
—
|
|
(9
|
)
|
23
|
|
(g)
|
14
|
|
||||||
|
Income tax provision (benefit)
|
(21
|
)
|
272
|
|
80
|
|
331
|
|
|||||||
|
Segment income (loss) / Income (loss) from continuing operations
|
$
|
608
|
|
$
|
473
|
|
$
|
15
|
|
$
|
1,096
|
|
|||
|
Capital expenditures
(a)
|
$
|
2,620
|
|
$
|
39
|
|
$
|
26
|
|
$
|
2,685
|
|
|||
|
(a)
|
Includes accruals.
|
|
(b)
|
Unrealized gain on commodity derivative instruments (see
Note 14
).
|
|
(c)
|
Primarily related to the gain on sale of our Libya subsidiary (see
Note 5
).
|
(d)
Primarily a reduction of asset retirement obligations in our International segment (see
Note 12
).
|
(e)
|
Primarily related to dry well expense and unproved property impairment associated with the Rodo well in Alba Block Sub Area B, offshore E.G. (see
Note 10
).
|
|
(f)
|
Due to the anticipated sales of certain non-core proved properties in our International and United States segments (see
Note 11
).
|
|
(g)
|
Includes pension settlement loss of
$21 million
(see
Note 18
).
|
71
MARATHON OIL CORPORATION
Notes to Consolidated Financial Statements
|
Year Ended December 31, 2017
|
|||||||||||||||
|
Not Allocated
|
|||||||||||||||
|
(In millions)
|
U.S.
|
Int'l
|
to Segments
|
Total
|
|||||||||||
|
Revenues from contracts with customers
|
$
|
3,093
|
|
$
|
1,154
|
|
$
|
—
|
|
$
|
4,247
|
|
|||
|
Net gain (loss) on commodity derivatives
|
45
|
|
—
|
|
(81
|
)
|
(b)
|
(36
|
)
|
||||||
|
Marketing revenues
|
29
|
|
133
|
|
—
|
|
162
|
|
|||||||
|
Income from equity method investments
|
—
|
|
256
|
|
—
|
|
256
|
|
|||||||
|
Net gain on disposal of assets
|
1
|
|
—
|
|
57
|
|
(c)
|
58
|
|
||||||
|
Other income
|
12
|
|
6
|
|
60
|
|
78
|
|
|||||||
|
Less costs and expenses:
|
|||||||||||||||
|
Production
|
476
|
|
239
|
|
1
|
|
716
|
|
|||||||
|
Marketing
|
36
|
|
132
|
|
—
|
|
168
|
|
|||||||
|
Shipping, handling, and other operating
|
354
|
|
77
|
|
—
|
|
431
|
|
|||||||
|
Exploration
|
154
|
|
5
|
|
250
|
|
(d)
|
409
|
|
||||||
|
Depreciation, depletion and amortization
|
2,011
|
|
328
|
|
33
|
|
2,372
|
|
|||||||
|
Impairments
|
4
|
|
—
|
|
225
|
|
(e)
|
229
|
|
||||||
|
Taxes other than income
|
173
|
|
—
|
|
10
|
|
183
|
|
|||||||
|
General and administrative
|
119
|
|
30
|
|
222
|
|
371
|
|
|||||||
|
Net interest and other
|
—
|
|
—
|
|
270
|
|
(f)
|
270
|
|
||||||
|
Other net periodic benefit costs
|
—
|
|
(8
|
)
|
27
|
|
(g)
|
19
|
|
||||||
|
Loss on early extinguishment of debt
|
—
|
|
—
|
|
51
|
|
(h)
|
51
|
|
||||||
|
Income tax provision (benefit)
|
1
|
|
372
|
|
3
|
|
|
376
|
|
||||||
|
Segment income (loss) / Income (loss) from continuing operations
|
$
|
(148
|
)
|
$
|
374
|
|
$
|
(1,056
|
)
|
$
|
(830
|
)
|
|||
|
Capital expenditures
(a)
|
$
|
2,081
|
|
$
|
42
|
|
$
|
27
|
|
$
|
2,150
|
|
|||
|
(a)
|
Includes accruals.
|
|
(b)
|
Unrealized loss on commodity derivative instruments (see
Note 14
).
|
|
(c)
|
Primarily related to the sale of certain conventional assets in Oklahoma and Colorado
(see
Note 5
).
|
(d)
Primarily related to unproved property impairments associated with certain non-core properties within our International segment (see
Note 11
).
|
(e)
|
Primarily related to proved property impairments associated with certain non-core properties within our International segment (see
Note 11
).
|
|
(f)
|
Includes a gain of
$46 million
resulting from the termination of our forward starting interest rate swaps (see
Note 14
).
|
|
(g)
|
Includes pension settlement loss of
$32 million
(see
Note 18
).
|
|
(h)
|
Primarily related to the make-whole call provisions paid upon redemption of our senior unsecured notes (see
Note 16
).
|
72
MARATHON OIL CORPORATION
Notes to Consolidated Financial Statements
|
|
Year Ended December 31, 2016
|
||||||||||||||
|
Not Allocated
|
|||||||||||||||
|
(In millions)
|
U.S.
|
Int'l
|
to Segments
|
Total
|
|||||||||||
|
Revenues from contracts with customers
|
$
|
2,331
|
|
$
|
665
|
|
$
|
—
|
|
$
|
2,996
|
|
|||
|
Net gain (loss) on commodity derivatives
|
44
|
|
—
|
|
(110
|
)
|
(b)
|
(66
|
)
|
||||||
|
Marketing revenues
|
135
|
|
105
|
|
—
|
|
240
|
|
|||||||
|
Income from equity method investments
|
—
|
|
175
|
|
—
|
|
175
|
|
|||||||
|
Net gain (loss) on disposal of assets
|
8
|
|
2
|
|
379
|
|
(c)
|
389
|
|
||||||
|
Other income
|
20
|
|
30
|
|
3
|
|
53
|
|
|||||||
|
Less costs and expenses:
|
|||||||||||||||
|
Production
|
486
|
|
234
|
|
—
|
|
720
|
|
|||||||
|
Marketing costs
|
142
|
|
103
|
|
—
|
|
245
|
|
|||||||
|
Shipping, handling, and other operating
|
328
|
|
43
|
|
113
|
|
(d)
|
484
|
|
||||||
|
Exploration
|
127
|
|
17
|
|
179
|
|
(e)
|
323
|
|
||||||
|
Depreciation, depletion and amortization
|
1,835
|
|
276
|
|
45
|
|
2,156
|
|
|||||||
|
Impairments
|
20
|
|
—
|
|
47
|
|
(f)
|
67
|
|
||||||
|
Taxes other than income
|
149
|
|
—
|
|
2
|
|
151
|
|
|||||||
|
General and administrative
|
94
|
|
30
|
|
247
|
|
371
|
|
|||||||
|
Net interest and other
|
—
|
|
—
|
|
332
|
|
332
|
|
|||||||
|
Other net periodic benefit costs
|
—
|
|
(3
|
)
|
105
|
|
(g)
|
102
|
|
||||||
|
Income tax provision (benefit)
|
(228
|
)
|
49
|
|
1,102
|
|
(h)
|
923
|
|
||||||
|
Segment income (loss) / Income (loss) from continuing operations
|
$
|
(415
|
)
|
$
|
228
|
|
$
|
(1,900
|
)
|
$
|
(2,087
|
)
|
|||
|
Capital expenditures
(a)
|
$
|
936
|
|
$
|
82
|
|
$
|
18
|
|
$
|
1,036
|
|
|||
|
(a)
|
Includes accruals.
|
|
(b)
|
Unrealized loss on commodity derivative instruments (see
Note 14
).
|
|
(c)
|
Primarily related to net gain on disposal of assets (see
Note 5
).
|
|
(d)
|
Includes termination payment on our Gulf of Mexico deepwater drilling rig commitment of
$113 million
.
|
|
(e)
|
Primarily related to impairments associated with the decision to not drill remaining Gulf of Mexico undeveloped leases
(see
Note 11
).
|
(f)
Proved property impairments (see
Note 11
).
|
(g)
|
Includes pension settlement loss of
$103 million
(see
Note 18
).
|
|
(h)
|
Increased valuation allowance on certain of our deferred tax assets of
$1,346 million
.
|
Revenues from external customers (including commodity derivatives) are attributed to geographic areas based upon selling location. The following summarizes revenues from external customers by geographic area.
|
Year Ended December 31,
|
|||||||||||
|
(In millions)
|
2018
|
2017
|
2016
|
||||||||
|
United States
|
$
|
4,872
|
|
$
|
3,086
|
|
$
|
2,400
|
|
||
|
Equatorial Guinea
|
383
|
|
530
|
|
444
|
|
|||||
|
Libya
(a)
|
196
|
|
431
|
|
54
|
|
|||||
|
U.K.
|
360
|
|
289
|
|
263
|
|
|||||
|
Other international
|
77
|
|
37
|
|
9
|
|
|||||
|
Total
|
$
|
5,888
|
|
$
|
4,373
|
|
$
|
3,170
|
|
||
(a)
The decrease in 2018 is due to the sale of our Libya subsidiary in the first quarter of 2018 (see
Note 5
).
In
2018
, sales to Valero Marketing and Supply and Flint Hills Resources and each of their respective affiliates, each accounted for approximately
11%
of our total revenues. In
2017
, sales to Vitol and each of their respective affiliates accounted for approximately
10%
of our total revenues. In
2016
, sales to Valero Marketing and Supply, Tesoro Petroleum, and Flint Hills Resources and each of their respective affiliates accounted for approximately
13%
,
11%
and
10%
of our total revenues.
73
MARATHON OIL CORPORATION
Notes to Consolidated Financial Statements
The following summarizes total revenues from external customers (including commodity derivatives) by product line.
|
Year Ended December 31,
|
|||||||||||
|
(In millions)
|
2018
|
2017
|
2016
|
||||||||
|
Crude oil and condensate
|
$
|
4,823
|
|
$
|
3,477
|
|
$
|
2,605
|
|
||
|
Natural gas liquids
|
504
|
|
338
|
|
198
|
|
|||||
|
Natural gas
|
497
|
|
510
|
|
356
|
|
|||||
|
Other
|
64
|
|
48
|
|
11
|
|
|||||
|
Total
|
$
|
5,888
|
|
$
|
4,373
|
|
$
|
3,170
|
|
||
The following summarizes property, plant and equipment and equity method investments.
|
December 31,
|
|||||||
|
(In millions)
|
2018
|
2017
|
|||||
|
United States
|
$
|
16,094
|
|
$
|
15,955
|
|
|
|
Equatorial Guinea
|
1,333
|
|
1,598
|
|
|||
|
Other international
(a)
|
122
|
|
959
|
|
|||
|
Total long-lived assets
|
$
|
17,549
|
|
$
|
18,512
|
|
|
(a)
The decrease in 2018 is due to the sale of our Libya subsidiary in the first quarter of 2018 (see
Note 5
).
8
. Income Taxes
Income (loss) from continuing operations before income taxes were:
|
Year Ended December 31,
|
||||||||||||
|
(In millions)
|
2018
|
2017
|
2016
|
|||||||||
|
United States
|
$
|
642
|
|
$
|
(783
|
)
|
$
|
(1,449
|
)
|
|||
|
Foreign
|
785
|
|
329
|
|
285
|
|
||||||
|
Total
|
$
|
1,427
|
|
$
|
(454
|
)
|
$
|
(1,164
|
)
|
|||
Income tax provisions (benefits) for continuing operations were:
|
Year Ended December 31,
|
|||||||||||||||||||||||||||||||||||
|
2018
|
2017
|
2016
|
|||||||||||||||||||||||||||||||||
|
(In millions)
|
Current
|
Deferred
|
Total
|
Current
|
Deferred
|
Total
|
Current
|
Deferred
|
Total
|
||||||||||||||||||||||||||
|
Federal
|
$
|
6
|
|
$
|
—
|
|
$
|
6
|
|
$
|
(32
|
)
|
$
|
41
|
|
$
|
9
|
|
$
|
2
|
|
$
|
836
|
|
$
|
838
|
|
||||||||
|
State and local
|
(1
|
)
|
(23
|
)
|
(24
|
)
|
(14
|
)
|
2
|
|
(12
|
)
|
2
|
|
8
|
|
10
|
|
|||||||||||||||||
|
Foreign
|
274
|
|
75
|
|
349
|
|
483
|
|
(104
|
)
|
379
|
|
91
|
|
(16
|
)
|
75
|
|
|||||||||||||||||
|
Total
|
$
|
279
|
|
$
|
52
|
|
$
|
331
|
|
$
|
437
|
|
$
|
(61
|
)
|
$
|
376
|
|
$
|
95
|
|
$
|
828
|
|
$
|
923
|
|
||||||||
74
MARATHON OIL CORPORATION
Notes to Consolidated Financial Statements
A reconciliation of the federal statutory income tax rate applied to income (loss) from continuing operations before income taxes to the provision (benefit) for income taxes follows:
|
Year Ended December 31,
|
||||||||||||
|
(In millions)
|
2018
|
2017
|
2016
|
|||||||||
|
Total pre-tax income (loss) from continuing operations
|
$
|
1,427
|
|
$
|
(454
|
)
|
$
|
(1,164
|
)
|
|||
|
Total income tax expense (benefit)
|
$
|
331
|
|
$
|
376
|
|
$
|
923
|
|
|||
|
Effective income tax rate on continuing operations
|
23
|
%
|
83
|
%
|
79
|
%
|
||||||
|
Income taxes at the statutory tax rate
(a)(b)
|
$
|
300
|
|
$
|
(159
|
)
|
$
|
(407
|
)
|
|||
|
Effects of foreign operations
|
214
|
|
140
|
|
47
|
|
||||||
|
Adjustments to valuation allowances
|
(177
|
)
|
446
|
|
1,270
|
|
||||||
|
State income taxes
|
(17
|
)
|
(19
|
)
|
9
|
|
||||||
|
Tax law change
|
—
|
|
(35
|
)
|
6
|
|
||||||
|
Other federal tax effects
|
11
|
|
3
|
|
(2
|
)
|
||||||
|
Income tax expense (benefit) on continuing operations
|
$
|
331
|
|
$
|
376
|
|
$
|
923
|
|
|||
(a)
Includes income tax benefits primarily related to our U.S. federal income taxes where we have maintained a full valuation allowance since December 2016.
(b)
As a result of the Tax Reform Legislation (see below), the U.S. corporate income tax rate was reduced to 21% in 2018. The U.S. corporate income tax rate was 35% in 2017 and 2016.
The effective income tax rate is influenced by a variety of factors including the geographic and functional sources of income and the relative magnitude of these sources of income. The difference between the total provision and the sum of the amounts allocated to segments is reported in the "Not Allocated to Segments" column of the tables in
Note 7
.
Effects of foreign operations
– The effects of foreign operations increased our tax expense in 2018, 2017 and 2016 due to the mix of pre-tax income between high and low tax jurisdictions, including Libya where the tax rate is
93.5%
. Excluding Libya, the effective tax rates on continuing operations would be an expense of
14%
in
2018
, an expense of
5%
in
2017
, and an expense of
79%
in
2016
. As a result of the sale of our Libya subsidiary in the first quarter of 2018, we do not expect to incur further tax expense related to Libya.
Adjustments to valuation allowances
– Since December 31, 2016, we have maintained a full valuation allowance on our net federal deferred tax assets. In 2018, we reduced our valuation allowance by
$177 million
primarily related to current year activity in the U.S.
Change in tax law
– On December 22, 2017, the U.S. enacted the Tax Cuts and Jobs Act (the “Tax Reform Legislation”). Tax Reform Legislation, which is also commonly referred to as “U.S. tax reform”, significantly changing U.S. corporate income tax laws by, among other things, reducing the U.S. corporate income tax rate to 21% starting in 2018, and repeal of the corporate alternative minimum tax (“AMT”), and a one-time deemed repatriation of accumulated foreign earnings. In the fourth quarter of 2017, we remeasured our deferred taxes at 21%, in accordance with U.S. GAAP. The impact of the remeasurement on our federal deferred tax assets and liabilities was equally offset by an adjustment to our valuation allowance with no material impact to current year earnings. In accordance with Staff Accounting Bulletin No. 118 ("SAB 118") we finalized our tax position in the fourth quarter of 2018 with no material changes made to positions considered provisional as of December 31, 2017.
75
MARATHON OIL CORPORATION
Notes to Consolidated Financial Statements
Deferred tax assets and liabilities resulted from the following:
|
|
Year Ended December 31,
|
||||||
|
(In millions)
|
2018
|
2017
|
|||||
|
Deferred tax assets:
|
|||||||
|
Employee benefits
|
$
|
102
|
|
$
|
111
|
|
|
|
Operating loss carryforwards
|
1,304
|
|
1,030
|
|
|||
|
Capital loss carryforwards
|
2
|
|
3
|
|
|||
|
Foreign tax credits
|
611
|
|
611
|
|
|||
|
Other credit carryforwards
|
—
|
|
—
|
|
|||
|
Investments in subsidiaries and affiliates
|
—
|
|
174
|
|
|||
|
Other
|
5
|
|
69
|
|
|||
|
Subtotal
|
2,024
|
|
1,998
|
|
|||
|
Valuation allowance
|
(749
|
)
|
(926
|
)
|
|||
|
Total deferred tax assets
|
1,275
|
|
1,072
|
|
|||
|
Deferred tax liabilities:
|
|||||||
|
Property, plant and equipment
|
1,018
|
|
1,332
|
|
|||
|
Accrued revenue
|
60
|
|
81
|
|
|||
|
Other
|
3
|
|
3
|
|
|||
|
Total deferred tax liabilities
|
1,081
|
|
1,416
|
|
|||
|
Net deferred tax liabilities
|
$
|
—
|
|
$
|
344
|
|
|
|
Net deferred tax assets
|
$
|
194
|
|
$
|
—
|
|
|
Operating loss carryforwards
– At
December 31, 2018
, our operating loss carryforwards, relating to tax years beginning prior to January 1, 2018, before valuation allowance, include
$655 million
from the U.S. that expire in 2035-2037. Our operating loss carryforwards in the U.S. for tax years beginning after December 31, 2017, before our valuation allowance, include
$472 million
which can be carried forward indefinitely. Foreign operating loss carryforwards include
$26 million
that begin to expire in 2019. State operating loss carryforwards of
$151 million
expire in 2019 through 2038.
Valuation allowances
– At
December 31, 2018
, we reflect a valuation allowance in our consolidated balance sheet of
$749 million
against our net deferred tax assets in various jurisdictions in which we operate.
Property, plant and equipment
– At
December 31, 2018
, we reflected a deferred tax liability of
$1,018 million
. The reduction primarily relates to the sale of our Libya subsidiary in the first quarter of 2018.
Net deferred tax assets and liabilities were classified in the consolidated balance sheets as follows:
|
December 31,
|
|||||||
|
(In millions)
|
2018
|
2017
|
|||||
|
Assets:
|
|
|
|||||
|
Other noncurrent assets
|
$
|
393
|
|
$
|
489
|
|
|
|
Liabilities:
|
|
|
|||||
|
Noncurrent deferred tax liabilities
|
199
|
|
833
|
|
|||
|
Net deferred tax liabilities
|
$
|
—
|
|
$
|
344
|
|
|
|
Net deferred tax assets
|
$
|
194
|
|
$
|
—
|
|
|
We are continuously undergoing examination of our U.S. federal income tax returns by the IRS. Such audits have been completed through the 2014 tax year, with the exception of 2010-2011. Based on the status of the proposed settlement in the 2010-2011 IRS Federal Tax Audit ("IRS Audit"), as of December 31, 2018 we have established a receivable of
$146 million
with
$73 million
classified in other current assets on the consolidated balance sheet based on the AMT refunds we expect to receive in the next 12 months, and a receivable classified in other noncurrent assets of
$73 million
on the consolidated balance sheet related to future AMT refunds. As of December 31, 2018, we do not consider the IRS Audit to be effectively settled, however we believe the IRS Audit will be settled within the next 12 months. As a result, we have established an uncertain tax position for the same amount resulting in no impact to the consolidated statement of income for the year ended December 31, 2018. See
Note 25
for further detail. Further, we are routinely involved in U.S. state income tax audits and foreign jurisdiction tax audits. We believe all other audits will be resolved within the amounts paid and/or provided for these liabilities.
76
MARATHON OIL CORPORATION
Notes to Consolidated Financial Statements
As of
December 31, 2018
, our income tax returns remain subject to examination in the following major tax jurisdictions for the tax years indicated:
|
United States
(a)
|
2008-2017
|
|
Equatorial Guinea
|
2007-2017
|
|
United Kingdom
|
2008-2017
|
|
(a)
|
Includes federal and state jurisdictions.
|
The following table summarizes the activity in unrecognized tax benefits:
|
(In millions)
|
2018
|
2017
|
2016
|
||||||||
|
Beginning balance
|
$
|
126
|
|
$
|
66
|
|
$
|
65
|
|
||
|
Additions for tax positions of prior years
|
152
|
|
83
|
|
6
|
|
|||||
|
Reductions for tax positions of prior years
|
(15
|
)
|
(3
|
)
|
(5
|
)
|
|||||
|
Settlements
|
—
|
|
(20
|
)
|
—
|
|
|||||
|
Statute of limitations
|
—
|
|
—
|
|
—
|
|
|||||
|
Ending balance
|
$
|
263
|
|
$
|
126
|
|
$
|
66
|
|
||
If the unrecognized tax benefits as of
December 31, 2018
were recognized,
$160 million
would affect our effective income tax rate. As of
December 31, 2018
, there are
$251 million
uncertain tax positions for which it is reasonably possible that the amount could significantly change during the next twelve months. In the first quarter 2019 we withdrew our appeal in the U.K. related to the timing of certain Brae area decommissioning costs. As a result in the first quarter of 2019 we expect our unrecognized tax benefits to reduce by
$68
million with no adverse earnings impact on our consolidated results of operations. See
Note 25
for further detail.
Interest and penalties are recorded as part of the tax provision and were
$2 million
,
$27 million
and
$1 million
related to unrecognized tax benefits in
2018
,
2017
and
2016
. As of
December 31, 2018
and
2017
,
$27 million
and
$25 million
of interest and penalties were accrued related to income taxes.
9
. Inventories
Crude oil and natural gas are recorded at weighted average cost and carried at the lower of cost or net realizable value. Supplies and other items consist principally of tubular goods and equipment which are valued at weighted average cost and reviewed periodically for obsol
escence or impairment when market conditions indicate.
|
December 31,
|
|||||||
|
(In millions)
|
2018
|
2017
|
|||||
|
Crude oil and natural gas
|
$
|
11
|
|
$
|
9
|
|
|
|
Supplies and other items
|
85
|
|
117
|
|
|||
|
Inventories
|
$
|
96
|
|
$
|
126
|
|
|
10
. Property, Plant and Equipment
|
|
December 31,
|
||||||
|
(In millions)
|
2018
|
2017
|
|||||
|
United States
|
$
|
16,011
|
|
$
|
15,867
|
|
|
|
International
(a)
|
710
|
|
1,710
|
|
|||
|
Corporate
|
83
|
|
88
|
|
|||
|
Net property, plant and equipment
|
$
|
16,804
|
|
$
|
17,665
|
|
|
(a)
Decrease in 2018 is primarily the result of the sale of our Libya subsidiary in 2018, see
Note 5
for further detail.
77
MARATHON OIL CORPORATION
Notes to Consolidated Financial Statements
At
December 31, 2018
,
2017
and
2016
we had total deferred exploratory well costs as follows:
|
|
December 31,
|
||||||||||
|
(In millions)
|
2018
|
2017
|
2016
|
||||||||
|
Amounts capitalized less than one year after completion of drilling
|
$
|
297
|
|
$
|
263
|
|
$
|
131
|
|
||
|
Amounts capitalized greater than one year after completion of drilling
|
—
|
|
32
|
|
118
|
|
|||||
|
Total deferred exploratory well costs
|
$
|
297
|
|
$
|
295
|
|
$
|
249
|
|
||
|
Number of projects with costs capitalized greater than one year after
completion of drilling
|
—
|
|
1
|
|
3
|
|
|||||
|
(In millions)
|
2018
|
2017
|
2016
|
||||||||
|
Beginning balance
|
$
|
295
|
|
$
|
249
|
|
$
|
437
|
|
||
|
Additions
|
262
|
|
212
|
|
299
|
|
|||||
|
Charges to expense
(a)
|
(35
|
)
|
(64
|
)
|
(23
|
)
|
|||||
|
Transfers to development
|
(197
|
)
|
(102
|
)
|
(388
|
)
|
|||||
|
Dispositions
(b)
|
(28
|
)
|
—
|
|
(76
|
)
|
|||||
|
Ending balance
|
$
|
297
|
|
$
|
295
|
|
$
|
249
|
|
||
|
(a)
|
2018 includes
$32 million
related to the Rodo well in Alba Block Sub Area B, offshore E.G. 2017 includes
$64 million
as a result of our agreement to sell Diaba License G4-223 in the Republic of Gabon (see
Note 11
for further detail).
|
|
(b)
|
Includes the sale of our Libya subsidiary in 2018 and GOM assets in 2016.
|
We had
no
exploratory well costs capitalized greater than one year as of
December 31, 2018
and
$32 million
as of
December 31, 2017
. During the fourth quarter 2018, we concluded our evaluation of drilling opportunities on the Rodo well in Alba Block Sub Area B, offshore E.G. and determined that we would not pursue further activity. As a result,
$32 million
in exploratory well costs were expensed.
11
. Impairments
The following table summarizes impairment charges of proved properties from continuing operations. Additionally, it presents the values of assets, by major category, measured at fair value on a nonrecurring basis in periods subsequent to their initial recognition.
|
|
2018
|
2017
|
2016
|
||||||||||||||||||||
|
(In millions)
|
Fair Value
|
Impairment
|
Fair Value
|
Impairment
|
Fair Value
|
Impairment
|
|||||||||||||||||
|
Long-lived assets held for use
|
$
|
113
|
|
$
|
75
|
|
$
|
179
|
|
$
|
229
|
|
$
|
15
|
|
$
|
67
|
|
|||||
|
•
|
2018
- Impairments in our International and United States segments of
$75 million
, to a fair value of
$113 million
, were largely the result of anticipated sales for certain non-core proved properties. The related fair value measurement utilized the market approach, based upon anticipated sales proceeds less costs to sell which resulted in a Level 2 classification.
|
|
•
|
2017
-
Impairments in our International segment were primarily a result of lower forecasted long-term commodity prices and the anticipated sales of certain non-core proved properties of
$136 million
, to an aggregate fair value of
$103 million
. These fair values were measured using the market approach, based upon either anticipated sales proceeds less costs to sell or a market comparable sales price per boe which resulted in a Level 2 classification.
|
Impairments in our United States segment were
$89 million
, to an aggregate fair value of
$76 million
, and related to Gulf of Mexico and certain conventional Oklahoma assets primarily as a result of lower forecasted long-term commodity prices. The fair values were measured using an income approach based upon internal estimates of future production levels, prices and discount rate. Inputs to the fair value measurement include reserve and production estimates made by our reservoir engineers, estimated future commodity prices adjusted for quality and location differentials and forecasted operating expenses for the remaining estimated life of the reservoir which resulted in a Level 3 classification.
|
•
|
2016
-
Impairments of
$67 million
, to an aggregate fair value of
$15 million
, consisted primarily of proved properties in Oklahoma and the Gulf of Mexico in our United States segment as a result of lower forecasted commodity prices and revisions to estimated abandonment costs. The fair values were measured using an income approach based upon internal estimates of future production levels, prices and discount rate. Inputs to the fair value measurement include reserve and production estimates made by our reservoir engineers, estimated future commodity prices adjusted for
|
78
MARATHON OIL CORPORATION
Notes to Consolidated Financial Statements
quality and location differentials and forecasted operating expenses for the remaining estimated life of the reservoir which resulted in a Level 3 classification.
See
Note 5
for discussion of the divestitures in further detail and
Note 7
for relevant detail regarding segment presentation.
The following table summarizes impairment charges of unproved properties included as a component of exploration expense:
|
|
Year Ended December 31,
|
||||||||||
|
(In millions)
|
2018
|
2017
|
2016
|
||||||||
|
Exploration Expenses
|
|||||||||||
|
Unproved property impairments
|
$
|
208
|
|
$
|
246
|
|
$
|
195
|
|
||
|
Dry well costs
|
47
|
|
77
|
|
25
|
|
|||||
|
Geological and geophysical
|
21
|
|
25
|
|
5
|
|
|||||
|
Other
|
13
|
|
61
|
|
98
|
|
|||||
|
Total exploration expenses
|
$
|
289
|
|
$
|
409
|
|
$
|
323
|
|
||
Unproved property impairments and dry well costs
|
•
|
2018
- During the fourth quarter 2018, we concluded our evaluation of drilling opportunities on the Rodo well in Alba Block Sub Area B, offshore E.G. and determined that we would not pursue further activity. As a result, we expensed
$32 million
in dry well costs and
$16 million
in unproved property impairments. See
Note 10
for further discussion.
|
|
•
|
2017
-
As a result of lower forecasted long-term commodity prices and the anticipated sales of certain non-core international properties we recorded a non-cash charge of
$95 million
to unproved property impairments related to various properties; and
$64 million
in dry well costs related to our Diaba License G4-223 in the Republic of Gabon. Also, as a result of our decision not to develop the Tchicuate offshore Block in the Republic of Gabon, we recorded a non-cash charge of
$43 million
to unproved property impairments.
|
|
•
|
2016
- Unproved property impairments are primarily a result of our decision to not drill any of our remaining Gulf of Mexico undeveloped leases and also included certain other unproved properties in the United States.
|
See
Note 5
for relevant detail regarding the disposition of assets and
Note 7
for relevant detail regarding segment presentation of unproved property impairments.
79
MARATHON OIL CORPORATION
Notes to Consolidated Financial Statements
12
. Asset Retirement Obligations
Asset retirement obligations primarily consist of estimated costs to remove, dismantle and restore land or seabed at the end of oil and gas production operations. Changes in asset retirement obligations for the periods ended December 31 were as follows:
|
(In millions)
|
2018
|
2017
|
|||||
|
Beginning balance
|
$
|
1,483
|
|
$
|
1,652
|
|
|
|
Incurred liabilities, including acquisitions
|
21
|
|
25
|
|
|||
|
Settled liabilities, including dispositions
|
(117
|
)
|
(50
|
)
|
|||
|
Accretion expense (included in depreciation, depletion and amortization)
|
70
|
|
85
|
|
|||
|
Revisions of estimates
|
(204
|
)
|
(227
|
)
|
|||
|
Held for sale
(a)
|
(108
|
)
|
(2
|
)
|
|||
|
Ending balance
(b)
|
$
|
1,145
|
|
$
|
1,483
|
|
|
(a)
In the fourth quarter 2018, we entered into an agreement to sell our working interest in the Droshky field (Gulf of Mexico), including our
$98 million
asset retirement obligation. This transaction closed during the first quarter of 2019.
(b)
$944 million
of the 2018 ending balance relates to our asset retirement obligations in the U.K.
2018
|
•
|
Settled liabilities
include dispositions, primarily related to the sale of non-core, non-operated conventional properties in the Gulf of Mexico as well as retirements in the U.K.
|
|
•
|
Revisions of estimates
were primarily due to the acceleration of U.K. abandonment activities to capture favorable market conditions and lower estimated abandonment costs.
|
|
•
|
Ending balance
primarily relates to the U.K. and includes
$64 million
classified as short-term at
December 31, 2018
.
|
2017
|
•
|
Settled liabilities
include dispositions, primarily related to the sale of certain conventional assets in Oklahoma as well as retirements in the U.K. and the Gulf of Mexico.
|
|
•
|
Revisions of estimates
were primarily due to changes in U.K. estimated costs as well as timing of abandonment activities in the U.K.
|
|
•
|
Ending balance
primarily relates to the U.K. and includes
$55 million
classified as short-term at
December 31, 2017
.
|
13
. Goodwill
As of
December 31, 2018
, our consolidated balance sheet included goodwill of
$97 million
. Goodwill is tested for impairment on an annual basis, or between annual tests when events or changes in circumstances indicate the fair value may have been reduced below its carrying value. Goodwill is tested for impairment at the reporting unit level. Our reporting units are the same as our reporting segments, of which only International includes goodwill. We first assess the qualitative factors in order to determine whether the fair value of our International reporting unit is more likely than not less than its carrying amount. Certain qualitative factors used in our evaluation include, among other things, the results of the most recent quantitative assessment of the goodwill impairment test, macroeconomic conditions; industry and market conditions (including commodity prices and cost factors); overall financial performance; and other relevant entity-specific events. If, after considering these events and circumstances we determined that it is more likely than not that the fair value of the International reporting unit is less than its carrying amount, a quantitative goodwill test is performed. The quantitative goodwill test is performed using a combination of market and income approaches. The market approach references observable inputs specific to us and our industry, such as the price of our common equity, our enterprise value, and valuation multiples of us and our peers from the investor analyst community. The income approach utilizes discounted cash flows, which are based on forecasted assumptions. Key assumptions to the income approach include future liquid hydrocarbon and natural gas pricing, estimated quantities of liquid hydrocarbons and natural gas proved and probable reserves, estimated timing of production, discount rates, future capital requirements, operating expenses and tax rates. The assumptions used in the income approach are consistent with those that management uses to make business decisions. This quantitative goodwill test would represent Level 3 fair value measurements.
During the second quarter of 2018, we performed our annual impairment test of goodwill using the qualitative assessment. Our qualitative assessment considered the significant excess fair value over carrying value in our most recent step 1 test (second quarter 2017) and noted a general improvement in the qualitative factors above. After assessing the totality of the qualitative
80
MARATHON OIL CORPORATION
Notes to Consolidated Financial Statements
factors which could have a positive or negative impact on goodwill, our assessment did not indicate that it is more likely than not that the fair value is less than its carrying value. As a result, we concluded that no impairment to goodwill was required for our International reporting unit.
As of December 31, 2018 and 2017 our International Segment is the only reporting segment which includes goodwill. The table below displays the allocated beginning goodwill balance of our International segment along with changes in the carrying amount of goodwill for
2018
and
2017
:
|
(In millions)
|
International
|
|||
|
2017
|
||||
|
Beginning balance, gross
|
$
|
115
|
|
|
|
Less: accumulated impairments
|
—
|
|
||
|
Beginning balance, net
|
115
|
|
||
|
Dispositions
|
—
|
|
||
|
Impairment
|
—
|
|
||
|
Ending balance, net
|
$
|
115
|
|
|
|
2018
|
||||
|
Beginning balance, gross
|
$
|
115
|
|
|
|
Less: accumulated impairments
|
—
|
|
||
|
Beginning balance, net
|
115
|
|
||
|
Dispositions
(a)
|
(18
|
)
|
||
|
Impairment
|
—
|
|
||
|
Ending balance, net
|
$
|
97
|
|
|
(a)
Primarily related to the sale of our Libya subsidiary (see
Note 5
).
14
. Derivatives
For further information regarding the fair value measurement of derivative instruments see
Note 15
. See
Note 1
for discussion of the types of derivatives we may use and the reasons for them. All of our commodity derivatives and historical interest rate derivatives are/were subject to enforceable master netting arrangements or similar agreements under which we report net amounts. The following tables present the gross fair values of derivative instruments and the reported net amounts along with where they appear on the consolidated balance sheets.
|
December 31, 2018
|
|||||||||||||
|
(In millions)
|
Asset
|
Liability
|
Net Asset (Liability)
|
Balance Sheet Location
|
|||||||||
|
Not Designated as Hedges
|
|||||||||||||
|
Commodity
|
$
|
131
|
|
$
|
—
|
|
$
|
131
|
|
Other current assets
|
|||
|
Commodity
|
—
|
|
4
|
|
(4
|
)
|
Deferred credits and other liabilities
|
||||||
|
Total Not Designated as Hedges
|
$
|
131
|
|
$
|
4
|
|
$
|
127
|
|
||||
|
December 31, 2017
|
|||||||||||||
|
(In millions)
|
Asset
|
Liability
|
Net Asset (Liability)
|
Balance Sheet Location
|
|||||||||
|
Not Designated as Hedges
|
|||||||||||||
|
Commodity
|
$
|
—
|
|
$
|
138
|
|
$
|
(138
|
)
|
Other current liabilities
|
|||
|
Commodity
|
—
|
|
2
|
|
(2
|
)
|
Deferred credits and other liabilities
|
||||||
|
Total Not Designated as Hedges
|
$
|
—
|
|
$
|
140
|
|
$
|
(140
|
)
|
||||
81
MARATHON OIL CORPORATION
Notes to Consolidated Financial Statements
Derivatives Not Designated as Hedges
Terminated Interest Rate Swaps
During the third quarter of 2016, we entered into forward starting interest rate swaps to hedge the variations in cash flows related to fluctuations in long term interest rates from debt that were probable to be refinanced by us in 2018, specifically interest rate risk associated with future changes in the benchmark treasury rate. During the second quarter of 2017, we de-designated the forward starting interest rate swaps previously designated as cash flow hedges. In the third quarter of 2017, the forecasted transaction consummated and we issued
$1 billion
in senior unsecured notes. As a result, in the third quarter of 2017 we terminated our forward starting interest rate swaps for proceeds of
$54 million
. We recognized a gain of
$46 million
, related to deferred gains reclassified from accumulated other comprehensive income, in net interest and other during 2017. See
Note 16
for further detail.
The following table sets forth the net impact of the terminated forward starting interest rate swap derivatives de-designated as cash flow hedges on other comprehensive income (loss).
|
Year Ended December 31,
|
||||||||||||
|
(In millions)
|
2018
|
2017
|
2016
|
|||||||||
|
Interest Rate Swaps
|
|
|
||||||||||
|
Beginning balance
|
$
|
—
|
|
$
|
60
|
|
$
|
—
|
|
|||
|
Change in fair value recognized in other comprehensive income
|
—
|
|
(13
|
)
|
64
|
|
||||||
|
Reclassification from other comprehensive income
|
—
|
|
(47
|
)
|
(4
|
)
|
||||||
|
Ending balance
|
$
|
—
|
|
$
|
—
|
|
$
|
60
|
|
|||
82
MARATHON OIL CORPORATION
Notes to Consolidated Financial Statements
Commodity Derivatives
We have entered into multiple crude oil and natural gas derivatives indexed to NYMEX WTI and Henry Hub related to a portion of our forecasted United States sales through 2020. These commodity derivatives consist of three-way collars, basis swaps, and NYMEX roll basis swaps. Three-way collars consist of a sold call (ceiling), a purchased put (floor) and a sold put. The ceiling price is the maximum we will receive for the contract volumes; the floor is the minimum price we will receive, unless the market price falls below the sold put strike price. In this case, we receive the NYMEX WTI/Henry Hub price plus the difference between the floor and the sold put price. These commodity derivatives were not designated as hedges. The following table sets forth outstanding derivative contracts as of
December 31, 2018
and the weighted average prices for those contracts:
|
2019
|
2020
|
||||||||||
|
Crude Oil
|
First Quarter
|
Second Quarter
|
Third Quarter
|
Fourth Quarter
|
Full Year
|
||||||
|
Three-Way Collars
|
|||||||||||
|
Volume (Bbls/day)
|
70,000
|
70,000
|
50,000
|
50,000
|
—
|
||||||
|
Weighted average price per Bbl:
|
|||||||||||
|
Ceiling
|
$71.21
|
$71.21
|
$75.88
|
$75.88
|
—
|
||||||
|
Floor
|
$55.86
|
$55.86
|
$57.80
|
$57.80
|
—
|
||||||
|
Sold put
|
$48.71
|
$48.71
|
$50.80
|
$50.80
|
—
|
||||||
|
Basis Swaps
(a)(b)
|
|||||||||||
|
Volume (Bbls/day)
|
10,000
|
10,000
|
10,000
|
10,000
|
15,000
|
||||||
|
Weighted average price per Bbl
|
$(0.82)
|
$(0.82)
|
$(0.82)
|
$(0.82)
|
$(0.94)
|
||||||
|
NYMEX Roll Basis Swaps
|
|||||||||||
|
Volume (Bbls/day)
|
60,000
|
60,000
|
60,000
|
60,000
|
—
|
||||||
|
Weighted average price per Bbl
|
$0.38
|
$0.38
|
$0.38
|
$0.38
|
—
|
||||||
|
Natural Gas
|
|||||||||||
|
Three-Way Collars
|
|||||||||||
|
Volume (MMBtu/day)
|
200,000
|
—
|
—
|
—
|
—
|
||||||
|
Weighted average price per MMBtu:
|
|||||||||||
|
Ceiling
|
$5.25
|
—
|
—
|
—
|
—
|
||||||
|
Floor
|
$3.43
|
—
|
—
|
—
|
—
|
||||||
|
Sold put
|
$2.88
|
—
|
—
|
—
|
—
|
||||||
(a)
The basis differential price is between WTI Midland and WTI Cushing.
(b)
Between January 1, 2019 and
February 12, 2019, we entered into
5,000
Bbls/day of Midland basis swaps for July - December 2019 with an average price of
$(2.55)
and
1,000
Bbls/day of Clearbrook basis swaps for March - December 2019 with an average price of
$(3.50)
.
The mark-to-market impact and settlement of these commodity derivative instruments appears in net gain (loss) on commodity derivatives in our consolidated statements of income for the years ended
December 31, 2018
,
2017
, and
2016
. The
December 31, 2018
,
2017
, and
2016
mark-to-market impact was a net gain of
$267 million
, a net loss of
$81 million
and a net loss of
$110 million
, respectively. Net settlements of commodity derivative instruments for the years ended
December 31, 2018
,
2017
, and
2016
were a loss of
$281 million
, a gain of
$45 million
and a gain of
$44 million
, respectively.
83
MARATHON OIL CORPORATION
Notes to Consolidated Financial Statements
15
. Fair Value Measurements
Fair Values – Recurring
The following tables' present assets and liabilities accounted for at fair value on a recurring basis by hierarchy level.
|
|
December 31, 2018
|
||||||||||||||
|
(In millions)
|
Level 1
|
Level 2
|
Level 3
|
Total
|
|||||||||||
|
Derivative instruments, assets
|
|||||||||||||||
|
Commodity
(a)
|
$
|
21
|
|
$
|
106
|
|
$
|
—
|
|
$
|
127
|
|
|||
|
Derivative instruments, assets
|
$
|
21
|
|
$
|
106
|
|
$
|
—
|
|
$
|
127
|
|
|||
|
Derivative instruments, liabilities
|
|||||||||||||||
|
Derivative instruments, liabilities
|
$
|
—
|
|
$
|
—
|
|
$
|
—
|
|
$
|
—
|
|
|||
|
December 31, 2017
|
|||||||||||||||
|
(In millions)
|
Level 1
|
Level 2
|
Level 3
|
Total
|
|||||||||||
|
Derivative instruments, assets
|
|||||||||||||||
|
Derivative instruments, assets
|
$
|
—
|
|
$
|
—
|
|
$
|
—
|
|
$
|
—
|
|
|||
|
Derivative instruments, liabilities
|
|||||||||||||||
|
Commodity
(a)
|
$
|
(20
|
)
|
$
|
(120
|
)
|
$
|
—
|
|
$
|
(140
|
)
|
|||
|
Derivative instruments, liabilities
|
$
|
(20
|
)
|
$
|
(120
|
)
|
$
|
—
|
|
$
|
(140
|
)
|
|||
(a)
Derivative instruments are recorded on a net basis in our consolidated balance sheet (see
Note 14
).
Commodity derivatives include three-way collars, basis swaps, and NYMEX roll basis swaps. These instruments are measured at fair value using either a Black-Scholes or a modified Black-Scholes Model. For basis swaps and NYMEX roll basis swaps, inputs to the models include only commodity prices and interest rates and are categorized as Level 1 because all assumptions and inputs are observable in active markets throughout the term of the instruments. For three-way collars, inputs to the models include commodity prices and implied volatility and are categorized as Level 2 because predominantly all assumptions and inputs are observable in active markets throughout the term of the instruments.
Historically, both our interest rate swaps and forward starting interest rate swaps were measured at fair value with a market approach using actionable broker quotes, which are Level 2 inputs. See
Note 14
for additional discussion of the types of derivative instruments we used.
Fair Values – Goodwill
See
Note 13
for detail information relating to goodwill.
Fair Values – Nonrecurring
Fair Values – Financial Instruments
Our current assets and liabilities include financial instruments, the most significant of which are receivables, the current portion of our long-term debt and payables. We believe the carrying values of our receivables and payables approximate fair value. Our fair value assessment incorporates a variety of considerations, including (1) the short-term duration of the instruments, (2) our credit rating, and (3) our historical incurrence of and expected future insignificance of bad debt expense, which includes an evaluation of counterparty credit risk.
84
MARATHON OIL CORPORATION
Notes to Consolidated Financial Statements
The following table summarizes financial instruments, excluding receivables, payables and derivative financial instruments, and their reported fair values by individual balance sheet line item at
December 31, 2018
and
2017
.
|
|
December 31,
|
||||||||||||||
|
2018
|
2017
|
||||||||||||||
|
(In millions)
|
Fair
Value
|
Carrying
Amount
|
Fair
Value
|
Carrying
Amount
|
|||||||||||
|
Financial assets
|
|||||||||||||||
|
Current assets
(a)
|
$
|
13
|
|
$
|
13
|
|
$
|
762
|
|
$
|
761
|
|
|||
|
Other noncurrent assets
|
76
|
|
81
|
|
135
|
|
137
|
|
|||||||
|
Total financial assets
|
$
|
89
|
|
$
|
94
|
|
$
|
897
|
|
$
|
898
|
|
|||
|
Financial liabilities
|
|||||||||||||||
|
Other current liabilities
|
$
|
37
|
|
$
|
58
|
|
$
|
32
|
|
$
|
43
|
|
|||
|
Long-term debt, including current portion
(b)
|
5,469
|
|
5,528
|
|
5,976
|
|
5,526
|
|
|||||||
|
Deferred credits and other liabilities
|
93
|
|
88
|
|
110
|
|
103
|
|
|||||||
|
Total financial liabilities
|
$
|
5,599
|
|
$
|
5,674
|
|
$
|
6,118
|
|
$
|
5,672
|
|
|||
|
(a)
|
December 31, 2017
fair value and carrying amounts included our
two
notes receivable relating to the sale of our Canadian business; both were paid during the first quarter of 2018, see
Note 5
for further information.
|
|
(b)
|
Excludes capital leases and debt issuance costs.
|
Fair values of our notes receivable and our financial assets included in other noncurrent assets, and of our financial liabilities included in other current liabilities and deferred credits and other liabilities, are measured using an income approach and most inputs are internally generated, which results in a Level 3 classification. Estimated future cash flows are discounted using a rate deemed appropriate to obtain the fair value.
All of our long-term debt instruments are publicly traded. A market approach, based upon quotes from major financial institutions, which are Level 2 inputs, is used to measure the fair value of our debt.
16
. Debt
Revolving Credit Facility
As of
December 31, 2018
, we had no borrowings against our
$3.4 billion
unsecured revolving credit facility (as amended, the "Credit Facility"), as described below.
In October 2018, we extended the maturity date of our Credit Facility from May 28, 2021 to May 28, 2022. Fees on the unused commitment to the lenders, as well as the borrowing options under the Credit Facility, remain unaffected by the term extension. We retain the ability to request
two
one
-year extensions and an option to increase the commitment amount by up to an additional
$107 million
, subject to the consent of any increasing lenders. The sub-facilities for swing-line loans and letters of credit remain unchanged allowing up to an aggregate amount of
$100 million
and
$500 million
, respectively.
The Credit Facility includes a covenant requiring that our ratio of total debt to total capitalization not exceed
65%
as of the last day of each fiscal quarter. If an event of default occurs, the lenders holding more than half of the commitments may terminate the commitments under the Credit Facility and require the immediate repayment of all outstanding borrowings and the cash collateralization of all outstanding letters of credit under the Credit Facility. As of
December 31, 2018
, we were in compliance with this covenant with a debt-to-capitalization ratio of
31%
.
85
MARATHON OIL CORPORATION
Notes to Consolidated Financial Statements
Long-term debt
The following table details our long-term debt:
|
|
December 31,
|
||||||
|
(In millions)
|
2018
|
2017
|
|||||
|
Senior unsecured notes:
|
|||||||
|
2.700% notes due 2020
(a)
|
$
|
600
|
|
$
|
600
|
|
|
|
2.800% notes due 2022
(a)
|
1,000
|
|
1,000
|
|
|||
|
9.375% notes due 2022
(b)
|
32
|
|
32
|
|
|||
|
Series A notes due 2022
(b)
|
3
|
|
3
|
|
|||
|
8.500% notes due 2023
(b)
|
70
|
|
70
|
|
|||
|
8.125% notes due 2023
(b)
|
131
|
|
131
|
|
|||
|
3.850% notes due 2025
(a)
|
900
|
|
900
|
|
|||
|
4.400% notes due 2027
(a)
|
1,000
|
|
1,000
|
|
|||
|
6.800% notes due 2032
(a)
|
550
|
|
550
|
|
|||
|
6.600% notes due 2037
(a)
|
750
|
|
750
|
|
|||
|
5.200% notes due 2045
(a)
|
500
|
|
500
|
|
|||
|
Total
(b)
|
5,536
|
|
5,536
|
|
|||
|
Unamortized discount
|
(8
|
)
|
(10
|
)
|
|||
|
Unamortized debt issuance cost
|
(29
|
)
|
(32
|
)
|
|||
|
Total long-term debt
|
$
|
5,499
|
|
$
|
5,494
|
|
|
|
(a)
|
These notes contain a make-whole provision allowing us to repay the debt at a premium to market price.
|
|
(b)
|
In the event of a change in control, as defined in the related agreements, debt obligations totaling
$236 million
at
December 31, 2018
may be declared immediately due and payable.
|
The following table shows future debt payments:
|
(In millions)
|
|||
|
2019
|
$
|
—
|
|
|
2020
|
600
|
|
|
|
2021
|
—
|
|
|
|
2022
|
1,035
|
|
|
|
2023
|
201
|
|
|
|
Thereafter
|
3,700
|
|
|
|
Total long-term debt, including current portion
|
$
|
5,536
|
|
Debt Issuance
On July 24, 2017, we issued
$1 billion
in senior unsecured notes that will mature on July 15, 2027. Interest on the senior unsecured notes is payable semi-annually beginning January 15, 2018. We may redeem some or all of the senior unsecured notes at any time at the applicable redemption price, plus accrued interest, if any. We used the net proceeds of
$990 million
plus existing cash on hand to redeem the following senior unsecured notes:
|
•
|
$682 million
6.0%
Notes Due in 2017
|
|
•
|
$854 million
5.9%
Notes Due in 2018
|
|
•
|
$228 million
7.5%
Notes Due in 2019
|
As a result of the above redemption of
$1.76 billion
in senior unsecured notes, we recognized a loss on early extinguishment of debt of
$46 million
, primarily due to make-whole call provisions. In connection with the redemption of the senior unsecured notes, we terminated our forward starting interest rate swaps, which resulted in proceeds of
$54 million
and a gain of approximately
$46 million
into earnings in 2017. See
Note 14
for further detail on our historical forward starting interest rate swaps.
86
MARATHON OIL CORPORATION
Notes to Consolidated Financial Statements
Debt Redemption
In December 2017, we entered into a transaction to purchase
$1 billion
of
3.75%
municipal revenue bonds due in 2037, to be issued by the Parish of St. John the Baptist, State of Louisiana (the "Parish"). The Parish will use the proceeds to redeem
$1 billion
of
5.125%
municipal revenue bonds due in 2037 with cash on hand in a refunding transaction. We purchased the
$1 billion
of
3.75%
municipal revenue bonds due in 2037 on their date of issuance to hold for our own account and potential remarketing to the public at a future date.
17
. Incentive Based Compensation
Description of stock-based compensation plans
– The Marathon Oil Corporation 2016 Incentive Compensation Plan (the "2016 Plan") was approved by our stockholders in May 2016 and authorizes the Compensation Committee of the Board of Directors to grant stock options, SARs, stock awards (including restricted stock and restricted stock unit awards) and performance unit awards to employees. The 2016 Plan also allows us to provide equity compensation to our non-employee directors. No more than
55 million
shares of our common stock may be issued under the 2016 Plan. For stock options and SARs, the number of shares available for issuance under the 2016 Plan will be reduced by one share for each share of our common stock in respect of which the award is granted. For stock awards (including restricted stock and restricted stock unit awards), the number of shares available for issuance under the 2016 Plan will be reduced by
2.41
shares for each share of our common stock in respect of which the award is granted.
Shares subject to awards under the 2016 Plan that are forfeited, terminated or expire unexercised become available for future grants. In addition, the number of shares of our common stock reserved for issuance under the 2016 Plan will not be increased by shares tendered to satisfy the purchase price of an award, exchanged for other awards or withheld to satisfy tax withholding obligations. Shares issued as a result of awards granted under the 2016 Plan are generally funded out of common stock held in treasury, except to the extent there are insufficient treasury shares, in which case new common shares are issued.
After approval of the 2016 Plan,
no
new grants were or will be made from any prior plans. Any awards previously granted under any prior plans shall continue to be exercisable in accordance with their original terms and conditions.
Stock-based awards under the plans
Stock options
– We grant stock options under the 2016 Plan. Our stock options represent the right to purchase shares of our common stock at its fair market value on the date of grant. In general, our stock options vest ratably over a
three
-year period and have a maximum term of
ten
years from the date they are granted.
SARs
– At
December 31, 2018
, there are
no
SARs outstanding.
Restricted stock
– We grant restricted stock under the 2016 Plan. The restricted stock awards granted to officers generally vest
three
years from the date of grant, contingent on the recipient’s continued employment. We also grant restricted stock to certain non-officer employees based on their performance within certain guidelines and for retention purposes. The restricted stock awards to non-officers generally vest ratably over a
three
-year period, contingent on the recipient’s continued employment. Prior to vesting, all restricted stock recipients have the right to vote such stock and receive dividends thereon. The non-vested shares of restricted stock are not transferable and are held by our transfer agent.
Stock-based performance units
– We grant stock-based performance units to officers under the 2016 Plan. At the grant date, each unit represents the value of one share of our common stock. These units are settled in cash, and the amount of the payment is based on (1) the vesting percentage, which can be from
zero
to
200%
based on performance achieved and as determined by the Compensation Committee of the Board of Directors and (2) the fair market value of our common stock on the last day of the performance period. The performance goals are tied to our total shareholder return (“TSR”) as compared to TSR for a group of peer companies determined by the Compensation Committee of our Board of Directors. Dividend equivalents may accrue during the performance period and would be paid in cash at the end of the performance period based on the number of shares that would represent the value of the units granted multiplied by the vesting percentage.
Restricted stock units
– We maintain an equity compensation program for our non-employee directors. All non-employee directors receive annual grants of common stock units. Any units granted prior to 2012 must be held until completion of board service, at which time the non-employee director will receive common shares. For units granted between 2012 and 2016, common shares will generally vest following completion of board service or three years from the date of grant, whichever is earlier. For awards issued in 2017 and later, directors may elect to defer settlement of their common stock units until after they cease serving on the Board. Absent such an election to defer, common shares will vest upon the earlier of three years from the date of grant or completion of board service. We also grant restricted stock units to certain non-officer international employees which generally vest ratably over a
three
-year period, contingent on the recipient's continued employment. Grants of restricted stock units to these non-officer international employees are based on their performance and for retention purposes. Common
87
MARATHON OIL CORPORATION
Notes to Consolidated Financial Statements
shares will be issued for these restricted stock units after vesting. Prior to vesting, recipients of restricted stock units typically receive dividend equivalent payments, but they may not vote.
Total stock-based compensation expense
– Total employee stock-based compensation expense was
$53 million
,
$50 million
and
$51 million
in
2018
,
2017
and
2016
, while the total related income tax benefits were
$19 million
in 2016. Due to the full valuation allowance on our net federal deferred tax assets, we realized no tax benefit during 2018 and 2017. In 2018 and 2016, cash received upon exercise of stock option awards was
$26 million
and
$1 million
. There was no cash received upon exercise of stock option awards for 2017. There were
no
tax benefits realized for deductions for stock awards settled during
2018
,
2017
and
2016
.
Stock option awards
– During
2018
,
2017
and
2016
we granted stock option awards to officer employees. The weighted average grant date fair value of these awards was based on the following weighted average Black-Scholes assumptions:
|
|
2018
|
2017
|
2016
|
|||||
|
Exercise price per share
|
$14.52
|
$15.80
|
$7.22
|
|||||
|
Expected annual dividend yield
|
1.4
|
%
|
1.3
|
%
|
2.8
|
%
|
||
|
Expected life in years
|
6.45
|
|
6.4
|
|
6.3
|
|
||
|
Expected volatility
|
43
|
%
|
42
|
%
|
36
|
%
|
||
|
Risk-free interest rate
|
2.8
|
%
|
2.1
|
%
|
1.4
|
%
|
||
|
Weighted average grant date fair value of stock option awards granted
|
$5.83
|
$6.07
|
$1.97
|
|||||
The following is a summary of stock option award activity in
2018
.
|
Number
|
Weighted Average
|
Weighted Average
Remaining
|
Aggregate Intrinsic Value
|
|||||||
|
of Shares
|
Exercise Price
|
Contractual Term
|
(in millions)
|
|||||||
|
Outstanding at beginning of year
|
10,330,776
|
$25.52
|
||||||||
|
Granted
|
856,890
|
$14.52
|
||||||||
|
Exercised
|
(1,878,836)
|
$14.02
|
||||||||
|
Canceled
|
(3,128,823)
|
$31.64
|
||||||||
|
Outstanding at end of year
|
6,180,007
|
$24.39
|
5 years
|
$
|
4
|
|
||||
|
Exercisable at end of year
|
4,523,008
|
|
$28.46
|
3 years
|
$
|
1
|
|
|||
|
Expected to vest
|
1,635,216
|
|
$13.25
|
8 years
|
$
|
3
|
|
|||
The intrinsic value of stock option awards exercised during
2018
was
$13 million
while it was immaterial during
2017
and
2016
.
As of
December 31, 2018
, unrecognized compensation cost related to stock option awards was
$5 million
, which is expected to be recognized over a weighted average period of
one
year.
Restricted stock awards and restricted stock units
– The following is a summary of restricted stock and restricted stock unit award activity in
2018
.
|
Awards
|
Weighted Average
Grant Date
Fair Value
|
|||
|
Unvested at beginning of year
|
7,572,845
|
|
|
$14.24
|
|
Granted
|
4,817,577
|
|
$14.82
|
|
|
Vested and Exercised
|
(3,003,321
|
)
|
$15.79
|
|
|
Canceled
|
(882,155
|
)
|
$14.06
|
|
|
Unvested at end of year
|
8,504,946
|
|
|
$14.04
|
The vesting date fair value of restricted stock awards which vested during
2018
,
2017
and
2016
was
$48 million
,
$39 million
and
$20 million
. The weighted average grant date fair value of restricted stock awards was
$14.04
,
$14.24
and
$14.44
for awards unvested at
December 31, 2018
,
2017
and
2016
.
As of
December 31, 2018
there was
$74 million
of unrecognized compensation cost related to restricted stock awards which is expected to be recognized over a weighted average period of
one
year.
88
MARATHON OIL CORPORATION
Notes to Consolidated Financial Statements
Stock-based performance unit awards
– During
2018
,
2017
and
2016
we granted
754,140
,
563,631
and
1,205,517
stock-based performance unit awards to officers. At
December 31, 2018
, there were
1,196,176
units outstanding. Total stock-based performance unit awards expense was
$13 million
in
2018
,
$8 million
in
2017
and
$6 million
in
2016
.
The key assumptions used in the Monte Carlo simulation to determine the fair value of stock-based performance units granted in
2018
,
2017
and
2016
were:
|
2018
|
2017
|
2016
|
||||||
|
Valuation date stock price
|
$14.17
|
$14.17
|
$14.17
|
|||||
|
Expected annual dividend yield
|
1.4
|
%
|
1.4
|
%
|
1.4
|
%
|
||
|
Expected volatility
|
39
|
%
|
43
|
%
|
52
|
%
|
||
|
Risk-free interest rate
|
2.5
|
%
|
2.6
|
%
|
2.4
|
%
|
||
|
Fair value of stock-based performance units outstanding
|
$19.60
|
$19.45
|
$21.51
|
|||||
18
. Defined Benefit Postretirement Plans and Defined Contribution Plan
We have noncontributory defined benefit pension plans covering substantially all domestic employees, as well as U.K. employees who were hired before April 2010. Certain employees located in E.G., who are U.S. or U.K. based, also participate in these plans. Benefits under these plans are based on plan provisions specific to each plan. For the U.K. pension plan, the principal employer and plan trustees reached a decision to close the plan to future benefit accruals effective December 31, 2015.
We also have defined benefit plans for other postretirement benefits covering our U.S. employees. Health care benefits are provided up to age 65 through comprehensive hospital, surgical and major medical benefit provisions subject to various cost-sharing features. Post-age 65 health care benefits are provided to certain U.S. employees on a defined contribution basis. Life insurance benefits are provided to certain retiree beneficiaries. These other postretirement benefits are not funded in advance. Employees hired after 2016 are not eligible for any postretirement health care or life insurance benefits.
Obligations and funded status
–
The following summarizes the obligations and funded status for our defined benefit pension and other postretirement plans.
|
|
Pension Benefits
|
Other Benefits
|
|||||||||||||||||||||
|
|
2018
|
2017
|
2018
|
2017
|
|||||||||||||||||||
|
(In millions)
|
U.S.
|
Int’l
|
U.S.
|
Int’l
|
U.S.
|
U.S.
|
|||||||||||||||||
|
Accumulated benefit obligation
|
$
|
320
|
|
$
|
511
|
|
$
|
378
|
|
$
|
599
|
|
$
|
96
|
|
$
|
221
|
|
|||||
|
Change in benefit obligations:
|
|||||||||||||||||||||||
|
Beginning balance
|
$
|
384
|
|
$
|
599
|
|
$
|
397
|
|
$
|
583
|
|
$
|
221
|
|
$
|
227
|
|
|||||
|
Service cost
|
18
|
|
—
|
|
22
|
|
—
|
|
2
|
|
2
|
|
|||||||||||
|
Interest cost
|
12
|
|
14
|
|
13
|
|
17
|
|
7
|
|
8
|
|
|||||||||||
|
Plan amendment
|
—
|
|
3
|
|
—
|
|
—
|
|
(99
|
)
|
—
|
|
|||||||||||
|
Actuarial loss (gain)
|
(20
|
)
|
(38
|
)
|
42
|
|
(7
|
)
|
(15
|
)
|
5
|
|
|||||||||||
|
Foreign currency exchange rate changes
|
—
|
|
(29
|
)
|
—
|
|
52
|
|
—
|
|
—
|
|
|||||||||||
|
Settlements paid
|
(62
|
)
|
(23
|
)
|
(84
|
)
|
(31
|
)
|
—
|
|
—
|
|
|||||||||||
|
Benefits paid
|
(6
|
)
|
(15
|
)
|
(6
|
)
|
(15
|
)
|
(20
|
)
|
(21
|
)
|
|||||||||||
|
Ending balance
|
$
|
326
|
|
$
|
511
|
|
$
|
384
|
|
$
|
599
|
|
$
|
96
|
|
$
|
221
|
|
|||||
|
Change in fair value of plan assets:
|
|||||||||||||||||||||||
|
Beginning balance
|
$
|
216
|
|
$
|
670
|
|
$
|
227
|
|
$
|
595
|
|
$
|
—
|
|
$
|
—
|
|
|||||
|
Actual return on plan assets
|
(6
|
)
|
(21
|
)
|
27
|
|
47
|
|
—
|
|
—
|
|
|||||||||||
|
Employer contributions
|
61
|
|
17
|
|
52
|
|
17
|
|
20
|
|
21
|
|
|||||||||||
|
Foreign currency exchange rate changes
|
—
|
|
(34
|
)
|
—
|
|
57
|
|
—
|
|
—
|
|
|||||||||||
|
Settlements paid
|
(62
|
)
|
(23
|
)
|
(84
|
)
|
(31
|
)
|
—
|
|
—
|
|
|||||||||||
|
Benefits paid
|
(6
|
)
|
(15
|
)
|
(6
|
)
|
(15
|
)
|
(20
|
)
|
(21
|
)
|
|||||||||||
|
Ending balance
|
$
|
203
|
|
$
|
594
|
|
$
|
216
|
|
$
|
670
|
|
$
|
—
|
|
$
|
—
|
|
|||||
|
Funded status of plans at December 31
|
$
|
(123
|
)
|
$
|
83
|
|
$
|
(168
|
)
|
$
|
71
|
|
$
|
(96
|
)
|
$
|
(221
|
)
|
|||||
|
Amounts recognized in the consolidated balance sheets:
|
|||||||||||||||||||||||
|
Noncurrent assets
|
$
|
—
|
|
$
|
83
|
|
$
|
—
|
|
$
|
71
|
|
$
|
—
|
|
$
|
—
|
|
|||||
|
Current liabilities
|
(5
|
)
|
—
|
|
(6
|
)
|
—
|
|
(19
|
)
|
(21
|
)
|
|||||||||||
|
Noncurrent liabilities
|
(118
|
)
|
—
|
|
(162
|
)
|
—
|
|
(77
|
)
|
(200
|
)
|
|||||||||||
|
Accrued benefit cost
|
$
|
(123
|
)
|
$
|
83
|
|
$
|
(168
|
)
|
$
|
71
|
|
$
|
(96
|
)
|
$
|
(221
|
)
|
|||||
|
Pretax amounts in accumulated other comprehensive loss:
|
|||||||||||||||||||||||
|
Net loss (gain)
|
$
|
90
|
|
$
|
59
|
|
$
|
122
|
|
$
|
58
|
|
$
|
14
|
|
$
|
30
|
|
|||||
|
Prior service cost (credit)
|
(36
|
)
|
5
|
|
(45
|
)
|
3
|
|
(147
|
)
|
(56
|
)
|
|||||||||||
89
MARATHON OIL CORPORATION
Notes to Consolidated Financial Statements
Components of net periodic benefit cost from continuing operations and other comprehensive (income) loss
– The following summarizes the net periodic benefit costs and the amounts recognized as other comprehensive (income) loss for our defined benefit pension and other postretirement plans.
|
|
Pension Benefits
|
Other Benefits
|
|||||||||||||||||||||||||||||||||
|
Year Ended December 31,
|
Year Ended December 31,
|
||||||||||||||||||||||||||||||||||
|
|
2018
|
2017
|
2016
|
2018
|
2017
|
2016
|
|||||||||||||||||||||||||||||
|
(In millions)
|
U.S.
|
Int’l
|
U.S.
|
Int’l
|
U.S.
|
Int’l
|
U.S.
|
U.S.
|
U.S.
|
||||||||||||||||||||||||||
|
Components of net periodic benefit cost:
|
|||||||||||||||||||||||||||||||||||
|
Service cost
|
$
|
18
|
|
$
|
—
|
|
$
|
22
|
|
$
|
—
|
|
$
|
25
|
|
$
|
—
|
|
$
|
2
|
|
$
|
2
|
|
$
|
2
|
|
||||||||
|
Interest cost
|
12
|
|
14
|
|
13
|
|
17
|
|
16
|
|
23
|
|
7
|
|
8
|
|
11
|
|
|||||||||||||||||
|
Expected return on plan assets
|
(11
|
)
|
(24
|
)
|
(13
|
)
|
(30
|
)
|
(18
|
)
|
(35
|
)
|
—
|
|
—
|
|
—
|
|
|||||||||||||||||
|
Amortization:
|
|||||||||||||||||||||||||||||||||||
|
- prior service cost (credit)
|
(10
|
)
|
—
|
|
(10
|
)
|
—
|
|
(10
|
)
|
1
|
|
(8
|
)
|
(7
|
)
|
(3
|
)
|
|||||||||||||||||
|
- actuarial loss
|
11
|
|
—
|
|
8
|
|
1
|
|
14
|
|
—
|
|
1
|
|
—
|
|
—
|
|
|||||||||||||||||
|
Net settlement loss
(a)
|
18
|
|
3
|
|
28
|
|
4
|
|
97
|
|
6
|
|
—
|
|
—
|
|
—
|
|
|||||||||||||||||
|
Net periodic benefit cost
(b)
|
$
|
38
|
|
$
|
(7
|
)
|
$
|
48
|
|
$
|
(8
|
)
|
$
|
124
|
|
$
|
(5
|
)
|
$
|
2
|
|
$
|
3
|
|
$
|
10
|
|
||||||||
|
Other changes in plan assets and benefit obligations recognized in other comprehensive (income) loss (pretax):
|
|||||||||||||||||||||||||||||||||||
|
Actuarial loss (gain)
|
$
|
(4
|
)
|
$
|
8
|
|
$
|
28
|
|
$
|
(26
|
)
|
$
|
70
|
|
$
|
41
|
|
$
|
(15
|
)
|
$
|
5
|
|
$
|
11
|
|
||||||||
|
Amortization of actuarial gain (loss)
|
(29
|
)
|
(3
|
)
|
(36
|
)
|
(4
|
)
|
(111
|
)
|
(6
|
)
|
(1
|
)
|
—
|
|
—
|
|
|||||||||||||||||
|
Prior service cost (credit)
|
—
|
|
3
|
|
—
|
|
—
|
|
—
|
|
1
|
|
(99
|
)
|
—
|
|
(38
|
)
|
|||||||||||||||||
|
Amortization of prior service credit (cost)
|
10
|
|
—
|
|
10
|
|
—
|
|
10
|
|
(1
|
)
|
8
|
|
7
|
|
3
|
|
|||||||||||||||||
|
Total recognized in other comprehensive (income) loss
|
$
|
(23
|
)
|
$
|
8
|
|
$
|
2
|
|
$
|
(30
|
)
|
$
|
(31
|
)
|
$
|
35
|
|
$
|
(107
|
)
|
$
|
12
|
|
$
|
(24
|
)
|
||||||||
|
Total recognized in net periodic benefit cost and other comprehensive (income) loss
|
$
|
15
|
|
$
|
1
|
|
$
|
50
|
|
$
|
(38
|
)
|
$
|
93
|
|
$
|
30
|
|
$
|
(105
|
)
|
$
|
15
|
|
$
|
(14
|
)
|
||||||||
|
(a)
|
Settlements are recognized as they occur, once it is probable that lump sum payments from a plan for a given year will exceed the plan’s total service and interest costs for that year.
|
|
(b)
|
Net periodic benefit cost reflects a calculated market-related value of plan assets which recognizes changes in fair value over three years.
|
The estimated net loss and prior service credit for our defined benefit pension plans that will be amortized from accumulated other comprehensive loss into net periodic benefit cost in
2019
are
$7 million
and
$7 million
. The estimated net loss and prior service credit for our other defined benefit postretirement plans that will be amortized from accumulated other comprehensive loss into net periodic benefit cost in
2019
are
$1 million
and
$18 million
.
Plan assumptions
– The following summarizes the assumptions used to determine the benefit obligations at
December 31,
and net periodic benefit cost for the defined benefit pension and other postretirement plans for
2018
,
2017
and
2016
.
|
|
Pension Benefits
|
Other Benefits
|
||||||||||||||||||||||||
|
2018
|
2017
|
2016
|
2018
|
2017
|
2016
|
|||||||||||||||||||||
|
(In millions)
|
U.S.
|
Int’l
|
U.S.
|
Int’l
|
U.S.
|
Int’l
|
U.S.
|
U.S.
|
U.S.
|
|||||||||||||||||
|
Weighted average assumptions used to determine benefit obligation:
|
||||||||||||||||||||||||||
|
Discount rate
|
4.26
|
%
|
2.90
|
%
|
3.55
|
%
|
2.50
|
%
|
4.02
|
%
|
2.70
|
%
|
4.09
|
%
|
3.54
|
%
|
3.98
|
%
|
||||||||
|
Rate of compensation increase
(a)
|
4.00
|
%
|
—
|
%
|
4.00
|
%
|
—
|
%
|
4.00
|
%
|
—
|
%
|
4.00
|
%
|
4.00
|
%
|
4.00
|
%
|
||||||||
|
Weighted average assumptions used to determine net periodic benefit cost:
|
||||||||||||||||||||||||||
|
Discount rate
|
3.88
|
%
|
2.50
|
%
|
3.86
|
%
|
2.70
|
%
|
3.66
|
%
|
3.90
|
%
|
3.54
|
%
|
3.98
|
%
|
4.36
|
%
|
||||||||
|
Expected long-term return on plan assets
|
6.50
|
%
|
3.70
|
%
|
6.50
|
%
|
4.50
|
%
|
6.75
|
%
|
5.50
|
%
|
—
|
%
|
—
|
%
|
—
|
%
|
||||||||
|
Rate of compensation increase
(a)
|
4.00
|
%
|
—
|
%
|
4.00
|
%
|
—
|
%
|
4.00
|
%
|
—
|
%
|
4.00
|
%
|
4.00
|
%
|
4.00
|
%
|
||||||||
|
(a)
|
No future benefits will be incurred for the U.K. plan after December 31, 2015. Therefore, rate of compensation increase is no longer applicable to this plan.
|
90
MARATHON OIL CORPORATION
Notes to Consolidated Financial Statements
Expected long-term return on plan assets
– The expected long-term return on plan assets assumption for our U.S. funded plan is determined based on an asset rate-of-return modeling tool developed by a third-party investment group which utilizes underlying assumptions based on actual returns by asset category and inflation and takes into account our U.S. pension plan’s asset allocation. To determine the expected long-term return on plan assets assumption for our international plans, we consider the current level of expected returns on risk-free investments (primarily government bonds), the historical levels of the risk premiums associated with the other applicable asset categories and the expectations for future returns of each asset class. The expected return for each asset category is then weighted based on the actual asset allocation to develop the overall expected long-term return on plan assets assumption.
Assumed weighted average health care cost trend rates
|
2018
|
2017
|
2016
|
|||||
|
Initial health care trend rate
|
N/A
|
8.00
|
%
|
8.25
|
%
|
||
|
Ultimate trend rate
|
N/A
|
4.70
|
%
|
4.50
|
%
|
||
|
Year ultimate trend rate is reached
|
N/A
|
2025
|
|
2025
|
|
||
N/A
All retiree medical subsidies are frozen as of January 1, 2019.
Employer provided subsidies for post-65 retiree health care coverage were frozen effective January 1, 2017 at January 1, 2016 established amount levels. Company contributions are funded to a Health Reimbursement Account on the retiree’s behalf to subsidize the retiree’s cost of obtaining health care benefits through a private exchange (the “post-65 retiree health benefits”). Therefore, a 1% change in health care cost trend rates would not have a material impact on either the service and interest cost components and the postretirement benefit obligations.
In the fourth quarter of 2018, we terminated the post-65 retiree health benefits effective as of December 31, 2020. The post-65 retiree health benefits will no longer be provided after that date. In addition, the pre-65 retiree medical coverage subsidy has been frozen as of January 1, 2019, and the ability for retirees to opt in and out of this coverage, as well as pre-65 retiree dental and vision coverage, has also been eliminated. Retirees must enroll in connection with retirement for such coverage, or they lose eligibility. These plan changes reduced our retiree medical benefit obligation by approximately
$99 million
.
Plan investment policies and strategies
– The investment policies for our U.S. and international pension plan assets reflect the funded status of the plans and expectations regarding our future ability to make further contributions. Long-term investment goals are to: (1) manage the assets in accordance with applicable legal requirements; (2) produce investment returns which meet or exceed the rates of return achievable in the capital markets while maintaining the risk parameters set by the plan's investment committees and protecting the assets from any erosion of purchasing power; and (3) position the portfolios with a long-term risk/return orientation. Investment performance and risk is measured and monitored on an ongoing basis through quarterly investment meetings and periodic asset and liability studies.
U.S. plan
– The plan’s current targeted asset allocation is comprised of
55%
equity securities and
45%
other fixed income securities. Over time, as the plan’s funded ratio (as defined by the investment policy) improves, in order to reduce volatility in returns and to better match the plan’s liabilities, the allocation to equity securities will decrease while the amount allocated to fixed income securities will increase. The plan's assets are managed by a third-party investment manager.
International plan
– Our international plan's target asset allocation is comprised of
55%
equity securities and
45%
fixed income securities. The plan assets are invested in ten separate portfolios, mainly pooled fund vehicles, managed by several professional investment managers whose performance is measured independently by a third-party asset servicing consulting firm.
Fair value measurements
– Plan assets are measured at fair value. The following provides a description of the valuation techniques employed for each major plan asset class at
December 31, 2018
and
2017
.
Cash and cash equivalents
–
Cash and cash equivalents are valued using a market approach and are considered Level 1.
Equity securities
–
Investments in common stock are valued using a market approach at the closing price reported in an active market and are therefore considered Level 1. Private equity investments include interests in limited partnerships which are valued based on the sum of the estimated fair values of the investments held by each partnership, determined using a combination of market, income and cost approaches, plus working capital, adjusted for liabilities, currency translation and estimated performance incentives. These private equity investments are considered Level 3. Investments in pooled funds are valued using a market approach, these various funds consist of equity with underlying investments held in U.S. and non-U.S. securities. The pooled funds are benchmarked against a relative public index and are considered Level 2.
91
MARATHON OIL CORPORATION
Notes to Consolidated Financial Statements
Fixed income securities
– Fixed income securities are valued using a market approach. U.S. treasury notes and exchange traded funds ("ETFs") are valued at the closing price reported in an active market and are considered Level 1. Corporate bonds, private placements, and GNMA/FNMA/FHLMC pools are valued using calculated yield curves created by models that incorporate various market factors. Primarily investments are held in U.S. and non-U.S. corporate bonds in diverse industries and are considered Level 2. Other fixed income investments include futures contracts, real estate investment trusts, credit default, zero coupon, interest rate swaps. Investments in pooled funds are valued using a market approach, and primarily have investments held in U.S. and non-U.S. publicly traded investment grade government and corporate bonds and are considered Level 2.
Other
– Other investments are comprised of an unallocated annuity contract, two limited liability companies, and real estate. All are considered Level 3, as significant inputs to determine fair value are unobservable.
Commingled funds
– The investment in the commingled funds are valued using the net asset value of units held as a practical expedient. The commingled funds consist of equity and fixed income portfolios with underlying investments held in U.S. and non-U.S. securities.
The following tables present the fair values of our defined benefit pension plan's assets, by level within the fair value hierarchy, as of
December 31, 2018
and
2017
.
|
|
December 31, 2018
|
||||||||||||||||||||||||||||||
|
(In millions)
|
Level 1
|
Level 2
|
Level 3
|
Total
|
|||||||||||||||||||||||||||
|
|
U.S.
|
Int’l
|
U.S.
|
Int’l
|
U.S.
|
Int’l
|
U.S.
|
Int’l
|
|||||||||||||||||||||||
|
Cash and cash equivalents
(a)
|
$
|
(1
|
)
|
$
|
5
|
|
$
|
—
|
|
$
|
—
|
|
$
|
—
|
|
$
|
—
|
|
$
|
(1
|
)
|
$
|
5
|
|
|||||||
|
Equity securities:
|
|||||||||||||||||||||||||||||||
|
Common stock
|
75
|
|
—
|
|
—
|
|
—
|
|
—
|
|
—
|
|
75
|
|
—
|
|
|||||||||||||||
|
Private equity
|
—
|
|
—
|
|
—
|
|
—
|
|
14
|
|
—
|
|
14
|
|
—
|
|
|||||||||||||||
|
Pooled funds
|
—
|
|
—
|
|
—
|
|
191
|
|
—
|
|
—
|
|
—
|
|
191
|
|
|||||||||||||||
|
Fixed income securities:
|
|||||||||||||||||||||||||||||||
|
Corporate
|
—
|
|
—
|
|
4
|
|
—
|
|
—
|
|
—
|
|
4
|
|
—
|
|
|||||||||||||||
|
Government
|
22
|
|
—
|
|
9
|
|
—
|
|
3
|
|
—
|
|
34
|
|
—
|
|
|||||||||||||||
|
Pooled funds
|
—
|
|
—
|
|
—
|
|
398
|
|
—
|
|
—
|
|
—
|
|
398
|
|
|||||||||||||||
|
Other
|
—
|
|
—
|
|
—
|
|
—
|
|
17
|
|
—
|
|
17
|
|
—
|
|
|||||||||||||||
|
Total investments, at fair value
|
96
|
|
5
|
|
13
|
|
589
|
|
34
|
|
—
|
|
143
|
|
594
|
|
|||||||||||||||
|
Commingled funds
(b)
|
—
|
|
—
|
|
—
|
|
—
|
|
—
|
|
—
|
|
60
|
|
—
|
|
|||||||||||||||
|
Total investments
|
$
|
96
|
|
$
|
5
|
|
$
|
13
|
|
$
|
589
|
|
$
|
34
|
|
$
|
—
|
|
$
|
203
|
|
$
|
594
|
|
|||||||
|
|
December 31, 2017
|
||||||||||||||||||||||||||||||
|
(In millions)
|
Level 1
|
Level 2
|
Level 3
|
Total
|
|||||||||||||||||||||||||||
|
|
U.S.
|
Int’l
|
U.S.
|
Int’l
|
U.S.
|
Int’l
|
U.S.
|
Int’l
|
|||||||||||||||||||||||
|
Cash and cash equivalents
|
$
|
6
|
|
$
|
1
|
|
$
|
—
|
|
$
|
—
|
|
$
|
—
|
|
$
|
—
|
|
$
|
6
|
|
$
|
1
|
|
|||||||
|
Equity securities:
|
|||||||||||||||||||||||||||||||
|
Common stock
|
81
|
|
—
|
|
—
|
|
—
|
|
—
|
|
—
|
|
81
|
|
—
|
|
|||||||||||||||
|
Private equity
|
—
|
|
—
|
|
—
|
|
—
|
|
16
|
|
—
|
|
16
|
|
—
|
|
|||||||||||||||
|
Pooled funds
|
—
|
|
—
|
|
—
|
|
266
|
|
—
|
|
—
|
|
—
|
|
266
|
|
|||||||||||||||
|
Fixed income securities:
|
|||||||||||||||||||||||||||||||
|
Corporate
|
—
|
|
—
|
|
6
|
|
—
|
|
—
|
|
—
|
|
6
|
|
—
|
|
|||||||||||||||
|
Exchange traded funds
|
5
|
|
—
|
|
—
|
|
—
|
|
—
|
|
—
|
|
5
|
|
—
|
|
|||||||||||||||
|
Government
|
19
|
|
—
|
|
2
|
|
—
|
|
3
|
|
—
|
|
24
|
|
—
|
|
|||||||||||||||
|
Pooled funds
|
—
|
|
—
|
|
—
|
|
403
|
|
—
|
|
—
|
|
—
|
|
403
|
|
|||||||||||||||
|
Other
|
—
|
|
—
|
|
—
|
|
—
|
|
19
|
|
—
|
|
19
|
|
—
|
|
|||||||||||||||
|
Total investments, at fair value
|
111
|
|
1
|
|
8
|
|
669
|
|
38
|
|
—
|
|
157
|
|
670
|
|
|||||||||||||||
|
Commingled funds
(b)
|
—
|
|
—
|
|
—
|
|
—
|
|
—
|
|
—
|
|
59
|
|
—
|
|
|||||||||||||||
|
Total investments
|
$
|
111
|
|
$
|
1
|
|
$
|
8
|
|
$
|
669
|
|
$
|
38
|
|
$
|
—
|
|
$
|
216
|
|
$
|
670
|
|
|||||||
|
(a)
|
The negative cash balance was due to the timing of when investment trades occur and when they settle.
|
92
MARATHON OIL CORPORATION
Notes to Consolidated Financial Statements
|
(b)
|
After the adoption of the FASB update for the fair value hierarchy, we separately report the investments for which fair value was measured using the net asset value per share as a practical expedient. Amounts presented in this table are intended to reconcile the fair value hierarchy to the pension plan assets. See Note 2 for further information on the FASB update.
|
The activity during the year ended
December 31, 2018
and
2017
, for the assets using Level 3 fair value measurements was immaterial.
Cash flows
Estimated future benefit payments
– The following gross benefit payments, which were estimated based on actuarial assumptions applied at December 31,
2018
and reflect expected future services, as appropriate, are to be paid in the years indicated.
|
|
Pension Benefits
|
Other Benefits
|
|||||||||
|
(In millions)
|
U.S.
|
Int’l
|
U.S.
|
||||||||
|
2019
|
$
|
38
|
|
$
|
18
|
|
$
|
18
|
|
||
|
2020
|
34
|
|
18
|
|
18
|
|
|||||
|
2021
|
31
|
|
20
|
|
9
|
|
|||||
|
2022
|
29
|
|
21
|
|
8
|
|
|||||
|
2023
|
27
|
|
23
|
|
7
|
|
|||||
|
2024 through 2028
|
114
|
|
127
|
|
27
|
|
|||||
Contributions to defined benefit plans
– We expect to make contributions to the funded pension plans of up to
$50 million
in
2019
. Cash contributions to be paid from our general assets for the unfunded pension and postretirement plans are expected to be approximately
$5 million
and
$18 million
in
2019
.
Contributions to defined contribution plans
– We contribute to several defined contribution plans for eligible employees. Contributions to these plans totaled
$22 million
,
$20 million
and
$20 million
in
2018
,
2017
and
2016
.
19
. Reclassifications Out of Accumulated Other Comprehensive Income (Loss)
The following table presents a summary of amounts reclassified from accumulated other comprehensive income (loss):
|
Year Ended December 31,
|
|||||||||
|
(In millions)
|
2018
|
2017
|
Income Statement Line
|
||||||
|
Postretirement and postemployment plans
|
|||||||||
|
Amortization of prior service credit
|
$
|
18
|
|
$
|
17
|
|
Other net periodic benefit costs
|
||
|
Amortization of actuarial loss
|
(12
|
)
|
(9
|
)
|
Other net periodic benefit costs
|
||||
|
Net settlement loss
|
(21
|
)
|
(32
|
)
|
Other net periodic benefit costs
|
||||
|
Derivative hedges
|
|||||||||
|
Recognized gain on terminated derivative hedge
|
—
|
|
46
|
|
Net interest and other
|
||||
|
Ineffective portion of derivative hedge
|
—
|
|
1
|
|
Net interest and other
|
||||
|
(15
|
)
|
23
|
|
Income (loss) from continuing operations before income taxes
|
|||||
|
1
|
|
(40
|
)
|
(Provision) benefit for income taxes
|
|||||
|
Total reclassifications to expense, net of tax
|
$
|
(14
|
)
|
$
|
(17
|
)
|
Income (loss) from continuing operations
|
||
|
Foreign currency hedges
|
|||||||||
|
Net recognized loss in discontinued operations, net of tax
|
—
|
|
(30
|
)
|
Income (loss) from discontinued operations
|
||||
|
Total reclassifications to expense
|
$
|
(14
|
)
|
$
|
(47
|
)
|
Net income (loss)
|
||
93
MARATHON OIL CORPORATION
Notes to Consolidated Financial Statements
20
. Supplemental Cash Flow Information
|
Year Ended December 31,
|
|||||||||||
|
(In millions)
|
2018
|
2017
|
2016
|
||||||||
|
Net cash used in operating activities:
|
|||||||||||
|
Interest paid, net of amounts capitalized
|
$
|
(270
|
)
|
$
|
(379
|
)
|
$
|
(375
|
)
|
||
|
Income taxes paid to taxing authorities
(a)
|
(323
|
)
|
(391
|
)
|
(84
|
)
|
|||||
|
Noncash investing activities, related to continuing operations:
|
|||||||||||
|
Increase (decrease) asset retirement costs
|
$
|
(183
|
)
|
$
|
(202
|
)
|
$
|
110
|
|
||
|
Asset retirement obligations assumed by buyer
|
(82
|
)
|
14
|
|
40
|
|
|||||
|
Notes receivable for disposition of assets
|
—
|
|
748
|
|
—
|
|
|||||
(a)
2017 includes a payment of
$108 million
made to the U.K. tax authorities to preserve our appeal rights, see
Note 25
for additional discussion.
Other noncash investing activities include accrued capital expenditures as of December 31, 2018, 2017 and 2016 of
$250 million
,
$329 million
and
$155 million
.
21
. Other Items
Net interest and other
|
Year Ended December 31,
|
|||||||||||
|
(In millions)
|
2018
|
2017
|
2016
|
||||||||
|
Interest:
|
|||||||||||
|
Interest income
|
$
|
32
|
|
$
|
34
|
|
$
|
14
|
|
||
|
Interest expense
|
(280
|
)
|
(380
|
)
|
(398
|
)
|
|||||
|
Income on interest rate swaps
|
—
|
|
53
|
|
13
|
|
|||||
|
Interest capitalized
|
—
|
|
3
|
|
18
|
|
|||||
|
Total interest
|
(248
|
)
|
(290
|
)
|
(353
|
)
|
|||||
|
Other:
|
|||||||||||
|
Net foreign currency gain (loss)
|
9
|
|
8
|
|
6
|
|
|||||
|
Other
|
13
|
|
12
|
|
15
|
|
|||||
|
Total other
|
22
|
|
20
|
|
21
|
|
|||||
|
Net interest and other
|
$
|
(226
|
)
|
$
|
(270
|
)
|
$
|
(332
|
)
|
||
Foreign currency
– Aggregate foreign currency gains (losses) were included in the consolidated statements of income as follows:
|
Year Ended December 31,
|
|||||||||||
|
(In millions)
|
2018
|
2017
|
2016
|
||||||||
|
Net interest and other
|
$
|
9
|
|
$
|
8
|
|
$
|
6
|
|
||
|
Provision for income taxes
|
10
|
|
57
|
|
(32
|
)
|
|||||
|
Aggregate foreign currency gains (losses)
|
$
|
19
|
|
$
|
65
|
|
$
|
(26
|
)
|
||
94
MARATHON OIL CORPORATION
Notes to Consolidated Financial Statements
22
. Equity Method Investments
During
2018
,
2017
and
2016
our equity method investees were considered related parties and included:
|
•
|
EGHoldings, in which we have a
60%
noncontrolling interest. EGHoldings is engaged in LNG production activity.
|
•
Alba Plant LLC, in which we have a
52%
noncontrolling interest. Alba Plant LLC processes LPG.
|
•
|
AMPCO, in which we have a
45%
interest. AMPCO is engaged in methanol production activity.
|
Our equity method investments are summarized in the following table:
|
|
Ownership as of
|
December 31,
|
|||||||
|
(In millions)
|
December 31, 2018
|
2018
|
2017
|
||||||
|
EGHoldings
|
60%
|
$
|
402
|
|
$
|
456
|
|
||
|
Alba Plant LLC
|
52%
|
167
|
|
214
|
|
||||
|
AMPCO
|
45%
|
176
|
|
177
|
|
||||
|
Total
|
|
$
|
745
|
|
$
|
847
|
|
||
Dividends and partnership distributions received from equity method investees (excluding distributions that represented a return of capital previously contributed) were
$270 million
in
2018
,
$276 million
in
2017
and
$192 million
in
2016
.
Summarized financial information for equity method investees is as follows:
|
(In millions)
|
2018
|
2017
|
2016
|
||||||||
|
Income data – year:
(a)
|
|||||||||||
|
Revenues and other income
|
$
|
1,269
|
|
$
|
1,294
|
|
$
|
770
|
|
||
|
Income from operations
|
588
|
|
631
|
|
346
|
|
|||||
|
Net income
|
459
|
|
508
|
|
313
|
|
|||||
|
Balance sheet data – December 31:
|
|||||||||||
|
Current assets
|
$
|
559
|
|
$
|
586
|
|
|||||
|
Noncurrent assets
|
931
|
|
1,044
|
|
|||||||
|
Current liabilities
|
253
|
|
221
|
|
|||||||
|
Noncurrent liabilities
|
87
|
|
94
|
|
|||||||
|
(a)
|
See
Item 15 Exhibits
, Financial Statement Schedules which contains the Alba Plant LLC unaudited financial statements, which have been included pursuant to Rule 3-09 of Regulation S-X.
|
Revenues from related parties were
$48 million
,
$60 million
and
$54 million
in
2018
,
2017
and
2016
, with the majority related to EGHoldings in all years. We had
no
purchases from related parties in 2018 and
$132 million
and
$103 million
in
2017
and
2016
with the majority related to Alba Plant LLC in all years.
Current receivables from related parties at December 31,
2018
and
2017
, were
$25 million
and
$24 million
with the majority related to EGHoldings. Payables to related parties were
$15 million
and
$14 million
at December 31,
2018
and
2017
, with the majority related to Alba Plant LLC.
23
. Stockholders’ Equity
During 2018 we acquired
36 million
of common shares at a cost of
$700 million
under our share repurchase program. As of
December 31, 2018
the total remaining share repurchase authorization was
$800 million
. Purchases under the program are made at our discretion and may be in either open market transactions, including block purchases, or in privately negotiated transactions using cash on hand, cash generated from operations, proceeds from potential asset sales or cash from available borrowings to acquire shares. This program may be changed based upon our financial condition or changes in market conditions and is subject to termination prior to completion. The repurchase program does not include specific price targets or timetables.
Shares repurchased as of
December 31, 2018
were held as treasury stock. There were
no
share repurchases during 2017 under our publicly announced plans or programs.
95
MARATHON OIL CORPORATION
Notes to Consolidated Financial Statements
24
. Leases
We lease a wide variety of facilities and equipment under operating leases, including land, building space, equipment and vehicles. Most long-term leases include renewal options and, in certain leases, purchase options. Future minimum commitments for operating lease obligations having noncancellable lease terms in excess of one year are as follows:
|
(In millions)
|
Operating Lease Obligations
|
||
|
2019
|
$
|
62
|
|
|
2020
|
54
|
|
|
|
2021
|
35
|
|
|
|
2022
|
12
|
|
|
|
2023
|
5
|
|
|
|
Later years
|
49
|
|
|
|
Sublease rentals
|
—
|
|
|
|
Total minimum lease payments
|
$
|
217
|
|
*
Future minimum commitments for capital lease obligations are
nil
as of December 31,
2018
.
Operating lease rental expense related to continuing operations was
$99 million
,
$87 million
and
$87 million
in
2018
,
2017
and
2016
.
25
. Commitments and Contingencies
The U.K. tax authorities have challenged the timing of deductibility for certain Brae area decommissioning costs, which we claimed for U.K. corporation tax purposes. The dispute relates to the timing of the deduction and does not dispute the general deductibility of decommissioning costs. In the fourth quarter of 2017, we received notification from the U.K.’s First-tier Tribunal that the decommissioning cost deductions, which we had claimed, were not allowable. In accordance with U.K. regulations, in the fourth quarter of 2017, we paid the amount of tax and interest in question, approximately
$108 million
, prior to our appeal. In the first quarter of 2019 we withdrew our appeal on this matter, the resulting revisions to current and deferred tax liabilities are expected to have no cumulative adverse earnings impact on our consolidated results of operations. See
Note 8
for further detail.
We are continuously undergoing examination of our U.S. federal income tax returns by the IRS. These audits have been completed through the 2014 tax year, except for tax years 2010 and 2011. During the third quarter of 2017, we received a partnership adjustment notification related to the 2010 and 2011 tax years, for which we have filed a Tax Court Petition in the fourth quarter of 2017. We believe that it is more likely than not that we will prevail. See
Note 8
for further detail.
We are a defendant in a number of legal and administrative proceedings arising in the ordinary course of business including, but not limited to, royalty claims, contract claims, tax disputes and environmental claims. While the ultimate outcome and impact to us cannot be predicted with certainty, we believe the resolution of these proceedings will not have a material adverse effect on our consolidated financial position, results of operations or cash flows. Certain of these matters are discussed below.
Environmental matters
– We have incurred and will continue to incur capital, operating and maintenance, and remediation expenditures as a result of environmental laws and regulations. If these expenditures, as with all costs, are not ultimately offset by the prices we receive for our products and services, our operating results will be adversely affected. We believe that substantially all of our competitors must comply with similar environmental laws and regulations. However, the specific impact on each competitor may vary depending on a number of factors, including the age and location of its operating facilities, marketing areas and production processes. These laws generally provide for control of pollutants released into the environment and require responsible parties to undertake remediation of hazardous waste disposal sites. Penalties may be imposed for noncompliance.
At
December 31, 2018
and
2017
, accrued liabilities for remediation were not material. It is not presently possible to estimate the ultimate amount of all remediation costs that might be incurred or the penalties that may be imposed.
Guarantees
–
Over the years, we have sold various assets in the normal course of our business. Certain of the related agreements contain performance and general guarantees, including guarantees regarding inaccuracies in representations, warranties, covenants and agreements, and environmental and general indemnifications that require us to perform upon the occurrence of a triggering event or condition. These guarantees and indemnifications are part of the normal course of selling assets. We are typically not able to calculate the maximum potential amount of future payments that could be made under such
96
MARATHON OIL CORPORATION
Notes to Consolidated Financial Statements
contractual provisions because of the variability inherent in the guarantees and indemnities. Most often, the nature of the guarantees and indemnities is such that there is no appropriate method for quantifying the exposure because the underlying triggering event has little or no past experience upon which a reasonable prediction of the outcome can be based.
Contract commitments
–
At
December 31, 2018
and
2017
, contractual commitments to acquire property, plant and equipment totaled
$57 million
and
$102 million
.
In connection with the sale of our operated producing properties in the greater Ewing Bank area and non-operated producing interests in the Petronius and Neptune fields in the Gulf of Mexico, we retained an overriding royalty interest in the properties. As part of the sale agreement, proceeds associated with the production of our override, up to
$70 million
, are dedicated solely to the satisfaction of the corresponding future abandonment obligations of the properties. The term of our override ends once sales proceeds equal
$70 million
.
97
Select Quarterly Financial Data (Unaudited)
|
|
2018
|
2017
|
|||||||||||||||||||||||||||||
|
(In millions, except per share data)
|
1st Qtr.
|
2nd Qtr.
|
3rd Qtr.
|
4th Qtr.
|
1st Qtr.
|
2nd Qtr.
|
3rd Qtr.
|
4th Qtr.
|
|||||||||||||||||||||||
|
Revenues from contracts with customers
|
$
|
1,537
|
|
$
|
1,447
|
|
$
|
1,538
|
|
$
|
1,380
|
|
$
|
873
|
|
$
|
902
|
|
$
|
1,136
|
|
$
|
1,336
|
|
|||||||
|
Income (loss) from continuing operations before income taxes
(a)(b)
|
524
|
|
140
|
|
357
|
|
406
|
|
(16
|
)
|
(112
|
)
|
(458
|
)
|
132
|
|
|||||||||||||||
|
Income (loss) from continuing operations
|
356
|
|
96
|
|
254
|
|
390
|
|
(50
|
)
|
(153
|
)
|
(599
|
)
|
(28
|
)
|
|||||||||||||||
|
Discontinued operations
(c)
|
—
|
|
—
|
|
—
|
|
—
|
|
(4,907
|
)
|
14
|
|
—
|
|
—
|
|
|||||||||||||||
|
Net income (loss)
|
$
|
356
|
|
$
|
96
|
|
$
|
254
|
|
$
|
390
|
|
$
|
(4,957
|
)
|
$
|
(139
|
)
|
$
|
(599
|
)
|
$
|
(28
|
)
|
|||||||
|
Income (loss) per basic share:
|
|||||||||||||||||||||||||||||||
|
Continuing operations
|
$
|
0.42
|
|
$
|
0.11
|
|
$
|
0.30
|
|
$
|
0.47
|
|
$
|
(0.06
|
)
|
$
|
(0.18
|
)
|
$
|
(0.70
|
)
|
$
|
(0.03
|
)
|
|||||||
|
Discontinued operations
(c)
|
$
|
—
|
|
$
|
—
|
|
$
|
—
|
|
$
|
—
|
|
$
|
(5.78
|
)
|
$
|
0.02
|
|
$
|
—
|
|
$
|
—
|
|
|||||||
|
Net income (loss)
|
$
|
0.42
|
|
$
|
0.11
|
|
$
|
0.30
|
|
$
|
0.47
|
|
$
|
(5.84
|
)
|
$
|
(0.16
|
)
|
$
|
(0.70
|
)
|
$
|
(0.03
|
)
|
|||||||
|
Dividends paid per share
|
$
|
0.05
|
|
$
|
0.05
|
|
$
|
0.05
|
|
$
|
0.05
|
|
$
|
0.05
|
|
$
|
0.05
|
|
$
|
0.05
|
|
$
|
0.05
|
|
|||||||
|
(a)
|
For 2018, includes unproved property impairments and exploratory dry well costs of $49 million in the fourth quarter of 2018. For 2017, includes impairments to proved properties of $201 million and $24 million in the third quarter and fourth quarter, respectively. Also includes unproved property impairments and exploratory dry well costs of $215 million in the third quarter of 2017. (See Item 8. Financial Statements and Supplementary Data –
Note 11
to the consolidated financial statements).
|
|
(b)
|
The fourth quarter of 2018 includes a mark-to-market gain on commodity derivatives of $336 million. Additionally, the first quarter of 2018 includes a gain on sale of our Libya subsidiary of
$255 million
. (See Item 8. Financial Statements and Supplementary Data –
Note 5
to the consolidated financial statements).
|
|
(c)
|
We closed on the sale of our Canadian business in the second quarter of 2017. The Canadian business is reflected as discontinued operations in all periods presented. Included in the first quarter of 2017 is an after-tax non-cash impairment charge of
$4.96 billion
, primarily related to the property, plant, and equipment.
|
98
Supplementary Information on Oil and Gas Producing Activities (Unaudited)
The supplementary information is disclosed by the following geographic areas: the U.S.; E.G.; Libya; and Other International ("Other Int’l"), which includes the U.K., Gabon and the Kurdistan Region of Iraq. We closed on the sale of our subsidiary, Marathon Oil Libya Limited, in 2018 and have not reflected this business as discontinued operations ("Disc Ops") in the periods presented. We closed the sale of our Canada business in 2017 and have reflected this business as Disc Ops in 2017 and 2016. See
Note 5
for further details on dispositions.
Preparation of Reserve Estimates
All estimates of reserves are made in compliance with SEC Rule 4-10 of Regulation S-X. Crude oil and condensate, NGL, natural gas and our historical synthetic crude oil reserve estimates are reviewed and approved by our Corporate Reserves Group ("CRG"), which includes our Director of Corporate Reserves and his staff of Reserve Coordinators. Crude oil and condensate, NGLs and natural gas reserve estimates are developed or reviewed by Qualified Reserves Estimators ("QREs"). QREs are petro-technical professionals located throughout our organization who meet the qualifications we have established for employees engaged in estimating reserves and resources. QREs have the education, experience, and training necessary to estimate reserves and resources in a manner consistent with all external reserve estimation regulations and internal resource estimation directives and practices. QREs generally hold at least a Bachelor of Science degree in the appropriate technical field, have a minimum of three years of industry experience with at least one year in reserve estimation and have completed our QRE training course. All reserves changes (including proved) must be approved by the CRG. Additionally, any change to proved reserve estimates in excess of 5 mmboe on a total field basis, within a single month, must be approved by the Director of Corporate Reserves.
The Director of Corporate Reserves, who reports to our Chief Financial Officer, has a Bachelor of Science degree in petroleum engineering and is a registered Professional Engineer in the State of New Mexico. In his 32 years with Marathon Oil, he has held numerous engineering and management positions, including managing reservoir engineering and geoscience for our Eagle Ford development in South Texas. He is a 25 year member of the Society of Petroleum Engineers ("SPE").
Technologies used in proved reserves estimation includes statistical analysis of production performance, decline curve analysis, pressure and rate transient analysis, pressure gradient analysis, reservoir simulation and volumetric analysis. The observed statistical nature of production performance coupled with highly certain reservoir continuity or quality within the reliable technology areas and sufficient proved developed locations establish the reasonable certainty criteria required for booking proved reserves.
Audits of Estimates
We engage third-party consultants to provide, at a minimum, independent estimates for fields that comprise 80% of our total proved reserves over a rolling four-year period. We exceeded this percentage for the four-year period ended
December 31, 2018
, with 94% of our total proved reserves independently audited. An audit tolerance at a field level of +/- 10% to our internal estimates has been established. Should the third-party consultants’ initial analysis fall outside our tolerance band, both parties will re-examine the information provided, request additional data and refine their analysis, if appropriate. In the very limited instances where differences outside the 10% tolerance cannot be resolved by year end, a plan to resolve the difference is developed and executive management consent is obtained. The audit process did not result in any significant changes to our reserve estimates for
2018
,
2017
or
2016
.
For the year ended December 31, 2016, Netherland, Sewell & Associates, Inc. prepared a reserves certification for the Alba field in E.G. The NSAI summary report is filed as an exhibit to this Annual Report on Form 10-K. Members of the NSAI team have multiple years of industry experience, having worked for large, international oil and gas companies before joining NSAI. NSAI’s technical team members meet or exceed the education, training, and experience requirements set forth in the Standards Pertaining to the Estimating and Auditing of Oil and Gas Reserves Information promulgated by the Society of Petroleum Engineers. The senior technical advisor has over 14 years of practical experience in petroleum engineering and the estimation and evaluation of reserves and is a registered Professional Engineer in the State of Texas. The second team member has over 12 years of practical experience in petroleum geosciences and is a licensed Professional Geoscientist in the State of Texas.
Ryder Scott Company also performed audits of the prior years' reserves for several of our fields in
2018
,
2017
and
2016
. Their summary reports are filed as exhibits to this Annual Report on Form 10-K. The team lead for Ryder Scott has over 36 years of industry experience, having worked for a major financial advisory services group before joining Ryder Scott. He is a 25 year member of SPE and is a registered Professional Engineer in the State of Texas.
99
Supplementary Information on Oil and Gas Producing Activities (Unaudited)
Estimated
Quantities of Proved Oil and Gas Reserves
The estimation of net recoverable quantities of crude oil and condensate, natural gas liquids, natural gas and our historical synthetic crude oil is a highly technical process which is based upon several underlying assumptions that are subject to change. Proved reserves are determined using "SEC Pricing", calculated as an unweighted arithmetic average of the first-day-of-the-month closing price for each month. See
Item 1A. Risk Factors
and
Item 7. Management’s Discussion and Analysis of Financial Condition and Results of Operations – Critical Accounting Estimates
for the table providing our
2018
SEC pricing of benchmark prices and the underlying assumptions used.
The table below provides the
2018
SEC pricing for certain benchmark prices:
|
2018 SEC Pricing
|
|||
|
WTI Crude oil (per bbl)
|
$
|
65.56
|
|
|
Henry Hub natural gas (per mmbtu)
|
$
|
3.05
|
|
|
Brent crude oil (per bbl)
|
$
|
72.70
|
|
|
Mont Belvieu NGLs (per bbl)
|
$
|
26.63
|
|
100
Supplementary Information on Oil and Gas Producing Activities (Unaudited)
Estimated Quantities of Proved Oil and Gas Reserves
|
(mmbbl)
|
U.S.
|
E.G.
(a)
|
Libya
|
Other Int'l
|
Cont Ops
|
Disc Ops
|
Total
|
|||||||||||||
|
Crude oil and condensate
|
||||||||||||||||||||
|
Proved developed and undeveloped reserves:
|
||||||||||||||||||||
|
Beginning of year - 2016
|
580
|
|
52
|
|
201
|
|
22
|
|
855
|
|
—
|
|
855
|
|
||||||
|
Revisions of previous estimates
|
55
|
|
1
|
|
(28
|
)
|
3
|
|
31
|
|
—
|
|
31
|
|
||||||
|
Improved recovery
|
4
|
|
—
|
|
—
|
|
—
|
|
4
|
|
—
|
|
4
|
|
||||||
|
Purchases of reserves in place
|
12
|
|
—
|
|
—
|
|
—
|
|
12
|
|
—
|
|
12
|
|
||||||
|
Extensions, discoveries and
other additions |
37
|
|
—
|
|
—
|
|
1
|
|
38
|
|
—
|
|
38
|
|
||||||
|
Production
|
(48
|
)
|
(8
|
)
|
(1
|
)
|
(4
|
)
|
(61
|
)
|
—
|
|
(61
|
)
|
||||||
|
Sales of reserves in place
|
(77
|
)
|
—
|
|
—
|
|
—
|
|
(77
|
)
|
—
|
|
(77
|
)
|
||||||
|
End of year - 2016
|
563
|
|
45
|
|
172
|
|
22
|
|
802
|
|
—
|
|
802
|
|
||||||
|
Revisions of previous estimates
|
9
|
|
(2
|
)
|
—
|
|
8
|
|
15
|
|
—
|
|
15
|
|
||||||
|
Improved recovery
|
—
|
|
—
|
|
—
|
|
—
|
|
—
|
|
—
|
|
—
|
|
||||||
|
Purchases of reserves in place
|
18
|
|
—
|
|
—
|
|
—
|
|
18
|
|
—
|
|
18
|
|
||||||
|
Extensions, discoveries and
other additions |
30
|
|
4
|
|
—
|
|
—
|
|
34
|
|
—
|
|
34
|
|
||||||
|
Production
|
(49
|
)
|
(8
|
)
|
(7
|
)
|
(4
|
)
|
(68
|
)
|
—
|
|
(68
|
)
|
||||||
|
Sales of reserves in place
|
(1
|
)
|
—
|
|
—
|
|
—
|
|
(1
|
)
|
—
|
|
(1
|
)
|
||||||
|
End of year - 2017
|
570
|
|
39
|
|
165
|
|
26
|
|
800
|
|
—
|
|
800
|
|
||||||
|
Revisions of previous estimates
|
49
|
|
3
|
|
—
|
|
3
|
|
55
|
|
—
|
|
55
|
|
||||||
|
Improved recovery
|
—
|
|
—
|
|
—
|
|
—
|
|
—
|
|
—
|
|
—
|
|
||||||
|
Purchases of reserves in place
|
—
|
|
—
|
|
—
|
|
—
|
|
—
|
|
—
|
|
—
|
|
||||||
|
Extensions, discoveries and
other additions |
42
|
|
—
|
|
—
|
|
2
|
|
44
|
|
—
|
|
44
|
|
||||||
|
Production
|
(63
|
)
|
(6
|
)
|
(3
|
)
|
(5
|
)
|
(77
|
)
|
—
|
|
(77
|
)
|
||||||
|
Sales of reserves in place
|
(3
|
)
|
—
|
|
(162
|
)
|
(1
|
)
|
(166
|
)
|
—
|
|
(166
|
)
|
||||||
|
End of year - 2018
|
595
|
|
36
|
|
—
|
|
25
|
|
656
|
|
—
|
|
656
|
|
||||||
|
Proved developed reserves:
|
||||||||||||||||||||
|
Beginning of year - 2016
|
327
|
|
25
|
|
173
|
|
16
|
|
541
|
|
—
|
|
541
|
|
||||||
|
End of year - 2016
|
238
|
|
45
|
|
172
|
|
13
|
|
468
|
|
—
|
|
468
|
|
||||||
|
End of year - 2017
|
263
|
|
39
|
|
165
|
|
17
|
|
484
|
|
—
|
|
484
|
|
||||||
|
End of year - 2018
|
287
|
|
36
|
|
—
|
|
22
|
|
345
|
|
—
|
|
345
|
|
||||||
|
Proved undeveloped reserves:
|
||||||||||||||||||||
|
Beginning of year - 2016
|
253
|
|
27
|
|
28
|
|
6
|
|
314
|
|
—
|
|
314
|
|
||||||
|
End of year - 2016
|
325
|
|
—
|
|
—
|
|
9
|
|
334
|
|
—
|
|
334
|
|
||||||
|
End of year - 2017
|
307
|
|
—
|
|
—
|
|
9
|
|
316
|
|
—
|
|
316
|
|
||||||
|
End of year - 2018
|
308
|
|
—
|
|
—
|
|
3
|
|
311
|
|
—
|
|
311
|
|
||||||
101
Supplementary Information on Oil and Gas Producing Activities (Unaudited)
Estimated Quantities of Proved Oil and Gas Reserves (continued)
|
(mmbbl)
|
U.S.
|
E.G.
(a)
|
Libya
|
Other Int'l
|
Cont Ops
|
Disc Ops
|
Total
|
|||||||||||||
|
Natural gas liquids
|
||||||||||||||||||||
|
Proved developed and undeveloped reserves:
|
||||||||||||||||||||
|
Beginning of year - 2016
|
172
|
|
28
|
|
—
|
|
—
|
|
200
|
|
—
|
|
200
|
|
||||||
|
Revisions of previous estimates
|
(8
|
)
|
—
|
|
—
|
|
—
|
|
(8
|
)
|
—
|
|
(8
|
)
|
||||||
|
Improved recovery
|
—
|
|
—
|
|
—
|
|
—
|
|
—
|
|
—
|
|
—
|
|
||||||
|
Purchases of reserves in place
|
12
|
|
—
|
|
—
|
|
—
|
|
12
|
|
—
|
|
12
|
|
||||||
|
Extensions, discoveries and
other additions |
11
|
|
—
|
|
—
|
|
—
|
|
11
|
|
—
|
|
11
|
|
||||||
|
Production
|
(14
|
)
|
(4
|
)
|
—
|
|
—
|
|
(18
|
)
|
—
|
|
(18
|
)
|
||||||
|
Sales of reserves in place
|
(3
|
)
|
—
|
|
—
|
|
—
|
|
(3
|
)
|
—
|
|
(3
|
)
|
||||||
|
End of year - 2016
|
170
|
|
24
|
|
—
|
|
—
|
|
194
|
|
—
|
|
194
|
|
||||||
|
Revisions of previous estimates
|
37
|
|
3
|
|
—
|
|
—
|
|
40
|
|
—
|
|
40
|
|
||||||
|
Improved recovery
|
—
|
|
—
|
|
—
|
|
—
|
|
—
|
|
—
|
|
—
|
|
||||||
|
Purchases of reserves in place
|
5
|
|
—
|
|
—
|
|
—
|
|
5
|
|
—
|
|
5
|
|
||||||
|
Extensions, discoveries and
other additions |
34
|
|
2
|
|
—
|
|
—
|
|
36
|
|
—
|
|
36
|
|
||||||
|
Production
|
(16
|
)
|
(4
|
)
|
—
|
|
—
|
|
(20
|
)
|
—
|
|
(20
|
)
|
||||||
|
Sales of reserves in place
|
(1
|
)
|
—
|
|
—
|
|
—
|
|
(1
|
)
|
—
|
|
(1
|
)
|
||||||
|
End of year - 2017
|
229
|
|
25
|
|
—
|
|
—
|
|
254
|
|
—
|
|
254
|
|
||||||
|
Revisions of previous estimates
|
(9
|
)
|
1
|
|
—
|
|
—
|
|
(8
|
)
|
—
|
|
(8
|
)
|
||||||
|
Improved recovery
|
—
|
|
—
|
|
—
|
|
—
|
|
—
|
|
—
|
|
—
|
|
||||||
|
Purchases of reserves in place
|
—
|
|
—
|
|
—
|
|
—
|
|
—
|
|
—
|
|
—
|
|
||||||
|
Extensions, discoveries and
other additions |
25
|
|
—
|
|
—
|
|
—
|
|
25
|
|
—
|
|
25
|
|
||||||
|
Production
|
(20
|
)
|
(4
|
)
|
—
|
|
—
|
|
(24
|
)
|
—
|
|
(24
|
)
|
||||||
|
Sales of reserves in place
|
(1
|
)
|
—
|
|
—
|
|
—
|
|
(1
|
)
|
—
|
|
(1
|
)
|
||||||
|
End of year - 2018
|
224
|
|
22
|
|
—
|
|
—
|
|
246
|
|
—
|
|
246
|
|
||||||
|
Proved developed reserves:
|
||||||||||||||||||||
|
Beginning of year - 2016
|
92
|
|
12
|
|
—
|
|
—
|
|
104
|
|
—
|
|
104
|
|
||||||
|
End of year - 2016
|
78
|
|
24
|
|
—
|
|
—
|
|
102
|
|
—
|
|
102
|
|
||||||
|
End of year - 2017
|
118
|
|
25
|
|
—
|
|
—
|
|
143
|
|
—
|
|
143
|
|
||||||
|
End of year - 2018
|
119
|
|
22
|
|
—
|
|
—
|
|
141
|
|
—
|
|
141
|
|
||||||
|
Proved undeveloped reserves:
|
||||||||||||||||||||
|
Beginning of year - 2016
|
80
|
|
16
|
|
—
|
|
—
|
|
96
|
|
—
|
|
96
|
|
||||||
|
End of year - 2016
|
92
|
|
—
|
|
—
|
|
—
|
|
92
|
|
—
|
|
92
|
|
||||||
|
End of year - 2017
|
111
|
|
—
|
|
—
|
|
—
|
|
111
|
|
—
|
|
111
|
|
||||||
|
End of year - 2018
|
105
|
|
—
|
|
—
|
|
—
|
|
105
|
|
—
|
|
105
|
|
||||||
102
Supplementary Information on Oil and Gas Producing Activities (Unaudited)
Estimated Quantities of Proved Oil and Gas Reserves (continued)
|
(bcf)
|
U.S.
|
E.G.
(a)
|
Libya
|
Other Int'l
|
Cont Ops
|
Disc Ops
|
Total
|
|||||||||||||
|
Natural gas
|
||||||||||||||||||||
|
Proved developed and undeveloped reserves:
|
||||||||||||||||||||
|
Beginning of year - 2016
|
1,151
|
|
1,090
|
|
206
|
|
15
|
|
2,462
|
|
—
|
|
2,462
|
|
||||||
|
Revisions of previous estimates
|
145
|
|
8
|
|
(1
|
)
|
3
|
|
155
|
|
—
|
|
155
|
|
||||||
|
Improved recovery
|
—
|
|
—
|
|
—
|
|
—
|
|
—
|
|
—
|
|
—
|
|
||||||
|
Purchases of reserves in place
|
61
|
|
—
|
|
—
|
|
—
|
|
61
|
|
—
|
|
61
|
|
||||||
|
Extensions, discoveries and
other additions |
71
|
|
—
|
|
—
|
|
—
|
|
71
|
|
—
|
|
71
|
|
||||||
|
Production
(b)
|
(115
|
)
|
(155
|
)
|
—
|
|
(8
|
)
|
(278
|
)
|
—
|
|
(278
|
)
|
||||||
|
Sales of reserves in place
|
(25
|
)
|
—
|
|
—
|
|
—
|
|
(25
|
)
|
—
|
|
(25
|
)
|
||||||
|
End of year - 2016
|
1,288
|
|
943
|
|
205
|
|
10
|
|
2,446
|
|
—
|
|
2,446
|
|
||||||
|
Revisions of previous estimates
|
(33
|
)
|
(18
|
)
|
—
|
|
4
|
|
(47
|
)
|
—
|
|
(47
|
)
|
||||||
|
Improved recovery
|
—
|
|
—
|
|
—
|
|
—
|
|
—
|
|
—
|
|
—
|
|
||||||
|
Purchases of reserves in place
|
36
|
|
—
|
|
—
|
|
—
|
|
36
|
|
—
|
|
36
|
|
||||||
|
Extensions, discoveries and
other additions |
204
|
|
76
|
|
—
|
|
—
|
|
280
|
|
—
|
|
280
|
|
||||||
|
Production
(b)
|
(127
|
)
|
(168
|
)
|
(1
|
)
|
(6
|
)
|
(302
|
)
|
—
|
|
(302
|
)
|
||||||
|
Sales of reserves in place
|
(44
|
)
|
—
|
|
—
|
|
—
|
|
(44
|
)
|
—
|
|
(44
|
)
|
||||||
|
End of year - 2017
|
1,324
|
|
833
|
|
204
|
|
8
|
|
2,369
|
|
—
|
|
2,369
|
|
||||||
|
Revisions of previous estimates
|
188
|
|
35
|
|
—
|
|
4
|
|
227
|
|
—
|
|
227
|
|
||||||
|
Improved recovery
|
—
|
|
—
|
|
—
|
|
—
|
|
—
|
|
—
|
|
—
|
|
||||||
|
Purchases of reserves in place
|
—
|
|
—
|
|
—
|
|
—
|
|
—
|
|
—
|
|
—
|
|
||||||
|
Extensions, discoveries and
other additions |
198
|
|
—
|
|
—
|
|
—
|
|
198
|
|
—
|
|
198
|
|
||||||
|
Production
(b)
|
(156
|
)
|
(153
|
)
|
(1
|
)
|
(5
|
)
|
(315
|
)
|
—
|
|
(315
|
)
|
||||||
|
Sales of reserves in place
|
(1
|
)
|
—
|
|
(203
|
)
|
—
|
|
(204
|
)
|
—
|
|
(204
|
)
|
||||||
|
End of year - 2018
|
1,553
|
|
715
|
|
—
|
|
7
|
|
2,275
|
|
—
|
|
2,275
|
|
||||||
|
Proved developed reserves:
|
||||||||||||||||||||
|
Beginning of year - 2016
|
640
|
|
552
|
|
94
|
|
11
|
|
1,297
|
|
—
|
|
1,297
|
|
||||||
|
End of year - 2016
|
648
|
|
943
|
|
95
|
|
5
|
|
1,691
|
|
—
|
|
1,691
|
|
||||||
|
End of year - 2017
|
726
|
|
833
|
|
94
|
|
2
|
|
1,655
|
|
—
|
|
1,655
|
|
||||||
|
End of year - 2018
|
869
|
|
715
|
|
—
|
|
7
|
|
1,591
|
|
—
|
|
1,591
|
|
||||||
|
Proved undeveloped reserves:
|
||||||||||||||||||||
|
Beginning of year - 2016
|
511
|
|
538
|
|
112
|
|
4
|
|
1,165
|
|
—
|
|
1,165
|
|
||||||
|
End of year - 2016
|
640
|
|
—
|
|
110
|
|
5
|
|
755
|
|
—
|
|
755
|
|
||||||
|
End of year - 2017
|
598
|
|
—
|
|
110
|
|
6
|
|
714
|
|
—
|
|
714
|
|
||||||
|
End of year - 2018
|
684
|
|
—
|
|
—
|
|
—
|
|
684
|
|
—
|
|
684
|
|
||||||
103
Supplementary Information on Oil and Gas Producing Activities (Unaudited)
Estimated Quantities of Proved Oil and Gas Reserves (continued)
|
(mmbbl)
|
U.S.
|
E.G.
(a)
|
Libya
|
Other Int'l
|
Cont Ops
|
Disc Ops
|
Total
|
|||||||||||||
|
Synthetic crude oil
|
||||||||||||||||||||
|
Proved developed and undeveloped reserves:
|
||||||||||||||||||||
|
Beginning of year - 2016
|
—
|
|
—
|
|
—
|
|
—
|
|
—
|
|
698
|
|
698
|
|
||||||
|
Revisions of previous estimates
|
—
|
|
—
|
|
—
|
|
—
|
|
—
|
|
12
|
|
12
|
|
||||||
|
Improved recovery
|
—
|
|
—
|
|
—
|
|
—
|
|
—
|
|
—
|
|
—
|
|
||||||
|
Purchases of reserves in place
|
—
|
|
—
|
|
—
|
|
—
|
|
—
|
|
—
|
|
—
|
|
||||||
|
Extensions, discoveries and
other additions |
—
|
|
—
|
|
—
|
|
—
|
|
—
|
|
—
|
|
—
|
|
||||||
|
Production
|
—
|
|
—
|
|
—
|
|
—
|
|
—
|
|
(18
|
)
|
(18
|
)
|
||||||
|
Sales of reserves in place
|
—
|
|
—
|
|
—
|
|
—
|
|
—
|
|
—
|
|
—
|
|
||||||
|
End of year - 2016
|
—
|
|
—
|
|
—
|
|
—
|
|
—
|
|
692
|
|
692
|
|
||||||
|
Revisions of previous estimates
|
—
|
|
—
|
|
—
|
|
—
|
|
—
|
|
—
|
|
—
|
|
||||||
|
Improved recovery
|
—
|
|
—
|
|
—
|
|
—
|
|
—
|
|
—
|
|
—
|
|
||||||
|
Purchases of reserves in place
|
—
|
|
—
|
|
—
|
|
—
|
|
—
|
|
—
|
|
—
|
|
||||||
|
Extensions, discoveries and
other additions |
—
|
|
—
|
|
—
|
|
—
|
|
—
|
|
—
|
|
—
|
|
||||||
|
Production
|
—
|
|
—
|
|
—
|
|
—
|
|
—
|
|
(7
|
)
|
(7
|
)
|
||||||
|
Sales of reserves in place
|
—
|
|
—
|
|
—
|
|
—
|
|
—
|
|
(685
|
)
|
(685
|
)
|
||||||
|
End of year - 2017
|
—
|
|
—
|
|
—
|
|
—
|
|
—
|
|
—
|
|
—
|
|
||||||
|
Revisions of previous estimates
|
—
|
|
—
|
|
—
|
|
—
|
|
—
|
|
—
|
|
—
|
|
||||||
|
Improved recovery
|
—
|
|
—
|
|
—
|
|
—
|
|
—
|
|
—
|
|
—
|
|
||||||
|
Purchases of reserves in place
|
—
|
|
—
|
|
—
|
|
—
|
|
—
|
|
—
|
|
—
|
|
||||||
|
Extensions, discoveries and
other additions |
—
|
|
—
|
|
—
|
|
—
|
|
—
|
|
—
|
|
—
|
|
||||||
|
Production
|
—
|
|
—
|
|
—
|
|
—
|
|
—
|
|
—
|
|
—
|
|
||||||
|
Sales of reserves in place
|
—
|
|
—
|
|
—
|
|
—
|
|
—
|
|
—
|
|
—
|
|
||||||
|
End of year - 2018
|
—
|
|
—
|
|
—
|
|
—
|
|
—
|
|
—
|
|
—
|
|
||||||
|
Proved developed reserves:
|
||||||||||||||||||||
|
Beginning of year - 2016
|
—
|
|
—
|
|
—
|
|
—
|
|
—
|
|
698
|
|
698
|
|
||||||
|
End of year - 2016
|
—
|
|
—
|
|
—
|
|
—
|
|
—
|
|
692
|
|
692
|
|
||||||
|
End of year - 2017
|
—
|
|
—
|
|
—
|
|
—
|
|
—
|
|
—
|
|
—
|
|
||||||
|
End of year - 2018
|
—
|
|
—
|
|
—
|
|
—
|
|
—
|
|
—
|
|
—
|
|
||||||
|
Proved undeveloped reserves:
|
||||||||||||||||||||
|
Beginning of year - 2016
|
—
|
|
—
|
|
—
|
|
—
|
|
—
|
|
—
|
|
—
|
|
||||||
|
End of year - 2016
|
—
|
|
—
|
|
—
|
|
—
|
|
—
|
|
—
|
|
—
|
|
||||||
|
End of year - 2017
|
—
|
|
—
|
|
—
|
|
—
|
|
—
|
|
—
|
|
—
|
|
||||||
|
End of year - 2018
|
—
|
|
—
|
|
—
|
|
—
|
|
—
|
|
—
|
|
—
|
|
||||||
104
Supplementary Information on Oil and Gas Producing Activities (Unaudited)
Estimated Quantities of Proved Oil and Gas Reserves (continued)
|
(mmboe)
|
U.S.
|
E.G.
(a)
|
Libya
|
Other Int'l
|
Cont Ops
|
Disc Ops
|
Total
|
|||||||||||||
|
Total Proved Reserves
|
||||||||||||||||||||
|
Proved developed and undeveloped reserves:
|
||||||||||||||||||||
|
Beginning of year - 2016
|
944
|
|
261
|
|
235
|
|
25
|
|
1,465
|
|
698
|
|
2,163
|
|
||||||
|
Revisions of previous estimates
|
73
|
|
2
|
|
(28
|
)
|
4
|
|
51
|
|
12
|
|
63
|
|
||||||
|
Improved recovery
|
4
|
|
—
|
|
—
|
|
—
|
|
4
|
|
—
|
|
4
|
|
||||||
|
Purchases of reserves in place
|
34
|
|
—
|
|
—
|
|
—
|
|
34
|
|
—
|
|
34
|
|
||||||
|
Extensions, discoveries and
other additions |
59
|
|
—
|
|
—
|
|
1
|
|
60
|
|
—
|
|
60
|
|
||||||
|
Production
(b)
|
(82
|
)
|
(37
|
)
|
(1
|
)
|
(6
|
)
|
(126
|
)
|
(18
|
)
|
(144
|
)
|
||||||
|
Sales of reserves in place
|
(84
|
)
|
—
|
|
—
|
|
—
|
|
(84
|
)
|
—
|
|
(84
|
)
|
||||||
|
End of year - 2016
|
948
|
|
226
|
|
206
|
|
24
|
|
1,404
|
|
692
|
|
2,096
|
|
||||||
|
Revisions of previous estimates
|
42
|
|
(1
|
)
|
—
|
|
8
|
|
49
|
|
—
|
|
49
|
|
||||||
|
Improved recovery
|
—
|
|
—
|
|
—
|
|
—
|
|
—
|
|
—
|
|
—
|
|
||||||
|
Purchases of reserves in place
|
28
|
|
—
|
|
—
|
|
—
|
|
28
|
|
—
|
|
28
|
|
||||||
|
Extensions, discoveries and
other additions |
98
|
|
18
|
|
—
|
|
—
|
|
116
|
|
—
|
|
116
|
|
||||||
|
Production
(b)
|
(86
|
)
|
(40
|
)
|
(7
|
)
|
(5
|
)
|
(138
|
)
|
(7
|
)
|
(145
|
)
|
||||||
|
Sales of reserves in place
|
(10
|
)
|
—
|
|
—
|
|
—
|
|
(10
|
)
|
(685
|
)
|
(695
|
)
|
||||||
|
End of year - 2017
|
1,020
|
|
203
|
|
199
|
|
27
|
|
1,449
|
|
—
|
|
1,449
|
|
||||||
|
Revisions of previous estimates
|
71
|
|
8
|
|
—
|
|
5
|
|
84
|
|
—
|
|
84
|
|
||||||
|
Improved recovery
|
—
|
|
—
|
|
—
|
|
—
|
|
—
|
|
—
|
|
—
|
|
||||||
|
Purchases of reserves in place
|
—
|
|
—
|
|
|
|
—
|
|
—
|
|
—
|
|
—
|
|
||||||
|
Extensions, discoveries and
other additions |
100
|
|
—
|
|
—
|
|
2
|
|
102
|
|
—
|
|
102
|
|
||||||
|
Production
(b)
|
(109
|
)
|
(35
|
)
|
(3
|
)
|
(6
|
)
|
(153
|
)
|
—
|
|
(153
|
)
|
||||||
|
Sales of reserves in place
|
(4
|
)
|
—
|
|
(196
|
)
|
(1
|
)
|
(201
|
)
|
—
|
|
(201
|
)
|
||||||
|
End of year - 2018
|
1,078
|
|
176
|
|
—
|
|
27
|
|
1,281
|
|
—
|
|
1,281
|
|
||||||
|
Proved developed reserves:
|
||||||||||||||||||||
|
Beginning of year - 2016
|
526
|
|
129
|
|
189
|
|
18
|
|
862
|
|
698
|
|
1,560
|
|
||||||
|
End of year - 2016
|
424
|
|
226
|
|
188
|
|
14
|
|
852
|
|
692
|
|
1,544
|
|
||||||
|
End of year - 2017
|
502
|
|
203
|
|
181
|
|
17
|
|
903
|
|
—
|
|
903
|
|
||||||
|
End of year - 2018
|
552
|
|
176
|
|
—
|
|
24
|
|
752
|
|
—
|
|
752
|
|
||||||
|
Proved undeveloped reserves:
|
||||||||||||||||||||
|
Beginning of year - 2016
|
418
|
|
132
|
|
46
|
|
7
|
|
603
|
|
—
|
|
603
|
|
||||||
|
End of year - 2016
|
524
|
|
—
|
|
18
|
|
10
|
|
552
|
|
—
|
|
552
|
|
||||||
|
End of year - 2017
|
518
|
|
—
|
|
18
|
|
10
|
|
546
|
|
—
|
|
546
|
|
||||||
|
End of year - 2018
|
526
|
|
—
|
|
—
|
|
3
|
|
529
|
|
—
|
|
529
|
|
||||||
|
(a)
|
Consists of estimated reserves from properties governed by production sharing contracts.
|
|
(b)
|
Excludes the resale of purchased natural gas used in reservoir management.
|
105
Supplementary Information on Oil and Gas Producing Activities (Unaudited)
2018
proved reserves decreased by
168
mmboe primarily due to the following:
|
•
|
Revisions of previous estimates:
Increased by
84
mmboe including an increase of 108 mmboe associated with the acceleration of higher economic wells in the U.S. resource plays into the 5-year plan and an increase of 15 mmboe associated with wells to sales that were additions to the plan, partially offset by a decrease of 39 mmboe due to technical revisions across the business.
|
|
•
|
Extensions, discoveries, and other additions:
Increased by
102
mmboe primarily in the U.S. resource plays due to an increase of 69 mmboe associated with the expansion of proved areas and an increase of 33 mmboe associated with wells to sales from unproved categories.
|
|
•
|
Production:
Decreased by
153
mmboe.
|
|
•
|
Sales of reserves in place:
Decreased by
201
mmboe including
196
mmboe associated with the sale of our subsidiary in Libya,
4
mmboe associated with divestitures of certain conventional assets in New Mexico and Michigan, and
1
mmboe associated with the sale of the Sarsang block in Kurdistan.
|
2017
proved reserves decreased by
647
mmboe primarily due to the following:
|
•
|
Revisions of previous estimates:
Increased by 49 mmboe primarily due to the acceleration of higher economic wells in the Bakken into the 5-year plan resulting in an increase of 44 mmboe, with the remainder being due to revisions across the business.
|
|
•
|
Extensions, discoveries, and other additions:
Increased by 116 mmboe primarily due to an increase of 97 mmboe associated with the expansion of proved areas and wells to sales from unproved categories in Oklahoma.
|
|
•
|
Purchases of reserves in place:
Increased by 28 mmboe from acquisitions of assets in the Northern Delaware Basin in New Mexico.
|
|
•
|
Production:
Decreased by 145 mmboe.
|
|
•
|
Sales of reserves in place:
Decreased by 695 mmboe including 685 mmboe associated with the sale of our Canadian business and 10 mmboe associated with divestitures of certain conventional assets in Oklahoma and Colorado. See Item 8. Financial Statements and Supplementary Data -
Note 5
to the consolidated financial statements for information regarding these dispositions.
|
2016
proved reserves decreased by
67
mmboe primarily due to the following:
|
•
|
Revisions of previous estimates:
Increased by 63 mmboe primarily due to an increase of 151 mmboe associated with the acceleration of higher economic wells in the U.S. resource plays into the 5-year plan and a decrease of 64 mmboe due to U.S. technical revisions.
|
|
•
|
Extensions, discoveries, and other additions:
Increased by 60 mmboe primarily associated with the expansion of proved areas and new wells to sales from unproven categories in Oklahoma.
|
|
•
|
Purchases of reserves in place:
Increased by 34 mmboe from acquisition of STACK assets in Oklahoma.
|
|
•
|
Production:
Decreased by 144 mmboe.
|
|
•
|
Sales of reserves in place:
Decreased by 84 mmboe associated with the divestitures of certain Wyoming and Gulf of Mexico assets.
|
Changes in Proved Undeveloped Reserves
As of
December 31, 2018
,
529
mmboe of proved undeveloped reserves were reported, a decrease of
17
mmboe from
December 31, 2017
. The following table shows changes in proved undeveloped reserves for
2018
:
|
(mmboe)
|
||
|
Beginning of year
|
546
|
|
|
Revisions of previous estimates
|
47
|
|
|
Extensions, discoveries, and other additions
|
61
|
|
|
Dispositions
|
(19
|
)
|
|
Transfers to proved developed
|
(106
|
)
|
|
End of year
|
529
|
|
106
Supplementary Information on Oil and Gas Producing Activities (Unaudited)
Revisions of prior estimates.
Increased by
47
mmboe due to an increase of 108 mmboe associated with the acceleration of higher economic wells in the U.S. resource plays into the 5-year plan partially offset by a decrease of 61 mmboe due to technical revisions across the business.
Extensions, discoveries and other additions.
Increased by
61
mmboe due to the expansion of proved areas in the U.S. resource plays.
Transfers to proved developed.
106
mmboe of PUD reserves were converted to proved developed status during
2018
, primarily from assets in our U.S. resource plays. This
2018
transfer equates to a 19% PUD conversion rate and a 5-year average annual PUD conversion rate during the 2014-2018 period of 18%. All proved undeveloped reserve drilling locations are scheduled to be drilled prior to the end of 2023. There are no proved undeveloped reserves on the books beyond 5 years as of
December 31, 2018
.
Costs Incurred & Future Costs to Develop
Costs incurred in
2018
,
2017
and
2016
relating to the development of proved undeveloped reserves were
$1,082 million
,
$842 million
and
$359 million
. As of
December 31, 2018
, future development costs estimated to be required for the development of proved undeveloped crude oil and condensate, NGLs and natural gas reserves for the years
2019
through
2023
are projected to be $1,541 million, $1,595 million, $1,737 million, $1,398 million and $1,116 million.
Capitalized Costs and Accumulated Depreciation, Depletion and Amortization
(a)
Includes unproved property impairments (see
Note 11
).
|
(In millions)
|
U.S.
|
E.G.
|
Libya
|
Other Int'l
|
Total
|
||||||||||||||
|
Year Ended December 31, 2018
|
|||||||||||||||||||
|
Capitalized Costs:
|
|||||||||||||||||||
|
Proved properties
|
$
|
27,983
|
|
$
|
2,041
|
|
$
|
—
|
|
$
|
4,828
|
|
$
|
34,852
|
|
||||
|
Unproved properties
|
2,977
|
|
11
|
|
—
|
|
—
|
|
2,988
|
|
|||||||||
|
Total
|
30,960
|
|
2,052
|
|
—
|
|
4,828
|
|
37,840
|
|
|||||||||
|
Accumulated depreciation, depletion and amortization:
|
|
||||||||||||||||||
|
Proved properties
|
14,742
|
|
1,471
|
|
—
|
|
4,706
|
|
20,919
|
|
|||||||||
|
Unproved properties
(a)
|
299
|
|
(7
|
)
|
—
|
|
—
|
|
292
|
|
|||||||||
|
Total
|
15,041
|
|
1,464
|
|
—
|
|
4,706
|
|
21,211
|
|
|||||||||
|
Net capitalized costs
|
$
|
15,919
|
|
$
|
588
|
|
$
|
—
|
|
$
|
122
|
|
$
|
16,629
|
|
||||
|
Year Ended December 31, 2017
|
|||||||||||||||||||
|
Capitalized Costs:
|
|
||||||||||||||||||
|
Proved properties
|
$
|
27,477
|
|
$
|
1,990
|
|
$
|
830
|
|
$
|
5,050
|
|
$
|
35,347
|
|
||||
|
Unproved properties
|
2,755
|
|
110
|
|
217
|
|
76
|
|
3,158
|
|
|||||||||
|
Total
|
30,232
|
|
2,100
|
|
1,047
|
|
5,126
|
|
38,505
|
|
|||||||||
|
Accumulated depreciation, depletion and amortization:
|
|
||||||||||||||||||
|
Proved properties
|
14,254
|
|
1,348
|
|
289
|
|
4,850
|
|
20,741
|
|
|||||||||
|
Unproved properties
(a)
|
206
|
|
—
|
|
—
|
|
76
|
|
282
|
|
|||||||||
|
Total
|
14,460
|
|
1,348
|
|
289
|
|
4,926
|
|
21,023
|
|
|||||||||
|
Net capitalized costs
|
$
|
15,772
|
|
$
|
752
|
|
$
|
758
|
|
$
|
200
|
|
$
|
17,482
|
|
||||
107
Supplementary Information on Oil and Gas Producing Activities (Unaudited)
Costs Incurred for Property Acquisition, Exploration and Development
(a)
|
(In millions)
|
U.S.
|
E.G.
|
Libya
|
Other Int'l
|
Cont Ops
|
Disc Ops
|
Total
|
||||||||||||||||||||
|
December 31, 2018
|
|||||||||||||||||||||||||||
|
Property acquisition:
|
|||||||||||||||||||||||||||
|
Proved
|
$
|
211
|
|
$
|
—
|
|
$
|
—
|
|
$
|
11
|
|
$
|
222
|
|
$
|
—
|
|
$
|
222
|
|
||||||
|
Unproved
|
144
|
|
—
|
|
—
|
|
—
|
|
144
|
|
—
|
|
144
|
|
|||||||||||||
|
Exploration
|
929
|
|
1
|
|
—
|
|
(9
|
)
|
921
|
|
—
|
|
921
|
|
|||||||||||||
|
Development
|
1,332
|
|
(2
|
)
|
—
|
|
(126
|
)
|
(b)
|
1,204
|
|
—
|
|
1,204
|
|
||||||||||||
|
Total
|
$
|
2,616
|
|
$
|
(1
|
)
|
$
|
—
|
|
$
|
(124
|
)
|
$
|
2,491
|
|
$
|
—
|
|
$
|
2,491
|
|
||||||
|
December 31, 2017
|
|||||||||||||||||||||||||||
|
Property acquisition:
|
|||||||||||||||||||||||||||
|
Proved
|
$
|
191
|
|
$
|
1
|
|
$
|
—
|
|
$
|
—
|
|
$
|
192
|
|
$
|
—
|
|
$
|
192
|
|
||||||
|
Unproved
|
1,746
|
|
—
|
|
—
|
|
1
|
|
1,747
|
|
—
|
|
1,747
|
|
|||||||||||||
|
Exploration
|
882
|
|
1
|
|
—
|
|
40
|
|
923
|
|
—
|
|
923
|
|
|||||||||||||
|
Development
|
1,122
|
|
5
|
|
10
|
|
(144
|
)
|
(b)
|
993
|
|
6
|
|
999
|
|
||||||||||||
|
Total
|
$
|
3,941
|
|
$
|
7
|
|
$
|
10
|
|
$
|
(103
|
)
|
$
|
3,855
|
|
$
|
6
|
|
$
|
3,861
|
|
||||||
|
December 31, 2016
|
|||||||||||||||||||||||||||
|
Property acquisition:
|
|||||||||||||||||||||||||||
|
Proved
|
$
|
276
|
|
$
|
—
|
|
$
|
—
|
|
$
|
—
|
|
$
|
276
|
|
$
|
—
|
|
$
|
276
|
|
||||||
|
Unproved
|
642
|
|
—
|
|
—
|
|
(10
|
)
|
632
|
|
—
|
|
632
|
|
|||||||||||||
|
Exploration
|
525
|
|
1
|
|
—
|
|
13
|
|
539
|
|
—
|
|
539
|
|
|||||||||||||
|
Development
|
456
|
|
55
|
|
3
|
|
121
|
|
(b)
|
635
|
|
31
|
|
666
|
|
||||||||||||
|
Total
|
$
|
1,899
|
|
$
|
56
|
|
$
|
3
|
|
$
|
124
|
|
$
|
2,082
|
|
$
|
31
|
|
$
|
2,113
|
|
||||||
|
(a)
|
Includes costs incurred whether capitalized or expensed.
|
|
(b)
|
Includes revisions to asset retirement costs primarily due to changes in U.K. estimated costs as well as timing of abandonment activities in the U.K.
|
108
Supplementary Information on Oil and Gas Producing Activities (Unaudited)
Results of Operations for Oil and Gas Producing Activities
|
U.S.
|
E.G.
|
Libya
|
Other Int'l
|
Cont Ops
|
Disc Ops
|
Total
|
|||||||||||||||||||||
|
Year Ended December 31, 2018
|
|||||||||||||||||||||||||||
|
Revenues and other income:
|
|||||||||||||||||||||||||||
|
Sales
|
$
|
4,842
|
|
$
|
383
|
|
$
|
196
|
|
$
|
402
|
|
$
|
5,823
|
|
$
|
—
|
|
$
|
5,823
|
|
||||||
|
Other income
(a)
|
81
|
|
—
|
|
255
|
|
104
|
|
440
|
|
—
|
|
440
|
|
|||||||||||||
|
Total revenues and other income
|
4,923
|
|
383
|
|
451
|
|
506
|
|
6,263
|
|
—
|
|
6,263
|
|
|||||||||||||
|
Expenses:
|
|
||||||||||||||||||||||||||
|
Production costs
|
(1,371
|
)
|
(68
|
)
|
(12
|
)
|
(180
|
)
|
(1,631
|
)
|
—
|
|
(1,631
|
)
|
|||||||||||||
|
Exploration expenses
(b)
|
(245
|
)
|
(51
|
)
|
—
|
|
7
|
|
(289
|
)
|
—
|
|
(289
|
)
|
|||||||||||||
|
Depreciation, depletion and amortization
(c)
|
(2,247
|
)
|
(117
|
)
|
(8
|
)
|
(102
|
)
|
(2,474
|
)
|
—
|
|
(2,474
|
)
|
|||||||||||||
|
Technical support and other
|
(49
|
)
|
(5
|
)
|
—
|
|
(6
|
)
|
(60
|
)
|
—
|
|
(60
|
)
|
|||||||||||||
|
Total expenses
|
(3,912
|
)
|
(241
|
)
|
(20
|
)
|
(281
|
)
|
(4,454
|
)
|
—
|
|
(4,454
|
)
|
|||||||||||||
|
Results before income taxes
|
1,011
|
|
142
|
|
431
|
|
225
|
|
1,809
|
|
—
|
|
1,809
|
|
|||||||||||||
|
Income tax provision
|
19
|
|
(38
|
)
|
(163
|
)
|
(124
|
)
|
(306
|
)
|
—
|
|
(306
|
)
|
|||||||||||||
|
Results of operations
|
$
|
1,030
|
|
$
|
104
|
|
$
|
268
|
|
$
|
101
|
|
$
|
1,503
|
|
$
|
—
|
|
$
|
1,503
|
|
||||||
|
Year Ended December 31, 2017
|
|
||||||||||||||||||||||||||
|
Revenues and other income:
|
|
||||||||||||||||||||||||||
|
Sales
|
$
|
3,050
|
|
$
|
45
|
|
$
|
431
|
|
$
|
282
|
|
$
|
3,808
|
|
$
|
423
|
|
$
|
4,231
|
|
||||||
|
Transfers
|
—
|
|
344
|
|
—
|
|
—
|
|
344
|
|
—
|
|
344
|
|
|||||||||||||
|
Other income
(a)
|
74
|
|
—
|
|
—
|
|
38
|
|
112
|
|
(43
|
)
|
69
|
|
|||||||||||||
|
Total revenues and other income
|
3,124
|
|
389
|
|
431
|
|
320
|
|
4,264
|
|
380
|
|
4,644
|
|
|||||||||||||
|
Expenses:
|
|
|
|||||||||||||||||||||||||
|
Production costs
|
(985
|
)
|
(84
|
)
|
(44
|
)
|
(152
|
)
|
(1,265
|
)
|
(272
|
)
|
(1,537
|
)
|
|||||||||||||
|
Exploration expenses
(b)
|
(153
|
)
|
—
|
|
—
|
|
(254
|
)
|
(407
|
)
|
—
|
|
(407
|
)
|
|||||||||||||
|
Depreciation, depletion and amortization
(c)
|
(2,105
|
)
|
(134
|
)
|
(21
|
)
|
(273
|
)
|
(2,533
|
)
|
(6,676
|
)
|
(9,209
|
)
|
|||||||||||||
|
Technical support and other
|
(28
|
)
|
(4
|
)
|
(4
|
)
|
(25
|
)
|
(61
|
)
|
—
|
|
(61
|
)
|
|||||||||||||
|
Total expenses
|
(3,271
|
)
|
(222
|
)
|
(69
|
)
|
(704
|
)
|
(4,266
|
)
|
(6,948
|
)
|
(11,214
|
)
|
|||||||||||||
|
Results before income taxes
|
(147
|
)
|
167
|
|
362
|
|
(384
|
)
|
(2
|
)
|
(6,568
|
)
|
(6,570
|
)
|
|||||||||||||
|
Income tax provision
|
(1
|
)
|
(50
|
)
|
(333
|
)
|
13
|
|
(371
|
)
|
1,674
|
|
1,303
|
|
|||||||||||||
|
Results of operations
|
$
|
(148
|
)
|
$
|
117
|
|
$
|
29
|
|
$
|
(371
|
)
|
$
|
(373
|
)
|
$
|
(4,894
|
)
|
$
|
(5,267
|
)
|
||||||
|
Year Ended December 31, 2016
|
|
||||||||||||||||||||||||||
|
Revenues and other income:
|
|
||||||||||||||||||||||||||
|
Sales
|
$
|
2,249
|
|
$
|
42
|
|
$
|
54
|
|
$
|
237
|
|
$
|
2,582
|
|
$
|
724
|
|
$
|
3,306
|
|
||||||
|
Transfers
|
—
|
|
291
|
|
—
|
|
—
|
|
291
|
|
—
|
|
291
|
|
|||||||||||||
|
Other income
(a)
|
387
|
|
—
|
|
—
|
|
2
|
|
389
|
|
—
|
|
389
|
|
|||||||||||||
|
Total revenues and other income
|
2,636
|
|
333
|
|
54
|
|
239
|
|
3,262
|
|
724
|
|
3,986
|
|
|||||||||||||
|
Expenses:
|
|
|
|||||||||||||||||||||||||
|
Production costs
|
(952
|
)
|
(81
|
)
|
(36
|
)
|
(140
|
)
|
(1,209
|
)
|
(544
|
)
|
(1,753
|
)
|
|||||||||||||
|
Exploration expenses
(b)
|
(306
|
)
|
(1
|
)
|
(6
|
)
|
(10
|
)
|
(323
|
)
|
(7
|
)
|
(330
|
)
|
|||||||||||||
|
Depreciation, depletion and amortization
(c)
|
(1,901
|
)
|
(114
|
)
|
(7
|
)
|
(132
|
)
|
(2,154
|
)
|
(239
|
)
|
(2,393
|
)
|
|||||||||||||
|
Technical support and other
|
(21
|
)
|
(4
|
)
|
—
|
|
(5
|
)
|
(30
|
)
|
(1
|
)
|
(31
|
)
|
|||||||||||||
|
Total expenses
|
(3,180
|
)
|
(200
|
)
|
(49
|
)
|
(287
|
)
|
(3,716
|
)
|
(791
|
)
|
(4,507
|
)
|
|||||||||||||
|
Results before income taxes
|
(544
|
)
|
133
|
|
5
|
|
(48
|
)
|
(454
|
)
|
(67
|
)
|
(521
|
)
|
|||||||||||||
|
Income tax provision
(d)
|
195
|
|
(26
|
)
|
(2
|
)
|
57
|
|
224
|
|
15
|
|
239
|
|
|||||||||||||
|
Results of operations
|
$
|
(349
|
)
|
$
|
107
|
|
$
|
3
|
|
$
|
9
|
|
$
|
(230
|
)
|
$
|
(52
|
)
|
$
|
(282
|
)
|
||||||
|
(a)
|
Includes net gain (loss) on dispositions (see
Note 5
) and revisions to asset retirement costs primarily due to changes in U.K. estimated costs as well as timing of abandonment activities in the U.K.
|
|
(b)
|
Includes exploratory dry well costs, unproved property impairments, and other (see
Note 11
).
|
|
(c)
|
Includes long-lived asset impairments (see
Note 11
).
|
(d)
Discontinued operations activity includes $135 million of deferred tax expense related to Alberta provincial corporate tax rate increase.
109
Supplementary Information on Oil and Gas Producing Activities (Unaudited)
Results of Operations for Oil and Gas Producing Activities
The following reconciles results of operations for oil and gas producing activities to segment income:
|
Year Ended December 31,
|
|||||||||||
|
(In millions)
|
2018
|
2017
|
2016
|
||||||||
|
Results of operations
|
$
|
1,503
|
|
$
|
(5,267
|
)
|
$
|
(282
|
)
|
||
|
Discontinued operations
|
—
|
|
4,894
|
|
52
|
|
|||||
|
Results of continuing operations
|
1,503
|
|
(373
|
)
|
(230
|
)
|
|||||
|
Items not included in results of oil and gas operations, net of tax:
|
|||||||||||
|
Marketing income and other non-oil and gas producing related activities
|
(170
|
)
|
(107
|
)
|
(39
|
)
|
|||||
|
Income from equity method investments
|
214
|
|
229
|
|
142
|
|
|||||
|
Items not allocated to segment income, net of tax:
|
|||||||||||
|
Loss (gain) on asset dispositions and other income
|
(304
|
)
|
(79
|
)
|
(248
|
)
|
|||||
|
Long-lived asset impairments
|
103
|
|
475
|
|
148
|
|
|||||
|
Unrealized loss (gain) on derivatives
|
(265
|
)
|
81
|
|
72
|
|
|||||
|
Deferred tax valuation allowance increase
|
—
|
|
—
|
|
(32
|
)
|
|||||
|
Segment income (loss)
|
$
|
1,081
|
|
$
|
226
|
|
$
|
(187
|
)
|
||
110
Supplementary Information on Oil and Gas Producing Activities (Unaudited)
Standardized Measure of Discounted Future Net Cash Flows Relating to Proved Reserves
U.S. GAAP prescribes guidelines for computing the standardized measure of future net cash flows and changes therein relating to estimated proved reserves, giving very specific assumptions to be made such as the use of a 10% discount rate and an unweighted average of commodity prices in the prior 12-month period using the closing prices on the first day of each month as well as current costs applicable at the date of the estimate. These and other required assumptions have not always proved accurate in the past, and other valid assumptions would give rise to substantially different results. In addition, the 10% discount rate required to be used is not necessarily the most appropriate discount factor based on our cost of capital and the risks associated with our business and the oil and natural gas industry in general. This information is not the fair value nor does it represent the expected present value of future cash flows of our crude oil and condensate, natural gas liquid, and natural gas reserves.
|
(In millions)
|
U.S.
|
E.G.
|
Libya
|
Other Int'l
|
Total
|
||||||||||||||
|
Year Ended December 31, 2018
|
|||||||||||||||||||
|
Future cash inflows
|
$
|
49,054
|
|
$
|
2,218
|
|
$
|
—
|
|
$
|
1,813
|
|
$
|
53,085
|
|
||||
|
Future production and support costs
|
(15,995
|
)
|
(878
|
)
|
—
|
|
(876
|
)
|
(17,749
|
)
|
|||||||||
|
Future development costs
|
(7,729
|
)
|
(12
|
)
|
—
|
|
(1,072
|
)
|
(8,813
|
)
|
|||||||||
|
Future income tax expenses
|
(1,967
|
)
|
(355
|
)
|
—
|
|
275
|
|
(2,047
|
)
|
|||||||||
|
Future net cash flows
|
$
|
23,363
|
|
$
|
973
|
|
$
|
—
|
|
$
|
140
|
|
(a)
|
$
|
24,476
|
|
|||
|
10% annual discount for timing of cash flows
|
(10,653
|
)
|
(254
|
)
|
—
|
|
100
|
|
(10,807
|
)
|
|||||||||
|
Standardized measure of discounted future net cash flows-
related to continuing operations
|
$
|
12,710
|
|
$
|
719
|
|
$
|
—
|
|
$
|
240
|
|
$
|
13,669
|
|
||||
|
Standardized measure of discounted future net cash flows-
related to discontinued operations
|
|
|
$
|
—
|
|
||||||||||||||
|
Year Ended December 31, 2017
|
|||||||||||||||||||
|
Future cash inflows
|
$
|
36,480
|
|
$
|
1,966
|
|
$
|
10,303
|
|
$
|
1,403
|
|
$
|
50,152
|
|
||||
|
Future production and support costs
|
(14,796
|
)
|
(748
|
)
|
(931
|
)
|
(821
|
)
|
(17,296
|
)
|
|||||||||
|
Future development costs
|
(6,987
|
)
|
(7
|
)
|
(501
|
)
|
(1,247
|
)
|
(8,742
|
)
|
|||||||||
|
Future income tax expenses
|
(786
|
)
|
(274
|
)
|
(8,387
|
)
|
496
|
|
(8,951
|
)
|
|||||||||
|
Future net cash flows
|
$
|
13,911
|
|
$
|
937
|
|
$
|
484
|
|
$
|
(169
|
)
|
(a)
|
$
|
15,163
|
|
|||
|
10% annual discount for timing of cash flows
|
(7,009
|
)
|
(235
|
)
|
(224
|
)
|
168
|
|
(7,300
|
)
|
|||||||||
|
Standardized measure of discounted future net cash flows-
related to continuing operations
|
$
|
6,902
|
|
$
|
702
|
|
$
|
260
|
|
$
|
(1
|
)
|
$
|
7,863
|
|
||||
|
Standardized measure of discounted future net cash flows-
related to discontinued operations
|
|
|
$
|
—
|
|
||||||||||||||
|
Year Ended December 31, 2016
|
|||||||||||||||||||
|
Future cash inflows
|
$
|
27,610
|
|
$
|
1,977
|
|
$
|
8,511
|
|
$
|
921
|
|
$
|
39,019
|
|
||||
|
Future production and support costs
|
(12,758
|
)
|
(824
|
)
|
(930
|
)
|
(673
|
)
|
(15,185
|
)
|
|||||||||
|
Future development costs
|
(7,233
|
)
|
(13
|
)
|
(296
|
)
|
(1,345
|
)
|
(8,887
|
)
|
|||||||||
|
Future income tax expenses
|
—
|
|
(251
|
)
|
(6,884
|
)
|
514
|
|
(6,621
|
)
|
|||||||||
|
Future net cash flows
|
$
|
7,619
|
|
$
|
889
|
|
$
|
401
|
|
$
|
(583
|
)
|
(a)
|
$
|
8,326
|
|
|||
|
10% annual discount for timing of cash flows
|
(4,355
|
)
|
(264
|
)
|
(143
|
)
|
313
|
|
(4,449
|
)
|
|||||||||
|
Standardized measure of discounted future net cash flows-
related to continuing operations
|
$
|
3,264
|
|
$
|
625
|
|
$
|
258
|
|
$
|
(270
|
)
|
$
|
3,877
|
|
||||
|
Standardized measure of discounted future net cash flows-
related to discontinued operations
|
|
|
$
|
1,076
|
|
||||||||||||||
|
(a)
|
Future cash flows for Other International reflects the impact of future abandonment costs related to the U.K.
|
111
Supplementary Information on Oil and Gas Producing Activities (Unaudited)
Changes in the Standardized Measure of Discounted Future Net Cash Flows
|
Year Ended December 31,
|
||||||||||||
|
(In millions)
|
2018
|
2017
|
2016
|
|||||||||
|
Sales and transfers of oil and gas produced, net of production and support costs
|
$
|
(4,135
|
)
|
$
|
(2,853
|
)
|
$
|
(1,634
|
)
|
|||
|
Net changes in prices and production and support costs related to future production
|
6,342
|
|
4,916
|
|
(3,621
|
)
|
(b)
|
|||||
|
Extensions, discoveries and improved recovery, less related costs
|
998
|
|
661
|
|
(2,174
|
)
|
||||||
|
Development costs incurred during the period
|
1,240
|
|
1,027
|
|
669
|
|
||||||
|
Changes in estimated future development costs
|
(330
|
)
|
183
|
|
2,534
|
|
||||||
|
Revisions of previous quantity estimates
(a)
|
(501
|
)
|
497
|
|
654
|
|
||||||
|
Net changes in purchases and sales of minerals in place
|
(3,035
|
)
|
102
|
|
(651
|
)
|
||||||
|
Accretion of discount
|
1,175
|
|
698
|
|
1,005
|
|
||||||
|
Net change in income taxes
|
4,052
|
|
(1,245
|
)
|
1,038
|
|
||||||
|
Net change for the year
|
5,806
|
|
3,986
|
|
(2,180
|
)
|
||||||
|
Beginning of the year related to continuing operations
|
7,863
|
|
3,877
|
|
6,057
|
|
||||||
|
End of the year related to continuing operations
|
$
|
13,669
|
|
$
|
7,863
|
|
$
|
3,877
|
|
|||
|
Net change for the year related to discontinued operations
|
$
|
—
|
|
$
|
—
|
|
$
|
911
|
|
|||
|
(a)
|
Includes amounts resulting from changes in the timing of production.
|
|
(b)
|
Decrease primarily due to lower realized prices.
|
112
Item 9. Changes in and Disagreements with Accountants on Accounting and Financial Disclosure
None.
Item 9A. Controls and Procedures
Disclosure Controls and Procedures
An evaluation of the effectiveness of the design and operation of our disclosure controls and procedures (as defined in Rules 13a-15(e) and 15d-15(e) under the Securities Exchange Act of 1934) was carried out under the supervision and with the participation of our management, including our Chief Executive Officer and Chief Financial Officer. As of the end of the period covered by this Report based upon that evaluation, the Chief Executive Officer and Chief Financial Officer concluded that the design and operation of these disclosure controls and procedures were effective as of
December 31, 2018
.
Management's Annual Report on Internal Control Over Financial Reporting
See "Management’s Report on Internal Control over Financial Reporting" under Item 8 of this Form 10-K.
Attestation Report of the Registered Public Accounting Firm
See "Report of Independent Registered Public Accounting Firm" under Item 8 of this Form 10-K.
Changes in Internal Control Over Financial Reporting
During the fourth quarter of
2018
, there were no changes in our internal control over financial reporting that have materially affected, or were reasonably likely to materially affect, our internal control over financial reporting.
Item 9B. Other Information
None.
113
PART III
Item 10. Directors, Executive Officers and Corporate Governance
Information required by this item is incorporated by reference to "Proposal 1: Election of Directors," "Corporate Governance—Committees of the Board" and "Section 16(a) Beneficial Ownership Reporting Compliance" in our Proxy Statement for the
2019
Annual Meeting of Stockholders, to be filed with the SEC within 120 days of December 31,
2018
(the "
2019
Proxy Statement").
See "Executive Officers of the Registrant" under Item 1 of this Form 10-K for information about our executive officers.
Our Code of Ethics for Senior Financial Officers, which applies to the Company’s principal executive officer, principal financial officer, principal accounting officer or controller, or persons performing similar functions, is available on our website at
www.marathonoil.com
under Investors—Corporate Governance. You may request a printed copy free of charge by sending a request to the Corporate Secretary. We intend to disclose any amendments and any waivers to our Code of Ethics for Senior Financial Officers on our website at
www.marathonoil.com
under Investors —Corporate Governance within four business days. The waiver information will remain on the website for at least 12 months after the initial disclosure of such waiver.
Item 11. Executive Compensation
Information required by this item is incorporated by reference to "Corporate Governance—Compensation Committee Interlocks and Insider Participation," "Compensation Committee Report," "Director Compensation," "Compensation Discussion and Analysis" and "Executive Compensation" in the
2019
Proxy Statement.
Item 12. Security Ownership of Certain Beneficial Owners and Management and Related Stockholder Matters
Portions of information required by this item are incorporated by reference to "Security Ownership of Certain Beneficial Owners and Management" in the
2019
Proxy Statement.
Securities Authorized for Issuance Under Equity Compensation Plans
The following table provides information as of
December 31, 2018
with respect to shares of Marathon Oil common stock that may be issued under our existing equity compensation plans:
|
•
|
Marathon Oil Corporation 2016 Incentive Compensation Plan (the "2016 Plan")
|
|
•
|
Marathon Oil Corporation 2012 Incentive Compensation Plan (the "2012 Plan") – No additional awards will be granted under this plan.
|
|
•
|
Marathon Oil Corporation 2007 Incentive Compensation Plan (the "2007 Plan") – No additional awards will be granted under this plan.
|
|
•
|
Marathon Oil Corporation 2003 Incentive Compensation Plan (the "2003 Plan") – No additional awards will be granted under this plan.
|
|
•
|
Deferred Compensation Plan for Non-Employee Directors – No additional awards will be granted under this plan.
|
|
Plan category
|
Number of securities to be issued upon
exercise of outstanding options, warrants and rights
|
|
Weighted-average
exercise price of
outstanding options,
warrants and rights
(c)
|
Number of securities
remaining available for future issuance
under equity compensation plans
|
||||||
|
Equity compensation plans approved by stockholders
|
7,650,574
|
|
(a)
|
$
|
25.54
|
|
32,802,084
|
|
(d)
|
|
|
Equity compensation plans not approved by stockholders
|
6,979
|
|
(b)
|
N/A
|
|
—
|
|
|
||
|
Total
|
7,657,553
|
|
|
N/A
|
|
32,802,084
|
|
|
||
|
(a)
|
Includes the following:
|
|
•
|
1,531,500
stock options outstanding under the 2016 Plan;
2,959,103
stock options outstanding under the 2012 Plan;
1,689,404
stock options outstanding under the 2007 Plan;
|
|
•
|
252,600
common stock units that have been credited to non-employee directors pursuant to the non-employee director deferred compensation program and the annual director stock award program established under the 2016 Plan, 2012 Plan, 2007 Plan and 2003 Plan. Common stock units credited under the 2016 Plan, 2012 Plan, 2007 Plan and 2003 Plan were
97,297
,
59,251
,
78,967
and
17,085
, respectively;
|
114
|
•
|
1,217,967
restricted stock units granted to non-officers under the 2012 Plan and 2016 Plan and outstanding as of
December 31, 2018
.
|
|
•
|
In addition to the awards reported above,
1,191,709
and
6,095,270
shares of restricted stock were issued and outstanding as of
December 31, 2018
, but subject to forfeiture restrictions under the 2012 and 2016 Plans, respectively.
|
|
(b)
|
Reflects awards of common stock units made to non-employee directors under the Deferred Compensation Plan for Non-Employee Directors prior to April 30, 2003. When a non-employee director leaves the Board, he or she will be issued actual shares of Marathon Oil common stock in place of the common stock units.
|
|
(c)
|
The weighted-average exercise prices do not take the restricted stock units or common stock units into account as these awards have no exercise price.
|
|
(d)
|
Reflects the shares available for issuance under the 2016 Plan. No more than
14,308,395
of these shares may be issued for awards other than stock options or stock appreciation rights. In addition, shares related to grants that are forfeited, terminated, canceled or expire unexercised shall again immediately become available for issuance.
|
The Deferred Compensation Plan for Non-Employee Directors is our only equity compensation plan that has not been approved by our stockholders. Our authority to make equity grants under this plan was terminated effective April 30, 2003. Under the Deferred Compensation Plan for Non-Employee Directors, all non-employee directors were required to defer half of their annual retainers in the form of common stock units. On the date the retainer would have otherwise been payable to the non-employee director, we credited an unfunded bookkeeping account for each non-employee director with a number of common stock units equal to half of his or her annual retainer divided by the fair market value of our common stock on that date. The ongoing value of each common stock unit equals the market price of a share of our common stock. When the non-employee director leaves the Board, he or she is issued actual shares of our common stock equal to the number of common stock units in his or her account at that time.
Item 13. Certain Relationships and Related Transactions, and Director Independence
Information required by this item is incorporated by reference to "Transactions with Related Persons," and "Proposal 1: Election of Directors—Director Independence" in the
2019
Proxy Statement.
Item 14. Principal Accountant Fees and Services
Information required by this item is incorporated by reference to "Proposal 2: Ratification of Independent Auditor for
2019
" in the
2019
Proxy Statement.
115
PART IV
Item 15. Exhibits, Financial Statement Schedules
A. Documents Filed as Part of the Report
1. Financial Statements – See Part II, Item 8. of this Annual Report on Form 10-K.
2. Financial Statement Schedules – The unaudited financial statements and related footnotes of Alba Plant LLC, our equity method investment, are being filed within Exhibit 99.9 in accordance with Rule 3-09 of Regulation S-X. All other financial statement schedules required under SEC rules but not included in this Annual Report on Form 10-K are omitted because they are not applicable or the required information is contained in the consolidated financial statements or notes thereto.
3. Exhibits – The information required by this Item 15 is incorporated by reference to the Exhibit Index accompanying this Annual Report on Form 10-K.
Item 16. Form 10-K Summary
None.
116
SIGNATURES
Pursuant to the requirements of Section 13 or 15(d) of the Securities Exchange Act of 1934, the registrant has duly caused this report to be signed on its behalf by the undersigned, thereunto duly authorized.
|
February 21, 2019
|
|
MARATHON OIL CORPORATION
|
|
|
By: /s/ GARY E. WILSON
|
|
|
|
Gary E. Wilson
|
|
|
Vice President, Controller and Chief Accounting Officer
|
||
POWER OF ATTORNEY
Each person whose signature appears below appoints Lee M. Tillman, Dane E. Whitehead, and Gary E. Wilson, and each of them, as his or her true and lawful attorneys-in-fact and agents, with full power of substitution and resubstitution, for him or her and in his or her name, place and stead, in any and all capacities, to sign any and all amendments to this Annual Report on Form 10-K, and to file the same, with all exhibits thereto, and other documents in connection therewith, with the Securities and Exchange Commission, with full power and authority to each of said attorneys-in-fact and agents to do and perform each and every act whatsoever that is necessary, appropriate or advisable in connection with any or all of the above-described matters and to all intents and purposes as he or she might or could do in person, hereby ratifying and confirming all that said attorneys-in-fact and agents or any of them or their substitutes, may lawfully do or cause to be done by virtue hereof.
Pursuant to the requirements of the Securities Exchange Act of 1934, this report has been signed below by the following persons on
February 21, 2019
on behalf of the registrant and in the capacities indicated.
|
Signature
|
|
Title
|
|
/s/ LEE M. TILLMAN
|
|
Chairman, President and Chief Executive Officer
|
|
Lee M. Tillman
|
||
|
/s/ DANE E. WHITEHEAD
|
|
Executive Vice President and Chief Financial Officer
|
|
Dane E. Whitehead
|
||
|
/s/ GARY E. WILSON
|
|
Vice President, Controller and Chief Accounting Officer
|
|
Gary E. Wilson
|
||
|
/s/ GREGORY H. BOYCE
|
|
Director
|
|
Gregory H. Boyce
|
||
|
/s/ CHADWICK C. DEATON
|
|
Director
|
|
Chadwick C. Deaton
|
||
|
/s/ MARCELA E. DONADIO
|
|
Director
|
|
Marcela E. Donadio
|
||
|
/s/ DOUGLAS L. FOSHEE
|
|
Director
|
|
Douglas L. Foshee
|
||
|
/s/ M.ELISE HYLAND
|
|
Director
|
|
M. Elise Hyland
|
||
117
Exhibit Index
|
Exhibit
|
|
Incorporated by Reference (File No. 001-05153, unless otherwise indicated)
|
||||||
|
Number
|
Exhibit Description
|
Form
|
Exhibit
|
Filing Date
|
||||
|
1
|
Underwriting Agreement
|
|||||||
|
1.1
|
10-K
|
1.1
|
2/22/2018
|
|||||
|
2
|
Plan of Acquisition, Reorganization, Arrangement, Liquidation or Succession
|
|||||||
|
2.1
|
10-Q
|
10.1
|
5/5/2017
|
|||||
|
3
|
Articles of Incorporation and By-laws
|
|||||||
|
3.1
|
8-K
|
3.1
|
6/1/2018
|
|||||
|
3.2
|
10-Q
|
3.2
|
8/4/2016
|
|||||
|
3.3
|
10-K
|
3.3
|
2/28/2014
|
|||||
|
4
|
Instruments Defining the Rights of Security Holders, Including Indentures
|
|||||||
|
4.1
|
10-K
|
4.2
|
2/28/2014
|
|||||
|
10
|
Material Contracts
|
|||||||
|
10.1
|
8-K
|
4.1
|
6/2/2014
|
|||||
|
10.2
|
10-Q
|
10.1
|
5/7/2015
|
|||||
|
10.3
|
8-K
|
99.1
|
3/8/2016
|
|||||
1
|
Exhibit
|
|
Incorporated by Reference (File No. 001-05153, unless otherwise indicated)
|
||||||
|
Number
|
Exhibit Description
|
Form
|
Exhibit
|
Filing Date
|
||||
|
10.4
|
8-K
|
99.1
|
6/23/2017
|
|||||
|
10.5
|
10-Q
|
10.2
|
8/3/2017
|
|||||
|
10.6
|
|
8-K
|
99.1
|
10/22/2018
|
||||
|
10.7
†
|
DEF 14A
|
App. A
|
4/7/2016
|
|||||
|
10.8†
|
8-K/A
|
10.1
|
10/6/2016
|
|||||
|
10.9†
|
10-K
|
10.6
|
2/24/2017
|
|||||
|
10.10†
|
10-K
|
10.7
|
2/24/2017
|
|||||
|
10.11†
|
10-K
|
10.8
|
2/24/2017
|
|||||
|
10.12†
|
10-K
|
10.9
|
2/24/2017
|
|||||
|
10.12†
|
10-K
|
10.12
|
2/22/2018
|
|||||
|
10.12†
|
10-K
|
10.13
|
2/22/2018
|
|||||
|
10.15
†
|
DEF 14A
|
App. III
|
3/8/2012
|
|||||
2
|
Exhibit
|
|
Incorporated by Reference (File No. 001-05153, unless otherwise indicated)
|
||||||
|
Number
|
Exhibit Description
|
Form
|
Exhibit
|
Filing Date
|
||||
|
10.16
†
|
8-K
|
10.1
|
8/1/2014
|
|||||
|
10.17†
|
10-Q
|
10.1
|
5/7/2014
|
|||||
|
10.18
†
|
10-Q
|
10.2
|
5/7/2014
|
|||||
|
10.19†
|
10-Q
|
10.1
|
11/6/2013
|
|||||
|
10.20†
|
10-K
|
10.5
|
2/22/2013
|
|||||
|
10.21†
|
10-K
|
10.6
|
2/22/2013
|
|||||
|
10.22†
|
10-K
|
10.7
|
2/22/2013
|
|||||
|
10.23†
|
10-K
|
10.8
|
2/22/2013
|
|||||
|
10.24
†
|
10-K
|
10.9
|
2/22/2013
|
|||||
|
10.25
†
|
10-K
|
10.10
|
2/22/2013
|
|||||
|
10.26
†
|
10-K
|
10.5
|
2/29/2012
|
|||||
|
10.27†
|
10-K
|
10.6
|
2/29/2012
|
|||||
|
10.28
†
|
10-K
|
10.5
|
2/28/2011
|
|||||
|
10.29†
|
10-K
|
10.26
|
2/26/2010
|
|||||
|
10.30†
|
10-K
|
10.9
|
2/26/2010
|
|||||
|
10.31†
|
10-K
|
10.29
|
2/24/2017
|
|||||
|
10.32†
|
10-K
|
10.32
|
2/29/2012
|
|||||
|
10.33†
|
10-K
|
10.31
|
2/29/2012
|
|||||
|
10.34†
|
10-K
|
10.33
|
2/22/2018
|
|||||
|
10.35
†
|
10-K
|
10.10
|
2/28/2011
|
|||||
|
10.36
†
|
10-K
|
10.32
|
2/27/2009
|
|||||
3
|
Exhibit
|
|
Incorporated by Reference (File No. 001-05153, unless otherwise indicated)
|
||||||
|
Number
|
Exhibit Description
|
Form
|
Exhibit
|
Filing Date
|
||||
|
10.37
|
8-K
|
10.1
|
5/26/2011
|
|||||
|
21.1*
|
||||||||
|
23.1*
|
||||||||
|
23.2*
|
||||||||
|
23.3*
|
||||||||
|
23.4*
|
||||||||
|
31.1*
|
||||||||
|
31.2*
|
||||||||
|
32.1*
|
||||||||
|
32.2*
|
||||||||
|
99.1*
|
||||||||
|
99.2*
|
||||||||
|
99.3
|
10-K
|
99.3
|
2/22/2018
|
|||||
|
99.4
|
10-K
|
99.4
|
2/22/2018
|
|||||
|
99.5
|
|
10-K
|
99.3
|
2/24/2017
|
||||
|
99.6
|
10-K
|
99.2
|
2/22/2018
|
|||||
|
99.7
|
10-K
|
99.7
|
2/22/2018
|
|||||
|
99.9*
|
||||||||
|
101.INS*
|
XBRL Instance Document
|
|||||||
|
101.SCH*
|
XBRL Taxonomy Extension Schema
|
|||||||
|
101.CAL*
|
XBRL Taxonomy Extension Calculation Linkbase
|
|||||||
|
101.PRE*
|
XBRL Taxonomy Extension Presentation Linkbase
|
|||||||
|
101.LAB*
|
XBRL Taxonomy Extension Label Linkbase
|
|||||||
|
101.DEF*
|
XBRL Taxonomy Extension Definition Linkbase
|
|
|
|
||||
|
*
|
Filed herewith.
|
|||||||
|
†
|
Management contract or compensatory plan or arrangement.
|
|||||||
4
TABLE OF CONTENTS
Part IItem 1. BusinessItem 1A. Risk FactorsItem 1B. Unresolved Staff CommentsItem 2. PropertiesItem 3. Legal ProceedingsItem 4. Mine Safety DisclosuresPart IIItem 5. Market For Registrant S Common Equity, Related Stockholder Matters and Issuer Purchases Of Equity SecuritiesItem 6. Selected Financial DataItem 7. Management S Discussion and Analysis Of Financial Condition and Results Of OperationsItem 8. Financial Statements and Supplementary DataItem 7A. Quantitative and Qualitative Disclosures About Market RiskItem 9. Changes in and Disagreements with Accountants on Accounting and Financial DisclosureItem 9A. Controls and ProceduresItem 9B. Other InformationPart IIIItem 10. Directors, Executive Officers and Corporate GovernanceItem 11. Executive CompensationItem 12. Security Ownership Of Certain Beneficial Owners and Management and Related Stockholder MattersItem 13. Certain Relationships and Related Transactions, and Director IndependenceItem 14. Principal Accountant Fees and ServicesPart IVItem 15. Exhibits, Financial Statement SchedulesItem 16. Form 10-k Summary