MARTEN TRANSPORT LTD
10-Ks and 10-Qs
|
|
|
|
|
|
|
|
|
|
|
|
|
|
|
|
|
|
|
|
|
|
|
|
|
|
|
|
|
|
|
|
|
|
|
|
|
|
|
|
|
|
|
|
|
|
|
|
|
|
|
|
|
|
|
|
UNITED STATES SECURITIES AND EXCHANGE COMMISSION
Washington, D.C. 20549
FORM 10-K
ANNUAL REPORT PURSUANT TO SECTION 13 0R 15(d)
OF THE SECURITIES EXCHANGE ACT OF 1934
For the fiscal year ended December 31, 2010
Commission file number 0-15010
MARTEN TRANSPORT, LTD.
(Exact name of registrant as specified in its charter)
|
DELAWARE
|
39-1140809
|
|
|
(State of incorporation)
|
(I.R.S. Employer Identification no.)
|
|
|
129 MARTEN STREET
|
||
|
MONDOVI, WISCONSIN
|
54755
|
(715) 926-4216
|
|
(Address of principal executive offices)
|
(Zip Code)
|
(Registrant’s telephone number)
|
Securities registered pursuant to Section 12(b) of the Act:
|
Title of each class
:
|
Name of each exchange on which registered
:
|
|
COMMON STOCK, PAR VALUE $.01 PER SHARE
|
THE NASDAQ STOCK MARKET LLC
|
|
(NASDAQ GLOBAL SELECT MARKET)
|
|
Securities registered pursuant to Section 12(g) of the Act:
|
|
NONE
|
Indicate by check mark if the Registrant is a well-known seasoned issuer, as defined in Rule 405 of the Securities Act. YES
£
NO
S
Indicate by check mark if the Registrant is not required to file reports pursuant to Section 13 or 15(d) of the Exchange Act. YES
£
NO
S
Indicate by check mark whether the Registrant (1) has filed all reports required to be filed by Section 13 or 15(d) of the Securities Exchange Act of 1934 during the preceding 12 months (or for such shorter period that the Registrant was required to file such reports), and (2) has been subject to such filing requirements for the past 90 days. YES
S
NO
£
Indicate by check mark whether the Registrant has submitted electronically and posted on its corporate Web site, if any, every Interactive Data File required to be submitted and posted pursuant to Rule 405 of Regulation S-T (Section 232.405 of this chapter) during the preceding 12 months (or for such shorter period that the Registrant was required to submit and post such files). Yes
¨
No
¨
Indicate by check mark if disclosure of delinquent filers pursuant to Item 405 of Regulation S-K is not contained herein, and will not be contained, to the best of Registrant’s knowledge, in definitive proxy or information statements incorporated by reference in Part III of this Form 10-K or any amendment to this Form 10-K.
S
Indicate by check mark whether the Registrant is a large accelerated filer, an accelerated filer, a non-accelerated filer, or a smaller reporting company. See the definitions of “large accelerated filer,” “accelerated filer,” and “smaller reporting company” in Rule 12b-2 of the Exchange Act. Large accelerated filer
£
Accelerated filer
S
Non-accelerated filer (do not check if a smaller reporting company)
£
Smaller reporting company
£
Indicate by check mark whether the Registrant is a shell company (as defined in Exchange Act Rule 12b-2). YES
£
NO
S
As of June 30, 2010 (the last business day of the Registrant’s most recently completed second fiscal quarter), the aggregate market value of the Common Stock of the Registrant (based upon the closing price of the Common Stock at that date as reported by the NASDAQ Global Select Market), excluding outstanding shares beneficially owned by directors and executive officers, was $348,723,000.
As of March 1, 2011, 21,950,252 shares of Common Stock of the Registrant were outstanding.
Part III of this Annual Report on Form 10-K incorporates by reference information (to the extent specific sections are referred to in this Report) from the Registrant’s Proxy Statement for the annual meeting to be held May 3, 2011, or 2011 Proxy Statement.
TABLE OF CONTENTS
| Page | ||
|
PART I
|
||
|
ITEM 1.
|
BUSINESS
|
1
|
|
ITEM 1A.
|
RISK FACTORS
|
7
|
|
ITEM 1B.
|
UNRESOLVED STAFF COMMENTS
|
12
|
|
ITEM 2.
|
PROPERTIES
|
12
|
|
ITEM 3.
|
LEGAL PROCEEDINGS
|
12
|
|
ITEM 4A.
|
EXECUTIVE OFFICERS OF THE REGISTRANT
|
12
|
|
PART II
|
||
|
ITEM 5.
|
MARKET FOR REGISTRANT’S COMMON EQUITY, RELATED STOCKHOLDER
MATTERS AND ISSUER
PURCHASES OF EQUITY SECURITIES
|
14 |
|
ITEM 6.
|
SELECTED FINANCIAL DATA
|
16
|
|
ITEM 7.
|
MANAGEMENT’S DISCUSSION AND ANALYSIS OF FINANCIAL CONDITION
AND RESULTS OF OPERATIONS
|
17 |
|
ITEM 7A.
|
QUANTITATIVE AND QUALITATIVE DISCLOSURES ABOUT MARKET RISK
|
32
|
|
ITEM 8.
|
FINANCIAL STATEMENTS AND SUPPLEMENTARY DATA
|
33
|
|
ITEM 9.
|
CHANGES IN AND DISAGREEMENTS WITH ACCOUNTANTS ON
ACCOUNTING AND FINANCIAL DISCLOSURE
|
56 |
|
ITEM 9A.
|
CONTROLS AND PROCEDURES
|
56
|
|
ITEM 9B.
|
OTHER INFORMATION
|
56
|
|
PART III
|
||
|
ITEM 10.
|
DIRECTORS, EXECUTIVE OFFICERS AND CORPORATE GOVERNANCE
|
57
|
|
ITEM 11.
|
EXECUTIVE COMPENSATION
|
58
|
|
ITEM 12.
|
SECURITY OWNERSHIP OF CERTAIN BENEFICIAL OWNERS AND MANAGEMENT
AND RELATED STOCKHOLDER MATTERS
|
58 |
|
ITEM 13.
|
CERTAIN RELATIONSHIPS AND RELATED TRANSACTIONS, AND DIRECTOR
INDEPENDENCE
|
58 |
|
ITEM 14.
|
PRINCIPAL ACCOUNTANT FEES AND SERVICES
|
58
|
|
PART IV
|
||
|
ITEM 15.
|
EXHIBITS AND FINANCIAL STATEMENT SCHEDULES
|
59
|
|
OTHER
|
||
|
Signature Page
|
61
|
|
|
Exhibit Index
|
63
|
|
FORWARD-LOOKING INFORMATION
This Annual Report on Form 10-K contains certain forward-looking statements. Such statements are made pursuant to the safe harbor provisions of the Private Securities Litigation Reform Act of 1995. Any statements not of historical fact may be considered forward-looking statements. Written words such as “may,” “expect,” “believe,” “anticipate,” “plan,” “goal,” or “estimate,” or other variations of these or similar words, identify such statements. These statements by their nature involve substantial risks and uncertainties, and actual results may differ materially from those expressed in such forward-looking statements. Important factors known to us that could cause such material differences are identified in this Annual Report on Form 10-K under the heading “Risk Factors” beginning on page 7. We undertake no obligation to correct or update any forward-looking statements, whether as a result of new information, future events, or otherwise. You are advised, however, to consult any future disclosures we make on related subjects in future filings with the Securities and Exchange Commission.
References in this Annual Report to “we,” “us,” “our,” or the “Company” or similar terms refer to Marten Transport, Ltd. and its consolidated subsidiaries unless the context otherwise requires.
|
ITEM 1.
|
BUSINESS
|
Overview
We are one of the leading temperature-sensitive truckload carriers in the United States. We specialize in transporting and distributing food and other consumer packaged goods that require a temperature-controlled or insulated environment. In 2010, we generated $516.9 million in operating revenue, which consists of revenue from both truckload and logistics operations. Approximately 83% of our truckload revenue resulted from hauling temperature-sensitive products and 17% from hauling dry freight. We operate throughout the United States and in parts of Canada and Mexico, with substantially all of our revenue generated from within the United States. Our primary long-haul traffic lanes are between the Midwest and the West Coast, Southwest, Southeast, and the East Coast, as well as from California to the Pacific Northwest. We provide regional truckload carrier services in the Southeast, West Coast, Midwest, South Central and Northeast regions. In 2010, our average length of haul was 655 miles.
Our growth strategy is to expand our business internally by offering shippers a high level of service and significant freight capacity. We market primarily to shippers that offer consistent volumes of freight in the lanes we prefer and are willing to compensate us for a high level of service. With our fleet of 2,146 company and independent contractor tractors, we are able to offer service levels that include up to 99% on-time performance and delivery within the narrow time windows often required when shipping perishable commodities.
We have two reporting segments – Truckload and Logistics. Financial information regarding these segments can be found in Footnote 13 to the Notes to Consolidated Financial Statements under Item 8 of this Form 10-K. The primary source of our operating revenue is truckload revenue, which we generate by transporting long-haul and regional freight for our customers and report within our Truckload segment. Generally, we are paid by the mile for our services. We also derive truckload revenue from fuel surcharges, loading and unloading activities, equipment detention and other ancillary services. We continue to expand our regional truckload operations, which represented 52% of our tractor fleet as of December 31, 2010. Our operating revenue also includes revenue reported within our Logistics segment, which consists of revenue from our internal brokerage and intermodal operations, both launched in 2005, and through our 45% interest in MW Logistics, LLC, or MWL, a third-party provider of logistics services to the transportation industry. Brokerage services involve arranging for another company to transport freight for our customers while we retain the billing, collection and customer management responsibilities. Intermodal services involve the transport of our trailers on railroad flatcars for a portion of a trip, with the balance of the trip using our tractors or, to a lesser extent, contracted carriers.
1
Organized under Wisconsin law in 1970, we are a successor to a sole proprietorship Roger R. Marten founded in 1946. In 1988, we reincorporated under Delaware law. Our executive offices are located at 129 Marten Street, Mondovi, Wisconsin 54755. Our telephone number is (715) 926-4216.
We maintain a website at
www.marten.com
. We are not including the information contained on our website as a part of, nor incorporating it by reference into, this Annual Report on Form 10-K. We post on our website, free of charge, documents that we file with or furnish to the Securities and Exchange Commission, including our Annual Reports on Form 10-K, Quarterly Reports on Form 10-Q, Current Reports on Form 8-K and proxy statements, as soon as reasonably practicable after we electronically file such material with, or furnish such material to, the Securities and Exchange Commission. We also provide a link on our website to Forms 3, 4 and 5 that our officers, directors and 10% stockholders file with the Securities and Exchange Commission pursuant to Section 16(a) of the Securities Exchange Act of 1934.
Marketing and Operations
We approach our business as an integrated effort of marketing and operations. Our emphasis in marketing is directed to the temperature-sensitive market, which is generally service-sensitive, as opposed to being solely price competitive. We target food and consumer packaged goods companies whose products require temperature-sensitive services and who ship multiple truckloads per week. By emphasizing high-quality service, we seek to become a core carrier for our customers. In 2010, our two largest customers were General Mills and Kraft.
Our marketing efforts are conducted by a staff of approximately 135 sales, customer service and support personnel under the supervision of our senior management team. Marketing personnel travel within their regions to solicit new truckload and logistics customers and maintain contact with existing customers. Customer service managers regularly contact customers to solicit additional business on a load-by-load basis.
Our operations and sales personnel strive to improve our asset productivity by seeking freight that allows for rapid turnaround times, minimizes non-revenue miles between loads, and carries a favorable rate structure. Once we have established a customer relationship, customer service managers work closely with our fleet managers to match customer needs with our capacity and the location of revenue equipment. Fleet managers use our optimization system to assign loads to satisfy customer and operational requirements, as well as to meet the routing needs of our drivers. We attempt to route most of our trucks over selected operating lanes, which we believe assists us in meeting customer requirements, balancing traffic, reducing non-revenue miles, and improving the reliability of delivery schedules.
We employ technology in our operations when we believe that it will allow us to operate more efficiently and the investment is cost-justified. Examples of the technologies we employ include:
|
|
·
|
Terrestrial- and satellite-based tracking and messaging that allows us to communicate with our drivers, obtain load position updates, provide our customers with freight visibility, and download operating information such as fuel mileage and idling time for the tractor engines and temperature setting and run time for the temperature-control units on our trailers.
|
|
|
·
|
Freight optimization software that assists us in selecting loads that match our overall criteria, including profitability, repositioning, identifying capacity for expedited loads, driver availability and home time, and other factors.
|
|
|
·
|
Electronic data interchange and internet communication with customers concerning freight tendering, invoices, shipment status, and other information.
|
2
|
|
·
|
Electronic onboard recorders in our tractors to monitor drivers’ hours of service.
|
|
|
·
|
Auxiliary power units installed on our company-owned tractors that allow us to decrease fuel costs associated with idling our tractors.
|
|
|
·
|
Fuel-routing software that optimizes the fuel stops for each trip to take advantage of volume discounts available in our fuel network.
|
We believe this integrated approach to our marketing and operations, coupled with our use of technology, has allowed us to provide our customers with a high level of service and support our revenue growth in an efficient manner. For example, we had a non-revenue mile percentage of 9.6% during 2010, which points to the efficiency of our operations and we believe compares favorably to other temperature-sensitive and dry van trucking companies.
Major Customers
An important part of our growth strategy is to increase our business with large customers. Accordingly, a significant amount of our business is concentrated with a relatively small number of customers. In 2010, our top 30 customers accounted for approximately 78% of our revenue, and our top ten customers accounted for 52% of our revenue. Nine of our top ten customers have been significant customers of ours for over ten years. We believe we are the largest temperature-sensitive carrier for six of our top ten customers. General Mills accounted for 18% and Kraft accounted for 10% of our revenue in 2010. We believe our relationships with these key customers are sound, but we are dependent upon them and the loss of some or all of their business could have a materially adverse effect on our results.
Drivers and Other Personnel
We believe that maintaining a safe and productive professional driver group is essential to providing excellent customer service and achieving profitability. Approximately 175 of our drivers as of December 31, 2010 have driven more than one million miles for us without a preventable accident, while approximately 51 of our drivers have driven more than two million miles and eight have driven more than three million miles for us without a preventable accident.
We select drivers, including independent contractors, using our specific guidelines for safety records, including drivers’ Compliance, Safety, Accountability, or CSA, scores, driving experience, and personal evaluations. We maintain stringent screening, training, and testing procedures for our drivers to reduce the potential for accidents and the corresponding costs of insurance and claims. We train new drivers at a number of our terminals in all phases of our policies and operations, as well as in safety techniques and fuel-efficient operation of the equipment. All new drivers also must pass DOT required tests prior to assignment to a vehicle.
We primarily pay company-employed drivers a fixed rate per mile. The rate increases based on length of service. Drivers also are eligible for bonuses based upon safe, efficient driving. We pay independent contractors a fixed rate per mile. Independent contractors pay for their own fuel, insurance, maintenance, and repairs.
Competition in the trucking industry for qualified drivers is normally intense and is expected to increase as a result of recent regulatory changes mandated by CSA. Our operations have been impacted, and from time-to-time we have experienced under-utilization and increased expense, as a result of a shortage of qualified drivers. We place a high priority on the recruitment and retention of an adequate supply of qualified drivers.
As of December 31, 2010, we had approximately 2,678 employees. This total consists of approximately 2,083 drivers, 224 mechanics and maintenance personnel, and 371 support personnel, which includes management and administration. As of that date, we also contracted with 86 independent contractors. None of our employees are represented by a collective bargaining unit. We consider relations with our employees to be good.
3
Revenue Equipment
Our revenue equipment programs are an important part of our overall goal of profitable growth. We evaluate our equipment decisions based on factors such as initial cost, useful life, warranty terms, expected maintenance costs, fuel economy, driver comfort, customer needs, manufacturer support, and resale value. We generally operate newer, well-maintained equipment with uniform specifications to minimize our spare parts inventory, streamline our maintenance program, and simplify driver training.
As of December 31, 2010, we operated a fleet of 2,146 tractors, including 2,060 company-owned tractors and 86 tractors supplied by independent contractors. The average age of our company-owned tractor fleet at December 31, 2010 was approximately 2.5 years. In 2010, we replaced most of our company-owned tractors within approximately 4.5 years after purchase.
Peterbilt and Freightliner manufacture most of our company-owned tractors. Maintaining a relatively new and standardized fleet allows us to operate most miles while the tractors are under warranty to minimize repair and maintenance costs. It also enhances our ability to attract drivers, increases fuel economy, and improves customer acceptance by minimizing service interruptions caused by breakdowns. We adhere to a comprehensive maintenance program during the life of our equipment. We perform most routine servicing and repairs at our terminal facilities to reduce costly on-road repairs and out-of-route trips. We do not have any agreements with tractor manufacturers pursuant to which they agree to repurchase the tractors or guarantee a residual value, and we therefore could incur losses upon disposition if resale values of used tractors decline.
The EPA adopted revised emissions control regulations, which required progressive reductions in exhaust emissions from diesel engines through 2010, for engines manufactured in October 2002, and thereafter. The revised regulations decrease the amount of emissions that can be released by tractor engines and affect tractors produced after the effective date of the regulations. The last of three stepped reductions in exhaust emissions was effective for engines manufactured in January 2010, and thereafter. All tractor engines in our fleet as of December 31, 2010 were manufactured prior to January 2010 and, therefore, were not required to meet the revised design requirements. Compliance with these regulations has increased the cost of our new tractors, lowered fuel mileage and increased our operating expenses. Some manufacturers have significantly increased new equipment prices, in part to meet more stringent engine design requirements imposed by the EPA. These adverse effects combined with the uncertainty as to the reliability of the vehicles equipped with the newly designed diesel engines and the residual values that will be realized from the disposition of these vehicles could increase our costs or otherwise adversely affect our business or operations.
We historically have contracted with independent contractors to provide and operate a portion of our tractor fleet. Independent contractors own their own tractors and are responsible for all associated expenses, including financing costs, fuel, maintenance, insurance, and taxes. The percentage of our fleet provided by independent contractors was 4.0% as of December 31, 2010 compared to 7.8% as of December 31, 2009 and 7.9% as of December 31, 2008.
As of December 31, 2010, we operated a fleet of 3,928 trailers. Most of our trailers are equipped with Thermo-King refrigeration units, air ride suspensions, and anti-lock brakes. Most of our single van trailers are refrigerated, 53 feet long and 102 inches wide. The average age of our trailer fleet at December 31, 2010 was approximately 2.8 years. In 2010, we replaced most of our company-owned trailers within approximately six years after purchase.
4
Insurance and Claims
We self-insure for a portion of our claims exposure resulting from workers’ compensation, auto liability, general liability, cargo and property damage claims, as well as employees’ health insurance. We are responsible for our proportionate share of the legal expenses relating to such claims as well. We reserve currently for anticipated losses and expenses. We periodically evaluate and adjust our insurance and claims reserves to reflect our experience. We are responsible for the first $1.0 million on each auto liability claim and also responsible for up to $1.0 million for 33% of each auto liability claim amount in excess of $1.0 million. We are also responsible for the first $750,000 on each workers’ compensation claim. We have $8.3 million in standby letters of credit to guarantee settlement of claims under agreements with our insurance carriers and regulatory authorities. We maintain insurance coverage for per-incident and total losses in excess of the amounts for which we self-insure up to specified policy limits with licensed insurance carriers. Insurance carriers have raised premiums for many businesses, including trucking companies. As a result, our insurance and claims expense could increase, or we could raise our self-insured retention when our policies are renewed. We believe that our policy of self-insuring up to set limits, together with our safety and loss prevention programs, are effective means of managing insurance costs.
Fuel
Our operations are heavily dependent upon the use of diesel fuel. The price and availability of diesel fuel can vary and are subject to political, economic, and market factors that are beyond our control. Fuel prices fluctuated dramatically and quickly at various times during the last three years and they remain high based on historical standards. We actively manage our fuel costs by purchasing fuel in bulk in Mondovi and at a number of our other maintenance facilities throughout the country and have volume purchasing arrangements with national fuel centers that allow our drivers to purchase fuel at a discount while in transit. During 2010, over 99% of our fuel purchases were made at these designated locations. To help further reduce fuel consumption, we have equipped our company-owned tractors with auxiliary power units since 2007. These units reduce fuel consumption by providing quiet climate control and electrical power for our drivers without idling the tractor engine. We have also invested in satellite tracking equipment for our temperature-control units on our trailers that has improved fuel usage through management of required temperature settings and run time of the units.
We further manage our exposure to changes in fuel prices through fuel surcharge programs with our customers and other measures that we have implemented. We have historically been able to pass through a significant portion of long-term increases in fuel prices and related taxes to customers in the form of fuel surcharges. These fuel surcharges, which adjust with the cost of fuel, enable us to recover a substantial portion of the higher cost of fuel as prices increase, except for non-revenue miles, out-of-route miles or fuel used while the tractor is idling. As of December 31, 2010, we had no derivative financial instruments to reduce our exposure to fuel price fluctuations.
Competition
We operate primarily in the temperature-sensitive segment of the truckload market. This market is highly competitive and fragmented. We compete with many other truckload carriers that provide temperature-sensitive service of varying sizes and, to a lesser extent, with less-than-truckload carriers, railroads, and other transportation companies, many of which have more equipment, a wider range of services, and greater capital resources than we do or have other competitive advantages. In particular, several of the largest truckload carriers that offer primarily dry-van service also offer temperature-sensitive service, and these carriers could attempt to increase their business in the temperature-sensitive market. We also compete with other motor carriers for the services of drivers, independent contractors, and management employees. We believe that the principal competitive factors in our business are service, freight rates, capacity, and financial stability. As one of the largest and best-capitalized carriers focused on the temperature-sensitive segment, we believe we are well positioned to compete in that segment.
5
Regulation
The United States Department of Transportation, or DOT, and various state and local agencies exercise broad powers over our business, generally governing such activities as authorization to engage in motor carrier operations, safety and insurance requirements. Our company drivers and independent contractors also must comply with the safety and fitness regulations promulgated by the DOT, including those relating to drug and alcohol testing and hours-of-service.
The DOT, through the Federal Motor Carrier Safety Administration, or FMCSA, imposes safety and fitness regulations on us and our drivers. In December 2010, the FMCSA introduced a new system, Compliance, Safety, Accountability, or CSA, to measure and evaluate the on-road safety performance of commercial carriers and individual drivers. CSA’s Motor Carrier Safety Measurement System replaces the former SafeStat system and attempts to use more roadside data to identify behaviors that predict safety issues, be more proactive with intervention and maximize compliance monitoring resources. The implementation of CSA could remove a significant number of drivers from the industry as carriers will be less willing to hire and retain drivers with marginal ratings, which will increase competition for qualified drivers.
In December 2010, the FMCSA issued a regulatory proposal that would revise hours-of-service requirements for drivers, which designate the length of time that drivers are allowed to drive and work. The proposal retains the current “34-hour restart” provision allowing drivers to restart the clock on their weekly 60 hours per seven-day period or 70 hours per eight-day period by taking at least 34 consecutive hours off-duty. However, the restart period would be required to include two consecutive off-duty periods from midnight to 6:00 a.m. Additionally, the proposal would require drivers to complete all on-duty work within a 14-hour window, including at least a one hour break. The proposal leaves open for comment whether drivers’ daily driving time should remain at 11 hours or be reduced to 10 hours, with 10 hours the preference of the FMCSA. A final rule is expected by July 2011. Should the proposed changes be finalized, including a reduction in the daily driving time, tractor productivity would decrease and a loss of efficiency could be caused as drivers and shippers may need to be retrained, computer programming may require modifications and some shipping lanes may need to be reconfigured.
In January 2011, the FMCSA issued a regulatory proposal that would require commercial carriers to track compliance with hours-of-service regulations using electronic onboard recorders, which our tractor fleet is substantially equipped with as of December 31, 2010.
The EPA adopted revised emissions control regulations, which required progressive reductions in exhaust emissions from diesel engines through 2010, for engines manufactured in October 2002, and thereafter. The revised regulations decrease the amount of emissions that can be released by tractor engines and affect tractors produced after the effective date of the regulations. The last of three stepped reductions in exhaust emissions was effective for engines manufactured in January 2010, and thereafter. All tractor engines in our fleet as of December 31, 2010 were manufactured prior to January 2010 and, therefore, were not required to meet the revised design requirements. Compliance with these regulations has increased the cost of our new tractors, lowered fuel mileage and increased our operating expenses. Some manufacturers have significantly increased new equipment prices, in part to meet more stringent engine design requirements imposed by the EPA. These adverse effects combined with the uncertainty as to the reliability of the vehicles equipped with the newly designed diesel engines and the residual values that will be realized from the disposition of these vehicles could increase our costs or otherwise adversely affect our business or operations.
We are also subject to various environmental laws and regulations dealing with the handling of hazardous materials, fuel storage tanks, air emissions from our facilities, engine idling, and discharge and retention of storm water. These regulations did not have a significant impact on our operations or financial results in 2008 through 2010.
6
|
ITEM 1A.
|
RISK FACTORS
|
The following factors are important and should be considered carefully in connection with any evaluation of our business, financial condition, results of operations, prospects, or an investment in our common stock. The risks and uncertainties described below are those that we currently believe may materially affect our company or our financial results. Additional risks and uncertainties not presently known to us or that we currently deem immaterial may also impair our business operations or affect our financial results.
Our business is subject to general economic and business factors that are largely out of our control, any of which could have a materially adverse effect on our operating results
. Our business is dependent on a number of general economic and business factors that may have a materially adverse effect on our results of operations, many of which are beyond our control. These factors include excess capacity in the trucking industry, strikes or other work stoppages, and significant increases or fluctuations in interest rates, fuel taxes, and license and registration fees. We are affected by recessionary economic cycles and downturns in customers’ business cycles, particularly in market segments and industries where we have a significant concentration of customers. Economic conditions may adversely affect our customers and their ability to pay for our services.
It is not possible to predict the effects of actual or threatened armed conflicts or terrorist attacks, efforts to combat terrorism, military action against any foreign state, heightened security requirements, or other related events and the subsequent effects on the economy or on consumer confidence in the United States, or the impact, if any, on our future results of operations.
Instability of the credit markets and the resulting effects on the economy could have a material adverse effect on our operating results.
If the credit markets and the economy weaken, our business, financial results, and results of operations could be materially and adversely affected, especially if consumer confidence declines and domestic spending decreases. We may need to incur additional indebtedness, which may include drawing on our Credit Facility, or issue debt securities in the future to fund working capital requirements, make investments, or for general corporate purposes. Additionally, stresses in the credit market causes uncertainty in the equity markets, which may result in volatility of the market price for our securities.
We operate in a highly competitive and fragmented industry, and numerous competitive factors could impair our ability to maintain our current profitability
. We compete with many other truckload carriers that provide temperature-sensitive service of varying sizes and, to a lesser extent, with less-than-truckload carriers, railroads and other transportation companies, many of which have more equipment, a wider range of services and greater capital resources than we do or have other competitive advantages. In particular, several of the largest truckload carriers that offer primarily dry-van service also offer temperature-sensitive service, and these carriers could attempt to increase their business in the temperature-sensitive market. Many of our competitors periodically reduce their freight rates to gain business, especially during times of reduced growth rates in the economy, which may limit our ability to maintain or increase freight rates or maintain significant growth in our business. In addition, many customers reduce the number of carriers they use by selecting so-called “core carriers” as approved service providers, or conduct bids from multiple carriers for their shipping needs, and in some instances we may not be selected as a core carrier or to provide service under such bids.
In addition, the trend toward consolidation in the trucking industry may create other large carriers with greater financial resources and other competitive advantages relating to their size. Competition from freight logistics and brokerage companies may negatively impact our customer relationships and freight rates. Furthermore, economies of scale that may be passed on to smaller carriers by procurement aggregation providers may improve such carriers’ ability to compete with us.
7
We derive a significant portion of our revenue from our major customers, the loss of one or more of which could have a materially adverse effect on our business
. A significant portion of our revenue is generated from our major customers. For 2010, our top 30 customers, based on revenue, accounted for approximately 78% of our revenue; our top ten customers accounted for approximately 52% of our revenue; our top five customers accounted for approximately 41% of our revenue; and our top two customers accounted for approximately 28% of our revenue. Generally, we enter into one-year contracts with our major customers, the majority of which do not contain any firm obligations to ship with us. We cannot assure you that, upon expiration of existing contracts, these customers will continue to use our services or that, if they do, they will continue at the same levels. Many of our customers periodically solicit bids from multiple carriers for their shipping needs, and this process may depress freight rates or result in loss of business to our competitors. Some of our customers also operate their own private trucking fleets, and they may decide to transport more of their own freight. A reduction in or termination of our services by one or more of our major customers could have a materially adverse effect on our business and operating results.
If the growth in our regional operations declines, or if we expand into a market with insufficient economic activity, our results of operations could be adversely affected.
We operate regional service centers which are located in a number of cities within the United States. In order to support future growth, these regional operations require the commitment of additional capital, revenue equipment and facilities along with qualified management, drivers and other personnel. Should the growth in our regional operations decline, the results of our operations could be adversely affected. It may become more difficult to identify additional cities that can support service centers, and we may expand into cities where there is insufficient economic activity, reduced capacity for growth or less driver and non-driver personnel to support our operations. We may encounter operating conditions in these new markets that materially differ from our current operations and customer relationships may be difficult to obtain at appropriate freight rates. Also, we may not be able to apply our regional operating strategy successfully in additional cities, and it might take longer than expected or require a more substantial financial commitment than anticipated to establish our operations in the additional cities.
Increased prices, reduced productivity, and restricted availability of new revenue equipment could cause our financial condition, results of operations and cash flows to suffer
. We have experienced higher prices for new tractors over the past few years, primarily as a result of higher commodity prices and government regulations applicable to newly manufactured tractors and diesel engines. We expect to continue to pay increased prices for revenue equipment for the foreseeable future. Our business could be harmed if we are unable to continue to obtain an adequate supply of new tractors and trailers or if we have to pay increased prices for new revenue equipment.
The EPA adopted revised emissions control regulations, which required progressive reductions in exhaust emissions from diesel engines through 2010, for engines manufactured in October 2002, and thereafter. The revised regulations decrease the amount of emissions that can be released by tractor engines and affect tractors produced after the effective date of the regulations. The last of three stepped reductions in exhaust emissions was effective for engines manufactured in January 2010, and thereafter. All tractor engines in our fleet as of December 31, 2010 were manufactured prior to January 2010 and, therefore, were not required to meet the revised design requirements. Compliance with these regulations has increased the cost of our new tractors, lowered fuel mileage and increased our operating expenses. Some manufacturers have significantly increased new equipment prices, in part to meet more stringent engine design requirements imposed by the EPA. These adverse effects combined with the uncertainty as to the reliability of the vehicles equipped with the newly designed diesel engines and the residual values that will be realized from the disposition of these vehicles could increase our costs or otherwise adversely affect our business or operations.
We have significant ongoing capital requirements that could harm our financial condition, results of operations and cash flows if we are unable to generate sufficient cash from our operations
. The truckload industry is capital intensive, and our policy of operating newer equipment requires us to expend significant amounts annually. If we elect to expand our fleet in future periods, our capital needs would increase. We expect to pay for projected capital expenditures with cash flows from operations and borrowings under our revolving credit facility. If we are unable to generate sufficient cash from operations and obtain financing on favorable terms in the future, we may have to limit our growth, enter into less favorable financing arrangements, or operate our revenue equipment for longer periods, any of which could have a materially adverse effect on our profitability.
8
Ongoing insurance and claims expenses could significantly affect our earnings
. Our future insurance and claims expense might exceed historical levels, which could reduce our earnings. We self-insure for a portion of our claims exposure resulting from workers’ compensation, auto liability, general liability, cargo and property damage claims, as well as employees’ health insurance. We also are responsible for our legal expenses relating to such claims. We reserve currently for anticipated losses and expenses. We periodically evaluate and adjust our claims reserves to reflect our experience. However, ultimate results may differ from our estimates, which could result in losses over our reserved amounts.
We maintain insurance above the amounts for which we self-insure with licensed insurance carriers. Although we believe the aggregate insurance limits should be sufficient to cover reasonably expected claims, it is possible that one or more claims could exceed our aggregate coverage limits. Insurance carriers have raised premiums for many businesses, including trucking companies. As a result, our insurance and claims expense could increase, or we could raise our self-insured retention when our policies are renewed. If these expenses increase, or if we experience a claim in excess of our coverage limits, or we experience a claim for which coverage is not provided, results of our operations and financial condition could be materially and adversely affected.
We operate in a highly regulated industry and increased costs of compliance with, or liability for violation of, existing or future regulations could have a materially adverse effect on our business
. The DOT and various state and local agencies exercise broad powers over our business, generally governing such activities as authorization to engage in motor carrier operations, safety and insurance requirements. Our company drivers and independent contractors also must comply with the safety and fitness regulations promulgated by the DOT, including those relating to drug and alcohol testing and hours-of-service. We also may become subject to new or more restrictive regulations relating to fuel emissions, ergonomics, or other matters affecting safety or operating methods. Other agencies, such as the EPA and the Department of Homeland Security, or DHS, also regulate our equipment, operations, and drivers. Future laws and regulations may be more stringent and require changes in our operating practices, influence the demand for transportation services, or require us to incur significant additional costs. Higher costs incurred by us or by our suppliers who pass the costs onto us through higher prices could adversely affect our results of operations.
The DOT, through the Federal Motor Carrier Safety Administration, or FMCSA, imposes safety and fitness regulations on us and our drivers. In December 2010, the FMCSA introduced a new system, Compliance, Safety, Accountability, or CSA, to measure and evaluate the on-road safety performance of commercial carriers and individual drivers. CSA’s Motor Carrier Safety Measurement System replaces the former SafeStat system and attempts to use more roadside data to identify behaviors that predict safety issues, be more proactive with intervention and maximize compliance monitoring resources. The implementation of CSA could remove a significant number of drivers from the industry as carriers will be less willing to hire and retain drivers with marginal ratings, which will increase competition for qualified drivers.
In December 2010, the FMCSA issued a regulatory proposal that would revise hours-of-service requirements for drivers, which designate the length of time that drivers are allowed to drive and work. The proposal retains the current “34-hour restart” provision allowing drivers to restart the clock on their weekly 60 hours per seven-day period or 70 hours per eight-day period by taking at least 34 consecutive hours off-duty. However, the restart period would be required to include two consecutive off-duty periods from midnight to 6:00 a.m. Additionally, the proposal would require drivers to complete all on-duty work within a 14-hour window, including at least a one hour break. The proposal leaves open for comment whether drivers’ daily driving time should remain at 11 hours or be reduced to 10 hours, with 10 hours the preference of the FMCSA. A final rule is expected by July 2011. Should the proposed changes be finalized, including a reduction in the daily driving time, tractor productivity would decrease and a loss of efficiency could be caused as drivers and shippers may need to be retrained, computer programming may require modifications and some shipping lanes may need to be reconfigured.
9
In January 2011, the FMCSA issued a regulatory proposal that would require commercial carriers to track compliance with hours-of-service regulations using electronic onboard recorders, which our tractor fleet is substantially equipped with as of December 31, 2010.
Some states and municipalities have begun to restrict the locations and amount of time where diesel-powered tractors, such as ours, may idle, in order to reduce exhaust emissions. The State of California has enacted legislation which requires tractors weighing more than 10,000 pounds to use alternative sources, such as auxiliary power units, when powering their cabs at idle for more than five minutes. The State of California has also enacted legislation requiring compliance with exhaust emissions standards for refrigeration units on trailers. Compliance is being phased in by the state, which began with 2001 and earlier models. Given our investment in auxiliary power units for our tractors and the average age of our trailer fleet, we do not expect these regulations will have a significant impact on our operations or financial results.
From time to time, various federal, state, or local taxes are increased, including taxes on fuels. We cannot predict whether, or in what form, any such increase applicable to us will be enacted, but such an increase could adversely affect our profitability.
Increases in compensation or difficulty in attracting drivers could affect our profitability and ability to grow
. The transportation industry has historically experienced substantial difficulty in attracting and retaining qualified drivers, including independent contractors. With increased competition for drivers, including the impact that recent regulatory changes mandated by CSA may have on the number of drivers in the transportation industry, we could experience greater difficulty in attracting sufficient numbers of qualified drivers. In addition, due in part to current economic conditions, including the cost of fuel and insurance, the available pool of independent contractor drivers is smaller than it has been historically. Accordingly, we may face difficulty in attracting and retaining drivers for all of our current tractors and for those we may add. Additionally, we may face difficulty in increasing the number of our independent contractor drivers. In addition, our industry suffers from high turnover rates of drivers. Our turnover rate requires us to recruit a substantial number of drivers. Moreover, our turnover rate could increase. If we are unable to continue to attract drivers and contract with independent contractors, we could be required to continue adjusting our driver compensation package beyond the norm or let trucks sit idle. An increase in our expenses or in the number of tractors without drivers could materially and adversely affect our growth and profitability.
Fluctuations in the price or availability of fuel may increase our cost of operation, which could materially and adversely affect our profitability
. We require large amounts of diesel fuel to operate our tractors and to power the temperature-control units on our trailers. Fuel is one of our largest operating expenses. Fuel prices tend to fluctuate, and prices and availability of all petroleum products are subject to political, economic and market factors that are beyond our control. We depend primarily on fuel surcharges, auxiliary power units for our tractors, satellite tracking equipment for the temperature-control units on our trailers, volume purchasing arrangements with truck stop chains and bulk purchases of fuel at our terminals to control and recover our fuel expenses. There can be no assurance that we will be able to collect fuel surcharges, enter into volume purchase agreements, or execute successful hedges in the future. Additionally, we may encounter decreases in productivity that may offset or eliminate savings from auxiliary power units or satellite tracking equipment, or may incur unexpected maintenance or other costs associated with such units. The absence of meaningful fuel price protection through these measures, fluctuations in fuel prices, or a shortage of diesel fuel, could materially and adversely affect our results of operations.
10
Seasonality and the impact of weather can affect our profitability
. Our tractor productivity generally decreases during the winter season because inclement weather impedes operations and some shippers reduce their shipments. At the same time, operating expenses generally increase, with harsh weather creating higher accident frequency, increased claims and more equipment repairs. We can also suffer short-term impacts from weather-related events such as hurricanes, blizzards, ice-storms, and floods that could harm our results or make our results more volatile.
Service instability in the railroad industry could increase our operating costs and reduce our ability to offer intermodal services, which could adversely affect our revenue, results of operations, and customer relationships
. In the future, our dependence on railroads will increase if we continue to expand our intermodal services. In most markets, rail service is limited to a few railroads or even a single railroad. Any reduction in service by the railroads with which we have, or in the future may have, relationships is likely to increase the cost of the rail-based services we provide and reduce the reliability, timeliness, and overall attractiveness of our rail-based services. Furthermore, railroads are relatively free to adjust shipping rates up or down as market conditions permit. Price increases could result in higher costs to our customers and reduce or eliminate our ability to offer intermodal services. In addition, we cannot assure you that we will be able to negotiate additional contracts with railroads to expand our capacity, add additional routes, or obtain multiple providers, which could limit our ability to provide this service.
Our operations are subject to various environmental laws and regulations, the violation of which could result in substantial fines or penalties
. We are subject to various environmental laws and regulations dealing with the handling of hazardous materials, fuel storage tanks, air emissions from our vehicles and facilities, engine idling, and discharge and retention of storm water. We operate in industrial areas, where truck terminals and other industrial activities are located, and where groundwater or other forms of environmental contamination have occurred. Our operations involve the risks of fuel spillage or seepage, environmental damage, and hazardous waste disposal, among others. Although we have instituted programs to monitor and control environmental risks and promote compliance with applicable environmental laws and regulations, if we are involved in a spill or other accident involving hazardous substances or if we are found to be in violation of applicable laws or regulations, we could be subject to liabilities, including substantial fines or penalties or civil and criminal liability, any of which could have a materially adverse effect on our business and operating results.
If we are unable to retain our executive officers and key management employees, our business, financial condition and results of operations could be adversely affected.
We are highly dependent upon the services of our executive officers and key management employees. Currently, we do not have employment agreements with these employees and the loss of any of their services could have a materially adverse effect on our operations and future profitability. In addition, we must continue to develop and retain a core group of managers if we are to realize our goal of expanding our operations and continuing our growth. We cannot assure you that we will be able to do so in the future.
Our management information systems may prove inadequate
. We depend upon our management information systems for many aspects of our business. Some of our key software has been developed internally by our programmers or by adapting purchased software to our needs and this software may not be easily modified or integrated with other software and systems. Our business will be materially and adversely affected if our management information systems are disrupted or if we are unable to improve, upgrade, integrate or expand our systems as we continue to execute our growth strategy, including our logistics services.
11
|
ITEM 1B.
|
UNRESOLVED STAFF COMMENTS
|
None.
|
ITEM 2.
|
PROPERTIES
|
Our executive offices and principal terminal are located on approximately seven acres in Mondovi, Wisconsin. This facility consists of 39,000 square feet of office space and 21,000 square feet of equipment repair and maintenance space. We added additional equipment repair and maintenance facilities in 2007 and in 2009 in Mondovi, Wisconsin which consist of 15,000 square feet of space located on approximately 11 acres and 50,000 square feet of space located on approximately three acres, respectively. We operate facilities in or near the following cities at which we perform the following designated operating activities:
|
Company Locations
|
Owned or
Leased
|
Maintenance
|
Fueling
|
Driver
Recruitment
|
Driver
Training
|
Dispatch
|
Sales
|
|
Mondovi, Wisconsin
|
Owned
|
X
|
X
|
X
|
X
|
X
|
X
|
|
Ontario, California
|
Owned
|
X
|
X
|
X
|
X
|
||
|
Atlanta, Georgia
|
Owned
|
X
|
X
|
X
|
X
|
X
|
|
|
Portland, Oregon
|
Owned
|
X
|
X
|
X
|
X
|
||
|
Indianapolis, Indiana
|
Owned
|
X
|
X
|
X
|
X
|
X
|
|
|
Irving, Texas
|
Leased
|
X
|
X
|
X
|
X
|
X
|
|
|
Lakeland, Florida
|
Leased
|
X
|
X
|
X
|
|||
|
Phoenix, Arizona
|
Leased
|
X
|
X
|
X
|
X
|
X
|
|
|
Memphis, Tennessee
|
Leased
|
X
|
X
|
X
|
X
|
X
|
|
|
Richmond, Virginia
|
Leased
|
X
|
X
|
||||
|
Laredo, Texas
|
Leased
|
X
|
X
|
|
ITEM 3.
|
LEGAL PROCEEDINGS
|
We are involved in litigation incidental to our operations. These lawsuits primarily involve claims for workers’ compensation, personal injury, or property damage incurred in the transportation of freight.
|
ITEM 4A.
|
EXECUTIVE OFFICERS OF THE REGISTRANT
|
Our executive officers, with their ages and the offices held as of March 1, 2011, are as follows:
|
Name
|
Age
|
Position
|
|
Randolph L. Marten
|
58
|
Chairman of the Board,
Chief Executive Officer and Director
|
|
Timothy M. Kohl
|
63
|
President
|
|
Robert G. Smith
|
67
|
Chief Operating Officer
|
|
Timothy P. Nash
|
59
|
Executive Vice President of Sales and Marketing
|
|
James J. Hinnendael
|
47
|
Chief Financial Officer
|
|
John H. Turner
|
49
|
Vice President of Sales
|
12
Randolph L. Marten
has been a full-time employee of ours since 1974. Mr. Marten has been a Director since October 1980, our Chairman of the Board since August 1993 and our Chief Executive Officer since January 2005. Mr. Marten also served as our President from June 1986 until June 2008, our Chief Operating Officer from June 1986 until August 1998 and as a Vice President from October 1980 to June 1986.
Timothy M. Kohl
has been our President since June 2008. Mr. Kohl joined the company in November 2007, and has over 20 years’ experience in the transportation services industry. Mr. Kohl served as Knight Transportation Inc.’s President from 2004 to 2007 and as its Secretary from 2000 to 2007. Mr. Kohl served as a director on Knight’s Board of Directors from 2001 to 2006, and he served as its Chief Financial Officer from 2000 to 2004. Mr. Kohl also served as Knight’s Vice President of Human Resources from 1996 through 1999. From 1999 through 2000, Mr. Kohl served as Vice President of Knight’s southeast region. Prior to his employment with Knight, Mr. Kohl was employed by Burlington Motor Carriers as Vice President of Human Resources. Prior to his employment with Burlington Motor Carriers, Mr. Kohl served as Vice President of Human Resources for J.B. Hunt.
Robert G. Smith
has been our Chief Operating Officer since August 1998. Mr. Smith also served as our Vice President of Operations from June 1993 until May 1999 and as our Director of Operations from September 1989 to June 1993. Mr. Smith served as director of operations for Transport Corporation of America, an irregular-route truckload carrier, from 1985 to 1989.
Timothy P. Nash
has been our Executive Vice President of Sales and Marketing since November 2000. Mr. Nash also served as our Vice President of Sales from November 1990 to November 2000 and as a Regional Sales Manager from July 1987 to November 1990. Mr. Nash served as a regional sales manager for Overland Express, Inc., a long-haul truckload carrier, from 1986 to 1987.
James J. Hinnendael
has been our Chief Financial Officer since January 2006 and served as our Controller from January 1992 to December 2005. Mr. Hinnendael served in various professional capacities with Ernst & Young LLP, a public accounting firm, from 1987 to December 1991. Mr. Hinnendael is a certified public accountant.
John H. Turner
has been our Vice President of Sales since January 2007 and an executive officer since August 2007. He also served as our Vice President of Sales from October 2000 to February 2005, and as an executive officer from January 2002 to February 2005. Mr. Turner also served as our Director of Sales from July 1999 to October 2000 and in various professional capacities in our sales and marketing area from August 1991 to July 1999 and as our Operations Manager-West from October 1990 to August 1991. Previously, Mr. Turner served as a vice president for Naterra Land, Inc., a recreational land developer, from 2005 to 2006 and as the western fleet general manager and area sales manager for Munson Transportation, Inc., a long-haul truckload carrier, from 1986 to 1990.
13
|
ITEM 5.
|
MARKET FOR REGISTRANT’S COMMON EQUITY, RELATED STOCKHOLDER MATTERS AND ISSUER PURCHASES OF EQUITY SECURITIES
|
Our common stock is listed on the NASDAQ Global Select Market under the symbol “MRTN.” The table below shows the range of high and low bid prices for the quarters indicated on the NASDAQ Global Select Market. Such quotations reflect inter-dealer prices, without retail markups, markdowns or commissions and, therefore, may not necessarily represent actual transactions.
|
Common Stock Price
|
||||||||
|
Year ended December 31, 2010
|
High
|
Low
|
||||||
|
Fourth Quarter
|
$ | 24.36 | $ | 20.08 | ||||
|
Third Quarter
|
24.25 | 17.00 | ||||||
|
Second Quarter
|
23.54 | 18.75 | ||||||
|
First Quarter
|
20.52 | 16.66 | ||||||
|
Year ended December 31, 2009
|
||||||||
|
Fourth Quarter
|
$ | 18.82 | $ | 16.40 | ||||
|
Third Quarter
|
21.46 | 16.05 | ||||||
|
Second Quarter
|
22.50 | 17.75 | ||||||
|
First Quarter
|
19.57 | 14.49 | ||||||
The prices do not include adjustments for retail mark-ups, mark-downs or commissions. On March 1, 2011, we had 202 record stockholders, and approximately 1,198 beneficial stockholders of our common stock.
In August 2010, we announced a regular cash dividend program to our stockholders, subject to approval each quarter. The first two quarterly cash dividends of $0.02 per share of common stock were paid in September and December 2010. We currently expect to continue to pay quarterly cash dividends in the future. The payment of cash dividends in the future, and the amount of any such dividends, will depend upon our financial condition, results of operations, cash requirements, and certain corporate law requirements, as well as other factors deemed relevant by our Board of Directors. Our ability to pay cash dividends is currently limited by restrictions contained in our revolving credit facility. Our revolving credit facility prohibits us from paying, in any fiscal year, dividends in excess of 25% of our net income from the prior fiscal year.
On December 4, 2007, our Board of Directors approved and we announced a share repurchase program to repurchase up to one million shares of our common stock either through purchases on the open market or through private transactions and in accordance with Rule 10b-18 of the Exchange Act. The timing and extent to which we will repurchase shares depends on market conditions and other corporate considerations. The repurchase program does not have an expiration date. In the first quarter of 2008 we repurchased and retired 67,500 shares of our common stock for $810,000. We made no purchases in 2010, 2009, or in the remainder of 2008.
14
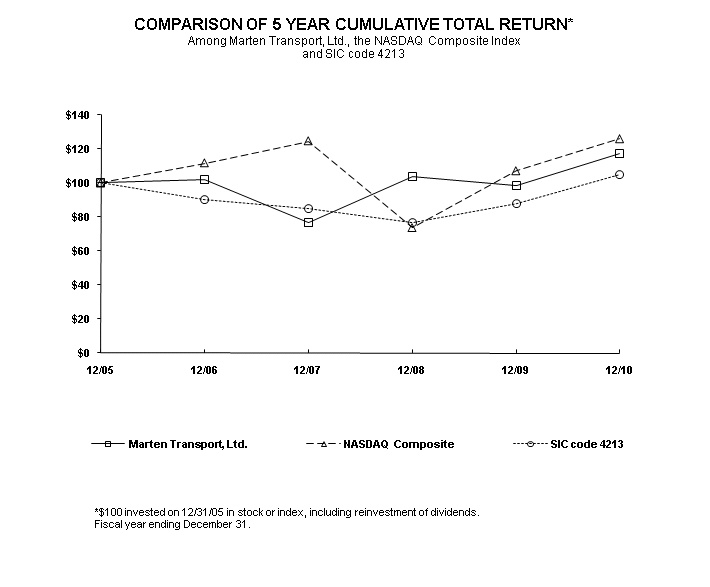
Comparative Stock Performance
The graph below compares the cumulative total stockholder return on our common stock with the NASDAQ Market index and the SIC code 4213 (trucking, except local) line-of-business index for the last five years. Research Data Group, Inc. prepared the line-of-business index. The graph assumes $100 is invested in our common stock, the NASDAQ Stock Market index and the line-of-business index on December 31, 2005, with reinvestment of dividends. The comparisons in the graph below are based on historical data and are not intended to forecast the possible future performance of our common stock. The information in the graph below shall be deemed “furnished” and not “filed” for purposes of Section 18 of the Exchange Act or otherwise subject to the liabilities of that section.
15
|
ITEM 6.
|
SELECTED FINANCIAL DATA
|
The following selected financial data should be read in conjunction with the consolidated financial statements and notes under Item 8 of this Form 10-K.
|
(
Dollars in thousands, except per share amounts)
|
2010
|
2009
|
2008
|
2007
|
2006
|
|||||||||||||||
|
FOR THE YEAR
|
||||||||||||||||||||
|
Operating revenue
|
$ | 516,920 | $ | 505,874 | $ | 607,099 | $ | 560,017 | $ | 518,890 | ||||||||||
|
Operating income
|
35,289 | 29,359 | 32,705 | 27,801 | 41,169 | |||||||||||||||
|
Net income
|
19,742 | 16,267 | 18,071 | 14,968 | 24,518 | |||||||||||||||
|
Operating ratio
(1)
|
93.2 | % | 94.2 | % | 94.6 | % | 95.0 | % | 92.1 | % | ||||||||||
|
PER-SHARE DATA
|
||||||||||||||||||||
|
Basic earnings per common share
|
$ | 0.90 | $ | 0.74 | $ | 0.83 | $ | 0.69 | $ | 1.13 | ||||||||||
|
Diluted earnings per common share
|
0.90 | 0.74 | 0.82 | 0.68 | 1.12 | |||||||||||||||
|
Dividends paid per common share
|
0.04 | — | — | — | — | |||||||||||||||
|
Book value
|
13.48 | 12.56 | 11.79 | 10.92 | 10.20 | |||||||||||||||
|
AT YEAR END
|
||||||||||||||||||||
|
Total assets
|
$ | 460,308 | $ | 414,838 | $ | 397,443 | $ | 407,390 | $ | 410,822 | ||||||||||
|
Long-term debt
|
19,346 | 1,499 | 2,857 | 44,643 | 58,659 | |||||||||||||||
|
Stockholders’ equity
|
295,904 | 274,907 | 257,451 | 238,213 | 221,906 | |||||||||||||||
|
(1)
|
Represents operating expenses as a percentage of operating revenue.
|
16
|
ITEM 7.
|
MANAGEMENT’S DISCUSSION AND ANALYSIS OF FINANCIAL CONDITION AND RESULTS OF OPERATIONS
|
The following discussion and analysis of our financial condition and results of operations should be read together with the selected consolidated financial data and our consolidated financial statements and the related notes appearing elsewhere in this report. This discussion and analysis contains forward-looking statements that involve risks, uncertainties and assumptions. Our actual results may differ materially from those anticipated in these forward-looking statements as a result of many factors, including but not limited to those under the heading “Risk Factors” beginning on page 7. We do not assume, and specifically disclaim, any obligation to update any forward-looking statement contained in this report.
Overview
The primary source of our operating revenue is truckload revenue, which we generate by transporting long-haul and regional freight for our customers and report within our Truckload segment. Generally, we are paid by the mile for our services. We also derive truckload revenue from fuel surcharges, loading and unloading activities, equipment detention and other ancillary services. The main factors that affect our truckload revenue are the rate per mile we receive from our customers, the percentage of miles for which we are compensated, the number of miles we generate with our equipment and changes in fuel prices. We monitor our revenue production primarily through average truckload revenue, net of fuel surcharges, per tractor per week. We also analyze our average truckload revenue, net of fuel surcharges, per total mile, non-revenue miles percentage, the miles per tractor we generate, our accessorial revenue and our other sources of operating revenue.
Our operating revenue also includes revenue reported within our Logistics segment, which consists of revenue from our internal brokerage and intermodal operations, both launched in 2005, and through our 45% interest in MWL, a third-party provider of logistics services to the transportation industry. Brokerage services involve arranging for another company to transport freight for our customers while we retain the billing, collection and customer management responsibilities. Intermodal services involve the transport of our trailers on railroad flatcars for a portion of a trip, with the balance of the trip using our tractors or, to a lesser extent, contracted carriers. The main factors that affect our logistics revenue are the rate per mile and other charges we receive from our customers.
In addition to the factors discussed above, our operating revenue is also affected by, among other things, the United States economy, inventory levels, the level of truck and rail capacity in the transportation market and specific customer demand.
Our operating revenue increased $11.0 million, or 2.2%, in 2010. This increase was primarily due to fuel surcharge revenue increasing by $20.2 million, or 36.2%, caused by significantly higher fuel prices in 2010. Our operating revenue, net of fuel surcharges, decreased $9.1 million, or 2.0%, compared with 2009. Truckload segment revenue, net of fuel surcharges, decreased 6.1% primarily due to a decrease in our average fleet size of 253 tractors, or 10.7%, partially offset by an increase in our average truckload revenue, net of fuel surcharges, per tractor per week of 5.2% in 2010. The changes in our operating statistics are primarily the result of the continued growth of our regional temperature-controlled operations, which we have increased to 51.8% of our truckload fleet as of December 31, 2010 from 25.9% as of December 31, 2009. By focusing on shorter lengths of haul in certain defined areas, we are addressing customer trends toward regional distribution to lower their transportation expense, furthering our own objectives of reducing fuel consumption per load, and matching some of our drivers’ desires to stay closer to home. The concentration of a portion of our fleet in these markets is evident in a 13.9% reduction from 2009 in average length of haul to 655 miles. Logistics segment revenue, net of intermodal fuel surcharges, increased 11.7% compared with 2009. The increase in logistics revenue primarily resulted from volume growth in each of our internal brokerage and intermodal services, and in the logistics services provided by MWL. Logistics revenue represented 24.0% of our operating revenue in 2010 compared to 21.6% in 2009 and 16.3% in 2008.
17
Our profitability on the expense side is impacted by variable costs of transporting freight for our customers, fixed costs, and expenses containing both fixed and variable components. The variable costs include fuel expense, driver-related expenses, such as wages, benefits, training, and recruitment, and independent contractor costs, which are recorded under purchased transportation. Expenses that have both fixed and variable components include maintenance and tire expense and our total cost of insurance and claims. These expenses generally vary with the miles we travel, but also have a controllable component based on safety, fleet age, efficiency and other factors. Our main fixed costs relate to the acquisition and financing of long-term assets, such as revenue equipment and operating terminals. We expect our annual cost of tractor and trailer ownership will increase in future periods as a result of higher prices of new equipment. Although certain factors affecting our expenses are beyond our control, we monitor them closely and attempt to anticipate changes in these factors in managing our business. For example, fuel prices fluctuated dramatically at various times during the last several years, with the United States Department of Energy, or DOE, national average cost of fuel increasing to $2.99 per gallon in 2010 from $2.47 per gallon in 2009. We manage our exposure to changes in fuel prices primarily through fuel surcharge programs with our customers, as well as through volume fuel purchasing arrangements with national fuel centers and bulk purchases of fuel at our terminals. To help further reduce fuel expense, we installed auxiliary power units in our tractors to provide climate control and electrical power for our drivers without idling the tractor engine. For our Logistics segment, our profitability on the expense side is impacted by the percentage of logistics revenue we pay to providers for the transportation services we arrange.
Our operating expenses as a percentage of operating revenue, or “operating ratio,” improved to 93.2% in 2010 from 94.2% in 2009. Operating expenses as a percentage of operating revenue, with both amounts net of fuel surcharge revenue, improved to 92.0% for 2010 from 93.5% for 2009. Our net income increased to $19.7 million in 2010 from $16.3 million in 2009. The increased profitability in 2010 was primarily due to the improvement in our overall cost structure and the increase in revenue per tractor per week in our Truckload segment.
Our business requires substantial, ongoing capital investments, particularly for new tractors and trailers. At December 31, 2010, we had approximately $4.4 million of cash and cash equivalents and marketable securities, net of checks issued in excess of cash balances, $19.3 million of long-term debt, including current maturities, and $295.9 million in stockholders’ equity. In 2010, net cash flows provided by operating and financing activities were primarily used to purchase new revenue equipment, net of proceeds from dispositions, in the amount of $69.3 million and to partially construct two regional operating facilities in the amount of $9.6 million. We estimate that capital expenditures, net of proceeds from dispositions, will be approximately $50 million in 2011. We paid our first two quarterly cash dividends of $0.02 per share of common stock in the third and fourth quarters of 2010 totaling $877,000. We believe our sources of liquidity are adequate to meet our current and anticipated needs for at least the next twelve months. Based upon anticipated cash flows, existing cash and cash equivalents balances, current borrowing availability and other sources of financing we expect to be available to us, we do not anticipate any significant liquidity constraints in the foreseeable future.
We have been transforming our business strategy toward a more-diversified set of transportation service solutions, primarily regional temperature-controlled operations along with intermodal and brokerage services, to align our growth with customer trends. We believe that we are well-positioned regardless of the economic environment with this transformation of our services combined with our competitive position, cost control emphasis, modern fleet and strong balance sheet.
This Management’s Discussion and Analysis of Financial Condition and Results of Operations includes discussions of operating, truckload and logistics revenue, and operating expenses as a percentage of operating revenue, each net of fuel surcharge revenue, and net fuel expense (fuel and fuel taxes net of fuel surcharge revenue and surcharges passed through to independent contractors, outside drayage carriers and railroads). We provide these additional disclosures because management believes these measures provide a more consistent basis for comparing results of operations from period to period. These financial measures in this report have not been determined in accordance with U.S. generally accepted accounting principles (GAAP). Pursuant to Item 10(e) of Regulation S-K, we have included the amounts necessary to reconcile these non-GAAP financial measures to the most directly comparable GAAP financial measures, operating revenue, operating expenses divided by operating revenue, and fuel and fuel taxes.
18
Share-based Payment Arrangement Compensation
Total share-based compensation expense recorded in 2010 was $1.3 million ($776,000 net of income tax benefit), in 2009 was $586,000 ($353,000 net of income tax benefit) and in 2008 was $666,000 ($432,000 net of income tax benefit). All share-based compensation expense is recorded in salaries, wages and benefits expense. Unrecognized compensation expense from unvested service-based stock option awards was $1.9 million as of December 31, 2010 and is expected to be recorded over a weighted-average period of 3.3 years. Unrecognized compensation expense from unvested performance unit awards was $875,000 as of December 31, 2010 and will be recorded based on the estimated number of units probable of achieving the vesting requirements of the awards through 2014.
Results of Operations
The following table sets forth for the years indicated certain operating statistics regarding our revenue and operations:
|
2010
|
2009
|
2008
|
||||||||||
|
Truckload Segment:
|
||||||||||||
|
Total Truckload revenue (in thousands)
|
$ | 392,764 | $ | 396,795 | $ | 508,186 | ||||||
|
Average truckload revenue, net of fuel surcharges,
per tractor per week
(1)
|
2,968 | 2,822 | 3,124 | |||||||||
|
Average tractors
(1)
|
2,105 | 2,358 | 2,352 | |||||||||
|
Average miles per trip
|
655 | 761 | 853 | |||||||||
|
Total miles – company-employed drivers (in thousands)
|
193,342 | 206,894 | 222,043 | |||||||||
|
Total miles – independent contractors (in thousands)
|
13,776 | 23,415 | 32,081 | |||||||||
|
Logistics Segment:
|
||||||||||||
| Total Logistics revenue (in thousands) | $ | 124,156 | $ | 109,079 | $ | 98,913 | ||||||
| Brokerage: | ||||||||||||
|
Marten Transport
|
||||||||||||
|
Revenue (in thousands)
|
$ | 41,219 | $ | 35,014 | $ | 24,746 | ||||||
|
Loads
|
21,896 | 18,932 | 11,621 | |||||||||
|
MWL
|
||||||||||||
|
Revenue (in thousands)
|
$ | 35,247 | $ | 32,160 | $ | 37,569 | ||||||
|
Loads
|
18,704 | 17,868 | 18,789 | |||||||||
|
Intermodal:
|
||||||||||||
|
Revenue (in thousands)
|
$ | 47,690 | $ | 41,905 | $ | 36,598 | ||||||
|
Loads
|
20,150 | 18,090 | 11,513 | |||||||||
|
Average tractors
|
67 | 62 | 53 | |||||||||
|
(1)
|
Includes tractors driven by both company-employed drivers and independent contractors. Independent contractors provided 86, 177 and 188 tractors as of December 31, 2010, 2009 and 2008, respectively.
|
19
Comparison of Year Ended December 31, 2010 to Year Ended December 31, 2009
The following table sets forth for the years indicated our operating revenue, operating income and operating ratio by segment, along with the change for each component:
|
Dollar
|
Percentage
|
|||||||||||||||
|
Change
|
Change
|
|||||||||||||||
|
(Dollars in thousands)
|
2010
|
2009
|
2010 vs. 2009
|
2010 vs. 2009
|
||||||||||||
|
Operating revenue:
|
||||||||||||||||
|
Truckload revenue, net of fuel
surcharge revenue
|
$ | 325,791 | $ | 346,983 | $ | (21,192 | ) | (6.1 | )% | |||||||
|
Truckload fuel surcharge revenue
|
66,973 | 49,812 | 17,161 | 34.5 | ||||||||||||
|
Total Truckload revenue
|
392,764 | 396,795 | (4,031 | ) | (1.0 | ) | ||||||||||
|
Logistics revenue, net of intermodal
fuel surcharge revenue
(1)
|
115,223 | 103,166 | 12,057 | 11.7 | ||||||||||||
|
Intermodal fuel surcharge revenue
|
8,933 | 5,913 | 3,020 | 51.1 | ||||||||||||
|
Total Logistics revenue
|
124,156 | 109,079 | 15,077 | 13.8 | ||||||||||||
|
Total operating revenue
|
$ | 516,920 | $ | 505,874 | $ | 11,046 | 2.2 | % | ||||||||
|
Operating income:
|
||||||||||||||||
|
Truckload
|
$ | 28,680 | $ | 22,827 | $ | 5,853 | 25.6 | % | ||||||||
|
Logistics
|
6,609 | 6,532 | 77 | 1.2 | ||||||||||||
|
Total operating income
|
$ | 35,289 | $ | 29,359 | $ | 5,930 | 20.2 | % | ||||||||
|
Operating ratio
(2)
:
|
||||||||||||||||
|
Truckload
|
92.7 | % | 94.2 | % | (1.6 | )% | ||||||||||
|
Logistics
|
94.7 | 94.0 | 0.7 | |||||||||||||
|
Consolidated operating ratio
|
93.2 | % | 94.2 | % | (1.1 | )% | ||||||||||
|
(1)
|
Logistics revenue is net of $9.1 million and $10.2 million of inter-segment revenue in 2010 and 2009, respectively, for loads transported by our tractors and arranged by MWL that have been eliminated in consolidation.
|
|
(2)
|
Represents operating expenses as a percentage of operating revenue.
|
Our operating revenue increased $11.0 million, or 2.2%, to $516.9 million in 2010 from $505.9 million in 2009. Our operating revenue, net of fuel surcharges, decreased $9.1 million, or 2.0%, to $441.0 million in 2010 from $450.1 million in 2009. The decrease in operating revenue, net of fuel surcharges, was due to a decrease in truckload revenue, net of fuel surcharges, partially offset by growth in logistics revenue. Fuel surcharge revenue increased to $75.9 million in 2010 from $55.7 million in 2009, caused by significantly higher fuel prices in 2010.
Truckload segment revenue decreased $4.0 million, or 1.0%, to $392.8 million in 2010 from $396.8 million in 2009. Truckload segment revenue, net of fuel surcharges, decreased 6.1% primarily due to a decrease in our average fleet size of 253 tractors, or 10.7%, partially offset by an increase in our average truckload revenue, net of fuel surcharges, per tractor per week of 5.2% in 2010 from 2009. The changes in our operating statistics are primarily the result of the continued growth of our regional temperature-controlled operations, which we have increased to 51.8% of our truckload fleet as of December 31, 2010 from 25.9% as of December 31, 2009. By focusing on shorter lengths of haul in certain defined areas, we are addressing customer trends toward regional distribution to lower their transportation expense, furthering our own objectives of reducing fuel consumption per load, and matching some of our drivers’ desires to stay closer to home. The concentration of a portion of our fleet in these markets is evident in a 13.9% reduction from 2009 in average length of haul to 655 miles. The improvement in our overall cost structure and the increase in revenue per tractor per week primarily caused the increase in profitability from 2009.
20
Logistics segment revenue increased $15.1 million, or 13.8%, to $124.2 million in 2010 from $109.1 million in 2009. Logistics segment revenue, net of intermodal fuel surcharges, increased 11.7%. The increase in logistics revenue primarily resulted from continued volume growth in each of our internal brokerage and intermodal services, and in the logistics services provided by MWL. The increase in the operating ratio for our logistics segment in 2010 was primarily due to an increase in the payments to carriers for transportation services which we arranged as a percentage of our brokerage revenue due to carrier constraints.
The following table sets forth for the periods indicated the dollar and percentage increase or decrease of the items in our consolidated statements of operations, and those items as a percentage of operating revenue:
|
Dollar
Change
|
Percentage
Change
|
Percentage of
Operating Revenue
|
||||||||||||||
|
(Dollars in thousands)
|
2010 vs. 2009 | 2010 vs. 2009 | 2010 | 2009 | ||||||||||||
|
Operating revenue
|
$ | 11,046 | 2.2 | % | 100.0 | % | 100.0 | % | ||||||||
|
Operating expenses (income):
|
||||||||||||||||
|
Salaries, wages and benefits
|
(7,233 | ) | (5.2 | ) | 25.4 | 27.4 | ||||||||||
|
Purchased transportation
|
3,831 | 3.6 | 21.4 | 21.1 | ||||||||||||
|
Fuel and fuel taxes
|
15,029 | 15.0 | 22.2 | 19.7 | ||||||||||||
|
Supplies and maintenance
|
(3,005 | ) | (7.9 | ) | 6.8 | 7.6 | ||||||||||
|
Depreciation
|
(1,153 | ) | (2.2 | ) | 10.0 | 10.5 | ||||||||||
|
Operating taxes and licenses
|
(450 | ) | (6.7 | ) | 1.2 | 1.3 | ||||||||||
|
Insurance and claims
|
(3,323 | ) | (16.7 | ) | 3.2 | 3.9 | ||||||||||
|
Communications and utilities
|
(206 | ) | (4.9 | ) | 0.8 | 0.8 | ||||||||||
|
Gain on disposition of
revenue equipment
|
520 | 31.9 | (0.2 | ) | (0.3 | ) | ||||||||||
|
Other
|
1,106 | 10.2 | 2.3 | 2.2 | ||||||||||||
|
Total operating expenses
|
5,116 | 1.1 | 93.2 | 94.2 | ||||||||||||
|
Operating income
|
5,930 | 20.2 | 6.8 | 5.8 | ||||||||||||
|
Net interest expense (income)
|
(58 | ) | (181.3 | ) | - | - | ||||||||||
|
Income before income taxes
|
5,988 | 20.4 | 6.8 | 5.8 | ||||||||||||
|
Less: Income before income
taxes attributable
to
noncontrolling interest
|
47 | 8.0 | 0.1 | 0.1 | ||||||||||||
|
Income before income taxes
attributable to
Marten Transport, Ltd.
|
5,941 | 20.7 | 6.7 | 5.7 | ||||||||||||
|
Provision for income taxes
|
2,466 | 19.8 | 2.9 | 2.5 | ||||||||||||
|
Net income
|
$ | 3,475 | 21.4 | % | 3.8 | % | 3.2 | % | ||||||||
21
Salaries, wages and benefits consist of compensation for our employees, including both driver and non-driver employees, employees’ health insurance, 401(k) plan contributions and other fringe benefits. These expenses vary depending upon the ratio of company drivers to independent contractors, our efficiency, our experience with employees’ health insurance claims, changes in health care premiums and other factors. The decrease in salaries, wages and benefits resulted primarily from a 6.6% decrease in the total miles driven by company drivers coupled with a broader implementation of our per diem pay structure for our drivers from 2009 to 2010.
Purchased transportation consists of payments to independent contractor providers of revenue equipment and to carriers for transportation services we arrange in connection with brokerage and intermodal activities. This category will vary depending upon the ratio of company drivers versus independent contractors, the amount of fuel surcharges passed through to independent contractors and the amount and rates, including fuel surcharges, we pay to third-party railroad and motor carriers. Purchased transportation expense increased $3.8 million in total, or 3.6%, in 2010 from 2009. Payments to carriers for transportation services we arranged in our brokerage and intermodal operations increased $12.7 million to $93.5 million in 2010 from $80.7 million in 2009. The portion of purchased transportation expense related to our independent contractors, including fuel surcharges, decreased $8.9 million in 2010, primarily due to a decrease in the number of independent contractor-owned tractors in our fleet. We expect that purchased transportation expense will increase as we continue to grow our Logistics segment.
Net fuel expense (fuel and fuel taxes net of fuel surcharge revenue and surcharges passed through to independent contractors, outside drayage carriers and railroads) decreased $4.2 million, or 8.0%, to $47.9 million in 2010 from $52.1 million in 2009. Fuel surcharges passed through to independent contractors, outside drayage carriers and railroads were $8.9 million in 2010 and $7.9 million in 2009. We have worked diligently to control fuel usage and costs by improving our volume purchasing arrangements and optimizing our drivers’ fuel purchases with national fuel centers, focusing on shorter lengths of haul, installing and tightly managing the use of auxiliary power units in our tractors to minimize engine idling and improving fuel usage in the temperature-control units on our trailers. Auxiliary power units, which we have installed in our company-owned tractors, provide climate control and electrical power for our drivers without idling the tractor engine. The decrease in net fuel expense was primarily due to a 6.6% decrease in the total miles driven by our company-owned fleet and to the cost control measures stated above, which were partially offset by a significant increase in the DOE national average cost of fuel to $2.99 per gallon in 2010 from $2.47 per gallon in 2009. Net fuel expense represented 13.1% of truckload and intermodal revenue, net of fuel surcharges, in 2010, compared with 13.6% in 2009.
Supplies and maintenance consist of repairs, maintenance, tires, parts, oil, and engine fluids, along with load-specific expenses including loading/unloading, tolls, pallets and trailer hostling. The decrease in supplies and maintenance in 2010 primarily resulted from a decrease in outside vendor maintenance on our revenue equipment which we were able to achieve by increasing the capacity of our regional maintenance facilities. Our maintenance practices were consistent with 2009.
Insurance and claims consist of the costs of insurance premiums and the accruals we make for claims within our self-insured retention amounts, primarily for personal injury, property damage, physical damage to our equipment, cargo claims, and workers’ compensation claims. These expenses will vary primarily based upon the frequency and severity of our accident experience, our self-insured retention levels and the market for insurance. The $3.3 million decrease in insurance and claims in 2010 was primarily due to a decrease in the cost of our self-insured auto liability and workers’ compensation accident claims. Our significant self-insured retention exposes us to the possibility of significant fluctuations in claims expense between periods depending on the frequency, severity and timing of claims and to adverse financial results if we incur large or numerous losses.
22
Gain on disposition of revenue equipment decreased to $1.1 million in 2010 from $1.6 million in 2009 as a result of a decrease in the market value for used revenue equipment, which was partially offset by an increase in the number of trailers sold. Future gains or losses on disposition of revenue equipment will be impacted by the market for used revenue equipment, which is beyond our control. We do not expect our gain on disposition to improve in the near future as we believe that there are few buyers with adequate financing in comparison with available inventory.
As a result of the foregoing factors, our operating expenses as a percentage of operating revenue, or “operating ratio,” improved to 93.2% in 2010 from 94.2% in 2009. The operating ratio for our Truckload segment improved to 92.7% from 94.2% in 2009 and the operating ratio for our Logistics segment increased to 94.7% from 94.0% in 2009. Operating expenses as a percentage of operating revenue, with both amounts net of fuel surcharge revenue, improved to 92.0% for 2010 from 93.5% for 2009.
Our effective income tax rate was 43.1% in 2010 and 43.4% in 2009.
As a result of the factors described above, net income increased to $19.7 million in 2010 from $16.3 million in 2009. Net earnings increased to $0.90 per diluted share in 2010 from $0.74 per diluted share in 2009.
23
Comparison of Year Ended December 31, 2009 to Year Ended December 31, 2008
The following table sets forth for the years indicated our operating revenue, operating income and operating ratio by segment, along with the change for each component:
|
Dollar
|
Percentage
|
|||||||||||||||
|
Change
|
Change
|
|||||||||||||||
|
(Dollars in thousands)
|
2009
|
2008
|
2009 vs. 2008
|
2009 vs. 2008
|
||||||||||||
|
Operating revenue:
|
||||||||||||||||
|
Truckload revenue, net of fuel
surcharge revenue
|
$ | 346,983 | $ | 384,264 | $ | (37,281 | ) | (9.7 | )% | |||||||
|
Truckload fuel surcharge revenue
|
49,812 | 123,922 | (74,110 | ) | (59.8 | ) | ||||||||||
|
Total Truckload revenue
|
396,795 | 508,186 | (111,391 | ) | (21.9 | ) | ||||||||||
|
Logistics revenue, net of intermodal
fuel surcharge revenue
(1)
|
103,166 | 90,194 | 12,972 | 14.4 | ||||||||||||
|
Intermodal fuel surcharge revenue
|
5,913 | 8,719 | (2,806 | ) | (32.2 | ) | ||||||||||
|
Total Logistics revenue
|
109,079 | 98,913 | 10,166 | 10.3 | ||||||||||||
|
Total operating revenue
|
$ | 505,874 | $ | 607,099 | $ | (101,225 | ) | (16.7 | )% | |||||||
|
Operating income:
|
||||||||||||||||
|
Truckload
|
$ | 22,827 | $ | 26,055 | $ | (3,228 | ) | (12.4 | )% | |||||||
|
Logistics
|
6,532 | 6,650 | (118 | ) | (1.8 | ) | ||||||||||
|
Total operating income
|
$ | 29,359 | $ | 32,705 | $ | (3,346 | ) | (10.2 | )% | |||||||
|
Operating ratio
(2)
:
|
||||||||||||||||
|
Truckload
|
94.2 | % | 94.9 | % | (0.7 | )% | ||||||||||
|
Logistics
|
94.0 | 93.3 | 0.8 | |||||||||||||
|
Consolidated operating ratio
|
94.2 | % | 94.6 | % | (0.4 | )% | ||||||||||
|
(1)
|
Logistics revenue is net of $10.2 million and $16.8 million of inter-segment revenue in 2009 and 2008, respectively, for loads transported by our tractors and arranged by MWL that have been eliminated in consolidation.
|
|
(2)
|
Represents operating expenses as a percentage of operating revenue.
|
Our operating revenue decreased $101.2 million, or 16.7%, to $505.9 million in 2009 from $607.1 million in 2008. This decrease was primarily due to fuel surcharge revenue decreasing to $55.7 million in 2009 from $132.6 million in 2008, caused by significantly lower fuel prices in 2009. Our operating revenue, net of fuel surcharges, decreased $24.3 million, or 5.1%, to $450.1 million in 2009 from $474.5 million in 2008. The decrease in operating revenue, net of fuel surcharges, was due to a decrease in truckload revenue, net of fuel surcharges, partially offset by growth in logistics revenue.
Truckload segment revenue decreased $111.4 million, or 21.9%, to $396.8 million in 2009 from $508.2 million in 2008. Truckload segment revenue, net of fuel surcharges, decreased 9.7% primarily due to a decrease in our average truckload revenue, net of fuel surcharges, per tractor per week of 9.7% in 2009. The reduction in revenue per tractor per week was primarily caused by a decrease in our average miles per tractor in 2009 due to the difficult freight environment. The changes in our operating statistics are consistent with the continued growth of our regional temperature-controlled operations. By focusing on shorter lengths of haul in certain defined areas, we are addressing customer trends toward regional distribution to lower their transportation expense, furthering our own objectives of reducing fuel consumption per load, and matching some of our drivers’ desires to stay closer to home. The concentration of a portion of our fleet in these markets is evident in a 10.8% reduction from 2008 in average length of haul to 761 miles. Our average fleet size was relatively stable in 2009 compared with 2008. The decrease in revenue per tractor per week, partially offset by the improvement in our overall cost structure, primarily caused the decrease in profitability from 2008.
24
Logistics segment revenue increased $10.2 million, or 10.3%, to $109.1 million in 2009 from $98.9 million in 2008. Logistics segment revenue, net of intermodal fuel surcharges, increased 14.4%. The increase in logistics revenue primarily resulted from continued volume growth in each of our internal brokerage and intermodal services, partially offset by a decrease in revenue generated by MWL. Within the difficult freight environment, our operating ratio for the Logistics segment in 2009 increased by 0.8% from 2008.
The following table sets forth for the years indicated the dollar and percentage increase or decrease of the items in our consolidated statements of operations, and those items as a percentage of operating revenue:
|
Dollar
Change
|
Percentage
Change
|
Percentage of
Operating Revenue
|
||||||||||||||
|
(Dollars in thousands)
|
2009 vs. 2008 | 2009 vs. 2008 | 2009 | 2008 | ||||||||||||
|
Operating revenue
|
$ | (101,225 | ) | (16.7 | )% | 100.0 | % | 100.0 | % | |||||||
|
Operating expenses (income):
|
||||||||||||||||
|
Salaries, wages and benefits
|
(13,864 | ) | (9.1 | ) | 27.4 | 25.1 | ||||||||||
|
Purchased transportation
|
(6,598 | ) | (5.8 | ) | 21.1 | 18.6 | ||||||||||
|
Fuel and fuel taxes
|
(75,994 | ) | (43.2 | ) | 19.7 | 29.0 | ||||||||||
|
Supplies and maintenance
|
(155 | ) | (0.4 | ) | 7.6 | 6.3 | ||||||||||
|
Depreciation
|
3,364 | 6.8 | 10.5 | 8.2 | ||||||||||||
|
Operating taxes and licenses
|
(57 | ) | (0.8 | ) | 1.3 | 1.1 | ||||||||||
|
Insurance and claims
|
(5,513 | ) | (21.7 | ) | 3.9 | 4.2 | ||||||||||
|
Communications and utilities
|
430 | 11.5 | 0.8 | 0.6 | ||||||||||||
|
Gain on disposition of revenue equipment
|
1,034 | 38.8 | (0.3 | ) | (0.4 | ) | ||||||||||
|
Other
|
(526 | ) | (4.6 | ) | 2.2 | 1.9 | ||||||||||
|
Total operating expenses
|
(97,879 | ) | (17.0 | ) | 94.2 | 94.6 | ||||||||||
|
Operating income
|
(3,346 | ) | (10.2 | ) | 5.8 | 5.4 | ||||||||||
|
Net interest expense (income)
|
(926 | ) | (96.7 | ) | - | 0.2 | ||||||||||
|
Income before income taxes
|
(2,420 | ) | (7.6 | ) | 5.8 | 5.2 | ||||||||||
|
Less: Income before income taxes attributable
to noncontrolling interest
|
(536 | ) | (47.9 | ) | 0.1 | 0.2 | ||||||||||
|
Income before income taxes attributable to
Marten Transport, Ltd.
|
(1,884 | ) | (6.2 | ) | 5.7 | 5.0 | ||||||||||
|
Provision for income taxes
|
(80 | ) | (0.6 | ) | 2.5 | 2.1 | ||||||||||
|
Net income
|
$ | (1,804 | ) | (10.0 | )% | 3.2 | % | 3.0 | % | |||||||
The decrease in salaries, wages and benefits resulted primarily from a 6.8% decrease in the total miles driven by company drivers coupled with a more broad implementation of our per diem pay structure for our drivers in 2009, a $3.4 million decrease in our self-insured medical claims, which decreased our employees’ health insurance expense, and a $1.6 million decrease in bonus compensation expensed for our non-driver employees.
Purchased transportation expense decreased $6.6 million in total, or 5.8%, in 2009 from 2008. Payments to carriers for transportation services we arranged in our brokerage and intermodal operations increased $6.9 million to $80.7 million in 2009 from $73.8 million in 2008. The portion of purchased transportation expense related to our independent contractors, including fuel surcharges, decreased $13.5 million in 2009, primarily due to a decrease in the amount of fuel surcharges paid to the independent contractors and a decrease in the number of independent contractor-owned tractors in our fleet.
25
Net fuel expense (fuel and fuel taxes net of fuel surcharge revenue and surcharges passed through to independent contractors, outside drayage carriers and railroads) decreased $9.3 million, or 15.2%, to $52.1 million in 2009 from $61.4 million in 2008. Fuel surcharges passed through to independent contractors, outside drayage carriers and railroads were $7.9 million in 2009 and $18.2 million in 2008. We have worked diligently to control fuel usage and costs by improving our volume purchasing arrangements and optimizing our drivers’ fuel purchases with national fuel centers, focusing on shorter lengths of haul, installing and tightly managing the use of auxiliary power units in our tractors to minimize engine idling and improving fuel usage in the temperature-control units on our trailers. The decrease in net fuel expense was primarily due to a significant decrease in the DOE national average cost of fuel to $2.47 per gallon in 2009 from $3.80 per gallon in 2008, a 6.8% decrease in the total miles driven by our company-owned fleet and to the cost control measures stated above. Net fuel expense represented 13.6% of truckload and intermodal revenue, net of fuel surcharges, in 2009, compared with 14.9% in 2008.
Depreciation relates to owned tractors, trailers, auxiliary power units, communications units, terminal facilities and other assets. The increase in depreciation was primarily due to a continued increase in the cost of revenue equipment and an increase in the relative percentage of company-owned tractors to independent contractor-owned tractors in 2009. We expect our annual cost of tractor and trailer ownership will increase in future periods as a result of higher prices of new equipment, which will result in greater depreciation over the useful life.
The $5.5 million decrease in insurance and claims in 2009 was primarily due to a decrease in the cost of our self-insured auto liability and workers’ compensation accident claims and to reduced physical damage claims related to our tractors and trailers.
Gain on disposition of revenue equipment decreased to $1.6 million in 2009 from $2.7 million in 2008 as a result of a decrease in the market value for used revenue equipment, which was partially offset by an increase in the number of trailers sold.
As a result of the foregoing factors, our operating expenses as a percentage of operating revenue, or “operating ratio”, was 94.2% in 2009 compared with 94.6% in 2008. The operating ratio for our Truckload segment decreased to 94.2% from 94.9% in 2008 and the operating ratio for our Logistics segment increased to 94.0% from 93.3% in 2008. The more broad implementation of our per diem pay structure for our drivers in 2009 positively impacted our operating ratio in 2009 compared with 2008.
The decrease in net interest expense of $926,000, or 96.7%, in 2009 from 2008 was primarily the result of lower average debt balances outstanding.
Our effective income tax rate increased to 43.4% in 2009 from 41.0% in 2008, primarily because of the nondeductible effect of a per diem pay structure for our drivers adopted in the first quarter of 2008 which was more broadly implemented during 2009.
As a result of the factors described above, net income decreased to $16.3 million in 2009 from $18.1 million in 2008. Net earnings decreased to $0.74 per diluted share in 2009 from $0.82 per diluted share in 2008.
26
Liquidity and Capital Resources
Our business requires substantial, ongoing capital investments, particularly for new tractors and trailers. Our primary sources of liquidity are funds provided by operations and our revolving credit facility. A portion of our tractor fleet is provided by independent contractors who own and operate their own equipment. We have no capital expenditure requirements relating to those drivers who own their tractors or obtain financing through third parties.
The table below reflects our net cash flows provided by operating activities, net cash flows used for investing activities and net cash flows provided by (used for) financing activities for the years indicated.
|
(In thousands)
|
2010
|
2009
|
2008
|
|||||||||
|
Net cash flows provided by operating
activities
|
$ | 64,522 | $ | 81,686 | $ | 77,044 | ||||||
|
Net cash flows (used for)
investing activities
|
(81,181 | ) | (77,164 | ) | (37,602 | ) | ||||||
|
Net cash flows provided by (used for)
financing activities
|
16,555 | (1,507 | ) | (40,665 | ) | |||||||
In 2010, net cash flows provided by operating and financing activities were primarily used to purchase new revenue equipment, net of proceeds from dispositions, in the amount of $69.3 million and to partially construct two regional operating facilities in the amount of $9.6 million. We estimate that capital expenditures, net of proceeds from dispositions, will be approximately $50 million in 2011. We paid our first two quarterly cash dividends of $0.02 per share of common stock in the third and fourth quarters of 2010 totaling $877,000. We currently expect to continue to pay quarterly cash dividends in the future. The payment of cash dividends in the future, and the amount of any such dividends, will depend upon our financial condition, results of operations, cash requirements, and certain corporate law requirements, as well as other factors deemed relevant by our Board of Directors. We believe our sources of liquidity are adequate to meet our current and anticipated needs for at least the next twelve months. Based upon anticipated cash flows, existing cash and cash equivalents balances, current borrowing availability and other sources of financing we expect to be available to us, we do not anticipate any significant liquidity constraints in the foreseeable future.
We maintain a credit agreement that provides for a five-year unsecured committed credit facility maturing in September 2011 in an aggregate principal amount of up to $50 million. The aggregate principal amount of the credit facility may be increased at our option, subject to completion of signed amendments with participating banks, up to a maximum aggregate principal amount of $100 million. At December 31, 2010, the credit facility had an outstanding principal balance of $19.3 million, outstanding standby letters of credit of $8.3 million and remaining borrowing availability of $22.4 million. The $19.3 million increase in the outstanding principal balance of the credit facility from December 31, 2009 primarily resulted from the excess of capital expenditures, net of proceeds from dispositions, over the amount of net cash flows provided by operating activities. This facility bears interest at a variable rate based on the London Interbank Offered Rate or the agent bank’s Prime Rate, in each case plus/minus applicable margins. The weighted average interest rate for the facility was 0.86% at December 31, 2010. The $19.3 million outstanding principal balance on the credit facility was classified as a current liability in our consolidated balance sheet as of December 31, 2010 because the maturity date of the facility is within the next twelve months. Prior to the maturity of our current credit agreement, we plan on entering into an agreement with a bank, subject to agreement by such bank, for a credit agreement that also provides for an unsecured committed credit facility.
Our credit facility prohibits us from paying, in any fiscal year, dividends in excess of 25% of our net income from the prior fiscal year. This facility also contains restrictive covenants which, among other matters, require us to maintain compliance with certain cash flow leverage and fixed charge coverage ratios. We were in compliance with all of these covenants at December 31, 2010.
27
In December 2007, our Board of Directors approved a share repurchase program to repurchase up to one million shares of our common stock either through purchases on the open market or through private transactions. The timing and extent to which we will repurchase shares depends on market conditions and other corporate considerations. In the first quarter of 2008 we repurchased and retired 67,500 shares of our common stock for $810,000. We made no purchases in 2010, 2009, or in the remainder of 2008. The repurchase program does not have an expiration date.
The following is a summary of our contractual obligations as of December 31, 2010.
|
Payments Due by Period
|
||||||||||||||||||||
|
2012
|
2014
|
|||||||||||||||||||
|
And
|
And
|
|||||||||||||||||||
|
(In thousands)
|
2011
|
2013
|
2015
|
Thereafter
|
Total
|
|||||||||||||||
|
Long-term debt obligations
|
$ | 19,346 | $ | — | $ | — | $ | — | $ | 19,346 | ||||||||||
|
Purchase obligations for revenue equipment
|
9,381 | — | — | — | 9,381 | |||||||||||||||
|
Building construction
obligations
|
2,856 | — | — | — | 2,856 | |||||||||||||||
|
Operating lease obligations
|
627 | 459 | 3 | — | 1,089 | |||||||||||||||
|
Total
|
$ | 32,210 | $ | 459 | $ | 3 | $ | — | $ | 32,672 | ||||||||||
Related Parties
We purchase fuel and obtain tires and related services from Bauer Built, Inc., or BBI. Jerry M. Bauer, one of our directors, is the president and a stockholder of BBI. We paid BBI $815,000 in 2010, $796,000 in 2009 and $1.4 million in 2008 for fuel and tire services. In addition, we paid $1.7 million in 2010, $1.5 million in 2009 and $2.3 million in 2008 to tire manufacturers for tires that we purchased from the tire manufacturers but were provided by BBI. BBI received commissions from the tire manufacturers related to these purchases. Other than any benefit received from his ownership interest, Mr. Bauer receives no compensation or other benefits from our business with BBI.
We paid Durand Builders Service, Inc. $262,000 in 2010, $1.1 million in 2009 and $564,000 in 2008 for various construction projects. Larry B. Hagness, one of our directors, is the president and owner of Durand Builders Service, Inc. Other than any benefit received from his ownership interest, Mr. Hagness receives no compensation or other benefits from these transactions.
In August 2008, we acquired a building adjacent to our headquarters which will be used for maintenance and storage from Randolph L. Marten, our Chairman of the Board and Chief Executive Officer, in a like-kind exchange for a partially constructed building of equal value owned by Marten Transport. Each of the buildings were valued at $291,000 at the time of the exchange.
We believe that the transactions with related parties noted above are on reasonable terms which, based upon market rates, are comparable to terms available from unaffiliated third parties.
Off-balance Sheet Arrangements
Other than standby letters of credit maintained in connection with our self-insurance programs in the amount of $8.3 million and operating leases summarized above in our summary of contractual obligations, we did not have any other material off-balance sheet arrangements at December 31, 2010.
28
Inflation and Fuel Costs
Most of our operating expenses are inflation-sensitive, with inflation generally producing increased costs of operations. During the past three years, the most significant effects of inflation have been on revenue equipment prices, accident claims, health insurance and employee compensation. We attempt to limit the effects of inflation through increases in freight rates and cost control efforts.
In addition to inflation, fluctuations in fuel prices can affect our profitability. We require substantial amounts of fuel to operate our tractors and power the temperature-control units on our trailers. Substantially all of our contracts with customers contain fuel surcharge provisions. Although we historically have been able to pass through a significant portion of long-term increases in fuel prices and related taxes to customers in the form of surcharges and higher rates, such increases usually are not fully recovered. These surcharge provisions are not effective in mitigating the fuel price increases related to non-revenue miles or fuel used while the tractor is idling.
Seasonality
Our tractor productivity generally decreases during the winter season because inclement weather impedes operations and some shippers reduce their shipments. At the same time, operating expenses generally increase, with harsh weather creating higher accident frequency, increased claims and more equipment repairs.
Critical Accounting Policies
The preparation of financial statements in conformity with U.S. generally accepted accounting principles requires management to make estimates and assumptions about future events, and apply judgments that affect the reported amounts of assets, liabilities, revenue and expenses in our consolidated financial statements and related notes. We base our estimates, assumptions and judgments on historical experience, current trends and other factors believed to be relevant at the time our consolidated financial statements are prepared. However, because future events and their effects cannot be determined with certainty, actual results could differ from our estimates and assumptions, and such differences could be material. We believe that the following critical accounting policies affect our more significant estimates, assumptions and judgments used in the preparation of our consolidated financial statements.
Revenue Recognition.
We recognize revenue, including fuel surcharges, at the time shipment of freight is completed. We account for revenue of our Logistics segment and revenue on freight transported by independent contractors within our Truckload segment on a gross basis because we are the primary obligor in the arrangements, we have the ability to establish prices, we have the risk of loss in the event of cargo claims and we bear credit risk with customer payments. Accordingly, all such revenue billed to customers is classified as operating revenue and all corresponding payments to carriers for transportation services we arrange in connection with brokerage and intermodal activities and to independent contractor providers of revenue equipment are classified as purchased transportation expense.
Accounts Receivable.
We are dependent upon a limited number of customers, and, as a result, our trade accounts receivable are highly concentrated. Trade accounts receivable are recorded at the invoiced amounts, net of an allowance for doubtful accounts. Our allowance for doubtful accounts was $170,000 as of December 31, 2010 and $245,000 as of December 31, 2009. A considerable amount of judgment is required in assessing the realization of these receivables including the current creditworthiness of each customer and related aging of the past-due balances, including any billing disputes. In order to assess the collectibility of these receivables, we perform ongoing credit evaluations of our customers’ financial condition. Through these evaluations, we may become aware of a situation where a customer may not be able to meet its financial obligations due to deterioration of its financial viability, credit ratings or bankruptcy. The allowance for doubtful accounts is based on the best information available to us and is reevaluated and adjusted as additional information is received. We evaluate the allowance based on historical write-off experience, the size of the individual customer balances, past-due amounts and the overall national economy. We review the adequacy of our allowance for doubtful accounts monthly.
29
Property and Equipment.
The transportation industry requires significant capital investments. Our net property and equipment was $372.1 million as of December 31, 2010 and $341.5 million as of December 31, 2009. Our depreciation expense was $51.9 million in 2010, $53.1 million in 2009 and $49.7 million in 2008. We compute depreciation of our property and equipment for financial reporting purposes based on the cost of each asset, reduced by its estimated salvage value, using the straight-line method over its estimated useful life. We determine and periodically evaluate our estimate of the projected salvage values and useful lives primarily by considering the market for used equipment, prior useful lives and changes in technology. We have not changed our policy regarding salvage values as a percentage of initial cost or useful lives of tractors and trailers within the last ten years. We believe that our policies and past estimates have been reasonable. Actual results could differ from these estimates. A 5% decrease in estimated salvage values would have decreased our net property and equipment as of December 31, 2010 by approximately $8.1 million, or 2.2%.
In 2010, we replaced most of our company-owned tractors within approximately 4.5 years and our trailers within approximately six years after purchase. Our useful lives for depreciating tractors is five years and trailers is seven years, with a 25% salvage value for tractors and a 35% salvage value for trailers. These salvage values are based upon the expected market values of the equipment after five years for tractors and seven years for trailers. Depreciation expense calculated in this manner approximates the continuing declining value of the revenue equipment, and continues at a consistent straight-line rate for units held beyond the normal replacement cycle. Calculating tractor depreciation expense with a five-year useful life and a 25% salvage value results in the same depreciation rate of 15% of cost per year and the same net book value of 32.5% of cost at the 4.5-year replacement date as using a 4.5-year useful life and 32.5% salvage value. As a result, there is no difference in recorded depreciation expense on a quarterly or annual basis with our five-year useful life and 25% salvage value compared with a 4.5-year useful life and 32.5% salvage value. Similarly, calculating trailer depreciation expense with a seven-year useful life and a 35% salvage value results in the same depreciation rate of 9.3% of cost per year and the same net book value of 44.3% of cost at the six-year replacement date as using a six-year useful life and 44.3% salvage value. As a result, there is no difference in recorded depreciation expense on a quarterly or annual basis with our seven-year useful life and 35% salvage value compared with a six-year useful life and 44.3% salvage value.
Impairment of Assets.
Long-lived assets are reviewed for impairment whenever events or changes in circumstances indicate that the carrying amount of an asset may not be recoverable. Recoverability of assets to be held and used is measured by a comparison of the carrying amount of an asset to future net undiscounted cash flows expected to be generated by the asset. If such assets are considered to be impaired, the impairment to be recognized is measured by the amount by which the carrying amount of the assets exceeds the fair value of the assets. Assets to be disposed of are reported at the lower of the carrying amount or fair value less the costs to sell.
Insurance and Claims.
We self-insure, in part, for losses relating to workers’ compensation, auto liability, general liability, cargo and property damage claims, along with employees’ health insurance with varying risk retention levels. We maintain insurance coverage for per-incident and total losses in excess of these risk retention levels in amounts we consider adequate based upon historical experience and our ongoing review. However, we could suffer a series of losses within our self-insured retention limits or losses over our policy limits, which could negatively affect our financial condition and operating results. We have $8.3 million in standby letters of credit to guarantee settlement of claims under agreements with our insurance carriers and regulatory authorities. The insurance and claims accruals in our consolidated balance sheets were $17.7 million as of December 31, 2010, and $19.2 million as of December 31, 2009. We reserve currently for the estimated cost of the uninsured portion of pending claims. We periodically evaluate and adjust these reserves based on our evaluation of the nature and severity of outstanding individual claims and our estimate of future claims development based on historical claims development factors. We believe that our claims development factors have historically been reasonable, as indicated by the adequacy of our insurance and claims accruals compared to settled claims. Actual results could differ from these current estimates. In addition, to the extent that claims are litigated and not settled, jury awards are difficult to predict. If our claims settlement experience worsened causing our historical claims development factors to increase by 5%, our estimated outstanding loss reserves as of December 31, 2010 would have needed to increase by approximately $3.7 million.
30
Share-based Payment Arrangement Compensation.
We have granted stock options to certain employees and non-employee directors. We recognize compensation expense for all stock options granted after December 31, 2005 net of an estimated forfeiture rate and only record compensation expense for those shares expected to vest on a straight-line basis over the requisite service period (normally the vesting period). Determining the appropriate fair value model and calculating the fair value of stock options require the input of highly subjective assumptions, including the expected life of the stock options and stock price volatility. We use the Black-Scholes model to value our stock option awards. We believe that future volatility will not materially differ from our historical volatility. Thus, we use the historical volatility of our common stock over the expected life of the award. The assumptions used in calculating the fair value of stock options represent our best estimates, but these estimates involve inherent uncertainties and the application of judgment. As a result, if factors change and we use different assumptions, stock option compensation expense could be materially different in the future.
In August 2010, we also granted performance unit awards to certain employees which are subject to vesting requirements over a five-year period, primarily based on our earnings growth. The fair value of each performance unit is based on the closing market price on the date of grant. We recognize compensation expense for these awards based on the estimated number of units probable of achieving the vesting requirements of the awards, net of an estimated forfeiture rate.
31
|
ITEM 7A.
|
QUANTITATIVE AND QUALITATIVE DISCLOSURES ABOUT MARKET RISK |
We are exposed to a variety of market risks, most importantly the effects of the price and availability of diesel fuel and changes in interest rates.
We require substantial amounts of diesel fuel to operate our tractors and power the temperature-control units on our trailers. The price and availability of diesel fuel can vary, and are subject to political, economic and market factors that are beyond our control. Significant increases in diesel fuel costs could materially and adversely affect our results of operations and financial condition. Based upon our fuel consumption in 2010, a 5% increase in the average cost of diesel fuel would have increased our fuel expense by $5.6 million.
We have historically been able to pass through a significant portion of long-term increases in diesel fuel prices and related taxes to customers in the form of fuel surcharges. Fuel surcharge programs are widely accepted among our customers, though they can vary somewhat from customer-to-customer. These fuel surcharges, which adjust weekly with the cost of fuel, enable us to recover a substantial portion of the higher cost of fuel as prices increase. These fuel surcharge provisions are not effective in mitigating the fuel price increases related to non-revenue miles or fuel used while the tractor is idling. In addition, we have worked diligently to control fuel usage and costs by improving our volume purchasing arrangements and optimizing our drivers’ fuel purchases with national fuel centers, focusing on shorter lengths of haul, installing and tightly managing the use of auxiliary power units in our tractors to minimize engine idling and improving fuel usage in the temperature-control units on our trailers.
While we do not currently have any outstanding hedging instruments to mitigate this market risk, we may enter into derivatives or other financial instruments to hedge a portion of our fuel costs in the future.
Our market risk is also affected by changes in interest rates. We maintain a revolving credit facility which bears interest at a variable rate based on the London Interbank Offered Rate or the agent bank’s Prime Rate, in each case plus/minus applicable margins. The weighted average interest rate for the facility was 0.86% at December 31, 2010. As of December 31, 2010, we had borrowed $19.3 million under the credit facility. Based on such outstanding amount, a one percentage point increase in market interest rates would cost us $193,000 in additional gross interest cost on an annual basis.
32
|
ITEM 8.
|
FINANCIAL STATEMENTS AND SUPPLEMENTARY DATA |
Management’s Annual Report on Internal Control Over Financial Reporting
Management is responsible for establishing and maintaining an adequate system of internal control over financial reporting as defined in Rules 13a-15(f) and 15d-15(f) under the Securities Exchange Act of 1934, as amended, for Marten Transport, Ltd. and subsidiaries (the “Company”). This system is designed to provide reasonable assurance regarding the reliability of financial reporting and the preparation of financial statements for external purposes in accordance with U.S. generally accepted accounting principles.
The Company’s internal control over financial reporting includes those policies and procedures that (i) pertain to the maintenance of records that, in reasonable detail, accurately and fairly reflect the transactions and dispositions of the assets of the Company; (ii) provide reasonable assurance that transactions are recorded as necessary to permit preparation of financial statements in accordance with generally accepted accounting principles, and that receipts and expenditures of the Company are being made only in accordance with authorizations of management and directors of the Company; and (iii) provide reasonable assurance regarding prevention or timely detection of unauthorized acquisition, use, or disposition of the Company’s assets that could have a material effect on the financial statements.
Because of its inherent limitations, internal control over financial reporting may not prevent or detect misstatements and even when determined to be effective, can only provide reasonable assurance with respect to financial statement preparation and presentation. Also, projection of any evaluation of the effectiveness of internal control over financial reporting to future periods is subject to the risk that controls may become inadequate because of changes in conditions, or that the degree or compliance with the policies or procedures may deteriorate.
Management, with the participation of the Company’s Chairman of the Board and Chief Executive Officer and Chief Financial Officer, evaluated the effectiveness of the Company’s internal control over financial reporting as of December 31, 2010. In making this evaluation, management used the criteria set forth by the Committee of Sponsoring Organizations of the Treadway Commission (COSO) in
Internal Control – Integrated Framework
. Based on this assessment, management concluded that the Company’s internal control over financial reporting was effective as of December 31, 2010. Further, the Company’s independent registered public accounting firm, KPMG LLP, has issued a report on the Company’s internal controls over financial reporting on page 34 of this Report.
March 15, 2011
33
Report of Independent Registered Public Accounting Firm
To the Board of Directors and Stockholders of Marten Transport, Ltd.:
We have audited the accompanying consolidated balance sheets of Marten Transport, Ltd. and subsidiaries (the Company) as of December 31, 2010 and 2009 and the related consolidated statements of operations, stockholders’ equity, and cash flows for each of the years in the three-year period ended December 31, 2010. In connection with our audits of the consolidated financial statements, we also have audited the financial statement schedule listed in Item 15(a)(2). We also have audited the Company’s internal control over financial reporting as of December 31, 2010 based on criteria established in
Internal Control - Integrated Framework
issued by the Committee of Sponsoring Organizations of the Treadway Commission (COSO). The Company’s management is responsible for these consolidated financial statements, for maintaining effective internal control over financial reporting, and for its assessment of the effectiveness of internal control over financial reporting, included in the accompanying Management’s Report on Internal Control Over Financial Reporting. Our responsibility is to express an opinion on these consolidated financial statements and financial statement schedule and an opinion on the Company’s internal control over financial reporting based on our audits.
We conducted our audits in accordance with the standards of the Public Company Accounting Oversight Board (United States). Those standards require that we plan and perform the audits to obtain reasonable assurance about whether the financial statements are free of material misstatement and whether effective internal control over financial reporting was maintained in all material respects. Our audits of the consolidated financial statements included examining, on a test basis, evidence supporting the amounts and disclosures in the financial statements, assessing the accounting principles used and significant estimates made by management, and evaluating the overall financial statement presentation. Our audit of internal control over financial reporting included obtaining an understanding of internal control over financial reporting, assessing the risk that a material weakness exists, and testing and evaluating the design and operating effectiveness of internal control based on the assessed risk. Our audits also included performing such other procedures as we considered necessary in the circumstances. We believe that our audits provide a reasonable basis for our opinions.
A company’s internal control over financial reporting is a process designed to provide reasonable assurance regarding the reliability of financial reporting and the preparation of financial statements for external purposes in accordance with generally accepted accounting principles. A company’s internal control over financial reporting includes those policies and procedures that (1) pertain to the maintenance of records that, in reasonable detail, accurately and fairly reflect the transactions and dispositions of the assets of the company; (2) provide reasonable assurance that transactions are recorded as necessary to permit preparation of financial statements in accordance with generally accepted accounting principles, and that receipts and expenditures of the company are being made only in accordance with authorizations of management and directors of the company; and (3) provide reasonable assurance regarding prevention or timely detection of unauthorized acquisition, use, or disposition of the company’s assets that could have a material effect on the financial statements.
Because of its inherent limitations, internal control over financial reporting may not prevent or detect misstatements. Also, projections of any evaluation of effectiveness to future periods are subject to the risk that controls may become inadequate because of changes in conditions or that the degree of compliance with the policies or procedures may deteriorate.
In our opinion, the consolidated financial statements referred to above present fairly, in all material respects, the financial position of Marten Transport, Ltd. and subsidiaries as of December 31, 2010 and 2009 and the results of their operations and their cash flows for each of the years in the three-year period ended December 31, 2010, in conformity with accounting principles generally accepted in the United States of America. Also, in our opinion, the accompanying financial statement schedule, when considered in relation to the basic consolidated financial statements taken as a whole, presents fairly, in all material respects, the information set forth therein. It is also in our opinion, Marten Transport, Ltd. maintained, in all material respects, effective internal control over financial reporting as of December 31, 2010 based on criteria established in
Internal Control - Integrated Framework
issued by the Committee of Sponsoring Organizations of the Treadway Commission.
As discussed in Note 1 to the consolidated financial statements, the Company adopted FASB Statement of Financial Accounting Standards No. 160, “Noncontrolling Interests in Consolidated Financial Statements – an amendment of ARB 51,” (FASB ASC 810-10-65-1, “Consolidation”) in 2009.
| KPMG LLP |
Minneapolis, Minnesota
March 15, 2011
34
MARTEN TRANSPORT, LTD.
|
December 31,
|
||||||||
|
(In thousands, except share information)
|
2010
|
2009
|
||||||
|
ASSETS
|
||||||||
|
Current assets:
|
||||||||
|
Cash and cash equivalents
|
$ | 5,306 | $ | 5,410 | ||||
|
Marketable securities
|
138 | 118 | ||||||
|
Receivables:
|
||||||||
|
Trade, less allowances of $170 and $245, respectively
|
51,094 | 45,434 | ||||||
|
Other
|
12,968 | 4,382 | ||||||
|
Prepaid expenses and other
|
13,406 | 12,328 | ||||||
|
Deferred income taxes
|
4,794 | 5,172 | ||||||
|
Total current assets
|
87,706 | 72,844 | ||||||
|
Property and equipment:
|
||||||||
|
Revenue equipment
|
469,437 | 455,641 | ||||||
|
Buildings and land
|
25,678 | 18,763 | ||||||
|
Office equipment and other
|
20,507 | 16,723 | ||||||
|
Less accumulated depreciation
|
(143,563 | ) | (149,670 | ) | ||||
|
Net property and equipment
|
372,059 | 341,457 | ||||||
|
Other assets
|
543 | 537 | ||||||
| $ | 460,308 | $ | 414,838 | |||||
|
LIABILITIES AND STOCKHOLDERS’ EQUITY
|
||||||||
|
Current liabilities:
|
||||||||
|
Checks issued in excess of cash balances
|
$ | 1,066 | $ | 1,671 | ||||
|
Accounts payable
|
17,800 | 16,308 | ||||||
|
Insurance and claims accruals
|
17,653 | 19,222 | ||||||
|
Accrued liabilities
|
12,724 | 15,588 | ||||||
|
Current maturities of long-term debt
|
19,346 | 1,428 | ||||||
|
Total current liabilities
|
68,589 | 54,217 | ||||||
|
Long-term debt,
less current maturities
|
— | 71 | ||||||
|
Deferred income taxes
|
95,815 | 85,643 | ||||||
|
Total liabilities
|
164,404 | 139,931 | ||||||
|
Commitments and contingencies
(
Note 12
)
|
||||||||
|
Stockholders’ equity:
|
||||||||
|
Marten Transport, Ltd. stockholders’ equity:
|
||||||||
|
Preferred stock, $.01 par value per share; 2,000,000 shares
|
||||||||
|
authorized; no shares issued and outstanding
|
— | — | ||||||
|
Common stock, $.01 par value per share; 48,000,000 shares
|
||||||||
|
authorized; 21,950,252 shares at December 31, 2010,
|
||||||||
|
and 21,885,073 shares at December 31, 2009, issued
|
||||||||
|
and outstanding
|
220 | 219 | ||||||
|
Additional paid-in capital
|
78,428 | 76,477 | ||||||
|
Retained earnings
|
215,345 | 196,480 | ||||||
|
Total Marten Transport, Ltd. stockholders’ equity
|
293,993 | 273,176 | ||||||
|
Noncontrolling interest
|
1,911 | 1,731 | ||||||
|
Total stockholders’ equity
|
295,904 | 274,907 | ||||||
| $ | 460,308 | $ | 414,838 | |||||
The accompanying notes are an integral part of these consolidated financial statements.
35
MARTEN TRANSPORT, LTD.
|
For the years ended December 31,
|
||||||||||||
|
(
In thousands, except per share information)
|
2010
|
2009
|
2008
|
|||||||||
|
Operating revenue
|
$ | 516,920 | $ | 505,874 | $ | 607,099 | ||||||
|
Operating expenses (income):
|
||||||||||||
|
Salaries, wages and benefits
|
131,519 | 138,752 | 152,616 | |||||||||
|
Purchased transportation
|
110,408 | 106,577 | 113,175 | |||||||||
|
Fuel and fuel taxes
|
114,927 | 99,898 | 175,892 | |||||||||
|
Supplies and maintenance
|
35,218 | 38,223 | 38,378 | |||||||||
|
Depreciation
|
51,916 | 53,069 | 49,705 | |||||||||
|
Operating taxes and licenses
|
6,222 | 6,672 | 6,729 | |||||||||
|
Insurance and claims
|
16,573 | 19,896 | 25,409 | |||||||||
|
Communications and utilities
|
3,964 | 4,170 | 3,740 | |||||||||
|
Gain on disposition of revenue equipment
|
(1,110 | ) | (1,630 | ) | (2,664 | ) | ||||||
|
Other
|
11,994 | 10,888 | 11,414 | |||||||||
| 481,631 | 476,515 | 574,394 | ||||||||||
|
Operating income
|
35,289 | 29,359 | 32,705 | |||||||||
|
Net interest expense (income)
|
(26 | ) | 32 | 958 | ||||||||
|
Income before income taxes
|
35,315 | 29,327 | 31,747 | |||||||||
|
Less: Income before income taxes attributable
|
||||||||||||
|
to noncontrolling interest
|
631 | 584 | 1,120 | |||||||||
|
Income before income taxes
|
||||||||||||
|
attributable to Marten Transport, Ltd.
|
34,684 | 28,743 | 30,627 | |||||||||
|
Provision for income taxes
|
14,942 | 12,476 | 12,556 | |||||||||
|
Net income
|
$ | 19,742 | $ | 16,267 | $ | 18,071 | ||||||
|
Basic earnings per common share
|
$ | 0.90 | $ | 0.74 | $ | 0.83 | ||||||
|
Diluted earnings per common share
|
$ | 0.90 | $ | 0.74 | $ | 0.82 | ||||||
|
Dividends paid per common share
|
$ | 0.04 | $ | — | $ | — | ||||||
The accompanying notes are an integral part of these consolidated financial statements.
36
MARTEN TRANSPORT, LTD.
Consolidated Statements of Stockholders’ Equity
|
Marten Transport, Ltd. Stockholders
|
||||||||||||||||||||||||
|
Common Stock
|
Additional
|
Retained
|
Non-
controlling
|
Total Stockholders’
|
||||||||||||||||||||
|
(In thousands)
|
Shares
|
Amount
|
Paid-In Capital
|
Earnings
|
Interest
|
Equity
|
||||||||||||||||||
|
Balance at December 31, 2007
|
21,812 | $ | 218 | $ | 74,570 | $ | 162,142 | $ | 1,283 | $ | 238,213 | |||||||||||||
|
Net income
|
— | — | — | 18,071 | — | 18,071 | ||||||||||||||||||
|
Repurchase and retirement
of common stock
|
(67 | ) | — | (810 | ) | — | — | (810 | ) | |||||||||||||||
|
Issuance of common stock from
share-based payment
arrangement exercises
|
85 | — | 356 | — | — | 356 | ||||||||||||||||||
|
Tax benefits from share-based
payment arrangement exercises
|
— | — | 523 | — | — | 523 | ||||||||||||||||||
|
Share-based payment arrangement
compensation expense
|
— | — | 666 | — | — | 666 | ||||||||||||||||||
|
Income before income taxes
attributable to noncontrolling
interest
|
— | — | — | — | 1,120 | 1,120 | ||||||||||||||||||
|
Noncontrolling interest distributions
|
— | — | — | — | (688 | ) | (688 | ) | ||||||||||||||||
|
Balance at December 31, 2008
|
21,830 | 218 | 75,305 | 180,213 | 1,715 | 257,451 | ||||||||||||||||||
|
Net income
|
— | — | — | 16,267 | — | 16,267 | ||||||||||||||||||
|
Issuance of common stock from
share-based payment
arrangement exercises
|
55 | 1 | 331 | — | — | 332 | ||||||||||||||||||
|
Tax benefits from share-based
payment arrangement exercises
|
— | — | 255 | — | — | 255 | ||||||||||||||||||
|
Share-based payment arrangement
compensation expense
|
— | — | 586 | — | — | 586 | ||||||||||||||||||
|
Income before income taxes
attributable to noncontrolling
interest
|
— | — | — | — | 584 | 584 | ||||||||||||||||||
|
Noncontrolling interest distributions
|
— | — | — | — | (568 | ) | (568 | ) | ||||||||||||||||
|
Balance at December 31, 2009
|
21,885 | 219 | 76,477 | 196,480 | 1,731 | 274,907 | ||||||||||||||||||
|
Net income
|
— | — | — | 19,742 | — | 19,742 | ||||||||||||||||||
|
Issuance of common stock from
share-based payment
arrangement exercises
|
65 | 1 | 302 | — | — | 303 | ||||||||||||||||||
|
Tax benefits from share-based
payment arrangement exercises
|
— | — | 385 | — | — | 385 | ||||||||||||||||||
|
Share-based payment arrangement
compensation expense
|
— | — | 1,264 | — | — | 1,264 | ||||||||||||||||||
|
Dividends on common stock
|
— | — | — | (877 | ) | — | (877 | ) | ||||||||||||||||
|
Income before income taxes
attributable to noncontrolling
interest
|
— | — | — | — | 631 | 631 | ||||||||||||||||||
|
Noncontrolling interest distributions
|
— | — | — | — | (451 | ) | (451 | ) | ||||||||||||||||
|
Balance at December 31, 2010
|
21,950 | $ | 220 | $ | 78,428 | $ | 215,345 | $ | 1,911 | $ | 295,904 | |||||||||||||
The accompanying notes are an integral part of these consolidated financial statements.
37
MARTEN TRANSPORT, LTD.
|
For the years ended December 31,
|
||||||||||||
|
(In thousands)
|
2010
|
2009
|
2008
|
|||||||||
|
CASH FLOWS PROVIDED BY OPERATING ACTIVITIES:
|
||||||||||||
|
Operations:
|
||||||||||||
|
Net income
|
$ | 19,742 | $ | 16,267 | $ | 18,071 | ||||||
|
Adjustments to reconcile net income
to net cash flows from operating activities:
|
||||||||||||
|
Depreciation
|
51,916 | 53,069 | 49,705 | |||||||||
|
Gain on disposition of revenue equipment
|
(1,110 | ) | (1,630 | ) | (2,664 | ) | ||||||
|
Deferred income taxes
|
10,550 | 5,563 | 4,842 | |||||||||
|
Tax benefits from share-based payment arrangement exercises
|
385 | 255 | 523 | |||||||||
|
Excess tax benefits from share-based
|
||||||||||||
|
payment arrangement exercises
|
(338 | ) | (223 | ) | (456 | ) | ||||||
|
Share-based payment arrangement compensation expense
|
1,264 | 586 | 666 | |||||||||
|
Income before income taxes attributable to noncontrolling interest
|
631 | 584 | 1,120 | |||||||||
|
Changes in other current operating items:
|
||||||||||||
|
Receivables
|
(14,246 | ) | 7,712 | 186 | ||||||||
|
Prepaid expenses and other
|
(1,078 | ) | 1,377 | 118 | ||||||||
|
Accounts payable
|
348 | 3,519 | (2,066 | ) | ||||||||
|
Insurance and claims accruals
|
(1,569 | ) | (2,164 | ) | 3,955 | |||||||
|
Accrued liabilities
|
(1,973 | ) | (3,229 | ) | 3,044 | |||||||
|
Net cash provided by operating activities
|
64,522 | 81,686 | 77,044 | |||||||||
|
CASH FLOWS USED FOR INVESTING ACTIVITIES:
|
||||||||||||
|
Revenue equipment additions
|
(109,345 | ) | (104,842 | ) | (64,509 | ) | ||||||
|
Proceeds from revenue equipment dispositions
|
40,062 | 32,876 | 31,938 | |||||||||
|
Buildings and land, office equipment and other additions
|
(11,959 | ) | (7,948 | ) | (4,055 | ) | ||||||
|
Proceeds from buildings and land, office equipment
|
||||||||||||
|
and other dispositions
|
87 | 31 | — | |||||||||
|
Purchases of marketable securities
|
(20 | ) | (113,170 | ) | (28,146 | ) | ||||||
|
Sales of marketable securities
|
— | 115,656 | 25,892 | |||||||||
|
Net change in other assets
|
(6 | ) | 233 | 1,278 | ||||||||
|
Net cash used for investing activities
|
(81,181 | ) | (77,164 | ) | (37,602 | ) | ||||||
|
CASH FLOWS PROVIDED BY (USED FOR) FINANCING ACTIVITIES:
|
||||||||||||
|
Borrowings under credit facility and long-term debt
|
160,395 | 1,115 | 154,267 | |||||||||
|
Repayment of borrowings under credit facility and long-term debt
|
(142,548 | ) | (2,473 | ) | (196,053 | ) | ||||||
|
Dividends on common stock
|
(877 | ) | — | — | ||||||||
|
Issuance of common stock from share-based payment
|
||||||||||||
|
arrangement exercises
|
303 | 332 | 356 | |||||||||
|
Excess tax benefits from share-based
|
||||||||||||
|
payment arrangement exercises
|
338 | 223 | 456 | |||||||||
|
Change in net checks issued in excess of cash balances
|
(605 | ) | (136 | ) | 1,807 | |||||||
|
Noncontrolling interest distributions
|
(451 | ) | (568 | ) | (688 | ) | ||||||
|
Repurchase and retirement of common stock
|
— | — | (810 | ) | ||||||||
|
Net cash provided by (used for) financing activities
|
16,555 | (1,507 | ) | (40,665 | ) | |||||||
|
NET CHANGE IN CASH AND CASH EQUIVALENTS
|
(104 | ) | 3,015 | (1,223 | ) | |||||||
|
CASH AND CASH EQUIVALENTS:
|
||||||||||||
|
Beginning of year
|
5,410 | 2,395 | 3,618 | |||||||||
|
End of year
|
$ | 5,306 | $ | 5,410 | $ | 2,395 | ||||||
|
SUPPLEMENTAL DISCLOSURE OF CASH FLOW INFORMATION:
|
||||||||||||
|
Cash paid for:
|
||||||||||||
|
Interest
|
$ | 225 | $ | 200 | $ | 1,240 | ||||||
|
Income taxes
|
$ | 13,789 | $ | 4,905 | $ | 6,368 | ||||||
|
Non-cash investing activities:
|
||||||||||||
|
Change in property and equipment not yet paid for
|
$ | 253 | $ | (1,288 | ) | $ | (468 | ) | ||||
The accompanying notes are an integral part of these consolidated financial statements.
38
MARTEN TRANSPORT, LTD.
Notes to Consolidated Financial Statements
1. Summary of Significant Accounting Policies
Nature of business:
Marten Transport, Ltd. is a long-haul and regional truckload carrier providing protective service transportation and distribution of time- and temperature-sensitive materials and general commodities to customers in the United States, Canada and Mexico.
Principles of consolidation:
The accompanying consolidated financial statements include the accounts of Marten Transport, Ltd., its subsidiaries and its 45% owned affiliate, MW Logistics, LLC (“MWL”). MWL is a third-party provider of logistics services to the transportation industry. We have applied the provisions of Financial Accounting Standards Board Accounting Standards Codification, or FASB ASC, 810,
Consolidation
to our investment in MWL and have determined that Marten is the primary beneficiary based on MWL’s equity structure. All material intercompany accounts and transactions have been eliminated in consolidation. As of December 31, 2010, MWL’s total assets and total liabilities, net of intercompany accounts and transactions, were $6.4 million and $3.9 million, respectively. MWL has elected to be classified as a partnership for federal income tax purposes. Consequently, federal income taxes are not payable by MWL.
Cash and cash equivalents:
Cash in excess of current operating requirements is invested in short-term, highly liquid investments. We consider all highly liquid investments purchased with original maturities of three months or less to be cash equivalents. Accounts at banks with an aggregate excess of the amount of checks issued over cash balances are included in current liabilities in the accompanying consolidated balance sheets, with changes in such accounts included as a financing activity in the accompanying consolidated statements of cash flows.
Marketable securities:
We invest available funds in short-term marketable securities. This investment is in a mutual fund investing primarily in repurchase agreements and other U.S. government-backed securities having original maturities of three months or less, and is stated at market value, which approximates cost.
Trade accounts receivable:
Trade accounts receivable are recorded at the invoiced amounts, net of an allowance for doubtful accounts. A considerable amount of judgment is required in assessing the realization of these receivables including the current creditworthiness of each customer and related aging of the past-due balances, including any billing disputes. In order to assess the collectibility of these receivables, we perform ongoing credit evaluations of our customers’ financial condition. Through these evaluations, we may become aware of a situation where a customer may not be able to meet its financial obligations due to deterioration of its financial viability, credit ratings or bankruptcy. The allowance for doubtful accounts is based on the best information available to us and is reevaluated and adjusted as additional information is received. We evaluate the allowance based on historical write-off experience, the size of the individual customer balances, past-due amounts and the overall national economy. We review the adequacy of our allowance for doubtful accounts monthly. Invoice balances over 30 days after the contractual due date are considered past due per our policy and are reviewed individually for collectibility. Initial payments by new customers are monitored for compliance with contractual terms. Account balances are charged off against the allowance after all means of collection have been exhausted and the potential recovery is considered remote.
Property and equipment:
Additions and improvements to property and equipment are capitalized at cost. Maintenance and repair expenditures are charged to operations. Gains and losses on disposals of revenue equipment are included in operations as they are a normal, recurring component of our operations.
39
MARTEN TRANSPORT, LTD.
Notes to Consolidated Financial Statements (Continued)
Depreciation is computed based on the cost of the asset, reduced by its estimated salvage value, using the straight-line method for financial reporting purposes. We begin depreciating assets in the month that each asset is placed in service and, therefore, is ready for its intended use. Accelerated methods are used for income tax reporting purposes. Following is a summary of estimated useful lives for financial reporting purposes:
|
Years
|
|
|
Tractors
|
5
|
|
Trailers
|
7
|
|
Service and other equipment
|
3-15
|
|
Buildings and improvements
|
20-40
|
In 2010, we replaced most of our company-owned tractors within approximately 4.5 years and our trailers within approximately six years after purchase. Our useful lives for depreciating tractors is five years and for trailers is seven years, with a 25% salvage value for tractors and a 35% salvage value for trailers. These salvage values are based upon the expected market values of the equipment after five years for tractors and seven years for trailers. Depreciation expense calculated in this manner approximates the continuing declining value of the revenue equipment, and continues at a consistent straight-line rate for units held beyond the normal replacement cycle.
Long-lived assets are reviewed for impairment whenever events or changes in circumstances indicate that the carrying amount of an asset may not be recoverable. Recoverability of assets to be held and used is measured by a comparison of the carrying amount of an asset to future net undiscounted cash flows expected to be generated by the asset. If such assets are considered to be impaired, the impairment to be recognized is measured by the amount by which the carrying amount of the assets exceeds the fair value of the assets. Assets to be disposed of are reported at the lower of the carrying amount or fair value less the costs to sell.
Tires in service:
The cost of original equipment and replacement tires placed in service is capitalized. Amortization is calculated based on cost, less estimated salvage value, using the straight-line method over 24 months. The current portion of capitalized tires in service is included in prepaid expenses and other in the accompanying consolidated balance sheets. The long-term portion of capitalized tires in service and the estimated salvage value are included in revenue equipment in the accompanying consolidated balance sheets. The cost of recapping tires is charged to operations.
Income taxes:
Deferred tax assets and liabilities are recognized for the future tax consequences attributable to differences between the financial statement carrying amounts of existing assets and liabilities and their respective tax basis. Deferred tax assets and liabilities are measured using enacted tax rates expected to apply to taxable income in the years in which those temporary differences are expected to be recovered or settled. The effect on deferred tax assets and liabilities of a change in tax rates is recognized in income in the period that includes the enactment date. We have reflected the necessary deferred tax assets and liabilities in the accompanying consolidated balance sheets. We believe the future tax deductions will be realized principally through future reversals of existing taxable temporary differences and future taxable income.
40
MARTEN TRANSPORT, LTD.
Notes to Consolidated Financial Statements (Continued)
In the ordinary course of business there is inherent uncertainty in quantifying our income tax positions. We assess our income tax positions and record tax benefits for all years subject to examination based upon management’s evaluation of the facts, circumstances, and information available at the reporting dates. For those tax positions where it is more-likely-than-not that a tax benefit will be sustained, we have recorded the largest amount of tax benefit with a greater than 50% likelihood of being realized upon ultimate settlement with a taxing authority that has full knowledge of all relevant information. For those income tax positions where it is not more-likely-than-not that a tax benefit will be sustained, no tax benefit has been recognized in the financial statements. Potential accrued interest and penalties related to unrecognized tax benefits are recognized as a component of income tax expense.
Insurance and claims:
We self-insure, in part, for losses relating to workers’ compensation, auto liability, general liability, cargo, and property damage claims, along with employees’ health insurance with varying risk retention levels. We maintain insurance coverage for per-incident and total losses in excess of these risk retention levels in amounts we consider adequate based upon historical experience and our ongoing review. We reserve currently for the estimated cost of the uninsured portion of pending claims, including legal costs. These reserves are periodically evaluated and adjusted based on our evaluation of the nature and severity of outstanding individual claims and an estimate of future claims development based on historical claims development factors. Under agreements with our insurance carriers and regulatory authorities, we have $8.3 million in standby letters of credit to guarantee settlement of claims.
Revenue recognition:
We record revenue and related expenses on the date shipment of freight is completed. We earned 18% and 10% of our revenue in 2010 from two single customers whose trade receivables represented 11% and 12%, respectively, of our trade receivables as of December 31, 2010. We earned 20% and 12% of our revenue in 2009 from two single customers whose trade receivables represented 11% and 16%, respectively, of our trade receivables as of December 31, 2009. We earned 19% and 10% of our revenue in 2008 from two single customers.
We account for revenue of our Logistics segment and revenue on freight transported by independent contractors within our Truckload segment on a gross basis because we are the primary obligor in the arrangements, we have the ability to establish prices, we have the risk of loss in the event of cargo claims and we bear credit risk with customer payments. Accordingly, all such revenue billed to customers is classified as operating revenue and all corresponding payments to carriers for transportation services we arrange in connection with brokerage and intermodal activities and to independent contractor providers of revenue equipment are classified as purchased transportation expense.
Share-based payment arrangement compensation:
Under our stock incentive plans, all of our employees and any subsidiary employees, as well as all of our non-employee directors, may be granted stock-based awards, including incentive and non-statutory stock options and performance unit awards. We account for share-based payment arrangements in accordance with FASB ASC 718,
Compensation-Stock Compensation
, which requires all share-based payments to employees and non-employee directors, including grants of employee stock options and performance unit awards, to be recognized in the income statement based on their fair values at the date of grant.
Earnings per common share:
Basic earnings per common share is computed by dividing net income by the weighted average number of common shares outstanding during the year. Diluted earnings per common share is computed by dividing net income by the sum of the weighted average number of common shares outstanding plus all additional common shares that would have been outstanding if potentially dilutive common shares related to stock options and performance unit awards had been issued using the treasury stock method.
41
MARTEN TRANSPORT, LTD.
Notes to Consolidated Financial Statements (Continued)
Segment reporting:
We report our operating segments in accordance with accounting standards codified in FASB ASC 280,
Segment Reporting
. We have six operating segments that have been aggregated into two reporting segments (Truckload and Logistics) for financial reporting purposes. See Note 13 for more information.
Use of estimates:
We must make estimates and assumptions to prepare the consolidated financial statements in conformity with U.S. generally accepted accounting principles. These estimates and assumptions affect the reported amounts of assets and liabilities and the disclosure of contingent assets and liabilities in the consolidated financial statements. These estimates are primarily related to insurance and claims accruals and depreciation. Ultimate results could differ from these estimates.
2. Details of Consolidated Balance Sheet Accounts
Prepaid expenses and other:
As of December 31, prepaid expenses and other consisted of the following:
|
(In thousands)
|
2010
|
2009
|
||||||
|
License fees
|
$ | 3,894 | $ | 4,009 | ||||
|
Tires in service
|
3,049 | 2,912 | ||||||
|
Parts and tires inventory
|
2,826 | 2,222 | ||||||
|
Insurance premiums
|
992 | 905 | ||||||
|
Other
|
2,645 | 2,280 | ||||||
| $ | 13,406 | $ | 12,328 | |||||
Accrued liabilities:
As of December 31, accrued liabilities consisted of the following:
|
(In thousands)
|
2010
|
2009
|
||||||
|
Accrued expenses
|
$ | 6,024 | $ | 6,075 | ||||
|
Vacation
|
3,110 | 3,146 | ||||||
|
Salaries and wages
|
1,820 | 1,795 | ||||||
|
Current income taxes
|
519 | 3,116 | ||||||
|
Other
|
1,251 | 1,456 | ||||||
| $ | 12,724 | $ | 15,588 | |||||
42
MARTEN TRANSPORT, LTD.
Notes to Consolidated Financial Statements (Continued)
As of December 31, long-term debt consisted of the following:
|
(In thousands)
|
2010
|
2009
|
||||||
|
Unsecured committed credit facility in the
|
||||||||
|
amount of $50 million with banks maturing in
|
||||||||
|
September 2011
|
$ | 19,346 | $ | 71 | ||||
|
Secured B Senior Unsecured Notes which
|
||||||||
|
matured in April 2010 and which bore
|
||||||||
|
interest at 8.57%
|
- | 1,428 | ||||||
|
Total long-term debt
|
19,346 | 1,499 | ||||||
|
Less current maturities of long-term debt
|
19,346 | 1,428 | ||||||
|
Long-term debt, less current maturities
|
$ | - | $ | 71 | ||||
We maintain a credit agreement that provides for a five-year unsecured committed credit facility (“credit facility”) maturing in September 2011 in an aggregate principal amount of up to $50 million. The aggregate principal amount of the credit facility may be increased at our option, subject to completion of signed amendments with participating banks, up to a maximum aggregate principal amount of $100 million. At December 31, 2010, the credit facility had an outstanding principal balance of $19.3 million, outstanding standby letters of credit of $8.3 million and remaining borrowing availability of $22.4 million. This facility bears interest at a variable rate based on the London Interbank Offered Rate or the agent bank’s Prime Rate, in each case plus/minus applicable margins. The weighted average interest rate for the facility was 0.86% at December 31, 2010. The $19.3 million outstanding principal balance on the credit facility was classified as a current liability in our consolidated balance sheet as of December 31, 2010 because the maturity date of the facility is within the next twelve months.
Our credit facility prohibits us from paying, in any fiscal year, dividends in excess of 25% of our net income from the prior fiscal year. The debt agreements also contain restrictive covenants which, among other matters, require us to maintain certain financial ratios, including debt-to-equity, cash flow leverage, interest coverage and fixed charge coverage. We were in compliance with all of these covenants at December 31, 2010.
43
MARTEN TRANSPORT, LTD.
Notes to Consolidated Financial Statements (Continued)
4. Related Party Transactions
The following related party transactions occurred during the three years ended December 31, 2010;
(a) We purchase fuel and obtain tires and related services from a company in which one of our directors is the president and a principal stockholder. We paid that company $815,000 in 2010, $796,000 in 2009 and $1.4 million in 2008 for fuel and tire services. In addition, we paid $1.7 million in 2010, $1.5 million in 2009 and $2.3 million in 2008 to tire manufacturers for tires that we purchased from the tire manufacturers but were provided by the same company. The same company received commissions from the tire manufacturers related to these purchases. We had accounts payable to that company of $44,000 as of December 31, 2010 and $24,000 as of December 31, 2009.
(b) We paid $262,000 in 2010, $1.1 million in 2009 and $564,000 in 2008 for various construction projects to a company in which one of our directors is the president and owner. We had accounts payable to that company of $56,000 as of December 31, 2010, and no payables to that company as of December 31, 2009.
(c) In August 2008, we acquired a building adjacent to our headquarters which will be used for maintenance and storage from our Chairman of the Board and Chief Executive Officer in a like-kind exchange for a partially constructed building of equal value owned by Marten Transport. Each of the buildings were valued at $291,000 at the time of the exchange.
5. Income Taxes
The components of the provision for income taxes consisted of the following:
|
(In thousands)
|
2010
|
2009
|
2008
|
|||||||||
|
Current:
|
||||||||||||
|
Federal
|
$ | 2,747 | $ | 6,084 | $ | 6,497 | ||||||
|
State
|
1,645 | 829 | 1,217 | |||||||||
| 4,392 | 6,913 | 7,714 | ||||||||||
|
Deferred:
|
||||||||||||
|
Federal
|
10,761 | 4,472 | 4,549 | |||||||||
|
State
|
(211 | ) | 1,091 | 293 | ||||||||
| 10,550 | 5,563 | 4,842 | ||||||||||
|
Total provision
|
$ | 14,942 | $ | 12,476 | $ | 12,556 | ||||||
44
MARTEN TRANSPORT, LTD.
Notes to Consolidated Financial Statements (Continued)
The statutory federal income tax rate is reconciled to the effective income tax rate as follows:
|
2010
|
2009
|
2008
|
||||||||||
|
Statutory federal
income tax rate
|
35 | % | 35 | % | 35 | % | ||||||
|
Per diem and other
non-deductible expenses
|
6 | 5 | 3 | |||||||||
|
Increase in taxes arising from
state income taxes, net of
federal income tax benefit
|
3 | 4 | 3 | |||||||||
|
Other
|
(1 | ) | (1 | ) | — | |||||||
|
Effective tax rate
|
43 | % | 43 | % | 41 | % | ||||||
Our effective income tax rate was 43.1% in 2010, 43.4% in 2009 and 41.0% in 2008. The increase in the effective rate from 2008 to 2009 was primarily due to the nondeductible effect of a per diem pay structure for our drivers adopted in the first quarter of 2008 which was more broadly implemented during 2009.
As of December 31, the net deferred tax liability consisted of the following:
|
(In thousands)
|
2010
|
2009
|
||||||
|
Deferred tax assets:
|
||||||||
|
Reserves and accrued liabilities
|
$ | 7,097 | $ | 7,452 | ||||
|
Other
|
1,684 | 1,168 | ||||||
| 8,781 | 8,620 | |||||||
|
Deferred tax liabilities:
|
||||||||
|
Depreciation
|
97,510 | 86,823 | ||||||
|
Prepaid expenses
|
2,292 | 2,268 | ||||||
| 99,802 | 89,091 | |||||||
|
Net deferred tax liability
|
$ | 91,021 | $ | 80,471 | ||||
We have not provided a valuation allowance against deferred tax assets at December 31, 2010 or 2009. We believe the deferred tax assets will be realized principally through future reversals of existing taxable temporary differences (deferred tax liabilities) and future taxable income.
Our reserves for unrecognized tax benefits were $215,000 as of December 31, 2010 and $158,000 as of December 31, 2009. The $57,000 increase in the amount reserved in 2010 relates to current period tax positions. The amount reserved as of December 31, 2009 was added in 2007 through 2009 relating to current period tax positions. If recognized, $140,000 of the unrecognized tax benefits as of December 31, 2010 would impact our effective tax rate. No potential interest or penalties related to unrecognized tax benefits were recognized in our financial statements as of December 31, 2010. We do not expect the reserves for unrecognized tax benefits to change significantly within the next twelve months.
The federal statute of limitations remains open for 2007 and forward. We file tax returns in numerous state jurisdictions with varying statutes of limitations.
45
MARTEN TRANSPORT, LTD.
Notes to Consolidated Financial Statements (Continued)
6. Earnings Per Common Share
Basic and diluted earnings per common share were computed as follows:
|
(In thousands, except per share amounts)
|
2010
|
2009
|
2008
|
|||||||||
|
Numerator:
|
||||||||||||
|
Net income
|
$ | 19,742 | $ | 16,267 | $ | 18,071 | ||||||
|
Denominator:
|
||||||||||||
|
Basic earnings per common share -
weighted-average shares
|
21,927 | 21,870 | 21,787 | |||||||||
|
Effect of dilutive stock options
|
104 | 114 | 144 | |||||||||
|
Diluted earnings per common share -
weighted-average shares and assumed conversions
|
22,031 | 21,984 | 21,931 | |||||||||
|
Basic earnings per common share
|
$ | 0.90 | $ | 0.74 | $ | 0.83 | ||||||
|
Diluted earnings per common share
|
$ | 0.90 | $ | 0.74 | $ | 0.82 | ||||||
Options totaling 351,000, 418,100, and 310,600 shares were outstanding but were not included in the calculation of diluted earnings per share for 2010, 2009 and 2008, respectively, because including the options in the denominator would be antidilutive, or decrease the number of weighted-average shares, due to their exercise prices exceeding the average market price of the common shares or due to inclusion of average unrecognized compensation expense in the calculation. Performance-based option awards totaling 107,000, 107,000 and 99,500 shares for 2010, 2009 and 2008, respectively, were also not included in the calculation of diluted earnings per share because the performance condition was not met.
Unvested performance unit awards (see Note 9) totaling 29,164 shares for 2010 were considered outstanding but were not included in the calculation of diluted earnings per share because inclusion of average unrecognized compensation expense in the calculation would cause the performance units to be antidilutive.
7. Dividends
In August 2010, we announced that our Board of Directors approved a regular cash dividend program to our stockholders, subject to approval each quarter. The first two quarterly cash dividends of $0.02 per share of common stock were paid in September and December 2010.
8. Share Repurchase Program
In December 2007, our Board of Directors approved a share repurchase program to repurchase up to one million shares of our common stock either through purchases on the open market or through private transactions. The timing and extent to which we will repurchase shares depends on market conditions and other corporate considerations. In the first quarter of 2008 we repurchased and retired 67,500 shares of our common stock for $810,000. We made no purchases in 2010, 2009, or in the remainder of 2008. The repurchase program does not have an expiration date.
46
MARTEN TRANSPORT, LTD.
Notes to Consolidated Financial Statements (Continued)
9. Employee Benefits
Stock Incentive Plans
- Under our 2005 Stock Incentive Plan (the “2005 Plan”), all of our employees and any subsidiary employees, as well as all of our non-employee directors, may be granted stock-based awards, including non-statutory stock options and performance unit awards. Stock options expire within 7 or 10 years after the date of grant and the exercise price must be at least the fair market value of our common stock on the date of grant. Stock options issued to non-employee directors upon their annual re-election to our Board of Directors are generally exercisable at the date of grant. Stock options issued to employees are generally exercisable beginning one year from the date of grant in cumulative amounts of 20% per year. Performance unit awards are subject to vesting requirements over a five-year period, primarily based on our earnings growth. Options exercised and performance unit award shares issued represent newly issued shares. The maximum number of shares of common stock available for issuance under the 2005 Plan is 2.85 million shares. As of December 31, 2010, there were 535,600 shares reserved for issuance under options outstanding and 63,400 shares reserved for issuance under outstanding performance unit awards under the 2005 Plan.
Under our 1995 Plan, officers, directors and employees were granted incentive and non-statutory stock options. Incentive stock option exercise prices were required to be at least the fair market value of our common stock on the date of grant. Non-statutory stock option exercise prices were required to be at least 85% of the fair market value of our common stock on the date of grant. Stock options expire within 10 years after the date of grant. Stock options issued to non-employee directors upon their annual re-election to our Board of Directors are generally exercisable at the date of grant. Stock options issued to employees are generally exercisable beginning one year from the date of grant in cumulative amounts of 20% per year. Options exercised represent newly issued shares. As of December 31, 2010, there were 153,582 shares reserved for issuance under options outstanding under the 1995 Plan. No additional options will be granted under the 1995 Plan.
We account for share-based payment arrangements in accordance with FASB ASC 718,
Compensation-Stock Compensation
, which requires all share-based payments to employees and non-employee directors, including grants of stock options and performance unit awards, to be recognized in the income statement based on their fair values at the date of grant.
47
MARTEN TRANSPORT, LTD.
Notes to Consolidated Financial Statements (Continued)
We use the Black-Scholes option pricing model to calculate the grant-date fair value of option awards. The fair value of option awards granted was estimated as of the date of grant using the following weighted average assumptions:
|
2010
|
2009
|
2008
|
||||||||||
|
Service-based options:
|
||||||||||||
|
Expected option life in years
(1)
|
6.1 | 6.1 | 6.2 | |||||||||
|
Expected stock price volatility percentage
(2)
|
39 | % | 40 | % | 40 | % | ||||||
|
Risk-free interest rate percentage
(3)
|
2.7 | % | 2.5 | % | 3.3 | % | ||||||
|
Expected dividend yield
(4)
|
0.05 | % |
—
|
— | ||||||||
|
Fair value as of the date of grant
|
$ | 9.31 | $ | 7.77 | $ | 7.76 | ||||||
|
Performance-based options:
|
||||||||||||
|
Expected option life in years
(1)
|
— | 6.0 | 6.6 | |||||||||
|
Expected stock price volatility percentage
(2)
|
— | 41 | % | 39 | % | |||||||
|
Risk-free interest rate percentage
(3)
|
— | 2.4 | % | 3.3 | % | |||||||
|
Expected dividend yield
(4)
|
— | — | — | |||||||||
|
Fair value as of the date of grant
|
— | $ | 8.55 | $ | 7.90 | |||||||
|
(1)
|
Expected option life – We use historical employee exercise and option expiration data to estimate the expected life assumption for the Black-Scholes grant-date valuation. We believe that this historical data is currently the best estimate of the expected term of a new option. We use a weighted-average expected life for all awards.
|
|
(2)
|
Expected stock price volatility – We use our stock’s historical volatility for the same period of time as the expected life. We have no reason to believe that its future volatility will differ from the past.
|
|
(3)
|
Risk-free interest rate – The rate is based on the U.S. Treasury yield curve in effect at the time of the grant for the same period of time as the expected life.
|
|
(4)
|
Expected dividend yield – The calculation is based on the total expected annual dividend payout divided by the average stock price.
|
48
MARTEN TRANSPORT, LTD.
Notes to Consolidated Financial Statements (Continued)
We use the straight-line attribution method to recognize expense for all service-based option awards with graded vesting. Service-based option awards become immediately exercisable in full in the event of retirement, death or disability and upon a change in control with respect to all options that have been outstanding for at least six months. To be eligible for retirement, an employee must reach age 65.
Compensation costs associated with service-based option awards are recognized, net of an estimated forfeiture rate, over the requisite service period, which is the period between the grant date and the earlier of the award’s stated vesting term or the date the employee is eligible for retirement. We immediately recognize the entire amount of share-based compensation cost for employees that are eligible for retirement at the date of grant. For awards granted to employees approaching retirement eligibility, we recognize compensation cost on a straight-line basis over the period from the grant date through the retirement eligibility date. Share-based compensation expense for employees who are not retirement eligible is recognized on a straight-line basis over the stated vesting period of the award.
All performance-based options outstanding, which totaled 107,000 shares, expired effective December 31, 2010. The exercisability of the options was based upon our achievement of certain operating ratios for a period of fiscal years ending with 2010. These criteria were not met, and accordingly, no compensation expense was recorded relating to these option awards.
In August 2010, we granted 63,400 performance unit awards under our 2005 Stock Incentive Plan to certain employees. This was our first grant of such awards. As of December 31, 2010 and each December 31
st
thereafter through December 31, 2014, each award will vest and become the right to receive a number of shares of common stock equal to a total vesting percentage multiplied by the number of units subject to such award. The total vesting percentage for each of the five years is equal to the sum of a performance vesting percentage, which is the percentage increase, if any, in our diluted net income per share for the year being measured over the prior year, and a service vesting percentage of five percentage points. The goal of the awards is to incentivize the certain employees to increase our earnings an average of fifteen percent per year over five years, which, when combined with the five percent per year service-based component, would result in full vesting over five years. The performance vesting percentage could be achieved earlier than in five years if annual earnings growth exceeds the average of fifteen percent, or not fully achieved if the annual earnings growth averages less than fifteen percent over the five-year period. All payments will be made in shares of our common stock. One half of the vested performance units will be paid to the employees immediately upon vesting, with the other half being credited to the employees’ accounts within the Marten Transport, Ltd. Deferred Compensation Plan, which restricts the sale of vested shares to the later of each employee’s termination of employment or attainment of age 62.
The fair value of each performance unit is based on the closing market price on the date of grant. We recognize compensation expense for these awards based on the estimated number of units probable of achieving the vesting requirements of the awards, net of an estimated forfeiture rate.
The amount of share-based compensation recognized during a period is based on the value of the portion of the awards that are ultimately expected to vest. Forfeitures are estimated at the time of grant and revised, if necessary, in subsequent periods if actual forfeitures differ from those estimates. We currently expect, based on an analysis of our historical forfeitures and known forfeitures on existing awards, that approximately 1.25% of unvested outstanding awards will be forfeited each year. This analysis will be re-evaluated quarterly and the forfeiture rate will be adjusted as necessary. Ultimately, the actual expense recognized over the vesting period will only be for those shares that vest.
49
MARTEN TRANSPORT, LTD.
Notes to Consolidated Financial Statements (Continued)
Total share-based compensation expense recorded in 2010 was $1.3 million ($776,000 net of income tax benefit, $0.035 of earnings per basic and diluted share), in 2009 was $586,000 ($353,000 net of income tax benefit, $0.02 of earnings per basic and diluted share), and in 2008 was $666,000 ($432,000 net of income tax benefit, $0.02 of earnings per basic and diluted share). All share-based compensation expense was recorded in salaries, wages and benefits expense.
The benefits of tax deductions in excess of recognized compensation costs (excess tax benefits) are recorded as a financing cash inflow rather than a deduction of taxes paid in operating cash flows. In 2010, 2009 and 2008, there was $338,000, $223,000 and $456,000, respectively, of excess tax benefits recognized resulting from exercises of options.
As of December 31, 2010, there was a total of $1.9 million of unrecognized compensation expense related to unvested service-based option awards, which is expected to be recognized over a weighted-average period of 3.3 years, and $875,000 of unrecognized compensation expense related to unvested performance unit awards, which will be recorded based on the estimated number of units probable of achieving the vesting requirements of the awards through 2014.
Option activity in 2010 was as follows:
|
Weighted
|
||||||||
|
Average
|
||||||||
|
Shares
|
Exercise Price
|
|||||||
|
Outstanding at December 31, 2009
|
765,361 | $ | 15.89 | |||||
|
Granted
|
99,000 | 22.11 | ||||||
| Exercised | (65,179 | ) | 4.65 | |||||
| Expired | (107,000 | ) | 21.35 | |||||
|
Forfeited
|
(3,000 | ) | 17.83 | |||||
|
Outstanding at December 31, 2010
|
689,182 | $ | 16.99 | |||||
|
Exercisable at December 31, 2010
|
412,722 | $ | 15.30 | |||||
The fair value of options granted in 2010 was $922,000 for service-based options. The fair value of options granted in 2009 was $913,000 for service-based options and $64,000 for performance-based options. The fair value of options granted in 2008 was $1.2 million for service-based options and $170,000 for performance-based options. The total intrinsic value of options exercised in 2010, 2009 and 2008 was $1.0 million, $719,000 and $1.3 million, respectively. Intrinsic value is the difference between the fair value of the acquired shares at the date of exercise and the exercise price, multiplied by the number of options exercised. Proceeds received from option exercises in 2010, 2009 and 2008 were $303,000, $332,000 and $356,000, respectively.
50
MARTEN TRANSPORT, LTD.
Notes to Consolidated Financial Statements (Continued)
The following table summarizes information concerning outstanding and exercisable option awards as of December 31, 2010:
|
Options Outstanding
|
Options Exercisable
|
||||||||||||||||||||
|
Range of Exercise Prices
|
Shares
|
Life
(1)
|
Price
(2)
|
Value
(3)
|
Shares
|
Life
(1)
|
Price
(2)
|
Value
(3)
|
|||||||||||||
|
Service-based options:
|
|||||||||||||||||||||
| $4.14 - $5.78 | 102,956 | 1.5 | $ | 4.99 | $ | 1,687 | 102,956 | 1.5 | $ | 4.99 | $ | 1,687 | |||||||||
| $1 0.76 | 50,626 | 2.8 | 10.76 | 538 | 50,626 | 2.8 | 10.76 | 538 | |||||||||||||
| $15.45 - $23.59 | 535,600 | 5.6 | 19.88 | 988 | 259,140 | 5.5 | 20.28 | 401 | |||||||||||||
| 689,182 | 4.8 | $ | 16.99 | $ | 3,213 | 412,722 | 4.2 | $ | 15.30 | $ | 2,626 | ||||||||||
|
|
(1)
|
Represents the weighted-average remaining contractual life in years.
|
|
|
(2)
|
Represents the weighted-average exercise price.
|
|
|
(3)
|
Represents the aggregate intrinsic value based on our closing stock price on December 31, 2010 for in-the-money options (in thousands).
|
Nonvested option awards as of December 31, 2010 and changes during 2010 were as follows:
|
Weighted
|
||||||||||||
|
Average
|
||||||||||||
|
Weighted
|
Remaining
|
|||||||||||
|
Average
|
Contractual
|
|||||||||||
|
Grant Date
|
Life
|
|||||||||||
|
Shares
|
Fair Value
|
(in Years)
|
||||||||||
|
Service-based options:
|
||||||||||||
|
Nonvested at December 31, 2009
|
266,080 | $ | 7.98 | 6.3 | ||||||||
|
Granted
|
99,000 | 9.31 | 6.8 | |||||||||
| Vested | (85,620 | ) | 8.51 | 5.9 | ||||||||
|
Forfeited
|
(3,000 | ) | 7.54 | 5.9 | ||||||||
|
Nonvested at December 31, 2010
|
276,460 | $ | 8.30 | 5.7 | ||||||||
|
Performance-based options:
|
||||||||||||
|
Nonvested at December 31, 2009
|
107,000 | $ | 9.12 | 6.6 | ||||||||
|
Expired
|
(107,000 | ) | 9.12 | — | ||||||||
|
Nonvested at December 31, 2010
|
— | $ | — | — | ||||||||
The total fair value of options which vested during 2010, 2009 and 2008 was $729,000, $561,000 and $629,000, respectively.
51
MARTEN TRANSPORT, LTD.
Notes to Consolidated Financial Statements (Continued)
The following table summarizes our nonvested performance unit award activity in 2010:
|
Weighted Average
|
||||||||
|
Grant Date
|
||||||||
|
Shares
|
Fair Value
|
|||||||
|
Nonvested at December 31, 2009
|
- | $ | - | |||||
|
Granted
|
63,400 | 20.73 | ||||||
|
Vested
|
(16,484 | ) (1) | 20.73 | |||||
|
Nonvested at December 31, 2010
|
46,916 | $ | 20.73 | |||||
|
(1)
|
This number of performance unit award shares vested based on our financial performance in 2010 and will be distributed or credited to the Marten Transport, Ltd. Deferred Compensation Plan in March 2011. The fair value of unit award shares that vested in 2010 was $342,000.
|
Retirement Savings Plan
- We sponsor a defined contribution retirement savings plan under Section 401(k) of the Internal Revenue Code. Employees are eligible for the plan after one year of service. Participants are able to contribute up to the limit set by law, which in 2010 was $16,500 for participants less than age 50 and $22,000 for participants age 50 and above. We contribute 35% of each participant’s contribution, up to a total of 6% contributed. Our contribution vests at the rate of 20% per year for the second through sixth years of service. In addition, we may make elective contributions as determined by the Board of Directors. No elective contributions were made in 2010, 2009 or 2008. Total expense recorded for the plan was $633,000 in 2010, $996,000 in 2009 and $1.0 million in 2008.
Stock Purchase Plans
- An Employee Stock Purchase Plan and an Independent Contractor Stock Purchase Plan are sponsored to encourage employee and independent contractor ownership of our common stock. Eligible participants specify the amount of regular payroll or contract payment deductions and voluntary cash contributions that are used to purchase shares of our common stock. The purchases are made at the market price on the open market. We pay the broker’s commissions and administrative charges for purchases of common stock under the plans.
52
MARTEN TRANSPORT, LTD.
Notes to Consolidated Financial Statements (Continued)
10. Deferred Compensation Plan
In August 2010, our Board of Directors approved and adopted the Marten Transport, Ltd. Deferred Compensation Plan. The deferred compensation plan is an unfunded, nonqualified deferred compensation plan designed to allow board elected officers and other select members of our management designated by our Compensation Committee to save for retirement on a tax-deferred basis.
Under the terms of the plan, each participant is eligible to defer portions of their base pay, annual bonus, or receipt of common stock otherwise payable under a vested performance unit award. Each participant can elect a fixed distribution date for the participant’s deferral account other than certain required performance unit award deferrals credited to the discretionary account, which will be distributed after the later of the date of the participant’s termination of employment of the date the participant attains age 62. Upon termination of a participant’s employment with the company, the plan requires a lump-sum distribution of the deferral account, excluding the required performance unit award deferrals, unless the participant had elected an installment distribution. Upon a participant’s death, the plan provides that a participant’s distributions accelerate and will be paid in a lump sum to the participant’s beneficiary. We may terminate the plan and accelerate distributions to participants, but only to the extent and at the times permitted under the Internal Revenue Code. We may terminate the plan and accelerate distributions upon a change in control, which is not a payment event under the plan. In conjunction with the approval of the plan, our Board of Directors also adopted an amendment to the Marten Transport, Ltd. 2005 Stock Incentive Plan to allow for deferral of receipt of income from a performance unit award under the plan. As of December 31, 2010, there were no participant account balances within the plan.
11. Fair Value of Financial Instruments
The carrying amounts of accounts receivable and accounts payable approximate fair value because of the short maturity of these instruments. The carrying value of our total long-term debt approximates fair value as the credit facility bears interest based upon a variable interest rate.
12. Commitments and Contingencies
We are committed to: (a) purchase $9.4 million of new revenue equipment in 2011; (b) building construction expenditures of $2.9 million in 2011; and (c) operating lease obligation expenditures totaling $1.1 million through 2014.
We are involved in legal actions that arise in the ordinary course of business. Although the outcomes of any such legal actions cannot be predicted, in the opinion of management, the resolution of any currently pending or threatened actions will not have a material adverse effect upon our long-term financial position or results of operations, but could be material to the results of any individual period.
13. Business Segments
We have six operating segments that have been aggregated into two reporting segments (Truckload and Logistics) for financial reporting purposes. The primary source of our operating revenue is truckload revenue, which we generate by transporting freight for our customers and report within our Truckload segment. Generally, we are paid by the mile for our services. We also derive truckload revenue from fuel surcharges, loading and unloading activities, equipment detention and other ancillary services.
53
MARTEN TRANSPORT, LTD.
Notes to Consolidated Financial Statements (Continued)
Our operating revenue also includes revenue reported within our Logistics segment, which consists of revenue from our internal brokerage and intermodal operations, both launched in 2005, and through our 45% interest in MWL, a third-party provider of logistics services to the transportation industry. Brokerage services involve arranging for another company to transport freight for our customers while we retain the billing, collection and customer management responsibilities. Intermodal services involve the transport of our trailers on railroad flatcars for a portion of a trip, with the balance of the trip using our tractors or, to a lesser extent, contracted carriers.
The following table sets forth for the years indicated our operating revenue and operating income by segment. We do not prepare separate balance sheets by segment and, as a result, assets are not separately identifiable by segment.
|
(
Dollars in thousands
)
|
2010
|
2009
|
2008
|
|||||||||
|
Operating revenue:
|
||||||||||||
|
Truckload revenue, net of fuel surcharge revenue
|
$ | 325,791 | $ | 346,983 | $ | 384,264 | ||||||
|
Truckload fuel surcharge revenue
|
66,973 | 49,812 | 123,922 | |||||||||
|
Total Truckload revenue
|
392,764 | 396,795 | 508,186 | |||||||||
|
Logistics revenue, net of intermodal
fuel surcharge revenue
(1)
|
115,223 | 103,166 | 90,194 | |||||||||
|
Intermodal fuel surcharge revenue
|
8,933 | 5,913 | 8,719 | |||||||||
|
Total Logistics revenue
|
124,156 | 109,079 | 98,913 | |||||||||
|
Total operating revenue
|
$ | 516,920 | $ | 505,874 | $ | 607,099 | ||||||
|
Operating income:
|
||||||||||||
|
Truckload
|
$ | 28,680 | $ | 22,827 | $ | 26,055 | ||||||
|
Logistics
|
6,609 | 6,532 | 6,650 | |||||||||
|
Total operating income
|
$ | 35,289 | $ | 29,359 | $ | 32,705 | ||||||
|
(1)
|
Logistics revenue is net of $9.1 million, $10.2 million and $16.8 million of inter-segment revenue in 2010, 2009 and 2008, respectively, for loads transported by our tractors and arranged by MWL that have been eliminated in consolidation.
|
During 2010, more than 99% of our revenue was generated within the United States. We earned 18% and 10% of our revenue in 2010 from two single customers whose trade receivables represented 11% and 12%, respectively, of our trade receivables as of December 31, 2010. We earned 20% and 12% of our revenue in 2009 from two single customers whose trade receivables represented 11% and 16%, respectively, of our trade receivables as of December 31, 2009. We earned 19% and 10% of our revenue in 2008 from two single customers.
54
MARTEN TRANSPORT, LTD.
Notes to Consolidated Financial Statements (Continued)
14. Reclassifications
The net interest expense balances of $32,000 for 2009 and $958,000 for 2008 in our consolidated statements of operations have been reclassified to be consistent with the current presentation. This reclassification does not have a material effect on our consolidated financial statements.
15. Quarterly Financial Data (Unaudited)
The following is a summary of the quarterly results of operations for 2010 and 2009:
|
2010 Quarters
(In thousands, except per share amounts)
|
First
|
Second
|
Third
|
Fourth
|
||||||||||||
|
Operating revenue
|
$ | 125,812 | $ | 125,862 | $ | 128,674 | $ | 136,572 | ||||||||
|
Operating income
|
7,034 | 9,193 | 9,986 | 9,076 | ||||||||||||
|
Net income
|
3,892 | 5,158 | 5,482 | 5,210 | ||||||||||||
|
Basic earnings per common share
|
0.18 | 0.24 | 0.25 | 0.24 | ||||||||||||
|
Diluted earnings per common share
|
0.18 | 0.23 | 0.25 | 0.24 | ||||||||||||
|
2009 Quarters
(
In thousands, except per share amounts)
|
First
|
Second
|
Third
|
Fourth
|
||||||||||||
|
Operating revenue
|
$ | 121,955 | $ | 125,804 | $ | 129,395 | $ | 128,720 | ||||||||
|
Operating income
|
7,251 | 7,503 | 6,536 | 8,069 | ||||||||||||
|
Net income
|
4,053 | 4,477 | 3,472 | 4,265 | ||||||||||||
|
Basic earnings per common share
|
0.19 | 0.20 | 0.16 | 0.19 | ||||||||||||
|
Diluted earnings per common share
|
0.18 | 0.20 | 0.16 | 0.19 | ||||||||||||
55
|
ITEM 9.
|
CHANGES IN AND DISAGREEMENTS WITH ACCOUNTANTS ON ACCOUNTING AND FINANCIAL DISCLOSURE
|
No reports on Form 8-K have been required to be filed within the twenty-four months prior to December 31, 2010, involving a change of accountants or disagreements on accounting and financial disclosure.
|
ITEM 9A.
|
CONTROLS AND PROCEDURES
|
As required by Rule 13a-15 under the Securities Exchange Act of 1934 (“Exchange Act”), we have carried out an evaluation of the effectiveness of the design and operation of our disclosure controls and procedures (as defined in Exchange Act Rule 13a-15(e)) as of the end of the period covered by this report. This evaluation was carried out under the supervision and with the participation of our management, including our Chief Executive Officer and our Chief Financial Officer. Based upon that evaluation, our Chief Executive Officer and our Chief Financial Officer concluded that our disclosure controls and procedures were effective as of December 31, 2010. There were no changes in our internal control over financial reporting that occurred during the period covered by this report that have materially affected, or that are reasonably likely to materially affect, our internal control over financial reporting. We intend to periodically evaluate our disclosure controls and procedures as required by the Exchange Act Rules.
We have included Management’s Annual Report on Internal Control Over Financial Reporting in Item 8 above.
|
ITEM 9B.
|
OTHER INFORMATION |
None.
56
|
ITEM 10.
|
DIRECTORS, EXECUTIVE OFFICERS AND CORPORATE GOVERNANCE
|
| A. |
Directors of the Registrant
.
The information in the “Election of Directors--Information About Nominees” and “Election of Directors--Other Information About Nominees” sections of our 2011 Proxy Statement is incorporated in this Report by reference.
|
| B. |
Executive Officers of the Registrant
.
Information about our executive officers is included in this Report under Item 4A, “Executive Officers of the Registrant.”
|
| C. |
Compliance with Section 16(a) of the Exchange Act
.
The information in the “Section 16(a) Beneficial Ownership Reporting Compliance” section of our 2011 Proxy Statement is incorporated in this Report by reference.
|
| D. |
Procedure for Director Nominations by Security Holders
.
There have been no material changes to the procedures by which security holders may recommend nominees to our board of directors.
|
| E. |
Audit Committee Financial Expert
.
The information in the “Election of Directors—Board and Board Committees” section of our 2011 Proxy Statement is incorporated in this Report by reference.
|
| F. |
Identification of the Audit Committee
.
The information in the “Election of Directors—Board and Board Committees” section of our 2011 Proxy Statement is incorporated in this Report by reference.
|
| G. |
Code of Ethics for Senior Financial Management
.
|
| Our Code of Ethics for Senior Financial Management applies to all of our executive officers, including our principal executive officer, principal financial officer and controller, and meets the requirements of the Securities and Exchange Commission. We have posted our Code of Ethics for Senior Financial Management on our website at www.marten.com . We intend to disclose any amendments to and any waivers from a provision of our Code of Ethics for Senior Financial Management on our website within five business days following such amendment or waiver. | |
57
|
ITEM 11.
|
EXECUTIVE COMPENSATION
|
The information in the “Election of Directors--Director Compensation,” “Compensation and Other Benefits” and “Compensation Discussion and Analysis” sections of our 2011 Proxy Statement is incorporated in this Report by reference.
|
ITEM 12.
|
SECURITY OWNERSHIP OF CERTAIN BENEFICIAL OWNERS AND MANAGEMENT AND RELATED STOCKHOLDER MATTERS
|
The information in the “Security Ownership of Certain Beneficial Owners and Management” and “Compensation and Other Benefits--Equity Compensation Plan Information” sections of our 2011 Proxy Statement is incorporated in this Report by reference.
|
ITEM 13.
|
CERTAIN RELATIONSHIPS AND RELATED TRANSACTIONS, AND DIRECTOR INDEPENDENCE
|
The information in the “Related Party Transactions” and “Election of Directors--Board and Board Committees” sections of our 2011 Proxy Statement is incorporated in this Report by reference.
|
ITEM 14.
|
PRINCIPAL ACCOUNTANT FEES AND SERVICES
|
The information in the “Fees of Independent Auditors” section of our 2011 Proxy Statement is incorporated in this Report by reference.
58
|
ITEM 15.
|
EXHIBITS AND FINANCIAL STATEMENT SCHEDULES
|
|
(a)
|
1.
|
Financial Statements
(See Part II, Item 8 of this Report):
|
Page
|
|
Management’s Annual Report on Internal Control Over
|
|||
|
Financial Reporting
|
33
|
||
|
Report of Independent Registered Public Accounting Firm
|
34
|
||
|
Consolidated Balance Sheets as of December 31, 2010 and 2009
|
35
|
||
|
Consolidated Statements of Operations for the years ended
|
|||
|
December 31, 2010, 2009 and 2008
|
36
|
||
|
Consolidated Statements of Stockholders’ Equity
|
|||
|
for the years ended December 31, 2010, 2009 and 2008
|
37
|
||
|
Consolidated Statements of Cash Flows for the years ended
|
|||
|
December 31, 2010, 2009 and 2008
|
38
|
||
|
Notes to Consolidated Financial Statements
|
39
|
||
|
2.
|
Financial Statement Schedules
(Consolidated Financial Statement
Schedule Included in Part IV of this Report):
|
||
|
Schedule II – Valuation and Qualifying Accounts and Reserves
|
62
|
||
|
Schedules not listed above have been omitted as the required information is inapplicable or the information is presented in the consolidated financial statements or related notes.
|
|||
59
|
3.
|
Exhibits
:
|
|||
|
The exhibits to this Report are listed in the Exhibit Index on pages 63 through 65. A copy of any of the exhibits listed will be sent at a reasonable cost to any shareholder as of March 8, 2011. Requests should be sent to James J. Hinnendael, Chief Financial Officer, at our corporate headquarters.
|
||||
|
The following is a list of each management contract or compensatory plan or arrangement required to be filed as an exhibit to this Report under Item 15(a)(3):
|
||||
|
(1)
|
Marten Transport, Ltd. 1995 Stock Incentive Plan.
|
|||
|
(2)
|
Marten Transport, Ltd. 2005 Stock Incentive Plan.
|
|||
|
(3)
|
Amendment to the Marten Transport, Ltd. 2005 Stock Incentive Plan.
|
|||
|
(4)
|
Form of Non-Statutory Stock Option Agreement for the 2005 Stock Incentive Plan.
|
|||
|
(5)
|
Named Executive Officer Compensation.
|
|||
|
(6)
|
2011 Non-employee Director Compensation Summary.
|
|||
|
(7)
|
Form of Amended and Restated Change in Control Severance Agreement.
|
|||
|
(8)
|
Form of First Amendment to Amended and Restated Change in Control Severance Agreement.
|
|||
|
(9)
|
Form of Non-employee Director Non-statutory Stock Option Agreement.
|
|||
|
(10)
|
Form of Performance Based Non-Statutory Stock Option Agreement for 2005 Stock Incentive Plan.
|
|||
|
(11)
|
2009 Non-Driver Employee Bonus Plan.
|
|||
|
(12)
|
Form of Indemnification Agreement.
|
|||
|
(13)
|
Marten Transport, Ltd. Deferred Compensation Plan.
|
|||
|
(14)
|
Form of Performance Unit Award Agreement.
|
|||
60
SIGNATURES
Pursuant to the requirements of Section 13 or 15(d) of the Securities Exchange Act of 1934, Marten Transport, Ltd., the Registrant, has duly caused this Report to be signed on its behalf by the undersigned, thereunto duly authorized.
| Dated: March 15, 2011 |
MARTEN TRANSPORT, LTD.
|
||
|
By:
|
/s/ Randolph L. Marten | ||
| Randolph L. Marten | |||
|
Chairman of the Board and
Chief Executive Officer
|
|||
Pursuant to the requirements of the Securities Exchange Act of 1934, this Report has been signed below on March 15, 2011, by the following persons on behalf of the Registrant and in the capacities indicated.
|
Signature
|
Title
|
|
|
/s/ Randolph L. Marten
|
Chairman of the Board, Chief Executive Officer
|
|
|
Randolph L. Marten
|
and Director (Principal Executive Officer)
|
|
|
/s/ James J. Hinnendael
|
Chief Financial Officer
|
|
|
James J. Hinnendael
|
(Principal Financial and Accounting Officer)
|
|
|
/s/ Larry B. Hagness
|
Director
|
|
|
Larry B. Hagness
|
||
|
/s/ Thomas J. Winkel
|
Director
|
|
|
Thomas J. Winkel
|
||
|
/s/ Jerry M. Bauer
|
Director
|
|
|
Jerry M. Bauer
|
||
|
/s/ Robert L. Demorest
|
Director
|
|
|
Robert L. Demorest
|
||
|
/s/ G. Larry Owens
|
Director
|
|
|
G. Larry Owens
|
61
SCHEDULE II
MARTEN TRANSPORT, LTD.
Valuation and Qualifying Accounts and Reserves
(In thousands)
|
Balance at
|
Charged to
|
|||||||||||||||
|
Beginning of
|
Costs and
|
Balance at
|
||||||||||||||
|
Description
|
Year
|
Expenses
|
Deductions
|
End of Year
|
||||||||||||
|
Insurance and claims accruals:
|
||||||||||||||||
|
Year ended December 31, 2010
|
$ | 19,222 | $ | 24,892 | $ | (26,461 | ) (1) | $ | 17,653 | |||||||
|
Year ended December 31, 2009
|
21,386 | 28,695 | (30,859 | ) (1) | 19,222 | |||||||||||
|
Year ended December 31, 2008
|
17,431 | 37,271 | (33,316 | ) (1) | 21,386 | |||||||||||
|
Allowance for doubtful accounts:
|
||||||||||||||||
|
Year ended December 31, 2010
|
245 | (21 | ) | (54 | ) (2) | 170 | ||||||||||
|
Year ended December 31, 2009
|
380 | 30 | (165 | ) (2) | 245 | |||||||||||
|
Year ended December 31, 2008
|
315 | 78 | (13 | ) (2) | 380 | |||||||||||
(1) Claims payments
(2) Write-off of bad debts, net of recoveries
See report of independent registered public accounting firm.
62
MARTEN TRANSPORT, LTD.
EXHIBIT INDEX TO ANNUAL REPORT
ON FORM 10-K
For the Year Ended December 31, 2010
|
Item No.
|
Item
|
Filing Method
|
|
|
3.1
|
Amended and Restated Certificate of Incorporation effective August 11, 2003
|
Incorporated by reference to Exhibit 4.1 of the Company’s Amendment No. 2 to Registration Statement on Form S-2 (File No. 33-107367).
|
|
|
3.2
|
Amendment to Amended and Restated Certificate of Incorporation effective May 25, 2005
|
Incorporated by reference to Exhibit 3.3 of the Company’s Quarterly Report on Form 10-Q for the quarter ended June 30, 2005 (File No. 0-15010).
|
|
|
3.3
|
Bylaws of the Company, as amended
|
Incorporated by reference to Exhibit 3.3 of the Company’s Annual Report on Form 10-K for the fiscal year ended December 31, 2007 (File No. 0-15010).
|
|
|
4.1
|
Specimen form of the Company’s Common Stock Certificate
|
Incorporated by reference to Exhibit 4.1 of the Company’s Registration Statement on Form S-1 (File No. 33-8108).
|
|
|
4.2
|
Amended and Restated Certificate of Incorporation effective August 11, 2003
|
See Exhibit 3.1 above.
|
|
|
4.3
|
Amendment to Amended and Restated Certificate of Incorporation effective May 25, 2005
|
See Exhibit 3.2 above.
|
|
|
4.4
|
Bylaws of the Company
|
See Exhibit 3.3 above.
|
|
|
10.1
|
Marten Transport, Ltd. 1995 Stock Incentive Plan
|
Incorporated by reference to Exhibit 10.18 of the Company’s Annual Report on Form 10-K for the year ended December 31, 1994 (File No. 0-15010).
|
|
|
10.2
|
Note Purchase and Private Shelf Agreement dated October 30, 1998, between the Company and The Prudential Insurance Company of America
|
Incorporated by reference to Exhibit 10.12 of the Company’s Quarterly Report on Form 10-Q for the quarter ended September 30, 1998 (File No. 0-15010).
|
|
|
10.3
|
Note Purchase Agreement, dated April 6, 2000, between the Company and The Prudential Insurance Company of America
|
Incorporated by reference to Exhibit 10.19 of the Company’s Quarterly Report on Form 10-Q for the quarter ended March 31, 2000 (File No. 0-15010).
|
|
|
10.4
|
Marten Transport, Ltd. 2005 Stock Incentive Plan
|
Incorporated by reference to Exhibit 10.18 of the Company’s Quarterly Report on Form 10-Q for the quarter ended June 30, 2005 (File No. 0-15010).
|
63
|
Item No.
|
Item
|
Filing Method
|
|
|
10.5
|
Form of Non-Statutory Stock Option Agreement for the 2005 Stock Incentive Plan
|
Incorporated by reference to Exhibit 10.1 of the Company’s Current Report on Form 8-K filed January 31, 2006.
|
|
|
10.6
|
Form of Non-employee Director Non-statutory Stock Option Agreement
|
Incorporated by reference to Exhibit 10.26 of the Company’s Quarterly Report on Form 10-Q for the quarter ended June 30, 2006 (File No. 0-15010).
|
|
|
10.7
|
Credit Agreement, dated as of August 31, 2006, by and among Marten Transport, Ltd., as borrower, the banks party thereto as lenders, and U.S. Bank National Association, as agent for the lenders
|
Incorporated by reference to Exhibit 10.1 of the Company’s Current Report on Form 8-K filed September 6, 2006.
|
|
|
10.8
|
First Amendment to Credit Agreement, effective as of January 1, 2007, by and among Marten Transport, Ltd., as borrower, the banks party thereto as lenders, and U.S. Bank National Association, as agent for the lenders
|
Incorporated by reference to Exhibit 10.1 of the Company’s Current Report on Form 8-K filed January 5, 2007.
|
|
|
10.9
|
Form of Performance Based Non-Statutory Stock Option Agreement for 2005 Stock Incentive Plan
|
Incorporated by reference to Exhibit 10.2 of the Company’s Current Report on Form 8-K filed February 16, 2007.
|
|
|
10.10
|
Form of Amended and Restated Change in Control Severance Agreement
|
Incorporated by reference to Exhibit 10.1 of the Company’s Current Report on Form 8-K filed August 15, 2007.
|
|
|
10.11
|
Second Amendment to Credit Agreement, effective as of November 30, 2007, by and among Marten Transport, Ltd., as borrower, the banks party thereto as lenders, and U.S. Bank National Association, as agent for the lenders
|
Incorporated by reference to Exhibit 10.14 of the Company’s Annual Report on Form 10-K for the year ended December 31, 2007 (File No. 0-15010).
|
|
|
10.12
|
Form of First Amendment to Amended and Restated Change in Control Severance Agreement
|
Incorporated by reference to Exhibit 10.18 of the Company’s Annual Report on Form 10-K for the year ended December 31, 2008 (File No. 0-15010).
|
|
|
10.13
|
2009 Non-Driver Employee Bonus Plan
|
Incorporated by reference to Exhibit 10.19 of the Company’s Annual Report on Form 10-K for the year ended December 31, 2008 (File No. 0-15010).
|
|
|
10.14
|
Form of Indemnification Agreement
|
Incorporated by reference to Exhibit 10.1 of the Company’s Current Report on Form 8-K filed February 22, 2010.
|
64
|
Item No.
|
Item
|
Filing Method
|
|
|
10.15
|
Named Executive Officer Compensation
|
Incorporated by reference to Exhibit 10.12 of the Company’s Quarterly Report on Form 10-Q for the quarter ended March 31, 2010 (File No. 0-15010).
|
|
|
10.16
|
Amendment to the Marten Transport, Ltd. 2005 Stock Incentive Plan
|
Incorporated by reference to Exhibit 10.17 of the Company’s Quarterly Report on Form 10-Q for the quarter ended September 30, 2010 (File No. 0-15010).
|
|
|
10.17
|
Marten Transport, Ltd. Deferred Compensation Plan
|
Incorporated by reference to Exhibit 10.18 of the Company’s Quarterly Report on Form 10-Q for the quarter ended September 30, 2010 (File No. 0-15010).
|
|
|
10.18
|
Form of Performance Unit Award Agreement
|
Incorporated by reference to Exhibit 10.19 of the Company’s Quarterly Report on Form 10-Q for the quarter ended September 30, 2010 (File No. 0-15010).
|
|
|
10.19
|
2011 Non-employee Director Compensation Summary
|
Filed with this Report.
|
|
|
23.1
|
Consent of KPMG LLP
|
Filed with this Report.
|
|
|
31.1
|
Certification pursuant to Item 601(b)(31) of Regulation S-K, as adopted pursuant to Section 302 of the Sarbanes-Oxley Act of 2002, by Randolph L. Marten, the Registrant’s Chief Executive Officer (Principal Executive Officer)
|
Filed with this Report.
|
|
|
31.2
|
Certification pursuant to Item 601(b)(31) of Regulation S-K, as adopted pursuant to Section 302 of the Sarbanes-Oxley Act of 2002, by James J. Hinnendael, the Registrant’s Chief Financial Officer (Principal Financial Officer)
|
Filed with this Report.
|
|
|
32.1
|
Certification pursuant to 18 U.S.C. Section 1350, as adopted pursuant to Section 906 of the Sarbanes-Oxley Act of 2002
|
Filed with this Report.
|
65
TABLE OF CONTENTS
Part IItem 1. BusinessItem 1A. Risk FactorsItem 1B. Unresolved Staff CommentsItem 2. PropertiesItem 3. Legal ProceedingsItem 4A. Executive Officers Of The RegistrantPart IIItem 5. Market For Registrant S Common Equity, Related Stockholder Matters and Issuer Purchases Of Equity SecuritiesItem 6. Selected Financial DataItem 7. Management S Discussion and Analysis Of Financial Condition and Results Of OperationsItem 7A. Quantitative and Qualitative Disclosures About Market RiskItem 8. Financial Statements and Supplementary Data Management S Annual Report on Internal Control Over Financial ReportingItem 8. Financial Statements and Supplementary DataItem 9. Changes in and Disagreements with Accountants on Accounting and Financial DisclosureItem 9A. Controls and ProceduresItem 9B. Other InformationPart IIIItem 10. Directors, Executive Officers and Corporate GovernanceItem 11. Executive CompensationItem 12. Security Ownership Of Certain Beneficial Owners and Management and Related Stockholder MattersItem 13. Certain Relationships and Related Transactions, and Director IndependenceItem 14. Principal Accountant Fees and ServicesPart IVItem 15. Exhibits and Financial Statement SchedulesItem No. Item Filing Method