|
|
|
|
|
|
|
|
|
|
|
|
|
|
|
|
|
|
|
|
|
|
|
|
|
|
|
|
|
|
|
|
|
|
|
|
|
|
|
|
|
|
|
|
|
|
|
|
|
|
|
|
|
Table of Contents
UNITED STATES SECURITIES AND EXCHANGE COMMISSION
Washington, D.C. 20549
FORM 10-Q
x QUARTERLY REPORT PURSUANT TO SECTION 13 OR 15(d) OF THE SECURITIES
EXCHANGE ACT OF 1934
For the quarterly period ended June 30, 2016
OR
¨ TRANSITION REPORT PURSUANT TO SECTION 13 OR 15(d) OF THE SECURITIES
EXCHANGE ACT OF 1934
Commission File Number 1-11758

(Exact Name of Registrant as specified in its charter)
|
Delaware (State or other jurisdiction of incorporation or organization) |
1585 Broadway New York, NY 10036 (Address of principal executive offices, including zip code) |
36-3145972 (I.R.S. Employer Identification No.) |
(212) 761-4000 (Registrant’s telephone number, including area code) |
Indicate by check mark whether the Registrant (1) has filed all reports required to be filed by Section 13 or 15(d) of the Securities Exchange Act of 1934 during the preceding 12 months (or for such shorter period that the Registrant was required to file such reports), and (2) has been subject to such filing requirements for the past 90 days. Yes x No ¨
Indicate by check mark whether the Registrant has submitted electronically and posted on its corporate Web site, if any, every Interactive Data File required to be submitted and posted pursuant to Rule 405 of Regulation S-T (§ 232.405 of this chapter) during the preceding 12 months (or for such shorter period that the Registrant was required to submit and post such files). Yes x No ¨
Indicate by check mark whether the Registrant is a large accelerated filer, an accelerated filer, a non-accelerated filer, or a smaller reporting company. See the definitions of “large accelerated filer,” “accelerated filer” and “smaller reporting company” in Rule 12b-2 of the Exchange Act. (Check one):
|
Large Accelerated Filer x |
Accelerated Filer ¨ |
|
|
Non-Accelerated Filer ¨ |
Smaller reporting company ¨ |
|
|
(Do not check if a smaller reporting company) |
Indicate by check mark whether the Registrant is a shell company (as defined in Rule 12b-2 of the Exchange Act). Yes ¨ No x
As of July 29, 2016, there were 1,911,808,935 shares of the Registrant’s Common Stock, par value $0.01 per share, outstanding.
Table of Contents
QUARTERLY REPORT ON FORM 10-Q
For the quarter ended June 30, 2016
|
Page |
||||
|
Part I—Financial Information |
||||
|
Item 1. |
1 | |||
| 1 | ||||
| 2 | ||||
| 3 | ||||
| 4 | ||||
| 5 | ||||
| 6 | ||||
| 6 | ||||
| 7 | ||||
| 8 | ||||
| 27 | ||||
| 34 | ||||
| 40 | ||||
| 43 | ||||
| 47 | ||||
| 47 | ||||
| 47 | ||||
| 48 | ||||
|
12. Variable Interest Entities and Securitization Activities |
53 | |||
| 59 | ||||
| 61 | ||||
| 64 | ||||
| 65 | ||||
| 65 | ||||
| 66 | ||||
| 67 | ||||
| 70 | ||||
| 71 | ||||
|
Item 2. |
Management’s Discussion and Analysis of Financial Condition and Results of Operations |
72 | ||
| 72 | ||||
| 73 | ||||
| 78 | ||||
| 90 | ||||
| 91 | ||||
| 91 | ||||
| 92 | ||||
|
Item 3. |
108 | |||
|
Item 4. |
121 | |||
| 122 | ||||
|
Part II—Other Information |
||||
|
Item 1. |
128 | |||
|
Item 2. |
129 | |||
|
Item 6. |
129 | |||
| i |

|
Table of Contents
Available Information.
We file annual, quarterly and current reports, proxy statements and other information with the U.S. Securities and Exchange Commission (the “SEC”). You may read and copy any document we file with the SEC at the SEC’s public reference room at 100 F Street, NE, Washington, DC 20549. Please call the SEC at 1-800-SEC-0330 for information on the public reference room. The SEC maintains an internet site that contains annual, quarterly and current reports, proxy and information statements and other information that issuers (including us) file electronically with the SEC. Our electronic SEC filings are available to the public at the SEC’s internet site, www.sec.gov.
Our internet site is www.morganstanley.com . You can access our Investor Relations webpage at www.morganstanley.com/about-us-ir . We make available free of charge, on or through our Investor Relations webpage, our proxy statements, Annual Reports on Form 10-K, Quarterly Reports on Form 10-Q, Current Reports on Form 8-K and any amendments to those reports filed or furnished pursuant to the Securities Exchange Act of 1934, as amended (the “Exchange Act”), as soon as reasonably practicable after such material is electronically filed with, or furnished to, the SEC. We also make available, through our Investor Relations webpage, via a link to the SEC’s internet site, statements of beneficial ownership of our equity securities filed by our directors, officers, 10% or greater shareholders and others under Section 16 of the Exchange Act.
You can access information about our corporate governance at www.morganstanley.com/about-us-governance. Our Corporate Governance webpage includes:
| • |
Amended and Restated Certificate of Incorporation; |
| • |
Amended and Restated Bylaws; |
| • |
Charters for its Audit Committee, Compensation, Management Development and Succession Committee, Nominating and Governance Committee, Operations and Technology Committee, and Risk Committee; |
| • |
Corporate Governance Policies; |
| • |
Policy Regarding Communication with the Board of Directors; |
| • |
Policy Regarding Director Candidates Recommended by Shareholders; |
| • |
Policy Regarding Corporate Political Activities; |
| • |
Policy Regarding Shareholder Rights Plan; |
| • |
Equity Ownership Commitment; |
| • |
Code of Ethics and Business Conduct; |
| • |
Code of Conduct; and |
| • |
Integrity Hotline Information. |
Morgan Stanley’s Code of Ethics and Business Conduct applies to all directors, officers and employees, including our Chief Executive Officer, Chief Financial Officer and Deputy Chief Financial Officer. We will post any amendments to the Code of Ethics and Business Conduct and any waivers that are required to be disclosed by the rules of either the SEC or the New York Stock Exchange LLC (“NYSE”) on our internet site. You can request a copy of these documents, excluding exhibits, at no cost, by contacting Investor Relations, 1585 Broadway, New York, NY 10036 (212-761-4000). The information on our internet site is not incorporated by reference into this report.
|
|
ii |
Table of Contents
MORGAN STANLEY
(in millions, except per share data)
(unaudited)
|
Three Months Ended
June 30,
|
Six Months Ended
June 30,
|
|||||||||||||||
|
2016 |
2015 |
2016 |
2015 |
|||||||||||||
|
Revenues: |
||||||||||||||||
|
Investment banking |
$ | 1,224 | $ | 1,614 | $ | 2,331 | $ | 2,971 | ||||||||
|
Trading |
2,746 | 2,973 | 4,811 | 6,623 | ||||||||||||
|
Investments |
126 | 261 | 92 | 527 | ||||||||||||
|
Commissions and fees |
1,020 | 1,158 | 2,075 | 2,344 | ||||||||||||
|
Asset management, distribution and administration fees |
2,637 | 2,742 | 5,257 | 5,423 | ||||||||||||
|
Other |
243 | 297 | 323 | 468 | ||||||||||||
|
|
|
|
|
|
|
|
|
|||||||||
|
Total non-interest revenues |
|
7,996 |
|
|
9,045 |
|
|
14,889 |
|
|
18,356 |
|
||||
|
|
|
|
|
|
|
|
|
|||||||||
|
Interest income |
|
1,667 |
|
|
1,386 |
|
|
3,414 |
|
|
2,870 |
|
||||
|
Interest expense |
754 | 688 | 1,602 | 1,576 | ||||||||||||
|
|
|
|
|
|
|
|
|
|||||||||
|
Net interest |
|
913 |
|
|
698 |
|
|
1,812 |
|
|
1,294 |
|
||||
|
|
|
|
|
|
|
|
|
|||||||||
|
Net revenues |
|
8,909 |
|
|
9,743 |
|
|
16,701 |
|
|
19,650 |
|
||||
|
|
|
|
|
|
|
|
|
|||||||||
|
Non-interest expenses: |
||||||||||||||||
|
Compensation and benefits |
4,015 | 4,405 | 7,698 | 8,929 | ||||||||||||
|
Occupancy and equipment |
329 | 351 | 658 | 693 | ||||||||||||
|
Brokerage, clearing and exchange fees |
484 | 487 | 949 | 950 | ||||||||||||
|
Information processing and communications |
429 | 438 | 871 | 853 | ||||||||||||
|
Marketing and business development |
154 | 179 | 288 | 329 | ||||||||||||
|
Professional services |
547 | 598 | 1,061 | 1,084 | ||||||||||||
|
Other |
468 | 558 | 955 | 1,230 | ||||||||||||
|
|
|
|
|
|
|
|
|
|||||||||
|
Total non-interest expenses |
|
6,426 |
|
|
7,016 |
|
|
12,480 |
|
|
14,068 |
|
||||
|
|
|
|
|
|
|
|
|
|||||||||
|
Income from continuing operations before income taxes |
|
2,483 |
|
|
2,727 |
|
|
4,221 |
|
|
5,582 |
|
||||
|
Provision for income taxes |
833 | 894 | 1,411 | 1,281 | ||||||||||||
|
|
|
|
|
|
|
|
|
|||||||||
|
Income from continuing operations |
|
1,650 |
|
|
1,833 |
|
|
2,810 |
|
|
4,301 |
|
||||
|
Income (loss) from discontinued operations, net of income taxes |
(4) | (2) | (7) | (7) | ||||||||||||
|
|
|
|
|
|
|
|
|
|||||||||
|
Net income |
$ |
1,646 |
|
$ |
1,831 |
|
$ |
2,803 |
|
$ |
4,294 |
|
||||
|
Net income applicable to noncontrolling interests |
64 | 24 | 87 | 93 | ||||||||||||
|
|
|
|
|
|
|
|
|
|||||||||
|
Net income applicable to Morgan Stanley |
$ |
1,582 |
|
$ |
1,807 |
|
$ |
2,716 |
|
$ |
4,201 |
|
||||
|
Preferred stock dividends and other |
157 | 142 | 235 | 222 | ||||||||||||
|
|
|
|
|
|
|
|
|
|||||||||
|
Earnings applicable to Morgan Stanley common shareholders |
$ |
1,425 |
|
$ |
1,665 |
|
$ |
2,481 |
|
$ |
3,979 |
|
||||
|
|
|
|
|
|
|
|
|
|||||||||
|
Earnings per basic common share: |
||||||||||||||||
|
Income from continuing operations |
$ | 0.77 | $ | 0.87 | $ | 1.33 | $ | 2.07 | ||||||||
|
Income (loss) from discontinued operations |
(0.01) | — | (0.01) | — | ||||||||||||
|
|
|
|
|
|
|
|
|
|||||||||
|
Earnings per basic common share |
$ |
0.76 |
|
$ |
0.87 |
|
$ |
1.32 |
|
$ |
2.07 |
|
||||
|
|
|
|
|
|
|
|
|
|||||||||
|
Earnings per diluted common share: |
||||||||||||||||
|
Income from continuing operations |
$ | 0.75 | $ | 0.85 | $ | 1.30 | $ | 2.03 | ||||||||
|
Income (loss) from discontinued operations |
— | — | — | — | ||||||||||||
|
|
|
|
|
|
|
|
|
|||||||||
|
Earnings per diluted common share |
$ |
0.75 |
|
$ |
0.85 |
|
$ |
1.30 |
|
$ |
2.03 |
|
||||
|
|
|
|
|
|
|
|
|
|||||||||
|
Dividends declared per common share |
$ |
0.15 |
|
$ |
0.15 |
|
$ |
0.30 |
|
$ |
0.25 |
|
||||
|
Average common shares outstanding: |
||||||||||||||||
|
Basic |
1,866 | 1,919 | 1,875 | 1,922 | ||||||||||||
|
Diluted |
1,899 | 1,960 | 1,907 | 1,962 | ||||||||||||
See Notes to Consolidated Financial Statements.
| 1 |
|
Table of Contents
MORGAN STANLEY
Consolidated Statements of Comprehensive Income
(dollars in millions)
(unaudited)
|
Three Months Ended
June 30,
|
Six Months Ended
June 30,
|
|||||||||||||||
|
2016 |
2015 |
2016 |
2015 |
|||||||||||||
|
Net income |
$ | 1,646 | $ | 1,831 | $ | 2,803 | $ | 4,294 | ||||||||
|
Other comprehensive income (loss), net of tax: |
||||||||||||||||
|
Foreign currency translation adjustments(1) |
$ | 131 | $ | 34 | $ | 317 | $ | (188) | ||||||||
|
Change in net unrealized gains (losses) on available for sale
|
143 | (228) | 538 | (28) | ||||||||||||
|
Pension, postretirement and other |
(5) | (3) | (4) | (1) | ||||||||||||
|
Change in net debt valuation adjustments(3) |
145 | — | 348 | — | ||||||||||||
|
|
|
|
|
|
|
|
|
|||||||||
|
Total other comprehensive income (loss) |
$ |
414 |
|
$ |
(197) |
|
$ |
1,199 |
|
$ |
(217) |
|
||||
|
|
|
|
|
|
|
|
|
|||||||||
|
Comprehensive income |
$ |
2,060 |
|
$ |
1,634 |
|
$ |
4,002 |
|
$ |
4,077 |
|
||||
|
Net income applicable to noncontrolling interests |
64 | 24 | 87 | 93 | ||||||||||||
|
Other comprehensive income (loss) applicable to noncontrolling interests |
81 | (16) | 136 | (18) | ||||||||||||
|
|
|
|
|
|
|
|
|
|||||||||
|
Comprehensive income applicable to Morgan Stanley |
$ |
1,915 |
|
$ |
1,626 |
|
$ |
3,779 |
|
$ |
4,002 |
|
||||
|
|
|
|
|
|
|
|
|
|||||||||
| (1) |
Amounts include Provision for (benefit from) income taxes of $ (59) million and $(54) million in the quarter ended June 30, 2016 (“current quarter”) and the quarter ended June 30, 2015 (“prior year quarter”), respectively, and $ (174) million and $120 million in the six months ended June 30, 2016 (“current year period”) and the six months ended June 30, 2015 (“prior year period”), respectively. |
| (2) |
Amounts include Provision for (benefit from) income taxes of $ 84 million and $(137) million in the current quarter and prior year quarter, respectively, and $ 314 million and $(16) million in the current year period and prior year period, respectively. |
| (3) |
Debt valuation adjustments (“DVA”) represent the change in the fair value resulting from fluctuations in the Firm’s credit spreads and other credit factors related to liabilities carried at fair value, primarily certain Long-term and Short-term borrowings. Amounts include Provision for (benefit from) income taxes of $ 80 million and $ 200 million in the current quarter and current year period, respectively. See Notes 2 and 14 for further information. |
See Notes to Consolidated Financial Statements.
|
|
2 |
Table of Contents
(dollars in millions, except share data)
(unaudited)
|
At June 30,
2016
|
At December 31,
2015
|
|||||||
|
Assets |
||||||||
|
Cash and due from banks |
$ | 27,597 | $ | 19,827 | ||||
|
Interest bearing deposits with banks |
28,536 | 34,256 | ||||||
|
Trading assets, at fair value ( $141,543 and $127,627 were pledged to various parties) |
256,794 | 239,505 | ||||||
|
Investment securities (includes $67,726 and $66,759 at fair value) |
80,144 | 71,983 | ||||||
|
Securities purchased under agreements to resell (includes $555 and $806 at fair value) |
97,589 | 87,657 | ||||||
|
Securities borrowed |
131,281 | 142,416 | ||||||
|
Customer and other receivables |
52,827 | 45,407 | ||||||
|
Loans: |
||||||||
|
Held for investment (net of allowances of $323 and $225) |
77,283 | 72,559 | ||||||
|
Held for sale |
15,882 | 13,200 | ||||||
|
Goodwill |
6,581 | 6,584 | ||||||
|
Intangible assets (net of accumulated amortization of $2,279 and $2,130) (includes $3 and $5 at fair value) |
2,833 | 2,984 | ||||||
|
Other assets |
51,526 | 51,087 | ||||||
|
|
|
|
|
|||||
|
Total assets |
$ |
828,873 |
|
$ |
787,465 |
|
||
|
|
|
|
|
|||||
|
Liabilities |
||||||||
|
Deposits (includes $95 and $125 at fair value) |
$ | 152,693 | $ | 156,034 | ||||
|
Short-term borrowings (includes $511 and $1,648 at fair value) |
880 | 2,173 | ||||||
|
Trading liabilities, at fair value |
140,662 | 128,455 | ||||||
|
Securities sold under agreements to repurchase (includes $699 and $683 at fair value) |
50,328 | 36,692 | ||||||
|
Securities loaned |
17,241 | 19,358 | ||||||
|
Other secured financings (includes $2,921 and $2,854 at fair value) |
9,901 | 9,464 | ||||||
|
Customer and other payables |
201,189 | 186,626 | ||||||
|
Other liabilities and accrued expenses |
14,112 | 18,711 | ||||||
|
Long-term borrowings (includes $37,804 and $33,045 at fair value) |
163,492 | 153,768 | ||||||
|
|
|
|
|
|||||
|
Total liabilities |
|
750,498 |
|
|
711,281 |
|
||
|
|
|
|
|
|||||
|
Commitments and contingent liabilities (see Note 11) |
||||||||
|
Equity |
||||||||
|
Morgan Stanley shareholders’ equity: |
||||||||
|
Preferred stock (see Note 14) |
7,520 | 7,520 | ||||||
|
Common stock, $0.01 par value: |
||||||||
|
Shares authorized: 3,500,000,000 ; Shares issued: 2,038,893,979 ; Shares outstanding: 1,917,509,492 and 1,920,024,027 |
20 | 20 | ||||||
|
Additional paid-in capital |
22,697 | 24,153 | ||||||
|
Retained earnings |
51,410 | 49,204 | ||||||
|
Employee stock trusts |
2,873 | 2,409 | ||||||
|
Accumulated other comprehensive income (loss) |
(905) | (1,656) | ||||||
|
Common stock held in treasury, at cost, $0.01 par value ( 121,384,487 and 118,869,952 shares) |
(3,626) | (4,059) | ||||||
|
Common stock issued to employee stock trusts |
(2,873) | (2,409) | ||||||
|
|
|
|
|
|||||
|
Total Morgan Stanley shareholders’ equity |
|
77,116 |
|
|
75,182 |
|
||
|
Noncontrolling interests |
1,259 | 1,002 | ||||||
|
|
|
|
|
|||||
|
Total equity |
|
78,375 |
|
|
76,184 |
|
||
|
|
|
|
|
|||||
|
Total liabilities and equity |
$ |
828,873 |
|
$ |
787,465 |
|
||
|
|
|
|
|
|||||
See Notes to Consolidated Financial Statements.
| 3 |
|
Table of Contents
Consolidated Statements of Changes in Total Equity
Six Months Ended June 30, 2016 and 2015
(dollars in millions)
(unaudited)
|
Preferred
Stock
|
Common
Stock
|
Additional
Paid-in Capital
|
Retained
Earnings
|
Employee
Stock Trusts
|
Accumulated
Other Comprehensive Income (Loss)
|
Common
Stock Held in Treasury at Cost
|
Common
Stock Issued to Employee Stock Trusts
|
Non-
controlling Interests
|
Total
Equity
|
|||||||||||||||||||||||||||||||
|
BALANCE AT DECEMBER 31, 2015 |
$ | 7,520 | $ | 20 | $ | 24,153 | $ | 49,204 | $ | 2,409 | $ | (1,656) | $ | (4,059) | $ | (2,409) | $ | 1,002 | $ | 76,184 | ||||||||||||||||||||
|
Cumulative adjustment for accounting change related to DVA(1) |
— | — | — | 312 | — | (312) | — | — | — | — | ||||||||||||||||||||||||||||||
|
Net adjustment for accounting change related to consolidation(2) |
— | — | — | — | — | — | — | — | 106 | 106 | ||||||||||||||||||||||||||||||
|
Net income applicable to Morgan Stanley |
— | — | — | 2,716 | — | — | — | — | — | 2,716 | ||||||||||||||||||||||||||||||
|
Net income applicable to noncontrolling interests |
— | — | — | — | — | — | — | — | 87 | 87 | ||||||||||||||||||||||||||||||
|
Dividends |
— | — | — | (822) | — | — | — | — | — | (822) | ||||||||||||||||||||||||||||||
|
Shares issued under employee plans and related tax effects |
— | — | (1,456) | — | 464 | — | 2,062 | (464) | — | 606 | ||||||||||||||||||||||||||||||
|
Repurchases of common stock and employee tax withholdings |
— | — | — | — | — | — | (1,629) | — | — | (1,629) | ||||||||||||||||||||||||||||||
|
Net change in Accumulated other comprehensive income (loss) |
— | — | — | — | — | 1,063 | — | — | 136 | 1,199 | ||||||||||||||||||||||||||||||
|
Other net decreases |
— | — | — | — | — | — | — | — | (72) | (72) | ||||||||||||||||||||||||||||||
|
|
|
|
|
|
|
|
|
|
|
|
|
|
|
|
|
|
|
|
|
|||||||||||||||||||||
|
BALANCE AT JUNE 30, 2016 |
$ | 7,520 | $ | 20 | $ | 22,697 | $ | 51,410 | $ | 2,873 | $ | (905) | $ | (3,626) | $ | (2,873) | $ | 1,259 | $ | 78,375 | ||||||||||||||||||||
|
|
|
|
|
|
|
|
|
|
|
|
|
|
|
|
|
|
|
|
|
|||||||||||||||||||||
|
BALANCE AT DECEMBER 31, 2014 |
$ | 6,020 | $ | 20 | $ | 24,249 | $ | 44,625 | $ | 2,127 | $ | (1,248) | $ | (2,766) | $ | (2,127) | $ | 1,204 | $ | 72,104 | ||||||||||||||||||||
|
Net income applicable to Morgan Stanley |
— | — | — | 4,201 | — | — | — | — | — | 4,201 | ||||||||||||||||||||||||||||||
|
Net income applicable to noncontrolling interests |
— | — | — | — | — | — | — | — | 93 | 93 | ||||||||||||||||||||||||||||||
|
Dividends |
— | — | — | (720) | — | — | — | — | — | (720) | ||||||||||||||||||||||||||||||
|
Shares issued under employee plans and related tax effects |
— | — | (577) | — | 314 | — | 1,423 | (314) | — | 846 | ||||||||||||||||||||||||||||||
|
Repurchases of common stock and employee tax withholdings |
— | — | — | — | — | — | (1,473) | — | — | (1,473) | ||||||||||||||||||||||||||||||
|
Net change in Accumulated other comprehensive income (loss) |
— | — | — | — | — | (199) | — | — | (18) | (217) | ||||||||||||||||||||||||||||||
|
Issuance of preferred stock |
1,500 | — | (7) | — | — | — | — | — | — | 1,493 | ||||||||||||||||||||||||||||||
|
Deconsolidation of certain legal entities associated with a real estate fund |
— | — | — | — | — | — | — | — | (191) | (191) | ||||||||||||||||||||||||||||||
|
Other net decreases |
— | — | (10) | — | — | — | — | — | (59) | (69) | ||||||||||||||||||||||||||||||
|
|
|
|
|
|
|
|
|
|
|
|
|
|
|
|
|
|
|
|
|
|||||||||||||||||||||
|
BALANCE AT JUNE 30, 2015 |
$ | 7,520 | $ | 20 | $ | 23,655 | $ | 48,106 | $ | 2,441 | $ | (1,447) | $ | (2,816) | $ | (2,441) | $ | 1,029 | $ | 76,067 | ||||||||||||||||||||
|
|
|
|
|
|
|
|
|
|
|
|
|
|
|
|
|
|
|
|
|
|||||||||||||||||||||
| (1) |
In accordance with the early adoption of a provision of the accounting update Recognition and Measurement of Financial Assets and Financial Liabilities , a cumulative catch up adjustment was recorded as of January 1, 2016 to move the cumulative DVA amount, net of noncontrolling interest and tax, related to outstanding liabilities under the fair value option election from Retained earnings into Accumulated other comprehensive income (loss) (“AOCI”). See Notes 2 and 14 for further information. |
| (2) |
In accordance with the accounting update Amendments to the Consolidation Analysis , a net adjustment was recorded as of January 1, 2016 to consolidate or deconsolidate certain entities under the new guidance. See Note 2 for further information. |
See Notes to Consolidated Financial Statements.
|
|
4 |
Table of Contents
(dollars in millions)
(unaudited)
|
Six Months Ended
June 30,
|
||||||||
|
2016 |
2015 |
|||||||
|
CASH FLOWS FROM OPERATING ACTIVITIES |
||||||||
|
Net income |
$ | 2,803 | $ | 4,294 | ||||
|
Adjustments to reconcile net income to net cash provided by (used for) operating activities: |
||||||||
|
Income from equity method investments |
(1) | (83) | ||||||
|
Compensation payable in common stock and options |
492 | 611 | ||||||
|
Depreciation and amortization |
879 | 654 | ||||||
|
Net gain on sale of available for sale securities |
(82) | (55) | ||||||
|
Impairment charges |
67 | 83 | ||||||
|
Provision for credit losses on lending activities |
131 | 38 | ||||||
|
Other operating adjustments |
218 | 37 | ||||||
|
Changes in assets and liabilities: |
||||||||
|
Trading assets, net of Trading liabilities |
(333) | 25,115 | ||||||
|
Securities borrowed |
11,135 | (7,261) | ||||||
|
Securities loaned |
(2,117) | (2,068) | ||||||
|
Customer and other receivables and other assets |
(10,537) | (601) | ||||||
|
Customer and other payables and other liabilities |
9,907 | (1,482) | ||||||
|
Securities purchased under agreements to resell |
(9,932) | (23,472) | ||||||
|
Securities sold under agreements to repurchase |
13,636 | (4,263) | ||||||
|
|
|
|
|
|||||
|
Net cash provided by (used for) operating activities |
|
16,266 |
|
|
(8,453) |
|
||
|
|
|
|
|
|||||
|
CASH FLOWS FROM INVESTING ACTIVITIES |
||||||||
|
Proceeds from (payments for): |
||||||||
|
Other assets—Premises, equipment and software, net |
(645) | (620) | ||||||
|
Changes in loans, net |
(4,724) | (9,082) | ||||||
|
Investment securities: |
||||||||
|
Purchases |
(30,700) | (26,832) | ||||||
|
Proceeds from sales |
20,274 | 26,501 | ||||||
|
Proceeds from paydowns and maturities |
3,507 | 2,796 | ||||||
|
Other investing activities |
(126) | (97) | ||||||
|
|
|
|
|
|||||
|
Net cash used for investing activities |
|
(12,414) |
|
|
(7,334) |
|
||
|
|
|
|
|
|||||
|
CASH FLOWS FROM FINANCING ACTIVITIES |
||||||||
|
Net proceeds from (payments for): |
||||||||
|
Short-term borrowings |
(1,293) | 861 | ||||||
|
Noncontrolling interests |
(43) | (60) | ||||||
|
Other secured financings |
(69) | (280) | ||||||
|
Deposits |
(3,341) | 5,659 | ||||||
|
Proceeds from: |
||||||||
|
Excess tax benefits associated with stock-based awards |
42 | 176 | ||||||
|
Derivatives financing activities |
— | 312 | ||||||
|
Issuance of preferred stock, net of issuance costs |
— | 1,493 | ||||||
|
Issuance of long-term borrowings |
20,628 | 22,909 | ||||||
|
Payments for: |
||||||||
|
Long-term borrowings |
(15,900) | (12,963) | ||||||
|
Derivatives financing activities |
(120) | (257) | ||||||
|
Repurchases of common stock and employee tax withholdings |
(1,629) | (1,473) | ||||||
|
Cash dividends |
(791) | (673) | ||||||
|
|
|
|
|
|||||
|
Net cash provided by (used for) financing activities |
|
(2,516) |
|
|
15,704 |
|
||
|
|
|
|
|
|||||
|
Effect of exchange rate changes on cash and cash equivalents |
|
714 |
|
|
(542) |
|
||
|
|
|
|
|
|||||
|
Net increase (decrease) in cash and cash equivalents |
|
2,050 |
|
|
(625) |
|
||
|
Cash and cash equivalents, at beginning of period |
54,083 | 46,984 | ||||||
|
|
|
|
|
|||||
|
Cash and cash equivalents, at end of period |
$ |
56,133 |
|
$ |
46,359 |
|
||
|
|
|
|
|
|||||
|
Cash and cash equivalents include: |
||||||||
|
Cash and due from banks |
$ | 27,597 | $ | 19,145 | ||||
|
Interest bearing deposits with banks |
28,536 | 27,214 | ||||||
|
|
|
|
|
|||||
|
Cash and cash equivalents, at end of period |
$ |
56,133 |
|
$ |
46,359 |
|
||
|
|
|
|
|
|||||
SUPPLEMENTAL DISCLOSURE OF CASH FLOW INFORMATION
Cash payments for interest were $ 1,082 million and $1,027 million.
Cash payments for income taxes, net of refunds, were $ 340 million and $342 million.
See Notes to Consolidated Financial Statements.
| 5 |
|
Table of Contents
NOTES TO CONSOLIDATED FINANCIAL STATEMENTS (Unaudited)
| 1. Introduction |
and Basis of Presentation |
|
|
6 |
Table of Contents
MORGAN STANLEY
NOTES TO CONSOLIDATED FINANCIAL STATEMENTS (Unaudited)—(Continued)
| 2. Significant |
Accounting Policies |
| 7 |
|
Table of Contents
MORGAN STANLEY
NOTES TO CONSOLIDATED FINANCIAL STATEMENTS (Unaudited)—(Continued)
| 3. Fair |
Values |
Fair Value Measurements
For a description of the valuation techniques applied to the Firm’s major categories of assets and liabilities measured at fair value on a recurring basis, see Note 3 to the consolidated financial statements in the 2015 Form 10-K. During the current quarter and current year period, there were no significant updates made to the Firm’s valuation techniques.
Assets and Liabilities Measured at Fair Value on a Recurring Basis
|
Level 1
|
Level 2
|
Level 3
|
Counterparty
and Cash Collateral Netting
|
Balance at June 30,
2016
|
||||||||||||||||
|
(dollars in millions) |
||||||||||||||||||||
|
Assets at Fair Value |
||||||||||||||||||||
|
Trading assets: |
||||||||||||||||||||
|
U.S. government and agency securities: |
||||||||||||||||||||
|
U.S. Treasury securities |
$ | 24,565 | $ | — | $ | — | $ | — | $ | 24,565 | ||||||||||
|
U.S. agency securities |
795 | 22,085 | 20 | — | 22,900 | |||||||||||||||
|
|
|
|
|
|
|
|
|
|
|
|||||||||||
|
Total U.S. government and agency securities |
|
25,360 |
|
|
22,085 |
|
|
20 |
|
|
— |
|
|
47,465 |
|
|||||
|
Other sovereign government obligations |
20,942 | 6,607 | 2 | — | 27,551 | |||||||||||||||
|
Corporate and other debt: |
||||||||||||||||||||
|
State and municipal securities |
— | 1,943 | 10 | — | 1,953 | |||||||||||||||
|
Residential mortgage-backed securities |
— | 586 | 216 | — | 802 | |||||||||||||||
|
Commercial mortgage-backed securities |
— | 961 | 51 | — | 1,012 | |||||||||||||||
|
Asset-backed securities |
— | 142 | 88 | — | 230 | |||||||||||||||
|
Corporate bonds |
— | 11,751 | 276 | — | 12,027 | |||||||||||||||
|
Collateralized debt and loan obligations |
— | 443 | 109 | — | 552 | |||||||||||||||
|
Loans and lending commitments(1) |
— | 3,879 | 5,418 | — | 9,297 | |||||||||||||||
|
Other debt |
— | 827 | 528 | — | 1,355 | |||||||||||||||
|
|
|
|
|
|
|
|
|
|
|
|||||||||||
|
Total corporate and other debt |
|
— |
|
|
20,532 |
|
|
6,696 |
|
|
— |
|
|
27,228 |
|
|||||
|
Corporate equities(2) |
100,018 | 367 | 572 | — | 100,957 | |||||||||||||||
|
Securities received as collateral |
10,121 | 7 | — | — | 10,128 | |||||||||||||||
|
Derivative and other contracts: |
||||||||||||||||||||
|
Interest rate contracts |
791 | 462,243 | 540 | — | 463,574 | |||||||||||||||
|
Credit contracts |
— | 16,157 | 304 | — | 16,461 | |||||||||||||||
|
Foreign exchange contracts |
140 | 76,264 | 101 | — | 76,505 | |||||||||||||||
|
Equity contracts |
1,368 | 40,524 | 637 | — | 42,529 | |||||||||||||||
|
Commodity contracts |
2,847 | 8,605 | 4,057 | — | 15,509 | |||||||||||||||
|
Other |
— | 16 | — | — | 16 | |||||||||||||||
|
Netting(3) |
(4,184) | (505,871) | (2,537) | (63,844) | (576,436) | |||||||||||||||
|
|
|
|
|
|
|
|
|
|
|
|||||||||||
|
Total derivative and other contracts |
|
962 |
|
|
97,938 |
|
|
3,102 |
|
|
(63,844) |
|
|
38,158 |
|
|||||
|
Investments(4): |
||||||||||||||||||||
|
Principal investments |
21 | 19 | 769 | — | 809 | |||||||||||||||
|
Other |
295 | 559 | 205 | — | 1,059 | |||||||||||||||
|
|
|
|
|
|
|
|
|
|
|
|||||||||||
|
Total investments |
|
316 |
|
|
578 |
|
|
974 |
|
|
— |
|
|
1,868 |
|
|||||
|
Physical commodities |
— | 193 | — | — | 193 | |||||||||||||||
|
|
|
|
|
|
|
|
|
|
|
|||||||||||
|
Total trading assets(4) |
|
157,719 |
|
|
148,307 |
|
|
11,366 |
|
|
(63,844) |
|
|
253,548 |
|
|||||
|
|
|
|
|
|
|
|
|
|
|
|||||||||||
|
AFS securities |
|
31,062 |
|
|
36,664 |
|
|
— |
|
|
— |
|
|
67,726 |
|
|||||
|
Securities purchased under agreements to resell |
— | 555 | — | — | 555 | |||||||||||||||
|
Intangible assets |
— | 3 | — | — | 3 | |||||||||||||||
|
|
|
|
|
|
|
|
|
|
|
|||||||||||
|
Total assets measured at fair value |
$ |
188,781 |
|
$ |
185,529 |
|
$ |
11,366 |
|
$ |
(63,844) |
|
$ |
321,832 |
|
|||||
|
|
|
|
|
|
|
|
|
|
|
|||||||||||
|
|
8 |
Table of Contents
MORGAN STANLEY
NOTES TO CONSOLIDATED FINANCIAL STATEMENTS (Unaudited)—(Continued)
|
Level 1
|
Level 2
|
Level 3
|
Counterparty and
Cash Collateral Netting
|
Balance at June 30,
2016
|
||||||||||||||||
|
(dollars in millions) |
||||||||||||||||||||
|
Liabilities at Fair Value |
||||||||||||||||||||
|
Deposits |
$ | — | $ | 65 | $ | 30 | $ | — | $ | 95 | ||||||||||
|
Short-term borrowings |
— | 511 | — | — | 511 | |||||||||||||||
|
Trading liabilities: |
||||||||||||||||||||
|
U.S. government and agency securities: |
||||||||||||||||||||
|
U.S. Treasury securities |
12,983 | — | — | — | 12,983 | |||||||||||||||
|
U.S. agency securities |
358 | 111 | — | — | 469 | |||||||||||||||
|
|
|
|
|
|
|
|
|
|
|
|||||||||||
|
Total U.S. government and agency securities |
|
13,341 |
|
|
111 |
|
|
— |
|
|
— |
|
|
13,452 |
|
|||||
|
Other sovereign government obligations |
15,885 | 2,668 | — | — | 18,553 | |||||||||||||||
|
Corporate and other debt: |
||||||||||||||||||||
|
State and municipal securities |
— | 3 | — | — | 3 | |||||||||||||||
|
Asset-backed securities |
— | 449 | — | — | 449 | |||||||||||||||
|
Corporate bonds |
— | 5,578 | 6 | — | 5,584 | |||||||||||||||
|
Other debt |
— | 15 | 3 | — | 18 | |||||||||||||||
|
|
|
|
|
|
|
|
|
|
|
|||||||||||
|
Total corporate and other debt |
|
— |
|
|
6,045 |
|
|
9 |
|
|
— |
|
|
6,054 |
|
|||||
|
Corporate equities(2) |
46,440 | 76 | 26 | — | 46,542 | |||||||||||||||
|
Obligation to return securities received as collateral |
18,731 | 7 | — | — | 18,738 | |||||||||||||||
|
Derivative and other contracts: |
||||||||||||||||||||
|
Interest rate contracts |
969 | 436,022 | 775 | — | 437,766 | |||||||||||||||
|
Credit contracts |
— | 16,403 | 1,418 | — | 17,821 | |||||||||||||||
|
Foreign exchange contracts |
82 | 78,441 | 102 | — | 78,625 | |||||||||||||||
|
Equity contracts |
1,262 | 43,177 | 2,110 | — | 46,549 | |||||||||||||||
|
Commodity contracts |
2,368 | 7,652 | 2,759 | — | 12,779 | |||||||||||||||
|
Other |
— | 91 | 11 | — | 102 | |||||||||||||||
|
Netting(3) |
(4,184) | (505,871) | (2,537) | (43,727) | (556,319) | |||||||||||||||
|
|
|
|
|
|
|
|
|
|
|
|||||||||||
|
Total derivative and other contracts |
|
497 |
|
|
75,915 |
|
|
4,638 |
|
|
(43,727) |
|
|
37,323 |
|
|||||
|
|
|
|
|
|
|
|
|
|
|
|||||||||||
|
Total trading liabilities |
|
94,894 |
|
|
84,822 |
|
|
4,673 |
|
|
(43,727) |
|
|
140,662 |
|
|||||
|
|
|
|
|
|
|
|
|
|
|
|||||||||||
|
Securities sold under agreements to repurchase |
|
— |
|
|
549 |
|
|
150 |
|
|
— |
|
|
699 |
|
|||||
|
Other secured financings |
— | 2,480 | 441 | — | 2,921 | |||||||||||||||
|
Long-term borrowings |
44 | 35,831 | 1,929 | — | 37,804 | |||||||||||||||
|
|
|
|
|
|
|
|
|
|
|
|||||||||||
|
Total liabilities measured at fair value |
$ |
94,938 |
|
$ |
124,258 |
|
$ |
7,223 |
|
$ |
(43,727) |
|
$ |
182,692 |
|
|||||
|
|
|
|
|
|
|
|
|
|
|
|||||||||||
| 9 |
|
Table of Contents
MORGAN STANLEY
NOTES TO CONSOLIDATED FINANCIAL STATEMENTS (Unaudited)—(Continued)
| Level 1 | Level 2 | Level 3 |
Counterparty and
Cash Collateral Netting |
Balance at
December 31, 2015 |
||||||||||||||||
| (dollars in millions) | ||||||||||||||||||||
|
Assets at Fair Value |
||||||||||||||||||||
|
Trading assets: |
||||||||||||||||||||
|
U.S. government and agency securities: |
||||||||||||||||||||
|
U.S. Treasury securities |
$ | 17,658 | $ | — | $ | — | $ | — | $ | 17,658 | ||||||||||
|
U.S. agency securities |
797 | 17,886 | — | — | 18,683 | |||||||||||||||
|
|
|
|
|
|
|
|
|
|
|
|||||||||||
|
Total U.S. government and agency securities |
18,455 | 17,886 | — | — | 36,341 | |||||||||||||||
|
Other sovereign government obligations |
13,559 | 7,400 | 4 | — | 20,963 | |||||||||||||||
|
Corporate and other debt: |
||||||||||||||||||||
|
State and municipal securities |
— | 1,651 | 19 | — | 1,670 | |||||||||||||||
|
Residential mortgage-backed securities |
— | 1,456 | 341 | — | 1,797 | |||||||||||||||
|
Commercial mortgage-backed securities |
— | 1,520 | 72 | — | 1,592 | |||||||||||||||
|
Asset-backed securities |
— | 494 | 25 | — | 519 | |||||||||||||||
|
Corporate bonds |
— | 9,959 | 267 | — | 10,226 | |||||||||||||||
|
Collateralized debt and loan obligations |
— | 284 | 430 | — | 714 | |||||||||||||||
|
Loans and lending commitments(1) |
— | 4,682 | 5,936 | — | 10,618 | |||||||||||||||
|
Other debt |
— | 2,263 | 448 | — | 2,711 | |||||||||||||||
|
|
|
|
|
|
|
|
|
|
|
|||||||||||
|
Total corporate and other debt |
— | 22,309 | 7,538 | — | 29,847 | |||||||||||||||
|
Corporate equities(2) |
106,296 | 379 | 433 | — | 107,108 | |||||||||||||||
|
Securities received as collateral |
11,221 | 3 | 1 | — | 11,225 | |||||||||||||||
|
Derivative and other contracts: |
||||||||||||||||||||
|
Interest rate contracts |
406 | 323,586 | 2,052 | — | 326,044 | |||||||||||||||
|
Credit contracts |
— | 22,258 | 661 | — | 22,919 | |||||||||||||||
|
Foreign exchange contracts |
55 | 64,608 | 292 | — | 64,955 | |||||||||||||||
|
Equity contracts |
653 | 38,552 | 1,084 | — | 40,289 | |||||||||||||||
|
Commodity contracts |
3,140 | 10,654 | 3,358 | — | 17,152 | |||||||||||||||
|
Other |
— | 219 | — | — | 219 | |||||||||||||||
|
Netting(3) |
(3,840) | (380,443) | (3,120) | (55,562) | (442,965) | |||||||||||||||
|
|
|
|
|
|
|
|
|
|
|
|||||||||||
|
Total derivative and other contracts |
414 | 79,434 | 4,327 | (55,562) | 28,613 | |||||||||||||||
|
Investments(4): |
||||||||||||||||||||
|
Principal investments |
20 | 44 | 486 | — | 550 | |||||||||||||||
|
Other |
163 | 310 | 221 | — | 694 | |||||||||||||||
|
|
|
|
|
|
|
|
|
|
|
|||||||||||
|
Total investments |
183 | 354 | 707 | — | 1,244 | |||||||||||||||
|
Physical commodities |
— | 321 | — | — | 321 | |||||||||||||||
|
|
|
|
|
|
|
|
|
|
|
|||||||||||
|
Total trading assets(4) |
150,128 | 128,086 | 13,010 | (55,562) | 235,662 | |||||||||||||||
|
|
|
|
|
|
|
|
|
|
|
|||||||||||
|
AFS securities |
34,351 | 32,408 | — | — | 66,759 | |||||||||||||||
|
Securities purchased under agreements to resell |
— | 806 | — | — | 806 | |||||||||||||||
|
Intangible assets |
— | — | 5 | — | 5 | |||||||||||||||
|
|
|
|
|
|
|
|
|
|
|
|||||||||||
|
Total assets measured at fair value |
$ | 184,479 | $ | 161,300 | $ | 13,015 | $ | (55,562) | $ | 303,232 | ||||||||||
|
|
|
|
|
|
|
|
|
|
|
|||||||||||
|
Liabilities at Fair Value |
||||||||||||||||||||
|
Deposits |
$ | — | $ | 106 | $ | 19 | $ | — | $ | 125 | ||||||||||
|
Short-term borrowings |
— | 1,647 | 1 | — | 1,648 | |||||||||||||||
|
Trading liabilities: |
||||||||||||||||||||
|
U.S. government and agency securities: |
||||||||||||||||||||
|
U.S. Treasury securities |
12,932 | — | — | — | 12,932 | |||||||||||||||
|
U.S. agency securities |
854 | 127 | — | — | 981 | |||||||||||||||
|
|
|
|
|
|
|
|
|
|
|
|||||||||||
|
Total U.S. government and agency securities |
13,786 | 127 | — | — | 13,913 | |||||||||||||||
|
Other sovereign government obligations |
10,970 | 2,558 | — | — | 13,528 | |||||||||||||||
|
Corporate and other debt: |
||||||||||||||||||||
|
Commercial mortgage-backed securities |
— | 2 | — | — | 2 | |||||||||||||||
|
Corporate bonds |
— | 5,035 | — | — | 5,035 | |||||||||||||||
|
Lending commitments |
— | 3 | — | — | 3 | |||||||||||||||
|
Other debt |
— | 5 | 4 | — | 9 | |||||||||||||||
|
|
|
|
|
|
|
|
|
|
|
|||||||||||
|
Total corporate and other debt |
— | 5,045 | 4 | — | 5,049 | |||||||||||||||
|
Corporate equities(2) |
47,123 | 35 | 17 | — | 47,175 | |||||||||||||||
|
Obligation to return securities received as collateral |
19,312 | 3 | 1 | — | 19,316 | |||||||||||||||
|
Derivative and other contracts: |
||||||||||||||||||||
|
Interest rate contracts |
466 | 305,151 | 1,792 | — | 307,409 | |||||||||||||||
|
Credit contracts |
— | 22,160 | 1,505 | — | 23,665 | |||||||||||||||
|
Foreign exchange contracts |
22 | 65,177 | 151 | — | 65,350 | |||||||||||||||
|
Equity contracts |
570 | 42,447 | 3,115 | — | 46,132 | |||||||||||||||
|
Commodity contracts |
3,012 | 9,431 | 2,308 | — | 14,751 | |||||||||||||||
|
Other |
— | 43 | — | — | 43 | |||||||||||||||
|
Netting(3) |
(3,840) | (380,443) | (3,120) | (40,473) | (427,876) | |||||||||||||||
|
|
|
|
|
|
|
|
|
|
|
|||||||||||
|
Total derivative and other contracts |
230 | 63,966 | 5,751 | (40,473) | 29,474 | |||||||||||||||
|
|
|
|
|
|
|
|
|
|
|
|||||||||||
|
Total trading liabilities |
91,421 | 71,734 | 5,773 | (40,473) | 128,455 | |||||||||||||||
|
|
|
|
|
|
|
|
|
|
|
|||||||||||
|
Securities sold under agreements to repurchase |
— | 532 | 151 | — | 683 | |||||||||||||||
|
Other secured financings |
— | 2,393 | 461 | — | 2,854 | |||||||||||||||
|
Long-term borrowings |
— | 31,058 | 1,987 | — | 33,045 | |||||||||||||||
|
|
|
|
|
|
|
|
|
|
|
|||||||||||
|
Total liabilities measured at fair value |
$ | 91,421 | $ | 107,470 | $ | 8,392 | $ | (40,473) | $ | 166,810 | ||||||||||
|
|
|
|
|
|
|
|
|
|
|
|||||||||||
|
|
10 |
Table of Contents
MORGAN STANLEY
NOTES TO CONSOLIDATED FINANCIAL STATEMENTS (Unaudited)—(Continued)
AFS—Available for sale
| (1) |
At June 30, 2016, Loans and lending commitments held at fair value consisted of $7,114 million of corporate loans, $1,721 million of residential real estate loans and $462 million of wholesale real estate loans. At December 31, 2015, Loans and lending commitments held at fair value consisted of $7,286 million of corporate loans, $1,885 million of residential real estate loans and $1,447 million of wholesale real estate loans. |
| (2) |
For trading purposes, the Firm holds or sells short equity securities issued by entities in diverse industries and of varying sizes. |
| (3) |
For positions with the same counterparty that cross over the levels of the fair value hierarchy, both counterparty netting and cash collateral netting are included in the column titled “Counterparty and Cash Collateral Netting.” For contracts with the same counterparty, counterparty netting among positions classified within the same level is included within that shared level. For further information on derivative instruments and hedging activities, see Note 4. |
| (4) |
Amounts exclude certain investments that are measured at fair value using the net asset value (“NAV”) per share, which are not classified in the fair value hierarchy. At June 30, 2016 and December 31, 2015, the fair value of these investments was $3,246 million and $3,843 million, respectively. For additional disclosure about such investments, see “Fair Value of Investments Measured at Net Asset Value” herein. |
Changes in Level 3 Assets and Liabilities Measured at Fair Value on a Recurring Basis
The following tables present additional information about Level 3 assets and liabilities measured at fair value on a recurring basis for all periods presented. Level 3 instruments may be hedged with instruments classified in Level 1 and Level 2. As a result, the realized and unrealized gains (losses) for assets and liabilities within the Level 3 category presented in the following tables do not reflect the related realized and unrealized gains (losses) on hedging instruments that have been classified by the Firm within the Level 1 and/or Level 2 categories.
Additionally, both observable and unobservable inputs may be used to determine the fair value of positions that the Firm has classified within the Level 3 category. As a result, the unrealized gains (losses) during the period for assets and liabilities within the Level 3 category presented in the following tables herein may include changes in fair value during the period that were attributable to both observable and unobservable inputs.
| 11 |
|
Table of Contents
MORGAN STANLEY
NOTES TO CONSOLIDATED FINANCIAL STATEMENTS (Unaudited)—(Continued)
Roll-forward of Level 3 Assets and Liabilities Measured at Fair Value on a Recurring Basis
|
Beginning
Balance at March 31, 2016 |
Total
Realized and Unrealized Gains (Losses) |
Purchases
(1) |
Sales | Issuances | Settlements |
Net
Transfers |
Ending
Balance at June 30, 2016 |
Unrealized
Gains (Losses) for Level 3 Assets/ Liabilities Outstanding at June 30, 2016 |
||||||||||||||||||||||||||||
|
(dollars in millions) |
||||||||||||||||||||||||||||||||||||
|
Assets at Fair Value |
||||||||||||||||||||||||||||||||||||
|
Trading assets: |
||||||||||||||||||||||||||||||||||||
|
U.S. agency securities |
$ | 8 | $ | — | $ | — | $ | (18) | $ | — | $ | — | $ | 30 | $ | 20 | $ | — | ||||||||||||||||||
|
Other sovereign government obligations |
8 | — | — | (3) | — | — | (3) | 2 | — | |||||||||||||||||||||||||||
|
Corporate and other debt: |
||||||||||||||||||||||||||||||||||||
|
State and municipal securities |
5 | 1 | 4 | — | — | — | — | 10 | 2 | |||||||||||||||||||||||||||
|
Residential mortgage-backed securities |
292 | 3 | — | (82) | — | — | 3 | 216 | (5) | |||||||||||||||||||||||||||
|
Commercial mortgage-backed securities |
59 | (3) | 1 | (4) | — | — | (2) | 51 | (5) | |||||||||||||||||||||||||||
|
Asset-backed securities |
4 | (4) | 6 | (1) | — | — | 83 | 88 | (4) | |||||||||||||||||||||||||||
|
Corporate bonds |
224 | 17 | 116 | (35) | — | — | (46) | 276 | 17 | |||||||||||||||||||||||||||
|
Collateralized debt and loan obligations |
348 | 18 | 3 | (178) | — | — | (82) | 109 | 18 | |||||||||||||||||||||||||||
|
Loans and lending commitments |
6,185 | (46) | 360 | (484) | — | (596) | (1) | 5,418 | (55) | |||||||||||||||||||||||||||
|
Other debt |
527 | 4 | 13 | (19) | — | — | 3 | 528 | 2 | |||||||||||||||||||||||||||
|
|
|
|
|
|
|
|
|
|
|
|
|
|
|
|
|
|
|
|||||||||||||||||||
|
Total corporate and other debt |
7,644 | (10) | 503 | (803) | — | (596) | (42) | 6,696 | (30) | |||||||||||||||||||||||||||
|
Corporate equities |
430 | (63) | 273 | (82) | — | — | 14 | 572 | (63) | |||||||||||||||||||||||||||
|
Net derivative and other contracts(2): |
||||||||||||||||||||||||||||||||||||
|
Interest rate contracts |
169 | (159) | 2 | — | (7) | 42 | (282) | (235) | (157) | |||||||||||||||||||||||||||
|
Credit contracts |
(723) | 65 | 1 | — | — | 93 | (550) | (1,114) | 53 | |||||||||||||||||||||||||||
|
Foreign exchange contracts |
126 | (58) | — | — | — | (94) | 25 | (1) | (47) | |||||||||||||||||||||||||||
|
Equity contracts |
(1,832) | 168 | 50 | — | (140) | 263 | 18 | (1,473) | (106) | |||||||||||||||||||||||||||
|
Commodity contracts |
1,200 | 211 | 5 | — | (4) | (88) | (26) | 1,298 | 130 | |||||||||||||||||||||||||||
|
Other |
— | — | — | — | — | — | (11) | (11) | — | |||||||||||||||||||||||||||
|
|
|
|
|
|
|
|
|
|
|
|
|
|
|
|
|
|
|
|||||||||||||||||||
|
Total net derivative and other contracts |
(1,060) | 227 | 58 | — | (151) | 216 | (826) | (1,536) | (127) | |||||||||||||||||||||||||||
|
Investments: |
||||||||||||||||||||||||||||||||||||
|
Principal investments |
743 | 4 | 33 | (11) | — | — | — | 769 | 6 | |||||||||||||||||||||||||||
|
Other |
179 | 1 | 25 | — | — | — | — | 205 | 1 | |||||||||||||||||||||||||||
|
|
|
|
|
|
|
|
|
|
|
|
|
|
|
|
|
|
|
|||||||||||||||||||
|
Total investments |
922 | 5 | 58 | (11) | — | — | — | 974 | 7 | |||||||||||||||||||||||||||
|
Intangible assets |
4 | — | — | — | — | — | (4) | — | — | |||||||||||||||||||||||||||
|
Liabilities at Fair Value |
||||||||||||||||||||||||||||||||||||
|
Deposits |
$ | 23 | $ | (1) | $ | — | $ | — | $ | 8 | $ | — | $ | (2) | $ | 30 | $ | (1) | ||||||||||||||||||
|
Trading liabilities: |
||||||||||||||||||||||||||||||||||||
|
Corporate and other debt: |
||||||||||||||||||||||||||||||||||||
|
Corporate bonds |
6 | (1) | (5) | 29 | — | — | (25) | 6 | (1) | |||||||||||||||||||||||||||
|
Lending commitments |
1 | 1 | — | — | — | — | — | — | — | |||||||||||||||||||||||||||
|
Other debt |
4 | — | (1) | — | — | — | — | 3 | — | |||||||||||||||||||||||||||
|
|
|
|
|
|
|
|
|
|
|
|
|
|
|
|
|
|
|
|||||||||||||||||||
|
Total corporate and other debt |
11 | — | (6) | 29 | — | — | (25) | 9 | (1) | |||||||||||||||||||||||||||
|
Corporate equities |
31 | (28) | (33) | 5 | — | — | (5) | 26 | — | |||||||||||||||||||||||||||
|
Obligation to return securities received as collateral |
1 | — | (1) | — | — | — | — | — | — | |||||||||||||||||||||||||||
|
Securities sold under agreements to repurchase |
151 | 1 | — | — | — | — | — | 150 | 1 | |||||||||||||||||||||||||||
|
Other secured financings |
454 | (14) | — | — | 23 | (22) | (28) | 441 | (14) | |||||||||||||||||||||||||||
|
Long-term borrowings |
1,798 | 21 | — | — | 164 | (131) | 119 | 1,929 | 26 | |||||||||||||||||||||||||||
|
|
12 |
Table of Contents
MORGAN STANLEY
NOTES TO CONSOLIDATED FINANCIAL STATEMENTS (Unaudited)—(Continued)
|
Beginning
Balance at December 31, 2015 |
Total
Realized and Unrealized Gains (Losses) |
Purchases
(1) |
Sales | Issuances | Settlements |
Net
Transfers |
Ending
Balance at June 30, 2016 |
Unrealized
Gains (Losses) for Level 3 Assets/ Liabilities Outstand- ing at June 30, 2016 |
||||||||||||||||||||||||||||
|
(dollars in millions) |
||||||||||||||||||||||||||||||||||||
|
Assets at Fair Value |
||||||||||||||||||||||||||||||||||||
|
Trading assets: |
||||||||||||||||||||||||||||||||||||
|
U.S. agency securities |
$ | — | $ | 1 | $ | — | $ | (19) | $ | — | $ | — | $ | 38 | $ | 20 | $ | 1 | ||||||||||||||||||
|
Other sovereign government obligations |
4 | — | — | (5) | — | — | 3 | 2 | 1 | |||||||||||||||||||||||||||
|
Corporate and other debt: |
||||||||||||||||||||||||||||||||||||
|
State and municipal securities |
19 | 1 | 4 | (15) | — | — | 1 | 10 | 1 | |||||||||||||||||||||||||||
|
Residential mortgage-backed securities |
341 | (19) | 19 | (133) | — | — | 8 | 216 | (14) | |||||||||||||||||||||||||||
|
Commercial mortgage-backed securities |
72 | (10) | — | (19) | — | — | 8 | 51 | (11) | |||||||||||||||||||||||||||
|
Asset-backed securities |
25 | (7) | 7 | (18) | — | — | 81 | 88 | (8) | |||||||||||||||||||||||||||
|
Corporate bonds |
267 | 62 | 113 | (128) | — | — | (38) | 276 | 61 | |||||||||||||||||||||||||||
|
Collateralized debt and loan obligations |
430 | 5 | 22 | (224) | — | — | (124) | 109 | 17 | |||||||||||||||||||||||||||
|
Loans and lending commitments |
5,936 | (111) | 970 | (720) | — | (672) | 15 | 5,418 | (121) | |||||||||||||||||||||||||||
|
Other debt |
448 | (2) | 133 | (63) | — | — | 12 | 528 | (2) | |||||||||||||||||||||||||||
|
|
|
|
|
|
|
|
|
|
|
|
|
|
|
|
|
|
|
|||||||||||||||||||
|
Total corporate and other debt |
7,538 | (81) | 1,268 | (1,320) | — | (672) | (37) | 6,696 | (77) | |||||||||||||||||||||||||||
|
Corporate equities |
433 | (45) | 296 | (119) | — | — | 7 | 572 | (64) | |||||||||||||||||||||||||||
|
Securities received as collateral |
1 | — | — | (1) | — | — | — | — | — | |||||||||||||||||||||||||||
|
Net derivative and other contracts(2): |
||||||||||||||||||||||||||||||||||||
|
Interest rate contracts |
260 | 305 | 3 | — | (21) | (60) | (722) | (235) | 205 | |||||||||||||||||||||||||||
|
Credit contracts |
(844) | (343) | 1 | — | — | 153 | (81) | (1,114) | (360) | |||||||||||||||||||||||||||
|
Foreign exchange contracts |
141 | (109) | — | — | — | (201) | 168 | (1) | (82) | |||||||||||||||||||||||||||
|
Equity contracts |
(2,031) | (321) | 71 | — | (184) | 1,121 | (129) | (1,473) | (434) | |||||||||||||||||||||||||||
|
Commodity contracts |
1,050 | 297 | 7 | — | (4) | (176) | 124 | 1,298 | 210 | |||||||||||||||||||||||||||
|
Other |
— | — | — | — | — | — | (11) | (11) | — | |||||||||||||||||||||||||||
|
|
|
|
|
|
|
|
|
|
|
|
|
|
|
|
|
|
|
|||||||||||||||||||
|
Total net derivative and other contracts |
(1,424) | (171) | 82 | — | (209) | 837 | (651) | (1,536) | (461) | |||||||||||||||||||||||||||
|
Investments: |
||||||||||||||||||||||||||||||||||||
|
Principal investments |
486 | (39) | 403 | (40) | — | (41) | — | 769 | (37) | |||||||||||||||||||||||||||
|
Other |
221 | (17) | 1 | — | — | — | — | 205 | (16) | |||||||||||||||||||||||||||
|
|
|
|
|
|
|
|
|
|
|
|
|
|
|
|
|
|
|
|||||||||||||||||||
|
Total investments |
707 | (56) | 404 | (40) | — | (41) | — | 974 | (53) | |||||||||||||||||||||||||||
|
Intangible assets |
5 | — | — | — | — | — | (5) | — | — | |||||||||||||||||||||||||||
|
Liabilities at Fair Value |
||||||||||||||||||||||||||||||||||||
|
Deposits |
$ | 19 | $ | (2) | $ | — | $ | — | $ | 13 | $ | — | $ | (4) | $ | 30 | $ | (2) | ||||||||||||||||||
|
Short-term borrowings |
1 | — | — | — | — | (1) | — | — | — | |||||||||||||||||||||||||||
| Trading liabilities: | ||||||||||||||||||||||||||||||||||||
|
Corporate and other debt: |
||||||||||||||||||||||||||||||||||||
|
Corporate bonds |
— | (5) | (7) | 10 | — | — | (2) | 6 | (5) | |||||||||||||||||||||||||||
|
Other debt |
4 | 2 | (3) | 4 | — | — | — | 3 | 2 | |||||||||||||||||||||||||||
|
|
|
|
|
|
|
|
|
|
|
|
|
|
|
|
|
|
|
|||||||||||||||||||
|
Total corporate and other debt |
4 | (3) | (10) | 14 | — | — | (2) | 9 | (3) | |||||||||||||||||||||||||||
|
Corporate equities |
17 | (3) | (22) | 18 | — | — | 10 | 26 | (3) | |||||||||||||||||||||||||||
|
Obligation to return securities received as collateral |
1 | — | (1) | — | — | — | — | — | — | |||||||||||||||||||||||||||
|
Securities sold under agreements to repurchase |
151 | 1 | — | — | — | — | — | 150 | 1 | |||||||||||||||||||||||||||
|
Other secured financings |
461 | (32) | — | — | 69 | (43) | (78) | 441 | (32) | |||||||||||||||||||||||||||
|
Long-term borrowings |
1,987 | (12) | — | — | 276 | (167) | (179) | 1,929 | (6) | |||||||||||||||||||||||||||
| 13 |
|
Table of Contents
MORGAN STANLEY
NOTES TO CONSOLIDATED FINANCIAL STATEMENTS (Unaudited)—(Continued)
|
Beginning
Balance at March 31, 2015 |
Total
Realized and Unrealized Gains (Losses) |
Purchases
(1) |
Sales | Issuances | Settlements |
Net
Transfers |
Ending
Balance at June 30, 2015 |
Unrealized
Gains (Losses) for Level 3 Assets/ Liabilities Outstanding at June 30, 2015 |
||||||||||||||||||||||||||||
| (dollars in millions) | ||||||||||||||||||||||||||||||||||||
|
Assets at Fair Value |
||||||||||||||||||||||||||||||||||||
|
Trading assets: |
||||||||||||||||||||||||||||||||||||
|
U.S. agency securities |
$ | — | $ | — | $ | — | $ | (3) | $ | — | $ | — | $ | 6 | $ | 3 | $ | — | ||||||||||||||||||
|
Other sovereign government obligations |
11 | — | 5 | (1) | — | — | (3) | 12 | — | |||||||||||||||||||||||||||
|
Corporate and other debt: |
||||||||||||||||||||||||||||||||||||
|
State and municipal securities |
— | 1 | 4 | (9) | — | — | 11 | 7 | 1 | |||||||||||||||||||||||||||
|
Residential mortgage-backed securities |
296 | 2 | 138 | (32) | — | — | (26) | 378 | 2 | |||||||||||||||||||||||||||
|
Commercial mortgage-backed securities |
180 | (4) | 5 | (9) | — | — | (88) | 84 | (5) | |||||||||||||||||||||||||||
|
Asset-backed securities |
67 | 5 | 11 | (64) | — | — | — | 19 | 1 | |||||||||||||||||||||||||||
|
Corporate bonds |
424 | (4) | 228 | (150) | — | (2) | (17) | 479 | (16) | |||||||||||||||||||||||||||
|
Collateralized debt and loan obligations |
822 | 68 | 300 | (439) | — | (78) | (13) | 660 | (10) | |||||||||||||||||||||||||||
|
Loans and lending commitments |
4,789 | 31 | 1,615 | (351) | — | (491) | (81) | 5,512 | 26 | |||||||||||||||||||||||||||
|
Other debt |
486 | (1) | 130 | (51) | — | — | — | 564 | (1) | |||||||||||||||||||||||||||
|
|
|
|
|
|
|
|
|
|
|
|
|
|
|
|
|
|
|
|||||||||||||||||||
|
Total corporate and other debt |
7,064 | 98 | 2,431 | (1,105) | — | (571) | (214) | 7,703 | (2) | |||||||||||||||||||||||||||
|
Corporate equities |
230 | 38 | 266 | (92) | — | — | 44 | 486 | 26 | |||||||||||||||||||||||||||
|
Securities received as collateral |
33 | — | — | (30) | — | — | — | 3 | — | |||||||||||||||||||||||||||
|
Net derivative and other contracts(2): |
||||||||||||||||||||||||||||||||||||
|
Interest rate contracts |
(496) | 95 | 4 | — | (13) | 14 | 160 | (236) | 135 | |||||||||||||||||||||||||||
|
Credit contracts |
(984) | (24) | 4 | — | (24) | 23 | 16 | (989) | (29) | |||||||||||||||||||||||||||
|
Foreign exchange contracts |
297 | 57 | — | — | (1) | 43 | 50 | 446 | 82 | |||||||||||||||||||||||||||
|
Equity contracts |
(2,472) | (23) | 39 | — | (54) | 206 | 202 | (2,102) | (161) | |||||||||||||||||||||||||||
|
Commodity contracts |
1,345 | 4 | 2 | — | (112) | (34) | — | 1,205 | (27) | |||||||||||||||||||||||||||
|
|
|
|
|
|
|
|
|
|
|
|
|
|
|
|
|
|
|
|||||||||||||||||||
|
Total net derivative and other contracts |
(2,310) | 109 | 49 | — | (204) | 252 | 428 | (1,676) | — | |||||||||||||||||||||||||||
|
Investments: |
||||||||||||||||||||||||||||||||||||
|
Principal investments |
829 | (21) | 5 | (12) | — | (205) | (15) | 581 | (21) | |||||||||||||||||||||||||||
|
Other |
391 | (4) | — | — | — | — | (87) | 300 | — | |||||||||||||||||||||||||||
|
|
|
|
|
|
|
|
|
|
|
|
|
|
|
|
|
|
|
|||||||||||||||||||
|
Total investments |
1,220 | (25) | 5 | (12) | — | (205) | (102) | 881 | (21) | |||||||||||||||||||||||||||
|
Intangible assets |
5 | 1 | — | — | — | — | — | 6 | 1 | |||||||||||||||||||||||||||
|
Liabilities at Fair Value |
||||||||||||||||||||||||||||||||||||
|
Trading liabilities: |
||||||||||||||||||||||||||||||||||||
|
Corporate and other debt: |
||||||||||||||||||||||||||||||||||||
|
Corporate bonds |
$ | 23 | $ | — | $ | (21) | $ | 15 | $ | — | $ | — | $ | (2) | $ | 15 | $ | — | ||||||||||||||||||
|
Other debt |
23 | — | — | 10 | — | (29) | — | 4 | — | |||||||||||||||||||||||||||
|
|
|
|
|
|
|
|
|
|
|
|
|
|
|
|
|
|
|
|||||||||||||||||||
|
Total corporate and other debt |
46 | — | (21) | 25 | — | (29) | (2) | 19 | — | |||||||||||||||||||||||||||
|
Corporate equities |
50 | 240 | (49) | 2 | — | — | 349 | 112 | 240 | |||||||||||||||||||||||||||
|
Obligation to return securities received as collateral |
33 | — | (30) | — | — | — | — | 3 | — | |||||||||||||||||||||||||||
|
Securities sold under agreements to repurchase |
154 | — | — | — | — | — | — | 154 | — | |||||||||||||||||||||||||||
|
Other secured financings |
133 | 2 | — | — | 37 | — | — | 168 | 2 | |||||||||||||||||||||||||||
|
Long-term borrowings |
1,738 | 51 | — | — | 549 | (88) | 73 | 2,221 | 51 | |||||||||||||||||||||||||||
|
|
14 |
Table of Contents
MORGAN STANLEY
NOTES TO CONSOLIDATED FINANCIAL STATEMENTS (Unaudited)—(Continued)
|
Beginning
Balance at December 31, 2014 |
Total
Realized and Unrealized Gains (Losses) |
Purchases
(1) |
Sales | Issuances | Settlements |
Net
Transfers |
Ending
Balance at June 30, 2015 |
Unrealized
Gains (Losses) for Level 3 Assets/ Liabilities Outstanding at June 30, 2015 |
||||||||||||||||||||||||||||
|
(dollars in millions) |
||||||||||||||||||||||||||||||||||||
|
Assets at Fair Value |
||||||||||||||||||||||||||||||||||||
|
Trading assets: |
||||||||||||||||||||||||||||||||||||
|
U.S. agency securities |
$ | — | $ | — | $ | 3 | $ | — | $ | — | $ | — | $ | — | $ | 3 | $ | — | ||||||||||||||||||
|
Other sovereign government obligations |
41 | 1 | 6 | (32) | — | — | (4) | 12 | 1 | |||||||||||||||||||||||||||
|
Corporate and other debt: |
||||||||||||||||||||||||||||||||||||
|
State and municipal securities |
— | 1 | 4 | — | — | — | 2 | 7 | 1 | |||||||||||||||||||||||||||
|
Residential mortgage-backed securities |
175 | 21 | 163 | (51) | — | — | 70 | 378 | 12 | |||||||||||||||||||||||||||
|
Commercial mortgage-backed securities |
96 | (6) | 16 | (22) | — | — | — | 84 | (9) | |||||||||||||||||||||||||||
|
Asset-backed securities |
76 | (4) | 11 | (29) | — | — | (35) | 19 | 2 | |||||||||||||||||||||||||||
|
Corporate bonds |
386 | 10 | 213 | (126) | — | (1) | (3) | 479 | 9 | |||||||||||||||||||||||||||
|
Collateralized debt and loan obligations |
1,152 | 145 | 404 | (682) | — | (331) | (28) | 660 | (6) | |||||||||||||||||||||||||||
|
Loans and lending commitments |
5,874 | 35 | 2,082 | (209) | — | (2,078) | (192) | 5,512 | 30 | |||||||||||||||||||||||||||
|
Other debt |
285 | (8) | 12 | — | — | (1) | 276 | 564 | 6 | |||||||||||||||||||||||||||
|
|
|
|
|
|
|
|
|
|
|
|
|
|
|
|
|
|
|
|||||||||||||||||||
|
Total corporate and other debt |
8,044 | 194 | 2,905 | (1,119) | — | (2,411) | 90 | 7,703 | 45 | |||||||||||||||||||||||||||
|
Corporate equities |
272 | 64 | 260 | (147) | — | — | 37 | 486 | 49 | |||||||||||||||||||||||||||
|
Securities received as collateral |
— | — | 3 | — | — | — | — | 3 | — | |||||||||||||||||||||||||||
|
Net derivative and other contracts(2): |
||||||||||||||||||||||||||||||||||||
|
Interest rate contracts |
(173) | 188 | 9 | — | (20) | 124 | (364) | (236) | 197 | |||||||||||||||||||||||||||
|
Credit contracts |
(743) | (276) | 17 | — | (54) | 31 | 36 | (989) | (284) | |||||||||||||||||||||||||||
|
Foreign exchange contracts |
151 | 121 | — | — | (1) | 144 | 31 | 446 | 120 | |||||||||||||||||||||||||||
|
Equity contracts |
(2,165) | (73) | 69 | — | (225) | 156 | 136 | (2,102) | (160) | |||||||||||||||||||||||||||
|
Commodity contracts |
1,146 | 299 | 3 | — | (112) | (72) | (59) | 1,205 | 234 | |||||||||||||||||||||||||||
|
|
|
|
|
|
|
|
|
|
|
|
|
|
|
|
|
|
|
|||||||||||||||||||
|
Total net derivative and other contracts |
(1,784) | 259 | 98 | — | (412) | 383 | (220) | (1,676) | 107 | |||||||||||||||||||||||||||
|
Investments: |
||||||||||||||||||||||||||||||||||||
|
Principal investments |
835 | (4) | 15 | (46) | — | (205) | (14) | 581 | (26) | |||||||||||||||||||||||||||
|
Other |
323 | (16) | 2 | (6) | — | — | (3) | 300 | (12) | |||||||||||||||||||||||||||
|
|
|
|
|
|
|
|
|
|
|
|
|
|
|
|
|
|
|
|||||||||||||||||||
|
Total investments |
1,158 | (20) | 17 | (52) | — | (205) | (17) | 881 | (38) | |||||||||||||||||||||||||||
|
Intangible assets |
6 | 1 | — | — | — | (1) | — | 6 | 1 | |||||||||||||||||||||||||||
|
Liabilities at Fair Value |
||||||||||||||||||||||||||||||||||||
|
Trading liabilities: |
||||||||||||||||||||||||||||||||||||
|
Corporate and other debt: |
||||||||||||||||||||||||||||||||||||
|
Corporate bonds |
$ | 78 | $ | (2) | $ | (12) | $ | 14 | $ | — | $ | — | $ | (67) | $ | 15 | $ | (2) | ||||||||||||||||||
|
Lending commitments |
5 | 5 | — | — | — | — | — | — | 5 | |||||||||||||||||||||||||||
|
Other debt |
38 | — | — | 6 | — | (39) | (1) | 4 | — | |||||||||||||||||||||||||||
|
|
|
|
|
|
|
|
|
|
|
|
|
|
|
|
|
|
|
|||||||||||||||||||
|
Total corporate and other debt |
121 | 3 | (12) | 20 | — | (39) | (68) | 19 | 3 | |||||||||||||||||||||||||||
|
Corporate equities |
45 | 19 | (75) | 25 | — | — | 136 | 112 | 20 | |||||||||||||||||||||||||||
|
Obligation to return securities received as collateral |
— | — | — | 3 | — | — | — | 3 | — | |||||||||||||||||||||||||||
|
Securities sold under agreements to repurchase |
153 | (1) | — | — | — | — | — | 154 | (1) | |||||||||||||||||||||||||||
|
Other secured financings |
149 | (6) | — | — | 37 | (24) | — | 168 | 2 | |||||||||||||||||||||||||||
|
Long-term borrowings |
1,934 | 65 | — | — | 612 | (300) | 40 | 2,221 | 59 | |||||||||||||||||||||||||||
| (1) |
Loan originations and consolidations of VIEs are included in purchases. |
| (2) |
Net derivative and other contracts represent Trading assets—Derivative and other contracts, net of Trading liabilities—Derivative and other contracts. For further information on derivative instruments and hedging activities, see Note 4. |
| 15 |
|
Table of Contents
MORGAN STANLEY
NOTES TO CONSOLIDATED FINANCIAL STATEMENTS (Unaudited)—(Continued)
Significant Unobservable Inputs Used in Recurring Level 3 Fair Value Measurements
The following disclosures provide information on the valuation techniques, significant unobservable inputs, and their ranges and averages for each major category of assets and liabilities measured at fair value on a recurring basis with a significant Level 3 balance. The level of aggregation and breadth of products cause the range of inputs to be wide and not evenly distributed across the inventory. Further, the range of unobservable inputs may differ across firms in the financial services industry because of diversity in the types of products included in each firm’s inventory. The following disclosures also include qualitative information on the sensitivity of the fair value measurements to changes in the significant unobservable inputs.
Recurring Level 3 Fair Value Measurements Valuation Techniques and Sensitivity of Unobservable Inputs
|
Balance at
June 30, 2016 |
Valuation Technique(s) / Significant Unobservable Input(s) / Sensitivity of the Fair Value to Changes in the Unobservable Inputs |
Range(1) |
Averages(2) |
||||||||
| (dollars in millions) | |||||||||||
|
Assets at Fair Value |
|||||||||||
|
Trading assets:
|
|||||||||||
|
Corporate and other debt: |
|||||||||||
|
Residential mortgage-backed securities |
$ 216 | Comparable pricing: | |||||||||
|
Comparable bond price / (A)
|
0 to 79 points
|
20 points
|
|||||||||
|
Commercial mortgage-backed securities |
|
51 |
|
Comparable pricing: |
|||||||
| Comparable bond price / (A) | 0 to 7 points | 1 point | |||||||||
|
Asset-backed securities |
88 | Comparable pricing: | |||||||||
|
Comparable bond price / (A)
|
45 to 55 points
|
46 points
|
|||||||||
|
Corporate bonds |
|
276 |
|
Comparable pricing(3): |
|||||||
| Comparable bond price / (A) | 3 to 135 points | 91 points | |||||||||
| Comparable pricing: | |||||||||||
|
EBITDA multiple / (A)
|
5 to 10 times
|
7 times
|
|||||||||
|
Collateralized debt and loan obligations |
109 | Comparable pricing(3): | |||||||||
| Comparable bond price / (A) | 20 to 95 points | 57 points | |||||||||
| Correlation model: | |||||||||||
|
Credit correlation / (B)
|
29% to 61%
|
42%
|
|||||||||
|
Loans and lending commitments |
|
5,418 |
|
Corporate loan model: |
|||||||
| Credit spread / (C) | 482 to 898 bps | 596 bps | |||||||||
| Margin loan model(3): | |||||||||||
| Credit spread / (C)(D) | 31 to 102 bps | 86 bps | |||||||||
| Volatility skew / (C)(D) | 20% to 46% | 32% | |||||||||
| Discount rate / (C)(D) | 1% to 8% | 3% | |||||||||
| Expected recovery: | |||||||||||
| Asset coverage / (A) | 47% to 99% | 90% | |||||||||
| Option model: | |||||||||||
| Volatility skew / (C) | -1% | -1% | |||||||||
| Comparable pricing: | |||||||||||
| Comparable loan price / (A) | 43 to 100 points | 87 points | |||||||||
| Discounted cash flow: | |||||||||||
|
Implied weighted average cost of capital / (C)(D) |
5% to 6% | 6% | |||||||||
|
Capitalization rate / (C)(D)
|
4% to 10%
|
4%
|
|||||||||
|
|
16 |
Table of Contents
MORGAN STANLEY
NOTES TO CONSOLIDATED FINANCIAL STATEMENTS (Unaudited)—(Continued)
|
Balance at
June 30, 2016 |
Valuation Technique(s) / Significant Unobservable Input(s) / Sensitivity of the Fair Value to Changes in the Unobservable Inputs |
Range(1) |
Averages(2) |
||||||||
| (dollars in millions) | |||||||||||
|
Other debt |
528 | Comparable pricing: | |||||||||
| Comparable loan price / (A) | 3 to 84 points | 66 points | |||||||||
| Comparable pricing: | |||||||||||
| Comparable bond price / (A) | 7 points | 7 points | |||||||||
| Option model: | |||||||||||
| At the money volatility / (C) | 16% to 53% | 53% | |||||||||
| Margin loan model(3): | |||||||||||
| Discount rate / (C) | 1% to 2% | 2% | |||||||||
| Discounted cash flow: | |||||||||||
| Discount rate / (C) | 10% to 13% | 12% | |||||||||
|
Corporate equities |
|
572 |
|
Comparable pricing: |
|||||||
| Comparable equity price / (A) | 100% | 100% | |||||||||
|
Net derivative and other contracts(4): |
|||||||||||
|
Interest rate contracts |
(235) | Option model(3): | |||||||||
|
Interest rate - Foreign exchange correlation / (A)(D) |
25% to 55% | 42% / 42% (5) | |||||||||
| Interest rate volatility skew / (A)(D) | 34% to 143% | 78% / 77% (5) | |||||||||
| Interest rate quanto correlation / (A)(D) | -8% to 35% | 2% / -7% (5) | |||||||||
| Interest rate curve correlation / (C)(D) | 19% to 95% | 71% / 76% (5) | |||||||||
| Inflation volatility / (A)(D) | 0% to 1% | 1% / 1% (5) | |||||||||
| Interest rate - Inflation correlation / (A)(D) | -24% to -44% | -34% / -33% (5) | |||||||||
| Interest rate curve / (C)(D) | 0% to 1% | 1% / 1% (5) | |||||||||
| Foreign exchange volatility skew / (C)(D) | 0% to 11% | 4% / 6% (5) | |||||||||
| Comparable pricing: | |||||||||||
| Comparable bond price / (C) | 95 to 100 points | 96 points | |||||||||
|
Credit contracts |
|
(1,114) |
|
Comparable pricing: |
|||||||
| Cash synthetic basis / (C)(D) | 5 to 12 points | 10 points | |||||||||
| Comparable bond price / (C)(D) | 0 to 85 points | 26 points | |||||||||
| Correlation model(3): | |||||||||||
| Credit correlation / (B) | 29% to 92% | 49% | |||||||||
|
Foreign exchange contracts(6) |
|
(1) |
|
Option model: |
|||||||
|
Interest rate - Foreign exchange correlation / (A)(D) |
25% to 55% | 42% / 42% (5) | |||||||||
| Interest rate volatility skew / (A)(D) | 34% to 143% | 78% / 77% (5) | |||||||||
| Interest rate curve / (A)(D) | 0% | 0% / 0% (5) | |||||||||
| Interest rate curve correlation / (C)(D) | 19% to 94% | 73% / 81% (5) | |||||||||
|
Equity contracts(6) |
|
(1,473) |
|
Option model: |
|||||||
| At the money volatility / (A)(D) | 6% to 81% | 35% | |||||||||
| Volatility skew / (A)(D) | -4% to 0% | -1% | |||||||||
| Equity - Equity correlation / (A)(D) | 40% to 98% | 79% | |||||||||
| Equity - Foreign exchange correlation / (C)(D) | -70% to -31% | -42% | |||||||||
| Equity - Interest rate correlation / (C)(D) | -7% to 50% | 19% / 12% (5) | |||||||||
|
Commodity contracts |
1,298 | Option model: | |||||||||
| Forward power price / (C)(D) | $2 to $95 per megawatt hour |
$34 per megawatt hour |
|||||||||
| Commodity volatility / (C)(D) | 6% to 90% | 18% | |||||||||
| Cross commodity correlation / (C)(D) | 5% to 99% | 93% | |||||||||
| 17 |
|
Table of Contents
MORGAN STANLEY
NOTES TO CONSOLIDATED FINANCIAL STATEMENTS (Unaudited)—(Continued)
|
Balance at
June 30, 2016 |
Valuation Technique(s) / Significant Unobservable Input(s) / Sensitivity of the Fair Value to Changes in the Unobservable Inputs |
Range(1) |
Averages(2) |
||||||||
| (dollars in millions) | |||||||||||
|
Investments: |
|||||||||||
|
Principal investments |
769 | Discounted cash flow: | |||||||||
|
Implied weighted average cost of capital / (C)(D) |
13% to 16% | 15% | |||||||||
| Exit multiple / (A)(D) | 8 to 23 times | 9 times | |||||||||
| Market approach(3): | |||||||||||
| EBITDA multiple / (A)(D) | 6 to 25 times | 12 times | |||||||||
| Forward capacity price / (A)(D) | $4 to $9 | $7 | |||||||||
| Comparable pricing: | |||||||||||
| Comparable equity price / (A) | 43% to 100% | 82% | |||||||||
|
Other |
205 | Discounted cash flow: | |||||||||
|
Implied weighted average cost of capital / (C)(D) |
9% | 9% | |||||||||
| Exit multiple / (A)(D) | 13 times | 13 times | |||||||||
| Market approach: | |||||||||||
| EBITDA multiple / (A)(D) | 6 to 13 times | 12 times | |||||||||
| Comparable pricing(3): | |||||||||||
| Comparable equity price / (A) | 100% | 100% | |||||||||
|
Liabilities at Fair Value |
|||||||||||
|
Securities sold under agreements to repurchase |
150 | Discounted cash flow: | |||||||||
| Funding spread / (A) | 117 to 123 bps | 120 bps | |||||||||
|
Other secured financings |
441 | Option model: | |||||||||
| Volatility skew / (C) | -1% | -1% | |||||||||
| Discounted cash flow(3): | |||||||||||
| Discount rate / (C) | 4% | 4% | |||||||||
| Discounted cash flow: | |||||||||||
| Funding spread / (A) | 101 to 126 bps | 114 bps | |||||||||
|
Long-term borrowings |
1,929 | Option model(3): | |||||||||
| At the money volatility / (C)(D) | 6% to 48% | 29% | |||||||||
| Volatility skew / (C)(D) | -2% to 0% | -1% | |||||||||
| Equity - Equity correlation / (C)(D) | 50% to 98% | 75% | |||||||||
| Equity - Foreign exchange correlation / (C)(D) | -50% to 11% | -25% | |||||||||
|
Option model: |
|||||||||||
| Interest rate - credit spread correlation / (A)(D) | -52% to 3% | -24% / -23% (5) | |||||||||
| Interest rate - Foreign exchange correlation / | |||||||||||
| (A)(D) | 53% | 53% / 53% (5) | |||||||||
| Interest rate - equity correlation / (A)(D) | 7% to 44% | 26% / 26% (5) | |||||||||
| Interest rate curve correlation / (C)(D) | 40% to 87% | 73% / 78% (5) | |||||||||
|
Correlation model: |
|||||||||||
| Credit correlation / (B) | 33% to 61% | 44% | |||||||||
|
Comparable pricing: |
|||||||||||
| Comparable equity price / (A) | 100% | 100% | |||||||||
|
|
18 |
Table of Contents
MORGAN STANLEY
NOTES TO CONSOLIDATED FINANCIAL STATEMENTS (Unaudited)—(Continued)
|
Balance at
December 31, 2015 |
Valuation Technique(s) / Significant Unobservable Input(s) / Sensitivity of the Fair Value to Changes in the Unobservable Inputs |
Range(1) |
Averages(2) |
||||||||
| (dollars in millions) | |||||||||||
|
Assets at Fair Value |
|||||||||||
|
Trading assets: |
|||||||||||
|
Corporate and other debt: |
|||||||||||
|
Residential mortgage-backed securities |
$ | 341 | Comparable pricing: | ||||||||
| Comparable bond price / (A) | 0 to 75 points | 32 points | |||||||||
|
Commercial mortgage-backed securities |
72 | Comparable pricing: | |||||||||
| Comparable bond price / (A) | 0 to 9 points | 2 points | |||||||||
|
Corporate bonds |
267 | Comparable pricing(3): | |||||||||
| Comparable bond price / (A) | 3 to 119 points | 90 points | |||||||||
| Comparable pricing: | |||||||||||
| EBITDA multiple / (A) | 7 to 9 times | 8 times | |||||||||
| Structured bond model: | |||||||||||
| Discount rate / (C) | 15% | 15% | |||||||||
|
Collateralized debt and loan obligations |
430 | Comparable pricing(3): | |||||||||
| Comparable bond price / (A) | 47 to 103 points | 67 points | |||||||||
| Correlation model: | |||||||||||
| Credit correlation / (B) | 39% to 60% | 49% | |||||||||
|
Loans and lending commitments |
5,936 | Corporate loan model: | |||||||||
| Credit spread / (C) | 250 to 866 bps | 531 bps | |||||||||
| Margin loan model(3): | |||||||||||
| Credit spread / (C)(D) | 62 to 499 bps | 145 bps | |||||||||
| Volatility skew / (C)(D) | 14% to 70% | 33% | |||||||||
| Discount rate / (C)(D) | 1% to 4% | 2% | |||||||||
| Option model: | |||||||||||
| Volatility skew / (C) | -1% | -1% | |||||||||
| Comparable pricing: | |||||||||||
| Comparable loan price / (A) | 35 to 100 points | 88 points | |||||||||
| Discounted cash flow: | |||||||||||
|
Implied weighted average cost of capital / (C)(D) |
6% to 8% | 7% | |||||||||
| Capitalization rate / (C)(D) | 4% to 10% | 4% | |||||||||
|
Other debt |
448 | Comparable pricing: | |||||||||
| Comparable loan price / (A) | 4 to 84 points | 59 points | |||||||||
| Comparable pricing: | |||||||||||
| Comparable bond price / (A) | 8 points | 8 points | |||||||||
| Option model: | |||||||||||
| At the money volatility / (C) | 16% to 53% | 53% | |||||||||
| Margin loan model(3): | |||||||||||
| Discount rate / (C) | 1% | 1% | |||||||||
|
Corporate equities |
433 | Comparable pricing: | |||||||||
| Comparable price / (A) | 50% to 80% | 72% | |||||||||
| Comparable pricing(3): | |||||||||||
| Comparable equity price / (A) | 100% | 100% | |||||||||
| Market approach: | |||||||||||
| EBITDA multiple / (A) | 9 times | 9 times | |||||||||
| 19 |
|
Table of Contents
MORGAN STANLEY
NOTES TO CONSOLIDATED FINANCIAL STATEMENTS (Unaudited)—(Continued)
|
Balance at
December 31, 2015 |
Valuation Technique(s) / Significant Unobservable Input(s) / Sensitivity of the Fair Value to Changes in the Unobservable Inputs |
Range(1) |
Averages(2) |
||||||||
| (dollars in millions) | |||||||||||
|
Net derivative and other contracts(4): |
|||||||||||
|
Interest rate contracts |
260 | Option model: | |||||||||
|
Interest rate volatility concentration liquidity multiple / (C)(D) |
0 to 3 times | 2 times | |||||||||
|
Interest rate - Foreign exchange
|
25% to 62% | 43% / 43%(5) | |||||||||
| Interest rate volatility skew / (A)(D) | 29% to 82% | 43% / 40%(5) | |||||||||
| Interest rate quanto correlation / (A)(D) | -8% to 36% | 5% / -6%(5) | |||||||||
| Interest rate curve correlation / (C)(D) | 24% to 95% | 60% / 69%(5) | |||||||||
| Inflation volatility / (A)(D) | 58% | 58% / 58%(5) | |||||||||
| Interest rate - Inflation correlation / (A)(D) | -41% to -39% | -41% / -41%(5) | |||||||||
|
Credit contracts |
(844) | Comparable pricing: | |||||||||
| Cash synthetic basis / (C)(D) | 5 to 12 points | 9 points | |||||||||
| Comparable bond price / (C)(D) | 0 to 75 points | 24 points | |||||||||
| Correlation model(3): | |||||||||||
| Credit correlation / (B) | 39% to 97% | 57% | |||||||||
|
Foreign exchange contracts(6) |
141 | Option model: | |||||||||
|
Interest rate - Foreign exchange
|
25% to 62% | 43% / 43%(5) | |||||||||
| Interest rate volatility skew / (A)(D) | 29% to 82% | 43% / 40%(5) | |||||||||
| Interest rate curve / (A)(D) | 0% | 0% / 0%(5) | |||||||||
|
Equity contracts(6) |
(2,031) | Option model: | |||||||||
| At the money volatility / (A)(D) | 16% to 65% | 32% | |||||||||
| Volatility skew / (A)(D) | -3% to 0% | -1% | |||||||||
| Equity - Equity correlation / (C)(D) | 40% to 99% | 71% | |||||||||
| Equity - Foreign exchange correlation / (A)(D) | -60% to -11% | -39% | |||||||||
| Equity - Interest rate correlation / (C)(D) | -29% to 50% | 16% / 8%(5) | |||||||||
|
Commodity contracts |
1,050 | Option model: | |||||||||
| Forward power price / (C)(D) | $3 to $91 per | $32 per | |||||||||
| megawatt hour | megawatt hour | ||||||||||
| Commodity volatility / (A)(D) | 10% to 92% | 18% | |||||||||
| Cross commodity correlation / (C)(D) | 43% to 99% | 93% | |||||||||
|
Investments: |
|||||||||||
|
Principal investments |
486 | Discounted cash flow: | |||||||||
|
Implied weighted average cost of capital / (C)(D) |
16% | 16% | |||||||||
| Exit multiple / (A)(D) | 8 to 14 times | 9 times | |||||||||
| Capitalization rate / (C)(D) | 5% to 9% | 6% | |||||||||
| Equity discount rate / (C)(D) | 20% to 35% | 26% | |||||||||
| Market approach(3): | |||||||||||
| EBITDA multiple / (A)(D) | 8 to 20 times | 11 times | |||||||||
| Forward capacity price / (A)(D) | $5 to $9 | $7 | |||||||||
| Comparable pricing: | |||||||||||
| Comparable equity price / (A) | 43% to 100% | 81% | |||||||||
|
Other |
221 | Discounted cash flow: | |||||||||
| Implied weighted average cost of capital / (C)(D) | 10% | 10% | |||||||||
| Exit multiple / (A)(D) | 13 times | 13 times | |||||||||
| Market approach: | |||||||||||
| EBITDA multiple / (A) | 7 to 14 times | 12 times | |||||||||
| Comparable pricing(3): | |||||||||||
| Comparable equity price / (A) | 100% | 100% | |||||||||
|
|
20 |
Table of Contents
MORGAN STANLEY
NOTES TO CONSOLIDATED FINANCIAL STATEMENTS (Unaudited)—(Continued)
|
Balance at
December 31, 2015 |
Valuation Technique(s) / Significant Unobservable Input(s) / Sensitivity of the Fair Value to Changes in the Unobservable Inputs |
Range(1) |
Averages(2) |
||||||||
| (dollars in millions) | |||||||||||
|
Liabilities at Fair Value |
|||||||||||
|
Securities sold under agreements to repurchase |
$ | 151 | Discounted cash flow: | ||||||||
| Funding spread / (A) | 86 to 116 bps | 105 bps | |||||||||
|
Other secured financings |
461 | Option model: | |||||||||
| Volatility skew / (C) | -1% | -1% | |||||||||
| Discounted cash flow(3): | |||||||||||
| Discount rate / (C) | 4% to 13% | 4% | |||||||||
| Discounted cash flow: | |||||||||||
| Funding spread / (A) | 95 to 113 bps | 104 bps | |||||||||
|
Long-term borrowings |
1,987 | Option model(3): | |||||||||
| At the money volatility / (C)(D) | 20% to 50% | 29% | |||||||||
| Volatility skew / (A)(D) | -1% to 0% | -1% | |||||||||
| Equity - Equity correlation / (A)(D) | 40% to 97% | 77% | |||||||||
|
Equity - Foreign exchange correlation / (C)(D) |
-70% to -11% | -39% | |||||||||
| Option model: | |||||||||||
| Interest rate volatility skew / (A)(D) | 50% | 50% | |||||||||
| Equity volatility discount / (A)(D) | 10% | 10% | |||||||||
| Correlation model: | |||||||||||
| Credit correlation / (B) | 40% to 60% | 52% | |||||||||
| Comparable pricing: | |||||||||||
| Comparable equity price / (A) | 100% | 100% | |||||||||
bps—Basis points
EBITDA—Earnings before interest, taxes, depreciation and amortization
| (1) |
The range of significant unobservable inputs is represented in points, percentages, basis points, times or megawatt hours. Points are a percentage of par; for example, 79 points would be 79% of par. A basis point equals 1/100th of 1%; for example, 898 bps would equal 8.98%. |
| (2) |
Amounts represent weighted averages except where simple averages and the median of the inputs are provided (see footnote 5 below). Weighted averages are calculated by weighting each input by the fair value of the respective financial instruments except for collateralized debt and loan obligations, principal investments, other debt, corporate bonds, long-term borrowings and derivative instruments where some or all inputs are weighted by risk. |
| (3) |
This is the predominant valuation technique for this major asset or liability class. |
| (4) |
Credit valuation adjustments (“CVA”) and funding valuation adjustments (“FVA”) are included in the balance but excluded from the Valuation Technique(s) and Significant Unobservable Input(s) in the previous table. CVA is a Level 3 input when the underlying counterparty credit curve is unobservable. FVA is a Level 3 input in its entirety given the lack of observability of funding spreads in the principal market. |
| (5) |
The data structure of the significant unobservable inputs used in valuing interest rate contracts, foreign exchange contracts, certain equity contracts and certain long-term borrowings may be in a multi-dimensional form, such as a curve or surface, with risk distributed across the structure. Therefore, a simple average and median, together with the range of data inputs, may be more appropriate measurements than a single point weighted average. |
| (6) |
Includes derivative contracts with multiple risks ( i.e., hybrid products). |
Sensitivity of the fair value to changes in the unobservable inputs:
| (A) |
Significant increase (decrease) in the unobservable input in isolation would result in a significantly higher (lower) fair value measurement. |
| (B) |
Significant changes in credit correlation may result in a significantly higher or lower fair value measurement. Increasing (decreasing) correlation drives a redistribution of risk within the capital structure such that junior tranches become less (more) risky and senior tranches become more (less) risky. |
| (C) |
Significant increase (decrease) in the unobservable input in isolation would result in a significantly lower (higher) fair value measurement. |
| (D) |
There are no predictable relationships between the significant unobservable inputs. |
| 21 |
|
Table of Contents
MORGAN STANLEY
NOTES TO CONSOLIDATED FINANCIAL STATEMENTS (Unaudited)—(Continued)
Fair Value of Investments Measured at Net Asset Value
For a description of the Firm’s investments in private equity funds, real estate funds and hedge funds measured at fair value based on NAV, see Note 3 to the consolidated financial statements in the 2015 Form 10-K.
Investments in Certain Funds Measured at NAV per Share
| At June 30, 2016 | At December 31, 2015 | |||||||||||||||
| Fair Value | Commitment | Fair Value | Commitment | |||||||||||||
| (dollars in millions) | ||||||||||||||||
|
Private equity funds |
$ | 1,698 | $ | 395 | $ | 1,917 | $ | 538 | ||||||||
|
Real estate funds |
1,228 | 111 | 1,337 | 128 | ||||||||||||
|
Hedge funds |
320 | 4 | 589 | 4 | ||||||||||||
|
|
|
|
|
|
|
|
|
|||||||||
|
Total |
$ | 3,246 | $ | 510 | $ | 3,843 | $ | 670 | ||||||||
|
|
|
|
|
|
|
|
|
|||||||||
|
|
22 |
Table of Contents
MORGAN STANLEY
NOTES TO CONSOLIDATED FINANCIAL STATEMENTS (Unaudited)—(Continued)
Fair Value Option
The Firm elected the fair value option for certain eligible instruments that are risk managed on a fair value basis to mitigate income statement volatility caused by measurement basis differences between the elected instruments and their associated risk management transactions or to eliminate complexities of applying certain accounting models.
Impact on Earnings of Transactions Under the Fair Value Option Election
In addition to the amounts in the following table, as discussed in Note 2 to the consolidated financial statements in the 2015 Form 10-K, instruments within Trading assets or Trading liabilities are measured at fair value. The amounts in this table are included within Net revenues and do not reflect gains or losses on related hedging instruments, if any.
|
Trading
Revenues |
Interest
Income (Expense) |
Gains (Losses)
Included in Net Revenues |
||||||||||
| (dollars in millions) | ||||||||||||
| Three Months Ended June 30, 2016 | ||||||||||||
|
Securities purchased under agreements to resell |
$ | (1) | $ | 2 | $ | 1 | ||||||
|
Deposits(1) |
(1) | (1) | (2) | |||||||||
|
Short-term borrowings(1) |
(9) | — | (9) | |||||||||
|
Securities sold under agreements to repurchase(1) |
(3) | (3) | (6) | |||||||||
|
Long-term borrowings(1) |
(1,289) | (130) | (1,419) | |||||||||
| Six Months Ended June 30, 2016 | ||||||||||||
|
Securities purchased under agreements to resell |
$ | (1) | $ | 4 | $ | 3 | ||||||
|
Deposits(1) |
(3) | (1) | (4) | |||||||||
|
Short-term borrowings(1) |
36 | — | 36 | |||||||||
|
Securities sold under agreements to repurchase(1) |
(12) | (5) | (17) | |||||||||
|
Long-term borrowings(1) |
(2,254) | (269) | (2,523) | |||||||||
| Three Months Ended June 30, 2015 | ||||||||||||
|
Securities purchased under agreements to resell |
$ | (2) | $ | 5 | $ | 3 | ||||||
|
Short-term borrowings(2) |
(2) | — | (2) | |||||||||
|
Securities sold under agreements to repurchase(2) |
6 | (2) | 4 | |||||||||
|
Long-term borrowings(2) |
152 | (138) | 14 | |||||||||
| Six Months Ended June 30, 2015 | ||||||||||||
|
Securities purchased under agreements to resell |
$ | (3) | $ | 5 | $ | 2 | ||||||
|
Short-term borrowings(2) |
(42) | — | (42) | |||||||||
|
Securities sold under agreements to repurchase(2) |
4 | (3) | 1 | |||||||||
|
Long-term borrowings(2) |
1,089 | (270) | 819 | |||||||||
| (1) |
Gains (losses) are mainly attributable to changes in foreign currency rates or interest rates or movements in the reference price or index for short-term and long-term borrowings before the impact of related hedges. In accordance with the early adoption of a provision of the accounting update Recognition and Measurement of Financial Assets and Financial Liabilities , unrealized DVA gains of $225 million and $548 million are recorded within OCI in the consolidated statements of comprehensive income and not included in this table for the current quarter and current year period, respectively. See Notes 2 and 14 for further information. |
| (2) |
Gains (losses) recorded in Trading revenues for the prior year quarter and prior year period are attributable to DVA and the respective remainder is attributable to changes in foreign currency rates or interest rates or movements in the reference price or index for structured notes before the impact of related hedges. |
| 23 |
|
Table of Contents
MORGAN STANLEY
NOTES TO CONSOLIDATED FINANCIAL STATEMENTS (Unaudited)—(Continued)
Gains (Losses) due to Changes in Instrument-Specific Credit Risk
|
Three Months Ended
June 30, |
Six Months Ended
June 30, |
|||||||||||||||||||||||||||||||
| 2016 | 2015 | 2016 | 2015 | |||||||||||||||||||||||||||||
|
Trading
Revenues |
OCI |
Trading
Revenues |
OCI |
Trading
Revenues |
OCI |
Trading
Revenues |
OCI | |||||||||||||||||||||||||
| (dollars in millions) | ||||||||||||||||||||||||||||||||
|
Short-term and long-term borrowings(1) |
$ | — | $ | 226 | $ | 182 | $ | — | $ | 41 | $ | 545 | $ | 307 | $ | — | ||||||||||||||||
|
Securities sold under agreements to repurchase(1) |
— | (1) | — | — | — | 3 | — | — | ||||||||||||||||||||||||
|
Loans and other debt(2) |
(14) | — | (6) | — | (114) | — | 71 | — | ||||||||||||||||||||||||
|
Lending commitments(3) |
2 | — | (1) | — | 3 | — | 8 | — | ||||||||||||||||||||||||
| (1) |
In accordance with the early adoption of a provision of the accounting update, Recognition and Measurement of Financial Assets and Financial Liabilities , for the current quarter and current year period DVA gains (losses) are recorded in OCI when unrealized and in Trading revenues when realized. In the prior year quarter and prior year period, the realized and unrealized DVA gains (losses) are recorded in Trading revenues. The cumulative impact of changes in the Firm’s DVA and the pre-tax amount recognized in AOCI is a gain of $87 million at June 30, 2016. See Notes 2 and 14 for further information. |
| (2) |
Loans and other debt instrument-specific credit gains (losses) were determined by excluding the non-credit components of gains and losses, such as those due to changes in interest rates. |
| (3) |
Gains (losses) on lending commitments were generally determined based on the differential between estimated expected client yields and contractual yields at each respective period-end. |
|
|
24 |
Table of Contents
MORGAN STANLEY
NOTES TO CONSOLIDATED FINANCIAL STATEMENTS (Unaudited)—(Continued)
Assets and Liabilities Measured at Fair Value on a Non-Recurring Basis
Certain assets and liabilities were measured at fair value on a non-recurring basis and are not included in the previous tables.
Assets and Liabilities Measured at Fair Value on a Non-Recurring Basis
| Fair Value by Level | ||||||||||||||||||||||||
|
Carrying
Value at June 30, 2016(1) |
Level 1 | Level 2 | Level 3 |
Total
Gains (Losses) for the Three Months Ended June 30, 2016(2) |
Total
Gains (Losses) for Six Months Ended June 30, 2016(2) |
|||||||||||||||||||
| (dollars in millions) | ||||||||||||||||||||||||
|
Assets: |
||||||||||||||||||||||||
|
Loans(3) |
$ | 6,700 | $ — | $ | 4,276 | $ | 2,424 | $ | (34) | $ | (131) | |||||||||||||
|
Other assets—Other investments(4) |
82 | — | — | 82 | (38) | (40) | ||||||||||||||||||
|
Other assets—Premises, equipment and software
|
— | — | — | — | (22) | (27) | ||||||||||||||||||
|
|
|
|
|
|
|
|
|
|
|
|
|
|||||||||||||
|
Total assets |
$ | 6,782 | $ — | $ | 4,276 | $ | 2,506 | $ | (94) | $ | (198) | |||||||||||||
|
|
|
|
|
|
|
|
|
|
|
|
|
|||||||||||||
|
Liabilities: |
||||||||||||||||||||||||
|
Other liabilities and accrued expenses(3) |
$ | 402 | $ — | $ | 331 | $ | 71 | $ | 13 | $ | 24 | |||||||||||||
|
|
|
|
|
|
|
|
|
|
|
|
|
|||||||||||||
|
Total liabilities |
$ | 402 | $ — | $ | 331 | $ | 71 | $ | 13 | $ | 24 | |||||||||||||
|
|
|
|
|
|
|
|
|
|
|
|
|
|||||||||||||
| Fair Value by Level | ||||||||||||||||||||||||
|
Carrying
Value at June 30, 2015(1) |
Level 1 | Level 2 | Level 3 |
Total
Gains (Losses) for the Three Months Ended June 30, 2015(2) |
Total
Gains (Losses) for the Six Months Ended June 30, 2015(2) |
|||||||||||||||||||
| (dollars in millions) | ||||||||||||||||||||||||
|
Assets: |
||||||||||||||||||||||||
|
Loans(3) |
$ | 3,244 | $ — | $ | 2,458 | $ | 786 | $ | 47 | $ | 8 | |||||||||||||
|
Other assets—Other investments(4) |
— | — | — | — | — | (2) | ||||||||||||||||||
|
Other assets—Premises, equipment and software
|
— | — | — | — | (2) | (22) | ||||||||||||||||||
|
|
|
|
|
|
|
|
|
|
|
|
|
|||||||||||||
|
Total assets |
$ | 3,244 | $ — | $ | 2,458 | $ | 786 | $ | 45 | $ | (16) | |||||||||||||
|
|
|
|
|
|
|
|
|
|
|
|
|
|||||||||||||
|
Liabilities: |
||||||||||||||||||||||||
|
Other liabilities and accrued expenses(3) |
$ | 283 | $ — | $ | 244 | $ | 39 | $ | (45) | (48) | ||||||||||||||
|
|
|
|
|
|
|
|
|
|
|
|
|
|||||||||||||
|
Total liabilities |
$ | 283 | $ — | $ | 244 | $ | 39 | $ | (45) | (48) | ||||||||||||||
|
|
|
|
|
|
|
|
|
|
|
|
|
|||||||||||||
| (1) |
Carrying values relate only to those assets that had fair value adjustments during the current quarter and prior year quarter. |
| (2) |
Changes in the fair value of Loans and losses related to Other assets—Other investments are recorded within Other revenues in the consolidated statements of income. Losses related to Other assets—Premises, equipment and software costs are recorded within Other expenses if not held for sale and within Other revenues if held for sale. Changes in the fair value of lending commitments reported in Other liabilities and accrued expenses that are designated as held for sale are recorded within Other revenues, whereas, changes in the fair value related to held for investment lending commitments are recorded within Other expenses. |
| (3) |
Non-recurring changes in the fair value of loans and lending commitments held for investment were calculated using the value of the underlying collateral. Loans and lending commitments held for sale were calculated using recently executed transactions; market price quotations; valuation models that incorporate market observable inputs where possible, such as comparable loan or debt prices and credit default swap spread levels adjusted for any basis difference between cash and derivative instruments; or default recovery analysis where such transactions and quotations are unobservable. |
| (4) |
Losses related to Other assets—Other investments were determined primarily using discounted cash flow models and methodologies that incorporate multiples of certain comparable companies. |
| (5) |
Losses related to Other assets—Premises, equipment and software costs were determined primarily using a default recovery analysis. |
| 25 |
|
Table of Contents
MORGAN STANLEY
NOTES TO CONSOLIDATED FINANCIAL STATEMENTS (Unaudited)—(Continued)
Financial Instruments Not Measured at Fair Value
For a further discussion of financial instruments not measured at fair value, see Note 3 to the consolidated financial statements in the 2015 Form 10-K. The carrying values of the remaining assets and liabilities not measured at fair value in the following tables approximate fair value due to their short-term nature. The following tables exclude certain financial instruments such as equity method investments and all non-financial assets and liabilities such as the value of the long-term relationships with the Firm’s deposit customers.
| At June 30, 2016 | Fair Value by Level | |||||||||||||||||||
|
Carrying
Value |
Fair Value | Level 1 | Level 2 | Level 3 | ||||||||||||||||
| (dollars in millions) | ||||||||||||||||||||
|
Financial Assets: |
||||||||||||||||||||
|
Cash and due from banks |
$ | 27,597 | $ | 27,597 | $ | 27,597 | $ | — | $ | — | ||||||||||
|
Interest bearing deposits with banks |
28,536 | 28,536 | 28,536 | — | — | |||||||||||||||
|
Investment securities—HTM securities |
12,418 | 12,567 | 3,758 | 8,809 | — | |||||||||||||||
|
Securities purchased under agreements to resell |
97,034 | 97,042 | — | 95,140 | 1,902 | |||||||||||||||
|
Securities borrowed |
131,281 | 131,282 | — | 131,156 | 126 | |||||||||||||||
|
Customer and other receivables(1) |
48,910 | 48,815 | — | 44,033 | 4,782 | |||||||||||||||
|
Loans(2) |
93,165 | 94,151 | — | 25,289 | 68,862 | |||||||||||||||
|
Other assets—Cash deposited with clearing organizations or segregated under federal and other regulations or requirements |
32,771 | 32,771 | 32,771 | — | — | |||||||||||||||
|
Financial Liabilities: |
||||||||||||||||||||
|
Deposits |
$ | 152,598 | $ | 152,788 | $ | — | $ | 152,788 | $ | — | ||||||||||
|
Short-term borrowings |
369 | 369 | — | 369 | — | |||||||||||||||
|
Securities sold under agreements to repurchase |
49,629 | 49,692 | — | 48,033 | 1,659 | |||||||||||||||
|
Securities loaned |
17,241 | 17,262 | — | 17,262 | — | |||||||||||||||
|
Other secured financings |
6,980 | 6,991 | — | 5,596 | 1,395 | |||||||||||||||
|
Customer and other payables(1) |
197,978 | 197,978 | — | 197,978 | — | |||||||||||||||
|
Long-term borrowings |
125,688 | 127,189 | — | 127,189 | — | |||||||||||||||
| At December 31, 2015 | Fair Value by Level | |||||||||||||||||||
|
Carrying
Value |
Fair Value | Level 1 | Level 2 | Level 3 | ||||||||||||||||
| (dollars in millions) | ||||||||||||||||||||
|
Financial Assets: |
||||||||||||||||||||
|
Cash and due from banks |
$ | 19,827 | $ | 19,827 | $ | 19,827 | $ | — | $ | — | ||||||||||
|
Interest bearing deposits with banks |
34,256 | 34,256 | 34,256 | — | — | |||||||||||||||
|
Investment securities—HTM securities |
5,224 | 5,188 | 998 | 4,190 | — | |||||||||||||||
|
Securities purchased under agreements to resell |
86,851 | 86,837 | — | 86,186 | 651 | |||||||||||||||
|
Securities borrowed |
142,416 | 142,414 | — | 142,266 | 148 | |||||||||||||||
|
Customer and other receivables(1) |
41,676 | 41,576 | — | 36,752 | 4,824 | |||||||||||||||
|
Loans(2) |
85,759 | 86,423 | — | 19,241 | 67,182 | |||||||||||||||
|
Other assets—Cash deposited with clearing organizations or segregated under federal and other regulations or requirements |
31,469 | 31,469 | 31,469 | — | — | |||||||||||||||
|
Financial Liabilities: |
||||||||||||||||||||
|
Deposits |
$ | 155,909 | $ | 156,163 | $ | — | $ | 156,163 | $ | — | ||||||||||
|
Short-term borrowings |
525 | 525 | — | 525 | — | |||||||||||||||
|
Securities sold under agreements to repurchase |
36,009 | 36,060 | — | 34,150 | 1,910 | |||||||||||||||
|
Securities loaned |
19,358 | 19,382 | — | 19,192 | 190 | |||||||||||||||
|
Other secured financings |
6,610 | 6,610 | — | 5,333 | 1,277 | |||||||||||||||
|
Customer and other payables(1) |
183,895 | 183,895 | — | 183,895 | — | |||||||||||||||
|
Long-term borrowings |
120,723 | 123,219 | — | 123,219 | — | |||||||||||||||
HTM—Held to maturity
| (1) |
Accrued interest, fees, and dividend receivables and payables where carrying value approximates fair value have been excluded. |
| (2) |
Amounts include all loans measured at fair value on a non-recurring basis. |
|
|
26 |
Table of Contents
MORGAN STANLEY
NOTES TO CONSOLIDATED FINANCIAL STATEMENTS (Unaudited)—(Continued)
| 4. |
Derivative Instruments and Hedging Activities |
For a discussion of the Firm’s derivative instruments and hedging activities, see Note 4 to the consolidated financial statements in the 2015 Form 10-K.
Fair Value, Notional and Offsetting of Derivative Assets and Liabilities
| Derivative Assets at June 30, 2016 | ||||||||||||||||||||||||||||||||
| Fair Value | Notional | |||||||||||||||||||||||||||||||
|
Bilateral
OTC |
Cleared
OTC |
Exchange
Traded |
Total |
Bilateral
OTC |
Cleared
OTC |
Exchange
Traded |
Total | |||||||||||||||||||||||||
| (dollars in millions) | ||||||||||||||||||||||||||||||||
|
Derivatives designated as accounting hedges: |
||||||||||||||||||||||||||||||||
|
Interest rate contracts |
$ | 3,325 | $ | 3,798 | $ | — | $ | 7,123 | $ | 34,003 | $ | 58,245 | $ | — | $ | 92,248 | ||||||||||||||||
|
Foreign exchange contracts |
88 | — | — | 88 | 2,795 | 59 | — | 2,854 | ||||||||||||||||||||||||
|
|
|
|
|
|
|
|
|
|
|
|
|
|
|
|
|
|||||||||||||||||
|
Total derivatives designated as accounting hedges |
3,413 | 3,798 | — | 7,211 | 36,798 | 58,304 | — | 95,102 | ||||||||||||||||||||||||
|
|
|
|
|
|
|
|
|
|
|
|
|
|
|
|
|
|||||||||||||||||
|
Derivatives not designated as accounting hedges(1): |
||||||||||||||||||||||||||||||||
|
Interest rate contracts |
287,757 | 168,366 | 328 | 456,451 | 3,940,102 | 6,615,199 | 1,636,768 | 12,192,069 | ||||||||||||||||||||||||
|
Credit contracts |
13,734 | 2,727 | — | 16,461 | 434,478 | 133,037 | — | 567,515 | ||||||||||||||||||||||||
|
Foreign exchange contracts |
75,891 | 386 | 140 | 76,417 | 1,851,368 | 16,653 | 21,279 | 1,889,300 | ||||||||||||||||||||||||
|
Equity contracts |
22,043 | — | 20,486 | 42,529 | 341,039 | — | 259,453 | 600,492 | ||||||||||||||||||||||||
|
Commodity contracts |
11,785 | — | 3,724 | 15,509 | 72,700 | — | 83,156 | 155,856 | ||||||||||||||||||||||||
|
Other |
16 | — | — | 16 | 1,135 | — | — | 1,135 | ||||||||||||||||||||||||
|
|
|
|
|
|
|
|
|
|
|
|
|
|
|
|
|
|||||||||||||||||
|
Total derivatives not designated as accounting hedges |
411,226 | 171,479 | 24,678 | 607,383 | 6,640,822 | 6,764,889 | 2,000,656 | 15,406,367 | ||||||||||||||||||||||||
|
|
|
|
|
|
|
|
|
|
|
|
|
|
|
|
|
|||||||||||||||||
|
Total gross derivatives(2) |
$ | 414,639 | $ | 175,277 | $ | 24,678 | $ | 614,594 | $ | 6,677,620 | $ | 6,823,193 | $ | 2,000,656 | $ | 15,501,469 | ||||||||||||||||
|
|
|
|
|
|
|
|
|
|||||||||||||||||||||||||
|
Amounts offset: |
||||||||||||||||||||||||||||||||
|
Counterparty netting |
(321,553) | (173,222) | (21,214) | (515,989) | ||||||||||||||||||||||||||||
|
Cash collateral netting |
(60,352) | (95) | — | (60,447) | ||||||||||||||||||||||||||||
|
|
|
|
|
|
|
|
|
|||||||||||||||||||||||||
|
Total derivative assets at fair value included in Trading assets |
$ | 32,734 | $ | 1,960 | $ | 3,464 | $ | 38,158 | ||||||||||||||||||||||||
|
|
|
|
|
|
|
|
|
|||||||||||||||||||||||||
|
Amounts not offset(3): |
||||||||||||||||||||||||||||||||
|
Financial instruments collateral |
(12,011) | — | — | (12,011) | ||||||||||||||||||||||||||||
|
Other cash collateral |
(23) | — | — | (23) | ||||||||||||||||||||||||||||
|
|
|
|
|
|
|
|
|
|||||||||||||||||||||||||
|
Net exposure |
$ | 20,700 | $ | 1,960 | $ | 3,464 | $ | 26,124 | ||||||||||||||||||||||||
|
|
|
|
|
|
|
|
|
|||||||||||||||||||||||||
| 27 |
|
Table of Contents
MORGAN STANLEY
NOTES TO CONSOLIDATED FINANCIAL STATEMENTS (Unaudited)—(Continued)
| Derivative Liabilities at June 30, 2016 | ||||||||||||||||||||||||||||||||
| Fair Value | Notional | |||||||||||||||||||||||||||||||
|
Bilateral
OTC |
Cleared
OTC |
Exchange
Traded |
Total |
Bilateral
OTC |
Cleared
OTC |
Exchange
Traded |
Total | |||||||||||||||||||||||||
| (dollars in millions) | ||||||||||||||||||||||||||||||||
|
Derivatives designated as accounting hedges: |
||||||||||||||||||||||||||||||||
|
Interest rate contracts |
$ | — | $ | — | $ | — | $ | — | $ | — | $ | 32 | $ | — | $ | 32 | ||||||||||||||||
|
Foreign exchange contracts |
$ | 492 | $ | 23 | $ | — | $ | 515 | $ | 8,348 | $ | 689 | $ | — | $ | 9,037 | ||||||||||||||||
|
|
|
|
|
|
|
|
|
|
|
|
|
|
|
|
|
|
|
|
|
|
|
|
||||||||||
|
Total derivatives designated as accounting hedges |
492 | 23 | — | 515 | 8,348 | 721 | — | 9,069 | ||||||||||||||||||||||||
|
|
|
|
|
|
|
|
|
|
|
|
|
|
|
|
|
|
|
|
|
|
|
|
||||||||||
|
Derivatives not designated as accounting hedges(1): |
||||||||||||||||||||||||||||||||
|
Interest rate contracts |
265,270 | 172,084 | 412 | 437,766 | 3,654,941 | 6,558,339 | 760,822 | 10,974,102 | ||||||||||||||||||||||||
|
Credit contracts |
14,888 | 2,933 | — | 17,821 | 489,656 | 115,979 | — | 605,635 | ||||||||||||||||||||||||
|
Foreign exchange contracts |
77,614 | 414 | 82 | 78,110 | 1,837,572 | 15,817 | 10,511 | 1,863,900 | ||||||||||||||||||||||||
|
Equity contracts |
25,633 | — | 20,916 | 46,549 | 342,625 | — | 261,986 | 604,611 | ||||||||||||||||||||||||
|
Commodity contracts |
9,390 | — | 3,389 | 12,779 | 68,095 | — | 64,896 | 132,991 | ||||||||||||||||||||||||
|
Other |
102 | — | — | 102 | 4,817 | — | — | 4,817 | ||||||||||||||||||||||||
|
|
|
|
|
|
|
|
|
|
|
|
|
|
|
|
|
|
|
|
|
|
|
|
||||||||||
|
Total derivatives not designated as accounting hedges |
392,897 | 175,431 | 24,799 | 593,127 | 6,397,706 | 6,690,135 | 1,098,215 | 14,186,056 | ||||||||||||||||||||||||
|
|
|
|
|
|
|
|
|
|
|
|
|
|
|
|
|
|
|
|
|
|
|
|
||||||||||
|
Total gross derivatives(2) |
$ | 393,389 | $ | 175,454 | $ | 24,799 | $ | 593,642 | $ | 6,406,054 | $ | 6,690,856 | $ | 1,098,215 | $ | 14,195,125 | ||||||||||||||||
|
|
|
|
|
|
|
|
|
|
|
|
|
|||||||||||||||||||||
|
Amounts offset: |
||||||||||||||||||||||||||||||||
|
Counterparty netting |
(321,553) | (173,222 | ) | (21,214 | ) | (515,989 | ) | |||||||||||||||||||||||||
|
Cash collateral netting |
(38,378) | (1,952 | ) | — | (40,330 | ) | ||||||||||||||||||||||||||
|
|
|
|
|
|
|
|
|
|
|
|
||||||||||||||||||||||
|
Total derivative liabilities at fair value included in Trading liabilities |
$ | 33,458 | $ | 280 | $ | 3,585 | $ | 37,323 | ||||||||||||||||||||||||
|
|
|
|
|
|
|
|
|
|
|
|
||||||||||||||||||||||
|
Amounts not offset(3): |
||||||||||||||||||||||||||||||||
|
Financial instruments collateral |
(11,509) | — | (514 | ) | (12,023 | ) | ||||||||||||||||||||||||||
|
Other cash collateral |
(10) | (41 | ) | — | (51 | ) | ||||||||||||||||||||||||||
|
|
|
|
|
|
|
|
|
|
|
|
||||||||||||||||||||||
|
Net exposure |
$ | 21,939 | $ | 239 | $ | 3,071 | $ | 25,249 | ||||||||||||||||||||||||
|
|
|
|
|
|
|
|
|
|
|
|
||||||||||||||||||||||
| Derivative Assets at December 31, 2015 | ||||||||||||||||||||||||||||||||
| Fair Value | Notional | |||||||||||||||||||||||||||||||
|
Bilateral
OTC |
Cleared
OTC |
Exchange
Traded |
Total |
Bilateral
OTC |
Cleared
OTC |
Exchange
Traded |
Total | |||||||||||||||||||||||||
| (dollars in millions) | ||||||||||||||||||||||||||||||||
|
Derivatives designated as accounting hedges: |
||||||||||||||||||||||||||||||||
|
Interest rate contracts |
$ | 2,825 | $ | 1,442 | $ | — | $ | 4,267 | $ | 36,999 | $ | 35,362 | $ | — | $ | 72,361 | ||||||||||||||||
|
Foreign exchange contracts |
166 | 1 | — | 167 | 5,996 | 167 | — | 6,163 | ||||||||||||||||||||||||
|
|
|
|
|
|
|
|
|
|
|
|
|
|
|
|
|
|
|
|
|
|
|
|
||||||||||
|
Total derivatives designated as accounting hedges |
2,991 | 1,443 | — | 4,434 | 42,995 | 35,529 | — | 78,524 | ||||||||||||||||||||||||
|
|
|
|
|
|
|
|
|
|
|
|
|
|
|
|
|
|
|
|
|
|
|
|
||||||||||
|
Derivatives not designated as accounting hedges(4): |
||||||||||||||||||||||||||||||||
|
Interest rate contracts |
220,289 | 101,276 | 212 | 321,777 | 4,348,002 | 5,748,525 | 1,218,645 | 11,315,172 | ||||||||||||||||||||||||
|
Credit contracts |
19,310 | 3,609 | — | 22,919 | 585,731 | 139,301 | — | 725,032 | ||||||||||||||||||||||||
|
Foreign exchange contracts |
64,438 | 295 | 55 | 64,788 | 1,907,290 | 13,402 | 7,715 | 1,928,407 | ||||||||||||||||||||||||
|
Equity contracts |
20,212 | — | 20,077 | 40,289 | 316,770 | — | 229,859 | 546,629 | ||||||||||||||||||||||||
|
Commodity contracts |
13,114 | — | 4,038 | 17,152 | 67,449 | — | 82,313 | 149,762 | ||||||||||||||||||||||||
|
Other |
219 | — | — | 219 | 5,684 | — | — | 5,684 | ||||||||||||||||||||||||
|
|
|
|
|
|
|
|
|
|
|
|
|
|
|
|
|
|
|
|
|
|
|
|
||||||||||
|
Total derivatives not designated as accounting hedges |
337,582 | 105,180 | 24,382 | 467,144 | 7,230,926 | 5,901,228 | 1,538,532 | 14,670,686 | ||||||||||||||||||||||||
|
|
|
|
|
|
|
|
|
|
|
|
|
|
|
|
|
|
|
|
|
|
|
|
||||||||||
|
Total gross derivatives(2) |
$ | 340,573 | $ | 106,623 | $ | 24,382 | $ | 471,578 | $ | 7,273,921 | $ | 5,936,757 | $ | 1,538,532 | $ | 14,749,210 | ||||||||||||||||
|
|
|
|
|
|
|
|
|
|
|
|
|
|||||||||||||||||||||
|
Amounts offset: |
||||||||||||||||||||||||||||||||
|
Counterparty netting |
(265,707 | ) | (104,294 | ) | (21,592 | ) | (391,593 | ) | ||||||||||||||||||||||||
|
Cash collateral netting |
(50,335 | ) | (1,037 | ) | — | (51,372 | ) | |||||||||||||||||||||||||
|
|
|
|
|
|
|
|
|
|
|
|
||||||||||||||||||||||
|
Total derivative assets at fair value included in Trading assets |
$ | 24,531 | $ | 1,292 | $ | 2,790 | $ | 28,613 | ||||||||||||||||||||||||
|
|
|
|
|
|
|
|
|
|
|
|
||||||||||||||||||||||
|
Amounts not offset(3): |
||||||||||||||||||||||||||||||||
|
Financial instruments collateral |
(9,190 | ) | — | — | (9,190 | ) | ||||||||||||||||||||||||||
|
Other cash collateral |
(9 | ) | — | — | (9 | ) | ||||||||||||||||||||||||||
|
|
|
|
|
|
|
|
|
|
|
|
||||||||||||||||||||||
|
Net exposure |
$ | 15,332 | $ | 1,292 | $ | 2,790 | $ | 19,414 | ||||||||||||||||||||||||
|
|
|
|
|
|
|
|
|
|
|
|
||||||||||||||||||||||
|
|
28 |
Table of Contents
MORGAN STANLEY
NOTES TO CONSOLIDATED FINANCIAL STATEMENTS (Unaudited)—(Continued)
| Derivative Liabilities at December 31, 2015 | ||||||||||||||||||||||||||||||||
| Fair Value | Notional | |||||||||||||||||||||||||||||||
|
Bilateral
OTC |
Cleared
OTC |
Exchange
Traded |
Total |
Bilateral
OTC |
Cleared
OTC |
Exchange
Traded |
Total | |||||||||||||||||||||||||
| (dollars in millions) | ||||||||||||||||||||||||||||||||
|
Derivatives designated as accounting hedges: |
||||||||||||||||||||||||||||||||
|
Interest rate contracts |
$ | 20 | $ | 250 | $ | — | $ | 270 | $ | 3,560 | $ | 9,869 | $ | — | $ | 13,429 | ||||||||||||||||
|
Foreign exchange contracts |
56 | 6 | — | 62 | 4,604 | 455 | — | 5,059 | ||||||||||||||||||||||||
|
|
|
|
|
|
|
|
|
|
|
|
|
|
|
|
|
|
|
|
|
|
|
|
||||||||||
|
Total derivatives designated as accounting hedges |
76 | 256 | — | 332 | 8,164 | 10,324 | — | 18,488 | ||||||||||||||||||||||||
|
|
|
|
|
|
|
|
|
|
|
|
|
|
|
|
|
|
|
|
|
|
|
|
||||||||||
|
Derivatives not designated as accounting hedges(4): |
||||||||||||||||||||||||||||||||
|
Interest rate contracts |
203,004 | 103,852 | 283 | 307,139 | 4,030,039 | 5,682,322 | 1,077,710 | 10,790,071 | ||||||||||||||||||||||||
|
Credit contracts |
19,942 | 3,723 | — | 23,665 | 562,027 | 131,388 | — | 693,415 | ||||||||||||||||||||||||
|
Foreign exchange contracts |
65,034 | 232 | 22 | 65,288 | 1,868,015 | 13,322 | 2,655 | 1,883,992 | ||||||||||||||||||||||||
|
Equity contracts |
25,708 | — | 20,424 | 46,132 | 332,734 | — | 229,266 | 562,000 | ||||||||||||||||||||||||
|
Commodity contracts |
10,864 | — | 3,887 | 14,751 | 59,169 | — | 62,974 | 122,143 | ||||||||||||||||||||||||
|
Other |
43 | — | — | 43 | 4,114 | — | — | 4,114 | ||||||||||||||||||||||||
|
|
|
|
|
|
|
|
|
|
|
|
|
|
|
|
|
|
|
|
|
|
|
|
||||||||||
|
Total derivatives not designated as accounting hedges |
324,595 | 107,807 | 24,616 | 457,018 | 6,856,098 | 5,827,032 | 1,372,605 | 14,055,735 | ||||||||||||||||||||||||
|
|
|
|
|
|
|
|
|
|
|
|
|
|
|
|
|
|
|
|
|
|
|
|
||||||||||
|
Total gross derivatives(2) |
$ | 324,671 | $ | 108,063 | $ | 24,616 | $ | 457,350 | $ | 6,864,262 | $ | 5,837,356 | $ | 1,372,605 | $ | 14,074,223 | ||||||||||||||||
|
|
|
|
|
|
|
|
|
|
|
|
|
|||||||||||||||||||||
|
Amounts offset: |
||||||||||||||||||||||||||||||||
|
Counterparty netting |
(265,707) | (104,294 | ) | (21,592 | ) | (391,593 | ) | |||||||||||||||||||||||||
|
Cash collateral netting |
(33,332) | (2,951 | ) | — | (36,283 | ) | ||||||||||||||||||||||||||
|
|
|
|
|
|
|
|
|
|
|
|
||||||||||||||||||||||
|
Total derivative liabilities at fair value included in Trading liabilities |
$ | 25,632 | $ | 818 | $ | 3,024 | $ | 29,474 | ||||||||||||||||||||||||
|
|
|
|
|
|
|
|
|
|
|
|
||||||||||||||||||||||
|
Amounts not offset(3): |
||||||||||||||||||||||||||||||||
|
Financial instruments collateral |
(5,384) | — | (405 | ) | (5,789 | ) | ||||||||||||||||||||||||||
|
Other cash collateral |
(5) | — | — | (5 | ) | |||||||||||||||||||||||||||
|
|
|
|
|
|
|
|
|
|
|
|
||||||||||||||||||||||
|
Net exposure |
$ | 20,243 | $ | 818 | $ | 2,619 | $ | 23,680 | ||||||||||||||||||||||||
|
|
|
|
|
|
|
|
|
|
|
|
||||||||||||||||||||||
OTC—Over-the-counter
| (1) |
Notional amounts include gross notionals related to open long and short futures contracts of $1,300.0 billion and $372.8 billion, respectively. The unsettled fair value on these futures contracts (excluded from this table) of $1,631 million and $153 million is included in Customer and other receivables and Customer and other payables, respectively, in the consolidated balance sheets. |
| (2) |
Amounts include transactions which are either not subject to master netting agreements or collateral agreements or are subject to such agreements but the Firm has not determined the agreements to be legally enforceable as follows: $4.8 billion of derivative assets and $6.3 billion of derivative liabilities at June 30, 2016, and $4.2 billion of derivative assets and $5.2 billion of derivative liabilities at December 31, 2015. |
| (3) |
Amounts relate to master netting agreements and collateral agreements that have been determined by the Firm to be legally enforceable in the event of default but where certain other criteria are not met in accordance with applicable offsetting accounting guidance. |
| (4) |
Notional amounts include gross notionals related to open long and short futures contracts of $1,009.5 billion and $653.0 billion, respectively. The unsettled fair value on these futures contracts (excluded from this table) of $1,145 million and $437 million is included in Customer and other receivables and Customer and other payables, respectively, in the consolidated balance sheets. |
| 29 |
|
Table of Contents
MORGAN STANLEY
NOTES TO CONSOLIDATED FINANCIAL STATEMENTS (Unaudited)—(Continued)
Gains (Losses) on Trading Instruments
The following table summarizes gains and losses included in Trading revenues in the consolidated statements of income from trading activities. These activities include revenues related to derivative and non-derivative financial instruments. The Firm generally utilizes financial instruments across a variety of product types in connection with their market-making and related risk management strategies. Accordingly, the trading revenues presented in the following table are not representative of the manner in which the Firm manages its business activities and are prepared in a manner similar to the presentation of trading revenues for regulatory reporting purposes.
| Gains (Losses) Recognized in Trading Revenues | ||||||||||||||||
|
Three Months Ended
June 30, |
Six Months Ended
June 30, |
|||||||||||||||
|
Product Type |
2016 | 2015 | 2016 | 2015 | ||||||||||||
| (dollars in millions) | ||||||||||||||||
|
Interest rate contracts |
$ | 320 | $ | 355 | $ | 626 | $ | 925 | ||||||||
|
Foreign exchange contracts |
362 | 170 | 599 | 515 | ||||||||||||
|
Equity security and index contracts(1) |
1,615 | 1,746 | 2,945 | 3,341 | ||||||||||||
|
Commodity and other contracts(2) |
20 | 140 | (124 | ) | 816 | |||||||||||
|
Credit contracts |
429 | 380 | 765 | 719 | ||||||||||||
|
|
|
|
|
|
|
|
|
|
|
|
|
|||||
|
Subtotal |
$ | 2,746 | $ | 2,791 | $ | 4,811 | $ | 6,316 | ||||||||
|
Debt valuation adjustments(3) |
— | 182 | — | 307 | ||||||||||||
|
|
|
|
|
|
|
|
|
|
|
|
|
|||||
|
Total trading revenue |
$ | 2,746 | $ | 2,973 | $ | 4,811 | $ | 6,623 | ||||||||
|
|
|
|
|
|
|
|
|
|
|
|
|
|||||
| (1) |
Dividend income is included within equity security and index contracts. |
| (2) |
Other contracts represent contracts not reported as interest rate, foreign exchange, equity security and index or credit contracts. |
| (3) |
In accordance with the early adoption of a provision of the accounting update Recognition and Measurement of Financial Assets and Financial Liabilities , unrealized DVA gains (losses) in the current quarter and current year period are recorded within OCI in the consolidated statements of comprehensive income. In the prior year quarter and prior year period, the DVA gains (losses) were recorded within Trading revenues in the consolidated statements of income. See Notes 2 and 14 for further information. |
OTC Derivative Products—Trading Assets
Counterparty Credit Rating and Remaining Maturity of OTC Derivative Assets
| Fair Value at June 30, 2016(1) | ||||||||||||||||||||||||||||
|
Contractual Years to Maturity |
Cross-Maturity
and Cash Collateral Netting(3) |
Net Exposure
Post-cash Collateral |
Net Exposure
Post- collateral(4) |
|||||||||||||||||||||||||
|
Credit Rating(2) |
Less than 1 | 1 - 3 | 3 - 5 | Over 5 | ||||||||||||||||||||||||
| (dollars in millions) | ||||||||||||||||||||||||||||
|
AAA |
$ | 137 | $ | 396 | $ | 1,312 | $ | 4,360 | $ | (4,953) | $ | 1,252 | $ | 1,175 | ||||||||||||||
|
AA |
3,156 | 1,502 | 1,814 | 12,226 | (12,717) | 5,981 | 3,771 | |||||||||||||||||||||
|
A |
11,078 | 7,607 | 5,336 | 28,058 | (38,694) | 13,385 | 7,784 | |||||||||||||||||||||
|
BBB |
5,794 | 4,489 | 2,622 | 15,861 | (19,993) | 8,773 | 6,808 | |||||||||||||||||||||
|
Non-investment grade |
3,923 | 2,505 | 996 | 5,370 | (7,514) | 5,280 | 3,122 | |||||||||||||||||||||
|
|
|
|
|
|
|
|
|
|
|
|
|
|
|
|
|
|
|
|
|
|||||||||
|
Total |
$ | 24,088 | $ | 16,499 | $ | 12,080 | $ | 65,875 | $ | (83,871) | $ | 34,671 | $ | 22,660 | ||||||||||||||
|
|
|
|
|
|
|
|
|
|
|
|
|
|
|
|
|
|
|
|
|
|||||||||
|
|
30 |
Table of Contents
MORGAN STANLEY
NOTES TO CONSOLIDATED FINANCIAL STATEMENTS (Unaudited)—(Continued)
| Fair Value at December 31, 2015(1) | ||||||||||||||||||||||||||||
|
Contractual Years to Maturity |
Cross-Maturity
and Cash Collateral Netting(3) |
Net Exposure
Post-cash Collateral |
Net Exposure
Post- collateral(4) |
|||||||||||||||||||||||||
|
Credit Rating(2) |
Less than 1 | 1-3 | 3-5 | Over 5 | ||||||||||||||||||||||||
| (dollars in millions) | ||||||||||||||||||||||||||||
|
AAA |
$ | 203 | $ | 453 | $ | 827 | $ | 3,665 | $ | (4,319) | $ | 829 | $ | 715 | ||||||||||||||
|
AA |
2,689 | 2,000 | 1,876 | 9,223 | (10,981) | 4,807 | 2,361 | |||||||||||||||||||||
|
A |
9,748 | 8,191 | 4,774 | 20,918 | (34,916) | 8,715 | 5,448 | |||||||||||||||||||||
|
BBB |
3,614 | 4,863 | 1,948 | 11,801 | (15,086) | 7,140 | 4,934 | |||||||||||||||||||||
|
Non-investment grade |
3,982 | 2,333 | 1,157 | 3,567 | (6,716) | 4,323 | 3,166 | |||||||||||||||||||||
|
|
|
|
|
|
|
|
|
|
|
|
|
|
|
|||||||||||||||
|
Total |
$ | 20,236 | $ | 17,840 | $ | 10,582 | $ | 49,174 | $ | (72,018) | $ | 25,814 | $ | 16,624 | ||||||||||||||
|
|
|
|
|
|
|
|
|
|
|
|
|
|
|
|||||||||||||||
| (1) |
Fair values shown represent the Firm’s net exposure to counterparties related to its OTC derivative products. |
| (2) |
Obligor credit ratings are determined by the Credit Risk Management Department. |
| (3) |
Amounts represent the netting of receivable balances with payable balances for the same counterparty across maturity categories. Receivable and payable balances with the same counterparty in the same maturity category are netted within such maturity category, where appropriate. Cash collateral received is netted on a counterparty basis, provided legal right of offset exists. |
| (4) |
Fair value is shown, net of collateral received (primarily cash and U.S. government and agency securities). |
| 31 |
|
Table of Contents
MORGAN STANLEY
NOTES TO CONSOLIDATED FINANCIAL STATEMENTS (Unaudited)—(Continued)
Notional and Fair Value of Protection Sold and Protection Purchased through Credit Default Swaps
| At June 30, 2016 | ||||||||||||||||
| Protection Sold | Protection Purchased | |||||||||||||||
| Notional |
Fair Value
(Asset)/Liability |
Notional |
Fair Value
(Asset)/Liability |
|||||||||||||
| (dollars in millions) | ||||||||||||||||
|
Single name credit default swaps |
$ | 347,624 | $ | 463 | $ | 338,727 | $ | (453 | ) | |||||||
|
Index and basket credit default swaps |
176,009 | 726 | 143,734 | (771 | ) | |||||||||||
|
Tranched index and basket credit default swaps |
43,657 | (793 | ) | 123,399 | 2,188 | |||||||||||
|
|
|
|
|
|
|
|
|
|
|
|
|
|||||
|
Total |
$ | 567,290 | $ | 396 | $ | 605,860 | $ | 964 | ||||||||
|
|
|
|
|
|
|
|
|
|
|
|
|
|||||
| At December 31, 2015 | ||||||||||||||||
| Protection Sold | Protection Purchased | |||||||||||||||
| Notional |
Fair Value
(Asset)/Liability |
Notional |
Fair Value
(Asset)/Liability |
|||||||||||||
| (dollars in millions) | ||||||||||||||||
|
Single name credit default swaps |
$ | 420,806 | $ | 1,980 | $ | 405,361 | $ | (2,079 | ) | |||||||
|
Index and basket credit default swaps |
199,688 | (102 | ) | 173,936 | (82 | ) | ||||||||||
|
Tranched index and basket credit default swaps |
69,025 | (1,093 | ) | 149,631 | 2,122 | |||||||||||
|
|
|
|
|
|
|
|
|
|
|
|
|
|||||
|
Total |
$ | 689,519 | $ | 785 | $ | 728,928 | $ | (39 | ) | |||||||
|
|
|
|
|
|
|
|
|
|
|
|
|
|||||
Credit Ratings of Reference Obligation and Maturities of Credit Protection Sold
| At June 30, 2016 | ||||||||||||||||||||||||
| Maximum Potential Payout/Notional |
Fair Value
(Asset)/ Liability(1) |
|||||||||||||||||||||||
| Years to Maturity | ||||||||||||||||||||||||
| Less than 1 | 1-3 | 3-5 | Over 5 | Total | ||||||||||||||||||||
| (dollars in millions) | ||||||||||||||||||||||||
|
Single name credit default swaps(2): |
||||||||||||||||||||||||
|
Investment grade |
$ | 92,734 | $ | 94,348 | $ | 48,928 | $ | 11,097 | $ | 247,107 | $ | (1,079 | ) | |||||||||||
|
Non-investment grade |
42,370 | 38,348 | 18,381 | 1,418 | 100,517 | 1,542 | ||||||||||||||||||
|
|
|
|
|
|
|
|
|
|
|
|
|
|
|
|
|
|
|
|||||||
|
Total |
$ | 135,104 | $ | 132,696 | $ | 67,309 | $ | 12,515 | $ | 347,624 | $ | 463 | ||||||||||||
|
|
|
|
|
|
|
|
|
|
|
|
|
|
|
|
|
|
|
|||||||
|
Index and basket credit default swaps(2): |
||||||||||||||||||||||||
|
Investment grade |
$ | 24,110 | $ | 39,948 | $ | 42,887 | $ | 4,060 | $ | 111,005 | $ | (1,222 | ) | |||||||||||
|
Non-investment grade |
51,914 | 28,315 | 13,761 | 14,671 | 108,661 | 1,155 | ||||||||||||||||||
|
|
|
|
|
|
|
|
|
|
|
|
|
|
|
|
|
|
|
|||||||
|
Total |
$ | 76,024 | $ | 68,263 | $ | 56,648 | $ | 18,731 | $ | 219,666 | $ | (67 | ) | |||||||||||
|
|
|
|
|
|
|
|
|
|
|
|
|
|
|
|
|
|
|
|||||||
|
Total credit default swaps sold |
$ | 211,128 | $ | 200,959 | $ | 123,957 | $ | 31,246 | $ | 567,290 | $ | 396 | ||||||||||||
|
|
|
|
|
|
|
|
|
|
|
|
|
|
|
|
|
|
|
|||||||
|
Other credit contracts |
43 | 25 | — | 276 | 344 | (17 | ) | |||||||||||||||||
|
|
|
|
|
|
|
|
|
|
|
|
|
|
|
|
|
|
|
|||||||
|
Total credit derivatives and other credit contracts |
$ | 211,171 | $ | 200,984 | $ | 123,957 | $ | 31,522 | $ | 567,634 | $ | 379 | ||||||||||||
|
|
|
|
|
|
|
|
|
|
|
|
|
|
|
|
|
|
|
|||||||
|
|
32 |
Table of Contents
MORGAN STANLEY
NOTES TO CONSOLIDATED FINANCIAL STATEMENTS (Unaudited)—(Continued)
| At December 31, 2015 | ||||||||||||||||||||||||
| Maximum Potential Payout/Notional |
Fair Value
(Asset)/ Liability(1) |
|||||||||||||||||||||||
| Years to Maturity | ||||||||||||||||||||||||
| Less than 1 | 1-3 | 3-5 | Over 5 | Total | ||||||||||||||||||||
| (dollars in millions) | ||||||||||||||||||||||||
|
Single name credit default swaps(2): |
||||||||||||||||||||||||
|
Investment grade |
$ | 84,543 | $ | 138,467 | $ | 63,754 | $ | 12,906 | $ | 299,670 | $ | (1,831) | ||||||||||||
|
Non-investment grade |
38,054 | 56,261 | 24,432 | 2,389 | 121,136 | 3,811 | ||||||||||||||||||
|
|
|
|
|
|
|
|
|
|
|
|
|
|||||||||||||
|
Total |
$ | 122,597 | $ | 194,728 | $ | 88,186 | $ | 15,295 | $ | 420,806 | $ | 1,980 | ||||||||||||
|
|
|
|
|
|
|
|
|
|
|
|
|
|||||||||||||
|
Index and basket credit default swaps(2): |
||||||||||||||||||||||||
|
Investment grade |
$ | 33,507 | $ | 59,403 | $ | 45,505 | $ | 5,327 | $ | 143,742 | $ | (1,977) | ||||||||||||
|
Non-investment grade |
52,590 | 43,899 | 15,480 | 13,002 | 124,971 | 782 | ||||||||||||||||||
|
|
|
|
|
|
|
|
|
|
|
|
|
|||||||||||||
|
Total |
$ | 86,097 | $ | 103,302 | $ | 60,985 | $ | 18,329 | $ | 268,713 | $ | (1,195) | ||||||||||||
|
|
|
|
|
|
|
|
|
|
|
|
|
|||||||||||||
|
Total credit default swaps sold |
$ | 208,694 | $ | 298,030 | $ | 149,171 | $ | 33,624 | $ | 689,519 | $ | 785 | ||||||||||||
|
|
|
|
|
|
|
|
|
|
|
|
|
|||||||||||||
|
Other credit contracts |
19 | 107 | 2 | 332 | 460 | (24) | ||||||||||||||||||
|
|
|
|
|
|
|
|
|
|
|
|
|
|||||||||||||
|
Total credit derivatives and other credit contracts |
$ | 208,713 | $ | 298,137 | $ | 149,173 | $ | 33,956 | $ | 689,979 | $ | 761 | ||||||||||||
|
|
|
|
|
|
|
|
|
|
|
|
|
|||||||||||||
| (1) |
Fair value amounts are shown on a gross basis prior to cash collateral or counterparty netting. |
| (2) |
In order to provide an indication of the current payment status or performance risk of the CDS, a breakdown of CDS based on the Firm’s internal credit ratings by investment grade and non-investment grade is provided. Internal credit ratings serve as the Credit Risk Management Department’s assessment of credit risk, and the basis for a comprehensive credit limits framework used to control credit risk. The Firm uses quantitative models and judgment to estimate the various risk parameters related to each obligor. Internal ratings procedures, methodologies, and models are all independently and formally governed, and models and methodologies are reviewed by a separate model risk management oversight function. |
| 33 |
|
Table of Contents
MORGAN STANLEY
NOTES TO CONSOLIDATED FINANCIAL STATEMENTS (Unaudited)—(Continued)
| 5. |
The following tables present information about the Firm’s AFS securities, which are carried at fair value, and HTM securities, which are carried at amortized cost. The net unrealized gains or losses on AFS securities are reported on an after-tax basis as a component of AOCI.
AFS and HTM Securities
| At June 30, 2016 | ||||||||||||||||
|
Amortized
Cost |
Gross
Unrealized Gains |
Gross
Unrealized Losses |
Fair Value | |||||||||||||
| (dollars in millions) | ||||||||||||||||
|
AFS debt securities: |
||||||||||||||||
|
U.S. government and agency securities: |
||||||||||||||||
|
U.S. Treasury securities |
$ | 29,923 | $ | 213 | $ | 8 | $ | 30,128 | ||||||||
|
U.S. agency securities(1) |
23,221 | 208 | 22 | 23,407 | ||||||||||||
|
|
|
|
|
|
|
|
|
|||||||||
|
Total U.S. government and agency securities |
53,144 | 421 | 30 | 53,535 | ||||||||||||
|
Corporate and other debt: |
||||||||||||||||
|
Commercial mortgage-backed securities: |
||||||||||||||||
|
Agency |
2,139 | 5 | 31 | 2,113 | ||||||||||||
|
Non-agency |
2,159 | 36 | 10 | 2,185 | ||||||||||||
|
Auto loan asset-backed securities |
2,071 | 7 | — | 2,078 | ||||||||||||
|
Corporate bonds |
4,009 | 66 | 2 | 4,073 | ||||||||||||
|
Collateralized loan obligations |
502 | — | 7 | 495 | ||||||||||||
|
FFELP student loan asset-backed securities(2) |
3,345 | — | 105 | 3,240 | ||||||||||||
|
|
|
|
|
|
|
|
|
|||||||||
|
Total corporate and other debt |
14,225 | 114 | 155 | 14,184 | ||||||||||||
|
|
|
|
|
|
|
|
|
|||||||||
|
Total AFS debt securities |
67,369 | 535 | 185 | 67,719 | ||||||||||||
|
|
|
|
|
|
|
|
|
|||||||||
|
AFS equity securities |
15 | — | 8 | 7 | ||||||||||||
|
|
|
|
|
|
|
|
|
|||||||||
|
Total AFS securities |
67,384 | 535 | 193 | 67,726 | ||||||||||||
|
HTM securities: |
||||||||||||||||
|
U.S. government securities: |
||||||||||||||||
|
U.S. Treasury securities |
3,705 | 53 | — | 3,758 | ||||||||||||
|
U.S. agency securities(1) |
8,713 | 96 | — | 8,809 | ||||||||||||
|
|
|
|
|
|
|
|
|
|||||||||
|
Total HTM securities |
12,418 | 149 | — | 12,567 | ||||||||||||
|
|
|
|
|
|
|
|
|
|||||||||
|
Total Investment securities |
$ | 79,802 | $ | 684 | $ | 193 | $ | 80,293 | ||||||||
|
|
|
|
|
|
|
|
|
|||||||||
|
|
34 |
Table of Contents
MORGAN STANLEY
NOTES TO CONSOLIDATED FINANCIAL STATEMENTS (Unaudited)—(Continued)
| At December 31, 2015 | ||||||||||||||||
|
Amortized
Cost |
Gross
Unrealized Gains |
Gross
Unrealized Losses |
Fair Value | |||||||||||||
| (dollars in millions) | ||||||||||||||||
|
AFS debt securities: |
||||||||||||||||
|
U.S. government and agency securities: |
||||||||||||||||
|
U.S. Treasury securities |
$ | 31,555 | $ | 5 | $ | 143 | $ | 31,417 | ||||||||
|
U.S. agency securities(1) |
21,103 | 29 | 156 | 20,976 | ||||||||||||
|
|
|
|
|
|
|
|
|
|||||||||
|
Total U.S. government and agency securities |
52,658 | 34 | 299 | 52,393 | ||||||||||||
|
Corporate and other debt: |
||||||||||||||||
|
Commercial mortgage-backed securities: |
||||||||||||||||
|
Agency |
1,906 | 1 | 60 | 1,847 | ||||||||||||
|
Non-agency |
2,220 | 3 | 25 | 2,198 | ||||||||||||
|
Auto loan asset-backed securities |
2,556 | — | 9 | 2,547 | ||||||||||||
|
Corporate bonds |
3,780 | 5 | 30 | 3,755 | ||||||||||||
|
Collateralized loan obligations |
502 | — | 7 | 495 | ||||||||||||
|
FFELP student loan asset-backed securities(2) |
3,632 | — | 115 | 3,517 | ||||||||||||
|
|
|
|
|
|
|
|
|
|||||||||
|
Total corporate and other debt |
14,596 | 9 | 246 | 14,359 | ||||||||||||
|
|
|
|
|
|
|
|
|
|||||||||
|
Total AFS debt securities |
67,254 | 43 | 545 | 66,752 | ||||||||||||
|
|
|
|
|
|
|
|
|
|||||||||
|
AFS equity securities |
15 | — | 8 | 7 | ||||||||||||
|
|
|
|
|
|
|
|
|
|||||||||
|
Total AFS securities |
67,269 | 43 | 553 | 66,759 | ||||||||||||
|
HTM securities: |
||||||||||||||||
|
U.S. government securities: |
||||||||||||||||
|
U.S. Treasury securities |
1,001 | — | 3 | 998 | ||||||||||||
|
U.S. agency securities(1) |
4,223 | 1 | 34 | 4,190 | ||||||||||||
|
|
|
|
|
|
|
|
|
|||||||||
|
Total HTM securities |
5,224 | 1 | 37 | 5,188 | ||||||||||||
|
|
|
|
|
|
|
|
|
|||||||||
|
Total Investment securities |
$ | 72,493 | $ | 44 | $ | 590 | $ | 71,947 | ||||||||
|
|
|
|
|
|
|
|
|
|||||||||
| (1) |
U.S. agency securities consist mainly of agency-issued debt, agency mortgage pass-through pool securities and collateralized mortgage obligations. |
| (2) |
FFELP—Federal Family Education Loan Program. Amounts are backed by a guarantee from the U.S. Department of Education of at least 95% of the principal balance and interest on such loans. |
| 35 |
|
Table of Contents
MORGAN STANLEY
NOTES TO CONSOLIDATED FINANCIAL STATEMENTS (Unaudited)—(Continued)
Investment Securities in an Unrealized Loss Position
| At June 30, 2016 | ||||||||||||||||||||||||
| Less than 12 Months | 12 Months or Longer | Total | ||||||||||||||||||||||
| Fair Value |
Gross
Unrealized Losses |
Fair
Value |
Gross
Unrealized Losses |
Fair
Value |
Gross
Unrealized Losses |
|||||||||||||||||||
| (dollars in millions) | ||||||||||||||||||||||||
|
AFS debt securities: |
||||||||||||||||||||||||
|
U.S. government and agency securities: |
||||||||||||||||||||||||
|
U.S. Treasury securities |
$ | 3,028 | $ | 8 | $ | — | $ | — | $ | 3,028 | $ | 8 | ||||||||||||
|
U.S. agency securities |
5,731 | 10 | 1,225 | 12 | 6,956 | 22 | ||||||||||||||||||
|
|
|
|
|
|
|
|
|
|
|
|
|
|||||||||||||
|
Total U.S. government and agency securities |
8,759 | 18 | 1,225 | 12 | 9,984 | 30 | ||||||||||||||||||
|
Corporate and other debt: |
||||||||||||||||||||||||
|
Commercial mortgage-backed securities: |
||||||||||||||||||||||||
|
Agency |
31 | — | 1,181 | 31 | 1,212 | 31 | ||||||||||||||||||
|
Non-agency |
216 | — | 625 | 10 | 841 | 10 | ||||||||||||||||||
|
Auto loan asset-backed securities |
83 | — | 204 | — | 287 | — | ||||||||||||||||||
|
Corporate bonds |
172 | 1 | 175 | 1 | 347 | 2 | ||||||||||||||||||
|
Collateralized loan obligations |
— | — | 494 | 7 | 494 | 7 | ||||||||||||||||||
|
FFELP student loan asset-backed securities |
583 | 12 | 2,637 | 93 | 3,220 | 105 | ||||||||||||||||||
|
|
|
|
|
|
|
|
|
|
|
|
|
|||||||||||||
|
Total corporate and other debt |
1,085 | 13 | 5,316 | 142 | 6,401 | 155 | ||||||||||||||||||
|
|
|
|
|
|
|
|
|
|
|
|
|
|||||||||||||
|
Total AFS debt securities |
9,844 | 31 | 6,541 | 154 | 16,385 | 185 | ||||||||||||||||||
|
|
|
|
|
|
|
|
|
|
|
|
|
|||||||||||||
|
AFS equity securities |
7 | 8 | — | — | 7 | 8 | ||||||||||||||||||
|
|
|
|
|
|
|
|
|
|
|
|
|
|||||||||||||
|
Total AFS securities |
9,851 | 39 | 6,541 | 154 | 16,392 | 193 | ||||||||||||||||||
|
|
|
|
|
|
|
|
|
|
|
|
|
|||||||||||||
|
HTM securities: |
||||||||||||||||||||||||
|
U.S. government and agency securities: |
||||||||||||||||||||||||
|
U.S. agency securities |
72 | — | — | — | 72 | — | ||||||||||||||||||
|
|
|
|
|
|
|
|
|
|
|
|
|
|||||||||||||
|
Total HTM securities |
72 | — | — | — | 72 | — | ||||||||||||||||||
|
|
|
|
|
|
|
|
|
|
|
|
|
|||||||||||||
|
Total Investment securities |
$ | 9,923 | $ | 39 | $ | 6,541 | $ | 154 | $ | 16,464 | $ | 193 | ||||||||||||
|
|
|
|
|
|
|
|
|
|
|
|
|
|||||||||||||
|
|
36 |
Table of Contents
MORGAN STANLEY
NOTES TO CONSOLIDATED FINANCIAL STATEMENTS (Unaudited)—(Continued)
| At December 31, 2015 | ||||||||||||||||||||||||
| Less than 12 Months | 12 Months or Longer | Total | ||||||||||||||||||||||
| Fair Value |
Gross
Unrealized Losses |
Fair Value |
Gross
Unrealized Losses |
Fair Value |
Gross
Unrealized Losses |
|||||||||||||||||||
| (dollars in millions) | ||||||||||||||||||||||||
|
AFS debt securities: |
||||||||||||||||||||||||
|
U.S. government and agency securities: |
||||||||||||||||||||||||
|
U.S. Treasury securities |
$ | 25,994 | $ | 126 | $ | 2,177 | $ | 17 | $ | 28,171 | $ | 143 | ||||||||||||
|
U.S. agency securities |
14,242 | 135 | 639 | 21 | 14,881 | 156 | ||||||||||||||||||
|
|
|
|
|
|
|
|
|
|
|
|
|
|||||||||||||
|
Total U.S. government and agency securities |
40,236 | 261 | 2,816 | 38 | 43,052 | 299 | ||||||||||||||||||
|
Corporate and other debt: |
||||||||||||||||||||||||
|
Commercial mortgage-backed securities: |
||||||||||||||||||||||||
|
Agency |
1,185 | 44 | 422 | 16 | 1,607 | 60 | ||||||||||||||||||
|
Non-agency |
1,479 | 21 | 305 | 4 | 1,784 | 25 | ||||||||||||||||||
|
Auto loan asset-backed securities |
1,644 | 7 | 881 | 2 | 2,525 | 9 | ||||||||||||||||||
|
Corporate bonds |
2,149 | 19 | 525 | 11 | 2,674 | 30 | ||||||||||||||||||
|
Collateralized loan obligations |
352 | 5 | 143 | 2 | 495 | 7 | ||||||||||||||||||
|
FFELP student loan asset-backed securities |
2,558 | 79 | 929 | 36 | 3,487 | 115 | ||||||||||||||||||
|
|
|
|
|
|
|
|
|
|
|
|
|
|||||||||||||
|
Total corporate and other debt |
9,367 | 175 | 3,205 | 71 | 12,572 | 246 | ||||||||||||||||||
|
|
|
|
|
|
|
|
|
|
|
|
|
|||||||||||||
|
Total AFS debt securities |
49,603 | 436 | 6,021 | 109 | 55,624 | 545 | ||||||||||||||||||
|
|
|
|
|
|
|
|
|
|
|
|
|
|||||||||||||
|
AFS equity securities |
7 | 8 | — | — | 7 | 8 | ||||||||||||||||||
|
|
|
|
|
|
|
|
|
|
|
|
|
|||||||||||||
|
Total AFS securities |
49,610 | 444 | 6,021 | 109 | 55,631 | 553 | ||||||||||||||||||
|
|
|
|
|
|
|
|
|
|
|
|
|
|||||||||||||
|
HTM securities: |
||||||||||||||||||||||||
|
U.S. government and agency securities: |
||||||||||||||||||||||||
|
U.S. Treasury securities |
898 | 3 | — | — | 898 | 3 | ||||||||||||||||||
|
U.S. agency securities |
3,677 | 34 | — | — | 3,677 | 34 | ||||||||||||||||||
|
|
|
|
|
|
|
|
|
|
|
|
|
|||||||||||||
|
Total HTM securities |
4,575 | 37 | — | — | 4,575 | 37 | ||||||||||||||||||
|
|
|
|
|
|
|
|
|
|
|
|
|
|||||||||||||
|
Total Investment securities |
$ | 54,185 | $ | 481 | $ | 6,021 | $ | 109 | $ | 60,206 | $ | 590 | ||||||||||||
|
|
|
|
|
|
|
|
|
|
|
|
|
|||||||||||||
| 37 |
|
Table of Contents
MORGAN STANLEY
NOTES TO CONSOLIDATED FINANCIAL STATEMENTS (Unaudited)—(Continued)
Amortized Cost, Fair Value and Annualized Average Yield of Investment Securities by Contractual Maturity Dates
| At June 30, 2016 | ||||||||||||
| Amortized Cost | Fair Value |
Annualized
Average Yield |
||||||||||
| (dollars in millions) | ||||||||||||
|
AFS debt securities: |
||||||||||||
|
U.S. government and agency securities: |
||||||||||||
|
U.S. Treasury securities: |
||||||||||||
|
Due within 1 year |
$ | 2,698 | $ | 2,702 | 0.7% | |||||||
|
After 1 year through 5 years |
22,137 | 22,317 | 1.0% | |||||||||
|
After 5 years through 10 years |
5,088 | 5,109 | 1.4% | |||||||||
|
|
|
|
|
|||||||||
|
Total |
29,923 | 30,128 | ||||||||||
|
|
|
|
|
|||||||||
|
U.S. agency securities: |
||||||||||||
|
Due within 1 year |
200 | 200 | 0.7% | |||||||||
|
After 1 year through 5 years |
2,629 | 2,632 | 0.5% | |||||||||
|
After 5 years through 10 years |
1,327 | 1,357 | 1.9% | |||||||||
|
After 10 years |
19,065 | 19,218 | 1.6% | |||||||||
|
|
|
|
|
|||||||||
|
Total |
23,221 | 23,407 | ||||||||||
|
|
|
|
|
|||||||||
|
Total U.S. government and agency securities |
53,144 | 53,535 | 1.2% | |||||||||
|
|
|
|
|
|||||||||
|
Corporate and other debt: |
||||||||||||
|
Commercial mortgage-backed securities: |
||||||||||||
|
Agency: |
||||||||||||
|
Due within 1 year |
73 | 74 | 0.8% | |||||||||
|
After 1 year through 5 years |
404 | 406 | 1.0% | |||||||||
|
After 5 years through 10 years |
639 | 641 | 1.3% | |||||||||
|
After 10 years |
1,023 | 992 | 1.6% | |||||||||
|
|
|
|
|
|||||||||
|
Total |
2,139 | 2,113 | ||||||||||
|
|
|
|
|
|||||||||
|
Non-agency: |
||||||||||||
|
After 10 years |
2,159 | 2,185 | 1.9% | |||||||||
|
|
|
|
|
|||||||||
|
Total |
2,159 | 2,185 | ||||||||||
|
|
|
|
|
|||||||||
|
Auto loan asset-backed securities: |
||||||||||||
|
Due within 1 year |
4 | 4 | 0.9% | |||||||||
|
After 1 year through 5 years |
1,902 | 1,909 | 1.3% | |||||||||
|
After 5 years through 10 years |
165 | 165 | 1.6% | |||||||||
|
|
|
|
|
|||||||||
|
Total |
2,071 | 2,078 | ||||||||||
|
|
|
|
|
|||||||||
|
Corporate bonds: |
||||||||||||
|
Due within 1 year |
638 | 640 | 1.3% | |||||||||
|
After 1 year through 5 years |
2,655 | 2,695 | 1.8% | |||||||||
|
After 5 years through 10 years |
716 | 738 | 2.6% | |||||||||
|
|
|
|
|
|||||||||
|
Total |
4,009 | 4,073 | ||||||||||
|
|
|
|
|
|||||||||
|
Collateralized loan obligations: |
||||||||||||
|
After 5 years through 10 years |
502 | 495 | 1.5% | |||||||||
|
|
|
|
|
|||||||||
|
Total |
502 | 495 | ||||||||||
|
|
|
|
|
|||||||||
|
|
38 |
Table of Contents
MORGAN STANLEY
NOTES TO CONSOLIDATED FINANCIAL STATEMENTS (Unaudited)—(Continued)
| At June 30, 2016 | ||||||||||||
| Amortized Cost | Fair Value |
Annualized
Average Yield |
||||||||||
| (dollars in millions) | ||||||||||||
|
FFELP student loan asset-backed securities: |
||||||||||||
|
After 1 year through 5 years |
59 | 59 | 0.6% | |||||||||
|
After 5 years through 10 years |
922 | 897 | 0.9% | |||||||||
|
After 10 years |
2,364 | 2,284 | 0.9% | |||||||||
|
|
|
|
|
|||||||||
|
Total |
3,345 | 3,240 | ||||||||||
|
|
|
|
|
|||||||||
|
Total corporate and other debt |
14,225 | 14,184 | 1.5% | |||||||||
|
|
|
|
|
|||||||||
|
Total AFS debt securities |
67,369 | 67,719 | 1.3% | |||||||||
|
|
|
|
|
|||||||||
|
AFS equity securities |
15 | 7 | — % | |||||||||
|
|
|
|
|
|||||||||
|
Total AFS securities |
67,384 | 67,726 | 1.3% | |||||||||
|
|
|
|
|
|||||||||
|
HTM securities: |
||||||||||||
|
U.S. government securities: |
||||||||||||
|
U.S. Treasury securities: |
||||||||||||
|
Due within 1 year |
200 | 201 | 0.7% | |||||||||
|
After 1 year through 5 years |
1,408 | 1,422 | 1.1% | |||||||||
|
After 5 years through 10 years |
1,693 | 1,719 | 1.7% | |||||||||
|
After 10 years |
404 | 416 | 2.5% | |||||||||
|
|
|
|
|
|||||||||
|
Total |
3,705 | 3,758 | ||||||||||
|
|
|
|
|
|||||||||
|
U.S. agency securities: |
||||||||||||
|
After 10 years |
8,713 | 8,809 | 2.0% | |||||||||
|
|
|
|
|
|||||||||
|
Total |
8,713 | 8,809 | ||||||||||
|
|
|
|
|
|||||||||
|
Total HTM securities |
12,418 | 12,567 | 1.8% | |||||||||
|
|
|
|
|
|||||||||
|
Total Investment securities |
$ | 79,802 | $ | 80,293 | 1.4% | |||||||
|
|
|
|
|
|||||||||
Gross Realized Gains and Gross Realized (Losses) on Sales of AFS Securities
|
Three Months Ended
June 30, |
Six Months Ended
June 30, |
|||||||||||||||
| 2016 | 2015 | 2016 | 2015 | |||||||||||||
| (dollars in millions) | ||||||||||||||||
|
Gross realized gains |
$ | 71 | $ | 40 | $ | 85 | $ | 69 | ||||||||
|
Gross realized (losses) |
(1) | (10) | (3) | (14) | ||||||||||||
|
|
|
|
|
|
|
|
|
|||||||||
|
Total |
$ | 70 | $ | 30 | $ | 82 | $ | 55 | ||||||||
|
|
|
|
|
|
|
|
|
|||||||||
Gross realized gains and losses are recognized in Other revenues in the consolidated statements of income.
| 39 |
|
Table of Contents
MORGAN STANLEY
NOTES TO CONSOLIDATED FINANCIAL STATEMENTS (Unaudited)—(Continued)
| 6. |
The Firm enters into reverse repurchase agreements, repurchase agreements, securities borrowed and securities loaned transactions to, among other things, acquire securities to cover short positions and settle other securities obligations, to accommodate customers’ needs and to finance its inventory positions. For further discussion of the Firm’s collateralized transactions, see Note 6 to the consolidated financial statements in the 2015 Form 10-K.
Offsetting of Certain Collateralized Transactions
| At June 30, 2016 | ||||||||||||||||||||
|
Gross
Amounts(1) |
Amounts
Offset |
Net Amounts
Presented |
Amounts Not
Offset(2) |
Net Exposure | ||||||||||||||||
| (dollars in millions) | ||||||||||||||||||||
|
Assets |
||||||||||||||||||||
|
Securities purchased under agreements to resell |
$ | 162,813 | $ | (65,224) | $ | 97,589 | $ | (91,746) | $ | 5,843 | ||||||||||
|
Securities borrowed |
138,436 | (7,155) | 131,281 | (124,773) | 6,508 | |||||||||||||||
|
Liabilities |
||||||||||||||||||||
|
Securities sold under agreements to repurchase |
$ | 115,552 | $ | (65,224) | $ | 50,328 | $ | (42,541) | $ | 7,787 | ||||||||||
|
Securities loaned |
24,396 | (7,155) | 17,241 | (16,724) | 517 | |||||||||||||||
| At December 31, 2015 | ||||||||||||||||||||
|
Gross
Amounts(1) |
Amounts
Offset |
Net Amounts
Presented |
Amounts Not
Offset(2) |
Net Exposure | ||||||||||||||||
| (dollars in millions) | ||||||||||||||||||||
|
Assets |
||||||||||||||||||||
|
Securities purchased under agreements to resell |
$ | 135,714 | $ | (48,057) | $ | 87,657 | $ | (84,752) | $ | 2,905 | ||||||||||
|
Securities borrowed |
147,445 | (5,029) | 142,416 | (134,250) | 8,166 | |||||||||||||||
|
Liabilities |
||||||||||||||||||||
|
Securities sold under agreements to repurchase |
$ | 84,749 | $ | (48,057) | $ | 36,692 | $ | (31,604) | $ | 5,088 | ||||||||||
|
Securities loaned |
24,387 | (5,029) | 19,358 | (18,881) | 477 | |||||||||||||||
| (1) |
Amounts include transactions which are either not subject to master netting agreements or are subject to such agreements but the Firm has not determined the agreements to be legally enforceable as follows: $5.5 billion of Securities purchased under agreements to resell, $3.7 billion of Securities borrowed, $7.2 billion of Securities sold under agreements to repurchase and $0.4 billion of Securities loaned at June 30, 2016, and $2.6 billion of Securities purchased under agreements to resell, $3.0 billion of Securities borrowed and $4.9 billion of Securities sold under agreements to repurchase at December 31, 2015. |
| (2) |
Amounts relate to master netting agreements that have been determined by the Firm to be legally enforceable in the event of default but where certain other criteria are not met in accordance with applicable offsetting accounting guidance. |
For information related to offsetting of derivatives, see Note 4.
|
|
40 |
Table of Contents
MORGAN STANLEY
NOTES TO CONSOLIDATED FINANCIAL STATEMENTS (Unaudited)—(Continued)
Secured Financing Transactions—Maturities and Collateral Pledged
Gross Secured Financing Balances by Remaining Contractual Maturity
| At June 30, 2016 | ||||||||||||||||||||
|
Overnight
and Open |
Less than
30 Days |
30-90 Days |
Over
90 Days |
Total | ||||||||||||||||
| (dollars in millions) | ||||||||||||||||||||
|
Securities sold under agreements to repurchase(1) |
$ | 38,732 | $ | 30,586 | $ | 20,309 | $ | 25,925 | $ | 115,552 | ||||||||||
|
Securities loaned(1) |
13,085 | 50 | 1,336 | 9,925 | 24,396 | |||||||||||||||
|
|
|
|
|
|
|
|
|
|
|
|
|
|
|
|
||||||
|
Gross amount of secured financing included in the offsetting disclosure |
$ | 51,817 | $ | 30,636 | $ | 21,645 | $ | 35,850 | $ | 139,948 | ||||||||||
|
Obligation to return securities received as collateral |
18,738 | — | — | — | 18,738 | |||||||||||||||
|
|
|
|
|
|
|
|
|
|
|
|
|
|
|
|
||||||
|
Total |
$ | 70,555 | $ | 30,636 | $ | 21,645 | $ | 35,850 | $ | 158,686 | ||||||||||
|
|
|
|
|
|
|
|
|
|
|
|
|
|
|
|
||||||
| At December 31, 2015 | ||||||||||||||||||||
|
Overnight
and Open |
Less than
30 Days |
30-90 Days |
Over
90 Days |
Total | ||||||||||||||||
| (dollars in millions) | ||||||||||||||||||||
|
Securities sold under agreements to repurchase(1) |
$ | 20,410 | $ | 25,245 | $ | 13,221 | $ | 25,873 | $ | 84,749 | ||||||||||
|
Securities loaned(1) |
12,247 | 478 | 2,156 | 9,506 | 24,387 | |||||||||||||||
|
|
|
|
|
|
|
|
|
|
|
|
|
|
|
|
||||||
|
Gross amount of secured financing included in the offsetting disclosure |
$ | 32,657 | $ | 25,723 | $ | 15,377 | $ | 35,379 | $ | 109,136 | ||||||||||
|
Obligation to return securities received as collateral |
19,316 | — | — | — | 19,316 | |||||||||||||||
|
|
|
|
|
|
|
|
|
|
|
|
|
|
|
|
||||||
|
Total |
$ | 51,973 | $ | 25,723 | $ | 15,377 | $ | 35,379 | $ | 128,452 | ||||||||||
|
|
|
|
|
|
|
|
|
|
|
|
|
|
|
|
||||||
| (1) |
Amounts are presented on a gross basis, prior to netting in the consolidated balance sheets. |
| 41 |
|
Table of Contents
MORGAN STANLEY
NOTES TO CONSOLIDATED FINANCIAL STATEMENTS (Unaudited)—(Continued)
Gross Secured Financing Balances by Class of Collateral Pledged
|
At
June 30, 2016 |
At
December 31, 2015 |
|||||||
| (dollars in millions) | ||||||||
|
Securities sold under agreements to repurchase(1) |
||||||||
|
U.S. government and agency securities |
$ | 39,920 | $ | 36,609 | ||||
|
State and municipal securities |
2,104 | 173 | ||||||
|
Other sovereign government obligations |
42,329 | 24,820 | ||||||
|
Asset-backed securities |
745 | 441 | ||||||
|
Corporate and other debt |
8,638 | 4,020 | ||||||
|
Corporate equities |
21,515 | 18,473 | ||||||
|
Other |
301 | 213 | ||||||
|
|
|
|
|
|
|
|||
|
Total securities sold under agreements to repurchase |
$ | 115,552 | $ | 84,749 | ||||
|
|
|
|
|
|
|
|||
|
Securities loaned(1) |
||||||||
|
U.S. government and agency securities |
$ | 182 | $ | — | ||||
|
Other sovereign government obligations |
7,454 | 7,336 | ||||||
|
Corporate and other debt |
123 | 71 | ||||||
|
Corporate equities |
16,602 | 16,972 | ||||||
|
Other |
35 | 8 | ||||||
|
|
|
|
|
|
|
|||
|
Total securities loaned |
$ | 24,396 | $ | 24,387 | ||||
|
|
|
|
|
|
|
|||
|
Gross amount of secured financing included in the offsetting disclosure |
$ | 139,948 | $ | 109,136 | ||||
|
|
|
|
|
|
|
|||
|
Obligation to return securities received as collateral |
||||||||
|
Corporate and other debt |
— | 3 | ||||||
|
Corporate equities |
18,737 | 19,313 | ||||||
|
Other |
1 | — | ||||||
|
|
|
|
|
|
|
|||
|
Total obligation to return securities received as collateral |
$ | 18,738 | $ | 19,316 | ||||
|
|
|
|
|
|
|
|||
|
Total |
$ | 158,686 | $ | 128,452 | ||||
|
|
|
|
|
|
|
|||
| (1) |
Amounts are presented on a gross basis, prior to netting in the consolidated balance sheets. |
|
|
42 |
Table of Contents
MORGAN STANLEY
NOTES TO CONSOLIDATED FINANCIAL STATEMENTS (Unaudited)—(Continued)
Cash and Securities Deposited with Clearing Organizations or Segregated
|
At
June 30, 2016 |
At
December 31, 2015 |
|||||||
| (dollars in millions) | ||||||||
|
Securities(1) |
$ | 23,710 | $ | 14,390 | ||||
|
Other assets—Cash deposited with clearing organizations or segregated under federal and other regulations or requirements |
32,771 | 31,469 | ||||||
|
|
|
|
|
|||||
|
Total |
$ | 56,481 | $ | 45,859 | ||||
|
|
|
|
|
|||||
| (1) |
Securities deposited with clearing organizations or segregated under federal and other regulations or requirements are sourced from Securities purchased under agreements to resell and Trading assets in the consolidated balance sheets. |
| 7. |
Loans
The Firm’s loans held for investment are recorded at amortized cost, and its loans held for sale are recorded at the lower of cost or fair value in the consolidated balance sheets. For a further description of these loans, refer to Note 7 to the consolidated financial statements in the 2015 Form 10-K. See Note 3 for further information regarding Loans and lending commitments held at fair value.
Loans Held for Investment and Held for Sale
| At June 30, 2016 | At December 31, 2015 | |||||||||||||||||||||||
|
Loans by Product Type |
Loans Held
for Investment |
Loans Held
for Sale |
Total
|
Loans Held
for Investment |
Loans Held
for Sale |
Total
Loans(1)(2) |
||||||||||||||||||
| (dollars in millions) | ||||||||||||||||||||||||
|
Corporate loans |
$ | 24,186 | $ | 14,448 | $ | 38,634 | $ | 23,554 | $ | 11,924 | $ | 35,478 | ||||||||||||
|
Consumer loans |
23,337 | — | 23,337 | 21,528 | — | 21,528 | ||||||||||||||||||
|
Residential real estate loans |
22,668 | 84 | 22,752 | 20,863 | 104 | 20,967 | ||||||||||||||||||
|
Wholesale real estate loans |
7,415 | 1,350 | 8,765 | 6,839 | 1,172 | 8,011 | ||||||||||||||||||
|
|
|
|
|
|
|
|
|
|
|
|
|
|||||||||||||
|
Total loans, gross of allowance for loan losses |
77,606 | 15,882 | 93,488 | 72,784 | 13,200 | 85,984 | ||||||||||||||||||
|
Allowance for loan losses |
(323) | — | (323) | (225) | — | (225) | ||||||||||||||||||
|
|
|
|
|
|
|
|
|
|
|
|
|
|||||||||||||
|
Total loans, net of allowance for loan losses |
$ | 77,283 | $ | 15,882 | $ | 93,165 | $ | 72,559 | $ | 13,200 | $ | 85,759 | ||||||||||||
|
|
|
|
|
|
|
|
|
|
|
|
|
|||||||||||||
| (1) |
Amounts include loans that are made to non-U.S. borrowers of $8,104 million and $9,789 million at June 30, 2016 and December 31, 2015, respectively. |
| (2) |
Loans at fixed interest rates and floating or adjustable interest rates were $10,102 million and $83,063 million, respectively, at June 30, 2016 and $8,471 million and $77,288 million, respectively, at December 31, 2015. |
| 43 |
|
Table of Contents
MORGAN STANLEY
NOTES TO CONSOLIDATED FINANCIAL STATEMENTS (Unaudited)—(Continued)
Credit Quality
For a further discussion about the Firm’s evaluation of credit transactions and monitoring and credit quality indicators, see Note 7 to the consolidated financial statements in the 2015 Form 10-K.
Credit Quality Indicators for Loans Held for Investment, Gross of Allowance for Loan Losses, by Product Type
| At June 30, 2016 | ||||||||||||||||||||
| Corporate | Consumer |
Residential
Real Estate |
Wholesale
Real Estate |
Total | ||||||||||||||||
|
(dollars in millions) |
||||||||||||||||||||
|
Pass |
$ | 22,183 | $ | 23,337 | $ | 22,627 | $ | 7,191 | $ | 75,338 | ||||||||||
|
Special mention |
539 | — | — | 224 | 763 | |||||||||||||||
|
Substandard |
1,308 | — | 41 | — | 1,349 | |||||||||||||||
|
Doubtful |
156 | — | — | — | 156 | |||||||||||||||
|
Loss |
— | — | — | — | — | |||||||||||||||
|
|
|
|
|
|
|
|
|
|
|
|||||||||||
|
Total loans |
$ | 24,186 | $ | 23,337 | $ | 22,668 | $ | 7,415 | $ | 77,606 | ||||||||||
|
|
|
|
|
|
|
|
|
|
|
|||||||||||
| At December 31, 2015 | ||||||||||||||||||||
| Corporate | Consumer |
Residential
Real Estate |
Wholesale
Real Estate |
Total | ||||||||||||||||
| (dollars in millions) | ||||||||||||||||||||
|
Pass |
$ | 22,040 | $ | 21,528 | $ | 20,828 | $ | 6,839 | $ | 71,235 | ||||||||||
|
Special mention |
300 | — | — | — | 300 | |||||||||||||||
|
Substandard |
1,202 | — | 35 | — | 1,237 | |||||||||||||||
|
Doubtful |
12 | — | — | — | 12 | |||||||||||||||
|
Loss |
— | — | — | — | — | |||||||||||||||
|
|
|
|
|
|
|
|
|
|
|
|||||||||||
|
Total loans |
$ | 23,554 | $ | 21,528 | $ | 20,863 | $ | 6,839 | $ | 72,784 | ||||||||||
|
|
|
|
|
|
|
|
|
|
|
|||||||||||
Allowance for Credit Losses and Impaired Loans
For factors considered by the Firm in determining the allowance for loan losses and impairments, see Notes 2 and 7 to the consolidated financial statements in the 2015 Form 10-K.
Loans by Product Type
| At June 30, 2016 | At December 31, 2015 | |||||||||||||||||||||||
| Corporate |
Residential
Real Estate |
Total | Corporate |
Residential
Real Estate |
Total | |||||||||||||||||||
|
(dollars in millions) |
||||||||||||||||||||||||
|
Impaired loans with allowance |
$ | 244 | $ | — | $ | 244 | $ | 39 | $ | — | $ | 39 | ||||||||||||
|
Impaired loans without allowance(1) |
338 | 30 | 368 | 89 | 17 | 106 | ||||||||||||||||||
|
Impaired loans unpaid principal balance(2) |
593 | 32 | 625 | 130 | 19 | 149 | ||||||||||||||||||
|
Past due 90 days loans and on nonaccrual |
1 | 20 | 21 | 1 | 21 | 22 | ||||||||||||||||||
| (1) |
At June 30, 2016 and December 31, 2015, no allowance was outstanding for these loans as the present value of the expected future cash flows (or, alternatively, the observable market price of the loan or the fair value of the collateral held) equaled or exceeded the carrying value. |
| (2) |
The impaired loans unpaid principal balance differs from the aggregate amount of impaired loan balances with and without allowance due to various factors, including charge-offs and net deferred loan fees or costs. |
|
|
44 |
Table of Contents
MORGAN STANLEY
NOTES TO CONSOLIDATED FINANCIAL STATEMENTS (Unaudited)—(Continued)
Loans by Region
| At June 30, 2016 | At December 31, 2015 | |||||||||||||||||||||||||||||||
| Americas | EMEA |
Asia-
Pacific |
Total | Americas | EMEA |
Asia-
Pacific |
Total | |||||||||||||||||||||||||
|
(dollars in millions) |
||||||||||||||||||||||||||||||||
|
Impaired loans |
$ | 589 | $ | 23 | $ | — | $ | 612 | $ | 108 | $ | 12 | $ | 25 | $ | 145 | ||||||||||||||||
|
Past due 90 days loans and on nonaccrual |
21 | — | — | 21 | 22 | — | — | 22 | ||||||||||||||||||||||||
|
Allowance for loan losses |
277 | 43 | 3 | 323 | 183 | 34 | 8 | 225 | ||||||||||||||||||||||||
EMEA—Europe, Middle East and Africa
Allowance for Credit Losses on Lending Activities
| Corporate | Consumer |
Residential
Real Estate |
Wholesale
Real Estate |
Total | ||||||||||||||||
| (dollars in millions) | ||||||||||||||||||||
|
Allowance for Loan Losses |
||||||||||||||||||||
|
Balance at December 31, 2015 |
$ | 166 | $ | 5 | $ | 17 | $ | 37 | $ | 225 | ||||||||||
|
Gross charge-offs |
— | — | — | — | — | |||||||||||||||
|
Gross recoveries |
— | — | — | — | — | |||||||||||||||
|
|
|
|
|
|
|
|
|
|
|
|||||||||||
|
Net recoveries/(charge-offs) |
— | — | — | — | — | |||||||||||||||
|
|
|
|
|
|
|
|
|
|
|
|||||||||||
|
Provision for (release of) loan losses(1) |
116 | (1) | 1 | 12 | 128 | |||||||||||||||
|
Other(2) |
(30) | — | — | — | (30) | |||||||||||||||
|
|
|
|
|
|
|
|
|
|
|
|||||||||||
|
Balance at June 30, 2016 |
$ | 252 | $ | 4 | $ | 18 | $ | 49 | $ | 323 | ||||||||||
|
|
|
|
|
|
|
|
|
|
|
|||||||||||
|
Allowance for Loan Losses by Impairment Methodology |
||||||||||||||||||||
|
Inherent |
$ | 147 | $ | 4 | $ | 18 | $ | 49 | $ | 218 | ||||||||||
|
Specific |
105 | — | — | — | 105 | |||||||||||||||
|
|
|
|
|
|
|
|
|
|
|
|||||||||||
|
Total allowance for loan losses at June 30, 2016 |
$ | 252 | $ | 4 | $ | 18 | $ | 49 | $ | 323 | ||||||||||
|
|
|
|
|
|
|
|
|
|
|
|||||||||||
|
Loans Evaluated by Impairment Methodology(3) |
||||||||||||||||||||
|
Inherent |
$ | 23,604 | $ | 23,337 | $ | 22,638 | $ | 7,415 | $ | 76,994 | ||||||||||
|
Specific |
582 | — | 30 | — | 612 | |||||||||||||||
|
|
|
|
|
|
|
|
|
|
|
|||||||||||
|
Total loans evaluated at June 30, 2016 |
$ | 24,186 | $ | 23,337 | $ | 22,668 | $ | 7,415 | $ | 77,606 | ||||||||||
|
|
|
|
|
|
|
|
|
|
|
|||||||||||
|
Allowance for Lending Commitments |
||||||||||||||||||||
|
Balance at December 31, 2015 |
$ | 180 | $ | 1 | $ | — | $ | 4 | $ | 185 | ||||||||||
|
Provision for lending commitments(4) |
1 | — | — | 2 | 3 | |||||||||||||||
|
Other |
— | (1) | — | — | (1) | |||||||||||||||
|
|
|
|
|
|
|
|
|
|
|
|||||||||||
|
Balance at June 30, 2016 |
$ | 181 | $ | — | $ | — | $ | 6 | $ | 187 | ||||||||||
|
|
|
|
|
|
|
|
|
|
|
|||||||||||
|
Allowance for Lending Commitments by Impairment Methodology |
|
|||||||||||||||||||
|
Inherent |
$ | 173 | $ | — | $ | — | $ | 6 | $ | 179 | ||||||||||
|
Specific |
8 | — | — | — | 8 | |||||||||||||||
|
|
|
|
|
|
|
|
|
|
|
|||||||||||
|
Total allowance for lending commitments at June 30, 2016 |
$ | 181 | $ | — | $ | — | $ | 6 | $ | 187 | ||||||||||
|
|
|
|
|
|
|
|
|
|
|
|||||||||||
|
Lending Commitments Evaluated by Impairment Methodology(3) |
|
|||||||||||||||||||
|
Inherent |
$ | 63,120 | $ | 5,264 | $ | 327 | $ | 496 | $ | 69,207 | ||||||||||
|
Specific |
64 | — | — | — | 64 | |||||||||||||||
|
|
|
|
|
|
|
|
|
|
|
|||||||||||
|
Total lending commitments evaluated at June 30, 2016 |
$ | 63,184 | $ | 5,264 | $ | 327 | $ | 496 | $ | 69,271 | ||||||||||
|
|
|
|
|
|
|
|
|
|
|
|||||||||||
| 45 |
|
Table of Contents
MORGAN STANLEY
NOTES TO CONSOLIDATED FINANCIAL STATEMENTS (Unaudited)—(Continued)
| Corporate | Consumer |
Residential
Real Estate |
Wholesale
Real Estate |
Total | ||||||||||||||||
| (dollars in millions) | ||||||||||||||||||||
|
Allowance for Loan Losses |
||||||||||||||||||||
|
Balance at December 31, 2014 |
$ | 118 | $ | 2 | $ | 8 | $ | 21 | $ | 149 | ||||||||||
|
Gross charge-offs |
— | — | (1) | — | (1) | |||||||||||||||
|
Gross recoveries |
1 | — | — | — | 1 | |||||||||||||||
|
|
|
|
|
|
|
|
|
|
|
|||||||||||
|
Net recoveries/(charge-offs) |
1 | — | (1) | — | — | |||||||||||||||
|
|
|
|
|
|
|
|
|
|
|
|||||||||||
|
Provision for loan losses(1) |
26 | — | 2 | 2 | 30 | |||||||||||||||
|
Other(2) |
(10) | — | — | — | (10) | |||||||||||||||
|
|
|
|
|
|
|
|
|
|
|
|||||||||||
|
Balance at June 30, 2015 |
$ | 135 | $ | 2 | $ | 9 | $ | 23 | $ | 169 | ||||||||||
|
|
|
|
|
|
|
|
|
|
|
|||||||||||
|
Allowance for Loan Losses by Impairment Methodology |
||||||||||||||||||||
|
Inherent |
$ | 130 | $ | 2 | $ | 9 | $ | 23 | $ | 164 | ||||||||||
|
Specific |
5 | — | — | — | 5 | |||||||||||||||
|
|
|
|
|
|
|
|
|
|
|
|||||||||||
|
Total allowance for loan losses at June 30, 2015 |
$ | 135 | $ | 2 | $ | 9 | $ | 23 | $ | 169 | ||||||||||
|
|
|
|
|
|
|
|
|
|
|
|||||||||||
|
Loans Evaluated by Impairment Methodology(3) |
||||||||||||||||||||
|
Inherent |
$ | 22,479 | $ | 19,464 | $ | 18,214 | $ | 6,388 | $ | 66,545 | ||||||||||
|
Specific |
21 | — | 27 | — | 48 | |||||||||||||||
|
|
|
|
|
|
|
|
|
|
|
|||||||||||
|
Total loans evaluated at June 30, 2015 |
$ | 22,500 | $ | 19,464 | $ | 18,241 | $ | 6,388 | $ | 66,593 | ||||||||||
|
|
|
|
|
|
|
|
|
|
|
|||||||||||
|
Allowance for Lending Commitments |
||||||||||||||||||||
|
Balance at December 31, 2014 |
$ | 147 | $ | — | $ | — | $ | 2 | $ | 149 | ||||||||||
|
Provision for lending commitments(4) |
6 | — | — | 2 | 8 | |||||||||||||||
|
|
|
|
|
|
|
|
|
|
|
|||||||||||
|
Balance at June 30, 2015 |
$ | 153 | $ | — | $ | — | $ | 4 | $ | 157 | ||||||||||
|
|
|
|
|
|
|
|
|
|
|
|||||||||||
|
Allowance for Lending Commitments by Impairment Methodology |
|
|||||||||||||||||||
|
Inherent |
$ | 153 | $ | — | $ | — | $ | 4 | $ | 157 | ||||||||||
|
Specific |
— | — | — | — | — | |||||||||||||||
|
|
|
|
|
|
|
|
|
|
|
|||||||||||
|
Total allowance for lending commitments at June 30, 2015 |
$ | 153 | $ | — | $ | — | $ | 4 | $ | 157 | ||||||||||
|
|
|
|
|
|
|
|
|
|
|
|||||||||||
|
Lending Commitments Evaluated by Impairment Methodology(3) |
|
|||||||||||||||||||
|
Inherent |
$ | 65,183 | $ | 4,235 | $ | 289 | $ | 623 | $ | 70,330 | ||||||||||
|
Specific |
— | — | — | — | — | |||||||||||||||
|
|
|
|
|
|
|
|
|
|
|
|||||||||||
|
Total lending commitments evaluated at June 30, 2015 |
$ | 65,183 | $ | 4,235 | $ | 289 | $ | 623 | $ | 70,330 | ||||||||||
|
|
|
|
|
|
|
|
|
|
|
|||||||||||
| (1) |
The Firm recorded provisions of $16 million and $4 million for loan losses for the current quarter and prior year quarter, respectively. |
| (2) |
Amount includes the impact related to the transfer to loans held for sale and foreign currency translation adjustments. |
| (3) |
Loan balances are gross of the allowance for loan losses, and lending commitments are gross of the allowance for lending commitments. |
| (4) |
The Firm recorded a release of $13 million and $29 million for commitments for the current quarter and prior year quarter, respectively. |
|
|
46 |
Table of Contents
MORGAN STANLEY
NOTES TO CONSOLIDATED FINANCIAL STATEMENTS (Unaudited)—(Continued)
| 10. |
| 47 |
|
Table of Contents
MORGAN STANLEY
NOTES TO CONSOLIDATED FINANCIAL STATEMENTS (Unaudited)—(Continued)
| 11. |
Commitments
The Firm’s commitments are summarized in the following table by years to maturity. Since commitments associated with these instruments may expire unused, the amounts shown do not necessarily reflect the actual future cash funding requirements.
Commitments
| Years to Maturity at June 30, 2016 | ||||||||||||||||||||
|
Less
than 1 |
1-3 | 3-5 | Over 5 | Total | ||||||||||||||||
| (dollars in millions) | ||||||||||||||||||||
|
Letters of credit and other financial guarantees obtained to satisfy collateral requirements |
$ | 125 | $ | — | $ | 1 | $ | 42 | $ | 168 | ||||||||||
|
Investment activities |
598 | 93 | 16 | 290 | 997 | |||||||||||||||
|
Corporate lending commitments(1) |
15,625 | 24,405 | 47,248 | 1,501 | 88,779 | |||||||||||||||
|
Consumer lending commitments |
5,255 | 5 | — | 4 | 5,264 | |||||||||||||||
|
Residential real estate lending commitments |
52 | 43 | 87 | 236 | 418 | |||||||||||||||
|
Wholesale real estate lending commitments |
127 | 266 | 137 | 69 | 599 | |||||||||||||||
|
Forward-starting reverse repurchase agreements and securities borrowing agreements(2) |
69,990 | — | — | — | 69,990 | |||||||||||||||
|
Underwriting commitments |
25 | — | — | — | 25 | |||||||||||||||
|
|
|
|
|
|
|
|
|
|
|
|||||||||||
|
Total |
$ | 91,797 | $ | 24,812 | $ | 47,489 | $ | 2,142 | $ | 166,240 | ||||||||||
|
|
|
|
|
|
|
|
|
|
|
|||||||||||
| (1) |
Due to the nature of the Firm’s obligations under the commitments, these amounts include certain commitments participated to third parties of $3.9 billion. |
| (2) |
The Firm enters into forward-starting reverse repurchase and securities borrowing agreements that primarily settle within three business days of the trade date, and of the total amount at June 30, 2016, $59.7 billion settled within three business days. |
|
|
48 |
Table of Contents
MORGAN STANLEY
NOTES TO CONSOLIDATED FINANCIAL STATEMENTS (Unaudited)—(Continued)
Guarantees
Obligations Under Guarantee Arrangements at June 30, 2016
| Maximum Potential Payout/Notional |
Carrying
Amount (Asset)/ Liability |
Collateral/
Recourse |
||||||||||||||||||||||||||
|
Years to Maturity |
||||||||||||||||||||||||||||
|
Less than 1 |
1-3 | 3-5 | Over 5 | Total | ||||||||||||||||||||||||
| (dollars in millions) | ||||||||||||||||||||||||||||
|
Credit derivative contracts(1) |
$ | 211,128 | $ | 200,959 | $ | 123,957 | $ | 31,246 | $ | 567,290 | $ | 396 | $ | — | ||||||||||||||
|
Other credit contracts |
43 | 25 | — | 276 | 344 | (17) | — | |||||||||||||||||||||
|
Non-credit derivative contracts(1) |
1,087,106 | 638,791 | 290,370 | 540,112 | 2,556,379 | 81,420 | — | |||||||||||||||||||||
|
Standby letters of credit and other financial guarantees issued(2) |
803 | 1,091 | 1,250 | 5,888 | 9,032 | (123) | 6,831 | |||||||||||||||||||||
|
Market value guarantees |
63 | 250 | 96 | 15 | 424 | 2 | 6 | |||||||||||||||||||||
|
Liquidity facilities |
3,001 | — | — | — | 3,001 | (5) | 5,406 | |||||||||||||||||||||
|
Whole loan sales guarantees |
— | — | 2 | 23,396 | 23,398 | 9 | — | |||||||||||||||||||||
|
Securitization representations and warranties |
— | — | — | 62,180 | 62,180 | 103 | — | |||||||||||||||||||||
|
General partner guarantees |
35 | 39 | 53 | 308 | 435 | 85 | — | |||||||||||||||||||||
| (1) |
Carrying amounts of derivative contracts are shown on a gross basis prior to cash collateral or counterparty netting. For further information on derivative contracts, see Note 4. |
| (2) |
These amounts include certain issued standby letters of credit participated to third parties totaling $0.7 billion due to the nature of the Firm’s obligations under these arrangements. |
| 49 |
|
Table of Contents
MORGAN STANLEY
NOTES TO CONSOLIDATED FINANCIAL STATEMENTS (Unaudited)—(Continued)
|
|
50 |
Table of Contents
MORGAN STANLEY
NOTES TO CONSOLIDATED FINANCIAL STATEMENTS (Unaudited)—(Continued)
| 51 |
|
Table of Contents
MORGAN STANLEY
NOTES TO CONSOLIDATED FINANCIAL STATEMENTS (Unaudited)—(Continued)
|
|
52 |
Table of Contents
MORGAN STANLEY
NOTES TO CONSOLIDATED FINANCIAL STATEMENTS (Unaudited)—(Continued)
| 12. |
Consolidated VIEs
Assets and Liabilities by Type of Activity
| At June 30, 2016 | At December 31, 2015 | |||||||||||||||
| VIE Assets | VIE Liabilities | VIE Assets | VIE Liabilities | |||||||||||||
| (dollars in millions) | ||||||||||||||||
|
Credit-linked notes |
$ | 901 | $ | — | $ | 900 | $ | — | ||||||||
|
Other structured financings |
924 | 240 | 787 | 13 | ||||||||||||
|
Asset-backed securitizations(1) |
319 | 191 | 668 | 423 | ||||||||||||
|
Other(2) |
931 | 29 | 245 | — | ||||||||||||
|
|
|
|
|
|
|
|
|
|||||||||
|
Total |
$ | 3,075 | $ | 460 | $ | 2,600 | $ | 436 | ||||||||
|
|
|
|
|
|
|
|
|
|||||||||
| (1) |
The value of assets is determined based on the fair value of the liabilities of and the interests owned by the Firm in such VIEs, because the fair values for the liabilities and interests owned are more observable. |
| (2) |
Other primarily includes certain operating entities, investment funds and structured transactions. |
| 53 |
|
Table of Contents
MORGAN STANLEY
NOTES TO CONSOLIDATED FINANCIAL STATEMENTS (Unaudited)—(Continued)
Assets and Liabilities by Balance Sheet Caption
|
At June 30,
2016 |
At December 31,
2015 |
|||||||
| (dollars in millions) | ||||||||
|
Assets |
||||||||
|
Cash and due from banks |
$ | 62 | $ | 14 | ||||
|
Trading assets, at fair value |
1,973 | 1,842 | ||||||
|
Customer and other receivables |
3 | 3 | ||||||
|
Goodwill |
18 | — | ||||||
|
Intangible assets |
141 | — | ||||||
|
Other assets |
878 | 741 | ||||||
|
|
|
|
|
|||||
|
Total assets |
$ | 3,075 | $ | 2,600 | ||||
|
|
|
|
|
|||||
|
Liabilities |
||||||||
|
Other secured financings, at fair value |
$ | 430 | $ | 431 | ||||
|
Other liabilities and accrued expenses |
30 | 5 | ||||||
|
|
|
|
|
|||||
|
Total liabilities |
$ | 460 | $ | 436 | ||||
|
|
|
|
|
|||||
|
|
54 |
Table of Contents
MORGAN STANLEY
NOTES TO CONSOLIDATED FINANCIAL STATEMENTS (Unaudited)—(Continued)
Non-Consolidated VIE Assets and Liabilities, Maximum and Carrying Value of Exposure to Loss
| At June 30, 2016 | ||||||||||||||||||||
|
Mortgage- and
|
Collateralized
|
Municipal
Tender Option Bonds |
Other
Structured Financings |
Other | ||||||||||||||||
| (dollars in millions) | ||||||||||||||||||||
|
VIE assets that the Firm does not consolidate (unpaid principal balance) |
$ | 115,088 | $ | 6,825 | $ | 4,999 | $ | 4,081 | $ | 39,281 | ||||||||||
|
Maximum exposure to loss: |
||||||||||||||||||||
|
Debt and equity interests |
$ | 12,670 | $ | 955 | $ | 31 | $ | 1,712 | $ | 4,706 | ||||||||||
|
Derivative and other contracts |
— | — | 3,001 | — | 73 | |||||||||||||||
|
Commitments, guarantees and other |
612 | 350 | — | 363 | 300 | |||||||||||||||
|
|
|
|
|
|
|
|
|
|
|
|||||||||||
|
Total maximum exposure to loss |
$ | 13,282 | $ | 1,305 | $ | 3,032 | $ | 2,075 | $ | 5,079 | ||||||||||
|
|
|
|
|
|
|
|
|
|
|
|||||||||||
|
Carrying value of exposure to loss—Assets: |
||||||||||||||||||||
|
Debt and equity interests |
$ | 12,670 | $ | 955 | $ | 3 | $ | 1,324 | $ | 4,706 | ||||||||||
|
Derivative and other contracts |
— | — | 5 | — | 27 | |||||||||||||||
|
|
|
|
|
|
|
|
|
|
|
|||||||||||
|
Total carrying value of exposure to loss—Assets |
$ | 12,670 | $ | 955 | $ | 8 | $ | 1,324 | $ | 4,733 | ||||||||||
|
|
|
|
|
|
|
|
|
|
|
|||||||||||
|
Carrying value of exposure to loss—Liabilities: |
||||||||||||||||||||
|
Derivative and other contracts |
$ | — | $ | — | $ | — | $ | — | $ | 31 | ||||||||||
|
Commitments, guarantees and other |
— | — | — | 2 | 10 | |||||||||||||||
|
|
|
|
|
|
|
|
|
|
|
|||||||||||
|
Total carrying value of exposure to loss—Liabilities |
$ | — | $ | — | $ | — | $ | 2 | $ | 41 | ||||||||||
|
|
|
|
|
|
|
|
|
|
|
|||||||||||
| At December 31, 2015 | ||||||||||||||||||||
|
Mortgage- and
|
Collateralized
Debt Obligations |
Municipal
Tender Option Bonds |
Other
Structured Financings |
Other | ||||||||||||||||
| (dollars in millions) | ||||||||||||||||||||
|
VIE assets that the Firm does not consolidate (unpaid principal balance) |
$ | 126,872 | $ | 8,805 | $ | 4,654 | $ | 2,201 | $ | 20,775 | ||||||||||
|
Maximum exposure to loss: |
||||||||||||||||||||
|
Debt and equity interests |
$ | 13,361 | $ | 1,259 | $ | 1 | $ | 1,129 | $ | 3,854 | ||||||||||
|
Derivative and other contracts |
— | — | 2,834 | — | 67 | |||||||||||||||
|
Commitments, guarantees and other |
494 | 231 | — | 361 | 222 | |||||||||||||||
|
|
|
|
|
|
|
|
|
|
|
|||||||||||
|
Total maximum exposure to loss |
$ | 13,855 | $ | 1,490 | $ | 2,835 | $ | 1,490 | $ | 4,143 | ||||||||||
|
|
|
|
|
|
|
|
|
|
|
|||||||||||
|
Carrying value of exposure to loss—Assets: |
||||||||||||||||||||
|
Debt and equity interests |
$ | 13,361 | $ | 1,259 | $ | 1 | $ | 685 | $ | 3,854 | ||||||||||
|
Derivative and other contracts |
— | — | 5 | — | 13 | |||||||||||||||
|
|
|
|
|
|
|
|
|
|
|
|||||||||||
|
Total carrying value of exposure to loss—Assets |
$ | 13,361 | $ | 1,259 | $ | 6 | $ | 685 | $ | 3,867 | ||||||||||
|
|
|
|
|
|
|
|
|
|
|
|||||||||||
|
Carrying value of exposure to loss—Liabilities: |
||||||||||||||||||||
|
Derivative and other contracts |
$ | — | $ | — | $ | — | $ | — | $ | 15 | ||||||||||
|
Commitments, guarantees and other |
— | — | — | 3 | — | |||||||||||||||
|
|
|
|
|
|
|
|
|
|
|
|||||||||||
|
Total carrying value of exposure to loss—Liabilities |
$ | — | $ | — | $ | — | $ | 3 | $ | 15 | ||||||||||
|
|
|
|
|
|
|
|
|
|
|
|||||||||||
| 55 |
|
Table of Contents
MORGAN STANLEY
NOTES TO CONSOLIDATED FINANCIAL STATEMENTS (Unaudited)—(Continued)
Non-Consolidated VIE Mortgage- and Asset-Backed Securitization Assets
| At June 30, 2016 | At December 31, 2015 | |||||||||||||||
|
Unpaid
|
Debt and
Equity Interests |
Unpaid
Principal Balance |
Debt and
Equity Interests |
|||||||||||||
| (dollars in millions) | ||||||||||||||||
|
Residential mortgages |
$ | 3,708 | $ | 410 | $ | 13,787 | $ | 1,012 | ||||||||
|
Commercial mortgages |
55,158 | 2,576 | 57,313 | 2,871 | ||||||||||||
|
U.S. agency collateralized mortgage obligations |
20,853 | 3,766 | 13,236 | 2,763 | ||||||||||||
|
Other consumer or commercial loans |
35,369 | 5,918 | 42,536 | 6,715 | ||||||||||||
|
|
|
|
|
|
|
|
|
|||||||||
|
Total mortgage- and asset-backed securitization assets |
$ | 115,088 | $ | 12,670 | $ | 126,872 | $ | 13,361 | ||||||||
|
|
|
|
|
|
|
|
|
|||||||||
|
|
56 |
Table of Contents
MORGAN STANLEY
NOTES TO CONSOLIDATED FINANCIAL STATEMENTS (Unaudited)—(Continued)
Transfers of Assets with Continuing Involvement
Transactions with SPEs in which the Firm, acting as principal, transferred financial assets with continuing involvement and received sales treatment are shown herein.
| At June 30, 2016 | ||||||||||||||||
|
Residential
Mortgage Loans |
Commercial
Mortgage Loans |
U.S. Agency
|
Credit-
Linked Notes and Other(1) |
|||||||||||||
| (dollars in millions) | ||||||||||||||||
|
SPE assets (unpaid principal balance)(2) |
$ | 21,239 | $ | 51,025 | $ | 11,116 | $ | 11,668 | ||||||||
|
Retained interests (fair value): |
||||||||||||||||
|
Investment grade |
$ | — | $ | 43 | $ | 755 | $ | — | ||||||||
|
Non-investment grade |
54 | 64 | — | 974 | ||||||||||||
|
|
|
|
|
|
|
|
|
|||||||||
|
Total retained interests (fair value) |
$ | 54 | $ | 107 | $ | 755 | $ | 974 | ||||||||
|
|
|
|
|
|
|
|
|
|||||||||
|
Interests purchased in the secondary market (fair value): |
||||||||||||||||
|
Investment grade |
$ | — | $ | 32 | $ | 142 | $ | — | ||||||||
|
Non-investment grade |
53 | 47 | — | — | ||||||||||||
|
|
|
|
|
|
|
|
|
|||||||||
|
Total interests purchased in the secondary market (fair value) |
$ | 53 | $ | 79 | $ | 142 | $ | — | ||||||||
|
|
|
|
|
|
|
|
|
|||||||||
|
Derivative assets (fair value) |
$ | — | $ | 291 | $ | — | $ | 206 | ||||||||
|
Derivative liabilities (fair value) |
— | — | — | 449 | ||||||||||||
| At December 31, 2015 | ||||||||||||||||
|
Residential
Mortgage Loans |
Commercial
Mortgage Loans |
U.S. Agency
|
Credit-
Linked Notes and Other(1) |
|||||||||||||
| (dollars in millions) | ||||||||||||||||
|
SPE assets (unpaid principal balance)(2) |
$ | 22,440 | $ | 72,760 | $ | 17,978 | $ | 12,235 | ||||||||
|
Retained interests (fair value): |
||||||||||||||||
|
Investment grade |
$ | — | $ | 238 | $ | 649 | $ | — | ||||||||
|
Non-investment grade |
160 | 63 | — | 1,136 | ||||||||||||
|
|
|
|
|
|
|
|
|
|||||||||
|
Total retained interests (fair value) |
$ | 160 | $ | 301 | $ | 649 | $ | 1,136 | ||||||||
|
|
|
|
|
|
|
|
|
|||||||||
|
Interests purchased in the secondary market (fair value): |
||||||||||||||||
|
Investment grade |
$ | — | $ | 88 | $ | 99 | $ | — | ||||||||
|
Non-investment grade |
60 | 63 | — | 10 | ||||||||||||
|
|
|
|
|
|
|
|
|
|||||||||
|
Total interests purchased in the secondary market (fair value) |
$ | 60 | $ | 151 | $ | 99 | $ | 10 | ||||||||
|
|
|
|
|
|
|
|
|
|||||||||
|
Derivative assets (fair value) |
$ | — | $ | 343 | $ | — | $ | 151 | ||||||||
|
Derivative liabilities (fair value) |
— | — | — | 449 | ||||||||||||
| (1) |
Amounts include CLO transactions managed by unrelated third parties. |
| (2) |
Amounts include assets transferred by unrelated transferors. |
| 57 |
|
Table of Contents
MORGAN STANLEY
NOTES TO CONSOLIDATED FINANCIAL STATEMENTS (Unaudited)—(Continued)
| At June 30, 2016 | ||||||||||||||||
| Level 1 | Level 2 | Level 3 | Total | |||||||||||||
| (dollars in millions) | ||||||||||||||||
|
Retained interests (fair value): |
||||||||||||||||
|
Investment grade |
$ | — | $ | 798 | $ | — | $ | 798 | ||||||||
|
Non-investment grade |
— | 15 | 1,077 | 1,092 | ||||||||||||
|
|
|
|
|
|
|
|
|
|
|
|
|
|||||
|
Total retained interests (fair value) |
$ | — | $ | 813 | $ | 1,077 | $ | 1,890 | ||||||||
|
|
|
|
|
|
|
|
|
|
|
|
|
|||||
|
Interests purchased in the secondary market (fair value): |
||||||||||||||||
|
Investment grade |
$ | — | $ | 174 | $ | — | $ | 174 | ||||||||
|
Non-investment grade |
— | 85 | 15 | 100 | ||||||||||||
|
|
|
|
|
|
|
|
|
|
|
|
|
|||||
|
Total interests purchased in the secondary market (fair value) |
$ | — | $ | 259 | $ | 15 | $ | 274 | ||||||||
|
|
|
|
|
|
|
|
|
|
|
|
|
|||||
|
Derivative assets (fair value) |
$ | — | $ | 482 | $ | 15 | $ | 497 | ||||||||
|
Derivative liabilities (fair value) |
— | 102 | 347 | 449 | ||||||||||||
| At December 31, 2015 | ||||||||||||||||
| Level 1 | Level 2 | Level 3 | Total | |||||||||||||
| (dollars in millions) | ||||||||||||||||
|
Retained interests (fair value): |
||||||||||||||||
|
Investment grade |
$ | — | $ | 886 | $ | 1 | $ | 887 | ||||||||
|
Non-investment grade |
— | 17 | 1,342 | 1,359 | ||||||||||||
|
|
|
|
|
|
|
|
|
|
|
|
|
|||||
|
Total retained interests (fair value) |
$ | — | $ | 903 | $ | 1,343 | $ | 2,246 | ||||||||
|
|
|
|
|
|
|
|
|
|
|
|
|
|||||
|
Interests purchased in the secondary market (fair value): |
||||||||||||||||
|
Investment grade |
$ | — | $ | 187 | $ | — | $ | 187 | ||||||||
|
Non-investment grade |
— | 112 | 21 | 133 | ||||||||||||
|
|
|
|
|
|
|
|
|
|
|
|
|
|||||
|
Total interests purchased in the secondary market (fair value) |
$ | — | $ | 299 | $ | 21 | $ | 320 | ||||||||
|
|
|
|
|
|
|
|
|
|
|
|
|
|||||
|
Derivative assets (fair value) |
$ | — | $ | 466 | $ | 28 | $ | 494 | ||||||||
|
Derivative liabilities (fair value) |
— | 110 | 339 | 449 | ||||||||||||
Proceeds from New Securitization Transactions and Retained Interests in Securitization Transactions
|
Three Months Ended
June 30, |
Six Months Ended
June 30, |
|||||||||||||||
| 2016 | 2015 | 2016 | 2015 | |||||||||||||
| (dollars in millions) | ||||||||||||||||
|
Proceeds received from new securitization transactions |
$ | 4,163 | $ | 6,273 | $ | 6,876 | $ | 11,164 | ||||||||
|
Proceeds from retained interests in securitization transactions |
502 | 658 | 1,133 | 1,606 | ||||||||||||
|
|
58 |
Table of Contents
MORGAN STANLEY
NOTES TO CONSOLIDATED FINANCIAL STATEMENTS (Unaudited)—(Continued)
Proceeds from Sales to CLO Entities Sponsored by Non-Affiliates
|
Three Months Ended
June 30, |
Six Months Ended
June 30, |
|||||||||||||||
| 2016 | 2015 | 2016 | 2015 | |||||||||||||
| (dollars in millions) | ||||||||||||||||
|
Proceeds from sale of corporate loans sold to those SPEs |
$ | — | $ | 621 | $ | 31 | $ | 966 | ||||||||
Net gains on sale of corporate loans to CLO transactions at the time of sale were not material in the current quarter, current year period, prior year quarter and prior year period.
The Firm also enters into transactions in which it sells equity securities and contemporaneously enters into bilateral OTC equity derivatives with the purchasers of the securities, through which it retains the exposure to the securities as shown in the following table.
| At June 30, 2016 | At December 31, 2015 | |||||||
| (dollars in millions) | ||||||||
|
Carrying value of assets derecognized at the time of sale and gross cash proceeds |
$ | 9,524 | $ | 7,878 | ||||
|
Fair value of assets sold |
9,692 | 7,935 | ||||||
|
Fair value of derivative assets recognized in the consolidated balance sheets |
218 | 97 | ||||||
|
Fair value of derivative liabilities recognized in the consolidated balance sheets |
50 | 40 | ||||||
| 13. Regulatory |
Requirements |
| 59 |
|
Table of Contents
MORGAN STANLEY
NOTES TO CONSOLIDATED FINANCIAL STATEMENTS (Unaudited)—(Continued)
The Firm’s Regulatory Capital and Capital Ratios
At June 30, 2016 and December 31, 2015, the Firm’s binding ratios are based on the Advanced Approach transitional rules.
Regulatory Capital Measures and Minimum Regulatory Capital Ratios
| At June 30, 2016 | At December 31, 2015 | |||||||||||||||||||||||||||||
| Amount | Ratio |
Minimum
Ratio(1) |
Amount | Ratio |
Minimum
Ratio(1) |
|||||||||||||||||||||||||
| (dollars in millions) | ||||||||||||||||||||||||||||||
|
Regulatory capital and capital ratios: |
||||||||||||||||||||||||||||||
|
Common Equity Tier 1 capital |
$ | 59,796 | 16.8 | % | 5.9 | % | $ | 59,409 | 15.5 | % | 4.5 | % | ||||||||||||||||||
|
Tier 1 capital |
66,782 | 18.8 | % | 7.4 | % | 66,722 | 17.4 | % | 6.0 | % | ||||||||||||||||||||
|
Total capital |
79,830 | 22.4 | % | 9.4 | % | 79,403 | 20.7 | % | 8.0 | % | ||||||||||||||||||||
|
Tier 1 leverage(2) |
— | 8.3 | % | 4.0 | % | — | 8.3 | % | 4.0 | % | ||||||||||||||||||||
|
Assets: |
||||||||||||||||||||||||||||||
|
Total RWAs |
$ | 355,982 | N/ | A | N/ | A | $ | 384,162 | N/ | A | N/ | A | ||||||||||||||||||
|
Adjusted average assets(3) |
804,511 | N/ | A | N/ | A | 803,574 | N/ | A | N/ | A | ||||||||||||||||||||
N/A—Not Applicable
| (1) |
Percentages represent minimum regulatory capital ratios under the transitional rules. |
| (2) |
Tier 1 leverage ratios are calculated under Standardized Approach transitional rules. |
| (3) |
Adjusted average assets represent the denominator of the Tier 1 leverage ratio and are composed of the average daily balance of consolidated on-balance sheet assets under U.S. GAAP during the calendar quarter, adjusted for disallowed goodwill, transitional intangible assets, certain deferred tax assets, certain investments in the capital instruments of unconsolidated financial institutions and other adjustments. |
U.S. Bank Subsidiaries’ Regulatory Capital Measures and Required Capital Ratios
| Morgan Stanley Bank, N.A. | ||||||||||||||||||||||||
| At June 30, 2016 | At December 31, 2015 | |||||||||||||||||||||||
| Amount | Ratio |
Required
Capital Ratio(1) |
Amount | Ratio |
Required
Capital Ratio(1) |
|||||||||||||||||||
| (dollars in millions) | ||||||||||||||||||||||||
|
Common Equity Tier 1 capital |
$ | 14,523 | 16.8% | 6.5% | $ | 13,333 | 15.1% | 6.5% | ||||||||||||||||
|
Tier 1 capital |
14,523 | 16.8% | 8.0% | 13,333 | 15.1% | 8.0% | ||||||||||||||||||
|
Total capital |
16,321 | 18.9% | 10.0% | 15,097 | 17.1% | 10.0% | ||||||||||||||||||
|
Tier 1 leverage |
14,523 | 10.9% | 5.0% | 13,333 | 10.2% | 5.0% | ||||||||||||||||||
|
|
60 |
Table of Contents
MORGAN STANLEY
NOTES TO CONSOLIDATED FINANCIAL STATEMENTS (Unaudited)—(Continued)
| Morgan Stanley Private Bank, National Association | ||||||||||||||||||||||||
| At June 30, 2016 | At December 31, 2015 | |||||||||||||||||||||||
| Amount | Ratio |
Required
Capital Ratio(1) |
Amount | Ratio |
Required
Capital Ratio(1) |
|||||||||||||||||||
| (dollars in millions) | ||||||||||||||||||||||||
|
Common Equity Tier 1 capital |
$ | 5,153 | 28.0% | 6.5% | $ | 4,197 | 26.5% | 6.5% | ||||||||||||||||
|
Tier 1 capital |
5,153 | 28.0% | 8.0% | 4,197 | 26.5% | 8.0% | ||||||||||||||||||
|
Total capital |
5,186 | 28.2% | 10.0% | 4,225 | 26.7% | 10.0% | ||||||||||||||||||
|
Tier 1 leverage |
5,153 | 11.4% | 5.0% | 4,197 | 10.5% | 5.0% | ||||||||||||||||||
| (1) |
Capital ratios that are required in order to be considered well-capitalized for U.S. regulatory purposes. |
| 61 |
|
Table of Contents
MORGAN STANLEY
NOTES TO CONSOLIDATED FINANCIAL STATEMENTS (Unaudited)—(Continued)
Preferred Stock Outstanding
|
Series |
Shares
Outstanding At June 30, 2016 |
Liquidation
Preference per Share |
Carrying Value | |||||||||||||
|
At
June 30, 2016 |
At
December 31, 2015 |
|||||||||||||||
| (shares in millions) | (dollars in millions) | |||||||||||||||
|
A |
44,000 | $ | 25,000 | $ | 1,100 | $ | 1,100 | |||||||||
|
C(1) |
519,882 | 1,000 | 408 | 408 | ||||||||||||
|
E |
34,500 | 25,000 | 862 | 862 | ||||||||||||
|
F |
34,000 | 25,000 | 850 | 850 | ||||||||||||
|
G |
20,000 | 25,000 | 500 | 500 | ||||||||||||
|
H |
52,000 | 25,000 | 1,300 | 1,300 | ||||||||||||
|
I |
40,000 | 25,000 | 1,000 | 1,000 | ||||||||||||
|
J |
60,000 | 25,000 | 1,500 | 1,500 | ||||||||||||
|
|
|
|
|
|||||||||||||
|
Total |
$ | 7,520 | $ | 7,520 | ||||||||||||
|
|
|
|
|
|||||||||||||
| (1) |
Series C is comprised of the issuance of 1,160,791 shares of Series C Preferred Stock to MUFG for an aggregate purchase price of $911 million, less the redemption of 640,909 shares of Series C Preferred Stock of $503 million, which were converted to common shares of approximately $705 million. |
|
|
62 |
Table of Contents
MORGAN STANLEY
NOTES TO CONSOLIDATED FINANCIAL STATEMENTS (Unaudited)—(Continued)
Accumulated Other Comprehensive Income (Loss)
Changes in AOCI by Component, Net of Tax and Noncontrolling Interests
|
Foreign
Currency Translation Adjustments |
AFS Securities |
Pensions,
Postretirement and Other |
DVA | Total | ||||||||||||||||
| (dollars in millions) | ||||||||||||||||||||
|
Balance at March 31, 2016 |
$ | (831) | $ | 76 | $ | (373) | $ | (110) | $ | (1,238) | ||||||||||
|
|
|
|
|
|
|
|
|
|
|
|||||||||||
|
Change in OCI before reclassifications |
52 | 188 | (5) | 143 | 378 | |||||||||||||||
|
Amounts reclassified from AOCI(2)(3) |
— | (45) | — | — | (45) | |||||||||||||||
|
|
|
|
|
|
|
|
|
|
|
|||||||||||
|
Net OCI during the period |
52 | 143 | (5) | 143 | 333 | |||||||||||||||
|
|
|
|
|
|
|
|
|
|
|
|||||||||||
|
Balance at June 30, 2016 |
$ | (779) | $ | 219 | $ | (378) | $ | 33 | $ | (905) | ||||||||||
|
|
|
|
|
|
|
|
|
|
|
|||||||||||
|
Balance at March 31, 2015 |
$ | (883) | $ | 127 | $ | (510) | $ | — | (1,266) | |||||||||||
|
|
|
|
|
|
|
|
|
|
|
|||||||||||
|
Change in OCI before reclassifications |
50 | (208) | (4) | — | (162) | |||||||||||||||
|
Amounts reclassified from AOCI(3) |
— | (20) | 1 | — | (19) | |||||||||||||||
|
|
|
|
|
|
|
|
|
|
|
|||||||||||
|
Net OCI during the period |
50 | (228) | (3) | — | (181) | |||||||||||||||
|
|
|
|
|
|
|
|
|
|
|
|||||||||||
|
Balance at June 30, 2015 |
$ | (833) | $ | (101) | $ | (513) | $ | — | (1,447) | |||||||||||
|
|
|
|
|
|
|
|
|
|
|
|||||||||||
|
Balance at December 31, 2015 |
$ | (963) | $ | (319) | $ | (374) | $ | — | $ | (1,656) | ||||||||||
|
Cumulative adjustment for accounting change related to DVA(1) |
— | — | — | (312) | (312) | |||||||||||||||
|
Change in OCI before reclassifications |
184 | 590 | (3) | 371 | 1,142 | |||||||||||||||
|
Amounts reclassified from AOCI(2)(3) |
— | (52) | (1) | (26) | (79) | |||||||||||||||
|
|
|
|
|
|
|
|
|
|
|
|||||||||||
|
Net OCI during the period |
184 | 538 | (4) | 345 | 1,063 | |||||||||||||||
|
|
|
|
|
|
|
|
|
|
|
|||||||||||
|
Balance at June 30, 2016 |
$ | (779) | $ | 219 | $ | (378) | $ | 33 | $ | (905) | ||||||||||
|
|
|
|
|
|
|
|
|
|
|
|||||||||||
|
Balance at December 31, 2014 |
$ | (663) | $ | (73) | $ | (512) | $ | — | $ | (1,248) | ||||||||||
|
|
|
|
|
|
|
|
|
|
|
|||||||||||
|
Change in OCI before reclassifications |
(170) | 7 | (4) | — | (167) | |||||||||||||||
|
Amounts reclassified from AOCI(3) |
— | (35) | 3 | — | (32) | |||||||||||||||
|
|
|
|
|
|
|
|
|
|
|
|||||||||||
|
Net OCI during the period |
(170) | (28) | (1) | — | (199) | |||||||||||||||
|
|
|
|
|
|
|
|
|
|
|
|||||||||||
|
Balance at June 30, 2015 |
$ | (833) | $ | (101) | $ | (513) | $ | — | $ | (1,447) | ||||||||||
|
|
|
|
|
|
|
|
|
|
|
|||||||||||
| (1) |
In accordance with the early adoption of a provision of the accounting update Recognition and Measurement of Financial Assets and Financial Liabilities , a cumulative catch up adjustment was recorded as of January 1, 2016 to move the cumulative DVA amount, net of noncontrolling interest and tax, related to outstanding liabilities under the fair value option election from Retained earnings into AOCI. See Note 2 for further information. |
| (2) |
Amounts reclassified from AOCI related to realization of DVA are classified within Trading revenues in the consolidated statements of income. The tax impact in Provision for (benefit from) income taxes resulting from such reclassifications was $(15) million related to DVA in the current year period. See Note 2 for further information. |
| (3) |
Amounts reclassified from AOCI related to realized gains and losses from sales of AFS securities are classified within Other revenues in the consolidated statements of income. The tax impact in Provision for (benefit from) income taxes resulting from such reclassifications was $(26) million in the current quarter and $(30) million in the current year period, and $(11) million in the prior quarter and $(20) million for the prior year period. |
| 63 |
|
Table of Contents
MORGAN STANLEY
NOTES TO CONSOLIDATED FINANCIAL STATEMENTS (Unaudited)—(Continued)
| 15. |
Calculation of Basic and Diluted Earnings per Common Share (“EPS”)
|
Three Months Ended
June 30, |
Six Months Ended
June 30, |
|||||||||||||||
| 2016 | 2015 | 2016 | 2015 | |||||||||||||
| (in millions, except for per share data) | ||||||||||||||||
|
Basic EPS: |
||||||||||||||||
|
Income from continuing operations |
$ | 1,650 | $ | 1,833 | $ | 2,810 | $ | 4,301 | ||||||||
|
Income (loss) from discontinued operations |
(4) | (2) | (7) | (7) | ||||||||||||
|
|
|
|
|
|
|
|
|
|||||||||
|
Net income |
1,646 | 1,831 | 2,803 | 4,294 | ||||||||||||
|
Net income applicable to noncontrolling interests |
64 | 24 | 87 | 93 | ||||||||||||
|
|
|
|
|
|
|
|
|
|||||||||
|
Net income applicable to Morgan Stanley |
1,582 | 1,807 | 2,716 | 4,201 | ||||||||||||
|
Less: Preferred stock dividends |
(156) | (141) | (234) | (219) | ||||||||||||
|
Less: Allocation of (earnings) loss to participating RSUs(1) |
(1) | (1) | (1) | (3) | ||||||||||||
|
|
|
|
|
|
|
|
|
|||||||||
|
Earnings applicable to Morgan Stanley common shareholders |
$ | 1,425 | $ | 1,665 | $ | 2,481 | $ | 3,979 | ||||||||
|
|
|
|
|
|
|
|
|
|||||||||
|
Weighted average common shares outstanding |
1,866 | 1,919 | 1,875 | 1,922 | ||||||||||||
|
Earnings per basic common share: |
||||||||||||||||
|
Income from continuing operations |
$ | 0.77 | $ | 0.87 | $ | 1.33 | $ | 2.07 | ||||||||
|
Income (loss) from discontinued operations |
(0.01) | — | (0.01) | — | ||||||||||||
|
|
|
|
|
|
|
|
|
|||||||||
|
Earnings per basic common share |
$ | 0.76 | $ | 0.87 | $ | 1.32 | $ | 2.07 | ||||||||
|
|
|
|
|
|
|
|
|
|||||||||
|
Diluted EPS: |
||||||||||||||||
|
Earnings applicable to Morgan Stanley common shareholders |
$ | 1,425 | $ | 1,665 | $ | 2,481 | $ | 3,979 | ||||||||
|
Weighted average common shares outstanding |
1,866 | 1,919 | 1,875 | 1,922 | ||||||||||||
|
Effect of dilutive securities: Stock options and RSUs(1) |
33 | 41 | 32 | 40 | ||||||||||||
|
|
|
|
|
|
|
|
|
|||||||||
|
Weighted average common shares outstanding and common stock equivalents |
1,899 | 1,960 | 1,907 | 1,962 | ||||||||||||
|
|
|
|
|
|
|
|
|
|||||||||
|
Earnings per diluted common share: |
||||||||||||||||
|
Income from continuing operations |
$ | 0.75 | $ | 0.85 | $ | 1.30 | $ | 2.03 | ||||||||
|
Income (loss) from discontinued operations |
— | — | — | — | ||||||||||||
|
|
|
|
|
|
|
|
|
|||||||||
|
Earnings per diluted common share |
$ | 0.75 | $ | 0.85 | $ | 1.30 | $ | 2.03 | ||||||||
|
|
|
|
|
|
|
|
|
|||||||||
| (1) |
Restricted stock units (“RSUs”) that are considered participating securities are treated as a separate class of securities in the computation of basic EPS, and, therefore, such RSUs are not included as incremental shares in the diluted EPS computations. The diluted EPS computations also do not include weighted average antidilutive RSUs and antidilutive stock options of 14 million shares and 12 million shares for the current quarter and prior year quarter, respectively, and 15 million shares and 12 million shares for the current year period and prior year period, respectively. |
|
|
64 |
Table of Contents
MORGAN STANLEY
NOTES TO CONSOLIDATED FINANCIAL STATEMENTS (Unaudited)—(Continued)
| 16. |
Interest Income and Interest Expense
|
Three Months Ended
June 30, |
Six Months Ended
June 30, |
|||||||||||||||
| 2016 | 2015 | 2016 | 2015 | |||||||||||||
| (dollars in millions) | ||||||||||||||||
|
Interest income(1): |
||||||||||||||||
|
Trading assets(2) |
$ | 526 | $ | 555 | $ | 1,109 | $ | 1,149 | ||||||||
|
Investment securities |
237 | 238 | 473 | 438 | ||||||||||||
|
Loans |
680 | 529 | 1,327 | 1,004 | ||||||||||||
|
Interest bearing deposits with banks |
52 | 22 | 105 | 45 | ||||||||||||
|
Securities purchased under agreements to resell and Securities borrowed(3) |
(120) | (200) | (198) | (305) | ||||||||||||
|
Customer receivables and Other(4) |
292 | 242 | 598 | 539 | ||||||||||||
|
|
|
|
|
|
|
|
|
|||||||||
|
Total interest income |
$ | 1,667 | $ | 1,386 | $ | 3,414 | $ | 2,870 | ||||||||
|
|
|
|
|
|
|
|
|
|||||||||
|
Interest expense(1): |
||||||||||||||||
|
Deposits |
$ | 15 | $ | 17 | $ | 37 | $ | 35 | ||||||||
|
Short-term borrowings |
7 | 5 | 14 | 9 | ||||||||||||
|
Long-term borrowings |
844 | 915 | 1,804 | 1,841 | ||||||||||||
|
Securities sold under agreements to repurchase and Securities loaned(5) |
259 | 235 | 513 | 543 | ||||||||||||
|
Customer payables and Other(6) |
(371) | (484) | (766) | (852) | ||||||||||||
|
|
|
|
|
|
|
|
|
|||||||||
|
Total interest expense |
$ | 754 | $ | 688 | $ | 1,602 | $ | 1,576 | ||||||||
|
|
|
|
|
|
|
|
|
|||||||||
|
Net interest |
$ | 913 | $ | 698 | $ | 1,812 | $ | 1,294 | ||||||||
|
|
|
|
|
|
|
|
|
|||||||||
| (1) |
Interest income and expense are recorded within the consolidated statements of income depending on the nature of the instrument and related market conventions. When interest is included as a component of the instrument’s fair value, interest is included within Trading revenues or Investments revenues. Otherwise, it is included within Interest income or Interest expense. |
| (2) |
Interest expense on Trading liabilities is reported as a reduction to Interest income on Trading assets. |
| (3) |
Includes fees paid on Securities borrowed. |
| (4) |
Includes interest from customer receivables and other interest earning assets. |
| (5) |
Includes fees received on Securities loaned. |
| (6) |
Includes fees received from prime brokerage customers for stock loan transactions incurred to cover customers’ short positions. |
| 17. |
The Firm sponsors various retirement plans for the majority of its U.S. and non-U.S. employees. The Firm provides certain other postretirement benefits, primarily health care and life insurance, to eligible U.S. employees.
Components of Net Periodic Benefit Expense (Income) for Pension and Other Postretirement Plans
|
Three Months Ended
June 30, |
Six Months Ended
June 30, |
|||||||||||||||
| 2016 | 2015 | 2016 | 2015 | |||||||||||||
| (dollars in millions) | ||||||||||||||||
|
Service cost, benefits earned during the period |
$ | 4 | $ | 5 | $ | 8 | $ | 10 | ||||||||
|
Interest cost on projected benefit obligation |
39 | 38 | 77 | 77 | ||||||||||||
|
Expected return on plan assets |
(30) | (29) | (60) | (59) | ||||||||||||
|
Net amortization of prior service credit |
(5) | (5) | (9) | (10) | ||||||||||||
|
Net amortization of actuarial loss |
3 | 7 | 6 | 13 | ||||||||||||
|
|
|
|
|
|
|
|
|
|||||||||
|
Net periodic benefit expense |
$ | 11 | $ | 16 | $ | 22 | $ | 31 | ||||||||
|
|
|
|
|
|
|
|
|
|||||||||
| 65 |
|
Table of Contents
MORGAN STANLEY
NOTES TO CONSOLIDATED FINANCIAL STATEMENTS (Unaudited)—(Continued)
| 18. |
|
|
66 |
Table of Contents
MORGAN STANLEY
NOTES TO CONSOLIDATED FINANCIAL STATEMENTS (Unaudited)—(Continued)
| 19. |
Segment Information
For a discussion about the Firm’s business segments, see Note 21 to the consolidated financial statements in the 2015 Form 10-K.
Selected Financial Information
| Three Months Ended June 30, 2016 | ||||||||||||||||||||
|
Institutional
Securities(1) |
Wealth
Management |
Investment
Management |
Intersegment
Eliminations |
Total | ||||||||||||||||
| (dollars in millions) | ||||||||||||||||||||
|
Total non-interest revenues(2)(3) |
$ | 4,496 | $ | 2,982 | $ | 581 | $ | (63) | $ | 7,996 | ||||||||||
|
Interest income |
966 | 920 | 3 | (222) | 1,667 | |||||||||||||||
|
Interest expense |
884 | 91 | 1 | (222) | 754 | |||||||||||||||
|
|
|
|
|
|
|
|
|
|
|
|||||||||||
|
Net interest |
82 | 829 | 2 | — | 913 | |||||||||||||||
|
|
|
|
|
|
|
|
|
|
|
|||||||||||
|
Net revenues |
$ | 4,578 | $ | 3,811 | $ | 583 | $ | (63) | $ | 8,909 | ||||||||||
|
|
|
|
|
|
|
|
|
|
|
|||||||||||
|
Income from continuing operations before income taxes |
$ | 1,506 | $ | 859 | $ | 118 | $ | — | $ | 2,483 | ||||||||||
|
Provision for income taxes |
453 | 343 | 37 | — | 833 | |||||||||||||||
|
|
|
|
|
|
|
|
|
|
|
|||||||||||
|
Income from continuing operations |
1,053 | 516 | 81 | — | 1,650 | |||||||||||||||
|
Income (loss) from discontinued operations, net of income taxes |
(4) | — | — | — | (4) | |||||||||||||||
|
|
|
|
|
|
|
|
|
|
|
|||||||||||
|
Net income |
1,049 | 516 | 81 | — | 1,646 | |||||||||||||||
|
Net income applicable to noncontrolling interests |
61 | — | 3 | — | 64 | |||||||||||||||
|
|
|
|
|
|
|
|
|
|
|
|||||||||||
|
Net income applicable to Morgan Stanley |
$ | 988 | $ | 516 | $ 78 | $ | — | $ 1,582 | ||||||||||||
|
|
|
|
|
|
|
|
|
|
|
|||||||||||
| 67 |
|
Table of Contents
MORGAN STANLEY
NOTES TO CONSOLIDATED FINANCIAL STATEMENTS (Unaudited)—(Continued)
| Three Months Ended June 30, 2015 | ||||||||||||||||||||
|
Institutional
Securities(1) |
Wealth
Management |
Investment
Management |
Intersegment
Eliminations |
Total | ||||||||||||||||
| (dollars in millions) | ||||||||||||||||||||
|
Total non-interest revenues(2)(3) |
$ | 5,205 | $ | 3,138 | $ | 757 | $ | (55) | $ | 9,045 | ||||||||||
|
Interest income |
723 | 782 | — | (119) | 1,386 | |||||||||||||||
|
Interest expense |
756 | 45 | 6 | (119) | 688 | |||||||||||||||
|
|
|
|
|
|
|
|
|
|
|
|||||||||||
|
Net interest |
(33) | 737 | (6) | — | 698 | |||||||||||||||
|
|
|
|
|
|
|
|
|
|
|
|||||||||||
|
Net revenues |
$ | 5,172 | $ | 3,875 | $ | 751 | $ | (55) | $ | 9,743 | ||||||||||
|
|
|
|
|
|
|
|
|
|
|
|||||||||||
|
Income from continuing operations before income taxes |
$ | 1,622 | $ | 885 | $ | 220 | $ | — | $ | 2,727 | ||||||||||
|
Provision for income taxes |
511 | 324 | 59 | — | 894 | |||||||||||||||
|
|
|
|
|
|
|
|
|
|
|
|||||||||||
|
Income from continuing operations |
1,111 | 561 | 161 | — | 1,833 | |||||||||||||||
|
Income (loss) from discontinued operations, net of income taxes |
(2) | — | — | — | (2) | |||||||||||||||
|
|
|
|
|
|
|
|
|
|
|
|||||||||||
|
Net income |
1,109 | 561 | 161 | — | 1,831 | |||||||||||||||
|
Net income applicable to noncontrolling interests |
22 | — | 2 | — | 24 | |||||||||||||||
|
|
|
|
|
|
|
|
|
|
|
|||||||||||
|
Net income applicable to Morgan Stanley |
$ | 1,087 | $ | 561 | $ | 159 | $ | — | $ | 1,807 | ||||||||||
|
|
|
|
|
|
|
|
|
|
|
|||||||||||
| Six Months Ended June 30, 2016 | ||||||||||||||||||||
|
Institutional
Securities(1) |
Wealth
Management |
Investment
Management |
Intersegment
Eliminations |
Total | ||||||||||||||||
| (dollars in millions) | ||||||||||||||||||||
|
Total non-interest revenues(2)(3) |
$ | 8,141 | $ | 5,819 | $ | 1,059 | $ | (130) | $ | 14,889 | ||||||||||
|
Interest income |
2,019 | 1,834 | 4 | (443) | 3,414 | |||||||||||||||
|
Interest expense |
1,868 | 174 | 3 | (443) | 1,602 | |||||||||||||||
|
|
|
|
|
|
|
|
|
|
|
|||||||||||
|
Net interest |
151 | 1,660 | 1 | — | 1,812 | |||||||||||||||
|
|
|
|
|
|
|
|
|
|
|
|||||||||||
|
Net revenues |
$ | 8,292 | $ | 7,479 | $ | 1,060 | $ | (130) | $ | 16,701 | ||||||||||
|
|
|
|
|
|
|
|
|
|
|
|||||||||||
|
Income from continuing operations before income taxes |
$ | 2,414 | $ | 1,645 | $ | 162 | $ | — | $ | 4,221 | ||||||||||
|
Provision for income taxes |
728 | 636 | 47 | — | 1,411 | |||||||||||||||
|
|
|
|
|
|
|
|
|
|
|
|||||||||||
|
Income from continuing operations |
1,686 | 1,009 | 115 | — | 2,810 | |||||||||||||||
|
Income (loss) from discontinued operations, net of income taxes |
(7) | — | — | — | (7) | |||||||||||||||
|
|
|
|
|
|
|
|
|
|
|
|||||||||||
|
Net income |
1,679 | 1,009 | 115 | — | 2,803 | |||||||||||||||
|
Net income applicable to noncontrolling interests |
100 | — | (13) | — | 87 | |||||||||||||||
|
|
|
|
|
|
|
|
|
|
|
|||||||||||
|
Net income applicable to Morgan Stanley |
$ | 1,579 | $ | 1,009 | $ | 128 | $ | — | $ | 2,716 | ||||||||||
|
|
|
|
|
|
|
|
|
|
|
|||||||||||
|
|
68 |
Table of Contents
MORGAN STANLEY
NOTES TO CONSOLIDATED FINANCIAL STATEMENTS (Unaudited)—(Continued)
| Six Months Ended June 30, 2015 | ||||||||||||||||||||
|
Institutional
Securities(1) |
Wealth
Management |
Investment
Management |
Intersegment
Eliminations |
Total | ||||||||||||||||
| (dollars in millions) | ||||||||||||||||||||
|
Total non-interest revenues(2)(3) |
$ | 10,751 | $ | 6,283 | $ | 1,431 | $ | (109) | $ | 18,356 | ||||||||||
|
Interest income |
1,593 | 1,519 | 1 | (243) | 2,870 | |||||||||||||||
|
Interest expense |
1,714 | 93 | 12 | (243) | 1,576 | |||||||||||||||
|
|
|
|
|
|
|
|
|
|
|
|||||||||||
|
Net interest |
(121) | 1,426 | (11) | — | 1,294 | |||||||||||||||
|
|
|
|
|
|
|
|
|
|
|
|||||||||||
|
Net revenues |
$ | 10,630 | $ | 7,709 | $ | 1,420 | $ | (109) | $ | 19,650 | ||||||||||
|
|
|
|
|
|
|
|
|
|
|
|||||||||||
|
Income from continuing operations before income taxes |
$ | 3,435 | $ | 1,740 | $ | 407 | $ | — | $ | 5,582 | ||||||||||
|
Provision for income taxes(4) |
517 | 644 | 120 | — | 1,281 | |||||||||||||||
|
|
|
|
|
|
|
|
|
|
|
|||||||||||
|
Income from continuing operations |
2,918 | 1,096 | 287 | — | 4,301 | |||||||||||||||
|
Income (loss) from discontinued operations, net of income taxes |
(7) | — | — | — | (7) | |||||||||||||||
|
|
|
|
|
|
|
|
|
|
|
|||||||||||
|
Net income |
2,911 | 1,096 | 287 | — | 4,294 | |||||||||||||||
|
Net income applicable to noncontrolling interests |
74 | — | 19 | — | 93 | |||||||||||||||
|
|
|
|
|
|
|
|
|
|
|
|||||||||||
|
Net income applicable to Morgan Stanley |
$ | 2,837 | $ | 1,096 | $ | 268 | $ | — | $ | 4,201 | ||||||||||
|
|
|
|
|
|
|
|
|
|
|
|||||||||||
| (1) |
In accordance with the early adoption of a provision of the accounting update Recognition and Measurement of Financial Assets and Financial Liabilities , for the current quarter and current year period DVA gains (losses) are recorded within OCI when unrealized and in Trading revenues when realized. In the prior year quarter and prior year period, the realized and unrealized DVA gains (losses) are recorded in Trading revenues. See Notes 2 and 14 for further information. |
| (2) |
In certain management fee arrangements, the Firm is entitled to receive performance-based fees (also referred to as incentive fees and includes carried interest) when the return on assets under management exceeds certain benchmark returns or other performance targets. In such arrangements, performance fee revenues are accrued (or reversed) quarterly based on measuring account/fund performance to date versus the performance benchmark stated in the investment management agreement. The Firm’s portion of unrealized cumulative amount of performance-based fee revenue (for which the Firm is not obligated to pay compensation) at risk of reversing if fund performance falls below stated investment management agreement benchmarks was approximately $421 million and $422 million at June 30, 2016 and December 31, 2015, respectively. See Note 11 for information regarding general partner guarantees, which include potential obligations to return performance fee distributions previously received. |
| (3) |
The Firm waives a portion of its fees from certain registered money market funds that comply with the requirements of Rule 2a-7 of the Investment Company Act of 1940. These fee waivers resulted in a reduction of fees of approximately $12 million and $50 million for the current quarter and prior year quarter, respectively, and $35 million and $100 million for the current year period and prior year period, respectively. |
| (4) |
The Firm’s effective tax rate from continuing operations for the prior year period included a net discrete tax benefit of $564 million, within Institutional Securities (see Note 18). |
| 69 |
|
Table of Contents
MORGAN STANLEY
NOTES TO CONSOLIDATED FINANCIAL STATEMENTS (Unaudited)—(Continued)
Geographic Information
For a discussion about the Firm’s geographic net revenues, see Note 21 to the consolidated financial statements in the 2015 Form 10-K.
Net Revenues by Region
|
Three Months Ended
June 30, |
Six Months Ended
June 30, |
|||||||||||||||
| 2016 | 2015 | 2016 | 2015 | |||||||||||||
| (dollars in millions) | ||||||||||||||||
|
Americas |
$ | 6,538 | $ | 6,777 | $ | 12,290 | $ | 13,707 | ||||||||
|
EMEA |
1,312 | 1,436 | 2,441 | 3,198 | ||||||||||||
|
Asia-Pacific |
1,059 | 1,530 | 1,970 | 2,745 | ||||||||||||
|
|
|
|
|
|
|
|
|
|||||||||
|
Net revenues |
$ | 8,909 | $ | 9,743 | $ | 16,701 | $ | 19,650 | ||||||||
|
|
|
|
|
|
|
|
|
|||||||||
|
|
70 |
Table of Contents
REPORT OF INDEPENDENT REGISTERED PUBLIC ACCOUNTING FIRM
/s/ Deloitte & Touche LLP
New York, New York
August 3, 2016
| 71 |
Table of Contents
| Item 2. | Management’s Discussion and Analysis of Financial Condition and Results of Operations |
|
|
72 |
Table of Contents
| At June 30, 2016 | At December 31, 2015 | |||||||
|
(dollars in millions, except where noted and per share amounts) |
||||||||
|
Total loans(3) |
$ | 93,165 | $ | 85,759 | ||||
|
Total assets |
$ | 828,873 | $ | 787,465 | ||||
|
Global Liquidity Reserve managed by bank and non-bank legal entities(4): |
||||||||
|
Bank legal entities |
$ | 91,062 | $ | 94,328 | ||||
|
Non-bank legal entities |
116,393 | 108,936 | ||||||
|
|
|
|
|
|||||
|
Total |
$ | 207,455 | $ | 203,264 | ||||
|
|
|
|
|
|||||
|
Total deposits |
$ | 152,693 | $ | 156,034 | ||||
|
Long-term borrowings |
$ | 163,492 | $ | 153,768 | ||||
|
Maturities of long-term borrowings outstanding (next 12 months) |
$ | 24,244 | $ | 22,396 | ||||
|
Book value per common share(5) |
$ | 36.29 | $ | 35.24 | ||||
|
Capital ratios (Transitional—Advanced)(6): |
||||||||
|
Common Equity Tier 1 capital ratio |
16.8% | 15.5% | ||||||
|
Tier 1 capital ratio |
18.8% | 17.4% | ||||||
|
Total capital ratio |
22.4% | 20.7% | ||||||
|
Capital ratios (Transitional—Standardized)(6): |
||||||||
|
Tier 1 leverage ratio(7) |
8.3% | 8.3% | ||||||
|
Worldwide employees |
54,529 | 56,218 | ||||||
EMEA—Europe, Middle East and Africa
| (1) |
For the calculation of basic and diluted earnings per common share, see Note 15 to the consolidated financial statements in Item 1. |
| (2) |
For a discussion of how the geographic breakdown for net revenues is determined, see Note 21 to the consolidated financial statements in Item 8 of the 2015 Form 10-K. |
| (3) |
Amounts include loans held for investment (net of allowance) and loans held for sale but exclude loans at fair value, which are included in Trading assets in the consolidated balance sheets (see Note 7 to the consolidated financial statements in Item 1). |
| (4) |
For a discussion of Global Liquidity Reserve, see “Management’s Discussion and Analysis of Financial Condition and Results of Operations—Liquidity and Capital Resources—Liquidity Risk Management Framework—Global Liquidity Reserve” in Part II, Item 7 of the 2015 Form 10-K. |
| (5) |
Book value per common share equals common shareholders’ equity of $69,596 million at June 30, 2016 and $67,662 million at December 31, 2015 divided by common shares outstanding of 1,918 million at June 30, 2016 and 1,920 million at December 31, 2015. |
| (6) |
For a discussion of our regulatory capital ratios, see “Liquidity and Capital Resources—Regulatory Requirements” herein. |
| (7) |
See Note 13 to the consolidated financial statements in Item 1 for information on the Tier 1 leverage ratio. |
| 73 |
|
Table of Contents
|
|
74 |
Table of Contents
Non-GAAP Financial Measures by Business Segment
|
Three Months Ended
June 30, |
Six Months Ended
June 30, |
|||||||||||||||
| 2016 | 2015 | 2016 | 2015 | |||||||||||||
| (dollars in billions) | ||||||||||||||||
|
Pre-tax profit margin(1): |
||||||||||||||||
|
Institutional Securities |
33% | 31% | 29% | 32% | ||||||||||||
|
Wealth Management |
23% | 23% | 22% | 23% | ||||||||||||
|
Investment Management |
20% | 29% | 15% | 29% | ||||||||||||
|
Consolidated |
28% | 28% | 25% | 28% | ||||||||||||
|
Average common equity(2)(3): |
||||||||||||||||
|
Institutional Securities |
$ | 43.2 | $ | 35.3 | $ | 43.2 | $ | 36.1 | ||||||||
|
Wealth Management |
15.3 | 11.3 | 15.3 | 10.9 | ||||||||||||
|
Investment Management |
2.8 | 2.3 | 2.8 | 2.3 | ||||||||||||
|
Parent(2) |
7.7 | 18.3 | 7.3 | 17.0 | ||||||||||||
|
|
|
|
|
|
|
|
|
|||||||||
|
Consolidated average common equity |
$ | 69.0 | $ | 67.2 | $ | 68.6 | $ | 66.3 | ||||||||
|
|
|
|
|
|
|
|
|
|||||||||
|
Return on average common equity(2)(3): |
||||||||||||||||
|
Institutional Securities |
8.0% | 11.3% | 6.4% | 15.1% | ||||||||||||
|
Wealth Management |
12.9% | 18.2% | 12.7% | 18.4% | ||||||||||||
|
Investment Management |
10.6% | 27.7% | 8.8% | 23.5% | ||||||||||||
|
Consolidated |
8.3% | 9.9% | 7.2% | 12.0% | ||||||||||||
| 75 |
|
Table of Contents
Reconciliation of Financial Measures from a U.S. GAAP to a Non-GAAP Basis
|
Three Months Ended
June 30, |
Six Months Ended
June 30, |
|||||||||||||||
| 2016 | 2015 | 2016 | 2015 | |||||||||||||
| (dollars in millions, except per share amounts) | ||||||||||||||||
|
Net revenues |
||||||||||||||||
|
Net revenues—U.S. GAAP |
$ | 8,909 | $ | 9,743 | $ | 16,701 | $ | 19,650 | ||||||||
|
Impact of DVA(4) |
— | (182) | — | (307) | ||||||||||||
|
|
|
|
|
|
|
|
|
|||||||||
|
Net revenues—non-GAAP |
$ | 8,909 | $ | 9,561 | $ | 16,701 | $ | 19,343 | ||||||||
|
|
|
|
|
|
|
|
|
|||||||||
|
Net income applicable to Morgan Stanley |
||||||||||||||||
|
Net income applicable to Morgan Stanley—U.S. GAAP |
$ | 1,582 | $ | 1,807 | $ | 2,716 | $ | 4,201 | ||||||||
|
Impact of DVA(4) |
— | (119) | — | (199) | ||||||||||||
|
|
|
|
|
|
|
|
|
|||||||||
|
Net income applicable to Morgan Stanley, excluding DVA—non-GAAP |
$ | 1,582 | $ | 1,688 | $ | 2,716 | $ | 4,002 | ||||||||
|
Impact of net discrete tax benefits(5) |
— | — | — | (564) | ||||||||||||
|
|
|
|
|
|
|
|
|
|||||||||
|
Net income applicable to Morgan Stanley, excluding DVA and net discrete tax benefits—non-GAAP |
$ | 1,582 | $ | 1,688 | $ | 2,716 | $ | 3,438 | ||||||||
|
|
|
|
|
|
|
|
|
|||||||||
|
Earnings per diluted common share |
||||||||||||||||
|
Earnings per diluted common share—U.S. GAAP |
$ | 0.75 | $ | 0.85 | $ | 1.30 | $ | 2.03 | ||||||||
|
Impact of DVA(4) |
— | (0.06) | — | (0.10) | ||||||||||||
|
|
|
|
|
|
|
|
|
|||||||||
|
Earnings per diluted common share, excluding DVA—non-GAAP |
$ | 0.75 | $ | 0.79 | $ | 1.30 | $ | 1.93 | ||||||||
|
Impact of net discrete tax benefits(5) |
— | — | — | (0.29) | ||||||||||||
|
|
|
|
|
|
|
|
|
|||||||||
|
Earnings per diluted common share, excluding DVA and net discrete tax benefits—non-GAAP |
$ | 0.75 | $ | 0.79 | $ | 1.30 | $ | 1.64 | ||||||||
|
|
|
|
|
|
|
|
|
|||||||||
|
Effective income tax rate |
||||||||||||||||
|
Effective income tax rate from continuing operations—U.S. GAAP |
33.5% | 32.8% | 33.4% | 22.9% | ||||||||||||
|
Impact of net discrete tax benefits(5) |
— | — | — | 10.2% | ||||||||||||
|
Effective income tax rate from continuing operations—non-GAAP |
33.5% | 32.8% | 33.4% | 33.1% | ||||||||||||
|
|
76 |
Table of Contents
Non-GAAP Financial Measures
Average common equity, return on average common equity, average tangible common equity, return on average tangible common equity and tangible book value per common share are all non-GAAP financial measures we consider to be useful measures to us, investors and analysts to assess capital adequacy and to allow better comparability of period-to-period operating performance. For a discussion of tangible common equity, see “Liquidity and Capital Resources—Tangible Equity” herein.
|
Three Months Ended
June 30, |
Six Months Ended
June 30, |
|||||||||||||||
| 2016 | 2015 | 2016 | 2015 | |||||||||||||
| (dollars in billions) | ||||||||||||||||
|
Average common equity(3)(6) |
||||||||||||||||
|
Average common equity |
$ | 69.0 | $ | 67.2 | $ | 68.6 | $ | 66.3 | ||||||||
|
Average common equity, excluding DVA |
$ | 69.1 | $ | 67.9 | $ | 68.7 | $ | 67.1 | ||||||||
|
Average common equity, excluding DVA and net discrete tax benefits |
$ | 69.1 | $ | 67.9 | $ | 68.7 | $ | 66.8 | ||||||||
|
Return on average common equity(3) |
||||||||||||||||
|
Return on average common equity |
8.3% | 9.9% | 7.2% | 12.0% | ||||||||||||
|
Return on average common equity, excluding DVA |
8.3% | 9.1% | 7.2% | 11.3% | ||||||||||||
|
Return on average common equity, excluding DVA and net discrete tax benefits |
8.3% | 9.1% | 7.2% | 9.6% | ||||||||||||
|
Average tangible common equity(6) |
||||||||||||||||
|
Average tangible common equity |
$ | 59.5 | $ | 57.5 | $ | 59.1 | $ | 56.7 | ||||||||
|
Average tangible common equity, excluding DVA |
$ | 59.6 | $ | 58.2 | $ | 59.2 | $ | 57.4 | ||||||||
|
Average tangible common equity, excluding DVA and net discrete tax benefits |
$ | 59.6 | $ | 58.2 | $ | 59.2 | $ | 57.1 | ||||||||
|
Return on average tangible common equity(7) |
||||||||||||||||
|
Return on average tangible common equity |
9.6% | 11.6% | 8.4% | 14.1% | ||||||||||||
|
Return on average tangible common equity, excluding DVA |
9.6% | 10.6% | 8.4% | 13.2% | ||||||||||||
|
Return on average tangible common equity, excluding DVA and net discrete tax benefits |
9.6% | 10.6% | 8.4% | 11.3% | ||||||||||||
| At June 30, 2016 | At December 31, 2015 | |||||||||||||||
|
Tangible book value per common share(8) |
$ | 31.39 | $ | 30.26 | ||||||||||||
DVA—Debt valuation adjustments represent the change in the fair value resulting from fluctuations in our credit spreads and other credit factors related to liabilities carried at fair value, primarily certain Long-term and Short-term borrowings.
| (1) |
Pre-tax profit margin is a non-GAAP financial measure that we consider to be a useful measure to us, investors and analysts to assess operating performance and represents income from continuing operations before income taxes as a percentage of net revenues, which are two U.S. GAAP reported amounts without adjustment. |
| (2) |
Average common equity for each business segment is determined using our Required Capital framework, an internal capital adequacy measure (see “Liquidity and Capital Resources—Regulatory Requirements—Attribution of Average Common Equity according to the Required Capital Framework” herein). Each business segment’s return on average common equity equals net income applicable to Morgan Stanley less preferred dividends as a percentage of average common equity for that segment. Effective tax rates used in the computation are determined on a separate legal entity basis. |
| (3) |
Return on average common equity equals consolidated net income applicable to Morgan Stanley less preferred dividends as a percentage of average common equity. Effective January 1, 2016, as a result of the adoption of a provision of the accounting update related to DVA, we have redefined the calculation of the return on average common equity excluding DVA to adjust for DVA only in the denominator. Prior to January 1, 2016, for the return on average common equity, excluding DVA, and excluding DVA and net discrete tax benefits, both the numerator and denominator were adjusted to exclude those items. |
| (4) |
In accordance with the early adoption of a provision of the accounting update Recognition and Measurement of Financial Assets and Financial Liabilities , unrealized DVA gains (losses) in the current quarter and current year period are recorded within OCI in the consolidated statements of comprehensive income. In the prior year quarter and prior year period, the DVA gains (losses) were recorded within Trading revenues in the consolidated statements of income. See Notes 2 and 14 to the consolidated financial statements in Item 1 for further information. |
| (5) |
For a discussion of our net discrete tax benefit, see “Supplemental Financial Information and Disclosures—Income Tax Matters” herein. |
| (6) |
The impact of DVA on average common equity and average tangible common equity was approximately $(106) million and $(714) million in the current quarter and prior year quarter, respectively. The impact of DVA on average common equity and average tangible common equity was approximately $(128) million and $(756) million in the current year period and prior year period, respectively. The impact of the net discrete tax benefit on average common equity and average tangible common equity was approximately $322 million in the prior year period. |
| (7) |
Return on average tangible common equity equals net income applicable to Morgan Stanley less preferred dividends as a percentage of average tangible common equity. Effective January 1, 2016, as a result of the adoption of a provision of the accounting update related to DVA, we have redefined the calculation of return on average tangible common equity excluding DVA to adjust for DVA only in the denominator. Prior to January 1, 2016, for the return on average tangible common equity, excluding DVA, and excluding DVA and net discrete tax benefits, both the numerator and the denominator were adjusted to exclude the impact of DVA and the impact of net discrete tax benefits. The impact of DVA was 1.0% and 0.9% in the prior year quarter and prior year period, respectively. The impact of the net discrete tax benefit was 1.9% in the prior year period. |
| (8) |
Tangible book value per common share equals tangible common equity of $60,185 million at June 30, 2016 and $58,098 million at December 31, 2015 divided by common shares outstanding of 1,918 million at June 30, 2016 and 1,920 million at December 31, 2015. |
| 77 |
|
Table of Contents
|
|
78 |
Table of Contents
INSTITUTIONAL SECURITIES
INCOME STATEMENT INFORMATION
| Three Months Ended | Six Months Ended | % Change | ||||||||||||||||||||||||||||
| June 30, | June 30, |
From Prior Year Quarter |
From Prior Year Period |
|||||||||||||||||||||||||||
| 2016 | 2015 | 2016 | 2015 | |||||||||||||||||||||||||||
| (dollars in millions) | ||||||||||||||||||||||||||||||
|
Revenues: |
||||||||||||||||||||||||||||||
|
Investment banking |
$ | 1,108 | $ | 1,440 | $ | 2,098 | $ | 2,613 | (23)% | (20)% | ||||||||||||||||||||
|
Trading |
2,498 | 2,785 | 4,389 | 6,207 | (10)% | (29)% | ||||||||||||||||||||||||
|
Investments |
76 | 16 | 108 | 128 | N/M | (16)% | ||||||||||||||||||||||||
|
Commissions and fees |
607 | 683 | 1,262 | 1,356 | (11)% | (7)% | ||||||||||||||||||||||||
|
Asset management, distribution and administration fees |
69 | 69 | 142 | 145 | 0% | (2)% | ||||||||||||||||||||||||
|
Other |
138 | 212 | 142 | 302 | (35)% | (53)% | ||||||||||||||||||||||||
|
|
|
|
|
|
|
|
|
|||||||||||||||||||||||
|
Total non-interest revenues |
4,496 | 5,205 | 8,141 | 10,751 | (14)% | (24)% | ||||||||||||||||||||||||
|
|
|
|
|
|
|
|
|
|||||||||||||||||||||||
|
Interest income |
966 | 723 | 2,019 | 1,593 | 34% | 27% | ||||||||||||||||||||||||
|
Interest expense |
884 | 756 | 1,868 | 1,714 | 17% | 9% | ||||||||||||||||||||||||
|
|
|
|
|
|
|
|
|
|||||||||||||||||||||||
|
Net interest |
82 | (33) | 151 | (121) | N/M | N/M | ||||||||||||||||||||||||
|
|
|
|
|
|
|
|
|
|||||||||||||||||||||||
|
Net revenues |
4,578 | 5,172 | 8,292 | 10,630 | (11)% | (22)% | ||||||||||||||||||||||||
|
|
|
|
|
|
|
|
|
|||||||||||||||||||||||
|
Compensation and benefits |
1,625 | 1,897 | 3,007 | 3,923 | (14)% | (23)% | ||||||||||||||||||||||||
|
Non-compensation expenses |
1,447 | 1,653 | 2,871 | 3,272 | (12)% | (12)% | ||||||||||||||||||||||||
|
|
|
|
|
|
|
|
|
|||||||||||||||||||||||
|
Total non-interest expenses |
3,072 | 3,550 | 5,878 | 7,195 | (13)% | (18)% | ||||||||||||||||||||||||
|
|
|
|
|
|
|
|
|
|||||||||||||||||||||||
|
Income from continuing operations before income taxes |
1,506 | 1,622 | 2,414 | 3,435 | (7)% | (30)% | ||||||||||||||||||||||||
|
Provision for income taxes |
453 | 511 | 728 | 517 | (11)% | 41% | ||||||||||||||||||||||||
|
|
|
|
|
|
|
|
|
|||||||||||||||||||||||
|
Income from continuing operations |
1,053 | 1,111 | 1,686 | 2,918 | (5)% | (42)% | ||||||||||||||||||||||||
|
Income (loss) from discontinued operations, net of income taxes |
(4) | (2) | (7) | (7) | N/M | 0% | ||||||||||||||||||||||||
|
|
|
|
|
|
|
|
|
|||||||||||||||||||||||
|
Net income |
1,049 | 1,109 | 1,679 | 2,911 | (5)% | (42)% | ||||||||||||||||||||||||
|
Net income applicable to noncontrolling interests |
61 | 22 | 100 | 74 | N/M | 35% | ||||||||||||||||||||||||
|
|
|
|
|
|
|
|
|
|||||||||||||||||||||||
|
Net income applicable to Morgan Stanley |
$ | 988 | $ | 1,087 | $ | 1,579 | $ | 2,837 | (9)% | (44)% | ||||||||||||||||||||
|
|
|
|
|
|
|
|
|
|||||||||||||||||||||||
N/M—Not Meaningful
| 79 |
|
Table of Contents
Investment Banking
Investment Banking Revenues
| Three Months Ended | Six Months Ended | % Change | ||||||||||||||||||||||||||||
| June 30, | June 30, |
From Prior
Year Quarter |
From Prior
Year Period |
|||||||||||||||||||||||||||
| 2016 | 2015 | 2016 | 2015 | |||||||||||||||||||||||||||
| (dollars in millions) | ||||||||||||||||||||||||||||||
|
Advisory revenues |
$ | 497 | $ | 423 | $ | 1,088 | $ | 894 | 17% | 22% | ||||||||||||||||||||
|
Underwriting revenues: |
||||||||||||||||||||||||||||||
|
Equity underwriting revenues |
266 | 489 | 426 | 796 | (46)% | (46)% | ||||||||||||||||||||||||
|
Fixed income underwriting revenues |
345 | 528 | 584 | 923 | (35)% | (37)% | ||||||||||||||||||||||||
|
|
|
|
|
|
|
|
|
|||||||||||||||||||||||
|
Total underwriting revenues |
611 | 1,017 | 1,010 | 1,719 | (40)% | (41)% | ||||||||||||||||||||||||
|
|
|
|
|
|
|
|
|
|||||||||||||||||||||||
|
Total investment banking revenues |
$ | 1,108 | $ | 1,440 | $ | 2,098 | $ | 2,613 | (23)% | (20)% | ||||||||||||||||||||
|
|
|
|
|
|
|
|
|
|||||||||||||||||||||||
Investment Banking Volumes
|
Three Months Ended
June 30, |
Six Months Ended
June 30, |
|||||||||||||||||||
| 2016(1) | 2015(1) | 2016(1) | 2015(1) | |||||||||||||||||
| (dollars in billions) | ||||||||||||||||||||
|
Completed mergers and acquisitions(2) |
$ | 235 | $ | 137 | $ | 526 | $262 | |||||||||||||
|
Equity and equity-related offerings(3) |
14 | 20 | 22 | 39 | ||||||||||||||||
|
Fixed income offerings(4) |
63 | 73 | 114 | 147 | ||||||||||||||||
| (1) |
Source: Thomson Reuters, data at July 1, 2016. Completed mergers and acquisitions volumes are based on full credit to each of the advisors in a transaction. Equity and equity-related offerings and fixed income offerings are based on full credit for single book managers and equal credit for joint book managers. Transaction volumes may not be indicative of net revenues in a given period. In addition, transaction volumes for prior periods may vary from amounts previously reported due to the subsequent withdrawal or change in the value of a transaction. |
| (2) |
Amounts include transactions of $100 million or more. |
| (3) |
Amounts include Rule 144A issuances and registered public offerings of common stock and convertible securities and rights offerings. |
| (4) |
Amounts include non-convertible preferred stock, mortgage-backed and asset-backed securities, and taxable municipal debt. Amounts include publicly registered and Rule 144A issues. Amounts exclude leveraged loans and self-led issuances. |
Investment banking revenues are composed of fees from advisory services and revenues from the underwriting of securities offerings and syndication of loans, net of syndication expenses.
Investment banking revenues of $1,108 million in the current quarter and $2,098 million in the current year period decreased 23% and 20% from the comparable periods due to lower underwriting revenues, partially offset by higher advisory revenues.
| • |
Advisory revenues increased in the current quarter and current year period due to higher completed M&A activity (see Investment Banking Volumes table). |
| • |
Equity underwriting revenues decreased as a result of significantly lower market volumes in both initial public offerings (“IPO”) and follow on offerings, while Fixed income underwriting revenues decreased primarily due to lower bond and loan fees. |
|
|
80 |
Table of Contents
Sales and Trading Net Revenues
Sales and Trading Net Revenues
|
Three Months Ended
June 30, |
Six Months Ended
June 30, |
% Change | ||||||||||||||||||||||
|
From Prior
Year Quarter |
From Prior
Year Period |
|||||||||||||||||||||||
| 2016 | 2015 | 2016 | 2015 | |||||||||||||||||||||
| (dollars in millions) | ||||||||||||||||||||||||
|
Trading |
$ | 2,498 | $ | 2,785 | $ | 4,389 | $ | 6,207 | (10)% | (29)% | ||||||||||||||
|
Commissions and fees |
607 | 683 | 1,262 | 1,356 | (11)% | (7)% | ||||||||||||||||||
|
Asset management, distribution and administration fees |
69 | 69 | 142 | 145 | 0% | (2)% | ||||||||||||||||||
|
Net interest |
82 | (33) | 151 | (121) | N/M | N/M | ||||||||||||||||||
|
|
|
|
|
|
|
|
|
|||||||||||||||||
|
Total sales and trading net revenues
|
$
|
3,256
|
|
$
|
3,504
|
|
$
|
5,944
|
|
$
|
7,587
|
|
|
(7)%
|
|
|
(22)%
|
|
||||||
|
|
|
|
|
|
|
|
|
|||||||||||||||||
N/M—Not Meaningful
Sales and Trading Net Revenues by Business
|
Three Months Ended
June 30, |
Six Months Ended
June 30, |
% Change | ||||||||||||||||||||||
|
From Prior
Year Quarter |
From Prior
Year Period |
|||||||||||||||||||||||
| 2016 | 2015 | 2016 | 2015 | |||||||||||||||||||||
| (dollars in millions) | ||||||||||||||||||||||||
|
Equity |
$ | 2,145 | $ | 2,342 | $ | 4,201 | $ | 4,635 | (8)% | (9)% | ||||||||||||||
|
Fixed income and commodities |
1,297 | 1,377 | 2,170 | 3,380 | (6)% | (36)% | ||||||||||||||||||
|
Other |
(186) | (215) | (427) | (428) | 13% | 0% | ||||||||||||||||||
|
|
|
|
|
|
|
|
|
|||||||||||||||||
|
Total sales and trading net revenues
|
$
|
3,256
|
|
$
|
3,504
|
|
$
|
5,944
|
|
$
|
7,587
|
|
|
(7)%
|
|
|
(22)%
|
|
||||||
|
|
|
|
|
|
|
|
|
|||||||||||||||||
Sales and Trading Net Revenues, Excluding DVA in 2015
Sales and trading net revenues, including equity and fixed income and commodities sales and trading net revenues that exclude the impact of DVA in 2015, are non-GAAP financial measures that we consider useful for us, investors and analysts to allow further comparability of period-to-period operating performance.
|
Three Months Ended
June 30, |
Six Months Ended
June 30, |
% Change | ||||||||||||||||||||||
|
From Prior
Year Quarter |
From Prior
Year Period |
|||||||||||||||||||||||
| 2016 | 2015 | 2016 | 2015 | |||||||||||||||||||||
| (dollars in millions) | ||||||||||||||||||||||||
|
Total sales and trading net revenues—U.S. GAAP |
$ | 3,256 | $ | 3,504 | $ | 5,944 | $ | 7,587 | (7)% | (22)% | ||||||||||||||
|
Impact of DVA(1) |
— | (182) | — | (307) | (100)% | (100)% | ||||||||||||||||||
|
|
|
|
|
|
|
|
|
|||||||||||||||||
|
Total sales and trading net revenues—non-GAAP |
$ | 3,256 | $ | 3,322 | $ | 5,944 | $ | 7,280 | (2)% | (18)% | ||||||||||||||
|
|
|
|
|
|
|
|
|
|||||||||||||||||
|
Equity sales and trading net revenues—U.S. GAAP |
$ | 2,145 | $ | 2,342 | $ | 4,201 | $ | 4,635 | (8)% | (9)% | ||||||||||||||
|
Impact of DVA(1) |
— | (72) | — | (97) | (100)% | (100)% | ||||||||||||||||||
|
|
|
|
|
|
|
|
|
|||||||||||||||||
|
Equity sales and trading net revenues—non-GAAP |
$ | 2,145 | $ | 2,270 | $ | 4,201 | $ | 4,538 | (6)% | (7)% | ||||||||||||||
|
|
|
|
|
|
|
|
|
|||||||||||||||||
|
Fixed income and commodities sales and trading net revenues—U.S. GAAP |
$ | 1,297 | $ | 1,377 | $ | 2,170 | $ | 3,380 | (6)% | (36)% | ||||||||||||||
|
Impact of DVA(1) |
— | (110) | — | (210) | (100)% | (100)% | ||||||||||||||||||
|
|
|
|
|
|
|
|
|
|||||||||||||||||
|
Fixed income and commodities sales and trading net revenues—non-GAAP |
$ | 1,297 | $ | 1,267 | $ | 2,170 | $ | 3,170 | 2% | (32)% | ||||||||||||||
|
|
|
|
|
|
|
|
|
|||||||||||||||||
| (1) |
In accordance with the early adoption of a provision of the accounting update Recognition and Measurement of Financial Assets and Financial Liabilities , unrealized DVA gains (losses) in the current quarter and current year period are recorded within OCI in the consolidated statements of comprehensive income. In the prior year quarter and prior year period, the DVA gains (losses) were recorded within Trading revenues in the consolidated statements of income. See Notes 2 and 14 to the consolidated financial statements in Item 1 for further information. |
| 81 |
|
Table of Contents
|
|
82 |
Table of Contents
WEALTH MANAGEMENT
INCOME STATEMENT INFORMATION
|
Three Months Ended
June 30, |
Six Months Ended
June 30, |
% Change | ||||||||||||||||||||||
|
From Prior
Year Quarter |
From Prior
Year Period |
|||||||||||||||||||||||
| 2016 | 2015 | 2016 | 2015 | |||||||||||||||||||||
| (dollars in millions) | ||||||||||||||||||||||||
|
Revenues: |
||||||||||||||||||||||||
|
Investment banking |
$ | 123 | $ | 186 | $ | 244 | $ | 378 | (34)% | (35)% | ||||||||||||||
|
Trading |
252 | 196 | 446 | 428 | 29% | 4% | ||||||||||||||||||
|
Investments |
— | 13 | (2) | 15 | N/M | N/M | ||||||||||||||||||
|
Commissions and fees |
423 | 490 | 835 | 1,016 | (14)% | (18)% | ||||||||||||||||||
|
Asset management, distribution and administration fees |
2,082 | 2,174 | 4,136 | 4,289 | (4)% | (4)% | ||||||||||||||||||
|
Other |
102 | 79 | 160 | 157 | 29% | 2% | ||||||||||||||||||
|
|
|
|
|
|
|
|
|
|||||||||||||||||
|
Total non-interest revenues |
2,982 | 3,138 | 5,819 | 6,283 | (5)% | (7)% | ||||||||||||||||||
|
|
|
|
|
|
|
|
|
|||||||||||||||||
|
Interest income |
920 | 782 | 1,834 | 1,519 | 18% | 21% | ||||||||||||||||||
|
Interest expense |
91 | 45 | 174 | 93 | 102% | 87% | ||||||||||||||||||
|
|
|
|
|
|
|
|
|
|||||||||||||||||
|
Net interest |
829 | 737 | 1,660 | 1,426 | 12% | 16% | ||||||||||||||||||
|
|
|
|
|
|
|
|
|
|||||||||||||||||
|
Net revenues |
3,811 | 3,875 | 7,479 | 7,709 | (2)% | (3)% | ||||||||||||||||||
|
|
|
|
|
|
|
|
|
|||||||||||||||||
|
Compensation and benefits |
2,152 | 2,200 | 4,240 | 4,425 | (2)% | (4)% | ||||||||||||||||||
|
Non-compensation expenses |
800 | 790 | 1,594 | 1,544 | 1% | 3% | ||||||||||||||||||
|
|
|
|
|
|
|
|
|
|||||||||||||||||
|
Total non-interest expenses |
2,952 | 2,990 | 5,834 | 5,969 | (1)% | (2)% | ||||||||||||||||||
|
|
|
|
|
|
|
|
|
|||||||||||||||||
|
Income from continuing operations before income taxes |
859 | 885 | 1,645 | 1,740 | (3)% | (5)% | ||||||||||||||||||
|
Provision for income taxes |
343 | 324 | 636 | 644 | 6% | (1)% | ||||||||||||||||||
|
|
|
|
|
|
|
|
|
|||||||||||||||||
|
Net income applicable to Morgan Stanley |
$ | 516 | $ | 561 | $ | 1,009 | $ | 1,096 | (8)% | (8)% | ||||||||||||||
|
|
|
|
|
|
|
|
|
|||||||||||||||||
N/M – Not Meaningful
| 83 |
|
Table of Contents
Statistical Data
Financial Information and Statistical Data (dollars in billions, except where noted)
|
At
June 30, 2016 |
At
December 31, 2015 |
|||||||||||||||
|
Client assets |
|
$ | 2,034 | $ | 1,985 | |||||||||||
|
Fee-based client assets(1) |
|
$ | 820 | $ | 795 | |||||||||||
|
Fee-based client assets as a percentage of total client assets |
|
40% | 40% | |||||||||||||
|
Client liabilities(2) |
|
$ | 69 | $ | 64 | |||||||||||
|
Bank deposit program |
|
$ | 150 | $ | 149 | |||||||||||
|
Investment securities portfolio |
|
$ | 64.6 | $ | 57.9 | |||||||||||
|
Loans and lending commitments |
|
$ | 61.3 | $ | 55.3 | |||||||||||
|
Wealth Management representatives |
|
15,909 | 15,889 | |||||||||||||
|
Retail locations |
|
609 | 608 | |||||||||||||
| Three Months Ended | Six Months Ended | |||||||||||||||
| June 30, | June 30, | |||||||||||||||
| 2016 | 2015 | 2016 | 2015 | |||||||||||||
|
Annualized revenues per representative (dollars in thousands)(3) |
$ | 959 | $ | 978 | $ | 941 | $ | 968 | ||||||||
|
Client assets per representative (dollars in millions)(4) |
$ | 128 | $ | 129 | $ | 128 | $ | 129 | ||||||||
|
Fee-based asset flows(5) |
$ | 12.0 | $ | 13.9 | $ | 17.9 | $ | 27.2 | ||||||||
| (1) |
Fee-based client assets represent the amount of assets in client accounts where the basis of payment for services is a fee calculated on those assets. |
| (2) |
Client liabilities include securities-based and tailored lending, home loans and margin lending. |
| (3) |
Annualized revenues per representative equal the Wealth Management business segment’s annualized revenues divided by the average representative headcount. |
| (4) |
Client assets per representative equal total period-end client assets divided by period-end representative headcount. |
| (5) |
Fee-based asset flows include net new fee-based assets, net account transfers, dividends, interest and client fees and exclude cash management-related activity. |
Net Revenues
Transactional Revenues
|
Three Months Ended
June 30, |
Six Months Ended
June 30, |
% Change | ||||||||||||||||||||||
|
From Prior
Year Quarter |
From Prior
Year Period |
|||||||||||||||||||||||
| 2016 | 2015 | 2016 | 2015 | |||||||||||||||||||||
| (dollars in millions) | ||||||||||||||||||||||||
|
Investment banking |
$ | 123 | $ | 186 | $ | 244 | $ | 378 | (34)% | (35)% | ||||||||||||||
|
Trading |
252 | 196 | 446 | 428 | 29% | 4% | ||||||||||||||||||
|
Commissions and fees |
423 | 490 | 835 | 1,016 | (14)% | (18)% | ||||||||||||||||||
|
|
|
|
|
|
|
|
|
|||||||||||||||||
|
Transactional revenues |
$ | 798 | $ | 872 | $ | 1,525 | $ | 1,822 | (8)% | (16)% | ||||||||||||||
|
|
|
|
|
|
|
|
|
|||||||||||||||||
|
|
84 |
Table of Contents
Fee-Based Client Assets Activity and Average Fee Rate by Account Type
For a description of fee-based client assets, including descriptions for the fee based client asset types and rollforward items in the following tables, see “Management’s Discussion and Analysis of Financial Condition and Results of Operations—Business Segments—Wealth Management—Fee-Based Client Assets” in Part II, Item 7 of the 2015 Form 10-K.
|
At
March 31, 2016 |
Inflows | Outflows |
Market
Impact |
At
June 30, 2016 |
Average for the
Three Months June 30, 2016 |
|||||||||||||||||
| Fee Rate | ||||||||||||||||||||||
| (dollars in billions) | (in bps) | |||||||||||||||||||||
|
Separately managed accounts(1) |
$ | 278 | $ | 9 | $ | (7) | $ | (1) | $ | 279 | 31 | |||||||||||
|
Unified managed accounts |
112 | 11 | (5) | 2 | 120 | 109 | ||||||||||||||||
|
Mutual fund advisory |
24 | — | (1) | — | 23 | 121 | ||||||||||||||||
|
Representative as advisor |
114 | 8 | (8) | 3 | 117 | 88 | ||||||||||||||||
|
Representative as portfolio manager |
255 | 17 | (12) | 5 | 265 | 101 | ||||||||||||||||
|
|
|
|
|
|
|
|
|
|
|
|||||||||||||
|
Subtotal |
$ | 783 | $ | 45 | $ | (33) | $ | 9 | $ | 804 | 74 | |||||||||||
|
Cash management |
15 | 4 | (3) | — | 16 | 6 | ||||||||||||||||
|
|
|
|
|
|
|
|
|
|
|
|||||||||||||
|
Total fee-based client assets |
$ | 798 | $ | 49 | $ | (36) | $ | 9 | $ | 820 | 73 | |||||||||||
|
|
|
|
|
|
|
|
|
|
|
|||||||||||||
| 85 |
|
Table of Contents
|
At
March 31, 2015 |
Inflows | Outflows |
Market
Impact |
At
June 30, 2015 |
Average for the
Three Months Ended June 30, 2015 |
|||||||||||||||||
| Fee Rate | ||||||||||||||||||||||
| (dollars in billions) | (in bps) | |||||||||||||||||||||
|
Separately managed accounts(1) |
$ | 287 | $ | 13 | $ | (7) | $ | 1 | $ | 294 | 34 | |||||||||||
|
Unified managed accounts |
99 | 8 | (4) | — | 103 | 114 | ||||||||||||||||
|
Mutual fund advisory |
30 | 1 | (2) | — | 29 | 121 | ||||||||||||||||
|
Representative as advisor |
121 | 8 | (8) | (1) | 120 | 89 | ||||||||||||||||
|
Representative as portfolio manager |
250 | 16 | (11) | (2) | 253 | 104 | ||||||||||||||||
|
|
|
|
|
|
|
|
|
|
|
|
||||||||||||
|
Subtotal |
$ | 787 | $ | 46 | $ | (32) | $ | (2) | $ | 799 | 77 | |||||||||||
|
Cash management |
16 | 2 | (4) | — | 14 | 6 | ||||||||||||||||
|
|
|
|
|
|
|
|
|
|
|
|
||||||||||||
|
Total fee-based client assets |
$ | 803 | $ | 48 | $ | (36) | $ | (2) | $ | 813 | 75 | |||||||||||
|
|
|
|
|
|
|
|
|
|
|
|
||||||||||||
|
At December 31,
2015 |
Inflows | Outflows |
Market
Impact |
At
June 30, 2016 |
Average for the
Six Months Ended June 30, 2016 |
|||||||||||||||||
| Fee Rate | ||||||||||||||||||||||
| (dollars in billions) | (in bps) | |||||||||||||||||||||
|
Separately managed accounts(1) |
$ | 283 | $ | 17 | $ | (17) | $ | (4) | $ | 279 | 32 | |||||||||||
|
Unified managed accounts |
105 | 21 | (9) | 3 | 120 | 109 | ||||||||||||||||
|
Mutual fund advisory |
25 | 1 | (3) | — | 23 | 121 | ||||||||||||||||
|
Representative as advisor |
115 | 13 | (14) | 3 | 117 | 88 | ||||||||||||||||
|
Representative as portfolio manager |
252 | 31 | (22) | 4 | 265 | 102 | ||||||||||||||||
|
|
|
|
|
|
|
|
|
|
|
|||||||||||||
|
Subtotal |
$ | 780 | $ | 83 | $ | (65) | $ | 6 | $ | 804 | 74 | |||||||||||
|
Cash management |
15 | 7 | (6) | — | 16 | 6 | ||||||||||||||||
|
|
|
|
|
|
|
|
|
|
|
|||||||||||||
|
Total fee-based client assets |
$ | 795 | $ | 90 | $ | (71) | $ | 6 | $ | 820 | 73 | |||||||||||
|
|
|
|
|
|
|
|
|
|
|
|||||||||||||
|
At December 31,
2014 |
Inflows | Outflows |
Market
Impact |
At
June 30, 2015 |
Average for the
Six Months Ended June 30, 2015 |
|||||||||||||||||
| Fee Rate | ||||||||||||||||||||||
| (dollars in billions) | (in bps) | |||||||||||||||||||||
|
Separately managed accounts(1) |
$ | 285 | $ | 23 | $ | (14) | $ | — | $ | 294 | 35 | |||||||||||
|
Unified managed accounts |
93 | 15 | (7) | 2 | 103 | 114 | ||||||||||||||||
|
Mutual fund advisory |
31 | 1 | (3) | — | 29 | 121 | ||||||||||||||||
|
Representative as advisor |
119 | 16 | (15) | — | 120 | 89 | ||||||||||||||||
|
Representative as portfolio manager |
241 | 31 | (20) | 1 | 253 | 104 | ||||||||||||||||
|
|
|
|
|
|
|
|
|
|
|
|||||||||||||
|
Subtotal |
$ | 769 | $ | 86 | $ | (59) | $ | 3 | $ | 799 | 77 | |||||||||||
|
Cash management |
16 | 3 | (5) | — | 14 | 6 | ||||||||||||||||
|
|
|
|
|
|
|
|
|
|
|
|||||||||||||
|
Total fee-based client assets |
$ | 785 | $ | 89 | $ | (64) | $ | 3 | $ | 813 | 75 | |||||||||||
|
|
|
|
|
|
|
|
|
|
|
|||||||||||||
bps—Basis points
| (1) |
Includes non-custody account values reflecting prior quarter-end balances due to a lag in the reporting of asset values by third-party custodians. |
|
|
86 |
Table of Contents
INVESTMENT MANAGEMENT
INCOME STATEMENT INFORMATION
|
Three Months Ended
June 30, |
Six Months Ended
June 30, |
% Change | ||||||||||||||||||||||
|
From Prior
Year Quarter |
From Prior
Year Period |
|||||||||||||||||||||||
| 2016 | 2015 | 2016 | 2015 | |||||||||||||||||||||
| (dollars in millions) | ||||||||||||||||||||||||
|
Revenues: |
||||||||||||||||||||||||
|
Investment banking |
$ | — | $ | — | $ | 1 | $ | — | — | N/M | ||||||||||||||
|
Trading |
5 | (6) | (5) | (3) | N/M | (67)% | ||||||||||||||||||
|
Investments |
50 | 232 | (14) | 384 | (78)% | N/M | ||||||||||||||||||
|
Commissions and fees |
— | — | 3 | — | — | N/M | ||||||||||||||||||
|
Asset management, distribution and administration fees |
517 | 522 | 1,043 | 1,036 | (1)% | 1% | ||||||||||||||||||
|
Other |
9 | 9 | 31 | 14 | — | 121% | ||||||||||||||||||
|
|
|
|
|
|
|
|
|
|||||||||||||||||
|
Total non-interest revenues |
581 | 757 | 1,059 | 1,431 | (23)% | (26)% | ||||||||||||||||||
|
|
|
|
|
|
|
|
|
|||||||||||||||||
|
Interest income |
3 | — | 4 | 1 | N/M | N/M | ||||||||||||||||||
|
Interest expense |
1 | 6 | 3 | 12 | (83)% | (75)% | ||||||||||||||||||
|
|
|
|
|
|
|
|
|
|||||||||||||||||
|
Net interest |
2 | (6) | 1 | (11) | N/M | N/M | ||||||||||||||||||
|
|
|
|
|
|
|
|
|
|||||||||||||||||
|
Net revenues |
583 | 751 | 1,060 | 1,420 | (22)% | (25)% | ||||||||||||||||||
|
|
|
|
|
|
|
|
|
|||||||||||||||||
|
Compensation and benefits |
238 | 308 | 451 | 581 | (23)% | (22)% | ||||||||||||||||||
|
Non-compensation expenses |
227 | 223 | 447 | 432 | 2% | 3% | ||||||||||||||||||
|
|
|
|
|
|
|
|
|
|||||||||||||||||
|
Total non-interest expenses |
465 | 531 | 898 | 1,013 | (12)% | (11)% | ||||||||||||||||||
|
|
|
|
|
|
|
|
|
|||||||||||||||||
|
Income from continuing operations before income taxes |
118 | 220 | 162 | 407 | (46)% | (60)% | ||||||||||||||||||
|
Provision for income taxes |
37 | 59 | 47 | 120 | (37)% | (61)% | ||||||||||||||||||
|
|
|
|
|
|
|
|
|
|||||||||||||||||
|
Income from continuing operations |
81 | 161 | 115 | 287 | (50)% | (60)% | ||||||||||||||||||
|
|
|
|
|
|
|
|
|
|||||||||||||||||
|
Net income |
81 | 161 | 115 | 287 | (50)% | (60)% | ||||||||||||||||||
|
Net income applicable to noncontrolling interests |
3 | 2 | (13) | 19 | 50% | N/M | ||||||||||||||||||
|
|
|
|
|
|
|
|
|
|||||||||||||||||
|
Net income applicable to Morgan Stanley |
$ | 78 | $ | 159 | $ | 128 | $ | 268 | (51)% | (52)% | ||||||||||||||
|
|
|
|
|
|
|
|
|
|||||||||||||||||
N/M – Not Meaningful
| 87 |
|
Table of Contents
Assets Under Management or Supervision and Average Fee Rate by Asset Class
For a description of the rollforward items in the following tables, see “Management’s Discussion and Analysis of Financial Condition and Results of Operations—Business Segments—Investment Management—Statistical Data” in Part II, Item 7 of the 2015 Form 10-K.
|
At
March 31, 2016 |
Inflows | Outflows | Distributions |
Market
Impact |
Foreign
Currency Impact |
At
June 30, 2016 |
Average for the
Three Months Ended June 30, 2016 |
|||||||||||||||||||||||||||||
|
Total
AUM |
Fee
Rate |
|||||||||||||||||||||||||||||||||||
| (dollars in billions) | (in bps) | |||||||||||||||||||||||||||||||||||
|
Equity |
$ | 81 | $ | 5 | $ | (6) | $ | — | $ | 1 | $ | — | $ | 81 | $ | 81 | 74 | |||||||||||||||||||
|
Fixed income |
62 | 7 | (8) | — | — | — | 61 | 61 | 32 | |||||||||||||||||||||||||||
|
Liquidity |
146 | 291 | (289) | — | 1 | — | 149 | 146 | 19 | |||||||||||||||||||||||||||
|
Alternative / Other products |
116 | 9 | (10) | (1) | 1 | — | 115 | 116 | 74 | |||||||||||||||||||||||||||
|
|
|
|
|
|
|
|
|
|
|
|
|
|
|
|
|
|||||||||||||||||||||
|
Total assets under management or supervision |
$ | 405 | $ | 312 | $ | (313) | $ | (1) | $ | 3 | $ | — | $ | 406 | $ | 404 | 48 | |||||||||||||||||||
|
|
|
|
|
|
|
|
|
|
|
|
|
|
|
|
|
|||||||||||||||||||||
|
Shares of minority stake assets |
8 | 8 | 8 | |||||||||||||||||||||||||||||||||
|
|
88 |
Table of Contents
|
At
March 31, 2015 |
Inflows | Outflows | Distributions |
Market
Impact |
Foreign
Currency Impact |
At
June 30, 2015 |
Average for the
Three Months Ended June 30, 2015 |
|||||||||||||||||||||||||||||
|
Total
AUM |
Fee
Rate |
|||||||||||||||||||||||||||||||||||
| (dollars in billions) | (in bps) | |||||||||||||||||||||||||||||||||||
|
Equity |
$ | 98 | $ | 3 | $ | (7) | $ | — | $ | 2 | $ | — | $ | 96 | $ | 98 | 71 | |||||||||||||||||||
|
Fixed income |
65 | 6 | (6) | — | (1) | — | 64 | 65 | 33 | |||||||||||||||||||||||||||
|
Liquidity |
131 | 306 | (305) | — | — | — | 132 | 131 | 9 | |||||||||||||||||||||||||||
|
Alternative / Other products |
112 | 6 | (5) | (2) | (1) | 1 | 111 | 112 | 81 | |||||||||||||||||||||||||||
|
|
|
|
|
|
|
|
|
|
|
|
|
|
|
|
|
|||||||||||||||||||||
|
Total assets under management or supervision |
$ | 406 | $ | 321 | $ | (323) | $ | (2) | $ | — | $ | 1 | $ | 403 | $ | 406 | 47 | |||||||||||||||||||
|
|
|
|
|
|
|
|
|
|
|
|
|
|
|
|
|
|||||||||||||||||||||
|
Shares of minority stake assets |
7 | 7 | 7 | |||||||||||||||||||||||||||||||||
|
At
December 31, 2015 |
Inflows | Outflows | Distributions |
Market
Impact |
Foreign
Currency Impact |
At
June 30, 2016 |
Average for the
Six Months Ended June 30, 2016 |
|||||||||||||||||||||||||||||
|
Total
AUM |
Fee
Rate |
|||||||||||||||||||||||||||||||||||
| (dollars in billions) | (in bps) | |||||||||||||||||||||||||||||||||||
|
Equity |
$ | 83 | $ | 10 | $ | (12) | $ | — | $ | — | $ | — | $ | 81 | $ | 80 | 73 | |||||||||||||||||||
|
Fixed income |
60 | 12 | (14) | — | 2 | 1 | 61 | 60 | 32 | |||||||||||||||||||||||||||
|
Liquidity |
149 | 627 | (627) | — | — | — | 149 | 148 | 18 | |||||||||||||||||||||||||||
|
Alternative / Other products |
114 | 14 | (14) | (1) | 1 | 1 | 115 | 115 | 77 | |||||||||||||||||||||||||||
|
|
|
|
|
|
|
|
|
|
|
|
|
|
|
|
|
|||||||||||||||||||||
|
Total assets under management or supervision |
$ | 406 | $ | 663 | $ | (667) | $ | (1) | $ | 3 | $ | 2 | $ | 406 | $ | 403 | 48 | |||||||||||||||||||
|
|
|
|
|
|
|
|
|
|
|
|
|
|
|
|
|
|||||||||||||||||||||
|
Shares of minority stake assets |
8 | 8 | 8 | |||||||||||||||||||||||||||||||||
|
At
December 31, 2014 |
Inflows | Outflows | Distributions |
Market
Impact |
Foreign
Currency Impact |
At
June 30, 2015 |
Average for the
Six Months Ended June 30, 2015 |
|||||||||||||||||||||||||||||
|
Total
AUM |
Fee
Rate |
|||||||||||||||||||||||||||||||||||
| (dollars in billions) | (in bps) | |||||||||||||||||||||||||||||||||||
|
Equity |
$ | 99 | $ | 7 | $ | (14) | $ | — | $ | 5 | $ | (1) | $ | 96 | $ | 99 | 70 | |||||||||||||||||||
|
Fixed income |
65 | 12 | (11) | — | — | (2) | 64 | 65 | 32 | |||||||||||||||||||||||||||
|
Liquidity |
128 | 589 | (585) | — | — | — | 132 | 129 | 9 | |||||||||||||||||||||||||||
|
Alternative / Other products |
111 | 11 | (10) | (2) | 1 | — | 111 | 112 | 80 | |||||||||||||||||||||||||||
|
|
|
|
|
|
|
|
|
|
|
|
|
|
|
|
|
|||||||||||||||||||||
|
Total assets under management or supervision |
$ | 403 | $ | 619 | $ | (620) | $ | (2) | $ | 6 | $ | (3) | $ | 403 | $ | 405 | 47 | |||||||||||||||||||
|
|
|
|
|
|
|
|
|
|
|
|
|
|
|
|
|
|||||||||||||||||||||
|
Shares of minority stake assets |
7 | 7 | 7 | |||||||||||||||||||||||||||||||||
bps—Basis points
| 89 |
|
Table of Contents
Supplemental Financial Information and Disclosures
U.S. Bank Subsidiaries’ Supplemental Financial Information Excluding Transactions with Affiliated Entities
| At June 30, 2016 | At December 31, 2015 | |||||||
| (dollars in billions) | ||||||||
|
U.S. Bank Subsidiaries assets |
$ | 175.1 | $ | 174.2 | ||||
|
U.S. Bank Subsidiaries investment securities portfolio(1) |
64.6 | 57.9 | ||||||
|
Wealth Management U.S. Bank Subsidiaries data: |
||||||||
|
Securities-based lending and other loans(2) |
$ | 31.4 | $ | 28.6 | ||||
|
Residential real estate loans |
22.7 | 20.9 | ||||||
|
|
|
|
|
|||||
|
Total |
$ | 54.1 | $ | 49.5 | ||||
|
|
|
|
|
|||||
|
Institutional Securities U.S. Bank Subsidiaries data: |
||||||||
|
Corporate loans |
$ | 21.2 | $ | 22.9 | ||||
|
Wholesale real estate loans |
8.9 | 8.9 | ||||||
|
|
|
|
|
|||||
|
Total |
$ | 30.1 | $ | 31.8 | ||||
|
|
|
|
|
|||||
| (1) |
The U.S. Bank Subsidiaries investment securities portfolio includes AFS investment securities of $54.2 billion at June 30, 2016 and $53.0 billion at December 31, 2015. The remaining balance represents held to maturity investment securities of $10.4 billion at June 30, 2016 and $4.9 billion at December 31, 2015. |
| (2) |
Other loans primarily include tailored lending. |
|
|
90 |
Table of Contents
Accounting Development Updates
| 91 |
|
Table of Contents
Liquidity and Capital Resources
Senior management establishes liquidity and capital policies. Through various risk and control committees, senior management reviews business performance relative to these policies, monitors the availability of alternative sources of financing, and oversees the liquidity, interest rate and currency sensitivity of our asset and liability position. The Treasury Department, Firm Risk Committee, Asset and Liability Management Committee, and other committees and control groups assist in evaluating, monitoring and controlling the impact that our business activities have on our consolidated balance sheets, liquidity and capital structure. Liquidity and capital matters are reported regularly to the Board and the Board’s Risk Committee.
The Balance Sheet
We monitor and evaluate the composition and size of our balance sheet on a regular basis. Our balance sheet management process includes quarterly planning, business-specific thresholds, monitoring of business-specific usage versus key performance metrics and new business impact assessments.
We establish balance sheet thresholds at the consolidated, business segment and business unit levels. We monitor balance sheet utilization and review variances resulting from business activity or market fluctuations. On a regular basis, we review current performance versus established thresholds and assess the need to re-allocate our balance sheet based on business unit needs. We also monitor key metrics, including asset and liability size, composition of the balance sheet and capital usage.
Total Assets by Business Segment
| At June 30, 2016 | ||||||||||||||||
|
Institutional
|
Wealth
|
Investment
|
Total | |||||||||||||
|
(dollars in millions) |
||||||||||||||||
|
Assets |
||||||||||||||||
|
Cash and cash equivalents |
$ | 33,333 | $ | 22,757 | $ | 43 | $ | 56,133 | ||||||||
|
Trading assets, at fair value |
252,857 | 1,175 | 2,762 | 256,794 | ||||||||||||
|
Investment securities |
15,495 | 64,649 | — | 80,144 | ||||||||||||
|
Securities purchased under agreements to resell |
93,310 | 4,279 | — | 97,589 | ||||||||||||
|
Securities borrowed |
130,812 | 469 | — | 131,281 | ||||||||||||
|
Customer and other receivables |
30,720 | 21,597 | 510 | 52,827 | ||||||||||||
|
Loans, net of allowance |
38,898 | 54,267 | — | 93,165 | ||||||||||||
|
Other assets(1) |
45,948 | 13,608 | 1,384 | 60,940 | ||||||||||||
|
|
|
|
|
|
|
|
|
|||||||||
|
Total assets |
$ | 641,373 | $ | 182,801 | $ | 4,699 | $ | 828,873 | ||||||||
|
|
|
|
|
|
|
|
|
|||||||||
|
At December 31, 2015 |
||||||||||||||||
|
Institutional
|
Wealth
|
Investment
|
Total | |||||||||||||
|
(dollars in millions) |
||||||||||||||||
|
Assets |
||||||||||||||||
|
Cash and cash equivalents |
$ | 22,356 | $ | 31,216 | $ | 511 | $ | 54,083 | ||||||||
|
Trading assets, at fair value |
236,174 | 883 | 2,448 | 239,505 | ||||||||||||
|
Investment securities |
14,124 | 57,858 | 1 | 71,983 | ||||||||||||
|
Securities purchased under agreements to resell |
83,205 | 4,452 | — | 87,657 | ||||||||||||
|
Securities borrowed |
141,971 | 445 | — | 142,416 | ||||||||||||
|
Customer and other receivables |
23,390 | 21,406 | 611 | 45,407 | ||||||||||||
|
Loans, net of allowance |
36,237 | 49,522 | — | 85,759 | ||||||||||||
|
Other assets(1) |
45,257 | 13,926 | 1,472 | 60,655 | ||||||||||||
|
|
|
|
|
|
|
|
|
|||||||||
|
Total assets |
$ | 602,714 | $ | 179,708 | $ | 5,043 | $ | 787,465 | ||||||||
|
|
|
|
|
|
|
|
|
|||||||||
| (1) |
Other assets primarily includes Cash deposited with clearing organizations or segregated under federal and other regulations or requirements; Other investments; Premises, equipment and software costs; Goodwill; Intangible assets and deferred tax assets. |
|
|
92 |
Table of Contents
| 93 |
|
Table of Contents
Global Liquidity Reserve by Type of Investment
| At June 30, 2016 | At December 31, 2015 | |||||||
|
(dollars in millions) |
||||||||
|
Cash deposits with banks |
$ | 11,812 | $ | 10,187 | ||||
|
Cash deposits with central banks |
39,479 | 39,774 | ||||||
|
Unencumbered highly liquid securities: |
||||||||
|
U.S. government obligations |
80,560 | 72,265 | ||||||
|
U.S. agency and agency mortgage-backed securities |
44,635 | 37,678 | ||||||
|
Non-U.S. sovereign obligations(1) |
17,394 | 28,999 | ||||||
|
Other investment grade securities |
13,575 | 14,361 | ||||||
|
|
|
|
|
|||||
|
Global Liquidity Reserve |
$ | 207,455 | $ | 203,264 | ||||
|
|
|
|
|
|||||
| (1) |
Non-U.S. sovereign obligations are composed of unencumbered German, French, Dutch, U.K., Brazilian and Japanese government obligations. |
Global Liquidity Reserve Managed by Bank and Non-Bank Legal Entities
| At June 30, 2016 | At December 31, 2015 |
Daily Average Balance
Three Months Ended June 30, 2016 |
||||||||||
|
(dollars in millions) |
||||||||||||
|
Bank legal entities: |
||||||||||||
|
Domestic |
$ | 85,504 | $ | 88,432 | $ | 86,901 | ||||||
|
Foreign |
5,558 | 5,896 | 5,368 | |||||||||
|
|
|
|
|
|
|
|||||||
|
Total Bank legal entities |
91,062 | 94,328 | 92,269 | |||||||||
|
|
|
|
|
|
|
|||||||
|
Non-Bank legal entities: |
||||||||||||
|
Parent |
61,087 | 54,810 | 61,380 | |||||||||
|
Non-Parent |
17,673 | 20,001 | 17,932 | |||||||||
|
|
|
|
|
|
|
|||||||
|
Total Domestic |
78,760 | 74,811 | 79,312 | |||||||||
|
Foreign |
37,633 | 34,125 | 38,204 | |||||||||
|
|
|
|
|
|
|
|||||||
|
Total Non-Bank legal entities |
116,393 | 108,936 | 117,516 | |||||||||
|
|
|
|
|
|
|
|||||||
|
Total |
$ | 207,455 | $ | 203,264 | $ | 209,785 | ||||||
|
|
|
|
|
|
|
|||||||
|
|
94 |
Table of Contents
| 95 |
|
Table of Contents
|
|
96 |
Table of Contents
| 97 |
|
Table of Contents
Tangible Equity
Tangible Equity Measures—Period End and Average
|
Balance at |
Monthly Average
Balance Three Months Ended June 30, 2016 |
|||||||||||
| June 30, 2016 | December 31, 2015 | |||||||||||
| (dollars in millions) | ||||||||||||
|
Common equity |
$ | 69,596 | $ | 67,662 | $ | 68,951 | ||||||
|
Preferred equity |
7,520 | 7,520 | 7,520 | |||||||||
|
|
|
|
|
|
|
|||||||
|
Morgan Stanley shareholders’ equity |
77,116 | 75,182 | 76,471 | |||||||||
|
Junior subordinated debentures issued to capital trusts |
2,853 | 2,870 | 2,851 | |||||||||
|
Less: Goodwill and net intangible assets |
(9,411) | (9,564) | (9,451) | |||||||||
|
|
|
|
|
|
|
|||||||
|
Tangible Morgan Stanley shareholders’ equity(1) |
$ | 70,558 | $ | 68,488 | $ | 69,871 | ||||||
|
|
|
|
|
|
|
|||||||
|
Common equity |
$ | 69,596 | $ | 67,662 | $ | 68,951 | ||||||
|
Less: Goodwill and net intangible assets |
(9,411) | (9,564) | (9,451) | |||||||||
|
|
|
|
|
|
|
|||||||
|
Tangible common equity(1) |
$ | 60,185 | $ | 58,098 | $ | 59,500 | ||||||
|
|
|
|
|
|
|
|||||||
| (1) |
Tangible Morgan Stanley shareholders’ equity and tangible common equity are non-GAAP financial measures that we and investors consider to be a useful measure to assess capital adequacy. |
Regulatory Requirements
|
|
98 |
Table of Contents
Minimum Risk-Based Capital Ratios: Transitional Provisions

| (1) |
These ratios assume the requirements for the G-SIB capital surcharge (3.0%) and countercyclical capital buffer (zero) remain at current levels. |
| 99 |
|
Table of Contents
Transitional and Fully Phased-In Regulatory Capital Ratios
| At June 30, 2016 | ||||||||||||||||
| Transitional | Fully Phased-In | |||||||||||||||
| Standardized | Advanced | Standardized | Advanced | |||||||||||||
| (dollars in millions) | ||||||||||||||||
|
Risk-based capital: |
||||||||||||||||
|
Common Equity Tier 1 capital |
$ | 59,796 | $ | 59,796 | $ | 57,556 | $ | 57,556 | ||||||||
|
Tier 1 capital |
66,782 | 66,782 | 65,274 | 65,274 | ||||||||||||
|
Total capital |
80,142 | 79,830 | 76,982 | 76,670 | ||||||||||||
|
Total RWAs |
342,504 | 355,982 | 352,692 | 366,781 | ||||||||||||
|
Common Equity Tier 1 capital ratio |
17.5% | 16.8% | 16.3% | 15.7% | ||||||||||||
|
Tier 1 capital ratio |
19.5% | 18.8% | 18.5% | 17.8% | ||||||||||||
|
Total capital ratio |
23.4% | 22.4% | 21.8% | 20.9% | ||||||||||||
|
Leverage-based capital: |
||||||||||||||||
|
Adjusted average assets(1) |
804,511 | N/A | 803,377 | N/A | ||||||||||||
|
Tier 1 leverage ratio(2) |
8.3% | N/A | 8.1% | N/A | ||||||||||||
| At December 31, 2015 | ||||||||||||||||
| Transitional | Fully Phased-In | |||||||||||||||
| Standardized | Advanced | Standardized | Advanced | |||||||||||||
| (dollars in millions) | ||||||||||||||||
|
Risk-based capital: |
||||||||||||||||
|
Common Equity Tier 1 capital |
$ | 59,409 | $ | 59,409 | $ | 55,441 | $ | 55,441 | ||||||||
|
Tier 1 capital |
66,722 | 66,722 | 63,000 | 63,000 | ||||||||||||
|
Total capital |
79,663 | 79,403 | 73,858 | 73,598 | ||||||||||||
|
Total RWAs |
362,920 | 384,162 | 373,421 | 395,277 | ||||||||||||
|
Common Equity Tier 1 capital ratio |
16.4% | 15.5% | 14.8% | 14.0% | ||||||||||||
|
Tier 1 capital ratio |
18.4% | 17.4% | 16.9% | 15.9% | ||||||||||||
|
Total capital ratio |
22.0% | 20.7% | 19.8% | 18.6% | ||||||||||||
|
Leverage-based capital: |
||||||||||||||||
|
Adjusted average assets(1) |
803,574 | N/A | 801,346 | N/A | ||||||||||||
|
Tier 1 leverage ratio(2) |
8.3% | N/A | 7.9% | N/A | ||||||||||||
N/A—Not Applicable
| (1) |
Adjusted average assets represent the denominator of the Tier 1 leverage ratio and are composed of the average daily balance of consolidated on-balance sheet assets under U.S. GAAP during the calendar quarter, adjusted for disallowed goodwill, transitional intangible assets, certain deferred tax assets, certain investments in the capital instruments of unconsolidated financial institutions and other adjustments. |
| (2) |
The minimum Tier 1 leverage ratio requirement is 4.0%. |
|
|
100 |
Table of Contents
Regulatory Capital Calculated under Advanced Approach Transitional Rules
| At June 30, 2016 | At December 31, 2015 | |||||||
| (dollars in millions) | ||||||||
|
Common Equity Tier 1 capital: |
||||||||
|
Common stock and surplus |
$ | 19,091 | $ | 20,114 | ||||
|
Retained earnings |
51,410 | 49,204 | ||||||
|
Accumulated other comprehensive income (loss) |
(905) | (1,656) | ||||||
|
Regulatory adjustments and deductions: |
||||||||
|
Net goodwill |
(6,582) | (6,582) | ||||||
|
Net intangible assets (other than goodwill and mortgage servicing assets) |
(1,698) | (1,192) | ||||||
|
Credit spread premium over risk-free rate for derivative liabilities |
(428) | (202) | ||||||
|
Net deferred tax assets |
(888) | (675) | ||||||
|
Net after-tax debt valuation adjustments(1) |
(20) | 156 | ||||||
|
Adjustments related to accumulated other comprehensive income |
61 | 411 | ||||||
|
Other adjustments and deductions |
(245) | (169) | ||||||
|
|
|
|
|
|||||
|
Total Common Equity Tier 1 capital |
$ | 59,796 | $ | 59,409 | ||||
|
|
|
|
|
|||||
|
Additional Tier 1 capital: |
||||||||
|
Preferred stock |
$ | 7,520 | $ | 7,520 | ||||
|
Trust preferred securities |
— | 702 | ||||||
|
Noncontrolling interests |
653 | 678 | ||||||
|
Regulatory adjustments and deductions: |
||||||||
|
Net deferred tax assets |
(592) | (1,012) | ||||||
|
Credit spread premium over risk-free rate for derivative liabilities |
(286) | (303) | ||||||
|
Net after-tax debt valuation adjustments(1) |
(13) | 233 | ||||||
|
Other adjustments and deductions |
(156) | (253) | ||||||
|
|
|
|
|
|||||
|
Additional Tier 1 capital |
$ | 7,126 | $ | 7,565 | ||||
|
|
|
|
|
|||||
|
Deduction for investments in covered funds |
(140) | (252) | ||||||
|
|
|
|
|
|||||
|
Total Tier 1 capital |
$ | 66,782 | $ | 66,722 | ||||
|
|
|
|
|
|||||
|
Tier 2 capital: |
||||||||
|
Subordinated debt |
$ | 11,120 | $ | 10,404 | ||||
|
Trust preferred securities |
1,675 | 2,106 | ||||||
|
Other qualifying amounts |
58 | 35 | ||||||
|
Regulatory adjustments and deductions |
195 | 136 | ||||||
|
|
|
|
|
|||||
|
Total Tier 2 capital |
$ | 13,048 | $ | 12,681 | ||||
|
|
|
|
|
|||||
|
Total capital |
$ | 79,830 | $ | 79,403 | ||||
|
|
|
|
|
|||||
| (1) |
In connection with the early adoption of a provision of the accounting update Recognition and Measurement of Financial Assets and Financial Liabilities , related to DVA, the aggregate balance of net after-tax valuation adjustments was reduced by $77 million as of January 1, 2016. |
| 101 |
|
Table of Contents
Roll-forward of Regulatory Capital Calculated under Advanced Approach Transitional Rules
|
Six Months Ended
June 30, 2016 |
||||
| (dollars in millions) | ||||
|
Common Equity Tier 1 capital: |
||||
|
Common Equity Tier 1 capital at December 31, 2015 |
$ | 59,409 | ||
|
Change related to the following items: |
||||
|
Value of shareholders’ common equity |
1,934 | |||
|
Net intangible assets (other than goodwill and mortgage servicing assets) |
(506) | |||
|
Credit spread premium over risk-free rate for derivative liabilities |
(226) | |||
|
Net deferred tax assets |
(213) | |||
|
Net after-tax debt valuation adjustments(1) |
(176) | |||
|
Adjustments related to accumulated other comprehensive income |
(350) | |||
|
Other deductions and adjustments |
(76) | |||
|
|
|
|||
|
Common Equity Tier 1 capital at June 30, 2016 |
$ | 59,796 | ||
|
|
|
|||
|
Additional Tier 1 capital: |
||||
|
Additional Tier 1 capital at December 31, 2015 |
$ | 7,565 | ||
|
Change related to the following items: |
||||
|
Trust preferred securities |
(702) | |||
|
Noncontrolling interests |
(25) | |||
|
Net deferred tax assets |
420 | |||
|
Credit spread premium over risk-free rate for derivative liabilities |
17 | |||
|
Net after-tax debt valuation adjustments(1) |
(246) | |||
|
Other adjustments and deductions |
97 | |||
|
|
|
|||
|
Additional Tier 1 capital at June 30, 2016 |
7,126 | |||
|
|
|
|||
|
Deduction for investments in covered funds at December 31, 2015 |
(252) | |||
|
Deduction for investments in covered funds |
112 | |||
|
|
|
|||
|
Deduction for investments in covered funds at June 30, 2016 |
(140) | |||
|
|
|
|||
|
Tier 1 capital at June 30, 2016 |
$ | 66,782 | ||
|
|
|
|||
|
Tier 2 capital: |
||||
|
Tier 2 capital at December 31, 2015 |
$ | 12,681 | ||
|
Change related to the following items: |
||||
|
Subordinated debt |
716 | |||
|
Trust preferred securities |
(431) | |||
|
Noncontrolling interests |
23 | |||
|
Other adjustments and deductions |
59 | |||
|
|
|
|||
|
Tier 2 capital at June 30, 2016 |
$ | 13,048 | ||
|
|
|
|||
|
Total capital at June 30, 2016 |
$ | 79,830 | ||
|
|
|
|||
| (1) |
In connection with the early adoption of a provision of the accounting update Recognition and Measurement of Financial Assets and Financial Liabilities , related to DVA, the aggregate balance of net after-tax valuation adjustments was reduced by $77 million as of January 1, 2016. |
|
|
102 |
Table of Contents
Roll-forward of RWAs Calculated under Advanced Approach Transitional Rules
|
Six Months Ended
June 30, 2016(1) |
||||
| (dollars in millions) | ||||
|
Credit risk RWAs: |
||||
|
Balance at December 31, 2015 |
$ | 173,586 | ||
|
Change related to the following items: |
||||
|
Derivatives |
1,624 | |||
|
Securities financing transactions |
1,239 | |||
|
Other counterparty credit risk |
79 | |||
|
Securitizations |
(3,246) | |||
|
Credit valuation adjustment |
3,256 | |||
|
Investment securities |
1,179 | |||
|
Loans |
(7,943) | |||
|
Cash |
1,148 | |||
|
Equity investments |
(1,201) | |||
|
Other credit risk(2) |
(1,366) | |||
|
|
|
|||
|
Total change in credit risk RWAs |
$ | (5,231) | ||
|
|
|
|||
|
Balance at June 30, 2016 |
$ | 168,355 | ||
|
|
|
|||
|
Market risk RWAs: |
||||
|
Balance at December 31, 2015 |
$ | 71,476 | ||
|
Change related to the following items: |
||||
|
Regulatory VaR |
(1,107) | |||
|
Regulatory stressed VaR |
(5,436) | |||
|
Incremental risk charge |
(64) | |||
|
Comprehensive risk measure |
(1,396) | |||
|
Specific risk: |
||||
|
Non-securitizations |
(577) | |||
|
Securitizations |
(3,308) | |||
|
|
|
|||
|
Total change in market risk RWAs |
$ | (11,888) | ||
|
|
|
|||
|
Balance at June 30, 2016 |
$ | 59,588 | ||
|
|
|
|||
|
Operational risk RWAs: |
||||
|
Balance at December 31, 2015 |
$ | 139,100 | ||
|
Change in operational risk RWAs(3) |
(11,061) | |||
|
|
|
|||
|
Balance at June 30, 2016 |
$ | 128,039 | ||
|
|
|
|||
|
Total RWAs |
$ | 355,982 | ||
|
|
|
|||
| VaR—Value-at-Risk |
|
| (1) |
The RWAs for each category in the table reflect both on- and off-balance sheet exposures, where appropriate. |
| (2) |
Amount reflects assets not in a defined category, non-material portfolios of exposures and unsettled transactions. |
| (3) |
Amount reflects a reduction in the internal loss data related to litigation utilized in the operational risk capital model. |
| 103 |
|
Table of Contents
|
|
104 |
Table of Contents
Average Common Equity by Business Segment and Parent Equity
|
Three Months Ended(1)
June 30, |
Six Months Ended(1)
June 30, |
|||||||||||||||
| 2016 | 2015 | 2016 | 2015 | |||||||||||||
| (dollars in billions) | ||||||||||||||||
|
Institutional Securities |
$ | 43.2 | $ | 35.3 | $ | 43.2 | $ | 36.1 | ||||||||
|
Wealth Management |
15.3 | 11.3 | 15.3 | 10.9 | ||||||||||||
|
Investment Management |
2.8 | 2.3 | 2.8 | 2.3 | ||||||||||||
|
Parent |
7.7 | 18.3 | 7.3 | 17.0 | ||||||||||||
|
|
|
|
|
|
|
|
|
|||||||||
|
Total |
$ | 69.0 | $ | 67.2 | $ | 68.6 | $ | 66.3 | ||||||||
|
|
|
|
|
|
|
|
|
|||||||||
| (1) |
Amounts are calculated on a monthly basis. Average common equity is a non-GAAP financial measure that we consider to be a useful measure for us, investors and analysts to assess capital adequacy. |
| 105 |
|
Table of Contents
Regulatory Developments
|
|
106 |
Table of Contents
| 107 |
|
Table of Contents
| Item 3. | Quantitative and Qualitative Disclosures about Market Risk |
Risk Management
Trading Risks
95%/One-Day Management VaR
|
95%/One-Day VaR for the
Quarter Ended June 30, 2016 |
95%/One-Day VaR for the
Quarter Ended March 31, 2016 |
|||||||||||||||||||||||||||||||
| Market Risk Category |
Period
End |
Average | High | Low |
Period
End |
Average | High | Low | ||||||||||||||||||||||||
| (dollars in millions) | ||||||||||||||||||||||||||||||||
|
Interest rate and credit spread |
$ | 26 | 32 | 38 | 26 | $ | 35 | $ | 33 | $ | 39 | $ | 28 | |||||||||||||||||||
|
Equity price |
20 | 17 | 43 | 13 | 16 | 18 | 26 | 14 | ||||||||||||||||||||||||
|
Foreign exchange rate |
10 | 7 | 12 | 6 | 7 | 7 | 11 | 5 | ||||||||||||||||||||||||
|
Commodity price |
9 | 10 | 12 | 9 | 11 | 11 | 13 | 10 | ||||||||||||||||||||||||
|
Less: Diversification benefit(1)(2) |
(32) | (28) | N/A | N/A | (30) | (27) | N/A | N/A | ||||||||||||||||||||||||
|
|
|
|
|
|
|
|
|
|||||||||||||||||||||||||
|
Primary Risk Categories |
$ | 33 | 38 | 61 | 31 | $ | 39 | $ | 42 | $ | 53 | $ | 34 | |||||||||||||||||||
|
|
|
|
|
|
|
|
|
|||||||||||||||||||||||||
|
Credit Portfolio |
22 | 20 | 23 | 18 | 19 | 16 | 20 | 12 | ||||||||||||||||||||||||
|
Less: Diversification benefit(1)(2) |
(13) | (12) | N/A | N/A | (11) | (12) | N/A | N/A | ||||||||||||||||||||||||
|
|
|
|
|
|
|
|
|
|||||||||||||||||||||||||
|
Total Management VaR |
$ | 42 | 46 | 68 | 39 | $ | 47 | $ | 46 | $ | 55 | $ | 39 | |||||||||||||||||||
|
|
|
|
|
|
|
|
|
|||||||||||||||||||||||||
N/A—Not Applicable
| (1) |
Diversification benefit equals the difference between the total Management VaR and the sum of the component VaRs. This benefit arises because the simulated one-day losses for each of the components occur on different days; similar diversification benefits also are taken into account within each component. |
| (2) |
The high and low VaR values for the total Management VaR and each of the component VaRs might have occurred on different days during the quarter, and therefore, the diversification benefit is not an applicable measure. |
|
|
108 |
Table of Contents
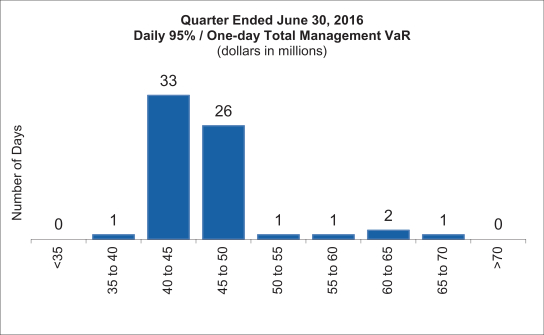
| 109 |
|
Table of Contents
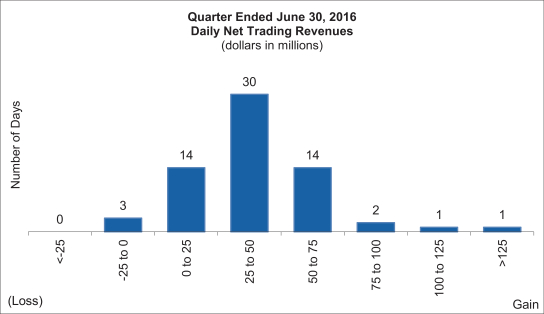
Non-trading Risks
|
|
110 |
Table of Contents
| 111 |
|
Table of Contents
Loan and Lending Commitment Portfolio by Business Segment
| At June 30, 2016 | ||||||||||||
|
Institutional
Securities |
Wealth
Management |
Total | ||||||||||
| (dollars in millions) | ||||||||||||
|
Corporate loans |
$ | 15,938 | $ | 8,248 | $ | 24,186 | ||||||
|
Consumer loans |
— | 23,337 | 23,337 | |||||||||
|
Residential real estate loans |
— | 22,668 | 22,668 | |||||||||
|
Wholesale real estate loans |
7,415 | — | 7,415 | |||||||||
|
|
|
|
|
|
|
|||||||
|
Loans held for investment, gross of allowance |
23,353 | 54,253 | 77,606 | |||||||||
|
Allowance for loan losses |
(291) | (32) | (323) | |||||||||
|
|
|
|
|
|
|
|||||||
|
Loans held for investment, net of allowance |
23,062 | 54,221 | 77,283 | |||||||||
|
|
|
|
|
|
|
|||||||
|
Corporate loans |
14,447 | — | 14,447 | |||||||||
|
Consumer loans |
— | — | — | |||||||||
|
Residential real estate loans |
38 | 46 | 84 | |||||||||
|
Wholesale real estate loans |
1,351 | — | 1,351 | |||||||||
|
|
|
|
|
|
|
|||||||
|
Loans held for sale |
15,836 | 46 | 15,882 | |||||||||
|
|
|
|
|
|
|
|||||||
|
Corporate loans |
7,114 | — | 7,114 | |||||||||
|
Residential real estate loans |
1,721 | — | 1,721 | |||||||||
|
Wholesale real estate loans |
462 | — | 462 | |||||||||
|
|
|
|
|
|
|
|||||||
|
Loans held at fair value |
9,297 | — | 9,297 | |||||||||
|
|
|
|
|
|
|
|||||||
|
Total loans(1) |
48,195 | 54,267 | 102,462 | |||||||||
|
Lending commitments(2)(3) |
88,057 | 7,003 | 95,060 | |||||||||
|
|
|
|
|
|
|
|||||||
|
Total loans and lending commitments(2)(3) |
$ | 136,252 | $ | 61,270 | $ | 197,522 | ||||||
|
|
|
|
|
|
|
|||||||
| At December 31, 2015 | ||||||||||||
|
Institutional
Securities |
Wealth
Management |
Total | ||||||||||
| (dollars in millions) | ||||||||||||
|
Corporate loans |
$ | 16,452 | $ | 7,102 | $ | 23,554 | ||||||
|
Consumer loans |
— | 21,528 | 21,528 | |||||||||
|
Residential real estate loans |
— | 20,863 | 20,863 | |||||||||
|
Wholesale real estate loans |
6,839 | — | 6,839 | |||||||||
|
|
|
|
|
|
|
|||||||
|
Loans held for investment, gross of allowance |
23,291 | 49,493 | 72,784 | |||||||||
|
Allowance for loan losses |
(195) | (30) | (225) | |||||||||
|
|
|
|
|
|
|
|||||||
|
Loans held for investment, net of allowance |
23,096 | 49,463 | 72,559 | |||||||||
|
|
|
|
|
|
|
|||||||
|
Corporate loans |
11,924 | — | 11,924 | |||||||||
|
Residential real estate loans |
45 | 59 | 104 | |||||||||
|
Wholesale real estate loans |
1,172 | — | 1,172 | |||||||||
|
|
|
|
|
|
|
|||||||
|
Loans held for sale |
13,141 | 59 | 13,200 | |||||||||
|
|
|
|
|
|
|
|||||||
|
Corporate loans |
7,286 | — | 7,286 | |||||||||
|
Residential real estate loans |
1,885 | — | 1,885 | |||||||||
|
Wholesale real estate loans |
1,447 | — | 1,447 | |||||||||
|
|
|
|
|
|
|
|||||||
|
Loans held at fair value |
10,618 | — | 10,618 | |||||||||
|
|
|
|
|
|
|
|||||||
|
Total loans(1) |
46,855 | 49,522 | 96,377 | |||||||||
|
Lending commitments(2)(3) |
95,572 | 5,821 | 101,393 | |||||||||
|
|
|
|
|
|
|
|||||||
|
Total loans and lending commitments(2)(3) |
$ | 142,427 | $ | 55,343 | $ | 197,770 | ||||||
|
|
|
|
|
|
|
|||||||
| (1) |
Amounts exclude $23.2 billion and $25.3 billion related to margin loans and $4.9 billion related to employee loans at June 30, 2016 and December 31, 2015, respectively. See Notes 6 and 7 to the consolidated financial statements in Item 1 for further information. |
| (2) |
Lending commitments represent the notional amount of legally binding obligations to provide funding to clients for all lending transactions. Since commitments associated with these business activities may expire unused or may not be utilized to full capacity, they do not necessarily reflect the actual future cash funding requirements. |
| (3) |
For syndications led by us, the lending commitments accepted by the borrower but not yet closed are net of the amounts agreed to by counterparties that will participate in the syndication. For syndications that we participate in and do not lead, lending commitments accepted by the borrower but not yet closed include only the amount that we expect will be allocated from the lead, syndicate bank. Due to the nature of our obligations under the commitments, these amounts include certain commitments participated to third parties. |
|
|
112 |
Table of Contents
Institutional Securities Loans and Lending Commitments by Credit Rating(1)
| At June 30, 2016 | ||||||||||||||||||||
| Years to Maturity | ||||||||||||||||||||
| Less than 1 | 1-3 | 3-5 | Over 5 | Total | ||||||||||||||||
| (dollars in millions) | ||||||||||||||||||||
|
AAA |
$ | 263 | $ | — | $ | 50 | $ | — | $ | 313 | ||||||||||
|
AA |
3,478 | 758 | 4,375 | — | 8,611 | |||||||||||||||
|
A |
2,169 | 6,517 | 10,610 | 1,104 | 20,400 | |||||||||||||||
|
BBB |
11,094 | 15,909 | 23,997 | 844 | 51,844 | |||||||||||||||
|
|
|
|
|
|
|
|
|
|
|
|||||||||||
|
Investment grade |
17,004 | 23,184 | 39,032 | 1,948 | 81,168 | |||||||||||||||
|
Non-investment grade |
8,040 | 17,529 | 18,520 | 7,134 | 51,223 | |||||||||||||||
|
Unrated(2) |
933 | 591 | 94 | 2,243 | 3,861 | |||||||||||||||
|
|
|
|
|
|
|
|
|
|
|
|||||||||||
|
Total |
$ | 25,977 | $ | 41,304 | $ | 57,646 | $ | 11,325 | $ | 136,252 | ||||||||||
|
|
|
|
|
|
|
|
|
|
|
|||||||||||
| 113 |
|
Table of Contents
| At December 31, 2015 | ||||||||||||||||||||
| Years to Maturity | ||||||||||||||||||||
| Less than 1 | 1-3 | 3-5 | Over 5 | Total | ||||||||||||||||
| (dollars in millions) | ||||||||||||||||||||
|
AAA |
$ | 287 | $ | 24 | $ | 50 | $ | — | $ | 361 | ||||||||||
|
AA |
5,022 | 2,553 | 3,735 | 63 | 11,373 | |||||||||||||||
|
A |
3,996 | 5,726 | 11,993 | 1,222 | 22,937 | |||||||||||||||
|
BBB |
5,089 | 16,720 | 23,248 | 4,086 | 49,143 | |||||||||||||||
|
|
|
|
|
|
|
|
|
|
|
|||||||||||
|
Investment grade |
14,394 | 25,023 | 39,026 | 5,371 | 83,814 | |||||||||||||||
|
Non-investment grade |
7,768 | 15,863 | 22,818 | 7,779 | 54,228 | |||||||||||||||
|
Unrated(2) |
930 | 1,091 | 246 | 2,118 | 4,385 | |||||||||||||||
|
|
|
|
|
|
|
|
|
|
|
|||||||||||
|
Total |
$ | 23,092 | $ | 41,977 | $ | 62,090 | $ | 15,268 | $ | 142,427 | ||||||||||
|
|
|
|
|
|
|
|
|
|
|
|||||||||||
| (1) |
Obligor credit ratings are determined by the Credit Risk Management Department. |
| (2) |
Unrated loans and lending commitments are primarily trading positions that are measured at fair value and risk managed as a component of Market Risk. For a further discussion of our Market Risk, see “Quantitative and Qualitative Disclosures about Market Risk—Risk Management—Market Risk” in Part II, Item 7A of the 2015 Form 10-K. |
|
|
114 |
Table of Contents
Institutional Securities Credit Exposure from Loans and Lending Commitments by Industry
|
Industry(1) |
At June 30,
2016 |
At December 31,
2015 |
||||||
|
(dollars in millions) |
||||||||
|
Real estate |
$ | 17,524 | $ | 17,847 | ||||
|
Healthcare |
16,891 | 12,677 | ||||||
|
Energy |
13,512 | 15,921 | ||||||
|
Consumer discretionary |
13,128 | 12,098 | ||||||
|
Utilities |
12,646 | 12,631 | ||||||
|
Industrials |
10,349 | 10,018 | ||||||
|
Information technology |
8,269 | 11,122 | ||||||
|
Consumer staples |
8,053 | 8,597 | ||||||
|
Funds, exchanges and other financial services(2) |
8,052 | 11,649 | ||||||
|
Materials |
6,698 | 6,440 | ||||||
|
Mortgage finance |
6,399 | 8,260 | ||||||
|
Telecommunications services |
4,245 | 4,403 | ||||||
|
Insurance |
3,793 | 4,682 | ||||||
|
Consumer finance |
2,768 | 977 | ||||||
|
Special purpose vehicles |
1,914 | 3,482 | ||||||
|
Other |
2,011 | 1,623 | ||||||
|
|
|
|
|
|||||
|
Total |
$ | 136,252 | $ | 142,427 | ||||
|
|
|
|
|
|||||
| (1) |
Industry categories are based on the Global Industry Classification Standard ® . |
| (2) |
Includes mutual funds, pension funds, private equity and real estate funds, exchanges and clearinghouses, and diversified financial services. |
| 115 |
|
Table of Contents
Wealth Management Lending Activities. The principal Wealth Management lending activities include securities-based lending and residential real estate loans.
Securities-based lending provided to our retail clients is primarily conducted through our Portfolio Loan Account (“PLA”) and Liquidity Access Line (“LAL”) platforms which had an outstanding loan balance of $27.1 billion and $24.9 billion at June 30, 2016 and December 31, 2015, respectively. For more information about our securities-based lending and residential real estate loans, see “Quantitative and Qualitative Disclosures about Market Risk—Risk Management—Credit Risk—Lending Activities” in Part II, Item 7A of the 2015 Form 10-K.
For the current quarter, loans and lending commitments associated with the Wealth Management business segment lending activities increased by approximately 5.3%, mainly due to growth in LAL and residential real estate loans.
Wealth Management Lending Activities by Remaining Contractual Maturity
| At June 30, 2016 | ||||||||||||||||||||
| Years to Maturity | ||||||||||||||||||||
| Less than 1 | 1-3 | 3-5 | Over 5 | Total | ||||||||||||||||
| (dollars in millions) | ||||||||||||||||||||
|
Securities-based lending and other loans |
$ | 28,177 | $ | 1,474 | $ | 1,051 | $ | 869 | $ | 31,571 | ||||||||||
|
Residential real estate loans |
— | — | 48 | 22,648 | 22,696 | |||||||||||||||
|
|
|
|
|
|
|
|
|
|
|
|||||||||||
|
Total |
$ | 28,177 | $ | 1,474 | $ | 1,099 | $ | 23,517 | $ | 54,267 | ||||||||||
|
Lending commitments |
5,539 | 823 | 376 | 265 | 7,003 | |||||||||||||||
|
|
|
|
|
|
|
|
|
|
|
|||||||||||
|
Total loans and lending commitments |
$ | 33,716 | $ | 2,297 | $ | 1,475 | $ | 23,782 | $ | 61,270 | ||||||||||
|
|
|
|
|
|
|
|
|
|
|
|||||||||||
| At December 31, 2015 | ||||||||||||||||||||
| Years to Maturity | ||||||||||||||||||||
| Less than 1 | 1-3 | 3-5 | Over 5 | Total | ||||||||||||||||
| (dollars in millions) | ||||||||||||||||||||
|
Securities-based lending and other loans |
$ | 25,975 | $ | 1,004 | $ | 889 | $ | 749 | $ | 28,617 | ||||||||||
|
Residential real estate loans |
— | — | 35 | 20,870 | 20,905 | |||||||||||||||
|
|
|
|
|
|
|
|
|
|
|
|||||||||||
|
Total |
$ | 25,975 | $ | 1,004 | $ | 924 | $ | 21,619 | $ | 49,522 | ||||||||||
|
Lending commitments |
5,143 | 286 | 115 | 277 | 5,821 | |||||||||||||||
|
|
|
|
|
|
|
|
|
|
|
|||||||||||
|
Total loans and lending commitments |
$ | 31,118 | $ | 1,290 | $ | 1,039 | $ | 21,896 | $ | 55,343 | ||||||||||
|
|
|
|
|
|
|
|
|
|
|
|||||||||||
|
|
116 |
Table of Contents
Credit Exposure—Derivatives
We incur credit risk as a dealer in OTC derivatives. Credit risk with respect to derivative instruments arises from the failure of a counterparty to perform according to the terms of the contract. In connection with our OTC derivative activities, we generally enter into master netting agreements and collateral arrangements with counterparties. These agreements provide us with the ability to demand collateral, as well as to liquidate collateral and offset receivables and payables covered under the same master netting agreement in the event of counterparty default. We manage our trading positions by employing a variety of risk mitigation strategies. These strategies include diversification of risk exposures and hedging. Hedging activities consist of the purchase or sale of positions in related securities and financial instruments, including a variety of derivative products ( e.g. , futures, forwards, swaps and options). For credit exposure information on our OTC derivative products, see Note 4 to the consolidated financial statements in Item 1. For a discussion of our credit exposure to derivative contracts, see “Quantitative and Qualitative Disclosures about Market Risk—Risk Management—Credit Risk—Credit Exposure—Derivatives” in Part II, Item 7A of the 2015 Form 10-K.
Credit Derivative Portfolio by Counterparty Type
The fair values shown herein are before the application of contractual netting or collateral. For additional credit exposure information on our credit derivative portfolio, see Note 4 to the consolidated financial statements in Item 1.
| At June 30, 2016 | ||||||||||||||||||||
| Fair Values(1) | Notionals | |||||||||||||||||||
| Receivable | Payable | Net |
Protection
Purchased |
Protection
Sold |
||||||||||||||||
|
(dollars in millions) |
||||||||||||||||||||
|
Banks and securities firms |
$ | 11,974 | $ | 12,705 | $ | (731) | $ | 435,374 | $ | 388,776 | ||||||||||
|
Insurance and other financial institutions |
4,424 | 5,013 | (589) | 165,290 | 175,372 | |||||||||||||||
|
Non-financial entities |
63 | 103 | (40) | 5,196 | 3,142 | |||||||||||||||
|
|
|
|
|
|
|
|
|
|
|
|||||||||||
|
Total |
$ | 16,461 | $ | 17,821 | $ | (1,360) | $ | 605,860 | $ | 567,290 | ||||||||||
|
|
|
|
|
|
|
|
|
|
|
|||||||||||
| At December 31, 2015 | ||||||||||||||||||||
| Fair Values(1) | Notionals | |||||||||||||||||||
| Receivable | Payable | Net |
Protection
Purchased |
Protection Sold | ||||||||||||||||
|
(dollars in millions) |
||||||||||||||||||||
|
Banks and securities firms |
$ | 16,962 | $ | 17,295 | $ | (333) | $ | 533,557 | $ | 491,267 | ||||||||||
|
Insurance and other financial institutions |
5,842 | 6,247 | (405) | 189,439 | 194,723 | |||||||||||||||
|
Non-financial entities |
115 | 123 | (8) | 5,932 | 3,529 | |||||||||||||||
|
|
|
|
|
|
|
|
|
|
|
|||||||||||
|
Total |
$ | 22,919 | $ | 23,665 | $ | (746) | $ | 728,928 | $ | 689,519 | ||||||||||
|
|
|
|
|
|
|
|
|
|
|
|||||||||||
| (1) |
Our CDS are classified in either Level 2 or Level 3 of the fair value hierarchy. Approximately 2% and 3% of receivable fair values and 8% and 6% of payable fair values represented Level 3 amounts at June 30, 2016 and December 31, 2015, respectively (see Note 3 to the consolidated financial statements in Item 1). |
| 117 |
|
Table of Contents
OTC Derivative Products at Fair Value, Net of Collateral, by Industry
| Industry(1) |
At June 30,
2016 |
At December 31,
2015 |
||||||
| (dollars in millions) | ||||||||
|
Utilities |
$ | 4,315 | $ | 3,428 | ||||
|
Banks and securities firms |
4,266 | 1,672 | ||||||
|
Funds, exchanges and other financial services(2) |
2,869 | 2,029 | ||||||
|
Industrials |
1,929 | 2,304 | ||||||
|
Regional governments |
1,568 | 1,163 | ||||||
|
Healthcare |
1,400 | 1,041 | ||||||
|
Sovereign governments |
1,017 | 524 | ||||||
|
Not-for-profit organizations |
979 | 794 | ||||||
|
Special purpose vehicles |
958 | 718 | ||||||
|
Consumer discretionary |
646 | 725 | ||||||
|
Insurance |
534 | 380 | ||||||
|
Energy |
529 | 396 | ||||||
|
Consumer staples |
473 | 506 | ||||||
|
Materials |
446 | 473 | ||||||
|
Information technology |
380 | 294 | ||||||
|
Other |
351 | 177 | ||||||
|
|
|
|
|
|||||
|
Total(3) |
$ | 22,660 | $ | 16,624 | ||||
|
|
|
|
|
|||||
| (1) |
Industry categories are based on the Global Industry Classification Standard ® . |
| (2) |
Amounts include mutual funds, pension funds, private equity and real estate funds, exchanges and clearinghouses, and diversified financial services. |
| (3) |
For further information on derivative instruments and hedging activities, see Note 4 to the consolidated financial statements in Item 1. |
|
|
118 |
Table of Contents
Top Ten Country Exposures at June 30, 2016
|
Country |
Net Inventory(1) |
Net
Counterparty Exposure(2)(3) |
Loans |
Lending
Commitments |
Exposure Before
Hedges |
Hedges(4) | Net Exposure(5) | |||||||||||||||||||||
| (dollars in millions) | ||||||||||||||||||||||||||||
|
United Kingdom: |
||||||||||||||||||||||||||||
|
Sovereigns |
$ | (200) | $ | 22 | $ | — | $ | — | $ | (178) | $ | (163) | $ | (341) | ||||||||||||||
|
Non-sovereigns |
580 | 10,381 | 2,684 | 5,786 | 19,431 | (2,026) | 17,405 | |||||||||||||||||||||
|
|
|
|
|
|
|
|
|
|
|
|
|
|
|
|||||||||||||||
|
Subtotal |
$ | 380 | $ | 10,403 | $ | 2,684 | $ | 5,786 | $ | 19,253 | $ | (2,189) | $ | 17,064 | ||||||||||||||
|
|
|
|
|
|
|
|
|
|
|
|
|
|
|
|||||||||||||||
|
Brazil: |
||||||||||||||||||||||||||||
|
Sovereigns |
$ | 4,848 | $ | — | $ | — | $ | — | $ | 4,848 | $ | (11) | $ | 4,837 | ||||||||||||||
|
Non-sovereigns |
24 | 307 | 1,123 | 33 | 1,487 | (863) | 624 | |||||||||||||||||||||
|
|
|
|
|
|
|
|
|
|
|
|
|
|
|
|||||||||||||||
|
Subtotal |
$ | 4,872 | $ | 307 | $ | 1,123 | $ | 33 | $ | 6,335 | $ | (874) | $ | 5,461 | ||||||||||||||
|
|
|
|
|
|
|
|
|
|
|
|
|
|
|
|||||||||||||||
|
Germany: |
||||||||||||||||||||||||||||
|
Sovereigns |
$ | 1,254 | $ | 770 | $ | — | $ | — | $ | 2,024 | $ | (1,239) | $ | 785 | ||||||||||||||
|
Non-sovereigns |
399 | 2,005 | 308 | 3,467 | 6,179 | (1,795) | 4,384 | |||||||||||||||||||||
|
|
|
|
|
|
|
|
|
|
|
|
|
|
|
|||||||||||||||
|
Subtotal |
$ | 1,653 | $ | 2,775 | $ | 308 | $ | 3,467 | $ | 8,203 | $ | (3,034) | $ | 5,169 | ||||||||||||||
|
|
|
|
|
|
|
|
|
|
|
|
|
|
|
|||||||||||||||
|
Japan: |
||||||||||||||||||||||||||||
|
Sovereigns |
$ | 1,967 | $ | 154 | $ | — | $ | — | $ | 2,121 | $ | (82) | $ | 2,039 | ||||||||||||||
|
Non-sovereigns |
452 | 2,480 | 231 | — | 3,163 | (153) | 3,010 | |||||||||||||||||||||
|
|
|
|
|
|
|
|
|
|
|
|
|
|
|
|||||||||||||||
|
Subtotal |
$ | 2,419 | $ | 2,634 | $ | 231 | $ | — | $ | 5,284 | $ | (235) | $ | 5,049 | ||||||||||||||
|
|
|
|
|
|
|
|
|
|
|
|
|
|
|
|||||||||||||||
|
Italy: |
||||||||||||||||||||||||||||
|
Sovereigns |
$ | 1,457 | $ | 19 | $ | — | $ | — | $ | 1,476 | $ | 44 | $ | 1,520 | ||||||||||||||
|
Non-sovereigns |
361 | 575 | 11 | 914 | 1,861 | (254) | 1,607 | |||||||||||||||||||||
|
|
|
|
|
|
|
|
|
|
|
|
|
|
|
|||||||||||||||
|
Subtotal |
$ | 1,818 | $ | 594 | $ | 11 | $ | 914 | $ | 3,337 | $ | (210) | $ | 3,127 | ||||||||||||||
|
|
|
|
|
|
|
|
|
|
|
|
|
|
|
|||||||||||||||
|
Singapore: |
||||||||||||||||||||||||||||
|
Sovereigns |
$ | 1,873 | $ | 165 | $ | — | $ | — | $ | 2,038 | $ | — | $ | 2,038 | ||||||||||||||
|
Non-sovereigns |
19 | 200 | 42 | 30 | 291 | — | 291 | |||||||||||||||||||||
|
|
|
|
|
|
|
|
|
|
|
|
|
|
|
|||||||||||||||
|
Subtotal |
$ | 1,892 | $ | 365 | $ | 42 | $ | 30 | $ | 2,329 | $ | — | $ | 2,329 | ||||||||||||||
|
|
|
|
|
|
|
|
|
|
|
|
|
|
|
|||||||||||||||
|
Canada: |
||||||||||||||||||||||||||||
|
Sovereigns |
$ | 26 | $ | 69 | $ | — | $ | — | $ | 95 | $ | — | $ | 95 | ||||||||||||||
|
Non-sovereigns |
(51) | 873 | 148 | 1,570 | 2,540 | (341) | 2,199 | |||||||||||||||||||||
|
|
|
|
|
|
|
|
|
|
|
|
|
|
|
|||||||||||||||
|
Subtotal |
$ | (25) | $ | 942 | $ | 148 | $ | 1,570 | $ | 2,635 | $ | (341) | $ | 2,294 | ||||||||||||||
|
|
|
|
|
|
|
|
|
|
|
|
|
|
|
|||||||||||||||
|
China: |
||||||||||||||||||||||||||||
|
Sovereigns |
$ | 135 | $ | 230 | $ | — | $ | — | $ | 365 | $ | (542) | $ | (177) | ||||||||||||||
|
Non-sovereigns |
880 | 276 | 990 | 275 | 2,421 | (74) | 2,347 | |||||||||||||||||||||
|
|
|
|
|
|
|
|
|
|
|
|
|
|
|
|||||||||||||||
|
Subtotal |
$ | 1,015 | $ | 506 | $ | 990 | $ | 275 | $ | 2,786 | $ | (616) | $ | 2,170 | ||||||||||||||
|
|
|
|
|
|
|
|
|
|
|
|
|
|
|
|||||||||||||||
|
Netherlands: |
||||||||||||||||||||||||||||
|
Sovereigns |
$ | (87) | $ | — | $ | — | $ | — | $ | (87) | $ | (9) | $ | (96) | ||||||||||||||
|
Non-sovereigns |
391 | 747 | 385 | 1,065 | 2,588 | (399) | 2,189 | |||||||||||||||||||||
|
|
|
|
|
|
|
|
|
|
|
|
|
|
|
|||||||||||||||
|
Subtotal |
$ | 304 | $ | 747 | $ | 385 | $ | 1,065 | $ | 2,501 | $ | (408) | $ | 2,093 | ||||||||||||||
|
|
|
|
|
|
|
|
|
|
|
|
|
|
|
|||||||||||||||
|
United Arab Emirates: |
||||||||||||||||||||||||||||
|
Sovereigns |
$ | (21) | $ | 1,491 | $ | — | $ | — | $ | 1,470 | $ | (35) | $ | 1,435 | ||||||||||||||
|
Non-sovereigns |
(22) | 328 | 47 | 83 | 436 | (15) | 421 | |||||||||||||||||||||
|
|
|
|
|
|
|
|
|
|
|
|
|
|
|
|||||||||||||||
|
Subtotal |
$ | (43) | $ | 1,819 | $ | 47 | $ | 83 | $ | 1,906 | $ | (50) | $ | 1,856 | ||||||||||||||
|
|
|
|
|
|
|
|
|
|
|
|
|
|
|
|||||||||||||||
| (1) |
Net inventory represents exposure to both long and short single-name and index positions ( i.e. , bonds and equities at fair value and CDS based on a notional amount assuming zero recovery adjusted for any fair value receivable or payable). As a market maker, we may transact in these CDS positions to facilitate client trading. At June 30, 2016, gross purchased protection, gross written protection, and net exposures related to single-name and index credit derivatives for those countries were $(99.4) billion, $98.0 billion and $(1.4) billion, respectively. For a further description of the triggers for purchased credit protection and whether those triggers may limit the effectiveness of our hedges, see “Credit Exposure—Derivatives” herein. |
| 119 |
|
Table of Contents
| (2) |
Net counterparty exposure ( i.e ., repurchase transactions, securities lending and OTC derivatives) takes into consideration legally enforceable master netting agreements and collateral. |
| (3) |
At June 30, 2016, the benefit of collateral received against counterparty credit exposure was $15.6 billion in the U.K., with 97% of collateral consisting of cash, government obligations of the U.K., U.S. and Italy, and $14.0 billion in Germany with 99% of collateral consisting of cash and government obligations of France, Belgium and Germany. The benefit of collateral received against counterparty credit exposure in the other countries totaled approximately $12.9 billion, with collateral primarily consisting of cash and government obligations of Japan, the U.S. and Brazil. These amounts do not include collateral received on secured financing transactions. |
| (4) |
Amounts represent CDS hedges (purchased and sold) on net counterparty exposure and lending executed by trading desks responsible for hedging counterparty and lending credit risk exposures for us. Amounts are based on the CDS notional amount assuming zero recovery adjusted for any fair value receivable or payable. |
| (5) |
In addition, at June 30, 2016, we had exposure to these countries for overnight deposits with banks of approximately $11.9 billion. |
|
|
120 |
Table of Contents
| 121 |
|
Table of Contents
FINANCIAL DATA SUPPLEMENT (Unaudited)
Average Balances and Interest Rates and Net Interest Income
| Three Months Ended June 30, 2016 | ||||||||||||
|
Average
Daily Balance |
Interest |
Annualized
Average Rate |
||||||||||
| (dollars in millions) | ||||||||||||
|
Assets |
||||||||||||
|
Interest earning assets: |
||||||||||||
|
Trading assets(1): |
||||||||||||
|
U.S. |
$ | 100,731 | $ | 459 | 1.8 | % | ||||||
|
Non-U.S. |
101,631 | 67 | 0.3 | |||||||||
|
Investment securities: |
||||||||||||
|
U.S. |
78,233 | 237 | 1.2 | |||||||||
|
Loans: |
||||||||||||
|
U.S. |
88,908 | 674 | 3.0 | |||||||||
|
Non-U.S. |
436 | 6 | 5.3 | |||||||||
|
Interest bearing deposits with banks: |
||||||||||||
|
U.S. |
27,821 | 38 | 0.6 | |||||||||
|
Non-U.S. |
1,429 | 14 | 3.8 | |||||||||
|
Securities purchased under agreements to resell and Securities borrowed(2): |
||||||||||||
|
U.S. |
157,223 | (64) | (0.2) | |||||||||
|
Non-U.S. |
82,863 | (56) | (0.3) | |||||||||
|
Customer receivables and Other(3): |
||||||||||||
|
U.S. |
46,144 | 233 | 2.0 | |||||||||
|
Non-U.S. |
21,655 | 59 | 1.1 | |||||||||
|
|
|
|
|
|||||||||
|
Total |
$ | 707,074 | $ | 1,667 | 0.9 | % | ||||||
|
|
|
|||||||||||
|
Non-interest earning assets |
107,742 | |||||||||||
|
|
|
|||||||||||
|
Total assets |
$ | 814,816 | ||||||||||
|
|
|
|||||||||||
|
Liabilities and Equity |
||||||||||||
|
Interest bearing liabilities: |
||||||||||||
|
Deposits: |
||||||||||||
|
U.S. |
$ | 152,792 | $ | 10 | — | % | ||||||
|
Non-U.S. |
2,043 | 5 | 1.0 | |||||||||
|
Short-term borrowings(4): |
||||||||||||
|
U.S. |
467 | — | 0.2 | |||||||||
|
Non-U.S. |
651 | 7 | 4.6 | |||||||||
|
Long-term borrowings(4): |
||||||||||||
|
U.S. |
154,745 | 835 | 2.2 | |||||||||
|
Non-U.S. |
8,198 | 9 | 0.4 | |||||||||
|
Trading liabilities(1): |
||||||||||||
|
U.S. |
31,410 | — | — | |||||||||
|
Non-U.S. |
51,385 | — | — | |||||||||
|
Securities sold under agreements to repurchase and Securities loaned(5): |
||||||||||||
|
U.S. |
31,412 | 141 | 1.8 | |||||||||
|
Non-U.S. |
31,729 | 118 | 1.5 | |||||||||
|
Customer payables and Other(6): |
||||||||||||
|
U.S. |
124,463 | (335) | (1.1) | |||||||||
|
Non-U.S. |
61,729 | (36) | (0.2) | |||||||||
|
|
|
|
|
|||||||||
|
Total |
$ | 651,024 | $ | 754 | 0.5 | |||||||
|
|
|
|||||||||||
|
Non-interest bearing liabilities and equity |
163,792 | |||||||||||
|
|
|
|||||||||||
|
Total liabilities and equity |
$ | 814,816 | ||||||||||
|
|
|
|||||||||||
|
Net interest income and net interest rate spread |
$ | 913 | 0.4 | % | ||||||||
|
|
|
|
|
|||||||||
|
|
122 |
Table of Contents
FINANCIAL DATA SUPPLEMENT (Unaudited)—(Continued)
Average Balances and Interest Rates and Net Interest Income
| Three Months Ended June 30, 2015 | ||||||||||||
|
Average
Daily Balance |
Interest |
Annualized
Average Rate |
||||||||||
| (dollars in millions) | ||||||||||||
|
Assets |
||||||||||||
|
Interest earning assets: |
||||||||||||
|
Trading assets(1): |
||||||||||||
|
U.S. |
$ | 86,632 | $ | 466 | 2.2 | % | ||||||
|
Non-U.S. |
134,452 | 89 | 0.3 | |||||||||
|
Investment securities: |
||||||||||||
|
U.S. |
71,668 | 238 | 1.3 | |||||||||
|
Loans: |
||||||||||||
|
U.S. |
72,960 | 526 | 2.9 | |||||||||
|
Non-U.S. |
239 | 3 | 5.1 | |||||||||
|
Interest bearing deposits with banks: |
||||||||||||
|
U.S. |
17,637 | 14 | 0.3 | |||||||||
|
Non-U.S. |
946 | 8 | 3.4 | |||||||||
|
Securities purchased under agreements to resell and Securities borrowed(2): |
||||||||||||
|
U.S. |
174,981 | (182) | (0.4) | |||||||||
|
Non-U.S. |
76,904 | (18) | (0.1) | |||||||||
|
Customer receivables and Other(3): |
||||||||||||
|
U.S. |
54,343 | 99 | 0.7 | |||||||||
|
Non-U.S. |
31,137 | 143 | 1.9 | |||||||||
|
|
|
|
|
|||||||||
|
Total |
$ | 721,899 | $ | 1,386 | 0.8 | % | ||||||
|
|
|
|||||||||||
|
Non-interest earning assets |
125,866 | |||||||||||
|
|
|
|||||||||||
|
Total assets |
$ | 847,765 | ||||||||||
|
|
|
|||||||||||
|
Liabilities and Equity |
||||||||||||
|
Interest bearing liabilities: |
||||||||||||
|
Deposits: |
||||||||||||
|
U.S. |
$ | 134,566 | $ | 16 | — | % | ||||||
|
Non-U.S. |
1,884 | 1 | 0.2 | |||||||||
|
Short-term borrowings(4): |
||||||||||||
|
U.S. |
1,157 | — | — | |||||||||
|
Non-U.S. |
1,361 | 5 | 1.5 | |||||||||
|
Long-term borrowings(4): |
||||||||||||
|
U.S. |
149,950 | 907 | 2.5 | |||||||||
|
Non-U.S. |
7,441 | 8 | 0.4 | |||||||||
|
Trading liabilities(1): |
||||||||||||
|
U.S. |
19,703 | — | — | |||||||||
|
Non-U.S. |
66,074 | — | — | |||||||||
|
Securities sold under agreements to repurchase and Securities loaned(5): |
||||||||||||
|
U.S. |
59,501 | 94 | 0.6 | |||||||||
|
Non-U.S. |
40,621 | 141 | 1.4 | |||||||||
|
Customer payables and Other(6): |
||||||||||||
|
U.S. |
53,206 | (483) | (3.7) | |||||||||
|
Non-U.S. |
124,827 | (1) | — | |||||||||
|
|
|
|
|
|||||||||
|
Total |
$ | 660,291 | $ | 688 | 0.4 | |||||||
|
|
|
|||||||||||
|
Non-interest bearing liabilities and equity |
187,474 | |||||||||||
|
|
|
|||||||||||
|
Total liabilities and equity |
$ | 847,765 | ||||||||||
|
|
|
|||||||||||
|
Net interest income and net interest rate spread |
$ | 698 | 0.4 | % | ||||||||
|
|
|
|
|
|||||||||
| 123 |
|
Table of Contents
FINANCIAL DATA SUPPLEMENT (Unaudited)—(Continued)
Average Balances and Interest Rates and Net Interest Income
| Six Months Ended June 30, 2016 | ||||||||||||
|
Average
Daily Balance |
Interest |
Annualized
Average Rate |
||||||||||
| (dollars in millions) | ||||||||||||
|
Assets |
||||||||||||
|
Interest earning assets: |
||||||||||||
|
Trading assets(1): |
||||||||||||
|
U.S. |
$ | 100,057 | $ | 957 | 1.9 | % | ||||||
|
Non-U.S. |
96,801 | 152 | 0.3 | |||||||||
|
Investment securities: |
||||||||||||
|
U.S. |
76,999 | 473 | 1.2 | |||||||||
|
Loans: |
||||||||||||
|
U.S. |
87,529 | 1,315 | 3.0 | |||||||||
|
Non-U.S. |
450 | 12 | 5.4 | |||||||||
|
Interest bearing deposits with banks: |
||||||||||||
|
U.S. |
29,289 | 80 | 0.5 | |||||||||
|
Non-U.S. |
1,225 | 25 | 4.1 | |||||||||
|
Securities purchased under agreements to resell and Securities borrowed(2): |
||||||||||||
|
U.S. |
154,488 | (126) | (0.2) | |||||||||
|
Non-U.S. |
84,499 | (72) | (0.2) | |||||||||
|
Customer receivables and Other(3): |
||||||||||||
|
U.S. |
47,400 | 468 | 2.0 | |||||||||
|
Non-U.S. |
22,092 | 130 | 1.2 | |||||||||
|
|
|
|
|
|||||||||
|
Total |
$ | 700,829 | $ | 3,414 | 1.0 | % | ||||||
|
|
|
|||||||||||
|
Non-interest earning assets |
108,150 | |||||||||||
|
|
|
|||||||||||
|
Total assets |
$ | 808,979 | ||||||||||
|
|
|
|||||||||||
|
Liabilities and Equity |
||||||||||||
|
Interest bearing liabilities: |
||||||||||||
|
Deposits: |
||||||||||||
|
U.S. |
$ | 154,540 | $ | 27 | — | % | ||||||
|
Non-U.S. |
2,353 | 10 | 0.9 | |||||||||
|
Short-term borrowings(4): |
||||||||||||
|
U.S. |
633 | 1 | 0.3 | |||||||||
|
Non-U.S. |
621 | 13 | 4.3 | |||||||||
|
Long-term borrowings(4): |
||||||||||||
|
U.S. |
153,073 | 1,786 | 2.4 | |||||||||
|
Non-U.S. |
7,732 | 18 | 0.5 | |||||||||
|
Trading liabilities(1): |
||||||||||||
|
U.S. |
31,735 | — | — | |||||||||
|
Non-U.S. |
49,756 | — | — | |||||||||
|
Securities sold under agreements to repurchase and Securities loaned(5): |
||||||||||||
|
U.S. |
31,635 | 271 | 1.7 | |||||||||
|
Non-U.S. |
28,144 | 242 | 1.7 | |||||||||
|
Customer payables and Other(6): |
||||||||||||
|
U.S. |
123,511 | (704) | (1.1) | |||||||||
|
Non-U.S. |
61,218 | (62) | (0.2) | |||||||||
|
|
|
|
|
|||||||||
|
Total |
$ | 644,951 | $ | 1,602 | 0.5 | |||||||
|
|
|
|||||||||||
|
Non-interest bearing liabilities and equity |
164,028 | |||||||||||
|
|
|
|||||||||||
|
Total liabilities and equity |
$ | 808,979 | ||||||||||
|
|
|
|||||||||||
|
Net interest income and net interest rate spread |
$ | 1,812 | 0.5 | % | ||||||||
|
|
|
|
|
|||||||||
|
|
124 |
Table of Contents
FINANCIAL DATA SUPPLEMENT (Unaudited)—(Continued)
Average Balances and Interest Rates and Net Interest Income
| Six Months Ended June 30, 2015 | ||||||||||||
|
Average
Daily Balance |
Interest |
Annualized
Average Rate |
||||||||||
| (dollars in millions) | ||||||||||||
|
Assets |
||||||||||||
|
Interest earning assets: |
||||||||||||
|
Trading assets(1): |
||||||||||||
|
U.S. |
$ | 88,677 | $ | 947 | 2.2 | % | ||||||
|
Non-U.S. |
125,895 | 202 | 0.3 | |||||||||
|
Investment securities: |
||||||||||||
|
U.S. |
71,495 | 438 | 1.2 | |||||||||
|
Loans: |
||||||||||||
|
U.S. |
69,845 | 995 | 2.9 | |||||||||
|
Non-U.S. |
258 | 9 | 7.1 | |||||||||
|
Interest bearing deposits with banks: |
||||||||||||
|
U.S. |
19,659 | 31 | 0.3 | |||||||||
|
Non-U.S. |
1,032 | 14 | 2.8 | |||||||||
|
Securities purchased under agreements to resell and Securities borrowed(2): |
||||||||||||
|
U.S. |
166,354 | (336) | (0.4) | |||||||||
|
Non-U.S. |
84,918 | 31 | 0.1 | |||||||||
|
Customer receivables and Other(3): |
||||||||||||
|
U.S. |
59,859 | 270 | 0.9 | |||||||||
|
Non-U.S. |
26,379 | 269 | 2.1 | |||||||||
|
|
|
|
|
|||||||||
|
Total |
$ | 714,371 | $ | 2,870 | 0.8 | % | ||||||
|
|
|
|||||||||||
|
Non-interest earning assets |
128,876 | |||||||||||
|
|
|
|||||||||||
|
Total assets |
$ | 843,247 | ||||||||||
|
|
|
|||||||||||
|
Liabilities and Equity |
||||||||||||
|
Interest bearing liabilities: |
||||||||||||
|
Deposits: |
||||||||||||
|
U.S. |
$ | 133,728 | $ | 33 | 0.1 | % | ||||||
|
Non-U.S. |
1,646 | 2 | 0.2 | |||||||||
|
Short-term borrowings(4): |
||||||||||||
|
U.S. |
1,158 | — | — | |||||||||
|
Non-U.S. |
1,137 | 9 | 1.6 | |||||||||
|
Long-term borrowings(4): |
||||||||||||
|
U.S. |
148,980 | 1,824 | 2.5 | |||||||||
|
Non-U.S. |
7,892 | 17 | 0.4 | |||||||||
|
Trading liabilities(1): |
||||||||||||
|
U.S. |
19,820 | — | — | |||||||||
|
Non-U.S. |
62,582 | — | — | |||||||||
|
Securities sold under agreements to repurchase and Securities loaned(5): |
||||||||||||
|
U.S. |
64,010 | 225 | 0.7 | |||||||||
|
Non-U.S. |
36,598 | 318 | 1.8 | |||||||||
|
Customer payables and Other(6): |
||||||||||||
|
U.S. |
57,825 | (864) | (3.0) | |||||||||
|
Non-U.S. |
120,318 | 12 | — | |||||||||
|
|
|
|
|
|||||||||
|
Total |
$ | 655,694 | $ | 1,576 | 0.5 | |||||||
|
|
|
|||||||||||
|
Non-interest bearing liabilities and equity |
187,553 | |||||||||||
|
|
|
|||||||||||
|
Total liabilities and equity |
$ | 843,247 | ||||||||||
|
|
|
|||||||||||
|
Net interest income and net interest rate spread |
$ | 1,294 | 0.3 | % | ||||||||
|
|
|
|
|
|||||||||
| (1) |
Interest expense on Trading liabilities is reported as a reduction of Interest income on Trading assets. |
| (2) |
Includes fees paid on Securities borrowed. |
| (3) |
Includes interest from customer receivables and other interest earning assets. |
| (4) |
The Firm also issues structured notes that have coupon or repayment terms linked to the performance of debt or equity securities, indices, currencies or commodities, which are recorded within Trading revenues (see Note 3 to the consolidated financial statements in Item 1). |
| (5) |
Includes fees received on Securities loaned. |
| (6) |
Includes fees received from prime brokerage customers for stock loan transactions incurred to cover customers’ short positions. |
| 125 |
|
Table of Contents
FINANCIAL DATA SUPPLEMENT (Unaudited)—(Continued)
Rate/Volume Analysis
Effect of Net Interest Income of Volume and Rate Changes
|
Three Months Ended June 30, 2016 versus
Three Months Ended June 30, 2015 |
||||||||||||
|
Increase (decrease) due to change in: |
||||||||||||
|
Volume |
Rate |
Net Change |
||||||||||
|
(dollars in millions) |
||||||||||||
|
Interest earning assets |
||||||||||||
|
Trading Assets: |
||||||||||||
|
U.S. |
$ | 76 | $ | (83) | $ | (7) | ||||||
|
Non-U.S. |
(22) | — | (22) | |||||||||
|
Investment securities: |
||||||||||||
|
U.S. |
22 | (23) | (1) | |||||||||
|
Loans: |
||||||||||||
|
U.S. |
115 | 33 | 148 | |||||||||
|
Non-U.S. |
2 | 1 | 3 | |||||||||
|
Interest bearing deposits with banks: |
||||||||||||
|
U.S. |
8 | 16 | 24 | |||||||||
|
Non-U.S. |
4 | 2 | 6 | |||||||||
|
Securities purchased under agreements to resell and Securities borrowed: |
||||||||||||
|
U.S. |
18 | 100 | 118 | |||||||||
|
Non-U.S. |
(1) | (37) | (38) | |||||||||
|
Customer receivables and Other: |
||||||||||||
|
U.S. |
(15) | 149 | 134 | |||||||||
|
Non-U.S. |
(44) | (40) | (84) | |||||||||
|
|
|
|
|
|
|
|||||||
|
Change in interest income |
$ | 163 | $ | 118 | $ | 281 | ||||||
|
|
|
|
|
|
|
|||||||
|
Interest bearing liabilities |
||||||||||||
|
Deposits: |
||||||||||||
|
U.S. |
$ | 2 | $ | (8) | $ | (6) | ||||||
|
Non-U.S. |
— | 4 | 4 | |||||||||
|
Short-term borrowings: |
||||||||||||
|
U.S. |
— | — | — | |||||||||
|
Non-U.S. |
(3) | 5 | 2 | |||||||||
|
Long-term borrowings: |
||||||||||||
|
U.S. |
29 | (101) | (72) | |||||||||
|
Non-U.S. |
1 | — | 1 | |||||||||
|
Securities sold under agreements to repurchase and Securities loaned: |
||||||||||||
|
U.S. |
(44) | 91 | 47 | |||||||||
|
Non-U.S. |
(31) | 8 | (23) | |||||||||
|
Customer payables and Other: |
||||||||||||
|
U.S. |
(647) | 795 | 148 | |||||||||
|
Non-U.S. |
1 | (36) | (35) | |||||||||
|
|
|
|
|
|
|
|||||||
|
Change in interest expense |
$ | (692) | $ | 758 | $ | 66 | ||||||
|
|
|
|
|
|
|
|||||||
|
Change in net interest income |
$ | 855 | $ | (640) | $ | 215 | ||||||
|
|
|
|
|
|
|
|||||||
|
|
126 |
Table of Contents
FINANCIAL DATA SUPPLEMENT (Unaudited)—(Continued)
Rate/Volume Analysis
|
Six Months Ended June 30, 2016 versus
Six Months Ended June 30, 2015 |
||||||||||||
|
Increase (decrease) due to change in: |
||||||||||||
|
Volume |
Rate |
Net Change |
||||||||||
|
(dollars in millions) |
||||||||||||
|
Interest earning assets |
||||||||||||
|
Trading assets: |
||||||||||||
|
U.S. |
$ | 122 | $ | (112) | $ | 10 | ||||||
|
Non-U.S. |
(47) | (3) | (50) | |||||||||
|
Investment securities: |
||||||||||||
|
U.S. |
34 | 1 | 35 | |||||||||
|
Loans: |
||||||||||||
|
U.S. |
252 | 68 | 320 | |||||||||
|
Non-U.S. |
7 | (4) | 3 | |||||||||
|
Interest bearing deposits with banks: |
||||||||||||
|
U.S. |
15 | 34 | 49 | |||||||||
|
Non-U.S. |
3 | 8 | 11 | |||||||||
|
Securities purchased under agreements to resell and Securities borrowed: |
||||||||||||
|
U.S. |
24 | 186 | 210 | |||||||||
|
Non-U.S. |
— | (103) | (103) | |||||||||
|
Customer receivables and Other: |
||||||||||||
|
U.S. |
(56) | 254 | 198 | |||||||||
|
Non-U.S. |
(44) | (95) | (139) | |||||||||
|
|
|
|
|
|
|
|||||||
|
Change in interest income |
$ | 310 | $ | 234 | $ | 544 | ||||||
|
|
|
|
|
|
|
|||||||
|
Interest bearing liabilities |
||||||||||||
|
Deposits: |
||||||||||||
|
U.S. |
$ | 5 | $ | (11) | $ | (6) | ||||||
|
Non-U.S. |
1 | 7 | 8 | |||||||||
|
Short-term borrowings: |
||||||||||||
|
U.S. |
— | 1 | 1 | |||||||||
|
Non-U.S. |
(4) | 8 | 4 | |||||||||
|
Long-term borrowings: |
||||||||||||
|
U.S. |
50 | (88) | (38) | |||||||||
|
Non-U.S. |
— | 1 | 1 | |||||||||
|
Securities sold under agreements to repurchase and Securities loaned: |
||||||||||||
|
U.S. |
(114) | 160 | 46 | |||||||||
|
Non-U.S. |
(73) | (3) | (76) | |||||||||
|
Customer payables and Other: |
||||||||||||
|
U.S. |
(981) | 1,141 | 160 | |||||||||
|
Non-U.S. |
(6) | (68) | (74) | |||||||||
|
|
|
|
|
|
|
|||||||
|
Change in interest expense |
$ | (1,122) | $ | 1,148 | $ | 26 | ||||||
|
|
|
|
|
|
|
|||||||
|
Change in net interest income |
$ | 1,432 | $ | (914) | $ | 518 | ||||||
|
|
|
|
|
|
|
|||||||
| 127 |
|
Table of Contents
| Item 1. | Legal Proceedings |
|
|
128 |
Table of Contents
| Item 2. | Unregistered Sales of Equity Securities and Use of Proceeds |
The following table sets forth the information with respect to purchases made by or on behalf of the Firm of its common stock during the quarterly period ended June 30, 2016.
Issuer Purchases of Equity Securities
(dollars in millions, except per share amounts)
|
Period |
Total Number of
Shares Purchased |
Average Price
Paid Per Share |
Total Number of
Shares Purchased as Part of Publicly Announced Plans of Programs(1) |
Approximate Dollar
Value of Shares that May Yet be Purchased Under the Plans or Programs |
||||||||||||
|
Month #1 (April 1, 2016-April 30, 2016) |
||||||||||||||||
|
Share Repurchase Program(2) |
3,670,865 | $ | 27.15 | 3,670,865 | $ | 525 | ||||||||||
|
Employee transactions(3) |
1,068,030 | $ | 26.05 | — | — | |||||||||||
|
Month #2 (May 1, 2016-May 31, 2016) |
||||||||||||||||
|
Share Repurchase Program(2) |
11,623,406 | $ | 26.71 | 11,623,406 | $ | 215 | ||||||||||
|
Employee transactions(3) |
13,059 | $ | 27.24 | — | — | |||||||||||
|
Month #3 (June 1, 2016-June 30, 2016) |
||||||||||||||||
|
Share Repurchase Program(2) |
8,188,782 | $ | 26.25 | 8,188,782 | $ | 3,500 | ||||||||||
|
Employee transactions(3) |
16,489 | $ | 27.12 | — | — | |||||||||||
|
Quarter ended at June 30, 2016 |
||||||||||||||||
|
Share Repurchase Program(2) |
23,483,053 | $ | 26.61 | 23,483,053 | $ | 3,500 | ||||||||||
|
Employee transactions(3) |
1,097,578 | $ | 26.08 | — | — | |||||||||||
| (1) |
Share purchases under publicly announced programs are made pursuant to open-market purchases, Rule 10b5-1 plans or privately negotiated transactions (including with employee benefit plans) as market conditions warrant and at prices the Firm deems appropriate and may be suspended at any time. |
| (2) |
The Firm’s Board of Directors has authorized the repurchase of the Firm’s outstanding stock under a share repurchase program (the “Share Repurchase Program”). The Share Repurchase Program is a program for capital management purposes that considers, among other things, business segment capital needs, as well as equity-based compensation and benefit plan requirements. The Share Repurchase Program has no set expiration or termination date. Share repurchases by the Firm are subject to regulatory approval. In June 2016, the Firm received a conditional non-objection from the Federal Reserve to its 2016 capital plan, which included a share repurchase of up to $3.5 billion of the Firm’s outstanding common stock during the period beginning July 1, 2016 through June 30, 2017. During the current quarter, the Firm repurchased approximately $625 million of the Firm’s outstanding common stock as part of its Share Repurchase Program. For further information, see “Liquidity and Capital Resources—Capital Management” in Part I, Item 2. |
| (3) |
Includes shares acquired by the Firm in satisfaction of the tax withholding obligations on stock-based awards and the exercise of stock options granted under the Firm’s stock-based compensation plans. |
| Item 6. | Exhibits |
An exhibit index has been filed as part of this Report on Page E-1.
| 129 |
|
Table of Contents
SIGNATURES
Pursuant to the requirements of the Securities Exchange Act of 1934, the Registrant has duly caused this report to be signed on its behalf by the undersigned thereunto duly authorized.
|
MORGAN STANLEY (Registrant) |
||
|
By: /s/ J ONATHAN P RUZAN |
||
|
Jonathan Pruzan Executive Vice President and Chief Financial Officer |
||
|
By: /s/ P AUL C. W IRTH |
||
|
Paul C. Wirth Deputy Chief Financial Officer |
||
Date: August 3, 2016
|
|
130 |
Table of Contents
EXHIBIT INDEX
MORGAN STANLEY
Quarter Ended June 30, 2016
|
Exhibit No. |
Description |
|
|
10.1 |
Directors’ Equity Capital Accumulation Plan as amended and restated as of August 1, 2016. |
|
|
10.2 |
Morgan Stanley Schedule of Non-Employee Directors Annual Compensation, effective as of August 1, 2016. |
|
|
12 |
Statement Re: Computation of Ratio of Earnings to Fixed Charges and Computation of Earnings to Fixed Charges and Preferred Stock Dividends. |
|
|
15 |
Letter of awareness from Deloitte & Touche LLP, dated August 3, 2016, concerning unaudited interim financial information. |
|
|
31.1 |
Rule 13a-14(a) Certification of Chief Executive Officer. |
|
|
31.2 |
Rule 13a-14(a) Certification of Chief Financial Officer. |
|
|
32.1 |
Section 1350 Certification of Chief Executive Officer. |
|
|
32.2 |
Section 1350 Certification of Chief Financial Officer. |
|
|
101 |
Interactive data files pursuant to Rule 405 of Regulation S-T: (i) the Consolidated Statements of Income—Three Months and Six Months Ended June 30, 2016 and 2015, (ii) the Consolidated Statements of Comprehensive Income—Three Months and Six Months Ended June 30, 2016 and 2015, (iii) the Consolidated Balance Sheets—June 30, 2016 and December 31, 2015, (iv) the Consolidated Statements of Changes in Total Equity—Six Months Ended June 30, 2016 and 2015, (v) the Consolidated Statements of Cash Flows—Six Months Ended June 30, 2016 and 2015, and (vi) Notes to Consolidated Financial Statements (unaudited). |
| E-1 |
|