|
|
|
|
|
|
|
|
|
|
|
|
|
|
|
|
|
|
|
|
|
|
|
|
|
|
|
|
|
|
|
|
|
|
|
|
|
|
|
|
|
|
|
|
|
|
|
|
|
|
|
|
|
Table of Contents
UNITED STATES SECURITIES AND EXCHANGE COMMISSION
Washington, D.C. 20549
FORM 10-Q
☒ QUARTERLY REPORT PURSUANT TO SECTION 13 OR 15(d) OF THE SECURITIES
EXCHANGE ACT OF 1934
For the quarterly period ended September 30, 2018
OR
☐ TRANSITION REPORT PURSUANT TO SECTION 13 OR 15(d) OF THE SECURITIES
EXCHANGE ACT OF 1934
Commission File Number 1-11758

(Exact Name of Registrant as specified in its charter)
|
Delaware (State or other jurisdiction of incorporation or organization) |
1585 Broadway New York, NY 10036 (Address of principal executive offices, including zip code)
|
36-3145972 (I.R.S. Employer Identification No.) |
(212) 761-4000 (Registrant’s telephone number, including area code) |
|||
Indicate by check mark whether the Registrant (1) has filed all reports required to be filed by Section 13 or 15(d) of the Securities Exchange Act of 1934 during the preceding 12 months (or for such shorter period that the Registrant was required to file such reports), and (2) has been subject to such filing requirements for the past 90 days. Yes ☒ No ☐
Indicate by check mark whether the Registrant has submitted electronically every Interactive Data File required to be submitted pursuant to Rule 405 of Regulation S-T (§ 232.405 of this chapter) during the preceding 12 months (or for such shorter period that the Registrant was required to submit such files). Yes ☒ No ☐
Indicate by check mark whether the Registrant is a large accelerated filer, an accelerated filer, a non-accelerated filer, smaller reporting company, or an emerging growth company. See the definitions of “large accelerated filer,” “accelerated filer,” “smaller reporting company,” and “emerging growth company” in Rule 12b-2 of the Exchange Act. (Check one):
|
Large Accelerated Filer ☒ |
Accelerated Filer ☐ |
|
|
Non-Accelerated Filer ☐ |
Smaller reporting company ☐ |
|
|
Emerging growth company ☐ |
If an emerging growth company, indicate by check mark if the Registrant has elected not to use the extended transition period for complying with any new or revised financial accounting standards provided pursuant to Section 13(a) of the Exchange Act. ☐
Indicate by check mark whether the Registrant is a shell company (as defined in Rule 12b-2 of the Exchange Act). Yes ☐ No ☒
As of October 31, 2018, there were 1,720,154,771 shares of the Registrant’s Common Stock, par value $0.01 per share, outstanding.
Table of Contents

|
QUARTERLY REPORT ON FORM 10-Q
For the quarter ended September 30, 2018
| Table of Contents | Part | Item | Page | |||||
| I | 1 | |||||||
|
Management’s Discussion and Analysis of Financial Condition and Results of Operations |
I | 2 | 1 | |||||
| 1 | ||||||||
| 2 | ||||||||
| 7 | ||||||||
| 17 | ||||||||
| 17 | ||||||||
| 18 | ||||||||
| 18 | ||||||||
| I | 3 | 30 | ||||||
| 30 | ||||||||
| 32 | ||||||||
| 39 | ||||||||
| I | 1 | 40 | ||||||
| 40 | ||||||||
| 41 | ||||||||
|
Consolidated Balance Sheets (Unaudited at September 30, 2018) |
42 | |||||||
|
Consolidated Statements of Changes in Total Equity (Unaudited) |
43 | |||||||
| 44 | ||||||||
| 45 | ||||||||
| 45 | ||||||||
| 46 | ||||||||
| 48 | ||||||||
| 58 | ||||||||
| 61 | ||||||||
| 64 | ||||||||
|
7. Loans, Lending Commitments and Allowance for Credit Losses |
65 | |||||||
| 67 | ||||||||
| 68 | ||||||||
| 68 | ||||||||
| 68 | ||||||||
|
12. Variable Interest Entities and Securitization Activities |
72 | |||||||
| 74 | ||||||||
| 76 | ||||||||
| 79 | ||||||||
| 79 | ||||||||
| 79 | ||||||||
| 80 | ||||||||
| 80 | ||||||||
| 83 | ||||||||
| 84 | ||||||||
| 87 | ||||||||
| II | 89 | |||||||
| II | 1 | 89 | ||||||
| II | 2 | 90 | ||||||
| I | 4 | 91 | ||||||
| II | 6 | 91 | ||||||
| E-1 | ||||||||
| S-1 | ||||||||
| i |
Table of Contents
|
|
Available Information
We file annual, quarterly and current reports, proxy statements and other information with the SEC. The SEC maintains an internet site, www.sec.gov , that contains annual, quarterly and current reports, proxy and information statements and other information that issuers file electronically with the SEC. Our electronic SEC filings are available to the public at the SEC’s internet site.
Our internet site is www.morganstanley.com . You can access our Investor Relations webpage at www.morganstanley.com/about-us-ir . We make available free of charge, on or through our Investor Relations webpage, our Proxy Statements, Annual Reports on Form 10-K, Quarterly Reports on Form 10-Q, Current Reports on Form 8-K and any amendments to those reports filed or furnished pursuant to the Securities Exchange Act of 1934, as amended (“Exchange Act”), as soon as reasonably practicable after such material is electronically filed with, or furnished to, the SEC. We also make available, through our Investor Relations webpage, via a link to the SEC’s internet site, statements of beneficial ownership of our equity securities filed by our directors, officers, 10% or greater shareholders and others under Section 16 of the Exchange Act.
You can access information about our corporate governance at www.morganstanley.com/about-us-governance. Our Corporate Governance webpage includes:
| • |
Amended and Restated Certificate of Incorporation; |
| • |
Amended and Restated Bylaws; |
| • |
Charters for our Audit Committee, Compensation, Management Development and Succession Committee, Nominating and Governance Committee, Operations and Technology Committee, and Risk Committee; |
| • |
Corporate Governance Policies; |
| • |
Policy Regarding Corporate Political Activities; |
| • |
Policy Regarding Shareholder Rights Plan; |
| • |
Equity Ownership Commitment; |
| • |
Code of Ethics and Business Conduct; |
| • |
Code of Conduct; |
| • |
Integrity Hotline Information; and |
| • |
Environmental and Social Policies. |
Our Code of Ethics and Business Conduct applies to all directors, officers and employees, including our Chief Executive Officer, Chief Financial Officer and Deputy Chief Financial Officer. We will post any amendments to the Code of Ethics and Business Conduct and any waivers that are required to be disclosed by the rules of either the SEC or the New York Stock Exchange LLC (“NYSE”) on our internet site. You can request a copy of these documents, excluding exhibits, at no cost, by contacting Investor Relations, 1585 Broadway, New York, NY 10036 (212-761-4000). The information on our internet site is not incorporated by reference into this report.
| ii |
Table of Contents
Table of Contents
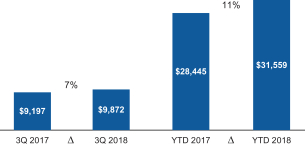
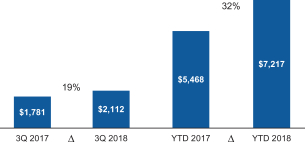
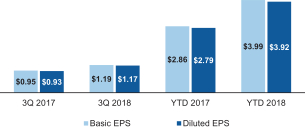
Table of Contents
| Management’s Discussion and Analysis |
|
| 3 | September 2018 Form 10-Q |
Table of Contents
| Management’s Discussion and Analysis |
|

| September 2018 Form 10-Q | 4 |
Table of Contents
| Management’s Discussion and Analysis |
|
| 5 | September 2018 Form 10-Q |
Table of Contents
| Management’s Discussion and Analysis |
|
| September 2018 Form 10-Q | 6 |
Table of Contents
| Management’s Discussion and Analysis |
|
| 7 | September 2018 Form 10-Q |
Table of Contents
| Management’s Discussion and Analysis |
|
Institutional Securities
| September 2018 Form 10-Q | 8 |
Table of Contents
| Management’s Discussion and Analysis |
|
| 9 | September 2018 Form 10-Q |
Table of Contents
| Management’s Discussion and Analysis |
|
| September 2018 Form 10-Q | 10 |
Table of Contents
| Management’s Discussion and Analysis |
|
| 11 | September 2018 Form 10-Q |
Table of Contents
| Management’s Discussion and Analysis |
|
Wealth Management
| September 2018 Form 10-Q | 12 |
Table of Contents
| Management’s Discussion and Analysis |
|
| 13 | September 2018 Form 10-Q |
Table of Contents
| Management’s Discussion and Analysis |
|
| September 2018 Form 10-Q | 14 |
Table of Contents
| Management’s Discussion and Analysis |
|
| 15 | September 2018 Form 10-Q |
Table of Contents
| Management’s Discussion and Analysis |
|
| September 2018 Form 10-Q | 16 |
Table of Contents
| Management’s Discussion and Analysis |
|
| 17 | September 2018 Form 10-Q |
Table of Contents
| Management’s Discussion and Analysis |
|
| September 2018 Form 10-Q | 18 |
Table of Contents
| Management’s Discussion and Analysis |
|
| 19 | September 2018 Form 10-Q |
Table of Contents
| Management’s Discussion and Analysis |
|
| September 2018 Form 10-Q | 20 |
Table of Contents
| Management’s Discussion and Analysis |
|
| 21 | September 2018 Form 10-Q |
Table of Contents
| Management’s Discussion and Analysis |
|
| September 2018 Form 10-Q | 22 |
Table of Contents
| Management’s Discussion and Analysis |
|
| 23 | September 2018 Form 10-Q |
Table of Contents
| Management’s Discussion and Analysis |
|
| September 2018 Form 10-Q | 24 |
Table of Contents
| Management’s Discussion and Analysis |
|
| 25 | September 2018 Form 10-Q |
Table of Contents
| Management’s Discussion and Analysis |
|
| September 2018 Form 10-Q | 26 |
Table of Contents
| Management’s Discussion and Analysis |
|
| 27 | September 2018 Form 10-Q |
Table of Contents
| Management’s Discussion and Analysis |
|
| September 2018 Form 10-Q | 28 |
Table of Contents
| Management’s Discussion and Analysis |
|
| 29 | September 2018 Form 10-Q |
Table of Contents
Table of Contents
| Risk Disclosures |
|

| 31 | September 2018 Form 10-Q |
Table of Contents
| Risk Disclosures |
|
| September 2018 Form 10-Q | 32 |
Table of Contents
| Risk Disclosures |
|
| 33 | September 2018 Form 10-Q |
Table of Contents
| Risk Disclosures |
|
| September 2018 Form 10-Q | 34 |
Table of Contents
| Risk Disclosures |
|
| 35 | September 2018 Form 10-Q |
Table of Contents
| Risk Disclosures |
|
| September 2018 Form 10-Q | 36 |
Table of Contents
| Risk Disclosures |
|
| 37 | September 2018 Form 10-Q |
Table of Contents
| Risk Disclosures |
|
| September 2018 Form 10-Q | 38 |
Table of Contents
Table of Contents
|
Consolidated Income Statement s (Unaudited) |
|
| Three Months Ended | Nine Months Ended | |||||||||||||||||||
| September 30, | September 30, | |||||||||||||||||||
| in millions, except per share data | 2018 | 2017 | 2018 | 2017 | ||||||||||||||||
|
Revenues |
||||||||||||||||||||
|
Investment banking |
$ | 1,567 | $ | 1,380 | $ | 4,994 | $ | 4,455 | ||||||||||||
|
Trading |
2,752 | 2,704 | 9,815 | 8,870 | ||||||||||||||||
|
Investments |
136 | 167 | 409 | 495 | ||||||||||||||||
|
Commissions and fees |
932 | 937 | 3,144 | 2,997 | ||||||||||||||||
|
Asset management |
3,251 | 3,026 | 9,632 | 8,695 | ||||||||||||||||
|
Other |
298 | 200 | 748 | 628 | ||||||||||||||||
|
Total non-interest revenues |
8,936 | 8,414 | 28,742 | 26,140 | ||||||||||||||||
|
Interest income |
3,627 | 2,340 | 9,781 | 6,411 | ||||||||||||||||
|
Interest expense |
2,691 | 1,557 | 6,964 | 4,106 | ||||||||||||||||
|
Net interest |
936 | 783 | 2,817 | 2,305 | ||||||||||||||||
|
Net revenues |
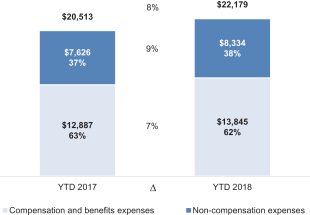
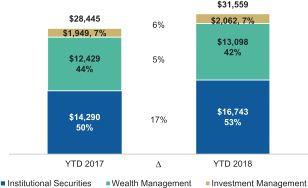
9,872 | 9,197 | 31,559 | 28,445 | ||||||||||||||||
|
Non-interest expenses |
||||||||||||||||||||
|
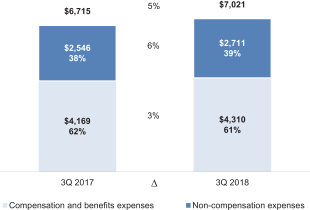
Compensation and benefits |
4,310 | 4,169 | 13,845 | 12,887 | ||||||||||||||||
|
Occupancy and equipment |
351 | 330 | 1,033 | 990 | ||||||||||||||||
|
Brokerage, clearing and exchange fees |
559 | 522 | 1,795 | 1,556 | ||||||||||||||||
|
Information processing and communications |
513 | 459 | 1,487 | 1,320 | ||||||||||||||||
|
Marketing and business development |
152 | 128 | 471 | 419 | ||||||||||||||||
|
Professional services |
570 | 534 | 1,660 | 1,622 | ||||||||||||||||
|
Other |
566 | 573 | 1,888 | 1,719 | ||||||||||||||||
|
Total non-interest expenses |
7,021 | 6,715 | 22,179 | 20,513 | ||||||||||||||||
|
Income from continuing operations before income taxes |
2,851 | 2,482 | 9,380 | 7,932 | ||||||||||||||||
|
Provision for income taxes |
696 | 697 | 2,050 | 2,358 | ||||||||||||||||
|
Income from continuing operations |
2,155 | 1,785 | 7,330 | 5,574 | ||||||||||||||||
|
Income (loss) from discontinued operations, net of income taxes |
(1 | ) | 6 | (5 | ) | (21 | ) | |||||||||||||
|
Net income |
$ | 2,154 | $ | 1,791 | $ | 7,325 | $ | 5,553 | ||||||||||||
|
Net income applicable to noncontrolling interests |
42 | 10 | 108 | 85 | ||||||||||||||||
|
Net income applicable to Morgan Stanley |
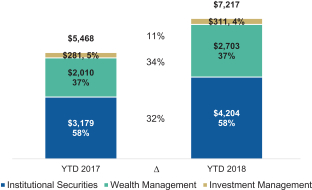
$ | 2,112 | $ | 1,781 | $ | 7,217 | $ | 5,468 | ||||||||||||
|
Preferred stock dividends and other |
93 | 93 | 356 | 353 | ||||||||||||||||
|
Earnings applicable to Morgan Stanley common shareholders |
$ | 2,019 | $ | 1,688 | $ | 6,861 | $ | 5,115 | ||||||||||||
|
Earnings per basic common share |
||||||||||||||||||||
|
Income from continuing operations |
$ | 1.19 | $ | 0.95 | $ | 3.99 | $ | 2.87 | ||||||||||||
|
Income (loss) from discontinued operations |
— | — | — | (0.01 | ) | |||||||||||||||
|
Earnings per basic common share |
$ | 1.19 | $ | 0.95 | $ | 3.99 | $ | 2.86 | ||||||||||||
|
Earnings per diluted common share |
||||||||||||||||||||
|
Income from continuing operations |
$ | 1.17 | $ | 0.93 | $ | 3.92 | $ | 2.81 | ||||||||||||
|
Income (loss) from discontinued operations |
— | — | — | (0.02 | ) | |||||||||||||||
|
Earnings per diluted common share |
$ | 1.17 | $ | 0.93 | $ | 3.92 | $ | 2.79 | ||||||||||||
|
Dividends declared per common share |
$ | 0.30 | $ | 0.25 | $ | 0.80 | $ | 0.65 | ||||||||||||
|
Average common shares outstanding |
||||||||||||||||||||
|
Basic |
1,697 | 1,776 | 1,719 | 1,789 | ||||||||||||||||
|
Diluted |
1,727 | 1,818 | 1,749 | 1,830 | ||||||||||||||||
| September 2018 Form 10-Q | 40 | See Notes to Consolidated Financial Statements |
Table of Contents
|
Consolidated Comprehensive Income Statements (Unaudited) |
|
|
Three Months Ended September 30, |
Nine Months Ended September 30, |
|||||||||||||||||
| $ in millions | 2018 | 2017 | 2018 | 2017 | ||||||||||||||
|
Net income |
$ | 2,154 | $ | 1,791 | $ | 7,325 | $ | 5,553 | ||||||||||
|
Other comprehensive income (loss), net of tax: |
||||||||||||||||||
|
Foreign currency translation adjustments |
$ | (79 | ) | $ | 61 | $ | (154 | ) | $ | 223 | ||||||||
|
Change in net unrealized gains (losses) on available-for-sale securities |
(171 | ) | 26 | (707 | ) | 218 | ||||||||||||
|
Pension, postretirement and other |
5 | — | 16 | 4 | ||||||||||||||
|
Change in net debt valuation adjustment |
(743 | ) | (149 | ) | 347 | (323 | ) | |||||||||||
|
Total other comprehensive income (loss) |
$ | (988 | ) | $ | (62 | ) | $ | (498 | ) | $ | 122 | |||||||
|
Comprehensive income |
$ | 1,166 | $ | 1,729 | $ | 6,827 | $ | 5,675 | ||||||||||
|
Net income applicable to noncontrolling interests |
42 | 10 | 108 | 85 | ||||||||||||||
|
Other comprehensive income (loss) applicable to noncontrolling interests |
(59 | ) | (6 | ) | 4 | 23 | ||||||||||||
|
Comprehensive income applicable to Morgan Stanley |
$ | 1,183 | $ | 1,725 | $ | 6,715 | $ | 5,567 | ||||||||||
| See Notes to Consolidated Financial Statements | 41 | September 2018 Form 10-Q |
Table of Contents
| Consolidated Balance Sheets |
|
| (Unaudited) | ||||||||
|
At September 30, |
At December 31, |
|||||||
| $ in millions, except share data | 2018 | 2017 | ||||||
|
Assets |
||||||||
|
Cash and cash equivalents: |
||||||||
|
Cash and due from banks |
$ | 36,641 | $ | 24,816 | ||||
|
Interest bearing deposits with banks |
22,638 | 21,348 | ||||||
|
Restricted cash |
33,202 | 34,231 | ||||||
|
Trading assets at fair value ( $127,919 and $169,735 were pledged to various parties) |
283,188 | 298,282 | ||||||
|
Investment securities (includes $57,232 and $55,203 at fair value) |
82,568 | 78,802 | ||||||
|
Securities purchased under agreements to resell |
69,086 | 84,258 | ||||||
|
Securities borrowed |
142,489 | 124,010 | ||||||
|
Customer and other receivables |
60,839 | 56,187 | ||||||
|
Loans: |
||||||||
|
Held for investment (net of allowance of $231 and $224) |
98,330 | 92,953 | ||||||
|
Held for sale |
11,653 | 11,173 | ||||||
|
Goodwill |
6,680 | 6,597 | ||||||
|
Intangible assets (net of accumulated amortization of $2,995 and $2,730) |
2,240 | 2,448 | ||||||
|
Other assets |
15,963 | 16,628 | ||||||
|
Total assets |
$ | 865,517 | $ | 851,733 | ||||
|
Liabilities |
||||||||
|
Deposits (includes $382 and $204 at fair value) |
$ | 175,185 | $ | 159,436 | ||||
|
Trading liabilities at fair value |
129,032 | 131,295 | ||||||
|
Securities sold under agreements to repurchase (includes $784 and $800 at fair value) |
60,328 | 56,424 | ||||||
|
Securities loaned |
11,833 | 13,592 | ||||||
|
Other secured financings (includes $4,554 and $3,863 at fair value) |
10,057 | 11,271 | ||||||
|
Customer and other payables |
191,026 | 191,510 | ||||||
|
Other liabilities and accrued expenses |
17,093 | 17,157 | ||||||
|
Borrowings (includes $50,506 and $46,912 at fair value) |
190,889 | 192,582 | ||||||
|
Total liabilities |
785,443 | 773,267 | ||||||
|
Commitments and contingent liabilities (see Note 11) |
||||||||
|
Equity |
||||||||
|
Morgan Stanley shareholders’ equity: |
||||||||
|
Preferred stock |
8,520 | 8,520 | ||||||
|
Common stock, $0.01 par value: |
||||||||
|
Shares authorized: 3,500,000,000 ; Shares issued: 2,038,893,979 ; Shares outstanding: 1,725,792,278 and 1,788,086,805 |
20 | 20 | ||||||
|
Additional paid-in capital |
23,664 | 23,545 | ||||||
|
Retained earnings |
63,330 | 57,577 | ||||||
|
Employee stock trusts |
2,797 | 2,907 | ||||||
|
Accumulated other comprehensive income (loss) |
(3,999 | ) | (3,060 | ) | ||||
|
Common stock held in treasury at cost, $0.01 par value ( 313,101,701 and 250,807,174 shares) |
(12,832 | ) | (9,211 | ) | ||||
|
Common stock issued to employee stock trusts |
(2,797 | ) | (2,907 | ) | ||||
|
Total Morgan Stanley shareholders’ equity |
78,703 | 77,391 | ||||||
|
Noncontrolling interests |
1,371 | 1,075 | ||||||
|
Total equity |
80,074 | 78,466 | ||||||
|
Total liabilities and equity |
$ | 865,517 | $ | 851,733 | ||||
| September 2018 Form 10-Q | 42 | See Notes to Consolidated Financial Statements |
Table of Contents
|
Consolidated Statements of Changes in Total Equity (Unaudited) |
|
|
$ in millions |
Preferred Stock |
Common Stock |
Additional Paid-in Capital |
Retained Earnings |
Employee Stock Trusts |
Accumulated Other Comprehensive Income (Loss) |
Common Stock Held in Treasury at Cost |
Common Stock Issued to Employee Stock Trusts |
Non- controlling Interests |
Total Equity |
||||||||||||||||||||||||||||||
|
Balance at December 31, 2017 |
$ | 8,520 | $ | 20 | $ | 23,545 | $ | 57,577 | $ | 2,907 | $ | (3,060 | ) | $ | (9,211 | ) | $ | (2,907 | ) | $ | 1,075 | $ | 78,466 | |||||||||||||||||
|
Cumulative adjustment for accounting changes 1 |
— | — | — | 306 | — | (437 | ) | — | — | — | (131) | |||||||||||||||||||||||||||||
|
Net income applicable to Morgan Stanley |
— | — | — | 7,217 | — | — | — | — | — | 7,217 | ||||||||||||||||||||||||||||||
|
Net income applicable to noncontrolling interests |
— | — | — | — | — | — | — | — | 108 | 108 | ||||||||||||||||||||||||||||||
|
Dividends |
— | — | — | (1,770 | ) | — | — | — | — | — | (1,770) | |||||||||||||||||||||||||||||
|
Shares issued under employee plans |
— | — | 119 | — | (110 | ) | — | 759 | 110 | — | 878 | |||||||||||||||||||||||||||||
|
Repurchases of common stock and employee tax withholdings |
— | — | — | — | — | — | (4,380 | ) | — | — | (4,380) | |||||||||||||||||||||||||||||
|
Net change in Accumulated other comprehensive income (loss) |
— | — | — | — | — | (502 | ) | — | — | 4 | (498) | |||||||||||||||||||||||||||||
|
Other net increases |
— | — | — | — | — | — | — | — | 184 | 184 | ||||||||||||||||||||||||||||||
|
Balance at September 30, 2018 |
$ | 8,520 | $ | 20 | $ | 23,664 | $ | 63,330 | $ | 2,797 | $ | (3,999 | ) | $ | (12,832 | ) | $ | (2,797 | ) | $ | 1,371 | $ | 80,074 | |||||||||||||||||
|
Balance at December 31, 2016 |
$ | 7,520 | $ | 20 | $ | 23,271 | $ | 53,679 | $ | 2,851 | $ | (2,643 | ) | $ | (5,797 | ) | $ | (2,851 | ) | $ | 1,127 | $ | 77,177 | |||||||||||||||||
|
Cumulative adjustment for accounting changes 1 |
— | — | 45 | (35 | ) | — | — | — | — | — | 10 | |||||||||||||||||||||||||||||
|
Net income applicable to Morgan Stanley |
— | — | — | 5,468 | — | — | — | — | — | 5,468 | ||||||||||||||||||||||||||||||
|
Net income applicable to noncontrolling interests |
— | — | — | — | — | — | — | — | 85 | 85 | ||||||||||||||||||||||||||||||
|
Dividends |
— | — | — | (1,558 | ) | — | — | — | — | — | (1,558) | |||||||||||||||||||||||||||||
|
Shares issued under employee plans |
— | — | 79 | — | 48 | — | 844 | (48 | ) | — | 923 | |||||||||||||||||||||||||||||
|
Repurchases of common stock and employee tax withholdings |
— | — | — | — | — | — | (3,008 | ) | — | — | (3,008) | |||||||||||||||||||||||||||||
|
Net change in Accumulated other comprehensive income (loss) |
— | — | — | — | — | 99 | — | — | 23 | 122 | ||||||||||||||||||||||||||||||
|
Issuance of preferred stock |
1,000 | — | (6 | ) | — | — | — | — | — | — | 994 | |||||||||||||||||||||||||||||
|
Other net decreases |
— | — | — | — | — | — | — | — | (99 | ) | (99) | |||||||||||||||||||||||||||||
|
Balance at September 30, 2017 |
$ | 8,520 | $ | 20 | $ | 23,389 | $ | 57,554 | $ | 2,899 | $ | (2,544 | ) | $ | (7,961 | ) | $ | (2,899 | ) | $ | 1,136 | $ | 80,114 | |||||||||||||||||
| 1. |
The cumulative adjustments relate to the adoption of certain accounting updates during the current and prior year periods. See Notes 2 and 14 for further information. |
| See Notes to Consolidated Financial Statements | 43 | September 2018 Form 10-Q |
Table of Contents
|
Consolidated Cash Flow Statements (Unaudited) |
|
|
Nine Months Ended
September 30, |
||||||||
| $ in millions | 2018 | 2017 | ||||||
|
Cash flows from operating activities |
||||||||
|
Net income |
$ | 7,325 | $ | 5,553 | ||||
|
Adjustments to reconcile net income to net cash provided by (used for) operating activities: |
||||||||
|
(Income) loss from equity method investments |
(62 | ) | — | |||||
|
Stock-based compensation expense |
743 | 775 | ||||||
|
Depreciation and amortization |
1,375 | 1,340 | ||||||
|
(Release of) Provision for credit losses on lending activities |
(27 | ) | 32 | |||||
|
Other operating adjustments |
35 | (62) | ||||||
|
Changes in assets and liabilities: |
||||||||
|
Trading assets, net of Trading liabilities |
10,039 | (19,646) | ||||||
|
Securities borrowed |
(18,479 | ) | (7,656) | |||||
|
Securities loaned |
(1,759 | ) | (214) | |||||
|
Customer and other receivables and other assets |
(4,092 | ) | (7,930) | |||||
|
Customer and other payables and other liabilities |
310 | 8,055 | ||||||
|
Securities purchased under agreements to resell |
15,172 | 11,849 | ||||||
|
Securities sold under agreements to repurchase |
3,904 | (645) | ||||||
|
Net cash provided by (used for) operating activities |
14,484 | (8,549) | ||||||
|
Cash flows from investing activities |
||||||||
|
Proceeds from (payments for): |
||||||||
|
Other assets—Premises, equipment and software, net |
(1,361 | ) | (1,177) | |||||
|
Changes in loans, net |
(7,697 | ) | (9,350) | |||||
|
Investment securities: |
||||||||
|
Purchases |
(16,836 | ) | (19,713) | |||||
|
Proceeds from sales |
2,947 | 16,111 | ||||||
|
Proceeds from paydowns and maturities |
9,126 | 5,378 | ||||||
|
Other investing activities |
(245 | ) | (77) | |||||
|
Net cash provided by (used for) investing activities |
(14,066 | ) | (8,828) | |||||
|
Cash flows from financing activities |
||||||||
|
Net proceeds from (payments for): |
||||||||
|
Noncontrolling interests |
(95 | ) | (43) | |||||
|
Other secured financings |
(1,874 | ) | 1,400 | |||||
|
Deposits |
15,749 | (1,224) | ||||||
|
Proceeds from: |
||||||||
|
Derivatives financing activities |
— | 73 | ||||||
|
Issuance of preferred stock, net of issuance costs |
— | 994 | ||||||
|
Issuance of Borrowings |
34,233 | 46,121 | ||||||
|
Payments for: |
||||||||
|
Borrowings |
(28,235 | ) | (25,097) | |||||
|
Derivatives financing activities |
— | (73) | ||||||
|
Repurchases of common stock and employee tax withholdings |
(4,380 | ) | (3,008) | |||||
|
Cash dividends |
(1,788 | ) | (1,562) | |||||
|
Other financing activities |
(248 | ) | (48) | |||||
|
Net cash provided by (used for) financing activities |
13,362 | 17,533 | ||||||
|
Effect of exchange rate changes on cash and cash equivalents |
(1,694 | ) | 3,406 | |||||
|
Net increase (decrease) in cash and cash equivalents |
12,086 | 3,562 | ||||||
|
Cash and cash equivalents, at beginning of period |
80,395 | 77,360 | ||||||
|
Cash and cash equivalents, at end of period |
$ | 92,481 | $ | 80,922 | ||||
|
Cash and cash equivalents: |
||||||||
|
Cash and due from banks |
$ | 36,641 | $ | 24,047 | ||||
|
Interest bearing deposits with banks |
22,638 | 24,144 | ||||||
|
Restricted cash |
33,202 | 32,731 | ||||||
|
Cash and cash equivalents, at end of period |
$ | 92,481 | $ | 80,922 | ||||
|
Supplemental Disclosure of Cash Flow Information |
||||||||
|
Cash payments for: |
||||||||
|
Interest |
$ | 6,818 | $ | 3,422 | ||||
|
Income taxes, net of refunds |
1,009 | 967 | ||||||
| September 2018 Form 10-Q | 44 | See Notes to Consolidated Financial Statements |
Table of Contents
Table of Contents
|
Notes to Consolidated Financial Statements (Unaudited) |
|
| September 2018 Form 10-Q | 46 |
Table of Contents
|
Notes to Consolidated Financial Statements (Unaudited) |
|
| 47 | September 2018 Form 10-Q |
Table of Contents
Table of Contents
|
Notes to Consolidated Financial Statements (Unaudited) |
|
| 49 | September 2018 Form 10-Q |
Table of Contents
|
Notes to Consolidated Financial Statements (Unaudited) |
|
Rollforward of Level 3 Assets and Liabilities Measured at Fair Value on a Recurring Basis for the Current Quarter
| $ in millions |
Beginning
Balance at June 30, 2018 |
Realized
and Unrealized Gains (Losses) |
Purchases 1 |
Sales and
Issuances 2 |
Settlements 1 |
Net
Transfers |
Ending
Balance at September 30, 2018 |
Unrealized
Gains (Losses) |
||||||||||||||||||||||||
|
Assets at Fair Value |
||||||||||||||||||||||||||||||||
|
Trading assets: |
||||||||||||||||||||||||||||||||
|
U.S. Treasury and agency securities |
$ | — | $ | — | $ | 5 | $ | — | $ | — | $ | — | $ | 5 | $ | — | ||||||||||||||||
|
Other sovereign government obligations |
5 | — | 32 | (2 | ) | — | 1 | 36 | — | |||||||||||||||||||||||
|
State and municipal securities |
2 | — | 2 | — | — | — | 4 | — | ||||||||||||||||||||||||
|
MABS |
327 | (1 | ) | 23 | (46 | ) | (14 | ) | 27 | 316 | (8) | |||||||||||||||||||||
|
Loans and lending commitments |
6,923 | 17 | 2,076 | (1,184 | ) | (777 | ) | (320 | ) | 6,735 | 12 | |||||||||||||||||||||
|
Corporate and other debt |
701 | (4 | ) | 109 | (153 | ) | (6 | ) | 63 | 710 | 9 | |||||||||||||||||||||
|
Corporate equities |
171 | (7 | ) | 15 | (50 | ) | — | (23 | ) | 106 | 5 | |||||||||||||||||||||
|
Net derivative and other contracts 3 : |
||||||||||||||||||||||||||||||||
|
Interest rate |
567 | (3 | ) | 12 | (9 | ) | (2 | ) | 12 | 577 | 24 | |||||||||||||||||||||
|
Credit |
(2 | ) | (39 | ) | 4 | — | 58 | — | 21 | (41) | ||||||||||||||||||||||
|
Foreign exchange |
(26 | ) | (35 | ) | — | — | 2 | 15 | (44 | ) | (9) | |||||||||||||||||||||
|
Equity |
(1,535 | ) | (149 | ) | 29 | (138 | ) | 84 | 38 | (1,671 | ) | (132) | ||||||||||||||||||||
|
Commodity and other |
2,032 | (29 | ) | — | (11 | ) | (1 | ) | 29 | 2,020 | (105) | |||||||||||||||||||||
|
Total net derivative and other contracts |
1,036 | (255 | ) | 45 | (158 | ) | 141 | 94 | 903 | (263) | ||||||||||||||||||||||
|
Investments |
941 | 5 | 72 | (103 | ) | — | (97 | ) | 818 | 2 | ||||||||||||||||||||||
|
Liabilities at Fair Value |
||||||||||||||||||||||||||||||||
|
Deposits |
$ | 37 | $ | (2 | ) | $ | — | $ | 11 | $ | — | $ | 23 | $ | 73 | $ | (2) | |||||||||||||||
|
Trading liabilities: |
||||||||||||||||||||||||||||||||
|
Corporate and other debt |
1 | — | — | — | — | — | 1 | — | ||||||||||||||||||||||||
|
Corporate equities |
24 | — | (12 | ) | 3 | — | (2 | ) | 13 | — | ||||||||||||||||||||||
|
Other secured financings |
170 | (2 | ) | — | — | — | — | 172 | (2) | |||||||||||||||||||||||
|
Borrowings |
3,295 | (56 | ) | — | 344 | (81 | ) | 6 | 3,620 | (55) | ||||||||||||||||||||||
| 1. |
Loan originations and consolidations of VIEs are included in purchases and deconsolidations of VIEs are included in Settlements. |
| 2. |
Amounts related to entering into Net derivatives and other contracts, Deposits, Other secured financings and Borrowings primarily represent issuances. Amounts for other line items primarily represent sales. |
| 3. |
Net derivative and other contracts represent Trading assets—Derivative and other contracts, net of Trading liabilities—Derivative and other contracts. Amounts are presented before counterparty netting. |
| September 2018 Form 10-Q | 50 |
Table of Contents
|
Notes to Consolidated Financial Statements (Unaudited) |
|
Rollforward of Level 3 Assets and Liabilities Measured at Fair Value on a Recurring Basis for the Prior Year Quarter
| $ in millions |
Beginning
Balance at June 30, 2017 |
Realized
and Unrealized Gains (Losses) |
Purchases 1 |
Sales and
Issuances 2 |
Settlements 1 |
Net
Transfers |
Ending
Balance at September 30, 2017 |
Unrealized
Gains (Losses) |
||||||||||||||||||||||||
|
Assets at Fair Value |
||||||||||||||||||||||||||||||||
|
Trading assets: |
||||||||||||||||||||||||||||||||
|
Other sovereign government obligations |
$ | 100 | $ | 2 | $ | 86 | $ | (82 | ) | $ | — | $ | (2 | ) | $ | 104 | $ | 1 | ||||||||||||||
|
State and municipal securities |
9 | — | 4 | (3 | ) | — | — | 10 | — | |||||||||||||||||||||||
|
MABS |
264 | 4 | 52 | (54 | ) | — | 8 | 274 | 1 | |||||||||||||||||||||||
|
Loans and lending commitments |
4,864 | 25 | 1,772 | (1,431 | ) | (236 | ) | (129 | ) | 4,865 | 17 | |||||||||||||||||||||
|
Corporate and other debt |
693 | 41 | 220 | (241 | ) | (4 | ) | (21 | ) | 688 | 34 | |||||||||||||||||||||
|
Corporate equities |
500 | (9 | ) | 24 | (268 | ) | — | 49 | 296 | — | ||||||||||||||||||||||
|
Net derivative and other contracts 3 : |
||||||||||||||||||||||||||||||||
|
Interest rate |
970 | 105 | 13 | (29 | ) | 33 | (16 | ) | 1,076 | 92 | ||||||||||||||||||||||
|
Credit |
(305 | ) | (33 | ) | 7 | (9 | ) | 35 | 2 | (303 | ) | (33) | ||||||||||||||||||||
|
Foreign exchange |
2 | (59 | ) | 9 | — | 17 | (47 | ) | (78 | ) | (50) | |||||||||||||||||||||
|
Equity |
1,093 | 114 | 60 | (77 | ) | 79 | (38 | ) | 1,231 | 110 | ||||||||||||||||||||||
|
Commodity and other |
1,509 | 158 | 1 | (1 | ) | (112 | ) | (21 | ) | 1,534 | 45 | |||||||||||||||||||||
|
Total net derivative and other contracts |
3,269 | 285 | 90 | (116 | ) | 52 | (120 | ) | 3,460 | 164 | ||||||||||||||||||||||
|
Investments |
946 | (4 | ) | 13 | (17 | ) | (16 | ) | 3 | 925 | (5) | |||||||||||||||||||||
|
Liabilities at Fair Value |
||||||||||||||||||||||||||||||||
|
Deposits |
$ | 79 | $ | (1 | ) | $ | — | $ | 32 | $ | — | $ | (6 | ) | $ | 106 | $ | (1) | ||||||||||||||
|
Trading liabilities: |
||||||||||||||||||||||||||||||||
|
Corporate and other debt |
15 | (2 | ) | (18 | ) | 9 | — | — | 8 | (1) | ||||||||||||||||||||||
|
Corporate equities |
28 | 1 | (10 | ) | 24 | — | 10 | 51 | 2 | |||||||||||||||||||||||
|
Securities sold under agreements to repurchase |
148 | (1 | ) | — | — | — | — | 149 | (1) | |||||||||||||||||||||||
|
Other secured financings |
244 | (5 | ) | — | 2 | (1 | ) | — | 250 | (5) | ||||||||||||||||||||||
|
Borrowings |
2,646 | (53 | ) | — | 679 | (49 | ) | (726 | ) | 2,603 | (47) | |||||||||||||||||||||
| 1. |
Loan originations and consolidations of VIEs are included in purchases and deconsolidations of VIEs are included in Settlements. |
| 2. |
Amounts related to entering into Net derivatives and other contracts, Deposits, Other secured financings and Borrowings primarily represent issuances. Amounts for other line items primarily represent sales. |
| 3. |
Net derivative and other contracts represent Trading assets—Derivative and other contracts, net of Trading liabilities—Derivative and other contracts. Amounts are presented before counterparty netting. |
| 51 | September 2018 Form 10-Q |
Table of Contents
|
Notes to Consolidated Financial Statements (Unaudited) |
|
Rollforward of Level 3 Assets and Liabilities Measured at Fair Value on a Recurring Basis for the Current Year Period
| $ in millions |
Beginning
Balance at December 31, 2017 |
Realized and
Unrealized Gains (Losses) |
Purchases 1 |
Sales and
Issuances 2 |
Settlements 1 | Net Transfers |
Ending
Balance at September 30, 2018 |
Unrealized Gains
(Losses) |
||||||||||||||||||||||||
|
Assets at fair value |
||||||||||||||||||||||||||||||||
|
Trading assets: |
||||||||||||||||||||||||||||||||
|
U.S. Treasury and agency securities |
$ | — | $ | — | $ | 5 | $ | — | $ | — | $ | — | $ | 5 | $ | — | ||||||||||||||||
|
Other sovereign government obligations |
1 | — | 35 | — | — | — | 36 | — | ||||||||||||||||||||||||
|
State and municipal securities |
8 | — | 3 | (7 | ) | — | — | 4 | — | |||||||||||||||||||||||
|
MABS |
423 | 88 | 73 | (317 | ) | (16 | ) | 65 | 316 | (6) | ||||||||||||||||||||||
|
Loans and lending commitments |
5,945 | 16 | 4,030 | (978 | ) | (1,926 | ) | (352 | ) | 6,735 | (8) | |||||||||||||||||||||
|
Corporate and other debt |
701 | 51 | 276 | (227 | ) | (8 | ) | (83 | ) | 710 | 16 | |||||||||||||||||||||
|
Corporate equities |
166 | 17 | 69 | (134 | ) | — | (12 | ) | 106 | 14 | ||||||||||||||||||||||
|
Net derivative and other contracts 3 : |
||||||||||||||||||||||||||||||||
|
Interest rate |
1,218 | (46 | ) | 84 | (38 | ) | (92 | ) | (549 | ) | 577 | (47) | ||||||||||||||||||||
|
Credit |
41 | (17 | ) | 9 | (40 | ) | 30 | (2 | ) | 21 | (20) | |||||||||||||||||||||
|
Foreign exchange |
(112 | ) | 71 | 2 | (48 | ) | 43 | — | (44 | ) | 1 | |||||||||||||||||||||
|
Equity 4 |
1,208 | 83 | 120 | (1,052 | ) | 319 | (2,349 | ) | (1,671 | ) | 19 | |||||||||||||||||||||
|
Commodity and other |
1,446 | 332 | 80 | (18 | ) | 17 | 163 | 2,020 | 33 | |||||||||||||||||||||||
|
Total net derivative and other contracts |
3,801 | 423 | 295 | (1,196 | ) | 317 | (2,737 | ) | 903 | (14) | ||||||||||||||||||||||
|
Investments |
1,020 | 5 | 134 | (209 | ) | — | (132 | ) | 818 | 5 | ||||||||||||||||||||||
|
Liabilities at fair value |
||||||||||||||||||||||||||||||||
|
Deposits |
$ | 47 | $ | 1 | $ | — | $ | 27 | $ | (2 | ) | $ | 2 | $ | 73 | $ | 1 | |||||||||||||||
|
Trading liabilities: |
||||||||||||||||||||||||||||||||
|
Corporate and other debt |
3 | — | (3 | ) | 1 | — | — | 1 | — | |||||||||||||||||||||||
|
Corporate equities |
22 | 4 | (12 | ) | 11 | — | (4 | ) | 13 | 4 | ||||||||||||||||||||||
|
Securities sold under agreements to repurchase |
150 | — | — | — | — | (150 | ) | — | — | |||||||||||||||||||||||
|
Other secured financings |
239 | 16 | — | 8 | (18 | ) | (41 | ) | 172 | 16 | ||||||||||||||||||||||
|
Borrowings |
2,984 | 156 | — | 1,275 | (339 | ) | (144 | ) | 3,620 | 168 | ||||||||||||||||||||||
| 1. |
Loan originations and consolidations of VIEs are included in Purchases and deconsolidations of VIEs are included in Settlements. |
| 2. |
Amounts related to entering into Net derivative and other contracts, Deposits, Other secured financings and Borrowings primarily represent issuances. Amounts for other line items primarily represent sales. |
| 3. |
Net derivative and other contracts represent Trading assets—Derivative and other contracts, net of Trading liabilities—Derivative and other contracts. Amounts are presented before counterparty netting. |
| 4. |
During the current year period, the Firm transferred from Level 3 to Level 2 $2.4 billion of Equity Derivatives due to a reduction in the significance of the unobservable inputs relating to volatility. |
| September 2018 Form 10-Q | 52 |
Table of Contents
|
Notes to Consolidated Financial Statements (Unaudited) |
|
Rollforward of Level 3 Assets and Liabilities Measured at Fair Value on a Recurring Basis for the Prior Year Period
| $ in millions |
Beginning
Balance at December 31, 2016 |
Realized and
Unrealized Gains (Losses) |
Purchases 1 |
Sales and
Issuances 2 |
Settlements 1 | Net Transfers |
Ending
Balance at September 30, 2017 |
Unrealized Gains
(Losses) |
||||||||||||||||||||||||
|
Assets at fair value |
||||||||||||||||||||||||||||||||
|
Trading assets: |
||||||||||||||||||||||||||||||||
|
U.S. Treasury and agency securities |
$ | 74 | $ | (1 | ) | $ | — | $ | (240 | ) | $ | — | $ | 167 | $ | — | $ | — | ||||||||||||||
|
Other sovereign government obligations |
6 | — | 104 | (5 | ) | — | (1 | ) | 104 | — | ||||||||||||||||||||||
|
State and municipal securities |
250 | 3 | 6 | (81 | ) | — | (168 | ) | 10 | — | ||||||||||||||||||||||
|
MABS |
217 | 49 | 120 | (120 | ) | (16 | ) | 24 | 274 | 13 | ||||||||||||||||||||||
|
Loans and lending commitments |
5,122 | 88 | 2,470 | (1,927 | ) | (964 | ) | 76 | 4,865 | 85 | ||||||||||||||||||||||
|
Corporate and other debt |
475 | 67 | 437 | (383 | ) | (7 | ) | 99 | 688 | 3 | ||||||||||||||||||||||
|
Corporate equities |
446 | 8 | 74 | (604 | ) | — | 372 | 296 | 3 | |||||||||||||||||||||||
|
Net derivative and other contracts 3 : |
||||||||||||||||||||||||||||||||
|
Interest rate |
420 | 137 | 36 | (42 | ) | 658 | (133 | ) | 1,076 | 146 | ||||||||||||||||||||||
|
Credit |
(373 | ) | (18 | ) | 6 | (9 | ) | 96 | (5 | ) | (303 | ) | (34) | |||||||||||||||||||
|
Foreign exchange |
(43 | ) | (92 | ) | 9 | — | 48 | — | (78 | ) | (72) | |||||||||||||||||||||
|
Equity |
184 | 168 | 816 | (231 | ) | 209 | 85 | 1,231 | 277 | |||||||||||||||||||||||
|
Commodity and other |
1,600 | 523 | 13 | (21 | ) | (431 | ) | (150 | ) | 1,534 | 88 | |||||||||||||||||||||
|
Total net derivative and other contracts |
1,788 | 718 | 880 | (303 | ) | 580 | (203 | ) | 3,460 | 405 | ||||||||||||||||||||||
|
Investments |
958 | 16 | 96 | (44 | ) | (78 | ) | (23 | ) | 925 | 10 | |||||||||||||||||||||
|
Liabilities at fair value |
||||||||||||||||||||||||||||||||
|
Deposits |
$ | 42 | $ | (2 | ) | $ | — | $ | 62 | $ | — | $ | — | $ | 106 | $ | (2) | |||||||||||||||
|
Trading liabilities: |
||||||||||||||||||||||||||||||||
|
Corporate and other debt |
36 | (1 | ) | (55 | ) | 99 | — | (73 | ) | 8 | — | |||||||||||||||||||||
|
Corporate equities |
35 | — | (69 | ) | 27 | — | 58 | 51 | (1) | |||||||||||||||||||||||
|
Securities sold under agreements to repurchase |
149 | — | — | — | — | — | 149 | 1 | ||||||||||||||||||||||||
|
Other secured financings |
434 | (28 | ) | — | 54 | (223 | ) | (43 | ) | 250 | (21) | |||||||||||||||||||||
|
Borrowings |
2,014 | (142 | ) | — | 1,418 | (328 | ) | (643 | ) | 2,603 | (136) | |||||||||||||||||||||
| 1. |
Loan originations and consolidations of VIEs are included in Purchases and deconsolidations of VIEs are included in Settlements. |
| 2. |
Amounts related to entering into Net derivative and other contracts, Deposits, Other secured financings and Borrowings primarily represent issuances. Amounts for other line items primarily represent sales. |
| 3. |
Net derivative and other contracts represent Trading assets—Derivative and other contracts, net of Trading liabilities—Derivative and other contracts. Amounts are presented before counterparty netting. |
| 53 | September 2018 Form 10-Q |
Table of Contents
|
Notes to Consolidated Financial Statements (Unaudited) |
|
| September 2018 Form 10-Q | 54 |
Table of Contents
|
Notes to Consolidated Financial Statements (Unaudited) |
|
| 55 | September 2018 Form 10-Q |
Table of Contents
|
Notes to Consolidated Financial Statements (Unaudited) |
|
Measured at Fair Value on a Nonrecurring Basis
| September 2018 Form 10-Q | 56 |
Table of Contents
|
Notes to Consolidated Financial Statements (Unaudited) |
|
Financial Instruments Not Measured at Fair Value
| 57 | September 2018 Form 10-Q |
Table of Contents
Table of Contents
|
Notes to Consolidated Financial Statements
(Unaudited) |
|
| 59 | September 2018 Form 10-Q |
Table of Contents
|
Notes to Consolidated Financial Statements (Unaudited) |
|
| September 2018 Form 10-Q | 60 |
Table of Contents
|
Notes to Consolidated Financial Statements (Unaudited) |
|
| 61 | September 2018 Form 10-Q |
Table of Contents
|
Notes to Consolidated Financial Statements (Unaudited) |
|
Investment Securities in an Unrealized Loss Position
| At September 30, 2018 | ||||||||||||||||||||||||||||||||
| Less than 12 Months | 12 Months or Longer | Total | ||||||||||||||||||||||||||||||
| $ in millions | Fair Value |
Gross
Unrealized Losses |
Fair Value |
Gross
Unrealized Losses |
Fair Value |
Gross
Unrealized Losses |
||||||||||||||||||||||||||
|
AFS securities |
||||||||||||||||||||||||||||||||
|
U.S. government and agency securities: |
||||||||||||||||||||||||||||||||
|
U.S. Treasury securities |
$ | 26,238 | $ | 858 | $ | 5,284 | $ | 168 | $ | 31,522 | $ | 1,026 | ||||||||||||||||||||
|
U.S. agency securities |
13,615 | 525 | 2,604 | 133 | 16,219 | 658 | ||||||||||||||||||||||||||
|
Total U.S. government and agency securities |
39,853 | 1,383 | 7,888 | 301 | 47,741 | 1,684 | ||||||||||||||||||||||||||
|
Corporate and other debt: |
||||||||||||||||||||||||||||||||
|
Agency CMBS |
828 | 70 | — | — | 828 | 70 | ||||||||||||||||||||||||||
|
Non-agency CMBS |
224 | 7 | 223 | 11 | 447 | 18 | ||||||||||||||||||||||||||
|
Corporate bonds |
725 | 14 | 521 | 20 | 1,246 | 34 | ||||||||||||||||||||||||||
|
FFELP student loan ABS |
881 | 7 | — | — | 881 | 7 | ||||||||||||||||||||||||||
|
Total corporate and other debt |
2,658 | 98 | 744 | 31 | 3,402 | 129 | ||||||||||||||||||||||||||
|
Total AFS securities |
42,511 | 1,481 | 8,632 | 332 | 51,143 | 1,813 | ||||||||||||||||||||||||||
|
HTM securities |
||||||||||||||||||||||||||||||||
|
U.S. government and agency securities: |
||||||||||||||||||||||||||||||||
|
U.S. Treasury securities |
3,102 | 44 | 9,655 | 586 | 12,757 | 630 | ||||||||||||||||||||||||||
|
U.S. agency securities |
2,373 | 73 | 8,510 | 544 | 10,883 | 617 | ||||||||||||||||||||||||||
|
Total U.S. government and agency securities |
5,475 | 117 | 18,165 | 1,130 | 23,640 | 1,247 | ||||||||||||||||||||||||||
|
Corporate and other debt: |
||||||||||||||||||||||||||||||||
|
Non-agency CMBS |
195 | 5 | 68 | 3 | 263 | 8 | ||||||||||||||||||||||||||
|
Total HTM securities |
5,670 | 122 | 18,233 | 1,133 | 23,903 | 1,255 | ||||||||||||||||||||||||||
|
Total investment securities |
$ | 48,181 | $ | 1,603 | $ | 26,865 | $ | 1,465 | $ | 75,046 | $ | 3,068 | ||||||||||||||||||||
| At December 31, 2017 | ||||||||||||||||||||||||||||||||
| Less than 12 Months | 12 Months or Longer | Total | ||||||||||||||||||||||||||||||
| $ in millions | Fair Value |
Gross
Unrealized Losses |
Fair Value |
Gross
Unrealized Losses |
Fair Value |
Gross
Unrealized Losses |
||||||||||||||||||||||||||
|
AFS debt securities |
||||||||||||||||||||||||||||||||
|
U.S. government and agency securities: |
||||||||||||||||||||||||||||||||
|
U.S. Treasury securities |
$ | 21,941 | $ | 495 | $ | 4,287 | $ | 94 | $ | 26,228 | $ | 589 | ||||||||||||||||||||
|
U.S. agency securities |
12,673 | 192 | 2,513 | 55 | 15,186 | 247 | ||||||||||||||||||||||||||
|
Total U.S. government and agency securities |
34,614 | 687 | 6,800 | 149 | 41,414 | 836 | ||||||||||||||||||||||||||
|
Corporate and other debt: |
||||||||||||||||||||||||||||||||
|
Agency CMBS |
930 | 49 | — | — | 930 | 49 | ||||||||||||||||||||||||||
|
Non-agency CMBS |
257 | 1 | 559 | 7 | 816 | 8 | ||||||||||||||||||||||||||
|
Corporate bonds |
316 | 3 | 389 | 9 | 705 | 12 | ||||||||||||||||||||||||||
|
FFELP student loan ABS |
984 | 7 | — | — | 984 | 7 | ||||||||||||||||||||||||||
|
Total corporate and other debt |
2,487 | 60 | 948 | 16 | 3,435 | 76 | ||||||||||||||||||||||||||
|
Total AFS debt securities |
37,101 | 747 | 7,748 | 165 | 44,849 | 912 | ||||||||||||||||||||||||||
|
AFS equity securities |
— | — | 5 | 10 | 5 | 10 | ||||||||||||||||||||||||||
|
Total AFS securities |
37,101 | 747 | 7,753 | 175 | 44,854 | 922 | ||||||||||||||||||||||||||
|
HTM securities |
||||||||||||||||||||||||||||||||
|
U.S. government and agency securities: |
||||||||||||||||||||||||||||||||
|
U.S. Treasury securities |
6,608 | 86 | 4,512 | 219 | 11,120 | 305 | ||||||||||||||||||||||||||
|
U.S. agency securities |
2,879 | 24 | 7,298 | 196 | 10,177 | 220 | ||||||||||||||||||||||||||
|
Total U.S. government and agency securities |
9,487 | 110 | 11,810 | 415 | 21,297 | 525 | ||||||||||||||||||||||||||
|
Corporate and other debt: |
||||||||||||||||||||||||||||||||
|
Non-agency CMBS |
124 | 1 | — | — | 124 | 1 | ||||||||||||||||||||||||||
|
Total HTM securities |
9,611 | 111 | 11,810 | 415 | 21,421 | 526 | ||||||||||||||||||||||||||
|
Total investment securities |
$ | 46,712 | $ | 858 | $ | 19,563 | $ | 590 | $ | 66,275 | $ | 1,448 | ||||||||||||||||||||
| September 2018 Form 10-Q | 62 |
Table of Contents
|
Notes to Consolidated Financial Statements (Unaudited) |
|
| 63 | September 2018 Form 10-Q |
Table of Contents
|
Notes to Consolidated Financial Statements (Unaudited) |
|
| September 2018 Form 10-Q | 64 |
Table of Contents
|
Notes to Consolidated Financial Statements (Unaudited) |
|
| 65 | September 2018 Form 10-Q |
Table of Contents
|
Notes to Consolidated Financial Statements (Unaudited) |
|
| September 2018 Form 10-Q | 66 |
Table of Contents
|
Notes to Consolidated Financial Statements (Unaudited) |
|
| 67 | September 2018 Form 10-Q |
Table of Contents
|
Notes to Consolidated Financial Statements (Unaudited) |
|
| September 2018 Form 10-Q | 68 |
Table of Contents
|
Notes to Consolidated Financial Statements (Unaudited) |
|
| 69 | September 2018 Form 10-Q |
Table of Contents
|
Notes to Consolidated Financial Statements (Unaudited) |
|
| September 2018 Form 10-Q | 70 |
Table of Contents
|
Notes to Consolidated Financial Statements (Unaudited) |
|
| 71 | September 2018 Form 10-Q |
Table of Contents
|
Notes to Consolidated Financial Statements (Unaudited) |
|
| September 2018 Form 10-Q | 72 |
Table of Contents
|
Notes to Consolidated Financial Statements (Unaudited) |
|
| 73 | September 2018 Form 10-Q |
Table of Contents
|
Notes to Consolidated Financial Statements (Unaudited) |
|
| September 2018 Form 10-Q | 74 |
Table of Contents
|
Notes to Consolidated Financial Statements (Unaudited) |
|
| 75 | September 2018 Form 10-Q |
Table of Contents
|
Notes to Consolidated Financial Statements (Unaudited) |
|
| September 2018 Form 10-Q | 76 |
Table of Contents
|
Notes to Consolidated Financial Statements (Unaudited) |
|
| 77 | September 2018 Form 10-Q |
Table of Contents
|
Notes to Consolidated Financial Statements (Unaudited) |
|
| September 2018 Form 10-Q | 78 |
Table of Contents
|
Notes to Consolidated Financial Statements (Unaudited) |
|
| 79 | September 2018 Form 10-Q |
Table of Contents
|
Notes to Consolidated Financial Statements (Unaudited) |
|
| September 2018 Form 10-Q | 80 |
Table of Contents
|
Notes to Consolidated Financial Statements (Unaudited) |
|
| 81 | September 2018 Form 10-Q |
Table of Contents
|
Notes to Consolidated Financial Statements (Unaudited) |
|
| September 2018 Form 10-Q | 82 |
Table of Contents
|
Notes to Consolidated Financial Statements (Unaudited) |
|
| 83 | September 2018 Form 10-Q |
Table of Contents
| Financial Data Supplement (Unaudited) |
|
|
| Average Balances and Interest Rates and Net Interest Income |
| Three Months Ended September 30, | ||||||||||||||||||||||||
|
2018 |
2017 | |||||||||||||||||||||||
| $ in millions |
Average
Daily
|
Interest |
Annualized
Average
|
Average
Daily
|
Interest |
Annualized
Average Rate |
||||||||||||||||||
|
Interest earning assets 1 |
||||||||||||||||||||||||
|
Investment securities 2 |
$ | 82,594 | $ | 440 | 2.1 | % | $ | 73,599 | $ | 313 | 1.7 | % | ||||||||||||
|
Loans 2 |
110,592 | 1,085 | 3.9 | 99,655 | 853 | 3.4 | ||||||||||||||||||
|
Securities purchased under agreements to resell and Securities borrowed 3 : |
||||||||||||||||||||||||
|
U.S. |
139,418 | 637 | 1.8 | 128,127 | 190 | 0.6 | ||||||||||||||||||
|
Non-U.S. |
89,825 | (62 | ) | (0.3 | ) | 99,019 | (114 | ) | (0.5 | ) | ||||||||||||||
|
Trading assets, net of Trading liabilities 4 : |
||||||||||||||||||||||||
|
U.S. |
55,399 | 508 | 3.6 | 58,000 | 463 | 3.2 | ||||||||||||||||||
|
Non-U.S. |
8,637 | 63 | 2.9 | 5,826 | 43 | 3.0 | ||||||||||||||||||
|
Customer receivables and Other 5 : |
||||||||||||||||||||||||
|
U.S. |
75,627 | 716 | 3.8 | 70,331 | 447 | 2.5 | ||||||||||||||||||
|
Non-U.S. |
33,099 | 240 | 2.9 | 28,210 | 145 | 2.1 | ||||||||||||||||||
|
Total |
$ | 595,191 | $ | 3,627 | 2.4 | % | $ | 562,767 | $ | 2,340 | 1.7 | % | ||||||||||||
|
Interest bearing liabilities |
||||||||||||||||||||||||
|
Deposits 2 |
$ | 173,921 | $ | 377 | 0.9 | % | $ | 150,116 | $ | 63 | 0.2 | % | ||||||||||||
|
Borrowings 2, 6 |
191,606 | 1,287 | 2.7 | 192,575 | 1,109 | 2.3 | ||||||||||||||||||
|
Securities sold under agreements to repurchase and Securities loaned 7 : |
||||||||||||||||||||||||
|
U.S. |
24,386 | 346 | 5.6 | 30,027 | 234 | 3.1 | ||||||||||||||||||
|
Non-U.S. |
34,960 | 132 | 1.5 | 38,536 | 91 | 0.9 | ||||||||||||||||||
|
Customer payables and Other 8 : |
||||||||||||||||||||||||
|
U.S. |
120,958 | 321 | 1.1 | 129,365 | (13 | ) | — | |||||||||||||||||
|
Non-U.S. |
71,998 | 228 | 1.3 | 66,697 | 73 | 0.4 | ||||||||||||||||||
|
Total |
$ | 617,829 | $ | 2,691 | 1.7 | % | $ | 607,316 | $ | 1,557 | 1.0 | % | ||||||||||||
|
Net interest income and net interest rate spread |
$ | 936 | 0.7 | % | $ | 783 | 0.7 | % | ||||||||||||||||
| September 2018 Form 10-Q | 84 |
Table of Contents
| Financial Data Supplement (Unaudited) |
|
|
| Average Balances and Interest Rates and Net Interest Income | ||
| Nine Months Ended September 30, | ||||||||||||||||||||||||
| 2018 | 2017 | |||||||||||||||||||||||
| $ in millions |
Average
|
Interest |
Annualized
Average Rate |
Average
Daily Balance |
Interest |
Annualized
Average Rate |
||||||||||||||||||
|
Interest earning assets 1 |
||||||||||||||||||||||||
|
Investment securities 2 |
$ | 80,886 | $ | 1,281 | 2.1 | % | $ | 76,356 | $ | 943 | 1.7 | % | ||||||||||||
|
Loans 2 |
109,001 | 3,097 | 3.8 | 97,099 | 2,399 | 3.3 | ||||||||||||||||||
|
Securities purchased under agreements to resell and Securities borrowed 3 : |
||||||||||||||||||||||||
|
U.S. |
133,208 | 1,410 | 1.4 | 126,738 | 406 | 0.4 | ||||||||||||||||||
|
Non-U.S. |
89,699 | (254 | ) | (0.4 | ) | 96,419 | (320 | ) | (0.4 | ) | ||||||||||||||
|
Trading assets, net of Trading liabilities 4 : |
||||||||||||||||||||||||
|
U.S. |
55,162 | 1,520 | 3.7 | 58,260 | 1,385 | 3.2 | ||||||||||||||||||
|
Non-U.S. |
7,045 | 167 | 3.2 | 3,701 | 76 | 2.7 | ||||||||||||||||||
|
Customer receivables and Other 5 : |
||||||||||||||||||||||||
|
U.S. |
71,293 | 1,880 | 3.5 | 68,611 | 1,128 | 2.2 | ||||||||||||||||||
|
Non-U.S. |
33,747 | 680 | 2.7 | 26,743 | 394 | 2.0 | ||||||||||||||||||
|
Total |
$ | 580,041 | $ | 9,781 | 2.3 | % | $ | 553,927 | $ | 6,411 | 1.5 | % | ||||||||||||
|
Interest bearing liabilities |
||||||||||||||||||||||||
|
Deposits 2 |
$ | 166,384 | $ | 809 | 0.7 | % | $ | 150,244 | $ | 88 | 0.1 | % | ||||||||||||
|
Borrowings 2, 6 |
192,746 | 3,683 | 2.6 | 181,544 | 3,197 | 2.4 | ||||||||||||||||||
|
Securities sold under agreements to repurchase and Securities loaned 7 : |
||||||||||||||||||||||||
|
U.S. |
24,871 | 952 | 5.1 | 31,958 | 651 | 2.7 | ||||||||||||||||||
|
Non-U.S. |
38,248 | 374 | 1.3 | 39,449 | 261 | 0.9 | ||||||||||||||||||
|
Customer payables and Other 8 : |
||||||||||||||||||||||||
|
U.S. |
121,556 | 577 | 0.6 | 128,420 | (196 | ) | (0.2 | ) | ||||||||||||||||
|
Non-U.S. |
71,382 | 569 | 1.1 | 64,257 | 105 | 0.2 | ||||||||||||||||||
|
Total |
$ | 615,187 | $ | 6,964 | 1.5 | % | $ | 595,872 | $ | 4,106 | 0.9 | % | ||||||||||||
|
Net interest income and net interest rate spread |
$ | 2,817 | 0.8 | % | $ | 2,305 | 0.6 | % | ||||||||||||||||
| 1. |
Prior period amounts have been revised to conform to the current presentation. |
| 2. |
Amounts include primarily U.S. balances. |
| 3. |
Includes fees paid on Securities borrowed. |
| 4. |
Trading assets, net of Trading liabilities exclude non-interest earning assets and non-interest bearing liabilities, such as equity securities. |
| 5. |
Includes interest from Customer receivables and Cash and cash equivalents. |
| 6. |
The Firm also issues structured notes that have coupon or repayment terms linked to the performance of debt or equity securities, indices, currencies or commodities, which are recorded within Trading revenues (see Notes 3 and 11 to the financial statements in the 2017 Form 10-K). |
| 7. |
Includes fees received on Securities loaned. The annualized average rate was calculated using (a) interest expense incurred on all securities sold under agreements to repurchase and securities loaned transactions, whether or not such transactions were reported in the balance sheets and (b) net average on-balance sheet balances, which exclude certain securities-for-securities transactions. |
| 8. |
Includes fees received from prime brokerage customers for stock loan transactions incurred to cover customers’ short positions. |
| 85 | September 2018 Form 10-Q |
Table of Contents
| Financial Data Supplement (Unaudited) |
|
|
| Effect of Volume and Rate Changes on Net Interest Income | ||
|
Current Quarter versus Prior Year Quarter |
Current Year Period versus Prior Year Period |
|||||||||||||||||||||||
|
Increase (Decrease) Due to Change in: |
Increase (Decrease) Due to Change in: |
|||||||||||||||||||||||
| $ in millions | Volume | Rate | Net Change | Volume | Rate | Net Change | ||||||||||||||||||
|
Interest earning assets |
||||||||||||||||||||||||
|
Investment securities |
$ | 38 | $ | 89 | $ | 127 | $ | 56 | $ | 282 | $ | 338 | ||||||||||||
|
Loans |
94 | 138 | 232 | 295 | 403 | 698 | ||||||||||||||||||
|
Securities purchased under agreements to resell and Securities borrowed: |
||||||||||||||||||||||||
|
U.S. |
17 | 430 | 447 | 25 | 979 | 1,004 | ||||||||||||||||||
|
Non-U.S. |
11 | 41 | 52 | 21 | 45 | 66 | ||||||||||||||||||
|
Trading assets, net of Trading liabilities: |
||||||||||||||||||||||||
|
U.S. |
(21 | ) | 66 | 45 | (65 | ) | 200 | 135 | ||||||||||||||||
|
Non-U.S. |
21 | (1 | ) | 20 | 51 | 40 | 91 | |||||||||||||||||
|
Customer receivables and Other: |
||||||||||||||||||||||||
|
U.S. |
34 | 235 | 269 | 52 | 700 | 752 | ||||||||||||||||||
|
Non-U.S. |
25 | 70 | 95 | 95 | 191 | 286 | ||||||||||||||||||
|
Change in interest income |
$ | 219 | $ | 1,068 | $ | 1,287 | $ | 530 | $ | 2,840 | $ | 3,370 | ||||||||||||
|
Interest bearing liabilities |
||||||||||||||||||||||||
|
Deposits |
$ | 10 | $ | 304 | $ | 314 | $ | 12 | $ | 709 | $ | 721 | ||||||||||||
|
Borrowings |
(6 | ) | 184 | 178 | 201 | 285 | 486 | |||||||||||||||||
|
Securities sold under agreements to repurchase and Securities loaned: |
||||||||||||||||||||||||
|
U.S. |
(44 | ) | 156 | 112 | (160 | ) | 461 | 301 | ||||||||||||||||
|
Non-U.S. |
(8 | ) | 49 | 41 | 1 | 112 | 113 | |||||||||||||||||
|
Customer payables and Other: |
||||||||||||||||||||||||
|
U.S. |
1 | 333 | 334 | 8 | 765 | 773 | ||||||||||||||||||
|
Non-U.S. |
6 | 149 | 155 | 11 | 453 | 464 | ||||||||||||||||||
|
Change in interest expense |
$ | (41 | ) | $ | 1,175 | $ | 1,134 | $ | 73 | $ | 2,785 | $ | 2,858 | |||||||||||
|
Change in net interest income |
$ | 260 | $ | (107 | ) | $ | 153 | $ | 457 | $ | 55 | $ | 512 | |||||||||||
| September 2018 Form 10-Q | 86 |
Table of Contents
Table of Contents
| Glossary of Common Acronyms |
|
| September 2018 Form 10-Q | 88 |
Table of Contents
Table of Contents
|
|
Unregistered Sales of Equity Securities and Use of Proceeds
The following table sets forth the information with respect to purchases made by or on behalf of the Firm of its common stock during the current quarter ended September 30, 2018.
Issuer Purchases of Equity Securities
| $ in millions, except per share data |
Total Number of
Shares Purchased |
Average Price Paid Per Share |
Total Number of
Shares Purchased as Part of Publicly Announced Plans or Programs 1 |
Approximate
Dollar Value of Shares that May Yet be Purchased Under the Plans or Programs |
||||||||||||
|
Month #1 (July 1, 2018—July 31, 2018) |
||||||||||||||||
|
Share Repurchase Program 2 |
4,855,200 | $ | 50.77 | 4,855,200 | $ | 4,473 | ||||||||||
|
Employee transactions 3 |
492,295 | $ | 50.33 | — | — | |||||||||||
|
Month #2 (August 1, 2018—August 31, 2018) |
||||||||||||||||
|
Share Repurchase Program 2 |
9,539,000 | $ | 49.18 | 9,539,000 | $ | 4,004 | ||||||||||
|
Employee transactions 3 |
12,162 | $ | 50.38 | — | — | |||||||||||
|
Month #3 (September 1, 2018—September 30, 2018) |
||||||||||||||||
|
Share Repurchase Program 2 |
9,525,673 | $ | 48.75 | 9,525,673 | $ | 3,540 | ||||||||||
|
Employee transactions 3 |
16,632 | $ | 48.47 | — | — | |||||||||||
|
Quarter ended at September 30, 2018 |
||||||||||||||||
|
Share Repurchase Program 2 |
23,919,873 | $ | 49.33 | 23,919,873 | $ | 3,540 | ||||||||||
|
Employee transactions 3 |
521,089 | $ | 50.27 | — | — | |||||||||||
| 1. |
Share purchases under publicly announced programs are made pursuant to open-market purchases, Rule 10b5-1 plans or privately negotiated transactions (including with employee benefit plans) as market conditions warrant and at prices the Firm deems appropriate and may be suspended at any time. On April 18, 2018, the Firm entered into a sales plan with Mitsubishi UFJ Financial Group, Inc. (“MUFG”) and Morgan Stanley & Co. LLC (“MS&Co.”) whereby MUFG will sell shares of the Firm’s common stock to the Firm, through the Firm’s agent MS&Co., as part of the Company’s share repurchase program (as defined below). The sales plan is only intended to maintain MUFG’s ownership percentage below 24.9% in order to comply with MUFG’s passivity commitments to the Board of Governors of the Federal Reserve System (the “Federal Reserve”) and will have no impact on the strategic alliance between MUFG and the Firm, including the joint ventures in Japan. |
| 2. |
The Firm’s Board of Directors has authorized the repurchase of the Firm’s outstanding stock under a share repurchase program (the “Share Repurchase Program”). The Share Repurchase Program is a program for capital management purposes that considers, among other things, business segment capital needs, as well as equity-based compensation and benefit plan requirements. The Share Repurchase Program has no set expiration or termination date. Share repurchases by the Firm are subject to regulatory approval. On June 28, 2018, the Federal Reserve published summary results of CCAR and the Firm received a conditional non-objection to its 2018 Capital Plan, where the only condition was that the Firm’s capital distributions not exceed the greater of the actual distributions it made over the previous four calendar quarters or the annualized average of actual distributions over the previous eight calendar quarters. As a result, the Firm’s 2018 Capital Plan includes a share repurchase of up to $4.7 billion of its outstanding common stock during the period beginning July 1, 2018 through June 30, 2019. During the quarter ended September 30, 2018, the Firm repurchased approximately $1.2 billion of the Firm’s outstanding common stock as part of its Share Repurchase Program. For further information, see “Liquidity and Capital Resources—Capital Management.” |
| 3. |
Includes shares acquired by the Firm in satisfaction of the tax withholding obligations on stock-based awards granted under the Firm’s stock-based compensation plans. |
| September 2018 Form 10-Q | 90 |
Table of Contents
|
|
| 91 | September 2018 Form 10-Q |
Table of Contents
Morgan Stanley
Quarter Ended September 30, 2018
| Exhibit No. |
Description |
|
| 15 | ||
| 31.1 | ||
| 31.2 | ||
| 32.1 | ||
| 32.2 | ||
| 101 |
Interactive data files pursuant to Rule 405 of Regulation S-T (unaudited): (i) the Consolidated Income Statements—Three Months and Nine Months Ended September 30, 2018 and 2017, (ii) the Consolidated Comprehensive Income Statements—Three Months and Nine Months Ended September 30, 2018 and 2017, (iii) the Consolidated Balance Sheets—at September 30, 2018 and December 31, 2017, (iv) the Consolidated Statements of Changes in Total Equity—Nine Months Ended September 30, 2018 and 2017, (v) the Consolidated Cash Flow Statements—Nine Months Ended September 30, 2018 and 2017, and (vi) Notes to Consolidated Financial Statements. |
|
E-1
Table of Contents
Pursuant to the requirements of the Securities Exchange Act of 1934, the Registrant has duly caused this report to be signed on its behalf by the undersigned thereunto duly authorized.
|
MORGAN STANLEY (Registrant) |
| By: /s/ J ONATHAN P RUZAN |
|
Jonathan Pruzan Executive Vice President and Chief Financial Officer |
| By: /s/ P AUL C. W IRTH |
|
Paul C. Wirth Deputy Chief Financial Officer |
Date: November 5, 2018
S-1