MSA SAFETY INC
10-Ks and 10-Qs
|
|
|
|
|
|
|
|
|
|
|
|
|
|
|
|
|
|
|
|
|
|
|
|
|
|
|
|
|
|
|
|
|
|
|
|
|
|
|
|
|
|
|
|
|
|
|
|
|
|
|
|
|
|
|
|
UNITED STATES
SECURITIES AND EXCHANGE COMMISSION
Washington, D.C. 20549
|
For the fiscal year ended December 31, 2015
|
FORM 10-K
|
Commission File No. 1-15579
|
|
ANNUAL REPORT PURSUANT TO SECTION 13 OR 15(d) OF THE
SECURITIES EXCHANGE ACT OF 1934 |
||

MSA SAFETY INCORPORATED
(Exact name of registrant as specified in its charter
)
|
||
|
Pennsylvania
(State or other jurisdiction of
incorporation or organization)
1000 Cranberry Woods Drive
Cranberry Township, Pennsylvania
(Address of principal executive offices)
|
Registrant’s telephone number, including area code: (724) 776-8600
|
46-4914539
(IRS Employer Identification No.)
16066-5207
(Zip code)
|
|
(Title of each class)
Common Stock, no par value
|
Securities registered pursuant to Section 12(b) of the Act:
|
(Name of each exchange on which registered)
New York Stock Exchange
|
Indicate by check mark whether the registrant is a well-known seasoned issuer, as defined in Rule 405 of the Securities Act. Yes
x
No
¨
Indicate by check mark if the registrant is not required to file reports pursuant to Section 13 or Section 15(d) of the Act. Yes
¨
No
x
Indicate by check mark whether the registrant (1) has filed all reports required to be filed by Section 13 or 15(d) of the Securities Exchange Act of 1934 during the preceding 12 months and (2) has been subject to such filing requirements for the past 90 days. Yes
x
No
¨
Indicate by check mark whether the registrant has submitted electronically and posted on its corporate Website, if any, every Interactive Data File required to be submitted and posted pursuant to Rule 405 of Regulation S-T (§ 232.405 of this chapter) during the preceding 12 months (or for such shorter period that the registrant was required to submit and post such files). Yes
x
No
¨
Indicate by check mark if disclosure of delinquent filers pursuant to Item 405 of Regulation S-K (§ 229.405 of this chapter) is not contained herein, and will not be contained, to the best of registrant’s knowledge, in the definitive proxy statement incorporated by reference in Part III of this Form 10-K or any amendment to this Form 10-K.
¨
Indicate by check mark whether the registrant is a large accelerated filer, an accelerated filer, a non-accelerated filer, or a smaller reporting company. See the definitions of “large accelerated filer,” “accelerated filer” and “smaller reporting company” in Rule 12b-2 of the Exchange Act. (Check one):
|
Large accelerated filer
x
|
Accelerated filer
¨
|
|
Non-accelerated filer
¨
|
Smaller reporting company
¨
|
(Do not check if a smaller reporting company)
Indicate by check mark whether the registrant is a shell company (as defined in Rule 12b-2 of the Act). Yes
¨
No
ý
As of February 19, 2016, there were outstanding 37,372,425 shares of common stock, no par value. The aggregate market value of voting stock held by non-affiliates as of June 30, 2015 was approximately $1.5 billion.
DOCUMENTS INCORPORATED BY REFERENCE
Portions of the Proxy Statement for the May 10, 2016 Annual Meeting of Shareholders are incorporated by reference into Part III.
Table of Contents
|
Item No.
|
Page
|
|
|
Part I
|
||
|
1.
|
||
|
1A.
|
||
|
1B.
|
||
|
2.
|
||
|
3.
|
||
|
4.
|
||
|
Part II
|
||
|
5.
|
||
|
6.
|
||
|
7.
|
||
|
7A.
|
||
|
8.
|
||
|
9.
|
||
|
9A.
|
||
|
9B.
|
||
|
Part III
|
||
|
10.
|
||
|
11.
|
||
|
12.
|
||
|
13.
|
||
|
14.
|
||
|
Part IV
|
||
|
15.
|
||
2
Forward-Looking Statements
This report may contain (and verbal statements made by MSA Safety Incorporated (MSA) may contain) forward-looking statements within the meaning of the Private Securities Litigation Reform Act of 1995. These statements relate to future events or our future financial performance and involve known and unknown risks, uncertainties and other factors that may cause our actual results, levels of activity, performance or achievements to be materially different from any future results, levels of activity, performance or achievements expressed or implied by these forward-looking statements. These risks and other factors include, but are not limited to, those listed in this report under “Risk Factors,” “Management’s Discussion and Analysis of Financial Condition and Results of Operations,” and elsewhere in this report. In some cases, you can identify forward-looking statements by words such as “may,” “will,” “should,” “expects,” “intends,” “plans,” “anticipates,” “believes,” “estimates,” “predicts,” “potential” or other comparable words. Actual results, performance or outcomes may differ materially from those expressed or implied by these forward-looking statements. Although we believe that the expectations reflected in the forward-looking statements are reasonable, we cannot guarantee future results, levels of activity, performance or achievements. We are under no duty to update publicly any of the forward-looking statements after the date of this report, whether as a result of new information, future events or otherwise.
3
Overview
—
MSA was founded in Pennsylvania in 1914. We are a global leader in the development, manufacture and supply of safety products that protect people and facility insfrastuctures. Our safety products typically integrate a combination of electronics, mechanical systems and advanced materials to protect users against hazardous or life threatening situations. Our comprehensive line of safety products is used by workers around the world in a broad range of markets including the oil and gas, fire service, construction and mining industries. We also sell products designed for specific industrial and military applications. The company's core products include self-contained breathing apparatus ("SCBA"), fixed gas and flame detection systems, portable gas detection instruments, industrial head protection, fire and rescue helmets, and fall protection devices.
We dedicate significant resources to research and development, which allows us to produce innovative safety products that are often first to market and exceed industry standards. Our global product development teams include cross-geographic and cross-functional members from various areas throughout the company, including research and development, marketing, sales, operations and quality management. Our engineers and technical associates work closely with the safety industry’s leading standards-setting groups and trade associations to develop industry specific product requirements and standards and to anticipate their impact on our product lines.
Segments
—
We tailor our product offerings and distribution strategy to satisfy distinct customer preferences that vary across geographic regions. To best serve these customer preferences, we have organized our business into seven geographic operating segments that are aggregated into four reportable geographic segments: North America, Europe, International and Corporate. Segment information is presented in the note entitled “Segment Information” in Item 8—Financial Statements and Supplementary Data.
Because our financial statements are stated in U.S. dollars and much of our business is conducted outside the U.S., currency fluctuations may affect our results of operations and financial position and may affect the comparability of our results between financial periods.
Products
—
We manufacture and sell a comprehensive line of safety products to protect the safety of workers and facility infrustructures around the world in the oil and gas, fire service, construction, and mining industries. We also sell products designed for specific industrial and military applications. Our products protect people against a wide variety of hazardous or life-threatening situations.
The following is a brief description of each of our product categories:
Core products.
MSA's corporate strategy includes a focus on driving sales of core products, which have leading market positions and a competitive advantage. These products typically realize a higher gross profit margin than non-core products. Core products, as mentioned above, include fixed gas and flame detection systems, breathing apparatus where SCBA is the principal product, portable gas detection instruments, industrial head protection products, fire and rescue helmets and fall protection devices. These products receive the highest levels of investment and resources as they typically realize a higher gross profit margin and provide higher levels of return on investment than non-core products. Core products comprised approximately 81% of sales in 2015 compared to 78% in 2014.
The following is a brief description of our core product offerings:
Fixed gas and flame detection instruments ("FGFD").
Our permanently installed fixed gas and flame detection instruments are used in oil, gas and petrochemical facilities and general industrial production facilities to detect the presence or absence of various gases in the air. Typical applications of these instruments include the detection of an oxygen deficiency in confined spaces or the presence of combustible or toxic gases. FGFD product lines have a meaningful portion of overall revenue generated from recurring business including replacement components and related service. A portion of business from this product line is project oriented and more associated with upstream exploration and production activity. Our strongest sales of these instruments have historically been in North America, Western Europe, Middle East and China. Key products include:
|
•
|
Multi-point permanently installed gas detection systems.
This product line is used to monitor for combustible and toxic gases and oxygen deficiency in virtually any application where continuous monitoring is required. Our systems are used for gas detection in petrochemical, pulp and paper, wastewater, refrigerant monitoring, and general industrial applications. These systems utilize a wide array of sensing technologies including electrochemical, catalytic, infrared and ultrasonic.
|
4
|
•
|
Flame detectors and open-path infrared gas detectors.
These instruments are used for plant-wide monitoring of toxic gases and for detecting the presence of flames. These systems use infrared optics to detect potentially hazardous conditions across long distances, making them suitable for use in such applications as offshore oil rigs, storage vessels, refineries, pipelines and ventilation ducts. First used in the oil and gas industry, our systems now have broad applications in petrochemical facilities, the transportation industry and in pharmaceutical production.
|
Breathing apparatus products.
Breathing apparatus products include SCBA, face masks and respirators, where SCBA is the primary product offering. SCBA are used by first responders, petrochemical plant workers and anyone entering an environment deemed immediately dangerous to life and health. Our newest breathing apparatus product, the MSA G1 SCBA, is an entirely redesigned platform that offers many customizable and differentiated features. We currently have 3 patents issued and an additional 10 patents pending for this product. Our strongest sales of breathing apparatus products have historically been in North America, across Western Europe and in China.
Portable gas detection instruments.
Our hand-held portable gas detection instruments are used to detect the presence or absence of various gases in the air. The product is used by oil, gas and petrochemical workers; general industry workers; miners; first responders or anyone working in a confined space environment. Typical applications of these instruments include the detection of an oxygen deficiency in confined spaces or the presence of combustible or toxic gases. Our single- and multi-gas detectors provide portable solutions for detecting the presence of oxygen, combustible gases and various toxic gases, including hydrogen sulfide, carbon monoxide, ammonia and chlorine, either singularly or up to six gases at once. Our ALTAIR
®
2X Single or Two Gas Detectors; ALTAIR
®
4X and ALTAIR
®
5X Multigas Detectors with XCell
®
sensor technology, which include internally developed sensors, provide faster response times and unsurpassed durability in a tough, easy-to-operate package. The ALTAIR
®
2XP provides users with unique and significant cost of ownership advantages over competitive offerings by giving users the ability to perform their own daily bump test to make sure the instrument is functioning properly. Our strongest sales of portable gas detection instruments have historically been in North America, across Western Europe and in Latin America.
Head protection.
We offer a complete line of industrial head protection that includes the iconic V-Gard
®
helmet brand, a bellwether product in MSA's portfolio for over 50 years. We offer customers a wide range of color choices and we are a world leader in the application of customized logos. Our industrial head protection has a wide user base including oil, gas and petrochemical workers, steel and construction workers, miners and industrial workers. Our Fas-Trac
®
III Suspension system was designed to provide comfort for the users of our helmets without sacrificing safety. Our strongest sales of head protection products have historically been in North America and Brazil.
Fire and rescue helmets.
We offer a complete line of fire helmets that includes our Cairns
®
and Gallet
®
helmet brands. Our Cairns helmets are primarily used by firefighters in North America while the Gallet helmets are used by firefighters across our European and International segments. Rescue helmets including the F2 X-Trem Brand, are used by military and first responders outside of North America. Our strongest sales of fire and rescue helmets have historically been in North America and Western Europe.
Fall protection.
Our broad line of fall protection equipment includes confined space equipment, harnesses, fall arrest equipment, lanyards and lifelines. Fall protection equipment is used by workers in the construction industry, oil, gas and petrochemical market, utilities industry and general industrial applications, and anyone working at height. Our strongest sales of fall protection equipment have historically been in North America. In October 2015, MSA acquired UK-based Latchways plc ("Latchways"). This acquisition - complementary from a product, geographic and end market standpoint - is expected to double our fall protection revenue, positioning MSA as one of the largest fall protection providers globally.
Non-core products.
MSA maintains a portfolio of non-core products which includes both adjacent and peripheral offerings. Adjacent products reinforce and extend the core, drawing upon our customer relationships, distribution channels, geographical presence and technical experience. These products are complimentary to the core offerings and have their roots within the core product value chain. Key adjacent products include respirators, eye and face protection, thermal imaging cameras, and gas masks. Gas masks and ballistic helmet sales are the primary purchases from our military customers and were approximately $56 million globally in 2015. Peripheral products are primarily sold to the mining industry and reflect a small portion of consolidated sales.
Customers
—
Our customers generally fall into three categories: distributors, industrial or military end-users, and retail consumers. In North America, the majority of our sales are made through our distributors. In our European and International segments, sales are made through both indirect and direct sales channels. For the year ended December 31, 2015, no individual customer represented more than 10% of our sales.
5
Sales and Distribution
—
Our sales and distribution team consists of marketing, field sales and customer service organizations. In most geographic areas, our field sales organizations work jointly with select distributors to call on end-users and educate them about hazards, exposure limits, safety requirements and product applications, as well as the specific performance attributes of our products. In our South Africa and Eastern Europe regions, where distributors are not as well established, our sales associates often work with and sell directly to end-users. We believe that understanding end-user requirements is critical to increasing MSA's market share.
The in-depth customer training and education provided by our sales associates to our customers is critical to ensuring proper use of many of our products, such as SCBA and gas detection instruments. As a result of our sales associates working closely with end-users, they gain valuable insight into customer preferences and needs. To better serve our customers and to ensure that our sales associates are among the most knowledgeable and professional in the industry, we place significant emphasis on training our sales associates in product application, industry standards and regulations.
We believe our sales and distribution strategy allows us to deliver a customer value proposition that differentiates our products and services from those of our competitors, resulting in increased customer loyalty and demand.
In areas where we use indirect selling, we promote, distribute and service our products to general industry through authorized national, regional and local distributors. Some of our key distributors include W.W. Grainger Inc., Airgas, Sonepar, Bunzl and Fastenal. In North America, we distribute fire service products primarily through specially trained local and regional distributors who provide advanced training and service capabilities to volunteer and paid municipal fire departments. In our European and International segments, we primarily sell to and service the fire service market directly. Because of our broad and diverse product line and our desire to reach as many markets and market segments as possible, we have over 4,000 authorized distributor locations worldwide. No individual distributor accounts for more than 10% of our sales.
Competition
—
The global safety products market is broad and highly fragmented with few participants offering a comprehensive line of safety products. The sophisticated safety products market in which we compete is comprised of both core and non-core offerings - and is a subset of the larger personal protection equipment market, and generates estimated annual sales of approximately $12 billion. We maintain leading positions in all of our core products. Over the long-term, we believe global demand for safety products will continue to grow. Purchases of these products are non-discretionary, protecting workers' health in hazardous and life-threatening work environments. Their use is often mandated by government and industry regulations, which are increasingly enforced on a global basis.
The safety products market is highly competitive, with participants ranging in size from small companies focusing on a single type of personal protection equipment to several large multinational corporations that manufacture and supply many types of sophisticated safety products. Our main competitors vary by region and product. We believe that participants in this industry compete primarily on the basis of product characteristics (such as functional performance, agency approvals, design and style), brand name recognition, service support and price.
We believe we compete favorably within each of our operating segments as a result of our high quality, our innovative offerings and strong brand trust and recognition.
Research and Development
—
To maintain our position at the forefront of safety equipment technology, we operate several sophisticated research and development facilities. We believe our dedication and commitment to innovation and research and development allows us to produce state-of-the-art safety products that are often first to market and exceed industry standards. In 2015, 2014 and 2013, on a global basis, we spent $48.6 million, $48.2 million and $45.9 million, respectively, on research and development, reflecting 4.3%, 4.3% and 4.1% of sales respectively. Our primary engineering groups are located in the United States, Germany, China and France. Our global product development teams include cross-geographic and cross-functional members from various areas throughout the company, including research and development, marketing, sales, operations and quality management. These teams are responsible for setting product line strategy based on their understanding of customers' needs and available technology, as well as the opportunities and challenges they foresee in each product area. We believe our team-based, cross-geographic and cross-functional approach to new product development is a source of competitive advantage. Our approach to the new product development process allows us to tailor our product offerings and product line strategies to satisfy distinct customer preferences and industry regulations that vary across our operating segments.
6
We believe another important aspect of our approach to new product development is that our engineers and technical associates work closely with the safety industry’s leading standards-setting groups and trade associations. These organizations include the National Institute for Occupational Safety and Health ("NIOSH"), the National Fire Protection Association ("NFPA"), American National Standards Institute ("ANSI"), International Safety Equipment Association ("ISEA"), and their overseas counterparts. We work with these organizations to develop industry specific product requirements and standards and anticipate their impact on our product lines. Key members of our management team understand the impact that these standard-setting organizations have on our new product development pipeline. As such, management devotes significant time and attention to anticipating a new standard’s impact on our sales and operating results. Because of our understanding of customer needs, membership on global standard-setting bodies, investment in research and development and our unique new product development process, we believe we are well-positioned to anticipate and adapt to changing product standards. While we acknowledge that the length of the approval process can be unpredictable, we also believe that we are well positioned to gain the approvals and certifications necessary to meet new government and multinational product regulations.
Patents and Intellectual Property
—
We own significant intellectual property, including a number of domestic and foreign patents, patent applications and trademarks related to our products, processes and business. Although our intellectual property plays an important role in maintaining our competitive position in a number of markets that we serve, no single patent, or patent application, trademark or license is, in our opinion, of such value to us that our business would be materially affected by the expiration or termination thereof, other than the “MSA” trademark. Our patents expire at various times in the future not exceeding 20 years. Our general policy is to apply for patents on an ongoing basis in the United States and other countries, as appropriate, to perfect our patent development. In addition to our patents, we have also developed or acquired a substantial body of manufacturing know-how that we believe provides a significant competitive advantage over our competitors.
Raw Materials and Suppliers
—
Many of the components of our products are formulated, machined, tooled or molded in-house from raw materials, which comprise approximately two thirds of our cost of sales. For example, we rely on integrated manufacturing capabilities for breathing apparatus, gas masks, ballistic helmets, hard hats and circuit boards. The primary raw materials that we source from third parties include rubber, high density polyethylene, chemical filter media, eye and face protective lenses, air cylinders, certain metals, electronic components and ballistic resistant and non-ballistic fabrics. We purchase these materials both domestically and internationally, and we believe our supply sources are both well established and reliable. We have close vendor relationship programs with the majority of our key raw material suppliers. Although we generally do not have long-term supply contracts, thus far we have not experienced any significant problems in obtaining adequate raw materials. Please refer to MSA's Form SD filed on May 29, 2015 for further information on our conflict minerals analysis. Form SD may be obtained free of charge at www.sec.gov.
Associates
—
At December 31, 2015, we employed approximately 4,600 associates of which 2,300 were employed by our European and International segments. None of our U.S. associates are subject to the provisions of a collective bargaining agreement. Some of our associates outside the United States are members of unions. We have not experienced a significant work stoppage in over 10 years and believe our relations with our associates are strong.
Environmental Matters
—
Our facilities and operations are subject to laws and regulations relating to environmental protection and human health and safety. In the opinion of management, compliance with current environmental protection laws will not have a material adverse effect on our financial condition. See Item 1A, Risk Factors, for further information regarding our environmental risks which could impact the Company.
Seasonality
—
Our operating results are not significantly affected by seasonal factors. Sales are generally higher during the second and fourth quarters. During periods of economic expansion or contraction and following significant catastrophes, our sales by quarter have varied from this seasonal pattern. Government related sales tend to spike in the fourth quarter. North America sales tend to be strong during the oil and gas market turnaround seasons late in the first quarter, early in the second quarter and then again at the end of the third quarter and beginning of the fourth quarter. European sales are typically weaker in the summer holiday months of July and August. International has recently had strong fourth quarters, but seasonality can be strongly affected by the timing of delivery of larger orders. Invoicing and the delivery of larger orders can affect sales patterns variably across all reporting segments. Additionally, strong shipments of the G1 SCBA in North America during all four quarters in 2015 somewhat masked underlying seasonal trends.
7
Available Information
—
Our Internet address is www.MSAsafety.com. We make the following filings available free of charge on the Investor Relations page on our website as soon as reasonably practicable after they have been electronically filed with or furnished to the Securities and Exchange Commission ("SEC"): our annual reports on Form 10-K, our quarterly reports on Form 10-Q, our current reports on Form 8-K and any amendments to those reports filed or furnished pursuant to Section 13(a) or 15(d) of the Securities Exchange Act of 1934, as well as our proxy statement. Information contained on our website is not part of this annual report on Form 10-K or our other filings with the Securities and Exchange Commission. The SEC maintains an Internet site at www.sec.gov that contains reports, proxy and information statements and other information regarding issuers like us who file electronically with the SEC. You also may read and copy any materials we file with the SEC at the SEC’s Public Reference Room at 100 F Street, NE, Washington, DC 20549-0213. You may obtain information on the operation of the Public Reference Room by calling the SEC at 1-800-SEC-0330.
Unfavorable economic and market conditions could materially and adversely affect our business, results of operations and financial condition.
We are subject to risks arising from adverse changes in global economic conditions. The global economy remains unstable. For example, we are currently seeing a slowdown in China, recessionary conditions in Brazil and a slowdown in certain regions that are dependent upon the mining of certain commodities. We expect economic conditions will continue to be challenging and uneven for the foreseeable future. Adverse changes in economic conditions could result in declines in revenue, profitability and cash flow due to reduced orders, payment delays, supply chain disruptions or other factors caused by the economic challenges faced by our customers and suppliers.
A portion of MSA's sales are made to customers in the oil, gas and petrochemical market. These sales expose MSA to the risks of doing business in that global market. We estimate that roughly 35% of our global business is sold into energy market vertical. Approximately 10% - 15% of consolidated revenue, primarily in industrial head protection and portable gas detection, is more exposed to a pull back in employment trends across the energy market. Another 5% - 10% of consolidated revenue, primarily in the FGFD product line is more exposed to a pull back in capital equipment spending within the energy market. It is possible that the volatility in upstream, midstream and downstream markets, driven partly by geopolitical factors, could negatively impact our business and our results of operations and financial condition.
A reduction in the spending patterns of government agencies or delays in obtaining government approval for our products could materially and adversely affect our net sales, earnings and cash flow.
The demand for our products sold to the fire service market, the homeland security market and other government agencies is, in large part, driven by available government funding. Government budgets are set annually and we cannot assure that government funding will be sustained at the same level in the future. A significant reduction in available government funding could materially and adversely affect our net sales, earnings and cash flow.
Our ability to market and sell our products is subject to existing government regulations and standards. Changes in such regulations and standards or our failure to comply with them could materially and adversely affect our results of operations.
Most of our products are required to meet performance and test standards designed to protect the safety of people and infrastructures around the world. Our inability to comply with these standards may materially and adversely affect our results of operations. Changes in regulations could reduce the demand for our products or require us to re-engineer our products, thereby creating opportunities for our competitors. Regulatory approvals for our products may be delayed or denied for a variety of reasons that are outside of our control. Additionally, market anticipation of significant new standards can cause customers to accelerate or delay buying decisions.
We are subject to various federal, state and local laws and any violation of these laws could adversely affect our results of operations.
We are subject to extensive regulation from U.S. federal, state, and local governments, as well as the governments of the countries in which we conduct business. Failure to comply with these regulations could result in severe civil or criminal penalties, sanctions or significant changes to our operations. These actions could have a materially adverse effect on our business, results of operations and financial condition.
8
We are subject to various environmental laws and any violation of these laws could adversely affect our results of operations.
Included in the extensive laws, regulations and ordinances, to which we are subject, are those relating to the protection of the environment. Examples include those governing discharges to air and water, handling and disposal practices for solid and hazardous wastes and the maintenance of a safe workplace. These laws impose penalties for noncompliance and liability for response costs and certain damages resulting from past and current spills, disposals, or other releases of hazardous materials. We could incur substantial costs as a result of noncompliance with or liability for cleanup pursuant to these environmental laws. Such laws continue to change, and we may be subject to more stringent environmental laws in the future. If more stringent environmental laws are enacted, these future laws could have a materially adverse effect on our results of operations.
The markets in which we compete are highly competitive, and some of our competitors have greater financial and other resources than we do. The competitive pressures faced by us could materially and adversely affect our business, results of operations and financial condition.
The safety products market is highly competitive, with participants ranging in size from small companies focusing on single types of safety products, to large multinational corporations that manufacture and supply many types of safety products. Our main competitors vary by region and product. We believe that participants in this industry compete primarily on the basis of product characteristics (such as functional performance, agency approvals, design and style), price, brand name trust and recognition and customer service. Some of our competitors have greater financial and other resources than we do and our business could be adversely affected by competitors’ new product innovations, technological advances made to competing products and pricing changes made by us in response to competition from existing or new competitors. We may not be able to compete successfully against current and future competitors and the competitive pressures faced by us could materially and adversely affect our business, results of operations and financial condition.
If we fail to introduce successful new products or extend our existing product lines, we may lose our market position and our financial performance may be materially and adversely affected.
In the safety products market, there are frequent introductions of new products and product line extensions. If we are unable to identify emerging consumer and technological trends, maintain and improve the competitiveness of our products and introduce new products, we may lose our market position, which could have a materially adverse effect on our business, financial condition and results of operations. We continue to invest significant resources in research and development and market research. However, continued product development and marketing efforts are subject to the risks inherent in the development process. These risks include delays, the failure of new products and product line extensions to achieve anticipated levels of market acceptance and the risk of failed product introductions.
Product liability claims and our inability to collect related insurance receivables could have a materially adverse effect on our business, operating results and financial condition.
MSA and its subsidiaries face an inherent business risk of exposure to product liability claims arising from the alleged failure of our products to prevent the types of personal injury or death against which they are designed to protect. Although we have not frequently experienced material uninsured losses due to product liability claims, it is possible that we could experience material losses in the future. In the event any of our products prove to be defective, we could be required to recall or redesign such products. In addition, we may voluntarily recall or redesign certain products that could potentially be harmful to end users. Any claim or product recall that results in significant expense or adverse publicity against us, could have a materially adverse effect on our business, operating results and financial condition, including any successful claim brought against us in excess or outside of available insurance coverage.
In the normal course of business, we make payments to settle product liability claims and for related legal fees and we record receivables for the amounts covered by insurance. Our insurance receivables totaled $229.5 million at December 31, 2015. Various factors could affect the timing and amount of recovery of insurance receivables, including: the outcome of negotiations with insurers, legal proceedings with respect to product liability insurance coverage and the extent to which insurers may become insolvent in the future. Amounts due from insurance carriers are subject to insolvency risk. Failure to recover amounts due from our insurance carriers could have a materially adverse effect on our business, operating results and financial condition. Mine Safety Appliances Company, LLC, ("MSA LLC") is currently involved in insurance coverage litigation with a number of insurance carriers. When those matters are fully resolved, MSA LLC will be solely responsible for expenses related to cumulative trauma product liability claims. Please refer to Note 19 in Part II Item 8 of this Form 10-K for further details.
9
Damage to the reputation of MSA or to one or more of our product brands could adversely affect our business.
Developing and maintaining our reputation, as well as the reputation of our brands, is a critical factor in our relationship with customers, distributors and others. Our inability to address adverse publicity or other issues, including concerns about product safety or quality, real or perceived, could negatively impact our business which could have a materially adverse effect on our business, operating results and financial condition.
A failure of our information systems could materially and adversely affect our business, results of operations and financial condition.
The proper functioning and security of our information systems is critical to the operation of our business. Our information systems may be vulnerable to damage or disruption from natural or man-made disasters, computer viruses, power losses or other system or network failures. In addition, hackers and cybercriminals could attempt to gain unauthorized access to our information systems with the intent of harming our company or obtaining sensitive information such as intellectual property, trade secrets, financial and business development information, and customer and vendor related information. If our information systems or security fail, our business, results of operations and financial condition could be materially and adversely affected.
Like many companies, from time to time, we have experienced attacks on our computer systems by unauthorized outside parties; however, we do not believe that such attacks have resulted in any material damage to us or our customers. Because the techniques used by computer hackers and others to access or sabotage networks constantly evolve and generally are not recognized until launched against a target, we may be unable to anticipate, prevent or detect these attacks. As a result, our technologies and processes may be misappropriated and the impact of any future incident cannot be predicted. Any loss of such information could harm our competitive position, or cause us to incur significant costs to remedy the damages caused by the incident. We routinely implement improvements to our network security safeguards and we expect to devote increasing resources to the security of our information technology systems. We cannot assure that such system improvements will be sufficient to prevent or limit the damage from any future cyber-attack or network disruptions.
Our plans to continue to improve productivity and reduce complexity may not be successful, which could adversely affect our ability to compete.
MSA has transitioned parts of its European business segment to a principal operating company ("European reorganization"). A Principal Operating Company is an entity that conducts manufacturing and purchasing activities in accordance with the laws and regulations of Switzerland. This principal operating company model integrates our historically individually managed entities, into one that is a centrally managed organization. We have begun to and plan to continue to leverage the benefits of scale created from this approach and are in the process of implementing a more efficient and cost-effective enterprise resource planning system in additional locations across the European and International Segments. MSA runs the risk that these and similar initiatives may not be completed substantially as planned, may be more costly to implement than expected, or may not have the positive effects anticipated. In addition, these various initiatives require MSA to implement a significant amount of organizational change which could divert management’s attention from other concerns, and if not properly managed, could cause disruptions in our day-to-day operations and have a negative impact on MSA's financial results. It is also possible that other major productivity and streamlining programs may be required in the future.
Our plans to improve future profitability through restructuring programs may not be successful and may lead to unintended consequences.
MSA incurred a significant amount of restructuring expense during 2015, primarily related to headcount reduction. These efforts should contribute to profitability in future periods. Our success will depend on our ability to maintain increased productivity without backfilling certain positions.
We have significant international operations and are subject to the risks of doing business in foreign countries.
We have business operations in over 40 foreign countries. In 2015, approximately half of our net sales were made by operations located outside the United States. Our international operations are subject to various political, economic and other risks and uncertainties, which could adversely affect our business. These risks include the following:
|
•
|
unexpected changes in regulatory requirements;
|
|
•
|
changes in trade policy or tariff regulations;
|
|
•
|
changes in tax laws and regulations;
|
|
•
|
changes to the company's legal structure could have unintended tax consequences;
|
10
|
•
|
inability to generate sufficient profit in certain foreign jurisdictions could lead to additional valuation allowances on deferred tax assets;
|
|
•
|
intellectual property protection difficulties;
|
|
•
|
difficulty in collecting accounts receivable;
|
|
•
|
complications in complying with a variety of foreign laws and regulations, some of which may conflict with U.S. laws;
|
|
•
|
trade protection measures and price controls;
|
|
•
|
trade sanctions and embargoes;
|
|
•
|
nationalization and expropriation;
|
|
•
|
increased international instability or potential instability of foreign governments;
|
|
•
|
effectiveness of worldwide compliance with MSA's anti-bribery policy, local laws and the Foreign Corrupt Practices Act
|
|
•
|
the ability to effectively negotiate with labor unions in foreign countries;
|
|
•
|
the need to take extra security precautions for our international operations; and
|
|
•
|
costs and difficulties in managing culturally and geographically diverse international operations.
|
Any one or more of these risks could have a negative impact on the success of our international operations and, thereby, materially and adversely affect our business as a whole.
Our future results are subject to the risk that purchased components and materials are unavailable or available at excessive cost due to material shortages, excessive demand, currency fluctuation and other factors.
We depend on various components and materials to manufacture our products. Although we have not experienced any difficulty in obtaining components and materials, it is possible that any of our supplier relationships could be terminated or otherwise disrupted. Any sustained interruption in our receipt of adequate supplies could have a materially adverse effect on our business, results of operations and financial condition. We cannot assure you that we will be able to successfully manage price fluctuations due to market demand, currency risks or material shortages, or that future price fluctuations will not have a materially adverse effect on our business, results of operations and financial condition.
Because we derive a significant portion of our sales from the operations of our foreign subsidiaries, future currency exchange rate fluctuations may adversely affect our results of operations and financial condition, and may affect the comparability of our results between financial periods.
For the year ended December 31, 2015, the operations in our European and International segments accounted for approximately 46% of our net sales. The results of our foreign operations are generally reported in the local currency and then translated into U.S. dollars at the applicable exchange rates for inclusion in our consolidated financial statements. The exchange rates between some of these currencies and the U.S. dollar have fluctuated significantly in recent years, and may continue to do so in the future. In addition, because our financial statements are stated in U.S. dollars, such fluctuations may affect our results of operations and financial position, and may affect the comparability of our results between financial periods. We cannot assure you that we will be able to effectively manage our exchange rate risks or that any volatility in currency exchange rates will not have a materially adverse effect on our results of operations and financial condition.
If we lose any of our key personnel or are unable to attract, train and retain qualified personnel, our ability to manage our business and continue our growth would be negatively impacted.
Our success depends in large part on the continued contributions of our key management, engineering and sales and marketing personnel, many of whom are highly skilled and would be difficult to replace. Our success also depends on the abilities of new personnel to function effectively, both individually and as a group. If we are unable to attract, effectively integrate and retain management, engineering or sales and marketing personnel, then the execution of our growth strategy and our ability to react to changing market requirements may be impeded, and our business could suffer as a result. Competition for personnel is intense, and we cannot assure you that we will be successful in attracting and retaining qualified personnel. In addition, we do not currently maintain key person life insurance.
11
Our inability to successfully identify, consummate and integrate current and future acquisitions or to realize anticipated cost savings and other benefits could adversely affect our business.
One of our operating strategies is to selectively pursue acquisitions. On October 21, 2015, MSA completed the acquisition of Latchways - a leading global provider of innovative fall protection systems and solutions based in the United Kingdom. Please refer to Note 13 in Part II Item 8 of this Form 10-K for further details. Any future acquisitions will depend on our ability to identify suitable acquisition candidates and successfully consummate such acquisitions. Acquisitions involve a number of risks including:
|
•
|
failure of the acquired businesses to achieve the results we expect;
|
|
•
|
diversion of our management’s attention from operational matters;
|
|
•
|
our inability to retain key personnel of the acquired businesses;
|
|
•
|
risks associated with unanticipated events or liabilities;
|
|
•
|
potential disruption of our existing business; and
|
|
•
|
customer dissatisfaction or performance problems at the acquired businesses.
|
If we are unable to integrate or successfully manage businesses that we have recently acquired including Latchways, or may acquire in the future, we may not realize anticipated cost savings, improved manufacturing efficiencies and increased revenue, which may result in materially adverse short- and long-term effects on our operating results, financial condition and liquidity. Even if we are able to integrate the operations of our acquired businesses into our operations, we may not realize the full benefits of the cost savings, revenue enhancements or other benefits that we may have expected at the time of acquisition. In addition, even if we achieve the expected benefits, we may not be able to achieve them within the anticipated time frame, and such benefits may be offset by costs incurred in integrating the acquired companies and increases in other expenses.
Our continued success depends on our ability to protect our intellectual property. If we are unable to protect our intellectual property, our business could be materially and adversely affected.
Our success depends, in part, on our ability to obtain and enforce patents, maintain trade secret protection and operate without infringing on the proprietary rights of third parties
.
We have been issued patents and have registered trademarks with respect to many of our products, but our competitors could independently develop similar or superior products or technologies, duplicate any of our designs, trademarks, processes or other intellectual property or design around any processes or designs on which we have or may obtain patents or trademark protection. In addition, it is possible that third parties may have, or will acquire, licenses for patents or trademarks that we may use or desire to use, so that we may need to acquire licenses to, or to contest the validity of, such patents or trademarks of third parties. Such licenses may not be made available to us on acceptable terms, if at all, and we may not prevail in contesting the validity of third party rights.
We also protect trade secrets, know-how and other confidential information against unauthorized use by others or disclosure by persons who have access to them, such as our employees, through contractual arrangements
.
These agreements may not provide meaningful protection for our trade secrets, know-how or other proprietary information in the event of any unauthorized use, misappropriation or disclosure of such trade secrets, know-how or other proprietary information
.
If we are unable to maintain the proprietary nature of our technologies, our results of operations and financial condition could be materially and adversely affected.
The continued success of our next generation G1 SCBA is dependent on our ability to manufacture the product in line with customer demand while controlling product cost.
The G1 SCBA has significant market potential; however, our success will depend upon our ability to maintain increased production and execute key value based engineering efforts aimed at improving the cost profile of the product.
We may be required to recognize impairment charges for our long-lived assets or available for sale investments.
At December 31, 2015, the net carrying value of long-lived assets (property, plant and equipment, goodwill and other intangible assets) totaled approximately $586.2 million. In accordance with generally accepted accounting principles, we periodically assess these assets to determine if they are impaired. Significant negative industry or economic trends, disruptions to our business, unexpected significant changes or planned changes in use of the assets and divestitures may result in impairments to goodwill and other long-lived assets. Future impairment charges could significantly affect our results of operations in the periods recognized. Impairment charges would also reduce our consolidated shareholders’ equity and increase our debt-to-total-capitalization ratio, which could negatively impact our credit rating and access to debt and equity markets.
12
Risks related to our defined benefit pension and other post-retirement plans may adversely impact our results of operations and cash flow.
Significant changes in actual investment return on pension assets, discount rates, and other factors could adversely affect our results of operations and pension contributions in future periods. U.S. generally accepted accounting principles require that we calculate income or expense for the plans using actuarial valuations. These valuations reflect assumptions about financial markets and interest rates, which may change based on economic conditions. Funding requirements for our pension plans may become more significant. However, the ultimate amounts to be contributed are dependent upon, among other things, interest rates, underlying asset returns and the impact of legislative or regulatory changes related to pension funding obligations. For further information regarding our pension plans, refer to "Pensions and Other Post-retirement Benefits" in Note 14 of Item 8 Financial Statements and Supplementary Data.
If we fail to meet our debt service requirements or the restrictive covenants in our debt agreements or if interest rates increase, our results of operations and financial condition could be materially and adversely affected.
We have a substantial amount of debt upon which we are required to make scheduled interest and principal payments and we may incur additional debt in the future. A significant portion of our debt bears interest at variable rates that may increase in the future. Our debt agreements require us to comply with certain restrictive covenants. If we are unable to generate sufficient cash to service our debt or if interest rates increase, our results of operations and financial condition could be materially and adversely affected. Additionally, a failure to comply with the restrictive covenants contained in our debt agreements could result in a default, which if not waived by our lenders, could substantially increase borrowing costs and require accelerated repayment of our debt. Please refer to Note 11 of the Consolidated Financial Statements in Part II Item 8 of this Form 10-K for commentary on our compliance with the restrictive covenants in our debt agreements as of December 31, 2015 as well as our drawing upon a Great British Pound denominated shelf facility in January 2016.
None.
13
Our principal executive offices are located at 1000 Cranberry Woods Drive, Cranberry Township, PA 16066 in a 212,000 square-foot building owned by us. We own or lease our primary facilities in the United States and in a number of other countries. We believe that all of our facilities, including the manufacturing facilities, are in good repair and in suitable condition for the purposes for which they are used. The following table sets forth a list of our primary facilities:
|
Location
|
Function
|
Square Feet
|
Owned
or Leased
|
||
|
North America
|
|||||
|
Murrysville, PA
|
Manufacturing
|
295,000
|
|
Owned
|
|
|
Cranberry Twp., PA
|
Office, Research and Development and Manufacturing
|
212,000
|
|
Owned
|
|
|
New Galilee, PA
|
Distribution
|
120,000
|
|
Leased
|
|
|
Jacksonville, NC
|
Manufacturing
|
107,000
|
|
Owned
|
|
|
Queretaro, Mexico
|
Office, Manufacturing and Distribution
|
77,000
|
|
Leased
|
|
|
Cranberry Twp., PA
|
Research and Development
|
68,000
|
|
Owned
|
|
|
Lake Forest, CA
|
Office, Research and Development and Manufacturing
|
62,000
|
|
Leased
|
|
|
Corona, CA
|
Manufacturing
|
19,000
|
|
Leased
|
|
|
Torreon, Mexico
|
Office
|
15,000
|
|
Leased
|
|
|
Lake Forest, CA
|
Office
|
6,000
|
|
Owned
|
|
|
Houston, TX
|
Office and Distribution
|
9,000
|
|
Leased
|
|
|
Europe
|
|||||
|
Berlin, Germany
|
Office, Research and Development, Manufacturing and Distribution
|
340,000
|
|
Leased
|
|
|
Chatillon sur Chalaronne, France
|
Office, Research and Development, Manufacturing and Distribution
|
94,000
|
|
Owned
|
|
|
Milan, Italy
|
Office
|
43,000
|
|
Owned
|
|
|
Rapperswil, Switzerland
|
Office
|
8,000
|
|
Leased
|
|
|
Glasgow, Scotland
|
Office
|
7,000
|
|
Leased
|
|
|
Mohammedia, Morocco
|
Manufacturing
|
24,000
|
|
Owned
|
|
|
Barcelona, Spain
|
Office
|
23,000
|
|
Leased
|
|
|
Galway, Ireland
|
Office and Manufacturing
|
20,000
|
|
Owned
|
|
|
Varnamo, Sweden
|
Office, Manufacturing and Distribution
|
18,000
|
|
Leased
|
|
|
Hoorn, Netherlands
|
Office and Distribution
|
10,000
|
|
Leased
|
|
|
Rajarhat, India
|
Office and Distribution
|
10,000
|
|
Leased
|
|
|
Warsaw, Poland
|
Office and Distribution
|
18,000
|
|
Leased
|
|
|
Devizes, UK
|
Office, Manufacturing and Distribution
|
115,000
|
|
Owned
|
|
|
Kozina, Slovenia
|
Office and Manufacturing
|
17,000
|
|
Leased
|
|
|
International
|
|||||
|
Suzhou, China
|
Office and Manufacturing
|
193,000
|
|
Owned
|
|
|
Sydney, Australia
|
Office, Manufacturing
|
18,000
|
|
Leased
|
|
|
Sao Paulo, Brazil
|
Office, Manufacturing and Distribution
|
74,000
|
|
Owned
|
|
|
Johannesburg, South Africa
|
Office, Manufacturing and Distribution
|
35,000
|
|
Leased
|
|
|
Lima, Peru
|
Office and Distribution
|
34,000
|
|
Owned
|
|
|
Santiago, Chile
|
Office and Distribution
|
32,000
|
|
Leased
|
|
|
Buenos Aires, Argentina
|
Office and Distribution
|
9,000
|
|
Owned
|
|
14
Please refer to Note 19 to the Consolidated Financial Statements in Part II Item 8 of this Form 10-K.
Not applicable.
Executive Officers of the Registrant
The following sets forth the names and ages of our executive officers as of February 29, 2016, indicating all positions held during the past five years:
|
Name
|
Age
|
|
Title
|
||
|
William M. Lambert
(a)
|
57
|
|
Chairman, President and Chief Executive Officer since May 2015.
|
||
|
Joakim Birgersson
(b)
|
51
|
|
Vice President and General Manager, Europe since August 2015
|
||
|
Steven C. Blanco
(c)
|
49
|
|
Vice President, General Manager Northern North America since May 2015.
|
||
|
Kerry M. Bove
(d)
|
57
|
|
Senior Vice President and Chief Strategy Officer since May 2015.
|
||
|
Ronald N. Herring, Jr.
(e)
|
55
|
|
Senior Vice President and President, MSA Europe and International Segments since May 2015.
|
||
|
Kenneth D. Krause
(f)
|
40
|
|
Vice President, Chief Financial Officer and Treasurer since December 2015.
|
||
|
Douglas K. McClaine
|
58
|
|
Vice President, Secretary and General Counsel since May 2005.
|
||
|
Thomas Muschter
(g)
|
55
|
|
Vice President, Global Product Leadership since November 2011.
|
||
|
Paul R. Uhler
|
57
|
|
Vice President, Global Human Resources since May 2006.
|
||
|
Nishan Vartanian
(h)
|
56
|
|
Senior Vice President and President, MSA Americas Segment since May 2015.
|
||
|
Markus H. Weber
(i)
|
51
|
|
Vice President and Chief Information Officer since April 2010.
|
||
|
(a)
|
Prior to his present position, Mr. Lambert was President and Chief Executive Officer.
|
|
(b)
|
Prior to his present position, Mr. Birgersson served as Project Director of Europe 2.0x.
|
|
(c)
|
Prior to his present position, Mr. Blanco served as Vice President of Global Operational Excellence.
|
|
(d)
|
Prior to his present position, Mr. Bove was Vice President and President MSA International Segment. Mr. Bove also served as Acting Chief Financial Officer from September to December 2015.
|
|
(e)
|
Prior to his present position, Mr. Herring was Vice President and President MSA Europe Segment.
|
|
(f)
|
Prior to his present position, Mr. Krause was Vice President, Strategic Finance and Treasurer.
|
|
(g)
|
Prior to his present position, Dr. Muschter held the positions of Director, Research & Development, International; and Director, Research & Development, Europe.
|
|
(h)
|
Prior to his present position, Mr. Vartanian was Vice President and President, MSA North America.
|
|
(i)
|
Prior to joining MSA, Mr. Weber served as Chief Information Officer of Berlin-Chemie AG, an international research-based pharmaceutical company.
|
15
Our common stock is traded on the New York Stock Exchange under the symbol “MSA.” Stock price ranges and dividends declared were as follows:
|
Price Range of Our
Common Stock
|
Dividends
|
|||||||||
|
High
|
Low
|
|||||||||
|
Year ended December 31, 2014
|
||||||||||
|
First Quarter
|
$
|
57.94
|
|
$
|
46.50
|
|
$
|
0.30
|
|
|
|
Second Quarter
|
58.90
|
|
49.85
|
|
0.31
|
|
||||
|
Third Quarter
|
61.08
|
|
49.37
|
|
0.31
|
|
||||
|
Fourth Quarter
|
58.99
|
|
46.25
|
|
0.31
|
|
||||
|
Year ended December 31, 2015
|
||||||||||
|
First Quarter
|
$
|
53.64
|
|
$
|
43.12
|
|
$
|
0.31
|
|
|
|
Second Quarter
|
52.59
|
|
43.43
|
|
0.32
|
|
||||
|
Third Quarter
|
54.54
|
|
38.32
|
|
0.32
|
|
||||
|
Fourth Quarter
|
47.46
|
|
39.17
|
|
0.32
|
|
||||
On February 16, 2016, there were 427 registered holders of our shares of common stock.
Issuer Purchases of Equity Securities
|
Period
|
Total Number of Shares Purchased
|
Average Price Paid Per Share
|
Total Number of Shares Purchased as Part of Publicly Announced
Plans or Programs
|
Maximum Number of Shares that May Yet Be Purchased
Under the Plans or Programs
|
||||||||
|
October 1 — October 31, 2015
|
180
|
|
$
|
43.48
|
|
—
|
|
2,136,533
|
|
|||
|
November 1 — November 30, 2015
|
4,778
|
|
44.96
|
|
—
|
|
1,980,734
|
|
||||
|
December 1 — December 31, 2015
|
—
|
|
—
|
|
—
|
|
2,137,024
|
|
||||
On May 12, 2015, The Board of Directors adopted a new stock repurchase program to replace the existing program. The new program authorizes up to $100.0 million in repurchases of MSA common stock in the open market and in private transactions. The share purchase program has no expiration date. The maximum shares that may be purchased is calculated based on the dollars remaining under the program and the respective month-end closing share price.
The above share purchases are related to stock compensation transactions.
We do not have any other share purchase programs.
16
Comparison of Five-Year Cumulative Total Return
The following paragraph compares the most recent five year performance of MSA stock with (1) the Standard & Poor’s 500 Composite Index and (2) the Russell 2000 Index. Because our competitors are principally privately held concerns or subsidiaries or divisions of corporations engaged in multiple lines of business, we do not believe it feasible to construct a peer group comparison on an industry or line-of-business basis. The Russell 2000 Index, while including corporations both larger and smaller than MSA in terms of market capitalization, is composed of corporations with an average market capitalization similar to us.
COMPARISON OF 5 YEAR CUMULATIVE TOTAL RETURN
Among MSA Safety Incorporated, the S&P 500 Index,
and the Russell 2000 Index
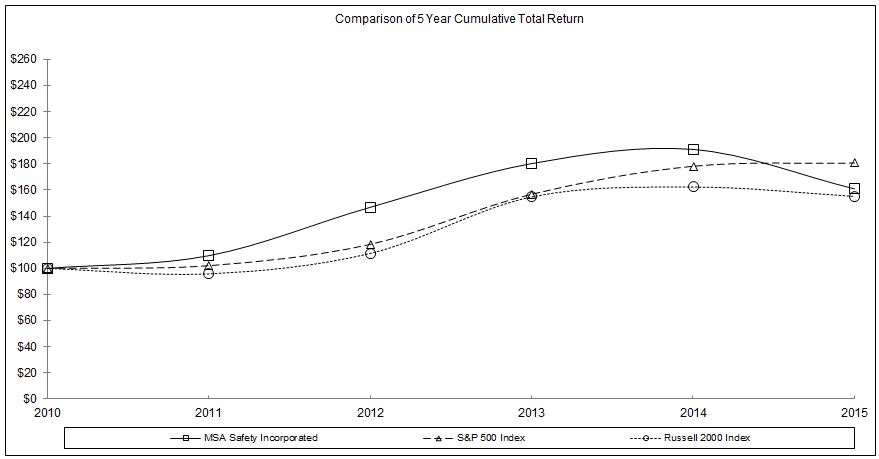
Assumes $100 invested on 12/31/10 in stock or index, including reinvestment of dividends. Fiscal year ending December 31.
|
Value at December 31,
|
|||||||||||||||||||||||
|
2010
|
2011
|
2012
|
2013
|
2014
|
2015
|
||||||||||||||||||
|
MSA Safety Incorporated
|
$
|
100.00
|
|
$
|
109.73
|
|
$
|
146.79
|
|
$
|
180.28
|
|
$
|
191.17
|
|
$
|
160.88
|
|
|||||
|
S&P 500 Index
|
100.00
|
|
102.11
|
|
118.45
|
|
156.82
|
|
178.28
|
|
180.75
|
|
|||||||||||
|
Russell 2000 Index
|
100.00
|
|
95.82
|
|
111.49
|
|
154.78
|
|
162.35
|
|
155.18
|
|
|||||||||||
Prepared by Zacks Investment Research, Inc. Used with permission. All rights reserved. Copyright 1980-2016.
Index Data: Copyright Standard and Poor’s, Inc. Used with permission. All rights reserved.
Index Data: Copyright Russell Investments, Inc. Used with permission. All rights reserved.
17
|
(In thousands, except as noted)
|
2015
|
2014
|
2013
|
2012
|
2011
|
||||||||||||||
|
Statement of Income Data:
|
|||||||||||||||||||
|
Net sales
|
$
|
1,130,783
|
|
$
|
1,133,885
|
|
$
|
1,112,058
|
|
$
|
1,110,443
|
|
$
|
1,112,814
|
|
||||
|
Income from continuing operations
|
69,590
|
|
87,447
|
|
85,858
|
|
87,557
|
|
67,518
|
|
|||||||||
|
Income from discontinued operations
|
1,217
|
|
1,059
|
|
2,389
|
|
3,080
|
|
2,334
|
|
|||||||||
|
Net income
|
70,807
|
|
88,506
|
|
88,247
|
|
90,637
|
|
69,852
|
|
|||||||||
|
Earnings per share attributable to MSA common shareholders:
|
|||||||||||||||||||
|
Basic per common share (in dollars):
|
|||||||||||||||||||
|
Income from continuing operations
|
$
|
1.86
|
|
$
|
2.34
|
|
$
|
2.31
|
|
$
|
2.37
|
|
$
|
1.85
|
|
||||
|
Income from discontinued operations
|
0.03
|
|
0.03
|
|
0.06
|
|
0.08
|
|
0.06
|
|
|||||||||
|
Net income
|
1.89
|
|
2.37
|
|
2.37
|
|
2.45
|
|
1.91
|
|
|||||||||
|
Diluted per common share (in dollars):
|
|||||||||||||||||||
|
Income from continuing operations
|
$
|
1.84
|
|
$
|
2.30
|
|
$
|
2.28
|
|
$
|
2.34
|
|
$
|
1.81
|
|
||||
|
Income from discontinued operations
|
0.03
|
|
0.03
|
|
0.06
|
|
0.08
|
|
0.06
|
|
|||||||||
|
Net income
|
1.87
|
|
2.33
|
|
2.34
|
|
2.42
|
|
1.87
|
|
|||||||||
|
Dividends paid per common share (in dollars)
|
1.27
|
|
1.23
|
|
1.18
|
|
1.38
|
|
1.03
|
|
|||||||||
|
Weighted average common shares outstanding—basic
|
37,293
|
|
37,138
|
|
36,868
|
|
36,564
|
|
36,221
|
|
|||||||||
|
Weighted average common shares outstanding—diluted
|
37,710
|
|
37,728
|
|
37,450
|
|
37,042
|
|
36,831
|
|
|||||||||
|
Balance Sheet Data:
|
|||||||||||||||||||
|
Total assets
|
$
|
1,424,818
|
|
$
|
1,264,792
|
|
$
|
1,234,270
|
|
$
|
1,111,746
|
|
$
|
1,115,052
|
|
||||
|
Long-term debt
|
459,959
|
|
245,000
|
|
260,667
|
|
272,333
|
|
334,046
|
|
|||||||||
|
Shareholders’ equity
|
516,496
|
|
533,809
|
|
566,452
|
|
462,955
|
|
433,666
|
|
|||||||||
The data presented in the Selected Financial Data table should be read in conjunction with comments provided in Management's Discussion and Analysis of Financial Condition and Results of Operations in Part II Item 7 and the Consolidated Financial Statements in Part II Item 8 of this Form 10-K. The 2015 data includes Latchways from the date of acquisition on October 21, 2015.
The following discussion and analysis should be read in conjunction with the historical financial statements and other financial information included elsewhere in this annual report on Form 10-K. This discussion may contain forward-looking statements that involve risks and uncertainties. The forward-looking statements are not historical facts, but rather are based on current expectations, estimates, assumptions and projections about our industry, business and future financial results. Our actual results could differ materially from the results contemplated by these forward-looking statements due to a number of factors, including those discussed in the sections of this annual report entitled “Forward-Looking Statements” and “Risk Factors.”
On March 7, 2014, Mine Safety Appliances Company, a Pennsylvania corporation (“Old MSA”), completed a previously disclosed reorganization into a holding company structure (the “Reorganization”) in accordance with Section 1924(b)(4) of the Pennsylvania Business Corporation Law of 1988 (the “PBCL”). As a result of the Reorganization, Old MSA became a wholly-owned subsidiary of MSA Safety Incorporated (“New MSA”), a Pennsylvania corporation and previously a direct wholly-owned subsidiary of Old MSA. New MSA became the publicly traded holding company of Old MSA and its subsidiaries. New MSA and its subsidiaries continue to conduct the business and operations that Old MSA and its subsidiaries conducted immediately prior to the Reorganization.
MSA's South African personal protective equipment distribution business and MSA's Zambian operations had historically been part of the International reportable segment. In accordance with generally accepted accounting principles, these results are excluded from continuing operations and are presented as discontinued operations in all periods presented. Please refer to Note 20 Discontinued Operations, which is included in Part II Item 8 of this Form 10-K, for further commentary on these discontinued operations.
18
Sales from MSA's General Monitors companies were historically reported in the country from which product was shipped. Effective January 1, 2014, the General Monitors business has been fully integrated into MSA. As such, sales made by General Monitors companies are now allocated to each country based on the destination of the end-customer and other criteria based on the value added to the order. The 2013 results presented below have been restated to reflect this change in allocation methodology. Please refer to Note 7 Segment Information, which is included in Part II Item 8 of this Form 10-K, for further information.
Certain centrally managed expenses were historically allocated and reported in the North America, Europe and International Segments as well as in the reconciling items column contained in our segment disclosure. Effective January 1, 2015, interest expense, foreign exchange (gain) loss and an allocation of SG&A expenses are now contained in the Corporate segment. Additionally, effective January 1, 2015, we changed the allocation methodology applied to Research and Development expense. The 2014 and 2013 results presented below have been recast to reflect the above noted changes. Please refer to Note 7 Segment Information, for further information.
On October 21, 2015, the Company acquired 100% of the common stock of Latchways plc ("Latchways") for $190.9 million in cash. Latchways, which is headquartered in the United Kingdom, is a leading provider of innovative fall protection systems and solutions. The acquisition of Latchways represents a key step in the execution of our corporate strategy by expanding our investment in one of the largest and fastest growing product segments of the global safety market. This acquisition will double our fall protection business, positioning MSA as one of the largest fall protection providers globally. Within the fall protection space, the Latchways acquisition strengthens our position in permanent engineered systems and our presence in other sectors such as utilities, telecommunications, and aircraft maintenance. The data presented in Part II Item 6 of this Form 10-K should be read in conjunction with the following comments. Additionally, please refer to Note 13 Acquisitions, which is included in Part II Item 8 of this Form 10-K, for further information.
19
BUSINESS OVERVIEW
We are a global leader in the development, manufacture and supply of products that protect people’s and safety. Our safety products typically integrate any combination of electronics, mechanical systems and advanced materials to protect users against hazardous or life threatening situations. Our comprehensive lines of safety products are used by workers around the world in a broad range of markets including the oil and gas, fire service, mining and construction industries, as well as the military. We are committed to providing our customers with service unmatched in the safety industry and, in the process, enhancing our ability to provide a growing line of safety solutions for customers in key global markets.
We tailor our product offerings and distribution strategy to satisfy distinct customer preferences that vary across geographic regions. To best serve these customer preferences, we have organized our business into seven geographical operating segments that are aggregated into four reportable geographic segments: North America, Europe, International and Corporate. Each segment includes a number of operating segments. In
2015
, 54%, 26% and 20% of our net sales were made by our North American, European and International segments, respectively.
North America
. Our largest manufacturing and research and development facilities are located in the United States. We serve our North American markets with sales and distribution functions in the U.S., Canada and Mexico.
Europe
. Our European segment includes companies in most Western European countries, and a number of Eastern European countries along with locations in the Middle East and Russia. In our largest European companies, Germany and France, we develop, manufacture and sell a wide variety of products. The technology associated with the development of our products in these countries is owned by our European Principal Operating company which is located in Rapperswil-Jona, Switzerland. Operations in other European segment countries focus primarily on sales and distribution in their respective home country markets. While some of these companies may perform limited production, most of their sales are of products that are manufactured in our plants in Germany, France, the U.S., the U.K., Ireland, Sweden and China, or are purchased from third party vendors.
International
. Our International segment includes companies in South America, Africa and the Asia Pacific region, some of which are in developing regions of the world. Principal International segment manufacturing operations are located in Brazil and China. These companies manufacture products that are sold primarily in each company’s home country as well as regional markets. The other companies in the International segment focus primarily on sales and distribution in their respective home country markets. While some of these companies may perform limited production, most of their sales are of products that are manufactured in our plants in China, Germany, France and the U.S., or are purchased from third party vendors.
Corporate
. The corporate segment primarily consists of general and administrative expenses incurred in our corporate headquarters, costs associated with corporate development initiatives, legal expense, interest expense, foreign exchange gains or losses, and other centrally-managed costs. Corporate general and administrative costs comprise the majority of the expense in the corporate segment. Corporate general and administrative costs were $38.5 million during the year ended December 31, 2015, which included $7.5 million of transaction and integration costs related to the Latchways acquisition. During the year ended December 31, 2014, corporate general and administrative costs were $35.0 million.
RESULTS OF OPERATIONS
Year Ended December 31, 2015 Compared to Year Ended December 31, 2014
Net Sales from continuing operations.
Net sales for the year ended
December 31, 2015
were
$1,130.8 million
, a decrease of $3.1 million, from
$1,133.9 million
for the year ended December 31, 2014.
The unfavorable translation effects of weaker foreign currencies decreased net sales, when stated in U.S. dollars, by 8%.
Excluding the impact of weakening foreign currencies, net sales increased 8% over the prior year period, of which 1% is attributable to our recent acquisition of Latchways. While we cannot quantify the amount, we expect foreign currency fluctuations to continue to have an effect on results in 2016 as a result of a strong U.S. dollar.
|
Net Sales from Continuing Operations
|
2015 vs. 2014
|
2014 vs. 2013
|
||
|
Organic growth
|
7
|
%
|
4
|
%
|
|
Acquisitions, divestitures, & other, net
|
1
|
%
|
—
|
%
|
|
Foreign exchange impact
|
(8
|
)%
|
(2
|
)%
|
|
Total % Year-Over-Year Change
|
—
|
%
|
2
|
%
|
20
For the year ended December 31, 2015, local currency core product sales increased by 11%, comprising 81% of our total business. Local currency non-core sales decreased 4%. By product group, core product group sales year-over-year growth was as follows on a local currency basis:
|
Percent
Increase
(Decrease)
|
Percent
Increase
(Decrease)
|
|||
|
Core Sales
|
2015
|
2014
|
||
|
Breathing Apparatus
|
52
|
%
|
(7
|
)%
|
|
Fall Protection
|
22
|
%
|
5
|
%
|
|
Fire & Rescue Helmets
|
9
|
%
|
4
|
%
|
|
Fixed Gas & Flame Detection
|
(2
|
)%
|
10
|
%
|
|
Portable Gas Detection
|
(7
|
)%
|
9
|
%
|
|
Head Protection
|
(9
|
)%
|
5
|
%
|
|
Total
|
11
|
%
|
4
|
%
|
|
Net Sales
(Dollars in millions)
|
2015
|
2014
|
Dollar
Increase
(Decrease)
|
Percent
Increase
(Decrease)
|
||||||||||
|
North America
|
$
|
609.0
|
|
$
|
547.7
|
|
$
|
61.3
|
|
11
|
%
|
|||
|
Europe
|
293.2
|
|
321.6
|
|
(28.4
|
)
|
(9
|
)%
|
||||||
|
International
|
228.6
|
|
264.5
|
|
(35.9
|
)
|
(14
|
)%
|
||||||
|
Total
|
1,130.8
|
|
1,133.9
|
|
(3.1
|
)
|
—
|
%
|
||||||
Net sales in the North American segment were
$609.0 million
for the year ended December 31, 2015, an increase of $61.3 million, or 11%, compared to
$547.7 million
for the year ended December 31, 2014. Strong G1 self-contained breathing apparatus sales throughout the year drove growth in breathing apparatus, up 113% during the period. Strength in fire service was partially offset by decreased demand in the gas, petroleum, & chemical markets, reflecting decreased shipments of portable gas detection, industrial head protection, and fixed gas and flame detection, down 16%, 11%, and 6%, respectively.
Net sales for the European segment were $
293.2 million
for the year ended
December 31, 2015
, a decrease of $28.4 million, or 9%, compared to $
321.6 million
for the year ended December 31, 2014. Currency translation effects decreased European segment sales in the current year, when stated in U.S. dollars, by 16%. Local currency sales in Europe increased 7%, of which 3% growth is attributable to the Latchways acquisition. The remaining increase reflects strong growth across several geographies in the segment. In Western Europe, shipments of military helmets in France and fire helmets in Northern and Central Europe were up 14% and 4% in the segment, respectively. Across Emerging European markets, most notably the Middle East, shipments of industrial head protection, portable gas detection, and fixed gas and flame detection were up 21%, 5% and 3% in the segment, respectively.
Net sales for the International segment were $
228.6 million
for the year ended
December 31, 2015
, a decrease of $35.9 million, or 14%, compared to $
264.5 million
for the year ended December 31, 2014. Currency translation effects decreased International segment sales, when stated in U.S. dollars, by 13%, reflecting weakened currencies across several International geographies, notably in Brazil and Australia. Local currency sales in the International segment decreased 1% when compared to the same period in 2014, reflecting lower demand in energy and commodities sectors as well as challenging economic conditions in key emerging markets like Brazil and China. The decrease in sales reflects a lower level of non-core and industrial head protection shipments, down 13% and 11%, respectively, partially offset by higher sales of fire & rescue helmets, breathing apparatus, portable gas detection instruments, and fixed gas and flame detection, up 29%, 11%, 6%, and 4%, respectively.
Other (loss) income.
Other loss for the year ended December 31, 2015 was $0.9 million compared to income of $2.8 million for the year ended December 31, 2014. In 2015, other loss of $0.9 million was driven by losses associated with the disposal of net assets related to the Safety Works business in our North American Segment. These losses were partially offset by gains from the disposal of assets in Australia. In 2014, income of $2.8 million was primarily driven by a $2.2 million gain from the sale of detector tube assets in the European segment. Refer to Note 15 of the Consolidated Financial Statements in Part II Item 8 of this Form 10-K for more information.
21
Gross profit.
Gross profit for the year ended
December 31, 2015
was $501.1 million, a decrease of $14.2 million, or 3%, from $515.3 million for the year ended December 31, 2014. The ratio of gross profit to net sales was 44.3% for 2015 compared to 45.4% in 2014, reflecting lower gross profit in our North American and International segments. The lower gross profit ratio in 2015 was primarily related to a less favorable product mix, increased indirect costs, and increased amortization related to the Latchways acquisition.
Selling, general and administrative expenses.
Selling, general and administrative expenses for the year ended December 31, 2015 were $315.3 million, a decrease of $7.5 million, or 2%, from $322.8 million for the year ended December 31, 2014. Currency translation effects decreased selling, general and administrative expenses for the year ended
December 31, 2015
, when stated in U.S. dollars, by 8%. The decrease reflects weakening currencies across several geographies, notably a weaker Euro, Brazilian real, and Australian dollar. Selling, general and administrative expenses were 27.9% of net sales in 2015 compared to 28.5% of net sales in 2014. Local currency selling, general and administrative expenses increased 6% in the current period, primarily reflecting Latchways acquisition related costs of $7.5 million and Latchways operating SG&A costs of $3.2 million. Excluding Latchways acquisition related costs, local currency selling, general, and administrative expenses increased 4%.
Research and development expenses.
Research and development expenses were $48.6 million for the year ended December 31, 2015, an increase of $0.4 million, or 1%, from $48.2 million for the year ended December 31, 2014. Currency translation effects decreased research and development expense for the year ended December 31, 2015, when stated in U.S. dollars, by 5%. Research and development expenses were 4.3% of net sales in both 2015 and 2014, which is in line with our target ratio of 4.0% - 4.5% of net sales. Local currency research and development spending increased 6%, reflecting our focus on the development of new and innovative technologies for the G1 platform and other core products. Our past R&D investments have yielded solid returns, with sales from products developed and launched over the past five years reflecting 38% of total sales.
Restructuring and other charges.
For the year ended
December 31, 2015
, we recorded charges of $12.3 million, an increase of $3.8 million, or 45%, compared to charges of $8.5 million for the year ended December 31, 2014. At December 31, 2015, the Company had accrued restructuring costs of $8.1 million, primarily related to severance costs associated with our global cost reduction program. The majority of this accrual at December 31, 2015 is expected to be paid out in 2016. The global cost reduction program is expected to save an estimated $10.0 million in future operating costs for 2016, primarily impacting selling, general, and administrative expense and, to a lesser extent, cost of goods sold. While the Company made significant progress in optimizing its cost structure at the end of 2015, the Company is actively evaluating additional cost reduction opportunities in 2016. Refer to Note 2 Restructuring and Other Charges of the Consolidated Financial Statements in Part II Item 8 of this Form 10-K for more information.
For the year ended December 31, 2014, the Company recorded charges of $8.5 million. European segment charges of $4.8 million related primarily to severance from staff reductions in Central and Southern Europe as well as reorganization costs in Central Europe. International segment charges of $3.7 million primarily related to staff reductions in South Africa, Australia, and Brazil as well as asset disposals in Australia and South Africa, as the Company continued to reduce its footprint and to optimize its cost structure in response to challenging economic conditions in certain markets.
Interest expense.
Interest expense for the year ended December 31, 2015 was $10.9 million, an increase of $1.0 million, or 10%, from $9.9 million for the year ended December 31, 2014. The increase in interest expense reflects increased borrowing levels in the current year associated with the Latchways acquisition.
Currency exchange.
Currency exchange losses were $2.2 million during the year ended December 31, 2015, compared to losses of $1.5 million during the same period in 2014. Currency exchange losses in both periods were mostly unrealized and relate primarily to the effect of the strengthening U.S. dollar on intercompany balances.
Income tax provision.
Our effective tax rate from continuing operations for the year ended December 31, 2015 was 40.0% compared to 32.3% for the year ended December 31, 2014. Excluding $7.7 million of charges associated with exit taxes related to our European reorganization, the effective tax rate for the year was 33.1% and 32.3% for the same period last year. The effective tax rate increase was primarily due to non-deductible losses in certain foreign jurisdictions.
MSA continues to move affiliates onto the Principal Operating Company model as part of the European reorganization. The reorganization is designed to drive optimal performance by aligning certain strategic planning and decision making into a single location enabled by a common IT platform. In January, the Company successfully integrated four more affiliates onto the model, and we anticipate incurring additional exit taxes in the range of $3 - 5 million in 2016.
22
Net income from continuing operations.
Net income from continuing operations for the year ended December 31, 2015 was $69.6 million, a decrease of $17.8 million, or 20%, from net income from continuing operations for the year ended December 31, 2014 of $87.4 million. Currency translation effects decreased current period net income when stated in U.S. dollars, by 2%. Local currency net income decreased 18%. Basic earnings per share from continuing operations was $1.86 in 2015 compared to $2.34 in 2014, a decrease of 48 cents per share, or 21%.
North American segment net income for the year ended December 31, 2015 was $87.1 million, an increase of $9.4 million, or 12%, from $77.7 million for the year ended December 31, 2014. The increase in North American segment net income reflects higher sales, notably in the fire sector, and controlled selling, general, and administrative spending.
European segment net income for the year ended December 31, 2015 was $6.8 million, a decrease of $16.0 million, or 70%, from $22.8 million for the year ended December 31, 2014. Currency translation effects decreased European segment net income in the current year, when stated in U.S. dollars, by 1%. Local currency net income decreased 69%, reflecting higher exit taxes earlier in the year associated with the Europe 2.0 program. Excluding exit taxes, local currency pre-tax income was 23% below the prior year period on higher selling, general, and administrative expense due to the Latchways integration, higher pension costs, increased customer facing costs, and costs incurred as we continued to transition parts of the European business to the principal operating model.
International segment net income for the year ended December 31, 2015 was $10.1 million, a decrease of $6.9 million, or 41%, from $17.0 million for the year ended December 31, 2014. Currency translation effects increased current period International segment net income, when stated in U.S. dollars, by 5%. Local currency net income declined 45%, primarily related to a lower level of sales, notably in Brazil. The decrease also reflects higher restructuring costs associated with our global cost reduction program, higher customer facing costs, and higher inventory costs.
Corporate segment net loss for the year ended December 31, 2015 was $33.2 million, an increase of $2.9 million, or 10%, from $30.3 million for the year ended December 31, 2014. The higher loss during the year ended December 31, 2015 reflects higher corporate development costs associated with the acquisition and integration of Latchways as well as one-time restructuring costs associated with our global cost reduction efforts.
Year Ended
December 31, 2014
Compared to Year Ended December 31, 2013
Net sales from continuing operations.
Net sales for the year ended
December 31, 2014
were $1,133.9 million, an increase of $21.8 million, or 2%, from $1,112.1 million for the year ended
December 31, 2013
.
The unfavorable translation effects of weaker foreign currencies decreased net sales, when stated in U.S. dollars, by 2%. Excluding the impact of weakening foreign currencies, net sales increased 4%.
|
Net Sales from Continuing Operations
|
2014 vs. 2013
|
2013 vs. 2012
|
||
|
Organic growth
|
4
|
%
|
2
|
%
|
|
Acquisitions, divestitures, & other, net
|
—
|
%
|
(1
|
)%
|
|
Foreign exchange impact
|
(2
|
)%
|
(1
|
)%
|
|
Total % Year-Over-Year Change
|
2
|
%
|
—
|
%
|
For the year ended December 31, 2014, local currency core product sales increased by 4%, comprising 79% of our total business. Local currency non-core sales increased 5%, primarily on higher helmet sales to the fire and military markets in Europe. By product group, core product group sales year-over-year growth was as follows on a local currency basis:
|
Percent
Increase
(Decrease)
|
Percent
Increase
(Decrease)
|
|||
|
Core Sales
|
2014
|
2013
|
||
|
Fixed Gas & Flame Detection
|
10
|
%
|
6
|
%
|
|
Portable Gas Detection
|
9
|
%
|
11
|
%
|
|
Fall Protection
|
5
|
%
|
6
|
%
|
|
Head Protection
|
5
|
%
|
3
|
%
|
|
Fire & Rescue Helmets
|
4
|
%
|
9
|
%
|
|
Breathing Apparatus
|
(7
|
)%
|
4
|
%
|
|
Total
|
4
|
%
|
6
|
%
|
23
|
Net Sales
(Dollars in millions)
|
2014
|
2013
|
Dollar
Increase (Decrease)
|
Percent
Increase (Decrease)
|
||||||||||
|
North America
|
$
|
547.7
|
|
$
|
533.2
|
|
$
|
14.5
|
|
3
|
%
|
|||
|
Europe
|
321.6
|
|
293.1
|
|
28.5
|
|
10
|
%
|
||||||
|
International
|
264.5
|
|
285.8
|
|
(21.3
|
)
|
(7
|
)%
|
||||||
|
Total
|
1,133.9
|
|
1,112.1
|
|
21.8
|
|
2
|
%
|
||||||
Net sales by the North American segment were
$547.7 million
for the year ended
December 31, 2014
, an increase of $14.5 million, or 3%, compared to
$533.2 million
for the year ended
December 31, 2013
. Leading growth were shipments of FGFD, head protection, and portable gas instruments, up 11%, 10%, and 7%, respectively. These increases were partially offset by an 11% decrease in shipments of breathing apparatus to the fire segment, reflecting delays in securing product approvals of the Company's G1 SCBA platform and other small decreases across a broad range of product lines. The Company began shipping its G1 SCBA after receiving certification in late November, though these shipments were not overly material to results in 2014.
Net sales for the European segment were $
321.6 million
for the year ended
December 31, 2014
, an increase of $28.5 million, or 10%, from $
293.1 million
for the year ended
December 31, 2013
. Local currency sales in Europe increased 10% on increased shipments of ballistic helmets, up 95% on higher sales to military markets in Southern Europe, increased shipments of FGFD, up 16%, primarily on strength in the Middle East, and higher sales of breathing apparatus, up 5% on increased demand across the segment.
Net sales of our International segment were $
264.5 million
for the year ended
December 31, 2014
, a decrease of $21.3 million, or 7%, compared to $
285.8 million
for the year ended
December 31, 2013
. Currency translation effects decreased International segment sales, when stated in U.S. dollars, by 6%, reflecting weakening currencies across several International geographies, notably in Brazil, Argentina, Chile, and Australia. Local currency sales in the International segment decreased 1% on a lower level of breathing apparatus, FGFD, and head protection shipments, down 17%, 7%, and 4%, respectively, in the segment. These decreases, primarily in our Latin America, and Australia region, were partially offset by higher sales in portable gas detection instruments throughout Asia, Australia, and Latin America, up 21% in the segment, as well as higher large shipments of fire helmets in Asia, driving a 24% increase.
Other income (loss).
Other income for the year ended
December 31, 2014
was $2.8 million, primarily related to a $2.2 million gain from the sale of detector tube assets in the European segment. The 2014 income compares with a loss of $0.2 million for the year ended December 31, 2013. In 2013, a $1.6 million land impairment loss in the North American segment was partially offset by interest income of $1.1 million and small gains from asset dispositions.
Gross profit.
Gross profit for the year ended
December 31, 2014
was $515.3 million, an increase of $18.5 million, or 4%, from $496.8 million for the year ended
December 31, 2013
. The ratio of gross profit to net sales was 45.4% for 2014 compared to 44.7% in 2013, reflecting higher gross profit in our North American and European segment. The higher gross profit ratio in 2014 was primarily related to the Company's ongoing focus of developing and introducing new products, pricing the MSA brand more effectively, lowering manufacturing costs and a more favorable sales mix weighted toward gas detection products.
Selling, general and administrative expenses.
Selling, general and administrative expenses for the year ended
December 31, 2014
were $322.8 million, an increase of $13.6 million, or 4%, from $309.2 million for the year ended
December 31, 2013
. Currency translation effects decreased selling, general and administrative expenses, when stated in U.S. dollars, by 2%. The decrease reflects weakening currencies across several geographies in the International segment, notably a weaker Brazilian real, Argentine peso, and Australian dollar. Selling, general and administrative expenses were 28.5% of net sales in 2014 compared to 27.8% of net sales in 2013. Local currency selling, general and administrative expenses increased 6% in the current period, primarily reflecting the impact of corporate strategic initiatives and executing our Europe 2.0 program, and higher charges related to the self-insured portion of the Company's recent product liability settlements.
Research and development expenses.
Research and development expenses were $48.2 million for the year ended
December 31, 2014
, an increase of $2.3 million, or 5%, from $45.9 million for the year ended
December 31, 2013
. The increase reflected our focus on developing innovative new products, including the G1 SCBA, a revolutionary new product designed side by side with firefighters.
24
Restructuring and other charges.
For the year ended
December 31, 2014
, we recorded charges of $8.5 million compared to charges of $5.3 million for the year ended December 31, 2013. European segment charges of $4.8 million related primarily to severance from staff reductions in Central and Southern Europe as well as reorganization costs in Central Europe. International segment charges of $3.7 million, primarily related to staff reductions in South Africa, Australia, and Brazil and asset disposals in Australia and South Africa, as the Company reduces its footprint and optimizes its cost structure in response to challenging economic conditions in certain markets.
For the year ended December 31, 2013, we recorded charges of $5.3 million. European segment charges of $3.0 million related primarily to staff reductions in Germany and the Netherlands. International segment charges of $2.3 million were primarily related to staff reductions in Australia and South Africa.
Interest expense.
Interest expense for the year ended
December 31, 2014
was $9.9 million, a decrease of $0.8 million, or 7%, from $10.7 million for the year ended December 31, 2013. The decrease in interest expense reflects lower borrowing levels in the current year as well as a reduction in borrowing costs associated with our debt refinancing activities in the first half of 2014.
Currency exchange.
Currency exchange losses were $1.5 million during the year ended December 31, 2014, compared to losses of $5.5 million during the same period in 2013. In 2014, currency exchange losses primarily relate to weakening of the Russian ruble. Currency exchange losses in both periods were mostly unrealized and relate primarily to the effect of the strengthening U.S. dollar on intercompany balances.
Income tax provision.
Our effective tax rate for the year ended
December 31, 2014
was 32.3% compared to 29.3% for the year ended December 31, 2013. In 2014, the Company recognized a tax benefit for the research and development tax credit. In 2013, the Company recognized a tax benefit for the research and development tax credits for both 2012 and 2013. Additionally, an unfavorable income mix also contributed to the higher effective tax rate in 2014.
Net income from continuing operations.
Net income from continuing operations for the year ended
December 31, 2014
was $87.4 million, an increase of $1.5 million, or 2%, from net income from continuing operations for the year ended December 31, 2013 of $85.9 million. Currency translation effects decreased current period net income when stated in U.S. dollars, by 2%. Basic earnings per share from continuing operations was $2.34 in 2014 compared to $2.31 in 2013, an increase of 3 cents per share, or 1%. Local currency net income increased 4%.
North American segment net income for the year ended
December 31, 2014
was $77.7 million, an increase of $9.5 million, or 14%, from $68.2 million for the year ended December 31, 2013. The increase in North American segment net income reflects higher sales and gross profits as well as lower operating costs.
European segment net income for the year ended
December 31, 2014
was $22.8 million, an increase of $0.8 million, or 4%, from $22.0 million for the year ended December 31, 2013. Currency translation impacts for the year ended December 31, 2014 increased European segment net income, when stated in U.S. dollars, by 2%. Local currency net income increased by 2%, reflecting higher selling, general, and administrative expense and restructuring expense, partially offset by increased sales and strong gross profit.
International segment net income for the year ended
December 31, 2014
was $17.0 million, a decrease of $10.9 million, or 39%, from $27.9 million for the year ended December 31, 2013. Currency translation effects decreased 2014 International segment net income when stated in U.S. dollars, by 4%, primarily due to a weaker Argentine peso, Brazilian real, and Chilean peso. Local currency net income decreased 35%, and was primarily related to a lower level of sales, higher operating expense, and higher restructuring costs.
Corporate segment net loss for the year ended
December 31, 2014
was $30.3 million, a decrease of $1.7 million, or 5%, compared to a net loss of $32.0 million for the year ended December 31, 2013. The lower loss during the year ended December 31, 2014 reflects a more favorable foreign currency exchange impact and lower interest expense, partially offset by higher selling, general, and administrative expense related to corporate strategic initiatives.
LIQUIDITY AND CAPITAL RESOURCES
Our main source of liquidity is operating cash flows, supplemented by borrowings. Our principal liquidity requirements are for working capital, capital expenditures, principal and interest payments on debt, dividend payments, and acquisitions. At December 31, 2015, approximately 30% of our long-term debt is at fixed interest rates with repayment schedules through 2021. Including the multi-currency note purchase and private shelf agreement entered into by the Company in January 2016 referenced below, approximately 47% of our long-term debt is at fixed interest rates. The remainder of our long-term debt is at variable rates on an unsecured revolving credit facility that is due in 2020. Approximately 78% of our borrowings are denominated in US dollars, which limits our exposure to currency exchange rate fluctuations.
25
At December 31, 2015, we had cash and cash equivalents totaling $105.9 million, of which $101.1 million was held by our foreign subsidiaries. The $101.1 million of cash and cash equivalents are held by our foreign subsidiaries whose earnings are considered indefinitely reinvested at December 31, 2015. These funds could be subject to additional income taxes if repatriated. It is not practical to determine the potential income tax liability that we would incur if these funds were repatriated to the U.S. because the time and manner of repatriation is uncertain. We believe that domestic cash and cash equivalents, domestic cash flows from operations, annual repatriation of a portion of the current period's foreign earnings, and the availability of our domestic line of credit are sufficient to fund our domestic liquidity requirements. Cash and cash equivalents decreased $0.1 million during the year ended December 31, 2015, compared to an increase of $9.7 million during 2014 and an increase of $13.5 million during 2013.
Our unsecured senior revolving credit facility, which was further amended on December 11, 2015, provides for borrowings up to $575.0 million through 2020 and is subject to certain commitment fees. This credit facility has sub-limits for the issuance of letters of credit, swingline borrowings and foreign currency denominated borrowings; and may be used for general corporate purposes, including working capital, permitted acquisitions, capital expenditures and repayment of existing indebtedness. The credit agreement also allows the Company to request increases in the aggregate commitments of the lenders of up to an additional $150.0 million. Loans under the revolving facility will bear interest, at a variable rate based on LIBOR or the federal funds rate, at the Company's option. Our weighted average interest rate was 1.96% in 2015. At
December 31, 2015
, $244.9 million of the $575.0 million senior revolving credit facility was unused including letters of credit.
On January 22, 2016, the Company entered into a multi-currency note purchase and private shelf agreement, by amending and drawing upon its existing shelf facility previously amended in 2014. MSA has issued notes in an aggregate principal amount of £54.9 million (approximately $80.0 million). Proceeds from this facility were used to repay a portion of the existing revolver. The interest rate on these notes is fixed at 3.4%. Please refer to the Form 8-K filed on January 28, 2016 for additional details on the terms and conditions surrounding these notes.
Considering the above noted changes and our outstanding debt, the Company currently has access to approximately $669.9 million of capital at December 31, 2015. Refer to Note 11 Short and Long- Term Debt to the Consolidated Financial Statements in Part II Item 8 of this Form 10-K.
Operating activities.
Operating activities provided cash of $55.3 million in 2015, compared to providing cash of $107.0 million in 2014. Lower operating cash flow in 2015 is primarily related to lower profitability in 2015 and changes in working capital. Trade receivables were $232.9 million at December 31, 2015 compared to $211.4 million at December 31, 2014, reflecting a local currency increase of $35.7 million on strong G1 SCBA sales results in the 2015 fourth quarter, partially offset by a $14.2 million decrease due to currency translation effects. Inventories were $125.8 million at December 31, 2015, compared to $123.0 million at December 31, 2014. Local currency inventory increased $19.2 million primarily due to the acquisition of Latchways and continued demand planning for our G1 SCBA. Currency translation effects of $16.4 million decreased inventories. Accounts payable were $68.2 million at December 31, 2015 compared to $70.2 million at December 31, 2014. Local currency accounts payable increased $2.7 million, primarily in the North American segment, offset by currency translation effects of $4.7 million. The December 31, 2015 trade receivables and inventory balances included Latchways trade receivables and inventory of $11.8 million and $9.1 million, respectively.
At December 31, 2015, the cumulative trauma product liability reserve totaled $50.1 million, compared to $74.9 million at December 31, 2014. Amounts comprising most of the reserve will be paid equally over the first two quarters in 2016. Insurance receivables related to cumulative trauma product liability losses at December 31, 2015 totaled $229.5 million, compared to $220.5 million at December 31, 2014.
Operating activities provided cash of $107.0 million in 2014, compared to providing cash of $110.8 million in 2013. Lower operating cash flow in 2014 is primarily related to higher insurance receivables, lower pension, and lower currency exchange losses, offset by changes in working capital. Trade receivables were $211.4 million at December 31, 2014 compared to $200.4 million at December 31, 2013, reflecting a local currency increase of $23.5 million on strong sales results in the 2014 fourth quarter, partially offset by a $12.5 million decrease due to currency translation effects. Inventories were $123.0 million at December 31, 2014, compared to $136.8 million at December 31, 2013. Local currency inventory decreased $1.1 million on decreases in our European and International segments. Currency translation effects of $12.7 million decreased inventories. Accounts payable were $70.2 million at December 31, 2014 compared to $66.9 million at December 31, 2013. Local currency accounts payable increased $6.8 million, primarily in the European segment, offset by currency translation effects of $3.5 million. Insurance receivables related to cumulative trauma product liability losses were $220.5 million at December 31, 2014 compared to $124.8 million at December 31, 2013.
26
Investing activities.
Investing activities used cash of $208.5 million for the year ended December 31, 2015, compared to using $30.7 million in 2014. The increased use of cash for investing activities in 2015 was related to the acquisition of Latchways. Cash generated from property disposals was $8.0 million in 2015 compared to $3.4 million in 2014. The cash received from property disposals in 2015 include proceeds from the sale of property in Australia. Capital expenditures were $36.2 million compared to $33.6 million in 2014. We plan to invest approximately $35.0 million in capital expenditures in 2016.
Investing activities used cash of $30.7 million for the year ended December 31, 2014, compared to using $35.2 million in 2013. The decrease in cash used by investing activities in 2014 was due to lower capital expenditures and higher cash generated by property disposals. Cash generated from property disposals was $3.4 million in 2014 compared to $1.4 million in 2013. The cash received from property disposals in 2014 include proceeds from the sale of our detector tube assets. Capital expenditures were $33.6 million compared to $36.5 million in 2013. The $2.9 million decrease in expenditures was driven primarily from lower investment in manufacturing in the International segment.
Financing activities.
Financing activities provided cash of $165.0 million for the year ended December 31, 2015, compared to using cash of $58.1 million in 2014. The change was primarily related to borrowings made to finance the acquisition of Latchways in 2015. We plan to repay these borrowings using the cash flows generated by Latchways.
We made dividend payments of $47.4 million during 2015, compared to $45.6 million during 2014. Dividends paid on our common stock during 2015 (our 99
th
consecutive year of dividend payments) were $1.27 per share. Dividends paid on our common stock in 2014 and 2013 were $1.23 and $1.18 per share, respectively. Restricted cash balances were $2.4 million at December 31, 2015 compared to $2.7 million at December 31, 2014 and were primarily used to support letter of credit balances.
As announced on May 13, 2015, the MSA Board of Directors authorized the Company to repurchase up to $100.0 million in shares of MSA common stock. During the second quarter of 2015 we executed share repurchases of $7.1 million. The program seeks to offset equity dilution associated with employee stock compensation. The Board of Directors did not set a time limitation on the repurchase program.
Financing activities used cash of $58.1 million for the year ended December 31, 2014, compared to using cash of $58.2 million in 2013. During 2014, we paid down $15.7 million of long-term debt compared to paying down $11.7 million in 2013. We made dividend payments of $45.6 million during 2014, compared to $44.0 million during 2013.
CUMULATIVE TRANSLATION ADJUSTMENTS
The year-end position of the U.S. dollar relative to international currencies resulted in a translation loss of $47.7 million being credited to cumulative translation adjustments for the year ended December 31, 2015. This compares to a translation loss of $40.0 million in 2014 and a translation loss of $6.1 million in 2013. The translation loss in 2015 was primarily related to the weakening of the euro, British pound, Brazilian real, and South African rand. The translation loss in 2014 was primarily related to the weakening of the euro, Mexican peso, Argentine peso, and the South African rand. The translation loss in 2013 was primarily related to the weakening of the Australian dollar, Brazilian real and the Argentine peso.
COMMITMENTS AND CONTINGENCIES
We are obligated to make future payments under various contracts, including debt and lease agreements. Our significant cash obligations as of December 31, 2015, including the effects of the January 2016 multi-currency note purchase and private shelf agreement and subsequent repayment of a portion of our existing unsecured senior revolving credit facility, are as follows:
|
(In millions)
|
Total
|
2016
|
2017
|
2018
|
2019
|
2020
|
Thereafter
|
|||||||||||||||||||||
|
Long-term debt
|
$
|
466.6
|
|
$
|
6.7
|
|
$
|
26.7
|
|
$
|
26.7
|
|
$
|
26.7
|
|
$
|
273.1
|
|
$
|
106.7
|
|
|||||||
|
Operating leases
|
51.4
|
|
11.2
|
|
9.5
|
|
7.4
|
|
6.1
|
|
4.6
|
|
12.6
|
|
||||||||||||||
|
Totals
|
518.0
|
|
17.9
|
|
36.2
|
|
34.1
|
|
32.8
|
|
277.7
|
|
119.3
|
|
||||||||||||||
The significant obligations table does not include obligations to taxing authorities due to uncertainty surrounding the ultimate settlement of amounts and timing of these obligations.
27
We expect to meet our 2016, 2017, 2018, and 2019 debt service obligations through cash provided by operations. Approximately $246.6 million of debt payable in 2020 relates to our unsecured senior revolving credit facility. We expect to generate sufficient operating cash flow to make payments against this amount each year. To the extent that a balance remains when the facility matures in 2020, we expect to refinance the remaining balance through new borrowing facilities. Interest expense on fixed rate debt over the next five years is expected to be approximately $8.3 million in 2016, $8.5 million in 2017, $7.4 million in 2018, $6.2 million in 2019, and $5.1 million in 2020.
The Company had outstanding bank guarantees and standby letters of credit with banks as of December 31, 2015 totaling $7.9 million, of which $3.5 million relate to the senior revolving credit facility. These letters of credit serve to cover customer requirements in connection with certain sales orders and insurance companies. No amounts were drawn on these arrangements at December 31, 2015. The Company is also required to provide cash collateral in connection with certain arrangements. At December 31, 2015, the Company has $2.4 million of restricted cash in support of these arrangements.
We expect to make net contributions of $6.2 million to our pension plans in 2016 which are primarily associated with our European and International segments. We have not been required to make contributions to our U.S. based qualified defined benefit pension plan in many years.
We have purchase commitments for materials, supplies, services and property, plant and equipment as part of our ordinary conduct of business.
Please refer to Note 19 Contingencies to the Consolidated Financial Statements in Part II Item 8 of this Form 10-K for further discussion on the Company's product liabilities.
CRITICAL ACCOUNTING POLICIES AND ESTIMATES
We prepare our consolidated financial statements in accordance with U.S. generally accepted accounting principles (GAAP). The preparation of these financial statements requires us to make estimates and judgments that affect the reported amounts of assets, liabilities, revenues and expenses and the related disclosures. We evaluate these estimates and judgments on an on-going basis based on historical experience and various assumptions that we believe to be reasonable under the circumstances. However, different amounts could be reported if we had used different assumptions and in light of different facts and circumstances. Actual amounts could differ from the estimates and judgments reflected in our financial statements. A summary of the Company's significant accounting policies is included in Note 1 to the Consolidated Financial Statements in Part II, Item 8 of this Form 10-K.
We believe that the following are the more critical judgments and estimates used in the preparation of our financial statements.
Accounting for contingencies.
We accrue for contingencies when we believe that it is probable that a liability or loss has been incurred and the amount can be reasonably estimated. Contingencies relate to uncertainties that require our judgment both in assessing whether or not a liability or loss has been incurred and in estimating the amount of the probable loss. Significant contingencies affecting our consolidated financial statements include pending or threatened litigation, including product liability claims and product warranties.
Product liability.
We face an inherent business risk of exposure to product liability claims arising from the alleged failure of our products to prevent the types of personal injury or death against which they are designed to protect. The Company categorizes the product liability losses of its subsidiary MSA LLC into two main categories: single incident and cumulative trauma.
Single incident product liability claims involve discrete incidents that are typically known to us when they occur and involve observable injuries which provide an objective basis for quantifying damages. MSA LLC estimates its liability for single incident product liability claims based on expected settlement costs for reported claims and an estimate of costs for unreported claims (claims incurred but not reported or IBNR). The estimate for IBNR claims is based on experience, sales volumes, and other relevant information. The reserve for single incident product liability claims, which includes reported and IBNR claims, at December 31, 2015 and 2014 was $3.5 million in each year. Single incident product liability expense during the year ended December 31, 2015 was $0.9 million and was not significant for the year ended December 31, 2014. Single incident product liability exposures are evaluated on an ongoing basis and adjustments are made to the reserve as appropriate.
28
Cumulative trauma product liability claims involve exposures to harmful substances (
e.g.
, silica, asbestos and coal dust) that occurred many years ago and may have developed over long periods of time into diseases such as silicosis, asbestosis, or coal worker’s pneumoconiosis. MSA LLC is presently named as a defendant in 1,988 lawsuits, some of which involve multiple plaintiffs, in which plaintiffs allege to have contracted certain cumulative trauma diseases. These lawsuits mainly involve respiratory protection products allegedly manufactured and sold by MSA LLC or its predecessors.
During the 2014 fourth quarter and extending into January 2015, MSA LLC resolved a number of cumulative trauma cases, the vast majority of which were insured. The settlements were recorded in both the insurance and product liability line under current liabilities, and in the insurance receivable in the other non-current asset section of the consolidated balance sheet.
More than half of the open lawsuits at December 31, 2015 have had a de minimis level of activity over the last 5 years. It is possible that these cases could become active again at any point due to changes in circumstances.
Cumulative trauma product liability litigation has been difficult to predict. In our past experience, it has typically not been until very late in the legal process that we can reasonably determine whether it is probable that any particular case will ultimately result in a liability. This uncertainty is caused by many factors; Cumulative trauma litigation is inherently unpredictable. Complaints generally do not provide information sufficient to determine if a lawsuit will develop into an actively litigated case. Even when a case is actively litigated, it is often difficult to determine if the lawsuit will be dismissed or otherwise resolved until late in the lawsuit. Moreover, even if it is probable that such a lawsuit will result in a loss; it is often difficult to estimate the amount of actual loss that will be incurred. These actual loss amounts are highly variable and turn on a case-by-case analysis of the relevant facts, which are often not learned until late in the lawsuit. In addition, there are uncertainties concerning the impact of bankruptcies of other companies that are co-defendants in claims, uncertainties surrounding the litigation process from jurisdiction to jurisdiction and from case to case, and uncertainties regarding the impact of potential changes in legislative or judicial standards.
Consequently, MSA LLC historically has been unable to estimate its cumulative trauma product liability exposure.
In 2014, MSA LLC engaged an outside valuation consultant to assist in assessing its ability to estimate MSA LLC's cumulative trauma product liability exposure. This assessment was based on MSA LLC’s cumulative claims experience, including recent claims trends, and the development of enhanced claims data analytics. The analysis focused on claims made or resolved over the last several years as these claims are likely to best represent future claim characteristics. After review by the valuation consultant, outside legal counsel, and Management, it was determined that MSA LLC could not estimate its liability for reported or IBNR cumulative trauma product liability claims.
The cumulative trauma product liability reserve totaled $74.9 million at December 31, 2014, comprised of $35.1 million in other non-current liabilities and the remainder recorded in the insurance and product liability line in the other current liabilities section of the consolidated balance sheet. These amounts relate to settlements that were reached in 2014 and 2015 that will be paid out in 2015 and 2016.
In 2015, Management continued to work with the outside valuation consultant and outside legal counsel to develop a method to provide a reasonable estimate for certain reported claims by using appropriate assumptions based on our unique circumstances. As a result, we've established a reserve for these reported claims that we believe represents our best estimate of potential loss at December 31, 2015.
The change in ability to estimate was driven by the maturation of MSA LLC’s defense efforts and an additional year of claims experience. Management’s claims experience has now advanced to a level that enables us to develop a reserve of potential loss. As a result, for certain reported claims, we estimated a liability of $7.1 million as of December 31, 2015. This amount has been added to the product liability reserve and the insurance receivable. The product liability reserve totals $50.1 million, and is recorded in the insurance and product liability line within current liabilities in the consolidated balance sheet.
To arrive at the estimate for certain reported claims, it was necessary to employ significant assumptions. In light of these significant assumptions, and all of the uncertainties inherent in cumulative trauma product liability litigation noted above, there can be no assurance that future experience with reported claims will follow MSA LLC’s past experience. Thus, the reserve of $7.1 million as of December 31, 2015 should be viewed as simply an estimate of a possible outcome for those reported claims where our experience allows us to reasonably make an estimate. Actual liabilities could vary greatly and we will need to adjust the estimate from time to time based on relevant facts and circumstances. If actual experience is worse than projected, it is likely that the estimate would increase, and these increases could potentially be material over time.
The uncertainties noted above relating to our cumulative trauma product liability litigation are particularly acute in the case of IBNR claims, which by definition are potential claims that have not yet been filed. Management continues to be unable to reasonably estimate, and therefore has not recorded any liability for, MSA LLC’s cumulative trauma IBNR claims. This determination was made by Management after review with its valuation consultant and outside legal counsel.
29
Our aggregate cumulative trauma product liability losses and administrative and defense costs for the three years ended December 31, 2015, totaled approximately $156.1 million, substantially all of which was insured.
Because litigation is subject to inherent uncertainties, and unfavorable rulings or developments could occur, there can be no certainty that MSA LLC may not ultimately incur charges in excess of presently recorded liabilities. The estimate does not purport to reflect MSA LLC’s overall claims exposure for either reported claims or future claims as noted above.
Although it is impossible to predict the ultimate outcome of current open claims, based on current information, our experience in handling these matters, and our substantial insurance program, we do not believe that the resolution of these claims will have a material adverse effect on our future financial condition or liquidity.
Income taxes.
We recognize deferred tax assets and liabilities using enacted tax rates to record the tax effect of temporary differences between the book and tax basis of recorded assets and liabilities. We record valuation allowances to reduce deferred tax assets to the amounts that we estimate are probable to be realized. When assessing the need for valuation allowances, we consider projected future taxable income and prudent and feasible tax planning strategies. Should a change in circumstances lead to a change in our judgments about the realizability of deferred tax assets in future years, we adjust the related valuation allowances in the period that the change in circumstances occurs. We had valuation allowances of $5.2 million and $3.8 million at December 31, 2015 and 2014, respectively.
We record an estimated income tax liability based on our best judgment of the amounts likely to be paid in the various tax jurisdictions in which we operate. We record tax benefits related to uncertain tax positions taken or expected to be taken on a tax return when such benefits meet a more likely than not threshold. We recognize interest related to unrecognized tax benefits in interest expense and penalties in operating expenses. The tax liabilities ultimately paid are dependent on a number of factors, including the resolution of tax audits, and may differ from the amounts recorded. Tax liabilities are adjusted through income when it becomes probable that the actual liability differs from the amount recorded.
No deferred U.S. income taxes have been provided on undistributed earnings of non-U.S. subsidiaries, which amounted to $408.5 million as of
December 31, 2015
. These earnings are considered to be reinvested for an indefinite period of time. Because we currently do not have any plans to repatriate these funds, we cannot determine the impact of local taxes, withholding taxes and foreign tax credits associated with the future repatriation of such earnings and, therefore, cannot reasonably estimate the associated tax liability. In cases where we intend to repatriate a portion of the undistributed earnings of our foreign subsidiaries, we provide U.S. income taxes on such earnings.
Pensions and other post-retirement benefits.
We sponsor certain pension and other post-retirement benefit plans. Accounting for the net periodic benefit costs and credits for these plans requires us to estimate the cost of benefits to be provided well into the future and to attribute these costs over the expected work life of the employees participating in these plans. These estimates require our judgment about discount rates used to determine these obligations, expected returns on plan assets, rates of future compensation increases, rates of increase in future health care costs, participant withdrawal and mortality rates and participant retirement ages. Differences between our estimates and actual results may significantly affect the cost of our obligations under these plans and could cause net periodic benefit costs and credits to change materially from year-to-year. The discount rate assumptions used in determining projected benefit obligations are based on published long-term bond indices or a company-specific yield curve model. Please refer to Note 14 to the Consolidated Financial Statements in Part II Item 8 of this Form 10-K for further details on the funded status of our pension and post-retirement benefit plans.
Stock Compensation.
We sponsor both a Management and a Non-Employee Directors' Equity Incentive plan which provide for grants of stock options, restricted stock and other equity-based vehicles such as restricted stock units and performance stock units; all of which are recognized as compensation expense based on grant date fair value. Stock options are valued using the Black-Scholes option pricing model. Performance stock units that have a market condition are valued on the grant date using a Monte Carlo simulation valuation model. We believe these valuation models are appropriate for use based and are consistent with models used by our peer companies. Please refer to Note 10 to the Consolidated Financial Statements in Part II Item 8 of this Form 10-K for further details on the assumptions used in these valuation models.
Revenue Recognition.
Revenue from the sale of products is recognized when title, ownership and the risk of loss have transferred to the customer, which generally occurs either when product is shipped to the customer or, in the case of most U.S. distributor customers, when product is delivered to the customer’s delivery site. We establish our shipping terms according to local practice and market characteristics. We do not ship product unless we have an order or other documentation authorizing shipment to our customers. We make appropriate provisions for uncollectible accounts receivable and product returns, both of which have historically been insignificant in relation to our net sales. Certain distributor customers receive price rebates based on their level of purchases and other performance criteria that are documented in established distributor programs. These rebates are accrued as a reduction of net sales as they are earned by the customer.
30
Goodwill.
Historically, in the third quarter of each year, or more frequently if indicators of impairment exist or if a decision is made to sell a business, we evaluate goodwill for impairment. The company changed its annual impairment assessment date to October 1 as discussed below. A significant amount of judgment is involved in determining if an indicator of impairment has occurred. Such indicators may include a decline in expected cash flows, a significant adverse change in the business climate, unanticipated competition, slower growth rates, or negative developments in equity and credit markets, among others.
All goodwill is assigned to and evaluated for impairment at the reporting unit level, which is defined as an operating segment or one level below an operating segment. For goodwill impairment testing purposes, we consider our operating segments to be our reporting units. We test goodwill for impairment by either performing a qualitative evaluation or a two-step quantitative test. The qualitative evaluation is an assessment of factors to determine whether it is more likely than not that the fair value of a reporting unit is less than its carrying value, including goodwill. Factors considered as part of the qualitative assessment include entity-specific industry, market and general economic conditions. In 2015 we elected to bypass the qualitative evaluation for all of our reporting units and performed a two-step quantitative test at September 30, 2015. Quantitative testing involves comparing the estimated fair value of each reporting unit to its carrying value. We estimate reporting unit fair value using a weighted average of fair values determined by discounted cash flow (DCF) and market approach methodologies, as we believe both are equally important indicators of fair value. A number of significant assumptions and estimates are involved in the application of the DCF model, including sales volumes and prices, costs to produce, tax rates, capital spending, discount rates, and working capital changes. Cash flow forecasts are generally based on approved business unit operating plans for the early years and historical relationships in later years. The betas used in calculating the individual reporting units’ weighted average cost of capital (WACC) rate are estimated for each reporting unit based on peer data. The market approach methodology measures value through an analysis of peer companies. The analysis entails measuring the multiples of EBITDA at which peer companies are trading.
In the event the estimated fair value of a reporting unit per the weighted average of the DCF and market approach models is less than the carrying value, additional analysis would be required. The additional analysis would compare the carrying amount of the reporting unit’s goodwill with the implied fair value of that goodwill, which may involve the use of valuation experts. The implied fair value of goodwill is the excess of the fair value of the reporting unit over the fair value amounts assigned to all of the assets and liabilities of that unit as if the reporting unit had been acquired in a business combination and the fair value of the reporting unit represented the purchase price. If the carrying value of goodwill exceeds its implied fair value, an impairment loss equal to such excess would be recognized, which could significantly and adversely impact reported results of operations and shareholders’ equity. At September 30, 2015, based on our quantitative test, the fair values of all of our reporting units exceeded their carrying value by at least 51%.
During the quarter ended December 31, 2015, the Company voluntarily changed the date of its annual goodwill impairment testing from the last day of the third quarter to the first day of the fourth quarter. This voluntary change is preferable under the circumstances as it provides the Company with additional time to complete its annual goodwill impairment testing in advance of its year-end reporting and results in better alignment with the timing of the Company's long range planning and forecasting process. The voluntary change in accounting principle related to the annual testing date will not delay, accelerate or avoid an impairment charge. The change will be applied prospectively.
Foreign currency.
As part of our currency exchange rate risk management strategy, we enter into certain derivative foreign currency forward contracts that do not meet the U.S. GAAP criteria for hedge accounting, but which have the impact of partially offsetting certain foreign currency exposures. We account for these forward contracts on a full mark-to-market basis and report the related gains or losses in currency exchange losses (gains) in the consolidated statement of income. Please refer to Note 17 to the Consolidated Financial Statements in Part II Item 8 of this Form 10-K for further details on our current positions.
RECENTLY ADOPTED AND RECENTLY ISSUED ACCOUNTING STANDARDS
In April 2014, the FASB issued ASU 2014-08,
Reporting Discontinued Operations and Disclosures of Disposals of an Entity
. This ASU amends the definition of a discontinued operation to include a disposal of a component or group of components that is disposed of or is classified as held for sale and represents a strategic shift that has (or will have) a major effect on an entity's operations and financial results. This ASU was adopted on January 1, 2015. The adoption of this ASU may have a material effect on our consolidated financial statements in the event that we were to divest of a component that meets the definition of discontinued operations.
31
In May 2014, the FASB issued ASU 2014-09,
Revenue with Contracts from Customers
. This ASU clarifies the principles for recognizing revenue such that an entity should recognize revenue to depict the transfer of promised goods or services to customers in an amount that reflects the consideration to which the entity expects to be entitled in exchange for those goods or services. In August 2015, the FASB issued ASU 2015-15,
Revenue with Contracts from Customers
. This ASU defers the effective date of the standard until January 1, 2018. The Company is currently evaluating the impact that the adoption of these ASUs will have on the consolidated financial statements.
In June 2014, the FASB issued ASU 2014-12,
Accounting for Share-Based Payments When the Terms of an Award Provide That a Performance Target Could be Achieved after the Requisite Service Period
. This ASU clarifies the accounting treatment for share based payment awards that contain performance targets. This ASU will be effective beginning in 2016. The adoption of this ASU is not expected to have a material effect on our consolidated financial statements.
In August 2014, the FASB issued ASU 2014-15,
Presentation of Financial Statements - Going Concern
. This ASU clarifies management's responsibility to evaluate whether there is a substantial doubt about the entity's ability to continue as a going concern and provides guidance for related footnote disclosures. This ASU will be effective beginning in 2016. The adoption of this ASU is not expected to have a material effect on our consolidated financial statements.
In January 2015, the FASB issued ASU 2015-01,
Income Statement - Extraordinary and Unusual Items
. This ASU eliminates the requirement to separately present and disclose extraordinary and unusual items in the financial statements. This ASU will be effective beginning in 2016. The adoption of this ASU is not expected to have a material effect on our consolidated financial statements.
In February 2015, the FASB issued ASU 2015-02,
Amendments to the Consolidation Analysis
. This ASU changes the analysis that an entity must perform to determine whether it should consolidate certain types of legal entities. This ASU will be effective beginning in 2016. The adoption of this ASU is not expected to have a material effect on our consolidated financial statements.
In April 2015, the FASB issued ASU 2015-03,
Imputation of Interest - Simplifying the Presentation of Debt Issuance Costs
. This ASU simplifies the presentation of debt issuance costs and requires that debt issuance costs related to a recognized debt liability be presented in the balance sheet as a direct deduction from the carrying amount of that debt liability. In August 2015, the FASB issued ASU 2015-15, I
mputation of Interest - Simplifying the Presentation of Debt Issuance Costs
. This ASU simplifies the presentation of debt issuance costs for line of credit arrangements. Both ASUs will be effective beginning in 2016. The adoption of these ASU is not expected to have a material effect on our consolidated financial statements.
In April 2015, the FASB issued ASU 2015-04,
Retirement Benefits - Practical Expedient for the Measurement Date of an Employer's Defined Benefit Obligation and Plan Assets.
This ASU allows entities with a fiscal year end that does not coincide with a month end to use the closest month end for measurement purposes. This ASU also allows entities that have a significant event in an interim period that calls for a remeasurement of defined benefit plan assets and obligations to use the month end date that is closest to the date of the significant event. This ASU will be effective beginning in 2016. The adoption of this ASU is not expected to have a material effect on our consolidated financial statements.
In April 2015, the FASB issued ASU 2015-05, Goodwill and Other Internal Use Software
- Customer's Accounting for Fees Paid in a Cloud Computing Arrangement
. This ASU clarifies when entities should account for fees paid in a cloud computing arrangement as a software license or service contract. This ASU will be effective beginning in 2016. The adoption of this ASU is not expected to have a material effect on our consolidated financial statements.
In July 2015, the FASB issued ASU 2015-11,
Simplifying the Measurement of Inventory.
This ASU requires inventory to be measured at the lower of cost and net realizable value. This ASU applies to inventory measured using the first-in, first-out (FIFO) or average cost methods only. This ASU will be effective beginning in 2017. The adoption of this ASU is not expected to have a material effect on our consolidated financial statements.
In July 2015, the FASB issued ASU 2015-12,
Plan Accounting: Defined Benefit Pension Plans (Topic 960), Defined Contribution Pension Plans (Topic 962), Health and Welfare Benefit Plans (Topic 965)
. This ASU simplifies complexities within employee benefit plan accounting including Fully Benefit-Responsive Investment Contracts, Plan Investment Disclosures, and the Measurement Date Practical Expedient. This ASU will be effective beginning in 2016. The adoption of this ASU is not expected to have a material effect on our consolidated financial statements.
32
In September 2015, the FASB issued ASU 2015-16,
Simplifying the Accounting for Measurement-Period Adjustments
. This ASU simplifies the accounting for adjustments made to provisional amounts recognized in a business combination. The amendments in this Update eliminate the requirement to retrospectively account for those adjustments. This ASU will be effective beginning in 2016. MSA elected to early adopt this standard for the period ended December 31, 2015. The adoption of this ASU could have a material effect on our consolidated financial statements to the extent that measurement-period adjustments for business combinations are identified.
In November 2015, the FASB issued ASU 2015-17,
Balance Sheet Classification of Deferred Taxes
. This ASU simplifies the presentation of deferred income taxes. The amendments in this Update require that deferred tax liabilities and assets be classified as noncurrent in a classified statement of financial position. This ASU is effective for financial statements issued for annual periods beginning after December 15, 2016, and interim periods within those annual periods. Early adoption is permitted. MSA elected to early adopt this standard for the period ended December 31, 2015. We elected to apply the amendments in this update retrospectively. As such, we have reclassified $23.8 million and $7.0 thousand previously reported in the 2014 Form 10-K as current deferred tax assets and other current liabilities on the Consolidated Balance Sheet, respectively, to non-current deferred tax assets and non-current deferred tax liabilities on the Consolidated Balance Sheet as of December 31, 2014.
In February 2016, the FASB issued ASU 2016-02,
Leases
. This ASU requires lessees to record a right of use asset and a liability for virtually all leases. This ASU will be effective beginning in 2019. While the adoption of this ASU is expected to have a material effect on our consolidated balance sheet, the Company continues to evaluate the impact that the adoption of this ASU will have on the consolidated financial statements.
Market risk represents the risk of adverse changes in the value of a financial instrument caused by changes in currency exchange rates, interest rates and equity prices. We are exposed to market risks related to currency exchange rates and interest rates.
Currency exchange rates.
We are subject to the effects of fluctuations in currency exchange rates on various transactions and on the translation of the reported financial position and operating results of our non-U.S. companies from local currencies to U.S. dollars. A hypothetical 10% strengthening or weakening of the U.S. dollar would increase or decrease our reported sales and net income for the year ended December 31, 2015 by approximately $51.0 million and $0.9 million, or 4.5% and 1.2%, respectively.
When appropriate, we may attempt to limit our transactional exposure to changes in currency exchange rates through forward contracts or other actions intended to reduce existing exposures by creating offsetting currency exposures. At December 31, 2015, we had open foreign currency forward contracts with a U.S. dollar notional value of $58.6 million. A hypothetical 10% increase in December 31, 2015 forward exchange rates would result in a $5.9 million increase in the fair value of these contracts.
Interest rates.
We are exposed to changes in interest rates primarily as a result of borrowing and investing activities used to maintain liquidity and fund business operations. Because of the relatively short maturities of temporary investments and the variable rate nature of our revolving credit facility, these financial instruments are reported at carrying values which approximate fair values.
At December 31, 2015, we had $140.0 million of fixed rate debt which matures at various dates through 2021. The incremental increase in the fair value of fixed rate long-term debt resulting from a hypothetical 10% decrease in interest rates would be approximately $2.0 million. However, our sensitivity to interest rate declines and the corresponding increase in the fair value of our debt portfolio would unfavorably affect earnings and cash flows only to the extent that we elected to repurchase or retire all or a portion of our fixed rate debt portfolio at prices above carrying values.
At December 31, 2015, we had $326.6 million of variable rate borrowings under our revolving credit facility. A 100 basis point increase or decrease in interest rates could impact on future earnings under our current capital structure. As described in Note 11 Short-Term and Long-Term Debt in Part II Item 8 of this Form 10-K, we issued $80.0 million in fixed rate notes in January 2016. The proceeds from this debt were used to pay down a portion of the variable rate revolving credit facility in January 2016, reducing our exposure to variability in interest rates.
Actuarial assumptions
.
The most significant actuarial assumptions affecting our net periodic pension credit and pension obligations are discount rates, expected returns on plan assets and plan asset valuations. Discount rates and plan asset valuations are point-in-time measures. Expected returns on plan assets are based on our historical returns by asset class.
33
The following table summarizes the impact of changes in significant actuarial assumptions on our December 31, 2015 actuarial valuations.
|
Impact of Changes in Actuarial Assumptions
|
|||||||||||||||||||||||
|
Change in Discount
Rate
|
Change in Expected
Return
|
Change in Market Value of Assets
|
|||||||||||||||||||||
|
(In thousands)
|
1%
|
(1)%
|
1%
|
(1)%
|
5%
|
(5)%
|
|||||||||||||||||
|
(Decrease) increase in net benefit cost
|
$
|
(6,771
|
)
|
$
|
8,209
|
|
$
|
(4,230
|
)
|
$
|
4,230
|
|
$
|
(975
|
)
|
$
|
938
|
|
|||||
|
(Decrease) increase in projected benefit obligation
|
(63,738
|
)
|
78,520
|
|
—
|
|
—
|
|
—
|
|
—
|
|
|||||||||||
|
Increase (decrease) in funded status
|
63,738
|
|
(78,520
|
)
|
—
|
|
—
|
|
20,954
|
|
(20,954
|
)
|
|||||||||||
34
Management’s Reports to Shareholders
Management’s Report on Responsibility for Financial Reporting
Management of MSA Safety Incorporated (the Company) is responsible for the preparation of the financial statements included in this annual report. The financial statements were prepared in accordance with accounting principles generally accepted in the United States of America and include amounts that are based on the best estimates and judgments of management. The other financial information contained in this annual report is consistent with the financial statements.
Management’s Report on Internal Control Over Financial Reporting
Management is responsible for establishing and maintaining adequate internal control over financial reporting. The Company’s internal control over financial reporting is a process designed to provide reasonable assurance regarding the reliability of financial reporting and the preparation of financial statements for external purposes in accordance with generally accepted accounting principles.
The Company’s internal control over financial reporting includes policies and procedures that (1) pertain to the maintenance of records that, in reasonable detail, accurately and fairly reflect transactions and dispositions of assets; (2) provide reasonable assurance that transactions are recorded as necessary to permit preparation of financial statements in accordance with generally accepted accounting principles, and that receipts and expenditures are being made only in accordance with authorizations of management and the directors of the Company; and (3) provide reasonable assurance regarding prevention or timely detection of unauthorized acquisition, use or disposition of the Company’s assets that could have a material effect on our financial statements.
Because of its inherent limitations, internal control over financial reporting may not prevent or detect misstatements. Also, projections of any evaluation of effectiveness to future periods are subject to the risk that controls may become inadequate because of changes in conditions, or that the degree of compliance with the policies or procedures may deteriorate.
Management assessed the effectiveness of the Company’s internal control over financial reporting as of December 31, 2015. In making this assessment, management used the criteria set forth by the Committee of Sponsoring Organizations of the Treadway Commission (COSO) in Internal Control-Integrated Framework (2013). Based on our assessment and those criteria, management has concluded that the Company maintained effective internal control over financial reporting as of December 31, 2015.
Management has excluded Latchways from its assessment of internal controls over financial reporting as of December 31, 2015 because the Company acquired Latchways effective October 21, 2015 (Acquisition Date), whose total assets represents 14%, and net income represents less than 1%, and whose customer revenues represents less than 1% of the related consolidated financial statement amounts as of December 31, 2015 and from the period from the acquisition date through December 31, 2015.
The Company's independent registered public accounting firm that audited the consolidated financial statements included in this annual report issued an attestation report on the Company's internal control over financial reporting.
|
/s/ WILLIAM M. LAMBERT
|
|
William M. Lambert
Chief Executive Officer
|
|
/s/ KENNETH D. KRAUSE
|
|
Kenneth D. Krause
Vice President of Finance and Chief Financial Officer
|
February 29, 2016
35
Report of Independent Registered Public Accounting Firm
The Board of Directors and Shareholders of MSA Safety Incorporated:
We have audited the accompanying consolidated balance sheet of MSA Safety Incorporated as of December 31, 2015, and the related consolidated statements of income, comprehensive income, cash flows, and changes in retained earnings and accumulated other comprehensive loss for the year ended December 31, 2015. Our audit also included the financial statement schedule listed in the Index at Item 15(a). These financial statements and schedule are the responsibility of the Company's management. Our responsibility is to express an opinion on these financial statements and schedule based on our audit.
We conducted our audit in accordance with the standards of the Public Company Accounting Oversight Board (United States). Those standards require that we plan and perform the audit to obtain reasonable assurance about whether the financial statements are free of material misstatement. An audit includes examining, on a test basis, evidence supporting the amounts and disclosures in the financial statements. An audit also includes assessing the accounting principles used and significant estimates made by management, as well as evaluating the overall financial statement presentation. We believe that our audit provides a reasonable basis for our opinion.
In our opinion, the financial statements referred to above present fairly, in all material respects, the consolidated financial position of MSA Safety Incorporated at December 31, 2015, and the consolidated results of its operations and its cash flows for the year ended December 31, 2015, in conformity with U.S. generally accepted accounting principles. Also, in our opinion, the related financial statement schedule, when considered in relation to the basic financial statements taken as a whole, presents fairly in all material respects the information set forth therein.
We also have audited, in accordance with the standards of the Public Company Accounting Oversight Board (United States), MSA Safety Incorporated’s internal control over financial reporting as of December 31, 2015, based on criteria established in Internal Control-Integrated Framework issued by the Committee of Sponsoring Organizations of the Treadway Commission (2013 framework), and our report dated February 29, 2016 expressed an unqualified opinion thereon.
/s/ Ernst & Young LLP
Pittsburgh, Pennsylvania
February 29, 2016
36
Report of Independent Registered Public Accounting Firm
The Board of Directors and Shareholders of MSA Safety Incorporated:
We have audited MSA Safety Incorporated’s internal control over financial reporting as of December 31, 2015, based on criteria established in Internal Control-Integrated Framework issued by the Committee of Sponsoring Organizations of the Treadway Commission (2013 Framework) (the COSO criteria). MSA Safety Incorporated’s management is responsible for maintaining effective internal control over financial reporting, and for its assessment of the effectiveness of internal control over financial reporting included in the accompanying Management’s Report on Internal Control Over Financial Reporting. Our responsibility is to express an opinion on the Company’s internal control over financial reporting based on our audit.
We conducted our audit in accordance with the standards of the Public Company Accounting Oversight Board (United States). Those standards require that we plan and perform the audit to obtain reasonable assurance about whether effective internal control over financial reporting was maintained in all material respects. Our audit included obtaining an understanding of internal control over financial reporting, assessing the risk that a material weakness exists, testing and evaluating the design and operating effectiveness of internal control based on the assessed risk, and performing such other procedures as we considered necessary in the circumstances. We believe that our audit provides a reasonable basis for our opinion.
A company’s internal control over financial reporting is a process designed to provide reasonable assurance regarding the reliability of financial reporting and the preparation of financial statements for external purposes in accordance with generally accepted accounting principles. A company’s internal control over financial reporting includes those policies and procedures that (1) pertain to the maintenance of records that, in reasonable detail, accurately and fairly reflect the transactions and dispositions of the assets of the company; (2) provide reasonable assurance that transactions are recorded as necessary to permit preparation of financial statements in accordance with generally accepted accounting principles, and that receipts and expenditures of the company are being made only in accordance with authorizations of management and directors of the company; and (3) provide reasonable assurance regarding prevention or timely detection of unauthorized acquisition, use, or disposition of the company’s assets that could have a material effect on the financial statements.
Because of its inherent limitations, internal control over financial reporting may not prevent or detect misstatements. Also, projections of any evaluation of effectiveness to future periods are subject to the risk that controls may become inadequate because of changes in conditions, or that the degree of compliance with the policies or procedures may deteriorate.
As indicated in the accompanying Management’s Report on Internal Control Over Financial Reporting, management’s assessment of and conclusion on the effectiveness of internal control over financial reporting did not include the internal controls of Latchways plc, which is included in the 2015 consolidated financial statements of MSA Safety Incorporated and constituted 14% and 34% of total and net assets, respectively, as of December 31, 2015, and less than 1% of revenues and net income, respectively, for the period from October 21, 2015 (acquisition date) through December 31, 2015. Our audit of internal control over financial reporting of MSA Safety Incorporated also did not include an evaluation of the internal control over financial reporting of Latchways, plc.
In our opinion, MSA Safety Incorporated maintained, in all material respects, effective internal control over financial reporting as of December 31, 2015, based on the COSO criteria.
We also have audited, in accordance with the standards of the Public Company Accounting Oversight Board (United States), the consolidated balance sheet of MSA Safety Incorporated as of December 31, 2015, and the related consolidated statements of income, comprehensive income, cash flows, and changes in retained earnings and accumulated other comprehensive loss for the year ended December 31, 2015 of MSA Safety Incorporated and our report dated February 29, 2016, expressed an unqualified opinion thereon.
/s/ Ernst & Young LLP
Pittsburgh, Pennsylvania
February 29, 2016
37
2014 Report of Independent Registered Public Accounting Firm
To the Shareholders and Board of Directors of MSA Safety Incorporated:
In our opinion, the consolidated balance sheet as of December 31, 2014 and the related consolidated statements of income, comprehensive income, cash flows, and changes in retained earnings and accumulated other comprehensive loss for each of two years in the period ended December 31, 2014 present fairly, in all material respects, the financial position of MSA Safety Incorporated and its subsidiaries at December 31, 2014, and the results of their operations and their
cash flows for each of the two years in the period ended December 31, 2014, in conformity with accounting principles generally accepted in the United States of America. In addition, in our opinion, the financial statement schedule for each of the two years in the period ended December 31, 2014 presents fairly, in all material respects, the information set forth therein when read in conjunction with the related consolidated financial statements. These financial statements and financial statement schedule are the responsibility of the Company's management. Our responsibility is to express an opinion on these financial statements and financial statement schedule based on our audits. We conducted our audits of these statements in accordance with the standards of the Public Company Accounting Oversight Board (United States). Those standards require that we plan and perform the audit to obtain reasonable assurance about whether the financial statements are free of material misstatement. An audit includes examining, on a test basis, evidence supporting the amounts and disclosures in the financial statements, assessing the accounting principles used and significant estimates made by management, and evaluating the overall financial statement presentation. We believe that our audits provide a reasonable basis for our opinion.
/s/ PricewaterhouseCoopers LLP
Pittsburgh, Pennsylvania
February 25, 2015, except for the effects of the change in presentation of deferred taxes, discussed in Note 1 and the effects of the change in the composition of reportable segments discussed in Note 7, as to which the date is February 29, 2016.
38
MSA SAFETY INCORPORATED
|
Year ended December 31,
|
|||||||||||
|
(In thousands, except per share amounts)
|
2015
|
2014
|
2013
|
||||||||
|
Net sales
|
$
|
1,130,783
|
|
$
|
1,133,885
|
|
$
|
1,112,058
|
|
||
|
Other (loss) income, net (Note 15)
|
(861
|
)
|
2,765
|
|
(175
|
)
|
|||||
|
1,129,922
|
|
1,136,650
|
|
1,111,883
|
|
||||||
|
Costs and expenses
|
|
|
|
||||||||
|
Cost of products sold
|
629,680
|
|
618,536
|
|
615,213
|
|
|||||
|
Selling, general and administrative
|
315,270
|
|
322,797
|
|
309,206
|
|
|||||
|
Research and development
|
48,630
|
|
48,247
|
|
45,858
|
|
|||||
|
Restructuring and other charges (Note 2)
|
12,258
|
|
8,515
|
|
5,344
|
|
|||||
|
Interest expense
|
10,854
|
|
9,851
|
|
10,677
|
|
|||||
|
Currency exchange losses, net
|
2,204
|
|
1,509
|
|
5,452
|
|
|||||
|
1,018,896
|
|
1,009,455
|
|
991,750
|
|
||||||
|
Income from continuing operations before income taxes
|
111,026
|
|
127,195
|
|
120,133
|
|
|||||
|
Provision for income taxes (Note 9)
|
44,407
|
|
41,044
|
|
35,145
|
|
|||||
|
Income from continuing operations
|
66,619
|
|
86,151
|
|
84,988
|
|
|||||
|
Income from discontinued operations (Note 20)
|
1,325
|
|
1,776
|
|
3,061
|
|
|||||
|
Net income
|
67,944
|
|
87,927
|
|
88,049
|
|
|||||
|
Net loss attributable to noncontrolling interests
|
2,863
|
|
579
|
|
198
|
|
|||||
|
Net income attributable to MSA Safety Incorporated
|
$
|
70,807
|
|
$
|
88,506
|
|
$
|
88,247
|
|
||
|
Amounts attributable to MSA Safety Incorporated common shareholders:
|
|||||||||||
|
Income from continuing operations
|
$
|
69,590
|
|
$
|
87,447
|
|
$
|
85,858
|
|
||
|
Income from discontinued operations (Note 20)
|
1,217
|
|
1,059
|
|
2,389
|
|
|||||
|
Net income
|
$
|
70,807
|
|
$
|
88,506
|
|
$
|
88,247
|
|
||
|
Earnings per share attributable to MSA Safety Incorporated common shareholders (Note 8)
|
|||||||||||
|
Basic
|
|||||||||||
|
Income from continuing operations
|
$
|
1.86
|
|
$
|
2.34
|
|
$
|
2.31
|
|
||
|
Income from discontinued operations (Note 20)
|
$
|
0.03
|
|
$
|
0.03
|
|
$
|
0.06
|
|
||
|
Net income
|
$
|
1.89
|
|
$
|
2.37
|
|
$
|
2.37
|
|
||
|
Diluted
|
|||||||||||
|
Income from continuing operations
|
$
|
1.84
|
|
$
|
2.30
|
|
$
|
2.28
|
|
||
|
Income from discontinued operations (Note 20)
|
$
|
0.03
|
|
$
|
0.03
|
|
$
|
0.06
|
|
||
|
Net income
|
$
|
1.87
|
|
$
|
2.33
|
|
$
|
2.34
|
|
||
The accompanying notes are an integral part of the consolidated financial statements.
39
MSA SAFETY INCORPORATED
CONSOLIDATED STATEMENT OF COMPREHENSIVE INCOME
|
Year ended December 31,
|
|||||||||||
|
(In thousands)
|
2015
|
2014
|
2013
|
||||||||
|
Net income
|
$
|
67,944
|
|
$
|
87,927
|
|
$
|
88,049
|
|
||
|
Foreign currency translation adjustments (Note 5)
|
(49,067
|
)
|
(40,568
|
)
|
(7,281
|
)
|
|||||
|
Pension and post-retirement plan actuarial gains (losses), net of tax (Note 14)
|
6,181
|
|
(48,490
|
)
|
54,951
|
|
|||||
|
Comprehensive net income (loss)
|
25,058
|
|
(1,131
|
)
|
135,719
|
|
|||||
|
Comprehensive net loss attributable to noncontrolling interests
|
4,280
|
|
1,176
|
|
1,331
|
|
|||||
|
Comprehensive net income attributable to MSA Safety Incorporated
|
$
|
29,338
|
|
$
|
45
|
|
$
|
137,050
|
|
||
The accompanying notes are an integral part of the consolidated financial statements.
40
MSA SAFETY INCORPORATED
|
December 31,
|
|||||||
|
(In thousands, except share amounts)
|
2015
|
2014
|
|||||
|
Assets
|
|||||||
|
Cash and cash equivalents
|
$
|
105,925
|
|
$
|
105,998
|
|
|
|
Trade receivables, less allowance for doubtful accounts of $8,189 and $7,821
|
232,862
|
|
211,440
|
|
|||
|
Inventories (Note 3)
|
125,849
|
|
122,954
|
|
|||
|
Income taxes receivable
|
8,745
|
|
2,876
|
|
|||
|
Prepaid expenses and other current assets (Note 17)
|
31,646
|
|
30,771
|
|
|||
|
Total current assets
|
505,027
|
|
474,039
|
|
|||
|
Property, plant, and equipment, net (Note 4)
|
155,839
|
|
151,352
|
|
|||
|
Prepaid pension cost (Note 14)
|
62,072
|
|
75,017
|
|
|||
|
Deferred tax assets (Note 9)
|
26,455
|
|
44,057
|
|
|||
|
Goodwill (Note 12)
|
340,338
|
|
252,520
|
|
|||
|
Intangible assets, net (Note 12)
|
90,068
|
|
31,323
|
|
|||
|
Other noncurrent assets
|
245,019
|
|
236,484
|
|
|||
|
Total assets
|
$
|
1,424,818
|
|
$
|
1,264,792
|
|
|
|
Liabilities
|
|||||||
|
Notes payable and current portion of long-term debt (Note 11)
|
$
|
6,668
|
|
$
|
6,700
|
|
|
|
Accounts payable
|
68,206
|
|
70,210
|
|
|||
|
Employees’ compensation
|
37,642
|
|
40,249
|
|
|||
|
Insurance and product liability (Note 19)
|
57,718
|
|
47,456
|
|
|||
|
Taxes on income (Note 9)
|
11,658
|
|
5,545
|
|
|||
|
Other current liabilities
|
70,013
|
|
63,890
|
|
|||
|
Total current liabilities
|
251,905
|
|
234,050
|
|
|||
|
Long-term debt (Note 11)
|
459,959
|
|
245,000
|
|
|||
|
Pensions and other employee benefits (Note 14)
|
156,160
|
|
174,598
|
|
|||
|
Deferred tax liabilities (Note 9)
|
24,872
|
|
26,313
|
|
|||
|
Other noncurrent liabilities (Note 19)
|
14,794
|
|
46,198
|
|
|||
|
Total liabilities
|
$
|
907,690
|
|
$
|
726,159
|
|
|
|
Commitments and contingencies (Note 19)
|
|
|
|||||
|
Shareholders' Equity
|
|||||||
|
Preferred stock, 4
1
/
2
% cumulative, $50 par value (Note 6)
|
3,569
|
|
3,569
|
|
|||
|
Common stock, no par value (180,000,000 shares authorized; 62,081,391 shares issued; 2015 shares outstanding 37,372,474 and 37,448,310 shares outstanding 2014)
|
157,643
|
|
148,401
|
|
|||
|
Treasury shares, at cost (Note 6)
|
(295,070
|
)
|
(286,557
|
)
|
|||
|
Accumulated other comprehensive loss
|
(208,199
|
)
|
(166,730
|
)
|
|||
|
Retained earnings
|
858,553
|
|
835,126
|
|
|||
|
Total shareholders’ equity
|
516,496
|
|
533,809
|
|
|||
|
Noncontrolling interests
|
632
|
|
4,824
|
|
|||
|
Total shareholders’ equity
|
517,128
|
|
538,633
|
|
|||
|
Total liabilities and shareholders’ equity
|
$
|
1,424,818
|
|
$
|
1,264,792
|
|
|
The accompanying notes are an integral part of the consolidated financial statements.
41
MSA SAFETY INCORPORATED
|
Year ended December 31,
|
|||||||||||
|
(In thousands)
|
2015
|
2014
|
2013
|
||||||||
|
Operating Activities
|
|||||||||||
|
Net income
|
$
|
67,944
|
|
$
|
87,927
|
|
$
|
88,049
|
|
||
|
Depreciation and amortization
|
31,684
|
|
29,921
|
|
30,764
|
|
|||||
|
Pension expense (Note 14)
|
11,955
|
|
4,836
|
|
12,268
|
|
|||||
|
Net gain from investing activities—asset disposals (Note 15)
|
(1,745
|
)
|
(2,094
|
)
|
(436
|
)
|
|||||
|
Stock-based compensation (Note 10)
|
7,599
|
|
9,053
|
|
10,337
|
|
|||||
|
Asset Impairment Charges (Note 15)
|
4,946
|
|
—
|
|
—
|
|
|||||
|
Deferred income tax provision (Note 9)
|
(1,699
|
)
|
(5,388
|
)
|
(3,234
|
)
|
|||||
|
Other noncurrent assets and liabilities
|
(45,859
|
)
|
(53,482
|
)
|
(18,162
|
)
|
|||||
|
Currency exchange losses, net
|
2,471
|
|
1,393
|
|
5,127
|
|
|||||
|
Excess tax benefit related to stock plans (Note 6)
|
(596
|
)
|
(2,573
|
)
|
(2,246
|
)
|
|||||
|
Other, net
|
(2,786
|
)
|
(5,168
|
)
|
4,386
|
|
|||||
|
Operating cash flow before changes in certain working capital items
|
73,914
|
|
64,425
|
|
126,853
|
|
|||||
|
(Increase) in trade receivables
|
(21,959
|
)
|
(23,480
|
)
|
(13,171
|
)
|
|||||
|
(Increase) in inventories (Note 3)
|
(9,403
|
)
|
(600
|
)
|
(6,296
|
)
|
|||||
|
Increase in accounts payable and accrued liabilities
|
20,286
|
|
56,988
|
|
10,732
|
|
|||||
|
(Increase) decrease in income taxes receivable, prepaid expenses and other current assets
|
(7,584
|
)
|
9,698
|
|
(7,337
|
)
|
|||||
|
Changes in certain working capital items
|
(18,660
|
)
|
42,606
|
|
(16,072
|
)
|
|||||
|
Cash Flow From Operating Activities
|
55,254
|
|
107,031
|
|
110,781
|
|
|||||
|
Investing Activities
|
|||||||||||
|
Capital expenditures
|
(36,241
|
)
|
(33,583
|
)
|
(36,517
|
)
|
|||||
|
Property disposals
|
8,022
|
|
3,385
|
|
1,360
|
|
|||||
|
Acquistion of business, net of cash acquired (Note 13)
|
(180,271
|
)
|
—
|
|
—
|
|
|||||
|
Other investing
|
—
|
|
(500
|
)
|
—
|
|
|||||
|
Cash Flow From Investing Activities
|
(208,490
|
)
|
(30,698
|
)
|
(35,157
|
)
|
|||||
|
Financing Activities
|
|||||||||||
|
Proceeds from (payments on) short-term debt, net (Note 11)
|
5
|
|
(796
|
)
|
662
|
|
|||||
|
Payments on long-term debt (Note 11)
|
(291,525
|
)
|
(421,667
|
)
|
(306,766
|
)
|
|||||
|
Proceeds from long-term debt (Note 11)
|
510,456
|
|
406,000
|
|
295,100
|
|
|||||
|
Restricted cash
|
264
|
|
86
|
|
(2,790
|
)
|
|||||
|
Cash dividends paid
|
(47,380
|
)
|
(45,586
|
)
|
(43,994
|
)
|
|||||
|
Distributions to noncontrolling interests
|
—
|
|
—
|
|
(556
|
)
|
|||||
|
Company stock purchases (Note 6)
|
(9,885
|
)
|
(5,654
|
)
|
(11,785
|
)
|
|||||
|
Exercise of stock options (Note 6)
|
1,930
|
|
6,926
|
|
9,643
|
|
|||||
|
Employee stock purchase plan
|
488
|
|
—
|
|
—
|
|
|||||
|
Excess tax benefit related to stock plans (Note 6)
|
596
|
|
2,573
|
|
2,246
|
|
|||||
|
Cash Flow From Financing Activities
|
164,949
|
|
(58,118
|
)
|
(58,240
|
)
|
|||||
|
Effect of exchange rate changes on cash and equivalents
|
(11,786
|
)
|
(8,482
|
)
|
(3,837
|
)
|
|||||
|
(Decrease) increase in cash and cash equivalents
|
(73
|
)
|
9,733
|
|
13,547
|
|
|||||
|
Beginning cash and cash equivalents
|
105,998
|
|
96,265
|
|
82,718
|
|
|||||
|
Ending cash and cash equivalents
|
$
|
105,925
|
|
$
|
105,998
|
|
$
|
96,265
|
|
||
|
Supplemental cash flow information:
|
|||||||||||
|
Interest payments
|
$
|
10,818
|
|
$
|
9,663
|
|
$
|
10,884
|
|
||
|
Income tax payments
|
50,001
|
|
31,679
|
|
36,242
|
|
|||||
The accompanying notes are an integral part of the consolidated financial statements.
42
MSA SAFETY INCORPORATED
CONSOLIDATED STATEMENT OF CHANGES IN RETAINED EARNINGS AND
ACCUMULATED OTHER COMPREHENSIVE LOSS
|
(In thousands)
|
Retained
Earnings
|
Accumulated
Other
Comprehensive
(Loss)
|
|||||
|
Balances January 1, 2013
|
$
|
747,953
|
|
$
|
(127,072
|
)
|
|
|
Net income
|
88,049
|
|
—
|
|
|||
|
Foreign currency translation adjustments
|
—
|
|
(7,281
|
)
|
|||
|
Pension and post-retirement plan adjustments, net of tax of $30,849
|
—
|
|
54,951
|
|
|||
|
Loss attributable to noncontrolling interests
|
198
|
|
1,133
|
|
|||
|
Common dividends
|
(43,952
|
)
|
—
|
|
|||
|
Preferred dividends
|
(42
|
)
|
—
|
|
|||
|
Balances December 31, 2013
|
792,206
|
|
(78,269
|
)
|
|||
|
Net income
|
87,927
|
|
—
|
|
|||
|
Foreign currency translation adjustments
|
—
|
|
(40,568
|
)
|
|||
|
Pension and post-retirement plan adjustments, net of tax of $26,840
|
—
|
|
(48,490
|
)
|
|||
|
Loss attributable to noncontrolling interests
|
579
|
|
597
|
|
|||
|
Common dividends
|
(45,544
|
)
|
—
|
|
|||
|
Preferred dividends
|
(42
|
)
|
—
|
|
|||
|
Balances December 31, 2014
|
835,126
|
|
(166,730
|
)
|
|||
|
Net income
|
67,944
|
|
—
|
|
|||
|
Foreign currency translation adjustments
|
—
|
|
(49,067
|
)
|
|||
|
Pension and post-retirement plan adjustments, net of tax of $1,160
|
—
|
|
6,181
|
|
|||
|
Loss attributable to noncontrolling interests
|
2,863
|
|
1,417
|
|
|||
|
Common dividends
|
(47,338
|
)
|
—
|
|
|||
|
Preferred dividends
|
(42
|
)
|
—
|
|
|||
|
Balances December 31, 2015
|
$
|
858,553
|
|
$
|
(208,199
|
)
|
|
The accompanying notes are an integral part of the consolidated financial statements.
43
MSA SAFETY INCORPORATED
NOTES TO CONSOLIDATED FINANCIAL STATEMENTS
Basis of Presentation—
The Consolidated Financial Statements of MSA Safety Incorporated ("MSA" or "the Company") are prepared in conformity with accounting principles generally accepted in the United States of America (GAAP) and require management to make certain judgments, estimates, and assumptions. These may affect the reported amounts of assets and liabilities and the disclosure of contingent assets and liabilities at the date of the consolidated financial statements. They also may affect the reported amounts of revenues and expenses during the period. Actual results could differ from those estimates upon subsequent resolution of identified matters.
Certain segment results in previously issued consolidated financial statements were recast to conform to the current period presentation. Refer to Note 7 for further information regarding MSA's segment allocation methodology.
Principles of Consolidation—
The consolidated financial statements include the accounts of the Company and all subsidiaries. Intercompany accounts and transactions are eliminated.
Noncontrolling Interests—
Noncontrolling interests reflect noncontrolling shareholders’ investments in certain consolidated subsidiaries and their proportionate share of the income and accumulated other comprehensive income of those subsidiaries.
Currency Translation—
The functional currency of all significant non-U.S. subsidiaries is the local currency. Assets and liabilities of these operations are translated at year-end exchange rates. Income statement accounts are translated using the average exchange rates for the reporting period. Translation adjustments for these companies are reported as a component of shareholders’ equity and are not included in income. Foreign currency transaction gains and losses are included in net income for the reporting period.
Cash Equivalents—
Cash equivalents include temporary deposits with financial institutions and highly liquid investments with original maturities of 90 days or less.
Restricted Cash—
Restricted cash, which is designated for use other than current operations, is included in prepaid expenses and other current assets in the Consolidated Balance Sheet. Restricted cash balances were
$2.4 million
and
$2.7 million
at December 31, 2015 and December 31, 2014, respectively. These balances were used to support letter of credit balances.
Inventories—
Inventories are stated at the lower of cost or market. Most U.S. inventories are valued on the last-in, first-out (LIFO) cost method. Other inventories are valued on the average cost method or at standard costs which approximate actual costs. It is the Company’s general policy to write-down any inventory that is identified as obsolete and any inventory that has aged or has not moved in more than
twenty-four months
.
Property and Depreciation—
Property is recorded at cost. Depreciation is computed using straight-line and accelerated methods over the estimated useful lives of the assets, generally as follows: buildings
20
to
40
years and machinery and equipment
3
to
10
years. Expenditures for significant renewals and improvements are capitalized. Ordinary repairs and maintenance are expensed as incurred. Gains or losses on property dispositions are included in other income and the cost and related depreciation are removed from the accounts. Depreciation expense for the years ended
December 31, 2015
,
2014
and
2013
was
$26.9 million
,
$26.2 million
and
$27.1 million
, respectively. Properties, plants, and equipment are reviewed for impairment whenever events or changes in circumstances indicate that the carrying amount of such assets may not be recoverable. Recoverability of assets is determined by comparing the estimated undiscounted net cash flows of the operations related to the assets to their carrying amount. An impairment loss would be recognized when the carrying amount of the assets exceeds the estimated undiscounted net cash flows. The amount of the impairment loss to be recorded is calculated as the excess of the carrying value of the assets over their fair value, with fair value determined using the best information available, which generally is a discounted cash flow model.
44
Goodwill and Other Intangible Assets—
Goodwill and Other Intangible assets are amortized on a straight-line basis over their useful lives. Intangible assets are reviewed for possible impairment whenever circumstances change such that the recorded value of the asset may not be recoverable. Goodwill is not amortized, but is subject to impairment assessments. We test the goodwill of each of our reporting units for impairment at least annually. The annual goodwill impairment assessment has historically been performed as of September 30 each year. The Company changed its annual impairment assessment date to October 1 as discussed below. All goodwill is assigned to reporting units. For this purpose, we consider our operating segments to be our reporting units. We test goodwill for impairment by either performing a qualitative evaluation or a two-step quantitative test. The qualitative evaluation is an assessment of various factors to determine whether it is more likely than not that the fair value of a reporting unit is less than its carrying value, including goodwill.
Factors considered as part of the qualitative assessment include entity-specific industry, market and general economic conditions. We may elect to bypass the qualitative assessment for some or all of our reporting units and perform a two-step quantitative test. Quantitative testing involves estimating a reporting unit’s fair value. We estimate reporting unit fair value using discounted cash flow (DCF) and market approach methodologies as we believe both are equally important indicators of fair value. A number of significant assumptions and estimates are involved in the application of the DCF model, including sales volumes and prices, costs to produce, tax rates, capital spending, discount rates, and working capital changes. Cash flow forecasts are generally based on approved business unit operating plans for the early years and historical relationships in later years. The betas used in calculating the individual reporting units’ weighted average cost of capital (WACC) rate are estimated for each reporting unit based on peer data. The market approach methodology measures value through an analysis of peer companies. The analysis entails measuring the multiples of EBITDA at which peer companies are trading.
In the event the estimated fair value of a reporting unit per the weighted average of the DCF and market approach models is less than the carrying value, additional analysis would be required. The additional analysis would compare the carrying amount of the reporting unit’s goodwill with the implied fair value of that goodwill, which may involve the use of valuation experts. The implied fair value of goodwill is the excess of the fair value of the reporting unit over the fair value amounts assigned to all of the assets and liabilities of that unit as if the reporting unit had been acquired in a business combination and the fair value of the reporting unit represented the purchase price. If the carrying value of goodwill exceeds its implied fair value, an impairment loss equal to such excess would be recognized, which could significantly and adversely impact reported results of operations and shareholders’ equity. There has been
no
impairment of our goodwill as of December 31, 2015.
During the quarter ended December 31, 2015, the Company voluntarily changed the date of its annual goodwill impairment testing from the last day of the third fiscal quarter to the first day of the fourth fiscal quarter. This voluntary change is preferable under the circumstances as it provides the Company with additional time to complete its annual goodwill impairment testing in advance of its year-end reporting and results in better alignment with the timing of the Company’s long range planning and forecasting process. The voluntary change in accounting principle related to the annual testing date will not delay, accelerate or avoid an impairment charge. The change will be applied prospectively.
Revenue Recognition—
Revenue from the sale of products is recognized when title, ownership and the risk of loss have transferred to the customer, which generally occurs either when product is shipped to the customer or, in the case of most U.S. distributor customers, when product is delivered to the customer’s delivery site. We establish our shipping terms according to local practice and market characteristics. We do not ship product unless we have an order or other documentation authorizing shipment to our customers. We make appropriate provisions for uncollectible accounts receivable and product returns, both of which have historically been insignificant in relation to our net sales. Certain distributor customers receive price rebates based on their level of purchases and other performance criteria that are documented in established distributor programs. These rebates are accrued as a reduction of net sales as they are earned by the customer.
Shipping and Handling—
Shipping and handling expenses for products sold to customers are charged to cost of products sold as incurred. Amounts billed to customers for shipping and handling are included in net sales.
Product Warranties—
Estimated expenses related to product warranties and additional service actions are charged to cost of products sold in the period in which the related revenue is recognized or when significant product quality issues are identified.
Research and Development—
Research and development costs are expensed as incurred.
45
Income Taxes—
Deferred income taxes are provided for temporary differences between financial and tax reporting. Deferred tax assets and liabilities are measured using enacted tax rates in effect for the year in which those temporary differences are expected to be recovered or settled. If it is more likely than not that some portion or all of a deferred tax asset will not be realized, a valuation allowance is recognized. We record tax benefits related to uncertain tax positions taken or expected to be taken on a tax return when such benefits meet a more likely than not threshold. We recognize interest related to unrecognized tax benefits in interest expense and penalties in operating expenses. No provision is made for possible U.S. taxes on the undistributed earnings of foreign subsidiaries that are considered to be reinvested indefinitely.
Stock-Based Compensation—
We account for stock-based compensation in accordance with the FASB guidance on share-based payment, which requires that we recognize compensation expense for employee and non-employee director stock-based compensation based on the grant date fair value. Except for retirement-eligible participants, for whom there is no requisite service period, this expense is recognized ratably over the requisite service periods following the date of grant. For retirement-eligible participants, this expense is recognized at the grant date.
Derivative Instruments—
We may use derivative instruments to minimize the effects of changes in currency exchange rates. We do not enter into derivative transactions for speculative purposes and do not hold derivative instruments for trading purposes. Changes in the fair value of derivative instruments designated as fair value hedges are recorded in the balance sheet as adjustments to the underlying hedged asset or liability. Changes in the fair value of derivative instruments that do not qualify for hedge accounting treatment are recognized in the income statement as currency exchange (income) loss in the current period.
Commitments and Contingencies—
For asserted claims and assessments, liabilities are recorded when an unfavorable outcome of a matter is deemed to be probable and the loss is reasonably estimable. Management determines the likelihood of an unfavorable outcome based on many factors such as the nature of the matter, available defenses and case strategy, progress of the matter, views and opinions of legal counsel and other advisors, applicability and success of appeals processes, and the outcome of similar historical matters, among others. Once an unfavorable outcome is deemed probable, management weighs the probability of estimated losses, and the most reasonable loss estimate is recorded. If an unfavorable outcome of a matter is deemed to be reasonably possible, then the matter is disclosed and no liability is recorded. With respect to unasserted claims or assessments, management must first determine that the probability that an assertion will be made is likely, then, a determination as to the likelihood of an unfavorable outcome and the ability to reasonably estimate the potential loss is made. Legal matters are reviewed on a continuous basis to determine if there has been a change in management’s judgment regarding the likelihood of an unfavorable outcome or the estimate of a potential loss. Please refer to Note 19 Contingencies for further details on product liability related matters.
Discontinued Operations and Assets Held For Sale—
For those businesses where management has committed to a plan to divest, each business is valued at the lower of its carrying amount or estimated fair value less cost to sell. If the carrying amount of the business exceeds its estimated fair value, an impairment loss is recognized. Fair value is estimated using accepted valuation techniques such as a discounted cash flow model, valuations performed by third parties, earnings multiples, or indicative bids, when available. A number of significant estimates and assumptions are involved in the application of these techniques, including the forecasting of markets and market share, sales volumes and prices, costs and expenses, and multiple other factors. Management considers historical experience and all available information at the time the estimates are made; however, the fair value that is ultimately realized upon the divestiture of a business may differ from the estimated fair value reflected in the Consolidated Financial Statements. Depreciation and amortization expense is not recorded on assets of a business to be divested once they are classified as held for sale.
For businesses classified as discontinued operations, the results of operations are reclassified from their historical presentation to discontinued operations on the Consolidated Statement of Income, for all periods presented. The gains or losses associated with these divested businesses are recorded in discontinued operations on the Consolidated Statement of Income. Additionally, segment information does not include the operating results of businesses classified as discontinued operations for all periods presented. Management does not expect any continuing involvement with these businesses following their divestiture, and these businesses are expected to be disposed of within one year.
Recently Adopted and Recently Issued Accounting Standards—
In April 2014, the FASB issued ASU 2014-08,
Reporting Discontinued Operations and Disclosures of Disposals of an Entity
. This ASU amends the definition of a discontinued operation to include a disposal of a component or group of components that is disposed of or is classified as held for sale and represents a strategic shift that has (or will have) a major effect on an entity's operations and financial results. This ASU was adopted on January 1, 2015. The adoption of this ASU may have a material effect on our consolidated financial statements in the event that we were to divest of a component that meets the definition of discontinued operations.
46
In May 2014, the FASB issued ASU 2014-09,
Revenue with Contracts from Customers
. This ASU clarifies the principles for recognizing revenue such that an entity should recognize revenue to depict the transfer of promised goods or services to customers in an amount that reflects the consideration to which the entity expects to be entitled in exchange for those goods or services. In August 2015, the FASB issued ASU 2015-15,
Revenue with Contracts from Customers
. This ASU defers the effective date of the standard until January 1, 2018. The Company is currently evaluating the impact that the adoption of these ASUs will have on the consolidated financial statements.
In June 2014, the FASB issued ASU 2014-12,
Accounting for Share-Based Payments When the Terms of an Award Provide That a Performance Target Could be Achieved after the Requisite Service Period
. This ASU clarifies the accounting treatment for share based payment awards that contain performance targets. This ASU will be effective beginning in 2016. The adoption of this ASU is not expected to have a material effect on our consolidated financial statements.
In August 2014, the FASB issued ASU 2014-15,
Presentation of Financial Statements - Going Concern
. This ASU clarifies management's responsibility to evaluate whether there is a substantial doubt about the entity's ability to continue as a going concern and provides guidance for related footnote disclosures. This ASU will be effective beginning in 2016. The adoption of this ASU is not expected to have a material effect on our consolidated financial statements.
In January 2015, the FASB issued ASU 2015-01,
Income Statement - Extraordinary and Unusual Items
. This ASU eliminates the requirement to separately present and disclose extraordinary and unusual items in the financial statements. This ASU will be effective beginning in 2016. The adoption of this ASU is not expected to have a material effect on our consolidated financial statements.
In February 2015, the FASB issued ASU 2015-02,
Amendments to the Consolidation Analysis
. This ASU changes the analysis that an entity must perform to determine whether it should consolidate certain types of legal entities. This ASU will be effective beginning in 2016. The adoption of this ASU is not expected to have a material effect on our consolidated financial statements.
In April 2015, the FASB issued ASU 2015-03,
Imputation of Interest - Simplifying the Presentation of Debt Issuance Costs
. This ASU simplifies the presentation of debt issuance costs and requires that debt issuance costs related to a recognized debt liability be presented in the balance sheet as a direct deduction from the carrying amount of that debt liability. In August 2015, the FASB issued ASU 2015-15, I
mputation of Interest - Simplifying the Presentation of Debt Issuance Costs
. This ASU simplifies the presentation of debt issuance costs for line of credit arrangements. Both ASUs will be effective beginning in 2016. The adoption of these ASU is not expected to have a material effect on our consolidated financial statements.
In April 2015, the FASB issued ASU 2015-04,
Retirement Benefits - Practical Expedient for the Measurement Date of an Employer's Defined Benefit Obligation and Plan Assets.
This ASU allows entities with a fiscal year end that does not coincide with a month end to use the closest month end for measurement purposes. This ASU also allows entities that have a significant event in an interim period that calls for a remeasurement of defined benefit plan assets and obligations to use the month end date that is closest to the date of the significant event. This ASU will be effective beginning in 2016. The adoption of this ASU is not expected to have a material effect on our consolidated financial statements.
In April 2015, the FASB issued ASU 2015-05, Goodwill and Other Internal Use Software
- Customer's Accounting for Fees Paid in a Cloud Computing Arrangement
. This ASU clarifies when entities should account for fees paid in a cloud computing arrangement as a software license or service contract. This ASU will be effective beginning in 2016. The adoption of this ASU is not expected to have a material effect on our consolidated financial statements.
In July 2015, the FASB issued ASU 2015-11,
Simplifying the Measurement of Inventory.
This ASU requires inventory to be measured at the lower of cost and net realizable value. This ASU applies to inventory measured using the first-in, first-out (FIFO) or average cost methods only. This ASU will be effective beginning in 2017. The adoption of this ASU is not expected to have a material effect on our consolidated financial statements.
In July 2015, the FASB issued ASU 2015-12,
Plan Accounting: Defined Benefit Pension Plans (Topic 960), Defined Contribution Pension Plans (Topic 962), Health and Welfare Benefit Plans (Topic 965)
. This ASU simplifies complexities within employee benefit plan accounting including Fully Benefit-Responsive Investment Contracts, Plan Investment Disclosures, and the Measurement Date Practical Expedient. This ASU will be effective beginning in 2016. The adoption of this ASU is not expected to have a material effect on our consolidated financial statements.
47
In September 2015, the FASB issued ASU 2015-16,
Simplifying the Accounting for Measurement-Period Adjustments
. This ASU simplifies the accounting for adjustments made to provisional amounts recognized in a business combination. The amendments in this Update eliminate the requirement to retrospectively account for those adjustments. This ASU will be effective beginning in 2016. MSA elected to early adopt this standard for the period ended December 31, 2015. The adoption of this ASU could have a material effect on our consolidated financial statements to the extent that measurement-period adjustments for business combinations are identified.
In November 2015, the FASB issued ASU 2015-17,
Balance Sheet Classification of Deferred Taxes
. This ASU simplifies the presentation of deferred income taxes. The amendments in this Update require that deferred tax liabilities and assets be classified as noncurrent in a classified statement of financial position. This ASU is effective for financial statements issued for annual periods beginning after December 15, 2016, and interim periods within those annual periods. Early adoption is permitted. MSA elected to early adopt this standard for the period ended December 31, 2015. We elected to apply the amendments in this update retrospectively. As such, we have reclassified
$23.8 million
and $
7.0
thousand dollars previously reported in the 2014 Form 10-K as current deferred tax assets and other current liabilities on the Consolidated Balance Sheet, respectively, to non-current deferred tax assets and non-current deferred tax liabilities on the Consolidated Balance Sheet as of December 31, 2014.
In February 2016, the FASB issued ASU 2016-02,
Leases
. This ASU requires lessees to record a right of use asset and a liability for virtually all leases. This ASU will be effective beginning in 2019. While the adoption of this ASU is expected to have a material effect on our consolidated balance sheet, the Company continues to evaluate the impact that the adoption of this ASU will have on the consolidated financial statements.
During the years ended
December 31, 2015
,
2014
and
2013
, we recorded restructuring charges of
$12.3 million
,
$8.5 million
, and
$5.3 million
, respectively. These charges were primarily related to reorganization activities.
In accordance with ongoing initiatives to right size our operations, headcount was reduced by
216
in 2015. Headcount was reduced by
151
in the International segment,
34
in the European segment,
19
in the North American segment, and
12
in the Corporate segment.
For the year ended
December 31, 2015
, International segment charges of
$5.4 million
were primarily related to staff reductions in Australia, Japan, and China. European segment restructuring charges of
$2.0 million
related to a one-time benefit for employees impacted by our European Principal Operating Company. The remaining
$1.3 million
of restructuring charges in the European segment were primarily related to staff reductions in Central and Southern Europe. North American charges of
$2.0 million
and Corporate segment charges of
$1.6 million
were primarily related to staff reductions. While the Company made significant progress in optimizing the cost structure at the end of 2015, the Company is actively evaluating additional cost reduction opportunities in 2016.
For the year ended
December 31, 2014
, European segment charges of
$4.8 million
were primarily related to severance from staff reductions in Central and Southern Europe as well as reorganization costs in Central Europe. International segment charges of
$3.7 million
for the year ended December 31, 2014 were primarily related to staff reductions in South Africa, Australia, and Brazil and asset disposals in Australia and South Africa, as the Company continued to focus manufacturing efforts in line with our core products and to respond to changing economic conditions.
For the year ended December 31, 2013, European segment charges of
$3.0 million
were primarily related to staff reductions in Germany and Netherlands. International segment charges of
$2.3 million
for the year ended December 31, 2013 were primarily related to staff reductions in Australia and South Africa.
48
Activity and reserve balances for restructuring charges by segment were as follows:
|
(in millions)
|
North America
|
Europe
|
International
|
Corporate
|
Total
|
||||||||||||||
|
Reserve balances at January 1, 2013
|
$
|
0.3
|
|
$
|
2.5
|
|
$
|
0.2
|
|
$
|
—
|
|
$
|
3.0
|
|
||||
|
Restructuring charges
|
—
|
|
3.0
|
|
2.3
|
|
—
|
|
5.3
|
|
|||||||||
|
Cash payments
|
(0.3
|
)
|
(3.8
|
)
|
(2.5
|
)
|
—
|
|
(6.6
|
)
|
|||||||||
|
Reserve balances at December 31, 2013
|
$
|
—
|
|
$
|
1.7
|
|
$
|
—
|
|
$
|
—
|
|
$
|
1.7
|
|
||||
|
Restructuring charges
|
—
|
|
4.8
|
|
3.7
|
|
—
|
|
8.5
|
|
|||||||||
|
Asset disposals
|
—
|
|
(0.4
|
)
|
(1.7
|
)
|
—
|
|
(2.1
|
)
|
|||||||||
|
Cash payments
|
—
|
|
(3.5
|
)
|
(1.8
|
)
|
—
|
|
(5.3
|
)
|
|||||||||
|
Reserve balances at December 31, 2014
|
$
|
—
|
|
$
|
2.6
|
|
$
|
0.2
|
|
$
|
—
|
|
$
|
2.8
|
|
||||
|
Restructuring charges
|
2.0
|
|
3.3
|
|
5.4
|
|
1.6
|
|
12.3
|
|
|||||||||
|
Cash payments
|
(0.9
|
)
|
(1.7
|
)
|
(3.9
|
)
|
(0.5
|
)
|
(7.0
|
)
|
|||||||||
|
Reserve balances at December 31, 2015
|
$
|
1.1
|
|
$
|
4.2
|
|
$
|
1.7
|
|
$
|
1.1
|
|
$
|
8.1
|
|
||||
The following table sets forth the components of inventory:
|
December 31,
|
|||||||
|
(In thousands)
|
2015
|
2014
|
|||||
|
Finished products
|
$
|
74,929
|
|
$
|
89,595
|
|
|
|
Work in process
|
8,979
|
|
$
|
8,942
|
|
||
|
Raw materials and supplies
|
85,643
|
|
68,885
|
|
|||
|
Inventories at current cost
|
169,551
|
|
167,422
|
|
|||
|
Less: LIFO valuation
|
(43,702
|
)
|
(44,468
|
)
|
|||
|
Total inventories
|
125,849
|
|
122,954
|
|
|||
Inventories stated on the LIFO basis represent
23%
and
21%
of total inventories at
December 31, 2015
and
2014
, respectively.
Reductions in certain inventory quantities during the years ended
December 31, 2015
and
2014
resulted in liquidations of LIFO inventories carried at lower costs prevailing in prior years. The effect of LIFO liquidations during 2015 reduced cost of sales by
$1.4 million
and increased net income by
$0.9 million
. The effect of LIFO liquidations during 2014 were inconsequential to changes in cost of sales and net income.
The following table sets forth the components of property, plant and equipment:
|
December 31,
|
|||||||
|
(In thousands)
|
2015
|
2014
|
|||||
|
Land
|
$
|
2,929
|
|
$
|
3,573
|
|
|
|
Buildings
|
114,324
|
|
110,144
|
|
|||
|
Machinery and equipment
|
345,064
|
|
335,318
|
|
|||
|
Construction in progress
|
12,451
|
|
17,327
|
|
|||
|
Total
|
474,768
|
|
466,362
|
|
|||
|
Less accumulated depreciation
|
(318,929
|
)
|
(315,010
|
)
|
|||
|
Net property
|
155,839
|
|
151,352
|
|
|||
49
|
MSA Safety Incorporated
|
Noncontrolling Interests
|
|||||||||||||||||||||||
|
(In thousands)
|
2015
|
2014
|
2013
|
2015
|
2014
|
2013
|
||||||||||||||||||
|
Pension and other post-retirement benefits
|
||||||||||||||||||||||||
|
Balance at beginning of period
|
$
|
(125,570
|
)
|
$
|
(77,080
|
)
|
$
|
(132,031
|
)
|
$
|
—
|
|
$
|
—
|
|
$
|
—
|
|
||||||
|
Unrecognized net actuarial (losses) gains
|
(8,002
|
)
|
(84,495
|
)
|
72,008
|
|
—
|
|
—
|
|
—
|
|
||||||||||||
|
Unrecognized prior service (cost) credit
|
(604
|
)
|
302
|
|
239
|
|
—
|
|
—
|
|
—
|
|
||||||||||||
|
Tax benefit (expense)
|
4,173
|
|
29,832
|
|
(25,783
|
)
|
—
|
|
—
|
|
—
|
|
||||||||||||
|
Total other comprehensive (loss) income before reclassifications, net of tax
|
(4,433
|
)
|
(54,361
|
)
|
46,464
|
|
—
|
|
—
|
|
—
|
|
||||||||||||
|
Amounts reclassified from accumulated other comprehensive loss:
|
||||||||||||||||||||||||
|
Amortization of prior service cost
|
(268
|
)
|
(251
|
)
|
(322
|
)
|
—
|
|
—
|
|
—
|
|
||||||||||||
|
Recognized net actuarial losses
|
16,215
|
|
9,114
|
|
13,875
|
|
—
|
|
—
|
|
—
|
|
||||||||||||
|
Tax benefit
|
(5,333
|
)
|
(2,992
|
)
|
(5,066
|
)
|
—
|
|
—
|
|
—
|
|
||||||||||||
|
Total amount reclassified from accumulated other comprehensive loss, net of tax
|
10,614
|
|
5,871
|
|
8,487
|
|
—
|
|
—
|
|
—
|
|
||||||||||||
|
Total other comprehensive income (loss)
|
6,181
|
|
(48,490
|
)
|
54,951
|
|
||||||||||||||||||
|
Balance at end of period
|
$
|
(119,389
|
)
|
$
|
(125,570
|
)
|
$
|
(77,080
|
)
|
$
|
—
|
|
$
|
—
|
|
$
|
—
|
|
||||||
|
Foreign currency translation
|
||||||||||||||||||||||||
|
Balance at beginning of period
|
$
|
(41,160
|
)
|
$
|
(1,189
|
)
|
$
|
4,959
|
|
$
|
(2,199
|
)
|
$
|
(1,602
|
)
|
$
|
(469
|
)
|
||||||
|
Foreign currency translation adjustments
|
(47,650
|
)
|
(39,971
|
)
|
(6,148
|
)
|
(1,417
|
)
|
(597
|
)
|
(1,133
|
)
|
||||||||||||
|
Balance at end of period
|
$
|
(88,810
|
)
|
$
|
(41,160
|
)
|
$
|
(1,189
|
)
|
$
|
(3,616
|
)
|
$
|
(2,199
|
)
|
$
|
(1,602
|
)
|
||||||
The reclassifications out of accumulated other comprehensive loss are included in the computation of net periodic pension and other post-retirement benefit costs (see Note 14—Pensions and Other Post-Retirement Benefits).
Preferred Stock -
The Company has authorized
100,000
shares of
$50
par value
4.5%
cumulative preferred nonvoting stock which is callable at
$52.50
. There are
71,340
shares issued and
52,878
shares held in treasury at December 31, 2015. There were
33
shares of preferred stock repurchased and subsequently canceled during 2015. The Treasury shares at cost line of the Consolidated Balance Sheet includes
$1.8 million
related to preferred stock. There were
no
treasury purchases of preferred stock during the years ended December 31, 2014 or 2013. The Company has also authorized
1,000,000
shares of
$10
par value second cumulative preferred voting stock.
No
shares have been issued as of December 31, 2015 or 2014.
50
Common Stock -
The Company has authorized
180,000,000
shares of
no
par value common stock. There were
37,372,474
and
37,448,310
shares outstanding at December 31, 2015 and December 31, 2014, respectively. Common stock activity is summarized as follows:
|
Shares
|
Dollars
|
|||||||||||||||||||
|
(Dollars in thousands)
|
Issued
|
Stock
Compensation
Trust
|
Treasury
|
Common
Stock
|
Stock
Compensation
Trust
|
Treasury
Cost
|
||||||||||||||
|
Balances January 1, 2013
|
62,081,391
|
|
(745,430
|
)
|
(24,328,162
|
)
|
$
|
112,135
|
|
$
|
(3,891
|
)
|
$
|
(267,987
|
)
|
|||||
|
Restricted stock awards
|
—
|
|
96,686
|
|
—
|
|
(505
|
)
|
505
|
|
—
|
|
||||||||
|
Restricted stock expense
|
—
|
|
—
|
|
—
|
|
4,244
|
|
—
|
|
—
|
|
||||||||
|
Restricted stock forfeitures
|
—
|
|
—
|
|
(7,365
|
)
|
(115
|
)
|
—
|
|
—
|
|
||||||||
|
Stock options exercised
|
—
|
|
277,687
|
|
—
|
|
8,194
|
|
1,449
|
|
—
|
|
||||||||
|
Stock option expense
|
—
|
|
—
|
|
—
|
|
2,825
|
|
—
|
|
—
|
|
||||||||
|
Performance stock issued
|
—
|
|
67,389
|
|
—
|
|
(352
|
)
|
352
|
|
—
|
|
||||||||
|
Performance stock expense
|
—
|
|
—
|
|
—
|
|
3,383
|
|
—
|
|
—
|
|
||||||||
|
Tax benefit related to stock plans
|
—
|
|
—
|
|
—
|
|
2,246
|
|
—
|
|
—
|
|
||||||||
|
Treasury shares purchased for stock compensation programs
|
—
|
|
—
|
|
(240,097
|
)
|
—
|
|
—
|
|
(11,785
|
)
|
||||||||
|
Balances December 31, 2013
|
62,081,391
|
|
(303,668
|
)
|
(24,575,624
|
)
|
132,055
|
|
(1,585
|
)
|
(279,772
|
)
|
||||||||
|
Restricted stock awards
|
—
|
|
72,291
|
|
13,936
|
|
(538
|
)
|
377
|
|
161
|
|
||||||||
|
Restricted stock expense
|
—
|
|
—
|
|
—
|
|
4,372
|
|
—
|
|
—
|
|
||||||||
|
Restricted stock forfeitures
|
—
|
|
—
|
|
(4,078
|
)
|
(346
|
)
|
—
|
|
—
|
|
||||||||
|
Stock options exercised
|
—
|
|
150,962
|
|
39,781
|
|
5,678
|
|
788
|
|
460
|
|
||||||||
|
Stock option expense
|
—
|
|
—
|
|
—
|
|
2,355
|
|
—
|
|
—
|
|
||||||||
|
Performance stock issued
|
—
|
|
80,415
|
|
—
|
|
(420
|
)
|
420
|
|
—
|
|
||||||||
|
Performance stock expense
|
—
|
|
—
|
|
—
|
|
2,705
|
|
—
|
|
—
|
|
||||||||
|
Performance stock forfeitures
|
—
|
|
—
|
|
—
|
|
(33
|
)
|
—
|
|
—
|
|
||||||||
|
Tax benefit related to stock plans
|
—
|
|
—
|
|
—
|
|
2,573
|
|
—
|
|
—
|
|
||||||||
|
Treasury shares purchased for stock compensation programs
|
—
|
|
—
|
|
(107,096
|
)
|
—
|
|
—
|
|
(5,654
|
)
|
||||||||
|
Balances December 31, 2014
|
62,081,391
|
|
—
|
|
(24,633,081
|
)
|
148,401
|
|
—
|
|
(284,805
|
)
|
||||||||
|
Restricted stock awards
|
—
|
|
—
|
|
34,624
|
|
(404
|
)
|
—
|
|
404
|
|
||||||||
|
Restricted stock expense
|
—
|
|
—
|
|
—
|
|
3,461
|
|
—
|
|
—
|
|
||||||||
|
Restricted stock forfeitures
|
—
|
|
—
|
|
(18,468
|
)
|
(426
|
)
|
—
|
|
—
|
|
||||||||
|
Stock options exercised
|
—
|
|
—
|
|
52,708
|
|
1,714
|
|
—
|
|
216
|
|
||||||||
|
Stock option expense
|
—
|
|
—
|
|
|
|
2,572
|
|
—
|
|
—
|
|
||||||||
|
Stock option forfeitures
|
—
|
|
—
|
|
—
|
|
(118
|
)
|
—
|
|
—
|
|
||||||||
|
Performance stock issued
|
—
|
|
—
|
|
52,839
|
|
(616
|
)
|
—
|
|
616
|
|
||||||||
|
Performance stock expense
|
—
|
|
—
|
|
—
|
|
2,265
|
|
—
|
|
—
|
|
||||||||
|
Performance stock forfeitures
|
—
|
|
—
|
|
—
|
|
(155
|
)
|
—
|
|
—
|
|
||||||||
|
Employee stock purchase plan
|
—
|
|
—
|
|
11,517
|
|
352
|
|
—
|
|
136
|
|
||||||||
|
Tax benefit related to stock plans
|
—
|
|
—
|
|
—
|
|
596
|
|
—
|
|
—
|
|
||||||||
|
Treasury shares purchased for stock compensation programs
|
—
|
|
—
|
|
(59,056
|
)
|
—
|
|
—
|
|
(2,781
|
)
|
||||||||
|
Share repurchase program
|
—
|
|
—
|
|
(150,000
|
)
|
—
|
|
—
|
|
(7,104
|
)
|
||||||||
|
Balances December 31, 2015
|
62,081,391
|
|
—
|
|
(24,708,917
|
)
|
$
|
157,642
|
|
$
|
—
|
|
$
|
(293,318
|
)
|
|||||
51
The Mine Safety Appliances Company Stock Compensation Trust was established to provide shares for certain benefit plans, including the management and non-employee directors’ equity incentive plans. Shares held by the Stock Compensation Trust, and the corresponding cost of those shares, are reported as a reduction of common shares issued. Differences between the cost of the shares held by the Stock Compensation Trust and the market value of shares released for stock-related benefits are reflected in common stock issued. The Company began issuing Treasury Shares for all Board of Director share based benefit plans in April 2014. The Company subsequently began issuing Treasury Shares for all share based benefit plans when the stock compensation trust was depleted in September 2014. Shares are issued from Treasury at the average Treasury Share cost on the date of the transaction.
On May 12, 2015, the Board of Directors adopted a new stock repurchase program replacing the existing program. The new program authorizes up to
$100 million
to repurchase MSA common stock in the open market and in private transactions. The share purchase program has no expiration date. The maximum shares that may be purchased is calculated based on the dollars remaining under the program and the respective month-end closing share price. We repurchased
150,000
shares since the program was approved in May. We do not have any other share purchase programs.
We are organized into
seven
geographic operating segments based on management responsibilities. The operating segments have been aggregated (based on economic similarities, the nature of their products, end-user markets and methods of distribution) into
four
reportable segments: North America, Europe, International, and Corporate.
The Corporate segment was established on January 1, 2015 to reflect the activities of centralized functions in our corporate headquarters and to capture results in a manner that the chief operating decision maker reviews. The corporate segment primarily consists of general and administrative expenses incurred in our corporate headquarters, costs associated with corporate development initiatives, legal expense, interest expense, foreign exchange gains or losses, and other centrally-managed costs. Additionally, effective January 1, 2015, we changed the allocation methodology applied to research and development expense. The 2014 and 2013 segment results have been recast to conform with current period presentation.
The Company's sales are allocated to each country based primarily on the destination of the end-customer.
Reportable segment information is presented in the following table:
52
|
(In thousands)
|
North America
|
Europe
|
International
|
Corporate
|
Reconciling Items
|
Consolidated Totals
|
|||||||||||||||||
|
2015
|
|||||||||||||||||||||||
|
Sales to external customers
|
$
|
608,983
|
|
$
|
293,156
|
|
$
|
228,644
|
|
$
|
—
|
|
$
|
—
|
|
$
|
1,130,783
|
|
|||||
|
Intercompany sales
|
133,355
|
|
207,357
|
|
18,831
|
|
—
|
|
(359,543
|
)
|
—
|
|
|||||||||||
|
Net income:
|
|||||||||||||||||||||||
|
Continuing operations
|
87,092
|
|
6,843
|
|
10,137
|
|
(33,218
|
)
|
(1,264
|
)
|
69,590
|
|
|||||||||||
|
Discontinued operations
|
—
|
|
—
|
|
1,217
|
|
—
|
|
—
|
|
1,217
|
|
|||||||||||
|
Total assets
|
820,960
|
|
412,144
|
|
175,449
|
|
16,362
|
|
(97
|
)
|
1,424,818
|
|
|||||||||||
|
Interest income
|
619
|
|
60
|
|
840
|
|
6
|
|
—
|
|
1,525
|
|
|||||||||||
|
Interest expense
|
—
|
|
—
|
|
—
|
|
10,854
|
|
—
|
|
10,854
|
|
|||||||||||
|
Noncash items:
|
|||||||||||||||||||||||
|
Depreciation and amortization
|
20,048
|
|
7,737
|
|
3,899
|
|
—
|
|
—
|
|
31,684
|
|
|||||||||||
|
Pension expense
|
(3,759
|
)
|
(7,527
|
)
|
(669
|
)
|
—
|
|
—
|
|
(11,955
|
)
|
|||||||||||
|
Income tax provision
|
45,849
|
|
14,213
|
|
4,046
|
|
(19,804
|
)
|
103
|
|
44,407
|
|
|||||||||||
|
Capital expenditures
|
20,071
|
|
10,727
|
|
5,443
|
|
—
|
|
—
|
|
36,241
|
|
|||||||||||
|
Net property
|
89,418
|
|
41,922
|
|
24,498
|
|
1
|
|
—
|
|
155,839
|
|
|||||||||||
|
2014
|
|||||||||||||||||||||||
|
Sales to external customers
|
547,739
|
|
321,618
|
|
264,528
|
|
—
|
|
—
|
|
1,133,885
|
|
|||||||||||
|
Intercompany sales
|
116,795
|
|
113,914
|
|
18,449
|
|
—
|
|
(249,158
|
)
|
—
|
|
|||||||||||
|
Net income:
|
|||||||||||||||||||||||
|
Continuing operations
|
77,687
|
|
22,808
|
|
16,977
|
|
(30,324
|
)
|
299
|
|
87,447
|
|
|||||||||||
|
Discontinued operations
|
—
|
|
—
|
|
1,059
|
|
—
|
|
—
|
|
1,059
|
|
|||||||||||
|
Total assets
|
819,095
|
|
236,801
|
|
188,360
|
|
20,865
|
|
(329
|
)
|
1,264,792
|
|
|||||||||||
|
Interest income
|
995
|
|
111
|
|
711
|
|
5
|
|
—
|
|
1,822
|
|
|||||||||||
|
Interest expense
|
—
|
|
—
|
|
—
|
|
9,851
|
|
—
|
|
9,851
|
|
|||||||||||
|
Noncash items:
|
|||||||||||||||||||||||
|
Depreciation and amortization
|
18,635
|
|
6,357
|
|
4,929
|
|
—
|
|
—
|
|
29,921
|
|
|||||||||||
|
Pension income (expense)
|
1,977
|
|
(6,234
|
)
|
(579
|
)
|
—
|
|
—
|
|
(4,836
|
)
|
|||||||||||
|
Income tax provision
|
40,919
|
|
9,452
|
|
7,276
|
|
(15,972
|
)
|
(631
|
)
|
41,044
|
|
|||||||||||
|
Capital expenditures
|
18,377
|
|
10,859
|
|
4,347
|
|
—
|
|
—
|
|
33,583
|
|
|||||||||||
|
Net property
|
86,718
|
|
32,892
|
|
31,741
|
|
1
|
|
—
|
|
151,352
|
|
|||||||||||
|
2013
|
|||||||||||||||||||||||
|
Sales to external customers
|
533,161
|
|
293,092
|
|
285,805
|
|
—
|
|
—
|
|
1,112,058
|
|
|||||||||||
|
Intercompany sales
|
120,952
|
|
98,491
|
|
22,136
|
|
—
|
|
(241,579
|
)
|
—
|
|
|||||||||||
|
Net income:
|
|||||||||||||||||||||||
|
Continuing operations
|
68,181
|
|
22,002
|
|
27,900
|
|
(31,962
|
)
|
(263
|
)
|
85,858
|
|
|||||||||||
|
Discontinued operations
|
—
|
|
—
|
|
2,389
|
|
—
|
|
—
|
|
2,389
|
|
|||||||||||
|
Total assets
|
764,411
|
|
258,057
|
|
192,754
|
|
18,419
|
|
629
|
|
1,234,270
|
|
|||||||||||
|
Interest income
|
243
|
|
90
|
|
809
|
|
—
|
|
—
|
|
1,142
|
|
|||||||||||
|
Interest expense
|
—
|
|
—
|
|
—
|
|
10,677
|
|
—
|
|
10,677
|
|
|||||||||||
|
Noncash items:
|
|||||||||||||||||||||||
|
Depreciation and amortization
|
19,639
|
|
5,357
|
|
5,768
|
|
—
|
|
—
|
|
30,764
|
|
|||||||||||
|
Pension expense
|
(4,765
|
)
|
(6,328
|
)
|
(1,175
|
)
|
—
|
|
—
|
|
(12,268
|
)
|
|||||||||||
|
Income tax provision
|
34,347
|
|
7,334
|
|
9,300
|
|
(16,101
|
)
|
265
|
|
35,145
|
|
|||||||||||
|
Capital expenditures
|
17,887
|
|
11,833
|
|
6,797
|
|
—
|
|
—
|
|
36,517
|
|
|||||||||||
|
Net property
|
84,104
|
|
33,162
|
|
35,488
|
|
1
|
|
—
|
|
152,755
|
|
|||||||||||
53
Reconciling items consist primarily of intercompany eliminations and items not directly attributable to operating segments
Geographic information on sales to external customers, based on country of origin:
|
(In thousands)
|
2015
|
2014
|
2013
|
||||||||
|
United States
|
$
|
593,539
|
|
$
|
530,845
|
|
$
|
528,178
|
|
||
|
Other
|
537,244
|
|
603,040
|
|
583,880
|
|
|||||
|
Total
|
$
|
1,130,783
|
|
$
|
1,133,885
|
|
$
|
1,112,058
|
|
||
Geographic information on net property, based on country of origin:
|
(In thousands)
|
2015
|
2014
|
2013
|
||||||||
|
United States
|
$
|
88,368
|
|
$
|
85,247
|
|
$
|
82,274
|
|
||
|
China
|
13,504
|
|
15,128
|
|
16,010
|
|
|||||
|
Germany
|
7,596
|
|
17,654
|
|
16,882
|
|
|||||
|
Other
|
46,371
|
|
33,323
|
|
37,589
|
|
|||||
|
Total
|
$
|
155,839
|
|
$
|
151,352
|
|
$
|
152,755
|
|
||
The percentage of total sales by product group were as follows:
|
2015
|
2014
|
2013
|
||||||
|
Breathing Apparatus
|
27
|
%
|
19
|
%
|
21
|
%
|
||
|
Fixed Gas and Flame Detection
|
21
|
%
|
23
|
%
|
22
|
%
|
||
|
Portable Gas Detection
|
13
|
%
|
15
|
%
|
14
|
%
|
||
|
Head Protection
|
11
|
%
|
13
|
%
|
13
|
%
|
||
|
Fire & Rescue Helmets
|
5
|
%
|
5
|
%
|
5
|
%
|
||
|
Fall Protection
|
5
|
%
|
4
|
%
|
4
|
%
|
||
|
Other
|
18
|
%
|
21
|
%
|
21
|
%
|
||
Basic earnings per share is computed by dividing net income, after the deduction of preferred stock dividends and undistributed earnings allocated to participating securities, by the weighted average number of common shares outstanding during the period. Diluted earnings per share assumes the issuance of common stock for all potentially dilutive share equivalents outstanding not classified as participating securities. Participating securities are defined as unvested stock-based payment awards that contain nonforfeitable rights to dividends.
54
|
(In thousands, except per share amounts)
|
2015
|
2014
|
2013
|
||||||||
|
Net income attributable to continuing operations
|
$
|
69,590
|
|
$
|
87,447
|
|
$
|
85,858
|
|
||
|
Preferred stock dividends
|
(41
|
)
|
(41
|
)
|
(41
|
)
|
|||||
|
Income from continuing operations available to common equity
|
69,549
|
|
87,406
|
|
85,817
|
|
|||||
|
Dividends and undistributed earnings allocated to participating securities
|
(192
|
)
|
(546
|
)
|
(643
|
)
|
|||||
|
Income from continuing operations available to common shareholders
|
69,357
|
|
86,860
|
|
85,174
|
|
|||||
|
Net income attributable to discontinued operations
|
$
|
1,217
|
|
$
|
1,059
|
|
$
|
2,389
|
|
||
|
Preferred stock dividends
|
(1
|
)
|
(1
|
)
|
(1
|
)
|
|||||
|
Income from discontinued operations available to common equity
|
1,216
|
|
1,058
|
|
2,388
|
|
|||||
|
Dividends and undistributed earnings allocated to participating securities
|
(3
|
)
|
(7
|
)
|
(18
|
)
|
|||||
|
Income from discontinued operations available to common shareholders
|
1,213
|
|
1,051
|
|
2,370
|
|
|||||
|
Basic weighted-average shares outstanding
|
37,293
|
|
37,138
|
|
36,868
|
|
|||||
|
Stock options and other stock compensation
|
417
|
|
590
|
|
582
|
|
|||||
|
Diluted weighted-average shares outstanding
|
37,710
|
|
37,728
|
|
37,450
|
|
|||||
|
Antidilutive stock options
|
658
|
|
—
|
|
15
|
|
|||||
|
Earnings per share attributable to continuing operations:
|
|||||||||||
|
Basic
|
$1.86
|
$2.34
|
$2.31
|
||||||||
|
Diluted
|
$1.84
|
$2.30
|
$2.28
|
||||||||
|
Earnings per share attributable to discontinued operations:
|
|||||||||||
|
Basic
|
$0.03
|
$0.03
|
$0.06
|
||||||||
|
Diluted
|
$0.03
|
$0.03
|
$0.06
|
||||||||
|
(In thousands)
|
2015
|
2014
|
2013
|
||||||||
|
Components of income before income taxes*
|
|||||||||||
|
U.S. income
|
$
|
60,753
|
|
$
|
58,209
|
|
$
|
48,621
|
|
||
|
Non-U.S. income
|
50,273
|
|
68,986
|
|
71,512
|
|
|||||
|
Income before income taxes
|
$
|
111,026
|
|
$
|
127,195
|
|
$
|
120,133
|
|
||
|
Provision for income taxes*
|
|||||||||||
|
Current
|
|||||||||||
|
Federal
|
$
|
21,253
|
|
$
|
23,659
|
|
$
|
18,656
|
|
||
|
State
|
2,389
|
|
1,349
|
|
1,492
|
|
|||||
|
Non-U.S.
|
22,979
|
|
21,101
|
|
18,453
|
|
|||||
|
Total current provision
|
46,621
|
|
46,109
|
|
38,601
|
|
|||||
|
Deferred
|
|||||||||||
|
Federal
|
3,813
|
|
(3,650
|
)
|
(3,582
|
)
|
|||||
|
State
|
(213
|
)
|
317
|
|
(483
|
)
|
|||||
|
Non-U.S.
|
(5,814
|
)
|
(1,732
|
)
|
609
|
|
|||||
|
Total deferred provision
|
(2,214
|
)
|
(5,065
|
)
|
(3,456
|
)
|
|||||
|
Provision for income taxes
|
$
|
44,407
|
|
$
|
41,044
|
|
$
|
35,145
|
|
||
*The components of income before income taxes and the provision for income taxes relate to continuing operations.
55
MSA’s European reorganization continued during 2015. The reorganization is designed to drive optimal performance by aligning certain strategic planning and decision making into a single location enabled by a common IT platform. During 2015, the Company incurred
$7.7 million
of charges associated with exit taxes related to our European reorganization.
Included in discontinued operations is tax expense of $
0.6
million in 2015, $
0.6
million in 2014 and $
1.4
million in 2013.
Cash flows from operations in the Consolidated Statement of Cash Flows include a deferred income tax provision (benefit) from discontinued operations of $
0.5
million, $
(0.3)
million and $
0.2
million in 2015, 2014 and 2013, respectively.
Reconciliation of the U.S. federal income tax rates for continuing operations to our effective tax rate:
|
2015
|
2014
|
2013
|
||||||
|
U.S. federal income tax rate
|
35.0
|
%
|
35.0
|
%
|
35.0
|
%
|
||
|
State income taxes—U.S.
|
1.3
|
|
0.8
|
|
0.6
|
|
||
|
Taxes on non-U.S. income
|
(2.1
|
)
|
(2.2
|
)
|
(4.5
|
)
|
||
|
Taxes on non-U.S. income - European reorganization
|
6.9
|
|
—
|
|
—
|
|
||
|
Research and development credit
|
(1.1
|
)
|
(0.7
|
)
|
(1.5
|
)
|
||
|
Manufacturing deduction credit
|
(1.6
|
)
|
(1.0
|
)
|
(1.1
|
)
|
||
|
Valuation allowances
|
1.7
|
|
(0.6
|
)
|
0.5
|
|
||
|
Other
|
(0.1
|
)
|
1.0
|
|
0.3
|
|
||
|
Effective income tax rate
|
40.0
|
%
|
32.3
|
%
|
29.3
|
%
|
||
Components of deferred tax assets and liabilities:
|
December 31,
|
|||||||
|
(In thousands)
|
2015
|
2014
|
|||||
|
Deferred tax assets
|
|||||||
|
Book expenses capitalized for tax
|
$
|
5,476
|
|
$
|
6,336
|
|
|
|
Post-retirement benefits
|
17,838
|
|
23,335
|
|
|||
|
Inventory reserves
|
2,487
|
|
3,147
|
|
|||
|
Vacation allowances
|
816
|
|
932
|
|
|||
|
Net operating losses and tax credit carryforwards
|
7,394
|
|
7,479
|
|
|||
|
Post employment benefits
|
3,488
|
|
2,382
|
|
|||
|
Foreign tax credit carryforwards
|
8,266
|
|
11,231
|
|
|||
|
Stock options
|
10,587
|
|
10,157
|
|
|||
|
Product Liability
|
6,253
|
|
3,918
|
|
|||
|
Basis of capital assets
|
912
|
|
1,009
|
|
|||
|
Warranties
|
3,666
|
|
3,210
|
|
|||
|
Reserve for doubtful accounts
|
2,320
|
|
1,948
|
|
|||
|
Accrued payroll
|
4,172
|
|
4,319
|
|
|||
|
Other
|
7,782
|
|
5,801
|
|
|||
|
Total deferred tax assets
|
81,457
|
|
85,204
|
|
|||
|
Valuation allowances
|
(5,153
|
)
|
(3,763
|
)
|
|||
|
Net deferred tax assets
|
76,304
|
|
81,441
|
|
|||
|
Deferred tax liabilities
|
|||||||
|
Property, plant and equipment
|
(10,938
|
)
|
(9,269
|
)
|
|||
|
Pension
|
(18,947
|
)
|
(22,195
|
)
|
|||
|
Intangibles
|
(43,789
|
)
|
(30,180
|
)
|
|||
|
Other
|
(1,047
|
)
|
(2,053
|
)
|
|||
|
Total deferred tax liabilities
|
(74,721
|
)
|
(63,697
|
)
|
|||
|
Net deferred taxes
|
$
|
1,583
|
|
$
|
17,744
|
|
|
56
At December 31, 2015, we had net operating loss carryforwards of approximately
$45.0 million
, all of which are in non-U.S. tax jurisdictions. Net operating loss carryforwards without a valuation allowance of
$0.1 million
will expire in
2020
. The remainder either have a valuation allowance or may be carried forward for a period of at least
six years
. The change in valuation allowance for the year of
$1.4 million
is primarily due to our inability to recognize deferred tax assets on certain foreign entities that continue to generate losses.
No
deferred U.S. income taxes have been provided on undistributed earnings of non-U.S. subsidiaries, which amounted to
$408.5 million
as of
December 31, 2015
. These earnings are considered to be reinvested for an indefinite period of time. Because we currently do not have any plans to repatriate these funds, we cannot determine the impact of local taxes, withholding taxes and foreign tax credits associated with the future repatriation of such earnings and, therefore, cannot reasonably estimate the associated tax liability. In cases where we intend to repatriate a portion of the undistributed earnings of our foreign subsidiaries, we provide U.S. income taxes on such earnings.
A reconciliation of the change in the tax liability for unrecognized tax benefits for the years ended
December 31, 2015
and
2014
is as follows:
|
(In thousands)
|
2015
|
2014
|
|||||
|
Beginning balance
|
$
|
9,857
|
|
$
|
5,888
|
|
|
|
Adjustments for tax positions related to the current year
|
8,203
|
|
4,072
|
|
|||
|
Adjustments for tax positions related to prior years
|
(4,887
|
)
|
3
|
|
|||
|
Statute expiration
|
(103
|
)
|
(106
|
)
|
|||
|
Ending balance
|
$
|
13,070
|
|
$
|
9,857
|
|
|
The total amount of unrecognized tax benefits, if recognized, would reduce our future effective tax rate. We have recognized tax benefits associated with these liabilities in the amount of
$2.1 million
and
$5.2 million
at
December 31, 2015
and
2014
, respectively.
We recognize interest related to unrecognized tax benefits in interest expense and penalties in operating expenses. Our liability for accrued interest and penalties related to uncertain tax positions was
$0.8 million
at
December 31, 2014
. During
2015
, we increased interest related to uncertain tax positions by
$0.1 million
. Our liability for accrued interest and penalties related to uncertain tax positions was
$0.9 million
at December 31, 2015.
We file a U.S. federal income tax return along with various state and foreign income tax returns. Examinations of our U.S. federal returns have been completed through 2010, with the 2011 tax year closed by statute. Various state and foreign income tax returns may be subject to tax audits for periods after 2009.
The 2008 Management Equity Incentive Plan provides for various forms of stock-based compensation for eligible key employees through May 2018. Management stock-based compensation includes stock options, restricted stock, restricted stock units and performance stock units. The 2008 Non-Employee Directors’ Equity Incentive Plan provides for grants of stock options and restricted stock to non-employee directors through May 2018. Stock options are granted at market prices and expire after
ten
years. Stock options are exercisable beginning
three years
after the grant date. Restricted stock and restricted stock units are granted without payment to the company and generally vest
three years
after the grant date. Restricted stock and restricted stock units are valued at the market value of the stock on the grant date. Performance stock units with a market condition are valued at an estimated fair value using the Monte Carlo model. The final number of shares to be issued for performance stock units may range from
zero
to
200%
of the target award based on achieving the specified performance targets over the performance period. In general, unvested stock options, restricted stock and performance stock units are forfeited if the participant’s employment with the company terminates for any reason other than retirement, death or disability. We issue Treasury shares for stock option exercises and grants of restricted stock and performance stock. Please refer to Note 6 for further information regarding stock compensation share issuance. As of
December 31, 2015
, there were
1,178,625
and
154,315
shares, respectively, reserved for future grants under the management and non-employee directors’ equity incentive plans.
57
Stock-based compensation expense was as follows:
|
(In thousands)
|
2015
|
2014
|
2013
|
||||||||
|
Restricted stock
|
$
|
3,035
|
|
$
|
4,026
|
|
$
|
4,129
|
|
||
|
Stock options
|
2,454
|
|
2,355
|
|
2,825
|
|
|||||
|
Performance stock
|
2,110
|
|
2,672
|
|
3,383
|
|
|||||
|
Total compensation expense before income taxes
|
7,599
|
|
9,053
|
|
10,337
|
|
|||||
|
Income tax benefit
|
2,896
|
|
3,293
|
|
3,810
|
|
|||||
|
Total compensation expense, net of income tax benefit
|
$
|
4,703
|
|
$
|
5,760
|
|
$
|
6,527
|
|
||
We did not capitalize any stock-based compensation expense, and all expense is recorded in SG&A expense in
2015
,
2014
, or
2013
.
Stock option expense is based on the fair value of stock option grants estimated on the grant dates using the Black-Scholes option pricing model and the following weighted average assumptions for options granted in
2015
,
2014
and
2013
.
|
2015
|
2014
|
2013
|
|||||||||
|
Fair value per option
|
$
|
15.63
|
|
$
|
17.26
|
|
$
|
14.17
|
|
||
|
Risk-free interest rate
|
1.8
|
%
|
2.1
|
%
|
1.2
|
%
|
|||||
|
Expected dividend yield
|
2.3
|
%
|
2.4
|
%
|
2.8
|
%
|
|||||
|
Expected volatility
|
39
|
%
|
41
|
%
|
39
|
%
|
|||||
|
Expected life (years)
|
6.7
|
|
6.6
|
|
6.1
|
|
|||||
The risk-free interest rate is based on the U.S. Treasury Constant Maturity rates as of the grant date converted into an implied spot rate yield curve. Expected dividend yield is based on the most recent annualized dividend divided by the
1
year average closing share price. Expected volatility is based on the
ten
year historical volatility using daily stock prices. Expected life is based on historical stock option exercise data.
A summary of option activity follows:
|
Shares
|
Weighted
Average
Exercise Price
|
Exercisable at
Year-end
|
|||||||
|
Outstanding January 1, 2013
|
1,784,660
|
|
$
|
33.05
|
|
||||
|
Granted
|
188,407
|
|
49.03
|
|
|||||
|
Exercised
|
(277,687
|
)
|
34.72
|
|
|||||
|
Outstanding December 31, 2013
|
1,695,380
|
|
34.55
|
|
1,178,657
|
|
|||
|
Granted
|
138,519
|
|
51.69
|
|
|||||
|
Exercised
|
(190,743
|
)
|
36.31
|
|
|||||
|
Expired
|
(1,071
|
)
|
45.68
|
|
|||||
|
Forfeited
|
(23,524
|
)
|
38.82
|
|
|||||
|
Outstanding December 31, 2014
|
1,618,561
|
|
35.74
|
|
1,147,712
|
|
|||
|
Granted
|
170,683
|
|
48.64
|
|
|||||
|
Exercised
|
(64,752
|
)
|
38.59
|
|
|||||
|
Expired
|
(1,109
|
)
|
44.36
|
|
|||||
|
Forfeited
|
(28,708
|
)
|
49.71
|
|
|||||
|
Outstanding December 31, 2015
|
1,694,675
|
|
$
|
36.69
|
|
1,280,665
|
|
||
58
For various exercise price ranges, characteristics of outstanding and exercisable stock options at
December 31, 2015
were as follows:
|
Stock Options Outstanding
|
||||||||
|
Range of Exercise Prices
|
Shares
|
Weighted-Average
|
||||||
|
Exercise Price
|
Remaining Life
|
|||||||
|
$17.83 – $29.33
|
533,382
|
|
$
|
21.67
|
|
3.52
|
||
|
$33.55 – $40.88
|
461,108
|
|
36.88
|
|
3.92
|
|||
|
$41.26 – $51.69
|
700,185
|
|
47.99
|
|
5.94
|
|||
|
$17.83 – $51.69
|
1,694,675
|
|
36.69
|
|
4.62
|
|||
|
|
Stock Options Exercisable
|
|||||||
|
Range of Exercise Prices
|
Shares
|
Weighted-Average
|
||||||
|
Exercise Price
|
Remaining Life
|
|||||||
|
$17.83 – $29.33
|
533,382
|
|
$
|
21.67
|
|
3.52
|
||
|
$33.55 – $40.88
|
461,108
|
|
36.88
|
|
3.92
|
|||
|
$41.26 – $48.95
|
286,175
|
|
45.63
|
|
2.62
|
|||
|
$17.83 – $48.95
|
1,280,665
|
|
$
|
32.50
|
|
3.46
|
||
Cash received from the exercise of stock options was
$1.9 million
,
$6.9 million
and
$9.6 million
for the years ended
December 31, 2015
,
2014
and
2013
, respectively. The tax (provision) benefit we realized from these exercises was
$(0.1) million
,
$1.0 million
and
$0.5 million
for the years ended
December 31, 2015
,
2014
and
2013
, respectively.
Stock options become exercisable when they are vested. The aggregate intrinsic value of stock options exercisable at
December 31, 2015
was
$14.0 million
. The aggregate intrinsic value of all stock options outstanding at
December 31, 2015
was
$11.5 million
.
A summary of restricted stock and unit activity follows:
|
Shares
|
Weighted Average
Grant Date
Fair Value
|
|||||
|
Unvested at January 1, 2013
|
417,843
|
|
$
|
31.92
|
|
|
|
Granted
|
92,448
|
|
48.98
|
|
||
|
Vested
|
(197,465
|
)
|
27.42
|
|
||
|
Forfeited
|
(9,407
|
)
|
40.23
|
|
||
|
Unvested at December 31, 2013
|
303,419
|
|
39.79
|
|
||
|
Granted
|
83,543
|
|
51.91
|
|
||
|
Vested
|
(108,245
|
)
|
34.94
|
|
||
|
Forfeited
|
(9,974
|
)
|
44.42
|
|
||
|
Unvested at December 31, 2014
|
268,743
|
|
45.34
|
|
||
|
Granted
|
83,725
|
|
48.06
|
|
||
|
Vested
|
(111,834
|
)
|
39.01
|
|
||
|
Forfeited
|
(22,925
|
)
|
45.84
|
|
||
|
Unvested at December 31, 2015
|
217,709
|
|
$
|
49.70
|
|
|
59
A summary of performance stock unit activity follows:
|
Shares
|
Weighted Average
Grant Date
Fair Value
|
|||||
|
Unvested at January 1, 2013
|
137,672
|
|
$
|
35.85
|
|
|
|
Granted
|
53,357
|
|
57.58
|
|
||
|
Vested
|
(45,809
|
)
|
26.08
|
|
||
|
Performance adjustments
|
4,169
|
|
25.84
|
|
||
|
Unvested at December 31, 2013
|
149,389
|
|
46.32
|
|
||
|
Granted
|
46,242
|
|
57.42
|
|
||
|
Vested
|
(91,696
|
)
|
39.19
|
|
||
|
Performance adjustments
|
41,428
|
|
39.42
|
|
||
|
Forfeited
|
(1,402
|
)
|
48.85
|
|
||
|
Unvested at December 31, 2014
|
143,961
|
|
52.42
|
|
||
|
Granted
|
87,256
|
|
41.99
|
|
||
|
Vested
|
(66,200
|
)
|
41.75
|
|
||
|
Performance adjustments
|
16,447
|
|
41.45
|
|
||
|
Forfeited
|
(9,820
|
)
|
51.51
|
|
||
|
Unvested at December 31, 2015
|
171,644
|
|
$
|
50.24
|
|
|
The 2015 performance adjustments above relate to the final number of shares issued for the 2012 Management Performance Units, which were
133.6%
of the target award based on Total Shareholder Return during the
three
year performance period, and vested in the first quarter of 2015.
During the years ended
December 31, 2015
,
2014
and
2013
, the total intrinsic value of stock options exercised (the difference between the market price on the date of exercise and the option price paid to exercise the option) was
$0.5 million
,
$3.7 million
and
$4.0 million
, respectively. The fair values of restricted stock vested during the years ended
December 31, 2015
, 2014 and 2013 were
$5.3 million
,
$5.8 million
and
$9.7 million
, respectively. The fair value of performance stock units vested during the year ended
December 31, 2015
was
$2.0 million
.
On
December 31, 2015
, there was
$4.4 million
of unrecognized stock-based compensation expense. The weighted average period over which this expense is expected to be recognized was approximately
two years
.
Short-Term Debt
Short-term borrowings with banks, which excludes the current portion of long-term debt, was insignificant and
$0.1 million
at
December 31, 2015
and
2014
, respectively. The average month-end balance of total short-term borrowings during 2015 was
$0.2 million
. The maximum month-end balance of
$0.6 million
occurred in February 2015. The weighted average interest rate on short-term borrowings was
14%
at December 31,
2014
.
Long-Term Debt
|
|
December 31,
|
||||||
|
(In thousands)
|
2015
|
2014
|
|||||
|
2006 Senior notes payable through 2021, 5.41%
|
$
|
40,000
|
|
$
|
46,667
|
|
|
|
2010 Senior notes payable through 2021, 4.00%
|
100,000
|
|
100,000
|
|
|||
|
Senior revolving credit facility maturing in 2020
|
326,626
|
|
105,000
|
|
|||
|
Total
|
466,626
|
|
251,667
|
|
|||
|
Amounts due within one year
|
6,667
|
|
6,667
|
|
|||
|
Long-term debt
|
$
|
459,959
|
|
$
|
245,000
|
|
|
60
In connection with the Company's acquisition of Latchways (Note 13), the Company entered into an a credit agreement, effective August 31, 2015. The credit agreement established a senior unsecured credit facility consisting of a
$125.0 million
senior revolving credit facility. On December 11, 2015, the Company repaid the outstanding indebtedness under, and terminated, the credit agreement dated August 31, 2015. The credit agreement was repaid with the proceeds of a borrowing under a new credit agreement dated December 11, 2015. The new credit agreement amended and restated the Company’s existing credit agreement dated March 7, 2014. Under the new credit agreement dated December 11, 2015, funds may be borrowed on an unsecured, revolving credit basis in a maximum outstanding amount not to exceed
$575.0 million
. The new credit agreement has a term expiring on December 11, 2020. At December 31, 2015,
$244.9 million
of the existing
$575.0 million
senior revolving credit facility was unused including letters of credit.
On January 22, 2016, the Company entered into multi-currency note purchase and private shelf agreement, pursuant to which MSA issued notes in an aggregate original principal amount of
£54.9 million
(approximately
$80.0 million
). The Notes are repayable in annual installments of
£6.1 million
(approximately
$8.9 million
), commencing January 22, 2023, with a final payment of any remaining amount outstanding on January 22, 2031. The interest rate on these notes is fixed at
3.4%
. The note purchase agreement requires MSA to comply with specified financial covenants including a requirement to maintain a minimum fixed charges coverage ratio of not less than
1.50
to 1.00 and a consolidated leverage ration not to exceed
3.25
to 1.00; in each case calculated on the basis of the trailing
four
fiscal quarters. In addition, the note purchase agreement contains negative covenants limiting the ability of MSA and its subsidiaries to incur additional indebtedness or issue guarantees, create or incur liens, make loans and investments, make acquisitions, transfer or sell assets, enter into transactions with affiliated parties, make changes in its organizational documents that are materially adverse to lenders or modify the nature of MSA's or its subsidiaries' business.
Approximate maturities on our long-term debt over the next five years are
$6.7 million
in 2016,
$26.7 million
in 2017,
$26.7 million
in 2018,
$26.7 million
in 2019,
$353.1 million
in 2020, and
$26.7 million
thereafter. The revolving credit facilities require the Company to comply with specified financial covenants. In addition, the credit facilities contain negative covenants limiting the ability of the Company and its subsidiaries to enter into specified transactions. The Company was in compliance with all covenants at December 31, 2015.
The Company had outstanding bank guarantees and standby letters of credit with banks as of December 31, 2015, totaling
$7.9 million
, of which
$3.5 million
relate to the senior revolving credit facility. The letters of credit serve to cover customer requirements in connection with certain sales orders and insurance companies.
No
amounts were drawn on these arrangements at December 31, 2015. The Company is also required to provide cash collateral in connection with certain arrangements. At December 31, 2015, the Company has
$2.4 million
of restricted cash in support of these arrangements.
Changes in goodwill during the years ended
December 31, 2015
and
2014
were as follows:
|
(In thousands)
|
2015
|
2014
|
|||||
|
Net balance at January 1
|
$
|
252,520
|
|
$
|
260,134
|
|
|
|
Additions (Note 13)
|
97,959
|
|
—
|
|
|||
|
Currency translation
|
(10,141
|
)
|
(7,614
|
)
|
|||
|
Net balance at December 31
|
$
|
340,338
|
|
$
|
252,520
|
|
|
At
December 31, 2015
, goodwill of
$197.9 million
,
$140.7 million
and
$1.7 million
related to the North American, European and International reporting segments, respectively.
Changes in intangible assets, net of accumulated amortization, during the years ended
December 31, 2015
and
2014
were as follows:
|
(In thousands)
|
2015
|
2014
|
|||||
|
Net balance at January 1
|
$
|
31,323
|
|
$
|
35,029
|
|
|
|
Additions (Note 13)
|
67,645
|
|
500
|
|
|||
|
Amortization expense
|
(4,811
|
)
|
(2,979
|
)
|
|||
|
Impairment losses (Note 15)
|
(723
|
)
|
—
|
|
|||
|
Currency translation
|
(3,366
|
)
|
(1,227
|
)
|
|||
|
Net balance at December 31
|
$
|
90,068
|
|
$
|
31,323
|
|
|
61
|
(In millions)
|
December 31, 2015
|
December 31, 2014
|
|||||||||||||||||||||
|
Intangible Assets:
|
Weighted Average Useful Life (years)
|
Gross Carrying Amount
|
Accumulated Amortization and Reserves
|
Net Carrying Amount
|
Gross Carrying Amount
|
Accumulated Amortization and Reserves
|
Net Carrying Amount
|
||||||||||||||||
|
Customer relationships
|
15
|
$
|
50.5
|
|
$
|
(0.7
|
)
|
$
|
49.8
|
|
—
|
|
$
|
—
|
|
$
|
—
|
|
|||||
|
Distribution agreements
|
20
|
24.6
|
|
(6.2
|
)
|
18.4
|
|
27.5
|
|
$
|
(6.5
|
)
|
$
|
21.0
|
|
||||||||
|
Technology related assets
|
10
|
17.5
|
|
(8.3
|
)
|
9.2
|
|
11.5
|
|
(6.6
|
)
|
4.9
|
|
||||||||||
|
Patents, trademarks and copyrights
|
15
|
16.5
|
|
(4.6
|
)
|
11.9
|
|
13.5
|
|
(8.6
|
)
|
4.9
|
|
||||||||||
|
License agreements
|
5
|
5.4
|
|
(5.3
|
)
|
0.1
|
|
6.8
|
|
(6.7
|
)
|
0.1
|
|
||||||||||
|
Other
|
15
|
3.9
|
|
(3.2
|
)
|
0.7
|
|
7.0
|
|
(6.6
|
)
|
0.4
|
|
||||||||||
|
Total
|
15
|
$
|
118.4
|
|
$
|
(28.3
|
)
|
$
|
90.1
|
|
66.3
|
|
(35.0
|
)
|
31.3
|
|
|||||||
Intangible asset amortization expense over the next five years is expected to be approximately
$8.0 million
in 2016,
$7.5 million
in 2017,
$6.1 million
in 2018,
$6.0 million
in 2019, and
$6.0 million
in 2020.
On October 21, 2015, MSA Safety Incorporated acquired Latchways plc and its affiliated companies, Latchways Australia Pty Limited ("LA"), Latchways Inc. ("LI"), HCL Group Plc ("HCL"), Height Solutions Limited ("HSL"), and Sigma 6 d.o.o. ('Sigma 6"), collectively referred to as ("Latchways"), for
$190.9 million
. There is no contingent consideration.
The acquisition was funded through cash on hand and borrowings on our
$125.0 million
unsecured senior revolving credit facility. Please refer to Note 11, Short-Term and Long-Term Debt for further details.
Latchways is a global provider of innovative fall protection systems based in the United Kingdom. Latchways solutions are found throughout the aerospace, power transmission, utility and telecommunication sectors, and Latchways products are integrated with major roofing and tower systems. In addition to providing us with greater access to the fall protection market, we believe that the acquisition significantly enhances our long-term corporate strategy in fall protection by providing us with world-class research and development talent and an industry-leading product line. While Latchways products will be sold globally, its operations will most significantly impact our European segment.
The following table summarizes the preliminary fair values of the Latchways assets acquired and liabilities assumed at the date of acquisition:
|
(In millions)
|
October 21, 2015
|
||
|
Current assets (including cash of $10.6 million)
|
$
|
35.7
|
|
|
Property, plant and equipment
|
9.5
|
|
|
|
Trade name and acquired technology
|
14.6
|
|
|
|
Customer-related intangibles
|
53.0
|
|
|
|
Goodwill
|
98.0
|
|
|
|
Total assets acquired
|
210.8
|
|
|
|
Total liabilities assumed
|
19.9
|
|
|
|
Net assets acquired
|
$
|
190.9
|
|
The amounts in the table above are subject to change upon completion of the valuation of the assets acquired and liabilities assumed. This valuation is expected to be completed by mid-2016.
62
Assets acquired and liabilities assumed in connection with the acquisition have been recorded at their fair values. Fair values were determined by management, based, in part on an independent valuation performed by a third party valuation specialist. The valuation methods used to determine the fair value of intangible assets included the excess earnings approach for customer relationships and technology related intangible assets; the relief from royalty method for trade name; and the cost method for assembled workforce which is included in goodwill. A number of significant assumptions and estimates were involved in the application of these valuation methods, including sales volumes and prices, costs to produce, tax rates, capital spending, discount rates, and working capital changes. Cash flow forecasts were generally based on Latchways pre-acquisition forecasts coupled with estimated MSA sales synergies. Identifiable intangible assets with finite lives are subject to amortization over their estimated useful lives. The identifiable intangible assets acquired in the Latchways transaction will be amortized over an estimated amortization period of
15 years
. Estimated future amortization expense related to these identifiable intangible assets is approximately
$4.5 million
in each of the next five years. The step up to fair value of acquired inventory as part of the purchase price allocation totaled
$1.6 million
. Estimated depreciation of this step up in inventory value is expected to be approximately
$0.7 million
in 2016. Estimated future depreciation expense related to Latchways property, plant and equipment is approximately
$0.9 million
in each of the next five years.
Goodwill is calculated as the excess of the purchase price over the fair value of net assets acquired and represents the future economic benefits arising from other assets acquired that could not be individually identified and separately recognized. Among the factors that contributed to a purchase price in excess of the fair value of the net tangible and intangible assets acquired were the acquisition of an assembled workforce, the expected synergies and other benefits that we believe will result from combining the operations of Latchways with our operations. Goodwill related to the Latchways acquisition has been recorded in our reportable segments as follows:
$96.6 million
in the European segment and
$1.4 million
in North American segment. Goodwill is not expected to be tax deductible.
Our results for the year ended December 31, 2015, include transaction costs of
$5.0M
, of which
$2.8M
is expected to be non-deductible for tax purposes. Integration costs related to the Latchways acquisition totaled
$2.5 million
(
$1.6 million
after tax). These costs are reported in selling, general and administrative expenses.
The operating results of Latchways have been included in our consolidated financial statements from the acquisition date through December 31, 2015. Our results for the year ended December 31, 2015 include Latchways sales and net loss of
$10.1 million
and
($0.7) million
, respectively. Excluding transaction and integration costs, Latchways had no impact on our 2015 fourth quarter net income.
The following unaudited pro forma information presents our combined results as if the acquisition had occurred at the beginning of 2014. The unaudited pro forma financial information was prepared to give effect to events that are (1) directly attributable to the merger; (2) factually supportable; and (3) expected to have a continuing impact on the combined company’s results. There were no material transactions between us and Latchways during the periods presented that are required to be eliminated. Transactions between Latchways companies during the periods presented have been eliminated in the unaudited pro forma condensed combined financial information. Pro forma adjustments were also made to the 2015 information to remove the effects of one-time transaction and integration costs. The unaudited pro forma financial information does not reflect any cost savings, operating synergies or revenue enhancements that the combined company may achieve as a result of the acquisitions or the costs to integrate the operations or the costs necessary to achieve cost savings, operating synergies or revenue enhancements.
Pro forma financial information (Unaudited)
|
(In millions, except per share amounts)
|
2015
|
2014
|
||||
|
Net sales
|
$
|
1,172
|
|
$
|
1,192
|
|
|
Income from continuing operations
|
77.8
|
|
94.8
|
|
||
|
Basic earnings per share from continuing operations
|
2.09
|
|
2.55
|
|
||
|
Diluted earnings per share from continuing operations
|
2.06
|
|
2.51
|
|
||
63
The unaudited pro forma condensed combined financial information is presented for information purposes only and is not intended to represent or be indicative of the combined results of operations or financial position that we would have reported had the acquisitions been completed as of the date and for the periods presented, and should not be taken as representative of our consolidated results of operations or financial condition following the acquisitions. In addition, the unaudited pro forma condensed combined financial information is not intended to project the future financial position or results of operations of the combined company.
The unaudited pro forma financial information was prepared using the acquisition method of accounting under existing GAAP. MSA has been treated as the acquirer.
We maintain various defined benefit and defined contribution plans covering the majority of our employees. Our principal U.S. plan is funded in compliance with the Employee Retirement Income Security Act (ERISA). It is our general policy to fund current costs for the international plans, except in Germany and Mexico, where it is common practice and permissible under tax laws to accrue book reserves.
We provide health care benefits and limited life insurance for certain retired employees who are covered by our principal U.S. defined benefit pension plan until they become Medicare-eligible.
64
Information pertaining to defined benefit pension plans and other post-retirement benefits plans is provided in the following table:
|
Pension Benefits
|
Other Benefits
|
||||||||||||||
|
(In thousands)
|
2015
|
2014
|
2015
|
2014
|
|||||||||||
|
Change in Benefit Obligations
|
|||||||||||||||
|
Benefit obligations at January 1
|
$
|
519,194
|
|
$
|
440,359
|
|
$
|
26,851
|
|
$
|
26,732
|
|
|||
|
Service cost
|
11,517
|
|
9,425
|
|
444
|
|
538
|
|
|||||||
|
Interest cost
|
18,314
|
|
19,340
|
|
863
|
|
1,107
|
|
|||||||
|
Participant contributions
|
105
|
|
130
|
|
255
|
|
259
|
|
|||||||
|
Plan amendments
|
604
|
|
(302
|
)
|
—
|
|
—
|
|
|||||||
|
Actuarial (gains) losses
|
(21,073
|
)
|
88,069
|
|
(3,998
|
)
|
(200
|
)
|
|||||||
|
Benefits paid
|
(19,261
|
)
|
(19,193
|
)
|
(1,441
|
)
|
(1,585
|
)
|
|||||||
|
Settlements
|
(2,094
|
)
|
(717
|
)
|
—
|
|
—
|
|
|||||||
|
Currency translation
|
(16,126
|
)
|
(17,917
|
)
|
—
|
|
—
|
|
|||||||
|
Benefit obligations at December 31
|
491,180
|
|
519,194
|
|
22,974
|
|
26,851
|
|
|||||||
|
Change in Plan Assets
|
|||||||||||||||
|
Fair value of plan assets at January 1
|
445,299
|
|
434,569
|
|
—
|
|
—
|
|
|||||||
|
Actual return on plan assets
|
(4,754
|
)
|
30,209
|
|
—
|
|
—
|
|
|||||||
|
Employer contributions
|
4,058
|
|
4,077
|
|
1,186
|
|
1,326
|
|
|||||||
|
Participant contributions
|
105
|
|
130
|
|
255
|
|
259
|
|
|||||||
|
Settlements
|
(2,094
|
)
|
(717
|
)
|
—
|
|
—
|
|
|||||||
|
Benefits paid
|
(16,979
|
)
|
(16,507
|
)
|
(1,441
|
)
|
(1,585
|
)
|
|||||||
|
Reimbursement of German benefits
|
(2,282
|
)
|
(2,686
|
)
|
—
|
|
—
|
|
|||||||
|
Administrative Expenses Paid
|
6
|
|
—
|
|
—
|
|
—
|
|
|||||||
|
Currency translation
|
(4,271
|
)
|
(3,776
|
)
|
—
|
|
—
|
|
|||||||
|
Fair value of plan assets at December 31
|
419,088
|
|
445,299
|
|
—
|
|
—
|
|
|||||||
|
Funded Status
|
|||||||||||||||
|
Funded status at December 31
|
(72,092
|
)
|
(73,895
|
)
|
(22,974
|
)
|
(26,851
|
)
|
|||||||
|
Unrecognized transition losses
|
12
|
|
16
|
|
—
|
|
—
|
|
|||||||
|
Unrecognized prior service cost (credit)
|
525
|
|
10
|
|
(1,524
|
)
|
(1,858
|
)
|
|||||||
|
Unrecognized net actuarial losses
|
188,531
|
|
192,692
|
|
2,117
|
|
6,450
|
|
|||||||
|
Net amount recognized
|
116,976
|
|
118,823
|
|
(22,381
|
)
|
(22,259
|
)
|
|||||||
|
Amounts Recognized in the Balance Sheet
|
|||||||||||||||
|
Noncurrent assets
|
62,072
|
|
75,017
|
|
—
|
|
—
|
|
|||||||
|
Current liabilities
|
(5,033
|
)
|
(5,380
|
)
|
(1,382
|
)
|
(1,457
|
)
|
|||||||
|
Noncurrent liabilities
|
(129,131
|
)
|
(143,532
|
)
|
(21,592
|
)
|
(25,394
|
)
|
|||||||
|
Net amount recognized
|
(72,092
|
)
|
(73,895
|
)
|
(22,974
|
)
|
(26,851
|
)
|
|||||||
|
Amounts Recognized in Accumulated Other Comprehensive Loss
|
|||||||||||||||
|
Net actuarial losses
|
188,531
|
|
192,692
|
|
2,425
|
|
6,450
|
|
|||||||
|
Prior service cost (credit)
|
525
|
|
10
|
|
(1,523
|
)
|
(1,858
|
)
|
|||||||
|
Unrecognized net initial obligation
|
12
|
|
16
|
|
—
|
|
—
|
|
|||||||
|
Total (before tax effects)
|
189,068
|
|
192,718
|
|
902
|
|
4,592
|
|
|||||||
|
Accumulated Benefit Obligations for all Defined Benefit Plans
|
453,382
|
|
479,764
|
|
—
|
|
—
|
|
|||||||
65
|
Pension Benefits
|
Other Benefits
|
||||||||||||||||||||||
|
(In thousands)
|
2015
|
2014
|
2013
|
2015
|
2014
|
2013
|
|||||||||||||||||
|
Components of Net Periodic Benefit Cost
|
|||||||||||||||||||||||
|
Service cost
|
$
|
11,517
|
|
$
|
9,425
|
|
$
|
11,132
|
|
$
|
444
|
|
$
|
538
|
|
$
|
687
|
|
|||||
|
Interest cost
|
18,314
|
|
19,340
|
|
17,934
|
|
863
|
|
1,107
|
|
1,050
|
|
|||||||||||
|
Expected return on plan assets
|
(34,130
|
)
|
(32,944
|
)
|
(30,884
|
)
|
—
|
|
—
|
|
—
|
|
|||||||||||
|
Amortization of transition amounts
|
2
|
|
2
|
|
3
|
|
—
|
|
—
|
|
—
|
|
|||||||||||
|
Amortization of prior service cost (credit)
|
66
|
|
84
|
|
102
|
|
(335
|
)
|
(335
|
)
|
(424
|
)
|
|||||||||||
|
Recognized net actuarial losses
|
15,545
|
|
8,639
|
|
13,323
|
|
27
|
|
182
|
|
552
|
|
|||||||||||
|
Settlement loss
|
641
|
|
290
|
|
658
|
|
—
|
|
—
|
|
—
|
|
|||||||||||
|
Termination benefits
|
—
|
|
—
|
|
—
|
|
—
|
|
—
|
|
—
|
|
|||||||||||
|
Net periodic benefit cost
|
11,955
|
|
4,836
|
|
12,268
|
|
999
|
|
1,492
|
|
1,865
|
|
|||||||||||
Actuarial gains and losses are amortized over the average future working lifetime of the active population in the plan using the projected unit credit method. This approximates
10 years
.
Amounts included in accumulated other comprehensive income expected to be recognized in 2016 net periodic benefit costs.
|
(In thousands)
|
Pension Benefits
|
Other Benefits
|
|||||
|
Loss recognition
|
$
|
12,254
|
|
$
|
11
|
|
|
|
Prior service cost (credit) recognition
|
61
|
|
(335
|
)
|
|||
|
Transition obligation recognition
|
2
|
|
—
|
|
|||
|
Pension Benefits
|
Other Benefits
|
||||||||||
|
2015
|
2014
|
2015
|
2014
|
||||||||
|
Assumptions used to determine benefit obligations
|
|||||||||||
|
Average discount rate
|
3.92
|
%
|
3.63
|
%
|
4.20
|
%
|
3.85
|
%
|
|||
|
Rate of compensation increase
|
3.06
|
%
|
3.03
|
%
|
—
|
|
—
|
|
|||
|
Assumptions used to determine net periodic benefit cost
|
|||||||||||
|
Average discount rate
|
3.63
|
%
|
4.54
|
%
|
3.85
|
%
|
4.62
|
%
|
|||
|
Expected return on plan assets
|
8.17
|
%
|
8.20
|
%
|
—
|
|
—
|
|
|||
|
Rate of compensation increase
|
3.03
|
%
|
3.06
|
%
|
—
|
|
—
|
|
|||
Discount rates were determined using various corporate bond indexes as indicators of interest rate levels and movements and by matching our projected benefit obligation payment stream to current yields on high quality bonds.
The expected return on assets for the 2015 net periodic pension cost was determined by multiplying the expected returns of each asset class (based on historical returns) by the expected percentage of the total portfolio invested in that asset class. A total return was determined by summing the expected returns over all asset classes.
|
Pension Plan Assets at
December 31,
|
|||||
|
2015
|
2014
|
||||
|
Equity securities
|
67
|
%
|
65
|
%
|
|
|
Fixed income securities
|
24
|
|
26
|
|
|
|
Pooled investment funds
|
5
|
|
5
|
|
|
|
Insurance contracts
|
3
|
|
3
|
|
|
|
Cash and cash equivalents
|
1
|
|
1
|
|
|
|
Total
|
100
|
%
|
100
|
%
|
|
66
The overall objective of our pension investment strategy is to earn a rate of return over time to satisfy the benefit obligations of the pension plans and to maintain sufficient liquidity to pay benefits and meet other cash requirements of our pension funds. Investment policies for our primary U.S. pension plan are determined by the plan’s Investment Committee and set forth in the plan’s investment policy. Asset managers are granted discretion for determining sector mix, selecting securities and timing transactions, subject to the guidelines of the investment policy. An aggressive, flexible management of the portfolio is permitted and encouraged, with shifts of emphasis among equities, fixed income securities and cash equivalents at the discretion of each manager. No target asset allocations are set forth in the investment policy. For our non-U.S. pension plans, our investment objective is generally met through the use of pooled investment funds and insurance contracts.
The following table summarizes our pension plan assets measured at fair value on a recurring basis by fair value hierarchy level (See Note 17):
|
December 31, 2015
|
|||||||||||||||
|
(In thousands)
|
Quoted Prices
in Active
Markets for
Identical
Assets
(Level 1)
|
Significant
Observable
Inputs
(Level 2)
|
Significant
Unobservable
Inputs
(Level 3)
|
Total
Fair
Value
|
|||||||||||
|
Equity securities
|
$
|
225,191
|
|
$
|
55,428
|
|
$
|
—
|
|
$
|
280,619
|
|
|||
|
Fixed income securities
|
29,903
|
|
70,164
|
|
—
|
|
100,067
|
|
|||||||
|
Pooled investment funds
|
—
|
|
19,345
|
|
—
|
|
19,345
|
|
|||||||
|
Insurance contracts
|
—
|
|
—
|
|
13,681
|
|
13,681
|
|
|||||||
|
Cash and cash equivalents
|
5,376
|
|
—
|
|
—
|
|
5,376
|
|
|||||||
|
Total
|
260,470
|
|
144,937
|
|
13,681
|
|
419,088
|
|
|||||||
|
December 31, 2014
|
|||||||||||||||
|
(In thousands)
|
Quoted Prices
in Active
Markets for
Identical
Assets
(Level 1)
|
Significant
Observable
Inputs
(Level 2)
|
Significant
Unobservable
Inputs
(Level 3)
|
Total
Fair
Value
|
|||||||||||
|
Equity securities
|
$
|
233,156
|
|
$
|
54,614
|
|
$
|
248
|
|
$
|
288,018
|
|
|||
|
Fixed income securities
|
41,447
|
|
72,412
|
|
505
|
|
114,364
|
|
|||||||
|
Pooled investment funds
|
—
|
|
22,623
|
|
—
|
|
22,623
|
|
|||||||
|
Insurance contracts
|
—
|
|
—
|
|
15,069
|
|
15,069
|
|
|||||||
|
Cash and cash equivalents
|
5,225
|
|
—
|
|
—
|
|
5,225
|
|
|||||||
|
Total
|
279,828
|
|
149,649
|
|
15,822
|
|
445,299
|
|
|||||||
Equity securities consist primarily of publicly traded U.S. and non-U.S. common stocks. Equities are valued at closing prices reported on the listing stock exchange.
Fixed income securities consist primarily of U.S. government and agency bonds and U.S. corporate bonds. Fixed income securities are valued at closing prices reported in active markets or based on yields currently available on comparable securities of issuers with similar credit ratings. When quoted prices are not available for identical or similar bonds, the bond is valued under a discounted cash flow approach that maximizes observable inputs, such as current yields of similar instruments, and may include adjustments, for certain risks that may not be observable, such as credit and liquidity risks.
Pooled investment funds consist of mutual and collective investment funds that invest primarily in publicly traded non-U.S. equity and fixed income securities. Pooled investment funds are valued at net asset values calculated by the fund manager based on fair value of the underlying securities. The underlying securities are generally valued at closing prices reported in active markets, quoted prices of similar securities, or discounted cash flows approach that maximizes observable inputs such as current value measurement at the reporting date.
Insurance contracts are valued in accordance with the terms of the applicable collective pension contract. The fair value of the plan assets equals the discounted value of the expected cash flows of the accrued pensions which are guaranteed by the counterparty insurer.
67
Cash equivalents consist primarily of money market and similar temporary investment funds. Cash equivalents are valued at closing prices reported in active markets.
The preceding methods may produce fair value measurements that are not indicative of net realizable value or reflective of future fair values. Although we believe the valuation methods are appropriate and consistent with other market participants, the use of different methodologies or assumptions to determine the fair value of certain financial instruments could result in a different fair value measurement at the reporting date.
The following table presents a reconciliation of Level 3 assets:
|
(In thousands)
|
Insurance
Contracts
|
Other
|
|||||
|
Balance January 1, 2014
|
$
|
13,512
|
|
$
|
780
|
|
|
|
Net realized and unrealized gains included in earnings
|
1,345
|
|
(180
|
)
|
|||
|
Net purchases, issuances and settlements
|
212
|
|
505
|
|
|||
|
Transfers into Level 3
|
—
|
|
(352
|
)
|
|||
|
Balance December 31, 2014
|
15,069
|
|
753
|
|
|||
|
Net realized and unrealized gains included in earnings
|
(1,526
|
)
|
(64
|
)
|
|||
|
Net purchases, issuances and settlements
|
138
|
|
(184
|
)
|
|||
|
Transfers out of Level 3
|
—
|
|
(505
|
)
|
|||
|
Balance December 31, 2015
|
13,681
|
|
—
|
|
|||
We expect to make net contributions of
$6.2 million
to our pension plans in 2016 which are primarily associated with our European and International segments.
For the 2015 beginning of the year measurement purposes (net periodic benefit expense),
6.5%
increase in the costs of covered health care benefits was assumed decreasing by
0.5%
for each successive year to
4.5%
in 2019 and thereafter. For the 2015 end of the year measurement purposes (benefit obligation),
6.5%
increase in the costs of covered health care benefits was assumed decreasing by
0.5%
for each successive year to
4.5%
in 2020 and thereafter. A
one
-percentage-point change in assumed health care cost trend rates would have increased or decreased the other post-retirement benefit obligations and current year plan expense by approximately
$1.1 million
and
$1.0 million
, respectively.
Expense for defined contribution pension plans was
$6.8 million
in
2015
,
$6.5 million
in 2014 and
$5.8 million
in 2013.
Estimated pension benefits to be paid under our defined benefit pension plans during the next five years are
$20.2 million
in 2016,
$21.0 million
in 2017,
$22.0 million
in 2018,
$22.7 million
in 2019,
$24.3 million
in 2020, and are expected to aggregate
$139.2 million
for the five years thereafter. Estimated other post-retirement benefits to be paid during the next
5
years are
$1.4 million
in 2016,
$1.5 million
in 2017,
$1.7 million
in 2018,
$1.8 million
in 2019,
$1.8 million
in 2020, and are expected to aggregate
$8.5 million
for the five years thereafter.
|
(In thousands)
|
2015
|
2014
|
2013
|
||||||||
|
Interest income
|
$
|
1,525
|
|
$
|
1,822
|
|
$
|
1,142
|
|
||
|
Gain on asset dispositions, net
|
1,724
|
|
2,094
|
|
436
|
|
|||||
|
Land impairment loss
|
—
|
|
(50
|
)
|
(1,557
|
)
|
|||||
|
Disposal of non-core product lines
|
(4,223
|
)
|
—
|
|
—
|
|
|||||
|
Impairment of intangible assets
|
(723
|
)
|
—
|
|
—
|
|
|||||
|
Other, net
|
836
|
|
(1,101
|
)
|
(196
|
)
|
|||||
|
Total
|
$
|
(861
|
)
|
$
|
2,765
|
|
$
|
(175
|
)
|
||
During the year ended December 31, 2015, we recorded
$4.2 million
of losses associated with the disposal of net assets related to the Safety Works business in our North American Segment. A discounted cash flow valuation was also performed and showed that the book value of intangible assets used to support certain non-core product sales exceeded their fair value by
$0.7 million
in our North American Segment. Additionally, we recognized a
$2.0 million
gain on the sale of property in Australia as the Company continues to right-size operations and optimize its global footprint.
68
During the year ended December 31, 2014, we recognized a
$2.2 million
gain on the sale of detector tube assets. All proceeds associated with this transaction were collected in 2014. Under the terms of the transitional agreements, we continued to manufacture and sell detector tubes on behalf of the buyer until mid-2014.
During the year ended December 31, 2013, impairment charges were taken on land not used in operations.
We lease office space, manufacturing and warehouse facilities, automobiles and other equipment under operating lease arrangements. Rent expense was
$10.8 million
in
2015
,
$11.7 million
in
2014
and
$12.9 million
in
2013
. Minimum rent commitments under noncancellable leases are
$11.2 million
in
2016
,
$9.5 million
in
2017
,
$7.4 million
in
2018
,
$6.1 million
in
2019
,
$4.6 million
in
2020
and
$12.6 million
thereafter.
As part of our currency exchange rate risk management strategy, we enter into certain derivative foreign currency forward contracts that do not meet the GAAP criteria for hedge accounting, but which have the impact of partially offsetting certain foreign currency exposures. We account for these forward contracts on a full mark-to-market basis and report the related gains or losses in currency exchange losses (gains) in the consolidated statement of income. At
December 31, 2015
, the notional amount of open forward contracts was
$58.6 million
and the unrealized loss on these contracts was
$0.2 million
. All open forward contracts will mature during the first quarter of 2016.
The following table presents the balance sheet location and fair value of assets and liabilities associated with derivative financial instruments.
|
|
December 31,
|
||||||
|
(In thousands)
|
2015
|
2014
|
|||||
|
Derivatives not designated as hedging instruments:
|
|||||||
|
Foreign exchange contracts: other current liabilities
|
$
|
581
|
|
$
|
429
|
|
|
|
Foreign exchange contracts: other current assets
|
401
|
|
34
|
|
|||
The following table presents the income statement location and impact of derivative financial instruments:
|
(In thousands)
|
Income Statement
Location
|
Loss
Recognized in Income
|
||||||
|
Year ended
December 31,
|
||||||||
|
2015
|
2014
|
|||||||
|
Derivatives not designated as hedging instruments:
|
||||||||
|
Foreign exchange contracts
|
Currency exchange loss
|
$
|
2,187
|
|
$
|
2,002
|
|
|
Fair value is defined as the price that would be received to sell an asset or paid to transfer a liability in an orderly transaction between market participants at the measurement date. The fair value hierarchy consists of three broad levels, which gives the highest priority to unadjusted quoted prices in active markets for identical assets or liabilities (Level 1) and the lowest priority to unobservable inputs (Level 3). The three levels of the fair value hierarchy are:
Level 1—Observable inputs that reflect unadjusted quoted prices for identical assets or liabilities in active markets.
Level 2—Inputs other than quoted prices included within Level 1 that are observable for the asset or liability, either directly or indirectly.
Level 3—Unobservable inputs for the asset or liability.
69
The valuation methodologies we used to measure financial assets and liabilities were limited to the pension plan assets described in Note 14 and the derivative financial instruments described in Note 17. See Note 14 for the fair value hierarchy classification of pension plan assets. We estimate the fair value of the derivative financial instruments, consisting of foreign currency forward contracts, based upon valuation models with inputs that generally can be verified by observable market conditions and do not involve significant management judgment. Accordingly, the fair values of the derivative financial instruments are classified within Level 2 of the fair value hierarchy.
With the exception of fixed rate long-term debt, we believe that the reported carrying amounts of our financial assets and liabilities approximate their fair values. The reported carrying amount of long-term debt (including the current portion) was
$140.0 million
and
$146.7 million
at
December 31, 2015
and 2014, respectively. The fair value of this debt was
$145.2 million
and
$153.4 million
at December 31, 2015 and 2014, respectively. The fair value of this debt was determined by evaluating like rated companies with publicly traded bonds and recent market transactions. The fair value of this debt was determined using Level 2 inputs as described above.
Product Liability
The Company categorizes the product liability losses of its subsidiary MSA LLC into
two
main categories: single incident and cumulative trauma.
Single incident product liability claims involve discrete incidents that are typically known to us when they occur and involve observable injuries which provide an objective basis for quantifying damages. MSA LLC estimates its liability for single incident product liability claims based on expected settlement costs for reported claims and an estimate of costs for unreported claims (claims incurred but not reported or IBNR). The estimate for IBNR claims is based on experience, sales volumes, and other relevant information. The reserve for single incident product liability claims, which includes reported and IBNR claims, at
December 31, 2015
and 2014 was
$3.5 million
in each year. Single incident product liability expense during the year ended December 31, 2015 was
$0.9 million
and was not significant for the year ended December 31, 2014. Single incident product liability exposures are evaluated on an ongoing basis and adjustments are made to the reserve as appropriate.
Cumulative trauma product liability claims involve exposures to harmful substances (
e.g.
, silica, asbestos and coal dust) that occurred many years ago and may have developed over long periods of time into diseases such as silicosis, asbestosis, or coal worker’s pneumoconiosis. MSA LLC is presently named as a defendant in
1,988
lawsuits, some of which involve multiple plaintiffs, in which plaintiffs allege to have contracted certain cumulative trauma diseases. These lawsuits mainly involve respiratory protection products allegedly manufactured and sold by MSA LLC or its predecessors.
A summary of cumulative trauma product liability lawsuit activity follows:
|
2015
|
2014
|
2013
|
||||||
|
Open lawsuits, January 1
|
2,326
|
|
2,840
|
|
2,609
|
|
||
|
New lawsuits
|
340
|
|
542
|
|
489
|
|
||
|
Settled and dismissed lawsuits
|
(678
|
)
|
(1,056
|
)
|
(258
|
)
|
||
|
Open lawsuits, December 31
|
1,988
|
|
2,326
|
|
2,840
|
|
||
As reflected in the roll-forward above, during the 2014 fourth quarter and extending into January 2015, MSA LLC resolved a number of cumulative trauma cases, the vast majority of which were insured. The settlements were recorded in both the insurance and product liability line under current liabilities, and in the insurance receivable in the other non-current asset section of the consolidated balance sheet.
More than half of the open lawsuits at December 31, 2015 have had a de minimis level of activity over the last
5
years. It is possible that these cases could become active again at any point due to changes in circumstances.
70
Cumulative trauma product liability litigation has been difficult to predict. In our past experience, it has typically not been until very late in the legal process that we can reasonably determine whether it is probable that any particular case will ultimately result in a liability. This uncertainty is caused by many factors; Cumulative trauma litigation is inherently unpredictable. Complaints generally do not provide information sufficient to determine if a lawsuit will develop into an actively litigated case. Even when a case is actively litigated, it is often difficult to determine if the lawsuit will be dismissed or otherwise resolved until late in the lawsuit. Moreover, even if it is probable that such a lawsuit will result in a loss; it is often difficult to estimate the amount of actual loss that will be incurred. These actual loss amounts are highly variable and turn on a case-by-case analysis of the relevant facts, which are often not learned until late in the lawsuit. In addition, there are uncertainties concerning the impact of bankruptcies of other companies that are co-defendants in claims, uncertainties surrounding the litigation process from jurisdiction to jurisdiction and from case to case, and uncertainties regarding the impact of potential changes in legislative or judicial standards.
Consequently, MSA LLC historically has been unable to estimate its cumulative trauma product liability exposure.
In 2014, MSA LLC engaged an outside valuation consultant to assist in assessing its ability to estimate MSA LLC's cumulative trauma product liability exposure. This assessment was based on MSA LLC’s cumulative claims experience, including recent claims trends, and the development of enhanced claims data analytics. The analysis focused on claims made or resolved over the last several years as these claims are likely to best represent future claim characteristics. After review by the valuation consultant, outside legal counsel, and Management, it was determined that MSA LLC could not estimate its liability for reported or IBNR cumulative trauma product liability claims.
The cumulative product liability reserve totaled
$74.9 million
at December 31, 2014, comprising of
$35.1 million
in other non-current liabilities and the remainder recorded in the insurance and product liability line in the other current liabilities section of the consolidated balance sheet. These amounts relate to settlements that were reached in 2014 and 2015 that will be paid out in 2015 and 2016.
In 2015, Management continued to work with the outside valuation consultant and outside legal counsel to develop a method to provide a reasonable estimate for certain reported claims by using appropriate assumptions based on our unique circumstances. As a result, we've established a reserve for these reported claims that we believe represents our best estimate of potential loss at December 31, 2015.
The change in ability to estimate was driven by the maturation of MSA LLC’s defense efforts and an additional year of claims experience. Management’s claims experience has now advanced to a level that enables us to develop a reserve of potential loss. As a result, for certain reported claims, we estimated a liability of
$7.1 million
as of December 31, 2015. This amount has been added to the product liability reserve and the insurance receivable (see below). The product liability reserve for cumulative trauma totals
$50.1 million
, and is recorded in the insurance and product liability line within current liabilities in the consolidated balance sheet.
To arrive at the estimate for certain reported claims, it was necessary to employ significant assumptions. In light of these significant assumptions, and all of the uncertainties inherent in cumulative trauma product liability litigation noted above, there can be no assurance that future experience with reported claims will follow MSA LLC’s past experience. Thus, the reserve of
$7.1 million
as of December 31, 2015 should be viewed as simply an estimate of a possible outcome for those reported claims where our experience allows us to reasonably make an estimate. Actual liabilities could vary greatly and we will need to adjust the estimate from time to time based on relevant facts and circumstances. If actual experience is worse than projected, it is likely that the estimate would increase, and these increases could potentially be material over time.
The uncertainties noted above relating to our cumulative trauma product liability litigation are particularly acute in the case of IBNR claims, which by definition are potential claims that have not yet been filed. Management continues to be unable to reasonably estimate, and therefore has not recorded any liability for, MSA LLC’s cumulative trauma IBNR claims. This determination was made by Management after review with its valuation consultant and outside legal counsel.
Our aggregate cumulative trauma product liability losses and administrative and defense costs for the three years ended December 31, 2015, totaled approximately
$156.1 million
, substantially all of which was insured.
Because litigation is subject to inherent uncertainties, and unfavorable rulings or developments could occur, there can be no certainty that MSA LLC may not ultimately incur charges in excess of presently recorded liabilities. The estimate does not purport to reflect MSA LLC’s overall claims exposure for either reported claims or future claims as noted above.
71
Although it is impossible to predict the ultimate outcome of current open claims, based on current information, our experience in handling these matters, and our substantial insurance program, we do not believe that the resolution of these claims will have a material adverse effect on our future financial condition or liquidity.
On February 26, 2016, a Kentucky state court jury in the James Couch claim rendered a verdict against subsidiary MSA LLC of
$7.2 million
dollars. Judgment has not yet been entered on the verdict. The Company is currently evaluating all available legal options. Outside legal counsel advises that the Company has strong grounds to appeal this decision.
Insurance Receivable
With some common contract exclusions, we maintain insurance for cumulative trauma product liability claims. We have purchased insurance policies for the policy years from 1952-1986 from over
20
different insurance carriers that provide coverage for cumulative trauma product liability losses and, in many instances, related defense costs (the "Occurrence-Based Policies"). The available limits of these policies exceed the recorded insurance receivable balance. After 1986, the Company’s insurance policies have significant per claim deductibles. Based on this, the Company does not expect to be materially reimbursed for any claims alleging exposures that occurred entirely after this date.
In the normal course of business, we make payments to settle product liability claims and for related defense costs. We record receivables for the amounts that are covered by insurance. Since December 31, 2014, the insurance receivable has increased by
$9.0 million
as a result of the above noted settlements and related defense costs.
Various factors could affect the timing and amount of recovery of the insurance receivable, including the outcome of negotiations with insurers, legal proceedings with respect to product liability insurance coverage and the extent to which insurers may become insolvent in the future.
Insurance receivables at
December 31, 2015
totaled
$229.5 million
, of which
$2.0 million
is reported in other current assets and
$227.5 million
in other non-current assets. Insurance receivables at December 31, 2014 totaled
$220.5 million
, of which
$2.0 million
is reported in other current assets and
$218.5 million
in other non-current assets.
A summary of insurance receivable balances and activity related to cumulative trauma product liability losses follows:
|
(In millions)
|
2015
|
2014
|
2013
|
||||||||
|
Balance January 1
|
$
|
220.5
|
|
$
|
124.8
|
|
$
|
130.0
|
|
||
|
Additions
|
17.3
|
|
98.2
|
|
34.0
|
|
|||||
|
Collections and settlements
|
(8.3
|
)
|
(2.5
|
)
|
(39.2
|
)
|
|||||
|
Balance December 31
|
$
|
229.5
|
|
$
|
220.5
|
|
$
|
124.8
|
|
||
Additions to insurance receivables in the above table represent insured cumulative trauma product liability losses and related defense costs. Uninsured cumulative trauma product liability losses during the year ended
December 31, 2015
,
2014
, and
2013
were
$1.0 million
,
$3.9 million
and
$1.7 million
, respectively. Collections primarily represent agreements with insurance companies to pay amounts due that are applicable to cumulative trauma claims. When there are contingencies embedded in these agreements, we apply payments to the insurance receivable in the period when the contingency is met. In cases where the payment stream covers multiple years and there are no contingencies, the present value of the payments is recorded as a note receivable (current and long-term) in the balance sheet within prepaid expenses and other current assets and other noncurrent assets.
MSA LLC believes that the increase in its insurance receivable balance that it has experienced since 2005 is primarily due to disagreements among its insurance carriers, and consequently with MSA LLC, as to when the individual obligations of insurance carriers to pay are triggered and the amount of each insurer’s obligation, as compared to other insurers. MSA LLC believes that its insurers do not contest that they have issued policies to our subsidiaries or that these policies cover cumulative trauma product liability claims. We believe that successful resolution of insurance litigation with various insurance carriers in recent years demonstrates that we have strong legal positions concerning MSA LLC's rights to coverage.
The collectability of MSA LLC's insurance receivables is regularly evaluated and we believe that the amounts recorded are probable of collection. These conclusions are based on analysis of the terms of the underlying insurance policies, experience in successfully recovering cumulative trauma product liability claims from our insurers under other policies, the financial ability of the insurance carriers to pay the claims, understanding and interpretation of the relevant facts and applicable law and the advice of MSA LLC's outside legal counsel.
72
Insurance Litigation
MSA LLC is currently involved in insurance coverage litigation with a number of our insurance carriers regarding its Occurrence-Based Policies.
In 2009, MSA LLC (as Mine Safety Appliances Company) sued The North River Insurance Company (North River) in the United States District Court for the Western District of Pennsylvania, alleging that North River breached one of its insurance policies by failing to pay amounts owed to MSA LLC and that it engaged in bad-faith claims handling. MSA LLC believes that North River’s refusal to indemnify it under the policy for product liability losses and legal fees paid by MSA LLC is wholly contrary to Pennsylvania law and MSA LLC is vigorously pursuing the legal actions necessary to collect all due amounts. A trial date has not yet been scheduled.
In 2010, North River sued MSA LLC (as Mine Safety Appliances Company) in the Court of Common Pleas of Allegheny County, Pennsylvania seeking a declaratory judgment concerning their responsibilities under three additional policies. MSA LLC asserted claims against North River for breaches of contract for failures to pay amounts owed to MSA LLC. MSA LLC also alleges that North River engaged in bad-faith claims handling. MSA LLC believes that North River’s refusal to indemnify us under these policies for product liability losses and legal fees paid by MSA LLC is wholly contrary to Pennsylvania law and MSA LLC is vigorously pursuing the legal actions necessary to collect all due amounts. Trial is currently scheduled for September 2016.
In July 2010, MSA LLC (as Mine Safety Appliances Company) filed a lawsuit in the Superior Court of the State of Delaware seeking declaratory and other relief from the majority of its excess insurance carriers concerning the future rights and obligations of MSA LLC and its excess insurance carriers under various insurance policies. The reason for this insurance coverage action is to secure a comprehensive resolution of its rights under the insurance policies issued by the insurers. Trial is currently scheduled for May 2016.
MSA LLC has resolved claims against certain of its insurance carriers on some of their policies, including the Occurrence-Based Policies through negotiated settlements. When a settlement is reached, MSA LLC dismisses the settling carrier from relevant above noted lawsuit(s). Assuming satisfactory resolution, once disputes are resolved with each of the remaining carriers responsible for the Occurrence-Based Policies, MSA LLC anticipates having commitments to provide future payment streams which should be sufficient to satisfy its recorded receivables due from insurance carriers. In addition, MSA LLC likely will retain some coverage through coverage-in-place agreements, although that coverage may not be immediately accessible. When these insurance coverage matters are fully resolved, MSA LLC (and its coverage-in-place carriers, where applicable) will be responsible for expenses related to cumulative trauma product liability claims.
Discontinued Operations -
As of December 31, 2015, the Company was actively negotiating the sale of substantially all of the assets and liabilities of its South African personal protective equipment distribution business and its Zambian operations with a potential acquirer. The transaction closed on February 29, 2016. The Company received
$15.9 million
from the closing of this transaction. The impact of the sale is not significant to net income or earnings per share. The operations of this business qualify as a component of an entity under FASB ASC 205-20 "Presentation of Financial Statements - Discontinued Operations", and thus the operations have been reclassified as discontinued operations and prior periods have been reclassified to conform to this presentation.
73
Summarized financial information for discontinued operations is as follows:
|
Year ended December 31,
|
|||||||||||
|
(In thousands)
|
2015
|
2014
|
2013
|
||||||||
|
Discontinued Operations
|
|||||||||||
|
Net sales
|
$
|
43,043
|
|
$
|
47,516
|
|
$
|
52,692
|
|
||
|
Other income, net
|
580
|
|
660
|
|
40
|
|
|||||
|
Cost and expenses:
|
|||||||||||
|
Cost of products sold
|
34,764
|
|
38,259
|
|
41,181
|
|
|||||
|
Selling, general and administrative
|
6,680
|
|
7,650
|
|
7,389
|
|
|||||
|
Restructuring and other charges
|
14
|
|
—
|
|
—
|
|
|||||
|
Currency exchange losses (gains), net
|
266
|
|
(116
|
)
|
(325
|
)
|
|||||
|
Income from discontinued operations before income taxes
|
1,899
|
|
2,383
|
|
4,487
|
|
|||||
|
Provision for income taxes
|
574
|
|
607
|
|
1,426
|
|
|||||
|
Income from discontinued operations, net of tax
|
1,325
|
|
1,776
|
|
3,061
|
|
|||||
The following assets and liabilities are included in the balance sheet line items noted below and are included in the International Segment detail in Note 7.
|
December 31,
|
|||||||
|
(In thousands)
|
2015
|
2014
|
|||||
|
Discontinued Operations assets and liabilities
|
|||||||
|
Trade receivables, less allowance for doubtful accounts
|
$
|
4,832
|
|
$
|
6,638
|
|
|
|
Inventories
|
8,499
|
|
11,829
|
|
|||
|
Net property
|
449
|
|
342
|
|
|||
|
Other assets
|
791
|
|
2,022
|
|
|||
|
Total assets
|
14,571
|
|
20,831
|
|
|||
|
Accounts payable
|
2,745
|
|
5,263
|
|
|||
|
Accrued and other liabilities
|
748
|
|
991
|
|
|||
|
Total liabilities
|
3,493
|
|
6,254
|
|
|||
|
Net assets
|
11,078
|
|
14,577
|
|
|||
The following summary provides financial information for discontinued operations related to net loss (income) related to noncontrolling interests:
|
Year ended December 31,
|
|||||||||||
|
(In thousands)
|
2015
|
2014
|
2013
|
||||||||
|
Net loss (income) attributable to noncontrolling interests
|
|||||||||||
|
Loss from continuing operations
|
$
|
2,971
|
|
$
|
1,296
|
|
$
|
870
|
|
||
|
Loss (income) from discontinued operations
|
(108
|
)
|
(717
|
)
|
(672
|
)
|
|||||
|
Net loss
|
2,863
|
|
579
|
|
198
|
|
|||||
74
|
2015
|
|||||||||||||||||||
|
Quarters
|
Year
|
||||||||||||||||||
|
(In thousands, except earnings per share)
|
1st
|
2nd
|
3rd
|
4th
|
|||||||||||||||
|
Continuing Operations:
|
|||||||||||||||||||
|
Net sales
|
$
|
256,708
|
|
$
|
287,011
|
|
$
|
273,746
|
|
$
|
313,318
|
|
$
|
1,130,783
|
|
||||
|
Gross profit
|
116,823
|
|
130,489
|
|
119,781
|
|
134,010
|
|
501,103
|
|
|||||||||
|
Net income attributable to MSA Safety Incorporated
|
9,316
|
|
23,722
|
|
15,712
|
|
20,840
|
|
69,590
|
|
|||||||||
|
Earnings per share*
|
|||||||||||||||||||
|
Basic
|
0.25
|
|
0.63
|
|
0.42
|
|
0.56
|
|
1.86
|
|
|||||||||
|
Diluted
|
0.25
|
|
0.62
|
|
0.41
|
|
0.55
|
|
1.84
|
|
|||||||||
|
Discontinued Operations:
|
|||||||||||||||||||
|
Net sales
|
11,157
|
|
11,384
|
|
11,648
|
|
8,854
|
|
43,043
|
|
|||||||||
|
Gross profit
|
2,167
|
|
2,326
|
|
2,170
|
|
1,616
|
|
8,279
|
|
|||||||||
|
Net income attributable to MSA Safety Incorporated
|
366
|
|
576
|
|
264
|
|
11
|
|
1,217
|
|
|||||||||
|
Earnings per share*
|
|||||||||||||||||||
|
Basic
|
0.01
|
|
0.02
|
|
0.01
|
|
—
|
|
0.03
|
|
|||||||||
|
Diluted
|
0.01
|
|
0.01
|
|
0.01
|
|
—
|
|
0.03
|
|
|||||||||
|
2014
|
|||||||||||||||||||
|
Quarters
|
Year
|
||||||||||||||||||
|
(In thousands, except earnings per share)
|
1st
|
2nd
|
3rd
|
4th
|
|||||||||||||||
|
Continuing Operations:
|
|||||||||||||||||||
|
Net sales
|
$
|
265,045
|
|
$
|
282,493
|
|
$
|
275,159
|
|
$
|
311,188
|
|
$
|
1,133,885
|
|
||||
|
Gross profit
|
121,815
|
|
129,670
|
|
123,723
|
|
140,141
|
|
515,349
|
|
|||||||||
|
Net income attributable to MSA Safety Incorporated
|
13,522
|
|
22,132
|
|
18,674
|
|
33,119
|
|
87,447
|
|
|||||||||
|
Earnings per share*
|
|||||||||||||||||||
|
Basic
|
0.37
|
|
0.59
|
|
0.50
|
|
0.88
|
|
2.34
|
|
|||||||||
|
Diluted
|
0.36
|
|
0.58
|
|
0.49
|
|
0.87
|
|
2.30
|
|
|||||||||
|
Discontinued Operations:
|
|||||||||||||||||||
|
Net sales
|
10,060
|
|
10,589
|
|
14,645
|
|
12,222
|
|
47,516
|
|
|||||||||
|
Gross profit
|
2,363
|
|
2,134
|
|
2,638
|
|
2,122
|
|
9,257
|
|
|||||||||
|
Net income attributable to MSA Safety Incorporated
|
504
|
|
356
|
|
631
|
|
(432
|
)
|
1,059
|
|
|||||||||
|
Earnings (loss) per share*
|
|||||||||||||||||||
|
Basic
|
0.01
|
|
0.01
|
|
0.02
|
|
(0.01
|
)
|
0.03
|
|
|||||||||
|
Diluted
|
0.01
|
|
0.01
|
|
0.02
|
|
(0.01
|
)
|
0.03
|
|
|||||||||
* Per share amounts are calculated independently for each period presented; therefore, the sum of the quarterly per share amounts may not equal the per share amounts for the year.
None.
75
(a)
Evaluation of disclosure controls and procedures
. Based on their evaluation as of the end of the period covered by this Form 10-K, the Company’s principal executive officer and principal financial officer have concluded that the Company’s disclosure controls and procedures (as defined in Rules 13a-15(e) and 15d-15(e) under the Securities Exchange Act of 1934 (the “Exchange Act”)) are effective to ensure that information required to be disclosed by the Company in reports that it files or submits under the Exchange Act is (i) recorded, processed, summarized and reported within the time periods specified in Securities and Exchange Commission rules and forms and (ii) accumulated and communicated to our management, including the principal executive officer and principle financial officer, as appropriate to allow timely decisions regarding required disclosure.
Management has excluded Latchways from its assessment of internal control over financial reporting as of December 31, 2015 because it was acquired by the Company in a purchase business combination during the fourth quarter of 2015. Latchways and its affiliates are wholly-owned by MSA.
(b)
Changes in internal control
. There were no changes in the Company’s internal control over financial reporting that occurred during the Company’s most recent fiscal quarter, other than the Latchways acquisition, that have materially affected, or are reasonably likely to materially affect, the Company’s internal control over financial reporting.
See Item 8. Financial Statements and Supplementary Data—“Management’s Report on Internal Control Over Financial Reporting” and “Report of Independent Registered Public Accounting Firm.”
None.
76
With respect to this Part III, incorporated by reference herein pursuant to Rule 12b—23 are (1) “Election of Directors,” (2) “Executive Compensation,” (3) “Other Information Concerning the Board of Directors,” (4) “Stock Ownership,” and (5) “Selection of Independent Registered Public Accounting Firm,” appearing in the Proxy Statement filed pursuant to Regulation 14A in connection with the registrant’s Annual Meeting of Shareholders to be held on May 10, 2016. The information appearing in such Proxy Statement under the caption “Audit Committee Report” and the other information appearing in such Proxy Statement and not specifically incorporated by reference herein is not incorporated herein. As to Item 10 above, also see the information reported in Part I of this Form 10-K, under the caption “Executive Officers of the Registrant,” which is incorporated herein by reference. As to Item 10 above, the Company has adopted a Code of Ethics applicable to its principal executive officer, principal financial officer and principal accounting officer and other Company officials. The text of the Code of Ethics is available on the Company’s website at
www.MSAsafety.com
. Any amendment to, or waiver of, a required provision of the Code of Ethics that applies to the Company’s principal executive, financial or accounting officer will also be posted on the Company’s Internet site at that address.
As to Item 12 above, the following table sets forth information as of December 31, 2015 concerning common stock issuable under the Company’s equity compensation plans.
|
Plan Category
|
Number of securities
to be issued upon
exercise of
outstanding
options,
warrants and rights
(a)
|
Weighted average
exercise price of outstanding options, warrants and rights (b) |
Number of securities
remaining available for future issuance under equity compensation plans (excluding securities reflected in column (a)) (c) |
||||||
|
Equity compensation plans approved by security holders
|
1,694,675
|
|
$
|
36.69
|
|
1,332,940*
|
|
||
|
Equity compensation plans not approved by security holders
|
None
|
|
—
|
|
None
|
|
|||
|
Total
|
1,694,675
|
|
36.69
|
|
1,332,940
|
|
|||
*
Includes 1,178,625 shares available for issuance under the 2008 Management Equity Incentive Plan and 154,315 shares available for issuance under the 2008 Non-Employee Directors’ Equity Incentive Plan.
77
(a) 1. Financial Statements and Report of Independent Registered Public Accounting Firm (see Part II, Item 8 of this Form 10-K).
The following information is filed as part of this Form 10-K.
|
|
Page
|
(a) 2. The following additional financial information for the three years ended December 31, 2015 is filed with the report and should be read in conjunction with the above financial statements:
Schedule II—Valuation and Qualifying Accounts
All other schedules are omitted because they are not applicable, not material or the required information is shown in the consolidated financial statements and consolidated notes to the financial statements listed above.
(a) 3. Exhibits
Several of the following exhibits are incorporated herein by reference under Rule 12b-32 of the Securities Exchange Act of 1934, as amended, as indicated next to the name of the exhibit. Several other instruments, which would otherwise be required to be listed below, have not been so listed because those instruments do not authorize securities in an amount that exceeds 10% of the total assets of the registrant and its subsidiaries on a consolidated basis. The registrant agrees to furnish a copy of any instrument that was so omitted on that basis to the Commission upon request.
|
3(i)
|
Amended and restated Articles of Incorporation, filed as Exhibit 3.1 to Form 8-K on March 7, 2014, is incorporated herein by reference.
|
|
3(ii)
|
Amended and restated By-laws of the registrant, filed as Exhibit 3.2 to Form 8-K on March 7, 2014, is incorporated herein by reference.
|
|
4(a)
|
Second Amended and Restated Note Purchase and Private Shelf Agreement dated January 22, 2016 by and among MSA Safety Incorporated, Mine Safety Appliances Company, LLC, and the Purchasers named therein, filed as Exhibit 4.1 to the January 28, 2016 Form 8-K, is incorporated herein by reference.
|
|
4(b)
|
Form of Amended and Restated Guarantee Agreement entered into as of March 7, 2014 by each of General Monitors, Inc., General Monitors Transnational, LLC and MSA International, Inc., in favor of the Note Purchasers under the Amended and Restated Note Purchase and Private Shelf Agreement dated as of March 7, 2014 (as confirmed and reaffirmed by such guarantors as of January 22, 2016), filed as Exhibit 4(b) to Form 10-K on February 25, 2015, is incorporated herein by reference.
|
|
4(c)
|
Form of Amended and Restated Guarantee Agreement entered into as of March 7, 2014 by each of General Monitors, Inc., General Monitors Transnational, LLC and MSA International, Inc., in favor of the Note Purchasers under the Amended and Restated Note Purchase and Private Shelf Agreement dated as of March 7, 2014 (as confirmed and reaffirmed by such guarantors as of January 22, 2016), filed as Exhibit 4(c) to Form 10-K on February 25, 2015, is incorporated herein by reference.
|
78
|
10(a)*
|
MSA Safety Incorporated 2008 Management Equity Incentive Plan, as amended, filed as Exhibit 10.2 to Form 8-K on March 7, 2014 is incorporated herein by reference.
|
|
10(b)*
|
Retirement Plan for Directors, as amended effective April 1, 2001, filed as Exhibit 10(a) to Form 10-Q on May 10, 2006, is incorporated herein by reference.
|
|
10(c)*
|
Supplemental Pension Plan as of May 5, 1998, filed as Exhibit 10(d) to Form 10-Q on August 12, 2003, is incorporated herein by reference.
|
|
10(d)*
|
Supplemental Pension Plan as amended and restated effective January 1, 2005, filed as Exhibit 10.3 to Form 10-Q on November 27, 2013, is incorporated herein by reference.
|
|
10(e)*
|
2008 Non-Employee Directors’ Equity Incentive Plan, as amended through November 27, 2013, filed as Exhibit 10(e) to Form 10-K on February 24, 2014, is incorporated herein by reference.
|
|
10(f)*
|
Executive Insurance Program as Amended and Restated as of January 1, 2006, filed as Exhibit 10(a) to Form 10-Q on August 7, 2007, is incorporated herein by reference.
|
|
10(g)*
|
Annual Incentive Bonus Plan as of May 5, 1998, filed as Exhibit 10(g) to Form 10-Q on August 12, 2003, is incorporated herein by reference.
|
|
10(h)*
|
Supplemental Executive Retirement Plan, effective January 1, 2008, filed as Exhibit 10.2 to Form 10-Q on April 30, 2009, is incorporated herein by reference.
|
|
10(i)*
|
Form of Change-in-Control Severance Agreement between the registrant and its executive officers, filed as Exhibit 10.1 to Form 10-Q on April 30, 2009, is incorporated herein by reference.
|
|
10(j)*
|
2003 Supplemental Savings Plan, effective January 1, 2003, filed as Exhibit 10(k) to Form 10-K on February 24, 2014, is incorporated herein by reference.
|
|
10(k)*
|
2005 Supplemental Savings Plan, effective January 1, 2005, filed as Exhibit 10.4 to Form 10-Q on April 30, 2009, is incorporated herein by reference.
|
|
10(l)*
|
CEO Annual Incentive Award Plan filed as Appendix A to the registrant’s definitive proxy statement dated March 29, 2005, is incorporated herein by reference.
|
|
10(m)
|
Second Amended and Restated Credit Agreement dated as of December 9, 2015 by and among MSA Safety Incorporated, the guarantors party thereto, the lenders party thereto, and PNC Bank, National Association, as administrative agent for the lenders, filed as Exhibit 10.1 to Form 8-K on December 11, 2015, is incorporated herein by reference.
|
|
16
|
Letter of PricewaterhouseCoopers LLP, dated November 24, 2014, regarding change in independent registered public accounting firm, filed as of Exhibit 16.1 to Form 8-K filed on November 24, 2014, is incorporated herein by reference.
|
|
21
|
Affiliates of the registrant is filed herewith.
|
|
23.1
|
Consent of Ernst & Young LLP, independent registered public accounting firm is filed herewith.
|
|
23.2
|
Consent of PricewaterhouseCoopers LLP, independent registered public accounting firm is filed herewith.
|
|
31.1
|
Certification of William M. Lambert pursuant to Rule 13a-14(a) is filed herewith.
|
|
31.2
|
Certification of Kenneth D. Krause pursuant to Rule 13a-14(a) is filed herewith.
|
|
32
|
Certification of Chief Executive Officer and Chief Financial Officer pursuant to 18 U.S.C.(S)1350 is filed herewith.
|
|
101.INS
|
XBRL Instance Document
|
|
101.SCH
|
XBRL Taxonomy Extension Schema Document
|
|
101.CAL
|
XBRL Taxonomy Extension Calculation Linkbase Document
|
|
101.DEF
|
XBRL Taxonomy Extension Definition Linkbase Document
|
|
101.LAB
|
XBRL Taxonomy Extension Label Linkbase Document
|
|
101.PRE
|
XBRL Taxonomy Extension Presentation Linkbase Document
|
*
The exhibits marked by an asterisk are management contracts or compensatory plans or arrangements.
79
SIGNATURES
Pursuant to the requirements of Section 13 or 15(d) of the Securities Exchange Act of 1934, the registrant has duly caused this report to be signed on its behalf by the undersigned, thereunto duly authorized.
|
MSA SAFETY INCORPORATED
|
||
|
February 29, 2016
|
By
|
/
S
/ W
ILLIAM
M. L
AMBERT
|
|
(Date)
|
William M. Lambert
Chairman, President and
Chief Executive Officer
|
|
Pursuant to the requirements of the Securities Exchange Act of 1934, this report has been signed below by the following persons on behalf of the registrant and in the capacities and on the dates indicated.
|
Signature
|
Title
|
Date
|
|
/
S
/ W
ILLIAM
M. L
AMBERT
William M. Lambert
|
Chairman, President and Chief Executive Officer
|
February 29, 2016
|
|
/
S
/ K
ENNETH
D. K
RAUSE
Kenneth D. Krause
|
Vice President, Chief Financial Officer and Treasurer
|
February 29, 2016
|
|
/
S
/ R
ANDALL
J. K
ILLEEN
Randall J. Killeen
|
Controller and Chief Accounting Officer
|
February 29, 2016
|
|
/
S
/ R
OBERT
A. B
RUGGEWORTH
Robert A. Bruggeworth
|
Director
|
February 29, 2016
|
|
/
S
/ A
LVARO
G
ARCIA
-T
UNON
Alvaro Garcia-Tunon
|
Director
|
February 29, 2016
|
|
/
S
/ T
HOMAS
B. H
OTOPP
Thomas B. Hotopp
|
Director
|
February 29, 2016
|
|
/
S
/ D
IANE
M. P
EARSE
Diane M. Pearse
|
Director
|
February 29, 2016
|
|
/
S
/ R
EBECCA
B. R
OBERTS
Rebecca B. Roberts
|
Director
|
February 29, 2016
|
|
/
S
/ J
OHN
T. R
YAN
III
John T. Ryan III
|
Director
|
February 29, 2016
|
|
/
S
/ L. E
DWARD
S
HAW
, J
R
.
L. Edward Shaw, Jr.
|
Director
|
February 29, 2016
|
|
/
S
/ T
HOMAS
H. W
ITMER
Thomas H. Witmer
|
Director
|
February 29, 2016
|
80
SCHEDULE II
MSA SAFETY INCORPORATED AND AFFILIATES
VALUATION AND QUALIFYING ACCOUNTS
THREE YEARS ENDED DECEMBER 31, 2015
|
2015
|
2014
|
2013
|
|||||||||
|
(In thousands)
|
|||||||||||
|
Allowance for doubtful accounts:
|
|||||||||||
|
Balance at beginning of year
|
$
|
7,821
|
|
$
|
7,306
|
|
$
|
7,402
|
|
||
|
Additions—
|
|||||||||||
|
Charged to costs and expenses
|
1,676
|
|
1,249
|
|
763
|
|
|||||
|
Deductions—
|
|||||||||||
|
Deductions from reserves, net (1)(2)
|
1,308
|
|
734
|
|
859
|
|
|||||
|
Balance at end of year
|
8,189
|
|
7,821
|
|
7,306
|
|
|||||
|
Income tax valuation allowance:
|
|||||||||||
|
Balance at beginning of year
|
$
|
3,763
|
|
$
|
4,938
|
|
$
|
3,961
|
|
||
|
Additions—
|
|||||||||||
|
Charged to costs and expenses (3)
|
1,390
|
|
—
|
|
977
|
|
|||||
|
Deductions—
|
|||||||||||
|
Deductions from reserves (3)
|
—
|
|
1,175
|
|
—
|
|
|||||
|
Balance at end of year
|
5,153
|
|
3,763
|
|
4,938
|
|
|||||
|
(1)
|
Bad debts written off, net of recoveries.
|
|
(2)
|
Activity for 2015, 2014 and 2013 includes currency translation (losses) of
$(535)
,
$(332)
and
$(121)
, respectively.
|
|
(3)
|
Activity for 2015, 2014 and 2013 includes currency translation gains (losses) of
$392
,
$(643)
and
$242
, respectively.
|
81
TABLE OF CONTENTS
Part IItem 1. BusinessItem 1A. Risk FactorsItem 1B. Unresolved Staff CommentsItem 2. PropertiesItem 3. Legal ProceedingsItem 4. Mine Safety DisclosuresPart IIItem 5. Market For The Registrant S Common Equity, Related Stockholder Matters and Issuer Purchases Of Equity SecuritiesItem 6. Selected Financial DataItem 7. Management S Discussion and Analysis Of Financial Condition and Results Of OperationsItem 7A. Quantitative and Qualitative Disclosures About Market RiskItem 8. Financial Statements and Supplementary DataNote 1 Significant Accounting PoliciesNote 2 Restructuring and Other ChargesNote 3 InventoriesNote 4 Property, Plant, and EquipmentNote 5 Reclassifications Out Of Accumulated Other Comprehensive LossNote 6 Capital StockNote 7 Segment InformationNote 8 Earnings Per ShareNote 9 Income TaxesNote 10 Stock PlansNote 11 Short and Long-term DebtNote 12 Goodwill and Intangible AssetsNote 13 AcquisitionsNote 14 Pensions and Other Post-retirement BenefitsNote 15 Other Income (loss), NetNote 16 LeasesNote 17 Derivative Financial InstrumentsNote 18 Fair Value MeasurementsNote 19 ContingenciesNote 20 Discontinued OperationsNote 21 Quarterly Financial Information (unaudited)Item 9. Changes in and Disagreements with Accountants on Accounting and Financial DisclosureItem 9A. Controls and ProceduresItem 9B. Other InformationPart IIIItem 10. Directors, Executive Officers and Corporate GovernanceItem 11. Executive CompensationItem 12. Security Ownership Of Certain Beneficial Owners and Management and Related Stockholder MattersItem 13. Certain Relationships and Related Transactions, and Director IndependenceItem 14. Principal Accountant Fees and ServicesPart IVItem 15. Exhibits and Financial Statement Schedules