MOTOROLA SOLUTIONS, INC.
10-Ks and 10-Qs
|
|
|
|
|
|
|
|
|
|
|
|
|
|
|
|
|
|
|
|
|
|
|
|
|
|
|
|
|
|
|
|
|
|
|
|
|
|
|
|
|
|
|
|
|
|
|
|
|
|
|
|
|
|
|
|
|
|
|
UNITED STATES
SECURITIES AND EXCHANGE COMMISSION
Washington, D.C. 20549
_____________________________
FORM 10-K
_____________________________
|
ý
|
ANNUAL REPORT PURSUANT TO SECTION 13 OR 15(d) OF THE SECURITIES EXCHANGE ACT OF 1934
|
For the fiscal year ended
December 31, 2015
or
|
¨
|
TRANSITION REPORT PURSUANT TO SECTION 13 OR 15(d) OF THE SECURITIES EXCHANGE ACT OF 1934
|
For the transition period from to
Commission File number 1-7221
_____________________________
MOTOROLA SOLUTIONS, INC.
(Exact name of registrant as specified in its charter)
_____________________________
|
DELAWARE
|
36-1115800
|
|
|
(State of Incorporation)
|
(I.R.S. Employer Identification No.)
|
|
1303 East Algonquin Road, Schaumburg, Illinois 60196
(Address of principal executive offices)
(847) 576-5000
(Registrant’s telephone number)
Securities registered pursuant to Section 12(b) of the Act:
|
Title of Each Class
|
Name of Each Exchange on Which Registered
|
|
|
Common Stock, $.01 Par Value per Share
|
New York Stock Exchange
|
|
Securities registered pursuant to Section 12(g) of the Act:
None
_____________________________
Indicate by check mark if the registrant is a well-known seasoned issuer, as defined in Rule 405 of the Securities Act. Yes
ý
No
¨
Indicate by check mark if the registrant is not required to file reports pursuant to Section 13 or 15(d) of the Securities Exchange Act of 1934. Yes
¨
No
ý
Indicate by check mark whether the registrant (1) has filed all reports required to be filed by Section 13 or 15(d) of the Securities Exchange Act of 1934 during the preceding 12 months (or for such shorter period that the registrant was required to file such reports), and (2) has been subject to such filing requirements for the past 90 days. Yes
ý
No
¨
Indicate by check mark whether the registrant has submitted electronically and posted on its corporate Web site, if any, every Interactive Data File required to be submitted and posted pursuant to Rule 405 of Regulation S-T during the preceding 12 months (or for such shorter period that the registrant was required to submit and post such files). Yes
ý
No
¨
Indicate by check mark if disclosure of delinquent filers pursuant to Item 405 of Regulation S-K is not contained herein, and will not be contained, to the best of registrant’s knowledge, in definitive proxy or information statements incorporated by reference in Part III of this Form 10-K or any amendment to this Form 10-K.
ý
Indicate by check mark whether the registrant is a large accelerated filer, an accelerated filer, a non-accelerated filer, or a smaller reporting company. See the definitions of “large accelerated filer,” “accelerated filer” and “smaller reporting company” in Rule 12b-2 of the Exchange Act. (Check one):
|
Large accelerated filer
x
|
Accelerated filer
¨
|
Non-accelerated filer
¨
|
Smaller reporting company
¨
|
|||
|
(Do not check if a smaller reporting company)
|
||||||
Indicate by check mark whether the registrant is a shell company (as defined in Rule 12b-2 of the Exchange Act). Yes
¨
No
ý
The aggregate market value of voting and non-voting common equity held by non-affiliates of the registrant as of
July 2, 2015
(the last business day of the Registrant’s most recently completed second quarter) was approximately
$10.8 billion
.
The number of shares of the registrant’s Common Stock, $.01 par value per share, outstanding as of February 1,
2016
was
174,337,851
.
DOCUMENTS INCORPORATED BY REFERENCE
Portions of the registrant’s definitive Proxy Statement to be delivered to stockholders in connection with its Annual Meeting of Stockholders to be held on
May 16, 2016
, are incorporated by reference into Part III.
1
|
|
Page
|
|
General
|
|
|
Business Organization
|
|
|
Strategy and Focus Areas
|
|
|
Customers and Contracts
|
|
|
Competition
|
|
|
Inventory and Raw Materials
|
|
|
Environmental Quality
and Regulatory Matters
|
|
|
Material Dispositions
|
|
2
Throughout this 10-K report we “incorporate by reference” certain information in parts of other documents filed with the Securities and Exchange Commission (the “SEC”). The SEC allows us to disclose important information by referring to it in that manner. Please refer to such information.
We are making forward-looking statements in this report. In “Item 1A: Risk Factors” we discuss some of the risk factors that could cause actual results to differ materially from those stated in the forward-looking statements.
“Motorola Solutions” (which may be referred to as the “Company,” “we,” “us,” or “our”) means Motorola Solutions, Inc. or Motorola Solutions, Inc. and its subsidiaries, or one of our segments, as the context requires. MOTOROLA, MOTO, MOTOROLA SOLUTIONS and the Stylized M Logo, as well as iDEN are trademarks or registered trademarks of Motorola Trademark Holdings, LLC and are used under license.
General
We are a leading global provider of mission-critical communication infrastructure, devices, accessories, software and services. Our products and services help government, public safety, and commercial customers improve their operations through increased effectiveness, efficiency, and safety of their mobile workforces. We serve our customers with a global footprint of sales in more than 100 countries based on our industry leading innovation and a deep portfolio of products and services.
We are incorporated under the laws of the State of Delaware as the successor to an Illinois corporation, Motorola, Inc., organized in 1928. We changed our name from Motorola, Inc. to Motorola Solutions, Inc. on January 4, 2011. Our principal executive offices are located at 1303 East Algonquin Road, Schaumburg, Illinois 60196.
Business Organization
We conduct our business globally and manage it through two segments: Products and Services.
Products Segment
The Products segment offers an extensive portfolio of infrastructure, devices, accessories, and software. The primary customers of the Products segment are government, public safety and first-responder agencies, municipalities, and commercial and industrial customers who operate private communications networks and manage a mobile workforce. In
2015
, the segment’s net sales were
$3.7 billion
, representing
65%
of our consolidated net sales. The Products segment has the following two principal product lines:
Devices:
Devices includes: (i) two-way portable radios and vehicle-mounted radios, (ii) accessories such as speaker microphones, batteries, earpieces, headsets, carry cases and cables, and (iii) software features and upgrades. Devices represented
72%
of the net sales of the Products segment in
2015
.
Systems:
Systems includes: (i) the radio network core and central processing software, (ii) base stations, (iii) consoles, (iv) repeaters, and (v) software applications and features. Systems represented
28%
of the net sales of the Products segment in
2015
.
Our Devices and Systems are based on the following industry technology standards:
|
Industry standard definition
|
The Association of Public Safety Communications Officials
Project 25 standard ("APCO-25") |
The European Telecommunications Standards Institute (“ETSI”)
Terrestrial Trunked Radio standard ("TETRA") |
ETSI, Digital mobile radio ("DMR") and professional commercial radio ("PCR") standards
|
|
Industry standard name
|
APCO P25
|
TETRA
|
DMR
|
|
Motorola Solutions product name
|
ASTRO
|
Dimetra IP
|
PCR MOTOTRBO (Digital)
|
|
Primary end users
|
Government, Public Safety
|
Government, Public Safety
|
Commercial
|
|
Primary geographic region of use
|
North America, Latin America, Asia, Middle East, Africa
|
Europe, Asia, Latin America, Middle East, Africa
|
All regions
|
3
Services Segment
The Services segment provides a full set of service offerings for government, public safety, and commercial communication networks. In
2015
, the segment’s net sales were
$2.0 billion
, representing
35%
of our consolidated net sales. The Services segment has the following principal product lines:
|
Integration services
|
Integration services includes the implementation, optimization, and integration of systems, devices, software, and applications. Integration services represented 45% of the net sales of the Services segment in 2015.
|
|
Managed & Support services
|
Managed & Support services includes a continuum of service offerings beginning with repair, technical support, and hardware maintenance. More advanced offerings include network monitoring, software maintenance, and cyber security services. Managed service offerings range from partial or full operation of customer owned networks to operation of Motorola Solutions owned networks. Services are provided across all radio network technologies, Command Center Consoles, and Smart Public Safety Solutions. Managed & Support services represented 52% of the net sales of the Services segment in 2015.
|
|
iDEN services
|
Integrated Digital Enhanced Network (“iDEN”) is a Motorola Solutions proprietary push-to-talk technology. iDEN services consist primarily of hardware and software maintenance services for our legacy iDEN customers and represented 3% of the net sales of the Services segment in 2015.
|
Strategy and Focus Areas
Our strategy is to partner with our customers to enable them to efficiently deliver reliable services through our innovative products and best-in-class services. We have a history of delivering these products and services by focusing on the following areas:
|
•
|
Building technology that improves productivity and safety;
|
|
•
|
Driving innovation and thought leadership;
|
|
•
|
Ensuring security and resiliency;
|
|
•
|
Providing ongoing support for customer investments; and
|
|
•
|
Delivering complete solutions, comprised of infrastructure, devices, system software and applications, and services to solve complex communication needs.
|
This focus provides us with the leadership position we have in our core products. We define our core products as our standards-based voice and data communication devices and systems and the related Integration and Managed & Support services. We expect to demonstrate strong results from our core products and services through: (i) leading the ongoing global migration to digital products, (ii) continuing to innovate APCO P25, TETRA, and DMR standards-based voice and data communication devices and systems, (iii) innovating new products and technologies for the future, (iv) enhancing and expanding our services offerings including Managed & Support services; and (v) expanding our direct sales and channel partner programs both geographically and across new commercial verticals.
We believe we have the scale and global presence to continue to maintain a leadership position in our core products. We have over
12,000
systems deployed in over
180
countries around the world. These systems have a multi-year useful life to the customer. We believe many of our government and commercial customers have yet to replace aged analog communications networks with next-generation digital systems that enable enhanced features and more efficient use of spectrum, providing us opportunities to help customers migrate to these digital systems. In addition, we believe government and commercial customers are just beginning to experience the benefits of converged wireless communications and the efficiencies realized through a connected, mobile workforce, which will provide opportunities for the implementation of new public safety communications systems. We believe we are well-positioned to assist our customers in the deployment of new networks as additional public safety dedicated spectrum becomes available.
In addition, we continue to innovate around our existing core products and services by finding innovative ways to improve our products by adding features and functionality to improve the user experience. By partnering with customers and observing how our products are used, our goal is to enhance our customers’ experience through future product enhancements and upgrades.
In addition to focused research and development ("R&D") efforts on existing technologies, our strategy for long-term growth and the evolution of our business includes the development of: (i) next-generation public safety solutions' including public safety Long Term Evolution ("LTE") systems and devices, (ii) Smart Public Safety Solutions including critical command center applications that incorporate voice, data and video, and (iii) new product introductions for expansion into core-adjacent markets and geographic regions.
We have been investing in next-generation public safety broadband networks based on the LTE standard since 2010, which reflects our belief that broadband is a foundational long-term trend for our government and public safety customers globally. We believe that the application of these new broadband technologies will also generate innovation and lead to new smart public safety technologies, products, and services which will change how government and public safety organizations create, organize, and effectively manage vast amounts of data. These changes will also require a more comprehensive approach to the services required to assist our customers in managing an ever more complex world of real-time, interconnected technology and processes.
4
Our strategy includes leveraging our products and services for markets outside of the public safety and commercial markets we traditionally serve. A portion of our new product introductions in recent years include products which may also be used in the hospitality, mining, military, transportation, education, and utility vertical markets ("verticals").
Geographical diversification is accelerated by our investments supporting: (i) different regional interfaces, (ii) multiple languages, (iii) tailored form factors, and (iv) unique feature sets.
In addition to organic development opportunities and growth, we continually evaluate opportunities for inorganic growth through acquisitions or targeted investments in innovative technology companies that align with our strategic initiatives.
Our Customers and Contracts
We address the communication needs of government agencies, state and local public safety and first-responder agencies, and commercial and industrial customers who utilize private communications networks and manage a mobile workforce. Our customer base is fragmented and widespread when considering the many levels of governmental and first-responder decision-makers that procure and use our products and services. Serving this global customer base spanning federal, state, county, province, territory, municipal, and departmental independent bodies, along with our commercial and industrial customers, requires a significant go-to-market investment.
Our sales model includes both direct sales by our in-house sales force, which tends to focus on our largest accounts, and sales through our channel partner program. Our trained channel partners include independent dealers, distributors, and independent software vendors around the world. The dealers and distributors each have their own sales organizations that complement and extend the reach of our sales force. The independent software vendors offer customized applications that meet specific needs in the verticals we serve.
Our largest customer is the U.S. federal government (through multiple contracts with its various branches and agencies, including the armed services), representing approximately
8%
of our consolidated net sales in
2015
. The loss of this customer could have a material adverse effect on our revenue and earnings over several quarters as some of our contracts with the U.S. federal government are long-term. All contracts with the U.S. federal government, and certain other government agencies, are subject to cancellation at the customer’s convenience. For a discussion of risks related to government contracting requirements, please refer to “Item 1A. Risk Factors.”
Net sales in North America continued to comprise a significant portion of our business, accounting for
65%
,
61%
and
63%
of our consolidated net sales in
2015
,
2014
, and
2013
, respectively.
Payment terms with our customers vary worldwide. Generally, contractual payment terms range from 30 to 45 days from the invoice date within North America and typically do not exceed 90 days from the invoice date in regions outside of North America. A portion of our contracts include implementation milestones, such as delivery, installation, and system acceptance, which generally take 30 to 180 days to complete. Invoicing the customer is dependent on completion of the milestones. We generally do not grant extended payment terms. As required for competitive reasons, we may provide long-term financing in connection with equipment purchases. Financing may cover all or a portion of the purchase price.
Generally, our contracts do not include a right of return, other than for standard warranty provisions. Due to customer purchasing patterns and the cyclical nature of the markets we serve, our sales tend to be somewhat higher in the fourth quarter.
Competition
The markets in which we operate are highly competitive. Key competitive factors include: performance, features, quality, availability, warranty, price, vendor financing, availability of service, company reputation and financial strength, partner community, and relationships with customers. Our strong reputation with customers and partners, trusted brand, technology leadership, breadth of portfolio, product performance, and specialized support services position us well for success.
We experience widespread competition from a growing number of existing and new competitors, including large system integrators and manufacturers of private and public wireless network equipment and devices. Traditional Land Mobile Radio competitors include: Harris, Airbus, Kenwood, Hytera, and Sepura.
As demand for fully integrated voice, data, and broadband systems continue to grow, we may face additional competition from public telecommunications carriers and telecommunications equipment providers. As we continue to evolve our Integration services and Managed & Support services strategy, we may work with other companies on a consortium or joint venture basis as customers' delivery needs become more complex to fulfill.
Several other competitive factors may have an impact on our future business including: evolving spectrum mandates by government regulators, increasing investment by broadband and IP solution providers, and new low-tier competitors.
5
Other Information
Backlog
Our backlog for the Products and Services segments includes all product and service orders that have been received and are believed to be firm. As of
December 31, 2015
and
December 31, 2014
our backlog was as follows:
|
|
December 31
|
||||||
|
(In millions)
|
2015
|
2014
|
|||||
|
Products
|
$
|
1,234
|
|
$
|
1,194
|
|
|
|
Services
|
5,241
|
|
4,582
|
|
|||
|
$
|
6,475
|
|
$
|
5,776
|
|
||
Approximately
52%
of the Products segment backlog and
22%
of the Services segment backlog is expected to be recognized as revenue during
2016
. The forward-looking estimate of the firmness of such orders is subject to future events that may cause the amount recognized to change.
Research and Development
We continue to prioritize investments in R&D to expand and improve our portfolio of products through both new product introductions and continuous enhancements to our core products. Our R&D programs are focused on the development of: (i) new public safety devices, infrastructure, and solutions, (ii) public safety broadband solutions based on the LTE technology, and (iii) smart public safety applications that include voice, data, and video.
R&D expenditures were
$620 million
in
2015
,
$681 million
in
2014
, and
$761 million
in
2013
. As of
December 31, 2015
, we had approximately
5,000
employees engaged in R&D activities. In addition, we engage in R&D activities with joint development and manufacturing partners and outsource certain activities to engineering firms to further supplement our internal spend.
Intellectual Property Matters
Patent protection is an important aspect of our operations. We have a portfolio of U.S. and foreign utility and design patents relating to our products, systems, and technologies, including research developments in radio frequency technology and circuits, wireless network technologies, over-the-air protocols, mission critical communications, software and services, and next-generation public safety. We have filed new patent applications with the U.S. Patent and Trademark Office and foreign patent offices.
We license some of our patents to third-parties, but licensing revenue is not a significant source of revenue. We are also licensed to use certain patents owned by others. Royalty and licensing fees vary from year-to-year and are subject to the terms of the agreements and sales volumes of the products subject to the license. Motorola Solutions has a royalty free-license under all of the patents and patent applications assigned to Motorola Mobility at the time of the separation of the two businesses in 2011.
We actively participate in the development of standards for interoperable, mission-critical digital two-way radio systems. Our patents are used in standards in which our products and services are based. We offer standards-based licenses to those patents on fair, reasonable, and non-discriminatory terms.
We believe that our patent portfolio will continue to provide us with a competitive advantage in our core product areas as well as provide leverage in the development of future technologies. Furthermore, we believe we are not dependent upon a single patent or even a few patents. Our success depends more upon our extensive know-how, innovative culture, technical leadership, and distribution channels. We do not rely primarily on patents or other intellectual property rights to protect or establish our market position; however, we will enforce our intellectual property rights in certain technologies when attempts to negotiate mutually agreeable licenses are not successful.
We seek to obtain patents and trademarks to protect our proprietary positions whenever possible and wherever practical. As of
December 31, 2015
, we owned approximately
4,440
granted patents in the U.S. and in foreign countries. As of
December 31, 2015
, we had approximately
1,315
U.S. and foreign patent applications pending. Foreign patents and patent applications are mostly counterparts of our U.S. patents. During
2015
, we were granted approximately
415
patents in the U.S. and in foreign countries.
We no longer own certain logos and other trademarks, trade names and service marks, including MOTOROLA, MOTO, MOTOROLA SOLUTIONS and the Stylized M logo and all derivatives thereof (“Motorola Marks”) and we license the Motorola Marks from Motorola Mobility, which is currently owned by Lenovo.
Inventory and Raw Materials
Our practice is to carry reasonable amounts of inventory to meet customers’ delivery requirements. We provide custom products which require the stocking of inventories and a large variety of piece parts and replacement parts in order to meet delivery and warranty requirements. To the extent suppliers’ product life cycles are shorter than ours, stocking of lifetime buy inventories is required to meet long-term warranty and contractual requirements. In addition, replacement parts are stocked for delivery on customer demand within a short delivery cycle.
6
Availability of required materials and components is generally dependable; however, fluctuations in supply and market demand could cause selective shortages and affect our results of operations. We currently procure certain materials and components from single-source vendors. A material disruption from a single-source vendor may have a material adverse impact on our results of operations. If certain single-source suppliers were to become capacity constrained or insolvent, it could result in a reduction or interruption in supplies, or an increase in the price of supplies, and adversely impact our financial results.
Natural gas, electricity and, to a lesser extent, oil are the primary sources of energy for our manufacturing operations. Each of these resources is currently in adequate supply for our operations. The cost to operate our facilities and freight costs are dependent on world oil prices. Given current oil spot rates, we anticipate cost savings. Labor is generally available in reasonable proximity to our manufacturing facilities and the manufacturing facilities of our largest outsourced manufacturing suppliers. Difficulties in obtaining any of the aforementioned resources, or a significant cost increase, could affect our financial results.
Environmental Quality and Regulatory Matters
Some of our operations use substances regulated under various federal, state, local, and international laws governing the environment and worker health and safety, including those governing the discharge of pollutants into the ground, air, and water, the management and disposal of hazardous substances and wastes, and the cleanup of contaminated sites, as well as relating to the protection of the environment. Certain of our products are subject to various federal, state, local, and international laws governing chemical substances in electronic products. During
2015
, compliance with these U.S. federal, state, and local, and international laws did not have a material effect on our capital expenditures, earnings, or competitive position.
Radio spectrum is required to provide wireless voice, data, and video communications service. The allocation of spectrum is regulated in the U.S. and other countries and limited spectrum space is allocated to wireless services and specifically to public safety users. In the U.S., the Federal Communications Commission (“FCC”) and the National Telecommunications and Information Administration (“NTIA”) regulate spectrum use by non-federal entities and federal entities, respectively. Similarly, countries around the world have one or more regulatory bodies that define and implement the rules for use of radio spectrum, pursuant to their respective national laws and international coordination under the International Telecommunications Union (“ITU”). We manufacture and market products in spectrum bands already made available by regulatory bodies. These include voice and data infrastructure, mobile radios, and portable or hand-held devices. Consequently, our results could be positively or negatively affected by the rules and regulations adopted from time to time by the FCC, NTIA, ITU, or regulatory agencies in other countries. Our products operate both on licensed and unlicensed spectrum. The availability of additional radio spectrum may provide new business opportunities. Conversely, the loss of available radio spectrum may result in the loss of business opportunities. Regulatory changes in current spectrum bands may also provide opportunities or may require modifications to some of our products so they can continue to be manufactured and marketed.
As television transmission and reception technology transitions from analog to more efficient digital modes, various countries around the world are examining, and in some cases already pursuing, the redevelopment of portions of the television spectrum. In the U.S., spectrum historically used for broadcast television, known as the 700MHz band, has been redeveloped and deployed for new uses (the so-called “digital dividend” spectrum), including broadband and narrowband wireless communications. In 2016, this trend continues and additional TV spectrum in the 600MHz band will be auctioned for broadband communications (part of the “Broadcast Incentive Auction”).
In the U.S., thirty-four MHz of spectrum in the 700 MHz band is now allocated to support public safety narrowband and broadband communications systems. This includes 24 MHz of spectrum previously allocated by the FCC and an additional ten MHz of spectrum (the “D block”) allocated in February 2012 as part of the Middle Class Tax Relief and Job Creation Act of 2012 in response to public safety requests for additional broadband spectrum. The resulting law also identified up to $7 billion in funding for the nationwide public safety broadband network. The law further provides for the establishment of a centralized governance model through an independent authority within NTIA designated as the “First-Responder Network Authority” or “FirstNet” to manage deployment and operation of the network. Additional work, currently ongoing in FirstNet, is required to enable deployment of the nationwide public safety broadband network. FirstNet released its network Request for Proposal in early 2016.
The law allows for states to opt out of the plan to develop a nationwide public safety network and perform their own competitive procurements if certain criteria are met. States that opt out would still be eligible for funding and would also be allowed to generate revenue through leases to secondary users. FirstNet and the FCC have also enabled the early deployment of broadband systems in several areas so that field experience can be gained regarding the benefits of broadband communications for public safety operations. In September 2012, the State of Texas received a Special Temporary Authorization ("STA") for deployment of 14 broadband sites in the Harris County area around Houston. A Spectrum Manager Lease Agreement ("SMLA") was signed in August 2014, with FirstNet and the State of Texas on behalf of Harris County, extending the access to this spectrum for three years. The State of Texas and Harris County, with assistance from Motorola Solutions, have deployed broadband equipment and applications and successfully demonstrated the benefits such systems can bring to FirstNet and other officials. FirstNet also entered into a spectrum lease with the State of California on behalf of Los Angeles Regional Interoperable Communications System Authority ("LA-RICS") to allow for a radio system that will provide mission critical communications for the region’s more than 34,000 law enforcement, fire service and health service professionals and more than 80 public safety agencies. LA-RICS selected Motorola Solutions to develop this radio system.
Although the law has been enacted, the implementation of a nationwide public safety network under FirstNet has been slow to progress. For a discussion of risks related to the implementation of a nationwide public safety network, please refer to
"Item 1A, Risk Factors."
7
Internationally, the ITU World Radio Conference ("WRC") is held every three to four years to discuss and promote global agreement on the use and cooperation of spectrum usage. The recent WRC-15 was held in November 2015. During this conference, leaders from United Nations member countries considered a number of initiatives, including whether to allocate additional spectrum for commercial broadband use as well as whether to allocate spectrum dedicated for public safety broadband. The WRC has agreed to support countries making individual decisions to allocate spectrum for public safety broadband in the 700MHz and 800MHz spectrum bands. Studies are underway to assess whether and how much spectrum is needed and to develop recommendations on where in the spectrum range the spectrum should be allocated (taking into account regional and global harmonization to the extent practicable). Motorola Solutions continues to work with its customers and governments around the world to advocate for future allocations of dedicated broadband spectrum for public safety which will provide new business opportunities for us in the future.
Several major markets including: Australia, Canada, the United States, Mexico, and South Korea have already set aside broadband spectrum for use by public safety and the wider first-responder community. We believe this trend will continue over time and the planned implementation of nationwide broadband public safety networks provides new opportunities for our broadband portfolio and services growth strategy.
In addition, certain countries, in response to increasing security concerns, already have spectrum landscapes that permit country administrations to allocate public safety spectrum quickly without a protracted process or agreement.
Employees
At
December 31, 2015
, we had approximately
14,000
employees, compared to
15,000
employees at
December 31, 2014
.
Material Dispositions
|
•
|
On October 27, 2014, we completed the sale of certain assets and liabilities of the Enterprise business to Zebra Technologies Corporation ("Zebra"). The financial results of the disposed business have been reclassified to discontinued operations for all periods presented. The results of discontinued operations are discussed in further detail in the “Discontinued Operations” footnote included in Item 8.
|
|
•
|
On January 1, 2012, we completed a series of transactions which resulted in exiting the amateur, marine, and airband radio businesses.
|
|
•
|
On October 28, 2011, we completed the sale of our wireless broadband businesses.
|
|
•
|
On April 29, 2011, we completed the sale of certain assets and liabilities of our Networks business to Nokia Siemens Networks ("NSN").
|
|
•
|
On January 4, 2011, the distribution of Motorola Mobility was completed. The stockholders of record as of the close of business on December 21, 2010 received one (1) share of Motorola Mobility common stock for each eight (8) shares of our common stock held.
|
Financial Information About Geographic Areas
The response to this section of Item 1 incorporates by reference Note 11, “Commitments and Contingencies” and Note 12, “Information by Segment and Geographic Region” of Part II, "Item 8: Financial Statements and Supplementary Data" of this document, the “Results of Operations—
2015
Compared to
2014
” and “Results of Operations—
2014
Compared to
2013
” sections of Part II, “Item 7: Management’s Discussion and Analysis of Financial Condition and Results of Operations” and “Item 1A: Risk Factors” of this document.
Financial Information About Segments
The response to this section of Item 1 incorporates by reference Note 12, “Information by Segment and Geographic Region,” of Part II, "Item 8: Financial Statements and Supplementary Data" of this document.
Available Information
We make available free of charge through our website, www.motorolasolutions.com/investors
,
our annual reports on Form 10-K, quarterly reports on Form 10-Q, current reports on Form 8-K, proxy statements, other reports filed under the Securities Exchange Act of 1934 (“Exchange Act”), and all amendments to those reports simultaneously or as soon as reasonably practicable after such material is electronically filed with, or furnished to, the SEC. Our reports are also available free of charge on the SEC’s website,
www.sec.gov.
Also available free of charge on our website are the following corporate governance documents:
|
•
|
Motorola Solutions, Inc. Restated Certificate of Incorporation with Amendments
|
|
•
|
Conformed Restated Certificate of Incorporation of Motorola Solutions, Inc. (amended Jan. 4, 2011)
|
|
•
|
Certificate of Amendment to the Restated Certificate of Incorporation of Motorola, Inc. (effective Jan. 4, 2011)
|
|
•
|
Certificate of Ownership and Merger of Motorola Name Change Corporation into Motorola, Inc. (effective Jan. 4, 2011)
|
|
•
|
Motorola Solutions, Inc. Amended and Restated Bylaws
|
|
•
|
Board Governance Guidelines
|
|
•
|
Director Independence Guidelines
|
8
|
•
|
Principles of Conduct for Members of the Motorola Solutions, Inc. Board of Directors
|
|
•
|
Motorola Solutions Code of Business Conduct, which is applicable to all Motorola Solutions employees, including the principal executive officers, the principal financial officer and the controller (principal accounting officer)
|
|
•
|
Audit Committee Charter
|
|
•
|
Compensation and Leadership Committee Charter
|
|
•
|
Governance and Nominating Committee Charter
|
All of our reports and corporate governance documents may also be obtained without charge by contacting Investor Relations, Motorola Solutions, Inc., Corporate Offices, 1303 East Algonquin Road, Schaumburg, Illinois 60196, E-mail:
investors@motorolasolutions.com
. This annual report on Form 10-K and Definitive Proxy Statement are available on the Internet at www.motorolasolutions.com/investors and may also be requested in hardcopy by completing the on-line request form available on our website at www.motorolasolutions.com/investors. Our Internet website and the information contained therein or incorporated therein are not intended to be incorporated into this Annual Report on Form 10-K.
We face a number of risks related to current global economic and political conditions, including low economic growth rates in certain markets, the impact of currency fluctuations, falling commodity prices, and unstable political conditions that have and could continue to unfavorably impact our business.
Global economic and political conditions continue to be challenging for many of our government and commercial markets, as economic growth in many countries, particularly in Europe and Latin America and in emerging markets, has remained low, currency fluctuations have impacted profitability, credit markets have remained tight for certain of our counterparties and many of our customers remain dependent on government grants to fund purchases of our products and services. Falling commodity prices continue to impact government customers in economies dependent on those commodities, and commercial customers in energy and mining related industries particularly in the Middle East, South America and Russia. In addition, conflicts in the Middle East and elsewhere have created many economic and political uncertainties that continue to impact worldwide markets. The length of time these adverse economic and political conditions may persist is unknown. These global economic and political conditions have impacted and could continue to impact our business, financial condition, results of operations, and cash flows in a number of ways, including:
•
Requests by Customers for Vendor Financing by Motorola Solutions: Certain of our customers, particularly, but not limited to, those who purchase large infrastructure systems, request that their suppliers provide financing in connection with equipment purchases and/or the provision of solutions and services, particularly as the size and length of these types of contracts increases and as we increase our business in developing countries. Requests for vendor financing continue to increase in volume and scope, including in response to reduced tax revenue at the state and local government level and ongoing tightening of credit for certain commercial customers. Motorola Solutions has continued to provide vendor financing to both our government and commercial customers. We have been faced with and expect to continue to be faced with choosing between further increasing our level of vendor financing or potentially losing sales, as some of our competitors, particularly those in Asia, have been more willing to provide vendor financing to customers around the world, particularly customers in Africa and Latin America. To the extent we are unable to sell these receivables on terms acceptable to us we may retain exposure to the credit quality of our customers who we finance.
•
Customers' Inability to Obtain Financing to Make Purchases from Motorola Solutions and/or Maintain Their Business: Some of our customers require substantial financing, including public financing or government grants, in order to fund their operations and make purchases from us. The inability of these customers to obtain sufficient credit or other funds, including as a result of lower tax revenues, falling oil prices, currency fluctuations or unavailability of government grants, to finance purchases of our products and services and/or to meet their payment obligations to us could have, and in some cases has had, a negative impact on our financial results. This risk increases as the size and length of our contracts increase. In addition, if global economic conditions result in insolvencies for our customers, it will negatively impact our financial results.
•
Challenges in Budgeting and Forecasting: It is difficult to estimate changes in various parts of the U.S. and world economy, including the markets in which we participate. Components of our budgeting and forecasting are dependent upon estimates of demand for our products and estimates of foreign exchange rates. The prevailing economic uncertainties render estimates of future income and expenditures challenging.
•
Potential Deferment or Cancellation of Purchases and Orders by Customers: Uncertainty about current and future global economic conditions may cause, and in some cases has caused, businesses and governments to defer or cancel purchases in response to tighter credit, decreased cash availability and de-prioritization of communications equipment within the budgeting process. If future demand for our products declines due to economic conditions, it will negatively impact our financial results.
•
Inability to Operate and Grow in Certain Markets: We operate in a number of markets with a risk of intensifying political instability, including Russia, Brazil, the Middle East and Africa. If political instability continues in these markets and in other parts of the world in which we operate it could have a significant impact on our ability to grow and, in some cases, operate in those locations, which will negatively impact our financial results
.
9
A significant amount of our international business is transacted in local currency and a significant percentage of our cash and cash equivalents are held outside of the United States, which exposes us to risk relating to currency fluctuations, changes in foreign exchange regulations and repatriation delays and costs, which could negatively impact our sales, profitability and financial flexibility.
We have sizable sales and operations in Canada and our Europe and Africa, Asia, Middle East, and Latin America regions. A significant amount of this business is transacted in local currency. As a result, our financial performance is impacted by currency fluctuations. We are also experiencing increased pressure to agree to established currency conversion rates and cost of living adjustments as a result of foreign currency fluctuations.
A significant percentage of our cash and cash equivalents is currently held outside the U.S. and we continue to generate profits outside of the U.S., while many of our liabilities, such as our public debt, the majority of our pension liabilities and certain other cash payments, such as dividends and share repurchases, are payable in the U.S. While we have regularly repatriated funds with minimal adverse impact, repatriation of some of the funds has been and could continue to be subject to delay for local country approvals and could have potential adverse tax consequences. In addition, foreign exchange regulations may limit our ability to convert or repatriate foreign currency. As a result of having a lower amount of cash and cash equivalents in the U.S., our financial flexibility may be reduced.
A portion of our business is dependent upon U.S. government contracts and grants, which are highly regulated and subject to oversight audits by U.S. government representatives and subject to cancellations. Such audits could result in adverse findings and negatively impact our business.
Our U.S. government business is subject to specific procurement regulations with numerous compliance requirements. These requirements, although customary in U.S. government contracting, increase our performance and compliance costs. These costs may increase in the future, thereby reducing our margins, which could have an adverse effect on our financial condition. Failure to comply with these regulations or other compliance requirements could lead to suspension or debarment from U.S. government contracting or subcontracting for a period of time, and the inability to receive future grants. Among the causes for debarment are violations of various laws or policies, including those related to procurement integrity, export control, U.S. government security regulations, employment practices, protection of criminal justice data, protection of the environment, accuracy of records, proper recording of costs, foreign corruption and the False Claims Act.
Generally, U.S. government contracts and grants are subject to oversight audits by U.S. government representatives. Such audits could result in adjustments to our contracts or grants. Any costs found to be improperly allocated to a specific contract or grant may not be allowed, and such costs already reimbursed may have to be refunded. Future audits and adjustments, if required, may materially reduce our revenues or profits upon completion and final negotiation of audits. Negative audit findings could also result in investigations, termination of a contract or grant, forfeiture of profits or reimbursements, suspension of payments, fines and suspension or prohibition from doing business with the U.S. government. All contracts with the U.S. government are subject to cancellation at the convenience of the U.S. government.
In addition, contacts with government officials and participation in political activities are areas that are tightly controlled by federal, state, local and international laws. Failure to comply with these laws could cost us opportunities to seek certain government sales opportunities or even result in fines, prosecution, or debarment.
A security breach or other significant disruption of our IT systems, those of our outsource partners, suppliers or those we manufacture, install, and in some cases operate and maintain for our customers, caused by cyber attack or other means, could have a negative impact on our operations, sales, and operating results.
All information technology systems are potentially vulnerable to damage, unauthorized access or interruption from a variety of sources, including but not limited to, cyber attack, cyber intrusion, computer viruses, security breach, energy blackouts, natural disasters, terrorism, sabotage, war, and telecommunication failures. As a provider of mission-critical communications systems for customers in critical infrastructure sectors of the U.S. and globally, including systems that we operate and maintain for certain of our customers, we face additional risk as a target of sophisticated attacks aimed at compromising both our Company’s and our customers’ sensitive information and intellectual property, through means referred to as advanced persistent threats. This risk is heightened because these systems may contain sensitive governmental information or personally identifiable or other protected information. While we employ a number of countermeasures and security controls, including training and audits and utilization of commercial information security threat sharing networks to protect against such attacks, we have experienced a gradual and steady increase in the sophistication of these threats, most noticeably through well-crafted social engineering and phishing attempts. We cannot guarantee that all threat attempts will be successfully thwarted even with these countermeasures. Further, we are dependent, in certain instances, upon our outsourced business partners, suppliers, and customers to adequately protect our IT systems and those IT systems that we manage for our customers. In addition, some of our customers are exploring broadband solutions that use public carrier networks on which our solutions would operate. We do not have direct oversight or influence over how public carrier networks manage the security, quality, or resiliency of their networks, and because they are an attractive high value target due to their role in critical infrastructure, they expose customers to an elevated risk over our private networks.
Our Company outsources certain business operations, including, but not limited to IT, HR information systems, manufacturing, repair, distribution and engineering services. These arrangements are governed by various contracts and agreements which reference and mandate Company and international standards of information protection, as appropriate. In addition, we maintain certain networked equipment at customer locations and are reliant on those customers to protect and maintain that equipment. The “attack surface” for us to protect against our adversaries is thus often extended to these partners
10
and customers, as well as our suppliers, and we may be dependent upon their cyber security capabilities as well as their willingness to exchange threat and response information with us.
A cyber attack or other significant disruption involving our IT systems or those of our outsource partners, suppliers or our customers could result in the unauthorized release of proprietary, confidential or sensitive information of ours or our customers. Such unauthorized access to, or release of, this information could: (i) allow others to unfairly compete with us, (ii) compromise safety or security, given the mission-critical nature of our customers’ systems, (iii) subject us to claims for breach of contract, tort, and other civil claims, and (iv) damage our reputation. We could face regulatory penalties, enforcement actions, remediation obligations and/or private litigation by parties whose data is improperly disclosed or misused. In addition, there has been a sharp increase in laws in Europe, the U.S. and elsewhere, imposing requirements for the handling of personal data, including data of employees, consumers and business contacts, as well as imposing requirements for remediation action, including specific timing and method of notification. There is a risk that our Company, directly or as the result of some third-party service provider we use, could be found to have failed to comply with the laws or regulations of some country regarding the collection, consent, handling, transfer, retention or disposal of such personal data, and therefore subject us to fines or other sanctions. The European Courts invalidation of Safe Harbor as a mechanism to legitimize cross border data flows increases the risk that our Company, directly or through some third-party service provider that we use, may inappropriately transfer EU personal data. Any or all of the foregoing could have a negative impact on our business, financial condition, results of operations, and cash flow.
Government regulation of radio frequencies may limit the growth of public safety broadband systems or reduce barriers to entry for new competitors.
Radio frequencies are required to provide wireless services. The allocation of frequencies is regulated in the U.S. and other countries and limited spectrum space is allocated to wireless services and specifically to public safety users. The growth of public safety broadband communications systems may be affected: (i) by regulations relating to the access to allocated spectrum for public safety users, (ii) if adequate frequencies are not allocated, or (iii) if new technologies are not developed to better utilize the frequencies currently allocated for such use. Industry growth may also be affected by new licensing fees required to use frequencies.
The U.S. leads the world in allocating spectrum to enable wireless communications including LTE. Other countries have also allocated spectrum to allow deployment of these and other technologies. This changing landscape may introduce new competition and new opportunities for us.
The Middle Class Tax Relief and Job Creation Act of 2012 (the “Legislation”) authorized an additional ten MHz of broadband spectrum for public safety use for a total of 20 MHz of broadband spectrum for public safety. In addition, public safety retained 14 MHz of the 700 MHz narrowband spectrum, subject to the FCC's authority to determine whether such spectrum should be authorized for future broadband use. The Legislation further provides for the establishment of a centralized governance model through an independent authority within NTIA designated as the “First-Responder Network Authority” or “FirstNet” but allows for states to opt out of the plan to develop a nationwide public safety network and perform their own competitive procurements if certain criteria are met. States that opt out would still be eligible for some funding and would also be allowed to help cover their operating costs by leasing unused/underused spectrum to secondary users.
Although the Legislation has been enacted, the implementation of a nationwide public safety network under FirstNet has been slow to progress due to complexities involving: (i) regulatory requirements, (ii) development of the specifications and statements of work, (iii) decision making on the system architecture and (iv) political considerations from various stakeholders.
Longer term, MSI’s opportunities to sell LTE equipment and related services in this space will be substantially impacted by: (1) the deployment model being developed by FirstNet, which has been heading in a direction more favorable to commercial carriers; (2) the type of procurement process established by FirstNet; (3) the timing and number of states (if any) that choose to opt out of FirstNet, and whether the FCC approves their request, as detailed in the Legislation; (4) FirstNet’s stated intent to reduce handset prices; and (5) fiscal, public, and regulatory policies and/or special interest politics that risk delaying deployment. FirstNet released its RFP in early 2016 and will only accept national deployment bids, likely removing the possibility that a bidder could be selected to build out the network for a single state or region.
We derive a portion of our revenue from government customers who award business through competitive bidding which can involve significant upfront costs and risks. This effort may not result in awards of business or we may fail to accurately estimate the costs to fulfill contracts awarded to us, which could have adverse consequences on our future profitability.
Many government customers, including most U.S. government customers, award business through a competitive bidding process, which results in greater competition and increased pricing pressure. The competitive bidding process involves significant cost and managerial time to prepare bids for contracts that may not be awarded to us. Even if we are awarded contracts, we may fail to accurately estimate the resources and costs required to fulfill a contract, or to resolve problems with our subcontractors or suppliers, which could negatively impact the profitability of any contract award to us, particularly in the case of fixed price contracts. In addition, following the award of a contract, we have experienced and may continue to experience significant expense or delay, contract modification or contract rescission as a result of customer delay or our competitors protesting or challenging contracts awarded to us in competitive bidding.
11
We enter into fixed-price contracts that could subject us to losses in the event we fail to properly estimate our costs or hedge our risks associated with currency fluctuations.
We enter into a number of firm fixed-price contracts. If our initial cost estimates are incorrect, we can lose money on these contracts. Because certain of these contracts involve new technologies and applications, require us to engage subcontractors and/or can last multiple years, unforeseen events, such as technological difficulties, fluctuations in the price of raw materials, problems with our subcontractors or suppliers and other cost overruns, can result in the contract pricing becoming less favorable or even unprofitable to us and have an adverse impact on our financial results. In addition, a significant increase in inflation rates or currency fluctuations could have an adverse impact on the profitability of longer-term contracts.
Over the last several years we have outsourced portions of certain business operations like IT, HR information systems, manufacturing, repair, distribution and engineering services and expect to outsource additional business operations. This outsourcing limits our control over these business operations and exposes us to additional risk as a result of the actions of our outsource partners.
As we outsource more of our business operations we are not able to directly control these activities. Our outsource partners may not prioritize our business over that of their other customers and they may not meet our desired level of quality, performance, service, cost reductions or other metrics. Failure to meet key performance indicators may result in our being in default with our customers. In addition, we may rely on our outsource partners to secure materials from our suppliers with whom our outsource partners may not have existing relationships and we may be required to continue to manage these relationships even after we outsource certain business operations.
As we outsource business operations we become dependent on the IT systems of our outsource partners, including to transmit demand and purchase orders to suppliers, which can result in a delay in order placement. In addition, in an effort to reduce costs and limit their liabilities, our outsource partners may not have robust systems or make commitments in as timely a manner as we require.
In some cases the actions of our outsource partners may result in our being found to be in violation of laws or regulations like import or export regulations. As many of our outsource partners operate outside of the U.S., our outsourcing activity exposes us to information security vulnerabilities and increases our global risks. In addition, we are exposed to the financial viability of our outsource partners. Once a business activity is outsourced we may be contractually prohibited from or may not practically be able to bring such activity back within the Company or move it to another outsource partner. The actions of our outsource partners could result in reputational damage to us and could negatively impact our business, financial conditions, results of operations, and cash flows.
We no longer own a number of our enterprise legacy information systems, including components of our Enterprise Resource Planning (ERP) system. We are planning to implement a new ERP system and we rely on complex and in some cases aging information technology systems and networks to operate our business. Any system or network disruption could have a negative impact on our operations, sales and operating results.
We rely on the efficient and uninterrupted operation of complex information technology systems and networks, some of which are within the Company and some of which are outsourced. In connection with the sale of our Enterprise business to Zebra, we transferred ownership of a number of our enterprise legacy information systems including components of our Enterprise Resource Planning (ERP) system to Zebra. We are currently in a transition services agreement to co-use these systems with Zebra until 2017 which limits our ability to make changes to these systems. We are planning to implement a new ERP system to replace pieces of the systems now owned by Zebra. If this implementation is delayed or introduces defective, or improperly installed or implemented computer code, it may result in a business disruption.
We also currently rely on a number of older legacy information systems that are harder to maintain and when we begin to implement our new ERP system we will have fewer resources to maintain these older legacy systems. A system failure could negatively impact our operations and financial results.
In addition, as we have outsourced more of our business operations we have increased our dependence on the IT systems of our outsourced business partners which are not under our direct management or control. Any disruption to either those outsourced systems or the communication links between Motorola Solutions and the outsourced supplier, may negatively impact our ability to manufacture, distribute, or repair products. We may incur additional costs to remedy the damages caused by these disruptions.
12
Our future operating results depend on our ability to purchase at acceptable prices a sufficient amount of materials, parts, and components, as well as services and software to meet the demands of our customers and any disruption to our suppliers or significant increase in the price of supplies could have a negative impact on our results of operations.
Our ability to meet customers' demands depends, in part, on our ability to timely obtain an adequate delivery of quality materials, parts, and components, as well as services and software from our suppliers. In addition, certain supplies, including for some of our critical components, are available only from a single source or limited sources and we may not be able to diversify sources in a timely manner. If demand for our products or services increases from our current expectations or if suppliers are unable to meet our demand for other reasons, including as a result of natural disasters or financial issues, we could experience an interruption in supplies or a significant increase in the price of supplies, including as a result of having to move to an alternative source, that could have a negative impact on our business as a result of increased cost or delay in or inability to deliver our products. This risk may increase as a result of consolidation of certain of our suppliers. We have experienced shortages in the past that have negatively impacted our results of operations and may experience such shortages in the future. In addition, credit constraints at our suppliers could cause us to accelerate payment of accounts payable by us, impacting our cash flow.
We have seen and expect to continue to see increases in the price of certain supplies as we no longer qualify for certain volume discounts given our significant decrease in direct material spend over the last several years as a result of our spin-offs and divestitures. We have also experienced less support and focus from our suppliers as our spend has diminished, making it more difficult for us to resolve gaps in supply due to unforeseen changes in forecast and demand. In addition, our current contractual arrangements with certain suppliers may be cancelled or not extended by such suppliers and, therefore, not afford us with sufficient protection against a reduction or interruption in supplies. Moreover, in the event any of these suppliers breach their contracts with us, our legal remedies associated with such a breach may be insufficient to compensate us for any damages we may suffer.
Our sales within a quarter are not linear, with a substantial percentage of products shipping in the final month of the quarter. This lack of linearity creates inefficiencies in our business performance and any interruption during this final month could have a substantial impact on our quarterly financial results.
On average, a substantial percentage of our quarterly sales ship in the final month of a quarter. Any interruption in our ability to ship products during this final month, such as unavailability of critical components, disruption to our manufacturing capabilities or disruptions in our distribution channel, will have a disproportionately large impact on our quarterly financial results, as we may be unable to recover in time to ship the products and recognize revenue in that quarter.
In addition, this lack of linearity results in inefficiencies in our financial performance, as we must invest in capacity and resources to support this business model, meaning we have underutilized operations during the first two months of the quarter. We also must maintain additional component inventory and engage in pre-builds of finished goods to mitigate the impact of this lack of linearity and meet potential last month demand. This could result in our carrying excess inventory, which is costly and may result in increased inventory obsolescence over time.
13
We no longer own certain logos and other trademarks, trade names and service marks, including MOTOROLA, MOTO, MOTOROLA SOLUTIONS and the Stylized M logo and all derivatives and formatives thereof (“Motorola Marks”) and we license the Motorola Marks from Motorola Trademark Holdings, LLC (“MTH”), which is currently owned by Motorola Mobility, a subsidiary of Lenovo. Our joint use of the Motorola Marks could result in product and market confusion and negatively impact our ability to expand our business under the Motorola brand. In addition, if we do not comply with the terms of the license agreement we could lose our rights to the Motorola Marks. Because of the change of control of Motorola Mobility, which is now owned by Lenovo, we may find that an incompatible third-party owns the Motorola Marks.
We have a worldwide, perpetual and royalty-free license from MTH to use the Motorola Marks as part of our corporate name and in connection with the manufacture, sale, and marketing of our current products and services. The license of the Motorola Marks is important to us because of the reputation of the Motorola brand for our products and services. There are risks associated with both Motorola Mobility and the Company using the Motorola Marks and with this loss of ownership. As both Motorola Mobility and the Company will be using the Motorola Marks, confusion could arise in the market, including customer confusion regarding the products offered by and the actions of the two companies. Motorola Mobility was acquired by Lenovo in 2014, which resulted in Lenovo having effective control over the Motorola Marks. This risk could increase as both Motorola Mobility's and our products continue to converge. This risk could increase under Lenovo's control if they expand their use of the Motorola Marks. Also, any negative publicity associated with either company in the future could adversely affect the public image of the other. In addition, because our license of the Motorola Marks will be limited to products and services within our specified fields of use, we will not be permitted to use the Motorola Marks in other fields of use without the approval of Motorola Mobility, which is now controlled by Lenovo. In the event that we desire to expand our business into any other fields of use, we may need to do so with a brand other than the Motorola brand. Developing a brand as well-known and with as much brand equity as Motorola could take considerable time and expense. The risk of needing to develop a second brand increases as Motorola Mobility's and our products continue to converge and if our business expands into other fields of use. In addition, we could lose our rights to use the Motorola Marks if we do not comply with the terms of the license agreement. Such a loss could negatively affect our business, results of operations and financial condition. Furthermore, MTH has the right to license the brand to third-parties and either Motorola Mobility or licensed third-parties may use the brand in ways that make the brand less attractive for customers of Motorola Solutions, creating increased risk that Motorola Solutions may need to develop an alternate or additional brand. In 2013 Motorola Mobility modified certain Motorola Marks used by the Company. Motorola Mobility may require the Company to adopt the use of the modified Motorola Marks, which would result in the Company incurring the costs of rebranding.
In addition, neither Motorola Mobility nor Lenovo are prohibited from selling the Motorola Marks. In the event of a liquidation of Motorola Mobility or the then owner of the Motorola Marks, it is possible that a bankruptcy court would permit the Motorola Marks to be assigned to a third-party. While our right to use the Motorola Marks under our license should continue in our specified field of use in such situations, it is possible that we could be party to a license arrangement with a third-party whose interests are incompatible with ours, thereby potentially making the license arrangement difficult to administer, and increasing the costs and risks associated with sharing the Motorola Marks. In addition, there is a risk that, in the event of a bankruptcy of Motorola Mobility or the then owner of the Motorola Marks, Motorola Mobility, the then owner or its bankruptcy trustee may attempt to reject the license, or a bankruptcy court may refuse to uphold the license or certain of its terms. Such a loss could negatively affect our business, results of operations and financial condition.
We may not continue to have access to the capital markets for financing on acceptable terms and conditions, particularly if our credit ratings are downgraded, which could limit our ability to repay our indebtedness and could cause liquidity issues.
From time to time we access the capital markets to obtain financing. Our access to the capital markets and the bank credit markets at acceptable terms and conditions are impacted by many factors, including: (i) our credit ratings, (ii) the liquidity of the overall capital markets, (iii) strength and credit availability in the banking markets, and (iv) the current state of the global economy. In addition, we frequently access the credit markets to obtain performance bonds, bid bonds, standby letters of credit and surety bonds, as well as to hedge foreign exchange risk and sell receivables. In addition, there can be no assurances we will be able to refinance our existing indebtedness (i) on commercially reasonable terms, (ii) on terms, including with respect to interest rates, as favorable as our current debt, or (iii) at all. There can be no assurances that we will continue to have access to the capital markets or bank credit markets on terms acceptable to us and if we are unable to repay or refinance our debt, we cannot guarantee that we will be able to generate enough cash flows from operations or that we will be able to obtain enough capital to service our debt, fund our planned capital expenditures or pay future dividends.
We are rated investment grade by all three national rating agencies. Any downward changes by the rating agencies to our credit rating may negatively impact the value and liquidity of both our debt and equity securities. Under certain circumstances, an increase in the interest rate payable by us under our revolving credit facility, if any amounts were borrowed under such facility, could negatively affect our operating cash flows. In addition, a downgrade in our credit ratings could limit our ability to: (i) access the capital markets or bank credit markets, (ii) provide performance bonds, bid bonds, standby letters of credit and surety bonds, (iii) hedge foreign exchange risk, (iv) fund our foreign affiliates, and (v) sell receivables. A downgrade in our credit rating could also result in less favorable trade terms with suppliers. In addition, any downgrades in our credit ratings may affect our ability to obtain additional financing in the future and may affect the terms of any such financing. Any future disruptions, uncertainty or volatility in the capital markets may result in higher funding costs for us and adversely affect our ability to access funds and other credit related products. In addition, we may avoid taking actions that would otherwise benefit us or our stockholders, such as engaging in certain acquisitions or engaging in stock repurchases, that would negatively impact our credit rating.
14
We utilize the services of subcontractors to perform under many of our contracts and the inability of our subcontractors to perform in a timely and compliant manner could negatively impact our ability to comply with our performance obligations as the prime contractor.
We engage subcontractors, including third-party integrators, on many of our contracts and as we expand our solutions and services business our use of subcontractors has and will continue to increase. Our subcontractors may further subcontract performance and may supply third-party products and software from a number of smaller companies. We may have disputes with our subcontractors, including disputes regarding the quality and timeliness of work performed by the subcontractor or its subcontractors and the functionality, warranty and indemnities of products, software and services supplied by our subcontractor. We are not always successful in passing down customer requirements to our subcontractors, and thus in some cases may be required to absorb contractual risks from our customers without corresponding back-to-back coverage from our subcontractor. Our subcontractors may not be able to acquire or maintain the quality of the materials, components, subsystems and services they supply, or secure preferred warranty and indemnity coverage from their suppliers which might result in greater product returns, service problems, warranty claims and costs and regulatory compliance issues. Any of the foregoing could harm our business, financial condition and results of operations.
Failure of our suppliers, subcontractors, distributors, resellers and representatives to use acceptable legal or ethical business practices and adhere to our Supplier Code of Conduct or our Human Rights Policy could negatively impact our business.
It is our policy to require our suppliers, subcontractors, distributors, resellers, and third-party sales representatives (“TPSRs”) to operate in compliance with applicable laws, rules and regulations regarding working conditions, employment practices, environmental compliance, anti-corruption and trademark and copyright licensing. However, we do not control their labor and other business practices. If one of our suppliers, subcontractors, brokers, distributors, resellers, or TPSRs violates labor or other laws or implements labor or other business practices that are regarded as unethical, the shipment of finished products to us could be interrupted, orders could be canceled, relationships could be terminated and our reputation could be damaged. If one of our suppliers or subcontractors fails to procure necessary license rights to trademarks, copyrights or patents, legal action could be taken against us that could impact the salability of our products and expose us to financial obligations to a third-party. Any of these events could have a negative impact on our sales and results of operations.
Our employees, customers, suppliers and outsource partners are located throughout the world and, as a result, we face risks that other companies that are not global may not face.
Most of our products that are manufactured by or for us outside the U.S. are manufactured in Malaysia. If manufacturing in our facility, or a facility manufacturing products for us, in Malaysia is disrupted, our overall capacity would be significantly reduced and our business, financial condition, results of operation, and cash flows could be negatively impacted.
Our customers and suppliers are located throughout the world. In 2015, approximately
39%
percent of our revenue was generated outside the U.S. In addition, we have a number of research and development, administrative and sales facilities outside the U.S. and more than
50%
of our employees are employed outside the U.S. Most of our suppliers' operations are outside the U.S. and most of our products are manufactured outside the U.S., both internally and by third-parties.
Because we have sizable sales and operations, including outsourcing and procurement arrangements, outside of the U.S., we have more complexity in our operations and are exposed to a unique set of global risks that could negatively impact our business, financial condition, results of operations, and cash flows, including but not limited to: (i) currency fluctuations, (ii) import/export regulations, tariffs, trade barriers and trade disputes, customs classifications and certifications, including but not limited to changes in classifications or errors or omissions related to such classifications and certifications, (iii) changes in U.S. and non-U.S. rules related to trade, environmental, health and safety, technical standards, consumer and intellectual property and consumer protection, (iv) longer payment cycles, (v) tax issues, such as tax law changes, variations in tax laws from country to country and as compared to the U.S., obligations under tax incentive agreements, difficulties in repatriating cash generated or held abroad in a tax-efficient manner and difficulties in securing local country approvals for cash repatriations, (vi) changes in foreign exchange regulations, (vii) challenges in collecting accounts receivable, (viii) cultural and language differences, (ix) employment regulations and local labor conditions, (x) privacy and data protection regulations and restrictions, (xi) difficulties protecting intellectual property in foreign countries, (xii) instability in economic or political conditions, including inflation, recession and actual or anticipated military or political conflicts and terrorism, (xiii) natural disasters, (xiv) public health issues or outbreaks, (xv) changes in laws or regulations that negatively impact benefits being received by us or that require costly modifications in products sold or operations performed in such countries, (xvi) litigation in foreign court systems and foreign administrative proceedings, and (xvii) applicability of anti-corruption laws including the Foreign Corrupt Practices Act (“FCPA”) and the U.K. Bribery Act.
We have a number of employees, contractors, representatives and agents in, and sell our products and services throughout, the Middle East and our operations, as well as demand for our products and services, could be negatively impacted by political conflicts and hostilities in this region. The potential for future unrest, terrorist attacks, increased global conflicts, hostility against U.S.-based multinational companies and the escalation of existing conflicts has created worldwide uncertainties that have negatively impacted, and may continue to negatively impact, demand for certain of our products.
We also are subject to risks that our operations could be conducted by our employees, contractors, representatives or agents in ways that violate the FCPA, the U.K. Bribery Act, or other similar anti-corruption laws. While we have policies and procedures to comply with these laws, our employees, contractors, representatives and agents may take actions that violate our policies. Any such violations could have a negative impact on our business. Moreover, we face additional risks that our anti-
15
corruption policies and procedures may be violated by TPSRs or other third-parties that help sell our products or provide other solutions and services, because such TPSRs and other third parties are not our employees, and, it is therefore more difficult to oversee [and control] their conduct.
Many of our components and some of our products, including software, are developed and/or manufactured by third-parties and in some cases designed by third-parties and if such third-parties lack sufficient quality control, change the design of components or if there are significant changes in the financial or business condition of such third-parties, it may have a negative impact on our business.
We rely on third-parties to develop and/or manufacture many of our components and some of our finished products, and to design certain components and finished products, as well as provide us with software necessary for the operation of those products and we may increase our reliance such third-parties in the future. We could have difficulties fulfilling our orders and our sales and profits could decline if: (i) we are not able to engage such third-parties with the capabilities or capacities required by our business, (ii) such third-parties lack sufficient quality control or fail to deliver quality components, products, services or software on time and at reasonable prices, or deliver products, services or software that do not meet regulatory or industry standards or requirements, (iii) if there are significant changes in the financial or business condition of such third-parties, or (iv) if we have difficulties transitioning operations to such third-parties.
Because of the long life-cycle of many of our products, we need access to limited quantities of components for manufacturing and repair and suppliers have been and may continue to be unwilling to manufacture such components or may only do so at high prices. Certain key component suppliers are reducing the expected lifetime of key components, in particular semiconductor and electrical components, on some of our products. This could result in the need for more frequent product redesigns and increased engineering costs on some products or costly last time buys, which may negatively impact our financial performance. In addition, we may be unable to meet our repair obligations to our customers.
We are exposed to risks under large, multi-year system and solutions and services contracts that may negatively impact our business.
We enter into large, multi-year system and solutions and services contracts with large municipal, state, and nationwide government and commercial customers. In some cases we may not be the prime contractor and may be dependent on other third-parties such as commercial carriers or systems integrators. This exposes us to risks, including among others: (i) technological risks, especially when the contracts involve new technology, (ii) risk of defaults by third-parties on whom we are relying for products or services as part of our offering or who are the prime contractors, (iii) financial risks, including the estimates inherent in projecting costs associated with large, long-term contracts, the impact of currency fluctuations, inflation, and the related impact on operating results, (iv) cyber security risk, especially in managed services contracts with public safety and commercial customers that process data, and (v) political risk, especially related to the contracts with government customers. In addition, multi-year awards from governmental customers may often only receive partial funding initially and may typically be cancelable on short notice with limited penalties. Recovery of front loaded capital expenditures in long-term managed services contracts is dependent on the continued viability of such customers. The termination of funding for a government program or insolvency of commercial customer could result in a loss of anticipated future revenue attributable to that program, which could have an adverse impact on our profitability.
The expansion of our solutions and services business creates new competitors and new and increased areas of risk that we have not been exposed to in the past and that we may not be able to properly assess or mitigate.
We plan to continue to expand our solutions and services business by offering additional and expanded managed services for existing and new types of customers, such as designing, building, operating, managing and in some cases owning a public-safety system or other commercial system. The offering of managed services involves the integration of multiple services, multiple vendors and multiple technologies, requiring that we partner with other solutions and services providers, often on multi-year projects. In some cases, we must compete with a company in some business areas and cooperate with the same company in other business areas. From time to time such projects may require that we form a joint venture with or engage in joint development with our partners. Risks associated with expanding our managed services offerings include:
•
We may be unable to recognize revenue from the sale of equipment in connection with managed services contracts for a period of time, which may be several years.
•
T
he managed services business is one characterized by large subcontracting arrangements and we may not be able to obtain favorable contract terms or adequate indemnities or other protections from our subcontractors to adequately mitigate our exposure to our customers.
•
We may face increasing competition from traditional system integrators and the defense industry as solutions and services contracts become larger and more complicated.
•
Expansion will bring us into contact with new regulatory requirements and restrictions, such as data residency or data localization obligations, with which we will have to comply and may increase the costs of doing business, reduce margins and delay or limit the range of new solutions and services which we will be able to offer.
•
We may be required to agree to specific performance metrics that meet the customer's requirements for network security, availability, reliability, maintenance and support and, in some cases, if these performance metrics are not met we may not be paid.
16
Our success depends in part on our timely introduction of new products and technologies and our results can be impacted by the effectiveness of our significant investments in new products and technologies.
The markets for certain of our products are characterized by changing technologies and evolving industry standards. In some cases it is unclear what specific technology will be adopted in the market or what delivery model will prevail, including whether public safety LTE will be delivered via private networks, public carriers or some combination thereof. In addition, new technologies such as voice over LTE or push-to-talk clients over LTE could reduce sales of our traditional products. The shift to smart public safety and the prevalence of data in our customer’s use cases results in our competing in a more fragmented marketplace. In addition, new technologies and new competitors continue to enter our markets at a faster pace than we have experienced in the past, resulting in increased competition from non-traditional suppliers, including public carriers, telecom equipment providers, consumer device manufacturers and software companies. New products are expensive to develop and bring to market and additional complexities are added when this process is outsourced as we have done in certain cases or as we increase our reliance on third-party content and technology. Our success depends, in substantial part, on the timely and successful introduction of new products, upgrades and enhancements of current products to comply with emerging industry standards, laws and regulations, such as China's proprietary technology, PDT, and to address competing technological and product developments carried out by our competitors. Developing new technologies to compete in a specific market may not be financially viable, resulting in our inability to compete in that market. The R&D of new, technologically-advanced products is a complex and uncertain process requiring high levels of innovation and investment, as well as the accurate anticipation of technology and market trends. Many of our products and systems are complex and we may experience delays in completing development and introducing new products or technologies in the future. We may focus our resources on technologies that do not become widely accepted or are not commercially viable or involve compliance obligations with additional areas of regulatory requirements.
Our results are subject to risks related to our significant investment in developing and introducing new products. These risks include among others: (i) difficulties and delays in the development, production, testing and marketing of products, particularly when such activities are done through third-parties, (ii) customer acceptance of products, (iii) the development of, approval of, and compliance with industry standards and regulatory requirements, (iv) the significant amount of resources we must devote to the development of new technologies, and (v) the ability to differentiate our products and compete with other companies in the same markets.
If the quality of our products does not meet our customers' expectations or regulatory or industry standards, then our sales and operating earnings, and ultimately our reputation, could be negatively impacted.
Some of the products we sell may have quality issues resulting from the design or manufacture of the product, or from the software used in the product. Sometimes, these issues may be caused by components we purchase from other manufacturers or suppliers. Often these issues are identified prior to the shipment of the products and may cause delays in shipping products to customers, or even the cancellation of orders by customers. Sometimes, we discover quality issues in the products after they have been shipped to our customers, requiring us to resolve such issues in a timely manner that is the least disruptive to our customers, particularly in light of the mission-critical nature of our communications products. Such pre-shipment and post-shipment quality issues can have legal, financial and reputational ramifications, including: (i) delays in the recognition of revenue, loss of revenue or future orders, (ii) customer-imposed penalties for failure to meet contractual requirements, (iii) increased costs associated with repairing or replacing products, and (iv) a negative impact on our goodwill and brand name reputation.
In some cases, if the quality issue affects the product's performance, safety or regulatory compliance, then such a “defective” product may need to be “stop-shipped” or recalled. Depending on the nature of the quality issue and the number of products in the field, it could cause us to incur substantial recall or corrective field action costs, in addition to the costs associated with the potential loss of future orders and the damage to our goodwill or brand reputation. In addition, we may be required, under certain customer contracts, to pay damages for failed performance that might exceed the revenue that we receive from the contracts. Recalls and field actions involving regulatory non-compliance could also result in fines and additional costs. Recalls and field actions could result in third-party litigation by persons or companies alleging harm or economic damage as a result of the use of the products.
17
We have completed a number of large divestitures over the last several years and have ongoing obligations and potential liabilities associated with those transactions and the businesses we divested. In addition, these divestitures have resulted in less diversity of our business and our customer base, which could negatively impact our financial results in the event of a downturn in our mission-critical communications business.
Over the last several years we have spun-off or sold a number of large businesses, including Motorola Mobility, our Networks business and our Enterprise business. In connection with our divestitures we typically remain liable for certain pre-closing liabilities associated with the divested business, such as pension liabilities, taxes, employment, environmental liabilities and litigation. In the case of the sale of our Enterprise business we agreed to a multi-year non-compete which may limit our ability to develop and sell products for our commercial customers. In addition, although we often assign contracts associated with the divested business to a buyer in a divestiture, often that assignment will be subject to the consent of the contractual counterparty, which may not be obtained or may be conditioned, resulting in the company remaining liable under the contract. In connection with our divestitures we make representations and warranties and agree to covenants relating to the business divested. We remain liable for a period of time for breaches of representations, warranties and covenants and we also indemnify buyers in the event of such breaches and for other specific risks. Even though we establish reserves for any expected ongoing liability associated with divested businesses, those reserves may not be sufficient if unexpected liabilities arise and this could negatively impact our financial condition and future results of operations.
Because we are now singularly focused on mission-critical communications for public safety and commercial customers we have less diversity in our business and our customer base. A downturn in this business could have a greater negative impact on our financial results than when we were a more diversified communications provider.
We expect to continue to make strategic acquisitions of other companies or businesses and these acquisitions introduce significant risks and uncertainties, including risks related to integrating the acquired businesses and achieving benefits from the acquisitions.
In order to position ourselves to take advantage of growth opportunities or to meet other strategic needs such as product or technology gaps, we have made, and expect to continue to make, strategic acquisitions that involve significant risks and uncertainties. These risks and uncertainties include: (i) the difficulty or inability in integrating newly-acquired businesses and operations in an efficient and effective manner, particularly in light of the fact that certain of our enterprise legacy information systems including components of our ERP system are owned by Zebra and we are unable to make significant changes to these systems until completion of our new ERP implementation, (ii) risks associated with integrating financial reporting and internal control systems, particularly in light of the ERP system changes, (iii) the challenges in achieving strategic objectives, cost savings and other benefits from acquisitions, (iv) the risk that our contractual relationships or the markets do not evolve as anticipated and that the technologies acquired do not prove to be those needed to be successful in those markets, (v) the potential loss of key employees of the acquired businesses, (vi) the risk of diverting the attention of senior management from our operations, (vii) the risks of entering new markets in which we have limited experience, (viii) difficulties in integrating information technology systems and other business processes to accommodate the acquired businesses and (ix) future impairments of goodwill of an acquired business. In particular, failure to achieve targeted cost and revenue synergies could negatively impact our business performance.
Certain acquisition candidates in the industries in which we participate may carry higher relative valuations (based on revenues, earnings, cash flow, or other relevant multiples) than we do. This is particularly evident in software and certain services businesses. Acquiring a business that has a higher relative valuation than Motorola Solutions may be dilutive to our earnings. In addition, we may not pursue opportunities that are highly dilutive to near-term earnings.
Key employees of acquired businesses may receive substantial value in connection with a transaction in the form of cash payments for their ownership interest, particularly in the case of founders and other shareholder employees, change-in-control agreements, acceleration of stock options and the lifting of restrictions on other equity-based compensation rights. To retain such employees and integrate the acquired business, we may offer additional retention incentives, but it may still be difficult to retain certain key employees.
We face many risks relating to intellectual property rights.
Our business will be harmed if: (i) we, our customers and/or our suppliers are found to have infringed intellectual property rights of third-parties, (ii) the intellectual property indemnities in our supplier agreements are inadequate to cover damages and losses due to infringement of third-party intellectual property rights by supplier products, (iii) we are required to provide broad intellectual property indemnities to our customers, (iv) our intellectual property protection is inadequate to protect against threats of misappropriation from internal or external sources or otherwise inadequate to protect our proprietary rights, or (v) our competitors negotiate significantly more favorable terms for licensed intellectual property. We may be harmed if we are forced to make publicly available, under the relevant open-source licenses, certain internally developed software-related intellectual property as a result of either our use of open-source software code or the use of third-party software that contains open-source code.
Since our products are comprised of complex technology, much of which we acquire from suppliers through the purchase of components or licensing of software, we are often involved in or impacted by assertions, including both requests for licenses and litigation, regarding patent and other intellectual property rights. Third-parties have asserted, and in the future may assert, intellectual property infringement claims against us and against our customers and suppliers. Many of these assertions are brought by non-practicing entities whose principle business model is to secure patent licensing-based revenue from product manufacturing companies. The patent holders often make broad and sweeping claims regarding the applicability of their patents
18
to our products, seeking a percentage of sales as licenses fees, seeking injunctions to pressure us into taking a license, or a combination thereof. Defending claims may be expensive and divert the time and efforts of our management and employees. Increasingly, third-parties have sought broad injunctive relief which could limit our ability to sell our products in the U.S. or elsewhere with intellectual property subject to the claims. If we do not succeed in any such litigation, we could be required to expend significant resources to pay damages, develop non-infringing products or to obtain licenses to the intellectual property that is the subject of such litigation, each of which could have a negative impact on our financial results. However, we cannot be certain that any such licenses, if available at all, will be available to us on commercially reasonable terms. In some cases, we might be forced to stop delivering certain products if we or our customer or supplier are subject to a final injunction.
We attempt to negotiate favorable intellectual property indemnities with our suppliers for infringement of third-party intellectual property rights. However, there is no assurance that we will be successful in our negotiations or that a supplier's indemnity will cover all damages and losses suffered by us and our customers due to the infringing products or that a supplier will choose to accept a license or modify or replace its products with non-infringing products which would otherwise mitigate such damages and losses. Further, we may not be able to participate in intellectual property litigation involving a supplier and may not be able to influence any ultimate resolution or outcome that may negatively impact our sales if a court enters an injunction that enjoins the supplier's products or if the International Trade Commission issues an exclusionary order that blocks our products from importation into the U.S. Intellectual property disputes involving our suppliers have resulted in our involvement in International Trade Commission proceedings from time to time. These proceedings are costly and entail the risk that we will be subjected to a ban on the importation of our products into the U.S. solely as a result of our use of a supplier's components.
In addition, our customers increasingly demand that we indemnify them broadly from all damages and losses resulting from intellectual property litigation against them. These demands stem from the increasing trend of the non-practicing entities that engage in patent enforcement and litigation targeting the end users of our products. End users are targeted so the non-practicing entities can seek royalties and litigation judgments in proportion to the value of the use of our products, rather than in proportion to the cost of our products. Such demands can amount to many times the selling price of our products.
Our patent and other intellectual property rights are important competitive tools and may generate income under license agreements. We regard our intellectual property as proprietary and attempt to protect it with patents, copyrights, trademarks, trade secret laws, confidentiality agreements and other methods. We also generally restrict access to and distribution of our proprietary information. Despite these precautions, it may be possible for a third-party to obtain and use our proprietary information or develop similar technology independently. In addition, effective patent, copyright, trademark and trade secret protection may be unavailable or limited in certain foreign countries. Unauthorized use of our intellectual property rights by third-parties and the cost of any litigation necessary to enforce our intellectual property rights could have a negative impact on our financial results.
As we expand our business, including through acquisitions, and compete with new competitors in new markets, the breadth and strength of our intellectual property portfolio in those new markets may not be as developed as in our longer-standing businesses. This may expose us to a heightened risk of litigation and other challenges from competitors in these new markets. Further, competitors may be able to negotiate significantly more favorable terms for licensed intellectual property than we are able to, which puts them at a competitive advantage.
Tax matters could have a negative impact on our financial condition and results of operations.
We are subject to income taxes in the U.S. and numerous foreign tax jurisdictions. Our provision for income taxes and cash tax liability may be negatively impacted by: (i) changes in the mix of earnings taxable in jurisdictions with different statutory tax rates, (ii) changes in tax laws and accounting principles, (iii) changes in the valuation of our deferred tax assets and liabilities, (iv) failure to meet commitments under tax incentive agreements, (v) discovery of new information during the course of tax return preparation, (vi) increases in nondeductible expenses, or (vii) difficulties in repatriating cash held abroad in a tax-efficient manner.
Tax audits may also negatively impact our business, financial condition and results of operations. We are subject to continued examination of our income tax returns, and tax authorities may disagree with our tax positions and assess additional tax. We regularly evaluate the likelihood of adverse outcomes resulting from these examinations to determine the adequacy of our provision for income taxes. There can be no assurance that the outcomes from these continuing examinations will not have a negative impact on our future financial condition and operating results.
Our success depends in part upon our ability to attract, retain and prepare succession plans for senior management and key employees.
The performance of our CEO, senior management and other key employees is critical to our success. If we are unable to retain talented, highly qualified senior management and other key employees or attract them when needed, it could negatively impact our business. We rely on the experience of our senior management, most of whom have been with the Company for many years and as a result have specific knowledge relating to us and our industry that is difficult to replace and competition for management with experience in the communications industry is intense. A loss of the CEO, a member of senior management or key employee particularly to a competitor could also place us at a competitive disadvantage. Further, if we fail to adequately plan for the succession of our CEO, senior management and other key employees, our business could be negatively impacted.
19
It may be difficult for us to recruit and retain the types of engineers and other highly-skilled employees that are necessary to remain competitive and layoffs of such skilled employees as a result of divestitures, restructuring activities or cost reductions may benefit our competitors.
Competition for key technical personnel in high-technology industries is intense. As we expand our solutions and services business we have an even greater demand for technical personnel in areas like software development than we have historically had and competition for such resources is greater. We believe that our future success depends in large part on our continued ability to hire, assimilate, retain and leverage the skills of qualified engineers and other highly-skilled personnel needed to develop successful new products or services. We may not be as successful as our competitors at recruiting, assimilating, retaining and utilizing these highly-skilled personnel, which could have a negative impact on our business. In addition, as we have divested businesses and restructured our operations we have, in some cases, had to layoff engineers and other highly skilled employees. If these employees were to go to work for our competitors it could have a negative impact on our business.
We may not have the ability to settle the principal amount of the $1 billion of 2% Senior Convertible Notes (the "Senior Convertible Notes") in cash in the event of conversion or to repurchase the Senior Convertible Notes upon the occurrence of a fundamental change.
Our Senior Convertible Notes are convertible any time on or after two years from their issuance date, except in certain limited circumstances. In the event of conversion, the Company currently intends to settle the principal amount of the Senior Convertible Notes in cash.
If we do not have adequate cash available, either from cash on hand, funds generated from operations or existing financing arrangements, or we cannot obtain additional financing arrangements, we may not be able to settle the principal amount of the Senior Convertible Notes in cash and, in the case of settlement of conversion elections, will be required to settle the principal amount of the Senior Convertible Notes in stock. If we settle any portion of the principal amount of the Senior Convertible Notes in stock, it will result in immediate, and possibly material, dilution to the interests of existing security holders.
Following any conclusion that we no longer have the ability to settle the Senior Convertible Notes in cash, we will be required on a going forward basis to change our accounting policy for earnings per share from the treasury stock method to the if-converted method. Earnings per share will most likely be lower under the if-converted method as compared to the treasury stock method.
Our ability to repurchase the Senior Convertible Notes in cash upon the occurrence of a fundamental change or make any other required payments may be limited by law or the terms of other agreements relating to our indebtedness outstanding at the time. Our failure to repurchase the Senior Convertible Notes when required would result in an event of default with respect to the Senior Convertible Notes and may constitute an event of default or prepayment under, or result in the acceleration of the maturity of, our then-existing indebtedness.
The accounting for convertible debt securities that may be settled in cash or in shares of common stock could have a material effect on our reported financial results.
Under U.S. GAAP, an entity must separately account for the debt component and the embedded conversion option of convertible debt instruments that may be settled entirely or partially in cash or in shares of common stock upon conversion, such as our Senior Convertible Notes, in a manner that reflects the issuer’s effective interest cost. The fair value of the embedded conversion option is classified as an addition to stockholder’s equity. The difference between book carrying cost and face value of the debt represents a non-cash discount. This difference will be amortized into interest expense over the estimated life of the Senior Convertible Notes using the effective yield method. As a result, we will be required to record a greater amount of non-cash interest expense as a result of the amortization of their discount over the term of the Senior Convertible Notes. Accordingly, we will report lower net income because of the recognition of both the current period’s discount amortization and the Senior Convertible Notes’ coupon interest, which could adversely affect the trading price of our shares of common stock and the trading price (if any) of the Senior Convertible Notes.
Under certain circumstances, convertible debt instruments (such as the Senior Convertible Notes) that may be settled entirely or partially in cash are evaluated for their impact on earnings per share utilizing the treasury stock method, the effect of which is that the shares issuable upon conversion of the Senior Convertible Notes are not included in the calculation of diluted earnings per share except to the extent that the conversion value of the Senior Convertible Notes exceeds their principal amount. Under the treasury stock method the number of shares outstanding for purposes of calculating diluted earnings per share includes the number of shares that would be required to settle the excess of the conversion value of the Senior Convertible Notes, if any, over the principal amounts of the Senior Convertible Notes (which would be settled in cash). The conversion value of the Senior Convertible Notes will exceed the principal amount of the notes to the extent the trading price of a share of our stock exceeds $68.50. We intend to settle the principal amount of the convertible notes in cash. However, we may not have access to the capital markets for financing on acceptable terms and conditions, particularly if our credit ratings are downgraded. Accordingly, we may be forced to fully settle the Senior Convertible Notes in shares of common stock upon conversion, the effect of which would cause the dilutive impact to earnings per share to be significantly in excess of the dilutive impact reflected by the treasury stock method.
20
Returns on pension and retirement plan assets and interest rate changes could affect our earnings and cash flows in future periods.
Although we engaged in pension de-risking activities in 2014, we continue to have large underfunded pension obligations, in part resulting from the fact that we retained almost all of the U.S. pension liabilities and a major portion of our non-U.S. pension liabilities following our divestitures, including the distribution of Motorola Mobility, the sale of our Networks business and the sale of our Enterprise business. The funding position of our pension plans is affected by the performance of the financial markets, particularly the equity and debt markets, and the interest rates used to calculate our pension obligations for funding and expense purposes. Minimum annual pension contributions are determined by government regulations and calculated based upon our pension funding status, interest rates, and other factors. If the financial markets perform poorly, we have been and could be required to make additional large contributions. The equity and debt markets can be volatile, and therefore our estimate of future contribution requirements can change dramatically in relatively short periods of time. Similarly, changes in interest rates can affect our contribution requirements. In volatile capital market environments, the uncertainty of material changes in future minimum required contributions increases.
Changes in our operations or sales outside the U.S. markets could result in lost benefits in impacted countries and increase our cost of doing business.
We have entered into various agreements with non-U.S. governments, agencies or similar organizations under which we receive certain benefits relating to its operations and/or sales in the jurisdiction. If our circumstances change, and operations or sales are not at levels originally anticipated, we may be at risk of having to reimburse benefits already granted, and losing some or all of these benefits and increasing our cost of doing business.
We transferred a significant portfolio of intellectual property rights, including patents, to Motorola Mobility and Zebra and we are unable to leverage these intellectual property rights as we did prior to the distribution of Motorola Mobility or the sale of our Enterprise business.
We contributed approximately 17,200 granted patents and approximately 8,000 pending patent applications worldwide to Motorola Mobility in connection with the distribution. We also transferred approximately 2,700 granted patents and approximately 800 pending patent applications to Zebra in connection with the sale of the Enterprise business. Although we have a worldwide, perpetual, royalty-free license to these patents and other intellectual property rights, we no longer own them. As a result we are unable to leverage these intellectual property rights for purposes of generating licensing revenue or entering into favorable licensing arrangements with third-parties. As a result we may incur increased license fees or litigation costs. Although we cannot predict the extent of such unanticipated costs, it is possible such costs could negatively impact our financial results.
We are subject to a wide range of product regulatory and safety, consumer, worker safety and environmental laws that continue to expand and could impact our ability to grow our business, could subject us to unexpected costs and liabilities and could impact our financial performance.
Our operations and the products we manufacture and/or sell are subject to a wide range of product regulatory and safety, consumer, worker safety and environmental laws. Compliance with such existing or future laws could subject us to future costs or liabilities, impact our production capabilities, constrict our ability to sell, expand or acquire facilities, restrict what products and services we can offer, and generally impact our financial performance. Some of these laws are environmental and relate to the use, disposal, clean up of, and exposure to certain substances. For example, in the U.S., laws often require parties to fund remedial studies or actions regardless of fault and often times in response to action or omissions that were legal at the time they occurred. We continue to incur disposal costs and have ongoing remediation obligations. Changes to environmental laws or our discovery of additional obligations under these laws could have a negative impact on our financial performance.
Laws focused on: (i) the energy efficiency of electronic products and accessories, (ii) recycling of both electronic products and packaging, (iii) reducing or eliminating certain hazardous substances in electronic products, (iv) and the transportation of batteries continue to expand significantly. Laws pertaining to accessibility features of electronic products, standardization of connectors and power supplies, the transportation of lithium-ion batteries and other aspects of our products are also proliferating. There are also demanding and rapidly changing laws around the globe related to issues such as product safety, radio interference, radio frequency radiation exposure, medical related functionality, and consumer and social mandates pertaining to use of wireless or electronic equipment. These laws, and changes to these laws, could have a substantial impact on whether we can offer certain products, solutions and services, on product costs, and on what capabilities and characteristics our products or services can or must include.
These laws could impact our products and negatively affect our ability to manufacture and sell products competitively. We expect these trends to continue. In addition, we anticipate that we will see increased demand to meet voluntary criteria related to reduction or elimination of certain constituents from products, increasing energy efficiency, and providing additional accessibility.
21
We may be unable to obtain components and parts that are verified to be Democratic Republic of Congo ("DRC") Conflict Free, which could result in reputational damage if we disclose that our products include minerals that have been identified as “not found to be DRC conflict free” or if we disclose that we are unable to determine whether such minerals are included in our products.
The Dodd-Frank Wall Street Reform and Consumer Protection Act included disclosure requirements regarding the use of tin, tantalum, tungsten and gold (which are defined as “conflict minerals”) in our products and if the origin of these materials were from the DRC or an adjoining country. If the minerals originated from the DRC or an adjoining country then a company must disclose the measures it has taken to exercise due diligence and chain of custody to prevent the sourcing of such minerals that have been found to be financing conflict in the DRC. There is a limited pool of suppliers who can provide verifiable DRC Conflict Free components and parts, particularly since our supply chain is complex. As a result, we may be required to publicly disclose that we are not currently able to determine if the products we manufactured in 2015 are DRC Conflict Free. For future reporting years, if the industry systems that we are relying on are not mature enough for us to make a definitive Conflict Free determination, we may have to declare our products as “not found to be DRC conflict free,” or such other definitional standard as determined by the SEC and/or the judicial system and we may face reputational challenges with our customers, other stockholders and the activist community as a result. In addition, the European Union is in the process of drafting conflict minerals legislation which may have an impact on our reporting obligations and compliance programs in Europe.
None.
Motorola Solutions' principal executive offices are located at 1303 East Algonquin Road, Schaumburg, Illinois 60196. Motorola Solutions also operates manufacturing facilities and sales offices in other U.S. locations and in many other countries.
As of
December 31, 2015
, we: (i) owned
10
facilities (manufacturing, sales, service, and office),
seven
of which were located in North America and
three
of which were located in other countries; (ii) leased
154
facilities,
66
of which were located in North America and South America and
88
of which were located in other countries; and (iii) primarily utilized four major facilities for the manufacturing and distribution of our products, located in: Penang, Malaysia; Schaumburg, Illinois; Elgin, Illinois; and Berlin, Germany. Motorola Solutions sold its Penang, Malaysia facility and manufacturing operations to Sanmina Corporation ("Sanmina") on February 1, 2016.
We generally consider the productive capacity of our manufacturing facilities to be adequate and sufficient for our requirements. The extent of utilization of each manufacturing facility varies throughout the year.
In
2015
, a substantial portion of our products were manufactured in our owned facilities in Malaysia and Illinois. Approximately
25%
of our manufacturing, based on volume, is done by a small number of non-affiliated electronics manufacturing suppliers and distribution and logistics services providers, most of which are outside the U.S. We rely on these third-party providers in order to enhance our ability to lower costs and deliver products that meet demand. If manufacturing in Malaysia, Illinois, or by third-parties were disrupted, our overall productive capacity could be significantly reduced.
We are a defendant in various lawsuits, claims, and actions, which arise in the normal course of business. In the opinion of management, the ultimate disposition of these matters will not have a material adverse effect on our consolidated financial position, liquidity, or results of operations. However, an unfavorable resolution could have a material adverse effect on our consolidated financial position, liquidity, or results of operations in the periods in which the matters are ultimately resolved, or in the periods in which more information is obtained that changes management's opinion of the ultimate disposition.
Not applicable.
Executive Officers of the Registrant
The following are the persons who were the executive officers of Motorola Solutions, their ages, and their current titles as of
February 22, 2016
and the positions they have held during the last five years with the Company:
Gregory Q. Brown; age 55; Chairman and Chief Executive Officer since May 3, 2011; President and Chief Executive Officer from January 2011 to May 2011.
Gino A. Bonanotte; age 51; Executive Vice President and Chief Financial Officer since November 13, 2013; Corporate Vice President and Acting Chief Financial Officer from August 2013 to November 2013; Corporate Vice President, Finance, Sales and Field Operations, from October 2012 to August 2013; and Corporate Vice President, Finance, Product and Business Operations and Americas Field Operations from September 2010 to October 2012.
Bruce W. Brda; age 53; Executive Vice President, Products & Services since January 4, 2016; Executive Vice President, Systems & Products from May 2015 to January 2016; Senior Vice President, Systems & Products from December 2014 to May 2015; Senior Vice President, Government Solutions from March 2014 to December 2014; Senior Vice President, Global Solutions & Services from January 2013 to March 2014; Senior Vice President, Global Services from July 2011 to January 2013; and Senior Vice President and General Manager, Advanced Services from January 2011 to July 2011.
22
Eduardo F. Conrado; age 49; Executive Vice President and Chief Strategy & Innovation Officer since August 24, 2015; Senior Vice President and Chief Innovation Officer from January 2015 to August 2015; Senior Vice President, Marketing and IT from January 2013 to January 2015; Senior Vice President, Chief Marketing Officer from January 2011 to January 2013; and Senior Vice President and Chief Marketing Officer, Motorola Solutions business from September 2010 to January 2011.
Mark S. Hacker; age 44; Executive Vice President, General Counsel and Chief Administrative Officer since January 21, 2015; Senior Vice President and General Counsel from June 2013 to January 2015; Corporate Vice President, Law, Sales and Product Operations, International and Legal Operations from January 2013 to June 2013; Corporate Vice President, Law, Sales and Field Operations and Legal Operations from January 2012 to January 2013; Vice President, Sales and Field Operations and Legal Operations from November 2011 to January 2012; Vice President, Legal Operations and International Law from April 2011 to November 2011; and Vice President, Law from September 2010 to April 2011.
John P. "Jack" Molloy; age 44; Executive Vice President, Worldwide Sales since January 4, 2016; Executive Vice President, Americas Sales & Services from November 2015 to January 2016; Senior Vice President, The Americas Sales & Marketing from September 2015 to November 2015; Senior Vice President, North America Sales from January 2014 to August 2015; Corporate Vice President, Central US & Canada and NA Energy Market from January 2013 to December 2013: Vice President, Central US & Canada Sales from July 2011 to December 2012; and Director of Sales, Central US from January 2007 to June 2011.
John K. Wozniak; age 44; Corporate Vice President and Chief Accounting Officer since November 3, 2009.
The above executive officers will serve as executive officers of Motorola Solutions until the regular meeting of the Board of Directors in May 2016 or until their respective successors are elected. There is no family relationship between any of the executive officers listed above.
23
Motorola Solutions' common stock is listed on the New York Stock Exchange. The number of stockholders of record of its common stock on February 1,
2016
was
32,725
.
Information regarding securities authorized for issuance under equity compensation plans is incorporated by reference to the information under the caption “Equity Compensation Plan Information” of Motorola Solutions’ Proxy Statement for the
2016
Annual Meeting of Stockholders. The remainder of the response to this Item incorporates by reference Note 16, “Quarterly and Other Financial Data (unaudited)” of the Notes to Consolidated Financial Statements appearing under “Item 8: Financial Statements and Supplementary Data.’’
The following table provides information with respect to acquisitions by the Company of shares of its common stock during the quarter ended
December 31, 2015
.
ISSUER PURCHASES OF EQUITY SECURITIES
|
Period
|
(a) Total Number
of Shares
Purchased
|
(b) Average Price
Paid per
Share
(1)
|
(c) Total Number
of Shares Purchased
as Part of Publicly
Announced Plans
or Program
(2)
|
(d) Approximate Dollar
Value of Shares that
May Yet Be Purchased
Under the Plans or
Program
(2)
|
|||||||||
|
9/30/15 to 10/27/15
|
2,036,950
|
|
$
|
69.28
|
|
2,036,950
|
|
$
|
1,071,794,030
|
|
|||
|
10/28/15 to 11/24/15
|
551,800
|
|
$
|
69.17
|
|
551,800
|
|
$
|
1,033,625,234
|
|
|||
|
11/25/15 to 12/28/15
|
—
|
|
$
|
—
|
|
—
|
|
$
|
1,033,625,234
|
|
|||
|
Total
|
2,588,750
|
|
$
|
69.25
|
|
2,588,750
|
|
||||||
|
(1)
|
Average price paid per share of common stock repurchased is the execution price, including commissions paid to brokers.
|
|
(2)
|
Through actions taken on July 28, 2011, January 30, 2012, July 25, 2012, July 22, 2013, and November 4, 2014 the Board of Directors has authorized the Company to repurchase an aggregate amount of up to $12.0 billion of its outstanding shares of common stock (the “share repurchase program”). The share repurchase program does not have an expiration date. As of December 31, 2015, the Company had used approximately $11.0 billion, including transaction costs, to repurchase shares.
|
24
PERFORMANCE GRAPH
The following graph compares the five-year cumulative total returns of Motorola Solutions, Inc., the S&P 500 Index and the S&P Communications Equipment Index.
This graph assumes $100 was invested in the stock or the indices on December 31, 2010 and reflects the payment of dividends, including the Company's distribution to its shareholders of one share of Motorola Mobility for every eight shares of its common stock on January 4, 2011. For purposes of this graph, the Motorola Mobility distribution is treated as a dividend of $26.46 per share (post the 1-for-7 reverse stock split announced on the same day, January 4, 2011) paid at the close of business January 4, 2011.
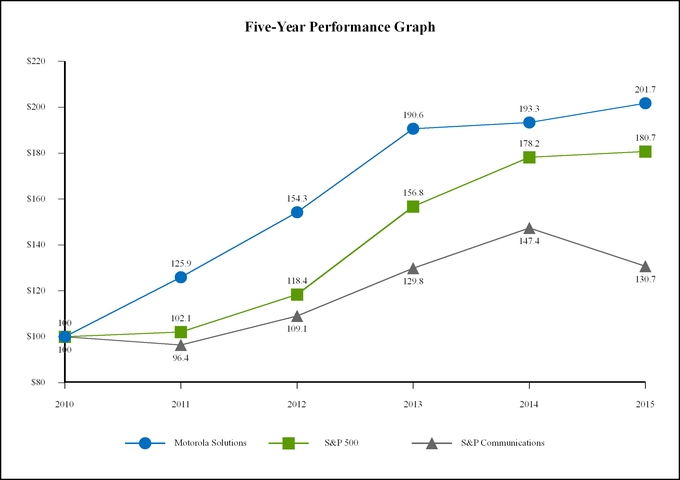
25
|
Years Ended December 31
|
|||||||||||||||||||
|
(In millions, except per share amounts)
|
2015
|
2014
|
2013
|
2012
|
2011
|
||||||||||||||
|
Operating Results
|
|||||||||||||||||||
|
Net sales
|
$
|
5,695
|
|
$
|
5,881
|
|
$
|
6,227
|
|
$
|
6,269
|
|
$
|
5,738
|
|
||||
|
Operating earnings (loss)
|
994
|
|
(1,006
|
)
|
947
|
|
920
|
|
598
|
|
|||||||||
|
Earnings (loss) from continuing operations, net of tax*
|
640
|
|
(697
|
)
|
933
|
|
670
|
|
582
|
|
|||||||||
|
Per Share Data (in dollars)
|
|||||||||||||||||||
|
Diluted earnings (loss) from continuing operations per common share*
|
$
|
3.17
|
|
$
|
(2.84
|
)
|
$
|
3.45
|
|
$
|
2.25
|
|
$
|
1.71
|
|
||||
|
Earnings per diluted common share*
|
3.02
|
|
5.29
|
|
4.06
|
|
2.96
|
|
3.41
|
|
|||||||||
|
Diluted weighted average common shares outstanding (in millions)
|
201.8
|
|
245.6
|
|
270.5
|
|
297.4
|
|
339.7
|
|
|||||||||
|
Dividends declared per share
|
$
|
1.43
|
|
$
|
1.30
|
|
$
|
1.14
|
|
$
|
0.96
|
|
$
|
0.22
|
|
||||
|
Balance Sheet
|
|||||||||||||||||||
|
Total assets
|
$
|
8,387
|
|
$
|
10,423
|
|
$
|
11,851
|
|
$
|
12,679
|
|
$
|
13,929
|
|
||||
|
Total debt
|
4,390
|
|
3,400
|
|
2,461
|
|
1,863
|
|
1,535
|
|
|||||||||
|
Other Data
|
|||||||||||||||||||
|
Capital expenditures
|
$
|
175
|
|
$
|
181
|
|
$
|
169
|
|
$
|
170
|
|
$
|
165
|
|
||||
|
% of sales
|
3.1
|
%
|
3.1
|
%
|
2.7
|
%
|
2.7
|
%
|
2.9
|
%
|
|||||||||
|
Research and development expenditures
|
$
|
620
|
|
$
|
681
|
|
$
|
761
|
|
$
|
790
|
|
$
|
778
|
|
||||
|
% of sales
|
10.9
|
%
|
11.6
|
%
|
12.2
|
%
|
12.6
|
%
|
13.6
|
%
|
|||||||||
* Amounts attributable to Motorola Solutions, Inc. common shareholders.
26
The following is a discussion and analysis of our financial position as of December 31,
2015
and
2014
and results of operations for each of the three years in the period ended
December 31, 2015
. This commentary should be read in conjunction with our consolidated financial statements and the notes thereto appearing under “Item 8: Financial Statements and Supplementary Data.”
Executive Overview
Recent Developments
On February 19, 2016, we completed the acquisition of 100% of the equity interest in Guardian Digital Communications Limited ("GDCL"), a holding company of Airwave Solutions Limited ("Airwave"), the largest private operator of a public safety network in the world. The equity interest was acquired for the sum of £1, after which we invested into GDCL net cash of approximately £700 million, or approximately $1 billion, to settle all third party debt. We will make a deferred cash payment of £64 million, or approximately $90 million, on November 15, 2018. We funded the investment with a $675 million term loan and approximately $400 million of international cash on hand. The acquisition of Airwave enables us to grow revenue and geographically diversify our global Managed & Support services offerings within our Services segment, while offering a proven service delivery platform to build on for providing innovative, leading, mission-critical communications solutions and services to customers.
Our Business
We are a leading global provider of mission-critical communication infrastructure, devices, accessories, software, and services. Our products and services help government, public safety, and commercial customers improve their operations through increased effectiveness, efficiency, and safety of their mobile workforces. We serve our customers with a global footprint of sales in more than 100 countries based on our industry leading innovation and a deep portfolio of products and services.
We conduct our business globally and manage it through two segments:
Products:
The Products segment is comprised of Devices and Systems. Devices includes two-way portable and vehicle mounted radios, accessories, and software features and upgrades. Systems includes the radio network core and central processing software, base stations, consoles, repeaters, and software applications and features. The primary customers of the Products segment are government, public safety and first-responder agencies, municipalities, and commercial and industrial customers who operate private communications networks and manage a mobile workforce. In
2015
, the segment’s net sales were
$3.7 billion
, representing
65%
of our consolidated net sales.
Services:
The Services segment provides a full set of service offerings for government, public safety, and commercial communication networks including: (i) Integration services, (ii) Managed & Support services, and (iii) iDEN services. Integration services includes the implementation, optimization, and integration of systems, devices, software, and applications. Managed & Support services includes a continuum of service offerings beginning with repair, technical support, and hardware maintenance. More advanced offerings include network monitoring, software maintenance, and cyber security services. Managed service offerings range from partial or full operation of customer owned networks to operation of Motorola Solutions owned networks. Services are provided across all radio network technologies, Command Center Consoles, and Smart Public Safety Solutions. iDEN services consists primarily of hardware and software maintenance services for our legacy iDEN customers. In
2015
, the segment’s net sales were
$2.0 billion
, representing
35%
of our consolidated net sales.
Trends Affecting Our Business
Impact of Macroeconomic Conditions:
The stronger U.S. dollar has had a negative impact on sales denominated in currencies other than the U.S. dollar. In addition, weakening economic conditions and a significant drop in global commodity prices has negatively impacted sales in Latin America and Eastern Europe. The weakening dollar has reduced the purchasing power of our customers, and the lower price of commodities has negatively impacted government budgets and funds available for the purchase of our products in these regions.
The impact of foreign exchange rate fluctuations on net earnings is partially mitigated by the following: (i) the majority of our revenues are derived from contracts within North America denominated in U.S. dollars, (ii) the cost of sales for the delivery of our Services offerings are predominately labor costs incurred within the same geographic region as the associated sales, resulting in minimal impact of foreign exchange rates on gross margin within the Services segment, and (iii) a significant portion of our operating expenses are denominated in foreign currencies as a result of our offshore R&D and selling, general, and administrative ("SG&A") footprint.
Cost Savings Initiatives:
We are committed to employing disciplined financial policies and driving continuous efficiencies and improvements in our cost structure. We expect to reduce SG&A and R&D expenses during 2016 by approximately $150 million in comparison to
2015
.
Growth of Our Services Portfolio:
Our Services segment is expected to grow at a higher rate than our Products segment. Overall, the Services segment has a lower gross margin percentage than the Products segment, but we expect consolidated operating margins to continue to expand.
27
iDEN:
We have experienced a downward trend in iDEN product and services sales over the last three years due to decreased demand as a result of the dated nature of the technology. We expect the downward trend to continue as service contracts expire and new technology replaces iDEN equipment in the marketplace. This trend primarily relates to our Services segment as the majority of iDEN sales are hardware and software maintenance services. The expected decline in iDEN sales will impact both revenues and gross margins within the Services segment as iDEN services’ gross margins are generally higher than the remainder of our services portfolio.
Change in Presentation
During the first quarter of
2015
, we restructured our regions operationally separating the Asia Pacific and Middle East region into two regions which are now reflected as Asia Pacific ("AP") and Middle East ("ME"). As a result of this change, our sales force is better aligned and focused on the growth opportunities within each geographic region. Accordingly, we now report net sales in the following five geographic regions: North America, Latin America, Europe and Africa ("EA"), AP, and ME. We have updated all periods presented to reflect this change in presentation.
What were our
2015
financial results?
|
•
|
Net sales were
$5.7 billion
in
2015
compared to
$5.9 billion
in
2014
. Net sales in
2015
included the unfavorable impact of foreign currency fluctuations primarily within EA, AP, and Latin America, partially offset by growth in North America.
|
|
•
|
Operating earnings were
$1.0 billion
in
2015
, compared to an operating loss of
$1.0 billion
in
2014
. Included in the 2014 operating loss was a
$1.9 billion
pension settlement loss.
|
|
•
|
Earnings from continuing operations were
$640 million
, or
$3.17
per diluted common share in
2015
, compared to losses of
$697 million
, or
$(2.84)
per diluted common share in
2014
.
|
|
•
|
Cash provided by operating activities was
$1.0 billion
in
2015
, compared to cash used for operating activities of
$685 million
in
2014
. Pension plan contributions were
$13 million
in
2015
and
$1.3 billion
in
2014
.
|
|
•
|
We repurchased
$3.2 billion
of our shares and paid
$277 million
in cash dividends during
2015
.
|
What were the financial results for our two segments in
2015
?
|
•
|
In the Products segment, net sales were
$3.7 billion
in
2015
, a
decrease
of
$131 million
, or
3%
, compared to
$3.8 billion
in
2014
. On a geographic basis, net sales decreased in EA and Latin America and increased in North America, AP, and ME, compared to
2014
. Operating earnings were
$704 million
in
2015
, compared to an operating loss of
$667 million
in
2014
. Operating margin increased in
2015
to
19.2%
from
(17.5)%
in
2014
. Approximately
$1.3 billion
of pension settlement losses were allocated to the Products segment in 2014.
|
|
•
|
In the Services segment, net sales were
$2.0 billion
in
2015
, a
decrease
of
$55 million
, or
3%
, compared to
$2.1 billion
in
2014
. On a geographic basis, net sales decreased in EA, Latin America, and AP and increased in ME and North America, compared to
2014
. Operating earnings were
$290 million
in
2015
, compared to an operating loss of
$339 million
in
2014
. Operating margin increased in
2015
to
14.4%
from
(16.3)%
in
2014
. Approximately
$584 million
of pension settlement losses were allocated to the Services segment in 2014.
|
What were our major accomplishments in 2015?
Structural highlights
|
•
|
On August 4, 2015, the Board of Directors authorized a modified "Dutch auction" tender offer to repurchase up to $2.0 billion of our outstanding common stock under the previously existing share repurchase authority. The tender offer commenced on August 7, 2015 and expired on September 3, 2015. We paid $2.0 billion, including transaction costs, to repurchase approximately 30.1 million shares at a tender price of $66.50 per share;
|
|
•
|
On August 25, 2015, we entered into an agreement with Silver Lake Partners to issue $1.0 billion of 2% Senior Convertible Notes (the "Senior Convertible Notes") which mature in September 2020. The investment provides capital and a financial partnership to work together on opportunities in software and services growth areas; and
|
|
•
|
Reduced operating expenses by more than $200 million as compared to
2014
, including reorganizing our R&D and SG&A functions. This reorganization both reduced costs and enabled efficiencies that shifted more investment into key areas such as Services and Public Safety LTE solutions.
|
Business highlights
|
•
|
Ended
2015
with a record backlog position of
$6.5 billion
, up 12% compared to
2014
;
|
|
•
|
Grew revenue
3%
in North America,
32%
in the Middle East, and
1%
in Asia Pacific;
|
|
•
|
Grew diluted earnings per share from continuing operations to
$3.17
;
|
|
•
|
In November
2015
, we increased our quarterly dividend by 21% to
$0.41
per share;
|
|
•
|
Grew Managed & Support services by 1%;
|
|
•
|
Increased operating cash flows to
$1.0 billion
;
|
|
•
|
Returned
$3.5 billion
in capital in the form of
$3.2 billion
in share repurchases and
$277 million
in dividends; and
|
28
|
•
|
We were awarded a portion of the largest public safety LTE contract in 2015 with the United Kingdom government covering more than 300,000 emergency and public service users at more than 300 agencies across Great Britain.
|
Looking Forward
We remain committed to driving shareholder value with revenue growth, operating leverage, cash flow generation, and efficient capital deployment. We plan to demonstrate this through disciplined financial policies that will drive an additional reduction of
$150 million
of organic SG&A and R&D expenses in 2016, bringing the cumulative reduction in operating expenses to more than
$600 million
over the past three years. Likewise, we strive to optimize our capital structure to enable prioritized investments in the business and targeted acquisitions as a source of generating solid future operating cash flows. These potential investments are balanced against returning excess capital to shareholders through dividends and share repurchases. We expect to continue the quarterly dividends that were initiated in 2011 as well as the opportunity to return capital to shareholders through share repurchases. Our share repurchase program has approximately
$1.0 billion
of authority available as of
December 31, 2015
.
Entering
2016
, we believe we are well-positioned to compete in both our core markets and adjacent growth areas. We have a broad, compelling products and services portfolio specifically tailored for our mission-critical communications customer base that spans many layers of governments, public safety, and first responders, as well as commercial and industrial customers in a number of key verticals. As we add new products, features, and software upgrades, we ensure our solutions are interoperable and backward-compatible, enabling customers to confidently invest for their future needs while allowing them to utilize their prior investment in our technology.
Supplementing our traditional core business is our Managed & Support services business, which has been a focus area of investment and growth in recent years. As communication networks have become increasingly complex, software-centric, and data-driven, we have shifted our offerings to align with this technology trend in serving our customers. We expect to continue to see growing demands for our Managed & Support services going forward. These services offerings help customers manage, support, and upgrade their networks as well as utilize features, applications, and data in new ways including predictive policing, proactive support, or smarter response strategies. We expect our overall revenue mix to continue to shift towards services over time. On February 19, 2016, the Company acquired Airwave, the largest private operator of a public safety network in the world, delivering mission-critical voice and data communications to more than 300 public service agencies in Great Britain. This acquisition will expand our Managed & Support services business.
Another key technology trend complementing our existing business is the expanded use of broadband LTE by our customers. We have been proactively investing in next-generation public safety broadband solutions for years, as we believe public safety LTE solutions are the next-generation tool for our public safety first-responder customers. We believe our expertise in both public and private networks makes us uniquely qualified to provide these public safety broadband solutions to this customer base. We have now won the four largest public safety LTE network installations awarded to date and expect LTE sales to represent a larger portion of our revenue in the coming years.
29
Results of Operations
|
|
Years ended December 31
|
|||||||||||||||||||
|
(Dollars in millions, except per share amounts)
|
2015
|
% of
Sales ** |
2014
|
% of
Sales ** |
2013
|
% of
Sales ** |
||||||||||||||
|
Net sales from products
|
$
|
3,676
|
|
$
|
3,807
|
|
$
|
4,109
|
|
|||||||||||
|
Net sales from services
|
2,019
|
|
2,074
|
|
2,118
|
|
||||||||||||||
|
Net sales
|
5,695
|
|
5,881
|
|
6,227
|
|
||||||||||||||
|
Costs of product sales
|
1,625
|
|
44.2
|
%
|
1,678
|
|
44.1
|
%
|
1,808
|
|
44.0
|
%
|
||||||||
|
Costs of services sales
|
1,351
|
|
66.9
|
%
|
1,372
|
|
66.2
|
%
|
1,310
|
|
61.9
|
%
|
||||||||
|
Costs of sales
|
2,976
|
|
52.3
|
%
|
3,050
|
|
51.9
|
%
|
3,118
|
|
50.1
|
%
|
||||||||
|
Gross margin
|
2,719
|
|
47.7
|
%
|
2,831
|
|
48.1
|
%
|
3,109
|
|
49.9
|
%
|
||||||||
|
Selling, general and administrative expenses
|
1,021
|
|
17.9
|
%
|
1,184
|
|
20.1
|
%
|
1,330
|
|
21.4
|
%
|
||||||||
|
Research and development expenditures
|
620
|
|
10.9
|
%
|
681
|
|
11.6
|
%
|
761
|
|
12.2
|
%
|
||||||||
|
Other charges
|
84
|
|
1.5
|
%
|
1,972
|
|
33.5
|
%
|
71
|
|
1.1
|
%
|
||||||||
|
Operating earnings (loss)
|
994
|
|
17.5
|
%
|
(1,006
|
)
|
(17.1
|
)%
|
947
|
|
15.2
|
%
|
||||||||
|
Other income (expense):
|
||||||||||||||||||||
|
Interest expense, net
|
(173
|
)
|
(3.0
|
)%
|
(126
|
)
|
(2.1
|
)%
|
(113
|
)
|
(1.8
|
)%
|
||||||||
|
Gains on sales of investments
|
107
|
|
1.9
|
%
|
5
|
|
0.1
|
%
|
37
|
|
0.6
|
%
|
||||||||
|
Other
|
(11
|
)
|
(0.2
|
)%
|
(34
|
)
|
(0.6
|
)%
|
9
|
|
0.1
|
%
|
||||||||
|
Total other expense
|
(77
|
)
|
(1.4
|
)%
|
(155
|
)
|
(2.6
|
)%
|
(67
|
)
|
(1.1
|
)%
|
||||||||
|
Earnings (loss) from continuing operations before income taxes
|
917
|
|
16.1
|
%
|
(1,161
|
)
|
(19.7
|
)%
|
880
|
|
14.1
|
%
|
||||||||
|
Income tax expense (benefit)
|
274
|
|
4.8
|
%
|
(465
|
)
|
(7.9
|
)%
|
(59
|
)
|
(0.9
|
)%
|
||||||||
|
Earnings (loss) from continuing operations
|
643
|
|
11.3
|
%
|
(696
|
)
|
(11.8
|
)%
|
939
|
|
15.1
|
%
|
||||||||
|
Less: Earnings attributable to noncontrolling interests
|
3
|
|
0.1
|
%
|
1
|
|
—
|
%
|
6
|
|
0.1
|
%
|
||||||||
|
Earnings (loss) from continuing operations*
|
640
|
|
11.2
|
%
|
(697
|
)
|
(11.9
|
)%
|
933
|
|
15.0
|
%
|
||||||||
|
Earnings (loss) from discontinued operations, net of tax
|
(30
|
)
|
(0.5
|
)%
|
1,996
|
|
33.9
|
%
|
166
|
|
2.7
|
%
|
||||||||
|
Net earnings*
|
$
|
610
|
|
10.7
|
%
|
$
|
1,299
|
|
22.1
|
%
|
$
|
1,099
|
|
17.6
|
%
|
|||||
|
Earnings (loss) per diluted common share*:
|
||||||||||||||||||||
|
Continuing operations
|
$
|
3.17
|
|
$
|
(2.84
|
)
|
$
|
3.45
|
|
|||||||||||
|
Discontinued operations
|
(0.15
|
)
|
8.13
|
|
0.61
|
|
||||||||||||||
|
Earnings per diluted common share*
|
$
|
3.02
|
|
|
$
|
5.29
|
|
|
$
|
4.06
|
|
|
||||||||
* Amounts attributable to Motorola Solutions, Inc. common shareholders.
** Percentages may not add due to rounding.
Geographic Market Sales by Locale of End Customer
|
2015
|
2014
|
2013
|
||||||
|
North America
|
65
|
%
|
61
|
%
|
63
|
%
|
||
|
Latin America
|
6
|
%
|
9
|
%
|
8
|
%
|
||
|
EA
|
15
|
%
|
17
|
%
|
16
|
%
|
||
|
AP
|
12
|
%
|
11
|
%
|
12
|
%
|
||
|
ME
|
2
|
%
|
2
|
%
|
1
|
%
|
||
|
|
100
|
%
|
100
|
%
|
100
|
%
|
||
30
Results of Operations—
2015
Compared to
2014
Net Sales
Net sales were
$5.7 billion
in
2015
,
down
$186 million
, or
3%
, compared to
$5.9 billion
in
2014
. The
decline
in net sales is reflective of decreases in EA and Latin America, partially offset by growth in North America, ME, and AP. The decrease in EA and Latin America was primarily the result of lower Products and Services sales, driven by challenging macroeconomic conditions in Latin America and Eastern Europe, and foreign exchange rate unfavorability. North America grew on strong Products and Services sales, ME realized an increase in Services sales, and AP grew on strong Products sales.
Gross Margin
Gross margin was
$2.7 billion
, or
47.7%
of net sales in
2015
, compared to
$2.8 billion
, or
48.1%
of net sales, in
2014
. The
decrease
in gross margin was primarily a result of foreign exchange rate unfavorability. The
decrease
in gross margin percentage is primarily attributable to a decrease in gross margin as a percentage of sales within the Services segment while the gross margin percentage of the Products segment remained relatively flat. The decrease in gross margin percentage in the Services segment was primarily driven by: (i) a decrease in North America Integration services margins due to the deployment of certain large projects at lower gross margins and (ii) lower net sales in iDEN services which have a slightly higher gross margin percentage compared to the rest of the services portfolio.
Selling, General and Administrative Expenses
SG&A expenses
decreased
14%
to
$1.0 billion
, or
17.9%
of net sales in
2015
, compared to
$1.2 billion
, or
20.1%
of net sales in
2014
. The
decrease
in SG&A expenditures is primarily due to: (i) cost savings initiatives, including headcount reductions, (ii) lower pension expenses, and (iii) the favorable impact of foreign exchange rates, partially offset by higher incentive compensation accruals.
Research and Development Expenditures
R&D expenditures
decreased
9%
to
$620 million
, or
10.9%
of net sales in
2015
, compared to
$681 million
, or
11.6%
of net sales in
2014
. The
decrease
in R&D expenditures is primarily due to: (i) cost savings initiatives, including headcount reductions, and the movement of employees to lower cost work sites and (ii) the favorable impact of foreign exchange rates, partially offset by higher incentive compensation accruals.
Other Charges
We recorded net charges of
$84 million
in Other charges in
2015
, compared to net charges of
$2.0 billion
in
2014
. The charges in
2015
included: (i)
$108 million
of net reorganization of business charges, including a
$31 million
impairment of the corporate aircraft and (ii)
$8 million
of charges relating to the amortization of intangibles, partially offset by a
$32 million
non-U.S. pension curtailment gain. The charges in
2014
included: (i) a
$1.9 billion
charge related to the settlement of a U.S. pension plan, (ii)
$64 million
of net reorganization of business charges, (iii)
$8 million
of legal settlement charges, and (iv)
$4 million
of charges relating to the amortization of intangibles, partially offset by a
$21 million
gain on the sale of a building and land.
Net Interest Expense
Net interest expense was
$173 million
in
2015
, compared to net interest expense of
$126 million
in
2014
. The increase in interest expense in
2015
compared to
2014
was a result of higher average debt balances.
Gains on Sales of Investments
Gains on sales of investments were
$107 million
in
2015
, compared to
$5 million
in
2014
. The net gains in
2015
and
2014
were related to the sales of equity investments.
Other
Net Other
expense
was
$11 million
in
2015
, compared to net Other
expense
of
$34 million
in
2014
. The net Other
expense
in
2015
was primarily comprised of: (i) a
$23 million
foreign currency
loss
and (ii) a
$6 million
investment impairment, partially offset by: (i) a
$7 million
gain
on derivative instruments, (ii) a
$6 million
gain
on equity method investments, and (iii)
$5 million
of other non-operating
gains
. Net Other
expense
in
2014
was primarily comprised of: (i) a
$37 million
loss on the extinguishment of debt, (ii) a
$4 million
loss
on derivative instruments, (iii) a
$3 million
foreign currency
loss
, and (iv)
$6 million
of other non-operating
losses
, partially offset by a
$16 million
gain
on equity method investments.
Effective Tax Rate
We recorded a
$274 million
net tax expense in
2015
, resulting in an effective tax rate of
30%
, compared to
$465 million
of net tax benefit in
2014
, resulting in an effective tax rate of
40%
. Our effective tax rate in
2015
was lower than the U.S. statutory tax rate of 35% primarily due to lower tax rates on non-U.S. income.
Our effective tax rate in
2014
was favorably impacted by: (i) state tax benefits on the pension settlement loss, (ii) $29 million in tax benefits associated with the net reduction in unrecognized tax benefits and (iii) $19 million in net reduction in our deferred tax liability for undistributed foreign earnings primarily due to changes in permanent reinvestment assertions. These benefits were partially offset by tax expense for the establishment of a $55 million valuation allowance on certain foreign deferred tax assets.
31
Our effective tax rate will change from period to period based on non-recurring events, such as the settlement of income tax audits, changes in valuation allowances, and the tax impact of significant unusual or extraordinary items, as well as recurring factors including changes in the geographic mix of income and effects of various global income tax strategies.
Earnings (Loss) from Continuing Operations Attributable to Motorola Solutions, Inc.
After taxes, we had earnings from continuing operations attributable to Motorola Solutions, Inc. of
$640 million
, or
$3.17
per diluted share, in
2015
, compared to a net loss from continuing operations attributable to Motorola Solutions, Inc. of
$697 million
, or
$(2.84)
per diluted share, in
2014
.
The
increase
in earnings from continuing operations in
2015
, as compared to
2014
, was primarily driven by: (i) a
$1.9 billion
decrease in Other charges, (ii) a
$163 million
decrease in SG&A, and (iii) a
$61 million
decrease in R&D. The
increase
in earnings from continuing operations per diluted share was driven by a reduction in shares outstanding, primarily as a result of our "Dutch auction" tender offer, as well as repurchases made through our ongoing share repurchase program, and an increase in earnings from continuing operations.
Earnings from Discontinued Operations
After taxes, we had a
$30 million
, or
$0.15
per diluted share, loss from discontinued operations in
2015
, compared to earnings from discontinued operations of
$2.0 billion
, or
$8.13
per diluted share, in
2014
. The earnings from discontinued operations in both
2015
and
2014
were primarily related to the sale of the Enterprise business.
Results of Operations—
2014
Compared to
2013
Net Sales
Net sales were
$5.9 billion
in
2014
,
down
$346 million
, or
6%
compared to
$6.2 billion
in
2013
. The
decline
in net sales is reflective of decreases in North America, AP, and Latin America, partially offset by growth in EA and ME. The decrease in North America was a result of lower Products and Services sales, driven by reduced devices and systems sales and iDen services. The decreases in Latin America and AP were primarily the result of lower Products sales. EA and ME grew on strong Products and Services sales.
Gross Margin
Gross margin was
$2.8 billion
, or
48.1%
of net sales in
2014
, compared to
$3.1 billion
, or
49.9%
of net sales, in
2013
. The
decrease
in gross margin percentage is attributable to: (i) a decline in gross margin as a percentage of sales within the Services segment in North America, (ii) lower net sales of iDEN services in Latin America, which have slightly higher gross margin percentage compared to the rest of the Services portfolio, and (iii) a decrease in gross margin as a percentage of sales in EA as a result of the mix of projects in the field.
Selling, General and Administrative Expenses
SG&A expenses decreased
11%
to
$1.2 billion
, or
20.1%
of net sales in
2014
, compared to
$1.3 billion
, or
21.4%
of net sales in
2013
. The
decrease
in SG&A is primarily due to: (i) the reduction of sales support costs by lowering our overall non-quota carrying employee base, (ii) lower pension expenses, (iii) lower incentive compensation expenses, and (iv) reduced costs through the increased use of centralized services.
Research and Development Expenditures
R&D expenditures decreased
11%
to
$681 million
, or
11.6%
of net sales in
2014
, compared to
$761 million
, or
12.2%
of net sales in
2013
. The
decrease
in R&D expenditures is primarily due to: (i) headcount reductions enacted during previous periods, (ii) lower incentive compensation expenses, (iii) the consolidation of testing processes and lab sites, and (iv) the movement of employees to lower cost work sites.
Other Charges
We recorded net charges of
$2.0 billion
in Other charges in
2014
, compared to net charges of
$71 million
in
2013
. The charges in
2014
included: (i) a
$1.9 billion
charge related to the settlement of a U.S. pension plan, (ii)
$64 million
of net reorganization of business charges, (iii)
$8 million
of legal settlement charges, and (iv)
$4 million
of charges relating to the amortization of intangibles, partially offset by a
$21 million
gain on the sale of a building and land. The charges in
2013
included: (i)
$70 million
of net reorganization of business charges and (ii)
$1 million
of charges relating to amortization of intangibles.
Net Interest Expense
Net interest expense was
$126 million
in
2014
, compared to net interest expense of
$113 million
in
2013
. The increase in interest expense in
2014
compared to
2013
was a result of higher average debt balances.
Gains on Sales of Investments
Gains on sales of investments were
$5 million
in
2014
, compared to
$37 million
in
2013
. The net gains in
2014
and
2013
were related to the sales of equity investments.
Other
Net Other
expense
was
$34 million
in
2014
, compared to net Other
income
of
$9 million
in
2013
. The net Other
expense
in
2014
was primarily comprised of: (i) a
$37 million
loss on the extinguishment of debt, (ii) a
$4 million
loss
on derivative instruments, (iii) a
$3 million
foreign currency
loss
, and (iv)
$6 million
of other non-operating
losses
, partially offset by a
$16
32
million
gain
on equity method investments. Net Other
income
in
2013
was primarily comprised of: (i) a
$10 million
gain
on equity method investments, (ii) an
$8 million
gain
on derivative instruments, and (iii)
$11 million
of other non-operating
gains
, partially offset by (i) a
$17 million
foreign currency
loss
and (ii) a
$3 million
investment impairment.
Effective Tax Rate
We recorded a
$465 million
net tax benefit in
2014
, resulting in an effective tax rate of
40%
, compared to
$59 million
of net tax benefit in
2013
, resulting in an effective tax rate of negative
7%
. Our effective tax rate in
2014
was favorably impacted by: (i) state tax benefits on the pension settlement loss, (ii) $29 million in tax benefits associated with the net reduction in unrecognized tax benefits, and (iii) $19 million in net reduction in our deferred tax liability for undistributed foreign earnings primarily due to changes in permanent reinvestment assertions. These benefits were partially offset by tax expense for the establishment of a $55 million valuation allowance on certain foreign deferred tax assets.
Our negative effective tax rate in
2013
was lower than the U.S. statutory tax rate of 35% due to: (i) $337 million associated with excess foreign tax credits on undistributed foreign earnings, (ii) a $25 million reduction in our deferred tax liability for undistributed foreign earnings primarily due to changes in permanent reinvestment assertions, and (iii) a $9 million tax benefit for R&D tax credits.
Earnings (Loss) from Continuing Operations Attributable to Motorola Solutions, Inc.
After taxes, we had a net loss from continuing operations attributable to Motorola Solutions, Inc. of
$697 million
, or
$(2.84)
per diluted share, in
2014
, compared to net earnings from continuing operations attributable to Motorola Solutions, Inc. of
$933 million
, or
$3.45
per diluted share, in
2013
.
The
decrease
in earnings (loss) from continuing operations in
2014
, as compared to
2013
, was primarily driven by: (i) a $1.9 billion charge related to the settlement of a U.S. pension plan and (ii) a
$278 million
decrease in gross margin primarily due to sales declines and a change in sales mix, partially offset by: (i) a
$146 million
decrease
in SG&A and (ii) an
$80 million
decrease
in R&D. The
decrease
in earnings (loss) from continuing operations per diluted share was driven by lower net earnings, partially offset by a reduction in shares outstanding as a result of our share repurchase program.
Earnings from Discontinued Operations
After taxes, we had
$2.0 billion
, or
$8.13
per diluted share, of earnings from discontinued operations in
2014
, compared to earnings from discontinued operations of
$166 million
, or
$0.61
per diluted share, in
2013
. The earnings from discontinued operations in
2014
and
2013
were primarily related to the Enterprise business.
Segment Information
The following commentary should be read in conjunction with the financial results of each operating business segment as detailed in Note 12, “Information by Segment and Geographic Region,” to our consolidated financial statements. Net sales and operating results for our two segments for
2015
,
2014
, and
2013
are presented below.
Products Segment
The Products segment’s net sales represented
65%
of our consolidated net sales in
2015
and
2014
, compared to
66%
in
2013
.
|
|
Years ended December 31
|
Percent Change
|
|||||||||||||||
|
(Dollars in millions)
|
2015
|
2014
|
2013
|
2015—2014
|
2014—2013
|
||||||||||||
|
Segment net sales
|
$
|
3,676
|
|
$
|
3,807
|
|
$
|
4,109
|
|
(3
|
)%
|
(7
|
)%
|
||||
|
Operating earnings (loss)
|
704
|
|
(667
|
)
|
639
|
|
N/M
|
|
(204
|
)%
|
|||||||
* N/M = Percent Change is not meaningful due to the comparison using prior year operating losses as a basis for the calculation.
Segment Results—
2015
Compared to
2014
The segment’s net sales
decreased
$131 million
, or
3%
, to
$3.7 billion
in
2015
, as compared to
$3.8 billion
in
2014
. The
decrease
in the segment's net sales was primarily driven by: (i) the effect of unfavorable foreign exchange rates with a strengthening U.S. dollar in EA, Latin America, and AP, (ii) decreases in devices and systems sales in EA and Latin America impacted by the reduced purchasing power of our customers caused by the devaluation of their local currency and macroeconomic conditions, (iii) a decrease in systems sales in North America, and (iv) declines in devices sales in AP and ME, partially offset by: (i) growth in devices sales in North America and (ii) increased systems sales in AP and ME. On a geographic basis, net sales
decreased
in EA and LA and increased in North America, AP, and ME in
2015
, compared to
2014
. The segment's backlog was
$1.2 billion
at both
December 31, 2015
and
December 31, 2014
.
Net sales in North America continued to comprise a significant portion of the segment’s business, accounting for approximately
67%
of the segment’s net sales in
2015
, up from
62%
of the segment’s net sales in
2014
.
33
The segment had operating earnings of
$704 million
in
2015
, compared to an operating loss of
$667 million
in
2014
. The increase in operating earnings in
2015
compared to
2014
was driven primarily by: (i) a decrease in Other charges as a result of a $1.3 billion expense related to the 2014 settlement of a U.S. pension plan, (ii) lower SG&A expenditures as a result of cost savings initiatives, including headcount reductions, the favorable impact of foreign exchange rates, and reduced pension expenses, and (iii) lower R&D expenditures driven by cost savings initiatives and the favorable impact of foreign exchange rates.
Segment Results—
2014
Compared to
2013
The segment's net sales
decreased
$302 million
, or
7%
, to
$3.8 billion
in
2014
, as compared to
$4.1 billion
in
2013
. The
decrease
in the segment's net sales was primarily driven by: (i) decreases in devices and systems sales in North America and AP, (ii) a decrease in devices sales Latin America, and (iii) a decrease in systems sales in EA and ME, partially offset by: (i) an increase in devices sales in EA and ME and (ii) an increase in systems sales in Latin America. On a geographic basis, net sales
decreased
in North America, AP, and Latin America and increased in ME and EA in
2014
, compared to
2013
. The segment's backlog was
$1.2 billion
at
December 31, 2014
and
$1.1 billion
at
December 31, 2013
.
Net sales in North America comprised a significant portion of the segment’s business, accounting for approximately
62%
of the segment’s net sales in
2014
, down from
63%
of the segment’s net sales in
2013
.
The segment had an operating loss of
$667 million
in
2014
, compared to operating earnings of
$639 million
in
2013
. The decrease in operating earnings in
2014
compared to
2013
, was driven primarily by: (i) an increase in Other charges as a result of a $1.3 billion expense related to the
2014
settlement of a U.S. pension plan and (ii) lower net sales, resulting in lower gross margin, partially offset by lower SG&A and R&D expenditures as a result of cost savings actions taken to lower variable compensation expenses.
Services Segment
The Services segment’s net sales represented
35%
of our consolidated net sales in
2015
and
2014
, compared to
34%
in
2013
.
|
|
Years ended December 31
|
Percent Change
|
|||||||||||||||
|
(Dollars in millions)
|
2015
|
2014
|
2013
|
2015—2014
|
2014—2013
|
||||||||||||
|
Segment net sales
|
$
|
2,019
|
|
$
|
2,074
|
|
$
|
2,118
|
|
(3
|
)%
|
(2
|
)%
|
||||
|
Operating earnings (loss)
|
290
|
|
(339
|
)
|
308
|
|
N/M
|
|
(210
|
)%
|
|||||||
* N/M = Percent Change is not meaningful due to the comparison using prior year operating losses as a basis for the calculation.
Segment Results—
2015
Compared to
2014
The segment’s net sales
decreased
$55 million
, or
3%
, to
$2.0 billion
in
2015
, as compared to
$2.1 billion
in
2014
. The
decrease
in the segment's net sales was primarily driven by: (i) the effect of unfavorable foreign exchange rates with a strengthening U.S. dollar in EA, Latin America, and AP, (ii) lower Integration services sales, primarily in EA, related to the winding down of a large system implementation in Norway, and (iii) declining iDEN services sales in Latin America, partially offset by an increase in Managed & Support services in North America and ME. On a geographic basis, net sales for
2015
decreased
in EA, Latin America, and AP and increased in ME and North America, compared to
2014
. The segment's backlog was
$5.2 billion
at
December 31, 2015
and
$4.6 billion
at
December 31, 2014
. The increase in the segment's backlog in
2015
compared to
2014
was driven in part by the United Kingdom government LTE contract awarded in 2015.
Net sales in North America continued to comprise a significant portion of the segment’s business, accounting for approximately
62%
of the segment’s net sales in
2015
, up from
59%
of the segment’s net sales in
2014
.
The segment had operating earnings of
$290 million
in
2015
, compared to an operating loss of
$339 million
in
2014
. The increase in operating earnings in
2015
compared to
2014
, was driven primarily by: (i) a decrease in Other charges as a result of a $584 million expense related to the 2014 settlement of a U.S. pension plan and (ii) lower SG&A expenditures as a result of cost savings initiatives, including headcount reductions, the favorable impact of foreign exchange rates, and reduced pension expenses.
Segment Results—
2014
Compared to
2013
The segment's net sales
decreased
$44 million
, or
2%
, to
$2.1 billion
in
2014
, as compared to
2013
. The
decrease
in the segment's net sales was primarily driven by a decrease in iDEN services sales in North America and Latin America, partially offset by an increase in Managed & Support services in Latin America, North America, and EA. On a geographic basis, net sales for
2014
decreased
in North America and AP, increased in EA and ME, and remained relatively constant in Latin America, compared to
2013
. The segment's backlog was
$4.6 billion
at
December 31, 2014
and
$4.3 billion
at
December 31, 2013
.
Net sales in North America continued to comprise a significant portion of the segment’s business, accounting for approximately
59%
of the segment’s net sales in
2014
, down from
61%
of the segment’s net sales in
2013
.
The segment had an operating loss of
$339 million
in
2014
, compared to operating earnings of
$308 million
in
2013
. The decrease in operating earnings in
2014
compared to
2013
, was driven primarily by: (i) an increase in Other charges as a result of a $584 million expense related to the
2014
settlement of a U.S. pension plan and (ii) lower net sales, resulting in lower gross
34
margin, partially offset by lower SG&A and R&D expenditures as a result of cost savings actions taken to lower variable compensation expenses.
Reorganization of Businesses
During
2015
we implemented various productivity improvement plans aimed at continuing operating margin improvements by driving efficiencies and reducing operating costs. In
2015
, we recorded net reorganization of business charges of
$117 million
relating to the separation of
1,100
employees, of which
900
were indirect employees and
200
were direct employees. The
$117 million
of charges in earnings from continuing operations included
$9 million
recorded to Cost of sales and
$108 million
recorded to Other charges. Included in the aggregate
$117 million
are charges of: (i)
$74 million
for employee separation costs,
$31 million
for the impairment of the corporate aircraft, (iii)
$10 million
for exit costs, and (iv) a
$6 million
building impairment charge, partially offset by
$4 million
of reversals for accruals no longer needed.
During
2014
, we recorded net reorganization of business charges of
$96 million
relating to the separation of
1,200
employees, of which
900
were indirect employees and
300
were direct employees. Of these charges,
$23 million
related to discontinued operations. The remaining
$73 million
of charges in earnings (loss) from continuing operations included
$9 million
recorded to Cost of sales and
$64 million
recorded to Other charges. Included in the aggregate
$73 million
are charges of: (i)
$67 million
for employee separation costs and (ii)
$7 million
related to charges for exit costs, partially offset by
$1 million
of reversals for accruals no longer needed.
During
2013
, we recorded net reorganization of business charges of
$133 million
relating to the separation of
2,200
employees, of which
1,400
were indirect employees and
800
were direct employees. Of these charges,
$47 million
related to discontinued operations. The remaining
$86 million
of charges in earnings from continuing operations included
$16 million
recorded to Cost of sales and
$70 million
recorded to Other charges. Included in the aggregate
$86 million
are charges of: (i)
$94 million
for employee separation costs and (ii)
$2 million
related to charges for exit costs, partially offset by
$10 million
of reversals for accruals no longer needed.
The following table displays the net charges incurred by business segment:
|
Years ended December 31
|
2015
|
2014
|
2013
|
||||||||
|
Products
|
$
|
84
|
|
$
|
48
|
|
$
|
57
|
|
||
|
Services
|
33
|
|
25
|
|
29
|
|
|||||
|
$
|
117
|
|
$
|
73
|
|
$
|
86
|
|
|||
Cash payments for exit costs and employee separations in connection with these reorganization plans were
$71 million
,
$148 million
, and
$59 million
in
2015
,
2014
, and
2013
, respectively. The cash payments included
$5 million
in
2015
,
$50 million
in
2014
, and
$20 million
in
2013
related to employees of discontinued operations. Of the
$60 million
reorganization of businesses accrual remaining at December 31,
2015
,
$51 million
relates to employee separation costs that are expected to be paid in
2016
and
$9 million
relates to exit costs.
Liquidity and Capital Resources
We
decreased
the aggregate of our cash and cash equivalent balances by
$2.0 billion
from
$4.0 billion
as of
December 31, 2014
to
$2.0 billion
as of
December 31, 2015
. The
decrease
is primarily due to
$3.5 billion
of capital returned to shareholders through share repurchases and dividends paid and an investment of
$401 million
in United Kingdom treasury securities used to partially offset our British Pound Sterling foreign currency risk associated with the purchase of Airwave that we closed in February 2016, offset by
$1.0 billion
of cash provided by operating activities and
$971 million
of proceeds raised by the issuance of the Senior Convertible Notes (net of issuance costs paid).
As highlighted in the consolidated statements of cash flows, our liquidity and available capital resources are impacted by four key components: (i) cash and cash equivalents, (ii) operating activities, (iii) investing activities, and (iv) financing activities.
Cash and Cash Equivalents
At
December 31, 2015
,
$1.1 billion
of the
$2.0 billion
cash and cash equivalents balance was held in the U.S. and
$838 million
was held by the Company or its subsidiaries in other countries, with approximately
$495 million
held in the United Kingdom. At both
December 31, 2015
and
December 31, 2014
, restricted cash was
$63 million
.
We continue to analyze and review various repatriation strategies to efficiently repatriate cash. In
2015
, we repatriated approximately
$249 million
in cash to the U.S. from international jurisdictions. Undistributed earnings that we intend to reinvest indefinitely, and for which no U.S. income taxes have been provided, aggregate to
$1.4 billion
at
December 31, 2015
. We currently have no plans to repatriate the foreign earnings permanently reinvested. If circumstances change and it becomes apparent that some or all of the permanently reinvested earnings will be remitted to the U.S. in the foreseeable future, an additional income tax charge may be necessary.
Where appropriate, we may also pursue capital reduction activities; however, such activities can be involved and lengthy. While we regularly repatriate funds, and a portion of offshore funds can be repatriated with minimal adverse financial impact,
35
repatriation of some of these funds may be subject to delay for local country approvals and could have potential adverse cash tax consequences.
Operating Activities
Cash provided by operating activities from continuing operations in
2015
was
$1.0 billion
, compared to cash used by operating activities from continuing operations of
$685 million
in
2014
and cash provided by operating activities from continuing operations of
$555 million
in
2013
. Operating cash flows in
2015
, as compared to
2014
, were positively impacted by: (i) an increase in earnings from continuing operations, (ii) reduced pension contributions, and (iii) higher sales of accounts receivable. Operating cash flows in
2014
, as compared to
2013
, were negatively impacted by contributions to our pension plans of $1.3 billion, an increase of $1.1 billion compared to
2013
.
We made
$3 million
of contributions to our U.S. pension plans during
2015
, compared to
$1.1 billion
contributed in
2014
to fund the purchase of group annuity contracts and lump sum distributions from one of our U.S. pension plans, as described in Note 7 to our consolidated financial statements, and
$150 million
contributed in
2013
. In addition, we contributed
$10 million
,
$237 million
, and
$32 million
to our Non-U.S. Pension Plans during
2015
,
2014
, and
2013
, respectively. We expect to make approximately
$12 million
of cash contributions in
2016
, primarily to our Non-U.S. Pension Benefit Plans in
2016
.
Investing Activities
Net cash used by investing activities from continuing operations was
$528 million
in
2015
, compared to net cash provided by investing activities from continuing operations of
$3.2 billion
in
2014
and
$2.0 billion
in
2013
. The
$3.7 billion
decrease
in net cash provided by investing activities from
2014
to
2015
was primarily due to reduced proceeds from sales of investments and businesses related to the sale of the Enterprise business and a
$401 million
investment in United Kingdom treasury securities. The
$1.2 billion
increase
in net cash provided by investing activities from
2013
to
2014
was primarily due to a
$3.3 billion
increase
of proceeds from sales of investments and businesses, related to the sale of our Enterprise business, partially offset by a
$2.1 billion
decrease
in proceeds from sales of Sigma Fund investments, which we exited in the fourth quarter of 2013.
Sigma Fund:
Prior to December 2013, we invested most of our U.S. dollar-denominated cash in a fund (the “Sigma Fund”) that was managed by independent investment management firms under specific investment guidelines restricting the type of investments held and their time to maturity. In December 2013, we completed the liquidation of the Sigma Fund and migrated the international U.S dollar-denominated cash to a U.S. dollar cash pool invested primarily in U.S. dollar prime money market funds. The creation of the international cash pool enhances our flexibility to repatriate excess overseas cash and fund global operations. These money market funds are classified as Cash and cash equivalents within the consolidated balance sheets as of December 31,
2015
and
2014
.
Acquisitions and Investments:
We used cash of
$586 million
for acquisitions and new investment activities in
2015
, compared to
$47 million
in
2014
, and
$57 million
in
2013
. In December
2015
, we invested
$401 million
in United Kingdom treasury securities in order to partially offset our British Pound Sterling foreign currency risk associated with the purchase of Airwave. We liquidated these investments in February 2016 to partially fund the acquisition of Airwave. Additionally, we paid
$49 million
for the acquisition of two public safety software solution providers, as well as several debt and equity investments. The cash used in
2014
was for the acquisition of an equipment provider for $22 million and a number of equity investments. The cash used in
2013
was for the acquisition of a communications software provider in push-to-talk-over-broadband applications for a purchase price, net of cash acquired, of $36 million, and other small strategic equity investments.
Capital Expenditures:
Capital expenditures were
$175 million
in
2015
, compared to
$181 million
in
2014
, and
$169 million
in
2013
. Capital spending in
2015
,
2014
, and
2013
was primarily comprised of: (i) network build-out expenditures related to our Services segment, (ii) updates to our information technology infrastructure, and (iii) facility renovations. The decrease in capital spending in
2015
, as compared to
2014
, was primarily driven by a decrease in facilities and information technology spend. The increase in capital spending in
2014
, as compared to
2013
, was primarily driven by an increase in revenue-generating network build-out expenditures.
Sales of Property, Plant, and Equipment:
We had
$3 million
of proceeds related to the sale of property, plant, and equipment in
2015
, compared to
$33 million
in
2014
and
$66 million
in
2013
. The proceeds in all periods were primarily comprised of sales of buildings and land.
Sales of Investments and Businesses:
We received
$230 million
of proceeds in
2015
compared to
$3.4 billion
in
2014
and
$61 million
in
2013
. The
$230 million
of proceeds received in
2015
were primarily comprised of: (i) $49 million reimbursement from Zebra for cash transferred with the sale of the Enterprise business in conjunction with legal entities sold through a stock sale, (ii) $107 million from the sale of two equity investments, (iii) $13 million net cash received from Zebra for the final purchase price adjustment, as well as for reimbursement of liabilities of the Enterprise business paid on Zebra's behalf, and (iv) proceeds from the sale of various debt and equity securities, partially offset by $27 million of net cash transferred in conjunction with the sale of our ownership interest in a majority owned subsidiary to the entity's noncontrolling interest. The
$3.4 billion
of cash received in
2014
was primarily comprised of proceeds from the sale of the Enterprise business. The
$61 million
of proceeds received in
2013
were primarily comprised of proceeds from sales of equity investments.
36
Financing Activities
Net cash used for financing activities was
$2.4 billion
in
2015
compared to
$1.7 billion
in
2014
and
$842 million
in
2013
. Cash used for financing activities in
2015
was primarily comprised of: (i)
$3.2 billion
used for purchases of common stock under our share repurchase program and (ii)
$277 million
of cash used for the payment of dividends, partially offset by: (i)
$971 million
of net proceeds from the issuance of the Senior Convertible Notes and (ii)
$100 million
of net proceeds from the issuance of common stock in connection with our employee stock option and employee stock purchase plans.
Cash used for financing activities in
2014
was primarily comprised of: (i)
$2.5 billion
used for purchases of our common stock under our share repurchase program, (ii)
$465 million
of cash used for the repayment of debt, and (iii)
$318 million
of cash used for the payment of dividends, partially offset by: (i)
$1.4 billion
of net proceeds from the issuance of debt, (ii)
$135 million
of net proceeds from the issuance of common stock in connection with our employee stock option and employee stock purchase plans, and (iii)
$93 million
of distributions received from discontinued operations.
Cash used for financing activities in
2013
was primarily comprised of: (i)
$1.7 billion
used for purchases of our common stock under our share repurchase program and (ii)
$292 million
of cash used for the payment of dividends, partially offset by: (i)
$593 million
of net proceeds from the issuance of debt, (ii)
$365 million
of distributions received from discontinued operations, and (iii)
$165 million
of net proceeds from the issuance of common stock in connection with our employee stock option and employee stock purchase plans.
On August 25, 2015, the Company entered into an agreement with Silver Lake Partners to issue $1.0 billion of 2% Senior Convertible Notes which mature in September 2020. Interest on these notes is payable semiannually. The notes are convertible anytime on or after two years from their issuance date, except in certain limited circumstances. The notes are convertible based on a conversion rate of 14.5985 per $1,000 principal amount (which is equal to an initial conversion price of $68.50 per share). In the event of conversion, the Company intends to settle the principal amount of the Senior Convertible Notes in cash.
During the year ended December 31, 2014, we redeemed
$400 million
aggregate principal amount outstanding of our
6.000%
Senior Notes due November
2017
for an aggregate purchase price of approximately
$456 million
. After accelerating the amortization of debt issuance costs, debt discounts, and hedge adjustments, we recognized a loss of
$37 million
related to the redemption within Other income (expense) in the consolidated statements of operations. During the year ended December 31, 2014, we issued an aggregate principal amount of
$1.4 billion
consisting of: (i)
$600 million
of
4.000%
Senior Notes due
2024
, of which, after debt issuance costs and debt discounts, we recognized net proceeds of
$583 million
, (ii)
$400 million
of
3.500%
Senior Notes due
2021
, of which, after debt issuance costs and debt discounts, we recognized net proceeds of
$393 million
, and (iii)
$400 million
of
5.500%
Senior notes due
2044
, of which, after debt issuance costs and debt discounts, we recognized net proceeds of
$394 million
.
During 2013, we issued an aggregate principal amount of $600 million of 3.50% Senior Notes due March 1, 2023, recognizing net proceeds of $588 million, after debt discount and issuance costs.
We have investment grade ratings on our senior unsecured long-term debt from the three largest U.S. national rating agencies. On August 5, 2015, our corporate credit and senior unsecured long-term debt ratings were downgraded by two of the three rating agencies in connection with our capital structure activities. Moody's Investors Service downgraded its Baa2 rating to Baa3 and changed its outlook from stable to negative. Standard & Poor’s Rating Services downgraded its BBB rating to BBB- and maintained its stable outlook. Fitch Ratings confirmed its BBB rating on August 5, 2015 but changed its outlook to negative from stable. We continue to believe that we will be able to maintain sufficient access to the capital markets. Any future disruptions, uncertainty, or volatility in the capital markets or deterioration in our credit ratings may result in higher funding costs for us and adversely affect our ability to access funds.
In connection with the completion of the acquisition of Airwave, we entered into a new term loan credit agreement (the “Term Loan Agreement”), under which we borrowed a term loan (the “Term Loan”) with an initial principal amount of
$675 million
. Interest on the Term Loan is variable and indexed to LIBOR. No additional borrowings are permitted under the Term Loan Agreement and amounts borrowed and repaid or prepaid may not be re-borrowed. Our borrowing capacity under the 2014 Motorola Solutions Credit Agreement may be partially limited at the end of the first quarter of 2016 due to the additional indebtedness incurred in connection with the Term Loan. However, we believe we will continue to have sufficient liquidity to operate our business.
We may, from time to time, seek to retire certain of our outstanding debt through open market cash purchases, privately-negotiated transactions or otherwise. Such repurchases, if any, will depend on prevailing market conditions, our liquidity requirements, contractual restrictions and other factors.
Share Repurchase Program:
Through actions taken on July 28, 2011, January 30, 2012, July 25, 2012, July 22, 2013, and November 4, 2014, the Board of Directors has authorized an aggregate share repurchase amount of up to
$12.0 billion
of our outstanding shares of common stock (the “share repurchase program”). The share repurchase program does not have an expiration date. As of
December 31, 2015
, we have used approximately
$11.0 billion
of the share repurchase authority, including transaction costs, to repurchase shares, leaving approximately
$1.0 billion
of authority available for future repurchases.
On August 4, 2015, the Board of Directors authorized the Company to commence a modified "Dutch auction" tender offer to repurchase up to $2.0 billion of its outstanding shares of common stock. The repurchase of these shares was authorized under the existing share repurchase authority. The tender offer commenced on August 7, 2015 and expired on September 3,
37
2015. The Company paid $2.0 billion, including transaction costs, to repurchase approximately 30.1 million shares at a tender price of $66.50 per share.
We paid an aggregate of
$3.2 billion
during
2015
, including transaction costs, to repurchase approximately
48.0 million
shares at an average price of
$66.22
per share. During
2014
, we paid an aggregate of
$2.5 billion
, including transaction costs, to repurchase approximately
39.4 million
shares at an average price of
$64.63
per share. During
2013
, we paid an aggregate of
$1.7 billion
, including transaction costs, to repurchase approximately
28.6 million
shares at an average price of
$59.30
per share. All repurchased shares have been retired.
Payment of Dividends:
We paid cash dividends to holders of our common stock of
$277 million
in
2015
,
$318 million
in
2014
, and
$292 million
in
2013
.
Credit Facilities
As of
December 31, 2015
, we had a
$2.1 billion
unsecured syndicated revolving credit facility (the “2014 Motorola Solutions Credit Agreement”) scheduled to mature on May 29, 2019. We must comply with certain customary covenants, including maximum leverage ratio as defined in the 2014 Motorola Solutions Credit Agreement. We were in compliance with our financial covenants as of
December 31, 2015
. We did not borrow under the 2014 Motorola Solutions Credit Agreement during the
twelve
months ended
December 31, 2015
.
As of
December 31, 2015
, we had a letter of credit sub-limit of
$450 million
under the 2014 Motorola Solutions Credit Agreement. No letters of credit were issued under the revolving credit facility as of
December 31, 2015
.
Contractual Obligations and Other Purchase Commitments
Summarized in the table and text below are our obligations and commitments to make future payments under long-term debt obligations, lease obligations, purchase obligations and tax obligations as of
December 31, 2015
.
|
|
Payments Due by Period
|
||||||||||||||||||||||||||||||
|
(in millions)
|
Total
|
2016
|
2017
|
2018
|
2019
|
2020
|
Uncertain
Timeframe |
Thereafter
|
|||||||||||||||||||||||
|
Long-term debt obligations
|
$
|
4,448
|
|
$
|
4
|
|
$
|
5
|
|
$
|
5
|
|
$
|
5
|
|
$
|
1,005
|
|
$
|
—
|
|
$
|
3,424
|
|
|||||||
|
Lease obligations
|
484
|
|
67
|
|
57
|
|
48
|
|
42
|
|
37
|
|
—
|
|
233
|
|
|||||||||||||||
|
Purchase obligations*
|
73
|
|
57
|
|
14
|
|
2
|
|
—
|
|
—
|
|
—
|
|
—
|
|
|||||||||||||||
|
Tax obligations
|
88
|
|
50
|
|
—
|
|
—
|
|
—
|
|
—
|
|
38
|
|
—
|
|
|||||||||||||||
|
Total contractual obligations
|
$
|
5,093
|
|
$
|
178
|
|
$
|
76
|
|
$
|
55
|
|
$
|
47
|
|
$
|
1,042
|
|
$
|
38
|
|
$
|
3,657
|
|
|||||||
*Amounts included represent firm, non-cancelable commitments.
Lease Obligations:
We lease certain office, factory and warehouse space, land, information technology and other equipment, principally under non-cancelable operating leases. Our future minimum lease obligations, net of minimum sublease rentals, totaled
$484 million
. Rental expense, net of sublease income, was
$42 million
in
2015
,
$62 million
in
2014
, and
$51 million
in
2013
.
Purchase Obligations:
During the normal course of business, in order to manage manufacturing lead times and help ensure adequate component supply, we enter into agreements with contract manufacturers and suppliers that either allow them to procure inventory based upon criteria as defined by us or establish the parameters defining our requirements. In addition, we have entered into software license agreements which are firm commitments and are not cancelable. We had entered into firm, noncancelable, and unconditional commitments under such arrangements through
2017
. The total payments expected to be made under these agreements are
$73 million
, of which
$68 million
relate to take or pay obligations from arrangements with suppliers for the sourcing of inventory supplies and materials and
$5 million
relate to information technology software and services arrangements. We do not anticipate the cancellation of any of our take or pay agreements in the future and estimate that purchases from these suppliers will exceed the minimum obligations during the agreement periods.
Tax Obligations:
We have approximately
$88 million
of unrecognized income tax benefits relating to multiple tax jurisdictions and tax years. Based on the potential outcome of our global tax examinations, or the expiration of the statute of limitations for specific jurisdictions, it is reasonably possible that the unrecognized tax benefits will change within the next twelve months. The associated net tax impact on the effective tax rate, exclusive of valuation allowance changes, is estimated to be in the range of a
$50 million
tax charge to a
$50 million
tax benefit, with cash payments not expected to exceed
$30 million
.
Commitments Under Other Long-Term Agreements:
We have entered into certain long-term agreements to purchase software, components, supplies and materials from suppliers which are not "take or pay" in nature. Most of the agreements extend for periods of one to three years (three to five years for software). Generally, these agreements do not obligate us to make any purchases, and many permit us to terminate the agreement with advance notice (usually ranging from 60 to 180 days). If we were to terminate these agreements, we generally would be liable for certain termination charges, typically based on work performed and supplier on-hand inventory and raw materials attributable to canceled orders. Our liability would only arise in the event we terminate the agreements for reasons other than “cause.”
We outsource certain corporate functions, such as benefit administration and information technology-related services, under third-party contracts, the longest of which is expected to expire in
2019
. Our remaining payments under these contracts
38
are approximately
$246 million
over the remaining life of the contracts; however, these contracts can be terminated. Termination would result in a penalty substantially less than the remaining annual contract payments. We would also be required to find another source for these services, including the possibility of performing them in-house.
As is customary in bidding for and completing certain projects and pursuant to a practice we have followed for many years, we have a number of performance/bid bonds, standby letters of credit and surety bonds outstanding (collectively, referred to as “Performance Bonds”), primarily relating to projects with our government customers. These Performance Bonds normally have maturities of multiple years and are standard in the industry as a way to give customers a convenient mechanism to seek resolution if a contractor does not satisfy certain requirements under a contract. Typically, a customer can draw on the Performance Bond only if we do not fulfill all terms of a project contract. If such an occasion occurred, we would be obligated to reimburse the institution that issued the Performance Bond for the amounts paid. In our long history, it has been rare for us to have a Performance Bond drawn upon. At
December 31, 2015
, outstanding Performance Bonds totaled approximately
$1.8 billion
, compared to
$1.6 billion
at
December 31, 2014
. Any future disruptions, uncertainty, or volatility in bank, insurance or capital markets, or a change in our credit ratings could adversely affect our ability to obtain Performance Bonds and may result in higher funding costs to obtain such Performance Bonds.
Off-Balance Sheet Arrangements:
At
December 31, 2015
, we had no significant off-balance sheet arrangements other than operating leases and guarantees to third parties as described in Note 11 to the consolidated financial statements and our obligation to settle the embedded conversion option under the Senior Convertible Notes described in Note 4 to the consolidated financial statements.
Long-term Customer Financing Commitments
Outstanding Commitments:
Certain purchasers of our products and services may request that we provide long-term financing (defined as financing with a term of greater than one year) in connection with the sale of equipment. These requests may include all or a portion of the purchase price of the products and services. Our obligation to provide long-term financing may be conditioned on the issuance of a letter of credit in favor of us by a reputable bank to support the purchaser's credit or a pre-existing commitment from a reputable bank to purchase the long-term receivables from us. We had outstanding commitments to provide long-term financing to third-parties totaling
$112 million
at
December 31, 2015
, compared to
$293 million
at
December 31, 2014
. Outstanding commitments decreased during
2015
primarily as a result of two large customer contracts, one of which was converted to an order without long-term financing and the other where the financing commitment was funded and sold.
Outstanding Long-Term Receivables:
We had net non-current long-term receivables of
$47 million
at
December 31, 2015
, compared to
$31 million
at
December 31, 2014
. There were
$1 million
of allowances for losses in
2015
and
$14 million
of allowances for losses in
2014
. These long-term receivables are generally interest bearing, with interest rates ranging from
0%
to
13%
.
Sales of Receivables
From time to time, we sell accounts receivable and long-term receivables to third-parties under one-time arrangements. We may or may not retain the obligation to service the sold accounts receivable and long-term receivables. Servicing obligations are limited to collection activities for sold accounts receivables and long-term receivables.
The following table summarizes the proceeds received from sales of accounts receivable and long-term receivables for the years ended
December 31, 2015
,
2014
, and
2013
:
|
Years ended December 31
|
2015
|
2014
|
2013
|
||||||||
|
Accounts receivable sales proceeds
|
$
|
29
|
|
$
|
50
|
|
$
|
14
|
|
||
|
Long-term receivables sales proceeds
|
196
|
|
124
|
|
131
|
|
|||||
|
Total proceeds from receivable sales
|
$
|
225
|
|
$
|
174
|
|
$
|
145
|
|
||
At
December 31, 2015
, the Company had retained servicing obligations for
$668 million
of long-term receivables, compared to
$496 million
of long-term receivables at
December 31, 2014
.
Adequate Internal Funding Resources
We believe that we have adequate internal resources available to fund expected working capital and capital expenditure requirements for the next twelve months as supported by the level of cash and cash equivalents in the U.S. and the ability to repatriate funds from foreign jurisdictions.
Other Contingencies
Potential Contractual Damage Claims in Excess of Underlying Contract Value:
In certain circumstances, our businesses may enter into contracts with customers pursuant to which the damages that could be claimed by the customer for failed performance might exceed the revenue we receive from the contract. Contracts with these types of uncapped damages provisions are fairly rare, but individual contracts could still represent meaningful risk. There is a possibility that a claim by a customer to one of these contracts could result in expenses that are far in excess of the revenue received in connection with the contract.
39
Indemnification Provisions:
We may provide indemnifications for losses that result from the breach of general warranties contained in certain commercial, intellectual property and divestiture agreements. Historically, we have not made significant payments under these agreements, nor have there been significant claims asserted against us. However, there is an increasing risk in relation to intellectual property indemnities given the current legal climate. In indemnification cases, payment by us is conditioned on the other party making a claim pursuant to the procedures specified in the particular contract, which procedures typically allow us to challenge the other party’s claims. In some instances we may have recourse against third-parties for certain payments made by us. Further, our obligations under divestiture agreements for indemnification based on breach of representations and warranties are generally limited in terms of duration, typically not more than 18 months, and for amounts not in excess of a percentage of the contract value.
Legal Matters:
We are a defendant in various lawsuits, claims, and actions, which arise in the normal course of business. In the opinion of management, the ultimate disposition of these matters will not have a material adverse effect on our consolidated financial position, liquidity, or results of operations. However, an unfavorable resolution could have a material adverse effect on our consolidated financial position, liquidity, or results of operations in the periods in which the matters are ultimately resolved, or in the periods in which more information is obtained that changes management's opinion of the ultimate disposition.
Significant Accounting Policies
Management’s Discussion and Analysis of Financial Condition and Results of Operations discusses our consolidated financial statements, which have been prepared in accordance with U.S. generally accepted accounting principles ("GAAP"). The preparation of these financial statements requires management to make estimates and assumptions that affect the reported amounts of assets and liabilities and the disclosure of contingent assets and liabilities at the date of the financial statements, as well as the reported amounts of revenues and expenses during the reporting period.
Management bases its estimates and judgments on historical experience, current economic and industry conditions and on various other factors that are believed to be reasonable under the circumstances. This forms the basis for making judgments about the carrying values of assets and liabilities that are not readily apparent from other sources. Actual results may differ from these estimates under different assumptions or conditions. Management believes the following significant accounting policies require significant judgment and estimates.
Revenue Recognition
Net sales consist of a wide range of activities including the delivery of stand-alone equipment or services, custom design and installation over a period of time, and bundled sales of equipment, software and services. We enter into revenue arrangements that may consist of multiple deliverables of our products and services due to the needs of our customers. We recognize revenue when persuasive evidence of an arrangement exists, delivery has occurred, the sales price is fixed or determinable, and collectability of the sales price is reasonably assured. We recognize revenue from the sale of equipment, equipment containing both software and nonsoftware components that function together to deliver the equipment’s essential functionality, and services in accordance with general revenue recognition accounting principles. We recognize revenue in accordance with software accounting guidance for the following types of sales transactions: (i) stand alone sales of software products or software upgrades, (ii) stand alone sales of software maintenance agreements, and (iii) sales of software bundled with equipment where the software is not essential to the functionality of that equipment.
Products
For equipment sales, in addition to the criteria mentioned above, revenue recognition occurs when title and risk of loss has transferred to the customer, objective evidence exists that customer acceptance provisions have been met, no significant obligations remain and allowances for discounts, price protection, returns and customer incentives can be reliably estimated. Recorded revenues are reduced by these allowances. We base our estimates of these allowances on historical experience taking into consideration the type of products sold, the type of customer, and the specific type of transaction in each arrangement. Where customer incentives cannot be reliably estimated, we defer revenue until the incentive has been finalized with the customer. We include shipping charges billed to customers in net revenue, and include the related shipping costs in cost of sales.
We sell software and equipment obtained from other companies. We establish our own pricing and retain related inventory risk, are the primary obligor in sales transactions with customers, and assume the credit risk for amounts billed to customers. Accordingly, we generally recognize revenue for the sale of products obtained from other companies based on the gross amount billed.
Long-Term Contracts
For long-term contracts that involve customization of equipment and/or software, we generally recognize revenue using the percentage of completion method based on the percentage of costs incurred to date compared to the total estimated costs to complete the contract (“Estimated Costs at Completion”). The components of estimated costs to complete a contract and management’s process for reviewing Estimated Costs at Completion and progress toward completion are discussed further below. Contracts may be combined or segmented in accordance with the applicable criteria under contract accounting principles. In certain instances, when revenues or costs associated with long-term contracts cannot be reliably estimated or the contract contains other inherent uncertainties, revenues and costs are deferred until the project is complete and customer acceptance is obtained.
40
Total Estimated Costs at Completion include direct labor, material and subcontracting costs. Due to the nature of the work required to be performed under many of our long-term contracts, determining Estimated Costs at Completion is complex and subject to many variables. We have a standard and disciplined quarterly process in which management reviews the progress and performance of open contracts in order to determine the best estimate of Estimated Costs at Completion. As part of this process, management reviews information including, but not limited to, any outstanding key contract matters, progress towards completion, the project schedule, identified risks and opportunities, and the related changes in estimates of revenues and costs. The risks and opportunities include management's judgment about the ability and cost to achieve the project schedule, technical requirements, and other contract requirements. Management must make assumptions and estimates regarding labor productivity and availability, the complexity of the work to be performed, the availability of materials, and performance by subcontractors, among other variables. Based on this analysis, any quarterly adjustments to net sales, cost of sales, and the related impact to operating income are recorded as necessary in the period they become known. These adjustments may result from positive project performance, and may result in an increase in operating income during the performance of individual contracts. Likewise, these adjustments may result in a decrease in operating income if Estimated Costs at Completion increase. Changes in estimates of net sales or cost of sales could affect the profitability of one or more of our contracts. The impact on Operating earnings as a result of changes in Estimated Costs at Completion was not significant for the years
2015
,
2014
, and
2013
. When estimates of total costs to be incurred on a contract exceed estimates of total revenue to be earned, a provision for the entire loss on the contract is recorded in the period the loss is determined.
Hardware and Software Services Support
Revenue under equipment and software support and maintenance agreements, which do not contain specified future software upgrades, is recognized ratably over the contract term.
Software and Licenses
Revenue from pre-paid perpetual licenses is recognized at the inception of the arrangement, presuming all other revenue recognition criteria are met. Revenue from non-perpetual licenses or term licenses is recognized ratably over the period of the license.
Multiple-Element Arrangements
Arrangements with customers may include multiple deliverables, including any combination of products, services and software. These multiple-element arrangements could also include an element accounted for as a long-term contract coupled with other products, services and software. For multiple-element arrangements that include products containing software that function together with the equipment to deliver its essential functionality, undelivered software elements that relate to the product's essential software, and undelivered non-software services, deliverables are separated into more than one unit of accounting when: (i) the delivered element(s) have value to the customer on a stand-alone basis and (ii) delivery of the undelivered element(s) is probable and substantially in our control.
In these arrangements, we allocate revenue to all deliverables based on their relative selling prices. We use the following hierarchy to determine the selling price to be used for allocating revenue to deliverables: (i) vendor-specific objective evidence (“VSOE”) of fair value, (ii) third-party evidence (“TPE”) of selling price, and (iii) best estimate of selling price (“ESP”).
We determine VSOE based on our normal pricing and discounting practices for the specific product or service when that same product or service is sold separately. In determining VSOE, we require that a substantial majority of the selling prices for a product or service fall within a reasonably narrow pricing range, generally evidenced by the pricing rates of approximately 80% of such historical stand-alone transactions falling within plus or minus 15% of the median rate.
When VSOE does not exist, we attempt to determine TPE based on competitor prices for similar deliverables when sold separately. Generally, our go-to-market strategy for many of our products differs from that of our competitors and our offerings contain a significant level of customization and differentiation such that the comparable pricing of products with similar functionality sold by other companies cannot be obtained. Furthermore, we are unable to reliably determine what similar competitor products’ selling prices are on a stand-alone basis. Therefore, we typically are not able to determine TPE.
When both VSOE and TPE are unavailable, we use ESP. We determine ESP by: (i) collecting all reasonably available data points including sales, cost and margin analysis of the product, and other inputs based on our normal pricing and discounting practices, (ii) making any reasonably required adjustments to the data based on market and Company-specific factors, and (iii) stratifying the data points, when appropriate, based on customer, magnitude of the transaction and sales volume.
We also consider the geographies in which the products or services are sold, major product and service groups, customer classification, and other environmental or marketing variables in determining VSOE, TPE, and ESP.
Once elements of an arrangement are separated into more than one unit of accounting, revenue is recognized for each separate unit of accounting based on the nature of the revenue as described above.
Our arrangements with multiple deliverables may also contain one or more software deliverables that are subject to software revenue recognition guidance. The revenue for these multiple-element arrangements is allocated to the software deliverable(s) and the non-software deliverable(s) based on the relative selling prices of all of the deliverables in the arrangement using the fair value hierarchy outlined above. In circumstances where we cannot determine VSOE or TPE for any of the deliverables in the arrangement, ESP is used for the purpose of allocating the arrangement consideration between software and non-software deliverables.
41
We allocate arrangement consideration to multiple software or software-related deliverables, including the sale of software upgrades or software support agreements to previously sold software, in accordance with software accounting guidance. For such arrangements, revenue is allocated to the deliverables based on the relative fair value of each element of the software, and fair value is determined using VSOE. Where VSOE does not exist for the undelivered software element, revenue is deferred until either the undelivered element is delivered or VSOE is established, whichever occurs first. When the final undelivered software element is post contract support, service revenue is recognized on a ratable basis over the remaining service period. When VSOE of a delivered element has not been established, but VSOE exists for the undelivered elements, we use the residual method to recognize revenue when the fair value of all undelivered elements is determinable. Under the residual method, the fair value of the undelivered elements is deferred and the remaining portion of the arrangement consideration is allocated to the delivered elements and is recognized as revenue.
Inventory Valuation
We record valuation reserves on our inventory for estimated excess or obsolescence. The amount of the reserve is equal to the difference between the cost of the inventory and the estimated market value based upon assumptions about future demand and market conditions. On a quarterly basis, management performs an analysis based on future demand requirement estimates of the underlying inventory to identify reserves needed for excess and obsolescence. In addition, we adjust the carrying value of inventory if the current market value of that inventory is below our cost.
At
December 31, 2015
and
2014
, Inventories consisted of the following:
|
December 31
|
2015
|
2014
|
|||||
|
Finished goods
|
$
|
151
|
|
$
|
163
|
|
|
|
Work-in-process and production materials
|
287
|
|
313
|
|
|||
|
438
|
|
476
|
|
||||
|
Less inventory reserves
|
(142
|
)
|
(131
|
)
|
|||
|
|
$
|
296
|
|
$
|
345
|
|
|
We balance the need to maintain strategic inventory levels to ensure competitive delivery performance to our customers against the risk of inventory obsolescence due to rapidly changing technology and customer requirements. As reflected above, our inventory reserves represented
32%
of the gross inventory balance at
December 31, 2015
, compared to
28%
of the gross inventory balance at
December 31, 2014
. We have inventory reserves for excess inventory, pending cancellations of product lines due to technology changes, long-life cycle products, lifetime buys at the end of supplier production runs, business exits, and a shift of production to outsourced manufacturing.
If future demand or market conditions are less favorable than those projected by management, additional inventory writedowns may be required.
Income Taxes
We record deferred income tax assets and liabilities based on the estimated future tax effects of differences between the financial and tax bases of assets and liabilities based on currently enacted tax laws. The Company’s deferred and other tax balances are based on management’s interpretation of the tax regulations and rulings in numerous taxing jurisdictions. Income tax expense and liabilities recognized by the Company also reflect our best estimates and assumptions regarding, among other things, the level of future taxable income, the effect of the Company’s various tax planning strategies and uncertain tax positions. Future tax authority rulings and changes in tax laws and projected levels of taxable income and future tax planning strategies could affect the actual effective tax rate and tax balances recorded by the Company. We evaluate deferred income tax asset balances on a quarterly basis to determine if valuation allowances are required by considering available evidence, including historical and projected taxable income and tax planning strategies that are both prudent and feasible. Tax related interest and penalties are classified as a component of interest expense.
Retirement Benefits
Our benefit obligations and net periodic pension cost (benefits) associated with our domestic noncontributory pension plans (“U.S. Pension Benefit Plans”), our foreign noncontributory pension plans (“Non-U.S. Plans”), as well as our domestic postretirement health care plan (“Postretirement Health Care Benefits”), are determined using actuarial assumptions. The assumptions are based on management’s best estimates, after consulting with outside investment advisors and actuaries.
Accounting methodologies use an attribution approach that generally spreads the effects of individual events over the service lives of the participants in the plan, or estimated average lifetime when almost all of the plan participants are considered "inactive." Examples of “events” are plan amendments and changes in actuarial assumptions such as discount rate, expected long-term rate of return on plan assets, and rate of compensation increases.
There are various assumptions used in calculating the net periodic benefit expense and related benefit obligations. One of these assumptions is the expected long-term rate of return on plan assets. The required use of the expected long-term rate of return on plan assets may result in recognized pension income that is greater or less than the actual returns of those plan assets in any given year. Over time, however, the expected long-term returns are designed to approximate the actual long-term returns. We use a five-year, market-related asset value method of recognizing asset related gains and losses.
42
We use long-term historical actual return experience with consideration of the expected investment mix of the plans’ assets, as well as future estimates of long-term investment returns, to develop our expected rate of return assumption used in calculating the net periodic pension cost and the net retirement healthcare expense. Our investment return assumption for the U.S. Pension Benefit Plans and Postretirement Healthcare Benefits Plan was
7.00%
in both
2015
and
2014
. Our investment return assumption for the Non-U.S. Plan was
5.90%
in
2015
and
5.92%
in
2014
. At
December 31, 2015
, the pension plans, including the U.S. Pension Benefit Plans and Non-U.S. Plan, and the Postretirement Health Care Benefits Plan investment portfolios were both comprised of approximately
37%
equity investments.
A second key assumption is the discount rate. The discount rate assumptions used for pension benefits and postretirement health care benefits reflect, at
December 31
of each year, the prevailing market rates for high-quality, fixed-income debt instruments that, if the obligation was settled at the measurement date, would provide the necessary future cash flows to pay the benefit obligation when due. Our discount rates for measuring our U.S. pension benefit obligations were
4.73%
and
4.30%
at December
2015
and
2014
, respectively. Our discount rates for measuring our Non-U.S. Plans were
3.57%
and
3.19%
at December
2015
and
2014
, respectively. Our discount rates for measuring the Postretirement Health Care Benefits Plan obligation were
4.26%
and
3.90%
at
December 31, 2015
and
2014
, respectively.
A final set of assumptions involves the cost drivers of the underlying benefits. The rate of compensation increase is determined based upon long-term plans for such increases. For the Non-U.S. defined benefit plan, we assumed a weighted average rate for future compensation increases of
0.41%
and
2.54%
for
2015
and
2014
, respectively. During
2015
, the Non-U.S. defined benefit plan within the United Kingdom was amended to close future benefit accruals to all participants effective
December 31, 2015
resulting in a
0%
rate for future compensation, contributing to the decrease within the Non-U.S. Plans in
2015
compared to
2014
. Benefits under the U.S. Pension Plans have been frozen, and therefore future compensation increases are no longer a relevant assumption in the calculation of the benefit obligation on those plans. Historically, the Company utilized health care cost trend rates to determine the accumulated benefit obligation and net periodic benefit. However, the Postretirement Health Care Benefits Plan was amended in
2014
such that all eligible participants would receive an annual subsidy for the purchase of their own health care coverage from private insurance companies and for the reimbursement of eligible health care expenses. As such, health care costs are no longer considered necessary to determine the accumulated postretirement benefit obligation.
Under relevant accounting rules, when almost all of the plan participants are considered inactive, the amortization period for certain unrecognized losses changes from the average remaining service period to the average remaining lifetime of the participant. As such, depending on the specific plan, we amortize gains and losses over periods ranging from
eleven
to
thirty-five
years. Prior service costs are being amortized over periods ranging from
two
to
nine
years. Benefits under all pension plans are valued based on the projected unit credit cost method.
Effective on January 1, 2016, the Company changed the method used to estimate the interest and service cost components of net periodic cost for defined benefit pension and other post-retirement benefit plans. Historically, the interest and service cost components were estimated using a single weighted-average discount rate derived from the yield curve used to measure the projected benefit obligation at the beginning of the period. The Company has elected to use a full yield curve approach in the estimation of these components of net periodic cost by applying the specific spot rates along the yield curve used in the determination of the projected benefit obligation to the relevant projected cash flows. The Company made this change to improve the correlation between projected benefit cash flows and the corresponding yield curve spot rates and to provide a more precise measurement of interest and service costs. This change does not affect the measurement of total benefit obligations as the change in interest and service cost is completely offset in the actuarial loss reported in the period. The Company has concluded that this change is a change in estimate and, accordingly, will account for it prospectively beginning in 2016. The impact of the change estimate is an anticipated reduction of the interest and service cost components within net periodic cost in 2016 by approximately $20 million for the U.S. Pension Benefit Plans, $6 million for the Non U.S. Pension Benefit Plans, and $2 million for the Postretirement Health Care Benefits Plan compared to the prior year approach.
Valuation and Recoverability of Goodwill
We assess the recorded amount of goodwill for recovery on an annual basis in the fourth quarter of each fiscal year. Goodwill is assessed more frequently if an event occurs or circumstances change that would indicate it is more-likely-than-not that the fair value of a reporting unit is below its carrying amount. We continually assess whether any such events and circumstances have occurred, which requires a significant amount of judgment. Such events and circumstances may include: adverse changes in macroeconomic conditions, adverse changes in the industry or market in which we transact, changes in cost factors negatively impacting earnings and cash flows, negative or declining overall financial performance, events affecting the carrying value or composition of a reporting unit, or a sustained decrease in share price, among others. Any such adverse event or change in circumstances could have a significant impact on the recoverability of goodwill and could have a material impact on our consolidated financial statements.
The goodwill impairment assessment is performed at the reporting unit level. A reporting unit is an operating segment or one level below an operating segment (referred to as a “component”). A component of an operating segment is a reporting unit if the component constitutes a business for which discrete financial information is available and segment management regularly reviews the operating results of that component. When two or more components of an operating segment have similar economic characteristics, the components are aggregated and deemed a single reporting unit. An operating segment is deemed to be a reporting unit if all of its components are similar, if none of its components is a reporting unit, or if the segment comprises only a single component. Based on this guidance, we have determined that our Products and Services segments each meet the definition of a reporting unit. We performed a qualitative assessment of goodwill and determined that it was not more-likely-than-
43
not that the fair value of each reporting unit was less than its carrying amount for the fiscal years
2015
,
2014
, and
2013
. In performing this qualitative assessment we assessed relevant events and circumstances including macroeconomic conditions, industry and market conditions, cost factors, overall financial performance, changes in share price, and entity-specific events. For fiscal years
2015
,
2014
, and
2013
, we concluded it was more-likely-than-not that the fair value of each reporting unit exceeded its carrying value.
Recent Accounting Pronouncements
In May 2014, the Financial Accounting Standards Board ("FASB") issued Accounting Standards Update ("ASU") No. 2014-09, "Revenue from Contracts with Customers." This new standard will replace most existing revenue recognition guidance in U.S. GAAP. The core principle of the ASU is that an entity should recognize revenue for the transfer of goods or services equal to the amount it expects to receive for those goods and services. The ASU requires additional disclosure about the nature, amount, timing and uncertainty of revenue and cash flows arising from customer contracts, including significant judgments and estimates and changes in those estimates. In August 2015, the FASB issued ASU 2015-14, "Revenue from Contracts with Customers: Deferral of the Effective Date" that delayed the effective date of ASU 2014-09 by one year to January 1, 2018, as the our annual reporting period begins after December 15, 2017. ASU 2014-09 allows for both retrospective and modified retrospective methods of adoption. We are in the process of determining the method of adoption we will elect and are currently assessing the impact of this ASU on our consolidated financial statements and footnote disclosures.
In April 2015, the FASB issued ASU No. 2015-03, "Interest-Imputation of Interest (Subtopic 835-30): Simplifying the Presentation of Debt Issuance Costs." Under this guidance, debt issuance costs related to a recognized debt liability are required to be presented in the balance sheet as a direct reduction from the carrying amount of such debt liability, consistent with debt discounts. The recognition and measurement guidance for debt issuance costs are not affected by this guidance. In adopting the ASU, we will be required to apply a full retrospective approach to all periods presented. This guidance will be effective January 1, 2016 and, upon adoption, debt issuance costs capitalized in other assets in the consolidated balance sheet will be reclassified and presented as a reduction to long-term debt. As of December 31, 2015, debt issuance costs, net of accumulated amortization, recognized in the consolidated balance sheet were $41 million.
In November 2015, the FASB issued ASU 2015-17 “Balance Sheet Classification of Deferred Taxes” (ASU 2015-17). ASU 2015-17 simplifies current guidance, which requires entities to separately present deferred tax assets and deferred tax liabilities as current and noncurrent in a classified balance sheet. ASU 2015-17 is effective for the Company’s fiscal year 2017, however, early adoption is allowed. We have adopted the standard on a prospective basis as of December 31, 2015. Prior period amounts have not been adjusted to reflect this presentation. The standard reduces the complexity in the preparation of the income tax provision and simplifies the presentation of the deferred taxes in our consolidated balance sheet.
Forward-Looking Statements
Except for historical matters, the matters discussed in this Form 10-K are forward-looking statements within the meaning of applicable federal securities law. These statements are made pursuant to the safe harbor provisions of the Private Securities Litigation Reform Act of 1995 and generally include words such as “believes,” “expects,” “intends,” “aims,” “estimates” and similar expressions. We can give no assurance that any future results or events discussed in these statements will be achieved. Any forward-looking statements represent our views only as of today and should not be relied upon as representing our views as of any subsequent date. Readers are cautioned that such forward-looking statements are subject to a variety of risks and uncertainties that could cause our actual results to differ materially from the statements contained in this Form 10-K. Forward-looking statements include, but are not limited to, statements under the following headings: (1) “Business,” about: (a) industry growth and demand, including opportunities resulting from such growth, (b) future product development and the demand for new products, (c) customer spending, (d) the impact of our strategy and focus areas, (e) the impact from the loss of key customers, (f) competitive position and our ability to maintain a leadership position in our core products, (g) increased competition, (h) the impact of regulatory matters, (i) the impact from the allocation and regulation of spectrum, particularly with respect to broadband spectrum, (j) the firmness of each segment's backlog, (k) the competitiveness of the patent portfolio, (l) the impact of research and development, (m) the availability of materials and components, energy supplies and labor, and (n) the seasonality of the business; (2) “Properties,” about the sufficiency of our manufacturing capacity and the consequences of a disruption in manufacturing; (3) “Legal Proceedings,” about the ultimate disposition of pending legal matters and timing; (4) “Management's Discussion and Analysis,” about: (a) the impact of the Airwave acquisition on our business, (b) the benefits of the relationship with Silver Lake Partners, (c) the expected efficiencies of reorganizing our R&D and SG&A functions, (d) market growth/contraction, demand, spending and resulting opportunities, (e) impact of foreign exchange rate fluctuations, (f) our continued ability to reduce our operating expenses, (g) the growth of our Services segment and the resulting impact on consolidated gross margin, (h) the increase in public safety LTE revenues, (i) the decline in iDEN, (j) the return of capital to shareholders through dividends and/or repurchasing shares, (k) our ability to invest in capital expenditures and R&D, (l) the success of our business strategy and portfolio, (m) future payments, charges, use of accruals and expected cost-saving and profitability benefits associated with our reorganization of business programs and employee separation costs, (n) our ability and cost to repatriate funds, (o) future cash contributions to pension plans or retiree health benefit plans, (p) the liquidity of our investments, (q) our ability and cost to access the capital markets, (r) our ability to borrow and the amount available under our credit facilities, (s) our ability to settle the principal amount of the Senior Convertible Notes in cash, (t) our ability and cost to obtain Performance Bonds, (u) adequacy of internal resources to fund expected working capital and capital expenditure measurements, (v) expected payments pursuant to commitments under long-term agreements, (w) the ability to meet minimum purchase obligations, (x) our ability to sell accounts receivable and the terms and amounts of such sales, (y) the outcome and effect of ongoing and future legal proceedings, (z) the impact of the loss of key customers, and (aa) the expected effective tax rate and deductibility of certain items; and (5) “Quantitative and Qualitative Disclosures about Market Risk,” about: (a) the impact of foreign currency exchange
44
risks, (b) future hedging activity and expectations of the Company, and (c) the ability of counterparties to financial instruments to perform their obligations.
Some of the risk factors that affect our business and financial results are discussed in “Item 1A: Risk Factors.” We caution the reader that the risk factors discussed in “Item 1A: Risk Factors,” and those described elsewhere in this report or in our other Securities and Exchange Commission filings, could cause our actual results to differ materially from those stated in the forward-looking statements.
Interest Rate Risk
As of
December 31, 2015
, we have
$4.4 billion
of long-term debt, including the current portion of long-term debt, which is primarily priced at long-term, fixed interest rates. Of this total long-term debt amount, a
$29 million
Euro-denominated variable interest loan has a hedge that changes the interest rate characteristics from variable to fixed-rate. A hypothetical unfavorable movement of 10% in the interest rates would have an immaterial impact on the hedge’s fair value.
Foreign Currency Risk
We use financial instruments to reduce our overall exposure to the effects of currency fluctuations on cash flows. Our policy prohibits speculation in financial instruments for profit on exchange rate price fluctuations, trading in currencies for which there are no underlying exposures, or entering into transactions for any currency to intentionally increase the underlying exposure. Instruments that are designated as part of a hedging relationship must be effective at reducing the risk associated with the exposure being hedged and are designated as part of a hedging relationship at the inception of the contract. Accordingly, changes in the market values of hedge instruments must be highly correlated with changes in market values of the underlying hedged items both at the inception of the hedge and over the life of the hedge contract.
Our strategy related to foreign exchange exposure management is to offset the gains or losses on the financial instruments against losses or gains on the underlying operational cash flows or investments based on our assessment of risk. We enter into derivative contracts for some of our non-functional currency cash, receivables, and payables, which are primarily denominated in major currencies that can be traded on open markets. We typically use forward contracts and options to hedge these currency exposures. In addition, we enter into derivative contracts for some forecasted transactions, which are designated as part of a hedging relationship if it is determined that the transaction qualifies for hedge accounting under the provisions of the authoritative accounting guidance for derivative instruments and hedging activities. A portion of our exposure is from currencies that are not traded in liquid markets and these are addressed, to the extent reasonably possible, by managing net asset positions, product pricing and component sourcing.
At
December 31, 2015
, we had outstanding foreign exchange contracts totaling
$494 million
, compared to
$628 million
outstanding at
December 31, 2014
. Management does not believe these financial instruments should subject it to undue risk due to foreign exchange movements because gains and losses on these contracts should generally offset gains and losses on the underlying assets, liabilities and transactions.
The following table shows the five largest net notional amounts of the positions to buy or sell foreign currency as of
December 31, 2015
and the corresponding positions as of
December 31, 2014
:
|
Notional Amount
|
|||||||
|
Net Buy (Sell) by Currency
|
2015
|
2014
|
|||||
|
Chinese Renminbi
|
$
|
(114
|
)
|
$
|
(161
|
)
|
|
|
Euro
|
99
|
|
214
|
|
|||
|
British Pound
|
62
|
|
34
|
|
|||
|
Australian Dollar
|
(60
|
)
|
(42
|
)
|
|||
|
Brazilian Real
|
(44
|
)
|
(28
|
)
|
|||
Foreign exchange financial instruments that are subject to the effects of currency fluctuations, which may affect reported earnings, include derivative financial instruments and other monetary assets and liabilities denominated in a currency other than the functional currency of the legal entity holding the instrument. Derivative financial instruments consist primarily of currency forward contracts and options. Other monetary assets and liabilities denominated in a currency other than the functional currency of the legal entity consist primarily of cash, cash equivalents, short-term investments, as well as accounts payable and receivable. Accounts payable and receivable are reflected at fair value in the financial statements. Assuming the amounts of the outstanding foreign exchange contracts represent our underlying foreign exchange risk related to monetary assets and liabilities, a hypothetical unfavorable 10% movement in the foreign exchange rates, from current levels, would reduce the value of those monetary assets and liabilities by approximately
$49 million
. Our market risk calculation represents an estimate of reasonably possible net losses that would be recognized assuming hypothetical 10% movements in future currency market pricing and is not necessarily indicative of actual results, which may or may not occur. It does not represent the maximum possible loss or any expected loss that may occur, since actual future gains and losses will differ from those estimated, based upon, among other things, actual fluctuation in market rates, operating exposures, and the timing thereof. We believe, however, that any such loss
45
incurred would be offset by the effects of market rate movements on the respective underlying derivative financial instruments transactions. The foreign exchange financial instruments are held for purposes other than trading.
®
Reg. U.S. Patent & Trademark Office.
MOTOROLA MOTO, MOTOROLA SOLUTIONS and the Stylized M Logo, as well as iDEN are trademarks or registered trademarks of Motorola Trademark Holdings, LLC and are used under license. All other products or service names are the property of their respective owners.
46
REPORT OF INDEPENDENT REGISTERED PUBLIC ACCOUNTING FIRM
The Board of Directors and Stockholders
Motorola Solutions, Inc.:
We have audited the accompanying consolidated balance sheets of Motorola Solutions, Inc. and Subsidiaries as of December 31,
2015
and
2014
, and the related consolidated statements of operations, comprehensive income, stockholders’ equity, and cash flows for each of the years in the three‑year period ended December 31,
2015
. These consolidated financial statements are the responsibility of the Company’s management. Our responsibility is to express an opinion on these consolidated financial statements based on our audits.
We conducted our audits in accordance with the standards of the Public Company Accounting Oversight Board (United States). Those standards require that we plan and perform the audit to obtain reasonable assurance about whether the financial statements are free of material misstatement. An audit includes examining, on a test basis, evidence supporting the amounts and disclosures in the financial statements. An audit also includes assessing the accounting principles used and significant estimates made by management, as well as evaluating the overall financial statement presentation. We believe that our audits provide a reasonable basis for our opinion.
In our opinion, the consolidated financial statements referred to above present fairly, in all material respects, the financial position of Motorola Solutions, Inc. and Subsidiaries as of December 31,
2015
and
2014
, and the results of their operations and their cash flows for each of the years in the three‑year period ended December 31,
2015
, in conformity with U.S. generally accepted accounting principles.
We also have audited, in accordance with the standards of the Public Company Accounting Oversight Board (United States), Motorola Solutions, Inc.’s internal control over financial reporting as of December 31,
2015
, based on criteria established in Internal Control - Integrated Framework (2013) issued by the Committee of Sponsoring Organizations of the Treadway Commission (COSO), and our report dated
February 22, 2016
expressed an unqualified opinion on the effectiveness of the Company’s internal control over financial reporting.

Chicago, Illinois
February 22, 2016
47
|
|
Years ended December 31
|
||||||||||
|
(In millions, except per share amounts)
|
2015
|
2014
|
2013
|
||||||||
|
Net sales from products
|
$
|
3,676
|
|
$
|
3,807
|
|
$
|
4,109
|
|
||
|
Net sales from services
|
2,019
|
|
2,074
|
|
2,118
|
|
|||||
|
Net sales
|
5,695
|
|
5,881
|
|
6,227
|
|
|||||
|
Costs of products sales
|
1,625
|
|
1,678
|
|
1,808
|
|
|||||
|
Costs of services sales
|
1,351
|
|
1,372
|
|
1,310
|
|
|||||
|
Costs of sales
|
2,976
|
|
3,050
|
|
3,118
|
|
|||||
|
Gross margin
|
2,719
|
|
2,831
|
|
3,109
|
|
|||||
|
Selling, general and administrative expenses
|
1,021
|
|
1,184
|
|
1,330
|
|
|||||
|
Research and development expenditures
|
620
|
|
681
|
|
761
|
|
|||||
|
Other charges
|
84
|
|
1,972
|
|
71
|
|
|||||
|
Operating earnings (loss)
|
994
|
|
(1,006
|
)
|
947
|
|
|||||
|
Other income (expense):
|
|||||||||||
|
Interest expense, net
|
(173
|
)
|
(126
|
)
|
(113
|
)
|
|||||
|
Gains on sales of investments
|
107
|
|
5
|
|
37
|
|
|||||
|
Other
|
(11
|
)
|
(34
|
)
|
9
|
|
|||||
|
Total other expense
|
(77
|
)
|
(155
|
)
|
(67
|
)
|
|||||
|
Earnings (loss) from continuing operations before income taxes
|
917
|
|
(1,161
|
)
|
880
|
|
|||||
|
Income tax expense (benefit)
|
274
|
|
(465
|
)
|
(59
|
)
|
|||||
|
Earnings (loss) from continuing operations
|
643
|
|
(696
|
)
|
939
|
|
|||||
|
Earnings (loss) from discontinued operations, net of tax
|
(30
|
)
|
1,996
|
|
166
|
|
|||||
|
Net earnings
|
613
|
|
1,300
|
|
1,105
|
|
|||||
|
Less: Earnings attributable to noncontrolling interests
|
3
|
|
1
|
|
6
|
|
|||||
|
Net earnings attributable to Motorola Solutions, Inc.
|
$
|
610
|
|
$
|
1,299
|
|
$
|
1,099
|
|
||
|
Amounts attributable to Motorola Solutions, Inc. common stockholders:
|
|||||||||||
|
Earnings (loss) from continuing operations, net of tax
|
$
|
640
|
|
$
|
(697
|
)
|
$
|
933
|
|
||
|
Earnings (loss) from discontinued operations, net of tax
|
(30
|
)
|
1,996
|
|
166
|
|
|||||
|
Net earnings attributable to Motorola Solutions, Inc.
|
$
|
610
|
|
$
|
1,299
|
|
$
|
1,099
|
|
||
|
Earnings (loss) per common share:
|
|||||||||||
|
Basic:
|
|||||||||||
|
Continuing operations
|
$
|
3.21
|
|
$
|
(2.84
|
)
|
$
|
3.51
|
|
||
|
Discontinued operations
|
(0.15
|
)
|
8.13
|
|
0.62
|
|
|||||
|
$
|
3.06
|
|
$
|
5.29
|
|
$
|
4.13
|
|
|||
|
Diluted:
|
|||||||||||
|
Continuing operations
|
$
|
3.17
|
|
$
|
(2.84
|
)
|
$
|
3.45
|
|
||
|
Discontinued operations
|
(0.15
|
)
|
8.13
|
|
0.61
|
|
|||||
|
$
|
3.02
|
|
$
|
5.29
|
|
$
|
4.06
|
|
|||
|
Weighted average common shares outstanding:
|
|||||||||||
|
Basic
|
199.6
|
|
245.6
|
|
266.0
|
|
|||||
|
Diluted
|
201.8
|
|
245.6
|
|
270.5
|
|
|||||
|
Dividends declared per share
|
$
|
1.43
|
|
$
|
1.30
|
|
$
|
1.14
|
|
||
See accompanying notes to consolidated financial statements.
48
Consolidated Statements of Comprehensive Income
|
|
Years ended December 31
|
||||||||||
|
(In millions)
|
2015
|
2014
|
2013
|
||||||||
|
Net earnings
|
$
|
613
|
|
$
|
1,300
|
|
$
|
1,105
|
|
||
|
Other comprehensive income (loss), net of tax (Note 3):
|
|||||||||||
|
Foreign currency translation adjustments
|
(62
|
)
|
(108
|
)
|
(4
|
)
|
|||||
|
Derivative instruments
|
—
|
|
1
|
|
(2
|
)
|
|||||
|
Marketable securities
|
(47
|
)
|
46
|
|
(4
|
)
|
|||||
|
Defined benefit plans
|
98
|
|
493
|
|
1,023
|
|
|||||
|
Total other comprehensive income (loss)
|
(11
|
)
|
432
|
|
1,013
|
|
|||||
|
Comprehensive income
|
602
|
|
1,732
|
|
2,118
|
|
|||||
|
Less: Earnings attributable to noncontrolling interest
|
3
|
|
1
|
|
6
|
|
|||||
|
Comprehensive income attributable to Motorola Solutions, Inc. common shareholders
|
$
|
599
|
|
$
|
1,731
|
|
$
|
2,112
|
|
||
See accompanying notes to consolidated financial statements.
49
|
|
December 31
|
||||||
|
(In millions, except par value)
|
2015
|
2014
|
|||||
|
ASSETS
|
|||||||
|
Cash and cash equivalents
|
$
|
1,980
|
|
$
|
3,954
|
|
|
|
Accounts receivable, net
|
1,362
|
|
1,409
|
|
|||
|
Inventories, net
|
296
|
|
345
|
|
|||
|
Deferred income taxes
|
—
|
|
431
|
|
|||
|
Other current assets
|
917
|
|
740
|
|
|||
|
Current assets held for disposition
|
27
|
|
—
|
|
|||
|
Total current assets
|
4,582
|
|
6,879
|
|
|||
|
Property, plant and equipment, net
|
487
|
|
549
|
|
|||
|
Investments
|
268
|
|
316
|
|
|||
|
Deferred income taxes
|
2,278
|
|
2,151
|
|
|||
|
Goodwill
|
420
|
|
383
|
|
|||
|
Other assets
|
312
|
|
145
|
|
|||
|
Non-current assets held for disposition
|
40
|
|
—
|
|
|||
|
Total assets
|
$
|
8,387
|
|
$
|
10,423
|
|
|
|
LIABILITIES AND STOCKHOLDERS’ EQUITY
|
|||||||
|
Current portion of long-term debt
|
$
|
4
|
|
$
|
4
|
|
|
|
Accounts payable
|
518
|
|
540
|
|
|||
|
Accrued liabilities
|
1,671
|
|
1,706
|
|
|||
|
Total current liabilities
|
2,193
|
|
2,250
|
|
|||
|
Long-term debt
|
4,386
|
|
3,396
|
|
|||
|
Other liabilities
|
1,904
|
|
2,011
|
|
|||
|
Stockholders’ Equity
|
|||||||
|
Preferred stock, $100 par value
|
—
|
|
—
|
|
|||
|
Common stock, $.01 par value:
|
2
|
|
2
|
|
|||
|
Authorized shares: 600.0
|
|||||||
|
Issued shares: 12/31/15—174.5; 12/31/14—220.5
|
|||||||
|
Outstanding shares: 12/31/15—174.3; 12/31/14—219.8
|
|||||||
|
Additional paid-in capital
|
42
|
|
1,178
|
|
|||
|
Retained earnings
|
1,716
|
|
3,410
|
|
|||
|
Accumulated other comprehensive loss
|
(1,866
|
)
|
(1,855
|
)
|
|||
|
Total Motorola Solutions, Inc. stockholders’ equity (deficit)
|
(106
|
)
|
2,735
|
|
|||
|
Noncontrolling interests
|
10
|
|
31
|
|
|||
|
Total stockholders’ equity (deficit)
|
(96
|
)
|
2,766
|
|
|||
|
Total liabilities and stockholders’ equity
|
$
|
8,387
|
|
$
|
10,423
|
|
|
See accompanying notes to consolidated financial statements.
50
Consolidated Statements of Stockholders’ Equity
|
(In millions, except per share amounts)
|
Shares
|
Common Stock and Additional Paid-in Capital
|
Accumulated Other Comprehensive Income (Loss)
|
Retained Earnings
|
Noncontrolling Interests
|
|||||||||||||
|
Balance as of January 1, 2013
|
277.3
|
|
$
|
4,940
|
|
$
|
(3,300
|
)
|
$
|
1,625
|
|
$
|
25
|
|
||||
|
Net earnings
|
|
|
|
|
1,099
|
|
6
|
|
||||||||||
|
Other comprehensive income
|
|
|
1,013
|
|
|
|
||||||||||||
|
Issuance of common stock and stock options exercised
|
6.8
|
|
100
|
|
|
|
|
|||||||||||
|
Share repurchase program
|
(28.6
|
)
|
(1,694
|
)
|
|
|
|
|||||||||||
|
Excess tax benefit from share-based compensation
|
|
25
|
|
|
|
|
||||||||||||
|
Share-based compensation expense
|
|
153
|
|
|
|
|
||||||||||||
|
Acquisition of noncontrolling interest
|
|
(3
|
)
|
|
|
(1
|
)
|
|||||||||||
|
Dividends declared
|
|
|
|
(299
|
)
|
|
|
|||||||||||
|
Balance as of December 31, 2013
|
255.5
|
|
$
|
3,521
|
|
$
|
(2,287
|
)
|
$
|
2,425
|
|
$
|
30
|
|
||||
|
Net earnings
|
|
|
|
|
1,299
|
|
1
|
|
||||||||||
|
Other comprehensive income
|
|
|
432
|
|
|
|
||||||||||||
|
Issuance of common stock and stock options exercised
|
4.4
|
|
86
|
|
|
|
|
|||||||||||
|
Share repurchase program
|
(39.4
|
)
|
(2,546
|
)
|
|
|
|
|||||||||||
|
Excess tax benefit from share-based compensation
|
|
5
|
|
|
|
|
||||||||||||
|
Share-based compensation expense
|
|
114
|
|
|
|
|
||||||||||||
|
Dividends declared
|
|
|
|
(314
|
)
|
|
|
|||||||||||
|
Balance as of December 31, 2014
|
220.5
|
|
$
|
1,180
|
|
$
|
(1,855
|
)
|
$
|
3,410
|
|
$
|
31
|
|
||||
|
Net earnings
|
|
|
|
610
|
|
3
|
|
|||||||||||
|
Other comprehensive loss
|
|
|
(11
|
)
|
|
|
||||||||||||
|
Issuance of common stock and stock options exercised
|
2
|
|
80
|
|
|
|
|
|||||||||||
|
Share repurchase program
|
(48
|
)
|
(1,147
|
)
|
|
(2,030
|
)
|
|
||||||||||
|
Tax shortfalls from share-based compensation
|
|
|
(155
|
)
|
|
|
|
|||||||||||
|
Sale of controlling interest in subsidiary common stock
|
|
|
|
|
(24
|
)
|
||||||||||||
|
Share-based compensation expense
|
|
78
|
|
|
|
|
||||||||||||
|
Dividends declared
|
|
|
|
|
|
(274
|
)
|
|
||||||||||
|
Equity component of Senior Convertible Notes
|
|
|
8
|
|
|
|
|
|||||||||||
|
Balance as of December 31, 2015
|
174.5
|
|
$
|
44
|
|
$
|
(1,866
|
)
|
$
|
1,716
|
|
$
|
10
|
|
||||
See accompanying notes to consolidated financial statements.
51
|
|
Years ended December 31
|
||||||||||
|
(In millions)
|
2015
|
2014
|
2013
|
||||||||
|
Operating
|
|||||||||||
|
Net earnings attributable to Motorola Solutions, Inc.
|
$
|
610
|
|
$
|
1,299
|
|
$
|
1,099
|
|
||
|
Earnings attributable to noncontrolling interests
|
3
|
|
1
|
|
6
|
|
|||||
|
Net earnings
|
613
|
|
1,300
|
|
1,105
|
|
|||||
|
Earnings (loss) from discontinued operations, net of tax
|
(30
|
)
|
1,996
|
|
166
|
|
|||||
|
Earnings (loss) from continuing operations, net of tax
|
643
|
|
(696
|
)
|
939
|
|
|||||
|
Adjustments to reconcile earnings (loss) from continuing operations to net cash provided by (used for) operating activities:
|
|||||||||||
|
Depreciation and amortization
|
150
|
|
173
|
|
158
|
|
|||||
|
Non-cash other charges (income)
|
52
|
|
—
|
|
(14
|
)
|
|||||
|
Non-U.S. pension curtailment gain
|
(32
|
)
|
—
|
|
—
|
|
|||||
|
Gain on sale of building and land
|
—
|
|
(21
|
)
|
—
|
|
|||||
|
Loss on pension plan settlement
|
—
|
|
1,883
|
|
—
|
|
|||||
|
Share-based compensation expense
|
78
|
|
94
|
|
120
|
|
|||||
|
Gains on sales of investments and businesses, net
|
(107
|
)
|
(5
|
)
|
(37
|
)
|
|||||
|
Loss from the extinguishment of long-term debt
|
—
|
|
37
|
|
—
|
|
|||||
|
Deferred income taxes
|
160
|
|
(557
|
)
|
(334
|
)
|
|||||
|
Changes in assets and liabilities, net of effects of acquisitions, dispositions, and foreign currency translation adjustments:
|
|||||||||||
|
Accounts receivable
|
21
|
|
(62
|
)
|
(36
|
)
|
|||||
|
Inventories
|
16
|
|
(5
|
)
|
(8
|
)
|
|||||
|
Other current assets
|
92
|
|
(47
|
)
|
50
|
|
|||||
|
Accounts payable and accrued liabilities
|
10
|
|
(120
|
)
|
(232
|
)
|
|||||
|
Other assets and liabilities
|
(78
|
)
|
(1,359
|
)
|
(51
|
)
|
|||||
|
Net cash provided by (used for) operating activities from continuing operations
|
1,005
|
|
(685
|
)
|
555
|
|
|||||
|
Investing
|
|||||||||||
|
Acquisitions and investments, net
|
(586
|
)
|
(47
|
)
|
(57
|
)
|
|||||
|
Proceeds from sales of investments and businesses, net
|
230
|
|
3,403
|
|
61
|
|
|||||
|
Capital expenditures
|
(175
|
)
|
(181
|
)
|
(169
|
)
|
|||||
|
Proceeds from sales of property, plant and equipment
|
3
|
|
33
|
|
66
|
|
|||||
|
Proceeds from sales of Sigma Fund investments and short-term investments, net
|
—
|
|
—
|
|
2,133
|
|
|||||
|
Net cash provided by (used for) investing activities from continuing operations
|
(528
|
)
|
3,208
|
|
2,034
|
|
|||||
|
Financing
|
|||||||||||
|
Repayment of debt
|
(4
|
)
|
(465
|
)
|
(4
|
)
|
|||||
|
Net proceeds from issuance of debt
|
971
|
|
1,375
|
|
593
|
|
|||||
|
Issuance of common stock
|
100
|
|
135
|
|
165
|
|
|||||
|
Purchase of common stock
|
(3,177
|
)
|
(2,546
|
)
|
(1,694
|
)
|
|||||
|
Excess tax benefit from share-based compensation
|
5
|
|
11
|
|
25
|
|
|||||
|
Payment of dividends
|
(277
|
)
|
(318
|
)
|
(292
|
)
|
|||||
|
Distributions from discontinued operations
|
—
|
|
93
|
|
365
|
|
|||||
|
Net cash used for financing activities from continuing operations
|
(2,382
|
)
|
(1,715
|
)
|
(842
|
)
|
|||||
|
Discontinued Operations
|
|||||||||||
|
Net cash provided by operating activities from discontinued operations
|
—
|
|
95
|
|
389
|
|
|||||
|
Net cash provided by (used for) investing activities from discontinued operations
|
—
|
|
4
|
|
(24
|
)
|
|||||
|
Net cash used for financing activities from discontinued operations
|
—
|
|
(93
|
)
|
(365
|
)
|
|||||
|
Effect of exchange rate changes on cash and cash equivalents from discontinued operations
|
—
|
|
(6
|
)
|
—
|
|
|||||
|
Net cash provided by discontinued operations
|
—
|
|
—
|
|
—
|
|
|||||
|
Effect of exchange rate changes on cash and cash equivalents from continuing operations
|
(69
|
)
|
(79
|
)
|
10
|
|
|||||
|
Net increase (decrease) in cash and cash equivalents
|
(1,974
|
)
|
729
|
|
1,757
|
|
|||||
|
Cash and cash equivalents, beginning of period
|
3,954
|
|
3,225
|
|
1,468
|
|
|||||
|
Cash and cash equivalents, end of period
|
$
|
1,980
|
|
$
|
3,954
|
|
$
|
3,225
|
|
||
|
Supplemental Cash Flow Information
|
|
|
|
||||||||
|
Cash paid during the period for:
|
|||||||||||
|
Interest, net
|
$
|
163
|
|
$
|
128
|
|
$
|
122
|
|
||
|
Income and withholding taxes, net of refunds
|
105
|
|
105
|
|
246
|
|
|||||
See accompanying notes to consolidated financial statements.
52
Notes to Consolidated Financial Statements
(Dollars in millions, except as noted)
1. Summary of Significant Accounting Policies
Principles of Consolidation
:
The consolidated financial statements include the accounts of Motorola Solutions, Inc. (the “Company” or “Motorola Solutions”) and all controlled subsidiaries. All intercompany transactions and balances have been eliminated.
The consolidated financial statements as of
December 31, 2015
and
2014
and for the years ended
December 31, 2015
,
2014
and
2013
, include, in the opinion of management, all adjustments (consisting of normal recurring adjustments and reclassifications) necessary to present fairly the Company's consolidated financial position, results of operations, statements of comprehensive income, and statements of stockholders' equity and cash flows for all periods presented.
Use of Estimates:
The preparation of financial statements in conformity with United States ("U.S.") Generally Accepted Accounting Principles ("GAAP") requires management to make certain estimates and assumptions that affect the reported amounts of assets and liabilities and disclosure of contingent assets and liabilities at the date of the financial statements and the reported amounts of revenues and expenses during the reporting periods. Actual results could differ from those estimates.
Revenue Recognition:
Net sales consist of a wide range of activities including the delivery of stand-alone equipment or services, custom design and installation over a period of time, and bundled sales of equipment, software and services. The Company enters into revenue arrangements that may consist of multiple deliverables of its products and services due to the needs of its customers. The Company recognizes revenue when persuasive evidence of an arrangement exists, delivery has occurred, the sales price is fixed or determinable, and collectability of the sales price is reasonably assured. The Company recognizes revenue from the sale of equipment, equipment containing both software and nonsoftware components that function together to deliver the equipment’s essential functionality, and services in accordance with general revenue recognition accounting principles. The Company recognizes revenue in accordance with software accounting guidance for the following types of sales transactions: (i) stand alone sales of software products or software upgrades, (ii) stand alone sales of software maintenance agreements, and (iii) sales of software bundled with equipment where the software is not essential to the functionality of that equipment.
Products
For equipment sales, in addition to the criteria mentioned above, revenue recognition occurs when title and risk of loss has transferred to the customer, objective evidence exists that customer acceptance provisions have been met, no significant obligations remain and allowances for discounts, price protection, returns and customer incentives can be reliably estimated. Recorded revenues are reduced by these allowances. The Company bases its estimates of these allowances on historical experience taking into consideration the type of products sold, the type of customer, and the specific type of transaction in each arrangement. Where customer incentives cannot be reliably estimated, the Company defers revenue until the incentive has been finalized with the customer. The Company includes shipping charges billed to customers in net revenue, and includes the related shipping costs in cost of sales.
The Company sells software and equipment obtained from other companies. The Company establishes its own pricing and retains related inventory risk, is the primary obligor in sales transactions with customers, and assumes the credit risk for amounts billed to customers. Accordingly, the Company generally recognizes revenue for the sale of products obtained from other companies based on the gross amount billed.
Long-Term Contracts
For long-term contracts that involve customization of equipment and/or software, the Company generally recognizes revenue using the percentage of completion method based on the percentage of costs incurred to date compared to the total estimated costs to complete the contract (“Estimated Costs at Completion”). The components of estimated costs to complete a contract and management’s process for reviewing Estimated Costs at Completion and progress toward completion are discussed further below. Contracts may be combined or segmented in accordance with the applicable criteria under contract accounting principles. In certain instances, when revenues or costs associated with long-term contracts cannot be reliably estimated or the contract contains other inherent uncertainties, revenues and costs are deferred until the project is complete and customer acceptance is obtained.
Total Estimated Costs at Completion include direct labor, material and subcontracting costs. Due to the nature of the work required to be performed under many of the Company’s long-term contracts, determining Estimated Costs at Completion is complex and subject to many variables. The Company has a standard and disciplined quarterly Estimated Costs at Completion process in which management reviews the progress and performance of open contracts. As part of this process, management reviews information including, but not limited to, any outstanding key contract matters, progress towards completion, the project schedule, identified risks and opportunities, and the related changes in estimates of revenues and costs. The risks and opportunities include management's judgment about the ability and cost to achieve the project schedule, technical requirements, and other contract requirements. Management must make assumptions and estimates regarding labor productivity and availability, the complexity of the work to be performed, the availability of materials, and performance by subcontractors, among other variables. Based on this analysis, any quarterly adjustments to net sales, cost of sales, and the related impact to operating income are recorded as necessary in the period they become known. These adjustments may result from positive project performance, and may result in an increase in operating income during the performance of individual contracts. Likewise, these
53
adjustments may result in a decrease in operating income if Estimated Costs at Completion increase. Changes in estimates of net sales or cost of sales could affect the profitability of one or more of our contracts. The impact on Operating earnings as a result of changes in Estimated Costs at Completion was not significant for the years
2015
,
2014
, and
2013
. When estimates of total costs to be incurred on a contract exceed total estimates of revenue to be earned, a provision for the entire loss on the contract is recorded in the period the loss is determined.
Hardware and Software Services Support
Revenue under equipment and software maintenance agreements, which do not contain specified future software upgrades, is recognized ratably over the contract term.
Software and Licenses
Revenue from pre-paid perpetual licenses is recognized at the inception of the arrangement, presuming all other revenue recognition criteria are met. Revenue from non-perpetual licenses or term licenses is recognized ratably over the period of the license.
Multiple-Element Arrangements
Arrangements with customers may include multiple deliverables, including any combination of products, services and software. These multiple-element arrangements could also include an element accounted for as a long-term contract coupled with other products, services and software. For multiple-element arrangements that include products containing software that functions together with the equipment to deliver its essential functionality, undelivered software elements that relate to the product's essential software, and undelivered non-software services deliverables are separated into more than one unit of accounting when: (i) the delivered element(s) have value to the customer on a stand-alone basis and (ii) delivery of the undelivered element(s) is probable and substantially in the control of the Company.
In these arrangements, the Company allocates revenue to all deliverables based on their relative selling prices. The Company uses the following hierarchy to determine the selling price to be used for allocating revenue to deliverables: (i) vendor-specific objective evidence (“VSOE”) of fair value, (ii) third-party evidence (“TPE”) of selling price, and (iii) best estimate of selling price (“ESP”).
The Company determines VSOE based on its normal pricing and discounting practices for the specific product or service when that same product or service is sold separately. In determining VSOE, the Company requires that a substantial majority of the selling prices for a product or service fall within a reasonably narrow pricing range, generally evidenced by the pricing rates of approximately 80% of such historical stand-alone transactions falling within plus or minus 15% of the median rate.
When VSOE does not exist, the Company attempts to determine TPE based on competitor prices for similar deliverables when sold separately. Generally, the Company's go-to-market strategy for many of its products differs from that of its competitors and its offerings contain a significant level of customization and differentiation such that the comparable pricing of products with similar functionality sold by other companies cannot be obtained. Furthermore, the Company is unable to reliably determine what similar competitor products’ selling prices are on a stand-alone basis. Therefore, the Company is typically not able to determine TPE.
When both VSOE and TPE are unavailable, the Company uses ESP. The Company determines ESP by: (i) collecting all reasonably available data points including sales, cost and margin analysis of the product, and other inputs based on its normal pricing and discounting practices, (ii) making any reasonably required adjustments to the data based on market and Company-specific factors, and (iii) stratifying the data points, when appropriate, based on customer, magnitude of the transaction and sales volume.
The Company also considers the geographies in which the products or services are sold, major product and service groups, customer classification, and other environmental or marketing variables in determining VSOE, TPE, and ESP.
Once elements of an arrangement are separated into more than one unit of accounting, revenue is recognized for each separate unit of accounting based on the nature of the revenue as described above.
The Company's arrangements with multiple deliverables may also contain one or more software deliverables that are subject to software revenue recognition guidance. The revenue for these multiple-element arrangements is allocated to the software deliverable(s) and the non-software deliverable(s) based on the relative selling prices of all of the deliverables in the arrangement using the fair value hierarchy outlined above. In circumstances where the Company cannot determine VSOE or TPE of the selling price for any of the deliverables in the arrangement, ESP is used for the purpose of allocating the arrangement consideration between software and non-software deliverables.
The Company allocates arrangement consideration to multiple software or software-related deliverables, including the sale of software upgrades or software support agreements to previously sold software, in accordance with software accounting guidance. For such arrangements, revenue is allocated to the deliverables based on the relative fair value of each element, and fair value is determined using VSOE. Where VSOE does not exist for the undelivered software element, revenue is deferred until either the undelivered element is delivered or VSOE is established, whichever occurs first. When the final undelivered software element is post contract support, service revenue is recognized on a ratable basis over the remaining service period. When VSOE of a delivered element has not been established, but VSOE exists for the undelivered elements, the Company uses the residual method to recognize revenue when the fair value of all undelivered elements is determinable. Under the residual method, the fair value of the undelivered elements is deferred and the remaining portion of the arrangement consideration is allocated to the delivered elements and is recognized as revenue.
54
Cash Equivalents:
The Company considers all highly-liquid investments purchased with an original maturity of three months or less to be cash equivalents. Restricted cash was
$63 million
at both
December 31, 2015
and
December 31, 2014
.
Investments:
Investments in equity and debt securities classified as available-for-sale are carried at fair value. When applicable, debt securities classified as held-to-maturity are carried at amortized cost. Equity securities that are restricted for more than
one
year or that are not publicly traded are carried at cost. Certain investments are accounted for using the equity method if the Company has significant influence over the issuing entity.
The Company assesses declines in the fair value of investments to determine whether such declines are other-than-temporary. This assessment is made considering all available evidence, including changes in general market conditions, specific industry and individual company data, the length of time and the extent to which the fair value has been less than cost, the financial condition and the near-term prospects of the entity issuing the security, and the Company’s ability and intent to hold the investment until recovery. Other-than-temporary impairments of investments are recorded to Other within Other income (expense) in the Company’s consolidated statements of operations in the period in which they become impaired.
Inventories:
Inventories are valued at the lower of average cost (which approximates cost on a first-in, first-out basis) or market (net realizable value or replacement cost).
Property, Plant and Equipment:
Property, plant and equipment are stated at cost less accumulated depreciation. Depreciation is recorded on a straight-line basis, based on the estimated useful lives of the assets (buildings and building equipment,
five
to
forty
years; machinery and equipment,
two
to
ten
years) and commences once the assets are ready for their intended use.
Goodwill and Intangible Assets:
Goodwill is assessed for impairment at least annually at the reporting unit level. The Company performs its annual assessment of goodwill for impairment in the fourth quarter of each fiscal year. The annual assessment is performed using the two-step goodwill test which may also include the optional qualitative assessment to determine whether it is more-likely-than-not that the fair value of a reporting unit is less than its carrying amount prior to performing the two-step goodwill impairment test. If this is the case, the two-step goodwill impairment test is required. If it is more-likely-than-not that the fair value of a reporting unit is greater than its carrying amount, the two-step goodwill impairment test is not required.
If the two-step goodwill impairment test is performed, first, the fair value of each reporting unit is compared to its book value. Second, if the fair value of the reporting unit is less than its book value, the Company performs a hypothetical purchase price allocation based on the reporting unit's fair value to determine the fair value of the reporting unit's goodwill. Fair value is determined using a combination of present value techniques and market prices of comparable businesses.
Intangible assets are amortized on a straight line basis over their respective estimated useful lives ranging from
one
to
ten
years. The Company has no intangible assets with indefinite useful lives.
Impairment of Long-Lived Assets:
Long-lived assets, which include intangible assets, held and used by the Company are reviewed for impairment whenever events or changes in circumstances indicate that the carrying amount of assets may not be recoverable. The Company evaluates recoverability of assets to be held and used by comparing the carrying amount of an asset (group) to future net undiscounted cash flows to be generated by the asset (group). If an asset (group) is considered to be impaired, the impairment to be recognized is equal to the amount by which the carrying amount of the asset (group) exceeds the asset's (group's) fair value calculated using a discounted future cash flows analysis or market comparables. Assets held for sale, if any, are reported at the lower of the carrying amount or fair value less cost to sell.
Income Taxes:
The Company records deferred income tax assets and liabilities based on the estimated future tax effects of differences between the financial and tax bases of assets and liabilities based on currently enacted tax laws. The Company's deferred and other tax balances are based on management's interpretation of the tax regulations and rulings in numerous tax jurisdictions. Income tax expense and liabilities recognized by the Company also reflect its best estimates and assumptions regarding, among other things, the level of future taxable income, the effect of the Company's various tax planning strategies, and uncertain tax positions. Future tax authority rulings and changes in tax laws, changes in projected levels of taxable income, and future tax planning strategies could affect the actual effective tax rate and tax balances recorded by the Company.
Sales and Use Taxes:
The Company records taxes imposed on revenue-producing transactions, including sales, use, value added and excise taxes, on a net basis with such taxes excluded from revenue.
Long-term Receivables:
Long-term receivables include trade receivables where contractual terms of the note agreement are greater than
one
year. Long-term receivables are considered impaired when management determines collection of all amounts due according to the contractual terms of the note agreement, including principal and interest, is no longer probable. Impaired long-term receivables are valued based on the present value of expected future cash flows discounted at the receivable’s effective interest rate, or the fair value of the collateral if the receivable is collateral dependent. Interest income and late fees on impaired long-term receivables are recognized only when payments are received. Previously impaired long-term receivables are no longer considered impaired and are reclassified to performing when they have performed under a workout or restructuring for four consecutive quarters.
Foreign Currency:
Certain of the Company’s non-U.S. operations use their respective local currency as their functional currency. Those operations that do not have the U.S. dollar as their functional currency translate assets and liabilities at current rates of exchange in effect at the balance sheet date and revenues and expenses using rates that approximate those
55
in effect during the period. The resulting translation adjustments are included as a component of Accumulated other comprehensive loss in the Company’s consolidated balance sheets. For those operations that have the U.S. dollar as their functional currency, transactions denominated in the local currency are measured in U.S. dollars using the current rates of exchange for monetary assets and liabilities and historical rates of exchange for nonmonetary assets. Gains and losses from remeasurement of monetary assets and liabilities are included in Other within Other income (expense) within the Company’s consolidated statements of operations.
Derivative Instruments:
Gains and losses on hedges of existing assets or liabilities are marked-to-market and the result is included in Other within Other income (expense) within the Company’s consolidated statements of operations. Certain financial instruments are used to hedge firm future commitments or forecasted transactions. Gains and losses pertaining to those instruments that qualify for hedge accounting are deferred until such time as the underlying transactions are recognized and subsequently recognized in the same line within the consolidated statements of operations as the hedged item. Gains and losses pertaining to those instruments that do not qualify for hedge accounting are recorded immediately in Other income (expense) within the consolidated statements of operations.
Earnings Per Share:
The Company calculates its basic earnings (loss) per share based on the weighted-average number of common shares issued and outstanding. Net earnings (loss) attributable to Motorola Solutions, Inc. is divided by the weighted average common shares outstanding during the period to arrive at the basic earnings (loss) per share. Diluted earnings (loss) per share is calculated by dividing net earnings (loss) attributable to Motorola Solutions, Inc. by the sum of the weighted average number of common shares used in the basic earnings (loss) per share calculation and the weighted average number of common shares that would be issued assuming exercise or conversion of all potentially dilutive securities, excluding those securities that would be anti-dilutive to the earnings (loss) per share calculation. Both basic and diluted earnings (loss) per share amounts are calculated for earnings (loss) from continuing operations and net earnings attributable to Motorola Solutions, Inc. for all periods presented.
Share-Based Compensation Costs:
The Company grants share-based compensation awards and offers an employee stock purchase plan. The amount of compensation cost for these share-based awards is generally measured based on the fair value of the awards as of the date that the share-based awards are issued and adjusted to the estimated number of awards that are expected to vest. The fair values of stock options and stock appreciation rights are generally determined using a Black-Scholes option pricing model which incorporates assumptions about expected volatility, risk free rate, dividend yield, and expected life. Performance based stock options, performance-contingent stock options, and market stock units vest based on market conditions and are therefore measured under a Monte Carlo simulation in order to simulate a range of possible future unit prices for Motorola Solutions over the performance period. Compensation cost for share-based awards is recognized on a straight-line basis over the vesting period.
Retirement Benefits:
The Company records annual expenses relating to its pension benefit and postretirement plans based on calculations which include various actuarial assumptions, including discount rates, assumed asset rates of return, compensation increases, and turnover rates. The Company reviews its actuarial assumptions on an annual basis and makes modifications to the assumptions based on current rates and trends. The effects of the gains, losses, and prior service costs and credits are amortized either over the average service life or over the average remaining lifetime of the participants, depending on the number of active employees in the plan. The funded status, or projected benefit obligation less plan assets, for each plan, is reflected in the Company’s consolidated balance sheets using a December 31 measurement date.
Recent Accounting Pronouncements:
In May 2014, the Financial Accounting Standards Board ("FASB") issued Accounting Standards Update ("ASU") No. 2014-09, "Revenue from Contracts with Customers." This new standard will replace most existing revenue recognition guidance in U.S. GAAP. The core principle of the ASU is that an entity should recognize revenue for the transfer of goods or services equal to the amount it expects to receive for those goods and services. This ASU requires additional disclosures about the nature, amount, timing and uncertainty of revenue and cash flows arising from customer contracts, including significant judgments and estimates and changes in those estimates. In August 2015, the FASB issued ASU 2015-14, "Revenue from Contracts with Customers: Deferral of the Effective Date" that delayed the effective date of ASU 2014-09 by one year to January 1, 2018, as the Company’s annual reporting period begins after December 15, 2017. ASU 2014-09 allows for both retrospective and modified retrospective methods of adoption. The Company is in the process of determining the method of adoption it will elect and is currently assessing the impact of this ASU on its consolidated financial statements and footnote disclosures.
In April 2015, the FASB issued ASU No. 2015-03, "Interest-Imputation of Interest (Subtopic 835-30): Simplifying the Presentation of Debt Issuance Costs." Under this guidance, debt issuance costs related to a recognized debt liability are required to be presented in the balance sheet as a direct reduction from the carrying amount of such debt liability, consistent with debt discounts. The recognition and measurement guidance for debt issuance costs are not affected by this guidance. In adopting the ASU, the Company will be required to apply a full retrospective approach to all periods presented. This guidance will be effective January 1, 2016 and, upon adoption, debt issuance costs capitalized in other assets in the consolidated balance sheet will be reclassified and presented as a reduction to long-term debt. As of December 31, 2015, debt issuance costs, net of accumulated amortization, recognized in the consolidated balance sheet were
$41 million
.
On November 20, 2015, the FASB issued ASU No. 2015-17, "Balance Sheet Classification of Deferred Taxes," which amends existing guidance on income taxes to require the classification of all deferred tax assets and liabilities as non-current on the balance sheet. The ASU will be effective for the Company beginning January 1, 2017, including interim periods in its fiscal year 2017, and allows for both retrospective and prospective methods of transition upon adoption. The Company has adopted
56
the standard on a prospective basis as of December 31, 2015. Prior period amounts have not been adjusted to reflect this presentation. The standard reduces the complexity in the preparation of the income tax provision and simplifies the presentation of the deferred taxes in our consolidated balance sheet.
2. Discontinued Operations
On October 27, 2014, the Company completed the sale of its Enterprise business to Zebra Technologies Corporation ("Zebra") for
$3.45 billion
in cash. Certain assets of the Enterprise business were excluded from the transaction and retained by the Company, including the Company’s iDEN business. The historical financial results of the Enterprise business, excluding those assets and liabilities retained in the transaction, are reflected in the Company's consolidated financial statements and footnotes as discontinued operations for all periods presented.
The following table displays summarized activity in the Company’s consolidated statements of operations for discontinued operations during the years ended
December 31, 2015
,
2014
, and
2013
.
|
Years ended December 31
|
2015
|
2014
|
2013
|
||||||||
|
Net sales
|
$
|
—
|
|
$
|
1,904
|
|
$
|
2,469
|
|
||
|
Operating earnings
|
—
|
|
203
|
|
268
|
|
|||||
|
Gains (losses) on sales of investments and businesses, net
|
(24)
|
|
1,888
|
|
3
|
|
|||||
|
Earnings (loss) before income taxes
|
(24
|
)
|
2,074
|
|
266
|
|
|||||
|
Income tax expense
|
6
|
|
78
|
|
100
|
|
|||||
|
Earnings (loss) from discontinued operations, net of tax
|
(30
|
)
|
1,996
|
|
166
|
|
|||||
During the year ended
December 31, 2015
, the Company recorded adjustments to the gain on the sale of the Enterprise business, including additional tax expense on the sale of the Enterprise business to reflect actual amounts filed in the income tax return. During the year ended
December 31, 2015
, the Company also settled the working capital true-up with Zebra for
$12 million
.
3. Other Financial Data
Statement of Operations Information
Other Charges (Income)
Other charges (income) included in Operating earnings (loss) consist of the following:
|
Years ended December 31
|
2015
|
|
2014
|
2013
|
|||||||
|
Other charges (income):
|
|||||||||||
|
Intangibles amortization
|
$
|
8
|
|
$
|
4
|
|
$
|
1
|
|
||
|
Reorganization of businesses
|
77
|
|
64
|
|
70
|
|
|||||
|
Legal settlement
|
—
|
|
8
|
|
—
|
|
|||||
|
Non-U.S. pension curtailment gain
|
(32
|
)
|
—
|
|
—
|
|
|||||
|
Settlement of pension plan
|
—
|
|
1,917
|
|
—
|
|
|||||
|
Impairment of corporate aircraft
|
31
|
|
—
|
|
—
|
|
|||||
|
Gain on sale of building and land
|
—
|
|
(21
|
)
|
—
|
|
|||||
|
|
$
|
84
|
|
$
|
1,972
|
|
$
|
71
|
|
||
57
Other Income (Expense)
Interest expense, net, and Other both included in Other income (expense) consist of the following:
|
Years ended December 31
|
2015
|
2014
|
2013
|
||||||||
|
Interest expense, net:
|
|||||||||||
|
Interest expense
|
$
|
(186
|
)
|
$
|
(147
|
)
|
$
|
(132
|
)
|
||
|
Interest income
|
13
|
|
21
|
|
19
|
|
|||||
|
$
|
(173
|
)
|
$
|
(126
|
)
|
$
|
(113
|
)
|
|||
|
Other:
|
|||||||||||
|
Loss from the extinguishment of long-term debt
|
$
|
—
|
|
$
|
(37
|
)
|
$
|
—
|
|
||
|
Investment impairments
|
(6
|
)
|
—
|
|
(3
|
)
|
|||||
|
Foreign currency loss
|
(23
|
)
|
(3
|
)
|
(17
|
)
|
|||||
|
Gain (loss) on derivative instruments
|
7
|
|
(4
|
)
|
8
|
|
|||||
|
Gains on equity method investments
|
6
|
|
16
|
|
10
|
|
|||||
|
Other
|
5
|
|
(6
|
)
|
11
|
|
|||||
|
|
$
|
(11
|
)
|
$
|
(34
|
)
|
$
|
9
|
|
||
Earnings Per Common Share
Basic and diluted earnings per common share from both continuing operations and net earnings attributable to Motorola Solutions, Inc. is computed as follows:
|
Amounts attributable to Motorola Solutions, Inc. common stockholders
|
|||||||||||||||||||||||
|
|
Earnings (loss) from Continuing Operations
|
Net Earnings
|
|||||||||||||||||||||
|
Years ended December 31
|
2015
|
2014
|
2013
|
2015
|
2014
|
2013
|
|||||||||||||||||
|
Basic earnings per common share:
|
|||||||||||||||||||||||
|
Earnings (loss)
|
$
|
640
|
|
$
|
(697
|
)
|
$
|
933
|
|
$
|
610
|
|
$
|
1,299
|
|
$
|
1,099
|
|
|||||
|
Weighted average common shares outstanding
|
199.6
|
|
245.6
|
|
266.0
|
|
199.6
|
|
245.6
|
|
266.0
|
|
|||||||||||
|
Per share amount
|
$
|
3.21
|
|
$
|
(2.84
|
)
|
$
|
3.51
|
|
$
|
3.06
|
|
$
|
5.29
|
|
$
|
4.13
|
|
|||||
|
Diluted earnings per common share:
|
|||||||||||||||||||||||
|
Earnings (loss)
|
$
|
640
|
|
$
|
(697
|
)
|
$
|
933
|
|
$
|
610
|
|
$
|
1,299
|
|
$
|
1,099
|
|
|||||
|
Weighted average common shares outstanding
|
199.6
|
|
245.6
|
|
266.0
|
|
199.6
|
|
245.6
|
|
266.0
|
|
|||||||||||
|
Add effect of dilutive securities:
|
|||||||||||||||||||||||
|
Share-based awards
|
2.1
|
|
—
|
|
4.5
|
|
2.1
|
|
—
|
|
4.5
|
|
|||||||||||
|
Senior Convertible Notes
|
0.1
|
|
—
|
|
—
|
|
0.1
|
|
—
|
|
—
|
|
|||||||||||
|
Diluted weighted average common shares outstanding
|
201.8
|
|
245.6
|
|
270.5
|
|
201.8
|
|
245.6
|
|
270.5
|
|
|||||||||||
|
Per share amount
|
$
|
3.17
|
|
$
|
(2.84
|
)
|
$
|
3.45
|
|
$
|
3.02
|
|
$
|
5.29
|
|
$
|
4.06
|
|
|||||
In the computation of diluted earnings per common share from continuing operations and on a net earnings basis for the year ended
December 31, 2015
, the assumed exercise of
2.7 million
options and the assumed vesting of
0.3 million
RSUs were excluded because their inclusion would have been antidilutive. For the year ended
December 31, 2014
, the Company recorded a net loss from continuing operations and, accordingly, the basic and diluted weighted average shares outstanding are equal because any increase to the basic shares would be antidilutive, including the assumed exercise of
6.3 million
stock options and the assumed vesting of
1.1 million
RSUs. In the computation of diluted earnings per common share from continuing operations and on a net earnings basis for the year ended
December 31, 2013
, the assumed exercise of
5.6 million
stock options and the assumed vesting of
0.2 million
RSUs were excluded because their inclusion would have been antidilutive.
On August 25, 2015, the Company issued
$1.0 billion
of
2%
Senior Convertible Notes (the "Senior Convertible Notes") which mature in September 2020. The notes are convertible based on a conversion rate of
14.5985
per $1,000 principal amount (which is equal to an initial conversion price of
$68.50
per share). See discussion in Note 4. In the event of conversion, the Company intends to settle the principal amount of the Senior Convertible Notes in cash.
58
Because of the Company’s intention to settle the par value of the Senior Convertible Notes in cash upon conversion, Motorola Solutions does not reflect any shares underlying the Senior Convertible Notes in its diluted weighted average shares outstanding until the average stock price per share for the period exceeds the conversion price. In this case, only the number of shares that would be issuable (under the treasury stock method of accounting for share dilution) will be included, which is based upon the amount by which the average stock price exceeds the conversion price of
$68.50
. For the year ended
December 31, 2015
, the dilutive impact of the Senior Convertible Notes was
67 thousand
shares.
Balance Sheet Information
Cash and Cash Equivalents
The Company’s cash and cash equivalents were
$2.0 billion
at
December 31, 2015
and
$4.0 billion
at
December 31, 2014
. Of these amounts,
$63 million
was restricted at both
December 31, 2015
and
December 31, 2014
.
Accounts Receivable, Net
Accounts receivable, net, consist of the following:
|
December 31
|
2015
|
2014
|
|||||
|
Accounts receivable
|
$
|
1,390
|
|
$
|
1,444
|
|
|
|
Less allowance for doubtful accounts
|
(28
|
)
|
(35
|
)
|
|||
|
|
$
|
1,362
|
|
$
|
1,409
|
|
|
Inventories, Net
Inventories, net, consist of the following:
|
December 31
|
2015
|
2014
|
|||||
|
Finished goods
|
$
|
151
|
|
$
|
163
|
|
|
|
Work-in-process and production materials
|
287
|
|
313
|
|
|||
|
438
|
|
476
|
|
||||
|
Less inventory reserves
|
(142
|
)
|
(131
|
)
|
|||
|
|
$
|
296
|
|
$
|
345
|
|
|
Other Current Assets
Other current assets consist of the following:
|
December 31
|
2015
|
2014
|
|||||
|
Available-for-sale securities
|
$
|
401
|
|
$
|
—
|
|
|
|
Costs and earnings in excess of billings
|
374
|
|
417
|
|
|||
|
Tax-related refunds receivable
|
44
|
|
103
|
|
|||
|
Zebra receivable for cash transferred
|
—
|
|
49
|
|
|||
|
Other
|
98
|
|
171
|
|
|||
|
|
$
|
917
|
|
$
|
740
|
|
|
In conjunction with the sale of the Enterprise business to Zebra, the Company transfered legal entities which maintained cash balances. During the year ended
December 31, 2015
, approximately
$49 million
of transferred cash balances were reimbursed by Zebra in accordance with the sales agreement.
Property, Plant and Equipment, Net
Property, plant and equipment, net, consist of the following:
|
December 31
|
2015
|
2014
|
|||||
|
Land
|
$
|
17
|
|
$
|
18
|
|
|
|
Building
|
523
|
|
559
|
|
|||
|
Machinery and equipment
|
1,585
|
|
1,672
|
|
|||
|
2,125
|
|
2,249
|
|
||||
|
Less accumulated depreciation
|
(1,638
|
)
|
(1,700
|
)
|
|||
|
|
$
|
487
|
|
$
|
549
|
|
|
59
Depreciation expense for the years ended
December 31, 2015
,
2014
, and
2013
was
$142 million
,
$169 million
and
$157 million
, respectively.
During the year ended
December 31, 2015
, the Company entered into an arrangement to sell its Penang, Malaysia manufacturing operations, including the land, building, equipment, inventory, and employees to a contract manufacturer. During the year ended
December 31, 2015
, the Company recognized an impairment loss of
$6 million
on the building within Other charges in its consolidated statements of operations, and presented the assets as held for sale in its consolidated balance sheets. The sale of the Penang, Malaysia facility and manufacturing operations was completed on February 1, 2016.
During the year ended
December 31, 2015
, the Company entered into an agreement to broker the sale of its corporate aircraft. During the year ended
December 31, 2015
, the Company recognized an impairment loss of
$31 million
within Other charges based on the indicated market value of the aircraft and presented the aircraft as held for sale in its consolidated balance sheets.
Investments
Investments consist of the following:
|
|
|||||||||||||||
|
December 31, 2015
|
Cost Basis
|
Unrealized
Gains |
Unrealized
Loss |
Investments
|
|||||||||||
|
Available-for-sale securities:
|
|
|
|
|
|||||||||||
|
Government, agency, and government-sponsored enterprise obligations
|
$
|
455
|
|
$
|
—
|
|
$
|
(11
|
)
|
$
|
444
|
|
|||
|
Corporate bonds
|
7
|
|
—
|
|
—
|
|
7
|
|
|||||||
|
Common stock and equivalents
|
—
|
|
6
|
|
—
|
|
6
|
|
|||||||
|
462
|
|
6
|
|
(11
|
)
|
457
|
|
||||||||
|
Other investments, at cost
|
203
|
|
—
|
|
—
|
|
203
|
|
|||||||
|
Equity method investments
|
9
|
|
—
|
|
—
|
|
9
|
|
|||||||
|
674
|
|
6
|
|
(11
|
)
|
669
|
|
||||||||
|
Less: current portion of available-for-sale securities
|
401
|
|
|||||||||||||
|
|
$
|
268
|
|
||||||||||||
In December
2015
, the Company invested
$401 million
in United Kingdom treasury securities in order to partially offset the risk associated with fluctuations in the British Pound Sterling in the period before the closing of the purchase of Airwave. The Company liquidated these investments in February 2016 to partially fund the acquisition of Airwave. The investments are recorded within Other current assets in the Company's consolidated balance sheets.
|
|
|||||||||||
|
December 31, 2014
|
Cost Basis
|
Unrealized
Gains |
Investments
|
||||||||
|
Available-for-sale securities:
|
|
|
|
||||||||
|
Government, agency, and government-sponsored enterprise obligations
|
$
|
14
|
|
$
|
—
|
|
14
|
|
|||
|
Corporate bonds
|
16
|
|
—
|
|
16
|
|
|||||
|
Mutual funds
|
2
|
|
—
|
|
2
|
|
|||||
|
Common stock and equivalents
|
1
|
|
70
|
|
71
|
|
|||||
|
33
|
|
70
|
|
103
|
|
||||||
|
Other investments, at cost
|
191
|
|
—
|
|
191
|
|
|||||
|
Equity method investments
|
22
|
|
—
|
|
22
|
|
|||||
|
|
$
|
246
|
|
$
|
70
|
|
$
|
316
|
|
||
Gains on sales of investments, net for the years ended
December 31, 2015
,
2014
, and
2013
were
$107 million
,
$5 million
, and
$37 million
, respectively. During the years ended
December 31, 2015
and
December 31, 2013
, the Company recorded investment impairment charges of
$6 million
and
$3 million
, respectively, representing other-than-temporary declines in the value of the Company’s equity investment portfolio. There were
no
investment impairments recorded during the year ended
December 31, 2014
. Investment impairment charges are included in Other within Other income (expense) in the Company’s consolidated statements of operations.
60
Other Assets
Other assets consist of the following:
|
December 31
|
2015
|
2014
|
|||||
|
Intangible assets
|
$
|
49
|
|
$
|
23
|
|
|
|
Long-term receivables
|
47
|
|
31
|
|
|||
|
Defined benefit plan assets
|
128
|
|
—
|
|
|||
|
Other
|
88
|
|
91
|
|
|||
|
|
$
|
312
|
|
$
|
145
|
|
|
Defined benefit plan assets at
December 31, 2015
included the overfunded status of the United Kingdom pension plan of
$105 million
, compared to a net liability position in previous periods.
Accrued Liabilities
Accrued liabilities consist of the following:
|
December 31
|
2015
|
2014
|
|||||
|
Deferred revenue
|
$
|
390
|
|
$
|
355
|
|
|
|
Compensation
|
241
|
|
190
|
|
|||
|
Billings in excess of costs and earnings
|
337
|
|
358
|
|
|||
|
Tax liabilities
|
48
|
|
91
|
|
|||
|
Dividend payable
|
71
|
|
75
|
|
|||
|
Trade liabilities
|
135
|
|
131
|
|
|||
|
Other
|
449
|
|
506
|
|
|||
|
|
$
|
1,671
|
|
$
|
1,706
|
|
|
Other Liabilities
Other liabilities consist of the following:
|
December 31
|
2015
|
2014
|
|||||
|
Defined benefit plans
|
$
|
1,512
|
|
$
|
1,611
|
|
|
|
Postretirement health care benefit plan
|
49
|
|
49
|
|
|||
|
Deferred revenue
|
113
|
|
139
|
|
|||
|
Unrecognized tax benefits
|
50
|
|
54
|
|
|||
|
Other
|
180
|
|
158
|
|
|||
|
|
$
|
1,904
|
|
$
|
2,011
|
|
|
Stockholders’ Equity Information
Share Repurchase Program:
Through actions taken on July 28, 2011, January 30, 2012, July 25, 2012, July 22, 2013, and November 3, 2014, the Board of Directors has authorized the Company to repurchase in the aggregate up to
$12.0 billion
of its outstanding shares of common stock (the “share repurchase program”). The share repurchase program does not have an expiration date.
On August 4, 2015, the Board of Directors authorized the Company to commence a modified "Dutch auction" tender offer to repurchase up to
$2.0 billion
of its outstanding shares of common stock. The repurchase of these shares was authorized under the existing share repurchase authority, as outlined above. The tender offer commenced on August 7, 2015 and expired on September 3, 2015. The Company paid
$2.0 billion
, including transaction costs, to repurchase approximately
30.1 million
shares at a tender price of
$66.50
per share.
During
2015
, the Company paid an aggregate of
$3.2 billion
(including the Dutch auction tender offer), including transaction costs, to repurchase
48.0 million
shares at an average price of
$66.22
per share. During
2014
, the Company paid an aggregate of
$2.5 billion
, including transaction costs, to repurchase
39.4 million
shares at an average price of
$64.63
. During
2013
, the Company paid an aggregate of
$1.7 billion
, including transaction costs, to repurchase
28.6 million
shares at an average price of
$59.30
. As of
December 31, 2015
, the Company had used approximately
$11.0 billion
of the share repurchase authority, including transaction costs, to repurchase shares, leaving
$1.0 billion
of authority available for future repurchases.
Payment of Dividends:
On November 17, 2015, the Company announced that its Board of Directors approved an increase in the quarterly cash dividend from
$0.34
per share to
$0.41
per share of common stock.
During the
years ended
December 31,
61
2015
,
2014
, and
2013
the Company paid
$277 million
,
$318 million
, and
$292 million
, respectively, in cash dividends to holders of its common stock.
62
Accumulated Other Comprehensive Loss
The following table displays the changes in Accumulated other comprehensive loss, including amounts reclassified into income, and the affected line items in the consolidated statements of operations during the
years ended
December 31, 2015
,
2014
, and
2013
:
|
Years ended December 31
|
|||||||||||
|
2015
|
2014
|
2013
|
|||||||||
|
Foreign Currency Translation Adjustments:
|
|||||||||||
|
Balance at beginning of period
|
$
|
(204
|
)
|
$
|
(96
|
)
|
$
|
(92
|
)
|
||
|
Other comprehensive loss before reclassification adjustment
|
(82
|
)
|
(58
|
)
|
(11
|
)
|
|||||
|
Tax benefit
|
20
|
|
9
|
|
7
|
|
|||||
|
Other comprehensive income before reclassification adjustment, net of tax
|
(62
|
)
|
(49
|
)
|
(4
|
)
|
|||||
|
Reclassification adjustment into Earnings from discontinued operations
|
—
|
|
(75
|
)
|
—
|
|
|||||
|
Tax expense
|
—
|
|
16
|
|
—
|
|
|||||
|
Reclassification adjustment into Earnings from discontinued operations, net of tax
|
—
|
|
(59
|
)
|
—
|
|
|||||
|
Other comprehensive loss, net of tax
|
(62
|
)
|
(108
|
)
|
(4
|
)
|
|||||
|
Balance at end of period
|
$
|
(266
|
)
|
$
|
(204
|
)
|
$
|
(96
|
)
|
||
|
Derivative instruments:
|
|||||||||||
|
Balance at beginning of period
|
$
|
—
|
|
$
|
(1
|
)
|
$
|
1
|
|
||
|
Other comprehensive income before reclassification adjustment
|
—
|
|
—
|
|
—
|
|
|||||
|
Tax expense
|
—
|
|
—
|
|
(1
|
)
|
|||||
|
Other comprehensive income before reclassification adjustment, net of tax
|
—
|
|
—
|
|
(1
|
)
|
|||||
|
Reclassification adjustment into Cost of sales
|
—
|
|
1
|
|
(1
|
)
|
|||||
|
Tax expense
|
—
|
|
—
|
|
—
|
|
|||||
|
Reclassification adjustment into Cost of sales, net of tax
|
—
|
|
1
|
|
(1
|
)
|
|||||
|
Other comprehensive income, net of tax
|
—
|
|
1
|
|
(2
|
)
|
|||||
|
Balance at end of period
|
$
|
—
|
|
$
|
—
|
|
$
|
(1
|
)
|
||
|
Available-for-Sale Securities:
|
|||||||||||
|
Balance at beginning of period
|
$
|
44
|
|
$
|
(2
|
)
|
$
|
2
|
|
||
|
Other comprehensive income before reclassification adjustment
|
(15
|
)
|
72
|
|
1
|
|
|||||
|
Tax benefit (expense)
|
5
|
|
(26
|
)
|
(2
|
)
|
|||||
|
Other comprehensive income (loss) before reclassification adjustment, net of tax
|
(10
|
)
|
46
|
|
(1
|
)
|
|||||
|
Reclassification adjustment into Gains on sales of investments and businesses, net
|
(61
|
)
|
—
|
|
(4
|
)
|
|||||
|
Tax expense
|
24
|
|
—
|
|
1
|
|
|||||
|
Reclassification adjustment into Gains on sales of investments and businesses, net of tax
|
(37
|
)
|
—
|
|
(3
|
)
|
|||||
|
Other comprehensive income, net of tax
|
(47
|
)
|
46
|
|
(4
|
)
|
|||||
|
Balance at end of period
|
$
|
(3
|
)
|
$
|
44
|
|
$
|
(2
|
)
|
||
|
Defined Benefit Plans:
|
|||||||||||
|
Balance at beginning of period
|
(1,695
|
)
|
(2,188
|
)
|
(3,211
|
)
|
|||||
|
Other comprehensive income (loss) before reclassification adjustment
|
108
|
|
(1,165
|
)
|
1,524
|
|
|||||
|
Tax benefit (expense)
|
12
|
|
447
|
|
(571
|
)
|
|||||
|
Other comprehensive income (loss) before reclassification adjustment, net of tax
|
120
|
|
(718
|
)
|
953
|
|
|||||
|
Reclassification adjustment - Actuarial net losses into Selling, general, and administrative expenses
|
71
|
|
118
|
|
159
|
|
|||||
|
Reclassification adjustment - Prior service benefits into Selling, general, and administrative expenses
|
(62
|
)
|
(57
|
)
|
(49
|
)
|
|||||
|
Reclassification adjustment - Other charges
|
—
|
|
1,883
|
|
—
|
|
|||||
|
Reclassification adjustment - Non-U.S. pension curtailment gain into Selling, general, and administrative expenses
|
(32
|
)
|
—
|
|
—
|
|
|||||
|
Disposition of the Enterprise business retirement benefits
|
—
|
|
(1
|
)
|
—
|
|
|||||
|
Tax expense (benefit)
|
1
|
|
(732
|
)
|
(40
|
)
|
|||||
|
Reclassification adjustment into Selling, general, and administrative expenses, net of tax
|
(22
|
)
|
1,211
|
|
70
|
|
|||||
|
Other comprehensive income, net of tax
|
98
|
|
493
|
|
1,023
|
|
|||||
|
Balance at end of period
|
$
|
(1,597
|
)
|
$
|
(1,695
|
)
|
$
|
(2,188
|
)
|
||
|
Total Accumulated other comprehensive loss
|
$
|
(1,866
|
)
|
$
|
(1,855
|
)
|
$
|
(2,287
|
)
|
||
63
4. Debt and Credit Facilities
Long-Term Debt
|
December 31
|
2015
|
2014
|
|||||
|
2% Senior Convertible Notes due 2020
|
993
|
|
—
|
|
|||
|
3.5% senior notes due 2021
|
396
|
|
395
|
|
|||
|
3.75% senior notes due 2022
|
748
|
|
748
|
|
|||
|
3.5% senior notes due 2023
|
595
|
|
594
|
|
|||
|
4.0% senior notes due 2024
|
590
|
|
589
|
|
|||
|
6.5% debentures due 2025
|
118
|
|
118
|
|
|||
|
7.5% debentures due 2025
|
346
|
|
346
|
|
|||
|
6.5% debentures due 2028
|
36
|
|
36
|
|
|||
|
6.625% senior notes due 2037
|
54
|
|
54
|
|
|||
|
5.5% senior notes due 2044
|
400
|
|
400
|
|
|||
|
5.22% debentures due 2097
|
91
|
|
91
|
|
|||
|
Other long-term debt
|
29
|
|
36
|
|
|||
|
4,396
|
|
3,407
|
|
||||
|
Adjustments for unamortized gains on interest rate swap terminations
|
(6
|
)
|
(7
|
)
|
|||
|
Less: current portion
|
(4
|
)
|
(4
|
)
|
|||
|
Long-term debt
|
$
|
4,386
|
|
$
|
3,396
|
|
|
On August 25, 2015, the Company entered into an agreement with Silver Lake Partners to issue
$1.0 billion
of
2%
Senior Convertible Notes which mature in September 2020. Interest on these notes is payable semiannually. The notes are convertible anytime on or after
two years
from their issuance date, except in certain limited circumstances. The notes are convertible based on a conversion rate of 14.5985 per $1,000 principal amount (which is equal to an initial conversion price of
$68.50
per share). The value by which the Senior Convertible Notes exceeded their principal amount if converted as of
December 31, 2015
was
$21 million
. In the event of conversion, the Company intends to settle the principal amount of the Senior Convertible Notes in cash.
The Company has recorded a debt liability associated with the Senior Convertible Notes by determining the fair value of an equivalent debt instrument without a conversion option. Using a discount rate of
2.4%
, which was determined based on a review of relevant market data, the Company has calculated the debt liability to be
$992 million
, indicating an
$8 million
discount to be amortized over the expected life of the debt instrument. As of December 31, 2015, the remaining unamortized debt discount was
$7 million
, which will be amortized over
two
years as a component of interest expense. For the year ended
December 31, 2015
, total interest expense relating to both the contractual interest coupon and amortization of debt discount was
$8 million
. The total of proceeds received in excess of the fair value of the debt liability of
$8 million
has been recorded within Additional paid-in capital.
During the year ended December 31, 2014, the Company redeemed
$400 million
aggregate principal amount outstanding of its
6.000%
Senior Notes due November
2017
for an aggregate purchase price of approximately
$456 million
. After accelerating the amortization of debt issuance costs, debt discounts, and hedge adjustments, the Company recognized a loss of
$37 million
related to the redemption within Other income (expense) in the consolidated statement of operations. During the year ended December 31, 2014, the Company issued an aggregate principal amount of
$1.4 billion
consisting of: (i)
$600 million
of
4.000%
Senior Notes due
2024
, of which, after debt issuance costs and debt discounts, the Company recognized net proceeds of
$583 million
, (ii)
$400 million
of
3.500%
Senior Notes due
2021
, of which, after debt issuance costs and debt discounts, the Company recognized net proceeds of
$393 million
, and (iii)
$400 million
of
5.500%
Senior Notes due
2044
, of which, after debt issuance costs and debt discounts, the Company recognized net proceeds of
$394 million
.
Aggregate requirements for long-term debt maturities during the next five years are as follows:
2016
—
$4 million
;
2017
—
$5 million
;
2018
—
$5 million
;
2019
—
$5 million
; and
2020
—
$1 billion
.
In connection with the completion of the acquisition of Airwave, the Company entered into a new term loan credit agreement (the “Term Loan Agreement”), under which the Company borrowed a term loan (the “Term Loan”) with an initial principal amount of
$675 million
. Interest on the Term Loan is variable and indexed to LIBOR. No additional borrowings are permitted under the Term Loan Agreement and amounts borrowed and repaid or prepaid may not be re-borrowed. The Company's borrowing capacity under the 2014 Motorola Solutions Credit Agreement may be partially limited at the end of the first quarter of 2016 due to the additional indebtedness incurred in connection with the Term Loan.
Credit Facilities
As of
December 31, 2015
, the Company had a
$2.1 billion
unsecured syndicated revolving credit facility, which includes a
$450 million
letter of credit sub-limit, (the “2014 Motorola Solutions Credit Agreement”) scheduled to mature on May 29, 2019. The Company must comply with certain customary covenants, including a maximum leverage ratio as defined in the 2014
64
Motorola Solutions Credit Agreement. The Company was in compliance with its financial covenants as of
December 31, 2015
. The Company did not borrow under the 2014 Motorola Solutions Credit Agreement during the
twelve
months ended
December 31, 2015
.
As of
December 31, 2015
, the Company had a letter of credit sub-limit of
$450 million
under the 2014 Motorola Solutions Credit Agreement. No letters of credit were issued under the revolving credit facility as of
December 31, 2015
.
5. Risk Management
Foreign Currency Risk
The Company uses financial instruments to reduce its overall exposure to the effects of currency fluctuations on cash flows. The Company’s policy prohibits speculation in financial instruments for profit on exchange rate fluctuations, trading in currencies for which there are no underlying exposures, or entering into transactions for any currency to intentionally increase the underlying exposure. Instruments that are designated as part of a hedging relationship must be effective at reducing the risk associated with the exposure being hedged and are designated as part of a hedging relationship at the inception of the contract. Accordingly, changes in the market values of hedge instruments must be highly correlated with changes in market values of the underlying hedged items both at the inception of the hedge and over the life of the hedge contract.
The Company’s strategy related to foreign exchange exposure management is to offset the gains or losses on the financial instruments against gains or losses on the underlying operational cash flows or investments based on the Company's assessment of risk. The Company enters into derivative contracts for some of its non-functional currency cash, receivables, and payables, which are primarily denominated in major currencies that can be traded on open markets. The Company typically uses forward contracts and options to hedge these currency exposures. In addition, the Company has entered into derivative contracts for some forecasted transactions, which are designated as part of a hedging relationship if it is determined that the transaction qualifies for hedge accounting under the provisions of the authoritative accounting guidance for derivative instruments and hedging activities. A portion of the Company’s exposure is from currencies that are not traded in liquid markets and these are addressed, to the extent reasonably possible, by managing net asset positions, product pricing and component sourcing.
At
December 31, 2015
, the Company had outstanding foreign exchange contracts totaling
$494 million
, compared to
$628 million
outstanding at
December 31, 2014
. The Company does not believe these financial instruments should subject it to undue risk due to foreign exchange movements because gains and losses on these contracts should generally offset gains and losses on the underlying assets, liabilities and transactions.
The following table shows the Company's five largest net notional amounts of the positions to buy or sell foreign currency as of
December 31, 2015
and the corresponding positions as of
December 31, 2014
:
|
|
Notional Amount
|
||||||
|
Net Buy (Sell) by Currency
|
2015
|
2014
|
|||||
|
Chinese Renminbi
|
$
|
(114
|
)
|
$
|
(161
|
)
|
|
|
Euro
|
99
|
|
214
|
|
|||
|
British Pound
|
62
|
|
34
|
|
|||
|
Australian Dollar
|
(60
|
)
|
(42
|
)
|
|||
|
Brazilian Real
|
(44
|
)
|
(28
|
)
|
|||
Interest Rate Risk
One of the Company’s European subsidiaries has Euro-denominated loans. The interest on the Euro-denominated loans is variable. The Company has interest rate swap agreements in place which change the characteristics of interest rate payments from variable to maximum fixed-rate payments. The interest rate swaps are not designated as a hedge. As such, the changes in the fair value of the interest rate swaps are included in Other income (expense) in the Company’s consolidated statements of operations. The fair value of the interest rate swaps was a liability position of
$1 million
at
December 31, 2015
and a liability position of
$2 million
at
December 31, 2014
.
Counterparty Risk
The use of derivative financial instruments exposes the Company to counterparty credit risk in the event of nonperformance by counterparties. However, the Company’s risk is limited to the fair value of the instruments when the derivative is in an asset position. The Company actively monitors its exposure to credit risk. As of
December 31, 2015
, all of the counterparties have investment grade credit ratings. As of
December 31, 2015
, the Company was exposed to an aggregate credit risk of approximately
$6 million
with all counterparties.
65
Derivative Financial Instruments
The following tables summarize the fair values and location in the consolidated balance sheets of all derivative financial instruments held by the Company at
December 31, 2015
and
2014
:
|
|
Fair Values of Derivative Instruments
|
||||||||||
|
|
Assets
|
Liabilities
|
|||||||||
|
December 31, 2015
|
Fair
Value |
Balance
Sheet Location |
Fair
Value |
Balance
Sheet Location |
|||||||
|
Derivatives not designated as hedging instruments:
|
|||||||||||
|
Foreign exchange contracts
|
6
|
|
Other assets
|
2
|
|
Accrued liabilities
|
|||||
|
Interest agreements
|
—
|
|
Other assets
|
1
|
|
Accrued liabilities
|
|||||
|
Total derivatives
|
$
|
6
|
|
|
$
|
3
|
|
|
|||
|
|
Fair Values of Derivative Instruments
|
||||||||
|
|
Assets
|
Liabilities
|
|||||||
|
December 31, 2014
|
Fair
Value |
Balance
Sheet Location |
Fair
Value |
Balance
Sheet Location |
|||||
|
Derivatives not designated as hedging instruments:
|
|||||||||
|
Foreign exchange contracts
|
1
|
|
Other assets
|
5
|
|
Accrued liabilities
|
|||
|
Interest agreements
|
—
|
|
Other assets
|
2
|
|
Accrued liabilities
|
|||
|
Total derivatives not designated as hedging instruments
|
1
|
|
7
|
|
|||||
The following table summarizes the effect of derivative instruments in the Company's consolidated statements of operations, including immaterial amounts related to discontinued operations, for the years ended
December 31, 2015
,
2014
and
2013
:
|
|
December 31
|
Statement of
Operations Location |
||||||||||
|
Gain (Loss) on Derivative Instruments
|
2015
|
2014
|
2013
|
|||||||||
|
Derivatives not designated as hedging instruments:
|
||||||||||||
|
Interest rate contracts
|
$
|
1
|
|
$
|
1
|
|
$
|
2
|
|
Other income (expense)
|
||
|
Foreign exchange contracts
|
6
|
|
(5
|
)
|
6
|
|
Other income (expense)
|
|||||
|
Total derivatives not designated as hedging instruments
|
$
|
7
|
|
$
|
(4
|
)
|
$
|
8
|
|
|
||
The Company had
no
instruments designated as hedging instruments for the year ended
December 31, 2015
.
6. Income Taxes
Components of earnings (loss) from continuing operations before income taxes are as follows:
|
Years ended December 31
|
2015
|
2014
|
2013
|
||||||||
|
United States
|
$
|
725
|
|
$
|
(1,355
|
)
|
$
|
585
|
|
||
|
Other nations
|
192
|
|
194
|
|
295
|
|
|||||
|
|
$
|
917
|
|
$
|
(1,161
|
)
|
$
|
880
|
|
||
66
Components of income tax expense (benefit) are as follows:
|
Years ended December 31
|
2015
|
2014
|
2013
|
||||||||
|
United States
|
$
|
71
|
|
$
|
14
|
|
$
|
29
|
|
||
|
Other nations
|
30
|
|
67
|
|
234
|
|
|||||
|
States (U.S.)
|
13
|
|
11
|
|
12
|
|
|||||
|
Current income tax expense
|
114
|
|
92
|
|
275
|
|
|||||
|
United States
|
154
|
|
(503
|
)
|
(368
|
)
|
|||||
|
Other nations
|
(13
|
)
|
(11
|
)
|
35
|
|
|||||
|
States (U.S.)
|
19
|
|
(43
|
)
|
(1
|
)
|
|||||
|
Deferred income tax expense (benefit)
|
160
|
|
(557
|
)
|
(334
|
)
|
|||||
|
Total income tax expense (benefit)
|
$
|
274
|
|
$
|
(465
|
)
|
$
|
(59
|
)
|
||
Deferred tax balances that were recorded within Accumulated other comprehensive loss in the Company’s consolidated balance sheets resulted from retirement benefit adjustments, currency translation adjustments, net gains (losses) on derivative instruments and fair value adjustments to available-for-sale securities. The adjustments were
$(62) million
,
$286 million
, and
$606 million
for the years ended
December 31, 2015
,
2014
, and
2013
, respectively.
The Company evaluates its permanent reinvestment assertions with respect to foreign earnings at each reporting period and, except for certain earnings that the Company intends to reinvest indefinitely due to the capital requirements of the foreign subsidiaries or due to local country restrictions, accrues for the U.S. federal and foreign income tax applicable to the earnings. During the fourth quarter of
2015
, the Company reassessed its unremitted earnings position and concluded that certain of its non-U.S. subsidiaries’ earnings were permanently reinvested overseas. The Company intends to utilize these offshore earnings for working capital needs in its international operations. During
2015
, the Company recorded a net tax benefit of
$8 million
related to the reversal of related deferred tax liabilities. During
2014
, the Company recorded a net tax benefit of
$19 million
related to the reversal of deferred tax liabilities related to undistributed foreign earnings due to the change in permanent reinvestment assertion. During
2013
, the Company reassessed its unremitted earnings position concluding that certain of its non-U.S. subsidiaries' earnings were permanently reinvested overseas. As a result, the Company recognized a tax benefit of
$25 million
during 2013 for the reversal of related deferred tax liabilities.
Undistributed earnings that the Company intends to reinvest indefinitely, and for which no U.S. income taxes have been provided, aggregate to
$1.4 billion
at
December 31, 2015
. The Company currently has no plans to repatriate the foreign earnings permanently reinvested and therefore, the time and manner of repatriation is uncertain. If circumstances change and it becomes apparent that some or all of the permanently reinvested earnings will be remitted to the U.S. in the foreseeable future, an additional income tax charge may be necessary. However, given the uncertain repatriation time and manner at
December 31, 2015
, it is not practicable to estimate the amount of any additional income tax charge on the hypothetical distribution of permanently reinvested earnings. On a cash basis, these repatriations from the Company's non-U.S. subsidiaries could require the payment of additional taxes. The portion of earnings not reinvested indefinitely may be distributed without an additional charge given the U.S. federal and foreign income tax accrued on undistributed earnings and the utilization of available foreign tax credits.
In 2013, the Company reorganized certain of its non-U.S. subsidiaries under a holding company structure in order to facilitate the efficient movement of non-U.S. cash and provide a platform to fund foreign investments, such as potential acquisitions and capital expenditures. During 2013, the Company recognized a
$337 million
tax benefit associated with the excess tax credits relating to the earnings of certain non-U.S. subsidiaries reorganized under the holding company structure.
67
Differences between income tax expense (benefit) computed at the U.S. federal statutory tax rate of
35%
and income tax expense (benefit) as reflected in the consolidated statements of operations are as follows:
|
Years ended December 31
|
2015
|
2014
|
2013
|
||||||||||||||
|
Income tax expense (benefit) at statutory rate
|
$
|
321
|
|
35.0
|
%
|
$
|
(406
|
)
|
35.0
|
%
|
$
|
308
|
|
35.0
|
%
|
||
|
Tax on non-U.S. earnings
|
(46
|
)
|
(5.0
|
)%
|
(27
|
)
|
2.3
|
%
|
17
|
|
1.9
|
%
|
|||||
|
State income taxes, net of federal benefit
|
24
|
|
2.6
|
%
|
(30
|
)
|
2.6
|
%
|
8
|
|
0.9
|
%
|
|||||
|
Recognition of previously unrecognized income tax benefits
|
1
|
|
0.1
|
%
|
(29
|
)
|
2.5
|
%
|
6
|
|
0.7
|
%
|
|||||
|
Other provisions
|
14
|
|
1.6
|
%
|
9
|
|
(0.7
|
)%
|
(4
|
)
|
(0.5
|
)%
|
|||||
|
Valuation allowances
|
(9
|
)
|
(1.0
|
)%
|
55
|
|
(4.7
|
)%
|
(3
|
)
|
(0.3
|
)%
|
|||||
|
Section 199 deduction
|
(19
|
)
|
(2.1
|
)%
|
(12
|
)
|
1.0
|
%
|
(14
|
)
|
(1.6
|
)%
|
|||||
|
Tax on undistributed non-U.S. earnings
|
(7
|
)
|
(0.8
|
)%
|
(19
|
)
|
1.6
|
%
|
(22
|
)
|
(2.5
|
)%
|
|||||
|
Research credits
|
(5
|
)
|
(0.5
|
)%
|
(6
|
)
|
0.5
|
%
|
(18
|
)
|
(2.0
|
)%
|
|||||
|
Tax benefit of repatriated non-U.S. earnings
|
—
|
|
—
|
%
|
—
|
|
—
|
%
|
(337
|
)
|
(38.3
|
)%
|
|||||
|
|
$
|
274
|
|
29.9
|
%
|
$
|
(465
|
)
|
40.1
|
%
|
$
|
(59
|
)
|
(6.7
|
)%
|
||
Gross deferred tax assets were
$3.5 billion
and
$3.6 billion
at
December 31, 2015
and
2014
, respectively. Deferred tax assets, net of valuation allowances, were
$3.4 billion
at both
December 31, 2015
and
2014
, respectively. Gross deferred tax liabilities were
$1.2 billion
and
$774 million
at
December 31, 2015
and
2014
, respectively.
Significant components of deferred tax assets (liabilities) are as follows:
|
December 31
|
2015
|
2014
|
|||||
|
Inventory
|
$
|
30
|
|
$
|
34
|
|
|
|
Accrued liabilities and allowances
|
136
|
|
148
|
|
|||
|
Employee benefits
|
612
|
|
799
|
|
|||
|
Capitalized items
|
357
|
|
379
|
|
|||
|
Tax basis differences on investments
|
14
|
|
(10
|
)
|
|||
|
Depreciation tax basis differences on fixed assets
|
19
|
|
52
|
|
|||
|
Undistributed non-U.S. earnings
|
(19
|
)
|
(18
|
)
|
|||
|
Tax carryforwards
|
1,028
|
|
1,246
|
|
|||
|
Business reorganization
|
20
|
|
22
|
|
|||
|
Warranty and customer liabilities
|
20
|
|
19
|
|
|||
|
Deferred revenue and costs
|
146
|
|
136
|
|
|||
|
Valuation allowances
|
(129
|
)
|
(226
|
)
|
|||
|
Deferred charges
|
41
|
|
39
|
|
|||
|
Other
|
3
|
|
(38
|
)
|
|||
|
|
$
|
2,278
|
|
$
|
2,582
|
|
|
At
December 31, 2015
and
2014
, the Company had valuation allowances of
$129 million
and
$226 million
, respectively, against its deferred tax assets, including
$98 million
and
$195 million
, respectively, relating to deferred tax assets for non-U.S. subsidiaries. The Company’s valuation allowances for its non-U.S. subsidiaries had a net decrease of
$97 million
during
2015
and a net increase of
$17 million
during
2014
. The decrease in the valuation allowance relating to deferred tax assets of non-U.S. subsidiaries during
2015
relates to the expiration of net operating losses, the release of a Singapore valuation allowance, and the change in the value of net deferreds related to pension in the United Kingdom. The increase in the valuation allowance relating to deferred tax assets of non-U.S. subsidiaries during
2014
related to deferred tax assets considered to be not more-likely-than-not to be realizable based on estimates of future taxable income.
The Company’s U.S. valuation allowance did not change during
2015
compared to a net increase of
$9 million
during
2014
. The U.S. valuation allowance of
$31 million
as of
December 31, 2015
primarily relates to state tax carryforwards. The Company believes that the remaining deferred tax assets are more-likely-than-not to be realizable based on estimates of future taxable income and the implementation of tax planning strategies.
68
Tax carryforwards are as follows:
|
December 31, 2015
|
Gross
Tax Loss |
Tax
Effected |
Expiration
Period |
|||||
|
United States:
|
||||||||
|
U.S. tax losses
|
66
|
|
$
|
23
|
|
2022-2033
|
||
|
Foreign tax credits
|
—
|
|
584
|
|
2018-2025
|
|||
|
General business credits
|
—
|
|
133
|
|
2026-2035
|
|||
|
Minimum tax credits
|
—
|
|
100
|
|
Unlimited
|
|||
|
State tax losses
|
1,221
|
|
33
|
|
2016-2031
|
|||
|
State tax credits
|
—
|
|
28
|
|
2018-2029
|
|||
|
Non-U.S. Subsidiaries:
|
||||||||
|
Japan tax losses
|
91
|
|
30
|
|
2017-2021
|
|||
|
Germany tax losses
|
86
|
|
25
|
|
Unlimited
|
|||
|
United Kingdom tax losses
|
95
|
|
17
|
|
Unlimited
|
|||
|
Singapore tax losses
|
40
|
|
7
|
|
Unlimited
|
|||
|
Other subsidiaries tax losses
|
47
|
|
12
|
|
Various
|
|||
|
Spain tax credits
|
—
|
|
24
|
|
Various
|
|||
|
Other subsidiaries tax credits
|
—
|
|
12
|
|
Various
|
|||
|
|
|
$
|
1,028
|
|
|
|||
The Company had unrecognized tax benefits of
$88 million
and
$96 million
at
December 31, 2015
and
December 31, 2014
, respectively, of which approximately
$50 million
and
$76 million
, respectively, if recognized, would affect the effective tax rate, net of resulting changes to valuation allowances.
A roll-forward of unrecognized tax benefits is as follows:
|
2015
|
2014
|
||||||
|
Balance at January 1
|
$
|
96
|
|
$
|
147
|
|
|
|
Additions based on tax positions related to current year
|
2
|
|
4
|
|
|||
|
Additions for tax positions of prior years
|
4
|
|
21
|
|
|||
|
Reductions for tax positions of prior years
|
(9
|
)
|
(55
|
)
|
|||
|
Settlements and agreements
|
(3
|
)
|
(19
|
)
|
|||
|
Lapse of statute of limitations
|
(2
|
)
|
(2
|
)
|
|||
|
Balance at December 31
|
$
|
88
|
|
$
|
96
|
|
|
The IRS is currently examining the Company's 2012 and 2013 tax years. The Company also has several state and non-U.S. audits pending. A summary of open tax years by major jurisdiction is presented below:
|
Jurisdiction
|
Tax Years
|
|
United States
|
2008-2015
|
|
China
|
2002-2015
|
|
France
|
2010-2015
|
|
Germany
|
2008-2015
|
|
India
|
1997-2015
|
|
Israel
|
2012-2015
|
|
Japan
|
2011-2015
|
|
Malaysia
|
2010-2015
|
|
Singapore
|
2013-2015
|
|
United Kingdom
|
2008-2015
|
Although the final resolution of the Company’s global tax disputes is uncertain, based on current information, in the opinion of the Company’s management, the ultimate disposition of these matters will not have a material adverse effect on the Company’s consolidated financial position, liquidity or results of operations. However, an unfavorable resolution of the
69
Company’s global tax disputes could have a material adverse effect on the Company’s consolidated financial position, liquidity, or results of operations in the periods, and as of the dates, on which the matters are ultimately resolved.
Based on the potential outcome of the Company’s global tax examinations, the expiration of the statute of limitations for specific jurisdictions, or the continued ability to satisfy tax incentive obligations, it is reasonably possible that the unrecognized tax benefits will change within the next twelve months. The associated net tax impact on the effective tax rate, exclusive of valuation allowance changes, is estimated to be in the range of a
$50 million
tax charge to a
$50 million
tax benefit, with cash payments not to exceed
$30 million
.
At
December 31, 2015
, the Company had
$29 million
accrued for interest and
$24 million
accrued for penalties on unrecognized tax benefits. At
December 31, 2014
, the Company had
$26 million
and
$26 million
accrued for interest and penalties, respectively, on unrecognized tax benefits.
7. Retirement Benefits
Pension and Postretirement Health Care Benefits Plans
U.S. Pension Benefit Plans
The Company’s noncontributory U.S. pension plan (the “Regular Pension Plan”) provides benefits to U.S. employees hired prior to January 1, 2005, who became eligible after
one
year of service. In December 2008, the Company amended the Regular Pension Plan such that, effective March 1, 2009: (i) no participant shall accrue any benefit or additional benefit on or after March 1, 2009, and (ii) no compensation increases earned by a participant on or after March 1, 2009 shall be used to compute any accrued benefit.
In September 2014, the Company entered into a Definitive Purchase Agreement (the “Agreement”) by and among the Company, The Prudential Insurance Company of America (“PICA”), Prudential Financial, Inc. and State Street Bank and Trust Company, as Independent Fiduciary of the Company’s Regular Pension Plan. Under the Agreement, the Regular Pension Plan purchased from PICA a group annuity contract that requires PICA to pay and administer certain future annuity payments to approximately
30,000
of the Company’s retirees. On December 3, 2014, the Company transfered
$3.2 billion
of plan assets to PICA upon the close of the Agreement and then subsequently terminated the plan. During 2014, the Company established a new pension plan with substantially the same terms as the Regular Pension Plan (the “New Plan”) to accommodate the Company's remaining active employees and non-retirees. Upon the establishment of the New Plan, the Company offered and paid out from plan assets the maximum of
$1.0 billion
of a lump-sum distribution to certain participants who had accrued a pension benefit, had left the Company prior to June 30, 2014, and had not yet started receiving pension benefit payments. As a result of the actions taken to the Plan, the Company recorded a settlement loss of
$1.9 billion
in 2014 which is recorded in "Other charges" within the statement of operations.
The Company has an additional noncontributory supplemental retirement benefit plan, the Motorola Supplemental Pension Plan (“MSPP”), which provides supplemental benefits to individuals by replacing the Regular Pension Plan benefits that are lost by such individuals under the retirement formula due to application of the limitations imposed by the Internal Revenue Code. Effective January 1, 2007, eligible compensation was capped at the IRS limit plus
$175,000
(the “Cap”) or, for those already in excess of the Cap as of January 1, 2007, the eligible compensation used to compute such employee’s MSPP benefit for all future years is the greater of: (i) such employee’s eligible compensation as of January 1, 2007 (frozen at that amount) or (ii) the relevant Cap for the given year. Similar to the Regular Pension Plan, the Company amended the MSPP (collectively, the “U.S. Pension Benefit Plans”) in December 2008 such that effective March 1, 2009: (i) no participant shall accrue any benefit or additional benefit on or after March 1, 2009, and (ii) no compensation increases earned by a participant on or after March 1, 2009 shall be used to compute any accrued benefit. Effective January 1, 2009, the MSPP was closed to new participants unless such participation was required under a prior contractual entitlement.
Postretirement Health Care Benefits Plan
Certain health care benefits are available to eligible domestic employees hired prior to January 1, 2002 and meeting certain age and service requirements upon termination of employment (the “Postretirement Health Care Benefits Plan”). As of January 1, 2005, the Postretirement Health Care Benefits Plan was closed to new participants.
During 2012, the Postretirement Health Care Benefits Plan was amended ("the Original Amendment") such that, as of January 1, 2013, retirees over the age of
65
are provided an annual subsidy to use toward the purchase of their own health care coverage from private insurance companies or for reimbursement of eligible health care expenses. The Original Amendment resulted in a remeasurement of the plan generating an
$87 million
decrease in accumulated other comprehensive loss, net of taxes. The majority of that
$87 million
decrease was recognized by the end of 2015.
In September 2014, the Postretirement Health Care Benefits Plan was then further amended (“the New Amendment”) to provide the annual subsidy discussed as part of the Original Amendment to all participants under the plan effective March 1, 2015. Additionally, the New Amendment eliminated dental benefits that were previously provided under the plan. The New Amendment required a remeasurement, resulting in a
$45 million
decrease in accumulated other comprehensive loss, net of taxes. A substantial portion of the decrease is related to a prior service credit and will be recognized as a credit to the consolidated statements of operations over almost
three
years, or the period in which the remaining employees eligible for the plan will qualify for benefits under the plan.
70
During the years ended
December 31, 2015
,
2014
, and
2013
,
$59 million
,
$50 million
, and
$43 million
of prior service cost credit, respectively, was recognized into the Company’s consolidated statements of operations for amendments to the Postretirement Health Care Benefits Plan.
Non U.S. Pension Benefit Plans
The Company also provides defined benefit plans which cover non-U.S. employees in certain jurisdictions, principally the United Kingdom and Germany (the “Non U.S. Pension Benefit Plans”). Other pension plans outside of the U.S. are not material to the Company either individually or in the aggregate.
In June 2015, the Company amended its Non-US defined benefit plan within the United Kingdom by closing future benefit accruals to all participants effective December 31, 2015. As a result, the Company recorded a curtailment gain of
$32 million
to “Other Charges” within the consolidated statement of operations during 2015.
Net Periodic Cost (Benefit)
The net periodic cost (benefit) for pension and Postretirement Health Care Benefits plans was as follows:
|
U.S. Pension Benefit Plans
|
Non U.S. Pension Benefit Plans
|
Postretirement Health Care Benefits Plan
|
|||||||||||||||||||||||||||||||||
|
Years ended December 31
|
2015
|
2014
|
2013
|
2015
|
2014
|
2013
|
2015
|
2014
|
2013
|
||||||||||||||||||||||||||
|
Service cost
|
$
|
—
|
|
$
|
—
|
|
$
|
—
|
|
$
|
12
|
|
$
|
15
|
|
$
|
11
|
|
$
|
1
|
|
$
|
2
|
|
$
|
2
|
|
||||||||
|
Interest cost
|
193
|
|
370
|
|
352
|
|
66
|
|
80
|
|
69
|
|
8
|
|
10
|
|
11
|
|
|||||||||||||||||
|
Expected return on plan assets
|
(212
|
)
|
(381
|
)
|
(364
|
)
|
(103
|
)
|
(90
|
)
|
(77
|
)
|
(9
|
)
|
(10
|
)
|
(10
|
)
|
|||||||||||||||||
|
Amortization of:
|
|||||||||||||||||||||||||||||||||||
|
Unrecognized net loss
|
46
|
|
97
|
|
130
|
|
17
|
|
12
|
|
13
|
|
8
|
|
9
|
|
14
|
|
|||||||||||||||||
|
Unrecognized prior service benefit
|
—
|
|
—
|
|
—
|
|
(3
|
)
|
(7
|
)
|
(6
|
)
|
(59
|
)
|
(50
|
)
|
(43
|
)
|
|||||||||||||||||
|
Curtailment gain
|
—
|
|
—
|
|
—
|
|
(32
|
)
|
—
|
|
—
|
|
—
|
|
—
|
|
—
|
|
|||||||||||||||||
|
Settlement/loss
|
—
|
|
1,883
|
|
—
|
|
—
|
|
—
|
|
—
|
|
—
|
|
—
|
|
—
|
|
|||||||||||||||||
|
Net periodic pension cost (benefit)
|
$
|
27
|
|
$
|
1,969
|
|
$
|
118
|
|
$
|
(43
|
)
|
$
|
10
|
|
$
|
10
|
|
$
|
(51
|
)
|
$
|
(39
|
)
|
$
|
(26
|
)
|
||||||||
71
The status of the Company’s plans is as follows:
|
|
U.S. Pension Benefit Plans
|
Non U.S. Pension Benefit Plans
|
Postretirement Health Care Benefits Plan
|
||||||||||||||||||||
|
|
2015
|
2014
|
2015
|
2014
|
2015
|
2014
|
|||||||||||||||||
|
Change in benefit obligation:
|
|||||||||||||||||||||||
|
Benefit obligation at January 1
|
$
|
4,536
|
|
$
|
7,317
|
|
$
|
2,075
|
|
$
|
1,904
|
|
$
|
212
|
|
$
|
278
|
|
|||||
|
Service cost
|
—
|
|
—
|
|
12
|
|
15
|
|
1
|
|
2
|
|
|||||||||||
|
Interest cost
|
193
|
|
370
|
|
66
|
|
80
|
|
8
|
|
10
|
|
|||||||||||
|
Plan amendments
|
—
|
|
—
|
|
1
|
|
—
|
|
—
|
|
(41
|
)
|
|||||||||||
|
Settlements/curtailments
|
—
|
|
(4,227
|
)
|
(5
|
)
|
—
|
|
—
|
|
—
|
|
|||||||||||
|
Actuarial loss (gain)
|
(319
|
)
|
1,357
|
|
(151
|
)
|
263
|
|
(12
|
)
|
(14
|
)
|
|||||||||||
|
Foreign exchange valuation adjustment
|
—
|
|
—
|
|
(123
|
)
|
(146
|
)
|
—
|
|
—
|
|
|||||||||||
|
Employee contributions
|
—
|
|
—
|
|
2
|
|
2
|
|
—
|
|
—
|
|
|||||||||||
|
Benefit payments
|
(106
|
)
|
(281
|
)
|
(62
|
)
|
(43
|
)
|
(17
|
)
|
(23
|
)
|
|||||||||||
|
Benefit obligation at December 31
|
4,304
|
|
4,536
|
|
1,815
|
|
2,075
|
|
192
|
|
212
|
|
|||||||||||
|
Change in plan assets:
|
|||||||||||||||||||||||
|
Fair value at January 1
|
3,317
|
|
6,071
|
|
1,806
|
|
1,513
|
|
163
|
|
161
|
|
|||||||||||
|
Return on plan assets
|
(84
|
)
|
642
|
|
33
|
|
191
|
|
(6
|
)
|
21
|
|
|||||||||||
|
Company contributions
|
3
|
|
1,112
|
|
10
|
|
237
|
|
—
|
|
—
|
|
|||||||||||
|
Settlements
|
—
|
|
(3,196
|
)
|
—
|
|
—
|
|
—
|
|
—
|
|
|||||||||||
|
Employee contributions
|
—
|
|
—
|
|
2
|
|
2
|
|
—
|
|
—
|
|
|||||||||||
|
Foreign exchange valuation adjustment
|
—
|
|
—
|
|
(93
|
)
|
(96
|
)
|
—
|
|
—
|
|
|||||||||||
|
Lump sum settlements
|
—
|
|
(1,031
|
)
|
—
|
|
—
|
|
—
|
|
—
|
|
|||||||||||
|
Benefit payments
|
(106
|
)
|
(281
|
)
|
(62
|
)
|
(41
|
)
|
(14
|
)
|
(19
|
)
|
|||||||||||
|
Fair value at December 31
|
3,130
|
|
3,317
|
|
1,696
|
|
1,806
|
|
143
|
|
163
|
|
|||||||||||
|
Funded status of the plan
|
(1,174
|
)
|
(1,219
|
)
|
(119
|
)
|
(269
|
)
|
(49
|
)
|
(49
|
)
|
|||||||||||
|
Unrecognized net loss
|
1,777
|
|
1,846
|
|
453
|
|
593
|
|
104
|
|
109
|
|
|||||||||||
|
Unrecognized prior service benefit
|
—
|
|
—
|
|
—
|
|
(35
|
)
|
(24
|
)
|
(83
|
)
|
|||||||||||
|
Prepaid (accrued) pension cost
|
$
|
603
|
|
$
|
627
|
|
$
|
334
|
|
$
|
289
|
|
$
|
31
|
|
$
|
(23
|
)
|
|||||
|
Components of prepaid (accrued) pension cost:
|
|||||||||||||||||||||||
|
Non-current benefit liability
|
$
|
(1,174
|
)
|
$
|
(1,219
|
)
|
$
|
(119
|
)
|
$
|
(269
|
)
|
$
|
(49
|
)
|
$
|
(49
|
)
|
|||||
|
Deferred income taxes
|
657
|
|
701
|
|
46
|
|
51
|
|
31
|
|
10
|
|
|||||||||||
|
Accumulated other comprehensive loss
|
1,120
|
|
1,145
|
|
407
|
|
507
|
|
49
|
|
16
|
|
|||||||||||
|
Prepaid (accrued) pension cost
|
$
|
603
|
|
$
|
627
|
|
$
|
334
|
|
$
|
289
|
|
$
|
31
|
|
$
|
(23
|
)
|
|||||
The net funded status of the of the Non U.S. Pension Benefit Plans primarily reflects a net underfunded status of
$224 million
related to Germany and a net overfunded status of
$105 million
related to the United Kingdom as of
December 31, 2015
.
The benefit obligation and plan assets for the Company's plans are measured as of
December 31, 2015
. The Company utilizes a
five
-year, market-related asset value method of recognizing asset related gains and losses.
Under relevant accounting rules, when almost all of the plan participants are considered inactive, the amortization period for certain unrecognized losses changes from the average remaining service period to the average remaining lifetime of the participants. As such, depending on the specific plan, the Company amortizes gains and losses over periods ranging from
eleven
to
thirty-five
years. Prior service costs are amortized over periods ranging from
two
to
nine
years. Benefits under all pension plans are valued based on the projected unit credit cost method.
The net periodic cost for
2016
will include amortization of the unrecognized net loss and prior service costs for the U.S. Pension Benefit Plans and Non U.S. Pension Benefit Plans, currently included in Accumulated other comprehensive loss, of
$38 million
and
$11 million
, respectively. It is estimated that the
2016
net periodic expense for the Postretirement Health Care Benefits Plan will include amortization of a net credit of
$16 million
, comprised of the unrecognized prior service gain and unrecognized actuarial loss, currently included in Accumulated other comprehensive loss.
72
Actuarial Assumptions
Certain actuarial assumptions such as the discount rate and the long-term rate of return on plan assets have a significant effect on the amounts reported for net periodic cost and the benefit obligation. The assumed discount rates reflect the prevailing market rates of a universe of high-quality, non-callable, corporate bonds currently available that, if the obligation were settled at the measurement date, would provide the necessary future cash flows to pay the benefit obligation when due. The long-term rates of return on plan assets represent an estimate of long-term returns on an investment portfolio consisting of a mixture of equities, fixed income, cash and other investments similar to the actual investment mix. In determining the long-term return on plan assets, the Company considers long-term rates of return on the asset classes (both historical and forecasted) in which the Company expects the plan funds to be invested.
Weighted average actuarial assumptions used to determine costs for the plans at the beginning of the fiscal year were as follows:
|
U.S. Pension Benefit Plans
|
Non U.S. Pension Benefit Plans
|
Postretirement Health Care Benefits Plan
|
|||||||||||||||
|
2015
|
2014
|
2015
|
2014
|
2015
|
2014
|
||||||||||||
|
Discount rate
|
4.30
|
%
|
5.15
|
%
|
3.19
|
%
|
4.24
|
%
|
3.90
|
%
|
4.65
|
%
|
|||||
|
Investment return assumption
|
7.00
|
%
|
7.00
|
%
|
5.90
|
%
|
5.92
|
%
|
7.00
|
%
|
7.00
|
%
|
|||||
Weighted average actuarial assumptions used to determine benefit obligations for the plans were as follows:
|
|
U.S. Pension Benefit Plans
|
Non U.S. Pension Benefit Plans
|
Postretirement Health Care Benefits Plan
|
||||||||||||||
|
2015
|
2014
|
2015
|
2014
|
2015
|
2014
|
||||||||||||
|
Discount rate
|
4.73
|
%
|
4.30
|
%
|
3.57
|
%
|
3.19
|
%
|
4.26
|
%
|
3.90
|
%
|
|||||
|
Future compensation increase rate
|
n/a
|
|
n/a
|
|
0.41
|
%
|
2.54
|
%
|
n/a
|
|
n/a
|
|
|||||
The accumulated benefit obligations for the plans were as follows:
|
|
U.S. Pension Benefit Plans
|
Non U.S. Pension Benefit Plans
|
|||||||||||||
|
December 31
|
2015
|
2014
|
2015
|
2014
|
|||||||||||
|
Accumulated benefit obligation
|
$
|
4,304
|
|
$
|
4,536
|
|
$
|
1,809
|
|
$
|
2,059
|
|
|||
In 2014, the Society of Actuaries ("SOA") released the “RP-2014 White Collar” mortality table which was utilized in calculating the 2014 projected benefit obligation. During 2015, the SOA issued an update, Mortality Improvement Scale MP-2015, which includes two additional years of mortality data and was utilized to calculate the 2015 projected benefit obligation.
Effective on January 1, 2016, the Company changed the method used to estimate the interest and service cost components of net periodic cost for defined benefit pension and other post-retirement benefit plans. Historically, the interest and service cost components were estimated using a single weighted-average discount rate derived from the yield curve used to measure the projected benefit obligation at the beginning of the period. The Company has elected to use a full yield curve approach in the estimation of these components of net periodic cost by applying the specific spot rates along the yield curve used in the determination of the projected benefit obligation to the relevant projected cash flows. The Company made this change to improve the correlation between projected benefit cash flows and the corresponding yield curve spot rates and to provide a more precise measurement of interest and service costs. This change does not affect the measurement of total benefit obligations as the change in interest and service cost is completely offset in the actuarial loss reported in the period. The Company has concluded that this change is a change in estimate and, accordingly, will account for it prospectively beginning in 2016.
73
Investment Policy
The individual plans have adopted an investment policy designed to meet or exceed the expected rate of return on plan assets assumption. To achieve this, the plans retain professional advisors and investment managers that invest plan assets into various classes including, but not limited to, equity and fixed income securities, cash, cash equivalents, commodities, hedge funds, infrastructure/utilities, insurance contracts, leveraged loan funds and real estate. The Company uses long-term historical actual return experience with consideration of the expected investment mix of the plans’ assets, as well as future estimates of long-term investment returns, to develop its expected rate of return assumption used in calculating the net periodic cost. The individual plans have target mixes for these asset classes, which are readjusted periodically when an asset class weighting deviates from the target mix, with the goal of achieving the required return at a reasonable risk level.
The weighted-average asset allocations by asset categories for all pension and the Postretirement Health Care Benefits plans were as follows:
|
|
All Pension Benefit Plans
|
Postretirement Health Care Benefits Plan
|
|||||||||
|
December 31
|
2015
|
2014
|
2015
|
2014
|
|||||||
|
Target Mix:
|
|||||||||||
|
Equity securities
|
37
|
%
|
41
|
%
|
36
|
%
|
37
|
%
|
|||
|
Fixed income securities
|
45
|
%
|
44
|
%
|
42
|
%
|
42
|
%
|
|||
|
Cash and other investments
|
18
|
%
|
15
|
%
|
22
|
%
|
21
|
%
|
|||
|
Actual Mix:
|
|||||||||||
|
Equity securities
|
37
|
%
|
43
|
%
|
37
|
%
|
20
|
%
|
|||
|
Fixed income securities
|
44
|
%
|
44
|
%
|
41
|
%
|
20
|
%
|
|||
|
Cash and other investments
|
19
|
%
|
13
|
%
|
22
|
%
|
60
|
%
|
|||
Within the equity securities asset class, the investment policy provides for investments in a broad range of publicly-traded securities including both domestic and foreign equities. Within the fixed income securities asset class, the investment policy provides for investments in a broad range of publicly-traded debt securities including: U.S. Treasury issues, corporate debt securities, mortgage and asset-backed securities, as well as foreign debt securities. In the cash and other investments asset class, investments may include, but are not limited to: cash, cash equivalents, commodities, hedge funds, infrastructure/utilities, insurance contracts, leveraged loan funds and real estate.
Cash Funding
The Company made
$3 million
of contributions to its U.S. Pension Benefit Plans during
2015
, compared to
$1.1 billion
contributed in
2014
. The Company contributed
$10 million
to its Non U.S. Pension Benefit Plans during
2015
, compared to
$237 million
contributed in
2014
. The Company made
no
contributions to its Postretirement Health Care Benefits Plan in
2015
or
2014
.
Expected Future Benefit Payments
The following benefit payments are expected to be paid:
|
Year
|
U.S. Pension Benefit Plans
|
Non U.S. Pension Benefit Plans
|
Postretirement Health Care Benefits Plan
|
||||||||
|
2016
|
$
|
94
|
|
$
|
47
|
|
$
|
19
|
|
||
|
2017
|
108
|
|
46
|
|
18
|
|
|||||
|
2018
|
124
|
|
52
|
|
17
|
|
|||||
|
2019
|
141
|
|
55
|
|
16
|
|
|||||
|
2020
|
162
|
|
62
|
|
15
|
|
|||||
|
2021-2025
|
1,128
|
|
376
|
|
63
|
|
|||||
Other Benefit Plans
Split-Dollar Life Insurance Arrangements
The Company maintains a number of endorsement split-dollar life insurance policies on now-retired officers under a plan that was frozen prior to December 31, 2004. The Company had purchased the life insurance policies to insure the lives of employees and then entered into a separate agreement with the employees that split the policy benefits between the Company and the employee. Motorola Solutions owns the policies, controls all rights of ownership, and may terminate the insurance policies. To effect the split-dollar arrangement, Motorola Solutions endorsed a portion of the death benefits to the employee and upon the death of the employee, the employee’s beneficiary typically receives the designated portion of the death benefits
74
directly from the insurance company and the Company receives the remainder of the death benefits. It is currently expected that minimal cash payments will be required to fund these policies.
The net periodic pension cost for these split-dollar life insurance arrangements was
$5 million
for the years ended
December 31, 2015
,
2014
and
2013
. The Company has recorded a liability representing the actuarial present value of the future death benefits as of the employees’ expected retirement date of
$63 million
and
$66 million
as of
December 31, 2015
and
December 31, 2014
, respectively.
Deferred Compensation Plan
The Company amended and reinstated its deferred compensation plan (“the Plan”) effective June 1, 2013 to reopen the Plan to certain participants. Under the Plan, participants may elect to defer base salary and cash incentive compensation in excess of 401(k) plan limitations. Participants under the Plan may choose to invest their deferred amounts in the same investment alternatives available under the Company's 401(k) plan. The Plan also allows for Company matching contributions for the following: (i) the first
4%
of compensation deferred under the Plan, subject to a maximum of
$50,000
for board officers, (ii) lost matching amounts that would have been made under the 401(k) plan if participants had not participated in the Plan, and (iii) discretionary amounts as approved by the Compensation and Leadership Committee of the Board of Directors.
Defined Contribution Plan
The Company and certain subsidiaries have various defined contribution plans, in which all eligible employees may participate. In the U.S., the 401(k) plan is a contributory plan. Matching contributions are based upon the amount of the employees’ contributions. The Company’s expenses for material defined contribution plans for the years ended
December 31, 2015
,
2014
and
2013
were
$28 million
,
$31 million
and
$32 million
, respectively.
Under the 401(k) plan, the Company may make an additional discretionary 401(k) plan matching contribution to eligible employees. For the years ended
December 31, 2015
,
2014
, and
2013
the Company made
no
discretionary matching contributions.
8. Share-Based Compensation Plans and Other Incentive Plans
The Company grants options and stock appreciation rights to acquire shares of common stock to certain employees, including executives, and to existing option holders of acquired companies in connection with the merging of option plans following an acquisition. Each option granted and stock appreciation right has an exercise price of no less than
100%
of the fair market value of the common stock on the date of the grant. The awards have a contractual life of
five
to
ten
years and vest over
two
to
four
years. Stock options and stock appreciation rights assumed or replaced with comparable stock options or stock appreciation rights in conjunction with a change in control of the Company only become exercisable if the holder is also involuntarily terminated (for a reason other than cause) or resigns for good reason within
24
months of a change in control.
Restricted stock (“RS”) and restricted stock unit (“RSU”) grants consist of shares or the rights to shares of the Company’s common stock which are awarded to employees, including executives, and non-employee directors. The grants are restricted such that they are subject to substantial risk of forfeiture and to restrictions on their sale or other transfer by the employee. Shares of RS and RSUs assumed or replaced with comparable shares of RS or RSUs in conjunction with a change in control will only have the restrictions lapse if the holder is also involuntarily terminated (for a reason other than cause) or resigns for good reason within
24 months
of a change in control.
On March 9, 2015 the Compensation and Leadership Committee of the Board of Directors granted performance-based stock options (“performance options”) and market stock units ("MSUs") to the Company’s executive officers. Performance options have a
three
year performance period and are granted as a target number of units subject to adjustment based on company performance. Each performance option granted has an exercise price of no less than
100%
of the fair market value of the common stock on the date of the grant. The awards have a contractual life of
ten years
. Shares ultimately issued for performance option awards granted in
2015
are based on the actual total shareholder return (“TSR”) compared to the S&P 500 over the
three
year performance period based on a payout factor that corresponds to actual TSR results as established for
2015
. Vesting occurs on the third anniversary of the grant date. Under the terms of the MSUs, vesting is conditioned upon continuous employment until the vesting date and the payout factor is at least
60%
of the share price on the award date. The payout factor is the share price on vesting date divided by share price on award date, with a maximum of
200%
. The share price used in the payout factor is calculated using an average of the closing prices on the grant or vesting date, and the
30
calendar days immediately preceding the grant or vesting date. Vesting occurs ratably over
three years
.
On August 24, 2015, in conjunction with the issuance of the Senior Convertible Notes, the Company approved a grant of performance-contingent stock options (“PCSOs”) to certain executive officers. The total number of PCSOs granted is designed to represent approximately
1%
of the fully-diluted equity of the Company. The PCSOs vest upon satisfaction of the following stock price hurdles which must be maintained for
10
-consecutive trading days during the
three
-year period following the grant date:
20%
of the total award will vest at an
$85
stock price; an additional
30%
of the total award will vest at a
$102.50
stock price; and the final
50%
of the total award will vest at a
$120
stock price. If any stock price hurdles are not met during the three-year period, the corresponding portion of the options will not vest and will be forfeited. The awards have a
seven
-year term and a per share exercise price of
$68.50
.
The employee stock purchase plan allows eligible participants to purchase shares of the Company’s common stock through payroll deductions of up to
20%
of eligible compensation on an after-tax basis. Plan participants cannot purchase more
75
than
$25,000
of stock in any calendar year. The price an employee pays per share is
85%
of the lower of the fair market value of the Company’s stock on the close of the first trading day or last trading day of the purchase period. The plan has two purchase periods, the first from October 1 through March 31 and the second from April 1 through September 30. For the years ended December 31,
2015
,
2014
and
2013
, employees purchased
1.0 million
,
1.4 million
and
1.5 million
shares, respectively, at purchase prices of
$52.99
and
$56.67
,
$51.76
and
$53.79
, and
$43.02
and
$50.47
, respectively.
Significant Assumptions Used in the Estimate of Fair Value
The Company calculates the value of each employee stock option, estimated on the date of grant, using the Black-Scholes option pricing model. The weighted-average estimated fair value of employee stock options granted during
2015
,
2014
and
2013
was
$10.21
,
$11.02
and
$9.52
, respectively, using the following weighted-average assumptions:
|
2015
|
2014
|
2013
|
||||||
|
Expected volatility
|
20.0
|
%
|
21.7
|
%
|
22.1
|
%
|
||
|
Risk-free interest rate
|
1.6
|
%
|
1.6
|
%
|
0.9
|
%
|
||
|
Dividend yield
|
2.9
|
%
|
2.5
|
%
|
2.4
|
%
|
||
|
Expected life (years)
|
6.0
|
|
5.2
|
|
5.9
|
|
||
The Company calculates the value of each performance option, MSU, and PCSO using the Monte Carlo Simulation, estimated on the date of grant. The fair value of performance options, MSUs, and PCSOs granted during
2015
was
$17.42
,
$60.37
, and
$3.97
, respectively, using the following assumptions:
|
Performance Options
|
Market Stock Units
|
PCSOs
|
||||||
|
Expected volatility of common stock
|
21.0
|
%
|
19.3
|
%
|
26.0
|
%
|
||
|
Expected volatility of the S&P 500
|
23.3
|
%
|
n/a
|
|
n/a
|
|
||
|
Risk-free interest rate
|
1.8
|
%
|
1.1
|
%
|
1.5
|
%
|
||
|
Dividend yield
|
2.9
|
%
|
2.9
|
%
|
3.1
|
%
|
||
|
Expected life (years)
|
6.5
|
|
n/a
|
|
5
|
|
||
The Company uses the implied volatility for traded options on the Company’s stock as the expected volatility assumption in the valuation of stock options, MSUs, and PCSOs. The selection of the implied volatility approach was based upon the availability of actively traded options on the Company’s stock and the Company’s assessment that implied volatility is more representative of future stock price trends than historical volatility. The Company uses the historical volatility as the expected volatility assumption in the valuation of performance options in order to calculate the correlation coefficients between the S&P 500 and the Company's stock, which can only be calculated using historical data.
The risk-free interest rate assumption is based upon the average daily closing rates during the year for U.S. Treasury notes that have a life which approximates the expected life of the grant. The dividend yield assumption is based on the Company’s future expectation of dividend payouts. The expected life represents the average of the contractual term of the options and the weighted-average vesting period for all option tranches.
The Company has applied forfeiture rates, estimated based on historical data, of
10%
-
50%
to the stock option fair values calculated by the Black-Scholes option pricing model. These estimated forfeiture rates are applied to grants based on their remaining vesting term and may be revised in subsequent periods if actual forfeitures differ from these estimates.
The following table summarizes information about the total stock options outstanding and exercisable under all stock option plans, including performance options and PCSOs, at
December 31, 2015
(in thousands, except exercise price and years):
|
|
Options Outstanding
|
Options Exercisable
|
|||||||||||||||
|
Exercise price range
|
No. of
options |
Wtd. avg.
Exercise Price |
Wtd. avg.
contractual life (in yrs.) |
No. of
options |
Wtd. avg.
Exercise Price |
Wtd. avg.
contractual life (in yrs.) |
|||||||||||
|
Under $30
|
551
|
|
$
|
27
|
|
4
|
551
|
|
$
|
27
|
|
4
|
|||||
|
$30-$40
|
2,047
|
|
39
|
|
4
|
2,047
|
|
39
|
|
4
|
|||||||
|
$41-$50
|
106
|
|
45
|
|
5
|
106
|
|
45
|
|
5
|
|||||||
|
$51-$60
|
1,482
|
|
55
|
|
7
|
1,119
|
|
54
|
|
7
|
|||||||
|
$61-$70
|
3,593
|
|
67
|
|
9
|
213
|
|
65
|
|
8
|
|||||||
|
$71-$80
|
165
|
|
74
|
|
2
|
158
|
|
74
|
|
1
|
|||||||
|
$81 and over
|
127
|
|
89
|
|
0
|
127
|
|
89
|
|
0
|
|||||||
|
|
8,071
|
|
|
|
4,321
|
|
|
||||||||||
76
As of
December 31, 2015
, the weighted average contractual life for options outstanding and exercisable was
7
and
5
years, respectively.
Current Year Activity
Total share-based compensation activity was as follows (in thousands, except exercise price):
|
|
Stock Options
|
Performance Options*
|
Restricted Stock Units
|
Market Stock Units
|
|||||||||||||||||||||||
|
Shares in Thousands
|
Number of Options Outstanding
|
Weighted Average Exercise Price of Shares
|
Number of Options Outstanding
|
Weighted Average Exercise Price of Shares
|
Number of Non-Vested Awards
|
Weighted Average Grant Date Fair Value
|
Number of Non-Vested Awards
|
Weighted Average Grant Date Fair Value
|
|||||||||||||||||||
|
Balance as of January 1, 2015
|
9,684
|
|
$
|
85
|
|
—
|
|
$
|
—
|
|
1,753
|
|
$
|
58
|
|
—
|
|
$
|
—
|
|
|||||||
|
Granted
|
550
|
|
66
|
|
2,042
|
|
68
|
|
797
|
|
62
|
|
84
|
|
60
|
|
|||||||||||
|
Releases/Exercised
|
(892
|
)
|
47
|
|
—
|
|
—
|
|
(885
|
)
|
53
|
|
—
|
|
—
|
|
|||||||||||
|
Adjustments for actual payouts
|
—
|
|
—
|
|
—
|
|
—
|
|
—
|
|
—
|
|
—
|
|
—
|
|
|||||||||||
|
Forfeited/Canceled
|
(3,313
|
)
|
155
|
|
—
|
|
—
|
|
(149
|
)
|
60
|
|
—
|
|
—
|
|
|||||||||||
|
Balance as of December 31, 2015
|
6,029
|
|
$
|
51
|
|
2,042
|
|
$
|
68
|
|
1,516
|
|
$
|
59
|
|
84
|
|
$
|
60
|
|
|||||||
|
Vested or expected to vest
|
4,604
|
|
46
|
|
—
|
|
—
|
|
885
|
|
53
|
|
—
|
|
—
|
|
|||||||||||
* Inclusive of PCSO awards
At
December 31, 2015
and
2014
,
12.0 million
and
19.7 million
shares, respectively, were available for future share-based award grants under the current share-based compensation plan, covering all equity awards to employees and non-employee directors.
Total Share-Based Compensation Expense
Compensation expense for the Company’s share-based compensation plans was as follows:
|
Years ended December 31
|
2015
|
2014
|
2013
|
||||||||
|
Share-based compensation expense included in:
|
|||||||||||
|
Costs of sales
|
$
|
9
|
|
$
|
10
|
|
$
|
16
|
|
||
|
Selling, general and administrative expenses
|
52
|
|
61
|
|
73
|
|
|||||
|
Research and development expenditures
|
17
|
|
23
|
|
31
|
|
|||||
|
Share-based compensation expense included in Operating earnings
|
78
|
|
94
|
|
120
|
|
|||||
|
Tax benefit
|
24
|
|
30
|
|
37
|
|
|||||
|
Share-based compensation expense, net of tax
|
$
|
54
|
|
$
|
64
|
|
$
|
83
|
|
||
|
Decrease in basic earnings per share
|
$
|
(0.25
|
)
|
$
|
(0.28
|
)
|
$
|
(0.31
|
)
|
||
|
Decrease in diluted earnings per share
|
$
|
(0.25
|
)
|
$
|
(0.28
|
)
|
$
|
(0.31
|
)
|
||
|
Share-based compensation expense in discontinued operations
|
$
|
—
|
|
$
|
20
|
|
$
|
33
|
|
||
At December 31, 2015, the Company had unrecognized compensation expense related to RS, RSUs, and MSUs of
$60 million
, net of estimated forfeitures, expected to be recognized over the weighted average period of approximately
two years
. The total fair value of RS and RSU shares vested during the years ended
December 31, 2015
,
2014
, and
2013
was
$55 million
,
$160 million
, and
$138 million
, respectively. The aggregate fair value of outstanding RS, RSUs, and MSUs as of
December 31, 2015
was
$95 million
.
At
December 31, 2015
, the Company had
$20 million
of total unrecognized compensation expense, net of estimated forfeitures, related to stock option plans that will be recognized over the weighted average period of approximately
two
years, and
$4 million
of unrecognized compensation expense related to the employee stock purchase plan that will be recognized over the remaining purchase period. Cash received from stock option exercises and the employee stock purchase plan was
$100 million
,
$135 million
, and
$165 million
for the years ended
December 31, 2015
,
2014
, and
2013
, respectively. The total intrinsic value of options exercised during the years ended
December 31, 2015
,
2014
, and
2013
was
$15 million
,
$38 million
, and
$85 million
, respectively. The aggregate intrinsic value for options outstanding and exercisable as of
December 31, 2015
was
$110 million
and
$102 million
, respectively, based on a
December 31, 2015
stock price of
$68.45
per share.
77
Motorola Solutions Incentive Plans
The Company's incentive plans provide eligible employees with an annual payment, calculated as a percentage of an employee’s eligible earnings, in the year after the close of the current calendar year if specified business goals and individual performance targets are met. The expense for awards under these incentive plans for the years ended
December 31, 2015
,
2014
and
2013
was
$119 million
,
$53 million
and
$87 million
, respectively.
Long-Range Incentive Plan
The Long-Range Incentive Plan (“LRIP”) rewards participating elected officers for the Company’s achievement of specified business goals during the period, based on a single performance objective measured over a three year period. The expense for LRIP for the years ended
December 31, 2015
,
2014
and
2013
was
$12 million
,
$3 million
and
$4 million
, respectively.
9. Fair Value Measurements
The Company holds certain fixed income securities, equity securities and derivatives, which are recognized and disclosed at fair value in the financial statements on a recurring basis. Fair value is defined as the price that would be received to sell an asset or paid to transfer a liability in an orderly transaction between market participants as of the measurement date. Fair value is measured using the fair value hierarchy and related valuation methodologies as defined in the authoritative literature. This guidance specifies a hierarchy of valuation techniques based on whether the inputs to each measurement are observable or unobservable. Observable inputs reflect market data obtained from independent sources, while unobservable inputs reflect the Company's assumptions about current market conditions. The prescribed fair value hierarchy and related valuation methodologies as they pertain to the Company are as follows:
Level 1—Quoted prices for identical instruments in active markets.
Level 2—Quoted prices for similar instruments in active markets, quoted prices for identical or similar instruments in markets that are not active, and model-derived valuations, in which all significant inputs are observable, in active markets.
Level 3—Valuations derived from valuation techniques, in which one or more significant inputs are unobservable.
Investments and Derivatives
The fair values of the Company’s financial assets and liabilities by level in the fair value hierarchy as of
December 31, 2015
and
2014
were as follows:
|
December 31, 2015
|
Level 1
|
Level 2
|
Total
|
||||||||
|
Assets:
|
|||||||||||
|
Foreign exchange derivative contracts
|
$
|
—
|
|
$
|
6
|
|
$
|
6
|
|
||
|
Available-for-sale securities:
|
|||||||||||
|
Government, agency, and government-sponsored enterprise obligations
|
—
|
|
444
|
|
444
|
|
|||||
|
Corporate bonds
|
—
|
|
7
|
|
7
|
|
|||||
|
Common stock and equivalents
|
6
|
|
—
|
|
6
|
|
|||||
|
Liabilities:
|
|||||||||||
|
Foreign exchange derivative contracts
|
$
|
—
|
|
$
|
2
|
|
$
|
2
|
|
||
|
Interest agreement derivative contracts
|
—
|
|
1
|
|
1
|
|
|||||
|
December 31, 2014
|
Level 1
|
Level 2
|
Total
|
||||||||
|
Assets:
|
|||||||||||
|
Foreign exchange derivative contracts
|
$
|
—
|
|
$
|
1
|
|
$
|
1
|
|
||
|
Available-for-sale securities:
|
|||||||||||
|
Government, agency, and government-sponsored enterprise obligations
|
—
|
|
14
|
|
14
|
|
|||||
|
Corporate bonds
|
—
|
|
16
|
|
16
|
|
|||||
|
Mutual funds
|
—
|
|
2
|
|
2
|
|
|||||
|
Common stock and equivalents
|
71
|
|
—
|
|
71
|
|
|||||
|
Liabilities:
|
|||||||||||
|
Foreign exchange derivative contracts
|
$
|
—
|
|
$
|
5
|
|
$
|
5
|
|
||
|
Interest agreement derivative contracts
|
—
|
|
2
|
|
2
|
|
|||||
There were no significant transfers between Level 1 and Level 2 during
2015
or
2014
.
78
Pension and Postretirement Health Care Benefits Plan Assets
The fair values of the various pension and postretirement health care benefits plans’ assets by level in the fair value hierarchy as of
December 31, 2015
and
2014
were as follows:
U.S. Pension Benefit Plans
|
December 31, 2015
|
Level 1
|
Level 2
|
Total
|
||||||||
|
Common stock and equivalents
|
$
|
89
|
|
$
|
—
|
|
$
|
89
|
|
||
|
Commingled equity funds
|
—
|
|
1,541
|
|
1,541
|
|
|||||
|
Preferred stock
|
2
|
|
—
|
|
2
|
|
|||||
|
Government, agency and government-sponsored enterprise obligations
|
—
|
|
120
|
|
120
|
|
|||||
|
Other government bonds
|
—
|
|
70
|
|
70
|
|
|||||
|
Corporate bonds
|
—
|
|
862
|
|
862
|
|
|||||
|
Mortgage-backed bonds
|
—
|
|
2
|
|
2
|
|
|||||
|
Commingled short-term investment funds
|
—
|
|
435
|
|
435
|
|
|||||
|
Total investment securities
|
$
|
91
|
|
$
|
3,030
|
|
$
|
3,121
|
|
||
|
Accrued income receivable
|
9
|
|
|||||||||
|
Fair value plan assets
|
|
|
$
|
3,130
|
|
||||||
The table above includes
no
securities on loan as part of a securities lending arrangement.
|
December 31, 2014
|
Level 1
|
Level 2
|
Total
|
||||||||
|
Common stock and equivalents
|
$
|
902
|
|
$
|
—
|
|
$
|
902
|
|
||
|
Commingled equity funds
|
—
|
|
565
|
|
565
|
|
|||||
|
Preferred stock
|
3
|
|
—
|
|
3
|
|
|||||
|
Government, agency and government-sponsored enterprise obligations
|
—
|
|
520
|
|
520
|
|
|||||
|
Other government bonds
|
—
|
|
91
|
|
91
|
|
|||||
|
Corporate bonds
|
—
|
|
795
|
|
795
|
|
|||||
|
Mortgage-backed bonds
|
—
|
|
16
|
|
16
|
|
|||||
|
Commingled short-term investment funds
|
—
|
|
422
|
|
422
|
|
|||||
|
Total investment securities
|
$
|
905
|
|
$
|
2,409
|
|
$
|
3,314
|
|
||
|
Accrued income receivable
|
3
|
|
|||||||||
|
Fair value plan assets
|
|
|
$
|
3,317
|
|
||||||
The table above includes
no
securities on loan as part of a securities lending arrangement.
There were no significant transfers between Level 1 and Level 2 during
2015
or
2014
.
Non-U.S. Pension Benefit Plans
|
December 31, 2015
|
Level 1
|
Level 2
|
Total
|
||||||||
|
Common stock and equivalents
|
$
|
21
|
|
$
|
—
|
|
$
|
21
|
|
||
|
Commingled equity funds
|
—
|
|
293
|
|
293
|
|
|||||
|
Government, agency, and government-sponsored enterprise obligations
|
—
|
|
811
|
|
811
|
|
|||||
|
Commingled bond funds
|
—
|
|
56
|
|
56
|
|
|||||
|
Commingled short-term investment funds
|
—
|
|
7
|
|
7
|
|
|||||
|
Total investment securities
|
$
|
21
|
|
$
|
1,167
|
|
$
|
1,188
|
|
||
|
Cash
|
457
|
|
|||||||||
|
Accrued income receivable
|
2
|
|
|||||||||
|
Insurance contracts
|
49
|
|
|||||||||
|
Fair value plan assets
|
|
|
$
|
1,696
|
|
||||||
The table above includes
no
securities on loan as part of a securities lending arrangement.
79
|
December 31, 2014
|
Level 1
|
Level 2
|
Total
|
||||||||
|
Common stock and equivalents
|
$
|
194
|
|
$
|
—
|
|
$
|
194
|
|
||
|
Commingled equity funds
|
—
|
|
569
|
|
569
|
|
|||||
|
Government, agency, and government-sponsored enterprise obligations
|
—
|
|
26
|
|
26
|
|
|||||
|
Corporate bonds
|
—
|
|
316
|
|
316
|
|
|||||
|
Commingled bond funds
|
—
|
|
399
|
|
399
|
|
|||||
|
Commingled short-term investment funds
|
—
|
|
9
|
|
9
|
|
|||||
|
Total investment securities
|
$
|
194
|
|
$
|
1,319
|
|
$
|
1,513
|
|
||
|
Cash
|
233
|
|
|||||||||
|
Accrued income receivable
|
5
|
|
|||||||||
|
Insurance contracts
|
55
|
|
|||||||||
|
Fair value plan assets
|
|
|
$
|
1,806
|
|
||||||
The table above includes securities on loan as part of a securities lending arrangement of
$16 million
of common stock and equivalents, and
$12 million
of corporate bonds. All securities on loan were fully collateralized.
There were no significant transfers between Level 1 and Level 2 during
2015
or
2014
.
Postretirement Health Care Benefits Plan
|
December 31, 2015
|
Level 1
|
Level 2
|
Total
|
||||||||
|
Common stock and equivalents
|
$
|
4
|
|
$
|
—
|
|
$
|
4
|
|
||
|
Commingled equity funds
|
—
|
|
71
|
|
71
|
|
|||||
|
Government, agency, and government-sponsored enterprise obligations
|
—
|
|
5
|
|
5
|
|
|||||
|
Other government bonds
|
—
|
|
3
|
|
3
|
|
|||||
|
Corporate bonds
|
—
|
|
40
|
|
40
|
|
|||||
|
Commingled short-term investment funds
|
—
|
|
14
|
|
14
|
|
|||||
|
Invested cash
|
—
|
|
6
|
|
6
|
|
|||||
|
Fair value plan assets
|
$
|
4
|
|
$
|
139
|
|
$
|
143
|
|
||
The table above includes
no
securities on loan as part of a securities lending arrangement.
|
December 31, 2014
|
Level 1
|
Level 2
|
Total
|
||||||||
|
Common stock and equivalents
|
$
|
20
|
|
$
|
—
|
|
$
|
20
|
|
||
|
Commingled equity funds
|
—
|
|
13
|
|
13
|
|
|||||
|
Government, agency, and government-sponsored enterprise obligations
|
—
|
|
11
|
|
11
|
|
|||||
|
Other government bonds
|
—
|
|
2
|
|
2
|
|
|||||
|
Corporate bonds
|
—
|
|
18
|
|
18
|
|
|||||
|
Commingled short-term investment funds
|
—
|
|
99
|
|
99
|
|
|||||
|
Fair value plan assets
|
$
|
20
|
|
$
|
143
|
|
$
|
163
|
|
||
The table above includes
no
securities on loan as part of a securities lending arrangement.
There were no significant transfers between Level 1 and Level 2 during
2015
or
2014
.
At
December 31, 2015
, the Company had
$1.3 billion
of investments in money market funds (Level 2) classified as Cash and cash equivalents in its consolidated balance sheet, compared to
$3.3 billion
at
December 31, 2014
. The money market funds had quoted market prices that are equivalent to par.
Using quoted market prices and market interest rates, the Company determined that the fair value of long-term debt at
December 31, 2015
was
$4.1 billion
(Level 2), compared to a face value of
$4.4 billion
. Since considerable judgment is required in interpreting market information, the fair value of the long-term debt is not necessarily indicative of the amount which could be realized in a current market exchange.
All other financial instruments are carried at cost, which is not materially different from the instruments’ fair values.
80
10. Long-term Customer Financing and Sales of Receivables
Long-term Customer Financing
Long-term receivables consist of trade receivables with payment terms greater than twelve months, long-term loans and lease receivables under sales-type leases. Long-term receivables consist of the following:
|
December 31
|
2015
|
2014
|
|||||
|
Long-term receivables
|
$
|
60
|
|
$
|
49
|
|
|
|
Less current portion
|
(13
|
)
|
(18
|
)
|
|||
|
Non-current long-term receivables, net
|
$
|
47
|
|
$
|
31
|
|
|
The current portion of long-term receivables is included in Accounts receivable and the non-current portion of long-term receivables is included in Other assets in the Company’s consolidated balance sheets. There was
$2 million
of interest income recognized on long-term receivables for the year ended
December 31, 2015
. There was
$1 million
of interest income recognized on long-term receivables for the year ended
2014
and
no
interest income recognized on long-term receivables for the year ended
2013
.
Certain purchasers of the Company's products and services may request that the Company provide long-term financing (defined as financing with a term greater than one year) in connection with the sale of products and services. These requests may include all or a portion of the purchase price of the products and services. The Company's obligation to provide long-term financing may be conditioned on the issuance of a letter of credit in favor of the Company by a reputable bank to support the purchaser's credit or a pre-existing commitment from a reputable bank to purchase the long-term receivables from the Company. The Company had outstanding commitments to provide long-term financing to third-parties totaling
$112 million
at
December 31, 2015
, compared to
$293 million
at
December 31, 2014
. Outstanding commitments decreased during the year ended
December 31, 2015
primarily as a result of two large customer contracts, one of which was converted to an order without long-term financing and the other where the financing commitment was funded and sold.
Sales of Receivables
From time to time, the Company sells accounts receivable and long-term receivables to third-parties under one-time arrangements. The Company may or may not retain the obligation to service the sold accounts receivable and long-term receivables.
The following table summarizes the proceeds received from sales of accounts receivable and long-term receivables for the years ended
December 31, 2015
,
2014
and
2013
.
|
Years ended December 31
|
2015
|
2014
|
2013
|
||||||||
|
Cumulative annual proceeds received from sales:
|
|||||||||||
|
Accounts receivable sales proceeds
|
$
|
29
|
|
$
|
50
|
|
$
|
14
|
|
||
|
Long-term receivables sales proceeds
|
196
|
|
124
|
|
131
|
|
|||||
|
Total proceeds from receivable sales
|
$
|
225
|
|
$
|
174
|
|
$
|
145
|
|
||
At
December 31, 2015
, the Company had retained servicing obligations for
$668 million
of long-term receivables, compared to
$496 million
of long-term receivables at
December 31, 2014
. Servicing obligations are limited to collection activities of sold accounts receivables and long-term receivables.
Credit Quality of Customer Financing Receivables and Allowance for Credit Losses
An aging analysis of financing receivables at
December 31, 2015
and
December 31, 2014
is as follows:
|
December 31, 2015
|
Total
Long-term Receivable |
Current Billed
Due |
Past Due Under 90 Days
|
Past Due Over 90 Days
|
|||||||||||
|
Municipal leases secured tax exempt
|
$
|
35
|
|
$
|
—
|
|
$
|
—
|
|
$
|
—
|
|
|||
|
Commercial loans and leases secured
|
25
|
|
1
|
|
1
|
|
1
|
|
|||||||
|
Total gross long-term receivables, including current portion
|
$
|
60
|
|
$
|
1
|
|
$
|
1
|
|
$
|
1
|
|
|||
81
|
December 31, 2014
|
Total
Long-term Receivable |
Past Due Over 90 Days
|
|||||
|
Municipal leases secured tax exempt
|
$
|
14
|
|
$
|
—
|
|
|
|
Commercial loans and leases secured
|
35
|
|
12
|
|
|||
|
Total gross long-term receivables, including current portion
|
$
|
49
|
|
$
|
12
|
|
|
The Company uses an internally developed credit risk rating system for establishing customer credit limits. This system is aligned with and comparable to the rating systems utilized by independent rating agencies.
The Company’s policy for valuing the allowance for credit losses is to review all customer financing receivables for collectibility on an individual receivable basis. For those receivables where collection risk is probable, the Company calculates the value of impairment based on the net present value of expected future cash flows from the customer.
The Company had a total of
$1 million
of financing receivables over 90 days past due as of
December 31, 2015
in relation to one loan. As of
December 31, 2015
, the Company is not accruing interest on this loan, and the past due amount is adequately reserved.
11. Commitments and Contingencies
Lease Obligations
The Company leases certain office, factory and warehouse space, land, and information technology and other equipment under principally non-cancelable operating leases. Rental expense, net of sublease income, for the years ended
December 31, 2015
,
2014
and
2013
was
$42 million
,
$62 million
, and
$51 million
, respectively.
At
December 31, 2015
, future minimum lease obligations, net of minimum sublease rentals, for the next five years and beyond are as follows:
|
(in millions)
|
2016
|
|
2017
|
|
2018
|
|
2019
|
|
2020
|
|
Beyond
|
|
||||||
|
$
|
67
|
|
$
|
57
|
|
$
|
48
|
|
$
|
42
|
|
$
|
37
|
|
$
|
233
|
|
|
Purchase Obligations
During the normal course of business, in order to manage manufacturing lead times and help ensure adequate component supply, the Company enters into agreements with contract manufacturers and suppliers that either allow them to procure inventory based upon criteria as defined by the Company or establish the parameters defining the Company’s requirements. In addition, we have entered into software license agreements which are firm commitments and are not cancelable. As of
December 31, 2015
, the Company had entered into firm, noncancelable, and unconditional commitments under such arrangements through
2017
. The Company expects to make total payments of
$73 million
under these arrangements as follows:
$57 million
in
2016
,
$14 million
in
2017
, and
$2 million
in
2018
.
The Company outsources certain corporate functions, such as benefit administration and information technology related services, under various contracts, the longest of which is expected to expire in
2019
. The remaining payments under these contracts are approximately
$246 million
over the remaining life of the contracts. However, these contracts can be terminated. Termination would result in a penalty substantially less than the remaining annual contract payments. The Company would also be required to find another source for these services, including the possibility of performing them in-house.
Legal
The Company is a defendant in various lawsuits, claims, and actions that arise in the normal course of business. While the outcome of these matters is currently not determinable, the Company does not expect the ultimate disposition of these matters to have a material adverse effect on the Company’s consolidated financial position, liquidity or results of operations.
Indemnifications
The Company is a party to a variety of agreements pursuant to which it is obligated to indemnify the other party with respect to certain matters. In indemnification cases, payment by the Company is conditioned on the other party making a claim pursuant to the procedures specified in the particular contract, which procedures typically allow the Company to challenge the other party's claims. In some instances, the Company may have recourse against third-parties for certain payments made by the Company.
Some of these obligations arise as a result of divestitures of the Company's assets or businesses and require the Company to indemnify the other party against losses arising from breaches of representations and warranties and covenants and, in some cases, the settlement of pending obligations. The Company's obligations under divestiture agreements for indemnification based on breaches of representations and warranties are generally limited in terms of duration, and for amounts for breaches of such representations and warranties in connection with prior divestitures not in excess of a percentage of the contract value. The Company had
no
pending claims at
December 31, 2015
.
82
In addition, the Company may provide indemnifications for losses that result from the breach of general warranties contained in certain commercial and intellectual property agreements. Historically, the Company has not made significant payments under these agreements.
12. Information by Segment and Geographic Region
The Company conducts its business globally and manages it through
two
segments:
Products:
The Products segment is comprised of Devices and Systems. Devices includes two-way portable and vehicle-mounted radios, accessories, software features, and upgrades. Systems includes the radio network core and central processing software, base stations, consoles, repeaters, and software applications and features. The primary customers of the Products segment are government, public safety and first-responder agencies, municipalities, and commercial and industrial customers who operate private communications networks and manage a mobile workforce. In
2015
, the segment’s net sales were
$3.7 billion
, representing
65%
of the Company's consolidated net sales.
Services:
The Services segment provides a full set of offerings for government, public safety and commercial communication networks including: (i) Integration services, (ii) Managed & Support services, and (iii) iDEN services. Integration services includes implementation, optimization, and integration of networks, devices, software, and applications. Managed & Support services includes a continuum of service offerings beginning with repair, technical support and hardware maintenance. More advanced offerings include network monitoring, software maintenance and cyber security services. Managed service offerings range from partial or full operation of customer owned networks to operation of Motorola Solutions owned networks. Services are provided across all radio network technologies, Command Center Consoles and Smart Public Safety Solutions. iDEN services consists primarily of hardware and software maintenance services for our legacy iDEN customers. In
2015
, the segment’s net sales were
$2.0 billion
, representing
35%
of the Company's consolidated net sales.
For the years ended
December 31, 2015
,
2014
and
2013
, no single customer accounted for more than
10%
of the Company's net sales.
Segment Information
|
|
Net Sales
|
Operating Earnings (Loss)
|
|||||||||||||||||||||
|
Years ended December 31
|
2015
|
2014
|
2013
|
2015
|
2014
|
2013
|
|||||||||||||||||
|
Products
|
$
|
3,676
|
|
$
|
3,807
|
|
$
|
4,109
|
|
$
|
704
|
|
$
|
(667
|
)
|
$
|
639
|
|
|||||
|
Services
|
2,019
|
|
2,074
|
|
2,118
|
|
290
|
|
(339
|
)
|
308
|
|
|||||||||||
|
$
|
5,695
|
|
$
|
5,881
|
|
$
|
6,227
|
|
994
|
|
(1,006
|
)
|
947
|
|
|||||||||
|
Total other expense
|
(77
|
)
|
(155
|
)
|
(67
|
)
|
|||||||||||||||||
|
Earnings (loss) from continuing operations before income taxes
|
|
|
|
$
|
917
|
|
$
|
(1,161
|
)
|
$
|
880
|
|
|||||||||||
|
|
Capital Expenditures
|
Depreciation Expense
|
|||||||||||||||||||||
|
Years ended December 31
|
2015
|
2014
|
2013
|
2015
|
2014
|
2013
|
|||||||||||||||||
|
Products
|
$
|
76
|
|
$
|
87
|
|
$
|
90
|
|
$
|
82
|
|
$
|
94
|
|
$
|
93
|
|
|||||
|
Services
|
99
|
|
94
|
|
79
|
|
60
|
|
75
|
|
64
|
|
|||||||||||
|
$
|
175
|
|
$
|
181
|
|
$
|
169
|
|
$
|
142
|
|
$
|
169
|
|
$
|
157
|
|
||||||
The Company's "chief operating decision maker" does not review or allocate resources based on segment assets.
Geographic Area Information
|
Net Sales
|
Assets
|
||||||||||||||||||||||
|
Years ended December 31
|
2015
|
2014
|
2013
|
2015
|
2014
|
2013*
|
|||||||||||||||||
|
United States
|
$
|
3,473
|
|
$
|
3,354
|
|
$
|
3,648
|
|
$
|
6,254
|
|
$
|
8,468
|
|
$
|
6,201
|
|
|||||
|
United Kingdom
|
96
|
|
128
|
|
112
|
|
1,127
|
|
966
|
|
1,607
|
|
|||||||||||
|
Other, net of eliminations
|
2,126
|
|
2,399
|
|
2,467
|
|
1,006
|
|
989
|
|
1,501
|
|
|||||||||||
|
|
$
|
5,695
|
|
$
|
5,881
|
|
$
|
6,227
|
|
$
|
8,387
|
|
$
|
10,423
|
|
$
|
9,309
|
|
|||||
* Excluding assets held for disposition
83
13. Reorganization of Businesses
The Company maintains a formal Involuntary Severance Plan (the “Severance Plan”), which permits the Company to offer eligible employees severance benefits based on years of service and employment grade level in the event that employment is involuntarily terminated as a result of a reduction-in-force or restructuring. The Severance Plan includes defined formulas to calculate employees’ termination benefits. In addition to the Involuntary Severance Plan, during the year ended December 31, 2013, the Company accepted voluntary applications to its Severance Plan from a defined subset of employees within the United States. Voluntary applicants received termination benefits based on the formulas defined in the Severance Plan. However, termination benefits, which are normally capped at six months of salary, were capped at a full year’s salary.
The Company recognizes termination benefits based on formulas per the Severance Plan at the point in time that future settlement is probable and can be reasonably estimated based on estimates prepared at the time a restructuring plan is approved by management. Exit costs consist of future minimum lease payments on vacated facilities and other contractual terminations. At each reporting date, the Company evaluates its accruals for employee separation and exit costs to ensure the accruals are still appropriate. In certain circumstances, accruals are no longer needed because of efficiencies in carrying out the plans or because employees previously identified for separation resigned from the Company and did not receive severance, or were redeployed due to circumstances not foreseen when the original plans were approved. In these cases, the Company reverses accruals through the consolidated statements of operations where the original charges were recorded when it is determined they are no longer needed.
During
2015
,
2014
, and
2013
the Company continued to implement various productivity improvement plans aimed at achieving long-term, sustainable profitability by driving efficiencies and reducing operating costs. Both of the Company’s segments were impacted by these plans. The employees affected were located in all geographic regions.
2015
Charges
During
2015
, the Company recorded net reorganization of business charges of
$117 million
, including
$9 million
of charges in Costs of sales and
$108 million
of charges in Other charges in the Company’s consolidated statements of operations. Included in the
$117 million
were charges of: (i)
$74 million
for employee separation costs, (ii)
$31 million
for the impairment of the corporate aircraft, (iii)
$10 million
for exit costs, and (iv) a
$6 million
building impairment charge, partially offset by
$4 million
of reversals of accruals no longer needed.
The following table displays the net charges incurred by segment:
|
Year ended December 31
|
2015
|
||
|
Products
|
$
|
84
|
|
|
Services
|
33
|
|
|
|
|
$
|
117
|
|
The following table displays a rollforward of the reorganization of businesses accruals established for exit costs and employee separation costs, including those related to discontinued operations which were maintained by the Company after the sale of the Enterprise business, from
January 1, 2015
to
December 31, 2015
:
|
Accruals at
January 1 |
Additional
Charges |
Adjustments
|
Amount
Used |
Accruals at
December 31 |
|||||||||||||||
|
Exit costs
|
$
|
—
|
|
$
|
10
|
|
$
|
—
|
|
$
|
(1
|
)
|
$
|
9
|
|
||||
|
Employee separation costs
|
57
|
|
74
|
|
(10
|
)
|
(70
|
)
|
51
|
|
|||||||||
|
|
$
|
57
|
|
$
|
84
|
|
$
|
(10
|
)
|
$
|
(71
|
)
|
$
|
60
|
|
||||
Exit Costs
At
January 1, 2015
, the Company had
no
accrual for exit costs attributable to lease terminations. There were
$10 million
of additional charges in
2015
. The
$1 million
used in
2015
reflects cash payments. The remaining accrual of
$9 million
, which was included in Accrued liabilities in the Company’s consolidated balance sheets at
December 31, 2015
, represented future cash payments, primarily for lease termination obligations.
Employee Separation Costs
At
January 1, 2015
, the Company had an accrual of
$57 million
for employee separation costs. The
2015
additional charges of
$74 million
represent severance costs for approximately an additional
1,100
employees, of which
200
were direct employees and
900
were indirect employees. The adjustments of
$10 million
reflect
$4 million
of reversals of accruals no longer needed and
$6 million
of reversals of accruals held for employees separated from discontinued operations. The
$70 million
used in
2015
reflects cash payments to severed employees. The remaining accrual of
$51 million
, which is included in Accrued liabilities in the Company’s consolidated balance sheet at
December 31, 2015
, is expected to be paid, generally, within one year to: (i) severed employees who have already begun to receive payments and (ii) approximately
300
employees to be separated in
2016
.
84
2014
Charges
During
2014
, the Company recorded net reorganization of business charges of
$73 million
, including
$9 million
of charges in Costs of sales and
$64 million
of charges under Other charges in the Company’s consolidated statements of operations. Included in the aggregate
$73 million
are charges of (i)
$67 million
for employee separation costs, and (ii)
$7 million
of charges for exit costs, partially offset by
$1 million
of reversals for accruals no longer needed.
The following table displays the net charges incurred by segment:
|
Year ended December 31
|
2014
|
||
|
Products
|
$
|
48
|
|
|
Services
|
25
|
|
|
|
|
$
|
73
|
|
The following table displays a rollforward of the reorganization of businesses accruals established for exit costs and employee separation costs, including those related to discontinued operations which were maintained by the Company after the sale of the Enterprise business, from
January 1, 2014
to
December 31, 2014
:
|
Accruals at
January 1 |
Additional
Charges |
Adjustments
|
Amount
Used |
Accruals at
December 31 |
|||||||||||||||
|
Exit costs
|
$
|
6
|
|
$
|
7
|
|
$
|
—
|
|
$
|
(13
|
)
|
$
|
—
|
|
||||
|
Employee separation costs
|
103
|
|
93
|
|
(4
|
)
|
(135
|
)
|
57
|
|
|||||||||
|
|
$
|
109
|
|
$
|
100
|
|
$
|
(4
|
)
|
$
|
(148
|
)
|
$
|
57
|
|
||||
Exit Costs
At
January 1, 2014
, the Company had an accrual of
$6 million
for exit costs attributable to lease terminations. There were
$7 million
of additional charges in
2014
. The
$13 million
used in
2014
reflects cash payments. There was
no
remaining accrual as of
December 31, 2014
.
Employee Separation Costs
At
January 1, 2014
, the Company had an accrual of
$103 million
for employee separation costs. The additional
2014
charges of
$93 million
represent severance costs for approximately an additional
1,200
employees, of which
300
were direct employees and
900
were indirect employees. The adjustments of
$4 million
reflect reversals of accruals no longer needed. The
$135 million
used in
2014
reflects cash payments to these separated employees, including
$50 million
related to employees of the Enterprise business and included in cash flow from discontinued operations. The remaining accrual of
$57 million
was included in Accrued liabilities in the Company’s consolidated balance sheet at
December 31, 2014
.
2013
Charges
The Company recorded net reorganization of business charges of
$86 million
, including
$16 million
of charges in Costs of sales and
$70 million
of charges in Other charges in the Company’s consolidated statements of operations. Included in the aggregate
$86 million
are charges of (i)
$94 million
for employee separation costs and (ii)
$2 million
of charges for exit costs, partially offset by
$10 million
of reversals for accruals no longer needed.
The following table displays the net charges incurred by segment:
|
Year ended December 31
|
2013
|
||
|
Products
|
$
|
57
|
|
|
Services
|
29
|
|
|
|
$
|
86
|
|
|
The following table displays a rollforward of the reorganization of businesses accruals established for exit costs and employee separation costs, including those related to discontinued operations which were maintained by the Company after the sale of the Enterprise business, from
January 1, 2013
to
December 31, 2013
:
|
Accruals at
January 1 |
Additional
Charges |
Adjustments
|
Amount
Used |
Accruals at
December 31 |
|||||||||||||||
|
Exit costs
|
$
|
4
|
|
$
|
3
|
|
$
|
—
|
|
$
|
(1
|
)
|
$
|
6
|
|
||||
|
Employee separation costs
|
31
|
|
146
|
|
(16
|
)
|
(58
|
)
|
103
|
|
|||||||||
|
|
$
|
35
|
|
$
|
149
|
|
$
|
(16
|
)
|
$
|
(59
|
)
|
$
|
109
|
|
||||
85
Exit Costs
At
January 1, 2013
, the Company had an accrual of
$4 million
for exit costs attributable to lease terminations. There were
$3 million
of additional charges in 2013. The
$1 million
used in
2013
reflects cash payments. The remaining accrual of
$6 million
, which was included in Accrued liabilities in the Company’s consolidated balance sheets at
December 31, 2013
, represented future cash payments, primarily for lease termination obligations.
Employee Separation Costs
At
January 1, 2013
, the Company had an accrual of
$31 million
for employee separation costs, representing the severance costs for approximately
400
employees. The additional
2013
charges of
$146 million
represent severance costs for approximately an additional
2,200
employees, of which
800
were direct employees and
1,400
were indirect employees. The adjustments of
$16 million
reflect accruals no longer required. The
$58 million
used in
2013
reflects cash payments to these separated employees, including
$20 million
related to employees of the Enterprise business and included in cash flow from discontinued operations. The remaining accrual of
$103 million
was included in Accrued liabilities in the Company’s consolidated balance sheet at
December 31, 2013
.
14. Intangible Assets and Goodwill
The Company accounts for acquisitions using purchase accounting with the results of operations for each acquiree included in the Company’s consolidated financial statements for the period subsequent to the date of acquisition. The pro forma effects of the acquisitions completed in
2015
,
2014
, and
2013
were not significant individually or in the aggregate. The Company did not have any significant acquisitions during the years ended
December 31, 2015
,
2014
, and
2013
.
Intangible Assets
Amortized intangible assets are comprised of the following:
|
|
2015
|
2014
|
|||||||||||||
|
December 31
|
Gross
Carrying Amount |
Accumulated
Amortization |
Gross
Carrying Amount |
Accumulated
Amortization |
|||||||||||
|
Intangible assets:
|
|||||||||||||||
|
Completed technology
|
$
|
60
|
|
$
|
32
|
|
$
|
37
|
|
$
|
27
|
|
|||
|
Patents
|
8
|
|
5
|
|
8
|
|
4
|
|
|||||||
|
Customer-related
|
23
|
|
10
|
|
15
|
|
8
|
|
|||||||
|
Other intangibles
|
20
|
|
15
|
|
17
|
|
15
|
|
|||||||
|
|
$
|
111
|
|
$
|
62
|
|
$
|
77
|
|
$
|
54
|
|
|||
Amortization expense on intangible assets, which is included within Other charges in the consolidated statements of operations, was
$8 million
,
$4 million
, and
$1 million
for the years ended
December 31, 2015
,
2014
, and
2013
, respectively. As of
December 31, 2015
, future amortization expense is estimated to be
$9 million
in
2016
and
2017
,
$8 million
in
2018
, and
$7 million
in
2019
, and
$4 million
in
2020
.
Amortized intangible assets, excluding goodwill, were comprised of the following by segment:
|
|
2015
|
2014
|
|||||||||||||
|
|
Gross
Carrying Amount |
Accumulated
Amortization |
Gross
Carrying Amount |
Accumulated
Amortization |
|||||||||||
|
Products
|
$
|
89
|
|
$
|
60
|
|
$
|
77
|
|
$
|
54
|
|
|||
|
Services
|
22
|
|
2
|
|
—
|
|
—
|
|
|||||||
|
|
$
|
111
|
|
$
|
62
|
|
$
|
77
|
|
$
|
54
|
|
|||
86
Goodwill
The following table displays a rollforward of the carrying amount of goodwill by segment from
January 1, 2014
to
December 31, 2015
:
|
Products
|
Services
|
Total
|
|||||||||
|
Balance as of January 1, 2014
|
|||||||||||
|
Aggregate goodwill acquired
|
$
|
249
|
|
$
|
112
|
|
$
|
361
|
|
||
|
Accumulated impairment losses
|
—
|
|
—
|
|
—
|
|
|||||
|
Goodwill, net of impairment losses
|
249
|
|
112
|
|
361
|
|
|||||
|
Goodwill acquired
|
15
|
|
7
|
|
22
|
|
|||||
|
Balance as of December 31, 2014
|
|||||||||||
|
Aggregate goodwill acquired/disposed
|
264
|
|
119
|
|
383
|
|
|||||
|
Accumulated impairment losses
|
—
|
|
—
|
|
—
|
|
|||||
|
Goodwill, net of impairment losses
|
264
|
|
119
|
|
383
|
|
|||||
|
Goodwill acquired
|
6
|
|
31
|
|
37
|
|
|||||
|
Balance as of December 31, 2015
|
|||||||||||
|
Aggregate goodwill acquired
|
270
|
|
150
|
|
420
|
|
|||||
|
Accumulated impairment losses
|
—
|
|
—
|
|
—
|
|
|||||
|
Goodwill, net of impairment losses
|
$
|
270
|
|
$
|
150
|
|
$
|
420
|
|
||
On December 31, 2013, the Company completed the acquisition of a communication software provider in push-to-talk-over-broadband applications for a gross purchase price of
$48 million
. As a result of the acquisition, the Company recognized
$22 million
of goodwill and
$20 million
of identifiable intangible assets in 2014 when the purchase accounting was completed.
On November 18, 2014, the Company completed the acquisition of an equipment provider for a purchase price of
$22 million
. During the nine months ended October 3, 2015, the Company completed the purchase accounting for this acquisition, recognizing
$6 million
of goodwill and
$12 million
of identifiable intangible assets. These identifiable intangible assets were classified as completed technology to be amortized over
five
years.
During the year ended
December 31, 2015
, the Company completed the acquisitions of
two
providers of public safety software-based solutions for an aggregate purchase price of
$50 million
, recognizing an additional
$31 million
of goodwill,
$22 million
of identifiable intangible assets, and
$3 million
of acquired liabilities related to these acquisitions. The
$22 million
of identifiable intangible assets were classified as: (i)
$11 million
completed technology, (ii)
$8 million
customer-related, and (iii)
$3 million
of other intangibles. These intangible assets will be amortized over periods ranging from
five
to
ten
years.
The results of operations for these acquisitions have been included in the Company’s consolidated statements of operations subsequent to the acquisition date. The pro forma effects of these acquisitions are not significant individually or in the aggregate.
On February 19, 2016, we completed the acquisition of
100%
of the equity interest in Guardian Digital Communications Limited ("GDCL"), a holding company of Airwave Solutions Limited ("Airwave"), the largest private operator of a public safety network in the world. For the purposes of purchase accounting, the net purchase price was
$1.1 billion
, taking into account approximately
$1 billion
of net cash paid at closing and approximately
$90 million
of deferred consideration which will be due on November 15, 2018. The acquisition of Airwave enables the Company to grow revenue and geographically diversify its global Managed & Support services offerings within its Services segment, while offering a proven service delivery platform to build on for providing innovative, leading, mission-critical communications solutions and services to customers. As of the date of issuance of the Company's financial statements, the purchase accounting has not been completed.
The Company conducts its annual assessment of goodwill for impairment in the fourth quarter of each year. The goodwill impairment assessment is performed at the reporting unit level. A reporting unit is an operating segment or one level below an operating segment. The Company has determined that the Products segment and Services segment each meet the definition of a reporting unit.
The Company performed a qualitative assessment to determine whether it was more-likely-than-not that the fair value of each reporting unit was less than its carrying amount for the fiscal years
2015
,
2014
, and
2013
. In performing this qualitative assessment the Company assessed relevant events and circumstances including macroeconomic conditions, industry and market conditions, cost factors, overall financial performance, changes in share price, and entity-specific events. For fiscal years
2015
,
2014
, and
2013
, the Company concluded it was more-likely-than-not that the fair value of each reporting unit exceeded its carrying value. Therefore, the two-step goodwill impairment test was not required and there was
no
impairment of goodwill.
87
15. Valuation and Qualifying Accounts
The following table presents the valuation and qualifying account activity for the years ended
December 31, 2015
,
2014
, and
2013
:
|
Balance at
January 1 |
Charged to
Earnings |
Used
|
Adjustments*
|
Balance at
December 31 |
|||||||||||||||
|
2015
|
|||||||||||||||||||
|
Allowance for doubtful accounts
|
$
|
35
|
|
$
|
9
|
|
$
|
(17
|
)
|
$
|
1
|
|
$
|
28
|
|
||||
|
Inventory reserves
|
131
|
|
24
|
|
(13
|
)
|
—
|
|
142
|
|
|||||||||
|
2014
|
|||||||||||||||||||
|
Allowance for doubtful accounts
|
53
|
|
19
|
|
(35
|
)
|
(2
|
)
|
35
|
|
|||||||||
|
Inventory reserves
|
125
|
|
24
|
|
(15
|
)
|
(3
|
)
|
131
|
|
|||||||||
|
2013
|
|||||||||||||||||||
|
Allowance for doubtful accounts
|
50
|
|
13
|
|
(8
|
)
|
(2
|
)
|
53
|
|
|||||||||
|
Inventory reserves
|
112
|
|
25
|
|
(14
|
)
|
2
|
|
125
|
|
|||||||||
*
Adjustments include translation adjustments
88
16. Quarterly and Other Financial Data (unaudited)
|
|
2015
|
2014
|
|||||||||||||||||||||||||||||
|
|
1st
|
2nd
|
3rd
|
4th
|
1st
|
2nd
|
3rd
|
4th
|
|||||||||||||||||||||||
|
Operating Results
|
|||||||||||||||||||||||||||||||
|
Net sales
|
$
|
1,223
|
|
$
|
1,368
|
|
$
|
1,422
|
|
$
|
1,682
|
|
$
|
1,228
|
|
$
|
1,393
|
|
$
|
1,436
|
|
$
|
1,824
|
|
|||||||
|
Costs of sales
|
675
|
|
720
|
|
737
|
|
844
|
|
651
|
|
737
|
|
751
|
|
911
|
|
|||||||||||||||
|
Gross margin
|
548
|
|
648
|
|
685
|
|
838
|
|
577
|
|
656
|
|
685
|
|
913
|
|
|||||||||||||||
|
Selling, general and administrative expenses
|
256
|
|
254
|
|
259
|
|
252
|
|
307
|
|
308
|
|
287
|
|
282
|
|
|||||||||||||||
|
Research and development expenditures
|
159
|
|
156
|
|
153
|
|
152
|
|
174
|
|
176
|
|
166
|
|
165
|
|
|||||||||||||||
|
Other charges
|
14
|
|
(16
|
)
|
42
|
|
44
|
|
(11
|
)
|
34
|
|
25
|
|
1,924
|
|
|||||||||||||||
|
Operating earnings (loss)
|
119
|
|
254
|
|
231
|
|
390
|
|
107
|
|
138
|
|
207
|
|
(1,458
|
)
|
|||||||||||||||
|
Earnings (loss) from continuing operations*
|
87
|
|
150
|
|
126
|
|
277
|
|
85
|
|
78
|
|
66
|
|
(926
|
)
|
|||||||||||||||
|
Net earnings*
|
74
|
|
142
|
|
115
|
|
279
|
|
127
|
|
824
|
|
147
|
|
201
|
|
|||||||||||||||
|
Per Share Data (in dollars)
|
|||||||||||||||||||||||||||||||
|
Earnings (loss) from Continuing operations*:
|
|||||||||||||||||||||||||||||||
|
Basic earnings (loss) per common share
|
$
|
0.40
|
|
$
|
0.72
|
|
$
|
0.63
|
|
$
|
1.58
|
|
$
|
0.33
|
|
$
|
0.31
|
|
$
|
0.27
|
|
$
|
(4.02
|
)
|
|||||||
|
Diluted earnings (loss) per common share
|
0.40
|
|
0.72
|
|
0.63
|
|
1.56
|
|
0.33
|
|
0.30
|
|
0.27
|
|
(4.02
|
)
|
|||||||||||||||
|
Net earnings*:
|
|||||||||||||||||||||||||||||||
|
Basic earnings per common share
|
$
|
0.34
|
|
$
|
0.68
|
|
$
|
0.58
|
|
$
|
1.60
|
|
$
|
0.50
|
|
$
|
3.25
|
|
$
|
0.60
|
|
$
|
0.87
|
|
|||||||
|
Diluted earnings per common share
|
0.34
|
|
0.68
|
|
0.57
|
|
1.57
|
|
0.49
|
|
3.22
|
|
0.59
|
|
0.87
|
|
|||||||||||||||
|
Dividends declared
|
$
|
0.34
|
|
$
|
0.34
|
|
$
|
0.34
|
|
$
|
0.41
|
|
$
|
0.31
|
|
$
|
0.31
|
|
$
|
0.34
|
|
$
|
0.34
|
|
|||||||
|
Dividends paid
|
0.34
|
|
0.34
|
|
0.34
|
|
0.34
|
|
0.31
|
|
0.31
|
|
0.31
|
|
0.34
|
|
|||||||||||||||
|
Stock prices
|
|||||||||||||||||||||||||||||||
|
High
|
$
|
70.00
|
|
$
|
62.53
|
|
$
|
69.61
|
|
$
|
72.45
|
|
$
|
67.11
|
|
$
|
67.80
|
|
$
|
67.41
|
|
$
|
67.87
|
|
|||||||
|
Low
|
$
|
62.41
|
|
$
|
57.14
|
|
$
|
56.79
|
|
$
|
65.24
|
|
$
|
62.72
|
|
$
|
62.50
|
|
$
|
58.89
|
|
$
|
58.50
|
|
|||||||
* Amounts attributable to Motorola Solutions, Inc. common shareholders.
89
None.
Evaluation of Disclosure Controls and Procedures.
Under the supervision and with the participation of our senior management, including our chief executive officer and chief financial officer, we conducted an evaluation of the effectiveness of the design and operation of our disclosure controls and procedures, as defined in Rules 13a-15(e) and 15d-15(e) under the Securities Exchange Act of 1934, as amended (the “Exchange Act”), as of the end of the period covered by this annual report (the “Evaluation Date”). Based on this evaluation, our chief executive officer and chief financial officer concluded as of the Evaluation Date that our disclosure controls and procedures were effective such that the information relating to Motorola Solutions, including our consolidated subsidiaries, required to be disclosed in our Securities and Exchange Commission (“SEC”) reports (i) is recorded, processed, summarized and reported within the time periods specified in SEC rules and forms, and (ii) is accumulated and communicated to Motorola Solutions’ management, including our chief executive officer and chief financial officer, as appropriate to allow timely decisions regarding required disclosure.
Management’s Report on Internal Control Over Financial Reporting.
Motorola Solutions’ management is responsible for establishing and maintaining adequate internal control over financial reporting as such term is defined in Rule 13a-15(f) of the Exchange Act. Under the supervision and with the participation of our senior management, including our chief executive officer and chief financial officer, we assessed the effectiveness of our internal control over financial reporting as of
December 31, 2015
, using the criteria set forth in the
Internal Control—Integrated Framework (2013)
issued by the Committee of Sponsoring Organizations of the Treadway Commission (COSO). Based on this assessment, management has concluded that our internal control over financial reporting is effective as of
December 31, 2015
. The Company’s independent registered public accounting firm, KPMG LLP, has issued a report on the Company’s internal control over financial reporting. The report on the audit of internal control over financial reporting appears in this Form 10-K.
Changes in Internal Control Over Financial Reporting.
There have been no changes in our internal control over financial reporting that occurred during the quarter ended
December 31, 2015
, that have materially affected or are reasonably likely to materially affect our internal control over financial reporting.
We previously were in the process of a multi-year phased upgrade and consolidation of our enterprise resource planning (“ERP”) systems into a single global platform across our businesses. With the sale of the Enterprise business which included the transfer of our existing ERP system to Zebra, we have entered into transition service agreements which require us to operate in a shared information technology environment with Zebra until 2017. We are completing the design phase for the initial release of our future ERP system and have begun system integration testing. There will be two phases of our move to the new ERP. Phase one is scheduled to go-live in the third quarter of 2016 and will allow us to cease using the Zebra transition services agreement. Phase one also includes the replacement of regional systems supporting our product based business and the current indirect procurement system. Phase two is targeted for release in the first quarter of 2017 and will address the consolidation of our projects based business.
None.
90
REPORT OF INDEPENDENT REGISTERED PUBLIC ACCOUNTING FIRM
The Board of Directors and Stockholders
Motorola Solutions, Inc.:
We have audited Motorola Solutions, Inc.’s internal control over financial reporting as of December 31,
2015
, based on criteria established in Internal Control - Integrated Framework (2013) issued by the Committee of Sponsoring Organizations of the Treadway Commission (COSO). Motorola Solutions, Inc.’s management is responsible for maintaining effective internal control over financial reporting and for its assessment of the effectiveness of internal control over financial reporting, included in the accompanying Management’s Report on Internal Control Over Financial Reporting in Item 9A: Controls and Procedures. Our responsibility is to express an opinion on the Company’s internal control over financial reporting based on our audit.
We conducted our audit in accordance with the standards of the Public Company Accounting Oversight Board (United States). Those standards require that we plan and perform the audit to obtain reasonable assurance about whether effective internal control over financial reporting was maintained in all material respects. Our audit included obtaining an understanding of internal control over financial reporting, assessing the risk that a material weakness exists, and testing and evaluating the design and operating effectiveness of internal control based on the assessed risk. Our audit also included performing such other procedures as we considered necessary in the circumstances. We believe that our audit provides a reasonable basis for our opinion.
A company’s internal control over financial reporting is a process designed to provide reasonable assurance regarding the reliability of financial reporting and the preparation of financial statements for external purposes in accordance with generally accepted accounting principles. A company’s internal control over financial reporting includes those policies and procedures that (1) pertain to the maintenance of records that, in reasonable detail, accurately and fairly reflect the transactions and dispositions of the assets of the company; (2) provide reasonable assurance that transactions are recorded as necessary to permit preparation of financial statements in accordance with generally accepted accounting principles, and that receipts and expenditures of the company are being made only in accordance with authorizations of management and directors of the company; and (3) provide reasonable assurance regarding prevention or timely detection of unauthorized acquisition, use, or disposition of the company’s assets that could have a material effect on the financial statements.
Because of its inherent limitations, internal control over financial reporting may not prevent or detect misstatements. Also, projections of any evaluation of effectiveness to future periods are subject to the risk that controls may become inadequate because of changes in conditions, or that the degree of compliance with the policies or procedures may deteriorate.
In our opinion, Motorola Solutions, Inc. maintained, in all material respects, effective internal control over financial reporting as of December 31,
2015
, based on criteria established in Internal Control - Integrated Framework (2013) issued by the Committee of Sponsoring Organizations of the Treadway Commission.
We also have audited, in accordance with the standards of the Public Company Accounting Oversight Board (United States), the consolidated balance sheets of Motorola Solutions, Inc. and Subsidiaries as of December 31,
2015
and
2014
, and the related consolidated statements of operations, comprehensive income, stockholders’ equity, and cash flows for each of the years in the three-year period ended December 31,
2015
, and our report dated
February 22, 2016
expressed an unqualified opinion on those consolidated financial statements.

Chicago, Illinois
February 22, 2016
91
The response to this Item required by Item 401 of Regulation S-K, with respect to directors, incorporates by reference the information under the caption “
2016
Director Nominees” of Motorola Solutions’ Proxy Statement for the
2016
Annual Meeting of Stockholders (the “Proxy Statement”) and, with respect to executive officers, is contained in Part I hereof under the caption “Executive Officers of the Registrant” and, with respect to the audit committee, incorporates by reference the information under the caption “Corporate Governance - Committees of the Board” and “Audit Committee Matters - Report of Audit Committee” of the Proxy Statement.
The response to this Item required by Item 405 of Regulation S-K incorporates by reference the information under the caption “Security Ownership Information-Section 16 (a) Beneficial Ownership Reporting Compliance” of the Proxy Statement.
The response to this Item also incorporates by reference the information under the caption “Important Dates for the
2017
Annual Meeting - Recommending a Director Candidate to the Governance and Nominating Committee” of the Proxy Statement.
Motorola Solutions has adopted a code of ethics, the Motorola Solutions Code of Business Conduct (the “Code”), that applies to all employees, including the Company’s principal executive officer, principal financial officer and controller (principal accounting officer). The Code is posted on Motorola Solutions’ Internet website, www.motorolasolutions.com/investors, and is available free of charge, upon request to Investor Relations, Motorola Solutions, Inc., Corporate Offices, 1303 East Algonquin Road, Schaumburg, Illinois 60196, E-mail: investors@motorolasolutions.com. Any amendment to, or waiver from, the Code applicable to executive officers will be posted on our Internet website within four business days following the date of the amendment or waiver. Motorola Solutions’ Code of Business Conduct applies to all of the Company’s employees worldwide, without exception, and describes employee responsibilities to the various stakeholders involved in our business. The Code goes beyond the legal minimums by implementing the values we share as employees of Motorola Solutions—our key beliefs—uncompromising integrity and constant respect for people. The Code places special responsibility on managers and prohibits retaliation for reporting issues.
Item 11
.
Executive Compensation
The response to this Item incorporates by reference the information under the captions "Director Compensation - Determining Director Compensation - How the Directors are Compensated,” "Compensation Discussion and Analysis," "Compensation and Leadership Committee Report,” "Compensation and Leadership Committee Interlocks and Insider Participation," and under “Named Executive Officer Compensation," the following subsections: "
2015
Summary Compensation Table,” "Grants of Plan-Based Awards in
2015
," “Outstanding Equity Awards at
2015
Fiscal Year-End,” “Option Exercises and Stock Vested in
2015
,” "Nonqualified Deferred Compensation in
2015
,” "Retirement Plans," "Pension Benefits in
2015
," "Employment Contracts," and "Termination of Employment and Change in Control Arrangements," of the Proxy Statement.
Item 12
.
Security Ownership of Certain Beneficial Owners and Management and Related Stockholder Matters
The response to this Item incorporates by reference the information under the captions “Equity Compensation Plan Information” and “Security Ownership Information” of the Proxy Statement.
Item 13
.
Certain Relationships and Related Transactions, and Director Independence
The response to this Item incorporates by reference the relevant information under the caption “Corporate Governance - Related Person Transaction Policy and Procedures” and “Independent Directors” of the Proxy Statement.
Item 14
.
Principal Accounting Fees and Services
The response to this Item incorporates by reference the information under the caption “Audit Committee Matters - Independent Registered Public Accounting Firm Fees” and “Audit Committee Matters - Audit Committee Pre-Approval Policies” of the Proxy Statement.
92
Item 15
.
Exhibits, Financial Statement Schedules
|
(a)
|
1. Financial Statements
|
See Part II, Item 8 hereof.
|
2.
|
Financial Statement Schedules and Independent Auditors’ Report
|
All schedules omitted are inapplicable or the information required is shown in the consolidated financial statements or notes thereto.
|
3.
|
Exhibits
|
Exhibits required to be attached by Item 601 of Regulation S-K are listed in the Exhibit Index attached hereto, which is incorporated herein by this reference. Exhibit numbers 10.7 through 10.71, listed in the attached Exhibit Index, are management contracts or compensatory plans or arrangements required to be filed as exhibits to this form by Item 15(b) hereof.
|
(b)
|
Exhibits:
|
See Item 15(a)3 above.
93
CONSENT OF INDEPENDENT REGISTERED PUBLIC ACCOUNTING FIRM
The Board of Directors
Motorola Solutions, Inc.:
We consent to the incorporation by reference in the registration statements on Form S-8 (Nos. 033-59285, 333-51847, 333-36308, 333-53120, 333-60560, 333-60612, 333-87728, 333-105107, 333-123879, 333-133736, 333-142845, 333-160137, and 333-204324) and S-3 (Nos. 333-76637, 333-36320, 333-206451, and 333-208332) of Motorola Solutions, Inc. of our reports dated
February 22, 2016
, with respect to the consolidated balance sheets of Motorola Solutions, Inc. and Subsidiaries as of December 31,
2015
and
2014
, and the related consolidated statements of operations, comprehensive income, stockholders’ equity, and cash flows for each of the years in the three-year period ended December 31,
2015
, and the effectiveness of internal control over financial reporting as of December 31,
2015
, which reports appear in the December 31,
2015
annual report on Form 10-K of Motorola Solutions, Inc.
Chicago, Illinois
February 22, 2016
94
SIGNATURES
Pursuant to the requirements of Section 13 or 15(d) of the Securities Exchange Act of 1934, Motorola Solutions, Inc. has duly caused this report to be signed on its behalf by the undersigned, thereunto duly authorized.
|
MOTOROLA SOLUTIONS, INC.
|
||
|
By:
|
/
S
/ G
REGORY
Q. B
ROWN
|
|
|
Gregory Q. Brown
|
||
|
Chairman and Chief Executive Officer
|
||
February 22, 2016
Pursuant to the requirements of the Securities Exchange Act of 1934, this report has been signed below by the following persons on behalf of Motorola Solutions, Inc. and in the capacities and on the dates indicated.
|
Signature
|
|
Title
|
Date
|
|
|
/S/ GREGORY Q. BROWN
|
Chairman and Chief Executive Officer
|
February 22, 2016
|
||
|
Gregory Q. Brown
|
|
and Director
(Principal Executive Officer)
|
||
|
/S/ GINO A. BONANOTTE
|
|
Executive Vice President and
|
February 22, 2016
|
|
|
Gino A. Bonanotte
|
Chief Financial Officer
(Principal Financial Officer)
|
|||
|
/S/ JOHN K. WOZNIAK
|
|
Corporate Vice President and
|
February 22, 2016
|
|
|
John K. Wozniak
|
Chief Accounting Officer
(Principal Accounting Officer)
|
|||
|
/S/ KENNETH C. DAHLBERG
|
|
Director
|
February 22, 2016
|
|
|
Kenneth C. Dahlberg
|
||||
|
/S/ EGON P. DURBAN
|
Director
|
February 22, 2016
|
||
|
Egon P. Durban
|
||||
|
/S/ MICHAEL V. HAYDEN
|
|
Director
|
February 22, 2016
|
|
|
Michael V. Hayden
|
||||
|
/S/ CLAYTON M. JONES
|
Director
|
February 22, 2016
|
||
|
Clayton M. Jones
|
||||
|
/S/ JUDY C. LEWENT
|
|
Director
|
February 22, 2016
|
|
|
Judy C. Lewent
|
||||
|
/S/ GREGORY K. MONDRE
|
Director
|
February 22, 2016
|
||
|
Gregory K. Mondre
|
||||
|
/S/ ANNE R. PRAMAGGIORE
|
|
Director
|
February 22, 2016
|
|
|
Anne R. Pramaggiore
|
||||
|
/S/ SAMUEL C. SCOTT III
|
|
Director
|
February 22, 2016
|
|
|
Samuel C. Scott III
|
||||
|
/S/ BRADLEY E. SINGER
|
|
Director
|
February 22, 2016
|
|
|
Bradley E. Singer
|
||||
95
EXHIBIT INDEX
|
2.1
|
Master Acquisition Agreement, dated April 14, 2014, by and between Motorola Solutions, Inc. and Zebra Technologies, Inc. (incorporated by reference to Exhibit 2.1 to Motorola Solutions’ Current Report on Form 8-K filed on April 16, 2014 (File No. 1-7221)).
|
||
|
2.2
|
Share Purchase Agreement, dated December 3, 2015, by and between Motorola Solutions, Inc., Motorola Solutions UK Acquisition Company Limited (as successor by novation from Motorola Solutions Overseas Limited), and Guardian Digital Communications Holdings Limited (incorporated by reference to Exhibit 1.1 to Motorola Solutions’ Current Report on 8-K filed on December 3, 2015 (File 1-17221)).
|
||
|
3.1 (a)
|
Restated Certificate of Incorporation of Motorola, Inc., as amended through May 5, 2009 (incorporated by reference to Exhibit 3(i)(b) to Motorola, Inc.’s Quarterly Report on Form 10-Q for the fiscal quarter ended July 4, 2009 (File No. 1-7221)).
|
||
|
3.1 (b)
|
Certificate of Amendment to the Restated Certificate of Incorporation of Motorola, Inc., effective January 4, 2011, as filed with the Secretary of State of the State of Delaware (incorporated by reference to Exhibit 3.1 to Motorola Solutions’ Current Report on Form 8-K filed on January 10, 2011 (File No. 1-7221)).
|
||
|
3.1 (c)
|
Certificate of Ownership and Merger merging Motorola Name Change Corporation into Motorola, Inc., effective January 4, 2011, as filed with the Secretary of State of the State of Delaware (incorporated by reference to Exhibit 3.2 to Motorola Solutions’ Current Report on Form 8-K filed on January 10, 2011 (File No. 1-7221)).
|
||
|
3.2
|
Amended and Restated Bylaws of Motorola Solutions, Inc. as of November 13, 2014 (incorporated by reference to Exhibit 3.1 to Motorola Solutions’ Current Report on Form 8-K filed on November 14, 2014 (File No. 1-7221)).
|
||
|
4.1 (a)
|
Senior Indenture, dated as of May 1, 1995, between The Bank of New York Mellon Trust Company, N.A. (as successor Trustee to JPMorgan Chase Bank (as successor in interest to Bank One Trust Company) and BNY Midwest Trust Company (as successor in interest to Harris Trust and Savings Bank) and Motorola, Inc. (incorporated by reference to Exhibit 4(d) of the Registrant’s Registration Statement on Form S-3 dated September 25, 1995 (Registration No. 33-62911)).
|
||
|
4.1 (b)
|
Instrument of Resignation, Appointment and Acceptance, dated as of January 22, 2001, among Motorola, Inc., Bank One Trust Company, N.A. and BNY Midwest Trust Company (as successor in interest to Harris Trust and Savings Bank) (incorporated by reference to Exhibit 4.2(b) to Motorola, Inc.’s Annual Report on Form 10-K for the fiscal year ended December 31, 2000 (File No. 1-7221)).
|
||
|
4.1 (c)
|
Indenture dated as of August 19, 2014 between Motorola Solutions, Inc. and The Bank of New York Mellon Trust Company, N.A., as trustee. (incorporated by reference to Exhibit 4.1 to Motorola Solutions’ Current Report on Form 8-K filed on August 19, 2014 (File No. 1-7221)).
|
||
|
4.1 (d)
|
Indenture dated as of August 25, 2015 between Motorola Solutions, Inc. and The Bank of New York Mellon Trust Company, N.A., as Trustee, related to 2% Convertible Senior Notes Due 2020 (incorporated by reference to Exhibit 10.1 to Motorola Solutions’ Current Report on Form 8-K filed on August 26, 2015 (File No. 1-7221)).
|
||
|
Certain instruments defining the rights of holders of long-term debt of Motorola, Inc. and of all its subsidiaries for which consolidated or unconsolidated financial statements are required to be filed are being omitted pursuant to paragraph (b)(4)(iii)(A) of Item 601 of Regulation S-K. Motorola Solutions agrees to furnish a copy of any such instrument to the Commission upon request.
|
|||
|
10.1
|
Amended and Restated Master Separation and Distribution Agreement among Motorola Mobility Holdings, Inc. (f/k/a Motorola SpinCo Holdings Corporation), Motorola Mobility, Inc. and Motorola, Inc. effective as of July 31, 2010 (incorporated by reference to Exhibit 2.1 to Amendment No. 1 to the Form 10 Registration Statement filed on August 31, 2010 by Motorola Mobility Holdings, Inc. (formerly Motorola SpinCo Holdings Corporation) (File No. 1-34805)).
|
||
|
10.2
|
Amended and Restated Intellectual Property License Agreement between Motorola Mobility, Inc. and Motorola, Inc. effective as of July 31, 2010 (incorporated by reference to Exhibit 10.2 to Amendment No. 1 to the Form 10 Registration Statement filed on August 31, 2010 by Motorola Mobility Holdings, Inc. (formerly Motorola SpinCo Holdings Corporation (File No. 1-34805)).
|
||
|
10.3
|
Amended and Restated Exclusive License Agreement between Motorola Trademark Holdings, LLC and Motorola, Inc. effective as of July 30, 2010 (incorporated by reference to Exhibit 10.3 to Amendment No. 3 to the Form 10 Registration Statement filed on November 12, 2010 by Motorola Mobility Holdings, Inc. (File No. 1-34805)).
|
||
|
10.4
|
Tax Sharing Agreement among Motorola Mobility Holdings, Inc. (f/k/a Motorola SpinCo Holdings Corporation), Motorola Mobility, Inc. and Motorola, Inc. effective as of July 31, 2010 (incorporated by reference to Exhibit 10.4 to Amendment No. 1 to the Form 10 Registration Statement filed on August 31, 2010 by Motorola Mobility Holdings, Inc. (formerly Motorola SpinCo Holdings Corporation) (File No. 1-34805)).
|
||
|
10.5
|
Amended and Restated Employee Matters Agreement among Motorola Mobility Holdings, Inc. (f/k/a Motorola SpinCo Holdings Corporation), Motorola Mobility, Inc. and Motorola, Inc. effective as of July 31, 2010 (incorporated by reference to Exhibit 10.7 to Amendment No. 2 to the Form 10 Registration Statement filed on October 8, 2010 by Motorola Mobility Holdings, Inc. (formerly Motorola SpinCo Holdings Corporation (File No. 1-34805)).
|
||
|
10.6
|
Stock Purchase Agreement, dated as of November 4, 2014, by and among Motorola Solutions, Inc. and ValueAct (incorporated by reference to Exhibit 10.1 to Motorola Solutions’ Current Report on Form 8-K filed on November 5, 2014 (File No. 1-7221)).
|
||
|
10.7
|
Motorola Solutions Omnibus Incentive Plan of 2015, effective May 18, 2015 (an amendment and restatement of the Motorola Solutions Omnibus Incentive Plan of 2006) (incorporated by reference to Exhibit 10.1 to Motorola Solutions’ Current Report on Form 8-K filed on May 21, 2015 (file No. 1-7221)).
|
||
|
10.8
|
Form of Motorola Solutions, Inc. Performance Option Award Agreement for grants to Section 16 Officers on or after March 9, 2015 (incorporated by reference to Exhibit 10.1 to Motorola Solutions’ Current Report on Form 8-K filed on March 11, 2015 (File No. 1-7221)).
|
||
96
|
10.9
|
Form of Performance Option Award Agreement (non-CEO) (incorporated by reference to Exhibit 10.3 to Motorola Solutions’ Current Report on Form 8-K filed on August 26, 2015 (File No. 1-7221)).
|
||
|
10.10
|
Form of Motorola Solutions, Inc. Award Document-Terms and Conditions Related to Employee Nonqualified Stock Options for grants to Section 16 Officers on or after May 6, 2013 (incorporated by reference to Exhibit 10.2 to Motorola Solutions’ Quarterly Report on Form 10-Q for the fiscal quarter ended June 30, 2013 (File No. 1-7221)).
|
||
|
10.11
|
Form of Motorola Solutions Inc. Award Document-Terms and Conditions Related to Employee Nonqualified Stock Options relating to the Motorola Solutions Omnibus Incentive Plan of 2006 for grants on or after February 3, 2014 (incorporated by reference to Exhibit 10.9 to Motorola Solutions’ Annual Report on Form 10-K for the fiscal year ended December 31, 2013 (File No. 1-7221)).
|
||
|
10.12
|
Form of Motorola Solutions Inc. Award Document-Terms and Conditions Related to Employee Nonqualified Stock Options relating to the Motorola Solutions Omnibus Incentive Plan of 2006 for grants on or after January 4, 2011 (incorporated by reference to Exhibit 10.11 to Motorola Solutions’ Annual Report on Form 10-K for the fiscal year ended December 31, 2010 (File No. 1-7221)).
|
||
|
10.13
|
Form of Motorola, Inc. Award Document-Terms and Conditions Related to Employee Nonqualified Stock Options relating to the Motorola Solutions Omnibus Incentive Plan of 2006 for grants from August 1, 2009 to January 3, 2011 (incorporated by reference to Exhibit 10.1 to Motorola Inc.’s Quarterly Report on Form 10-Q for the fiscal quarter ended July 4, 2009 (File No. 1-7221)).
|
||
|
10.14
|
Form of Motorola, Inc. Award Document-Terms and Conditions Related to Employee Nonqualified Stock Options relating to the Motorola Solutions Omnibus Incentive Plan of 2006 for grants from May 6, 2008 to August 1, 2009 (incorporated by reference to Exhibit 10.54 to Motorola Inc.’s Quarterly Report on Form 10-Q for the fiscal quarter ended March 29, 2008 (File No. 1-7221)).
|
||
|
10.15
|
Form of Motorola, Inc. Award Document-Terms and Conditions Related to Employee Nonqualified Stock Options relating to the Motorola Solutions Omnibus Incentive Plan of 2006 for grants from February 11, 2007 to May 4, 2008 (incorporated by reference to Exhibit 10.37 to Motorola Inc.’s Current Report on Form 8-K filed on February 15, 2007 (File No. 1-7221)).
|
||
|
10.16
|
Form of Motorola Solutions Stock Option Consideration Agreement for grants on or after February 3, 2014 (incorporated by reference to Exhibit 10.14 to Motorola Solutions’ Annual Report on Form 10-K for the fiscal year ended December 31, 2013 (File No. 1-7221)).
|
||
|
10.17
|
Form of Motorola Solutions Stock Option Consideration Agreement for grants from January 4, 2011 to February 2, 2014 (incorporated by reference to Exhibit 10.15 to Motorola Solutions’ Annual Report on Form 10-K for the fiscal year ended December 31, 2010 (File No. 1-7221)).
|
||
|
10.18
|
Form of Motorola, Inc. Stock Option Consideration Agreement for grants from May 6, 2008 to January 3, 2011 (incorporated by reference to Exhibit 10.56 to Motorola Inc.’s Quarterly Report on Form 10-Q for the fiscal quarter ended March 29, 2008 (File No. 1-7221)).
|
||
|
10.19
|
Form of Motorola, Inc. Stock Option Consideration Agreement for grants from February 27, 2007 to May 5, 2008 (incorporated by reference to Exhibit 10.4 to Motorola Inc.’s Annual Report on Form 10-K for the fiscal year ended December 31, 2006 (File No. 1-7221)).
|
||
|
10.20
|
Form of Motorola Solutions, Inc. Market Stock Unit Agreement for grants to Section 16 Officers on or after March 9, 2015 (incorporated by reference to Exhibit 10.2 to Motorola Solutions’ Current Report on Form 8-K filed on March 11, 2015 (File No. 1-7221)).
|
||
|
10.21
|
Form of Motorola Solutions, Inc. Restricted Stock Unit Agreement relating to the Motorola Solutions Omnibus Incentive Plan of 2006 for grants to Section 16 Officers on or after May 6, 2013 (incorporated by reference to Exhibit 10.1 to Motorola Inc’s Quarterly Report on Form 10-Q for the fiscal quarter ended June 30, 2013 (File No. 1-7221)).
|
||
|
10.22
|
Form of Motorola Solutions, Inc. Restricted Stock Unit Agreement relating to the Motorola Solutions Omnibus Incentive Plan of 2006 for grants to Appointed Vice Presidents and Elected Officers on or after February 3, 2014 (incorporated by reference to Exhibit 10.19 to Motorola Solutions’ Annual Report on Form 10-K for the fiscal year ended December 31, 2013 (File No. 1-7221)).
|
||
|
10.23
|
Form of Motorola Solutions, Inc. Restricted Stock Unit Agreement relating to the Motorola Solutions Omnibus Incentive Plan of 2006 for grants to Appointed Vice Presidents and Elected Officers from January 4, 2011 to February 2, 2014 (incorporated by reference to Exhibit 10.18 to Motorola Solutions’ Annual Report on Form 10-K for the fiscal year ended December 31, 2010 (File No. 1-7221)).
|
||
|
10.24
|
Motorola Solutions, Inc. Amended Award Document-Terms and Conditions Related to Employee Nonqualified Stock Options and Addendum A to Motorola Solutions, Inc. Award Document-Terms and Conditions Related to Employee Stock Appreciation Rights, relating to the Motorola Solutions Omnibus Incentive Plan of 2006 for a grant on February 22, 2011 to Gregory Q. Brown. (incorporated by reference to Motorola Solutions’ Quarterly Report on Form 10-Q for the fiscal quarter ended April 2, 2011 (File No. 1-7221)).
|
||
|
10.25
|
Form of Motorola Solutions Award Document-Terms and Conditions Related to Employee Nonqualified Stock Options for Gregory Q. Brown, relating to the Motorola Solutions Omnibus Incentive Plan of 2006 for grant on February 1, 2011 pursuant to the terms of the Employment Agreement dated August 27, 2008, as amended, by and between Motorola, Inc. and Gregory Q. Brown (incorporated by reference to Exhibit 10.24 to Motorola Solutions’ Annual Report on Form 10-K for the fiscal year ended December 31, 2010 (File No. 1-7221)).
|
||
|
10.26
|
Form of Motorola Solutions Award Document-Terms and Conditions Related to Employee Nonqualified Stock Options for Gregory Q. Brown, relating to the Motorola Solutions Omnibus Incentive Plan of 2006 for grants on or after January 4, 2011 (incorporated by reference to Exhibit 10.25 to Motorola Solutions’ Annual Report on Form 10-K for the fiscal year ended December 31, 2010 ( File No. 1-7221)).
|
||
97
|
10.27
|
Form of Motorola, Inc. Award Document-Terms and Conditions Related to Employee Nonqualified Stock Options for Gregory Q. Brown, relating to the Motorola Solutions Omnibus Incentive Plan of 2006 for grants from May 7, 2009 to January 3, 2011 (incorporated by reference to Exhibit 10.13 to Motorola, Inc.’s Quarterly Report on Form 10-Q for the fiscal quarter ended April 4, 2009 (File No. 1-7221)).
|
||
|
10.28
|
Form of Motorola Solutions, Inc. Performance Option Award Agreement for grants to Gregory Q. Brown on or after March 9, 2015 (incorporated by reference to Exhibit 10.3 to Motorola Solutions’ Current Report on Form 8-K filed on March 11, 2015 (File No. 1-7221)).
|
||
|
10.29
|
Form of Performance Option Award Agreement (CEO) (incorporated by reference to Exhibit 10.4 to Motorola Solutions’ Current Report on Form 8-K filed on August 26, 2015 (File No. 1-7221)).
|
||
|
10.30
|
Form of Motorola Solutions Stock Option Consideration Agreement for Gregory Q. Brown for grants on or after January 4, 2011 under the Motorola Solutions Omnibus Incentive Plan of 2006 (incorporated by reference to Exhibit 10.27 to Motorola Solutions’ Annual Report on Form 10-K for the fiscal year ended December 31, 2010)(File No. 1-7221)).
|
||
|
10.31
|
Form of Motorola, Inc. Stock Option Consideration Agreement for Gregory Q. Brown for grants from May 7, 2009 to January 3, 2011 under the Motorola Solutions Omnibus Incentive Plan of 2006 (incorporated by reference to Exhibit 10.14 to Motorola, Inc.’s Quarterly Report on Form 10-Q for the fiscal quarter ended April 4, 2009 (File No. 1-7221)).
|
||
|
10.32
|
Form of Motorola, Inc. Stock Option Consideration Agreement for Gregory Q. Brown for grants from January 31, 2008 to May 6, 2009 under the Motorola Solutions Omnibus Incentive Plan of 2006 (incorporated by reference to Exhibit 10.10 to Motorola, Inc.’s Annual Report on Form 10-K for the fiscal year ended December 31, 2007 (File No. 1-7221)).
|
||
|
10.33
|
Form of Motorola Solutions, Inc. Restricted Stock Unit Award Agreement for Gregory Q. Brown under the Motorola Solutions Omnibus Incentive Plan of 2006 for grants on or after January 4, 2011 (incorporated by reference to Exhibit 10.32 to Motorola Solutions’ Annual Report on Form 10-K for the fiscal year ended December 31, 2010 (File No. 1-7221)).
|
||
|
10.34
|
Form of Motorola Solutions, Inc. Market Stock Unit Agreement for grants to Gregory Q. Brown on or after March 9, 2015 (incorporated by reference to Exhibit 10.4 to Motorola Solutions’ Current Report on Form 8-K filed on March 11, 2015 (File No. 1-7221)).
|
||
|
10.35
|
Form of Motorola Solutions Deferred Stock Units Agreement between Motorola Solutions, Inc. and its non-employee directors, relating to the deferred stock units issued in lieu of cash compensation to directors under the Motorola Solutions Omnibus Incentive Plan of 2006, for acquisitions on or after January 1, 2012 (incorporated by reference to Exhibit 10.37 to Motorola Solutions’ Annual Report on Form 10-K for the fiscal year ended December 31, 2011 (File No. 1-7221)).
|
||
|
10.36
|
Form of Motorola Solutions Deferred Stock Units Agreement between Motorola Solutions, Inc. and its non-employee directors, relating to the deferred stock units issued in lieu of cash compensation to directors under the Motorola Solutions Omnibus Incentive Plan of 2006, for acquisitions on or after January 4, 2011 (incorporated by reference to Exhibit 10.37 to Motorola Solutions’ Annual Report on Form 10-K for the fiscal year ended December 31, 2010 (File No. 1-7221)).
|
||
|
10.37
|
Form of Motorola Solutions Deferred Stock Units Award between Motorola Solutions, Inc. and its non-employee directors under the Motorola Solutions Omnibus Incentive Plan of 2006 or any successor plan for grants on or after January 1, 2012 (incorporated by reference to Exhibit 10.40 to Motorola Solutions’ Annual Report on Form 10-K for the fiscal year ended December 31, 2011 (File No. 1-7221)).
|
||
|
10.38
|
Form of Motorola Solutions Deferred Stock Units Award between Motorola Solutions, Inc. and its non-employee directors under the Motorola Solutions Omnibus Incentive Plan of 2006 or any successor plan for grants from January 4, 2011 to December 31, 2011 (incorporated by reference to Exhibit 10.39 to Motorola Solutions’ Annual Report on Form 10-K for the fiscal year ended December 31, 2010 (File No. 1-7221)).
|
||
|
10.39
|
Form of Deferred Stock Units Award between Motorola, Inc. and its non-employee directors under the Motorola Solutions Omnibus Incentive Plan of 2006 or any successor plan for grants from February 11, 2007 to January 3, 2011(incorporated by reference to Exhibit 10.9 to Motorola, Inc.’s Annual Report on Form 10-K for the fiscal year ended December 31, 2006 (File No. 1-7221)).
|
||
|
10.40
|
Motorola Omnibus Incentive Plan of 2003, as amended through May 4, 2009 (incorporated by reference to Exhibit 10.6 to Motorola, Inc.’s Quarterly Report on Form 10-Q for the fiscal quarter ended April 4, 2009 (File No. 1-7221)).
|
||
|
10.41
|
Motorola Omnibus Incentive Plan of 2000, as amended through May 4, 2009 (incorporated by reference to Exhibit 10.8 to Motorola, Inc.’s Quarterly Report on Form 10-Q for the fiscal quarter ended April 4, 2009 (File No. 1-7221)).
|
||
|
10.42
|
Form of Motorola, Inc. Award Document-Terms and Conditions Related to Employee Nonqualified Stock Options, relating to the Motorola Omnibus Incentive Plan of 2003, the Motorola Omnibus Incentive Plan of 2002, the Motorola Omnibus Incentive Plan of 2000, the Motorola Amended and Restated Incentive Plan of 1998 and the Motorola Compensation/Acquisition Plan of 2000 for grants on or after May 2, 2005 (incorporated by reference to Exhibit 10.46 to Motorola, Inc.’s Quarterly Report on Form 10-Q for the fiscal quarter ended April 2, 2005 (File No. 1-7221)).
|
||
|
10.43
|
Form of Deferred Stock Units Agreement between Motorola, Inc. and its non-employee directors, relating to the deferred stock units issued in lieu of cash compensation to directors under the Motorola Omnibus Incentive Plan of 2003 or any successor plan, for acquisitions from January 1, 2006 to February 11, 2007 (incorporated by reference to Exhibit No. 10.25 to Motorola, Inc.’s Annual Report on Form 10-K for the fiscal year ended December 31, 2005 (File No. 1-7221)).
|
||
98
|
10.44
|
Motorola Non-Employee Directors Stock Plan, as amended and restated on May 6, 2003 (incorporated by reference to Exhibit 10.20 to Motorola, Inc.’s Quarterly Report on Form 10-Q for the fiscal quarter ended March 29, 2003 (File No. 1-7221)).
|
||
|
10.45
|
Motorola Solutions Executive Officer Short Term Incentive Plan dated January 17, 2013 (effective January 1, 2013) (incorporated by reference to Exhibit 10.50 to Motorola Solutions’ Annual Report on Form 10-K for the fiscal year ended December 31, 2012 (File No. 1-7221)).
|
||
|
10.46
|
Motorola Solutions Executive Officer Short Term Incentive Plan Term Sheet (incorporated by reference to Exhibit 10.51 to Motorola Solutions’ Annual Report on Form 10-K for the fiscal year ended December 31, 2012 (File No. 1-7221)).
|
||
|
10.47
|
Motorola Solutions Long Range Incentive Plan (LRIP), as Amended and Restated January 26, 2012 (incorporated by reference to Exhibit 10.53 to Motorola Solutions’ Annual Report on Form 10-K for the fiscal year ended December 31, 2011 (File No. 1-7221)).
|
||
|
10.48
|
Motorola Solutions Long Range Incentive Plan (LRIP), as Amended and Restated February 11, 2015 (incorporated by reference to Exhibit 10.5 to Motorola Solutions’ Quarterly Report on Form 10-Q for the fiscal quarter ended April 4, 2015 (File No. 1-7221)).
|
||
|
10.49
|
2015-2017 Performance Measures under the Motorola Solutions Long Range Incentive Plan (LRIP), as Amended and Restated February 11, 2015 (incorporated by reference to Exhibit 10.6 to Motorola Solutions’ Quarterly Report on Form 10-Q for the fiscal quarter ended on April 4, 2015 (File No. 1-7221)).
|
||
|
10.50
|
2014-2016 Performance Measures under the Motorola Solutions Long Range Incentive Plan (LRIP), as Amended and Restated January 26, 2012 (incorporated by reference to Exhibit No. 10.55 to Motorola Solutions’ Annual Report on Form 10-K for the fiscal year ended December 31, 2013 (File No. 1-7221)).
|
||
|
10.51
|
2013-2015 Performance Measures under the Motorola Solutions Long Range Incentive Plan (LRIP), as Amended and Restated January 26, 2012 (incorporated by reference to Exhibit 10.1 to Motorola Solutions’ Quarterly Report on Form 10-Q for the fiscal quarter ended March 30, 2013 (File No. 1-7221)).
|
||
|
10.52
|
Motorola Solutions Management Deferred Compensation Plan (As Amended and Restated Effective as of June 1, 2013) (incorporated by reference to Exhibit 10.1 to Motorola Solutions' Current Report on Form 8-K filed on June 5, 2013 (File No. 1-7221)).
|
||
|
10.53
|
Motorola Solutions Management Deferred Compensation Plan, as amended and restated effective as of December 1, 2010, as amended January 4, 2011 (incorporated by reference to Exhibit 10.57 to Motorola Solutions’ Annual Report on Form 10-K for the fiscal year ended December 31, 2010 (File No. 1-7221)).
|
||
|
10.54
|
Motorola Solutions, Inc. 2011 Senior Officer Change in Control Severance Plan, as amended and restated November 13, 2014 (incorporated by reference to Exhibit No. 10.54 to Motorola Solutions’ Annual Report on Form 10-K for the fiscal year ended December 31, 2014 (File No. 1-7221)).
|
||
|
10.55
|
Motorola Solutions, Inc. 2011 Executive Severance Plan, as amended and restated November 13, 2014 (incorporated by reference to Exhibit No. 10.55 to Motorola Solutions’ Annual Report on Form 10-K for the fiscal year ended December 31, 2014 (File No. 1-7221)).
|
||
|
10.56
|
Arrangement for directors’ fees for non-employee directors (description incorporated by reference from the information under the caption “How the Directors are Compensated” of Motorola Solutions’ Proxy Statement for the Annual Meeting of Stockholders to be held on May 16, 2016 (“Motorola Solutions’ Proxy Statement”)).
|
||
|
*10.57
|
Description of Insurance covering non-employee directors and their spouses (including a description incorporated by reference from the information under the caption “Director Retirement Plan and Insurance Coverage” of the Motorola Solutions’ Proxy Statement.
|
||
|
10.58
|
Employment Agreement dated August 27, 2008 by and between Motorola, Inc. and Gregory Q. Brown (incorporated by reference to Exhibit 10.1 to Motorola, Inc.’s Current Report on Form 8-K filed on August 29, 2008 (File No. 1-7221)).
|
||
|
10.59
|
Amendment made on December 15, 2008 to the Employment Agreement dated August 27, 2008 by and between Motorola, Inc. and Gregory Q. Brown (incorporated by reference to Exhibit No. 10.50 to Motorola, Inc.’s Annual Report on Form 10-K for the fiscal year ended December 31, 2008 (File No. 1-7221)).
|
||
|
10.60
|
Second Amendment, dated May 28, 2010, to the Employment Agreement dated August 27, 2008, as amended, by and between Motorola, Inc. and Gregory Q. Brown (incorporated by reference to Exhibit 10.1 to Motorola, Inc.’s Current Report on Form 8-K filed on May 28, 2010 (File No. 1-7221)).
|
||
|
10.61
|
Third Amendment, dated March 10, 2014, to the Employment Agreement dated August 27, 2008, as amended, by and between Motorola Solutions, Inc. and Gregory Q. Brown (incorporated by reference to Exhibit 10.1 to Motorola Solutions Current Report on Form 8-K filed on March 13, 2014 (File No. 1-7221)).
|
||
|
10.62
|
Revolving Credit Agreement dated as of May 29, 2014 among Motorola Solutions, Inc., JPMorgan Chase Bank, N.A., as administrative agent, and the several lenders and agents party thereto (incorporated by reference to Exhibit 10.1 to Motorola Solutions Current Report on Form 8-K filed on June 2, 2014 (File No. 1-7221)).
|
||
|
10.63
|
Definitive Purchase Agreement by and among Motorola Solutions, Inc., The Prudential Insurance Company of America, Prudential Financial, Inc., and State Street Bank and Trust Company, as Independent Fiduciary of the Motorola Solutions Pension Plan, dated as of September 22, 2014 (incorporated by reference to Exhibit 10.1 to Motorola Solutions’ Quarterly Report on Form 10-Q for the fiscal quarter ended September 27, 2014 (File No. 1-7221))**
|
||
|
10.64
|
Revised and Amended Aircraft Time Sharing Agreement as of October 1, 2015, by and between Motorola Solutions, Inc. and Gregory Q. Brown (incorporated by reference to Exhibit 10.4 to Motorola Solutions’, Quarterly Report on Form 10-Q for the fiscal quarter ended October 3, 2015 (File No. 1-7221)).
|
||
|
10.65
|
Investment Agreement by and among Motorola Solutions, Inc., Silver Lake Partners IV, L.P. and Silver Lake Partners IV Cayman (AIV II), L.P., dated as of August 4, 2015 (incorporated by reference to Exhibit 10.1 to Motorola Solutions’ Current Report on Form 8-K filed on August 5, 2015 (file No. 1-7221)).
|
||
99
|
10.66
|
Term Loan Credit Agreement, dated February 18, 2016, by and among Motorola Solutions, Inc., Lloyds Bank PLC, as administrative agent, and the several lenders and agents party there to (incorporated by reference to Exhibit 10.1 to Motorola Solutions' Current Report on Form 8-K filed on February 22, 2016 (file No. 1-7221)).
|
||
|
*12
|
Statement regarding Computation of Ratio of Earnings to Fixed Charges.
|
||
|
*21
|
Subsidiaries of Motorola Solutions, Inc.
|
||
|
23
|
Consent of Independent Registered Public Accounting Firm, see page 94 of the Annual Report on Form 10-K of which this Exhibit Index is a part.
|
||
|
*31.1
|
Certification of Gregory Q. Brown pursuant to Section 302 of the Sarbanes-Oxley Act of 2002.
|
||
|
*31.2
|
Certification of Gino A. Bonanotte pursuant to Section 302 of the Sarbanes-Oxley Act of 2002.
|
||
|
*32.1
|
Certification of Gregory Q. Brown pursuant to Section 906 of the Sarbanes-Oxley Act of 2002.
|
||
|
*32.2
|
Certification of Gino A. Bonanotte pursuant to Section 906 of the Sarbanes-Oxley Act of 2002.
|
||
|
101.INS
|
XBRL Instance Document
|
||
|
101.SCH
|
XBRL Taxonomy Extension Scheme Document
|
||
|
101.CAL
|
XBRL Taxonomy Extension Calculation Linkbase Document
|
||
|
101.DEF
|
XBRL Taxonomy Extension Definition Linkbase Document
|
||
|
101.LAB
|
XBRL Taxonomy Extension Label Linkbase Document
|
||
|
101.PRE
|
XBRL Taxonomy Extension Presentation Linkbase Document
|
||
* Filed herewith
** Confidential treatment has been requested for portions of this agreement
100
TABLE OF CONTENTS
Part IItem 1: BusinessItem 1A: Risk FactorsItem 1B: Unresolved Staff CommentsItem 2: PropertiesItem 3: Legal ProceedingsItem 4: Mine Safety DisclosuresPart IIItem 5: Market For Registrant S Common Equity, Related Stockholder Matters and Issuer Purchases Of Equity SecuritiesItem 6: Selected Financial DataItem 7: Management S Discussion and Analysis Of Financial Condition and Results Of OperationsItem 7A. Quantitative and Qualitative Disclosures About Market RiskItem 8: Financial Statements and Supplementary DataItem 9. Changes in and Disagreements with Accountants on Accounting and Financial DisclosureItem 9A. Controls and ProceduresItem 9B. Other InformationPart IIIItem 10. Directors, Executive Officers and Corporate GovernanceItem 11. Executive CompensationItem 12. Security Ownership Of Certain Beneficial Owners and Management and Related Stockholder MattersItem 13. Certain Relationships and Related Transactions, and Director IndependenceItem 14. Principal Accounting Fees and ServicesPart IVItem 15. Exhibits, Financial Statement Schedules