UNITED STATES
SECURITIES AND EXCHANGE COMMISSION
Washington, D.C. 20549
FORM
20-F
|
¨
|
REGISTRATION STATEMENT PURSUANT TO SECTION 12(b) OR (g) OF THE SECURITIES EXCHANGE ACT OF 1934
|
OR
|
x
|
ANNUAL REPORT PURSUANT TO SECTION 13 OR 15(d) OF THE SECURITIES EXCHANGE ACT OF 1934
|
For the fiscal year ended December 31, 2018
OR
|
¨
|
TRANSITION REPORT PURSUANT TO SECTION 13 OR 15(d) OF THE SECURITIES EXCHANGE ACT OF 1934
|
OR
|
¨
|
SHELL COMPANY REPORT PURSUANT TO SECTION 13 OR 15(d) OF THE SECURITIES EXCHANGE ACT OF 1934
|
Commission file number 001-35788
(Exact name of Registrant as specified in its charter)
N/A
(Translation of Registrant’s name into English)
Grand Duchy of Luxembourg
(Jurisdiction of incorporation or organization)
24-26, Boulevard d’Avranches, L-1160 Luxembourg,
Grand Duchy of Luxembourg
(Address of Registrant’s principal executive offices)
Henk Scheffer, Company Secretary, 24-26, Boulevard d’Avranches, L-1160 Luxembourg,
Grand Duchy of Luxembourg. Fax: +352 4792 2235
(Name, Telephone, E-mail and/or Facsimile number and Address of Company Contact Person)
Securities registered or to be registered pursuant to Section 12(b) of the Act:
|
Title of each class
|
Name of each exchange on which registered
|
|
Ordinary Shares
|
New York Stock Exchange
|
Securities registered or to be registered pursuant to Section 12(g) of the Act:
None
Securities for which there is reporting obligation pursuant to Section 15(d) of the Act:
None
Indicate the number of outstanding shares of the issuer’s classes of capital or common stock as of the close of the period covered by the annual report:
Ordinary Shares
Indicate by check mark if the registrant is a well-known seasoned issuer, as defined in Rule 405 of the Securities Act.
Yes
x
No
¨
If this report is an annual or transition report, indicate by check mark if the registrant is not required to file reports pursuant to Section 13 or 15(d) of the Securities Exchange Act of 1934.
Yes
¨
No
x
Indicate by check mark whether the registrant (1) has filed all reports required to be filed by Section 13 or 15(d) of the Securities Exchange Act of 1934 during the preceding 12 months (or for such shorter period that the registrant was required to file such reports), and (2) has been subject to such filing requirements for the past 90 days.
Yes
x
No
¨
Indicate by check mark whether the registrant has submitted electronically every Interactive Data File required to be submitted pursuant to Rule 405 of Regulation S‐T (§232.405 of this chapter) during the preceding 12 months (or for such shorter period that the registrant was required to submit such files).
Yes
x
No
¨
Indicate by check mark whether the registrant is a large accelerated filer, an accelerated filer, a non-accelerated filer or an emerging growth company. See definition of “accelerated filer, large accelerated filer and emerging growth company” in Rule 12b-2 of the Exchange Act.
|
Large accelerated filer
x
|
Accelerated filer
¨
|
Non-accelerated filer
¨
|
Emerging growth company
¨
|
Indicate by check mark which basis of accounting the registrant has used to prepare the financial statements included in this filing:
U.S. GAAP ☐ International Financial Reporting Standards as issued by the International Accounting Standards
Board
x
Other
¨
If “Other” has been checked in response to the previous question, indicate by check mark which financial statement item the registrant has elected to follow.
Item 17
¨
Item 18
¨
If this is an annual report, indicate by check mark whether the registrant is a shell company (as defined in Rule 12b-2 of the Exchange Act).
Yes
¨
No
x
TABLE OF CONTENTS
|
Page
|
||
|
|
||
|
|
||
PRESENTATION OF FINANCIAL AND CERTAIN OTHER INFORMATION
Definitions and terminology
Unless indicated otherwise, or the context otherwise requires, references herein to “ArcelorMittal”, “we”, “us”, “our” and the “Company” or similar terms are to ArcelorMittal, formerly known as Mittal Steel Company N.V. (“Mittal Steel”), having its registered office at 24-26, Boulevard d’Avranches, L-1160 Luxembourg, Grand Duchy of Luxembourg, and, where the context requires, its consolidated subsidiaries. References to the “ArcelorMittal group” and the “Group” are to ArcelorMittal and its consolidated subsidiaries. ArcelorMittal’s principal subsidiaries, categorized by reporting segment and location, are listed below.
For the purposes of this annual report, the names of the following ArcelorMittal subsidiaries as abbreviated below will be used where applicable.
|
Name of Subsidiary
|
Abbreviation
|
Country
|
||
|
NAFTA
|
|
|||
|
ArcelorMittal Dofasco G.P.
|
ArcelorMittal Dofasco
|
Canada
|
||
|
ArcelorMittal México S.A. de C.V.
|
ArcelorMittal Mexico
|
Mexico
|
||
|
ArcelorMittal USA LLC
|
ArcelorMittal USA
|
USA
|
||
|
ArcelorMittal Long Products Canada G.P.
|
ArcelorMittal Long Products Canada
|
Canada
|
||
|
|
||||
|
Brazil and neighboring countries ("Brazil")
|
||||
|
ArcelorMittal Brasil S.A.
|
ArcelorMittal Brasil
|
Brazil
|
||
|
Acindar Industria Argentina de Aceros S.A.
|
Acindar
|
Argentina
|
||
|
Europe
|
||||
|
ArcelorMittal Atlantique et Lorraine S.A.S.
|
ArcelorMittal Atlantique & Lorraine
|
France
|
||
|
ArcelorMittal Belgium N.V.
|
ArcelorMittal Belgium
|
Belgium
|
||
|
ArcelorMittal España S.A.
|
ArcelorMittal España
|
Spain
|
||
|
ArcelorMittal Flat Carbon Europe S.A.
|
AMFCE
|
Luxembourg
|
||
|
ArcelorMittal Galati S.A.
1
|
ArcelorMittal Galati
|
Romania
|
||
|
ArcelorMittal Poland S.A.
|
ArcelorMittal Poland
|
Poland
|
||
|
ArcelorMittal Eisenhüttenstadt GmbH
|
ArcelorMittal Eisenhüttenstadt
|
Germany
|
||
|
ArcelorMittal Bremen GmbH
|
ArcelorMittal Bremen
|
Germany
|
||
|
ArcelorMittal Méditerranée S.A.S.
|
ArcelorMittal Méditerranée
|
France
|
||
|
ArcelorMittal Belval & Differdange S.A.
|
ArcelorMittal Belval & Differdange
|
Luxembourg
|
||
|
ArcelorMittal Hamburg GmbH
|
ArcelorMittal Hamburg
|
Germany
|
||
|
ArcelorMittal Ostrava a.s.
1
|
ArcelorMittal Ostrava
|
Czech Republic
|
||
|
ArcelorMittal Duisburg GmbH
|
ArcelorMittal Duisburg
|
Germany
|
||
|
ArcelorMittal International Luxembourg S.A.
|
ArcelorMittal International Luxembourg
|
Luxembourg
|
||
|
ArcelorMittal Italia S.p.A.
2
|
ArcelorMittal Italia
|
Italy
|
||
|
Africa and Commonwealth of Independent States ("ACIS")
|
||||
|
ArcelorMittal South Africa Ltd.
|
ArcelorMittal South Africa
|
South Africa
|
||
|
JSC ArcelorMittal Temirtau
|
ArcelorMittal Temirtau
|
Kazakhstan
|
||
|
PJSC ArcelorMittal Kryvyi Rih
|
ArcelorMittal Kryvyi Rih
|
Ukraine
|
||
|
Mining
|
||||
|
ArcelorMittal Mining Canada G.P. and ArcelorMittal Infrastructure Canada G.P.
|
ArcelorMittal Mines and Infrastructure Canada
|
Canada
|
||
|
ArcelorMittal Liberia Ltd
|
ArcelorMittal Liberia
|
Liberia
|
||
|
JSC ArcelorMittal Temirtau
|
ArcelorMittal Temirtau
|
Kazakhstan
|
||
|
PJSC ArcelorMittal Kryvyi Rih
|
ArcelorMittal Kryvyi Rih
|
Ukraine
|
||
|
1.
|
ArcelorMittal Galati S.A. and ArcelorMittal Ostrava a.s. were classified as held for sale as of December 31, 2018.
|
|
2.
|
On November 1, 2018, ArcelorMittal completed the acquisition of Ilva S.p.A. subsequently renamed ArcelorMittal Italia S.p.A.
See
"Item 4.A—Information on the Company—History and development of the Company—
Key transactions and events in 2018.
"
|
4
In addition, unless indicated otherwise, or the context otherwise requires, references in this annual report to abbreviations or terms shown below have the following definitions:
|
Articles of Association
|
the amended and restated articles of association of ArcelorMittal, dated May 16, 2018, filed as Exhibit 1.1 hereto
|
KZT
|
the Kazakhstani tenge, the official currency of Kazakhstan
|
|
|
AUD$ or AUD
|
Australian dollars, the official currency of Australia
|
Metallurgical coal
|
a broader term than coking coal that includes all coals used in steelmaking, such as coal used for the pulverized coal injection (“PCI”) process
|
|
|
Brownfield project
|
the expansion of an existing operation
|
Number of employees
|
employees on the payroll of the Company
|
|
|
C$ or CAD
|
Canadian dollars, the official currency of Canada
|
Production capacity
|
the annual production capacity of plant and equipment based on existing technical parameters as estimated by management
|
|
|
CEO Office
|
the Chief Executive Officer, Mr. Lakshmi N. Mittal, and the President and Chief Financial Officer, Mr. Aditya Mittal
|
Ps or MXN
|
the Mexican peso, the official currency of the United Mexican States
|
|
|
CIS
|
the countries of the Commonwealth of Independent States
|
Real, reais or R$
|
Brazilian reais, the official currency of Brazil
|
|
|
CNY
|
Chinese yuan, the official currency of China
|
ROM
|
run of mine - mined iron ore or coal to be fed to a preparation and/or concentration process
|
|
|
Coking coal
|
coal that, by virtue of its coking properties, is used in the manufacture of coke, which is used in the steelmaking process
|
Sales
|
include shipping and handling fees and costs billed to a customer in a sales transaction
|
|
|
Crude steel
|
the first solid steel product upon solidification of liquid steel, including ingots from conventional mills and semis (e.g., slab, billet and blooms) from continuous casters
|
SBQ
|
special bar quality steel, a high-quality long product
|
|
|
Downstream
|
finishing operations: flat products - the process after the production of hot-rolled coil/plates, and long products - the process after the production of blooms/billets (including production of bars, wire rods, SBQ, etc.)
|
Significant Shareholder
|
a trust (HSBC Trustee (C.I.) Limited, as trustee), of which Mr. Lakshmi N. Mittal, Mrs. Usha Mittal and their children are the beneficiaries
|
|
|
DMTU or dmtu
|
dry metric tonne unit
|
Sinter
|
a metallic input used in the blast furnace steel-making process, which aggregates fines, binder and other materials into a coherent mass by heating without melting
|
|
|
DRI
|
direct reduced iron, a metallic iron formed by removing oxygen from iron ore without the formation of, or passage through, a smelting phase. DRI can be used as feedstock for steel production
|
Spanish Stock Exchanges
|
the stock exchanges of Madrid, Barcelona, Bilbao and Valencia
|
|
|
Energy coal
|
coal used as a fuel source in electrical power generation, cement manufacture and various industrial applications. Energy coal may also be referred to as steam or thermal coal
|
Steel products
|
finished and semi-finished steel products, and exclude raw materials (including those described under “upstream” below), direct reduced iron (“DRI”), hot metal, coke, etc.
|
|
|
Euro, euros, EUR or €
|
the official currency of the European Union (“EU”) member states participating in the European Monetary Union
|
Tons, net tons or ST
|
short tons are used in measurements involving steel products (a short ton is equal to 907.2 kilograms or 2,000 pounds)
|
|
|
Executive Officers
|
those executives of the Company who are supporting the CEO Office and jointly with the CEO Office represent the senior management of the Company
|
Metric Tonnes or MT
|
metric tonnes and are used in measurements involving steel products, as well as crude steel, iron ore, iron ore pellets, DRI, hot metal, coke, coal, pig iron and scrap (a metric tonne is equal to 1,000 kilograms or 2,204.62 pounds)
|
|
5
|
GMB
|
the Group Management Board, the former senior management body which was replaced by the CEO Office as of January 1, 2016. The CEO Office, supported by five Executive Officers, makes up the Company’s senior management
|
UAH
|
Ukrainian Hryvnia, the official currency of Ukraine
|
|
|
Greenfield project
|
the development of a new project
|
US$, $, dollars, USD or U.S. dollars
|
United States dollars, the official currency of the United States
|
|
|
Iron ore fines
|
ultra-fine iron ore generated by mining and grinding processes, that are aggregated into iron ore pellets through an agglomeration process or used as sinter feed
|
Upstream
|
operations that precede downstream steel-making, coking coal, coke, sinter, DRI, blast furnace, basic oxygen furnace (“BOF”), electric arc furnace (“EAF”), casters & hot rolling/plate mill
|
|
|
Iron pellets
|
agglomerated ultra-fine iron ore particles of a size and quality suitable for use in steel-making processes
|
Wet recoverable
|
a quantity of iron ore or coal recovered after the material from the mine has gone through a preparation and/or concentration process excluding drying
|
|
|
Kilometers
|
measures of distance are stated in kilometers, each of which equals approximately 0.62 miles, or in meters, each of which equals approximately 3.28 feet
|
ZAR
|
South African rand, the official currency of the Republic of South Africa
|
|
Financial information
This annual report contains the audited consolidated financial statements of ArcelorMittal and its consolidated subsidiaries, including the consolidated statements of financial position as of December 31, 2018 and 2017, and the consolidated statements of operations, other comprehensive income, changes in equity and cash flows for each of the years ended December 31, 2018, 2017 and 2016. ArcelorMittal’s consolidated financial statements were prepared in accordance with International Financial Reporting Standards (“IFRS”) as issued by the International Accounting Standards Board (“IASB”).
The financial information and certain other information presented in a number of tables in this annual report have been rounded to the nearest whole number or the nearest decimal. Therefore, the sum of the numbers in a column may not conform exactly to the total figure given for that column. In addition, certain percentages presented in the tables in this annual report reflect calculations based upon the underlying information prior to rounding and, accordingly, may not conform exactly to the percentages that would be derived if the relevant calculations were based upon the rounded numbers. This annual report on Form 20-F includes net debt and operating working capital, which are non-GAAP financial measures. ArcelorMittal believes net debt and operating working capital to be relevant to enhance the understanding of its financial position and provides additional information to investors and management with respect to the Company’s operating cash flows, capital structure and credit assessment. Non-GAAP financial measures should be read in conjunction with and not as an alternative for, ArcelorMittal’s financial information prepared in accordance with IFRS. Such non-GAAP measures may not be comparable to similarly titled measures applied by other companies.
Market information
This annual report includes industry data and projections about the Company’s markets obtained from industry surveys, market research, publicly available information and industry publications. Statements on ArcelorMittal’s competitive position contained in this annual report are based primarily on public sources including, but not limited to, publications of the World Steel Association. Industry publications generally state that the information they contain has been obtained from sources believed to be reliable but that the accuracy and completeness of such information is not guaranteed and that the projections they contain are based on a number of significant assumptions. The Company has not independently verified this data or determined the reasonableness of such assumptions. In addition, in many cases the Company has made statements in this annual report regarding its industry and its position in the industry based on internal surveys, industry forecasts and market research, as well as the Company’s experience. While these statements are believed to be reliable, they have not been independently verified.
6
CAUTIONARY STATEMENT REGARDING FORWARD-LOOKING STATEMENTS
This annual report and the documents incorporated by reference in this annual report contain forward-looking statements based on estimates and assumptions. This annual report contains forward-looking statements within the meaning of the Private Securities Litigation Reform Act of 1995. Forward-looking statements include, among other things, statements concerning the business, future financial condition, results of operations and prospects of ArcelorMittal, including its subsidiaries. These statements usually contain the words “believes”, “plans”, “expects”, “anticipates”, “intends”, “estimates” or other similar expressions. For each of these statements, you should be aware that forward-looking statements involve known and unknown risks and uncertainties. Although it is believed that the expectations reflected in these forward-looking statements are reasonable, there is no assurance that the actual results or developments anticipated will be realized or, even if realized, that they will have the expected effects on the business, financial condition, results of operations or prospects of ArcelorMittal.
These forward-looking statements speak only as of the date on which the statements were made, and no obligation has been undertaken to publicly update or revise any forward-looking statements made in this annual report or elsewhere as a result of new information, future events or otherwise, except as required by applicable laws and regulations. A detailed discussion of principal risks and uncertainties which may cause actual results and events to differ materially from such forward-looking statements is included in the section titled “Risk factors”
(Part I, Item 3D of this Annual Report on Form 20-F)
. The Company undertakes no obligation to update or revise publicly any forward-looking statements whether because of new information, future events, or otherwise, except as required by securities and other applicable laws.
|
ITEM 1.
|
IDENTITY OF DIRECTORS, SENIOR MANAGEMENT AND ADVISERS
|
Not applicable.
|
ITEM 2.
|
OFFER STATISTICS AND EXPECTED TIMETABLE
|
Not applicable.
|
ITEM 3.
|
KEY INFORMATION
|
A. Selected financial data
The following tables present selected consolidated financial information of ArcelorMittal as of and for the years ended December 31, 2018, 2017, 2016, 2015 and 2014, prepared in accordance with IFRS as issued by the IASB. This selected consolidated financial information should be read in conjunction with ArcelorMittal’s consolidated financial statements, including the notes thereto, included elsewhere herein.
7
|
(Amounts in $ millions except per share data)
|
Year ended December 31,
|
||||||||
|
2018
|
2017
|
2016
|
2015
|
2014
|
|||||
|
Sales
|
76,033
|
68,679
|
56,791
|
63,578
|
79,282
|
||||
|
Operating income/(loss)
|
6,539
|
5,434
|
4,161
|
(4,161)
|
3,034
|
||||
|
Net income/(loss) from continuing operations (including non-controlling interest)
|
5,330
|
4,575
|
1,734
|
(8,423)
|
(974)
|
||||
|
Net income/(loss) attributable to equity holders of the parent
|
5,149
|
4,568
|
1,779
|
(7,946)
|
(1,086)
|
||||
|
Net income/(loss) (including non-controlling interest)
|
5,330
|
4,575
|
1,734
|
(8,423)
|
(974)
|
||||
|
Earnings per common share (in U.S. dollars)
|
|||||||||
|
Basic earnings (loss) per common share
1, 2
|
5.07
|
4.48
|
1.87
|
(10.29)
|
(1.43)
|
||||
|
Diluted earnings (loss) per common share
1, 2
|
5.04
|
4.46
|
1.86
|
(10.29)
|
(1.43)
|
||||
|
Dividends declared per share
3,4
|
0.20
|
0.10
|
—
|
—
|
0.45
|
||||
Consolidated Statements of Financial Position
|
(Amounts in $ millions except share data)
|
As of December 31,
|
||||||||
|
2018
|
2017
|
2016
|
2015
|
2014
|
|||||
|
Total assets
|
91,249
|
85,297
|
75,142
|
76,846
|
99,179
|
||||
|
Net assets
|
44,108
|
40,855
|
32,325
|
27,570
|
45,160
|
||||
|
Share capital
|
364
|
401
|
401
|
10,011
|
10,011
|
||||
|
Basic weighted average common shares outstanding (millions)
2
|
1,015
|
1,020
|
953
|
772
|
771
|
||||
|
Diluted weighted average common shares outstanding (millions)
2
|
1,021
|
1,024
|
955
|
772
|
771
|
||||
|
1
|
Basic earnings per common share are computed by dividing net income attributable to equity holders of ArcelorMittal by the weighted average number of common shares outstanding during the periods presented. Diluted earnings per common share include assumed shares from stock options, shares from restricted stock units and convertible debt (if dilutive) in the weighted average number of common shares outstanding during the periods presented. See note 10.3 to the consolidated financial statements for further information.
|
|
2
|
Following the Company’s equity offering in April 2016, the earnings (loss) per share for prior periods have been recast in accordance with IFRS for the years ended December 31, 2015 and 2014, respectively, to include the bonus element derived from the 35% discount to the theoretical ex-right price included in the subscription price. Following the completion of the Company's share consolidation of each three existing shares into one share without nominal value on May 22, 2017, the earnings (loss) per share and corresponding basic and diluted weighted average common shares outstanding for the years ended December 31, 2016, 2015 and 2014, respectively, have been recast in accordance with IFRS.
|
|
3
|
Following the Company’s equity offering in April 2016, the dividends declared per share for prior periods have been recast for the year ended December 31, 2014 to include the bonus element derived from the 35% discount to the theoretical ex-right price included in the subscription price. The actual dividends paid was $0.20 per issued share as of December 31, 2014. Following the completion of the Company's share consolidation of each three existing shares into one share without nominal value on May 22, 2017, the dividends declared per share for the year ended December 31, 2014 was recast.
|
|
4
|
The Board has agreed on a new dividend policy which was approved by the shareholders at the AGM in May 2018. Given the current deleveraging focus, dividends began at $0.10 per share in 2018 (paid from 2017 results). The Board is proposing an increase in the base dividend for 2019 (paid from 2018 earnings) to $0.20 per share to the shareholders at the annual shareholders meeting in May 2019.
|
B. Capitalization and indebtedness
Not applicable.
C. Reasons for the offer and use of proceeds
Not applicable.
8
D.
Risk factors
ArcelorMittal’s business, financial condition, results of operations, reputation or prospects could be materially adversely affected by one or more of the risks and uncertainties described below.
Risks related to the global economy and the mining and steel industry
ArcelorMittal’s business and results are substantially affected by regional and global macroeconomic conditions. Recessions or prolonged periods of weak growth in the global economy or the economies of ArcelorMittal’s key selling markets have in the past had and in the future would be likely to have a material adverse effect on the mining and steel industries and on ArcelorMittal’s results of operations and financial condition.
The mining and steel industries have historically been highly volatile largely due to the cyclical nature of the business sectors that are the principal consumers of steel as described above. Demand for minerals, metals and steel products thus generally correlates to macroeconomic fluctuations in the global economy. This correlation and the adverse effect of macroeconomic downturns on metal mining companies and steel producers were evidenced in the 2008/2009 financial and subsequent economic crisis, for example, during which the results of both mining companies and steel producers were substantially affected, with many steel producers (including ArcelorMittal) recording sharply reduced revenues and operating losses.
Global steel demand has improved since 2015, when global apparent steel consumption contracted notably in China and most of ArcelorMittal’s core markets except Europe. Global economic growth was particularly strong during the second half of 2017 and the first half of 2018. Growth slowed less than anticipated in China in 2018 as strength in real estate and machinery partially offset weakness in automotive growth and a slowdown in infrastructure. There is, however, a risk of a significant slowdown in Chinese growth in 2019 due in particular to the potential fall-out from the trade dispute with the United States and the real estate market likely having reached a peak. In Europe, a major market for ArcelorMittal, results have suffered in prior years from recession and stagnation. After a period of robust industrial activity in late 2017 and early 2018, momentum has eased amid moderating export growth and less accommodative policies. Slowing global trade and increased uncertainty have negatively impacted industry, with the weakness amplified by a larger-than-expected temporary decline in automotive output due to regulatory changes. While economic conditions have improved in recent periods in many of ArcelorMittal’s other markets, including Brazil and the CIS, such improvements may prove fragile. Economic conditions have remained challenging in some of the Company’s other markets, including South Africa, which suffered a technical recession during the first half of 2018 but has since gradually recovered.
Overall, the short-term outlook for 2019 global GDP growth is an expected slowdown to 2.7% down from 3.0% in 2018. Leading indicators support a slowdown in growth in the U.S. to a still robust 2.4%, despite the fading fiscal stimulus and tighter financial conditions. While growth in Europe weakened sharply during the second half of 2018, growth is still expected to recover to average 1.7% in 2019 as consumer expenditure is supported by low unemployment and weak inflation. Chinese growth is also expected to slow, and while growth in some emerging markets is likely to improve, notably Brazil, others are likely to see growth capped by rising borrowing costs as interest rates rise.
More generally, there are many risks to the global macro-economic outlook in 2019, including (among other things) monetary policy uncertainty; geopolitical tensions globally; political tensions in Europe; unsolved sovereign debt issues in many southern European countries; threats to globalization by renewed protectionism, including rising trade tensions stemming from the U.S imposition of tariffs on steel and aluminum imports and international responses thereto; the lack of progress in Brexit negotiations raising the risk of a disruptive exit with potential far-reaching consequences including the imposition of potential trade barriers, custom duties, logistic issues and restrictions to the free movement of goods and people; high levels of government, corporate and consumer indebtedness in various countries (including high levels of indebtedness in emerging markets) and a potentially significant slowdown in Chinese growth. A materialization of any of these risks could depress demand for (and hence the price of) steel and iron ore and therefore have a material adverse effect on ArcelorMittal’s results of operations and financial condition.
Excess capacity and oversupply in the steel industry and in the iron ore mining industry have in the past and may continue in the future to weigh on the profitability of steel producers, including ArcelorMittal.
The steel industry is affected by global and regional production capacity and fluctuations in steel imports and exports, which are themselves affected by the existence and amounts of tariffs and customer stocking and destocking cycles. The steel industry globally has historically suffered from structural overcapacity, and the current global steelmaking capacity exceeds the
9
current global consumption of steel. This overcapacity is amplified during periods of global or regional economic weakness due to weaker global or regional demand. In particular, China is both the largest global steel consumer and the largest global steel producer by a large margin, and the balance between its domestic production and consumption has been an important factor influencing global steel prices in recent years, such as in 2015, when Chinese domestic steel demand weakened resulting in a surge in Chinese steel exports. While the structural imbalance between Chinese supply and demand has been reduced by capacity eliminations in recent years, if Chinese capacity were to increase again, and/or if Chinese demand were to weaken significantly, there could be a renewed flood of Chinese steel exports. Other developing markets (such as Brazil, Russia and Ukraine) continue to show structural overcapacity after domestic demand fell sharply during recent recessions, and developed Asia continues to exhibit overcapacity and the need to export significant volumes onto world markets. Regional steel markets are also vulnerable at times of economic crisis in countries with significant steel making capacity. One such example is Turkey where a currency crisis has caused domestic demand to decline sharply during the second half of 2018 and leading to a pick-up in exports, particularly for long steel products. In Europe, while the rebound in demand has lessened the structural imbalance between capacity and demand, a decrease in demand would mean a return to the structural overcapacity issues that have plagued the EU 28 for years. Finally, in the United States, improved economic conditions and the pricing support from the Section 232 tariffs have led to new capacity being built and previously idled capacity re-opened, increasing the risk of oversupply and overcapacity in the event of a market downturn.
The overcapacity of steel production in the developing world and in China in particular has weighed on global steel prices at times over the past decade, as exports have surged to Europe and NAFTA, ArcelorMittal’s principal markets, often at low prices that may be at or below the cost of production, depressing steel prices in regional markets world-wide. See “Unfair trade practices in ArcelorMittal’s home markets could negatively affect steel prices and reduce ArcelorMittal’s profitability while trade sanctions and barriers may have an adverse effect on ArcelorMittal's operations in various markets.” If global demand were to weaken, such a phenomenon could happen again.
Finally, excess iron ore supply coupled with decreased demand in iron ore consuming industries, such as steel, has led to a prolonged depression of iron ore prices at various points in recent years, in particular in 2015, which in turn weighed on steel prices as iron ore is a principal raw material in steelmaking. While the supply/demand balance has improved more recently, no assurance can be given that it will not deteriorate again, particularly if Chinese steel demand declines or worldwide capacity increases due to new construction or the restart of production. A renewed phase of steel and iron ore oversupply would likely have a material adverse effect on ArcelorMittal’s results of operations and financial condition.
Protracted low steel and iron ore prices would likely have an adverse effect on ArcelorMittal’s results of operations.
As an integrated producer of steel and iron ore, ArcelorMittal’s results of operations are sensitive to the market prices of steel and iron ore in its markets and globally. The impact of market steel prices on its results is direct. The impact of market iron ore prices is both direct, as ArcelorMittal sells iron ore on the market to third parties, and indirect as iron ore is a principal raw material used in steel production and fluctuations in its market price are typically and eventually passed through to steel prices. Steel prices and iron ore prices are affected by supply trends (see above), demand trends and inventory cycles. In terms of demand, steel and iron ore prices are sensitive to trends in cyclical industries, such as the automotive, construction, appliance, machinery, equipment and transportation industries, which are significant markets for ArcelorMittal’s products. In the past, substantial price decreases during periods of economic weakness have not always been offset by commensurate price increases during periods of economic strength. In addition, as indicated above, excess supply relative to demand in local markets generally results in increased exports and drives down global prices. In terms of inventory, steel stocking and destocking cycles affect apparent demand for steel and hence steel prices and steel producers’ profitability. For example, steel distributors may accumulate substantial steel inventories in periods of low prices and, in periods of rising real demand for steel from end-users, steel distributors may sell steel from inventory (destock), thereby delaying the effective implementation of steel price increases. Conversely, steel price decreases can sometimes develop their own momentum, as customers adopt a “wait and see” attitude and destock in the expectation of further price decreases.
As a result of these factors, steel and iron ore prices came under pressure at various points in recent periods and particularly in 2015, when both steel and iron ore reached their lowest prices over the last decade. This had a pronounced negative effect on ArcelorMittal’s results of operations, in the form of significant declines in revenues and operating income for 2015. Moreover, the particularly sharp decline in steel prices in the second half of 2015 triggered inventory related losses of $1.3 billion, and the significant decline in iron ore and coal prices led to a $3.4 billion impairment of mining assets and goodwill in the fourth quarter of 2015.
10
While steel and iron ore prices have generally improved more recently, the timing and extent of continued price recovery, maintenance of improved price levels or a return to prior low levels cannot be predicted. In
particular, while the imposition of tariffs in the United States and Europe at a rate of 25% has resulted in higher steel prices or in preventing significant drops in steel prices, further tariffs on a widening list of imported products and retaliatory protectionist measures by other countries risk having a significant negative impact on global trade and ultimately economic growth, steel demand and steel and iron ore prices. A renewed scenario of prolonged low steel and iron ore prices would have a material adverse effect on ArcelorMittal’s results of operations and financial condition.
Volatility in the supply and prices of raw materials, energy and transportation, and volatility in steel prices or mismatches between steel prices and raw material prices could adversely affect ArcelorMittal’s results of operations.
The prices of steel, iron ore, coking coal and scrap have been highly volatile in recent years. Volatility in steel and raw material prices can result from many factors including: trends in demand for iron ore in the steel industry itself, and particularly from Chinese steel producers (as the largest group of producers); industry structural factors (including the oligopolistic nature of the seaborne iron ore industry and the fragmented nature of the steel industry); the expectation or imposition of corrective trade measures such as tariffs; massive stocking and destocking activities (sudden drops in prices can lead end-users to delay orders pushing prices down further); speculation; new laws or regulations; changes in the supply of iron ore, in particular due to new mines coming into operation; business continuity of suppliers; changes in pricing models or contract arrangements; expansion projects of suppliers; worldwide production, including interruptions thereof by suppliers; capacity-utilization rates; accidents or other similar events at suppliers’ premises or along the supply chain; wars, natural disasters, political disruption and other similar events; fluctuations in exchange rates; the bargaining power of raw material suppliers and the availability and cost of transportation.
As a producer and seller of steel, the Company is directly exposed to fluctuations in the market price for steel, iron ore, coking coal and other raw materials, energy and transportation. In particular, steel production consumes substantial amounts of raw materials including iron ore, coking coal and coke, and the production of direct reduced iron, the production of steel in EAFs and the re-heating of steel involve the use of significant amounts of energy, making steel companies dependent on the price of and their reliable access to supplies of raw materials and energy. Although ArcelorMittal has substantial sources of iron ore and coal from its own mines (the Company’s self-sufficiency rates were 49% for iron ore and 12% for PCI and coal in 2018),
it nevertheless remains exposed to volatility in the supply and price of iron ore and coking coal given that it obtains a significant portion of such raw materials under supply contracts from third parties.
For additional details on ArcelorMittal’s raw materials supply and self-sufficiency, see “Item 4.B—Information on the Company—Business overview—Mining products—Other raw materials and energy”.
Furthermore, while steel and raw material (in particular iron ore and coking coal) price trends have historically been correlated, a lack of correlation or an abnormal lag in the corollary relationship between raw material and steel prices may also occur and result in a “price-cost effect” in the steel industry. ArcelorMittal has experienced price-cost effect at various points in recent years and may continue to do so. In some of ArcelorMittal’s segments, in particular Europe and NAFTA, there are several months between raw material purchases and sales of steel products incorporating those materials, rendering them particularly susceptible to price-cost effect. For example, coking coal sourced from Australia takes several weeks to reach Europe (e.g. ~4 weeks sailing time, plus loading/unloading time at ports), creating a structural lag. Sudden spikes in raw materials, such as coking coal, have occurred in the past and may occur in the future. Because ArcelorMittal sources a substantial portion of its raw materials through long-term contracts with quarterly (or more frequent) formula-based or negotiated price adjustments and as a steel producer sells a substantial part of its steel products at spot prices, it faces the risk of adverse differentials between its own production costs, which are affected by global raw materials and scrap prices, on the one hand, and trends for steel prices in regional markets, on the other hand.
Another area of exposure to price volatility is transportation. Freight costs (i.e., shipping) are a substantial component of ArcelorMittal’s cost of goods sold. In particular, if freight costs were to increase before iron ore or steel prices, this would directly and mechanically weigh on ArcelorMittal’s profitability (although it would make imports less competitive).
Unfair trade practices in ArcelorMittal’s home markets could negatively affect steel prices and reduce ArcelorMittal’s profitability, while trade sanctions and barriers may have an adverse effect on ArcelorMittal's operations in various markets.
ArcelorMittal is exposed to the effects of “dumping” and other unfair trade and pricing practices by competitors. Moreover, government subsidization of the steel industry remains widespread in certain countries, particularly those with centrally-
11
controlled economies such as China. In periods of lower global demand for steel, there is an increased risk of additional volumes of unfairly-traded steel exports into various markets, including North America and Europe and other markets such as South Africa, in which ArcelorMittal produces and sells its products. Such imports have had and could in the future have the effect of further reducing prices and demand for ArcelorMittal’s products.
Against this backdrop of increasing dumping and other unfair trade and pricing pressures, China is lobbying members of the World Trade Organization (“WTO”) for immediate “Market Economy Status” (“MES”) in light of the expiry on December 11, 2016 of certain protocols to its 2001 accession to the WTO. MES is a bilateral designation that is granted individually by a given country and can be made on the basis of a legal or political determination. Several countries, including several in markets in which ArcelorMittal operates, have already granted China MES. Disputes are ongoing before the WTO with respect to China’s MES and the methodologies used to calculate dumping margins. No assurance can be given as to whether or when the U.S., Brazil or other countries will grant MES to China. A country’s decision to grant MES to China or whether anti-dumping measures that have been adopted will withstand disputes could substantially reduce the anti-dumping duty margins that may be applied against China pursuant to the rules of WTO, which would encourage or at least fail to discourage China’s exportation of unfairly traded steel products into several markets in which ArcelorMittal operates.
See “Item 4.B—Information on the Company—Business overview—Government Regulations—Foreign trade” and "—Government Regulations" for more information.
An increase in exports of low-cost steel products from developing countries, along with a lack of effective remedial trade policies, could depress steel prices in various markets globally, including in ArcelorMittal’s key markets. Conversely, ArcelorMittal is exposed to the effects of trade sanctions, barriers and protectionist policies due to the global nature of its operations. Various countries have instituted, and may institute trade sanctions and barriers that could, depending on the nature of the measures adopted, adversely affect ArcelorMittal’s business by limiting the Company’s access to or competitiveness in steel markets. While such protectionist measures can help the producers in the adopting country, they may be ineffective, raise the risk of exports being directed to markets where no such measures are in place and/or result in retaliatory measures
.
For example, the adoption of protectionist measures in the United States in March 2018 in the form of Section 232 25% import tariffs on all steel product categories led to a surge of steel imports in other markets (for example, exports from Turkey in particular surged in Europe in the first half of 2018) and consequently provoked retaliatory safeguard measures by other countries (the European Commission, Turkey, Canada and the Eurasian Economic Union all adopted provisional safeguard measures in the form of tariff quotas on steel products during 2018). See “Item 4.B—Information on the Company—Business overview—Government Regulations—Foreign trade” for more information. It is unclear what impact these protectionist measures will have in 2019, whether they will be effective in increasing or maintaining steel prices in the adopting country or countries and whether they will have an overall negative impact on global macroeconomic conditions. With regard to ArcelorMittal in particular, the measures may cause a reduction of its exports from Canada and Mexico into the United States and a redirection of cheaper exports from the U.S. market to Europe, the negative effects of which could offset the positive effect of increased selling prices in the United States for the Company's U.S. plants. In 2018, the positive effect of the Section 232 tariffs in the United States was partially offset by the negative effects on ArcelorMittal's exports from Canada and Mexico into the United States.
In February 2019, President Trump received from the US Department of Commerce the findings of another Section 232 investigation into whether imported vehicles pose a national security threat to the United States and will have 90 days to decide on any action such as tariffs. The imposition of such tariffs could weigh significantly on US demand for imported vehicles, particularly from Europe and hence on demand for steel from European auto manufacturers who are among ArcelorMittal Europe’s principal clients. The overall adverse impact on ArcelorMittal would depend in part on the extent to which this decrease in demand is offset by an increase in demand from US auto manufacturer clients (who would benefit from the protectionist tariffs) as well as from ones based in Canada and Mexico (which countries would benefit under existing agreements from a partial exemption from such tariffs), all of which would benefit ArcelorMittal NAFTA’s operations.
In addition, the Trump administration and the U.S. Congress may make substantial changes in legislation, regulation and government policy directly affecting ArcelorMittal’s business or indirectly affecting the Company because of impacts on its customers and suppliers. In particular, the Company’s exports from Canada or Mexico into the United States may be negatively affected by the implementation of the Trump administration's replacement of the NAFTA trade agreement with Canada and Mexico. More generally, actions further to President Trump's suggestions that he may seek to renegotiate other free trade agreements or withdraw the United States from the WTO could have an adverse effect on the Company's operations. All of the above, including escalating tariffs on steel imports or a more general trade war, pose a degree of uncertainty which could have a significant adverse effect on steel demand, ArcelorMittal’s results of operations and global macroeconomic conditions generally.
12
Developments in the competitive environment in the steel industry could have an adverse effect on ArcelorMittal’s competitive position and hence its business, financial condition, results of operations or prospects.
The markets in which steel companies operate are highly competitive. Competition—in the form of established producers expanding in new markets, smaller producers increasing production in anticipation of demand increases or amid recoveries, or exporters selling excess capacity from markets such as China—could cause ArcelorMittal to lose market share, increase expenditures or reduce pricing. Any of these developments could have a material adverse effect on its business, financial condition, results of operations or prospects.
Competition from other materials could reduce market prices and demand for steel products and thereby reduce ArcelorMittal’s cash flows and profitability.
In many applications, steel competes with other materials that may be used as substitutes, such as aluminum, concrete, composites, glass, plastic and wood. In particular, as a result of increasingly stringent regulatory requirements, as well as developments in alternative materials, designers, engineers and industrial manufacturers, especially those in the automotive industry, are increasing their use of lighter weight and alternative materials, such as aluminum, composites and plastics in their products.
In the automotive area, ArcelorMittal has introduced new advanced high-strength steel products, such as Usibor® 2000, Ductibor® 1000 and Fortiform® a new 3rd generation AHSS for cold stamping, new engineering S-in motion® projects and a dedicated electric iCARe® range to respond to the shift toward electric cars
. In the construction area, ArcelorMittal has launched Steligence®, a unique holistic commercial approach to serve this market with a complete set of products, services and solutions. See “Item 4.B—Information on the Company—Business overview—Competitive strengths—Sustainable development—Outcome 2: Products that accelerate more sustainable lifestyles” and “--Outcome 3: Products that create sustainable infrastructure.” Despite these product innovations, a
loss of market share to substitute materials, increased government regulatory initiatives favoring the use of alternative materials, as well as the development of additional new substitutes for steel products could significantly reduce market prices and demand for steel products and thereby reduce ArcelorMittal’s cash flows and profitability.
ArcelorMittal is subject to strict environmental laws and regulations that could give rise to a significant increase in costs and liabilities.
ArcelorMittal is subject to a broad range of environmental laws and regulations in each of the jurisdictions in which it operates. These laws and regulations impose increasingly stringent environmental protection standards regarding, among others, air emissions, wastewater storage, treatment and discharges, the use and handling of hazardous or toxic materials, waste disposal practices and the remediation of environmental contamination. The costs of complying with, and the imposition of liabilities pursuant to, environmental laws and regulations can be significant, and compliance with new and more stringent obligations may require additional capital expenditures or modifications in operating practices. Failure to comply can result in civil and or criminal penalties being imposed, the suspension of permits, requirements to curtail or suspend operations and lawsuits by third parties. Despite ArcelorMittal’s efforts to comply with environmental laws and regulations, environmental incidents or accidents may occur that negatively affect the Company’s reputation or the operations of key facilities.
ArcelorMittal also incurs costs and liabilities associated with the assessment and remediation of contaminated sites. In addition to the impact on current facilities and operations, environmental remediation obligations can give rise to substantial liabilities in respect of divested assets and past activities. This may also be the case for acquisitions when liabilities for past acts or omissions are not adequately reflected in the terms and price of the acquisition. ArcelorMittal could become subject to further remediation obligations in the future, as additional contamination is discovered or cleanup standards become more stringent.
Costs and liabilities associated with mining activities include those resulting from tailings and sludge disposal, effluent management, and rehabilitation of land disturbed during mining processes. ArcelorMittal could become subject to unidentified liabilities in the future, such as those relating to uncontrolled tailings breaches or other future events or to underestimated emissions of polluting substances. For example, the failure of a tailings ponds dam at ArcelorMittal’s mines could cause significant damage, including death, injury and environmental harm. While the Company carries out assessments of its facilities, it cannot guarantee that failures or breaches of a tailings ponds dam will not occur in the future. For example, in February 2019, the Company decided to implement the evacuation plan related to its dormant Serra Azul tailing dam with a 5.8Mm
3
tailings volume in Brazil, evacuating the 119 person community situated downstream to the dam as a precautionary measure based on an updated site-based assessment following recent incidents in the Brazilian mining sector in order to undertake further testing and implement any necessary mitigation measures.
13
ArcelorMittal’s operations may be located in areas where individuals or communities may regard its activities as having a detrimental effect on their natural environment and conditions of life. Any actions taken by such individuals or communities in response to such concerns could compromise ArcelorMittal’s profitability or, in extreme cases, the viability of an operation or the development of new activities in the relevant region or country.
See “Item 4.B—Information on the Company—Business overview—Government regulations—Environmental laws and regulations” and note 8.3 to ArcelorMittal’s consolidated financial statements.
Laws and regulations restricting emissions of greenhouse gases could force ArcelorMittal to incur increased capital and operating costs and could have a material adverse effect on ArcelorMittal’s results of operations and financial condition.
Compliance with new and more stringent environmental obligations relating to greenhouse gas emissions may require additional capital expenditures or modifications in operating practices, as well as additional reporting obligations. The integrated steel process involves carbon and creates carbon dioxide (“CO
2
”), which distinguishes integrated steel producers from mini-mills and many other industries where CO
2
generation is primarily linked to energy use. The EU has established greenhouse gas regulations and has revised its emission trading system for the period after 2020 in a manner that may require ArcelorMittal to incur additional costs to acquire emissions allowances. Delegated regulations in this regard are expected. In Kazakhstan, the government has installed a domestic trading system which currently is in a pilot phase but would be similar to the EU system. South Africa envisages to start with a CO
2
tax system in 2019. The United States required reporting of greenhouse gas emissions from certain large sources beginning in 2011. Although at the federal level the current administration is seeking to delay further regulation of greenhouse gas emissions, emissions trading regimes and other initiatives are continuing to be pursued at the state and regional level. Various regulations are in consideration or recently implemented in Argentina, Ukraine and Canada
.
Further measures may be enacted in the future. In particular, in December 2015, the 195 countries participating in the United National Framework Convention on Climate Change reached an international agreement (the "Paris Agreement"). The Paris Agreement aims to implement the necessary drivers to achieve drastic reductions of carbon emissions. The Company takes this message seriously and investigates its possibilities to contribute to this by developing research and development programs, investigating its technical possibilities to reduce emissions (the Company’s emission footprint in 2017 was approximately 200 million tonnes) and following the state of knowledge on climate change closely.
Such obligations, whether in the form of a national or international cap-and-trade emissions permit system, a carbon tax or acquisition of emission rights at market prices, emissions controls, reporting requirements, or other regulatory initiatives, could have a negative effect on ArcelorMittal’s production levels, income and cash flows. Such regulations could also have a negative effect on the Company’s suppliers and customers, which could result in higher costs and lower sales. Moreover, the EU Commission’s decision to further reduce the allocation of CO
2
emission rights to companies could negatively impact the global steel industry, as the amount of such rights is currently at the edge of covering technically achievable operating conditions. CO
2
emissions regulations have already resulted in increased costs in Europe, and ArcelorMittal expects costs will continue to increase with the implementation of Phase IV of the European Union’s Emission Trading Scheme (“ETS”) starting in 2021.
Furthermore, many developing nations have not yet instituted significant greenhouse gas regulations, and the Paris Agreement specifically recognized that peaking of greenhouse gas emissions will occur later in developing countries. As the Paris Agreement recognizes that the Intended Nationally Determined Contributions (“INDC”) for developing nations may be less stringent in light of different national circumstances, ArcelorMittal may be at a competitive disadvantage relative to steelmakers having more or all of their production in such countries. Depending on the extent of the difference between the requirements in developed regions (such as Europe) and developing regions (such as China or the CIS), this competitive disadvantage could be severe and render production in the developed region structurally unprofitable.
In addition, as regulators and investors increasingly focus on climate change issues, the Company is exposed to the risk of frameworks and regulations being adopted that are ill-adapted to its operations. For example, the most established framework for carbon pricing and emissions trading schemes is currently the European Union's ETS. The Company has highlighted the importance that a carbon border adjustment be included in order to avoid competitive distortions (i.e., European steel becoming overpriced due to European carbon policy, prompting the market to outsource its steel from other regions where carbon is less expensive). With respect to investors, the European Commission has presented a package of measures to implement key actions
14
with respect to its sustainable finance plan, including a proposed regulation to create a unified classification system (“taxonomy”) on what can be considered an environmentally sustainable economic activity, as a step in the efforts to channel investments into sustainable activities. If the metrics adopted in the taxonomy are not appropriate for the Company or if investors begin to view investments in steel and mining as undesirable, it may become more difficult and/or more expensive for the Company to obtain financing. While the Company has taken significant steps and continues to adapt its operations in light of climate change and the need for sustainability, such steps may not be in line with future frameworks or regulations or market views of investment suitability.
See “Item 4.B—Information on the Company—Business overview—Government regulations—Environmental laws and regulations” and note 8.3 to ArcelorMittal’s consolidated financial statements.
ArcelorMittal is subject to stringent health and safety laws and regulations that give rise to significant costs and could give rise to significant liabilities and/or negatively impact ArcelorMittal's reputation.
ArcelorMittal is subject to a broad range of health and safety laws and regulations in each of the jurisdictions in which it operates. These laws and regulations, as interpreted by relevant agencies and the courts, impose increasingly stringent health and safety protection standards. The costs of complying with, and the imposition of liabilities pursuant to, health and safety laws and regulations could be significant, and failure to comply could result in the assessment of civil and criminal penalties, the suspension of permits or operations, and lawsuits by third parties. In addition, under certain circumstances authorities could require ArcelorMittal facilities to curtail or suspend operations based on health and safety concerns.
Despite ArcelorMittal’s efforts to monitor and reduce accidents at its facilities
(see “Item 4.B—Information on the Company—Business overview—Government regulations—Health and safety laws and regulations”)
, health and safety incidents do occur, some of which may result in costs and liabilities and negatively impact ArcelorMittal’s reputation or the operations of the affected facility. Such accidents could include explosions or gas leaks, fires or collapses in underground mining operations, vehicular accidents, and other accidents involving mobile equipment, or exposure to radioactive or other potentially hazardous materials. Some of ArcelorMittal’s industrial activities involve the use, storage and transport of dangerous chemicals and toxic substances, and ArcelorMittal is therefore subject to the risk of industrial accidents which could have significant adverse consequences for the Company’s workers and facilities, as well as the environment. Such accidents could lead to production stoppages, loss of key personnel, the loss of key assets, or put at risk employees (and those of sub-contractors and suppliers) or persons living near affected sites.
See
“Item 4.B—Information on the Company—Business overview—Government regulations—Environmental laws and regulations” and
note 8.3 to ArcelorMittal’s consolidated financial statements.
Risks related to ArcelorMittal
ArcelorMittal has a substantial amount of indebtedness, which could make it more difficult or expensive to refinance its maturing debt, incur new debt and/or flexibly manage its business.
As of December 31, 2018, ArcelorMittal had total debt outstanding of $12.5 billion ($12.6 billion including debt classified as held for sale)
, including $3.2 billion
of short-term indebtedness (including payables to banks and the current portion of long-term debt) and
$9.3 billion
of long-term indebtedness. As of December 31, 2018, ArcelorMittal had $2.4 billion
of cash and cash equivalents, including restricted cash of $0.2 billion
, and $5.5 billion
available to be drawn under existing credit facilities. The Company also relies on its true sale of receivables programs ($5.0 billion of trade receivables sold and outstanding at December 31, 2018), as a way to manage its working capital cycle.
An increase in ArcelorMittal’s level of debt outstanding could have adverse consequences, including impairing its ability to obtain additional financing for working capital, capital expenditures, acquisitions, general corporate purposes or other purposes, and limiting its flexibility to adjust to changing market conditions or withstand competitive pressures, resulting in greater vulnerability to a downturn in general economic conditions. Substantial increases in the Company's gearing could affect its ability to, and the conditions under which it might, access financial markets to refinance maturing debt on acceptable terms. ArcelorMittal’s access to financial markets for refinancing also depends on the conditions in the global capital and credit markets, which are volatile. Under such circumstances as occurred during the 2008/2009 financial and economic crisis and again at the height of the eurozone sovereign debt crisis in 2012, the Company could experience difficulties in accessing the financial markets on acceptable terms or at all.
15
Moreover, ArcelorMittal could, in order to increase its financial flexibility and strengthen its balance sheet, implement capital raising measures such as equity offerings (as was done in May 2009, January 2013 and April 2016), which could (depending on how they are structured) dilute the interests of existing shareholders or require them to invest further funds to avoid such dilution. In addition, ArcelorMittal has undertaken and may undertake further asset disposals in order to reduce debt. These asset disposals are subject to execution risk and may fail to materialize, and the proceeds received from such disposals may not reflect values that management believes are achievable and/or cause substantial accounting losses (particularly if the disposals are done in difficult market conditions). In addition, to the extent that the asset disposals include the sale of all or part of core assets (including through an increase in the share of non-controlling interests), this could reduce ArcelorMittal’s consolidated cash flows and/or the economic interest of ArcelorMittal shareholders in such assets, which may be cash-generative and profitable ones.
In addition, credit rating agencies could downgrade ArcelorMittal’s ratings either due to factors specific to ArcelorMittal, a prolonged cyclical downturn in the steel industry and mining industries, macroeconomic trends (such as global or regional recessions) or trends in credit and capital markets more generally, and any future downgrades could lead to an increase in its cost of borrowing. The margin under ArcelorMittal’s principal credit facilities and certain of its outstanding bonds is subject to adjustment in the event of a change in its long-term credit ratings, and downgrades that occurred in 2012 and 2015 resulted in increased interest expense.
ArcelorMittal’s principal credit facilities contain restrictive covenants. These covenants limit, inter alia, encumbrances on the assets of ArcelorMittal and its subsidiaries, the ability of ArcelorMittal’s subsidiaries to incur debt and the ability of ArcelorMittal and its subsidiaries to dispose of assets in certain circumstances. ArcelorMittal’s principal credit facilities also include the following financial covenant: ArcelorMittal must ensure that the “Leverage Ratio”, being the ratio of “Consolidated Total Net Borrowings” (consolidated total borrowings less consolidated cash and cash equivalents) to “Consolidated EBITDA” (the consolidated net pre-taxation profits of the ArcelorMittal group for a Measurement Period, subject to certain adjustments as defined in the facilities), at the end of each “Measurement Period” (each period of 12 months ending on the last day of a financial half-year or a financial year of ArcelorMittal), is not greater than a ratio of 4.25 to one
. As of December 31, 2018, the Company was in compliance with the Leverage Ratio.
These restrictive and financial covenants could limit ArcelorMittal’s operating and financial flexibility. Failure to comply with any covenant would enable the lenders to accelerate ArcelorMittal’s repayment obligations. Moreover, ArcelorMittal’s debt facilities have provisions whereby certain events relating to other borrowers within the ArcelorMittal group could, under certain circumstances, lead to acceleration of debt repayment under the credit facilities. Any invocation of these cross-acceleration clauses could cause some or all of the other debt to accelerate, creating liquidity pressures. In addition, the mere market perception of a potential breach of any financial covenant could have a negative impact on ArcelorMittal’s ability to refinance its indebtedness on acceptable conditions.
Furthermore, some of ArcelorMittal’s debt is subject to floating rates of interest and thereby exposes ArcelorMittal to interest rate risk (i.e., if interest rates rise, ArcelorMittal’s debt service obligations on its floating rate indebtedness would increase). Depending on market conditions, ArcelorMittal from time to time uses interest-rate swaps or other financial instruments to hedge a portion of its interest rate exposure either from fixed to floating or from floating to fixed. ArcelorMittal had exposure to 83% of its long-term debt at fixed interest rates and 17% at floating rates as of December 31, 2018.
See “
Item 5.B—
Operating and financial review and prospects—Liquidity and capital resources”.
ArcelorMittal’s level of profitability and cash flow currently is and, depending on market and operating conditions, may in the future be, substantially affected by its ability to reduce costs and improve operating efficiency.
The steel industry has historically been cyclical, periodically experiencing difficult operating conditions. In light of this, ArcelorMittal has historically and increasingly in recent periods, taken initiatives to reduce its costs and increase its operating efficiency. These initiatives have included various asset optimization and other programs throughout the Company. The most recent of these programs is the Action 2020 plan announced in February 2016 that includes, among other aspects, several efficiency improvement initiatives. While the Company has partially implemented the plan across all segments, continued implementation of cost saving and efficiency improvement initiatives is subject to operational challenges and limitations. For example, the volume gains achieved in 2017 were reversed in 2018 due to operational disruptions. Failure to implement fully such initiatives would prevent the attainment of announced profitability or cash flow improvement targets, and more generally could have a material adverse effect on the Company’s profitability and cash flow.
16
ArcelorMittal’s mining operations are subject to risks associated with mining activities.
ArcelorMittal's mining operations are subject to the hazards and risks usually associated with the exploration, development and production of natural resources, any of which could result in production shortfalls or damage to persons or property. In particular, the hazards associated with open-pit mining operations include, among others:
|
•
|
flooding of the open pit;
|
|
•
|
collapse of the open-pit wall;
|
|
•
|
accidents associated with the operation of large open-pit mining and rock transportation equipment;
|
|
•
|
accidents associated with the preparation and ignition of large-scale open-pit blasting operations;
|
|
•
|
production disruptions or difficulties associated with mining in extreme weather conditions;
|
|
•
|
hazards associated with the disposal of mineralized waste water, such as groundwater and waterway contamination; and
|
|
•
|
collapse of tailings ponds dams or dams.
|
Hazards associated with underground mining operations, of which ArcelorMittal has several, include, among others:
|
•
|
underground fires and explosions, including those caused by flammable gas;
|
|
•
|
gas and coal outbursts;
|
|
•
|
cave-ins or falls of ground;
|
|
•
|
discharges of gases and toxic chemicals;
|
|
•
|
flooding;
|
|
•
|
sinkhole formation and ground subsidence;
and
|
|
•
|
blasting, removing, and processing material from an underground mine.
|
ArcelorMittal is exposed to all of these hazards. The occurrence of any of the events listed above could delay production, increase production costs and result in death or injury to persons, damage to property and liability for ArcelorMittal, some or all of which may not be covered by insurance, as well as substantially harm ArcelorMittal’s reputation, both as a company focused on ensuring the health and safety of its employees and more generally.
17
ArcelorMittal’s reserve estimates may materially differ from mineral quantities that it may be able to actually recover; ArcelorMittal’s estimates of mine life may prove inaccurate; and market price fluctuations and changes in operating and capital costs may render certain ore reserves uneconomical to mine.
ArcelorMittal’s reported reserves are estimated quantities of the ore and metallurgical coal that it has determined can be economically mined and processed under present and anticipated conditions to extract their mineral content. There are numerous uncertainties inherent in estimating quantities of reserves and in projecting potential future rates of mineral production, including factors beyond ArcelorMittal’s control. The process of estimating reserves involves estimating deposits of minerals that cannot be measured in an exact manner, and the accuracy of any reserve estimate is a function of the quality of available data, engineering and geological interpretation and judgment. As a result, no assurance can be given that the estimated amounts of ore or coal will be recovered or that it will be recovered at the anticipated rates. Estimates may vary, and results of mining and production subsequent to the date of an estimate may lead to revisions of estimates. Reserve estimates and estimates of mine life may require revisions based on actual market conditions, production experience and other factors. Fluctuations in the market prices of minerals and metals, reduced recovery rates or increased operating and capital costs due to inflation, exchange rates, mining duties, changes in regulatory requirements or other factors may render proven and probable reserves uneconomic to exploit and may ultimately result in a revision of reserves. In particular, a prolonged period of low prices or other indicators could lead to a review of the Group’s reserves. Such review would reflect the Company’s view based on estimates, assumptions and judgments and could result in a reduction in the Group’s reported reserves. The Group’s reserve estimates reported in this annual report do not exceed the quantities that the Company estimates could be extracted economically if future prices were at similar levels to the average contracted price for the three years ended December 31, 2018. As a result, if the average contracted prices decline in 2019, in particular to near or below the low levels seen in the fourth quarter of 2015 and in the first half of 2016, the Company’s estimates of its reserves at year-end 2019 may decline.
In addition, substantial time and expenditures are required to:
|
•
|
establish mineral reserves through drilling;
|
|
•
|
determine appropriate mining and metallurgical processes for optimizing the recovery of saleable product from iron ore and coal reserves;
|
|
•
|
obtain environmental and other licenses or securing surface rights with local communities;
|
|
•
|
construct mining and processing facilities and the infrastructure required for greenfield properties;
|
|
•
|
extract the saleable products from the mined iron ore or coal; and
|
|
•
|
maintain the appropriate blend of ore to ensure the final product qualities expected by the customer are achieved.
|
If a project proves not to be economically feasible by the time ArcelorMittal is able to exploit it, ArcelorMittal may incur substantial losses and be obliged to recognize impairments. In addition, potential changes or complications involving metallurgical and other technological processes that arise during the life of a project may result in delays and cost overruns that may render the project not economically feasible.
ArcelorMittal faces rising extraction costs over time as reserves deplete.
Reserves are gradually depleted in the ordinary course of a given mining operation. As mining progresses, distances to the primary crusher and to waste deposits become longer, pits become steeper and underground operations become deeper. As a result, ArcelorMittal usually experiences rising unit extraction costs over time with respect to each of its mines.
18
ArcelorMittal has incurred and may incur in the future operating costs when production capacity is idled or increased costs to resume production at idled facilities.
ArcelorMittal’s decisions about which facilities to operate and at which levels are made based upon customers’ orders for products as well as the capabilities and cost performance of the Company’s facilities. Considering temporary or structural overcapacity in the current market situation, production operations are concentrated at several plant locations and certain facilities are idled in response to customer demand, although operating costs are still incurred at such idled facilities. When idled facilities are restarted, ArcelorMittal incurs costs to replenish raw material inventories, prepare the previously idled facilities for operation, perform the required repair and maintenance activities and prepare employees to return to work safely and resume production responsibilities. Such costs could have an adverse effect on its results of operations or financial condition.
ArcelorMittal has grown through acquisitions and may continue to do so. Failure to manage external growth and difficulties completing planned acquisitions or integrating acquired companies could harm ArcelorMittal’s future results of operations, financial condition and prospects.
The Company was formed and subsequently grew through mergers and acquisitions. After curtailing its large-scale M&A activity for several years following the 2008 financial crisis, it has made several large acquisitions in recent years, including its acquisition (via a joint venture) of Calvert in 2014, its acquisition of Votorantim in 2018 and its acquisition of Ilva S.p.A. and certain of its subsidiaries (“Ilva”), Europe’s largest single steel site and only integrated steelmaker in Italy, also in 2018.
To the extent ArcelorMittal continues to pursue significant acquisitions, financing of such acquisitions may (depending on the structure) result in increased debt, leverage and gearing. Acquisitions also entail increased operating costs, as well as greater allocation of management resources away from daily operations. Managing acquisitions requires the continued development of ArcelorMittal’s financial and management information control systems, the integration of acquired assets with existing operations, the adoption of manufacturing best practices, handling any labor disruptions that may arise, attracting and retaining qualified management and personnel (particularly to work at more remote sites where there is a shortage of skilled personnel) as well as the continued training and supervision of such personnel, and the ability to manage the risks and liabilities associated with the acquired businesses. Failure to manage acquisitions could have a material adverse effect on ArcelorMittal’s business, financial condition, results of operations or prospects.
ArcelorMittal may fail to implement its strategy with respect to Ilva.
The Company may encounter difficulties in integrating Ilva or in implementing its strategy with respect to Ilva. In particular, ArcelorMittal is implementing a major improvements project involving substantial capital expenditures designed to bring Ilva up to and beyond EU environmental standards, to improve the operational performance of Ilva’s assets, to rebuild client confidence and to integrate Ilva’s personnel and apply the Company’s best practices and expertise. There is no guarantee that the Company will be successful in implementing its strategy or in realizing the expected benefits of the acquisition in full or at all.
ArcelorMittal faces risks associated with its proposed acquisition, via a joint venture, of ESIL.
As discussed in “Item 4.A—Information on the Company—History and development of the Company—Key transactions and events in 2018,” ArcelorMittal is in the process of acquiring, via a joint venture with Nippon Steel & Sumitomo Metal Corporation (“NSSMC”), Essar Steel India Limited (“ESIL”) in a bankruptcy resolution process. The joint venture’s proposal, set out in a resolution plan (the “Resolution Plan”) detailing among other things the amount to be paid to existing creditors and towards capital infusion (totaling $6.8 billion and including approximately $340 million of guaranteed working capital adjustment) and the improvements and related capital expenditures (totaling $2.8 billion) to be made over the medium-term, has been approved by the creditors’ committee and is pending final judicial review. The Company provided a $567 million performance guarantee in connection with the execution of the Resolution Plan. Initial financing for the debt repayment and equity infusion has been secured through a $7 billion term facility (or “bridge financing”) agreement.
Should the Resolution Plan be implemented, as is currently expected, it would subject ArcelorMittal to various risks. On the operational front, the industrial project to turnaround ESIL and further improve operational profitability is large-scale and ambitious. While ArcelorMittal has substantial experience in turnaround situations, the scale of this one is particularly
19
large and it is the Company’s inaugural large-scale acquisition in India, an emerging market. Capital expenditure in excess of budgeted amounts, delays and difficulties in achieving commercial objectives therefore cannot be ruled out. The risks in this respect are compounded to an extent by the fact that ESIL is emerging from bankruptcy (meaning, among other things, that maintenance capital expenditures were deferred) and it will be owned and operated by a joint venture with attendant risks around strategic alignment, potential discord and deadlock. On the financial front, there are uncertainties and risks in respect of ArcelorMittal’s exposure (via equity investment in the joint venture and possible guarantee of the joint venture’s debt). While ArcelorMittal and NSSMC currently expect to finance the joint venture through a combination of partnership equity (one-third) and debt (two-thirds), the exact ratio has not yet been determined, and the nature of the long-term debt financing of the joint venture has not yet been defined (including, whether and/or what amounts will be guaranteed by ArcelorMittal and NSSMC). Pending the implementation of long-term financing, ArcelorMittal will guarantee any amounts drawn by the joint venture under the bridge financing.
ArcelorMittal’s greenfield and brownfield investment projects are inherently subject to financing, execution and completion risks.
The Company has announced a number of greenfield or brownfield development projects, in addition to Ilva and ESIL, some of which are or may be ongoing.
See “Item 4.D—Information on the Company—Property, plant and equipment—Capital expenditure projects—Updates on previously announced investment projects” for further information on projects the Company has announced.
To the extent these projects go forward, they would entail substantial capital expenditures, and their timely completion and successful operation may be affected by factors beyond the control of ArcelorMittal. These factors include receiving financing on reasonable terms, obtaining or renewing required regulatory approvals and licenses, securing and maintaining adequate property rights to land and mineral resources, local opposition to land acquisition or project development, managing relationships with or obtaining consents from other shareholders, revision of economic viability projections, demand for the Company’s products, local environmental or health-related conditions, and general economic conditions. Any of these factors may cause the Company to delay, modify or forego some or all aspects of its development projects. The Company cannot guarantee that it will be able to execute its greenfield or brownfield development projects, and to the extent that they proceed, that it will be able to complete them on schedule, within budget, or achieve an adequate return on its investment. Conversely, should the Company decide to postpone or cancel development projects, it could incur various negative consequences such as litigation or impairment charges.
ArcelorMittal faces risks associated with its investments in joint ventures and associates.
ArcelorMittal has investments in various joint ventures and associates. See note 2.4 to ArcelorMittal’s consolidated financial statements. Joint ventures and associates may be controlled and managed by joint venture or controlling partners that may not fully comply with ArcelorMittal’s standards, controls and procedures, including ArcelorMittal’s health, safety, environment and community standards, which could lead to higher costs, reduced production or environmental, health and safety incidents or accidents, which could adversely affect ArcelorMittal’s results and reputation. Joint ventures are also subject to the risk of dead-lock and/or coordination issues affecting the implementation of strategy.
In addition, certain of these joint ventures and associates are currently experiencing, or may in the future experience, difficult operating conditions and/or incur losses. Difficult operating conditions in joint ventures and associates in which ArcelorMittal has invested may expose it to loss of its investment, requirements for additional investments or calls on guarantees. For example, ArcelorMittal’s joint venture Al Jubail’s financial situation has been negatively impacted by a slower than expected ramp-up of operations and may require further funding. ArcelorMittal has provided shareholder loans to assist with funding and additional equity funding is expected from the other partners
.
ArcelorMittal’s loans and receivables to the joint venture were $163 million at December 31, 2018 after recognition of its share in net losses. The Company has also guaranteed $397 million of Al Jubail’s external debt. Due to the failure of other shareholders to provide requisite equity funding by December 31, 2018, the joint venture’s indebtedness became technically in default as of such date. ArcelorMittal’s guarantee of such indebtedness has not been called by the lenders, and ArcelorMittal does not currently expect it to be called. ArcelorMittal is working with the other shareholders in the joint venture to resolve the situation through their contribution of the requisite equity and currently expects the technical default to be cured in the near term. The technical default relates only to the indebtedness of the joint venture and is not expected to affect the availability or maturity of any borrowings of ArcelorMittal. As of December 31, 2018, ArcelorMittal had given $1.1 billion in guarantees on behalf of other associates and joint ventures including $348 million issued on behalf of Calvert and the above mentioned Al Jubail guarantee. See notes 2.4.1, 2.4.2 and 8.3 to ArcelorMittal’s consolidated financial statements.
20
ArcelorMittal’s investments in joint ventures and associates may also result in impairments. For example, in 2015, the Company recorded an impairment charge of $283 million in respect of its joint venture investment in Kalagadi Manganese (Proprietary) Ltd. In May 2018, the Company announced the sale of its 50% shareholding in its joint venture investment in Macsteel Holdings Luxembourg S.à r.l and recorded an impairment of $132 million to adjust the carrying amount of the investment to the expected sale proceeds. As of December 31, 2018, ArcelorMittal’s investments accounted for under the equity method had a book value of $4.9 billion, including DHS Group ($1,015 million), China Oriental ($952 million), Gonvarri ($524 million) and Baffinland ($380 million).
The Significant Shareholder has the ability to exercise significant influence over the outcome of shareholder votes.
As of December 31, 2018, a trust (HSBC Trustee (C.I.) Limited, as trustee), of which Mr. Lakshmi N. Mittal, Mrs. Usha Mittal and their children are the beneficiaries (referred to as the "Significant Shareholder"), beneficially owned (within the meaning of Rule 13d-3 under the Securities Exchange Act of 1934, as amended) shares amounting (when aggregated with ordinary shares of ArcelorMittal and options to acquire ordinary shares held directly by Mr. and Mrs. Mittal) to 382,297,751 shares, representing 37.41% of ArcelorMittal’s outstanding shares. See “
Item 7.A—
Major shareholders and related party transactions—Major shareholders”. As a result, the Significant Shareholder has the ability to significantly influence the decisions adopted at the ArcelorMittal general meetings of shareholders, including matters involving mergers or other business combinations, the acquisition or disposition of assets, issuances of equity and the incurrence of indebtedness. The Significant Shareholder also has the ability to significantly influence a change of control of ArcelorMittal.
The loss or diminution of the services of the Chairman of the Board of Directors and Chief Executive Officer of ArcelorMittal could have an adverse effect on its business and prospects.
The Chairman of the Board of Directors and Chief Executive Officer of ArcelorMittal, Mr. Lakshmi N. Mittal, has for over 30 years contributed significantly to shaping and implementing the business strategy of Mittal Steel and subsequently ArcelorMittal. His strategic vision was instrumental in the creation of the world’s largest and most global steel group. The loss or any diminution of the services of the Chairman of the Board of Directors and Chief Executive Officer could have an adverse effect on ArcelorMittal’s business and prospects. ArcelorMittal does not maintain key person life insurance on its Chairman of the Board of Directors and Chief Executive Officer.
ArcelorMittal is a holding company that depends on the earnings and cash flows of its operating subsidiaries, which may not be sufficient to meet future operational needs or for shareholder distributions, and loss-making subsidiaries may drain cash flow necessary for such needs or distributions.
As a holding company, ArcelorMittal is dependent on the earnings and cash flows of, and dividends and distributions from, its operating subsidiaries to pay expenses, meet its debt service obligations, pay any cash dividends or distributions on its ordinary shares or conduct share buy-backs. Significant cash or cash equivalent balances may be held from time to time at the Company’s international operating subsidiaries, including in particular those in France and the United States, where the Company maintains cash management systems under which most of its cash and cash equivalents are centralized, and in Brazil, Canada, India, Kazakhstan, South Africa and Ukraine. Some of these operating subsidiaries have debt outstanding or are subject to acquisition agreements that impose restrictions on such operating subsidiaries’ ability to pay dividends, but such restrictions are not significant in the context of ArcelorMittal’s overall liquidity. These subsidiaries may also experience operating difficulties that impact their cash flows. ArcelorMittal South Africa, for example, has been experiencing significant difficulties in recent years. In order to decrease its significant outstanding debt, in January 2016, ArcelorMittal South Africa conducted a rights offering entirely underwritten by ArcelorMittal that resulted, via the repayment of an intragroup loan of R3.2 billion (R2.7 billion or $0.2 billion outstanding as of December 31, 2018) and an additional cash injection by ArcelorMittal of approximately R460 million, in ArcelorMittal’s shareholding in ArcelorMittal South Africa increasing from 52% to 71% (see note 2.2.1 to the consolidated financial statements for current ownership).
Repatriation of funds from operating subsidiaries may also be affected by tax and foreign exchange policies in place from time to time in the various countries where the Company operates, though none of these policies are currently significant in the context of ArcelorMittal’s overall liquidity. Under the laws of Luxembourg, ArcelorMittal will be able to pay dividends or distributions only to the extent that it is entitled to receive cash dividend distributions from its subsidiaries, recognize gains from the sale of its assets or record share premium from the issuance of shares.
If the earnings and cash flows of its operating subsidiaries are substantially reduced, ArcelorMittal may not be in a position to meet its operational needs or to make shareholder distributions in line with announced proposals.
21
Changes in assumptions underlying the carrying value of certain assets, including as a result of adverse market conditions, could result in the impairment of such assets, including intangible assets such as goodwill.
At each reporting date, in accordance with the Company’s accounting policy described in note 5.3 to ArcelorMittal’s consolidated financial statements, ArcelorMittal reviews the carrying amounts of its tangible and intangible assets (goodwill is reviewed annually or whenever changes in circumstances indicate that the carrying amount may not be recoverable) to determine whether there is any indication that the carrying amount of those assets may not be recoverable through continuing use. If any such indication exists, the recoverable amount of the asset (or cash generating unit) is reviewed in order to determine the amount of the impairment, if any.
If certain of management’s estimates change during a given period, such as the discount rate, capital expenditures, expected changes to average selling prices, growth rates, shipments and direct costs, the estimate of the recoverable amount of goodwill or the asset could fall significantly and result in impairment. While impairment does not affect reported cash flows, the decrease of the estimated recoverable amount and the related non-cash charge in the consolidated statements of operations could have a material adverse effect on ArcelorMittal’s results of operations. For example, in 2017 and 2016, the Company recorded impairment charges as a result of the annual impairment test of $160 million and $156 million, respectively, related to tangible assets in the ACIS segment. The Company also recognizes impairment in connection with intended sales, when the carrying amount of the disposal group is lower than the sale proceeds. In this context, in 2018, the Company recognized a total impairment charge of $994 million including $888 million in connection with the intended sale of the Ilva remedies and $86 million in relation to the sale of the Votorantim remedies. Following these impairment charges, substantial amounts of goodwill, tangible and intangible assets remain recorded on its balance sheet (there was $5 billion of goodwill for the Company, $3.4 billion of tangible assets and $0.8 billion of goodwill for ACIS on the balance sheet at December 31, 2018). No assurance can be given as to the absence of significant further impairment losses in future periods, particularly if market conditions deteriorate.
ArcelorMittal’s ability to fully utilize its recognized deferred tax assets depends on its profitability and future cash flows.
At December 31, 2018, ArcelorMittal had $8.3 billion
recorded as deferred tax assets on its consolidated statements of financial position, of which $1.4 billion was recorded in 2018 primarily due to the expectation of higher future profits mainly in Luxembourg, including the impact of the share capital conversion. Following the approval of the extraordinary general meeting held on May 16, 2018 to change the share capital of ArcelorMittal S.A. from euro to U.S. dollar, the parent company will file consolidated tax returns in U.S. dollars for the main Luxembourg tax integration going forward, and the related euro denominated tax losses and deferred tax asset were translated into U.S. dollars effective as of January 1, 2018. The deferred tax assets can be utilized only if, and only to the extent that, ArcelorMittal’s operating subsidiaries generate adequate levels of taxable income in future periods to offset the tax loss carry forwards and reverse the temporary differences prior to expiration. At December 31, 2018, the amount of future income required to recover ArcelorMittal’s deferred tax assets of $8.3 billion was at least $32 billion at certain operating subsidiaries.
ArcelorMittal’s ability to generate taxable income is subject to general economic, financial, competitive, legislative, regulatory and other factors that are beyond its control. If ArcelorMittal generates lower taxable income than the amount it has assumed in determining its deferred tax assets, then the value of deferred tax assets will be reduced. In addition, assumptions regarding the future recoverability of deferred tax assets depend on management’s estimates of future taxable income in accordance with the tax laws applicable to ArcelorMittal’s subsidiaries in the countries in which they operate. If in the course of its assessments management determines that the carrying amount of any of its deferred tax assets may not be recoverable pursuant to such prevailing tax laws, the recoverable amount of such deferred tax assets may be impaired.
The Company’s investment projects may add to its financing requirements and adversely affect its cash flows and results of operations.
The steelmaking and mining businesses are capital intensive requiring substantial ongoing maintenance capital expenditure. In addition, ArcelorMittal has announced significant investment projects in the past and some are or may be ongoing. See
“Item 4.D—Information on the Company—Property, plant and equipment—Capital expenditure projects”, “Item 5.F—Operating and financial review and prospects—Tabular disclosure of contractual obligations” and
note 8.4 to ArcelorMittal’s consolidated financial statements. ArcelorMittal expects to fund these capital expenditures primarily through internal sources. Such sources may not suffice, however, depending on the amount of internally generated cash flows and other
22
uses of cash, which may require ArcelorMittal to choose between incurring external financing, further increasing the Company’s level of indebtedness, or foregoing investments in projects targeted for profitable growth.
Underfunding of pension and other post-retirement benefit plans at some of ArcelorMittal’s operating subsidiaries could require the Company to make substantial cash contributions to pension plans or to pay for employee healthcare, which may reduce the cash available for ArcelorMittal’s business.
ArcelorMittal’s principal operating subsidiaries in Brazil, Canada, Europe, South Africa and the United States provide defined benefit pension and other post-retirement benefit plans to their employees. Some of these plans are currently underfunded, see note 7.2 to ArcelorMittal’s consolidated financial statements for the total value of plan assets and any deficit.
ArcelorMittal’s funding obligations depend upon future asset performance, which is tied to equity and debt markets to a substantial extent, the level of interest rates used to discount future liabilities, actuarial assumptions and experience, benefit plan changes and government regulation. Because of the large number of variables that determine pension funding requirements, which are difficult to predict, as well as any legislative action, future cash funding requirements for ArcelorMittal’s pension plans and other post-employment benefit plans could be significantly higher than current estimates. Increases in the general life expectancy assumption have contributed to increases in the defined benefit obligation. ArcelorMittal also makes contributions to a multi-employer pension plan in the U.S. (the Steelworkers Pension Trust) for which it is one of the largest employers. If the other contributors were to default on their obligations, ArcelorMittal would become liable for the plan. In these circumstances, funding requirements could have a material adverse effect on ArcelorMittal’s business, financial condition, results of operations or prospects.
ArcelorMittal could experience labor disputes that may disrupt its operations and its relationships with its customers and its ability to rationalize operations and reduce labor costs in certain markets may be limited in practice or encounter implementation difficulties.
A majority of the employees of ArcelorMittal and of its contractors are represented by labor unions and are covered by collective bargaining or similar agreements, which are subject to periodic renegotiation. Strikes or work stoppages could occur prior to, or during, negotiations preceding new collective bargaining agreements, during wage and benefits negotiations or during other periods for other reasons, in particular in connection with any announced intentions to adapt the footprint. ArcelorMittal may experience strikes and work stoppages at various facilities. Prolonged strikes or work stoppages, which may increase in their severity and frequency, may have an adverse effect on the operations and financial results of ArcelorMittal. The risk of strikes and work stoppages is particularly acute during collective bargaining agreement negotiations. For example, in 2017, there was a 72-hour strike notice given at ArcelorMittal Mont Wright (an iron ore mine in Northern Quebec) after the Company's contract offer was rejected. In 2018, workers at ArcelorMittal Liberia went on strike two times for a duration of 5 days in connection with an inter-union dispute and employee demands and, in May 2018, workers in the railway division of the Company's Kryvyi Rih steel mill in Ukraine went on strike for 4 days to demand higher wages. In the U.S. in September 2018, the United Steelworkers Union authorized a strike after the Company and the Union were unable to reach an agreement prior to the expiration of the existing contract. The parties eventually concluded and ratified a labor agreement on November 29, 2018, without a strike being reported.
Faced with temporary or structural overcapacity in various markets, particularly developed ones, ArcelorMittal has in the past sought and may in the future seek to rationalize operations through temporary or permanent idling and/or closure of plants. These initiatives have in the past and may in the future lead to protracted labor disputes and political controversy.
ArcelorMittal is subject to economic policy, political, social and legal risks and uncertainties in the emerging markets in which it operates or proposes to operate, and these uncertainties may have a material adverse effect on ArcelorMittal’s business, financial condition, results of operations or prospects.
ArcelorMittal operates, or proposes to operate, in a large number of emerging markets. In recent years, many of these countries have implemented measures aimed at improving the business environment and providing a stable platform for economic development. ArcelorMittal’s business strategy has been developed partly on the assumption that this modernization, restructuring and upgrading of the business climate and physical infrastructure will continue, but this cannot be guaranteed. Any slowdown in the development of these economies could have a material adverse effect on ArcelorMittal’s business, financial condition, results of operations or prospects, as could insufficient investment by government agencies or the private sector in physical infrastructure. For example, the failure of a country to develop reliable electricity and natural gas supplies and networks, and any resulting shortages or rationing, could lead to disruptions in ArcelorMittal’s production.
23
Moreover, some of the countries in which ArcelorMittal operates have been undergoing substantial political transformations from centrally-controlled command economies to market-oriented systems or from authoritarian regimes to democratically-elected governments and vice-versa. Political, economic and legal reforms necessary to complete such transformation may not progress sufficiently. On occasion, ethnic, religious, historical and other divisions have given rise to tensions and, in certain cases, wide-scale civil disturbances and military conflict. The political systems in these countries are vulnerable to their populations’ dissatisfaction with their government, reforms or the lack thereof, social and ethnic unrest and changes in governmental policies, any of which could have a material adverse effect on ArcelorMittal’s business, financial condition, results of operations or prospects and its ability to continue to do business in these countries. For example, in Ukraine, political unrest and intermittent combats between the Ukrainian army and pro-Russian rebels in the Donbass region have occurred since Russia’s purported annexation of Crimea in March 2014. In addition, certain of ArcelorMittal’s operations are also located in areas where acute drug-related violence (including executions and kidnappings of non-gang civilians) occurs and the largest drug cartels operate, such as the states of Michoacan, Sinaloa and Sonora in Mexico.
Certain emerging markets where ArcelorMittal has operations have experienced or are experiencing particularly difficult operating conditions. Brazil, for example, is emerging from a period of severe recession and political uncertainty. South Africa entered a recession in the second quarter of 2018, and prior to this recession, the South African steel and mining industries have been subject to a challenging operating environment characterized by lower local demand, increased cheap imports and higher costs, resulting in losses in recent years for ArcelorMittal South Africa.
In addition, epidemics may affect ArcelorMittal’s operations in certain regions. For example, ArcelorMittal operates in Liberia, which underwent an Ebola virus disease epidemic in 2014 and 2015. This affected ArcelorMittal’s operations and projects in Liberia. There can be no assurance that other epidemics will not adversely affect ArcelorMittal’s ongoing operations, production targets and expansion plans, if any, in other markets in which it operates.
In addition, the legal systems in some of the countries in which ArcelorMittal operates remain less than fully developed, particularly with respect to the independence of the judiciary, property rights, the protection of foreign investment and bankruptcy proceedings, generally resulting in a lower level of legal certainty or security for foreign investment than in more developed countries. ArcelorMittal may encounter difficulties in enforcing court judgments or arbitral awards in some countries in which it operates because, among other reasons, those countries may not be parties to treaties that recognize the mutual enforcement of court judgments. Assets in certain countries where ArcelorMittal operates could also be at risk of expropriation or nationalization, and compensation for such assets may be below fair value. For example, the Venezuelan government has implemented a number of selective nationalizations of companies operating in the country to date. Although ArcelorMittal believes that the long-term growth potential in emerging markets is strong, and intends them to be the focus of the majority of its near-term growth capital expenditures, legal obstacles could have a material adverse effect on the implementation of ArcelorMittal’s growth plans and its operations in such countries.
ArcelorMittal’s results of operations could be affected by fluctuations in foreign exchange rates, particularly the euro to U.S. dollar exchange rate, as well as by exchange controls imposed by governmental authorities in the countries where it operates.
ArcelorMittal operates and sells products globally and as a result, its business, financial condition, results of operations or prospects could be adversely affected by fluctuations in exchange rates. A substantial portion of ArcelorMittal’s assets, liabilities, operating costs, sales and earnings are denominated in currencies other than the U.S. dollar (ArcelorMittal’s reporting currency). Accordingly, its results of operations are subject to translation risk (i.e., the USD value of the revenues and profits generated in other currencies and its debt denominated in other currencies) and transaction risk (i.e., a mismatch between the currency of costs and revenues). Foreign exchange losses for the year ended December 31, 2018 were $235 million, primarily related to the effect of the depreciation of the U.S. dollar against the euro on the Company's euro denominated debt in the first quarter of 2018. As of April 1, 2018, the Company’s statement of operations no longer includes foreign exchange exposure on the euro denominated debt following the designation of the euro denominated debt as a hedge of certain euro denominated net investments in foreign operations. See note 6.3 to ArcelorMittal’s consolidated financial statements.
Moreover, ArcelorMittal operates in several countries whose currencies are, or have in the past been, subject to limitations imposed by those countries’ central banks, or which have experienced sudden and significant devaluations. In emerging countries where ArcelorMittal has operations and/or generates substantial revenue, such as Argentina, Brazil, Venezuela, Kazakhstan and Ukraine, the risk of significant currency devaluation is high. For example, the Argentinian peso substantially depreciated during the third quarter of 2018 versus the U.S dollar. and the three-year cumulative inflation rate has exceeded 100% causing Argentina to be now considered as a hyperinflationary economy.
24
Currency devaluations, the imposition of new exchange controls or other similar restrictions on currency convertibility, or the tightening of existing controls in the countries in which ArcelorMittal operates could adversely affect its business, financial condition, results of operations or prospects.
See “Item 4.B—Information on the Company—Business overview—Government regulations—Key currency regulations and exchange controls” and “Item 5—Operating and Financial Review and Prospects—Impact of Exchange Rate Movements.”
Disruptions to ArcelorMittal’s manufacturing processes could adversely affect its operations, customer service levels and financial results.
Steel manufacturing processes are dependent on critical steel-making equipment, such as furnaces, continuous casters, rolling mills and electrical equipment (such as transformers), and such equipment may incur downtime as a result of unanticipated failures or other events, such as fires, explosions or furnace breakdowns. ArcelorMittal’s manufacturing plants have experienced, and may in the future experience, plant shutdowns or periods of reduced production as a result of such equipment failures or other events, one example being the collapse of the oxygen and nitrogen pipelines in November 2018 at ArcelorMittal Temirtau or the fire in a conveyor belt of the coke plant in ArcelorMittal Asturias in Aviles in October 2018. Overall, in 2018, unanticipated operational disruptions reduced steel shipments by approximately 2.5 million tonnes.To the extent that lost production as a result of such a disruption cannot be compensated for by unaffected facilities, such disruptions could have an adverse effect on ArcelorMittal’s operations, customer service levels and results of operations.
Natural disasters or severe weather conditions could damage ArcelorMittal’s production facilities or adversely affect its operations.
Natural disasters could significantly damage ArcelorMittal’s production facilities and general infrastructure. For example, ArcelorMittal Mexico’s production facilities located in Lázaro Cárdenas, Michoacán, Mexico are located in or close to areas prone to earthquakes. The Lázaro Cárdenas area has, in addition, been subject to a number of tsunamis in the past. The site of the joint venture AM/NS Calvert (“Calvert”) in the United States is located in an area subject to tornados and hurricanes. ArcelorMittal also has assets in locations subject to bush fires, specifically in Kazakhstan and South Africa, and to Arctic freeze. More generally, changing weather patterns and climatic conditions in recent years, possibly due to the phenomenon of global warming, have added to the unpredictability and frequency of natural disasters. Damage to ArcelorMittal production facilities due to natural disasters could, to the extent that lost production cannot be compensated for by unaffected facilities, adversely affect its business, results of operations or financial condition.
In addition to natural disasters, ArcelorMittal’s operations can be affected by severe weather conditions. This is due in particular to the long supply chain for certain of its operations and the location of certain operations in areas subject to harsh winter conditions (i.e., the Great Lakes Region, Canada and Kazakhstan). However, other weather events can affect ArcelorMittal's plants like the unusually long period of drought in South Africa, leading to a water crisis situation in April 2018, which threatened the operations of ArcelorMittal Saldanha, and in Brazil, which has experienced a water crisis for the last few years that directly affects industrial production of ArcelorMittal Tubarão. Flooding also affected ArcelorMittal's operations at ArcelorMittal Asturias in Aviles, Spain in June 2018.
Heavy rains during the wet season in Liberia may also cause handling and logistic constraints, as occurred in the third quarter of 2018, impacting shipment volumes.
ArcelorMittal’s insurance policies provide limited coverage, potentially leaving it uninsured against some business risks.
The occurrence of an event that is uninsurable or not fully insured could have a material adverse effect on ArcelorMittal’s business, financial condition, results of operations or prospects. ArcelorMittal maintains insurance on property and equipment in amounts believed to be consistent with industry practices, but it is not fully insured against all such risks. ArcelorMittal’s insurance policies cover physical loss or damage to its property and equipment on a reinstatement basis as arising from a number of specified risks and certain consequential losses, including business interruption arising from the occurrence of an insured event under the policies. Under ArcelorMittal’s property and equipment policies, damages and losses caused by certain natural disasters, such as earthquakes, floods and windstorms, are also covered.
ArcelorMittal also purchases worldwide third-party public and product liability insurance coverage for all of its subsidiaries. Various other types of insurance are also maintained, such as comprehensive construction and contractor insurance for its greenfield and major capital expenditures projects, directors and officers liability, transport, and charterers’ liability, as well as other customary policies such as car insurance, travel assistance and medical insurance.
In addition, ArcelorMittal maintains trade credit insurance on receivables from selected customers, subject to limits that it believes are consistent with those in the industry, in order to protect it against the risk of non-payment due to customers’
25
insolvency or other causes. Not all of ArcelorMittal’s customers are or can be insured, and even when insurance is available, it may not fully cover the exposure.
Notwithstanding the insurance coverage that ArcelorMittal and its subsidiaries carry, the occurrence of an event that causes losses in excess of limits specified under the relevant policy, or losses arising from events not covered by insurance policies, could materially harm ArcelorMittal’s financial condition and future operating results.
Product liability claims could have a significant adverse financial impact on ArcelorMittal.
ArcelorMittal sells products to major manufacturers engaged in manufacturing and selling a wide range of end products. ArcelorMittal also from time to time offers advice to these manufacturers. Furthermore, ArcelorMittal’s products are also sold to, and used in, certain safety-critical applications, such as, for example, pipes used in gas or oil pipelines and in automotive applications. There could be significant consequential damages resulting from the use of or defects in such products. ArcelorMittal has a limited amount of product liability insurance coverage, and a major claim for damages related to ArcelorMittal products sold and, as the case may be, advice given in connection with such products could leave ArcelorMittal uninsured against a portion or the entirety of the award and, as a result, materially harm its financial condition and future operating results.
ArcelorMittal is subject to regulatory and compliance risks, which may expose it to investigations by governmental authorities, litigation and fines, in relation, among other things, to its pricing and marketing practices or other antitrust matters. The resolution of such matters could negatively affect the Company’s profitability and cash flows in a particular period or harm its reputation.
ArcelorMittal is the largest steel producer in the world. As a result, ArcelorMittal may be subject to exacting scrutiny from regulatory authorities and private parties, particularly regarding its trade practices and dealings with customers and counterparties. As a result of its position in steel markets and its historically acquisitive growth strategy, ArcelorMittal could be subject to governmental investigations and lawsuits based on antitrust laws in particular. These could require significant expenditures and result in liabilities or governmental orders that could have a material adverse effect on ArcelorMittal’s business, operating results, financial condition and prospects. ArcelorMittal and certain of its subsidiaries are currently under investigation by governmental entities in several countries, and are named as defendants in a number of lawsuits relating to various antitrust matters. See note 8.3 to ArcelorMittal’s consolidated financial statements. Antitrust proceedings, investigations and follow-on claims involving ArcelorMittal subsidiaries are also currently pending in various countries including Brazil and Germany.
Because of the fact-intensive nature of the issues involved and the inherent uncertainty of such litigation and investigations, the nature of the resolutions of such proceedings are difficult to forecast but negative outcomes are possible. An adverse ruling in the proceedings described above or in other similar proceedings in the future could subject ArcelorMittal to substantial administrative penalties and/or civil damages. In cases relating to other companies, civil damages have been as high as hundreds of millions of U.S. dollars in major civil antitrust proceedings during the last decade. In addition, ArcelorMittal operates in many jurisdictions around the world, increasing the risk of non-compliance with laws and regulations in relation to anti-corruption, economic sanctions and other ethical matters, despite its compliance policies and procedures. Unfavorable outcomes in current and potential future litigation and investigations could reduce ArcelorMittal’s liquidity and negatively affect its profitability, cash flows, results of operations and financial condition, as well as harm its reputation.
ArcelorMittal is currently and in the future may be subject to legal proceedings, the resolution of which could negatively affect the Company’s profitability and cash flows in a particular period.
ArcelorMittal’s profitability or cash flows in a particular period could be affected by adverse rulings in legal proceedings currently pending or by legal proceedings that may be filed against the Company in the future. See note 8.3 to ArcelorMittal’s consolidated financial statements.
ArcelorMittal’s business is subject to an extensive, complex and evolving regulatory framework and its governance and compliance processes may fail to prevent regulatory penalties and reputational harm, whether at operating subsidiaries, joint ventures or associates.
ArcelorMittal operates in a global environment, and, at a time of increased enforcement activity and enforcement initiatives worldwide, its business straddles multiple jurisdictions and complex regulatory frameworks. Such regulatory frameworks, including but not limited to the area of economic sanctions, are constantly evolving, and ArcelorMittal may as a result become
26
subject to increasing limitations on its business activities and to the risk of fines or other sanctions for non-compliance. Moreover, ArcelorMittal’s governance and compliance processes, which include the review of internal controls over financial reporting, may not prevent breaches of law or accounting or governance standards at the Company or its subsidiaries. The risk of violation is also present at the Company’s joint ventures and associates where ArcelorMittal has only a non-controlling stake and does not control governance practices or accounting and reporting procedures.
In addition, ArcelorMittal may be subject to breaches of its Code of Business Conduct, other rules and protocols for the conduct of business, as well as to instances of fraudulent behavior and dishonesty by its employees, contractors or other agents. The Company’s failure to comply with applicable laws and other standards could subject it to fines, litigation, loss of operating licenses and reputational harm.
The income tax liability of ArcelorMittal may substantially increase if the tax laws and regulations in countries in which it operates change or become subject to adverse interpretations or inconsistent enforcement.
Taxes payable by companies in many of the countries in which ArcelorMittal operates are substantial and include value-added tax, excise duties, profit taxes, payroll-related taxes, property taxes, mining taxes and other taxes. Tax laws and regulations in some of these countries may be subject to frequent change, varying interpretation and inconsistent enforcement. Ineffective tax collection systems and national or local government budget requirements may increase the likelihood of the imposition of arbitrary or onerous taxes and penalties, which could have a material adverse effect on ArcelorMittal’s financial condition and results of operations. In addition to the usual tax burden imposed on taxpayers, these conditions create uncertainty as to the tax implications of various business decisions. This uncertainty could expose ArcelorMittal to significant fines and penalties and to enforcement measures despite its best efforts at compliance, and could result in a greater than expected tax burden. See note 9 to ArcelorMittal’s consolidated financial statements.
In addition, many of the jurisdictions in which ArcelorMittal operates have adopted transfer pricing legislation. If tax authorities impose significant additional tax liabilities as a result of transfer pricing adjustments, it could have a material adverse effect on ArcelorMittal’s financial condition and results of operations.
It is possible that tax authorities in the countries in which ArcelorMittal operates will introduce additional revenue raising measures. The introduction of any such provisions may affect the overall tax efficiency of ArcelorMittal and may result in significant additional taxes becoming payable. Any such additional tax exposure could have a material adverse effect on the Company’s financial condition and results of operations.
ArcelorMittal may face a significant increase in its income taxes if tax rates increase or the tax laws or regulations in the jurisdictions in which it operates, or treaties between those jurisdictions, are modified in an adverse manner. This may adversely affect ArcelorMittal’s cash flows, liquidity and ability to pay dividends.
ArcelorMittal’s reputation and business could be materially harmed as a result of data breaches, data theft, unauthorized access or successful hacking.
ArcelorMittal’s operations depend on the secure and reliable performance of its information technology systems. An increasing number of companies, including ArcelorMittal, have recently experienced intrusion attempts or even breaches of their information technology security, some of which have involved sophisticated and highly targeted attacks on their computer networks. ArcelorMittal’s corporate website was the target of a hacking attack in January 2012, which brought the website down for several days, and phishing, ransomware and virus attacks have been increasing in more recent years through 2018, with WannaCry impacting the Company in March 2018. Implementation of digitalization, Industry 4.0 and Cloud computing result in new risks with increasing threats to ArcelorMittal's operations and systems.
Because the techniques used to obtain unauthorized access, disable or degrade service or sabotage systems change frequently and often are not recognized until launched against a target, the Company may be unable to anticipate these techniques or to implement in a timely manner effective and efficient countermeasures.
If unauthorized parties attempt or manage to bring down the Company’s website or force access into its information technology systems, they may be able to misappropriate confidential information, cause interruptions in the Company’s operations, damage its computers or process control systems or otherwise damage its reputation and business. In such circumstances, the Company could be held liable or be subject to regulatory or other actions for breaching confidentiality and personal data protection rules
.
Any compromise of the security of the Company’s information technology systems could result in a loss of confidence in the Company’s security measures and subject it to litigation, civil or criminal penalties, and adverse publicity that could adversely affect its reputation, financial condition and results of operations.
27
Changes to global data privacy laws and cross-border transfer requirements could adversely affect ArcelorMittal's business and operations.
ArcelorMittal's business depends on the transfer of data between its affiliated entities, to and from its business partners, and with third-party service providers, which may be subject to global data privacy laws and cross-border transfer restrictions. While ArcelorMittal takes steps to comply with these legal requirements, the volatility and changes to the applicability of those laws, as well as evolving standards and judicial and regulatory interpretations of such laws may impact ArcelorMittal’s ability to effectively transfer data across borders in support of its business operations and lead to possible administrative, civil, or criminal liability, as well as reputational harm to the Company and its employees. ArcelorMittal has taken actions necessary to comply with the European Union’s General Data Protection Regulation ("GDPR"), which became enforceable in May 2018. The GDPR creates a range of compliance obligations for subject companies and increases financial penalties for non-compliance. Other countries in which ArcelorMittal operates or has a presence such as Brazil, India and South Africa have or are in the process of adopting similar legislation for the protection of personal information. Ensuring compliance will require investments to improve business processes, IT solutions and security solutions.
The costs of compliance with GDPR and similar legislation for the protection of personal data and the potential for fines and penalties in the event of a breach of these laws may have an adverse effect on ArcelorMittal's business and operations.
U.S. investors may have difficulty enforcing civil liabilities against ArcelorMittal and its directors and senior management.
ArcelorMittal is incorporated under the laws of the Grand Duchy of Luxembourg with its principal executive offices and corporate headquarters in Luxembourg. The majority of ArcelorMittal’s directors and senior management are residents of jurisdictions outside of the United States. The majority of ArcelorMittal’s assets and the assets of these persons are located outside the United States. As a result, U.S. investors may find it difficult to effect service of process within the United States upon ArcelorMittal or these persons or to enforce outside the United States judgments obtained against ArcelorMittal or these persons in U.S. courts, including actions predicated upon the civil liability provisions of the U.S. federal securities laws. Likewise, it may also be difficult for an investor to enforce in U.S. courts judgments obtained against ArcelorMittal or these persons in courts in jurisdictions outside the United States, including actions predicated upon the civil liability provisions of the U.S. federal securities laws. It may also be difficult for a U.S. investor to bring an original action in a Luxembourg court predicated upon the civil liability provisions of the U.S. federal securities laws against ArcelorMittal’s directors and senior management and non-U.S. experts named in this annual report.
|
ITEM 4.
|
INFORMATION ON THE COMPANY
|
A.
History and development of the Company
ArcelorMittal is the world’s leading integrated steel and mining company. It results from the merger in 2007 of its predecessor companies Mittal Steel Company N.V. and Arcelor, each of which had grown through acquisitions over many years. Since its creation ArcelorMittal has experienced periods of external growth as well consolidation and deleveraging (including through divestments), the latter in particular during the years following the global financial and economic crises of 2008-2010. In recent years ArcelorMittal has punctuated its overall deleveraging focus with targeted acquisitions. These have included the acquisition through a joint venture of the Calvert plant in the United States in 2014 and, in 2018 the acquisition of Votorantim S.A.'s long business in Brazil and Ilva in Italy, Europe's largest single steel site. Most recently the Company is poised (subject to favorable resolution of legal challenges) to acquire ESIL (via a joint venture with NSSMC), its bid having been selected by ESIL’s committee of creditors. For more information on the key transactions carried out in 2018, see “—Key transactions and events in 2018” below.
ArcelorMittal's success is built on its core values of sustainability, quality and leadership and the entrepreneurial boldness that has empowered its emergence as the first truly global steel and mining company. Acknowledging that a combination of structural issues and macroeconomic conditions will continue to challenge returns in its sector, the Company has adapted its footprint to the new demand realities, redoubled its efforts to control costs and repositioned its operations with a view toward
28
outperforming its competitors. ArcelorMittal’s research and development capability is strong and includes several major research centers as well as strong academic partnerships with universities and other scientific bodies.
Against this backdrop, ArcelorMittal's strategy is to leverage four distinctive attributes that will enable it to capture leading positions in the most attractive areas of the steel industry’s value chain, from mining at one end to distribution and first-stage processing at the other: global scale and scope; superior technical capabilities; a diverse portfolio of steel and related businesses, one of which is mining; and financial capabilities.
The Company’s strategy is further detailed under “Item 4.B—Information on the Company—Business overview—Business strategy”.
Geography:
ArcelorMittal is the largest steel producer in the Americas, Africa and Europe and is the fifth largest steel producer in the CIS region. ArcelorMittal has steel-making operations in 19 countries on four continents, including 48 integrated and mini-mill steel-making facilities. As of December 31, 2018, ArcelorMittal had approximately 209,000 employees.
ArcelorMittal’s steel-making operations have a high degree of geographic diversification. Approximately 38% of its crude steel is produced in the Americas, approximately 48% is produced in Europe and approximately 14% is produced in other countries, such as Kazakhstan, South Africa and Ukraine. In addition, ArcelorMittal’s sales of steel products are spread over both developed and developing markets, which have different consumption characteristics. ArcelorMittal’s mining operations, present in North and South America, Africa, Europe and the CIS region, are integrated with its global steel-making facilities and are important producers of iron ore and coal in their own right.
Products:
ArcelorMittal produces a broad range of high-quality finished and semi-finished steel products (“semis”). Specifically, ArcelorMittal produces flat steel products, including sheet and plate, and long steel products, including bars, rods and structural shapes. In addition, ArcelorMittal produces pipes and tubes for various applications. ArcelorMittal sells its steel products primarily in local markets and through its centralized marketing organization to a diverse range of customers in approximately 160 countries including the automotive, appliance, engineering, construction and machinery industries. The Company also produces various types of mining products including iron ore lump, fines, concentrate and sinter feed, as well as coking, PCI and thermal coal.
As a global steel producer, the Company is able to meet the needs of different markets. Steel consumption and product requirements clearly differ between developed markets and developing markets. Steel consumption in developed economies is weighted towards flat products and a higher value-added mix, while developing markets utilize a higher proportion of long products and commodity grades. To meet these diverse needs, the Company maintains a high degree of product diversification and seeks opportunities to increase the proportion of higher value-added products in its product mix.
Automotive focus:
ArcelorMittal has a leading market share in its core markets in the automotive steel business and is a leader in the fast-growing advanced high strength steels segment. ArcelorMittal is the first steel company in the world to embed its own engineers within an automotive customer to provide engineering support. The Company begins working with original equipment manufacturers (“OEMs”) as early as five years before a vehicle reaches the showroom, to provide generic steel solutions, co-engineering and help with the industrialization of the project. In November 2016, ArcelorMittal introduced a new generation of advanced high strength steels, including new press hardenable steels and martensitic steels. Together, these new steel grades aim to help automakers further reduce body-in-white weight to improve fuel economy without compromising vehicle safety or performance. In November 2017, ArcelorMittal launched the second generation of its iCARe® electrical steels. iCARe® steel grades play a central role in the construction of electric motors.
See “Item 4.B— Information on the Company—Business overview—Competitive strengths—Research and development” below for further detail.
Mining Value Chain:
ArcelorMittal has a significant portfolio of raw material and mining assets. In 2018, approximately 49% of ArcelorMittal’s iron-ore requirements and approximately 12% of its PCI and coal requirements were supplied from its own mines. The Company currently has iron ore mining activities in Brazil, Bosnia, Canada, Kazakhstan, Liberia, Mexico, Ukraine and the United States. The Company currently has coal mining activities in Kazakhstan and the United States.
In addition, ArcelorMittal produces substantial amounts of direct reduced iron, or DRI, which is a scrap substitute used in its mini-mill facilities to supplement external metallics purchases. ArcelorMittal is also a significant producer of coke, which is produced from metallurgical coal and is a critical raw material for steel-making, satisfying 91% of its coke needs through its own production facilities. ArcelorMittal’s facilities have good access to shipping facilities, including through ArcelorMittal’s own, or partially owned, 15 deep-water port facilities and linked railway sidings.
29
ArcelorMittal has its own downstream steel distribution business, primarily run through its Europe segment. It also provides value-added and customized steel solutions through additional processing activities to meet specific customer requirements.
Key transactions and events in 2018
ArcelorMittal’s principal investments, acquisitions and disposals, and other key events that occurred during the year ended December 31, 2018 are summarized below.
For further information on ArcelorMittal’s ongoing capital expenditure projects, see “Item 4.D—Information on the Company—property, plant and equipment—Capital expenditure projects”.
Acquisition of Ilva
On November 1, 2018, ArcelorMittal announced that AM InvestCo Italy S.r.l ("AM Investco") completed the acquisition of Ilva, after having been granted merger clearance by the European Commission ("EC") on May 7, 2018 on the basis of the Company’s committed divestment package (see below) and fulfilling all of the conditions precedent in ArcelorMittal’s contract with the Italian government for the lease and subsequent purchase of Ilva, including the labor agreement with Ilva’s trade unions, which was reached on September 6, 2018. Ilva is Europe’s largest single steel site and only integrated steelmaker in Italy with its main production facility based in Taranto. Ilva also has significant steel finishing capacity in Taranto, Novi Ligure and Genova. As a result of the lease agreement, the assets and liabilities subject to the transaction are leased by subsidiaries of AM InvestCo, including ArcelorMittal Italia S.p.A. The purchase price amounts to €1.8 billion ($2.1 billion) subject to certain adjustments, with annual leasing costs of €180 million ($206 million) to be paid in quarterly installments, with rental payments qualifying as down payments against the purchase price. The lease is for a minimum period of four years. The agreement includes industrial capital expenditure commitments of approximately €1.3 billion ($1.4 billion) over a seven-year period focused on blast furnaces including €0.2 billion revamping of blast furnace #5 intending to bring steel production to 8 million tonnes by 2024, steel shops and finishing lines and environmental capital expenditure commitments of approximately €0.8 billion ($0.9 billion) including €0.3 billion for stock pile coverage, €0.2 billion for reduction of emissions at coke ovens and €0.2 billion in waste water treatment. The agreement also includes environmental remediation obligations of approximately €0.5 billion ($0.6 billion), the latter of which will be funded with funds seized by the Italian Government from the former shareholder. As part of the labor agreement with Ilva’s trade unions, of Ilva’s 13,800 employees, 10,700 were hired by ArcelorMittal. In addition, between 2023 and 2025, the Company has committed to hire any workers who remain under Ilva’s extraordinary administration. The Company has identified synergies of €310 million, which are targeted to be realized by 2020. ArcelorMittal is the principal partner in AM InvestCo with a 94.45% equity stake in the consortium, with Banca Intesa Sanpaolo ("ISP") holding 5.55%. ISP's interest is subject to put and call option arrangements exercisable by ArcelorMittal and ISP between November 1, 2020 and November 1, 2025 and between November 1, 2021 and November 1, 2025, respectively. Following completion of the transaction, ArcelorMittal has assumed full management control of Ilva, which forms a new business cluster within ArcelorMittal Europe - Flat Products and has been renamed ArcelorMittal Italia. See Note 2.2.4 to ArcelorMittal’s consolidated financial statements for further details.
Ilva related Divestments
On October 12, 2018 and November 2, 2018 ArcelorMittal received two binding offers from Liberty House Group (“Liberty House”) for the acquisition of ArcelorMittal Ostrava (Czech Republic), ArcelorMittal Galati (Romania), ArcelorMittal Skopje (North Macedonia), ArcelorMittal Piombino (Italy), the Company's only galvanized steel plant in Italy, ArcelorMittal Dudelange (Luxembourg) and the following finishing lines at ArcelorMittal Liège (Belgium): hot dipped galvanizing lines 4 and 5 in Flémalle, hot-rolled pickling, cold rolling and tin packaging lines in Tilleur. All assets are part of a divestment package the Company agreed to with the EC during its merger control investigation into the Company’s acquisition of Ilva. On January 23, 2019, the Company submitted to the EC a revised offer from Liberty House in respect of the same package of assets. Transaction closing is conditional on EC approval and the conclusion of consultations with local and European Works Councils.
ESIL
On March 2, 2018, ArcelorMittal announced the signature of a joint venture formation agreement with NSSMC in relation to its offer to acquire ESIL, which was subsequently amended and restated on January 22, 2019. On April 2, 2018, ArcelorMittal submitted an offer (the "Offer") in the re-bidding process for ESIL. On October 17, 2018, following a judgment from the Supreme Court of India on October 4, 2018, ArcelorMittal announced that it had approved a payment of 7,469 crore
30
rupees (approximately $1 billion, subsequently paid) to the financial creditors of Uttam Galva and KSS Petron in order that the Offer would be eligible for consideration by ESIL's Committee of Creditors ("CoC"). ArcelorMittal had previously been a shareholder of Uttam Galva and HSBC Trustee (C. I.) Limited, as trustee of trusts of which Mr. Lakshmi N. Mittal, Mrs. Usha Mittal and their children are the beneficiaries, had previously been a shareholder of KSS Petron. At the time of such payment, neither had any interest in such companies and, in particular, the trusts and their beneficiaries did not have any liability to KSS Petron or its creditors or other stakeholders and hence did not benefit from such payment.
On October 19, 2018, ArcelorMittal was evaluated the H1 Resolution Applicant (the preferred bidder) by the CoC of ESIL and on October 26, 2018, ArcelorMittal announced that the CoC voted to approve the Company’s acquisition plan for ESIL (the "Resolution Plan"). ESIL’s Resolution Professional, on behalf of the CoC, issued the Company with a Letter of Intent ("LOI") stating that the Company was identified as the "Successful Resolution Applicant".
The Resolution Plan includes an upfront payment of 42,000 crore rupees (approximately $5.7 billion) towards ESIL’s debt resolution, with a further 8,000 crore rupees (approximately $1.1 billion) of capital injection into ESIL to support operational improvement, increase production levels and deliver enhanced levels of profitability.
The Company provided a $0.6 billion performance guarantee in connection with the execution of the Resolution Plan.
In line with ESIL’s corporate insolvency process, ArcelorMittal’s Resolution Plan must now be formally accepted by India’s National Company Law Tribunal (“NCLT”) before completion. The NCLT has completed hearing the CoC's application for the approval of the Resolution Plan, as well as objections and challenges from different parties, including creditors of ESIL and the current shareholder. While it is difficult to predict the timing of an NCLT approval, a decision is expected in the first quarter of 2019 and the amounts of debt payment and capital injection specified in the Resolution Plan would become payable promptly after such approval is obtained.
ESIL is an integrated flat steel producer, and the largest steel company in western India.
ESIL’s main steel manufacturing facility is located at Hazira, Gujarat in Western India. It also has:
|
–
|
Two iron ore beneficiation plants close to the mines in Kirandul and Dabuna, with slurry pipelines that then transport the beneficiated iron ore slurry to the pellet plants in the Kirandul-Vizag and Dabuna-Paradeep systems;
|
|
–
|
a downstream facility in Pune (including a pickling line, a cold rolling mill, a galvanizing mill, a color coating mill and a batch annealing plant); and
|
|
–
|
seven service centers in the industrial clusters of Hazira, Bhuj, Indore, Bahadurgarh, Chennai, Kolkata and Pune. It has a complete range of flat rolled steel products, including value added products, and significant iron ore pellet capacity with two main pellet plant systems in Kirandul-Vizag and Dabuna-Paradeep, which have the potential for expansion. Its facilities are located close to ports with deep draft for movement of raw materials and finished goods.
|
In terms of iron ore pellet capacity, the Kirandul-Vizag system has
8 million
tonnes of annual pellet capacity and the Dabuna-Paradeep system has 6 million tonnes of annual pellet capacity, which is in the process of being expanded to a new capacity level of
12 million
tonnes. This expansion would bring pellet capacity above Essar’s own requirements and provide the opportunity to improve operating income by fully utilizing such pellet capacity.
The Resolution Plan includes a capital expenditure plan of 18,697 crore (approximately
$2.8 billion
) to be implemented in two stages over six years. The first stage would involve investments to increase the production of finished steel goods sustainably
to
6.5 million
tonnes per annum and includes completion of ongoing capital expenditure projects with respect to a coke oven, second sinter plant, third line CSP caster, Paradeep pellet plant and Dabuna beneficiation plant. The first stage will also include investment in maintenance to restore current assets, the implementation of an environmental management plan and the implementation of ArcelorMittal’s best practices on raw material sourcing, plant operations, sales and product mix (in particular through greater sophistication of the quality and markets of the steel produced with a focus on developing sales to the automotive industry), people management and health & safety. The second stage would involve investments to increase the production of finished steel goods from
6.5 million
tonnes per annum to
8.5 million
tonnes per annum by the end of 2024, including asset reconfiguration and the addition of a coke oven, blast furnace and basic oven furnace.
There is also a long-term aspiration to increase finished steel shipments to between
12
and
15 million
tonnes through the addition of new iron and steelmaking assets, so that ESIL can play an active role and fully benefit from the anticipated growth in the Indian steel industry.
31
After completion, ArcelorMittal expects jointly to own and operate ESIL in partnership with NSSMC, Japan’s largest steel producer and the third largest steel producer in the world, in-line with a joint venture formation agreement signed with NSSMC (the “Joint Venture”). ArcelorMittal and NSSMC currently expect to finance the Joint Venture through a combination of partnership equity (one-third) and debt (two-thirds), and ArcelorMittal anticipates that its investment in the Joint Venture will be equity accounted.
On November 20, 2018, ArcelorMittal entered into a $7 billion term facilities agreement (the “Term Facilities Agreement”) with a group of lenders in connection with the acquisition of ESIL. The agreement has a term of one year (i.e., until November 20, 2019), subject to ArcelorMittal’s option to extend the term by six months. The facility may be used for certain payments by ArcelorMittal as well as by the Joint Venture. Any amounts borrowed by the Joint Venture under the agreement are irrevocably and unconditionally guaranteed by ArcelorMittal. The Term Facilities Agreement includes the following financial covenant: ArcelorMittal must ensure that the “Leverage Ratio”, being the ratio of “Consolidated Total Net Borrowings” (consolidated total borrowings less consolidated cash and cash equivalents) to “Consolidated EBITDA” (the consolidated net pre-taxation profits of the ArcelorMittal group for a Measurement Period, subject to certain adjustments as defined in the facilities), at the end of each “Measurement Period” (each period of 12 months ending on the last day of a financial half-year or a financial year of ArcelorMittal), is not greater than a ratio of 4.25 to one. The Term Facilities Agreement is also subject to certain mandatory prepayment events, including as a result of the use of proceeds from debt capital market issuances by the Group or capital raising by the Joint Venture and certain other disposals, in each case above $1 billion.
ESIL’s assets do not include certain assets that are ancillary to the steel plant, such as a slurry pipeline, power plants and port facilities. AM and NSSMC are visiting some of these facilities in light of the planned acquisition of ESIL to understand the supply arrangements for raw materials and power for the steel mill.
Acquisition of Votorantim Siderurgia.
In February 2018, the Brazilian antitrust authority ("CADE") approved the acquisition by ArcelorMittal of Votorantim Siderurgia, subject to certain divestments. The closing of the transaction occurred on April 1, 2018, and Votorantim Siderurgia, under the new corporate name of ArcelorMittal Sul Fluminense (“AMSF”), became a subsidiary of ArcelorMittal Brasil.
The combination of the businesses resulted in a long product steel producer with annual crude steel capacity of 5.1 million metric tonnes. This acquisition aims to create value through cost, logistical and operational synergies totaling approximately $110 million per annum. See Note 2.2.4 to ArcelorMittal’s consolidated financial statements for further details. In particular, the combination results in geographically complementary production facilities (i.e., ArcelorMittal’s Monelevade, Juiz de Fora and Piracicaba facilities and Votorantim’s Barra Mansa and Resende plants and its 50% interest in the joint venture Sitrel in Três Lagoas).
CADE’s approval was subject to the fulfillment of certain divestment commitments which were completed in early May. The divestments included ArcelorMittal Brasil’s two production sites of Cariacica and Itaúna, as well as some wire drawing equipment. See Note 2.3.1 to ArcelorMittal’s consolidated financial statements for further details.
Other Events in 2018
|
•
|
During 2018, ArcelorMittal completed several debt financing and repayment transactions. Please refer to “Item 5B—Operating and financial review and prospects—Liquidity and capital resources—Financings” for a summary of the transactions.
|
|
•
|
On May 16, 2018, the extraordinary general meeting of shareholders of ArcelorMittal held in Luxembourg approved the resolution on the agenda to change the currency of the share capital from euro to U.S. dollar.
|
|
•
|
On March 26, 2018, ArcelorMittal completed a share buyback program. ArcelorMittal repurchased 7 million shares for a total value €184 million ($226 million) at an average price per share of €26.34.
|
|
•
|
On March 5, 2018, ArcelorMittal announced that Aditya Mittal, CFO of ArcelorMittal and CEO of ArcelorMittal Europe, was appointed as President, ArcelorMittal, in addition to his current responsibilities. This nomination reflects the increasing global strategic role Aditya Mittal has across the group, supporting the Chairman and CEO, Mr.
|
32
Lakshmi Mittal. As President and CFO, he will continue to report to the Chairman and CEO. Together, Mr. Mittal and Aditya Mittal comprise the CEO office.
Recent developments
|
•
|
On February 19, 2019, ArcelorMittal announced the completion of its share buyback program on February 15, 2019 (the "2019 Program"). The Company repurchased 4 million shares for a total value of approximately $90 million (€80 million) at an approximate average price per share of €19.89 ($22.42) pursuant to the 2019 Program that was announced on February 7, 2019. The 2019 Program was completed under the authorization given by the annual general meeting of shareholders held on May 5, 2015 and applicable market abuse regulations. The shares acquired under the 2019 Program are intended to meet ArcelorMittal's obligations arising from employee share programs.
|
33
Other information
ArcelorMittal is a public limited liability company (
société anonyme
) that was incorporated for an unlimited period under the laws of the Grand Duchy of Luxembourg on June 8, 2001. ArcelorMittal is registered at the R.C.S. Luxembourg under number B 82.454.
The mailing address and telephone number of ArcelorMittal’s registered office are:
|
ArcelorMittal
|
|
24-26, Boulevard d’Avranches
|
|
L-1160 Luxembourg
|
|
Grand Duchy of Luxembourg
|
|
Telephone: +352 4792-1
|
ArcelorMittal’s agent for U.S. federal securities law purposes is:
|
ArcelorMittal USA LLC
|
|
1 South Dearborn Street, 19th floor
|
|
Chicago, Illinois 60603
|
|
United States of America
|
|
Telephone: + 1 312 899-3985
|
Internet site
ArcelorMittal maintains an Internet site at www.arcelormittal.com. Information contained on or otherwise accessible through this Internet site is not a part of this annual report. All references in this annual report to this Internet site are inactive textual references to this URL and are for information only.
The SEC maintains an internet site that contains reports, proxy and information statements, and other information regarding issuers that file electronically with the SEC at www.sec.gov.
B. Business overview
Business strategy
ArcelorMittal’s success is built on its core values of sustainability, quality and leadership and the entrepreneurial boldness that has empowered its emergence as the first truly global steel and mining company. Acknowledging that a combination of structural issues and macroeconomic conditions will continue to challenge returns in its sector, the Company has adapted its footprint to the new demand realities, intensified its efforts to control costs and repositioned its operations to outperform its competitors.
Against this backdrop, ArcelorMittal's strategy is to leverage four distinctive attributes that will enable it to capture leading positions in the most attractive areas of the steel industry value chain, from mining at one end to distribution and first-stage processing at the other:
|
•
|
Global scale and scope
|
|
•
|
Unmatched technical capabilities
|
|
•
|
Diverse portfolio of steel and related businesses, particularly mining
|
|
•
|
Financial capability.
|
Three themes
Steel
. ArcelorMittal looks to expand its leadership role in attractive markets and segments by leveraging the Company’s technical capabilities and its global scale and scope. These are critical differentiators for sophisticated customers that value the distinctive technical and service capabilities the Company offers. Such customers are typically found in the automotive, energy,
34
infrastructure and a number of smaller markets where ArcelorMittal is a market leader. In addition, the Company is present in, and will further develop, attractive steel businesses that benefit from favorable market structures or geographies. In developing attractive steel businesses, ArcelorMittal’s goal is to be the supplier of choice by anticipating customers’ requirements and exceeding their expectations. It will invest to develop and grow these businesses and enhance its ability to serve its customers. Given the current environment, that investment will be highly disciplined. Commodity steel markets will inevitably remain an important part of ArcelorMittal’s steel portfolio. Here, a lean cost structure should limit the downside in weak markets while allowing the Company to capture the upside in strong markets.
Mining.
ArcelorMittal is working to continue to create value from its world-class mining business. Mining forms part of the steel value chain but typically enjoys a number of structural advantages, such as a steeper cost curve. The Company's strategy is to create value from its most significant assets, through selective expansion/de-bottlenecking, by controlling cost and capital expenditure, and by supplying products that are highly valued by steel producers. ArcelorMittal's financial capability allowed it to continue to invest in key mining assets (notably ArcelorMittal Mines and Infrastructure Canada), while the diversity of its steel and mining portfolio facilitates the ability of the mining business to optimize the value of its products in the steelmaking process. The Company's mining business aspires to be the supplier of choice for a balanced mix of both internal and external customers, while at the same time providing a natural hedge against market volatility for its steel operations.
All operations.
ArcelorMittal strives to achieve best-in-class competitiveness. Operational excellence, including health and safety, the number one priority, is at the core of the Company's strategy in both steel and mining. The Company steadily optimizes its asset base to ensure it is achieving high operating rates at its best assets. Its technical capabilities and the diversity of its portfolio of businesses underpin a strong commitment to institutional learning and continuous improvement through measures such as benchmarking and best-practice sharing. Innovation in products and processes also plays an important role while supporting overall competitiveness.
Five key strategic enablers
Critical to implementing this strategy are five key enablers:
A clear license to operate.
Many of ArcelorMittal's businesses are located in regions that are in the early stages of economic development. Practically all are resource-intensive. The Company recognizes that it has an obligation to act responsibly towards all stakeholders. ArcelorMittal's commitment to sustainability is outlined below. See "Item 4.B—Information on the Company—Business overview—Competitive strengths—Sustainable development." Sustainability is a core value that underlies ArcelorMittal's efforts to be both the world’s safest steel and mining company and a responsible environmental steward.
A decentralized organizational structure.
ArcelorMittal's scale and scope are defining characteristics that give it a competitive advantage. They also introduce complexity and the risks of inefficiency, bureaucracy and diffuse accountability. To manage these risks, the Company favors a structure in which the responsibility for profit and loss is focused on business units aligned with markets.
Active portfolio management.
Throughout the Company's history, it has sought to grow and strengthen the business through acquisitions. That remains the case. The acquisition of existing assets and businesses is typically seen as a more attractive growth path than greenfield investment. The Company is, however, also willing to dispose of businesses that cannot meet its performance standards or that have more value to others.
The best talent.
ArcelorMittal's success will depend on the quality of its people, and its ability to engage, motivate and reward them. As detailed below, the Company is committed to investing in its people and ensuring a strong leadership pipeline. See "Item 6.D—Directors, Senior Management and Employees—Employees—Employee development." It will continue to improve its processes to attract, develop and retain the best talent.
35
Action 2020 Plan
On February 5, 2016, the Company announced its Action 2020 plan, which represents a strategic roadmap for each of ArcelorMittal’s main business segments. The Action 2020 plan goes over and above the Company’s ongoing management gains plan and seeks to deliver real structural improvements unique to ArcelorMittal’s business. The Action 2020 plan targets to improve the Company’s operating income by $3 billion, absent any recovery in steel spreads and raw materials prices from the levels at the beginning of 2016. The Company is approximately two-thirds of the way along the Action 2020 journey but made limited progress in 2018 with $0.4 billion in cost and product mix improvements, largely offset by volume reductions due to operational disruptions.
Some of the key segment initiatives included in the Action 2020 plan at the time of launch, and which the Company continues to pursue are as follows:
|
•
|
Europe: The Company plans to continue its successful asset optimization as an ongoing transformation plan, involving continued optimization, the clustering of finishing sites to remove substantial overhead, centralization of activities (including procurement), improvement of logistics and service and digital transformation. Together with expected higher added value (HAV) mix and volume gains, this targets delivering a $1 billion improvement in operating income over the period.
|
|
•
|
NAFTA: The downstream footprint optimization in the U.S. has been completed with substantial improvements in operating income. The Company has been continuing to ramp-up Calvert to full capacity since 2016. Other projects are expected to boost the HAV mix and generate further improvement.
|
|
•
|
Brazil: The Company plans to execute its value plan and targets an improvement in sales mix including a recovery of a share of higher margin domestic volumes, improved HAV mix by the end of 2020 and cost improvements.
|
|
•
|
ACIS: The Company plans to continue its strategic focus on operational excellence to deliver volumes that will leverage the new competitive cost base it has in the CIS (following competitive currency devaluation), realize savings in Ukraine at the coke oven battery and execute on the improved competitiveness plan in South Africa with a better mix following restart of coke oven battery and higher PCI usage.
|
The overall progress was limited in 2018 by operational disruptions which resulted in a volume loss of $0.3 billion effectively reversing the cumulative gains achieved in 2017. As a result, the cumulative savings from Action 2020 amount to $1.6 billion. The Company remains focused on achieving its 2020 targets. Volume is a key component of Action 2020 (5 million tonnes volume improvement) and the Company expects to see more progress in this area in 2019 and beyond, assuming market conditions remain favorable.
The above statements regarding Action 2020 are objectives. They constitute forward-looking statements and are subject to significant business, economic, regulatory and competitive uncertainties and contingencies, many of which are beyond the control of the Company and its management, and are based upon various assumptions including with respect to future decisions, which are subject to change, and the Company's ability to implement its strategy and in particular cost saving and efficiency improvement initiatives, which are subject to operational challenges and limitations. Actual results may vary and those variations may be material. See “—Competitive strengths—Dynamic responses to market challenges and opportunities” for the Company’s progress against these objectives.
Competitive strengths
As shown by the following graph, ArcelorMittal has a diversified portfolio of steel and mining products to meet a wide range of customer needs across many steel-consuming sectors, including automotive, appliance, engineering, construction, energy and machinery and via distributors.
36
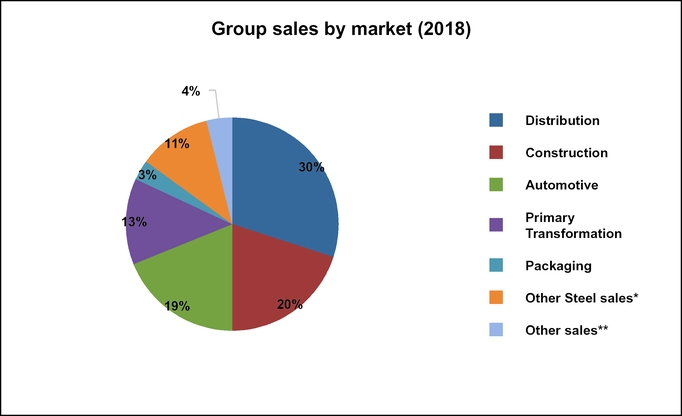
* Other steel sales mainly represent metal processing, machinery, electrical equipment and domestic appliances
**Other sales mainly represent mining, chemicals & water, slag, waste, sale of energy and shipping
The Company believes that the following factors contribute to ArcelorMittal’s success in the global steel and mining industry:
Market leader in steel.
ArcelorMittal is the world’s largest steel producer, with annual achievable production capacity of approximately 118 million tonnes (112 million tonnes without Ilva remedies) of crude steel for the year ended December 31, 2018. Steel shipments for the year ended December 31, 2018 totaled
83.9 million
tonnes.
ArcelorMittal is the largest producer of steel in North and South America and Africa and the fifth largest steel producer in the CIS region. It is also the largest steel producer in the EU, with significant operations in France, Germany, Belgium, Spain, Italy, Luxembourg, Poland, the Czech Republic and Romania. In addition, many of ArcelorMittal’s operating units have access to developing markets that are expected to experience, over time, above-average growth in steel consumption (such as Central and Eastern Europe, South America, India, Africa, CIS and Southeast Asia).
The Company sells its products in local markets and through a centralized marketing organization to customers in approximately 160 countries. ArcelorMittal’s diversified product offering, together with its distribution network and research and development (“R&D”) programs, enable it to build strong relationships with customers, which include many of the world’s major automobile and appliance manufacturers. The Company is a strategic partner to several of the major original equipment manufacturers (“OEMs”) and has the capability to build long-term contractual relationships with them based on early vendor involvement, contributions to global OEM platforms and common value-creation programs.
A world-class mining business
.
ArcelorMittal has a global portfolio of 13 operating units with mines in operation and development and is among the largest iron ore producers in the world. In the year ended December 31, 2018, ArcelorMittal mines produced
58.5 million
tonnes of iron ore which supplied
49%
of the Company’s iron ore requirements, and also produced
5.9 million
tonnes of coking coal and PCI which supplied
12%
of the Company’s PCI and metallurgical coal requirements.
The Company has iron ore mining activities in Brazil, Bosnia, Canada, Kazakhstan, Liberia, Mexico, Ukraine and the United States. The Company has coal mining activities in Kazakhstan and the United States. ArcelorMittal’s main mining
37
products include iron ore lump, fines, concentrate, pellets, sinter feed, coking coal, PCI and thermal coal. As of December 31, 2018, ArcelorMittal’s iron ore reserves were estimated at
3,742 million
tonnes run of mine and its total coking coal reserves were estimated at
204 million
tonnes run of mine or
110 million
wet recoverable tonnes. See “Item 4D—Information on the Company—Property, plant and equipment—Reserves (iron ore and coal)” for a detailed list of the entities providing reserves and the ownership structure.
The Company’s long-life iron ore and coal reserves provide a measure of security of supply and an important natural hedge against raw material volatility and global supply constraints. The mining business is managed as a separate segment which enhances ArcelorMittal’s ability to optimize capital allocation.
Market-leading automotive steel business.
The Company estimates that it has approximately 18% of the worldwide market share for the automotive industry, specifically for flat products as of December 31, 2018.
Long-term contracts add to the stability of the business. ArcelorMittal has built close relationships with its customers, often working with them at the vehicle design stage. These relationships are founded on the Company’s continuing investment in R&D and its ability to provide well-engineered solutions that help make vehicles lighter, safer and more fuel-efficient.
ArcelorMittal has a leading market share in its core markets and is a leader in the fast-growing advanced high strength steels segment. In 2012, ArcelorMittal initiated a development effort for hybrid vehicles with a dedicated S-in motion® project. Its S-in motion® line of solutions (C&D car segments, SUV, pick-up trucks, light commercial vehicles, truck cabs) is a unique offering for the automotive market that respond to OEMs’ requirements for safety, fuel economy and reduced CO2 emissions. By utilizing advanced high strength steels promoted in the S-in motion® projects, OEMs can achieve significant weight reduction using the Company's emerging grades solutions such as Fortiform®, the Company's third generation Advanced High Strength Steels ("AHSS") for cold forming, or Usibor® 2000 and Ductibor® 1000, the Company's latest AHSS grades for hot stamping. Further S-in motion® projects are currently underway for electrical cars in the C segment as well as for the plug-in hybrid C-segment with results expected in 2019. The growth of various types of electric vehicles will impact design and manufacturing. For instance, new large mass batteries change the mass distribution of a vehicle and impact the design and manufacturing of the chassis and wheels. Battery protection provides another example: both battery boxes and body structure have to protect batteries in the event of a crash. For these specific cases, AHSS and especially Ultra High Strength Steels will play a major role. AHSS products are among the most affordable solutions on the market for these specific applications. In a context where the supply of electric vehicles, and especially Battery Electric Vehicles ("BEVs") are expected to grow quickly, new projects have been launched to address these new trends. For further details on the new products under development, see "Item 4.B—Information on the Company—Business overview—Competitive strengths—Research and development.”
In parallel, ArcelorMittal continues to promote intensively the second generation of its iCARe® electrical steels. iCARe® steel grades play a central role in the construction of electric motors which are used in BEVs, hybrid vehicles ("HV"), plug in hybrid vehicles ("PHEV") and mild hybrid vehicles ("MHV"). This new iCARe® generation features optimized mechanical, magnetic and thermal properties of the steel as compared to the first generation of iCARe® electrical steels.
In the automotive industry, ArcelorMittal mainly supplies the geographic markets where its production facilities are located in Europe, North and South America and South Africa. The Company expanded its automotive footprint to China through Valin ArcelorMittal Automotive Steel Co., Ltd (“VAMA”), its joint venture with Hunan Valin, which has obtained approvals from international and domestic car manufacturers. VAMA’s product mix is oriented toward higher value products and mainly toward the OEMs to which the Company sells tailored solutions based on its products. With sales and service offices worldwide, production facilities in North and South America, South Africa, Europe and China, ArcelorMittal believes it is uniquely positioned to supply global automotive customers with the same products worldwide. The Company has multiple joint ventures and has also developed a global downstream network of partners through its distribution solutions activities. This provides the Company with a proximity advantage in virtually all regions where its global customers are present.
Research and development
. The Company’s Global Research and Development (“R&D”) division provides the technical foundation for the sustainability and commercial success of the Company by stimulating innovative thinking and the continuous improvement of products and processes. ArcelorMittal believes it possesses leading R&D capabilities among steel producers, and is committed to maintaining and extending this advantage by anticipating and responding to major technological,
38
sustainability and social trends, and by maximizing opportunities in the digital economy. The Company operates 11 research sites around the world, and in 2018, ArcelorMittal's R&D expense was $
290 million
.
R&D aims to develop products that create value for customers, improve ArcelorMittal's competitiveness through process optimization, and make a significant contribution to a sustainable future through products and processes that support the Company's 10 Sustainable Development outcomes. In 2018, the Company's global R&D received 21 awards.
To support this commitment, ArcelorMittal has developed expertise in lifecycle analysis (“LCA”), which analyzes the environmental impact of products during their production, use and disposal. LCA helps assess sustainability value at the product development stage, particularly in comparison to competing materials - which, in the case of steel, includes aluminum and concrete. The Company undertook a total of 32 LCA studies in 2018 related to steel products and the processes used to produce them, all guided by ISO standard 14040-44.
ArcelorMittal's R&D strategy focuses on four main pillars:
Maintaining the competitiveness of the Company's steel among its unique automotive customer base.
R&D continually drives the innovation that enables the Company's strategic focus on higher-added-value products. A key focus is products designed to meet the complex and changing needs of the automotive industry - a sector that contributed approximately 19% of the Company’s revenues in 2018, including both flat and long products. The Company aims to maintain its leadership in this sector by responding to the trends of electrification and digitalization in transport, and harnessing its R&D capabilities to tailor its innovations to the makers of conventional, hybrid, and electric vehicles.
For example, ArcelorMittal has developed its S-in motion® range of solutions, which showcase the benefits of Advanced High Strength Steel (“AHSS”) grades and manufacturing processes that help automotive customers meet demanding new targets for fuel economy and thereby drive improvements in CO
2
emissions.
The Company works closely with automotive customers - including through co-engineering efforts with North American and European car-makers - which enables them to access the Company’s technology, information and expertise to drive the development of engineering solutions efficiently. In addition, they can draw on the Company’s extensive lifecycle analysis expertise to consider the environmental footprint of products, including CO
2
emissions, from manufacture, through use, to final disposal and recycling. In 2018, ArcelorMittal won 21 technology-related awards, including the Honda R&D Americas Inc.'s Excellence in Innovation Award.
For further details of developments in more sustainable solutions for the automotive sector in 2018, see “Item 4.B— Information on the Company—Business overview—Competitive strengths—Sustainable development—Outcome 2: Products that accelerate more sustainable lifestyles”.
Creating a robust and diverse portfolio of niche non-automotive steel products to serve customers across multiple sectors.
Customers in many sectors share the automotive industry's demand for innovative products and processes. The Company aims to deliver similar breakthrough advances in these sectors by creating differentiated products and unique engineering solutions, all designed to ensure that steel is the customers' material of choice.
Construction is a key sector for ArcelorMittal, accounting for approximately 20% of direct sales in 2018. The Company's R&D effort is focused on providing higher-value-added products which meet customer needs, including their sustainable development objectives. In 2018, ArcelorMittal launched Steligence
®
, a new concept for the holistic use of steel in construction.
ArcelorMittal is also developing innovative solutions for the energy segment, both renewable and conventional. For example, ArcelorMittal has improved the corrosion resistance of its line pipe steel, and has developed a high-strength pressure vessel steel which allows weight savings when used in offshore processing facilities. It has innovated steel for wind turbines, and its patented anti-corrosion steel coating Magnelis
®
is used extensively in framing solutions for photovoltaic (PV) modules. The Company's pioneering technology for electrical steels also benefits this market.
These and other projects are described further in “Item 4.B—Information on the Company—Business overview—Competitive strengths—Sustainable development—Outcome 3: Products that create sustainable infrastructure”.
39
Packaging is, in the Company's view, another important opportunity. ArcelorMittal maintains a dedicated R&D packaging center in Maizières-les-Metz, France, and continues to respond to the expectations of its customers in the packaging market; see “Item 4.B—Information on the Company—Business overview—Competitive strengths—Sustainable development—Outcome 2: Products that accelerate more sustainable lifestyles”.
Developing breakthrough process innovations to deliver cost reduction, sustainability benefits and new product development.
The creation of unique processes creates value for the Company and its stakeholders by driving new cost competitiveness, promoting process-driven product development, and enabling environmental improvements, including carbon reductions. Process improvements deliver financial (management) gains for the Company.
The Company's jet vapor deposition ("JVD") technology is an example of process-led product development, which enables advanced steels for the automotive industry. See, "Item 4.B—Information on the Company—Business overview—Competitive strengths—Sustainable development—Outcome 2: Products that accelerate more sustainable lifestyles."
R&D also drives significant environmental improvements through new technology. ArcelorMittal implemented the hybrid filtration process in 2017 in Zenica (Bosnia), Gent (Belgium) and Dabrowa (Poland) and in 2018 the technology was extended to cover a broader scope of emissions in a pilot site in Gijon (Spain). Results indicate performance levels well within emerging emissions standards.
For other details of R&D's role in reducing ArcelorMittal's environmental impact, delivering energy saving programs and lowering emissions of solids, water and gases, see “Item 4.B—Information on the Company—Business overview—Competitive strengths—Sustainable development—Outcome 5: Trusted user of air, land and water” and “—Outcome 6: Responsible energy user that helps create a lower carbon future”.
Fully capitalizing on opportunities from the digital economy.
ArcelorMittal sees significant opportunities in the transformational potential of digitalization and Artificial Intelligence. It believes digitalization will enable unparalleled efficiencies, unforeseen insights and new modes of operation, all of which are expected to generate substantial cost and environmental benefits.
Diversified and efficient producer
. As a global steel manufacturer with a leading position in many markets, ArcelorMittal benefits from scale and production cost efficiencies in various markets and a measure of protection against the cyclicality of the steel industry and raw materials prices.
|
•
|
Diversified production process.
In 2018, approximately 71.8 million tonnes of crude steel were produced through the basic oxygen furnace process, approximately 17.6 million tonnes through the electric arc furnace process and approximately 3.1 million tonnes of crude steel through the open hearth furnace process. This provides ArcelorMittal with greater flexibility in its raw material and energy use, and increased ability to meet varying customer requirements in the markets it serves.
|
|
•
|
Product and geographic diversification.
By operating a portfolio of assets diversified across product segments and geographic areas, ArcelorMittal benefits from a number of natural hedges. As a global steel producer with a broad range of high-quality finished and semi-finished steel products, ArcelorMittal is able to meet the needs of diverse markets. Steel consumption and product requirements vary between mature economy markets and developing economy markets. Steel consumption in mature economies is largely from flat products and a higher value-added mix, while developing markets utilize a higher proportion of long products and commodity grades. As developing economies mature and as market needs evolve, local customers will require increasingly advanced steel products. To meet these diverse needs, ArcelorMittal maintains a high degree of product diversification and seeks opportunities to increase the proportion of its product mix consisting of higher value-added products.
|
|
•
|
Upstream integration
. ArcelorMittal believes that its own raw material production provides it with a competitive advantage over time. Additionally, ArcelorMittal benefits from the ability to optimize its steel-making facilities’ efficient use of raw materials, its global procurement strategy and the implementation of company-wide knowledge management practices with respect to raw materials. Certain of the Company’s operating units also have access to infrastructure, such as deep-water port facilities, railway sidings and engineering workshops that lower transportation and logistics costs.
|
40
|
•
|
Downstream integration
. ArcelorMittal’s downstream integration, primarily through its Europe segment for distribution solutions, enables it to provide customized steel solutions to its customers more effectively. The Company’s downstream assets have cut-to-length, slitting and other processing facilities, which provide value additions and help it to maximize operational efficiencies.
|
Dynamic responses to market challenges and opportunities.
ArcelorMittal’s management team has a strong track record and extensive experience in the steel and mining industries. In 2015, the Company completed a 3 year management gains program which generated savings of $3 billion from sustainable selling, general and administrative expenses (“SG&A”) and fixed and variable cost reductions. The program targeted cost savings related to reliability, fuel rate, yield and productivity with two-thirds of targeted costs being variable costs.
From late 2011 until 2015, the Company implemented an asset optimization initiative in Europe aimed at maximizing steel production at its lowest cost facilities. Implementation costs (consisting principally of restructuring costs and fixed asset impairments) totaled $2.1 billion (of which $0.8 billion was non-cash). Among other things, the initiatives included mothballing the liquid phase at the Florange site of ArcelorMittal Atlantique & Lorraine, France in 2012 and restructuring ArcelorMittal Liège (of which certain finishing lines are in the process of being sold to Liberty House as part of the divestment package related to the Ilva acquisition). In February 2016, the Company announced its Action 2020 plan (see “Item 4.B—Information on the Company––Business overview––Business strategy”) which targets an improvement in operating income of $3 billion, absent any recovery in steel spreads and raw materials prices from the levels at the beginning of 2016.
The Company has made measurable progress on its strategic Action 2020 plan resulting in a $0.6 billion contribution to 2017 operating income and $0.1 billion contribution to 2018 operating income, bringing the cumulative benefit to $1.6 billion. The Company is approximately two-thirds of the way along the Action 2020 journey with all segments contributing to the progress. In 2018, the Company achieved $0.4 billion in savings through combination of cost and product mix improvements including: savings in South Africa with improved cost performance driven by better mix following restart of coke oven battery and higher PCI usage, further optimization savings through digital transformations in Europe, savings in Ukraine related to the coke oven battery and cost and mix improvements in Brazil. However, these savings were largely offset by operational disruptions, which resulted in the loss in volume contribution of $0.3 billion or approximately 2.5 million metric tonnes. Volume is a key component of Action 2020 (which aims for a 5 million tonne volume improvement) and the Company expects to see more progress in this area in 2019 and beyond, assuming market conditions remain favorable.
|
•
|
Europe: The transformation program has progressed well. Savings at the cluster-leading plants continue to be made, with changes to the operating model to restructure and modernize the organization now well embedded. The organization is benefiting from a more integrated, centrally coordinated approach, further reducing costs. Additional gains are being made with enhanced use of and investment in digitalization in the manufacturing process, supply chain and commercial teams. Overall, net volume gains and improved mix contributed with higher hot strip mill production, offset in part by lower volumes caused by operational issues primarily in the long business.
|
|
•
|
NAFTA: Indiana Harbor footprint optimization has been completed: Savings achieved came from headcount rationalization and efficiencies following closure of its 84” hot strip mill ("HSM"), idling of the No.2 steel shop, and ongoing benefits from a new caster at No.3 steel shop. Restoration of the 80” HSM and Indiana Harbor was completed in 2018.
|
|
•
|
NAFTA: Calvert ramp up is advancing with automotive qualifications proceeding and increased capacity utilization.
|
|
•
|
Brazil: Structural cost reductions are being implemented; improved HAV mix from flat business.
|
|
•
|
ACIS: Ukraine benefited from the construction of a new coke oven battery #5 (in 2018) and other PCI/energy saving initiatives.
|
|
•
|
Mining: The business remains focused on service, quality and asset reliability. Cost focus maintained: net cash provided by operating activities and capital expenditures breakeven point remains $40/t China CFR 62% Fe.
|
Proven expertise in acquisitions and turnarounds
. ArcelorMittal’s management team has proven expertise in successfully acquiring and subsequently integrating operations, as well as turning around underperforming assets within tight timeframes. The Company takes a disciplined approach to investing and uses teams with diverse areas of expertise from different business units across the Company to evaluate new assets, conduct due diligence and monitor integration and post-acquisition performance. The Company has grown through a series of acquisitions and by improving the operating performance and financial management at acquired facilities. In particular, ArcelorMittal seeks to improve acquired businesses by eliminating operational bottlenecks, addressing any historical under-investments and increasing the capability of acquired facilities to produce higher quality steel. The Company introduces focused capital expenditure programs, implements company-wide best
41
practices, balances working capital, ensures adequate management resources and introduces safety and environmental improvements at acquired facilities. ArcelorMittal believes that these operating and financial measures have improved the operating performance and quality of steel produced at such facilities.
In the 2009-2016 period, ArcelorMittal largely curtailed M&A and greenfield investment activity due to difficult economic and market conditions. The Company has focused on improving its costs through its management gains program, non-core asset disposals and resizing its operational footprint through asset optimization. The Company implemented a strategy to dispose of non-core assets, including for example, the disposal of Gallatin, Circuit Foil Luxembourg, the steel cord business, ATIC and others in 2014. In 2016, the Company sold its minority shareholding in Gestamp and the Laplace and Vinton Long Carbon facilities in the United States as part of this strategy. As global market conditions gradually improved, the Company took advantage of select growth opportunities. In 2014, ArcelorMittal completed a 50/50 joint venture of Calvert in the United States in partnership with Nippon Steel & Sumitomo Metal Corporation ("NSSMC"). In 2018, the Company completed the acquisition of Votorantim S.A.'s long business in Brazil and the acquisition of Ilva S.p.A. in Italy. Most recently the Company is poised (subject to favorable resolution of legal challenges) to acquire (via a joint venture with NSSMC), Essar Steel India Limited ("ESIL"), its bid having been selected by ESIL’s committee of creditors. See "Item 4.A— Information on the Company—History and development of the Company—Key transactions and events in 2018" for further information.
Sustainable development.
ArcelorMittal aims to
create long-term value for its shareholders and other stakeholders, while maintaining a profitable market share. The Company understands that to achieve this, it must anticipate and respond to the long-term environmental and social trends that are transforming the context in which it operates. Among these trends, the most material are: sector-by-sector decarbonization that contributes to wider efforts to limit global warming to two degrees Celsius or less; the transformation of many industries including transport, construction and energy in the shift towards a more sustainable economy; and the growing importance of sustainability standards within value chains, including as a competitive advantage for the Company’s customers.
As a result, the Company aims to ensure that ArcelorMittal steel is the material of choice in a circular, low-carbon economy, and contributes to the creation of high quality and sustainable lives in the coming decades, in support of the global ambitions expressed by the United Nation's Sustainable Development Goals ("SDGs"). The Company pursues its contribution not only by continually innovating the way it makes steel, but by enhancing the support its solutions can provide to the transformation of many sectors including transport, energy and construction in the transition towards a more sustainable economy.
The Company sees significant advantages in developing an integrated marketing offer for its customers: being the supplier of choice for innovative products and processes made from trusted raw materials, in ways that meet and exceed customers' sustainability expectations, including on carbon. This is at the heart of the Company's approach to Sustainable Development ("SD").
ArcelorMittal's SD framework, launched in 2015, outlines the 10 SD outcomes it needs to achieve in order to create long-term value for all its stakeholders. The Company believes these are aligned with, and contribute to, many of the UN's SDGs - these are referenced in the individual outcome sections below, and a mapping of this alignment is provided as part of the reporting index to ArcelorMittal's Integrated Annual Review (the 2017 Integrated Annual review is available at: https://annualreview2017.arcelormittal.com/).
42
In 2018, the Company’s Board of Directors established the Appointments, Remuneration & Corporate Governance and Sustainability Committee (the "ARCGS"), an expansion of the previous ARCG Committee, which oversees progress towards the 10 SD outcomes under the following five management themes:
|
Management theme
|
Relevant SD outcome
|
|
Health and safety
|
Outcome 1
|
|
Environment
|
Outcome 4, Outcome 5
|
|
Climate change
|
Outcome 6
|
|
Customer reassurance
|
Outcome 7
|
|
Social
|
Outcome 1, Outcome 8, Outcome 9
|
In addition to the management themes above, the Board also oversees the product innovation agenda, which includes the Company’s SD Outcomes 2, 3 and 10.
The ARCGS's oversight underpins the Company’s overarching strategy to ensure that both corporate functions and business segments contribute to achieving the 10 SD outcomes. This strategy is made up of the following elements:
|
•
|
A set of Key Performance Indicators ("KPIs") for every business segment to report against, to be verified by third parties and overseen by the Board of Directors;
|
|
•
|
An expectation that each business segment, acting on its understanding of SD trends and through its engagement with stakeholders, develops a plan in pursuit of the 10 SD outcomes;
|
|
•
|
Leading contributions to SD from corporate functions for the benefit of the group, including: progress towards low-carbon steelmaking; innovating steel solutions and steelmaking technologies with a positive SD impact; and developing a ‘mine to metal’ chain of assurance against multi-stakeholder environmental and social standards;
|
|
•
|
A robust articulation of the Company's approach and progress through clear narrative and transparent, third-party-assured reporting.
|
Climate change.
While the Company continues to use the SD Framework of 10 SD Outcomes to report its progress towards SD, as summarized in this section, it believes that it is important to contextualize this framework with a holistic discussion of the overarching theme of climate change - which affects many of the 10 SD Outcomes - as this discussion responds to the expectations of investors and other stakeholders.
The Paris Agreement, underpinned by a strong body of science, demonstrates the clear consensus that each and every business needs to understand and reduce their contribution to climate change. ArcelorMittal was one of 89 companies at the Climate Summit in Paris in December 2017 that affirmed the need to collectively change course, in order to bring about a drastic reduction of global greenhouse gas (GHG) emissions. The Company believes steel has a vital contribution to make in this respect. Lifecycle analysis studies show steel is a lower-carbon alternative over its lifecycle compared with other materials such as aluminum and concrete in many applications. ArcelorMittal's modern, specialist steels are already helping to make products and materials more carbon-efficient. At the same time, ArcelorMittal recognizes that it must go further to reduce its own emissions, while identifying the risks and opportunities that climate change presents.
In 2018, climate change was identified as one of five themes to be overseen by the ARCGS Committee. The ARCGS nominated senior officers to take responsibility for its low carbon transition strategy, its carbon performance, and its work on carbon-related government policy. They are supported by corporate functions covering strategy, technology, R&D, risk, corporate responsibility and communications, all of which report to one executive vice-president, who works closely with the CEO and CFO on climate issues.
The Company’s processes for identifying and assessing climate-related risks and opportunities, as with all forms of risk assessment, are continuous, dynamic and discrete and are integrated into both site and corporate management processes. A regular bottom-up process allows sites to identify short-term risks and opportunities, which are consolidated at the corporate level. Longer-term social, environmental, stakeholder, and technological trends are assessed at the corporate level by the strategy, R&D and sustainable development functions on an ongoing basis.
The Company sees the low-carbon transition as presenting significant opportunities for steel. Steel is expected to be vital in the application of new industrial technologies; and the market for steel to support the renewable energy transition is expected to
43
grow. ArcelorMittal develops innovative products and processes that help its customers reduce their carbon footprint, presenting further growth opportunities. These include light-weight steel for the automotive, construction and packaging industries; preparing by-products for use by other industries, such as blast furnace slag in place of Portland cement and the provision of community heating from waste heat; and facilitating the design of buildings with fewer resources and in ways that enable components to be dismantled and re-used. Progress in these areas is outlined in SD outcomes 2 (products), 3 (infrastructure) and 4 (resources) below.
At the same time, the Company acknowledges the reputational as well as regulatory risks that it may face if stakeholders do not understand or trust the Company's commitment to contributing to a low-carbon future.
The Company's most significant climate-related financial risk over the medium to long-term results from local carbon emissions regulations that require carbon reduction in domestic steel but do not regulate steel imports. Since steel is a globally-traded commodity, such regulations can result in carbon leakage as well as an uncompetitive marketplace unless they include a carbon border adjustment. The Company believes that the EU Emissions Trading Scheme (ETS) is the most immediate example of this, because its Phase 4 (2021 to 2030) requires a substantial reduction in the carbon intensity of European steel but does not include a carbon border adjustment for steel imports into Europe. The Company predicts that less regulated steel will out-compete European-made steel, and therefore carbon emissions will effectively be exported from the EU. Unless a carbon border adjustment is adopted or other adaptations made, the regulations would only change where steel is made, rather than how it is made.
ArcelorMittal engages openly and widely with stakeholders on the potential pathways for low-carbon steelmaking, and the policy conditions needed to support them. It has continuing and constructive dialogue on these topics with its customers and investors, and with global organizations such as the We Mean Business coalition, the World Business Council for Sustainable Development, the Carbon Disclosure Project, the Science-Based Targets Initiative and the International Energy Association.
The 10 SD Outcomes, and ArcelorMittal’s progress towards them, are summarized below:
Outcome 1: Safe, healthy, quality working lives for ArcelorMittal’s people
ArcelorMittal's employees are essential to its ambition to build a high-performing organization. The Company's intended outcome is that its workforce is safe and healthy, is committed to ArcelorMittal's success, and operates with integrity. ArcelorMittal aims to build an inclusive culture in which diversity is valued, and every individual is respected and their potential developed. Safety is the number one priority.
Safety
The Company-wide safety program, “Journey to Zero”, was introduced in 2007. It aims to achieve zero fatalities and lost-time injuries by creating a culture of shared vigilance in which risks and hazards are understood and monitored, best practices are shared, and appropriate action is taken at every level. The Company's remuneration policy links 10% of the bonuses of its leadership - from managers to the CEO to the lost-time injury frequency rate in the business where he or she works. The Company works with trade unions to drive safety improvements through a global partnership, which includes joint local Health and Safety Committees at every production unit and a Global Health and Safety Committee to which they report. This is supported internally by the ArcelorMittal Health and Safety Council.
The Company has seen significant improvements in its LTIFR (the “lost-time injury frequency rate” - the number of injuries per million hours worked that result in employees or contractors taking time off work) since the introduction of the Journey to Zero program. The LTIFR* in 2018 was its lowest ever, at 0.69* incidents per million hours worked, compared to 0.78 incidents per million hours worked in 2017. The industry average was 0.97 incidents per million hours worked in 2017, according to the World Steel Association. For comparison, ArcelorMittal recorded an LTIFR of 3.1 incidents per million hours worked in 2007, the year after the Company's formation.
44
Own personnel and contractors
|
For the year ended December 31,
|
||||
|
Lost time injury frequency rate
|
2018
|
2017
|
||
|
Mining
|
0.61
|
0.77
|
||
|
NAFTA
|
0.53
|
0.73
|
||
|
Brazil (LATAM)
|
0.36
|
0.43
|
||
|
Europe
|
0.93*
|
1.03
|
||
|
ACIS
|
0.61
|
0.61
|
||
|
Total Steel
|
0.70*
|
0.78
|
||
|
Total (Steel and Mining)
|
0.69*
|
0.78
|
||
*Data does not include the LTIFR for Ilva (subsequently renamed ArcelorMittal Italia) which was acquired on November 1, 2018. ArcelorMittal Italia LTIFR for the last two months of 2018 was 8.20, and the total LTIFR for ArcelorMittal inclusive of this was 0.73.
ArcelorMittal recognizes that, more than improving its performance against LTIFR, it must work harder to ensure that its safety culture prevents fatalities and serious incidents. It is with deep regret that the Company reported 10 fatalities during 2018. No fatalities occurred in its mining operations. Any fatality is a cause of great distress to ArcelorMittal's leadership and the entire workforce. The Company's leadership is driving a campaign to ensure that a culture of vigilance and mutual accountability, in which every individual takes responsibility for the actions of those around them, prevails among the workforce. This includes a series of measures:
|
•
|
more and better detection, recording, and understanding of hazards and risks in order to prevent severe incidents;
|
|
•
|
improved safety leadership practices, supported by the launch in 2018 of the Target 21 Safety Leadership Program;
|
|
•
|
the Take Care! training program, rolled out and tracked for workers in every segment;
|
|
•
|
improved communications internally across the workforce using social media techniques; and
|
|
•
|
sharing lessons within the steel and other heavy industries.
|
Improving workers' ability to monitor and analyze potential severe injuries and fatalities ("PSIFs") is a key focus, as it provides a deeper understanding of how safety incidents can arise and therefore be avoided. The volume of incidents logged has increased more than three times since 2016. In 2018, the number of PSIFs recorded pro-actively - in other words where the incident was prevented and logged - increased from an average of 142 per month in 2017 to 205 per month in 2018. Reactive PSIFs - which are a known indicator of the risk of fatality - fell 16% in the same period. The Company believes this pro-active trend is having a positive impact on LTIFR. PSIF is now a KPI for the Company and, alongside fatalities and LTIFR, reported monthly to its leadership.
ArcelorMittal's Take Care! program delivers ‘experiential’ training through modules designed to embed an instinctive safety culture, and participation and completion is tracked across each segment. The Company’s annual health and safety day in 2018 saw more than 198,463 participants view
We choose the safest way
, its innovative film which won a gold medal at The Cannes Corporate Media & TV Awards.
ArcelorMittal investigates all accidents, and designated members of senior management review all fatalities to ensure lessons are learned throughout the Company. The Global Health and Safety Committee, which held 12 meetings in 2018, is included in this review, and in September 2018 launched a designated sub-group to improve the learning process. The Company supports sites where fatalities have occurred to ensure stronger alignment between Group-level safety strategy and implementation at the site level.
Health
ArcelorMittal takes a proactive approach to the health of employees. Alongside its objective of eliminating accidents, Journey to Zero aims to encourage healthy lifestyles and foster wellbeing, and to reduce occupational diseases to zero. At the local level, initiatives are run to prevent health issues arising from microclimatic conditions and the handling of chemicals, as well as from personal behaviors, such as smoking, or drug and alcohol use. For example, the "Mina Viva" project, developed at ArcelorMittal Mineração Serra Azul mine site for the prevention of alcohol and drug misuse, was the winner of the Protection Brazil 2018 Award, in the Quality of Life at Work category. Across the Company, a corporate initiative in 2018 sought to
45
identify sites with the highest priorities, and work with them on a one-to-one basis to improve performance. Wellbeing programs help employees address stress and fatigue, and encourage physical activity. The Company aims to continuously improve the hygiene standards within its facilities, and is a member of the International Occupational Hygiene Association. An annual health week provides activities with a local focus on these issues.
The Company runs a program to improve the health of workers in its coke plants, by sharing good practices in health management. It uses bio-monitoring to detect anomalies, measure the effect of the improvements being made, and as an employee engagement tool. Initially deployed in Europe, the project was extended to South Africa in 2018, where local teams began building action plans using best practices learned in Europe.
Other aspects of SD outcome 1
Finding and keeping the right people is key to building a high-performing organization, which is a strategic priority for ArcelorMittal. This means ensuring strong employee engagement and employee development whilst fostering a culture that is both diverse and inclusive. See “Item 6.D—Directors, senior management and employees—Employees”.
Outcome 2: Products that accelerate more sustainable lifestyles
Steel is strong, durable, versatile, formable and recyclable. These qualities suit it to innovative, sustainable solutions for the designers and manufacturers of products that support people's lifestyles, such as vehicles, packaging and household appliances.
ArcelorMittal aims for its steel to be the material of choice for these designers and manufacturers. In recent years, the Company has observed growing expectations for sustainability performance from its customers, adding to the expectations from regulators and investors. It aims to meet and exceed those expectations, and help customers design products that contribute to sustainable development through the energy and resource efficiency of the production process, the affordability of the end product, and their suitability for re-use, refurbishment or recyclability. The Company has developed a Sustainable Innovation ("SI") tool; its ultimate goal is to enable its researchers to evaluate the contribution to the sustainable development of all new products.
ArcelorMittal's global R&D teams work closely with car-makers and automotive suppliers to understand and apply steel solutions to future vehicle design, and the Company believes it is viewed as a leader in technology by most automotive customers, with a global market share of around 18% in 2018.
The Company's R&D offer to automotive customers, S-in motion®, includes new steel grades, processes and applications that further reduce the weight of the basic vehicle structure - technically, the 'body-in-white' - to improve fuel economy without compromising vehicle safety or performance. Examples include a global portfolio of products in its third generation, highly formable ("HF") Advanced High Strength Steel ("AHSS") range, and Press Hardenable Steel ("PHS") products, such as Ductibor® 1000 and Usibor® 2000. ArcelorMittal supports this innovation through investments that enable facilities in Europe and the U.S. to produce new PHS and third generation AHSS steels. For example, the Company introduced its unique jet vapor deposition ("JVD") line in 2017 in Liege, to create a new generation of coated products with improved quality and enhanced functionality (Jetgal®). To enable increased production of the Fortiform® range of automotive products, the Company is continuing to develop quenching and partitioning ("Q&P") technology, which is already installed at its facilities in Gent and Liege, Belgium, and at the Company's AM/NS Calvert joint venture with Nippon Steel and Sumitomo Metals Corp in Alabama, U.S.
ArcelorMittal also develops innovations for appliances and packaging steel to improve their sustainability - for example through new coating techniques, and techniques to reduce weight while maintaining the superior strength of steel. For the packaging sector, a circular economy forum is exploring the opportunities for steel in packaging, with an emphasis on carbon reduction and reuse. For example, specialized steel TH650N exhibits hardness up to six times that of aluminum, and excellent formability; test results in 2018 show that when TH650N is used in combination with TH550, the designed solution can reduce the weight of aerosol cans by around 17%. ArcelorMittal is working to highlight these advantages with aerosol manufacturers. The Company continues to respond to pending or anticipated new legislation requiring ecologically-friendly coatings with the development of steel for food packaging that avoids the need to use chromium VI and bisphenol A.
In 2018, R&D launched 15 new products and solutions to accelerate sustainable lifestyles, while also progressing further on 17 such product development programs. MS 1200 Jetgal® is one of these new products: this is a new Ultra High Strength Steel that aims to reduce the weight of roll-formed parts. Its mechanical properties are augmented by outstanding coating
46
uniformity and corrosion protection offered by the Jet Vapor Deposition ("JVD") process will make it particularly attractive for electric vehicle production.
The Company believes that its approach to product development will enable it, and its customers, to contribute to the global sustainable development agenda in ways that are aligned to the UN's SDGs, particularly SDG 11 (Sustainable Cities and Communities). See “Item 4.B—Information on the Company—Business overview—Competitive strengths—Research and development” above for further detail.
Outcome 3: Products that create sustainable infrastructure
Steel has the potential to play a vital role in a low-carbon, circular economy. The qualities described in Outcome 2 above - strength, flexibility, durability, and recyclability - all lend themselves to the kind of low impact solutions increasingly sought by customers in the construction, energy, public transport and general industrial markets. ArcelorMittal is committed to raising understanding of the important contribution steel can make to sustainable development and the circular economy, and to innovating alongside and on behalf of its customers in ways that improve durability, reduce weight, cut pollution, or reduce construction times. It believes that it has an important contribution to make to a number of the UN's SDGs, including SDG 7 (Affordable and clean energy), SDG 9 (Industry, innovation and infrastructure), SDG 11 (Sustainable cities and communities) and SDG 13 (Climate action).
ArcelorMittal aims to offer solutions to customers at every stage of their projects. Global R&D offers construction customers opportunities to engage at the design stage, and during product development, and provides access to quality information about the sustainability impacts of products. Innovation in organic coating at the production stage, for example, reduces energy, labor and other costs for customers.
In 2018, the R&D division launched 11 products and solutions to support sustainable construction and infrastructure, while also progressing further on 21 such product development programs.
In 2018, ArcelorMittal launched Steligence
®
to highlight the innovations the Company’s steel has to offer in the design and performance of a building, and to support its customers in their use. Steligence
®
aims to facilitate the next generation of high-performance buildings by harnessing the sustainability credentials of steel, not just in terms of its unmatched recyclability, but also through the potential for the re-use of steel components and the reduced use of materials. It is a holistic approach which helps specialist architectural and engineering disciplines meet the increasing demand for sustainability in building design as well as the competing demands of flexibility, creativity and cost. Potential benefits for customers adopting the Steligence
®
approach include: more storeys within a given height than with traditional materials; lower costs for foundations because of weight reductions; and longer uninterrupted spans between columns, resulting in more flexibility for interior floor layouts.
A key concept within Steligence
®
is making buildings easier to assemble and dismantle. This makes them quicker to build, leading to significant efficiencies and cost savings; it also creates potential for re-use. This reflects ArcelorMittal's wider interest in modularization and the potential re-use of steel components, a field it is discussing with customers, and in lifecycle assessment ("LCA"). The approach is demonstrated in the Company's planned new Luxembourg headquarters, announced in 2017. The building has been designed so that nearly all the steel components can potentially be dismantled and re-used in a new building without the need for recycling. ArcelorMittal was presented with the Excellence in Life Cycle Assessment award for its use of LCA to support the Steligence® project at the World Steel Association's 'Steelie' awards in October 2018.
The Company’s expertise in LCA is an important asset in its construction business. LCA is a requirement of Environmental Product Declarations ("EPD") for construction products in Europe and contributes to increasing the Company's competitiveness in the construction sector. For example, an EPD contributes to additional credits in Leadership in Energy and Environmental Design certification, one of the main international environmental standards for construction projects. The Company's EPDs are reviewed by third parties and validated by the Institut Bauen und Umwelt, the Institute of Construction and Environment, and are made available via ArcelorMittal Europe's Constructalia website. The Company is also leading the development of a methodological framework for EPDs in Brazil, where it published its first EPD in 2019.
ArcelorMittal also participates in the Worldsteel LCA expert group and the SOVAMAT initiative (SOcial VAlue of MATerials), an international network of experts on the social and environmental impacts of materials. It is a member of the CIRAIG International Lifecycle Chair, the international reference center for the lifecycle of products, processes and services,
47
and is active in particular in their circular economy working group. It is also a member of the Round table for Product Social Metrics.
In 2018, the Company participated in the EU-funded Sustainable BRIdges ("SBRI") project, aiming to develop a holistic approach to assessing steel-composite bridges by combining LCA, lifecycle costs and lifecycle performance. To reach a wide audience among bridge engineers and authorities, two design manuals were prepared with working examples, and an SBRI ‘app’ was launched to enable the calculation of case studies and comparative analysis of alternative solutions. See “Item 4.B— Information on the Company—Business overview—Competitive strengths—Research and development” above for further detail.
Outcome 4: Efficient use of resources and high recycling rates
ArcelorMittal aims to be acknowledged for using resources in the most efficient and effective ways - ways that create significant value for customers and shareholders as well as for the environment. The Company sees steel and steelmaking by-products as having a far larger role to play in the circular economy of the future and contributing to the UN's SDG 12 (Responsible consumption and production), including target 12.5, which aims "to substantially reduce waste generation through prevention, reduction, recycling and reuse".
The Company is one of the world's biggest recyclers, chiefly because of the volume of scrap steel it recycles; this also delivers substantial carbon benefits. It will continue to take advantage of these benefits as global scrap stocks increase, although currently scrap stocks can supply only one third of global demand for steel. See "—Recycling steel," below.
Within ArcelorMittal's operations, resource efficiency efforts take two main forms:
|
•
|
increasing the value created by the steelmaking process through re-using and recycling by-products, solids and waste gases; and
|
|
•
|
utilizing obsolete scrap steel as a feedstock for both the basic oxygen furnace ("BOF") and the electric arc furnace ("EAF").
|
Re-use and recycling of by-products.
Resource efficiency efforts provide scope for creating considerable value. Wherever possible, by-products are re-used within the steelmaking process; gases, for example, can be re-used as energy on site and for neighboring communities. Dust, slag and sludges can all be re-used in either the integrated steelmaking route (with sinter plant, blast furnaces and BOF) or the EAF route. This reduces the amount of virgin inputs required, reducing both raw material costs and environmental impact. At its Gent site, in 2018 the Company began exploring the use of BOF slag for building protection walls to reduce noise and dust; it is also using BOF slag for internal dust reduction works at Fos and Bremen.
By-products are also bought and re-used by other industries. Mill scale, produced during hot-rolling, is used to make counterweights by manufacturers of washing machines and lifts. Slag by-products are used in road construction, fertilizers and the cement industry. ArcelorMittal has a joint venture with the cement group Ecocem France,
using granulating blast furnace ("BF") slag as a partial replacement for Portland cement. In 2018, the Company opened a new facility at its Dunkirk site, which will produce 750,000 tonnes of ground granulated BF slag per year. The facility uses the site’s BF off-gas instead of natural gas to dry the material, creating further efficiencies and carbon reductions. It has also begun a collaboration with a consortium of academics to investigate ways to improve the process of ground granulated BF slag for use in concrete.
The Company’s global R&D division continues to explore the development of by-products for the circular economy. In 2018, it completed research on the impact of re-using slag as ballast in offshore wind turbine foundations, to replace ballast made from natural stones and sand. This research has demonstrated that its environmental impact is neutral compared with natural stone, while avoiding the ecosystem disruption that can result from the extraction of natural stone or sand. The application is already licensed in several countries; where it is not, this research can provide up-to-date impact data to the relevant authorities.
A partnership between global R&D, ArcelorMittal Dunkirk and the Paul Wurth Group aims to demonstrate an innovative treatment for BF sludge, previously a challenging residue to address because it contains zinc. The new hydrometallurgy technique isolates valuable sintering raw materials in the sludge, enabling 85% of it to be re-used internally, and is providing a valuable residue to the non-ferro industry to produce zinc. The breakthrough will allow ArcelorMittal to reduce energy, disposal costs, raw material inputs and CO
2
emissions. Engineering on a facility to treat 15,000 tonnes of BF sludge per year began at the Company's Dunkirk site in 2018. The project is supported by public funding from the “Région Hauts-de-France” and the European Regional Development Fund.
48
The Company is also investigating the potential re-use of slag from furnaces in water filtration and greenhouse gas capture. At the same time, it is seeking ways to reduce the volume of residues left by the steelmaking process where local markets for them do not yet exist.
Global R&D’s mining circular economy initiative, led by its Technology for Sustainable Resources ("T4SURE") team, is working on the use of tailings as a secondary raw material, either finding marketable solutions or generating valuable products to be used in-house.
Recycling steel.
Scrap is an important resource for steelmaking, and the Company’s research indicates that global recycling rates for obsolete steel currently stand at 87%. ArcelorMittal produces steel both via the EAF route, using scrap, and the integrated route in the basic oxygen furnace. ArcelorMittal's scrap input rate each year is in the region of 30%.
The Company recognizes that some stakeholders expect it to reduce its carbon footprint through the use of more scrap. The Company's vision is that eventually, all steel will be made with scrap, maximizing the potential of steel in a circular economy. However, globally, the production of steel is currently three times higher than the supply of scrap
.
In effect, virtually all the post-consumer scrap available globally is already being recycled. Only as more steel products become obsolete can the world produce more recycled steel.
ArcelorMittal has worked with customers and others to create an authoritative source of data on steel stocks and recovery and recycling rates across the world, and commissioned a third-party study in 2016 to model the impacts of increasing scrap availability on the steel industry. The study found that only beyond 2070 will scrap stocks increase sufficiently to enable steel made from scrap to become predominant.
ArcelorMittal is also collaborating with customers and the University of Cambridge to look at the efficiencies of steel flows downstream from its operations, and identify where there is potential for greater carbon- and cost- efficiencies through the reduction of pre-consumer scrap.
The use of obsolete scrap in steel production is made more attractive where its impurities from other materials are easily accommodated, typically in construction and infrastructure products, which are usually made via the EAF route. ArcelorMittal wants to improve the quality of the scrap it uses, and its global R&D division explores automated sorting processes for treating scrap by removing non-magnetic material. It has already invested in improved sorting, shearing and shredding machines at a number of sites; this could increase the Company's capacity to recycle scrap in its production processes.
See “Item 5—Operating and financial review and prospects—Scrap” for further details on the use of scrap and the price differential.
Outcome 5: Trusted user of air, land and water
ArcelorMittal shares natural capital such as air, land and water with many stakeholders, and aims to win stakeholder trust by operating transparently and responsibly.
Some of the challenges affecting air, land and water are global in nature, and ArcelorMittal engages in multi-stakeholder forums aimed at addressing them. Where the issues and the means of addressing them are local, country managers engage with stakeholders at every level, including site-by-site.
Before developing any new mine or steel plant, the Company carries out detailed environmental impact assessments, and establishes an environmental management plan. At all existing production sites, it monitors air, water, energy and residue data, and publishes data annually in its Integrated Annual Review and country level sustainability reports, of which 16 were published in 2018. The Company monitors regulatory developments and aims to be in compliance with all regulatory standards. See "Item 4B -Information on the Company-Business overview -Government regulations."
Addressing air quality concerns.
ArcelorMittal understands that air quality is among the most salient issues for the communities around its operations. It is also a continuing focus for regulators and our goal is to be fully compliant with regulatory standards. Although the specific sources of pollutants, particularly in urban and industrial areas, are not always
49
identifiable, the Company aims to listen to concerns wherever they are raised, and to respond appropriately. The Company also continues to make significant environmental investments that address air quality.
Where non-compliances are likely to occur, the Company takes immediate action to avoid this. For example, in Fos-sur-Mer (France) in 2018, it initiated a €14 million improvement program to refurbish all its coke ovens and bring them into line with the standards in force during 2018. By the end of 2018, 108 of the 126 kilns in the coke plant were returned to values below regulatory limits and, since the remaining 18 kilns remained non-compliant, the site was subject to a fine in December. Completion of the work on the remaining furnaces is planned for the first half of 2019. Environmental investments represent 40-50% of the investments made at Fos in recent years, totaling more than €100 million between 2012 and 2017. Over the last decade, these sustained and constant efforts have contributed to a very significant reduction in emissions at the site: a 49% reduction in dust between 2007 and 2017; a 50% reduction in sulfur dioxide (same period); 4% less nitrous oxides (same period) and a 70% cut in dioxins since 2009.
In 2018, ArcelorMittal's Investment Allocation Committee approved a total of 33 such projects totaling $405 million for new investment in environmental capital projects, most of them aimed at air quality improvements. These include innovative solutions developed by the Company's global R&D division, which continues to focus on dust and other emissions, including diffuse or fugitive dust emissions from yards and other facilities. For example, in 2018 the Company's Asturias plant became the first in the world to implement an innovative chemical treatment to reduce diffuse emissions in the unloading of sinter material in blast furnace bunkers. The Company's R&D department has also developed a pioneering hybrid filtration technology that has proven efficient at reducing dust emissions. In 2018, the technology was operational in Zenica (Bosnia), Gent (Belgium) and Dabrowa Gornica (Poland), and the Company began feasibility studies for installing it at further sites. A pilot to test its application to a broader set of air emissions is showing positive results.
ArcelorMittal continues to engage with community concerns, including over dust and industrial noise. During 2018, for example, the Company received concerns from stakeholders that high ambient levels of pollutants in Termitau (Kazakhstan), may have been caused by ArcelorMittal’s operations. Since 2011, ArcelorMittal Temirtau has invested $239 million in environmental improvements, which resulted in a 22.8% improvement in dust between 2011 and 2017. It has planned a further $198 million in environmental capital expenditures over the period 2018-2023. The Company is committed to participating in quality research to further understand the link between the steel plant and the health of local communities.
The Company works with its neighbors and local authorities to mitigate impacts. For example, in Brazil the Company is working on 14 large environmental projects as part of the 'air master plan' at its Tubarão site, which was extended in 2018 as part of the agreement with the public attorney and state government. In Asturias (Spain), the Company is targetting a 34% reduction in dust emissions by 2020 compared to 2017, and a further 22% by 2022. More information on the Company's work with communities on air quality can be found in "—
Outcome 8: Active and welcomed member of the community
,” below.
ArcelorMittal Italia became the new operator of the Ilva steel plant in Taranto, Italy in 2018, inheriting environmental challenges that have caused longstanding concerns among local communities. ArcelorMittal is determined to have a positive impact there. In Taranto, the Company has identified and prioritized environmental investment projects that should create significant benefits for its neighbors in a €0.8 billion ($0.9 billion) environmental investment program over a seven-year period, applying best practice, innovation and expertise from across ArcelorMittal’s operations. It has committed to addressing air and water quality issues urgently as it builds the steel plant towards industry-leading performance.
The Company recognizes all of the SDGs linked to environmental protection, of which the most important is SDG 9, which calls for the adoption of clean and environmentally sound industrial processes. ArcelorMittal’s ongoing program of investments to reduce its environmental footprint is aligned with this.
Improving land use and biodiversity.
ArcelorMittal aims to practice good land use management, and to protect biodiversity in the environments where it operates, including through partnerships with local environmental organizations and others to improve and research local biodiversity.
Mining is a key focus both in terms of responsible land management and biodiversity. The stability of tailings dams is a risk that every mining company faces, and managing them carefully is a vital aspect of ArcelorMittal’s responsibility as a mining company. The Company has 21 Tailings Storage Facilities (TSFs), of which 14 are active and 7 dormant, and employs a strong governance model based on the Mining Association of Canada (MAC) guidelines for TSFs. Each of the Company’s tailing dams has undergone rigorous internal and external audits and has been benchmarked against international best practice
50
guidance, for example that provided by MAC, and it is now transitioning to remote monitoring of its dams, using of satellite-based systems.
The recent incidents in the Brazilian mining sector show that, despite robust management systems for TSF and regular auditing, each mining company must always proactively manage its TSFs. Therefore, in addition to the ongoing process of strengthening our TSF monitoring methods, it is looking into how it can accelerate non-wet disposal options such as co-disposal, which we already employ in Mexico and Brazil iron ore mines, thickened paste tailings or dry tailings for existing and greenfield projects. Since 2018 all new projects must include dry tailings solutions.
As part of its layered external audits program, the Company undertook additional stress assessments in February at its dormant TSF at Serra Azul in Brazil, applying early observations available from the Feijao dam failure. Based on a range of safety evaluation factors, a decision was taken to put in practice an evacuation plan for all residents as a precautionary measure while further testing is undertaken and any mitigation measures can be implemented. The community, which was living 5km from the dam has been moved into temporary accommodation. If permanent resettlement is necessary, ArcelorMittal will follow international best practice in the treatment of these residents.
For detailed monitoring of tailings dams, Global R&D’s T4SURE team has developed the capabilities to upgrade and digitalize its systems using satellites, drones, wireless sensors and robots to feed a geographic information system. In the future, this will be extended to both plants and wildlife. This will help the Company to respond to increasing expectations from stakeholders looking for reassurance that biodiversity hotspots are not negatively impacted by the Company's mining operations.
At ArcelorMittal Liberia's iron ore mines, it is engaged in major biodiversity investments. In 2017, the Company renewed its environmental permit and updated its environmental and social impact assessment. This includes increased requirements for sediment control, water discharge and biodiversity conservation. In 2018, the Company continued to respond to increased expectations from regulators on water management.
Responsible water use.
Water is a vital resource to the Company and its stakeholders, and ArcelorMittal aims to be responsible both in the amount of water it consumes, and in the quality of the water discharged by its sites into the environment. Its work in the area is aligned to the UN's SDG 6 (Clean water and sanitation), with particular reference to the targets concerned with water recycling (6.3), efficiency (6.4) and management (6.5).
The Company's net water use in steelmaking - the difference between the water it withdraws and the water discharged - is measured, monitored and managed at each site by a dedicated team. In general, steel plants treat and recycle the same intake of water repeatedly, losing water only through evaporation. Water withdrawn from groundwater sources makes up less than 1% of the Company's water intake. Water treatment facilities play a vital role in managing its emissions to water, and in improving the water efficiency of its operations.
Unlike reducing carbon emissions, which is a global challenge, water use is a more localized issue. Where freshwater is scarce, or when there is a drought, the Company works with local municipal and water authorities to explore the best sources for water, including seawater, rainwater, and wastewater from water treatment plants. In Brazil, for example, where drought caused a state of emergency in some states in 2014, the Company's water master plan resulted in a reduction of water intake by more than 6,000,000 m3 /year, despite a 17% increase in production. This program won the 2018 Steelie Award in the
‘Excellence in Sustainability’
category. The Company is also pursuing a comprehensive water management plan in the Western Cape of South Africa, where drought presents the risk of impeded access to water supplies.
The Company seeks to improve water use and the quality of effluent discharge at its mine sites and conducts regular water quality monitoring as standard at all operations. Run-off from the Company's mining operations is treated either chemically or through sediment control dams and tested before being released into surface water bodies or reused elsewhere at the mine. Where possible, water is reused for processing, for example, as part of the cooling process during pellet production. At ArcelorMittal Mines and Infrastructure Canada ("AMMIC"), a multi-year holistic water management project aimed at controlling the surface effluents on the waste rock piles and to achieve compliance with federal regulations is ongoing. This consists of the construction of collector ditches on the perimeter of the waste rock piles and the installation of temporary and permanent water treatment units in Mont Wright and Fire-Lake.
51
Carefully managing tailings ponds to ensure they are structurally sound is vital and ArcelorMittal continues to manage and enhance its governance of tailings facilities through the Tailings Stewardship Program. The Tailings Stewardship Program commenced in January 2018 and provides for comprehensive stewardship of all wet tailings dams including physical and satellite monitoring, proactive risk reduction planning, annual deep dive reviews at each site by internal Company experts and an annual independent third party assurance program. This program has identified the higher risk sites and program activities are prioritized on the basis of risk. Action plans are in place for each site and progress against these action plans is monitored regularly.
The Serra Azul iron ore mine in Brazil is currently using in-pit dumping which allows tailings to dry naturally before the earth is reclaimed and placed in a dry stack dump. Elsewhere in Brazil, the Andrade mine commenced production of concentrate in 2018 which means that more of the ore mined will be used and the life of mine can therefore be extended. Dry stacking is also taking place at Andrade. The Company continues to explore opportunities to replace wet dams with dry treatment methods and this work is supported by the Company’s global R&D function.
Where possible, removing legacy tailings dams is an objective of the Company not only to reduce the environmental risk but also to minimize long-term liabilities. This can be effected by treating iron-bearing tailings through concentration.
Outcome 6: Responsible energy user that helps create a lower carbon future
ArcelorMittal is committed to making a positive contribution to a sustainable steel industry, and to the UN's SDG 13 (Climate Action), by planning for a low carbon future. It aims to achieve this by reducing energy use and carbon emissions, including through energy recycling, the use of renewables, and the development of new 'smart carbon' technological pathways to decarbonizing steel.
Energy efficiency and energy re-use.
Since 2007, the Company has pursued a carbon reduction target of 8% by 2020 through energy and carbon efficiency: good management, the application of technology, capital investment and innovation have all contributed to the progress to date. Sites undergo an energy audit process which assesses performance and identifies areas for improvement, and a significant number of ArcelorMittal’s large sites are ISO50001 standard certified or equivalent.
Each year, the Company’s Investment Allocation Committee ("IAC") approves a number of capital investments to bring significant energy and carbon efficiency improvements. In 2018, 26 further projects were approved, involving a capital allocation of $247 million, including the building of a coke oven gas ("COG") recycling plant in Vanderbijlpark. By replacing two existing natural gas plants, the project is expected to reduce operational costs and carbon emissions. ArcelorMittal also enters into energy performance service contracts for various energy efficiency initiatives, such as LED lighting, waste heat recovery and variable speed drives across its European sites, with notable social benefits alongside energy and carbon savings. ArcelorMittal’s global R&D division also continues to develop processes to support carbon and energy efficiency, and in 2018 deployed 19 such new processes across its portfolio. For example, smart oxygen sensors developed for the reheating furnaces in hot strip rolling mills have allowed reductions in energy and CO
2
of three to four percent.
In the U.S., the Company is working to reduce energy consumption at all of its facilities by 10% over a ten-year period, with 2013 as the baseline year. This objective is aligned with a voluntary agreement under the U.S. Department of Energy's Better Plants Partnership.
For decades, the Company has found ways to re-use waste energy from the steel-making process - either by recycling it within its own operations or exporting it as heat, steam or electricity, all of which enable carbon benefits for the Company or its partners. For example, ArcelorMittal exports its process gases to power generation companies; it also supplies community heating to the residents of Zenica (Bosnia and Herzegovina), Zdzieszowice (Poland), Dunkirk (France) and Tubarão (Brazil). In order to achieve optimal re-use of waste gases and avoid unnecessary flaring, the Company is now reviewing its systems and, where improvements projects are identified, it has been able to drive these using the expertise of specialist service providers. In 2018, two top pressure recovery turbines ("TRT") with a 25MW total capacity were installed at a joint venture power station operated by Tameh at the Company's Dabrowa Gornicza site, using the pressure from blast furnace flue gas to generate emissions-free electricity. In addition, it entered into a new agreement to provide extended community heating in Dunkirk (France) and commissioned a new system in Belval (Luxembourg).
52
In 2017, the Company developed a carbon reduction plan for its European steel sites to enable it to withstand the impact of the EU ETS Phase 4. This was followed in 2018 by a ‘bottom up’ process to identify the carbon reduction potential using existing technology at all sites across the Company’s global portfolio.
The Company is also seeking significant carbon and energy improvements in its mining sites. In 2018, a range of projects were planned to reduce CO
2
emissions by a total of 3.25 million tonnes per year. These included powerline replacement and fuel substitution projects. The Company also received approval for a project to capture, concentrate and burn coal-bed methane for heat and power generation at its coal mine in Kazakhstan, which is expected to have a significant impact on greenhouse gas emissions. The joint venture
between Satbayev University and ArcelorMittal Temirtau will focus on geological exploration of methane reserves and methane extraction from coal mines. This gas could be used to produce electricity in gas power stations or in converted vehicles.
Renewables.
Renewable energy is generated at a number of ArcelorMittal sites, for example through wind turbines at its Gent, Bremen and Hamburg plants, and through 15 hectares of solar panels at Fos-sur-Mer. At ArcelorMittal Hamburg, which is close to coastal wind power facilities, a "time shift" process regulates the power consumption of the electric arc furnace to absorb surplus electricity from wind power generation. The Company is actively exploring the potential for power purchase agreements ("PPAs") to supply its steel plants with renewable energy wherever prices are competitive. In 2018, it concluded an agreement to purchase electricity from a solar farm in Spain.
Developing new lower-carbon steelmaking technologies.
At the same time, the Company is assessing the potential of its portfolio for emerging breakthrough technologies. ArcelorMittal believes that, provided there is significant policy support for resourcing the technical challenge, the steel industry can adapt its technology over the coming decades to meet the challenge of decarbonization. Alongside a carbon border adjustment in Europe, this will require access to sufficient finance and competitively priced, renewable energy.
The Company sees a number of technological pathways to decarbonizing steel in the long term: the use of sustainable biological sources of carbon in place of coal, together with carbon capture utilization ("CCU"); electrolysis or hydrogen-based steelmaking powered by large volumes of renewable energy; and carbon capture and storage alongside the continued use of fossil fuels. The Company is advancing a range of technologies for low-emissions steelmaking to support the various possible pathways.
The first of these may be referred to as the 'smart carbon pathway'. Smart carbon describes any process that enables a cycle of waste carbon to be used as valuable resources to replace fossil fuels: converting biomass waste and plastic waste from other industries back into reduction gas for the steelmaking process and using CCU technologies to convert steel waste carbon gases into commercially viable products such as bio-oils, chemicals, plastics and fuels. When successful, novel products made out of “recycled carbon” can be produced at scale, and contribute significantly to the low-carbon economy.
The Company is taking the lead in demonstrating this pathway. For example, ArcelorMittal is piloting its Torero project in Gent (Belgium), to use bio-waste in the blast furnace in place of coal. It is also developing IGAR technology in Dunkirk (France) to reform waste carbon gases into fuel for the blast furnace - formally a Low-Impact Steelmaking project. It aims to reach the industrial pilot phase for IGAR in 2020, and began engineering work in 2018.
A third smart carbon technology, run in partnership with LanzaTech, is the most advanced; it converts waste carbon monoxide from blast furnace gas into ethanol. This process requires low-energy input. When this ethanol is used in place of fossil fuel-based commodities for the production of transport fuels, plastics and chemicals, it generates high greenhouse gas savings. During 2018, work began on a €150 million industrial-scale demonstration in Gent, and in 2019 the Company will begin building the ethanol plant. This is expected to start producing ethanol in 2020, with annual CO
2
savings equivalent to 600 Boeing 747 flights between London and New York, or 100,000 passenger cars. The Company is exploring the potential for scaling up the process at its other blast furnaces.
A further CCU project is an experiment in Fos-sur-Mer which tests the viability of using flue gases to grow microalgae, which could be converted into bio-crude or valuable chemicals.
Outcome 7: Supply chains that ArcelorMittal’s customers trust
ArcelorMittal considers responsible supply chain management to be a commercial and logistical necessity, both within its own supply chain, and as a key offer to the customers it supplies. It sees the development of a ‘mine to metal’ chain of
53
assurance against multi-stakeholder environmental and social standards as a significant competitive advantage. It aims to be a leader in this field, and win the trust of its customers by meeting or surpassing their standards, both in its own steel and mining operations, and in its supply chain.
The Company sees the momentum behind supply chain accountability continuing to grow, with a particular focus on mined raw materials. Consumer-facing brands want to demonstrate responsible sourcing, and customers are joining together to demand, and validate, higher standards in their supply chains, driven by their own due diligence processes. This is expressed through growing demand from the Company's customers for reassurance on environmental and social standards. As a result, ArcelorMittal regards supply chain certification and assurance as a vital commercial opportunity to forge closer links with customers, and believes that taking a leading role in multi-stakeholder engagement is one of the most effective ways to achieve them. It is working with peers in the steel and mining industries, and with other stakeholders, to advance the development of new third party standards. It has also been a key actor in creating two new assurance organizations: IRMA (the Initiative for Responsible Mining Assurance) and ResponsibleSteel
TM
. In 2018, ArcelorMittal joined the Responsible Minerals Initiative.
As a member of the IRMA steering committee, ArcelorMittal participates in the multi-stakeholder expert panels shaping its standards. As a key member of ResponsibleSteel, it began testing the first draft of the ResponsibleSteel
TM
standard at several of its European operations in 2017, a process which continued in 2018. The Company began expanding this testing process across its global business in 2018.
AMMIC is a member of the Mining Association of Canada ("MAC"). As part of MAC's Toward Sustainable Mining ("TSM") program, AMMIC's annual performance results are published on the MAC website. Because the TSM standard is internationally recognized by responsible sourcing programs, in 2018 ArcelorMittal committed to assessing all its marketable mines against it, and its Mont Wright iron ore mine has been certified. The Company began training at all relevant sites as part of a progression that will result in published assessments commencing in 2021. The Company is also a member of a multi-stakeholder collaboration on sustainable tin production in Indonesia, the Tin Working Group ("TWG").
The Company also engages directly on these issues with customers from the automotive, rail and other sectors, including construction, household goods and packaging, as well as with initiatives used by customers to share their processes for assessing supply chain risk, such as DRIVE Sustainability, Electronic Industry Citizen Coalition, Railsponsible, EcoVadis and the Green Building Council.
Alongside these multi-stakeholder, customer-focused initiatives, the Company is committed to driving standards in its own supply chain. Since 2011, the Company’s Code for Responsible Sourcing has set out minimum standards for its suppliers, and described how it will work with suppliers to achieve them. In 2018, the Company continued to ask all new global suppliers to sign the Code, and surveyed key suppliers for their implementation of the Code. At the same time, it reinforced its risk mapping and analysis, with particular reference to its raw material suppliers. This process aims to identify social and environmental areas of concern, and the key hotspots for further due diligence; the Company is developing action plans where these are needed. It also identifies those suppliers which have the potential to take part in certification schemes in the future.
Overall, the Company is shaping its supplier process to be better aligned to the OECD guidelines on due diligence on supply chains - in particular for conflict minerals, which reflect continued concern that some conflicts around the world are being financed by the trade in minerals such as tin, tantalum, tungsten and gold. From a portfolio of more than 2,000 steel products, only a very limited number of ArcelorMittal products contain tin and tungsten, which are necessary for the functionality or production of certain products. The Company publishes a Special Disclosure Report in compliance with the US Dodd Frank Act Section 1502, and is preparing to meet the requirements of the EU's new conflict minerals regulation.
Outcome 8: Active and welcomed member of the community
ArcelorMittal wants communities to have confidence that it will address the impacts it has on them and their environment, and to see it as a pro-active partner in local socio-economic development which is trusted to have an open dialogue when challenges arise.
To achieve this, it aims to:
|
•
|
Understand its context and impacts - from land and water use, to air pollution, taxes paid, and employment provided;
|
|
•
|
Listen to communities to understand what they think is important, and how they want to engage;
|
54
|
•
|
Develop environmental and social programs that best meet the objectives of the community and the Company's operations; and
|
|
•
|
Communicate regularly with communities in ways they find accessible and trustworthy.
|
ArcelorMittal employed approximately 209,000 people directly, as well as a large number of contractors and part-time workers in 2018; it has significant procurement expense, and in 2018 paid $
629 million
in income tax and more in other taxes. This economic contribution is aligned with the UN's SDG 8 (Decent work and economic growth) - the Company recognizes, however, that not all of this contribution is felt directly in the communities where it works, and that local stakeholders have issues and concerns.
Everywhere it operates, ArcelorMittal encourages people to share their concerns, and aims to understand in detail what its community impacts are, both positive and negative, so that it can adapt, prevent issues from arising where possible, and respond to those which have escalated. Where stakeholders have a grievance, ArcelorMittal is committed to giving them a fair hearing and, where the grievance is legitimate and concerns something in the Company's control, providing access to remedies. Overall, the Company aims to increase its oversight of local community engagement at the corporate level, and to identify best practices so it can improve management systems where needed. The Company's work with third-party assurance schemes such as TSM and ResponsibleSteel
TM
is providing insights for this, see "—
Outcome 7: Supply chains that ArcelorMittal’s customers trust
," above for more details on these schemes.
In 2018, the Company continued to identify priority sites for strengthening community engagement. These included establishing best-practice community relationships at the Company's Ilva acquisition, ArcelorMittal Italia, and a concerted communication campaign with local communities around its mine sites in Liberia, accompanied by a survey of social impact.
ArcelorMittal Liberia has also opened a $7 million vocational training center in Yekepa, see "—Outcome 9:
Pipeline of talented scientists and engineers for tomorrow
," below.
The Company works with local stakeholders on key issues. In Brazil, for example, in 2018 ArcelorMittal Brazil signed a cooperation agreement worth R$3.9 million with the State of Espirito Santo Federal University to support their study to identify the relationship between pollutants and asthma cases in Vitoria, Brazil. The three-year study involves 20 engineering and health specialists from the university, and aims to identify which pollutants, from particulate matters and gases, most influence the intensification of asthma symptoms in children and adolescents. In Mexico, Ejido representatives at the Las Truchas mine blockaded the site in September 2018 following the expiration of the lease agreement for some of the surface rights. This resulted in the temporary closure of mining operations. In November 2018, a temporary arrangement was agreed while negotiations for a new lease agreement valid until May 2019 were completed in February 2019. Negotiations are ongoing to reach a long-term agreement.
To support local economic development, ArcelorMittal has established a number of local supplier initiatives, including the Integrated Program for Supplier Development and Qualification in Brazil, the Minority and Women Business Enterprises Program in the U.S., and the Enterprise and Supplier Development Program in South Africa, which is supported by the Company’s "incubation hub." It has developed public-private partnerships in the U.S., Ukraine, and Poland.
Community partnerships are also regarded as a key driver for employee retention and engagement. Annual external reputation surveys specifically highlight the importance of community investment in employees’ sentiment about ArcelorMittal. To drive this sense of shared value for employees, the Company actively encourages employee volunteering.
Outcome 9: Pipeline of talented scientists and engineers for tomorrow
Talented scientists and engineers will play a critical part in building a sustainable future for society at large, for the steel industry, and for the Company. Developing skills in STEM (science, technology, engineering and mathematics) is the global theme for the Company’s community investment strategy, reflecting the importance of these skills to the Company's own business future and to society more widely.
The Company plans its investment in STEM based on the need for people with both professional skills and the ability to adapt to change, exploit new technology, and thrive in an increasingly complex workplace. The strategy is locally led according to the needs of country operations and is intended to build a long talent pipeline by reaching various age groups. Overall, it seeks to inspire children to explore STEM concepts, offer guidance and encouragement to school students considering STEM, and support and attract undergraduates and graduates with relevant skills, including in areas such as lifecycle analysis, robotics,
55
data analysis, nanotechnologies, circular economics, and 3D metallurgy. It also seeks to retain technical talent, and a key element in the pipeline is ensuring that knowledge and skills within the business are passed on.
The strategy is delivered in many ways: from providing teaching aids and technological support, through inviting students to steel plants, to the Company's long-term partnerships with leading academic organizations around the world, including technical schools and numerous universities in continental Europe, Brown University and MIT in the U.S., Cambridge in the UK, Lausanne in Switzerland, McMasters in Canada, and the China Central University. The Company wants to encourage and attract talent as widely as possible, and it has developed STEM initiatives that specifically focus on women and girls, who are historically underrepresented in STEM professions. A Company survey of these activities in 2017 indicated that 64% of its countries were running STEM projects focused on women and girls.
Since 2017, ArcelorMittal has run a global internal STEM network which draws on experts from across the business to share best practice on STEM outreach. The network holds quarterly meetings and shares tools through an internal portal.
In 2018, the Company launched or supported a wide range of programs and initiatives. These included the ArcelorMittal Science program in Brazil, and in Liberia, support for the Annual Leadership Camp run by the Society of Women Engineers at the University of Michigan in the USA (SWE at UM), which helps Liberian female undergraduate engineering students develop engineering leadership and organizational development skills.
The Company also offers internships and sponsorship of PhDs through joint research projects. These partnerships are designed to develop productive collaboration on specific issues, and help attract the best graduates. In 2018, in R&D alone, the Company hosted more than 90 engineering students in their final year on long-term internships, and 40 PhD students on a variety of different programs.
The Company has supported a range of activities around STEM social promotion in a number of countries. In Spain, for example, programs focusing on children and teenagers include STEM sessions in schools, high schools and in R&D labs. STEM+D sessions, which include sessions for high capability students, focus on key technology megatrends and digitalization, and are conducted by junior researchers from global R&D.
ArcelorMittal also supports a number of awards aimed at promoting STEM. These include the ArcelorMittal Environment Award in Brazil, dedicated to raising awareness of environmental issues among elementary school students and employees’ children, and the Prix des Innovateurs in France, which rewards young entrepreneurs, students and researchers who have developed innovative science or engineering projects.
In 2018, for the second year running, ArcelorMittal Belgium and Microsoft jointly organized a hackathon called "The Challenge,", in which 65 participants were given 48 hours to come up with a creative solution for an industry-based problem, focused on welding fractures, for a share in €8,500 of prize money. A similar hackathon is run in Kryvyi Rih in Ukraine.
Outcome 10: ArcelorMittal’s contribution to society measured, shared and valued
Both the Company and its stakeholders can benefit from understanding the broader social and economic value and impacts that ArcelorMittal creates, both directly and indirectly.
ArcelorMittal has aimed to understand and report on the social, environmental and economic value it creates against its 10 SD outcomes as its own articulation of the UN's Sustainable Development Goals. It believes that steel has a vital role to play as a material of the future in a low-carbon circular economy, given its strength, durability, reusability and endless recyclability. As such, steel’s contribution to society will continue as an essential material in building sustainable cities and communities (SDG11), while the Company’s efforts to improve the sustainability performance of its steelmaking and its supply chains contribute to sustainable industry (SDG 9), responsible production and consumption (SDG 12) and climate action (SDG 13), as well as decent work and economic growth (SDG 8).
ArcelorMittal believes that transparency about the social and environmental impacts of its operations help build stakeholder trust. The Company is continuously enhancing its disclosures through its corporate Integrated Annual Review, country level reports, and disclosures to the Carbon Disclosure Project and a number of investor and customer surveys. In 2018, it published its Report on Payments to Governments in respect of Extractive Activities for the year ended December 31, 2017.
56
ArcelorMittal's overall reporting framework also reflects UN SDG 12's specific target 12.6 ("Encourage companies, especially large and transnational companies, to adopt sustainable practices and to integrate sustainability information into their reporting cycle"). The impact of ArcelorMittal's social license continues to be measured and reported at the country level, through a number of country-level sustainable development reports, which can be found on the corporate website at https://corporate.arcelormittal.com/sustainability/reporting-hub/country-reports. Many of these include basic data on the Company’s direct contributions to the economy, reflect a balance between positive and negative impacts, and acknowledge the importance of demonstrating stakeholder value as part of maintaining a social license to operate. Recent examples include reports from the Company’s operations in South Africa, Poland, Mexico, Argentina, and the United States.
The connections between the stakeholder value the Company creates and its business success has been an important aspect of ArcelorMittal’s integrated reporting and integrated thinking, demonstrated in its integrated annual review published each year in advance of its Annual General Meeting. For example, the Company acknowledges the importance of creating a safe, inclusive workforce culture, good community relations, and climate-related value (via reduced emissions) to its long-term future.
These outcomes are underpinned by Transparent Good Governance
The Company’s commitment to integrity is enshrined in its code of business conduct and is supported by a comprehensive framework of policies in areas such as human rights, anti-corruption, and insider dealing. These reflect the principles and concepts of the UN Global Compact, the OECD Guidelines on Multinational Enterprises and UN Sustainable Development Goal 16 - Peace, justice and strong institutions. See also “Item 16.B—Code of Ethics” and “Item 6.C—Directors, senior management and employees—Board practices/corporate governance”.
Listening, learning, respect and transparency are key to the integrity of the Company’s leadership and governance, which helps ensure ArcelorMittal operates effectively and ethically in all parts of the world.
ArcelorMittal considers its relationships with its various stakeholders to be vital to its success. Conducted in the right way, these relationships help the Company know how best to respond to challenges, to anticipate future problems, and to earn trust. ArcelorMittal’s operations in each country are encouraged to assess their stakeholders' expectations and concerns, in order to inform their approach to the 10 SD outcomes. Working with customers, suppliers, unions and others can also contribute to UN SDG 17 ("Partnership for the goals").
ArcelorMittal continues to be a member of the Extractive Industries Transparency Initiative.
In Brazil, where transparency is of particular stakeholder concern, ArcelorMittal partners with the non-governmental organization Transparency International.
ArcelorMittal's human rights policy draws on the UN Universal Declaration of Human Rights, the International Bill of Human Rights, the core conventions of the International Labor Organization, and the UN Global Compact; it also aims to contribute to UN SDG 8's focus on decent working conditions, including target 8.7 on modern slavery. The policy includes commitments to workers, local communities and business partners, and covers health and safety, labor rights and the rights of indigenous people. Employees working in relevant functions are required to undertake training in the Company’s policy every three years, and in 2018, 94.1% of the Company’s relevant workforce had completed up-to-date human rights training, up from 66% in 2017. Where appropriate, ArcelorMittal provides face-to-face training for employees on human rights.
The Company also conducts wider ethical and integrity training: in 2018, 87.5% of ArcelorMittal's employees had completed up to date training in the Code of Business Conduct, and 90.4% had completed their Anti- Corruption training.
In 2018, the Company continued to deepen its understanding of the relevant risks in its supply chain by strengthening its supply chain risk management and audit processes. Its work to develop ResponsibleSteel™, a third party certification standard, as well as several mining certification standards aimed at ensuring that both its own sites and its supply chain uphold international human rights, environmental and governance standards.
57
Products
Information regarding segment sales by geographic area and sales by type of products can be found in note 3 to ArcelorMittal’s consolidated financial statements.
ArcelorMittal has a high degree of product diversification relative to other steel companies. Its plants manufacture a broad range of finished and semi-finished steel products with different specifications, including many complex and highly technical and sophisticated products that it sells to demanding customers for use in high-end applications.
ArcelorMittal’s principal steel products include:
|
•
|
semi-finished flat products such as slabs;
|
|
•
|
finished flat products such as plates, hot- and cold-rolled coils and sheets, hot-dipped and electro-galvanized coils and sheets, tinplate and color coated coils and sheets;
|
|
•
|
semi-finished long products such as blooms and billets;
|
|
•
|
finished long products such as bars, wire-rods, structural sections, rails, sheet piles and wire-products; and
|
|
•
|
seamless and welded pipes and tubes.
|
ArcelorMittal’s main mining products include:
|
•
|
iron ore lump, fines, concentrate, pellets and sinter feed; and
|
|
•
|
coking, PCI and thermal coal.
|
Steel-making process
Historically, primary steel producers have been divided into “integrated” and “mini-mill” producers. Over the past few decades, a third type of steel producer has emerged that combines the strengths of both the integrated and the mini-mill processes. These producers are referred to as “integrated mini-mill producers”.
Integrated steel-making
In integrated steel production, coal is converted to coke in a coke oven, and then combined in a blast furnace with iron ore and limestone to produce pig iron. Pig iron is then combined with scrap in a converter, which is generally a basic oxygen or tandem furnace, to produce raw or liquid steel. Once produced, the liquid steel is metallurgically refined and then transported to a continuous caster for casting into a slab, bloom or billet, which is then further shaped or rolled into its final form. Various finishing or coating processes may follow this casting and rolling. Recent modernization efforts by integrated steel producers have focused on cutting costs through eliminating unnecessary production steps, reducing manning levels through automation, and decreasing waste generation. Integrated mills are substantially dependent upon iron ore and coking coal which, due to supply and demand imbalances, shortening of contract durations and the linkage between contract prices and spot prices, have been characterized by price volatility in recent years.
Mini-mills
A mini-mill employs an electric arc furnace to directly melt scrap and/or scrap substitutes such as direct reduced iron, thus entirely replacing all of the steps up to and including the energy-intensive blast furnace. A mini-mill incorporates the melt shop, ladle metallurgical station, casting, and rolling into a unified continuous flow. Mini-mills are generally characterized by lower costs of production and higher productivity than integrated steel-makers. These attributes are due in part to the lower capital costs and lower operating costs resulting from the streamlined melting process and the more efficient plant layouts of mini-mills. The quality of steel produced by mini-mills is primarily limited by the quality of the metallic raw materials used in liquid steel-making, which in turn is affected by the limited availability of high-quality scrap or virgin ore-based metallics for use in the electric arc furnaces. Mini-mills are substantially dependent on scrap, which has been characterized by price volatility in recent years, and the cost of electricity.
58
Integrated mini-mills
Integrated mini-mills are mini-mills that produce their own metallic raw materials consisting of high-quality scrap substitutes, such as direct reduced iron. Unlike most mini-mills, integrated mini-mills are able to produce steel with the quality of an integrated producer, since scrap substitutes, such as direct reduced iron, are derived from virgin iron ore, which has fewer impurities. The internal production of scrap substitutes as the primary metallic feedstock provides integrated mini-mills with a competitive advantage over traditional scrap-based mini-mills by insulating the integrated mini-mills from their dependence on scrap, which continues to be subject to price volatility. The internal production of metallic feedstock also enables integrated mini-mills to reduce handling and transportation costs. The high percentage use of scrap substitutes such as direct reduced iron also allows the integrated mini-mills to take advantage of periods of low scrap prices by procuring a wide variety of lower-cost scrap grades, which can be blended with the higher-purity direct reduced iron charge. Because the production of direct reduced iron involves the use of significant amounts of natural gas, integrated mini-mills are more sensitive to the price of natural gas than are mini-mills using scrap.
Key steel products
Steel-makers primarily produce two types of steel products: flat products and long products. Flat products, such as sheet or plate, are produced from slabs. Long products, such as bars, rods and structural shapes, are rolled from blooms and/or billets.
Flat products
Slab.
A slab is a semi-finished steel product obtained by the continuous casting of steel or rolling ingots on a rolling mill and cutting them into various lengths. A slab has a rectangular cross-section and is used as a starting material in the production process of other flat products (e.g., hot-rolled sheet, plates).
Hot-rolled sheet.
Hot-rolled sheet is minimally processed steel that is used in the manufacture of various non-surface critical applications, such as automobile suspension arms, frames, wheels, and other unexposed parts in auto and truck bodies, agricultural equipment, construction products, machinery, tubing, pipe and guard rails. All flat-rolled steel sheet is initially hot-rolled, a process that consists of passing a cast slab through a multi-stand rolling mill to reduce its thickness to less than 12 millimeters. Flat-rolled steel sheet that has been wound is referred to as “coiled”.
Cold-rolled sheet.
Cold-rolled sheet is hot-rolled sheet that has been further processed through a pickle line, which is an acid bath that removes scaling from steel’s surface, and then successively passed through a rolling mill without reheating until the desired gauge, or thickness, and other physical properties have been achieved. Cold-rolling reduces gauge and hardens the steel and, when further processed through an annealing furnace and a temper mill, improves uniformity, ductility and formability. Cold-rolling can also impart various surface finishes and textures. Cold-rolled steel is used in applications that demand higher surface quality or finish, such as exposed automobile and appliance panels. As a result, the prices of cold-rolled sheet are higher than the prices of hot-rolled sheet. Typically, cold-rolled sheet is coated or painted prior to sale to an end-user.
Coated sheet.
Coated sheet is generally cold-rolled steel that has been coated with zinc, aluminum or a combination thereof to render it corrosion-resistant and to improve its paintability. Hot-dipped galvanized, electro-galvanized and aluminized products are types of coated sheet. These are also the highest value-added sheet products because they require the greatest degree of processing and tend to have the strictest quality requirements. Coated sheet is used for many applications, often where exposed to the elements, such as automobile exteriors, major household appliances, roofing and siding, heating and air conditioning equipment, air ducts and switch boxes, as well as in certain packaging applications, such as food containers.
Plates.
Plates are produced by hot-rolling either reheated slabs or ingots. The principal end uses for plates include various structural products such as for bridge construction, storage vessels, tanks, shipbuilding, line pipe, industrial machinery and equipment.
Tinplate.
Tinplate is a light-gauge, cold-rolled, low-carbon steel usually coated with a micro-thin layer of tin. Tinplate is usually between 0.14 millimeters and 0.84 millimeters thick and offers particular advantages for packaging, such as strength, workability, corrosion resistance, weldability and ease in decoration. Food and general line steel containers are made from tinplate.
Electrical steels
. There are three principal types of electrical steel: grain-oriented steels, non-grain oriented fully processed steels and non-grain oriented semi-processed steels.
59
|
•
|
Grain-oriented steels are 3% silicon-iron alloys developed with a grain orientation to provide very low power loss and high permeability in the rolling direction, for high efficiency transformers.
|
|
•
|
Non-grain oriented fully processed steels are iron-silicon alloys with varying silicon contents and have similar magnetic properties in all directions in the plane of the sheet. They are principally used for motors, generators, alternators, ballasts, small transformers and a variety of other electromagnetic applications. A wide range of products, including a newly developed thin gauge material for high frequency applications, are available.
|
|
•
|
Non-grain oriented semi-processed steels are largely non-silicon alloys sold in the not finally annealed condition to enhance punchability. Low power loss and good permeability properties are developed after final annealing of the laminations. These materials are sold under the Newcor and Polycor trademarks.
|
Long products
Billets/Blooms.
Billets and blooms are semi-finished steel products. Billets generally have square cross-sections up to 180 millimeters by 180 millimeters, and blooms generally have square or rectangular cross-sections greater than 180 millimeters by 180 millimeters. These products are either continuously cast or rolled from ingots and are used for further processing by rolling to produce finished products like bars, wire rod and sections.
Bars.
Bars are long steel products that are rolled from billets. Merchant bar and reinforcing bar (rebar) are two common categories of bars. Merchant bars include rounds, flats, angles, squares, and channels that are used by fabricators to manufacture a wide variety of products such as furniture, stair railings, and farm equipment. Rebar is used to strengthen concrete in highways, bridges and buildings.
Special bar quality (“SBQ”) steel.
SBQ steel is the highest quality steel long product and is typically used in safety-critical applications by manufacturers of engineered products. SBQ steel must meet specific applications’ needs for strength, toughness, fatigue life and other engineering parameters. SBQ steel is the only bar product that typically requires customer qualification and is generally sold under contract to long-term customers. End-markets are principally the automotive, heavy truck and agricultural sectors, and products made with SBQ steel include axles, crankshafts, transmission gears, bearings and seamless tubes.
Wire rods.
Wire rod is ring-shaped coiled steel with diameters ranging from 5.5 to 42 millimeters. Wire rod is used in the automotive, construction, welding and engineering sectors.
Wire products.
Wire products include a broad range of products produced by cold reducing wire rod through a series of dies to improve surface finish, dimensional accuracy and physical properties. Wire products are used in a variety of applications such as fasteners, springs, concrete wire, electrical conductors and structural cables.
Structural sections.
Structural sections or shapes are the general terms for rolled flanged shapes with at least one dimension of their cross-section of 80 millimeters or greater. They are produced in a rolling mill from reheated blooms or billets. Structural sections include wide-flange beams, bearing piles, channels, angles and tees. They are used mainly in the construction industry and in many other structural applications.
Rails.
Rails are hot-rolled from a reheated bloom. They are used mainly for railway rails but they also have many industrial applications, including rails for construction cranes.
Seamless tubes.
Seamless tubes have outer dimensions of approximately 25 millimeters to 508 millimeters. They are produced by piercing solid steel cylinders in a forging operation in which the metal is worked from both the inside and outside. The final product is a tube with uniform properties from the surface through the wall and from one end to the other.
Steel sheet piles.
Steel sheet piles are hot rolled products used in civil engineering for permanent and temporary retaining structures. Main applications are the construction of quay walls, jetties, breakwaters, locks and dams, river reinforcement and channel embankments, as well as bridge abutments and underpasses. Temporary structures like river cofferdams are made with steel sheet piles. A special combination of H beams and steel sheet piles are sometimes used for the construction of large container terminals and similar port structures.
Welded pipes and tubes.
Welded pipes and tubes are manufactured from steel sheet that is bent into a cylinder and welded either longitudinally or helically.
60
Mining products
ArcelorMittal’s principal mining products and raw material input items for steel operations include iron ore, solid fuels (coking coal and PCI coal), metallics, alloys, base metals, energy and industrial gases.
ArcelorMittal’s mining and raw materials supply strategy consists of:
|
•
|
Acquiring and expanding production of certain raw materials, in particular iron ore, coal and manufacturing refractory products and developing diverse third-party customer relationships;
|
|
•
|
With respect to purchasing, pursuing the lowest unit price available based on the principles of total cost of ownership and value-in-use through aggregated purchasing, supply chain and consumption optimization;
|
|
•
|
Exploiting its global purchasing reach; and
|
|
•
|
Leveraging local and low cost advantages on a global scale.
|
Faced with lower and more volatile raw materials prices in recent years, ArcelorMittal’s priority has been to optimize output and production from its existing sources focused mainly on iron ore and coking coal rather than to further expand its portfolio of mining assets. Iron ore and coking coal are its two most important inputs in the steel-making process.
ArcelorMittal is a party to contracts with other mining companies that provide long-term, stable sources of raw materials. The Company's largest iron ore supply contracts with Vale were renewed in 2017. ArcelorMittal's principal international iron ore suppliers include Vale, Cleveland-Cliffs Inc. in the United States, Metinvest in Ukraine, Severstal and Metalloinvest in Russia, Luossavaara-Kirunavaara AB in Sweden, IOC (Rio Tinto Ltd.) in Canada and Sishen in South Africa. ArcelorMittal’s principal coal suppliers include the BHP Billiton Mitsubishi Alliance (“BMA”), Rio Tinto, Anglo Coal, Glencore and Peabody in Australia, Contura and Warrior in the United States, Teck Coal in Canada and Vale in Mozambique.
ArcelorMittal believes that its portfolio of long-term supply contracts can play an important role in preventing disruptions in the production process. (see “Item 5—Operating and financial review and prospects—Key factors affecting results of operations—Raw materials”).
In 2018, ArcelorMittal sourced a large portion of its raw materials from its own mines and facilities including finance leases. The table below sets forth information regarding ArcelorMittal’s raw material consumption in 2018.
|
Millions of metric tonnes
|
Consumption
|
Sourced from own mines/facilities
2
|
Other sources
|
Self-sufficiency %
|
||||
|
Iron ore
|
118.3
|
58.3
|
60.0
|
49%
|
||||
|
PCI & coal
1
|
47.9
|
5.8
|
42.1
|
12%
|
||||
|
Coke
|
28.2
|
25.7
|
2.5
|
91%
|
||||
|
Scrap & DRI
|
36.3
|
19.3
|
17.0
|
53%
|
||||
|
1
|
Includes coal only for the steelmaking process and excludes steam coal for power generation. ArcelorMittal's consumption of PCI and coal was 9.8 million tonnes and 38.1 million tonnes, respectively, for the year ended December 31, 2018.
|
|
2
|
As of December 31, 2018, the Company does not have any strategic contracts.
|
Iron ore
ArcelorMittal sources significant portions of its iron ore needs from its own mines in Kazakhstan, Ukraine, Bosnia, Canada, the United States, Mexico, Liberia and Brazil. Several of ArcelorMittal’s steel plants also have in place off-take arrangements with mineral suppliers located near its production facilities.
For further information on iron-ore production, see “Item 5.A—Operating and financial review and prospects—Operating results”. For further information on each of ArcelorMittal’s principal iron ore mining operations, see “Item 4.D—Information on the Company—Property, plant and equipment”.
61
Solid fuels
Coking coal
As with iron ore, ArcelorMittal sources a percentage of its coking coal from its own coal mines in Kazakhstan and the United States. The Company’s mines in Kazakhstan supply substantially all of its requirements for its steelmaking operations at ArcelorMittal Temirtau, while the mines in the United States supply other steel plants within the ArcelorMittal group together with external customers.
For further information on coking coal mining production, see “Item 5.A—Operating and financial review and prospects—Operating results.”
Coke
ArcelorMittal has its own coke-making facilities at most of its integrated mill sites, including in Bosnia, the United States, Canada, Mexico, Brazil, Spain, France, Germany, Belgium, Poland, Czech Republic, Kazakhstan, South Africa and Ukraine. While ArcelorMittal meets most of its own coke requirements, certain of ArcelorMittal’s operating subsidiaries buy coke from mostly domestic or regional sources to optimize cost savings from transport efficiencies, and certain of its subsidiaries sell, on occasion, excess coke at market prices to third parties. The remainder of the spot purchases of coke are made from China, Columbia and the United States.
In the United States, ArcelorMittal USA produces part of its coke requirement in its own batteries, with the bulk procured under long-term contracts from dedicated coke batteries owned by third parties.
Other raw materials and energy
Metallics (scrap)
ArcelorMittal procures the majority of its scrap requirements locally and regionally optimizing transport costs. Typically, scrap purchases are made in the spot market on a monthly/weekly basis or with short-term contracts. In Europe, ArcelorMittal has entered into certain contracts for scrap recycling.
Alloys
ArcelorMittal purchases its requirements of bulk and noble alloys from a number of global, regional and local suppliers on contracts that are linked to generally-accepted indices or negotiated on a quarterly basis.
Base metals
The majority of the Company’s base metal needs, including zinc, tin, aluminum and nickel are purchased under annual volume contracts. Pricing is based on the market-accepted indices. Material is sourced from both local and global producers.
Electricity
ArcelorMittal generally procures its electricity through tariff-based systems in regulated areas such as parts of the United States and South Africa, through direct access to markets in most of European mills or through bilateral contracts elsewhere. The duration of these contracts varies significantly depending on the area and type of arrangement.
For integrated steel mills, plant off-gases from various process steps are utilized to generate a significant portion of the plant’s electricity requirements and lower the purchase volumes from the grid. This is either produced by the plant itself or with a partner in the form of a co-generation contract.
Natural gas
ArcelorMittal procures much of its natural gas requirements for its U.S., Canadian and Mexican operations from the natural gas spot market or through short-term contracts entered into with local suppliers, with prices fixed either by contract or tariff-based spot market prices. For its European and Ukrainian operations, with a contractual mix of “all-in” bilateral supply and direct access to the market, ArcelorMittal sources its natural gas requirements under the prevailing mix of oil-based pricing
62
systems and European short term/spot-indexed supply contracts. The remainder of ArcelorMittal’s natural gas consumption represents approximately 20% of ArcelorMittal’s total consumption and is generally sourced from regulated markets.
Industrial gases
Most of ArcelorMittal’s industrial gas requirements are produced and supplied under long-term contracts with various suppliers in different geographical regions.
Shipping
ArcelorMittal Shipping ("AM Shipping") provides ocean transportation solutions to ArcelorMittal’s manufacturing subsidiaries and affiliates. AM Shipping determines cost-efficient and timely approaches for the transport of raw materials, such as iron ore, coal, coke and scrap, and semi-finished and finished products. AM Shipping is also responsible for providing shipping services to the Company’s sales organizations. It provides complete logistics solutions from plants to customer locations using various modes of transport.
In 2018, AM Shipping arranged transportation for approximately 76.3 million tonnes of raw materials and about 13.9 million tonnes of finished products. The key objectives of AM Shipping are to ensure cost-effective and timely shipping services to all units. AM Shipping acts as an agent for a Mauritius-based shipping company, Global Chartering Ltd., Luxembourg-based ArcelorMittal Sourcing and Luxembourg based AM Mining SA. Global Chartering Ltd handles shipping of approximately 16% of the Company’s raw materials, which are transported by sea by chartering vessels on a short- to long-term basis. In its fleet are several Capesize, Panamax and Supramax vessels on a medium-to-long-term charter. AM Shipping’s strategy is to cover about 50% of the Company's cargo requirements on a medium to long-term basis, and to arrange remaining transportation requirements on a spot basis.
Purchasing
ArcelorMittal has implemented a global procurement process for its major procurement requirements, including raw materials, capital expenditure items, energy and shipping. ArcelorMittal’s centralized procurement teams also provide services such as optimization of contracts and the supply base, logistics and optimizing different qualities of materials suitable for different plants and low cost sourcing.
By engaging in these processes, ArcelorMittal seeks to benefit from economies of scale in a number of ways, including by establishing long-term relationships with suppliers that sometimes allow for advantageous input pricing, pooling its knowledge of the market fundamentals and drivers for inputs and deploying specialized technical knowledge. This enables ArcelorMittal to achieve a balanced supply portfolio in terms of diversification of sourcing risk in conjunction with the ability to benefit from a number of its own raw materials sources.
ArcelorMittal has institutionalized the “total cost of ownership” methodology as its way of conducting its procurement activities across the Group. This methodology focuses on the total cost of ownership for decision making, with the goal of lowering the total cost of production through minimization of waste, improved input material recovery rates and higher rates of recycling.
Sales and marketing
In 2018, ArcelorMittal sold
83.9 million
tonnes of steel products.
Sales
The majority of steel sales from ArcelorMittal are destined for domestic markets. For these domestic markets, sales are usually approached as a decentralized activity that is managed either at the business unit or at the production unit level. For certain specific markets, such as automotive, there is a global approach offering similar products manufactured in different production units around the world. In instances where production facilities are in relatively close proximity to one another, and where the market requirements are similar, the sales function is aggregated to serve a number of production units. In the EU region and in South America, ArcelorMittal owns a large number of service and distribution centers. Depending on the level of complexity of the product, or the level of service required by the customer, the service center operations form an integral part of the supply chain to ArcelorMittal’s customers. Distribution centers provide access to ArcelorMittal’s products to smaller customers that cannot or do not want to buy directly from the operating facility.
63
The Group prefers to sell exports through its international network of sales agencies to ensure that all ArcelorMittal products are presented to the market in a cost-efficient and coordinated manner.
Sales are executed at the local level, but are conducted in accordance with the Group’s sales and marketing and code of conduct policies.
For some global industries with customers in more than one of the geographical areas that ArcelorMittal serves, the Company has established customized sales and service functions. This is particularly the case for the automotive and packaging industries. Sales through these channels are coordinated at the Group level with respect to contract, price and payment conditions.
Marketing
Marketing follows the sales activity very closely and is by preference executed at the local level. In practice, this leads to a focus on regional marketing competencies, particularly where there are similarities among regional markets in close geographical proximity. Local marketing provides guidance to sales on forecasting and pricing. At the global level, the objective is to share marketing intelligence with a view towards identifying new opportunities, either in new products or applications, new product requirements or new geographical demand. Where a new product application is involved, the in-house research and development unit of ArcelorMittal is involved in developing the appropriate products.
An important part of the marketing function at ArcelorMittal is to develop short-range outlooks that provide future perspectives on the state of market demand and supply. These outlooks are shared with the sales team in the process of finalizing the sales strategy for the immediate future and with senior management when market conditions call for production adjustments.
Globally, sales and marketing activities are coordinated to ensure a harmonized approach to the market. The objective is to provide similar service experiences to all customers of ArcelorMittal in each market.
Insurance
ArcelorMittal maintains insurance policies to cover physical loss or damage to its property and equipment on a reinstatement basis arising from a number of specified risks, including certain natural disasters, such as earthquakes, acts of terrorism, floods and windstorms, and certain consequential losses, including business interruption arising from the occurrence of an insured event under the said policies.
ArcelorMittal also purchases worldwide third-party public and product liability insurance coverage for all of its subsidiaries.
Various other types of insurance are also maintained, such as comprehensive construction and contractor insurance for its greenfield and major capital expenditures projects, directors and officers liability, transport, and charterers’ liability, as well as other customary policies such as car insurance, travel assistance and medical insurance.
Each of the operating subsidiaries of ArcelorMittal maintains various local insurance policies that are mandatory at the local level, such as employer liability, workers compensation and auto liability, as well as specific insurance such as public liability to comply with local regulations.
In addition, ArcelorMittal maintains trade credit insurance on receivables from selected customers, subject to limits that it believes are consistent with those in the industry, in order to protect it against the risk of non-payment due to customers’ insolvency or other causes. Not all of ArcelorMittal’s customers are or can be insured, and even when insurance is available, it may not fully cover the exposure.
ArcelorMittal believes that its insurance coverage is in line with industry practice and sufficient to cover normal risks in its operations. Notwithstanding the insurance coverage that ArcelorMittal and its subsidiaries carry, the occurrence of an event that causes losses in excess of limits specified under the relevant policy, or losses arising from events not covered by insurance policies, could materially harm ArcelorMittal’s financial condition and future operating results.
Intellectual property
64
ArcelorMittal owns and maintains a patent portfolio covering processes and steel products, including uses and applications that it creates, develops and implements in territories throughout the world. Such patents and inventions primarily relate to steel solutions with new or enhanced properties, as well as new technologies that generate greater cost-efficiencies.
ArcelorMittal also owns trademarks, both registered and unregistered, relating to the names and logos of its companies and the brands of its products. ArcelorMittal has policies and systems in place to monitor and protect the confidentiality of its know-how and proprietary information. The Company applies a general policy for patenting selected new inventions, and its committees organize an annual patent portfolio screening by individuals from the Company’s R&D and business sectors in order to optimize the global efficiency of the Company’s patent portfolio. The Company’s patent portfolio includes more than 7,000 patents and patent applications, mostly recent and middle-aged, for approximately 600 patent families, with 70 inventions newly-protected in 2018. Because of this constant innovation, the Company does not expect the lapse of patents that protect older technology to materially affect current revenue.
In addition to its patent portfolio, ArcelorMittal is constantly developing technical know-how and other unpatented proprietary information related to design, production process, and use of high quality steel products, leading to development of new applications or to improvement of steel solutions proposed to its customers, such as the ones aiming at weight reduction for vehicles. ArcelorMittal has also been granted licenses for technologies developed by third parties in order to allow it to propose comprehensive steel solutions to customers. ArcelorMittal is not aware of any pending lawsuits alleging infringement of others’ intellectual property rights that could materially harm its business.
Government regulations
ArcelorMittal’s operations are subject to various regulatory regimes in the regions in which it conducts its operations. The following is a discussion of the principal features of selected regulatory regimes, as of December 31, 2018, that affect or are likely to affect the Company's operations.
See “Item 3.D—Key information—Risk factors” and note 8.3 to ArcelorMittal’s consolidated financial statements.
Environmental laws and regulations
ArcelorMittal’s operations are subject to a broad range of laws and regulations relating to air emissions, surface and groundwater protection, wastewater storage, treatment and discharges, the use and handling of hazardous or toxic materials, waste management, treatment and disposal practices, the remediation of environmental contamination, the protection of soil, biodiversity and ecosystems or rehabilitation (including in Mining). As these laws and regulations in the United States, the EU and other jurisdictions continue to become more stringent, ArcelorMittal expects to expend substantial resources including operating and capital expenditures to achieve or maintain ongoing compliance. Further details regarding specific environmental proceedings involving ArcelorMittal, including provisions to cover environmental remedial activities and liabilities, decommissioning and asset retirement obligations are described in notes 8.1 and 8.3 to ArcelorMittal’s consolidated financial statements.
Some of ArcelorMittal’s most important environmental compliance initiatives are described below, as well as the main environmental laws and regulations that apply to ArcelorMittal in its principal countries of operation. It is difficult to anticipate whether additional operating or capital expenditures will be required to comply with pending or recently-enacted amendments to environmental laws and regulations or what effect they will have on the Company’s business, financial results or cash flow from operations. In 2018, ArcelorMittal approved a number of multi-year capital expenditures totaling to $652 million in order to facilitate compliance with these environmental and energy laws and regulations.
Industrial emissions regulation: climate change
ArcelorMittal’s activities in the 28 member states of the EU are subject to the EU Emissions Trading Scheme (“ETS”), and it is likely that requirements relating to greenhouse gas (“GHG”) emissions will become more stringent and will continue to expand to other jurisdictions in the future. In the United States, the U.S. Environmental Protection Agency (“EPA”) currently requires reporting of GHG emissions by source and may impose permitting obligations on new sources or existing sources that seek to modify their operations that will result in an increase in certain GHG emissions.
65
In South Africa, a bill to tax carbon dioxide emissions is under discussion. In Mexico, Brazil and Kazakhstan new regulatory initiatives are being discussed by the different government authorities. In the United Kingdom, ArcelorMittal’s activities are subject to the Carbon Reduction Energy Efficiency Scheme (“CRC”).
In December 2015, 195 countries participating in the United Nations Framework Convention on Climate Change (“UNFCC”), at its COP21 held in Paris, adopted a new global agreement on the reduction of climate change (the “Paris Agreement”). The Paris Agreement sets a goal to limit the increase in global average temperature to well below 2 degrees celsius and pursuing efforts to limit the increase to 1.5 degrees celsius, to be achieved by getting global GHG emissions to peak as soon as possible. The Paris Agreement consists of two elements: a legally binding commitment by each participating country to set an emissions reduction target, referred to as “nationally determined contributions” or “NDCs”, with a review of the NDCs that could lead to updates and enhancements every five years beginning in 2023 (Article 4) and a transparency commitment requiring participating countries to disclose in full their progress (Article 13). The majority of countries have issued their intended NDCs.
In June 2017, the U.S. announced that it would cease to participate in the Paris Agreement. Pursuant to Article 28, the earliest possible withdrawal date would be in November 2020. The U.S. has signaled that it would comply with the four-year exit process.
ArcelorMittal is closely monitoring local, national and international negotiations, regulatory and legislative developments and is endeavoring to reduce its own emissions where appropriate.
United States
ArcelorMittal’s operating subsidiaries in the United States are subject to numerous environmental laws and regulations including at the federal level, the Clean Air Act, the Clean Water Act, the Resource Conservation and Recovery Act (“RCRA”), the Comprehensive Environmental Response, Compensation and Liability Act, also known as “Superfund”, the Safe Drinking Water Act and the Toxic Substances Control Act, as well as applicable state and local environmental requirements. Pursuant to these laws, regulations and requirements, the EPA and the states are implementing updated emission standards for certain pollutants.
Any more stringent standards could have significant financial implications on operations. ArcelorMittal USA continues to carefully monitor all developments in this area and to proactively engage with regulators as appropriate to define its regulatory obligations.
In 2013, US EPA Region V rejected the State of Minnesota’s plan for reducing regional haze, which was designed to preserve visibility in pristine national park areas, and promulgated its own plan to require the taconite industry to install new low NOx technology at taconite furnaces in the region. This requires significant capital investment. In 2015, the taconite industry reached a settlement with the EPA to establish more flexible ranges for final limits and secured additional time to meet them. The EPA promulgated a final rule effectuating that settlement in April 2016. However, the new rule raised an additional concern regarding the process for setting final limits as well as an unrelated issue relating to SO2 emissions. Discussions with the EPA are ongoing on both issues.
The original litigation has been dismissed and efforts are underway to comply with the new regulation’s NOx requirements. It is estimated that this will cost approximately $6.7 million.
ArcelorMittal USA does not presently expect to incur significant capital expenditures relating to other environmental regulatory developments or matters in 2018.
66
European Union
Significant EU Directives and regulations that are applicable to ArcelorMittal’s production units in the EU, include the following:
|
•
|
Directive 2010/75/EU of November 24, 2010 on Industrial Emissions (the “IED Directive”), which applies common rules for permitting and controlling industrial installations. To receive a permit, installations covered by the IED Directive must ensure that their Emissions Limit Values (“ELV”) do not exceed those associated with the Best Available Techniques (“BAT”), as adopted in the decision of the European Commission on February 28, 2012 establishing the BAT conclusions for iron and steel production under the IED (C(2012)903). Air, soil or water, energy emissions, waste generation, as well as noise, hazards and site closure, are all considered with few possibilities to obtain derogations related to the implementation of BAT and the associated emissions limits values. The implementation of the IED Directive materially impacts ArcelorMittal’s activities in the EU to an amount not yet determined since many issues that ultimately will determine this impact are not yet fixed due to authorities’ delays in implementing decisions and reconsideration of permits. Most of the Member States were expected to update permits and have ELVs achieved by operators in March 2016. Most permits were updated during 2017. However, negotiations and updates are still ongoing in some countries. On July 31, 2017, the European Commission adopted BAT conclusions for large combustion plants under the IED (C(2017)5225). The scope of these BAT reference documents ("BREF") covers the combustion of solid, liquid and gaseous fuels (including iron and steel process gases) in boilers, gas engines and gas turbines with a total rated thermal input of > 50MW (or in case of several units > 15 MW that are aggregated (sharing a common stack) so that the addition of all capacities reaches 50 MW). The main difficulty for the combustion of process gases is the achievement of NOx and SO
2
limits when using mixtures of gases with a high share of coke oven gas. Following the adoption of these BAT conclusions, competent authorities have four years (until August 17, 2021) to review and update the permit conditions accordingly and to ensure that the new ones are compliant. It is important to note that, according to the IED it is only mandatory to update the permit conditions when new BAT conclusions related to the main activity of the installation are published. Nevertheless, competent authorities have relative freedom to launch the review even in cases where it will not be the main activity, hence several facilities may be impacted by this new BREF.
|
|
•
|
Directive 2008/98/EC of November 19, 2008, which establishes the legislative framework for the handling and management of waste in the EU. On December 2, 2015, the Commission adopted an ambitious new Circular Economy Package to stimulate Europe's transition towards a circular economy which will boost global competitiveness. This was intended to contribute to "closing the loop" of product lifecycles with plans to extract the maximum value and use from all raw materials, products and waste, fostering energy savings and reducing greenhouse gas emissions and cover the full lifecycle: from production and consumption to waste management and the market for secondary raw materials. Directive 2008/98/EC was amended by Directive 2018/851 effective May 30, 2018 . This new Directive is intended to prevent waste and, where prevention of waste is not possible, to significantly increase recycling. The intention is to phase out landfilling and promote the use of economic instruments, such as extended producer responsibility (this is a policy approach under which producers are given a significant responsibility – financial and/or physical – for the treatment or disposal of post-consumer products) schemes. The Directive strengthens the concept of "waste hierarchy" requiring specific measures to prioritize prevention, re-use and recycling above landfilling and incineration.
|
|
•
|
Directive 2012/27/EU of October 25, 2012, which repeals prior Directives 2004/8/EC and 2006/32/EC, and brings forward legally binding measures to step up Member States’ efforts to use energy more efficiently at all stages of the energy chain – from the transformation of energy and its distribution to its final consumption. Measures include the legal obligation to establish energy efficiency obligations schemes or policy measures in all Member States. The final target is to achieve energy efficiency improvements of 20%. It is worth noting that most provisions of the texts do not apply to ETS industries and a lot of flexibility is given to the Member States to set up supportive schemes instead of obligatory ones. A political agreement was reached on June 14, 2018 for a revised Renewable Energy Directive. as part of the implementation of a resilient Energy Union and a forward-looking climate change policy. This, along with revised renewable energy targets for the EU for 2030 pursuant to Directive (EU) 2018/844 of the European Parliament and the amendment to Directive 2010/31/EU on the energy performance of buildings, will support Europe's commitment to complete clean energy transition and meet the goals set by the Paris Agreement.
|
|
•
|
“REACH” Regulation (EC) no. 1907/2006 for Registration, Evaluation, Authorization and Restriction of Chemicals, adopted on December 18, 2006, which controls the (chemical) substances used, manufactured in or imported into the
|
67
EU and “CLP” Regulation (EC) no. 1272/2008 of December 16, 2008 on the classification, labeling and packaging of substances and mixtures, which complements it.
|
•
|
Directive 2003/87/EC of October 13, 2003 (which has been amended several times and especially by Directive 2009/29/EC) and related directives establishing the ETS in three phases for achieving Kyoto Protocol commitments relating to GHGs for Member States. The ETS works on the “cap and trade” principle. This means there is a “cap”, or limit, on the total amount of certain GHGs that can be emitted by the factories, power plants and other installations subject to the ETS. Within this cap, companies receive emission allowances which they can sell to or buy from one another as needed. The limit on the total number of allowances available ensures that they have a value. At the end of each year, each company must surrender enough allowances to cover all its emissions, otherwise heavy fines are imposed. If a company reduces its emissions, it can keep the spare allowances to cover its future needs or sell them. Phase II of the ETS ended on December 31, 2012, and Phase III covers the period from 2013 to 2020. In Phase III, all CO
2
allowances should be auctioned (as per Regulation (EC) no. 1031/2010 of November 12, 2010 on the timing, administration and other aspects of auctioning of emission allowances). The Commission is implementing Phase III of the ETS in a manner that could increase costs for the Group to obtain sufficient emission allowances for its European operations depending on steel production levels and the market price of emission allowances. Through Commission Decision 2010/2/EU of December 24, 2009, manufacturing of coke oven products, of basic iron and steel, of ferro-alloys and of cast iron tubes have been recognized as exposed to a significant risk of “carbon leakage”. In its decision of April 27, 2011, the Commission determined transitional EU-wide rules for the harmonized free allocation of emission allowances and the benchmark values for the steel industry. The values adopted result in fewer free allocations than those sought by the European steel industry and will lead to additional costs for steel companies in Europe at the point in time when companies have fully utilized their free allocations. Under Commission Decision 2013/448/EU of September 5, 2013, implementation of a so called “Cross Sectoral Correction Factor” will further negatively impact CO
2
free allowances previously announced to the industry based on benchmark values. In 2014, the Commission investigated new possible schemes and mechanisms to regulate and adjust CO
2
prices on the ETS market (CO
2
backloading, or Market Stability Reserve). On October 6, 2015, the Commission published its decision concerning the establishment and operation of a Market Stability Reserve. The reserve is supposed to address the current surplus of allowances and improve the system's resilience to major shocks by adjusting the supply of allowances to be auctioned. In other words, it is meant to address the market imbalances. On October 23, 2014, the Commission agreed on a 2030 greenhouse gas reduction target of at least 40% compared to 1990. This is on top of the other main targets of the Commission’s 2030 policy framework calling for increasing the share of renewable energy to at least 27% and increasing energy efficiency by at least 27%.
|
|
•
|
On November 9, 2017, the European Parliament and Council announced a provisional agreement to revise and make the ETS more stringent during the Phase IV period of 2021 to 2030. Among other changes, Phase IV provisions would further accelerate reduction in the current oversupply of allowances in the ETS market (with industry free allowance surpluses expiring) and establish further protections against the risks of carbon leakage. Directive 2018/410 dated March 14, 2018 amends the rules of ETS for the next period, 2021-2030. The Delegated regulation on post 2020 free allocation of emission allowances rules ("FAR") will regulate the free allocation rules for the next period. According to these rules, the benchmarks will be at least 3% lower than the current period regardless of industry performance. Depending on further implementation rules, the lack of significant free allocation in Phase IV could result in an increase of marginal production costs by approximately €50 per tonne (assuming a price of 25€/tCO2), which would put the European steel industry at a significant disadvantage versus global competition.
|
The following EU Directives are also significant:
|
•
|
Directive 2008/50/EC of May 21, 2008 on ambient air quality and cleaner air for Europe.
|
|
•
|
Directive 2004/107/EC of December 15, 2004 relating to limit values and target values for pollutants in ambient air, including thresholds on very fine particulates. Several annexes to Directives 2004/107/EC and 2008/50/EC were amended by Directive (EU) 2015/1480 of August 28, 2015.
|
|
•
|
The Clean Air Policy Package, Directive (EU) 2016/2284 of December 14, 2016 on the reduction of national emissions of certain atmospheric pollutants. This Directive amends Directive 2003/35/EC and repeals Directive 2001/81/EC. This Directive, ensures that the national emission ceilings (NECs) set in the current Directive 2001/81/EC for 2010 onwards for SO
2
, NOx, NMVOC and NH3 shall apply until 2020 and establishes new national emission
|
68
reduction commitments (“reduction commitments”) applicable from 2020 and 2030 for SO
2
, NOx, NMVOC, NH3 and fine particulate matter (particulate matter of size 2.5 microns) (“PM2.5").
|
•
|
The new Directive on the control of major accidents hazards involving dangerous substances, also known as SEVESO III 2012/18/UE (repeals Directive 96/82/EC of December 9, 1996), which has been applicable since June 1, 2015. Updates take into account changes in the EU classification of dangerous substances, strengthen provisions on public access to safety information and introduce stricter standards for inspections of installations.
|
|
•
|
Directive (EU) 2015/2193 of November 25, 2015 on the limits of emissions of certain pollutants into the air from medium combustion plants ("MCP").
|
|
•
|
Directive 2011/92/UE concerning the impact assessment of certain public and private projects on the environment. Directive 2009/31/EC of April 23, 2009 on the geological storage of carbon dioxide.
|
|
•
|
Directive 2009/28/EC of April 23, 2009 on the promotion of the use of energy from renewable sources. As part of its ‘Clean Energy for all Europeans’ package, the European Commission proposed in 2016 an update of the Renewable Energy Directive for the period 2021 - 2030 (RED II). A final compromise document was agreed among EU Institutions on June 14, 2018.
|
|
•
|
Directive 2008/68/EC of September 24, 2008 on the inland transport of dangerous goods, by rail, road, and inland waterway and Directive (EU) 2016/2309 of December 16, 2016 adapting for the fourth time the Annexes to Directive 2008/68/EC.
|
|
•
|
Directive 2004/35/EC of April 21, 2004, and Directive 2008/99/EC of November 19, 2008, establishing liability (including criminal liability) for violations of the EU environmental legislation.
|
|
•
|
The new Directive 2013/59/EURATOM of December 5, 2013, establishing basic safety standards for protection from the exposure to ionizing radiation and repealing former EURATOM directives, effective from February 6, 2018.
|
ArcelorMittal anticipates that its capital expenditures with respect to environmental matters in the EU over the next several years will relate primarily to installations of additional air emission controls, to requirements imposed in the course of renewal of permits and authorizations, including those pursuant to the IED Directive, and to address GHG issues, including the reduction of emissions and purchase of allowances. In relation to ArcelorMittal Italia (formerly Ilva), environmental obligations of the previous owners have been transferred to ArcelorMittal through environmental permits. This will require significant capital investments, see note 8.4 to the consolidated financial statements for further information. Significant issues that need to be addressed include reduction of diffuse dust emissions (from storage yards) and channeled emissions (such as sinter primary de-dusting system and coke plant de-dusting systems, treatment of process waste waters and implementation of rain water collection, separation and treatment.
Other jurisdictions
Increasingly stringent environmental laws and regulations have also been adopted in other jurisdictions. Set out below is a summary of the principal environmental legislation applicable to ArcelorMittal in key jurisdictions where it has substantial manufacturing or mining operations.
Argentina
Law 25.675, which was enacted in 2002, requires facilities engaging in potentially hazardous activities to obtain Environmental Insurance. ArcelorMittal has obtained Environmental Bonding Insurance for Villa Constitucion, Tablada and San Nicolas plants in order to meet the requirements and renews the plans annually.
Law 11.717 and Decree 101/03 for Santa Fe province regulate environmental licenses and the environmental requalification plan. The Villa Constitucion plant’s license was officially obtained in June 2013. The Villa Constitucion Plant’s committed plan was monitored by environmental authorities and completed in January 2014. This license was renewed in 2017. The Tablada and San Nicolas Plant's licenses were obtained for Tablada in November 2013 and the San Nicolas license was obtained in July 2013 and an additional license in April 2014. The renewal process for the Villa Constitucion plant was tied to investments in water treatment for direct reduction process effluents and to the resolution of certain environmental issues
69
relating to the steel facility. The plan is expected be ready in March 2019 after which the renewal process will be addressed with the regulatory authorities. Regarding the San Nicolas and Tablada sites, there are no issues preventing approval.
Decree 2151/14 requires that industrial non-dangerous residues undergo recycle or recovery activities and avoid final disposal. The Company is already compliant but may be required to develop further projects in relation to new by-products.
In the Buenos Aires province, Decree 429/13 has imposed taxes relating to water consumption. The impact of this on the Company’s operations is minimal.
Law 27.191 was approved relating to renewable energy generation and consumption and applying fines for non-compliance. The new law and resolution 281/17, which established the framework that governs the Term Market for Renewable Energies ("MATER") and sets the rules for agreements between private companies, was fully applicable as of January 1, 2018. This is not expected to have a significant impact on the Company. With respect to Acindar, this new legislation does not have a significant impact on energy costs due to the current low contribution of renewable sources to Acindar’s current energy mix and the extended timeline to build and implement renewable energy projects. The law is expected to have a more significant impact from 2020, with a reduction in costs once Acindar is able to enter into direct supply agreements with generators. This may also, however, require renewable energy capital projects to be undertaken.
Decree 3395/92 for Air Quality Standards foreseeing more stringent air quality standards including incorporating PM2.5 to the regulated parameters for Buenos Aires province is still under review. The Company does not expect that any significant capital expenditures will be required to meet these new proposed standards.
In 2017, the Buenos Aires environmental authority OPDS commenced review of regulations relating to polychlorinated biphenyls (“PCBs”, which are highly toxic chemical compounds present in electricity transformer oil) to allow decontaminated equipment to reach 50 ppm instead of 2 ppm. This change would align with the regulations in the rest of the country. In May 2017, the Ministry of Energy dictated Resolution 1-E/2017,
the
purpose of which is to consider the special situation of manufacturing companies that are affected by the process of electricity price disclosure and to promote a regime of benefits with discounts on the cost of energy in exchange for accrediting an improvement program aimed at energy efficiency. In 2016, Acindar agreed to the first version of the scheme and obtained a discount of $385,000. After fulfilling each of the stages of the project, Acindar was awarded as an electrointensive industry an estimated discount in the cost of energy of $500,000.
Other national laws are being developed, imposing further responsibility on manufacturers, including hazardous wastes disposal and remediation of contaminated sites, to standardize requirements between provinces and to align them with international requirements.
Argentina is considering the introduction of a Carbon Tax with effect from 2020. The amount of the tax will depend on the fuels’ potential CO2 emissions (current proposal being considered is $25/TnCO2-e) and a fixed-sum tax per unit of fuel in order to match the current tax pressure. At this time it appears that the draft legislation excludes fuels that are used as raw materials. However, if natural gas (used as a raw material in the direct reduction process) falls within the purview of the legislation, the impact could be about $25 million per year. The Company has requested the regulatory authorities to exclude it from the imposition of this tax as it utilizes mineral petroleum coke and is awaiting a response.
Bosnia and Herzegovina
Environmental legislation in Bosnia and Herzegovina is essentially based on the provisions of a set of federal laws and regulations that have been effective since January 2008. The following practices are particularly relevant for ArcelorMittal Zenica: adopting best available techniques and complying with limit values that achieve environmental quality standards in air and water, preventing and controlling major accidents involving hazardous substances, procedures and measures for dealing with accidents in water and coastal water land, fees on sulfur dioxide, nitrogen oxides and dust emissions the discharge of pollutants in water, waste recovery, disposal and export and limitations on noise pollution. In 2018, the federal government amended laws and regulations related to air emission limits, monitoring of air emission and waste management which are also relevant to ArcelorMittal Zenica operations.
In April 2017, the Federal Ministry of Environment and Tourism issued an integrated environmental permit for all plants in ArcelorMittal Zenica. A water permit was issued by the relevant federal agency in July 2017. Both permits are valid until 2022.
70
In addition to investments already achieved and ongoing investments, several investments are expected in the coming years to continue improving the environmental footprint of the plant and thus the release of lower emissions, in the context of poor air quality in Bosnia Herzegovina and NGO concerns regarding the situation.
For ArcelorMittal Prijedor, the Omarska mine has two separate licenses, one for the surface pit, which was renewed in 2015 and remains valid through 2020, and the other for the GMS plant (Medjedja tailing dam and maintenance) which was renewed in 2018 and remains valid until 2023.
T
he process for obtaining an extension has been initiated. ArcelorMittal Prijedor is required to renew its environmental licenses every 5 years. ArcelorMittal Prijedor also obtained an environmental license for Limestone Quarry Drenovaca in 2016, which must be renewed in 2021.
Brazil
ArcelorMittal’s operating subsidiaries in Brazil are subject to federal, state and local environmental laws and resolutions issued by the Brazilian environmental authorities. The Federal Constitution established the protection of the environment as a principle, while both the government and society generally are responsible for the achievement of such purpose.
National Decree no. 7390/2010 regulates Articles 6, 11 and 12 of the National Policy on Climate Change (Federal Law No. 12187/2009). For the steel sector, a reduction target of 5% by 2020 with 2012 as the reference year has been established.
On April 4, 2012, the Brazilian Steel Institute and its associated companies launched the “Protocol for Sustainable Charcoal Production”. The Protocol’s objectives are to avoid charcoal production from illegal deforestation and to stimulate suppliers to produce charcoal from eucalyptus planted forests. In 2013, meetings were held to define actions to achieve the protocol’s objectives. In 2015, the criterion for Green Labeling in pig-iron production was established by the Brazilian Association of Technical Standards. Implementation of the new Protocol depends on the creation of new forms that were expected to be finalized, however, they are yet to be published.
Federal Resolution No. 436/2011 published by the Brazilian National Environmental Council ("CONAMA") established maximum limits for air pollutants emissions from stationary sources installed or having requested its installation license before January 2, 2007. More restrictive limits can be determined by the licensing environmental agency, according to the local conditions of the affected area. Beginning in 2014, more stringent limits became effective for emissions of particulate material, SO
2
, NOx from coke ovens, electric arc furnaces, rolling mills, sintering, charcoal blast furnaces and blast furnaces. ArcelorMittal Brasil already complies with these new emission standards. In Minas Gerais State the Normative Deliberation COPAM n° 227/2018 establishes procedures to reduce the atmospheric emissions of charcoal kilns from planted forest and to evaluate the air quality in its surroundings. ArcelorMittal's industrial units do not expect any issues with meeting the requirements of this Normative Deliberation.
São Paulo State published Decree No. 59263/2013, which established guidelines for contaminated site management. The main items are related to the publication of a State List of Contaminated Sites. The Decree requires the legally responsible person to provide bank guarantees or environmental insurance worth at least 125% of the costs estimated in such plan. The penalties for violating this Decree could consist of fines of up to $30 million or embargo, demolition and suspension of loans and tax benefits. Also in São Paulo State the Decree nº 63.262 regulates Law 7.663/91, which provides for the State Policy on Water Resources and the grant and exercise of water use rights in São Paulo. Authorization 14/18 granted ArcelorMittal Piracicaba the right to launch liquid effluents in the public sewage network, until January 31, 2019.
Due to the water crisis faced in the South East of Brazil, São Paulo, Minas Gerais and Espírito Santo, where most of ArcelorMittal Brasil's industrial sites are located, laws enacted in 2015 and 2016 that imposed restrictions on water permits for industrial use are still in effect. These restrictions are only applicable for the period when river flows are below pre-established levels. The restriction has not affected its operations since the site also has groundwater permits that provide the necessary flow for the operational activities and action has been taken to reduce water consumption, similar to actions taken at the Tubarão and Cariacica sites.
Regarding industrial effluents, regulatory Deliberation CERH n° 47/2014 established new procedures for granting submissions for the release of effluents in Minas Gerais State.
Following the 2005 World Health Organization (“WHO”) recommendations, there continues to be a trend to adopt new air quality standards at the national and state levels. National standards in force, established by Resolution CONAMA 003/1990, are considered outdated and a change of values for parameters such as PM10, NOx, and O3 are envisaged, together with the incorporation of the PM2.5 parameter. The states of São Paulo and Espírito Santo, through the State Decree 59113/2013 and
71
Decree No. 3463-R DE 12.16.2013, respectively, have reviewed the state air quality standards following the guideline values suggested by WHO, and have established emission control plans for gradual adaptation to the new standards. This trend may result in more stringent air emission limits on industrial activities in these states and other states from the review of national standards.
In Vitória, a municipal mechanism to control dust emissions and air quality was implemented in 2015, which, among other things, creates intermediate targets to be implemented from 2018, lowers emission values to new parameters, especially PM 2.5, and creates an emergency plan when air quality at Vitória falls to a critical level. The State is leading investigations on the “Black dust” saga which is followed by the press and social media due to potential health issues in the area. Emissions of several industries are scrutinized by the authorities. In November 2016, the Federal Public Prosecutor´s Office in Espírito Santo State requested to be party to the lawsuit in which ANAMA (National Association of Friends of the Environment) is claimant against ArcelorMittal in a matter involving visible emissions. The initial suit was suspended by the judge for one year while ArcelorMittal implemented an environmental agreement reached with authorities, which was appealed by ANAMA. There have been no orders or findings from the appeal judge in the matter yet and the suspension of the initial suit continues. The Normative Instruction n° 2/18 established the minimum criteria for the implementation of Plans and Projects of Environmental Education and Social Communication with respect to the workers and communities in the areas of influence of the companies to be licensed by the Espírito Santo State Environmental Agency.
Following the Samarco accident, the state of Minas has issued State Decree No. 46993/2016 and State Resolution SEMAD / FEAM 2372/16, both requiring extraordinary audits of tailings dams, generating increased costs for compliance and a number of surveillance visits from federal and state agencies (environment, geology and police departments).
Minas Gerais State Law 21972/2016 proposed significant changes both in the structure and the competences of the state Environmental Agency. State Normative Resolution COPAM nº 217/2017 establishes criteria for classification, according to size and polluting potential, as well as the locational criteria to be used to define the modalities of environmental licensing. Decree nº 47.474 / 2018 establishes rules for environmental licensing and classifies infractions according to the norms of protection to the environment and to water resources and establishes administrative procedures for the inspection and application of the penalties. Normative Resolution COPAM nº 223/2018 prohibits the storage, processing and final disposal of hazardous waste and waste generated outside the State. Normative Resolution COPAM nº 220/2018 established guidelines and procedures for the temporary halting of mining activity and mine closure.
National Decree no. 7390/2010 regulates Articles 6, 11 and 12 of the National Policy on Climate Change (Federal Law No. 12187/2009). Following the ratification of the Paris Agreement, the Intended Nationally Determined Contribution ("INDC") for Brazil, that proposes absolute emission reductions targets of 37% by 2025 and 43% by 2030 in comparison to historic emissions of 2005, was ratified by the Brazilian Congress. The implementation of the INDC targets is currently under discussion. There are no specific targets for the industrial sector, but it is expected that new regulations will be issued to reduce GHG emissions. Normative Instruction nº 19/18 establishes the procedures for the regularization and licensing by the Federal Environmental Agency of activities that use radioisotopes.
Canada
ArcelorMittal’s operating subsidiaries in Canada are subject to federal environmental laws regulating matters of national interest (for example, the Fisheries Act and the Canadian Environmental Act) and provincial legislation regulating matters of more local importance such as natural resource use, local air and water quality noise and hazardous waste management.
The province of Québec and the state of California in the U.S. are currently members of the Western Climate Initiative (“WCI”), a sub-national GHG emission cap and trade program. In 2016, the government of Ontario enacted the Climate Change Mitigation and Low-Carbon Economy Act and an associated regulation (O. Reg. 144/16) which established a GHG emission cap and trade program that began in 2017. In June 2018, Ontario’s new government canceled the existing GHG Regulation and is currently developing a new plan. Details about this new Provincial system and plans to legally challenge the Federal system have not been announced.
Separate consultations by the government of Québec are underway with large emitters of GHG in each province with regard to the cap and trade program regulation for the second and subsequent compliance periods from 2021 to 2030. For Québec, consultations were completed for the 2021 to 2023 compliance period and the financial impact of the regulation was reduced compared to what was presented at the end of 2016 for the period. For the period 2024 to 2030, negotiations will commence in 2019 in order to minimize the financial impact of regulatory changes.ArcelorMittal Dofasco could be subject to
72
the Federal “Backstop” GHG regulation.
In October 2016, the Federal government of Canada announced its intention to impose a minimum, national carbon price on provinces without a pricing system for reducing GHG emissions. In 2018, the federal government finalized the Federal Carbon Pollution Pricing System ("FCPP System") that has two components:
|
–
|
a charge on fossil fuels which will be administered by the Canada Revenue Agency, and
|
|
–
|
an output-based pricing system ("OBPS") for emission-intense industrial facilities which will be administered by Environment and Climate Change Canada ("ECCC").
|
The regulation pertaining to this FCPP System is effective from January 1, 2019 but the details are not expected to be finalized before the second quarter of 2019. The finalized regulation, which will not apply to the Québec province, would then be applied retroactively as of January 1, 2019.
The main features of the proposed system include a carbon levy on fossil fuel (which will be passed on to users) with a steep increase over the next 5 years and an exemption of the fuel levy for industrial users to be replaced by OBPS. A customization for each sector’s OBPS is underway as the program rules are developed over the coming months (including arguments regarding competitiveness and carbon leakage). The starting point of the standard is 90% of the average of the Ontario integrated steel sector. There is no acknowledgment
of fixed process emissions exemptions yet. The carbon pricing starts at CAD 20 per tonne in 2019 and is set to increase to CAD 50 per tonne by 2022.
It is too early in the consultation process to reasonably estimate the final impact for ArcelorMittal Dofasco.
On December 13, 2017, ECCC published a Clean Fuel Standard ("CFS") regulatory framework. The federal government plans to publish regulations in 2019 but the effective date is still to be determined. As per this regulation, the government would allow for a one-year “warm-up” in 2020 to allow time for obligated parties to adapt before mandatory compliance begins in 2021. The development of this regulation is ongoing and no significant developments have been shared by the government so far.
The CFS will establish lifecycle carbon intensity requirements separately for liquid, gaseous and solid fuels that are used in transportation, industry and buildings. This performance-based approach is intended to incentivize innovation, development and use of a broad range of lower carbon fuels, alternative energy sources and technologies. It is still too early to reasonably estimate the final program’s results considering the ongoing consultation process.
ECCC has developed Base Level Industrial Emission Requirements (“BLIERs”) under the Air Quality Management System, the national regulation addressing Criteria Air Contaminants. For the steel sector, emissions of NO
X,
SO
2,
VOCs and fugitive particulates are covered. The SO
2
BLIER requires ArcelorMittal Dofasco to install full coke oven gas desulphurization by December 31, 2025. The NOx BLIER will be managed through oxygen controls at the hot mill reheat furnaces by May 1, 2020.
BLIERS also apply to ArcelorMittal Mining Canada’s operations. This will likely require investments to reduce emissions in the future.
A Performance Agreement ("PA") has been signed by ArcelorMittal Mining Canada with the Iron Ore Pellet Sector on January 5, 2018 which specifies the membership, timelines and deliverables of the NOx Working Group and will ensure that the BLIERs limits for PM2.5 and SO2 are met, and that the approach to study NOx is implemented.
In Ontario, Air Regulation 419 requires ArcelorMittal Dofasco to manage an inventory of air pollution sources and model the concentrations of pollutants at the property boundary. Site Specific Standard limits for Benzo(a)pyrene, Benzene, Particulate Matter, Manganese and Sulphur Dioxide will be reviewed with the government over the next 2 years. These will likely result in requirements for studies and then further reductions in the future.
Permits for water discharges are becoming more stringent and it is possible that ArcelorMittal Dofasco may be required to treat for ammonia from its Primary Water Treatment Plant discharge to the Hamilton Harbour. Negotiations are currently underway with the government’s approvals offices.
73
In Québec, the mining and metallurgical sectors are negotiating depollution permits that will apply to ArcelorMittal Mining and Infrastructure Canada and ArcelorMittal Long Products Canada works. In the mining sector, some objectives for dust, NO
x
and SO
2
were also identified and a draft agreement prepared, but there has been no further progress.
The depollution permit for ArcelorMittal Mines Canada's Mont Wright operations was issued in March 2010 and modified in July 2015. The next update is required in 2020. Its Port-Cartier pellet plant depollution permit was issued in April 2015 and is to be renewed in 2020. The Fire Lake depollution permit was received in June 2015 and will require to be renewed in 2020. These permits establish the targets for water, air, soil and waste management, as well as the monitoring and reporting frequencies and requirements. The permits require ArcelorMittal Mines and Infrastructure Canada to implement a storm water treatment system at the pellet plant to comply with applicable Total Suspended Solids (TSS) standards. A permanent treatment plant is being designed and will be constructed and put in operation in 2021. Air emissions monitoring is conducted at the pellet plant and mitigation projects are being evaluated for dust (ESP), dioxin and furans and SO
2
abatement to attain compliance with applicable standards.
A water management multi-year project aimed to control the surface effluents on the waste rock piles and achieve compliance with the applicable federal regulation on the metal mines and diamond mines effluents (MMDMER) was started in 2017 and consists of the construction of collector ditches on the perimeter of the waste rock piles and the installation of temporary and permanent water treatment units in Mont-Wright and Fire-Lake.
Starting in 2014, ArcelorMittal Mines and Infrastructure Canada is taxed on sites with depollution permits for waste rock and tailings storage with a maximum annual cost per site of CAD1 million per year per site.
At the provincial level, a Decree has been issued on August 15, 2018 for the tailings expansion consisting of construction of a water containment basin (B+ basin) and the new tailings impoundments. The Decree imposes more restrictive environmental goals at the final mine effluent for total suspended solids, metals and nitrates.
Pursuant to the mining regulation and the restoration plans for the facilities in Mont Wright, Fire Lake and Port-Cartier ArcelorMittal Mines and Infrastructure Canada provided a financial guarantee of CAD80 million for restoration of the sites identified by Quebec Ministry of Natural Resources.
The depollution permit for ArcelorMittal Long Products Canada's Contrecoeur West facility was issued on December 21, 2018 and the process for issuance of the depollution permit for its Contrecoeur East facility is expected to be completed by the first quarter of 2019. Obtaining the new depollution permits will require increasing monitoring frequencies as well as conducting certain studies including water usage, air dispersion modeling, phase I environmental site assessment, former EAF dust stock pile site restoration and former slag management area assessment.
Québec adopted a Clean Air Regulation on June 30, 2011 that requires particulate matter ("PM") testing for steel mills, (annual testing of baghouses and testing of roof fans every three years), and installation of broken bag detectors in baghouses. A baghouse was replaced at ArcelorMittal Long Products Canada’s Contrecoeur West steel making facility in 2018. A combustion chamber and canopy hood volume increase at its Contrecoeur East facility is in progress with the expected completion date at the end of 2020. Currently under study is the replacement of bag houses at both of its Contrecoeur West and Contrecoeur East facilities. ArcelorMittal Long Products Canada estimates this will require a further investment of approximately CAD35 million to comply with this regulation.
In the mining sector, this regulation reduced the limit for total PM from 120 to 75 grams/tonne produced for existing pelletizing plants, including ArcelorMittal Mines and Infrastructure Canada. The limit for a new plant will be 50 grams/tonne produced. The electrostatic precipitator refurbishment plan included in the five-year capital expenditure plan will contribute to ensuring conformity with the new emission limit on a medium-term basis. This project is being undertaken over a 10 year timeline, and its expected cost will be approximately CAD15 million.
A one-year test with liquefied natural gas (“LNG”) was started in the spring of 2018. At ArcelorMittal Mines and Infrastructure Canada, a total of six burners on one production line were converted to LNG with the objective of reducing the cost of GHG. To improve the energy usage, multiple initiatives are implemented by ArcelorMittal Mines and Infrastructure Canada at the pellet plant, among which the 3-stage screening conveyor project is the most successful in increasing the energy efficiency. Projects on cleaner fuel usage, such as natural gas and bioenergy, are being studied at the pellet plant.
ArcelorMittal Mines and Infrastructure Canada is presently below the cap for CO2, but will pursue initiatives for CO2 reduction as the cap is decreasing every year and the trade value is increasing by about 7% on an annual basis.
74
On February 6, 2018, the Federal Government published Bill C-68, which aims to provide a framework for the proper management and control of fisheries and the conservation and protection of all fish and fish habit, including pollution prevention. The definition of fish habitat is also modified and broadened to include any waters frequented by fish in Canada. Discussions with authorities are ongoing through the Mining Association of Canada to address provisions related to water flow and to designated projects. Feedback indicate that regulators and government intends to amend Bill C-68.
The Québec Environmental Quality Act (“EQA”) has been subject to significant modifications, which, for the most part, entered in force on March 23, 2018. Under the new EQA, many mining and ore treatment activities which have serious anticipated environmental impacts as defined by the EQA, will be subject to the environmental impact assessment and review procedure provided for under the EQA. In such cases, the impact on ArcelorMittal Mines and Infrastructure Canada will be longer delays in obtaining regulatory authorizations, as an impact assessment and public consultations may be required for its projects and may take up to 2 years prior to the submission of the request for authorization.
Québec’s revised regulation relating to compensation for adverse effects on wetlands and bodies of water entered in force on September 20, 2018. This regulation determines the activities exempt from compensation, the calculation method of the amount of the financial contribution payable as compensation, as well as the cases in which a financial contribution may be replaced by work carried out. The regulation applies essentially to all the territory of Québec located south of the 49th parallel. As such, it does not apply to a mining project operated in Mont-Wright and no financial contribution or offset plans will be required for these projects. The regulation will apply to projects conducted in Port-Cartier.
Kazakhstan
In April 2016, Kazakhstan introduced a number of amendments to the environmental code in the area of GHG emissions. Among other things, the amendments suspended provisions of the environmental code which (i) prohibit GHG emissions without obtaining a quota and (ii) regulated trading of emission quotas until January 1, 2018. Previously issued quotas and trading of quotas had been suspended until January 2018. Effective January 1, 2018, this part of Kazakh legislation came into force. The Administrative Code of Kazakhstan that came into force on January 1, 2015 increased the penalty provisions for legal entities and officials for environmental violations. Fines were determined for exceeding the approved level of GHG emissions in the amount of five times the “monthly calculation index” for each unit of quota exceeding the permitted level.
Starting from January 1, 2017, one monthly calculation index is equal to 2,269 KZT ($6). The size of the monthly calculation index is approved by the state and re-considered annually. When deciding on the amount of the fine, the court or other authority considering the administrative offense will take into account the value of the index which was in effect at the time when the administrative proceeding was initiated. However, in line with the above amendments to the environmental code, the provisions of the administrative code imposing liabilities for exceeding GHG emission quotas were suspended until January 1, 2018 and came into effect thereafter.
The committee of environmental control and regulations of the Ministry of Energy has put forth a proposal to cancel the procedure of obtaining special permits that allow emissions and discharges to the environment (i.e., "ecological permits"). These ecological permits are separate from the permits governing GHG emissions. As of December 31, 2018, no ecological permits had been canceled.
Two new laws became effective in 2018: law 126-VI of the Republic of Kazakhstan dated December 27, 2017, which makes amendments and additions to certain legislative acts of the Republic of Kazakhstan on subsoil use and law 156-VI of the Republic of Kazakhstan dated May 25, 2018, which makes amendments to some legislative acts of the Republic of Kazakhstan on the improvement of business regulation.
Effective from January 1, 2019 the Environment code of the Republic of Kazakhstan banned the disposal of solid domestic waste without its prior recycling. Disposal of waste without recycling would be an administrative violation that could result in fines. Fines will be calculated based on the extent of environment damage caused.
Authorities have reduced liability in the Administrative Code of Kazakhstan for some ecology offenses such as for non-compliance with the requirements of the legislation on the mandatory obtaining of state ecological expertise from 500 monthly calculation index ("MCI") (US$3,300) to 350 MCI (USD$2,300). In addition, new rules allowing users of environmental resources to install an automated system for the monitoring of emissions at the sources of pollution have been introduced.
75
However, detailed procedures on how to comply with such requirements are not yet available. This is likely to reduce instances of penalties in the future
.
Liberia
The Environmental Protection Agency Act (2002) (“EPA Act”) was the initial environmental law in Liberia. It established an Environmental Administrative Court and provided for a National Environment Action Plan, which builds on local and regional action plans. The EPA Act requires Environmental Impact Assessments (“EIAs”) to be carried out for all activities and projects likely to have an adverse impact on the environment, as well as mechanisms to achieve restoration of degraded environments. It also provides the means for permits, fees and fines.
Enacted at the same time, the Act Adopting the Environment Protection and Management Law of the Republic of Liberia (2002) (“EPML”) is the principal piece of legislation covering environmental protection and management in Liberia. The Liberian system incorporates a social impact assessment within the Environmental Impact Assessment.
In the absence to date of any announced environmental management regulations, ArcelorMittal has devised an Environmental and Social Standards Manual to cover its operations in Liberia. This was approved by the Liberian EPA for use as a guidance document for all site activities under the existing Liberia mining project and remains the only set of such guidelines in the country. ArcelorMittal updates this Manual periodically, according to experience and operational needs.
The Act Adopting the National Forestry Reform Law (2006), together with the National Forestry Law (2000) and the Act Creating the Forestry Development Authority (2000) that it amended, cover all aspects of commercial and community use of forests. Community management of forests was significantly enhanced by the enactment of the Community Rights Law with respect to Forest Lands (2009). Some territory gazette under this law is within ArcelorMittal’s concession, and access to these areas is leading to a series of test cases between this law and the Company’s Mineral Development Agreement. Some parts of the concession are also protected under the Act for the Establishment of a Protected Forest Areas Network (2003), and specifically by the subsidiary Act for the Establishment of the East Nimba Nature Reserve (2003).
With respect to land tenure, in rural areas there is a strong crossover between agriculture and forestry. A moratorium on Public Land Sales banned all transactions involving public land and also voided any new Tribal Land Certificates (“TLC”). The 2010 Land Policy Review was silent on the validity of existing TLCs as ownership documents, although they are the first step in the chain of transfer of land from customary to individual title. In 2014, the Lands Commission suspended deals involving TLC, pending a review of their relationship to formal title deeds. The Ministry of Lands, Mines and Energy (“MLME”) reported allowing TLCs to be used as valid land ownership documentation in respect of land that had to be leased for development. They also produced guidelines for the process for valuing land for developmental rental purposes only, and these have been deployed in all concessions. So far, there has been no codification of these guidelines into law, but they are a requirement of concessionaires managed by MLME, of which ArcelorMittal is one.
The draft Land Rights Act is still yet to be passed. However, in October 2016, Title 12 of the Executive Law of the Liberian Codes of Law Revised was amended to create the Liberia Land Authority whose role is to control and manage the access and use of public and government land and ensure the development of land use plans and zoning schemes. The Authority is also entitled to establish county land boards and land management structures to govern and manage the land of communities.
Although ArcelorMittal suspended its proposed Project Phase 2 expansion in 2014 following the onset of Ebola in West Africa and subsequent poor market conditions, the various environmental permits already awarded set a number of stringent conditions for ongoing operations and for future project developments. Among other things, they have necessarily committed ArcelorMittal to a significant environmental offset program and a comprehensive mine closure plan. While most of the costs of these initiatives will be incorporated in operational expenditure over the life of the mine, the implication is that the offsets may eventually amount to at least $70 million and overall mine closure may amount to more than $100 million.
Renewal of the environmental permit at the end of June 2017 included mining activities for Gangra which were part of the Phase 2 expansion project. This permit has increased requirements in terms of sediment control, water discharge as well as biodiversity conservation. Increased requirements as identified in the 2017 Phase 1 ESIA addendum calls for more stringent sediment controls and land take management, and expansion of the offset program due to the increase in the mine footprint.
Mexico
76
In Mexico, steel and mining activities are under federal jurisdiction. Permits to operate are subject to different environmental authorizations. Complementary to the framework law on the environment of January 28, 1988 (Ley general para el equilibrio ecologico y protección ambiente or “LGEEPA”), the following specific regulations apply: prevention and control of air pollution, environmental impact study, environmental audit, transfer of contaminants, water management, waste management, sustainable forestry development, radioactivity control, wildlife management and environmental noise pollution control.
In addition, on June 6, 2012, Mexico issued a new General Federal Law for Climate Change and on June 7, 2013, a new Federal Law of Environmental Responsibility. These establish the “polluter pays” principle in which the person that caused the environmental breach is responsible for restoring the environment to its pre-pollution condition and for any other administrative, economic and potentially criminal liabilities.
In January 2014, ArcelorMittal Mexico’s raw water consumption costs increased 395% due to changes in the Water Federal Rights Law. In addition, for waste water discharges, any parameter above the maximum permissible limit now generates a fine according to a volume discharge and fine factor.
In September 2016, the environmental authority proposed launching a pilot scheme to establish a carbon market based on a cap and trade system, which in the future could oblige ArcelorMittal Mexico to comply with maximum CO
2
emission limits to buy carbon credits and/or invest in projects to reduce emissions and obtain carbon credits. The proposal is still under review and has not yet been finalized.
As per the General Federal Law for Climate Change, since 2017, ArcelorMittal Mexico must verify and validate its yearly CO
2
emissions report with an external authorized company every 3 years.
On December 31, 2018, the State Government launched a new tax law which includes ecological taxes, which requires each company to pay monthly dues by each ton of CO2 emissions, tons of solid waste stored and each m3 of waste-water discharged. In light of the high impact to all industries of this new law, companies have requested the Government to suspend the law which is being considered by the Government. The Company proposes to apply for a Writ of Amparo until this law is revised, amended or suspended.
South Africa
The National Environmental Management Act (“NEMA”) 107 of 1998 serves as the departure point for any project in South Africa and informs the Environmental Impact Assessment (“EIA”) process that needs to be followed in order to obtain the required authorization. An environmental authorization is issued pursuant to NEMA and other related environmental legislation, for example the National Environmental Management: Waste Act, 59 of 2008 (“NEM:WA”) as well as the National Environmental Management: Air Quality Act, 39 of 2004 (“NEM:AQA”) for any projects requiring an EIA process. Furthermore, the “duty of care” principle enshrined in NEMA specifies that any harm caused to the environment is a criminal offense under the terms of NEMA. A compliance notice/directive was issued on December 7, 2015 by the Department of Environmental Affairs regarding certain operations at the Newcastle Works. The compliance notice/directive required the Newcastle Works to cease its existing practices for waste disposal at a site that allegedly was operating unlawfully and to cease sales of slag to outside companies unless proof was submitted that such companies are in possession of a waste management license. Finally, the compliance notice/directive requires Newcastle Works to conduct a study of possible environmental related impacts with regard to certain identified areas of the site. ArcelorMittal South Africa conducted and submitted the study as required. The remaining instructions as part of the Compliance Notice / Directive were taken on review to the High Court. ArcelorMittal South Africa received a favorable outcome and the authorities are now appealing the decision by the High Court to the Supreme Court of Appeal. A further Compliance Notice was issued on August 30, 2018 by the Gauteng Department of Agriculture and Rural Development regarding certain operations at the Vanderbijlpark Works. In terms of the Compliance Notice, ArcelorMittal South Africa is required to cease operation of the gas combustion furnace used at the foundry until the required Air Emission Licence is obtained. This has not had any material effect on operations. The gas cleaning facilities at coke making also need to be operational within a specified time period of 2.5 years and a project is planned to this effect which will entail capital expenditures. ArcelorMittal South Africa is currently in compliance with the Compliance Notice.
The NEM:WA came into effect on July 1, 2009, and applies to all waste related activities and contaminated land and replaces older legislation in this regard. NEM:AQA, which took full effect on April 1, 2010, introduced strict air emission standards for new and existing plants. Existing plants or processes are granted a period of 5 years to achieve standards set for existing plants and 10 years to achieve standards set for new plants. ArcelorMittal South Africa’s coke making operations, in
77
particular, but other operations as well, are affected by the implementation of this Act, and major capital expenditures are expected to be implemented over the next two years to meet the relatively strict 2020 standards.
South Africa has committed to reduce GHG emissions below business as usual by 34% by 2020 and 42% by 2025, and adopt adaptation measures, as outlined in South Africa’s Intended NDC for purposes of the Paris Agreement. A carbon tax is envisaged to be implemented during 2019 together with complementary measures to reduce GHG emissions and effect behavioral change. In the carbon tax bill published in December 2017, the National Treasury lists a number of allowances to mitigate the impact the tax would have on industries. Further regulations regarding allowances provided for in the bill have not been published. Current expectations are that AMSA could achieve an 80% tax-free threshold with the remainder of its emissions being taxed at ZAR120/tCO2. This would equate to a financial impact
of up to ZAR300 million per year (depending on production levels) on South Africa’s operations.
A climate change bill was published in June 2018 and the objectives of the proposed Climate Change Act are to provide for an integrated response to climate change and ensure the effective management of inevitable climate change impacts by means of various regulatory requirements. Furthermore, the Climate Change Act seeks to make a fair contribution to the global effort to stabilize greenhouse gas concentrations in the atmosphere. The Climate Change Act makes provision for the development of a national environmentally sustainable development framework for achieving its objectives, which must be reviewed every five years. The proposed carbon tax will at some stage in the future also be integrated into this act as a mitigation measure.
Ukraine
Ukraine is gradually introducing EU environmental standards and emission standards, which will require significant capital expenditures in the near future.
On December 7, 2016, the Cabinet of Ministers of Ukraine approved the Concept of implementing the state policy in the sphere of climate change for the period until 2030. According to this Concept, an internal trading system of greenhouse gas emission quotas will be created and implemented in accordance with the provisions of Directive 2003/87/EC.
The Ministry of Ecology and Natural Resources of Ukraine has approved the plan of actions for the implementation of the concept by Order No. 878-р dated 06.12.2017. The plan includes:
|
•
|
formation, support and implementation of state policy in the field of climate changes and the gradation to a low-carbon state development;
|
|
•
|
proper regulations of activity relating to prevention of climate changes due to reduction of anthropogenic emissions and increasing the absorption of the greenhouse gases; and
|
|
•
|
adaptation to climate changes.
|
The above will apply to almost all sectors of the economy, including energy, industry, agro industrial complex, transport, water industry, forestry, housing and public utility sector, as well as public health and livelihoods, conservation and reproduction of natural ecosystems.
Pursuant to the plan, ministries and departments were required in 2018 to develop and submit for consideration to Ukraine’s Cabinet of Ministers laws for the implementation of monitoring, reporting and verification system for greenhouse gas emissions, greenhouse gas emission quotas trading, and approving strategies for the low carbon development of Ukraine until 2030.
On December 18, 2017, Ukraine's law on the assessment of environmental impacts came into force. This law establishes the legal and organizational basis for environmental impact assessment and permitting requirements, aimed at preventing damage to the environment, ensuring environmental safety, environmental protection, rational use and reproduction of natural resources in the process of making decisions on the implementation of economic activities that may have a significant impact on the environment, taking into account state, public and private interests.
Law of Ukraine No. 2354-VIII about strategic environmental assessment was published on April 11, 2018 and came into effect on October 12, 2018. This law regulates environmental impact assessment, in particular setting out industries/activities which require assessment, taking into account the possible consequences.
Drafts of new laws developed in accordance with European waste directives: 2008/98/ЕС, 1999/31/ЕС, 2006/21/ЕС are being considered. Draft laws of Ukraine relating to principles of monitoring, reporting and verification of greenhouse gas
78
emissions are being considered. Ukraine's Cabinet of Ministers has also communicated their support for the strategy for low carbon development of Ukraine by 2050.
Certain environmental permits of the Company will expire in April 2019 and the Company has initiated the process for renewal of these.
Venezuela
Industrias Unicon, C.A. (“Unicon”) is subject to various Venezuelan environmental regulations, the most important being the Organic Law for the Environment (2006) and the Criminal Law of the Environment (2012). Unicon is also subject to annual inspections by environmental entities of the federal and regional government, through whom environmental permits and adherence are reviewed. Strict compliance with environmental standards by Unicon has been verified by these governmental entities, with no observations. No inspections have taken place during 2018. Unicon is up to date with all environmental permits.
Health and safety laws and regulations
ArcelorMittal’s operations are subject to a broad range of laws and regulations relating to the protection of human health and safety. As these laws and regulations in the United States, the EU and other jurisdictions continue to become more stringent, ArcelorMittal expects to expend substantial amounts to achieve or maintain compliance. ArcelorMittal has established corporate health and safety guidelines requiring each of its business units and sites to comply with all applicable laws and regulations. Compliance with such laws and regulations and monitoring changes to them are addressed primarily at the business unit level. ArcelorMittal has a clear and strong health and safety policy aimed at reducing on a continuing basis the severity and frequency of accidents. The policy outlines the commitment ArcelorMittal has made to the health and safety of all employees and implements a common health and safety model across the entire organization which permits the Corporate Health and Safety department to define and track performance targets and monitor results from every business unit and site. Further, ArcelorMittal has implemented a database to record and share events and unsafe situations that have the potential for a serious injury. These situations and events are called SO/PSIFs (for “serious occurrences/potential serious injuries and fatalities”), the actual consequences of a SO/PSIF might have been minor, but as soon as the potential for a severe injury or fatality was present, it is considered as a “SO/PSIF”. At present, the database enables access to statistics for the ArcelorMittal group as a whole, and more detailed information on injuries for business units and sites. Additional information is available at plant sites. The database incorporates a company-wide used return-of-experience system for disseminating lessons learned from individual incidents. The aim is to achieve faster and more accurate feedback on the cause of accidents in order to prevent their recurrence. Another database, focusing on good practices/internal benchmarking has been deployed since 2010 and, as with any database, continues to grow in terms of content and uses over time. To monitor compliance, an auditing system has been put in place to check compliance with internal standards.
Under the Dodd-Frank Wall Street Reform and Consumer Protection Act (the “Dodd-Frank Act”) each reporting operator of a coal or other mine is required to include certain mine safety information within its periodic reports filed with the SEC. Pursuant to Section 1503 of the Dodd-Frank Act, the Company presents information regarding certain mining safety and health matters for each of its U.S. mine locations in Item 16H of this annual report.
Foreign trade
ArcelorMittal has manufacturing operations in many countries and sells its products worldwide. In 2018, certain countries and communities, such as Argentina, Brazil, Canada, Chile, the Eurasian Economic Union, the European Union, the Gulf Cooperation Council, South Africa, Taiwan, Thailand, Turkey, the United States of America and Vietnam, continued or launched investigations into whether to impose/continue imposing trade remedies (usually anti-dumping or safeguard measures) against injury, or the threat thereof, caused by increasing steel imports originating from various steel producing countries.
79
Under both international agreements and the domestic trade laws of most countries, trade remedies are available to domestic industries where imports are “dumped” or “subsidized” and such imports cause injury, or a threat thereof, to a domestic industry. Although there are differences in how trade remedies are assessed, such laws have common features established in accordance with World Trade Organization (“WTO”) standards. Dumping involves exporting a product at a price lower than that at which the same or similar product is sold in the home market of the exporter, or where the export prices are lower than a value that typically must be at or above the full cost of production (including sales and marketing costs) plus a reasonable amount for profit. Subsidies from governments (including, among others, grants and loans at artificially low interest rates) are similarly actionable under certain circumstances. The trade remedies available are typically (i) an antidumping duty order or suspension agreement where injurious dumping is found and (ii) a countervailing duty order or suspension agreement where injurious subsidization is found. Normally, the duty is equal to the amount of dumping or subsidization that is generally imposed on the imported product (other than in the European Union where the lesser duty rule is applied). Accordingly, such orders and suspension agreements do not prevent the importation of a product, but rather require that either the product be priced at a non-dumped level or without the benefit of subsidies, or that the importer pay the difference between such dumped or subsidized price and the actual price to the government as a duty.
Safeguard measures are addressed more generally to a particular product, irrespective of its country of origin, to protect domestic production against increased imports of that product. The remedies available for safeguard investigations are commonly safeguard duties or quotas on the imported products.
All WTO members are required to review antidumping duty and countervailing duty orders and suspension agreements every five years to determine if they should be maintained, revised or revoked. This requires a review of whether the dumping or subsidization is likely to continue or recur if the order/suspension agreement is revoked and whether a domestic industry in the country is likely to suffer the continuation or recurrence of the injury within the reasonably foreseeable future if the orders are revoked. If the government finds dumping or subsidization and the injury is likely to continue or recur, then the orders continue. In the case of safeguard measures enduring for greater than three years, all WTO members are required to review the imposed measures in the mid-term of the relevant measure. After a review, restrictions may be extended if they continue to be required, but the total period of relief provided may not exceed eight years. These so-called "sunset" reviews affect various countries of interest, for example in May 2016 the United States initiated a sunset review of the duties imposed in December 2014 for hot rolled products from Russia. In September 2016, the US Department of Commerce, in light of this sunset review, decided to continue applying those duties stating that such products from Russia posed the same dumping risks as in 2014. A new sunset review on the existing anti-dumping duties on imports of organic coated steel products from China into the EU was commenced in 2018.
In 2017, the European Commission’s antidumping duties on hot-rolled coil products imported from China became permanent and are to remain in place for a period of five years. It also imposed final anti-subsidy duties against the same products from China. The European Commission also imposed final anti-dumping duties on hot-rolled coil products imported from Russia, Iran, Brazil and Ukraine and initiated an anti-dumping investigation against non-auto corrosion resistant steel coming from China with final duties implemented in December 2017. Additionally it implemented final measures on quarter plate products imported from China. In the United States, final anti-dumping duties and countervailing duties against corrosion-resistant, hot-rolled and cold-rolled steel imports from China, Brazil and certain other countries became definitive in 2017, and the US Department of Commerce applied final anti-dumping and countervailing duties against heavy steel plate imports from China, Brazil, South Africa and certain other countries. In 2018, a new antidumping investigation started against Chinese imports of sheet piles as well as another antidumping investigation on welded tubes, pipes and hollow profiles of square or rectangular cross-section, originating from North Macedonia, Russia and Turkey.
In a number of markets in which ArcelorMittal has manufacturing operations, it may be the beneficiary of trade actions intended to address trade distortions consistent with WTO regulations, such as the examples already mentioned in Europe and the United States. In other situations, certain operations of ArcelorMittal may be a respondent to antidumping and countervailing duty cases and its exported products might be subject to antidumping and countervailing duties or other trade restrictions, for example antidumping duties imposed in 2017 by the Egyptian government against rebar imports from Ukraine, Turkey and China affecting exports from ArcelorMittal operations in Ukraine.
On April 20, 2017, a national security investigation (Section 232) with respect to steel imports was initiated in the United States. The Department of Commerce ("DOC") report was sent to the Trump Administration on January 11, 2018, after which the administration had 90 days to decide what action to take. On March 23, 2018, the US administration imposed tariffs of 25% on steel products from all but a select list of countries. However, until May 1, 2018, a temporary suspension applied for Canada, Mexico, Argentina, South Korea, Brazil and the EU.
80
On May 1, 2018, the US administration issued two proclamations authorizing modifications of the Section 232 tariffs on steel and aluminum. Australia obtained a full exemption from the tariffs. US imports of South Korean steel, Brazilian steel, and Argentina steel and aluminum remained exempt from the Section 232 tariffs but were instead subject to annual quotas covering imports that have entered the US since January 1, 2018. Annual US imports of South Korean steel products are limited to 70% of the average of 2015-2017 volumes allocated on a product-specific basis. Brazil was granted annual quotas of 100% of the average of 2015-2017 shipments for slabs and 70% of the 3 year average period for finished products. For Argentina, the applicable quota was set to 135% of the 3 year average period, representing a significant cut from 2017 when Argentina shipped 211,000 million tonnes (for tube products, the 2018 quota amounted to 180,000 million tonnes). Countries subject to annual quotas are also subject to quarterly limitations. As of July 1, 2018, exports of a subject country of a particular steel or aluminum product cannot exceed “500,000 kg and 30%” of the annual product-specific quota in a given quarter, which could lead to a surge at the beginning of each quarter. In its May 1, 2018 proclamations, the US administration also extended negotiations with Canada, Mexico, and the EU for a final 30 days and, effective June 1, 2018, the US administration implemented 25% tariffs on imports from the EU, Canada and Mexico. The Section 232 action has had a positive impact on ArcelorMittal USA’s financial performance as a result of the improved pricing environment in the United States. However, ArcelorMittal’s Canadian and Mexican businesses have been negatively impacted to the extent that Section 232 duties apply to their shipments to the United States. Some NAFTA business units have also been negatively impacted by retaliatory duties applied by Canada and Mexico.
The modifications of the Section 232 tariffs triggered concerns of trade deflection worldwide and several countries initiated domestic remediation measures. On March 26, 2018, the EU Commission opened ex-officio a safeguard investigation on 26 products (including 19 long, flat and stainless steel products and 7 tubes and other steel products). On July 18, 2018, the EU Commission published provisional measures which entered into force on July 19, 2018 with a maximum duration of 200 days (February 4, 2019). These provisional measures were based on global tariff quotas with a 100% quota based on average imports over the past 3 years on 23 product categories. Imports that exceeded the above quotas would face a 25% tariff but certain 'developing' countries are exempted when their import share is below 3%. The EU’s provisional safeguard measures were replaced by definitive safeguard measures approved by EU member states on January 16, 2019 which went into effect on February 4, 2019. These safeguards cover the full steel product scope, setting country-based quotas for larger importers on all product categories, except for hot rolled (global), and quarterly quota calculations for residual volumes of all products. The measures also include three phases of 5% quota relaxations in early February 2019, July 2019 and July 2020, which can be adapted to market conditions for each product individually. Countries subject to quotas have an incentive to frontload the consumption of their national quota in order to benefit from the residual quotas in the final quarter of the period, thus ensuring full quota consumptions. ArcelorMittal welcomed the imposition of the final safeguard measures in Europe, however the Company considers that the relaxation clause weakens the efficiency of these measures.
In response to the measures adopted by the US and the EU, Turkey opened a safeguard investigation on May 2, 2018 with provisional measures effective as of October 17, 2018. Turkey’s safeguard investigation on iron and steel products, which was supposed to be concluded by January 26, 2019, was extended for six months, i.e., until July 26, 2019, with the provisional safeguard measures set to remain in effect until May 5, 2019. The investigation covers hot-rolled, cold-rolled, coated, hot-dipped galvanized, bars and rods, angles, shapes and sections, wire rod, rails, tubes and hollow profiles and stainless steel and the provisional measures are in the form of a free tariff quota with 25% duties. ArcelorMittal has participated in the defense process to try to reduce the effects to its European exports into Turkey. As a result of the opening of a safeguard investigation on certain flat and long products, Canada decided to implement provisional measures that came into force on October 25, 2018 in the form of quotas and a 25% tariff on steel imports. The Eurasia economic union led by Russia also opened a safeguard investigation on August 7, 2018 covering some flat steel products only.
In February 2019, President Trump received the findings of another Section 232 investigation into whether imported vehicles pose a national security threat to the United States and will have 90 days to decide on any action such as tariffs. The investigation covers imports of vehicles including SUVs, vans and light trucks as well as auto parts. If any such tariffs are adopted, their impact on imports from Canada and Mexico into the United States would be attenuated by side letters that were executed by the United States, Canada and Mexico as part of the negotiations of the replacement of the NAFTA trade agreement. These side letters would exclude 2.6 million passenger vehicles annually from Canada and another 2.6 million from Mexico, as well as all light trucks and specific volumes of auto parts from such tariffs.
81
China poses unique trade policy questions as the EU, among other regions, debates whether to grant China market economy status (“MES”) under WTO rules. MES is a critical component in determining the magnitude of trade remedies that may be applied against a country engaging in unfair trade practices. Where a country has MES, this alters the comparative price selection and cost benchmarks used to calculate the margin of the alleged dumping. While China viewed the recognition of its MES as automatic and necessary from the point of expiry of certain of its WTO accession protocols on December 11, 2016, this status was not granted by certain regions and countries, notably the EU and the U.S. Accordingly, on December 12, 2016, China notified the WTO that it was requesting dispute consultations with both the United States and the European Union in respect of the special calculation methods used by both the United States and European Union in anti-dumping proceedings. In November, 2017, the United States submitted a statement to the WTO, as a third party brief in support of the European Union in a dispute with China, formally opposing granting China market economy status; the dispute is ongoing at the WTO. On December 19, 2017, the EU published its approved amendments of the Anti-Dumping Regulation (EU) 2016/1036 (New Anti-dumping Methodology-NADM), which stipulate that if the existence of “significant distortions” has been established by the complainant, the European Commission may use an alternative methodology for calculating dumping margins for imports from third countries. This new framework notably removes the former distinction between market and non-market economies (“NMEs”) for the calculation of dumping margins in the EU anti-dumping regulation. The alternative methodology can now be used by the EU for any WTO country.
Key currency regulations and exchange controls
As a holding company, ArcelorMittal is dependent on the earnings and cash flows of, and dividends and distributions from, its operating subsidiaries to pay expenses, meet its debt service obligations, pay any cash dividends or distributions on its ordinary shares or conduct share buy-backs. Significant cash or cash equivalent balances may be held from time to time at subsidiaries where repatriation of funds may be affected by tax and foreign exchange policies, including in Argentina, Brazil, China, India, Kazakhstan, South Africa, Ukraine and Venezuela. Such policies are briefly summarized below; however, none of these are currently significant in the context of ArcelorMittal’s overall liquidity.
Argentina
In December 2015, the newly elected Argentinian government announced initiatives to significantly relax foreign exchange controls and regulations. These measures, among other things, allow the currency to float, subject to intervention by the central bank to avoid destabilizing movements. The Argentine peso is not fully convertible and is most commonly traded as a non-deliverable forward (i.e., cash settlement at maturity based on the relative movement of the designated currency rather than the physical settlement of the designated currency at maturity), both onshore and offshore. Despite the lifting of controls, rules on the repatriation of export receipts remain unchanged in respect of the conversion of 100% of foreign exchange revenue into Argentine pesos. Access to the foreign exchange markets for the payment of dividends does not require authorization from the central bank, only the completion of certain legal and administrative procedures. As of July 1, 2018, Argentina has been considered a highly inflationary country. See also note 2.2.2 to the consolidated financial statements.
Brazil
The central bank of Brazil operates a managed floating foreign exchange regime, although intervention has become more regular in recent years. The Brazilian real is fully deliverable onshore (i.e., physical settlement of the designated currency at maturity), but is non-deliverable offshore. With proper documentation, the repatriation of registered invested capital and remittance of profits do not require prior approval from the central bank of Brazil. Profits can be freely remitted as dividends or as interest on capital to foreign shareholders or portfolio investors.
China
China’s foreign exchange regime has recently undergone significant liberalization. The People’s Bank of China (“PBOC”) maintains the Chinese renminbi in a managed float with reference to a basket of currencies. The CNY, which refers to the Chinese renminbi on the onshore market, is partially convertible and has a non-deliverable offshore market. All transactions involving foreign exchange are strictly controlled by the State Administration of Foreign Exchange. The CNH, which is the Chinese renminbi traded offshore, became deliverable in Hong Kong in July 2010. The CNH can generally be transferred freely between offshore accounts and interaction with the onshore market is growing, although transfers of CNH from Hong Kong to onshore China are subject to regulations and approval by the PBOC.
82
India
The Reserve Bank of India ("RBI") maintains the Indian rupee (“INR”) in a managed floating regime. The INR is partially convertible and has a non-deliverable offshore market. Onshore deliverable forwards are also available out to 10 years. The most common tenor with the best liquidity in the forwards market is one year or less. The INR is convertible for exports and imports of goods and services as well as unilateral transfers, including repatriating profits from foreign-funded companies, as well as for daily recurring transactions in the ordinary course of business. However, the INR is restricted on the capital account (purchase and sale transactions of foreign assets and liabilities) and there are specific transactions that have to be authorized by the RBI for routine capital account transactions, e.g. investments by foreign portfolio investors. Other permitted capital account transactions include foreign direct investment, foreign currency loans and bonds, securities and equity investments overseas. Companies may remit dividends overseas to foreign investors after they have been declared by the board of directors of private limited companies or annual general meetings of shareholders of public limited companies. Companies can remit royalty payments to foreign parents, subject to applicable rules and regulations.
Kazakhstan
In August 2015, the National Bank of Kazakhstan devalued the Kazakhstan tenge and introduced a free-floating exchange rate. The National Oil Fund conducts open market operations to finance economic programs, hence the current exchange rate regime may be best described as a managed float. Liquidity in foreign exchange markets is limited and mainly non-deliverable forwards are traded on offshore markets. There are no restrictions on tenge convertibility, but domestic legal entities must state their reasons for buying foreign currency and may only trade with authorized banks.
South Africa
The South African Reserve Bank operates a managed floating foreign exchange regime. The South African rand (“ZAR”) is deliverable and largely convertible and the reserve bank is gradually relaxing exchange controls. Since January 1, 2014, companies may apply for approval to establish a holding company to hold their offshore investments. Subject to certain conditions, listed companies may place ZAR 2 billion per annum with such holding companies, which can be transferred offshore without exchange control approval, and unlisted companies may transfer ZAR 1 billion per year.
Ukraine
The National Bank of Ukraine is responsible for the country’s monetary policy. The exchange rate system is highly regulated and only deliverable forwards are allowed on the onshore market. On the offshore market, only non-deliverable forwards are allowed, but liquidity is very limited. Since August 2016, foreign investors are entitled to repatriate profit, income or other funds relating to investments without any restrictions, after the payment of applicable taxes. Except for payments of 2014 to 2016 dividends, which were allowed subject to certain restrictions, there is a ban on the remittance of funds to foreign investors through the payment of dividends on securities traded on the stock exchange, a decrease in share capital or the exit of foreign investors from domestic legal entities.
Venezuela
Venezuela’s foreign exchange regime has been characterized by governmental devaluation and sudden legislative change. Until the beginning of 2018, Venezuela featured two exchange systems for the bolivar, its official currency: DIPRO, which was fixed at a rate of 10 bolivars per U.S. dollar and was used primarily for priority food and medicine sectors, and DICOM, which was allowed to float freely and applied to most other sectors. The Venezuelan government temporarily suspended the sale of U.S. dollars through its DICOM auction system during the fourth quarter of 2017 and effective January 30, 2018, eliminated the DIPRO rate and reopened the auction of the DICOM rate on February 5, 2018. DICOM is now the country’s only official exchange rate. On August 20, 2018, the bolivar soberano (VES) replaced the bolivar fuerte (VEF) at a rate of 1 VES to 100,000 VEF. The only way to convert the VES is through the DICOM rate, which sets an exchange limit of EUR 340,000 per month for domestic legal entities. Transactions are allowed on a non-deliverable offshore market but liquidity is very limited.
83
Disclosure pursuant to Section 219 of the Iran Threat Reduction & Syria Human Rights Act (ITRA)
ArcelorMittal’s business with customers in Iran
Section 219 of the Iran Threat Reduction and Syria Human Rights Act of 2012 added Section 13(r) to the U.S. Securities Exchange Act of 1934, as amended (the Exchange Act). Section 13(r) requires an issuer to disclose in its annual reports whether it or any of its affiliates knowingly engaged in certain activities, transactions or dealings relating to Iran. Disclosure is required even where the activities, transactions or dealings are conducted outside the United States by non-US persons in compliance with applicable law, and whether or not the activities are sanctionable under US law.
In 2018, ArcelorMittal sold the following products to customers in Iran:
In 2018, ArcelorMittal sold commodity-grade long and flat steel products and tubes for the consumer and construction sector, and the automotive sector and alloy steel plates destined to industrial projects as detailed below:
ArcelorMittal’s subsidiary ArcelorMittal International FZE in Dubai (“AMID”) sold steel products to customers in Iran, generating $66.2 million in revenue in 2018, which amounts to 4% of AMID's total sales in 2018.
AMID sells to trading companies, most of which are based in Dubai and some of which are owned by Iranian nationals, that export and ship the products to stockists (i.e., wholesalers) and fabricators in Iran which, to the best of ArcelorMittal’s knowledge, on-sell them primarily to companies involved in the private-sector construction and consumer goods industries.
Following the changes in U.S. secondary sanctions on May 8, 2018, ("Re-imposition of US Sanctions"), AMID has only sold (through traders) finished commodity grade long and flat steel products in the form of hot rolled coils and cold rolled coils to Iranian companies involved in construction and consumer goods industries. To the best of ArcelorMittal’s knowledge AMID has not had any direct or indirect sales to customers in Iran since November, 2018.
AMID continues to monitor this market and the market risks involved, before making any decision relating to continuation of the above described business by AMID in 2019.
During January to May 2018, ArcelorMittal’s Europe segment sold coated flat products, alloy steel plates, sections, wire rod and seamless pipes both directly and indirectly for projects in Iran. These activities generated $9.8 million in revenue with a profit of $0.52 million; ArcelorMittal’s Europe segment, to the best of ArcelorMittal's knowledge, has not had any direct or indirect sales to customers in Iran since June 2018.
Additionally, during January to May, 2018 ArcelorMittal’s Europe segment sold flat coated and non-coated products destined to Iranian automotive customers generating $2.54 million in revenue with a profit of $0.38 million. According to press reports and other public information, these companies may have links to the Iranian Government. ArcelorMittal's Europe segment, to the best of ArcelorMittal's knowledge, has not had any direct or indirect sales to Iranian automotive customers since June 2018.
ArcelorMittal's Europe segment continues to monitor this market and the market risks involved before making any decision relating to continuation of the above described business by ArcelorMittal's Europe segment in 2019.
To the best of the Company’s knowledge, none of the above sales have gone to any sanctionable end-uses or end users. No U.S. affiliate or persons are involved in these sales, and the sales are not conducted in U.S. dollars.
ArcelorMittal continues to monitor developments in this area, in particular the status of the Joint Comprehensive Plan of Action ("JCPOA") the Re-imposition of US Sanctions, and the expansion of the EU Blocking Regulation (Council Regulation (EC) 2271/96) and will determine whether and to what extent they affect its business with Iranian customers as currently conducted and intended to be conducted. ArcelorMittal carefully monitors political risk and sanctions exposure and has procedures and systems in place intended to manage those risks.
However, ArcelorMittal’s business is subject to an extensive, complex and evolving regulatory framework. Significant direct U.S. sanctions against Iran remain and significant U.S. secondary sanctions against Iran were re-imposed, and the risk is not mitigated by the EU Blocking Regulation. It is possible that ArcelorMittal may face conflicting obligations or risks under U.S. direct and secondary sanctions and the EU Blocking Regulation, or other conflicting instruments Despite its governance, compliance policies and procedures and continuous efforts to comply with all applicable sanctions regimes, its systems and
84
procedures may not always prevent the occurrence of violations which may lead to regulatory penalties or cause reputational harm to operating subsidiaries, joint ventures or associates. See “Item 3.D—Key information—Risk factors.”
Iran-related activities of ArcelorMittal affiliates
Pursuant to Section 13(r) of the Securities Exchange Act of 1934, ArcelorMittal is required to disclose whether any of its affiliates have engaged in certain Iran-related activities and transactions.
HPCL-Mittal Energy Limited (“HMEL”), a joint venture in which the HSBC Trustee (C.I.) Limited, as trustee of trusts of which Mr. Lakshmi N. Mittal, Mrs. Usha Mittal and their children are the beneficiaries, holds a 48.99% stake, owns and operates the Guru Gobind Singh Refinery, an oil refinery located in the Bathinda district of Punjab, India.
During the period of January to April 2018, in connection with its oil refining activities, HMEL purchased approximately 3.8 million barrels of crude oil on FOB basis from the National Iranian Oil Company (the "NIOC"). In addition HMEL also used shipping services from the National Iranian Tanker Company ("NITC") for the movement of crude oil from the Middle East including Iran to India.
HMEL did not purchase crude oil from NIOC or use shipping services from NITC after US secondary sanctions were re-imposed on Iran in August 2018.
During 2018, HMEL made total payments of $ 367.9 million including $125.80 million outstanding against cargos purchased in 2017 to NIOC. In 2018, HMEL paid $4.10 million for NITC’s shipping services. To the best of the Company’s knowledge none of the transactions were conducted in U.S. dollars. HMEL made no sales of refined products to Iran.
HMEL produces a variety of petroleum and petrochemical products, which individually require different types of crude oil in different quantities. HMEL generally co-mingles crude oil purchased from various sources, making it difficult to trace the raw materials used in manufacturing a given product or to link revenues directly to such inputs. HMEL cannot determine with certainty the amount of its revenue or profit in 2018 that were related to crude oil purchased from the NIOC.
PT Ispat Indo and its subsidiaries, a group of companies in which the HSBC Trustee (C.I.) Limited, as trustee of a trust of which Mr. Lakshmi N. Mittal, Mrs. Usha Mittal and their children are the beneficiaries, holds a 100% stake, owns and operates various steel manufacturing facilities at different locations in Indonesia.
During the period from January to July 2018, in connection with its activities, PT Ispat Indo and its subsidiaries purchased approximately 64,000 MT of steel billets and Direct Reduced Iron combined through different traders based in Germany and Austria, having offices in Dubai, with shipment from Arfa Iron & Steel, Khouzestan Steel Company and South Kaveh Steel Co.(SKS) in Iran.
Any and all contracts entered into by PT Ispat Indo after the re-imposition of US sanctions on Iran were canceled and any advance payments made in connection therewith were held by suppliers as penalties or claims for cancellation of the contract.
During 2018, PT Ispat Indo and its subsidiaries made total payments of SGD 37.794 million for material received from Iran before August 2018.
To the best of Company’s knowledge none of the transactions were conducted in U.S Dollars.
85
C. Organizational structure
Corporate structure
ArcelorMittal is a holding company with no business operations of its own. All of ArcelorMittal’s significant operating subsidiaries are indirectly owned by ArcelorMittal through intermediate holding companies. The following chart represents the operational structure of the Company, including ArcelorMittal’s significant operating subsidiaries and not its legal or ownership structure.
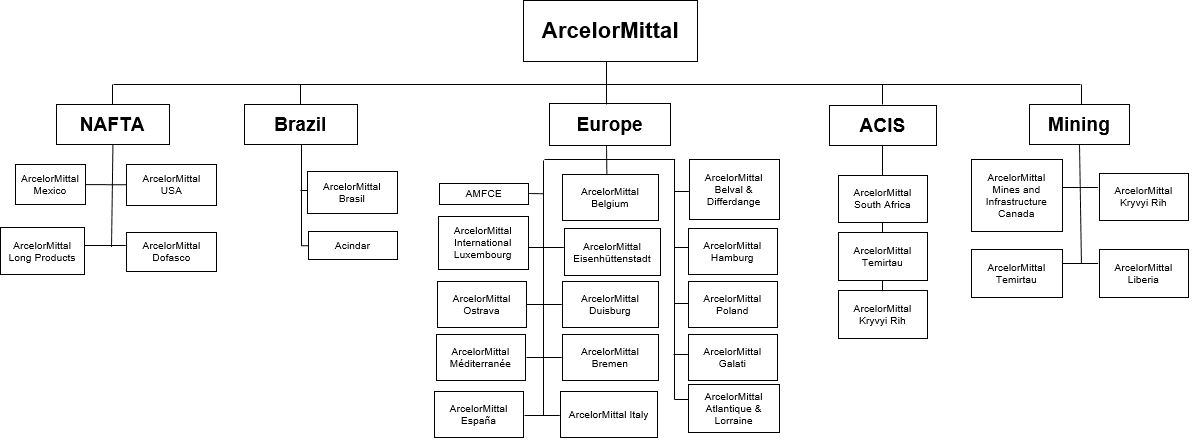
86
Please refer to the "Presentation of Financial and Certain Other Information" section of this Annual Report on Form 20-F for a listing of the Company’s principal subsidiaries, including country of incorporation. Please refer to note 2.2.1 of the consolidated financial statements for the ownership percentages of these subsidiaries. Unless otherwise stated, the subsidiaries as listed have share capital consisting solely of ordinary shares, which are held directly or indirectly by the Company and the proportion of ownership interests held equals to the voting rights held by the Company.
Investments accounted for under the equity method
ArcelorMittal has investments in entities accounted for under the equity method. See note 2.4 to ArcelorMittal’s consolidated financial statements.
Reportable segments
ArcelorMittal reports its business in the following five reportable segments corresponding to continuing activities: NAFTA, Brazil, Europe, ACIS and Mining.
NAFTA produces flat, long and tubular products. Flat products include slabs, hot-rolled coil, cold-rolled coil, coated steel products and plate and are sold primarily to customers in the following sectors: automotive, energy, construction packaging and appliances and via distributors and processors. Flat product facilities are located at seven integrated and mini-mill sites located in three countries. Long products include wire rod, sections, rebar, billets, blooms and wire drawing. Long production facilities are located at three integrated and mini-mill sites located in three countries. In 2018, shipments from NAFTA totaled
22.0 million
tonnes.
Brazil produces flat, long and tubular products. Flat products include slabs, hot-rolled coil, cold-rolled coil and coated steel. Long products comprise sections, wire rod, bar and rebars, billets, blooms and wire drawing. In 2018, shipments from Brazil totaled
11.5 million
tonnes.
Europe produces flat, long and tubular products. Flat products include hot-rolled coil, cold-rolled coil, coated products, tinplate, plate and slab. These products are sold primarily to customers in the automotive, general and packaging sectors. Flat product facilities are located at 14 integrated and mini-mill sites located in six countries. Long products include sections, wire rod, rebar, billets, blooms and wire drawing. Long product facilities are located at 14 integrated and mini-mill sites in eight countries. In addition, Europe includes downstream solutions, which provides primarily distribution of long and flat products as well as value-added and customized steel solutions through further processing to meet specific customer requirements. In 2018, shipments from Europe totaled
41.0 million
tonnes.
ACIS produces a combination of flat, long and tubular products. It has five flat and long production facilities in three countries. In 2018, shipments from ACIS totaled
11.7 million
tonnes, with shipments having been made worldwide.
Mining provides the Company’s steel operations with high quality and low-cost iron ore and coal reserves and also sells limited amounts of mineral products to third parties. The Company’s mines are located in North and South America, Europe, Africa and CIS. In 2018, iron ore and coal production from own mines totaled approximately
58.5 million
tonnes and
5.9 million
tonnes, respectively.
D. Property, plant and equipment
ArcelorMittal has steel production facilities, as well as iron ore and coal mining operations, in North and South America, Europe, Asia and Africa.
All of its operating subsidiaries are substantially owned by ArcelorMittal through intermediate holding companies, and are grouped into the five reportable segments described above in “Item 4.C—Information on the Company—Organizational structure”. Unless otherwise stated, ArcelorMittal owns all of the assets described in this section.
For further information on environmental issues that may affect ArcelorMittal’s utilization of its assets, see “Item 4.B—Information on the Company—Business overview—Government regulations—Environmental laws and regulations” and note 8.3 to ArcelorMittal’s consolidated financial statements.
87
Steel production facilities of ArcelorMittal
The following table provides an overview by type of steel facility of the principal production units of ArcelorMittal’s operations. While all of the Group’s facilities are shown in the tables, only the facilities of significant subsidiaries are described textually for each segment. The facilities included in the tables are listed from upstream to downstream in the steel-making process.
|
Facility
|
Number of Facilities
|
Capacity (in million tonnes per year)
1
|
Production in 2018 (in million tonnes)
2
|
|||
|
Coke Oven Battery
|
75
|
35.1
|
25.5
|
|||
|
Sinter Plant
|
32
|
102.8
|
66.8
|
|||
|
Blast Furnace
|
58
|
102.3
|
70.6
|
|||
|
Basic Oxygen Furnace (including Tandem Furnace)
|
75
|
106.3
|
75.5
|
|||
|
DRI Plant
|
13
|
9.4
|
7.4
|
|||
|
Electric Arc Furnace
|
32
|
27.4
|
18.8
|
|||
|
Continuous Caster—Slabs
|
50
|
96.0
|
65.5
|
|||
|
Hot Rolling Mill
|
23
|
82.7
|
54.6
|
|||
|
Pickling Line
|
35
|
37.3
|
17.9
|
|||
|
Tandem Mill
|
39
|
45.7
|
27.7
|
|||
|
Annealing Line (continuous / batch)
|
50
|
22.6
|
10.8
|
|||
|
Skin Pass Mill
|
35
|
20.9
|
8.8
|
|||
|
Plate Mill
|
12
|
8.1
|
3.0
|
|||
|
Continuous Caster—Bloom / Billet
|
34
|
32.1
|
23.2
|
|||
|
Breakdown Mill (Blooming / Slabbing Mill)
|
3
|
10.7
|
3.8
|
|||
|
Billet Rolling Mill
|
3
|
2.6
|
1.8
|
|||
|
Section Mill
|
25
|
13.6
|
8.3
|
|||
|
Bar Mill
|
21
|
8.7
|
6.2
|
|||
|
Wire Rod Mill
|
18
|
11.8
|
8.1
|
|||
|
Hot Dip Galvanizing Line
|
63
|
23.8
|
17.4
|
|||
|
Electro Galvanizing Line
|
13
|
2.4
|
1.0
|
|||
|
Tinplate Mill
|
17
|
3.6
|
2.0
|
|||
|
Tin Free Steel (TFS)
|
2
|
0.4
|
0.1
|
|||
|
Color Coating Line
|
19
|
2.8
|
2.0
|
|||
|
Seamless Pipes
|
7
|
0.9
|
0.4
|
|||
|
Welded Pipes
|
79
|
4.9
|
1.1
|
|||
|
1
|
Reflects design capacity and does not take into account other constraints in the production process (such as, upstream and downstream bottlenecks and product mix changes). As a result, in some cases, design capacity may be different from the current achievable capacity.
|
|
2
|
Production facility details include the production numbers for each step in the steel-making process. Output from one step in the process is used as input in the next step in the process. Therefore, the sum of the production numbers does not equal the quantity of sellable finished steel products.
|
88
|
NAFTA
|
Crude Steel
|
|||||||
|
Unit
|
Country
|
Locations
|
Production in 2018 (in million tonnes per year)
1
|
Type of plant
|
Products
|
|||
|
ArcelorMittal USA
|
USA
|
Warren, OH
|
n/a
|
Coke-Making
|
Coke
|
|||
|
ArcelorMittal USA
|
USA
|
Monessen, PA
|
n/a
|
Coke-Making
|
Coke
|
|||
|
ArcelorMittal USA
2
3
|
USA
|
East Chicago, IN
|
4.7
|
Integrated
|
Flat
|
|||
|
ArcelorMittal USA
|
USA
|
Burns Harbor, IN
|
4.4
|
Integrated
|
Flat
|
|||
|
ArcelorMittal USA
|
USA
|
Cleveland, OH
|
3.1
|
Integrated
|
Flat
|
|||
|
ArcelorMittal USA
|
USA
|
Riverdale, IL
|
0.7
|
Integrated
|
Flat
|
|||
|
ArcelorMittal USA
|
USA
|
Coatesville, PA
|
0.4
|
Mini-mill
|
Flat
|
|||
|
ArcelorMittal USA
|
USA
|
Columbus, OH
|
n/a
|
Downstream
|
Flat
|
|||
|
I/N Tek
|
USA
|
New Carlisle, IN
|
n/a
|
Downstream
|
Flat
|
|||
|
ArcelorMittal USA
4
|
USA
|
Conshohocken, PA
|
n/a
|
Downstream
|
Flat
|
|||
|
ArcelorMittal USA
|
USA
|
Weirton, WV
|
n/a
|
Downstream
|
Flat
|
|||
|
ArcelorMittal USA
|
USA
|
Gary, IN
|
n/a
|
Downstream
|
Flat
|
|||
|
Double G
|
USA
|
Jackson, MS
|
n/a
|
Downstream
|
Flat
|
|||
|
ArcelorMittal Dofasco
5
|
Canada
|
Hamilton
|
3.5
|
Integrated, Mini-mill
|
Flat
|
|||
|
ArcelorMittal Mexico
|
Mexico
|
Lázaro Cárdenas, Celaya
|
3.4
|
Mini-mill, Integrated, and Downstream
|
Flat, Long/ Bar, Wire Rod
|
|||
|
ArcelorMittal Long Products Canada
|
Canada
|
Contrecoeur East, West
|
2.1
|
Mini-mill
|
Long/ Wire Rod, Bars, Slabs
|
|||
|
ArcelorMittal USA
|
USA
|
Steelton, PA
|
0.2
|
Mini-mill
|
Long/ Rail
|
|||
|
ArcelorMittal Tubular Products
|
Canada
|
Brampton
|
n/a
|
Downstream
|
Pipes and Tubes
|
|||
|
ArcelorMittal Tubular Products
|
Canada
|
London
|
n/a
|
Downstream
|
Pipes and Tubes
|
|||
|
ArcelorMittal Tubular Products
|
Canada
|
Woodstock
|
n/a
|
Downstream
|
Pipes and Tubes
|
|||
|
ArcelorMittal Tubular Products
|
Canada
|
Hamilton
|
n/a
|
Downstream
|
Pipes and Tubes
|
|||
|
ArcelorMittal Tubular Products
|
USA
|
Shelby
|
n/a
|
Downstream
|
Pipes and Tubes
|
|||
|
ArcelorMittal Tubular Products
|
USA
|
Marion
|
n/a
|
Downstream
|
Pipes and Tubes
|
|||
|
ArcelorMittal Tubular Products
|
Mexico
|
Monterrey
|
n/a
|
Downstream
|
Pipes and Tubes
|
|||
|
1
|
Note: n/a = not applicable (no crude steel production).
|
|
2
|
Indiana Harbor.
|
|
3
|
ArcelorMittal USA idled its #2 basic oxygen furnace and its #2 slab caster at Indiana Harbor (East Chicago) in June 2017.
|
|
4
|
ArcelorMittal USA idled its plate rolling unit at the Conshohocken, PA facility in August 2018.
|
|
5
|
ArcelorMittal Dofasco idled the HDG lines #1 in 2017.
|
89
ArcelorMittal Dofasco
ArcelorMittal Dofasco (“Dofasco”) is a leading North American steel solution provider and Canada’s largest manufacturer of flat rolled steels. Dofasco’s steel-making plant in Hamilton, Ontario is adjacent to water, rail and highway transportation. The plant uses both integrated and EAF-based steelmaking processes. Its products include hot-rolled, cold-rolled, galvanized and tinplate. Dofasco supplies these products to the automotive, construction, packaging, manufacturing, pipe and tube and steel distribution markets.
ArcelorMittal USA
ArcelorMittal USA mainly produces flat products at their steelmaking facilities located at Indiana Harbor, Burns Harbor, Cleveland, Riverdale and Coatesville.
Indiana Harbor is a fully integrated steelmaker, strategically located on the southern shore of Lake Michigan in East Chicago, Indiana and benefits from Great Lakes shipping as well as highway and railroad transportation access. The Indiana Harbor facilities produce hot-rolled sheet, cold-rolled sheet and hot dip galvanized sheet for use in automotive, appliance, service center, tubular, strip converters and contractor applications.
Burns Harbor is strategically located on Lake Michigan in northwestern Indiana approximately 50 miles southeast of Chicago, Illinois. The area allows for shipping access to the Port of Indiana-Burns Harbor, as well as highway and railroad access. Burns Harbor produces hot-rolled sheet, cold-rolled sheet, hot dip galvanized sheet and steel plate for use in automotive, appliance, service center, construction and shipbuilding applications.
The Cleveland facility is located on the Cuyahoga River in Cleveland, Ohio with access to the Port of Cleveland and Great Lakes shipping, as well as highway and railroad transportation routes. The Cleveland plant serves the automotive, service centers, converters and tubular applications markets.
The Riverdale facility is located near the Indiana border in Riverdale, Illinois, with access to Lake Michigan, and highway and railroad networks. It produces hot-rolled strip for strip converter and service center applications, and obtains supplies of hot metal for its basic oxygen furnaces from the Burns Harbor or Indiana Harbor locations.
The Coatesville facility is located in Pennsylvania and produces plate products for use in rail transportation, pipes & tubes and distribution segments.
ArcelorMittal USA has standalone finishing facilities in Weirton, West Virginia making tin products and in Columbus, Ohio making coated products. It has coke plants at Burns Harbor and Warren that supply coke to its production facilities. ArcelorMittal USA’s idled its plate rolling unit at the Conshohocken, Pennsylvania, PA facility in August 2018.
ArcelorMittal USA, through various subsidiaries, owns interests in joint operations, including (i) ArcelorMittal Tek Inc. (60% interest), a cold-rolling mill near New Carlisle, Indiana; (ii) Double G Coatings (50% interest), a coating line producing galvanized and Galvalume steel near Jackson, Mississippi, and (iii) Hibbing Taconite Company, which is described under “—Mining” below.
ArcelorMittal Mexico
ArcelorMittal Mexico produces both flat and long steel products and operates an integrated route and EAF route using DRI. It produces higher quality slabs for use in specialized steel applications in the automotive, line pipe manufacturing, shipbuilding and appliance industries. It is also one of the largest single rebar and wire rod production facilities in Mexico and mainly uses the integrated route for steelmaking. The facility is located in Lazaro Cardenas in the Michoacán state by the Pacific coast and is highly accessible by ocean, rail, and other means. It also operates a rebar mill at Celaya with billets sourced from the Lazaro facility.
ArcelorMittal Long Products Canada
ArcelorMittal Long Products Canada is the largest mini-mill in Canada and has the flexibility to use either DRI or scrap, depending on their respective economics. It produces wire rods, wire products and bars, primarily sold in Canada and the
90
United States and principally serves the automotive, appliance, transportation, machinery and construction industries. It also produces slabs that are used within ArcelorMittal.
|
BRAZIL
|
Crude Steel
|
|||||||||
|
Unit
|
Country
|
Locations
|
Production in 2018 (in million tonnes per year)
1
|
Type of plant
|
Products
|
|||||
|
Sol
|
Brazil
|
Vitoria
|
n/a
|
Coke-Making
|
Coke
|
|||||
|
ArcelorMittal Tubarão
|
Brazil
|
Vitoria
|
7.0
|
Integrated
|
Flat
|
|||||
|
ArcelorMittal Vega
|
Brazil
|
São Francisco do Sul
|
n/a
|
Downstream
|
Flat
|
|||||
|
ArcelorMittal Brasil
|
Brazil
|
João Monlevade
|
1.1
|
Integrated
|
Long/ Wire Rod
|
|||||
|
Acindar
|
Argentina
|
Villa Constitucion
|
1.4
|
Mini-mill
|
Long/ Wire Rod, Bar
|
|||||
|
ArcelorMittal Brasil
2
|
Brazil
|
Juiz de Fora, Piracicaba
|
2.0
|
Mini-mill
|
Long/ Bar, Wire Rod
|
|||||
|
ArcelorMittal Costa Rica
|
Costa Rica
|
Costa Rica
|
n/a
|
Downstream
|
Long/ Wire Rod
|
|||||
|
Industrias Unicon
|
Venezuela
|
Barquisimeto, Matanzas, La Victoria
|
n/a
|
Downstream
|
Pipes and Tubes
|
|||||
|
ArcelorMittal Sul Fluminense
3
|
Brazil
|
Barra Mansa,
Resende |
0.7
|
Mini-mill
|
Long/Rebar, Wire rod, Bars, Sections, Wires
|
|||||
|
1
|
Note: n/a = not applicable (no crude steel production)
|
|
2
|
The Cariacica site was divested in May 2018
|
|
3
|
ArcelorMittal acquired Votorantim Siderurgia (subsequently renamed ArcelorMittal Sul Fluminense) in April 2018.
|
ArcelorMittal Brasil
ArcelorMittal Brasil produces both flat and long steel products. Flat products are manufactured at ArcelorMittal Tubarão and ArcelorMittal Vega. Its products include slabs, hot-rolled coil, cold-rolled coil and galvanized steel, and serve customers in automotive, appliances, construction and distribution segments. The Tubarão complex uses the integrated steelmaking route to produce slabs and further rolled to hot-rolled coils and is strategically located with access to Praia Mole Marine Terminal, road and railway systems. The Vega facility has cold-rolling and coating facilities and easy access to the port of São Francisco do Sul.
ArcelorMittal Brasil’s long products include wire rod and wire, merchant bars, special bars and rebars, for use in civil construction, industrial manufacturing, agricultural and distribution sectors. It produces transformed products including, among others, welded mesh, trusses, annealed wire and nails. It also operates an extensive distribution network across the country selling to retail customers. It also owns interests in two subsidiaries, Belgo Bekaert Arames Ltda. (BBA), which manufactures wire products for agricultural and industrial end-users, and Belgo-Mineira Bekaert Artefatos de Arame Ltda., which produces steel cords used in the tire industry. On April 1, 2018 ArcelorMittal Brasil completed the acquisition of Votorantim Siderurgia, Votorantim's long steel business in Brazil comprising forests and the upstream and downstream steel facilities of Barra Mansa and Resende which produce wire rod, bars, sections, wires, welded mesh and trusses. The transaction was approved by the Brazilian antitrust authority CADE subject to the disposal of ArcelorMittal Brasil's production sites of Cariacica and Itaúna, which was completed in May 2018 (see "Item 4.A—Information on the Company—History and development of the Company—Key transactions and events in 2018" for a description of the transaction). ArcelorMittal Bioflorestas produces charcoal from eucalyptus forestry operations that is used to fuel its furnaces in Juiz de Fora and to exchange for pig iron with local producers.
91
Acindar
Acindar is the largest long steel producer in Argentina. It produces and distributes products to meet the needs of the industrial, agricultural and construction sectors. It produces rebars, meshes, nails, preassembled and welded cages, square and round bars, flat bars, sections, piles, wire rod, drawn bars and barbed wire. It has an in-house distribution network that can also service end-users.
|
EUROPE
|
Crude Steel
|
|||||||||
|
Unit
|
Country
|
Locations
|
Production in 2018 (in million tonnes per year)
1
|
Type of plant
|
Products
|
|||||
|
ArcelorMittal Bremen
|
Germany
|
Bremen, Bottrop
|
3.4
|
Integrated
|
Flat
|
|||||
|
ArcelorMittal Eisenhüttenstadt
|
Germany
|
Eisenhüttenstadt
|
2.1
|
Integrated
|
Flat
|
|||||
|
ArcelorMittal Belgium
2
4
|
Belgium
|
Gent, Geel, Genk, Huy, Liège
|
5.4
|
Integrated and Downstream
|
Flat
|
|||||
|
ArcelorMittal Atlantique et Lorraine
|
France
|
Dunkirk,
Mardyck, Montataire, Desvres, Florange, Mouzon, Basse- Indre |
6.8
|
Integrated and Downstream
|
Flat
|
|||||
|
ArcelorMittal Méditerranée
|
France
|
Fos-sur-Mer,
Saint-Chély |
3.7
|
Integrated and Downstream
|
Flat
|
|||||
|
ArcelorMittal Galati
4
|
Romania
|
Galati
|
2.1
|
Integrated
|
Flat
|
|||||
|
ArcelorMittal España
|
Spain
|
Avilés, Gijón, Extebarri, Lesaka, Sagunto
|
4.8
|
Integrated and Downstream
|
Flat, Long, Rails, Wire Rod
|
|||||
|
ArcelorMittal Italy
|
Italy
|
Taranto, Genova, Novi Ligure
|
0.7
|
Integrated and Downstream
|
Flat, Pipes and Tubes
|
|||||
|
ArcelorMittal Poland
|
Poland
|
Krakow, Swietochlowice, Dabrowa Gornicza,
Chorzow, Sosnowiec, Zdzieszowice |
5.3
|
Integrated and Downstream
|
Flat, Long, Coke/ Sections, Wire Rod, Sheet Piles, Rails
|
|||||
|
ArcelorMittal Sestao
|
Spain
|
Bilbao
|
0.3
|
Mini-mill
|
Flat
|
|||||
|
ArcelorMittal Piombino
4
|
Italy
|
Avellino,
Piombino |
n/a
|
Downstream
|
Flat
|
|||||
|
ArcelorMittal Dudelange
4
|
Luxembourg
|
Dudelange
|
n/a
|
Downstream
|
Flat
|
|||||
|
ArcelorMittal Skopje
4
|
North Macedonia
|
Skopje
|
n/a
|
Downstream
|
Flat
|
|||||
|
ArcelorMittal Tallinn
|
Estonia
|
Tallinn
|
n/a
|
Downstream
|
Flat
|
|||||
|
Industeel
|
France, Belgium
|
Charleroi, Le Creusot, Chateauneuf,
Saint-Chamond, Seraing, Dunkirk |
0.5
|
Mini-mill and Downstream
|
Flat
|
|||||
|
ArcelorMittal Ostrava
4
|
Czech Republic
|
Ostrava
|
2.1
|
Integrated
|
Flat, Long
|
|||||
|
ArcelorMittal Belval & Differdange
|
Luxembourg
|
Esch-Belval, Differdange, Rodange
|
2.2
|
Mini-mill
|
Long /Sheet Piles, Rails, Sections & Special Sections
|
|||||
92
|
EUROPE (continued)
|
Crude Steel
|
|||||||||
|
Unit
|
Country
|
Locations
|
Production in 2018 (in million tonnes per year)
1
|
Type of plant
|
Products
|
|||||
|
ArcelorMittal Olaberria-Bergara
|
Spain
|
Olaberría, Bergara
|
1.0
|
Mini-mill
|
Long/ Sections
|
|||||
|
ArcelorMittal Gandrange
|
France
|
Gandrange
|
n/a
|
Downstream
|
Long/ Wire Rod, Bars
|
|||||
|
ArcelorMittal Warszawa
|
Poland
|
Warszawa
|
0.6
|
Mini-mill
|
Long/ Bars
|
|||||
|
ArcelorMittal Hamburg
|
Germany
|
Hamburg
|
0.9
|
Mini-mill
|
Long/ Wire Rods
|
|||||
|
ArcelorMittal Duisburg
|
Germany
|
Ruhrort, Hochfeld
|
1.1
|
Integrated
|
Long/ Billets, Wire Rod
|
|||||
|
ArcelorMittal Hunedoara
|
Romania
|
Hunedoara
|
0.3
|
Mini-mill
|
Long/ Sections
|
|||||
|
Sonasid
|
Morocco
|
Nador, Jorf Lasfar
|
0.6
|
Mini-mill
|
Long/ Wire Rod, Bars, Rebars in Coil
|
|||||
|
ArcelorMittal Zenica
|
Bosnia and Herzegovina
|
Zenica
|
0.7
|
Mini-mill / Integrated
|
Long/ Wire Rod, Bars
|
|||||
|
ArcelorMittal Tubular Products Galati SRL
4
|
Romania
|
Galati
|
n/a
|
Downstream
|
Pipes and Tubes
|
|||||
|
ArcelorMittal Tubular Products Roman SA
|
Romania
|
Roman
|
n/a
|
Downstream
|
Pipes and Tubes
|
|||||
|
ArcelorMittal Tubular Products Iasi SA
|
Romania
|
Iasi
|
n/a
|
Downstream
|
Pipes and Tubes
|
|||||
|
ArcelorMittal Tubular Products Ostrava a.s.
4
|
Czech Republic
|
Ostrava
|
n/a
|
Downstream
|
Pipes and Tubes
|
|||||
|
ArcelorMittal Tubular Products Karvina a.s.
|
Czech Republic
|
Karvina
|
n/a
|
Downstream
|
Pipes and Tubes
|
|||||
|
ArcelorMittal Tubular Products Kraków
|
Poland
|
Krakow
|
n/a
|
Downstream
|
Pipes and Tubes
|
|||||
|
ArcelorMittal Tubular Products Hautmont
|
France
|
Hautmont
|
n/a
|
Downstream
|
Pipes and Tubes
|
|||||
|
ArcelorMittal Tubular Products Vitry
|
France
|
Vitry
|
n/a
|
Downstream
|
Pipes and Tubes
|
|||||
|
ArcelorMittal Tubular Products Chevillon
|
France
|
Chevillon
|
n/a
|
Downstream
|
Pipes and Tubes
|
|||||
|
ArcelorMittal Tubular Products Lexy
|
France
|
Lexy, Rettel,Vincey, Fresnoy-le-Grand
|
n/a
|
Downstream
|
Pipes and Tubes
|
|||||
|
1
|
n/a = Not applicable (no crude steel production)
|
|
2
|
Entities (certain downstream facilities in Liège in the case of ArcelorMittal Belgium) classified as held for sale as of December 31, 2018. See also note 2.3.2 to the consolidated financial statements.
|
93
|
3
|
ArcelorMittal acquired Ilva (subsequently renamed ArcelorMittal Italia) on November 1, 2018. As a result, production figures relate only to November and December 2018.
|
|
4
|
Assets held for sale as of December 31, 2018
|
ArcelorMittal Atlantique & Lorraine
ArcelorMittal Atlantique & Lorraine has locations in Dunkirk, Mardyck, Montataire, Desvres, Florange, Mouzon and Basse-Indre. ArcelorMittal Atlantique & Lorraine produces and markets a large range of products, including slabs, hot-rolled, pickled, galvanized, color-coated and tin-plated coils. ArcelorMittal Atlantique & Lorraine’s products are sold principally in the regional market in France and Western Europe, particularly in the automotive and packaging market. The Dunkirk site has primary facilities and produces slabs for other ArcelorMittal Atlantique & Lorraine sites as well as supplies hot rolled coils to the sites of Desvres, Mardyck and Liège. The Mardyck site has finishing facilities and supplies the coating lines of Desvres, Mardyck and Montataire.
The Florange site supplies the finishing cold facilities and the coating lines of Mouzon and ArcelorMittal Dudelange, as well as the tinplate cold facilities for certain packaging facilities. Mouzon is specialized in finishing hot dip coating operations.
The Florange site has primary and finishing facilities that are located mainly along the Fensch River in Lorraine. The liquid phase of Florange has been idled since October 2011. Florange is being supplied with slabs from the Dunkirk site. The finishing plant of Florange has idled one continuous annealing line since September 2013, a tinplate mill since January 2012 and an organic coating line which was idled on a long-term basis since June 2011.
In 2012, ArcelorMittal and the French government reached an agreement following which the liquid phase was idled without any dismantling for six years. Following the expiration of the idling period at the end of 2018, the Company began its definitive closure and dismantling. Also in 2012, the Company also expressed its commitment to the French government that it would invest €180 million in the Florange site over the next five years, maintain the packaging activity in Florange for at least five years, reorganize the activity of the Florange site only by voluntary social measures for workers and launch an R&D program to continue to develop the blast furnace top gas recycling technology. The social measures terminated at the end of 2015 after the retirement of the relevant employees. In 2018, the €180 million investment commitment was completed. Following the expiration of the agreement between ArcelorMittal and the French government, the Company will proceed with the definitive closure of the facility and recorded a provision of $113 million for the dismantling of the facility in the fourth quarter of 2018.
The site of Basse-Indre is specialized in packaging activities. Its pickling line and cold-rolling mill are both idled since April 2014.
The sites of ArcelorMittal Atlantique & Lorraine produce and deliver a range of flat steel high-value finished products to customers, including cold-rolled, hot dip galvanized, electro-galvanized, aluminized and organic-coated material, tinplate, draw wall ironed tin plate (DWI) and tin free steel. Certain of its products are designed for the automotive market, such as Ultragal®, Extragal®, galfan, Usibor® (hot dip), while others are designed for the appliances market, such as Solfer® (cold-rolled) for enameling applications.
On May 7, 2018, the European Commission approved the acquisition of Ilva. As part of the European Commission's approval, ArcelorMittal agreed to divest certain of its European assets, including ArcelorMittal Dudelange (see "Item 4.A—Information on the Company—History and development of the Company—Key transactions and events in 2018") for a description of the transaction). Accordingly, ArcelorMittal Dudelange is classified as held for sale at December 31, 2018. The completion of the disposal of these facilities is subject to the European Commission's approval and the conclusion of information consultations with local and European Works Councils.
ArcelorMittal Belgium
ArcelorMittal Gent
ArcelorMittal Gent is a fully integrated coastal steelworks which is located along the Gent-Terneuzen canal, approximately 17 kilometers from the Terneuzen sea lock, which links the works directly with the North Sea. The canal is of the Panamax type and can accommodate ships of up to 65,000 tonnes. ArcelorMittal Gent produces flat steel products with high added value. A
94
significant part of the production is coated, either by hot dip galvanizing, electro galvanizing or organic coating. ArcelorMittal Gent also includes one organic coating line located in Geel and one electro galvanizing line located in Genk. ArcelorMittal Gent’s products are mainly used in the automotive industry and in household appliances, tubes, containers, radiators and construction. In 2018, ArcelorMittal Gent invested €65 million in a new furnace at Sidgal 3 line to produce Fortiform ® grades for automotives.
ArcelorMittal Liège
The primary facilities of ArcelorMittal Liège upstream are located in two main plants along the Meuse River. The finishing facilities of ArcelorMittal Liège are located south of Liège.
After a series of discussions earlier in 2013 regarding the potential reorganization of ArcelorMittal Liège, ArcelorMittal Liège agreed in December 2013 to the terms of a social plan with unions following a five-year industrial plan agreement and in February 2014 signed a five-year global agreement with the Walloon Government and local unions confirming the lines to be operated in the coming years and the commitments made by ArcelorMittal in terms of investments, R&D and local economic support. ArcelorMittal Liège confirmed and had fully completed its commitment to a €138 million investment program as of December 31, 2017. In addition, ArcelorMittal Liège definitively closed a coke plant in early June 2014, which was no longer viable due to excess supply in Europe.
On February 3, 2017, ArcelorMittal Liège inaugurated the JVD (Jet Vapor Deposition) line, a new €63 million asset that is part of the €138 million investment program. This world-class innovative line coats moving strips of steel in a vacuum chamber by vaporizing zinc onto the steel at high speed to produce coated steels for automotive and other industrial applications.
Following its transformation, ArcelorMittal Liège produces a wide range of innovative products to meet the demanding needs of companies in the automotive, industrial, domestic appliances. Remaining operating assets in Liège are the continuous annealing line 1, hot dip galvanizing line 7 (combiline) and line 8 (Eurogal), the electrogalvanzing line 5, the JVD line and the two organic coating lines 2 and 7 (combiline hot dip galvanizing line 7).
On May 7, 2018, the European Commission approved the acquisition of Ilva. As part of the European Commission's approval, ArcelorMittal agreed to divest certain of its European assets, including the hot dipped galvanizing lines 4 and 5 in Flémalle, hot-rolled pickling, cold rolling and tin packaging lines in Tilleur of ArcelorMittal Liège in Belgium (see "Item 4.A. —Information on the Company—History and development of the Company—Key transactions and events in 2018") for a description of the transaction). Accordingly, these facilities are classified as held for sale at December 31, 2018. The completion of the disposal of these facilities is subject to the European Commission's approval and the conclusion of information consultations with local and European Works Councils.
ArcelorMittal Bremen
ArcelorMittal Bremen is situated on the bank of the Weser River north of Bremen, Germany. ArcelorMittal Bremen produces and sells a wide range of products including slab, hot-rolled, pickled, cold-rolled and hot dip galvanized rolls to the automotive and primary transformation sectors.
ArcelorMittal Méditerranée
ArcelorMittal Méditerranée operates a flat carbon steel plant in Fos-sur-Mer. It also operates a finishing facility for electrical steel located in Saint-Chély, 300 kilometers northwest of Fos-sur-Mer. The Fos-sur-Mer plant is located 50 kilometers west of Marseille on the Mediterranean Sea.
ArcelorMittal Méditerranée’s products include coils to be made into wheels, pipes for energy transport and coils for finishing facilities for exposed and non-exposed parts of car bodies, as well as for the construction, home appliance, packaging, pipe and tube, engine and office material industries. The Saint-Chély plant produces electrical steel (with up to 3.2% silicon content), mainly for electrical motors. About 60% of its products are shipped from a private wharf, in part through a shuttle system. 30% of its products are shipped by rail, with the remaining amount transported by truck.
95
ArcelorMittal España
ArcelorMittal España’s Avilés and Gijón facilities, which are by far the largest of its facilities, are connected by ArcelorMittal España’s own railway system. These two facilities operate as a single integrated steel plant. The product range of ArcelorMittal España includes rail, wire rod, heavy plates and hot-rolled coil, as well as more highly processed products such as galvanized sheet, tinplate and organic-coated sheet. The facilities are also connected by rail to the region’s two main ports, Avilés and Gijón. Raw materials are received at the port of Gijón, where they are unloaded at ArcelorMittal España’s own dry-bulk terminal, which is linked to steel-making facilities by conveyor belt. A variety of products are shipped through the Avilés port facilities to other units of the Group and to ArcelorMittal España’s customers.
ArcelorMittal España is connected to the other ArcelorMittal facilities in Spain by the wide-gauge and narrow-gauge rail networks. Shuttle trains link the ArcelorMittal España facilities directly to the ArcelorMittal Sagunto plant, which it supplies with hot-rolled coils for subsequent processing into cold-rolled, galvanized and electro galvanized sheet.
ArcelorMittal España production is primarily sold to the railway, automotive and construction industries.
ArcelorMittal España’s Gijón coke plant is idled. On September 23, 2015, ArcelorMittal announced the investment of over €100 million in the refurbishment of the coke oven batteries in Gijón. The main part of the approved investment focuses on the re-construction of two 45-oven batteries at ArcelorMittal Asturias’ coke plant in Gijón, installation of a state-of-the-art emission collection and scrubbing system, and implementation of efficient by-product management systems. The refurbishment work started in 2016 and the coke oven batteries are expected to reach full capacity in 2020.
ArcelorMittal Italia
On November 1, 2018, ArcelorMittal completed the acquisition of Ilva S.p.A. (subsequently renamed ArcelorMittal Italia) and certain of its subsidiaries. ArcelorMittal Italia is the leading steel producer in Italy, Europe’s second largest steel consuming economy, and a new industrial hub within ArcelorMittal Europe Flat Products. ArcelorMittal Italia produces high-quality and sustainable steel to be used in a range of vital industry sectors across the domestic steel market such as construction, energy, automotive, home appliances, packaging and transport and for international export. ArcelorMittal Italia has operations across various structurally linked operating sites including Europe’s biggest single-site integrated steel facility in Taranto and rolling mills in Genoa and Novi Ligure. Genoa is also an important hub in terms of intermodal logistics. ArcelorMittal Italia will leverage on new synergies between its service centers in Genoa and Canossa to serve the largest European tinplate market.The agreement includes industrial capital expenditure commitments of approximately €1.3 billion ($1.4 billion) over a seven-year period focused on blast furnaces including €0.2 billion revamping of blast furnace #5 intending to bring steel production to 8 million tonnes by 2024 (current crude steel production is limited to 6 million tonnes until environmental capex plan is completed), steel shops and finishing lines and environmental capital expenditure commitments of approximately €0.8 billion ($0.9 billion) including €0.3 billion for stock pile coverage, €0.2 billion for reduction of emissions at coke ovens and €0.2 billion in waste water treatment. The agreement also includes environmental remediation obligations of approximately €0.5 billion ($0.6 billion), the latter of which will be funded with funds seized by the Italian Government from the former shareholder.
In Taranto, a new research and development center is being built; its objective is to develop strategic and high value-added products and to make provisions for new and ad hoc technical solutions designed to improve the environmental impact of the steel production processes. See "Item 4.A—Information on the Company—History and development of the Company—Key transactions and events in 2018" and note 2.2.4 to ArcelorMittal’s consolidated financial statements for further details.
ArcelorMittal Poland
ArcelorMittal Poland is the largest steel producer in Poland. ArcelorMittal Poland’s Zdzieszowice coke plant produces and supplies coke to ArcelorMittal subsidiaries and third parties.
ArcelorMittal Poland produces coke and a wide range of steel products, including both long and flat products such as slabs, billets, blooms, sections, sheet piles, rails up to 120 meters long, railway accessories, mining supports sections, hot-rolled coils, sheets and strips, cold-rolled coils, sheets and strips, galvanized coils and sheets, wire-rods and coated sheets and coils. Products are mainly sold in the domestic Polish market, while the remainder is exported, primarily to customers located in other EU member states. ArcelorMittal Poland’s principal customers are in the construction, engineering, transport, mining and automotive industries.
96
ArcelorMittal Eisenhüttenstadt
ArcelorMittal Eisenhüttenstadt is situated on the Oder river near the German-Polish border, 110 kilometers southeast of Berlin. ArcelorMittal Eisenhüttenstadt is a fully integrated and highly-automated flat steel producing plant. The facility is run with one medium-sized blast furnace.
ArcelorMittal Eisenhüttenstadt produces and sells a wide range of flat steel products, including hot-rolled, cold-rolled, electrical and hot dip galvanized and organic-coated coils to automotive, distribution, metal processing, construction and appliances industry customers in Germany, Central and Eastern Europe.
ArcelorMittal Ostrava and ArcelorMittal Galati
ArcelorMittal Ostrava produces long and flat products and sells most of its products to end-users primarily in the engineering and construction industries, as well as to small-lot resellers.
ArcelorMittal Ostrava’s product range includes slabs, billets, blooms, sections, rebars, wire rod, mining supports sections, hot-rolled coils, sheets and strips. Its products are mainly sold in the domestic Czech market and other EU member states.
ArcelorMittal Galati produces plates, hot-rolled coils, cold-rolled coils and galvanized products, which are sold mainly in the Romanian, Turkish, Balkan and European markets.
On May 7, 2018, the European Commission approved the acquisition of Ilva. As part of the Commission's approval, ArcelorMittal agreed to divest certain of its European assets, including ArcelorMittal Galati and ArcelorMittal Ostrava (see "Item 4.A—Information on the Company—History and development of the Company—Key transactions and events in 2018" for a description of the transaction). Accordingly, ArcelorMittal Galati and ArcelorMittal Ostrava are classified as held for sale at December 31, 2018. The completion of the disposal of these facilities is subject to the European Commission’s approval and the conclusion of information consultations with local and European Works Councils.
ArcelorMittal Belval & Differdange
ArcelorMittal Belval & Differdange produces a wide range of sections and sheets piles which are sold to the local European construction market as well as for export. With its Rodange facilities, it also produces a wide range of rails, special sections and heavy angles.
ArcelorMittal Hamburg
ArcelorMittal Hamburg produces billet and high quality wire rod and its production is mainly sold in the European market, primarily to automotive and engineering customers.
ArcelorMittal Olaberria-Bergara
The Olaberría facility’s production is sold to the local construction market as well as for export, while the Bergara facility’s production is sold primarily to the local European construction market.
ArcelorMittal Duisburg
ArcelorMittal Duisburg produces blooms, billets, bars and high quality wire rod and its production is mainly sold in the European market primarily to automotive, railway and engineering customers.
ArcelorMittal Downstream Solutions (AMDS)
The Europe segment also includes ArcelorMittal Downstream Solutions (“AMDS”), which primarily covers the downstream activities of ArcelorMittal in Europe. It provides distribution of long and flat products as well as value-added and customized steel solutions through further processing to meet specific customer requirements. In addition, specific solutions are dispatched through other business lines, primarily ArcelorMittal Construction, ArcelorMittal Projects, ArcelorMittal Tubular Products, ArcelorMittal Wire Solutions and ArcelorMittal International.
AMDS also includes Industeel, with facilities in Belgium and in France. Industeel Belgium and Industeel Creusot are designed to produce special steel plates, ranging from 5 to 180 millimeters in thickness, including stainless steel products, while
97
Industeel Loire is dedicated to extra heavy gauge products of alloyed carbon steel. Euroform operates hot forming facilities, mainly to transform extra heavy gauge products received from Industeel Loire. The R&D center in Le Creusot, France is fully dedicated to special plate products development.
During 2018, in response to the continued challenging economic context and overcapacity in Western and Eastern Europe, AMDS reduced its industrial footprint in Germany (Herford, Goslar & Berlin sites) and in France.
Also, early 2018, ArcelorMittal Tubular Lexy finalized the acquisition of Lorraine Tubes' assets. This company operates in the construction and mechanical sectors, with also a new development on HAV tubes for automotive. In addition, ArcelorMittal Projects Martillac completed the acquisition of Exosun's assets. The company is specialized in solar energy (trackers, photovoltaic energy). This acquisition enables the Company to complement its presence on the solar market (solar steel frames manufacturing units in Europe, China and Egypt) with ambitions on the growing photovoltaic market and trackers as an emerging solution.
|
ACIS
|
Crude Steel
|
|||||||||
|
Unit
|
Country
|
Locations
|
Production in 2018 (in million tonnes per year)
1
|
Type of plant
|
Products
|
|||||
|
ArcelorMittal Temirtau JSC
|
Kazakhstan
|
Termitau
|
3.3
|
Integrated
|
Flat, Long, Pipes and Tubes
|
|||||
|
ArcelorMittal Kryvyi Rih
|
Ukraine
|
Kryvyi Rih
|
4.8
|
Integrated
|
Long
|
|||||
|
ArcelorMittal South Africa
|
South Africa
|
Vanderbijlpark, Saldanha, Newcastle, Pretoria
|
5.0
|
Integrated Mini-mill Downstream
|
Flat, Long, Pipes and Tubes
|
|||||
|
JSC ArcelorMittal Tubular Products Aktau
|
Kazakhstan
|
Aktau
|
n/a
|
Downstream
|
Pipes and Tubes
|
|||||
|
1
|
Note: n/a = not applicable (no crude steel production).
|
ArcelorMittal South Africa
ArcelorMittal South Africa is the largest steel producer in Africa and its common shares are listed on the JSE Limited in South Africa under the symbol “ACL”. ArcelorMittal South Africa has three main steel production facilities of which Vanderbijlpark and Newcastle are located inland, while Saldanha is close to a deep water port which is supported by a metallurgical by-products division (Coke and Chemicals). ArcelorMittal South Africa has a diversified range of products and includes hot-rolled plates and sheet in coil form, cold-rolled sheet, coated sheet, wire-rod and sections, as well as forgings. Approximately 80% of its products are sold in the South African domestic market, while Africa is its largest export market. It also sells into Asia and has minor tonnages into Europe and the Americas.
In November 2018, ArcelorMittal South Africa acquired the Thabazimbi iron ore mine, which is currently in rehabilitation while the future of the asset is being investigated.
ArcelorMittal Temirtau
ArcelorMittal Temirtau’s product range of flat and long steel products includes pig iron, continuous caster slabs, continuous caster billets, hot- and cold-rolled coils and sheets, black plates, covers, tin plates, hot dipped galvanized products, color coated products, welded pipes and rebars. ArcelorMittal Temirtau also has iron ore mines and coal mines (see “—Mining” below for further information).
98
ArcelorMittal Temirtau sells steel products to a range of industries, including the tube- and pipe-making sectors, as well as manufacturers of consumer goods and appliances. The markets for its products include Kazakhstan, CIS and Russia, Middle East and China.
ArcelorMittal Kryvyi Rih
ArcelorMittal Kryvyi Rih’s product range includes billets, rebars and wire rods, light sections (angles) and merchant bars (rounds, squares and strips). ArcelorMittal Kryvyi Rih also has iron ore mines (see “—Mining” below for further information). Its products are sold to a range of industries such as hardware, construction, rerolling and fabrication. The markets for its products include Ukraine, CIS and Russia, North West and East Africa, Middle East and Gulf countries, Europe and Latin America.
In addition, ArcelorMittal Kryvyi Rih includes an export sales network which supplies a complete range of steel products not only from Kryvyi Rih but also from other plants of the Group to customers outside of their respective home markets.
99
Mining
ArcelorMittal’s mining segment has production facilities in North and South America, Europe, Africa and CIS. The following table provides an overview by type of facility of ArcelorMittal’s principal mining operations.
|
Unit
|
Country
|
Locations
|
ArcelorMittal Interest (%)
|
Type of Mine
|
Product
|
||||||
|
Iron Ore
|
|||||||||||
|
ArcelorMittal Mines and Infrastructure Canada
|
Canada
|
Mt Wright and Port Cartier, Qc
|
85.0
|
Iron Ore Mine (open pit), railway and port
|
Concentrate and pellets
|
||||||
|
Minorca Mines
|
USA
|
Virginia, MN
|
100.0
|
Iron Ore Mine (open pit)
|
Pellets
|
||||||
|
Hibbing Taconite Mines
|
USA
|
Hibbing, MN
|
62.3
|
Iron Ore Mine (open pit)
|
Pellets
|
||||||
|
ArcelorMittal Mexico
|
Mexico
|
Sonora, Lazaro Cardenas
|
100.0
|
Iron Ore Mine (open pit)
|
Concentrate, lump and fines
|
||||||
|
ArcelorMittal Mexico Peña Colorada
|
Mexico
|
Minatitlán
|
50.0
|
Iron Ore Mine (open pit)
|
Concentrate and pellets
|
||||||
|
ArcelorMittal Brasil Andrade Mine
|
Brazil
|
State of Minas Gerais
|
100.0
|
Iron Ore Mine (open pit)
|
Fines
|
||||||
|
ArcelorMittal Mineração Serra Azul
|
Brazil
|
State of Minas Gerais
|
100.0
|
Iron Ore Mine (open pit)
|
Lump and fines
|
||||||
|
ArcelorMittal Prijedor
|
Bosnia and Herzegovina
|
Prijedor
|
51.0
|
Iron Ore Mine (open pit)
|
Concentrate and lump
|
||||||
|
ArcelorMittal Kryvyi Rih
|
Ukraine
|
Kryvyi Rih
|
95.1
|
Iron Ore Mine (open pit and underground)
|
Concentrate, lump and sinter feed
|
||||||
|
ArcelorMittal Temirtau
|
Kazakhstan
|
Lisakovsk, Kentobe, Atasu, Atansore
|
100.0
|
Iron Ore Mine (open pit and underground)
|
Concentrate, lump and fines
|
||||||
|
ArcelorMittal Liberia
|
Liberia
|
Yekepa
|
85.0
|
Iron Ore Mine (open pit)
|
Fines
|
||||||
|
Coal
|
|||||||||||
|
ArcelorMittal Princeton
|
USA
|
McDowell, WV, Tazewell, VA
|
100.0
|
Coal Mine (surface and underground)
|
Coking and PCI coal
|
||||||
|
ArcelorMittal Temirtau
|
Kazakhstan
|
Karaganda
|
100.0
|
Coal Mine (underground)
|
Coking coal and thermal coal
|
||||||
Iron Ore
ArcelorMittal Mines and Infrastructure Canada
ArcelorMittal Mines and Infrastructure Canada is a major Canadian producer of iron ore concentrate and several types of pellets. It holds mineral rights over 32,279.5 hectares of land in the province of Québec, Canada. ArcelorMittal Mines and Infrastructure Canada operates the Mont-Wright Mine and concentrator near Fermont in northeastern Québec. Mont-Wright is located 416 kilometers north of the port of Port-Cartier, the site of the pelletizing plant and shipping terminal on the north shore of the Gulf of St. Lawrence, and approximately 1,000 kilometers northeast of Montreal. A private railway connects the mine and concentrator with Port-Cartier. The railway and the port are owned and operated by ArcelorMittal Mines and Infrastructure Canada. The Mont-Wright mine and the town of Fermont are connected by Highway 389 to Baie Comeau on the North Shore of the Gulf of St. Lawrence, a distance of 570 kilometers. ArcelorMittal Mines and Infrastructure Canada owns mineral rights to iron ore deposits in Fire Lake and Mont Reed. Fire Lake, which is located approximately 53 kilometers south of Mont-Wright, dispatched approximately 15.9 million tonnes of crude ore by rail to the Mont-Wright concentrator in 2018. The Mont Reed deposit is currently not mined. In addition, ArcelorMittal Mines and Infrastructure Canada holds surface rights over the land on which the Mont-Wright and Port Cartier installations are located, with the exception of a small area which remains the property of the Quebec Government but in no way compromises the mineral rights. The property began operating in 1976.
100
The expiration dates of the mining leases range from 2020 to 2033. These leases are renewable for three periods of ten years, provided the lessee has performed mining operations for at least two years in the previous ten years of the lease.
The Mont-Wright and Fire Lake mines are part of the highly-folded and metamorphosed southwestern branch of the Labrador Trough. The most important rock type in the area is the specular hematite iron formation forming wide, massive deposits that often form the crest of high ridges extending for many kilometers in the Quebec-Labrador area.
The Mont-Wright operation consists of open pit mines and a concentrator. The ore is crushed in two gyratory crushers and the concentrator operates with seven lines of three stage spiral classifiers and horizontal filters. The mining complex and infrastructure has a production capacity of approximately 26 million tonnes of concentrate per year. The Port-Cartier pellet plant produces acid and flux pellets that operate six ball mills, ten balling discs and two induration furnaces. The pelletizing plant has a capacity of 10 million tonnes of pellets per year. The mine produced 9.5 million tonnes of pellets and 15 million tonnes of concentrate in 2018.
Electric power for Mont-Wright and the town of Fermont is supplied by Hydro-Quebec via a 157 kilometer line. In the event of an emergency, the Hart Jaune Power plant, also connected to the Hydro-Quebec grid, can supply sufficient power to maintain the operations of the essential processing facilities.
ArcelorMittal USA Iron Ore Mines
ArcelorMittal USA operates an iron ore mine through its wholly-owned subsidiary ArcelorMittal Minorca and owns a majority stake in Hibbing Taconite Company, which is managed by Cleveland Cliffs Inc.
ArcelorMittal Minorca holds the mineral rights on more than 2,800 acres necessary to mine the stated reserves. Minorca's owned/leased lands increased to approximately 13,920 acres with the purchase of 160 acres of land in Meadowlands, MN for construction of wetlands as required by the State of Minnesota. The operations are located approximately three kilometers north of the town of Virginia in the northeast of Minnesota, which are accessible by road and rail. The Minorca Mine controls through leases all the mineral and surface rights needed to mine and process its estimated 2018 iron ore reserves. The expiration dates of the mining leases range from 2035 to 2056. ArcelorMittal Minorca operates a concentrating and pelletizing facility, along with two open pit iron ore mines - Laurentian, and East Pits - located 12 kilometers from the processing facilities. The processing operations consist of a crushing facility, a three-line concentration facility and a single-line straight grate pelletizing plant. The Minorca pelletizing facility produced 2.8 million metric tonnes of taconite pellets in 2018. Pellets are transported by rail to ports on Lake Superior. Lake vessels are used to transport the pellets to Indiana Harbor. The Minorca taconite plant was constructed and operated by Inland Steel from 1977 until 1998 when it was purchased by then ISPAT International, a predecessor company of ArcelorMittal.
The Hibbing Taconite Company holds mineral rights over 7,520 acres through 34 contiguous mineral leases, which are located mainly within the City of Hibbing with a processing facility five kilometers from north of the town center in the northeast of Minnesota and is accessible by road and rail. The Hibbing operations are jointly owned by subsidiaries of ArcelorMittal USA (62.3%), Cleveland-Cliffs Inc. (23.0%) and U.S. Steel (14.7%), with Cliffs Mining Services Company as the managing agent of the mine and processing facilities. The Hibbing Taconite Company, through leases, controls the mineral and surface rights needed to mine and process its estimated iron ore reserves. The expiration dates of the mining leases range from 2022 to 2056. These leases can be renewed through negotiations with the mineral owners, though no obligations to renew exist for the mineral owners. The operations consist of open pit mining, crushing, concentrating and pelletizing. The finished pellets are then transported by rail to the port of Allouez at Superior, Wisconsin, a distance of 130 kilometers, and then over the Great Lakes by lake vessels to ArcelorMittal’s integrated steelmaking plants, principally Burns Harbor. The Hibbing Taconite Company began operating in the third quarter of 1976. The mine produced 7.8 million metric tonnes of taconite pellets in 2018 (of which approximately 4.8 million metric tonnes are ArcelorMittal’s share).
Both the Minorca and Hibbing mines are located in the Mesabi iron range where iron ore has been extracted for over 100 years. The ore bodies are within the Biwabik Iron Formation, a series of shallow dipping Precambrian sedimentary rocks known as taconite with a total thickness in excess of 200 meters and running for approximately 200 kilometers. Although the first deposits mined in the Mesabi iron range consisted of oxidized hematite ores, production was shortened in the mid-1950 to low grade magnetic taconite ores. The processing of this ore involves a series of grinding and magnetic separation stages to remove the magnetite from the silica. Natural gas and electric power constitutes the main sources of energy for both Minorca and Hibbing. The electric power is provided by the Minnesota Power company.
101
ArcelorMittal Mexico Mining Assets
ArcelorMittal Mexico operates three iron ore mines in Mexico, the El Volcan and Las Truchas mines, and, through a joint operation with Ternium S.A., the Peña Colorada mine.
Peña Colorada
Consorcio Minero Benito Juarez Peña Colorada, S.A. de C.V. (Peña Colorada) holds mineral rights over 99,188 acres located at about 60 kilometers by highway to the northeast of the port city of Manzanillo, in the province of Minatitlán in the northwestern part of the State of Colima, Mexico. ArcelorMittal owns 50% of Peña Colorada Ltd., and Ternium S.A. owns the other 50% of the company.
Peña Colorada operates an open pit mine as well as a concentrating facility and a two-line pelletizing facility. The beneficiation plant is located at the mine, whereas the pelletizing plant is located in Manzanillo. Major processing facilities include a primary crusher, a dry cobbing plant, two autogenous mill, three horizontal and two vertical ball mills and several stages of magnetic separation. The concentrate is sent as a pulp through a pipeline from the mineral processing plant. Peña Colorada has operated since 1974. The Peña Colorada mine receives electrical power from the Comisión Federal de Electricidad (CFE), which is a state-owned company that serves customers across the entire country.
Government concessions are granted by the Mexican federal government for a period of 50 years and are renewable. The expiration dates of the current mining concessions range from 2021 to 2062.
The Peña Colorada pelletizing facility produced 3.6 million tonnes of pellets and 0.4 million tonnes of concentrate in 2018. Both magnetite concentrate and iron ore pellets are shipped from Manzanillo to ArcelorMittal Mexico, as well as to Ternium’s steel plants, by ship and by rail.
Peña Colorada is a complex polyphase iron ore deposit. The iron mineralization at Peña Colorada consists of banded to massive concentrations of magnetite within breccia zones and results from several magmatic, metamorphic and hydrothermal mineralization stages with associated skarns, dykes and late faults sectioning the entire deposit.
El Volcan
ArcelorMittal holds mineral rights over 1,053 hectares to support its El Volcan operations located approximately 68 kilometers northwest of the city of Obregon and 250 kilometers from the Guaymas port facility in the state of Sonora, Mexico. The El Volcan operations controlled all of the mineral rights and surface rights needed to mine and process iron ore during 2018. ArcelorMittal operates a concentrating facility along with an open pit mine and a pre-concentration facility at the mine site. The mine site is accessible by a 90-kilometer road from the city of Obregon, where the concentrator is located.
Government concessions are granted by the Mexican federal government for a period of 50 years and are renewable. The expiration dates of the current mining concessions range from 2055 to 2061.
The pre-concentration facilities at the mine include one primary crusher, one secondary crusher, a dry cobbing high intensity magnetic pulley and three tertiary crushers. The concentration plant includes two ball mills on line, a magnetic separation circuit, flotation systems, a belt conveyor filter and a disposal area for tails. The major port installations include a tippler for railroad cars, a conveyor, transfer towers and two ship loading systems. The mine exploitation and crushing operations and all transport activities are performed by contractors. The concentrate and port operations are operated with ArcelorMittal’s own resources. The concentrate is transported by rail to the Pacific port of Guaymas and then shipped to the steel plant in Lázaro Cárdenas. The mining operation uses two Caterpillar 3516B electric generators in continuous operation, with one generator operating 24 hours per day at an average consumption of 540 kilowatt hours while the second generator is on standby. The concentration facility uses electric power from the national grid.
The El Volcan mine concession was bought from the Sonora provincial government in 2004, followed by exploration of the property in 2005. The development of the mine started in 2007. Mining operations were halted during the 2008-2009 global economic crisis and on several occasions due to structural problems in the crushing facilities. Operations resumed without interruption from 2010 until October 2015. In the fourth quarter of 2015, the El Volcan operations were temporarily suspended due to weak market conditions. The El Volcan operations resumed in the first quarter of 2017 as a result of revised mine plan in light of improved price conditions. The total concentrate production in 2018 was 1.6 million tonnes. The iron mineralization
102
includes magnetite rich skarn associated to the intrusion and extrusion of magmas rich in iron and formed in a volcanic environment. The mine is expected to stop production in early 2019 due to the depletion of the reserves.
Las Truchas
ArcelorMittal now holds mineral rights over 54,892 hectares in Mexico. The Las Truchas mine is located approximately 27 kilometres southeast of the town of Lázaro Cárdenas in the State of Michoacán, Mexico. The Las Truchas operations are accessible by public highway and control all the mineral rights needed to mine and process its estimated 2018 iron ore reserves. Part of the surface rights needed to mine and process the 2018 iron ore reserves expired and are currently being re-negotiated.
Government concessions are granted by the Mexican federal government for a period of 50 years and are renewable. The expiration dates of the current mining concessions range from 2044 to 2059.
The Las Truchas mine is an integrated iron ore operation. It began operating in 1976 as a government enterprise (Sicartsa), and its mining activities consist of an open pit mine exploitation, crushing, dry cobbing preconcentrate and concentration plant. The aggregate 2018 production of concentrate and lumps totaled 1.1 million tonnes. The concentrator includes one primary crusher, two secondary crushers and three tertiary crushers, two ball mill and two bar mill and two wet magnetic separation circuits. The electrical energy supplier for the Las Truchas mine is a state-owned company, Comisión Federal de Electricidad (CFE). The concentrated ore is pumped from the mine site through a 26-kilometer slurry pipeline to the steel plant facility in Lázaro Cárdenas.
The Las Truchas deposits consist of massive concentrations of magnetite of irregular morphology. The main Las Truchas deposits occur along about seven kilometers long and about two kilometers wide. The Las Truchas mineral deposits have been classified as hydrothermal deposits, which may have originated from injections of late stage-plutonic-activity through older sedimentary rocks. The mineralization of the Las Truchas iron deposits occurs in disseminated and irregular massive concentrations of magnetite within metamorphic rocks and skarns. The mineralization also occurs as fillings of faults, breccia zones, and fractures.
ArcelorMittal Brasil - Andrade Mine
ArcelorMittal Brasil holds mineral rights of over 2,871 hectares located in the Iron Quadrangle (Quadrilatero Ferrifero), a widely-explored and mined region located approximately 80 kilometers east of Belo Horizonte in the Minas Gerais State of Brazil. ArcelorMittal’s operations control all of the mineral rights and surface rights needed to mine and process its estimated 2018 iron ore reserves, dominated by directly shippable hematite ore. In addition to the open pit mine, ArcelorMittal operates a crushing and screening facility. Production is transported to Monlevade plant through a private railway line. Power is mostly generated from hydroelectric power plants and supplied by CEMIG, an open capital company controlled by the Government of the State of Minas Gerais.
Companhia Siderurgica Belgo-Mineira (“CSBM”) initiated mining operations at the property in 1944 in order to facilitate the supply of ore to its steel plant in Joao Monlevade. The mine was managed by CSBM until the end of 2004. In January 2005, Vale signed a leasing agreement with CSBM for management and operation. In December 2005, CSBM changed its name to Arcelor Brasil S.A. which was then merged in August 2007 into Belgo Siderurgia S.A. The latter then changed its name to ArcelorMittal Brasil S.A. In November 2009, Vale returned the Andrade mine to ArcelorMittal Brasil S.A. In 2018, the Andrade mine produced 1.5 million tonnes of sinter feed. An increase of the crushing and screening facility production capacity to 3.5 million tonnes per year of sinter feed was completed in 2012. In 2013, a cross road was built in order to improve shipments to the local Brazilian market.
In 2018 Andrade started implementing a concentration plant that will enable concentrating Itabirite and mixing it with the hematite. This will improve the quality of the sinter feed to Monlevade Plant, have a positive impact on costs and increase its life span by 16 years. This project is expected to start production in early 2020.
ArcelorMittal Brasil - Serra Azul Mine
ArcelorMittal Brasil holds mineral rights over the central and east claims of the Serra Azul deposit over 375 hectares, located approximately 50 kilometers southwest of the town of Belo Horizonte in the Minas Gerais State of Brazil and accessible by public highway. ArcelorMittal’s operations control all of the mineral rights and surface rights needed to mine and process its estimated 2018 iron ore reserves. ArcelorMittal operates an open pit mine and a concentrating facility. The mine site is accessible by 80 kilometers of public highway from Belo Horizonte.
103
In addition to the open pit mine, processing operations consist of a crushing facility and a three-line concentration facility including screening, magnetic separation, spirals separators and jigging. Production is transported either by truck for local clients of lump, or by truck to two railway terminals located 35 and 50 kilometers, respectively, from the mine site for selling to local clients of sinter feed or for export through third-party port facilities located in the Rio de Janeiro State. Production is shipped mainly to local Brazilian market including the ArcelorMittal Brasil integrated plants. The Compania Energética de Minas Gerais (CEMIG) supplies power through a 13,800 volt line from Mateus Leme, located 20 kilometers from the mine. The electricity is locally transformed into 380 volts by six transformers spread around the operation. Minas Itatiaucu (MIL) initiated mining operations at the property in 1946. In 2007, London Mining Brazil Mineracao Ltda (London Mining) purchased the mineral rights from MIL. Following the acquisition of the property from London Mining, ArcelorMittal has operated the mine since 2008. In the same year, London Mining Brazil Mineração Ltda was merged into London Mining Participaçoes Ltda, which changed its corporate name to ArcelorMittal Mineração Serra Azul. In April 2016, ArcelorMittal Mineração Serra Azul was merged into ArcelorMittal Brasil. In 2018, ArcelorMittal Brasil - Serra Azul Mine produced 1.3 million tonnes of lumps and concentrate.
In February 2019, the Company decided to implement the evacuation plan related to its dormant Serra Azul tailing dam in Brazil, evacuating the 119 person community situated downstream to the dam as a precautionary measure based on an updated stability report following recent incidents in the Brazilian mining sector in order to undertake further testing and implement any necessary mitigation measures.
Both the Andrade and Serra Azul mines are located in the Iron Quadrangle (Quadrilatero Ferrifero), a widely-explored and mined region. The mineralization occurs as Itabirites, banded hematite-silica rocks, with varying weathering degrees. While the Serra Azul ore reserve estimates are constituted of rich friable Itabirites requiring some beneficiation, the Andrade ore reserve estimates are dominated by directly shippable hematite ore. As from 2020 Andrade will enable concentrating Itabirite and hematite fines as described above.
ArcelorMittal Prijedor
ArcelorMittal Prijedor, located near Prijedor in the Republic of Srpska in Bosnia and Herzegovina, is an iron ore mining operation that is 51% owned by ArcelorMittal. ArcelorMittal Prijedor holds mineral rights over approximately 2,000 hectares, the current concession was signed in 2018 for a period of 6 years. The production process includes crushing, with hydro-cyclones and magnetic separation at the concentration plant. The plant is close to the mine site, and materials are transported through a conveyor. Power is supplied from the national grid through a local power distribution company. In 2018, ArcelorMittal Prijedor produced 1.4 million tonnes of aggregated lumps and fines.
The mine supplies iron ore to ArcelorMittal’s steel-making operations located approximately 243 kilometers south of Prijedor in northern Bosnia (Zenica). The operation is in close proximity to long-established public roads. Additionally, ArcelorMittal Prijedor has a limestone quarry for which the output is used for the roads in the mine.
In 1916, Austrian mining companies established the first industrial production of iron ore in the Prijedor area. The mines were nationalized in the 1950s, and were then owned by Iron Mines Ljubija Company until Mittal Steel acquired 51% of the company in 2004.
The Omarska deposit is composed of two ore bodies: Jezero and Buvac. The Jezero open pit began operating in 1983 and, following an interruption in production during the Bosnian civil war in the 1990s, production resumed in 2004.
However, since 2011, ore has only been produced at the Buvac pit, since the Jezero reserves were exhausted. The Buvac pit was opened in 2008 and is located within a carboniferous clastic and carbonates sediments containing iron mineralization in the form of beds concordant with host rocks or in the form of massive irregular blocks. The genesis of this deposit is attributed to hydrothermal replacement and syn-sedimentary processes. The Buvac ore body is mainly composed of limonite-goethite mineralization, which was formed during weathering oxidization of the primary siderite bodies.
104
ArcelorMittal Kryvyi Rih
ArcelorMittal Kryvyi Rih (“AMKR”) holds mineral rights to support its operations located roughly within the borders of the city of Kryvyi Rih, 150 kilometers southwest of Dnipro, Ukraine over 1,301 hectares. AMKR’s operations control all of the mineral rights and surface rights needed to mine and process its estimated iron ore reserves. AMKR operates a concentrating facility, along with two open pit sites and one underground iron ore mine. The iron ore deposits are located within the southern part of the Krivorozhsky iron-ore basin. Access to the mines is via public roads, which are connected by a paved highway to Dnipro. The area is well served by rail. Power is supplied by the Ukraine energy market and is generated from a mix of nuclear, hydro, renewables and coal-fired power stations. AMKR has two iron ore mines: an open pit mine feeding a concentration plant that produced 9.3 million tonnes of concentrate in 2018, known as the Kryvyi Rih open cast, and an underground mine with production of 0.9 million tonnes of lump and sinter feed in 2018, known as the Kryvyi Rih underground mine. Operations began at the Kryvyi Rih open cast in 1959 and at the Kryvyi Rih underground mine in 1933. ArcelorMittal acquired the operations in 2005.
The expiration of the agreements on the subsoil use conditions and the subsoil use permits range from 2021 for underground mine to 2038 for open pits, while the expiration of the land lease agreements ranges from 2060 to 2061.
The iron ore extracted from the Kryvyi Rih open cast is first processed at the mine site through primary crushing. After initial processing, the product is loaded on a rail-loading facility and transported to the concentrator. The concentrator production process includes crushing, classification, magnetic separation and filtering. The iron ore extracted from the Kryvyi Rih’s underground mine by a modified sub-level caving method is crushed on surface and transported by rail to the steel plant. The main consumer of the sinter and concentrate products is the ArcelorMittal Kryvyi Rih steel plant, with some concentrate being shipped to other ArcelorMittal affiliates in Eastern Europe, as well as to third parties. The iron mineralization is hosted by early Proterozoic rocks containing seven altered ferruginous quartzite strata with shale layers. The major iron ore bearing units in the open pit mines have carbonate-silicate-magnetite composition. In addition, oxidized quartzite is mined simultaneously with primary ore but cannot be processed at present and is stored separately for future possible processing. Only the magnetite mineralization is included in the 2018 open pit iron ore reserve estimates. The underground mine is hosted by a ferruginous quartzite with martite and jaspilite.
Lisakovsk, Kentobe, Atasu, Atansore (Temirtau Iron Ore)
ArcelorMittal Temirtau has four iron ore mining operations in Kazakhstan. The mines are Lisakovsk, Kentobe, Atasu and Atansore. Dispatch of ore from these mines to the ArcelorMittal steel plant is by railway. ArcelorMittal Termitau’s operations control all of the mineral rights and surface rights needed to mine and process its estimated 2018 iron ore reserves.
Lisakovsk is an open pit operation located in northwest Kazakhstan about 1,100 kilometers from Temirtau, with production of 0.7 million tonnes of concentrate in 2018. The mine was initially commissioned in 1969 and was acquired in 2000. The existing subsoil agreement expires in 2020. The production process comprises crushing, screening, grinding, wet jigging and wet magnetic separation. The iron mineralization at Lisakovsk occurs as oolite containing mainly hygogoethite and goethite. The phosphorous content in the mineralization limits its utilization in the steel-making process. At Lisakovsk, natural gas is supplied by KazTransGazAimak JSC and transmitted through the local grid. Electric power for the other facilities is supplied by Promsnab Astana LLP.
Kentobe is an open pit operation, initially started in 1983 and acquired in 2002, located about 300 kilometers southeast of Temirtau, with production of 0.6 million tonnes of concentrate in 2018. Clearance for extension of the existing subsoil agreement until the end of 2026 was given by Kazakhstan Ministry of innovation and development and the addendum was signed on November 23, 2017. Ore processing is performed by crushing and dry magnetic separation, producing coarse concentrate. The Kentobe mine is located in the Balkhash metallogenic province hosting numerous volcanic, sedimentary and hydrothermal deposits. The mineralization at Kentobe includes two types of iron ore: oxidized and primary magnetite. The magnetite mineralization constitutes all the 2018 estimated ore reserves. Electric power is supplied to the Kentobe operations by Karaganda Energosbyt LLP.
105
Atasu is an underground mine operation located about 400 kilometers south/southwest from Temirtau with production of 0.8 million tonnes of lump and fines in 2018. The mine began operating in 1956 with open pit exploitation of near surface reserves. Surface operations ended in 1980. Underground operations commenced in 1976. The mining lease was obtained in 2003. The existing subsoil agreement expires at the end of 2026. Processing comprises of crushing and wet jigging. The Atasu mine is hosted by the West Karazhal deposit, which is a primary hematite ore with associated manganese mineralization. Studies have indicated that the deposit could have a sedimentary-volcanogenic origin caused by underwater hydrothermal activity. The mine receives electric power from the ABB Energo LLP.
Atansore is an open pit operation located about 500 kilometers northeast of Temirtau with production of 0.5 million tonnes of concentrate in 2018. The mining lease was obtained in 2004. The existing subsoil agreement expires at the end of 2029. The Atansor deposit is located within skarn zones related to a volcanic intrusion that can be traced for more than 1.5 kilometers. The mineralization includes both martitic oxidized ore and primary magnetite ore. Ore processing is performed by crushing and dry magnetic separation. At the Atansore operations, electric power is provided from the Kokshetauenergo center LLP.
ArcelorMittal Liberia
ArcelorMittal Liberia Holdings Limited (“AMLH”), through its agent (and subsidiary) ArcelorMittal Liberia Limited (“AML”), has been mining ‘direct shipping ore, or DSO’ from the Mt. Tokadeh and Mt. Gangra deposits in northern Nimba, Liberia since June 2011. AML signed a Mineral Development Agreement (“MDA”) in 2005 with the Government of Liberia (“GOL”) that is valid for 25 years and renewable for an additional 25-year period. The MDA covers 51,651.5 hectares, and is located approximately 300 kilometers northeast of Monrovia, Liberia . Three deposits within the MDA are grouped under the name “Western Range Project”, which includes the Mt. Tokadeh, Mt. Gangra and Mt Yuelliton deposits. In addition to the rights to explore and mine iron ore, the GOL has granted the right to develop, use, operate and maintain the Buchanan to Yekepa railroad and the Buchanan port. A phased approach has been taken to establish the final project configuration. Currently only high grade ore reserves of oxidized iron ore (DSO) are mined. This ore only requires crushing and screening to make it suitable for export. The materials-handling operation consists of stockyards at both the mine and port areas, linked by a 250-kilometer single track railway running from Tokadeh to the port of Buchanan. Production in 2018 was at 4.6 million tonnes, focused on the Atlantic markets. The power for the current Liberia DSO operations is obtained from on-site diesel based power generation. The Company expects to switch to the grid supply in 2019.
Planning and construction of the project were commenced in 1960 by a group of Swedish companies, which ultimately became the Liberian American-Swedish Minerals Company (“LAMCO”), and production commenced on the Nimba deposit in 1963. Production reached a peak of 12 million metric tonnes in 1974 but subsequently declined due to market conditions. Production started at Mt. Tokadeh in 1985 to extend the life of the Nimba ore bodies to 1992 when operations ceased due to the Liberian civil war. In 2005, Mittal Steel won a bid to resume operations and signed the MDA with the GOL. Rehabilitation work on the railway started in 2008 and, in June 2011, ArcelorMittal started mining operations at Tokadeh, followed by a first shipment of iron ore in September 2011.
The Nimba Itabirites is a 250 to 450 meter thick recrystallized iron formation. Although the iron deposits at Mt. Tokadeh, Mt. Gangra and Mt Yuelliton fit the general definition of Itabirite as laminated metamorphosed oxide-facies iron formation, they are of lower iron grade than the ore previously mined at Mount Nimba. Tropical weathering has caused the decomposition of the rock forming minerals resulting in enrichment in the iron content that is sufficient to support a DSO operation.
Coal
ArcelorMittal Princeton
The ArcelorMittal Princeton (“AMP”) properties are located in McDowell County, West Virginia and Tazewell County, Virginia, approximately 30 miles west of the city of Princeton, West Virginia, where AMP’s corporate office is located. The properties consist of two operating areas: the Low Vol operations and the Mid Vol operations, which are situated south of U.S. Route 52. 138kV high-voltage power lines deliver power to the company's new 138/13kV substation where transformers reduce voltage for specific equipment requirements.
The Low Vol operations are located in McDowell County, West Virginia, near the communities of Northfork, Keystone, Eckman, Gary, and Welch. The Eckman Plant and Dan’s Branch Loadout are also located there, as well as the following underground mines: XMV Mine Nos. 35, 39, and 43. XMV Mine No. 32 was sold in 2017, and No. 42 was mined out and closed in 2018. The Red Hawk surface mine and Berwind Loadout finished primary reclamation in 2018.
106
The Mid Vol operations are in southeastern McDowell County, West Virginia and northwestern Tazewell County, Virginia. The nearest communities are Horsepen and Abbs Valley, Virginia as well as Anawalt, West Virginia.
The property has a long history of coal mining, mostly by predecessors in title to AMP. Significant underground mining of some of the deeper coal seams on the properties have occurred, notably the Pocahontas no. 3 and no. 4 seams. In addition, a substantial amount of the thicker coal outcrops have been previously contour mined, providing access for highwall mining and on-bench storage of excess spoil from future surface mining. AMP was created in 2008 when the Mid-Vol Coal Group and the Concept Mining Group were integrated. The properties are located in the Pocahontas Coalfields of the Central Appalachian Coal Basin. The Carboniferous age coal deposits are situated in the Pottsville Group, New River and Pocahontas Formations. The rock strata, including the coal deposits, are sedimentary rocks formed by alluvial, fluvial, and deltaic sediments deposited in a shallow, subsiding basin. The most common rock types are various types of sandstone and shale. Thecoal deposits are typically in relatively thin coal beds, one to five feet thick.
There are three active leases across the AMP operations which cover approximately 50% of the annual production. One of these expires in 2025 and the other two expire in 2027.
The combined production of the mines in 2018 was 2.1 million tonnes of washed and direct shippable coal.
ArcelorMittal Temirtau (Karaganda Coal Mines)
ArcelorMittal Temirtau has eight underground coal mines and two coal preparation plants (CPP “Vostochnaya” and Temirtau Washery-2). In 1996 the mines entered into the structure of Ispat-Karmet JSC, Coal Division (now ArcelorMittal Temirtau JSC, Coal Division). The coal mines of ArcelorMittal Temirtau are located in the Karaganda Coal Basin. The basin is more than 3,000 square kilometers and was formed by strata of Upper Devonian and Carbonic ages, Mesozoic and Cainozoic formations. Due to structural peculiarities, the coal basin is divided into three geology-based mining areas: Karagandinskiy, Sherubay-Nurinskiy and Tentekskiy.
The mines are located in an area with well-developed infrastructure around the regional center of Karaganda city. Within a distance of 10 to 60 kilometers are the following satellite towns: Shakhtinsk, Saran and Abay, as well as Shakhan and Aktas. All mines are connected to the main railway, and coal is transported by railway to the coal wash plants and power stations.
The Kostenko mine merged with the neighboring Stakhanovskaya mine in 1998. The field of Kostenko mine falls within the Oktyabrskiy district of Karaganda city.
The Kuzembaeva mine was established in 1998. The eastern part of the mine falls within the center of Karaganda City.
The Saranskaya mine began operations in 1955. It merged with the Sokurskaya mine in mid-1997 and the Aktasskaya mine in 1998. Karaganda City is located approximately 12 kilometers to the northeast.
The Abayskaya mine began operations in 1961. In 1996, it was merged with the Kalinina mine. Karaganda City is located approximately 30 kilometers to the northeast.
The Kazakhstanskaya mine began operations in 1969. Karaganda City is located approximately 40 kilometers to the northeast. The railway station at MPS-Karabas is located approximately 30 kilometers to the southeast.
The Lenina mine was put in operation in 1964 and
was
subsequently merged with Naklonnaya no. 1/2 mine in 1968.
Karaganda City, located 50 kilometers to the northeast. The railway station MPS-Karabas is located 38 kilometers to the southeast.
The Shakhtinskaya mine began operations in 1973. Karaganda City is located approximately 35 kilometers to the northeast.
The Tentekskaya mine began operations in
1979
. Karaganda City is located approximately 40 kilometers to the northeast
. The railway station MPS-Karabas is located approximately 39 kilometers to the southeast.
The Kostenko, Kuzembaeva, Saranskaya, Abayskaya, Kazakhstanskaya, Lenina, Shakhtinskaya and Tentekskaya mines, together with the Vostochnaya wash plant, receive energy from the high-voltage transmission lines of Karaganda.
The subsoil use contract and license (all coal mines in Temirtau) will be valid until January 21, 2022. Total area under mineral rights is 28,816 hectares.
107
The mines produce primarily coking coal used in steel-making at ArcelorMittal Temirtau as well as thermal coal for ArcelorMittal Temirtau’s power plants. For beneficiation of coking coal, two washeries are operated. Surplus coal is supplied to ArcelorMittal Kryvyi Rih in Ukraine, and to external customers in Russia and China. In 2018, the Karaganda Coal Mines produced 3.8 million tonnes of metallurgical coal and approximately 3.3 million tonnes was consumed by the Temirtau steel operations.
Capital expenditure projects
The Company’s capital expenditures were $3.3 billion, $2.8 billion and $2.4 billion for the years ended December 31, 2018, 2017 and 2016, respectively. The following tables summarize the Company’s principal investment projects involving significant capital expenditure completed in 2018 and those that are currently ongoing. In 2019, capital expenditures are expected to be approximately $4.3 billion.
ArcelorMittal expects to fund these capital expenditures primarily through internal sources.
See note 3.1 to the consolidated financial statements for further information, including capital expenditures by segment.
Completed projects in most recent quarters
|
Region
|
Site
|
Project
|
Capacity / particulars
|
Actual completion
|
Note #
|
|||||
|
Europe
|
ArcelorMittal Differdange (Luxembourg)
|
Modernization of finishing of "Grey rolling mill"
|
Revamp finishing to achieve full capacity of grey mill at 850 thousand tonnes/year
|
Q2 2018
|
|
|||||
|
Europe
|
Gent & Liège (Europe Flat automotive UHSS Program)
|
Gent: Upgrade HSM and new furnace Liège: Annealing line transformation
|
Increase approximately 400 thousand tonnes in Ultra High Strength Steel capabilities
|
Q2 2018
|
|
|||||
|
NAFTA
|
Indiana Harbor (US)
|
Indiana Harbor “footprint optimization project”
|
Restoration of 80” HSM and upgrades at Indiana Harbor finishing
|
4Q 2018
|
|
|||||
108
|
Ongoing
Projects
*
|
|
|||||||||
|
Region
|
Site
|
Project
|
Capacity / particulars
|
Forecast completion
|
Note #
|
|||||
|
ACIS
|
ArcelorMittal Kryvyi Rih (Ukraine)
|
New LF&CC 2&3
|
Facilities upgrade to switch from ingot to continuous caster route. Additional billets of 290 thousand tonnes over ingot route through yield increase
|
2019
|
|
|||||
|
Europe
|
Sosnowiec (Poland)
|
Modernization of Wire Rod Mill
|
Upgrade rolling technology improving the mix of HAV products and increase volume by 90 thousand tonnes
|
2019
|
|
|||||
|
NAFTA
|
Mexico
|
New Hot Strip Mill
|
Production capacity of 2.5 million tonnes per year
|
2020
|
1
|
|||||
|
NAFTA
|
ArcelorMittal Dofasco (Canada)
|
Hot Strip Mill Modernization
|
Replace existing three end of life coilers with two states of the art coilers and new runout tables.
|
2020
|
2
|
|||||
|
NAFTA
|
Burns Harbor (US)
|
New walking beam Furnaces
|
Two new walking beam reheat furnaces bringing benefits on productivity, quality and operational cost
|
2021
|
|
|||||
|
Brazil
|
ArcelorMittal Vega Do Sul
|
Expansion project
|
Increase hot dipped / cold rolled coil capacity and construction of a new 700 thousand tonnes continuous annealing line (CAL) and continuous galvanizing line (CGL) combiline
|
2021
|
3
|
|||||
|
Brazil
|
Juiz de Fora
|
Melt shop expansion
|
Increase in melt shop capacity by 0.2 million tonnes/year
|
On hold
|
4
|
|||||
|
Brazil
|
Monlevade
|
Sinter plant, blast furnace and melt shop
|
Increase in liquid steel capacity by 1.2 million tonnes/year;
|
On hold
|
4
|
|||||
|
Sinter feed capacity of 2.3 million tonnes/year
|
||||||||||
|
Mining
|
Liberia
|
Phase 2 expansion project
|
Increase production capacity to 15 million tonnes/year
|
Under review
|
5
|
|||||
* Ongoing projects refer to projects for which construction has begun (excluding various projects that are under development), even if such projects have been placed on hold pending improved operating conditions.
|
1
|
|
2
Investment in ArcelorMittal Dofasco (Canada) to modernize the hot strip mill. The project is to install two new state of the art coilers and runout tables to replace three end of life coilers. The strip cooling system will be upgraded and include innovative power cooling technology to improve product capability. The project is expected to be completed in 2020.
3
In August 2018, ArcelorMittal announced the resumption of the Vega Do Sul expansion to provide an additional 700 thousand tonnes of cold-rolled annealed and galvanized capacity to serve the growing domestic market. The three-year, $0.3 billion investment program to increase rolling capacity with construction of a new continuous annealing line and CGL combiline (and the option to add an approximately 100 thousand tonnes organic coating line to serve construction and appliance segments), and upon completion, will strengthen ArcelorMittal’s position in the fast growing automotive and industry markets through Advanced High Strength Steel products. The investments will look to facilitate a wide range of products and applications whilst further optimizing current ArcelorMittal Vega facilities to maximize site capacity and its competitiveness, considering comprehensive digital and automation technology.
4
During the second quarter of 2013, ArcelorMittal restarted its Monlevade expansion projects, which was initially expected to be completed in two phases, with the first phase focused mainly on downstream facilities consisting of a new wire rod mill with additional capacity of 1.05 million tonnes of coils per year and estimated investment of $280 million. The investment also included a rebar revamping in Juiz de Fora to increase rebar production from 50,000 to 400,000 tonnes per year replacing equivalent wire rod production capacity that would be transferred to Monlevade. The Monlevade wire rod expansion project was completed in the fourth quarter of 2015 and the Juiz de For a rebar revamping was concluded in the last quarter of 2014, each in line with its respective budget. The Company does not expect to increase shipments from Monlevade until domestic demand improves. The Juiz de Fora meltshop expansion project to increase meltshop capacity by 200,000 tonnes is currently on hold. A decision regarding the execution of the second phase of the projects (for upstream facilities) will be taken at a later date.
5
ArcelorMittal had previously announced a Phase 2 project that envisaged the construction of 15 million tonnes of concentrate sinter fines capacity and associated infrastructure. The Phase 2 project was initially delayed due to the declaration of force majeure by contractors in August 2014 due to the Ebola virus outbreak in West Africa, and then reassessed following rapid iron ore price declines over the ensuing period. ArcelorMittal Liberia is now undertaking the engineering phase of a feasibility study to identify the optimal concentration solution for utilizing the resources at Tokadeh. The feasibility study is expected to be completed by mid 2019.
In December 2006, the Government of Liberia and ArcelorMittal announced the finalization of a first amendment to agreements relating to an iron ore mining and infrastructure development project entered into in 2005. A further amendment to the 2006 Mineral Development Agreement was negotiated and ratified in September 2013. The project consists of reopening mines in Nimba County, rehabilitating 260 kilometers of abandoned railway, developing the Buchanan port for shipping traffic and includes a number of important social initiatives, including providing training and health facilities for employees.
109
Production of direct shipping ore ("DSO") commenced in the second half of 2011 which increased to a capacity of five million tonnes in 2013 and produced 4.3 million tonnes in 2015. Following a period of exploration cessation caused by the onset of Ebola, ArcelorMittal Liberia recommence drilling for DSO resource extensions in late 2015. Drilling for orebody extensions commenced and in 2016 the operation at Tokadeh was right sized to 2 to 3 million tonnes to focus on its natural Atlantic markets. ArcelorMittal Liberia moved ore extraction from its depleting DSO (direct shipping ore) deposit at Tokadeh to the nearby, lower impurity (DSO Gangra) deposit. In the second half of 2017, ArcelorMittal started DSO operations from the Gangra deposit, which has a lower strip ratio and higher grade DSO. Production in 2018 was 4.6 million tonnes, below the full annual rate capacity of 5 million tonnes.
Updates on previously announced investment projects
In addition to the significant investment projects presented in the above table, the Company had previously announced several large investment projects. The status of certain of such projects as of the date of this annual report on Form 20-F is described below. While the Company continues to study certain of its key previously announced investment projects summarized below, no assurance can be given that they will proceed.
India greenfield projects.
The Company explored investment opportunities in India and in June 2010, entered into a memorandum of understanding with authorities in the state of Karnataka in South India that envisaged the construction of a six million tonne steel plant with a captive 750 megawatt power plant, representing a potential aggregate investment of $6.5 billion. The Company has completed all the necessary formalities for acquiring the land by signing and executing a lease cum sale agreement for 2643.25 acres of land on December 26, 2018 and the project is currently under review.
Baffinland (Canada
). In March 2011, ArcelorMittal acquired 70% of Baffinland Iron Mines Corp. (“Baffinland”), with Nunavut Iron Ore Inc. (“Nunavut Iron Ore”) owning the remaining 30%. In February 2013, ArcelorMittal and Nunavut Iron Ore entered into a joint arrangement and equalized their shareholdings at 50/50. ArcelorMittal retained operator and marketing rights and, in consideration for its increased shareholding, Nunavut Iron Ore assumed certain project funding obligations. During 2016, 2017 and 2018, following part of the capital increases being subscribed only by Nunavut Iron Ore, ArcelorMittal’s shareholding decreased to 44.54%, 31.07% and 28.76%, respectively. The project began commercial production in 2016 (for further details, see “Item 4.D—Information on the Company—Property, plant and equipment”).
Baffinland also has approved Phase 3 of the project, which involves the construction of a railway to replace the existing truck-haul operation for transport of iron ore from Mary River to Milne Inlet, as well as expansion of mining, crushing and screening operations and port shiploading capacity. The objective of Phase 3 is to increase production capacity to 12 million tonnes per year. Baffinland has budgeted approximately $936.8 million of capital expenditures for Phase 3, which will be funded with operating cash flows, additional equity and new debt. Nunavut Iron Ore has committed to provide up to $450 million of equity funding for Phase 3. ArcelorMittal had an option to provide up to $85 million of equity funding for Phase 3 which will expire on March 31, 2019. ArcelorMittal had an option to convert preference shares by October 31, 2017 but this was not exercised, resulting in a subsequent dilution of ArcelorMittal’s shareholding. If Nunavut or other parties fund further phases, it would result in further dilution of ArcelorMittal’s shareholding. Since August 2016, ArcelorMittal and Nunavut Iron Ore shared operator rights for Baffinland’s operations. ArcelorMittal's shared operator rights terminated on June 30, 2018, but the Company will continue to retain marketing rights until December 31, 2019.
Investment projects relating to Ilva and ESIL are described in"Item 4.A—Information on the Company—History and development of the Company—Key transactions and events in 2018".
Reserves (iron ore and coal)
Introduction
ArcelorMittal has both iron ore and metallurgical coal reserves. The Company’s iron ore mining operations are located in the United States, Canada, Mexico, Brazil, Liberia, Bosnia, Ukraine and Kazakhstan. The Company’s metallurgical coal mining operations are located in the United States and Kazakhstan.
The estimates of proven and probable ore reserves
at the Company’s mines and projects and the estimates of the mine life included in this annual report have been prepared by ArcelorMittal experienced engineers and geologists,
with the exception of Las Truchas mine (consolidated as Mexico, excluding Peña Colorada in the tables below) where the 2017 and 2018 reserve estimates were prepared by Gustavson Associates.
All reserve estimates as of December 31, 2017 and 2018 were prepared in compliance with the requirements of SEC Industry Guide 7.
In Eastern Europe (Bosnia) and the CIS, ArcelorMittal has conducted in-house and independent reconciliations of ore reserve estimate classifications based on SEC Industry Guide 7
and standards used by the State Committee on Reserves, known as the GKZ, or its national equivalent, in the former Soviet Union countries. The GKZ, or its national equivalent, constitutes the legal framework for ore reserve reporting in former Soviet Union countries where ArcelorMittal operates mines.
110
On the basis of these reconciliations, ArcelorMittal’s ore reserves have been estimated by applying mine planning, technical and economic assessments defined as categories A, B and C1 according to the GKZ standards. In general, provided Guide 7’s economic criteria are met (which is the case here), A+B is equivalent to “proven” and C1 is equivalent to “probable”.
|
•
|
Reserves are the part of a mineral deposit that could be economically and legally extracted or produced at the time of the reserve determination.
|
|
•
|
Proven reserves are reserves for which (a) quantity is computed from dimensions revealed in outcrops, trenches, working or drill holes; grade and/or quality are computed from the results of detailed sampling; and (b) the sites for inspection, sampling and measurement are spaced so closely and the geologic character is so well defined that size, shape, depth and mineral content of reserves are well-established.
|
|
•
|
Probable reserves are reserves for which quantity and grade and/or quality are computed from information similar to that used for proven reserves, but the sites for inspection, sampling and measurement are farther apart or are otherwise less adequately spaced. The degree of assurance, although lower than that for proven reserves, is high enough to assume continuity between points of observation.
|
The demonstration of economic viability is established through the application of a life of mine plan for each operation or project providing a positive net present value on a cash-forward looking basis. Economic viability is demonstrated using forecasts of operating and capital costs based on historical performance, with forward adjustments based on planned process improvements, changes in production volumes and in fixed and variable proportions of costs, and forecasted fluctuations in costs of raw material, supplies, energy and wages.
Ore reserve estimates
are updated annually in order to reflect new geological information and current mine plan and business strategies. The Company’s reserve estimates are of in-place material after adjustments for mining depletion and mining losses and recoveries, with no adjustments made for metal losses due to processing.
For a description of risks relating to reserves and reserve estimates, see “Item 3.D—Key information—Risk factors—Risks related to ArcelorMittal—ArcelorMittal’s reserve estimates may materially differ from mineral quantities that it may be able to actually recover; ArcelorMittal’s estimates of mine life may prove inaccurate; and market price fluctuations and changes in operating and capital costs may render certain ore reserves uneconomical to mine”.
Detailed independent verifications of the methods and procedures used are conducted on a regular basis by external consultants and sites are reviewed on a rotating basis. The 2016 year end reserve estimates for the Kazakhstan coal operations were independently audited by SRK Consulting (UK) Limited who recommended the changes that have been implemented. SRK Consulting (UK) Limited also completed the 2017 year end independent audits of the reserve estimates for ArcelorMittal Princeton coal operations in the United States and for ArcelorMittal Kryvyi Rih iron ore operations in Ukraine and recommended certain changes that are reflected in the 2017 year end reserve estimates. In 2018, iron ore reserve estimates for ArcelorMittal Mines and Infrastructure Canada were independently audited and validated by SRK Consulting (Canada) Inc., and no material changes to the 2018 iron ore reserve estimates were recommended. Improvement points were proposed and will be addressed during 2019 with the support of SRK Consulting (Canada) Inc. This will be reflected in the 2019 year-end reserve estimates.
Furthermore, in 2018, after completing a new geological interpretation and model of the Andrade mine (Brazil), SRK Consultores do Brasil Ltda reviewed and validated all the mine planning components supporting the iron ore reserve estimates of Andrade mine.
ArcelorMittal owns less than 100% of certain mining operations; reserve
estimates have not been adjusted to reflect ownership interests and therefore reflect 100% of reserves
of each mine. Please see the table below for ArcelorMittal’s ownership interest in each mine. All of the reserves presented are estimates at December 31, 2018 (unless otherwise stated).
Mine life is derived from the life of mine plans and corresponds to the duration of the mine production scheduled from ore reserve estimates only.
The Company’s mineral leases are of sufficient duration (or convey a legal right to renew for sufficient duration) to enable all ore reserves on the leased properties to be mined in accordance with current production schedules. The Company’s ore reserves may include areas where some additional approvals remain outstanding but where, based on the technical investigations the Company carries out as part of its mine planning process and its knowledge and experience of the approvals process, the Company expects that such approvals will be obtained as part of the normal course of business and within the timeframe required by the current life of mine schedule.
The reported iron ore and coal reserves contained in this annual report do not exceed the quantities that the Company estimates could be extracted economically if future prices were at similar levels to the average contracted price for the three years ended December 31, 2018. The average iron ore spot reference price for the last three years (2016-2018) was $66.47 per tonne (delivered to China, Qingdao 62% Fe US $ per tonne, Metal Bulletin) duly adjusted for quality, Fe content, logistics
111
and other considerations. For the same period, the average coal spot reference price was $178.67 per tonne (Premium HCC FOB Aus, Metal Bulletin).
The Company establishes optimum design and future operating cut-off grade based on its forecast of commodity prices and operating and sustaining capital costs. The cut-off grade varies from operation to operation and during the life of each operation in order to optimize cash flow, return on investments and the sustainability of the mining operations. Such sustainability in turn depends on expected future operating and capital costs. The reserve base can vary from year to year due to the revision of mine plans in response to market and operational conditions, in particular market price.
See “Item 3.D—Key information—Risk factors—Risks related to ArcelorMittal—ArcelorMittal’s reserve estimates may materially differ from mineral quantities that it may be able to actually recover; ArcelorMittal’s estimates of mine life may prove inaccurate; and market price fluctuations and changes in operating and capital costs may render certain ore reserves uneconomical to mine”.
Tonnage and grade estimates are reported as ‘Run of Mine’. Tonnage is reported on a wet metric basis.
Iron ore reserve estimates
The table below details ArcelorMittal’s estimated iron ore reserves as of December 31, 2018. The classification of the iron ore reserve estimates as proven or probable reflects the variability in the mineralization at the selected cut-off grade, the mining selectivity and the production rate and ability of the operation to blend the different ore types that may occur within each deposit. At ArcelorMittal mining operations, proven iron ore reserve estimates are typically based on drill hole spacing ranging from 25m x 25m to 100m x 100m, and probable iron ore reserve estimates are based on drill hole spacing ranging from 50m x 50m to 300m x 300m.
|
As of December 31, 2018
|
As of December 31, 2017
|
|||||||||||||||||||
|
Proven Ore Reserves
|
Probable Ore Reserves
|
Total Ore Reserves
|
Total Ore Reserves
|
|||||||||||||||||
|
Millions of Tonnes
|
% Fe
|
Millions of Tonnes
|
% Fe
|
Millions of Tonnes
|
% Fe
|
Millions of Tonnes
|
% Fe
|
|||||||||||||
|
Canada
(1)
|
1,917
|
|
30.2
|
197
|
|
29.2
|
2,114
|
|
30.1
|
1,990
|
|
28.0
|
||||||||
|
Minorca - USA
|
97
|
|
23.5
|
4
|
|
22.7
|
101
|
|
23.5
|
110
|
|
23.7
|
||||||||
|
Hibbing - USA
|
134
|
|
19.6
|
25
|
|
19.6
|
159
|
|
19.6
|
182
|
|
19.6
|
||||||||
|
Mexico (Excluding Peña Colorada)
|
10
|
|
38.0
|
114
|
|
31.9
|
124
|
|
32.4
|
129
|
|
32.7
|
||||||||
|
Peña Colorada - Mexico
|
107
|
|
21.8
|
104
|
|
21.2
|
211
|
|
21.5
|
233
|
|
21.2
|
||||||||
|
Brazil
|
50
|
|
56.0
|
45
|
|
49.6
|
95
|
|
53.0
|
72
|
|
61.1
|
||||||||
|
Liberia
|
5
|
|
52.0
|
479
|
|
47.9
|
484
|
|
48.0
|
489
|
|
48.0
|
||||||||
|
Bosnia
|
3
|
|
45.4
|
11
|
|
46.3
|
14
|
|
46.1
|
17
|
|
46.2
|
||||||||
|
Ukraine Open Pit
|
51
|
|
33.5
|
78
|
|
33.5
|
129
|
|
33.5
|
151
|
|
33.7
|
||||||||
|
Ukraine Underground
|
9
|
|
54.4
|
19
|
|
54.4
|
28
|
|
54.4
|
29
|
|
54.4
|
||||||||
|
Kazakhstan Open Pit
|
5
|
|
48.8
|
255
|
|
39.2
|
260
|
|
39.4
|
265
|
|
39.2
|
||||||||
|
Kazakhstan Underground
|
—
|
|
—
|
23
|
|
45.2
|
23
|
|
45.4
|
24
|
|
45.2
|
||||||||
|
Total
|
3,742
|
|
33.1
|
3,691
|
|
32.0
|
||||||||||||||
1. Given the decrease in ArcelorMittal’s ownership in Baffinland and the termination of its operator rights, Baffinland is no longer included in this table.
112
Supplemental information on iron ore operations
The table below provides supplemental information on the producing mines.
|
Operations/Projects
|
% Ownership
|
In Operation Since
|
2018 Run of Mine Production
(Million Tonnes)* |
2018 Saleable Production
(Million Tonnes) 1 * |
Estimated Mine Life (Years)
2
|
|||||
|
Canada
|
85
|
1976
|
70.7
|
24.5
|
30
|
|||||
|
Minorca - USA
|
100
|
1977
|
8.6
|
2.8
|
12
|
|||||
|
Hibbing - USA
|
62
|
1976
|
29.2
|
7.8
|
6
|
|||||
|
Mexico (Excluding Peña Colorada)
|
100
|
1976
|
7.0
|
2.7
|
18
|
|||||
|
Peña Colorada - Mexico
|
50
|
1974
|
13.3
|
4.0
|
14
|
|||||
|
Brazil
|
100
|
1944
|
4.0
|
2.8
|
44
|
|||||
|
Liberia
|
85
|
2011
|
4.6
|
4.6
|
24
|
|||||
|
Bosnia
|
51
|
2008
|
1.9
|
1.4
|
7
|
|||||
|
Ukraine Open Pit
|
95
|
1959
|
22.3
|
9.3
|
5
|
|||||
|
Ukraine Underground
|
95
|
1933
|
0.9
|
0.9
|
19
|
|||||
|
Kazakhstan Open Pit
|
100
|
1976
|
3.0
|
1.8
|
>50
|
|||||
|
Kazakhstan Underground
|
100
|
1956
|
1.7
|
0.8
|
11
|
|||||
|
1
|
Saleable production is constituted of a mix of direct shipping ore, concentrate, pellet feed and pellet products which have an iron content of approximately 65% to 66%. Exceptions in 2018 included the shipping of ore produced in Bosnia, Ukraine Underground and the Kazakh mines which have an iron content ranging between approximately 50% to 60% and are solely for internal use at ArcelorMittal’s regional steel plants. The direct shipping ore produced from Liberia had an average iron content of approximately 62% in 2018 while the sinter fines produced for external customers in Brazil from the Serra Azul operations averaged approximately 64% and the lumps averaged 56%.
|
|
2
|
The estimated mine life reported in this table corresponds to the duration of the production schedule of each operation based on the 2018 year-end iron ore reserve estimates only. The production varies for each operation during the mine life and as a result the mine life is not the total reserve tonnage divided by the 2018 production. ArcelorMittal believes that the life of these operations will be maintained as exploration and engineering studies confirm the economic potential of the additional mineralization already known to exist in the vicinity of these iron ore reserve estimates.
|
* Represents 100% of production.
Changes in iron ore reserve estimates: 2018 versus 2017
The Company’s iron ore reserve estimates had a net increase of 51 million metric tonnes of Run of Mine and a 1% increase in iron ore content between December 31, 2017 and 2018. This increase in reserves includes an addition of 218 million metric tonnes, mainly attributed to new interpretations of the ore bodies at the Canada and Brazil operations. However, this was offset by 167 million tonnes of mining depletion during 2018.
Metallurgical Coal Reserve Estimates
The table below details ArcelorMittal’s estimated metallurgical coal reserves as of December 31, 2018. The classification of coal reserve estimates as proven or probable reflects the variability in the coal seams thickness and quality, the mining selectivity and the planned production rate for each deposit. Proven coal reserve estimates are based on drill hole spacing ranging from 50m x 50m to 500m x 500m, and probable coal reserve estimates are based on drill hole spacing ranging from 100m x100m to 1,000m x 1,000m.
The Ash (%), Sulfur (%) and Volatile (%) for Princeton - USA shown in the table above are the in-situ coal qualities, whereas the Ash (%), Sulfur (%) and Volatile (%) for Karaganda - Kazakhstan are Run of Mine coal qualities.
|
As of December 31, 2018
|
As of December 31, 2017
|
|||||||||||||||||||||
|
Proven Coal Reserves
|
Probable Coal Reserves
|
Total Coal Reserves
|
Total Coal Reserves
|
|||||||||||||||||||
|
ROM Millions of Tonnes
|
Wet Recoverable Million Tonnes
|
ROM Millions of Tonnes
|
Wet Recoverable Million Tonnes
|
ROM Millions of Tonnes
|
Wet Recoverable Million Tonnes
|
Ash
(%) |
Sulfur (%)
|
Volatile (%)
|
Millions of Tonnes
|
Wet Recoverable Million Tonnes
|
||||||||||||
|
Princeton - USA
|
71
|
45
|
23
|
11
|
94
|
56
|
5
|
0.7
|
17
|
88
|
56
|
|||||||||||
|
Karaganda - Kazakhstan
|
11
|
5
|
99
|
49
|
110
|
54
|
35
|
0.6
|
29
|
136
|
57
|
|||||||||||
|
Total
|
204
|
110
|
20
|
0.7
|
23
|
224
|
114
|
|||||||||||||||
113
A new reserve estimation for the Kazakhstan coal operations was completed in 2018, based on a preliminary 10 year mine plan, remodeled from first principle, as recommended in the 2016 SRK Consulting (UK) Limited independent audit report.
The table below provides supplemental information on the producing mines.
|
Operations/Projects
|
% Ownership
|
In Operation Since
|
2018 Run of Mine Production
(Million Tonnes) |
2018 Wet Recoverable production
(Million Tonnes) |
Estimated Mine Life (Years)
1
|
|||||
|
Princeton - USA
|
100
|
1995
|
3.4
|
2.1
|
35
|
|||||
|
Karaganda - Kazakhstan
|
100
|
1934
|
10.0
|
3.8
|
10
|
|||||
|
1
|
The estimated mine life reported in this table corresponds to the duration of the production schedule of each operation based on the 2018 year-end metallurgical coal reserve estimates only. The production varies for each operation during the mine life and as a result the mine life is not the total reserve tonnage divided by the 2018 production. ArcelorMittal believes that the life of these operations will be significantly expanded as exploration and engineering studies confirm the economic potential of the additional mineralization already known to exist in the vicinity of these estimated coal reserves.
|
Changes in Metallurgical Coal Reserve Estimates: 2018 versus 2017
The Company’s metallurgical coal reserve estimates had a net decrease of 20 million tonnes of Run of Mine coal and a decrease of 4 million tonnes of recoverable coal between December 31, 2017 and 2018. This decrease includes the annual mining depletion of 13 million tonnes Run of Mine and 16 million tonnes Run of Mine, at the Kazakhstan coal operations, primarily due to the new reserve estimation. However, this was offset by an increase of 9 million tonnes of Run of Mine coal at Princeton, primarily due to a reinterpretation of modifying factors. The additional recoverable coal at Princeton was due to infill drilling and improved modeling. The reporting of recoverable coal reserves from Kazakhstan excludes the recoverable coal which in theory could be used for metallurgical applications but which in practice is sold and used as thermal coal by ArcelorMittal at its steel plant facilities.
|
ITEM 4A.
|
UNRESOLVED STAFF COMMENTS
|
There are no unresolved comments received from the staff of the Securities and Exchange Commission regarding ArcelorMittal’s periodic reports under the United States Securities Exchange Act of 1934, as amended.
|
ITEM 5.
|
OPERATING AND FINANCIAL REVIEW AND PROSPECTS
|
Overview
ArcelorMittal is the world’s largest and most global steel producer and a significant producer of iron ore and coal, with production of
92.5 million
tonnes of crude steel and, from own mines,
58.5 million
tonnes of iron ore and
5.9 million
tonnes of coal in 2018, as compared to production of 93.1 million tonnes of crude steel and, from own mines, 57.4 million tonnes of iron ore and 6.3 million tonnes of coal in 2017. ArcelorMittal had sales of
$76.0 billion
and steel shipments of
83.9 million
tonnes for the year ended December 31, 2018 as compared to sales of $68.7 billion and steel shipments of 85.2 million tonnes for the year ended December 31, 2017. ArcelorMittal is the largest steel producer in North and South America, Europe and Africa, a significant steel producer in the CIS and has a smaller but growing presence in Asia. As of December 31, 2018, ArcelorMittal had approximately 209,000 employees.
ArcelorMittal produces a broad range of high-quality finished and semi-finished steel products. Specifically, ArcelorMittal produces flat products, including sheet and plate, and long products, including bars, rods and structural shapes. It also produces pipes and tubes for various applications. ArcelorMittal sells its products primarily in local markets and to a diverse range of customers in approximately 160 countries, including the automotive, appliance, engineering, construction and machinery industries. ArcelorMittal’s mining operations produce iron ore and coal for consumption at its steel-making facilities and also for sale commercially outside of the Group.
Key factors affecting results of operations
114
The steel industry, and the iron ore and coal mining industries, which provide its principal raw materials, have historically been highly cyclical. They are significantly affected by general economic conditions, consumption trends as well as by worldwide production capacity and fluctuations in international steel trade and tariffs. In particular, this is due to the cyclical nature of the automotive, construction, machinery and equipment and transportation industries that are the principal consumers of steel. A telling example of the industry cyclicality was the sharp downturn in 2008/2009 after several strong years, which was a result of the global economic crisis.
Weakness in North American and European markets has a significant impact on ArcelorMittal’s results, with these markets together accounting for over 60% of ArcelorMittal's deliveries in 2018. Historically, in 2012, the onset of the eurozone crisis caused underlying European steel demand to weaken and, coupled with significant destocking, apparent steel demand fell by over 10%. Since then, deliveries have increased in each of the past six years, rising almost 3% per annum, returning to the average demand levels seen during the period between 2000 to 2005. However, deliveries remain approximately 18% below the 2007 peak. Imports into the European Union (“EU”) have also risen more strongly than demand, more than doubling since 2012 to over 31 million tonnes in 2018, meaning domestic European deliveries have lost market share, impacting the ability of ArcelorMittal to serve one of its largest markets. Underlying steel demand in North America increased strongly post-crisis, but apparent demand has been impacted by inventory movements, with high inventory levels resulting in stockists purchasing over six million fewer tonnes in 2015, as compared to 2014, as they sought to reduce inventory levels as steel prices declined. This caused a 10% decline in apparent steel demand in 2015, which negatively impacted the Company’s deliveries and profitability. Apparent demand in the United States declined further in 2016 as inventories continued to decrease and demand for Oil and Country Tubular Goods (“OCTG”) was still very weak. The situation has since improved, with apparent steel demand growing over 6% year-on-year in 2017, due mainly to growth in pipes and tubes, demand for which was up around 85% year-on-year compared to only 2% growth in flat and a slight decline in longs. Apparent steel demand grew again in 2018 by an estimated 2% and 3% for flat and long products respectively, while demand for pipes and tubes declined slightly. Steel prices also recovered significantly in the United States in 2018, due to the imposition of 25% Section 232 tariffs in the United States, coupled with improving capacity utilization. With the United States expected to be enjoying the longest economic expansion on record by the middle of 2019, and given the frailty of the current global economic outlook, any new economic downturn, especially one having a major negative impact on developed markets, could significantly impact ArcelorMittal’s deliveries and profitability.
See
“Item 3.D—Key information—Risk factors—
Risks related to the global economy and the mining and steel industry.
”
Demand dynamics in China have also substantially affected the global steel business. Historically, after growing strongly since 2000, Chinese steel demand started to decline in 2015 because of weaker real estate sector construction and machinery production. This decline in domestic demand led to a surge in Chinese steel exports, which more than doubled between 2012 and 2015, increasing by over 56 million tonnes to 112 million tonnes in 2015. This increase in Chinese exports was greater than the growth in world ex-China steel demand over the same period, and had the effect of curtailing domestic production in countries outside of China. A rebound in domestic demand and the beginning of a capacity reduction plan in China in the second half of 2016 led to a decline in exports, by 14% year-on-year in the second half of 2016 and by 3% for the year as whole. While most exports were directed to Asia, and exports to the U.S. were reduced due to the impact of anti-dumping trade cases, a declining but still significant proportion were being directed toward ArcelorMittal’s core European markets in 2016. In particular, Chinese exports in 2015 were being sold at prices below cost (China Iron and Steel Association (CISA) reported CISA mills losing an accumulated RMB 65 billion ($10 billion) in 2015), negatively impacting prices and therefore margins in many regions. Chinese producers continued to accumulate losses until April 2016 when domestic and export prices rose sharply as domestic demand surprised producers on the upside, increasing capacity utilization. Since the second half of 2016, not only has demand continued to grow but significant capacity has been closed, consisting of over 150 million tonnes of legal blast furnace capacity and an estimated 120 million tonnes of illegal induction furnaces. This has led to a significantly higher capacity utilization rate, despite a 40 million tonnes reduction in exports over the past few years, translating into a much improved domestic spread of steel prices over raw material costs, and therefore higher export prices. Starting in October 2017, this situation combined with environmental policies which led to temporary capacity restrictions over the winter period, and caused even higher utilization rates in China and an even higher spread of steel prices over raw materials. Although prices have since fallen back as these temporary capacity restrictions were less strictly enforced in October 2018, utilization rates remain high and the risk of a renewed flood of Chinese exports has been reduced; it currently appears likely to occur again only if Chinese capacity were to increase and/or if Chinese demand were to weaken significantly. See “Item 3.D—Key information—Risk factors—Risks related to the global economy and the mining and steel industry—Excess capacity and oversupply in the steel industry and in the iron ore mining industry have in the past and may continue in the future to weigh on the profitability of steel producers, including ArcelorMittal.”
115
Unlike many commodities, steel is not completely fungible due to wide differences in its shape, chemical composition, quality, specifications and application, all of which affect sales prices. Accordingly, there is still limited exchange trading and uniform pricing of steel, whereas there is increasing trading of steel raw materials, particularly iron ore. Commodity spot prices can vary, which causes sale prices from exports to fluctuate as a function of the worldwide balance of supply and demand at the time sales are made.
ArcelorMittal’s sales are made based on shorter-term purchase orders as well as some longer-term contracts to certain industrial customers, particularly in the automotive industry. Steel price surcharges are often implemented on steel sold pursuant to long-term contracts to recover increases in input costs. However, spot market steel, iron ore and coal prices and short-term contracts are more driven by market conditions.
One of the principal factors affecting the Company’s operating profitability is the relationship between raw material prices and steel selling prices. Profitability depends in part on the extent to which steel selling prices exceed raw material prices, and specifically the extent to which changes in raw material prices are passed through to customers in steel selling prices. Complicating factors include the extent of the time lag between (a) the raw material price change and the steel selling price change and (b) the date of the raw material purchase and of the actual sale of the steel product in which the raw material was used (average cost basis). In recent periods, steel selling prices have tended to react quickly to changes in raw material prices, due in part to the tendency of distributors to increase purchases of steel products early in a rising cycle of raw material prices and to hold back from purchasing as raw material prices decline. With respect to (b), as average cost basis is used to determine the cost of the raw materials incorporated, inventories must first be worked through before a decrease in raw material prices translates into decreased operating costs. In some of ArcelorMittal’s segments, in particular Europe and NAFTA, there are several months between raw material purchases and sales of steel products incorporating those materials. Although this lag has been reduced recently by changes to the timing of pricing adjustments in iron ore contracts, it cannot be eliminated and exposes these segments’ margins to changes in steel selling prices in the interim (known as a “price-cost squeeze”). In addition, decreases in steel prices may outstrip decreases in raw material costs in absolute terms, as has occurred numerous times over the past few years, for example in the second quarter of 2013 and fourth quarters of 2015, 2016 and 2018.
The Company’s operating profitability has been particularly sensitive to fluctuations in raw material prices, which have become more volatile since the iron ore industry moved away from annual benchmark pricing to quarterly pricing in 2010. Volatility on steel margins aside, the results of the Company’s mining segment (which sells externally as well as internally) are also directly impacted by iron ore prices, which decreased significantly in 2015, ending the year at $40 per tonne ("/t") and averaging only $56/t. Iron ore prices rebounded from $40/t during December 2015 to an average of $52/t in the first half of 2016, increasing to an average of $64/t during the second half of the year for a yearly average of $58/t. The upward trend continued into the first quarter of 2017 with an average of $86/t, and then fluctuated between $60-75/t during most of the following two years, leading to an annual average of $71/t in 2017 and $69/t in 2018. Despite recent iron ore price weakness, iron ore prices in January 2019 averaged $76/t, at the top of the trading range for the last two years due to the strength of Chinese steel production. If iron ore prices were to decline from these levels due (among other things) to weaker global, and especially Chinese demand, this would negatively impact ArcelorMittal’s revenues and profitability.
See
“Item 3.D—Key information—Risk factors—
Risks related to the global economy and the mining and steel industry—Protracted low steel and iron ore prices would likely have an adverse effect on ArcelorMittal’s results of operations.
”
116
Economic environment
[1]
Global GDP growth peaked at 3% in both 2017 and 2018, and is now beginning to moderate as the recovery in trade and manufacturing activity loses steam. Despite ongoing negotiations, trade tensions among major economies remain elevated. These tensions, combined with concerns about softening global growth prospects, have weighed on investor sentiment and contributed to declines in global equity prices. Borrowing costs for emerging market and developing economies ("EMDEs") have increased, in part as major advanced-economy central banks continue to withdraw policy accommodations in varying degrees. A strengthening U.S. dollar, heightened financial market volatility, and rising risk premiums have intensified capital outflow and currency pressures in some large EMDEs, with some vulnerable countries experiencing substantial financial stress. Energy prices have fluctuated markedly, mainly due to supply factors, with sharp falls experienced towards the end of 2018.
U.S. growth in 2018 is estimated to have picked up to 2.9%, from 2.2% in 2017, mostly reflecting stronger than-expected domestic demand. Activity was bolstered by pro-cyclical fiscal stimulus and still-accommodative monetary policy. The labor market remains robust, with the unemployment rate near a 50-year low, which bolstered consumption. Labor productivity is showing signs of picking up. Nominal wage gains have been outpacing inflation, resulting in modest real wage growth. Long-term inflation expectations have edged up but remain stable. During 2018, the U.S. administration raised tariffs on about $300 billion worth of imports, mostly from China. As a result, other countries have retaliated with tariffs on about $150 billion worth of U.S. exports. In all, new tariffs have been imposed on about 12% of U.S. goods imports and may expand further, resulting in higher prices and elevated policy uncertainty.
See
“Item 4.B—Information on the Company—Business overview—Government regulations—Foreign trade” and “Item 3.D—Key information—Risk factors—
Risks related to the global economy and the mining and steel industry—Unfair trade practices in ArcelorMittal’s home markets could negatively affect steel prices and reduce ArcelorMittal’s profitability, while trade sanctions and barriers may have an adverse effect on ArcelorMittal’s operations in various markets.
”
EU GDP growth slowed notably from 2.6% in 2017 to 2% in 2018. Exports have softened, reflecting the earlier appreciation of the euro and slowing external demand. Inflation remains low despite declines in unemployment. The European Central Bank has stopped adding to its balance sheet, although it is expected to maintain its negative interest rate policy until at least mid-2019. Financial system lending and profitability have continued to increase, though some EU banks may be exposed to financial stress in some EMDEs. Across the euro area, fiscal policy is expected to be mildly expansionary. Increased German expenditures are expected to lead to smaller surpluses, while deficits in France and Italy are likely to rise amid public pressures for additional spending and tax relief. Italy’s borrowing costs have increased and remain volatile, reflecting uncertainties about the outlook of the country’s debt load.
Growth in China is estimated to have slowed from 6.9% in 2017 to a still robust 6.6% in 2018, supported by resilient consumption, although the trend in the fourth quarter of 2018 was down further. A rebound in private fixed investment helped offset a decline in public infrastructure and other state spending. However, industrial production and export growth have decelerated, reflecting easing global manufacturing activity. Import growth continued to outpace export growth, contributing to a shrinking current account surplus. Net capital outflows have resumed, and international reserves have been edging down. Stock prices and the Renminbi have experienced continued downward pressures, and sovereign bond spreads have risen amid ongoing trade tensions and concerns about the growth outlook. New regulations on commercial bank exposures to shadow financing, together with stricter provisions for off-budget borrowing by local governments, have slowed credit growth to the non-financial sector. However, in mid- and late 2018, the Chinese authorities reiterated their intention to pursue looser macroeconomic policies to counter the potential economic impact of trade disputes with the United States. Prices of newly constructed residential buildings have rebounded, including in Tier 1 cities, following several years of correction. Consumer price inflation has generally moved up since mid-2018, partly reflecting currency depreciation and higher energy and food prices in most of last year, but it remains below target.
________________________________________________________________________________________________
[1]
GDP and industrial production data and estimates sourced from Oxford Economics January 10, 2019.
117
Growth in Brazil was lackluster in 2018 at 1.2%, reflecting the country's emergence from a severe recession, a truckers’ strike mid-year and continued policy uncertainty. In Russia, growth was resilient at 1.6% in 2018, supported by private consumption and exports; however, momentum has slowed, reflecting policy uncertainty, recent oil price declines, and renewed pressures on currency and asset prices. In Turkey, growth slowed down to 2.9% (from 7.4% in 2017) due in part to substantial deterioration in foreign investor confidence. Growth in Argentina plummeted to 2.1% in 2018 (from 2.9% in 2017) following acute financial market stress that resulted in sharp currency depreciation and monetary policy tightening, which have led to Argentina being designated a hyper-inflationary economy. In South Africa, activity contracted in the first half of 2018 and, despite a recovery in the second half, growth remained subdued at 0.7% in 2018 (from 1.3% in 2017), reflecting challenges in mining production, low business confidence, and policy uncertainty.
Global apparent steel consumption (“ASC”) grew further in 2018 after a robust growth in 2017, compared to growth of just over 1% in 2016. Growth in 2018 reflected increases in demand in most markets with the notable exceptions of Mexico, South Africa, South Korea, Turkey and Venezuela. Overall, 2018 global ASC is estimated to have grown over 2.8% as Chinese demand was stronger than anticipated, growing approximately 3.5%, supported by the strength of machinery output and a better than expected real estate market. Elsewhere, world-ex-China ASC grew around 2.1% year-on-year, supported by strong growth in Indian sub-continent (7.5%), Latin America (4%), ASEAN (4%), Africa (3.5%) and EU28 (3%). Further regions grew more slowly including CIS (2%) and NAFTA (1%) where growth in the U.S. of almost 2% was offset by declining demand in Mexico. Demand growth in world ex-China was impacted by a sharp decline in Turkish steel demand (a 10% decrease) due to the crisis that hit the economy during the second half of 2018 and a slight decline in developed Asia (a 0.5% decrease).
Steel production
[2]
After reaching a peak of over 1.67 billion tonnes in 2014, world crude steel production declined by 3% in 2015 to 1.62 billion tonnes as output fell in every major steel producing market, except India. In 2016 global output grew marginally as Chinese output increased by under 4 million tonnes and World ex-China growth, which had fallen by 3.6% year-on-year in 2015, rising by 0.4% in 2016 due to higher output from developing countries such as India (+7.2%), Ukraine (+5.4%) and Turkey (+5.2%), although this was partially offset by lower output from South America (-8.4%), EU28 (-2.5%) and developed Asia (-0.6%).
However, over the past two years global steel production grew strongly rising 6.3% in 2017 to 1.73 billion tonnes in line with a strengthening global economy. In 2018, despite concerns about trade protectionism, global production grew a further 4.6% to a new peak of 1.81 billion tonnes. In 2018, China accounted for 52% of global steel production, East Asia 11%, EU28 9%, NAFTA 7%, India 6%, CIS 5% and the rest of the world 9%.
Chinese steel production data over the past few years has been subject to increased uncertainty due to under-reporting and the closure of illegal induction furnaces (IF) around mid-2017. Since IF production was mostly unrecorded in the official figures, as this production is moved to mills whose production is recorded officially, official production estimates are likely stronger than the actual production output as estimated by ArcelorMittal. Although the Company believes that the 2018 official steel production in China of 928 million tonnes is broadly accurate, ArcelorMittal believes that the growth rates recorded by the World Steel Association of 7.8% in 2017 and, to a lesser extent the 6.6% growth recorded in 2018, are higher than what occurred over this period.
_________________________________________________________________________________________________
[2]
Annual Global production data is for all 95 countries for which production data is published by the World Steel Association
118
World ex-China steel production has risen strongly since 2016 rising 4.8% in 2017 to 859 million tonnes and a further 2.5% in 2018 to 880 million tonnes. In 2017, production was supported by double-digit growth of over 10% year-on-year in Brazil, Egypt, Turkey and Vietnam. By major regions, 2017 production grew by 1.6% year-on-year in East Asia, 3.9% in EU28, 4.6% in North America, 6.3% in India, decreased by 1.2% in CIS and increased by 13.1% in the rest of the world. In contrast, production in 2018 increased by 1.0% in East Asia, decreased 0.3% in EU28, and increased 4.1% in North America, 4.9% in India, 0.3% in CIS and 5.7% in the rest of the world. Production in East Asia has returned to historic highs as intense competition from excess capacity in China has eased, supported by steady growth in global steel demand. Production growth in EU28 has been curtailed by increased import penetration despite continued demand growth and weakness in German steel production. Stronger production growth in North America has been driven by US fiscal stimulus and supported by increasing trade protectionism, initially focused on steel imports like the Section 232 tariffs. Continued growth in Indian steel production reflects continued industrialization supporting strong domestic steel consumption growth. Weakness in CIS steel production is due to persistent weakness in Ukrainian steel production (the 2018 production of 21 million tonnes is a third below the 2011 peak of 35 million tonnes), despite historically high Russian production of nearly 72 million tonnes in 2018. After rising 13.1% to a record 37.5 million tonnes in 2017, Turkish steel production fell slightly by 0.6% in 2018 due to a balance of payment crisis caused by excessive economic policy stimulus in 2017 and triggered by diplomatic tensions with the United States.
Steel prices
Flat products
Steel prices for flat products in Europe improved during the first quarter of 2016 compared to December 2015 levels. In Northern Europe, the price for hot rolled coil ("HRC") improved in the first quarter of 2016, with a similar trend in Southern Europe. The second quarter of 2016 saw a sharp increase in international steel prices, led by China, driving an average increase of approximately €84/t quarter-on-quarter in the North and €97/t in the South. The average HRC prices for the first half of 2016 were at €371/t in Northern Europe and €351/t in Southern Europe compared to the first half of 2015, in which average HRC prices were €405/t in the North and €394/t in the South. Steel prices continued to increase in the third quarter and fourth quarter of 2016.
Steel prices for flat products in Europe were stable in Southern Europe and on a slight upward trend in Northern Europe during the first quarter of 2017 compared to December 2016. Prices of HRC increased in Northern Europe by €69/t quarter-on-quarter and in Southern Europe by €63/t quarter-on-quarter. Prices weakened in the second quarter of 2017 with an average price decline of €47/t in Europe. The average HRC prices for the first half of 2017 were at €545/t in Northern Europe and €513/t in Southern Europe compared to the first half of 2016 as described above. Prices bottomed out in July 2017, thus the downtrend reversed during August and September 2017. In the third quarter of 2017, spot HRC prices in Northern Europe remained €5/t below the second quarter 2017 average, and in Southern Europe there was an average increase of €9/t quarter-on-quarter. There was little fluctuation in prices in the fourth quarter of 2017, with a quarter-on-quarter improvement of €22/t in Northern Europe and €11/t in Southern Europe. HRC prices during the second half of 2017 increased €65/t in Northern Europe and €67/t in Southern Europe compared to the second half of 2016.
In the first quarter of 2018, steel prices for flat products in Europe continued their steady upward trend which started in November 2017. HRC prices peaked towards the end of March at €574/t in Northern Europe. In Southern Europe, HRC prices increased from €519/t in January to €558/t at the beginning of March. In the second quarter of 2018, prices decreased sharply in USD terms following the international market trend. However, the depreciation of the euro against USD helped to sustain domestic HRC prices in euro terms, with a low of €561/t in Northern Europe at the beginning of June 2018, €14 below its peak in April 2018. In Southern Europe, HRC prices bottomed out at €514/t by mid-June 2018 from a peak of €544/t in April 2018. Average HRC prices were €564/t in Northern Europe and €538/t in Southern Europe for the first half of 2018, compared to €545/t in Northern Europe and €513/t in Southern Europe for the first half of 2017. The provisional safeguard measures and tariff rate quotas implemented in July 2018 did not create a tangible effect on market protection in Europe and there was very limited improvement in flat products prices during the third quarter of 2018. In Northern Europe HRC prices increased slightly in euro terms compared to the June level but only to reach a quarterly average of €566/t representing a €1/t decrease quarter-on-quarter, while in Southern Europe the price improvement averaged at €537/t representing a €7/t increase over the second quarter level. In USD terms, however, prices declined across the regions due to further euro depreciation against USD. Market seasonality, high inventory levels and imports pressured prices during the fourth quarter of 2018 and HRC prices declined in euro and USD terms both in Northern Europe by €18/t to €548/t and in Southern Europe by €38/t to €499/t compared to the third quarter 2018 average levels. Overall, the second half 2018 HRC prices averaged at €557/t in Northern Europe and at €518/t in Southern Europe, corresponding to a €30/t and €13/t year-on-year increase, respectively.
119
In the United States, spot HRC prices increased during the first quarter of 2016. The second quarter of 2016 had a strong start and continued to strengthen for a quarter-on-quarter improvement of approximately $184/t. The average HRC price for the first half of 2016 in the United States was $547/t as compared to an average of $541/t in the first half of 2015. The spot HRC prices in the United States started to decrease in July 2016 and continued this downward trend until October 2016. During the third quarter of 2016, the HRC price increased an average of $11/t quarter-on-quarter. The spot HRC prices in the United States reached a low at an average range of $526-552/t in October 2016, but then sharply increased toward the end of the year. In the fourth quarter of 2016, the spot HRC price in the United States decreased approximately $64/t quarter-on-quarter. The average spot HRC price in the second half of 2016 in the United States was $618/t compared to an average of $467/t in the second half of 2015.
In the United States, spot HRC prices increased during the first quarter of 2017 by an average of $106/t quarter-on-quarter. Price levels improved sharply during January, had stability during February and peaked at $725/t by end of March 2017, to reach their highest average level since September 2014. During the second quarter of 2017, HRC spot prices decreased $11/t quarter-on-quarter, with progressive declines until the first week of June 2017, but were followed by a price pickup, sustained by declining inventories and improved international market sentiment. The average HRC price in the United States during the first half of 2017 was $688/t compared to the first half of 2016 at $547/t. The HRC spot price slightly improved in July and August, and stabilized towards the end of the third quarter of 2017, increasing $4/t quarter-on-quarter. Slight declines were recorded during October, but prices picked up during November and December to reach $704/t by the end of 2017. The average prices during the fourth quarter of 2017 decreased $2/t quarter-on-quarter. Overall, in the second half of 2017 prices averaged at $686/t, representing a $68/t increase compared to the second half of 2016.
In the United States, as a consequence of the then-ongoing Section 232 national security investigation which started in April 2017 and the expectation of the imminent implementation of import tariffs on steel, spot HRC prices increased sharply during the first quarter of 2018. Before the release of the investigation report by the Department of Commerce on February 16, 2018, HRC prices reached $830/t from $723/t at the beginning of January 2018. After the release of the report that recommended tariffs in the range of 24 to 53%, prices spiked further to $936/t at the beginning of March 2018. The increase slowed down as 25% tariffs and exceptions went into effect during March 2018, closing the month at a high of $960/t. In the second quarter of 2018, HRC prices surpassed the $1,000/t level in the United States, peaking at $1,012/t by the end of June. The average HRC prices were $907/t for the first half of 2018 in the United States, as compared to $688/t for the first half of 2017, corresponding to a $219/t increase year-on-year. HRC prices hit a 10 year high of $1,014/t at the beginning of July 2018 in the United States. However, market seasonality and weakening of the international prices in the second part of the year coupled with an increase in the domestic capacity utilization rate (thus an increase in domestic supply), resulted in consistent price deterioration, with HRC prices falling to $799/t by the end of the year. Third quarter HRC prices averaged $982/t, still $2/t above the second quarter level, while average prices declined in the fourth quarter by $99/t quarter-on-quarter to $883/t. Overall, average HRC prices for the second half of 2018 were $932/t as compared to $686/t for the second half of 2017 corresponding to a $246/t increase year-on-year.
In China, spot HRC prices increased during the first quarter of 2017, compared to the average levels of the fourth quarter of 2016, fluctuating on an upward trend until the first part of February 2017, but deteriorated afterwards, in line with raw material basket cost decline. Domestic HRC prices increased during the first quarter of 2017 by an average of $35/t quarter-on-quarter. Prices continued to slide, hitting a bottom level of $374/t, VAT excluded by mid-May, followed however by a rapid recovery to a $439/t, VAT excluded average in June, supported by a new upward trend in raw materials cost, positive market sentiment and local mill interest to ramp up production and maximize profits. HRC spot prices decreased in the second quarter of 2017 on average by $62/t quarter-on-quarter. In the first half 2017, HRC domestic prices in China averaged $427/t, VAT excluded, compared to $317/t, VAT excluded, during the first half of 2016. HRC spot prices in China continued their steady increase in the beginning of September and increased for the third quarter of 2017 by $113/t quarter-on-quarter. The price increases slowed down during the fourth quarter of 2017 with an increase of $29/t quarter-on-quarter. HRC spot prices in China averaged $523/t, VAT excluded in the second half of 2017, an increase of $138/t, VAT excluded from the second half of 2016.
In China, spot HRC prices fluctuated during the first quarter of 2018, peaking at $562/t VAT excluded at the end of February, followed by a sharp decline due to weak demand and high inventories. HRC prices bottomed out at the end of March at $507/t VAT excluded. Production cuts in several regions and mill inspections to ensure compliance with pollution emission standards impacted supply during the second quarter of 2018. These measures supported HRC prices in China, which increased from $524/t VAT excluded at the beginning of April to a high of $581/t VAT excluded by mid-June. However, due to improvements in production levels and seasonal weak demand, HRC prices declined at the end of the month. HRC domestic prices averaged $555/t VAT excluded for the first half of 2018 in China, as compared to $427/t VAT excluded for the first half of 2017.
Despite the implementation of tough environmental controls and positive fiscal policies to expand domestic demand, production continued to increase, sustained by attractive margins, while consumption remained flat during the second half of 2018. This
120
resulted in further pressure on HRC prices in China, which declined by $15/t (during the third quarter 2018) as compared to the second quarter average level to $546/t VAT excluded and by an additional $58/t to $488/t VAT excluded during the fourth quarter of 2018.
HRC domestic prices averaged $517/t VAT excluded in China for the second half of 2018, representing a $7/t decline as compared to $524/t VAT excluded for the second half of 2017.
The following table presents the spot HRC average price range per tonne in Northern and Southern Europe, the United States and China on a quarterly basis from 2016 to 2018.
|
Flat products
|
||||
|
Source: Steel Business Briefing (SBB)
|
Northern Europe
|
Southern Europe
|
United States
|
China
|
|
Spot HRC average price per tonne
|
Spot HRC average price per tonne
|
Spot HRC average price per tonne
|
Spot HRC average price per tonne, VAT excluded
|
|
|
Q1 2016
|
€329
|
€303
|
$456
|
$282
|
|
Q2 2016
|
€413
|
€400
|
$639
|
$353
|
|
Q3 2016
|
€426
|
€402
|
$650
|
$348
|
|
Q4 2016
|
€498
|
€474
|
$586
|
$423
|
|
Q1 2017
|
€569
|
€537
|
$694
|
$458
|
|
Q2 2017
|
€521
|
€491
|
$682
|
$396
|
|
Q3 2017
|
€517
|
€500
|
$687
|
$509
|
|
Q4 2017
|
€538
|
€510
|
$685
|
$538
|
|
Q1 2018
|
€561
|
€545
|
$834
|
$549
|
|
Q2 2018
|
€567
|
€530
|
$980
|
$561
|
|
Q3 2018
|
€566
|
€537
|
$982
|
$546
|
|
Q4 2018
|
€548
|
€499
|
$883
|
$488
|
Long products
During the first quarter of 2016, long steel products saw a quarter-on-quarter price decline in Europe for both medium sections and rebar. This downward trend reversed during the second quarter of 2016. The average medium sections price for the first half of 2016 in Europe was €481/t compared to €521/t for the first half of 2015. The average rebar price in Europe for the first half of 2016 was €404/t compared to €420/t for the first half of 2015. Long steel product prices weakened again during the third quarter of 2016 for both medium sections and rebar. Prices reached a low in October 2016, and started recovering through year end, reaching an average of €511/t and €454/t in December 2016 for medium sections and rebar, respectively, although the quarterly average prices remained down quarter-on-quarter. The average medium sections price in Europe for the second half of 2016 was €499/t as compared to €498/t for the second half of 2015. The average rebar price in Europe for the second half of 2016 was €432/t as compared to €389/t for the second half of 2015.
Long steel product prices increased in Europe in the beginning of the first quarter of 2017, followed by a decline in mid-February, but with a recovery by the end of March. Prices then weakened during the second quarter of 2017 for both medium sections and rebars, but seemed to bottom out by the end of June with a quarter on quarter decline of €15/t and €22/t, respectively. The average price for medium sections in Europe during the first half of 2017 was €508/t compared to €481/t in the first half of 2016. The average rebar price in Europe during the first half of 2017 was €452/t compared to €404/t in the first half of 2016. Prices for long steel products were on a steady upward trend toward the end of the year. Medium sections prices increased €29/t quarter-on-quarter, while rebar prices increased €28/t quarter-on-quarter. During the fourth quarter of 2017, medium sections prices further increased €58/t quarter-on-quarter, while rebar prices increased €84/t quarter-on-quarter. The average medium sections price in Europe for the second half of 2017 was €557/t as compared to €499/t for the second half of 2016. The average rebar price in Europe for the second half of 2017 was €517/t as compared to €432/t for the second half of 2016.
Long steel product prices remained relatively stable in Europe in euro terms at the beginning of 2018 compared to the peak level in December 2017, but continued their upward trend in USD terms as the euro strengthened. Prices weakened from mid-February and towards the end of the first quarter 2018 with inventories reaching comfortable levels and a cautious market following the volatility in raw material costs. Medium sections prices declined from €625/t in January to €600/t by the end of March. Similarly, rebar prices declined from €568/t in January to €553/t in March. Prices remained stable again during April 2018 but followed a downward trend until mid-June when medium sections bottomed out at €585/t and rebar at €528/t. Average
121
medium sections prices were €603/t in Europe for the first half of 2018 as compared to an average of €508/t for the first half of 2017. Average rebar prices were €552/t in Europe for the first half of 2018 as compared to €452/t for the first half of 2017. Good market sentiment and strong demand supported an improvement of long product prices during the third quarter of 2018, with medium sections reaching €620/t and rebars €560/t by September corresponding to a €35/t and €32/t increase, respectively, as compared to the bottom level in June, and representing a quarter-on-quarter average improvement of €20/t for medium sections and €6 for rebars. Prices remained relatively stable during the fourth quarter of 2018 as compared to the levels at the end of September despite some weakening in rebars with a quarterly average of €538/t representing a €13/t decrease quarter-on-quarter. The average medium sections prices were €618/t in Europe for the second half of 2018 as compared to €557/t for the second half of 2017. The average rebar prices were €545/t in Europe for the second half of 2018 as compared to €517/t for the second half of 2017.
With respect to scrap prices, in Turkey, even though the average first quarter 2016 price of imported scrap HMS 1&2 at $194/t CFR showed a small improvement of about $6/t against the average of the fourth quarter 2015, the average price of March 2016 at $218/t CFR represented a month-on-month increase of about $40/t. The Turkish rebar export price followed a similar trend. The March 2016 export price of Turkish rebar increased $44/t month-on-month. This upward trend continued during the first two months of the second quarter of 2016 with the export rebar price from Turkey reaching an average range of $451-457/t FOB in April, and $472-479/t FOB in May. In June 2016, rebar prices reduced to an average range of $395-403/t FOB Turkey. The average rebar export price from Turkey in the first half of 2016 was $388/t FOB compared to the first half of 2015, which was at $451/t FOB. The third quarter of 2016 average export price for Turkish rebar decreased followed by improvements in the fourth quarter. The average rebar export price for the second half of 2016 from Turkey was $394/t FOB as compared to $361/t FOB for the second half of 2015.
In the first quarter of 2017, imported scrap HMS 1&2 in Turkey improved by $18/t compared to the fourth quarter of 2016 average of $275/t CFR. Rebar export prices followed closely the evolution of Turkey imported Scrap HMS 1&2, declining in the beginning of 2017 from $430/t FOB in December 2016 to close to an average of $390/t FOB by the end of January 2017, and continued fluctuating towards the end of March 2017. However, Turkish rebar export prices increased during the first quarter of 2017 by $14/t quarter-on quarter. The price fluctuation continued during the second quarter of 2017, but with an uptick towards the end of June with an overall increase of $4/t over the previous quarter. The average price in the first half of 2017 for rebar exported from Turkey was $425/t FOB compared to $388/t FOB in the first half of 2016. From July through the end of 2017, the Turkey rebar FOB price has been fluctuating on an upward trend, closely following HMS 1&2 Turkey CFR price evolution. After hitting a three-year high of $550/t FOB in the beginning of September 2017, rebar prices declined to $508/t FOB by October. This drove an increase in the average price range during the third quarter of 2017 by $80/t quarter-on-quarter. Toward the end of 2017, the Turkey rebar FOB export price reached $570/t, and further improved the quarterly average price by $20/t for the fourth quarter of 2017. The average Turkey rebar export price was $517/t FOB in the second half of 2017, an increase of $123/t compared to $394/t FOB for the second half of 2016.
In the first quarter of 2018, the price of imported scrap HMS 1&2 in Turkey improved by $40/t to an average level of $363/t CFR as compared to the fourth quarter of 2017. Rebar export prices followed closely the evolution of Turkey imported scrap HMS 1&2, declining from $573/t FOB at the beginning of January to $555/t FOB by the end of the month. Rebar export prices then increased to a peak of $590/t FOB by the end of February followed by a downward trend reaching $568/t FOB at the end of March. During the second quarter of 2018, the Turkish export rebar price continued to follow a downward trend alongside the scrap HMS 1&2 index, ranging between $565/t FOB at the beginning of April to $540/t FOB at the end of May. The average Turkish export rebar price for the first half of 2018 was $562/t FOB, as compared to $425/t FOB for the first half of 2017. With US and European markets blocked for Turkish exporters due to EU safeguard measures and doubling of the Section 232 import tariffs into the U.S., Turkish producers faced increased competition on alternative markets resulting in further pressure on export rebar prices during the first part of the third quarter. Prices seemed to bottom out mid-August at $523/t; however they continued to deteriorate during October to a $500/t level. After a small uptick in November supported by an improvement in scrap prices as well as a strengthening of the Turkish Lira, Turkish export rebar prices dropped by the end of the fourth quarter of 2018 to $455/t, the lowest level since July 2017.
The average Turkish export rebar price for the second half of 2018 was $507/t FOB, as compared to $518/t FOB for the second half of 2017.
122
|
Long products
|
|||
|
Source: Steel Business Briefing (SBB)
|
Europe medium sections
|
Europe rebar
|
Turkish rebar
|
|
Spot average price per tonne
|
Spot average price per tonne
|
Spot FOB average price per tonne
|
|
|
Q1 2016
|
€454
|
€355
|
$335
|
|
Q2 2016
|
€509
|
€453
|
$442
|
|
Q3 2016
|
€511
|
€440
|
$379
|
|
Q4 2016
|
€488
|
€424
|
$409
|
|
Q1 2017
|
€515
|
€463
|
$424
|
|
Q2 2017
|
€501
|
€441
|
$427
|
|
Q3 2017
|
€530
|
€469
|
$507
|
|
Q4 2017
|
€587
|
€553
|
$527
|
|
Q1 2018
|
€614
|
€558
|
$572
|
|
Q2 2018
|
€591
|
€545
|
$552
|
|
Q3 2018
|
€611
|
€551
|
$524
|
|
Q4 2018
|
€626
|
€538
|
$490
|
Current and anticipated trends in steel production and prices
In China, in 2018, ArcelorMittal believes steel production grew approximately 2.5% (despite the 6.6% increase in official figures - see discussion in "—Steel production" above) as demand grew over 3%, yet exports declined by 8%. However, the Company expects production to be stable to slightly down in 2019 as domestic demand contracts around 1% offset by marginally higher exports. The Chinese HRC spread (difference between raw material costs and finished steel prices) in 2017 increased from approximately $150/t in the first half of 2017 to $250/t in the second half supported by an elevated crude steel utilization rate mainly due to a structural steel capacity cut and the winter heating season policy, which temporarily restricted steel supply. The high Chinese HRC spread was sustained at around $255/t in the first quarter of 2018 and increased to approximately $280/t by the middle of the year supported by an elevated crude steel utilization rate as demand was strong but capacity constrained. The spread fell from October until the end of the year to the level of $190-$195/t due to a lower winter capacity constraint compared to last year and negative sentiment on demand. The low spread has continued into the beginning of 2019, but is expected to pick up from March/April when the demand as well as positive sentiment comes back to the market.
Led by a significant increase in pipe and tube demand, U.S. ASC increased around 6% in 2017, which combined with imports relatively stable at a high level, allowed domestic production to increase as some capacity came back online. ASC increased again in 2018 by almost 2%, and with imports falling by around 10% due to the impact of the 25% Section 232 tariffs, production increased by 6.2%. The Company anticipates a small (1 to 2%) further increase in steel demand in 2019, but with imports continuing to be capped by tariffs, steel production is expected to grow at a slightly stronger rate than demand. In the EU, steel demand continues to grow slowly but imports have taken a larger share of demand over the past couple of years. While European mills output improved in 2017, crude steel output was at best only stable in 2018 (decreasing by 0.4% year-on-year) despite a 3% growth in ASC, as imports (especially longs) continued to take market share, growing over 10% year-on-year. In 2019, the Company expects much slower growth in steel consumption, which is why the safeguards measures on steel trade are important to enable European mills to benefit from any improvement in demand.
Overall, ArcelorMittal expects world ex-China ASC to grow again in 2019 due to strong demand growth in South American and developing Asian markets and the waning negative impact of declining Turkish steel demand, despite slightly slower growth in developed markets. Continued capacity restraint and relatively stable production in China, together with continued growth in demand in world ex-China should lead to a gradual improvement in utilization and support the spread of steel prices over raw material costs.
Raw materials
The primary raw material inputs for a steelmaker are iron ore, coking coal, solid fuels, metallics (e.g., scrap), alloys, electricity, natural gas and base metals. ArcelorMittal is exposed to price volatility in each of these raw materials with respect to its purchases in the spot market and under its long-term supply contracts. In the longer term, demand for raw materials is expected to continue to correlate closely with the steel market, with prices fluctuating according to supply and demand dynamics. Since most of the minerals used in the steel-making process are finite resources, they may also rise in response to
123
any perceived scarcity of remaining accessible supplies, combined with the evolution of the pipeline of new exploration projects to replace depleted resources.
Throughout 2016, raw material prices became increasingly volatile and impacted by short-term changes in sentiment, mainly related to Chinese market demand sentiment for crude steel and how the government might deal with excess steelmaking capacity. Iron ore and coking coal prices increased by 5.1% and 58.2% year-on-year respectively in 2016 (Metal Bulletin 2016 vs. 2015). The increase in the average reference iron ore and hard coking coal price continued in 2017 due to the impact of induction furnaces capacities closures since 2016. In 2017, iron ore and coking coal prices increased by 22.3% and 31.5% year-on-year respectively (Metal Bulletin 2017 vs. 2016). In 2018, strong steel production in China amid its fight against air pollution and overcapacity kept iron ore and coking coal prices at elevated levels and boosted prices for high-grade qualities as steel mills chased productivity. Though prices for the most common qualities of iron ore decreased 2.2% year-on-year in 2018, the high-grade qualities of iron ore posted a price increase on an annual basis. Coking coal prices increased 10.3% compared to 2017 (Metal Bulletin 2018 vs. 2017).
As for pricing mechanisms, since 2012, quarterly and monthly pricing systems have been the main type of contract pricing mechanisms, but spot purchases also appear to have gained a greater share as steelmakers have developed strategies to benefit from increasing spot market liquidity and volatility. In 2016, 2017 and 2018, the trend for using shorter-term pricing cycles continued. Pricing is generally linked to market price indexes and uses a variety of mechanisms, including current spot prices and average prices over specified periods. Therefore, there may not be a direct correlation between market reference prices and actual selling prices in various regions at a given time.
Iron
ore
After reaching $39.50/t (delivered to China Metal Bulletin Index 62% Fe) on January 13, 2016 and averaging $48.70/t for first quarter of 2016, iron ore market reference prices reached a low during the first quarter of 2016. During the second quarter of 2016, the average price was $55.50/t and the period was marked by high volatility, with a peak at $70.50/t on April 21, 2016 and a low of $48.18/t on June 2, 2016. For the third quarter of 2016, the average was $58.40/t with a slight downward trend throughout September. During the fourth quarter of 2016, it increased from a minimum of $55.86/t on October 4, 2016 and reached a maximum of $83.58/t on December 12, 2016, the average for the fourth quarter was of $70.50/t and was marked by high volatility and bullish market sentiment driven by higher steel prices as well as closure announcements by the Chinese authorities in steelmaking based on obsolete induction furnaces using mostly scrap as raw materials.
Iron ore prices recovered to $85.60/t in the first quarter of 2017 following strong demand for steel after the Chinese New Year. The average price for the second quarter of 2017 decreased to $62.90/t; this downward trend was influenced by increased inventory levels at Chinese ports. In the third quarter of 2017, the average price increased to $71.20/t driven by bullish sentiment in the steel market reflected in strong steel PMIs (Purchasing Manager Index) for China. During the fourth quarter of 2017, the price varied from a minimum of $58.52/t on October 31, 2017 and a maximum of $76.36/t December 22, 2017, with the average for the fourth quarter at $65.50/t. The quarter was marked by high volatility driven by environmental regulation announcements by the Chinese authorities to constrain emissions and steel production during the 2017-2018 winter period.
In t
he first quarter of 2018 iron ore prices recovered at $74.39/t, up 13.6% compared to the fourth quarter of 2017. However, great price disparities were observed. Seaborne iron ore demand was hit by a persistent weakness in downstream steel demand, the trade war developing between China and the U.S. and the extension of winter restrictions in China beyond March 15, 2018 all of which had a significant impact. In March, prices plummeted from the highest quarter price of $79.39/t in the beginning of the month to $64.99/t at the end of the month (Metal Bulletin 2017 & 2018). In the second quarter of 2018, prices decreased and remained stable at an average $65.30/t despite strong steel demand over the period. China iron ore port stocks remained high and concentrate production sharply decreased year-over-year as a result of mine inspections. However, steel PMI remained in expansion at 51.6 points in June. In the third quarter, prices were fairly stable, averaging $66.8/t. Low prices on the seaborne market found support in the fear of an intensification of the trade war between China and the U.S., depreciation of the Chinese currency, low future prices and environmental restriction in China. The last quarter of 2018 saw the iron ore price jumping and averaging $71.6/t. It reached $76.75/t on November 12, 2018 amid strong steel margins depleting stocks at Chinese ports and restocking demand in China before the start of the winter period. Also, the derailment of a BHP train carrying iron ore in Australia in the beginning of November provided some short-term support to the iron ore price that boosted the November average. However, prices dropped at the end of November, and in the beginning of December, mills corrected for weak off-season demand and reduced steel margins due to less stringent winter restrictions, which led to prices at the end of 2018 at $72.70/t.
124
Coking coal
In 2016, the spot price (Metal Bulletin Premium Hard Coking Coal FOB Australia index) traded on average at $78.90/t in the first quarter with the market contract price (price settled between major steel producers and suppliers) settling at $81/t for the same quarter; then the second quarter of 2016 had a contract settlement fixed at $84/t with the spot average for that quarter at $90.40/t while the third quarter had a market contract price settled at $92.50/t and the spot index traded between $90.20/t and $94.80/t for the first 15 days but averaged $131.50/t for the third quarter. During the fourth quarter of 2016, the spot price reached a maximum of $308.80/t on November 11, 2016 and decreased through the closing of the year to $231/t on December 30, 2016. The average spot price for the fourth quarter of 2016 was $265.80/t with quarterly market contract prices settled at $200/t. The highly volatile spot index over the second half of 2016 was influenced by the Chinese domestic supply reduction (originating from weather/logistic issues combined with regulations issued by the Chinese government on lower mining working days, from an annual rate of 330 days per year to a lower rate at 276 days, with temporary relief as described above) as well as several maintenance and mining operational issues in Australian coking coal mines during that period. Consequently, the premium HCC FOB Australia quarterly market contract price was settled at $200/t for the fourth quarter of 2016 and at $285/t for the first quarter of 2017.
In the first quarter of 2017, the spot prices (Metal Bulletin Premium Hard Coking Coal FOB Australia index) sharply dropped from $266.50/t in December 2016 (monthly average) to $155.20/t in March 2017 (monthly average) with the average spot price for the first quarter at $166.80/t. The temporary relief of the Chinese working days restriction and fully recovered supply from Australia, as well as expected additional seaborne supply from North America
allowed such a sharp drop in prices by the end of the first quarter of 2017. At the beginning of the second quarter of 2017, the cyclone Debbie that unexpectedly hit Australia caused supply disruptions and spot prices spiked. The upward trend of April up to $300/t on April 18, 2017 and a monthly average of $257.80/t was followed by the downward trend in May and June as the Australia mining-rail-port system recovered earlier than expected from the cyclone disruption. The spot price decreased through the second quarter to $175/t in May (monthly average) and $145/t in June 2017 (monthly average), leading to an average spot price for the second quarter of 2017 of $190.60/t.
For the second quarter of 2017, a new index-based methodology was adopted for the premium HCC FOB Australia quarterly contract price between some Japanese steel makers and Australian HCC suppliers. In the third quarter of 2017, the average spot price (Metal Bulletin Premium Hard Coking Coal FOB Australia index) increased to $188.30/t driven by bullish sentiment in the steel market and strong steel PMIs for China. In the fourth quarter, supported by the port congestion in Australia, the price further increased to $203.50/t.
Coking coal prices entered 2018 as a bullish market with record high vessel queues at a key port in Queensland, Australia and Chinese restocking demand high ahead of the Chinese New Year holiday. The spot prices (Metal Bulletin Premium Hard Coking Coal FOB Australia index) averaged $228/t in the first quarter of 2018 increasing 36.8% year-on-year and 12.2% as compared to the fourth quarter of 2017. The elevated prices were then corrected in the second quarter and reached $189/t (quarterly average) due to the extension of Chinese winter restrictions until April and delayed increase of steel demand in China. However, the downward movement was limited by a continued threat of supply disruptions due to Aurizon’s announced change in the maintenance plan at its rail system in Australia, and safety check at Chinese mines. The price also found support from Chinese coke prices as domestic coke producers faced environmental crackdowns. In the third quarter, coking coal prices averaged $184/t and $183/t in July and August respectively with no major supply disruption and less demand during Indian monsoon season. The prices rose again in September to $198/t with demand from strong steel production in China amid healthy margins and tight supply of low-Sulphur coking coal in the Chinese domestic market. Prices kept on increasing in the last quarter on the back of strong steel production and threat of supply issues from scheduled maintenance at key Australian ports which increased port queues again to the record levels seen at the end of 2017. The bullish sentiment found support from the breakout of a fire at one Australian mine, rendering it idle for at least six months. The coking coal spot prices increased to a quarterly average of $221/t in the fourth quarter of 2018.
ArcelorMittal has continued to leverage its iron ore and coking coal supply chain and diversified supply portfolio as well as the flexibility provided by contractual terms to mitigate regional supply disruptions and also mitigate part of the market price volatility.
125
|
|
|
|
|
|
Iron ore
|
Coking coal
|
|
Source: Metal Bulletin
|
average price per tonne (Delivered to China, Metal Bulletin index, 62% Fe)
|
average price per tonne (Premium Hard Coking Coal FOB Australia index)
|
|
Q1 2016
|
48.6
|
79
|
|
Q2 2016
|
55.5
|
90
|
|
Q3 2016
|
58.3
|
131
|
|
Q4 2016
|
70.5
|
266
|
|
|
|
|
|
Q1 2017
|
85.6
|
167
|
|
Q2 2017
|
62.9
|
191
|
|
Q3 2017
|
71.2
|
188
|
|
Q4 2017
|
65.5
|
203
|
|
|
|
|
|
Q1 2018
|
74.4
|
228
|
|
Q2 2018
|
65.5
|
189
|
|
Q3 2018
|
66.9
|
188
|
|
Q4 2018
|
71.5
|
221
|
Scrap
Both Eurofer and German Wirtschaftsvereinigung (“WV”) indexes were discontinued as of January 1, 2016. The German suppliers’ index (“BDSV”) is now used and converted into Delivered at Place (“DAP”), in order to be comparable with historical figures.
During 2018, the German suppliers' index “BDSV” for reference grade E3 was quite stable starting in January 2018 at €290.58/t and reached a yearly maximum of €293.98/t in March 2018. The index dropped continuously until December 2018 down to €279.99/t as Turkey’s requirements for EU scrap decreased at the end of 2018. HMS 1&2 North Europe followed a similar trend starting in January 2018 at €294/t and reached a yearly high of €297/t in March 2018. Unlike the German BDSV index, there were up and down movements from April throughout the rest of the year but the general trend remained down and the HMS 1&2 North Europe ended the year at €238/t in December 2018. European scrap price parity with exports continues. The European E3 price moved following HMS and exchange rate fluctuation. The European E3 price was $4/t below, $4/t above, $8/t above and $8/t below HMS in the first, second, third and fourth quarter of 2018, respectively, but the European E3 price and HMS were at the same average levels in 2018.
Turkey remained the main scrap buying country in the international market in 2018, with approximately 69% of its steel production based on the EAF process, with the other 31% through the blast furnace route, similar to its production in 2017. In 2016, the percentage of Turkey’s steel production through the EAF process and blast furnaces was 66% and 34% respectively. Steel production in Turkey stagnated in 2018 at the same level as 2017 after a 15% increase in 2017 as compared to 2016 and a 5.2% increase in 2016 as compared to 2015. There was a significant reduction of imported billets, which dropped by 46% in 2018 as compared to 2017, following a 50.1% decrease in 2017 as compared to 2016 and a 1.4% increase in 2016 as compared to 2015. As Turkish scrap import volumes increased in 2018 as compared to 2017 at 21 million tonnes, the decrease in billet imports was compensated by local scrap which increased by 7% year-on-year. In 2017, scrap imports into Turkey increased by 19% compared to 2016, with scrap imports totaling 17.7 million tonnes representing an 8.6% increase as compared to the same period in 2015.
In the domestic US market, average scrap prices increased by 20% or $53/t in 2018 as compared to a $61/t increase in 2017, which represented a 29% increase as compared to 2016. The Midwest Index for HMS 1 increased from an average of 208$/t in 2016 to $269/t in 2017 and $322/t in 2018. On the export market, East Coast FOB average prices increased by $40/t from $280/t in 2017 to $320/t in 2018.
126
Ferro alloys and base metals
Ferro alloys
The underlying price driver for manganese alloys is the price of manganese ore which was at the level of $7.16 per dry metric tonne unit (“dmt”) (for 44% lump ore) on Cost, Insurance and Freight (“CIF”) China for 2018, representing a 20% increase from $5.97/dmt in 2017 ($4.30/dmt in 2016) mainly due to sustained demand of manganese ore from China, reflecting appetite showed by manganese alloys producers.
The prices of high carbon ferro manganese decreased by 7% from $1,428/t in 2017 to $1,330/t in 2018 ($960/t in 2016). Prices of silicon manganese decreased by 8% from $1,343/t in 2017 to $1,235/t in 2018 ($992/t for 2016). Finally, prices for medium carbon ferro manganese stagnated (+1%) in 2018 at $1,930/t as compared to $1,910/t in 2017 ($1,376/t for 2016).
Base metals
Base metals used by ArcelorMittal are zinc, tin and aluminum for coating, aluminum for deoxidization of liquid steel and nickel for producing stainless or special steels. ArcelorMittal partially hedges its exposure to its base metal inputs in accordance with its risk management policies.
The average price of zinc for 2018 was $2,926/t, representing a 1% increase as compared to the 2017 average of $2,896/t (the 2016 average was $2,095/t). Stocks registered at the London Metal Exchange (“LME”) warehouses stood at 129,325 tonnes as of December 31, 2018, representing a 29% decrease compared to December 31, 2017 when registered stocks stood at 182,050 tonnes (427,850 tonnes in 2016).
The average price of tin for 2018 was $20,167/t, slightly above the 2017 average of $20,098/t (the 2016 average was $18,006/t).
The average price of aluminum for 2018 was $2,110/t, representing a 7% increase compared to the 2017 average of $1,968/t (the 2016 average was $1,605/t).
The average price of nickel for 2018 was $13,118/t, representing an 26% increase compared to the 2017 average of $10,407/t (the 2016 average was $9,609/t).
Energy market
Solid fuels, electricity and natural gas are some of the primary raw material inputs for a steelmaker. ArcelorMittal is exposed to price volatility in each of these raw materials with respect to its purchases in the spot market and under its long-term supply contracts. Since most of the minerals used in the steel-making process are finite resources, they may also rise in response to any perceived scarcity of remaining accessible supplies, combined with the evolution of the pipeline of new exploration projects to replace depleted resources.
Oil
In a year which was defined by political turmoil, the global oil market went from a tightening of the supply/demand balance to the prospect of a supply surplus. This came amid the general fear of an economic slowdown beyond 2018 as an intensifying tariff war between the world’s biggest economies could dent global demand growth combined with record high shale oil output from the U.S.
In the first quarter of 2016, after tumbling for six quarters in a row, the Brent crude oil price came to a halt just south of $30/barrel (“bbl”). In the following six months, prices climbed back up to levels around $50/bbl. A group of producers led by OPEC (the Organization of the Petroleum Exporting Countries) and Russia agreed at the end of 2016 to cut production and cap output at 1.8 million barrels per day (“bpd”). Initially, the cuts were to last for only six months but got extended in May 2017 and again in November 2017. As a result, in the summer of 2017, the momentum shifted and prices gained 75% year-on-year from $45/bbl in May 2017 to $80/bbl in May 2018. In June 2018, OPEC and its allies decided to increase production by 1 million bpd. This came at a time when the U.S. had just pulled out of the Iran nuclear deal, and was threatening sanctions against any country which further imported Iranian oil. The market reacted with a delayed price hike with the Brent crude oil front month contract peaking at $86/bbl (a 4-year high) in October 2018, only to fall more than 30% in the following month. To stop plummeting prices, a last effort from OPEC and its allies was made in early December, when they jointly decided to cut output by 1.2 million bpd throughout the first half of 2019. Brent crude oil finished the year at $53.8/bbl, a 15-month low.
127
The following table shows quarterly average prices of oil and CO2 for the past three years:
|
Commodities
|
||||
|
Source: Thomson Reuters
|
Brent crude oil
spot average price $ per barrel |
West Texas intermediate
spot average price $ per barrel |
European thermal coal import (API2)
spot average price $ per ton |
European Union allowance
spot average price € per ton of CO2 equivalent |
|
Q1 2016
|
35.21
|
33.63
|
44.84
|
5.64
|
|
Q2 2016
|
47.03
|
45.64
|
49.09
|
5.77
|
|
Q3 2016
|
46.99
|
44.94
|
61.84
|
4.55
|
|
Q4 2016
|
51.06
|
49.29
|
81.09
|
5.52
|
|
Q1 2017
|
54.57
|
51.78
|
77.86
|
5.17
|
|
Q2 2017
|
50.79
|
48.15
|
75.71
|
4.81
|
|
Q3 2017
|
52.17
|
48.20
|
86.11
|
5.91
|
|
Q4 2017
|
61.46
|
55.30
|
92.68
|
7.47
|
|
Q1 2018
|
67.23
|
62.89
|
86.09
|
9.80
|
|
Q2 2018
|
74.97
|
67.91
|
89.97
|
14.49
|
|
Q3 2018
|
75.84
|
69.43
|
98.66
|
18.85
|
|
Q4 2018
|
68.60
|
59.34
|
92.45
|
20.47
|
CO2
The integrated steel process involves carbon and CO
2
, which distinguishes integrated steel producers from mini-mills and many other industries where CO
2
generation is primarily linked to energy use. Launched in 2005, the European Union Emission Trading System (“EU-ETS”) is currently in its third phase, stretching from 2013 to 2020. After 2020, this system may require ArcelorMittal to incur additional costs to acquire emissions allowances. The EU-ETS is based on a cap-and-trade principle; it sets a cap on greenhouse gas emissions (“GHG”) from covered installations, which is then reduced year after year. Since 2009, a surplus of emission allowances has built up in the EU-ETS, kept prices below €10 per ton of CO2 equivalent (“€/tCO2e”) until 2018. In 2016 and 2017, the price for a European Union Allowance (“EUA”) - which gives the holder the right to emit one ton of carbon dioxide (“CO2”) - ranged between €4/tCO2e and €6/tCO2e.
To boost the EUA price and to provide an incentive to the industry and the power sector to alter their behavior in terms of CO2 emissions, in July 2015 the European Commission proposed a reform of the EU-ETS for the period 2021-2030 (phase 4). More than 2 years later, inter-institutional negotiations were concluded presenting solutions to reduce the current surplus. Consequently, in November 2017 the EUA price crossed the €8/tCO2e mark for the first time since January 2016. With the EU Council’s final approval in February 2018, the ETS reform became law (directive 2018/410). As a result, the EUA price surged up further and only came to a halt after surpassing the historical high of €25/tCO2e in September 2018. This marked a 360% price increase in only nine months. The EUA price has been subsequently trading around the €20/tCO2e mark driven by uncertainties around Brexit and the looming market stability reserve (“MSR”) which started operating in January 2019.
For further information on the Company's CO2 emissions and related risks see "Item 4.B—Business overview—Sustainable development-Outcome 6: Responsible energy user that helps create a lower carbon future" and "Item 3.D—Key information—Risk factors—Risks related to the global economy and the mining and steel industry—Laws and regulations restricting emissions of greenhouse gases could force ArcelorMittal to incur increased capital and operating costs and could have a material adverse effect on ArcelorMittal's results of operations and financial condition."
128
Thermal coal
Thermal coal prices have followed the same commodity super-cycle as crude oil and reached the low levels of $45/t at the beginning of 2016. Throughout 2016, prices had been on the rise and by the end of the year had almost doubled. After a sharp drop during the first two quarters of 2017 prices rebounded and finished the year strong. This came on the back of intensified demand from Asia which was witnessing one of the coldest winters ever recorded. The 2017/2018 winter began with a Chinese campaign aimed at switching millions of households from using coal to natural gas for heating purposes. At the same time, the country tightened imports by banning small ports from receiving foreign coal cargoes. The campaign unexpectedly boosted demand from coal-fired power plants as it created a shortage of natural gas. The tightening of the Asian market had some severe spill-overs to the European market and pushed the spot price for the all publications index number 2 (“API2”) - which reflects the price for imports into ARA (Amsterdam-Rotterdam-Antwerp) - above $90/t, a level not seen since the end of 2012. Throughout the first quarter of 2018, the API2 shed almost 20% as the global supply demand balance softened amid the Chinese New Year holiday. After increasing throughout the second quarter of 2018, the API2 reached a new 6-year high when it surpassed the $100/t mark in the third quarter. This was triggered by utilities replenishing stocks and strong demand from power stations due to a hot and dry summer. In the fourth quarter of 2018, prices remained volatile but decreased almost 20% amid China's imposition of new import restrictions, and Europe benefiting from a mild start to the winter.
Natural gas - Europe
Year after year the natural gas market is turning more into a global commodity due to the continuous development of liquefied natural gas (“LNG”), driven by the construction of new liquefaction units (called trains) in Russia, Australia and in the U.S. The worldwide LNG exports reached 430 billion cubic meters (“bcm”) in 2018, an increase of 8.2% compared to 2017. Consequently, natural gas is increasingly exposed to the same commodity super-cycles that also affect thermal coal and crude oil, for example. Unlike thermal coal and crude oil, the European natural gas market is showing stronger seasonal patterns.
Despite starting the year at the same price level as 2017, the 2018 TTF Spot Price (the price for natural gas to be delivered the next day, which is traded on a virtual trading platform located in the Netherlands) averaged €22.85 per Megawatt hour (“€/MWh”), which is more than 30% higher than the 2017 average (€17.32/MWh) and far above 2016 when prices settled at €14.03/MWh on average. Several events affected the transportation of natural gas in 2017 (an explosion at the Gas Connect Austria's Baumgarten site in eastern Austria and the shut-down of the Forties pipeline system, both of which happened at the end of year). 2018 started with milder than normal weather but a late cold snap at the end of February brought freezing temperatures from Siberia to Europe. Combined with limited storage flexibility and supply problems across Europe, spot prices at major European hubs skyrocketed to multi-year highs. In the aftermath, northwest European natural gas storage levels dropped well below the 5-year average. Efforts to refill storages, together with strong summer demand from natural gas fired power plants, exceptional high LNG prices and an overall rising energy complex kept supporting European natural gas prices up until the start of the fourth quarter of 2018 (an increase of 50% throughout the first nine months of the year). During the last quarter of the year, the TTF spot price tumbled from €29.5/MWh down to €22.0/MWh on the back of milder than seasonal temperatures, significantly improved storage levels, strong LNG arrivals and pipeline imports from Norway and Russia operating close to their maximum capacity.
Natural gas - United States
In 2018, natural gas production in the U.S. remained strong at a level of 102 billion cubic feet per day (“bcf/d”). In North America, natural gas prices trade independently of oil prices and are set by spot and future contracts, traded on the NYMEX exchange or over-the-counter. U.S. thermal coal continues to be challenged as a power producing fuel. Gas power plants first took the lead in the generation mix in 2016, which continued in 2017 with around 32% of electricity produced from burning natural gas. This trend accelerated in 2018 with just over 30GW of new capacity entering commercial service.
U.S. LNG export capacity stands at 4.9 bcf/d, almost 2.4 bcf/d added in 2018 compared to 2016 (1.38 bcf/d), the year the U.S. entered the LNG exporting business. Projections show that U.S. LNG export capacity will reach 8.9 billion bcf/d by the end of 2019, making it the third largest in the world behind Australia and Qatar. The rise of U.S. LNG is driven by the strong development of U.S. shale gas. The number of rigs increased significantly compared to 2017 levels, with the Permian basin marking the biggest increase of close to 100 additional rigs compared to 2017.
129
In 2017, the Henry Hub front month price (the price for gas traded on a U.S. virtual trading platform, for delivery in the next calendar month) increased by 27% as compared to an average of $3.08 per million British Thermal Units (“$/MMBtu”) in 2016. In the first nine months of 2018, month ahead prices averaged $2.85/MMBtu, a 6.5% decrease compared to the first nine months of 2017. The recession in natural gas prices that held from the beginning of 2015 until September 2018 changed in the first two weeks of November 2018, as weather-related natural gas demand increased sharply, and the relatively low levels of natural gas in storage could not provide the needed flexibility leading to 60% price hike in only 10 days. In mid-November 2018, the front-month Henry Hub natural gas futures hit a price of $4.8/MMBtu, the highest price since the second quarter of 2014. Consequently, end of November natural gas inventories stood 19% lower than the previous five-year average forcing the Henry Hub Month Ahead price to average $4.0/MMBtu throughout November and December 2018.
Natural gas - Asia
The Platts Japan Korea Marker (JKM) - the LNG benchmark price assessment for spot physical cargoes delivered ex-ship into Japan, South Korea, China and Taiwan - front month contract finished the year 2017 at the highest levels since the first quarter of 2015 ($11.2/MMBtu). Throughout the first quarter of 2018 prices dropped 35% (equivalent to $4/MMBtu) and bottomed at $7.2/MMBtu before entering a period of increasing prices. While prices normally would have relaxed on the back of muted demand from Asian consumers at the end of June 2018, the front month contract again surpassed the 11 USD/MMBtu level ($6/MMBtu higher year-on-year). However, in 2018 strong Asian restocking demand ahead of the winter met strong cooling needs. At the end of the first quarter of 2018, the price spread between the Pacific and the Atlantic basin dropped below $1/MMBtu erasing the arbitrage window and allowing LNG cargoes to sail to Europe. This spread quickly increased to $3.7/MMBtu dragging cargoes away from Europe. After a period of high volatility, the spread stabilized around $2.0/MMBtu by the end of the third quarter and into the fourth quarter, fueled by lackluster Asian demand. At the same time, charter rates for LNG vessels exploded and moved north of $160,000/day (a long way from the lows of 2016 and 2017 when spot rates were hovering at $25,000/day). This led to trapped LNG supply in the Atlantic basin leading to sharply dropping European natural gas prices.
The following table shows quarterly average spot prices of natural gas for the past three years:
|
Natural gas
|
|||
|
Source: Thomson Reuters
|
TTF
Spot average price € per MWh |
Henry Hub
Spot average price $ per MMBtu |
JKM
Spot average price $ per MMBtu |
|
Q1 2016
|
12.86
|
1.98
|
5.05
|
|
Q2 2016
|
13.21
|
2.25
|
4.66
|
|
Q3 2016
|
12.80
|
2.79
|
5.62
|
|
Q4 2016
|
17.28
|
3.18
|
7.25
|
|
Q1 2017
|
18.42
|
3.06
|
7.35
|
|
Q2 2017
|
15.61
|
3.14
|
5.85
|
|
Q3 2017
|
16.13
|
2.95
|
6.19
|
|
Q4 2017
|
19.13
|
2.92
|
9.45
|
|
Q1 2018
|
21.25
|
2.85
|
9.35
|
|
Q2 2018
|
21.06
|
2.83
|
8.71
|
|
Q3 2018
|
24.56
|
2.86
|
10.71
|
|
Q4 2018
|
24.65
|
3.72
|
10.24
|
130
Electricity - Europe
Unlike the natural gas market, electricity prices are only indirectly influenced by commodity super-cycles. Due to the regional nature of electricity markets prices follow mainly local drivers (i.e. energy mix of the respective country, power generation from renewables, country specific energy policies, etc.). However, unlike previous years, 2018 marked a structural change with the emergence of the carbon price as one of the major price drivers. The forward baseload power contract for the front calendar year (delivery 2019) strongly increased in all European market places throughout the year (e.g. from €40.5 to €59.1/MWh in Belgium (an increase of 46% year-to-date), from €41.75 to €58.45/MWh in France (an increase of 40% year-to-date) and from €36.7 to €52.7/MWh in Germany (an increase of 44% year-to-date). The 2018 price increase was mainly due to the overall fuel price increases, the unreliability of an aging French and Belgian nuclear fleet and a weak year in terms of renewable output.
The following table shows quarterly average spot prices of electricity in Germany, France and Belgium for the past three years:
|
Electricity
|
|||
|
Source: Thomson Reuters
|
Germany
Baseload spot average price € per MWh |
France
Baseload spot average price € per MWh |
Belgium
Baseload spot average price € per MWh |
|
Q1 2016
|
25.20
|
28.89
|
28.51
|
|
Q2 2016
|
24.79
|
25.89
|
27.15
|
|
Q3 2016
|
28.33
|
32.37
|
32.64
|
|
Q4 2016
|
37.56
|
59.92
|
58.18
|
|
Q1 2017
|
41.32
|
54.77
|
51.58
|
|
Q2 2017
|
29.76
|
33.90
|
35.74
|
|
Q3 2017
|
32.73
|
34.56
|
34.17
|
|
Q4 2017
|
32.49
|
56.19
|
56.47
|
|
Q1 2018
|
36.05
|
44.09
|
45.17
|
|
Q2 2018
|
36.03
|
36.78
|
44.10
|
|
Q3 2018
|
53.86
|
57.58
|
61.08
|
|
Q4 2018
|
51.89
|
62.47
|
71.01
|
131
Ocean freight
[3]
Ocean freight prices increased in 2018 compared to 2017 primarily due to a lack of dry bulk net fleet growth and a flat demand trend, after increasing in 2017 as well. The Baltic Dry Index (“BDI”) averaged 1,352 points against 1,145 points in 2017, an 18% increase year-on-year. The Capesize index increased by 9% year-on-year to average 16,529$/day against 15,129$/day in 2017 (7,388$/day in 2016). Meanwhile the Panamax index increased by 19% to average 11,654$/day against 9,766$/day in 2017 (5,562$/day in 2016). Dry bulk fleet growth has been slow because of a lack of deliveries which was due to vessels not being contracted in the low market of 2016. In 2018, new build deliveries reached the lowest rate of deliveries in the last 10 years, which helped to restrict supply. Due to the market being stronger than in previous years, demolition of ships reduced. Net fleet growth was 2.8% in 2018 compared to 2.9% in 2017. Demand of dry cargo was flat in 2018 affected by global political instability and disruptions. The U.S.-China trade tensions created uncertainty in the market while logistical disruptions (like BHP’s train derailment in Australia and leaks in Anglo American’s Minas Rio pipeline) constricted the supply of cargo in the second half of the year. Chinese imports were down year-on-year for the first time in 7 years. Chinese coal imports were positive in the first half of 2018 but saw a downturn in the second half as the Chinese government's policy preferred domestic production over imports. Year-on-year dry bulk trade growth was 2.3% in 2018 as compared to 4.1% in 2017.
The industry is preparing for the new sulphur cap on marine fuels set by the International Maritime Organization that will apply from 2020 onwards. Ship owners need to decide whether to install air pollution control devices known as scrubbers which will allow owners to continue using dirty marine fuel or waive the installation and use the more expensive cleaner marine fuel oil. This will have an impact on supply and potentially pricing (as shipowners attempt to pass on the increased costs) dynamics from 2019 onwards.
______________________________________________________________________________________________________________________________
[3]
Sources: ACM Braemar, Baltic Index, Clarksons Platou
132
Impact of Exchange Rate Movements
Because a substantial portion of ArcelorMittal’s assets, liabilities, sales and earnings are denominated in currencies other than the U.S. dollar (its reporting currency), ArcelorMittal has exposure to fluctuations in the values of these currencies relative to the U.S. dollar. These currency fluctuations, especially the fluctuation of the U.S. dollar relative to the euro, as well as fluctuations in the currencies of the other countries in which ArcelorMittal has significant operations and sales, can have a material impact on its results of operations. For example, ArcelorMittal’s non-U.S. subsidiaries may purchase raw materials, including iron ore and coking coal, in U.S. dollars, but may sell finished steel products in other currencies. Consequently, an appreciation of the U.S. dollar will increase the cost of raw materials; thereby having a negative impact on the Company’s operating margins, unless the Company is able to pass along the higher cost in the form of higher selling prices. In order to minimize its currency exposure, ArcelorMittal enters into hedging transactions to lock-in a set exchange rate, as per its risk management policies.
In 2016, the outcome of the Brexit referendum triggered a move toward safety trades that prompted U.S. dollar strength, supporting the trend towards lower interest rates in the G10 countries. This climate was confirmed later with the U.S. presidential campaign; however, a sharp reversal of market sentiment followed Donald Trump’s election, triggered by the expectation of an ambitious fiscal and investment program. As a consequence, the euro depreciated against the U.S. dollar to 1.0541 at the end of 2016 from 1.0898 at the start of the year, further driven by the reduction of the monthly asset purchase program from the European Central Bank.
In 2017, the fluctuations on the foreign exchange markets were broadly driven by the activity of central banks that started to reduce their accommodative monetary policies, including the U.S. Federal Reserve (the "Federal Reserve"), which increased rates three times during the year. The less accommodative policies adopted by the European Central Bank (“ECB”), Bank of Canada (“BoC”) and Bank of England (“BoE”) were already anticipated by the markets and their respective currencies strengthened even before the banks' monetary decisions. The euro strengthened significantly against the U.S. dollar, from 1.0541 at the beginning of 2017 to 1.1993 at the end of the year.
In 2018, the Company designated a portfolio of euro denominated debt (€5.2 billion as of December 31, 2018) as a hedge of certain euro denominated investments (€7.8 billion as of December 31, 2018) in order to mitigate the foreign currency risk arising from certain euro denominated subsidiaries net assets. The risk arises from the fluctuation in spot exchange rates between EUR/USD, which causes the amount of the net investments to vary. See also note 6.3 to the consolidated financial statements. As a result of the hedge designation, foreign exchange gains and losses related to the portfolio of euro denominated debt are recognized in other comprehensive income.
As of December 31, 2018, the Company is mainly subject to foreign exchange exposure relating to the euro, Brazilian real, Canadian dollar, Indian rupee, Kazakhstani tenge, South African rand, Mexican peso, Polish zloty, Argentine peso and Ukrainian hryvnia against the U.S. dollar resulting from its trade payables and receivables.
In 2018, the protectionism of the U.S. administration in its trade policies and the monetary policy divergence between the United States and G10 countries led to the global appreciation of the U.S. dollar
.
While the Federal Reserve increased rates from 2.25% to 3.00% in 2018, the ECB announced the end of its quantitative easing program and kept rates on hold. Therefore, the euro depreciated from 1.19 at the start of 2018 to 1.14 at the end of the year.
Elsewhere in Europe, the Czech central bank’s rate increase failed to support the Czech koruna in 2018. The Czech central bank was forced to tighten its policy at a faster pace to offset the loosening effect stemming from the Czech koruna's weakness. The Czech koruna weakened from 21.29 against the U.S. dollar on December 31, 2017 to 22.47 on December 31, 2018. In Poland, the national central bank maintained the reference rate unchanged at a record-low level of 1.50%, even though some members of the current monetary policy council voted for a rate increase at the November meeting for the first time since 2015. The Polish zloty weakened against the U.S. dollar at the end of 2018 to 3.76 compared to 3.48 at the beginning of the year.
133
In Ukraine, contrary to most other emerging markets currencies, the Ukrainian hryvnia appreciated by 6% against the U.S. dollar during the first half of 2018. As the economy did not show any signs of real improvement, this appreciation was probably the result of certain speculative flows. The second half of the year was marked by a tense geopolitical environment and domestic politics. As a consequence, the hryvnia erased the appreciation of the first half of the year and ended 2018 at 27.69 against the U.S. dollar.
In Kazakhstan, after a strong start of the year due to an increase in oil output with the launch of the Kashagan field, the expansion lost steam on slowing growth and trade disputes with Russia.
The tenge came under renewed depreciation pressure, preventing inflation from slowing and prompting the national central bank to keep interest rates on hold. The tenge depreciated against the U.S. dollar and reached its weakest level in December 2018 at 384.17.
In India, the balance of payments deficit weighed on the Indian rupee, which depreciated by 15% versus the U.S. dollar from January 2018 to October 2018. However, the decrease in oil prices since October 2018 was particularly beneficial for India's external finances. The Indian rupee weakened against the U.S. dollar from 63.87 at the start of the year to 69.63 in December 2018.
In October 2018, the Company entered into hedging programs including non deliverable forwards and non deliverable options for a total nominal amount of $5.9 billion in order to hedge the volatility between Indian Rupee and U.S. dollar in relation to the proposed acquisition of ESIL.See note 6.3 to the consolidated financial statements for further information.
South Africa exited its first half 2018 recession in the third quarter, expanding at an annualized pace of 2.2% quarter on quarter. Strong improvements in manufacturing, agriculture and services were partly offset by weakness in mining. In response to flagging growth, the government announced an economic recovery and stimulus plan in September 2018. Key proposals included visa reform to boost tourism and high-skilled immigration, implementing the mining charter, a new infrastructure fund, telecoms reform, and reviewing administered prices. The South African rand depreciated from 12.40 against the U.S. dollar at the beginning of the year to 14.43 in December 2018.
In North America, another trade battle took place as the United States, Canada and Mexico tried to reshape the North American Free Trade Agreement. The Canadian dollar and the Mexican peso were first weighed down by negative headlines regarding the negotiations and then supported by news suggesting that an agreement could be achieved. The U.S.-Mexico-Canada trade agreement (“USMCA”) was announced on October 1, 2018. Despite the announcement of this trade agreement, the Canadian dollar finally weakened against the U.S. dollar in the context of lower oil prices and risk aversion from 1.2540 in December 2017 to 1.3629 at the end of 2018. In Mexico, the appreciation of the Mexican peso following the announcement of the USMCA was softened by the new government's decision to cancel the Mexico City airport project at Texcoco. The Mexican peso ended 2018 at 19.64 against the U.S. dollar, only 0.6% below its level at the beginning of the year.
In Brazil
,
the real depreciated from 3.31 to 4.17 against the U.S dollar between January and August 2018, in line with fluctuations of other emerging markets currencies.
Optimism rose following the election of Jair Bolsonaro. The new president organized an economic cabinet with the nomination of Finance Minister Paulo Guedes. The Brazilian real strengthened and reached 3.87 in December 2018.
In Argentina, the Argentinian peso was subject to a very strong depreciation during the third quarter of 2018 versus the U.S dollar. When President Macri asked the IMF to speed up payments, the Argentinian peso lost more than 36% of its value. In a chain reaction, inflation has increased significantly since early 2018 and the three-year cumulative inflation rate has exceeded 100%. Argentina is now considered as a hyperinflationary economy. Inflation slowly decreased at the end of 2018; however, the current situation in addition to the 2019 general election have led to high volatility of the Argentinian currency. Starting at 18.65 against the U.S. dollar at the beginning of 2018, the Argentinian peso finished the year at 37.70. See note 2.2.2 to the consolidated financial statements for further information.
On February 17, 2016, the Venezuelan government devalued its currency by changing the official rate of the bolivar fuerte from 6.3 to 10 per U.S. dollar. It also announced the elimination of the SICAD rate and starting February 18, 2016, the SIMADI rate (renamed DICOM) was allowed to float freely at a rate of approximately 203 bolivar fuerte per U.S. dollar. The DICOM rate was originally set at 206 bolivars per U.S. dollar on March 10, 2016, before falling to 674 bolivars per U.S. dollar at December 31, 2016. The DICOM rate continued to weaken during 2017 to 3,345 bolivars per U.S. dollar on August 31, 2017, when the Venezuelan government temporarily suspended the sale of U.S. dollars through its DICOM auction system. Effective January 30, 2018, the Venezuelan government eliminated the DIPRO rate and reopened the DICOM auction system auction on February 5, 2018 at the new DICOM rate of 30,987 bolivars per euro (25,000 bolivars per U.S. dollar). DICOM is now the country’s only official exchange rate. On August 20, 2018, the bolivar soberano ("VES") replaced the bolivar fuerte ("VEF") at
134
a rate of 1 VES to 100,000 VEF. The VES continued to weaken and reached 638.16 against the U.S. dollar on December 31, 2018. See note 2.2.2 to the consolidated financial statements for further information.
Trade and Import Competition
Europe
[4]
A slowdown in global steel consumption coupled with excess capacity in China led to increased finished steel shipments into Europe in 2015, with import penetration rising to over 16% in 2018. Since then Chinese imports into Europe have fallen back from a peak of 7 million tonnes in 2015 to around 3 million tonnes in 2018. However, this has been more than offset by an increase in imports from Turkey (up from 2 million tonnes in 2015 to 7 million tonnes in 2018) and Developed Asia (2 million tonnes in 2014 to 5 million tonnes in 2018). Meanwhile, CIS imports have remained the largest share but have been relatively stable between 7 and 8 million tonnes since 2014. Overall, this continued a trend of imports growing more strongly than domestic demand. Between 2012 and 2018, Apparent Steel Consumption (“ASC”) increased by 18% while over the same period, finished steel imports increased by over 100%, taking market share from domestic producers. Over this period total finished imports have risen from just over 15 million tonnes in 2012 to over 31 million tonnes in 2018, causing import penetration to rise to a record high of almost 20%. Import penetration in flats rose strongly from 2012 (13%) to 2015 (20%). While import penetration in flats has risen slowly since 2015 (up to 22% in 2018), the significant increase recently has been in long products, where import penetration rose to 13% in 2018 up from only 10% the previous year. See “Item 4.B—Information on the Company—Business overview—Government regulations—Foreign trade” and “Item 3.D—Key information—Risk factors—Risks related to the global economy and the mining and steel industry—Unfair trade practices in ArcelorMittal’s home markets could negatively affect steel prices and reduce ArcelorMittal’s profitability, while trade sanctions and barriers may have an adverse effect on ArcelorMittal’s operations in various markets.”
United States
[5]
Finished steel imports peaked in 2014 at almost 30 million tonnes, declining to below 23 million tonnes in 2016 (or an import penetration of 25%). Imports in 2017 rose 12% year-on-year to around 25.5 million tonnes or an import penetration of over 26%. However, finished steel import penetration fell in 2018 to 23% as finished imports fell by 12% compared to a 2% year-on-year increase in ASC. Imports of semi-finished steel products continued to rise strongly, up by 11% year-on-year in 2018 after an increase of 28% during 2017.
Steel import penetration in 2018 fell back to 23%, close to the average between 2007 and 2013 and much lower than the 28% average import penetration between 2014 and 2016. The decrease in finished steel imports was due to increasing U.S. trade protection measures, despite attractive prices in the U.S. relative to international markets.
In 2018 over a third of imports came from Canada (25%) and Mexico (9%), up from around 29% in 2017. Imports from the rest of the world took a declining share, with 20% of U.S. steel imports coming from developed Asia (down 17% year-on-year), 18% from EU28 (up 1% year-on-year), 5% from Turkey (down 43% year-on-year), 3% from CIS (down 25% year-on-year) and 3% from China (down 10% year-on-year). In 2018, imports only significantly increased from ASEAN (up 13% year-on-year) taking a 5% share, mainly from Vietnam. See “Item 4.B—Information on the Company-Business overview—Government regulations—Foreign trade” and “Item 3.D—Key information-Risk factors—Risks related to the global economy and the mining and steel industry—Unfair trade practices in ArcelorMittal’s home markets could negatively affect steel prices and reduce ArcelorMittal’s profitability, while trade sanctions and barriers may have an adverse effect on ArcelorMittal’s operations in various markets.”
_______________________________________________________________________________________________________________________________
[4]
Source: Eurostat trade data to November 2018, Company estimates for December 2018.
[5]
Source: American Iron and Steel Association data to October 2018, Company estimates for November and December 2018.
135
Consolidation in the steel and mining industries
Prior to 2017, consolidation transactions had decreased significantly in terms of number and value in the context of economic uncertainties in developed economies combined with a slowdown in emerging markets.
However, in an effort to reduce the worldwide structural overcapacity, some key consolidation steps were undertaken in 2018 and 2017, specifically in China and in Europe.
Steel industry consolidation in China has remained slow since 2012. As a key initiative of the Chinese central government’s five-year plan issued in March 2011, the concentration process of the steel industry was expected to reduce overcapacity, rationalize steel production based on obsolete technology, improve energy efficiency, achieve environmental targets and strengthen the bargaining position of Chinese steel companies in price negotiations for iron ore. However, that initiative is yet to produce significant tangible results. In 2015, China dropped its target objective for the top ten Chinese steel producers to account for 60% of national production and for at least two producers to reach 100 million tonne capacity in the next few years. A new industry consolidation plan published by China aims at simplifying approval procedures and facilitating acquisition financing for firms in sectors like steel. In late 2016, Baosteel Group and Wuhan Iron and Steel Group completed their merger, creating Baowu Steel Group with an annual production capacity of around 60 million tonnes, also making it the world's second largest steelmaker.
In Europe, 2018 was a landmark year for the consolidation of the steel industry with two major transactions. Following an announcement made in September 2017, Tata Steel and Thyssenkrupp signed a final agreement at the end of June 2018 to consolidate their European steel mills and create the joint venture Thyssenkrupp Tata Steel, Europe's second-largest steel company after ArcelorMittal. The transaction is subject to merger control clearance in several jurisdictions, including the European Union.
In addition, on November 1, 2018, ArcelorMittal completed the acquisition of Ilva, Europe’s largest single steel site and only integrated steelmaker in Italy with its main production facility based in Taranto. Ilva also has significant steel finishing capacity in Taranto, Novi Ligure and Genova. The transaction was approved by the European Commission on May 7, 2018 subject to the disposal of certain assets in Italy, Romania, North Macedonia, the Czech Republic, Luxembourg and Belgium, for which ArcelorMittal submitted sales offers currently reviewed by the European Commission. See
“Item 4.A—Information on the Company— History and development of the Company—
Key transactions and events in 2018.
”
In the first quarter of 2018, ArcelorMittal signed a joint venture formation agreement with NSSMC in relation to its offer for a competitive resolution plan for ESIL in India setting out a positive future for the bankrupt company, an integrated flat steel producer and the largest steel company in western India. The updated plan would enable ESIL to participate in anticipated steel demand growth in India. Further to ArcelorMittal being named the preferred bidder in October 2018, ESIL's committee of creditors announced in October that the Company has been identified as the successful applicant. ArcelorMittal's resolution plan remains subject to the approval of India's NCLT. See
“Item 4.A—Information on the Company—History and development of the Company—
Key transactions and events in 2018.
”
Further future consolidation should allow the steel industry to perform more consistently through industry cycles by achieving greater efficiencies and economies of scale, and improve bargaining power with customers and, crucially, suppliers, who tend to have higher levels of consolidation.
Critical accounting policies and use of judgments and estimates
Management’s discussion and analysis of ArcelorMittal’s operational results and financial condition is based on ArcelorMittal’s consolidated financial statements, which have been prepared in accordance with IFRS. The preparation of financial statements in conformity with IFRS recognition and measurement principles and, in particular, making the critical accounting judgments highlighted below require the use of estimates and assumptions that affect the reported amounts of assets, liabilities, revenues and expenses. Management reviews its estimates on an ongoing basis using currently available information. Changes in facts and circumstances or obtaining new information or more experience may result in revised estimates, and actual results could differ from those estimates.
An overview of ArcelorMittal's critical accounting policies under which significant judgments, estimates and assumptions are made may be found in note 1.2 to the consolidated financial statements.
136
A. Operating results
The following discussion and analysis should be read in conjunction with ArcelorMittal’s consolidated financial statements included in this annual report.
ArcelorMittal reports its operations in five reportable segments: NAFTA, Brazil, Europe, ACIS and Mining. The key performance indicators that ArcelorMittal’s management uses to analyze operations are sales, average steel selling prices, crude steel production, steel shipments, iron ore and coal production and operating income. Management’s analysis of liquidity and capital resources is driven by net cash provided by operating activities.
Years ended December 31, 2018, 2017 and 2016
Sales, operating income, crude steel production, steel shipments, average steel selling prices and mining production
The following tables provide a summary of ArcelorMittal’s performance by reportable segment for the year ended December 31, 2018, 2017 and 2016:
|
Sales for the year ended December 31,
1
|
Operating income (loss) for the year ended December 31,
2
|
||||||||||
|
2018
|
2017
|
2016
|
2018
|
2017
|
2016
|
||||||
|
Segment
|
(in $ millions)
|
(in $ millions)
|
(in $ millions)
|
(in $ millions)
|
(in $ millions)
|
(in $ millions)
|
|||||
|
NAFTA
|
20,332
|
17,997
|
15,806
|
1,889
|
1,185
|
2,002
|
|||||
|
Brazil
|
8,711
|
7,755
|
6,223
|
1,356
|
697
|
614
|
|||||
|
Europe
|
40,488
|
36,208
|
29,272
|
1,632
|
2,359
|
1,270
|
|||||
|
ACIS
|
7,961
|
7,621
|
5,885
|
1,094
|
508
|
211
|
|||||
|
Mining
|
4,211
|
4,033
|
3,114
|
860
|
991
|
366
|
|||||
|
Others and eliminations
|
(5,670)
|
(4,935)
|
(3,509)
|
(292)
|
(306)
|
(302)
|
|||||
|
Total
|
76,033
|
68,679
|
56,791
|
6,539
|
5,434
|
4,161
|
|||||
|
1.
|
Amounts are prior to inter-segment eliminations (except for total) and sales include non-steel sales.
|
|
2.
|
Others and eliminations to segment operating income reflects certain adjustments made to operating income of the segments to reflect corporate costs, income from non-steel operations (e.g. energy, logistics and shipping services) and the elimination of stock margins between segments. See table below.
|
|
Adjustments to segment operating income and other
|
Year ended December 31,
|
||||
|
2018
|
2017
|
2016
|
|||
|
(in $ millions)
|
(in $ millions)
|
(in $ millions)
|
|||
|
Corporate and shared services
1
|
(170)
|
(199)
|
(71)
|
||
|
Financial activities
|
(23)
|
(23)
|
(17)
|
||
|
Shipping and logistics
|
1
|
(16)
|
(97)
|
||
|
Intragroup stock margin eliminations
2
|
(45)
|
(41)
|
(94)
|
||
|
Depreciation and impairment
|
(55)
|
(27)
|
(23)
|
||
|
Total adjustments to segment operating income and other
|
(292)
|
(306)
|
(302)
|
||
|
1.
|
Includes primarily staff and other holding costs and results from shared service activities.
|
|
2.
|
In 2017, fourth quarter iron ore prices decreased as compared to the fourth quarter of 2016 leading to lower stock margin eliminations.
|
Sales
ArcelorMittal had sales of $
76.0 billion
for the year ended December 31, 2018, representing a
10.7%
increase from sales of $68.7 billion for the year ended December 31, 2017, primarily due to a
13.5%
increase in the average steel selling prices, partially offset by a
1.6%
decrease in steel shipments. In the first half of 2018, sales were $39.2 billion increasing from sales of $33.3 billion in the first half of 2017, primarily due to 16.7% higher average steel selling prices. In the second half of 2018, sales of
$36.8 billion
represented a
4.2%
increase as compared to sales of $35.3 billion in the second half of 2017, primarily driven by a
10.6%
increase in average steel selling prices, partially offset by a
4.5%
decrease in steel shipments.
137
ArcelorMittal had sales of $68.7 billion for the year ended December 31, 2017, representing a 20.9% increase from sales of $56.8 billion for the year ended December 31, 2016, primarily due to a 20.4% increase in the average steel selling prices, a 1.6% increase in steel shipments, 22.3% higher seaborne iron ore reference prices and 6.1% higher marketable iron ore shipments. In the first half of 2017, sales were $33.3 billion increasing from sales of $28.1 billion in the first half of 2016, primarily due to 23% higher average steel selling prices and 43% higher seaborne iron ore reference prices. In the second half of 2017, sales of $35.3 billion represented a 23.4% increase as compared to sales of $28.7 billion in the second half of 2016, primarily driven by a 17.5%
increase in average steel selling prices, a
5.8% increase in steel shipments and a 6% increase in seaborne iron ore reference prices
.
Cost of sales
Cost of sales consists primarily of purchases of raw materials necessary for steel-making (iron ore, coke and coking coal, scrap and alloys), electricity, repair and maintenance costs, as well as direct labor costs, depreciation and impairment. Cost of sales for the year ended December 31, 2018 was $67.0 billion as compared to $60.9 billion for the year ended December 31, 2017, primarily due to a 9.4% increase in raw material costs (consistent with the increase in sales) and impairment charges of $1.0 billion primarily related to the remedy asset sales in connection with the Ilva acquisition and the agreed remedy package required for the approval of the Votorantim acquisition, partially offset by the $0.2 billion in gain from a bargain purchase recognized with respect to the acquisition of Ilva. Selling, general and administrative expenses (“SG&A”) were $2.5 billion for the year ended December 31, 2018 compared to $2.4 billion for the year ended December 31, 2017. SG&A as a percentage of sales decreased for the year ended December 31, 2018 (3.2%) as compared to 2017 (3.4%).
Cost of sales for the year ended December 31, 2017 was $60.9 billion as compared to $50.4 billion for the year ended December 31, 2016, primarily due to a 22.3% increase in iron ore reference prices, a 31.5% increase in coal reference prices and impairment charges of $206 million related to a downward revision of cash flow projections across all steel facilities in South Africa partially offset by cost optimization efforts as part of the Action 2020 plan. SG&A were $2.4 billion for the year ended December 31, 2017 compared to $2.2 billion for the year ended December 31, 2016. SG&A as a percentage of sales decreased for the year ended December 31, 2017 (3.4%) as compared to 2016 (3.9%).
Operating income
ArcelorMittal’s operating income for the year ended December 31, 2018 was $
6.5 billion
as compared with an operating income of $5.4 billion for the year ended December 31, 2017 and was primarily driven by improved operating conditions (positive price-cost effect in the steel segments), offset in part by the impact of lower iron ore reference prices and impairment charges of $1.0 billion primarily related to the remedy asset sales in connection with the Ilva acquisition and the agreed remedy package required for the approval of the Votorantim acquisition, partially offset by a $0.2 billion bargain purchase gain relating to the acquisition of Ilva. Operating income for the year ended December 31, 2018 was also impacted by $113 million in charges related to a blast furnace dismantling in Florange (France), $60 million in charges related to the new collective labor agreement in the United States (including a signing bonus), a $146 million provision taken in the first quarter of 2018 in respect of a litigation case that was paid in the third quarter of 2018, offset in part by the recognition in Brazil of $202 million in PIS/Cofins tax credits related to prior periods.
ArcelorMittal's operating income for the year ended December 31, 2017 was $5.4 billion as compared with an operating income of $4.2 billion for the year ended December 31, 2016 and was impacted by an impairment charge of $206 million related to a downward revision of cash flow projections in South Africa. Operating income in 2016 was positively affected by
a one-time gain of $832 million on employee benefits following the signing of the new U.S. labor contract and partially offset by an impairment charge of $49 million related to the held for sale classification of the ArcelorMittal Zaragoza facility in Spain and an impairment charge of $156 million mainly related to the Vanderbijlpark plant in South Africa.
Shipments and average steel selling price
ArcelorMittal had steel shipments of
83.9 million
tonnes for the year ended December 31, 2018 as compared to steel shipments of 85.2 million tonnes for the year ended December 31, 2017,
representing a decrease of
1.6%
, primarily due to
10.3%
decline in shipments in ACIS (including unplanned maintenance in Ukraine and operational issues in Kazakhstan/Ukraine) offset in part by increases in Brazil (
5.8%
, including the impact of the Votorantim acquisition), NAFTA (
1.0%
, including the impact of a slower restart post blast furnace maintenance in Mexico) and Europe (
0.2%
, including the impact from the Ilva acquisition offset by the effect of a flood in Asturias (Spain), power outage in Fos (France) and slower ramp-up after the blast furnace reline in Poland).
138
Steel shipments increased 1.3% to 43.1 million tonnes in the first half of 2018 compared to 42.5 million tonnes for the first half of 2017 while steel shipments decreased
4.5%
to
40.8 million
tonnes in the second half of 2018 compared to
42.7 million
tonnes in the second half of 2017.
ArcelorMittal had steel shipments of 85.2 million tonnes for the year ended December 31, 2017 as compared to steel shipments of 83.9 million tonnes for the year ended December 31, 2016, representing an increase of 1.6% primarily due to increase in NAFTA (2.6%), Brazil (0.8%) and Europe (1.7%) offset in part by decline in ACIS (1.3%). Steel shipments declined 2.4% to 42.5 million tonnes in the first half of 2017 compared to 43.6 million tonnes for the first half of 2016 while steel shipments increased 5.8% to 42.7 million tonnes in the second half of 2017 compared to 40.4 million tonnes for the second half of 2016.
Average steel selling price increased by
13.5%
for the year ended December 31, 2018 as compared to the year ended December 31, 2017. Average steel selling price in the first half of 2018 increased by 16.7% as compared to the first half of 2017 and increased by 10.5% in the second half of 2018 as compared to the second half of 2017.
Average steel selling price increased by 20.4% for the year ended December 31, 2017 as compared to the year ended December 31, 2016. Average steel selling price in the first half of 2017 increased by 23.1% as compared to the first half of 2016 and increased by 17.5% in the second half of 2017 as compared to the second half of 2016.
|
NAFTA
|
|||||
|
Performance for the year ended December 31,
|
|||||
|
(in millions of USD unless otherwise shown)
|
2018
|
2017
|
2016
|
||
|
Sales
|
20,332
|
17,997
|
15,806
|
||
|
Depreciation
|
522
|
518
|
549
|
||
|
Operating income
|
1,889
|
1,185
|
2,002
|
||
|
Crude steel production (thousand tonnes)
|
22,559
|
23,480
|
22,208
|
||
|
Steel shipments (thousand tonnes)
|
22,047
|
21,834
|
21,281
|
||
|
Average steel selling price (USD/tonne)
|
852
|
742
|
672
|
||
Sales
Sales in the NAFTA segment were $
20.3 billion
for the year ended December 31, 2018, representing a
13.0%
increase as compared to the year ended December 31, 2017. Sales increased primarily as a result of the increase in average steel selling prices by
14.8%
and a
1.0%
increase in steel shipments.
Sales in the NAFTA segment were $18.0 billion for the year ended December 31, 2017, representing a 13.9% increase as compared to 2016. Sales increased primarily as a result of the increase in average steel selling prices by 10.3% and a 2.6% increase in steel shipments.
Operating income
Operating income for the NAFTA segment was $
1.9 billion
for the year ended December 31, 2018 as compared to operating income of $1.2 billion for the year ended December 31, 2017, primarily driven by a
14.8%
increase in average steel selling prices.
Operating income for the year ended
December 31, 2018
included
$60 million
in charges related to the new collective labor agreement in the United States (which included a signing bonus).
Operating income for the NAFTA segment was $1.2 billion for the year ended December 31, 2017 as compared to operating income of $2.0 billion for the year ended December 31, 2016, affected by a negative price-cost effect for long products partially offset by a positive price-cost effect for flat products and gains from the Action 2020 program. Additionally, operating income for the year ended December 31, 2016 was positively affected by a one-time $832 million gain on employee benefits following the signing of the new U.S. labor contract.
Crude steel production, steel shipments and average steel selling price
139
Crude steel production decreased
3.9%
to
22.6 million
for the year ended December 31, 2018 as compared to
23.5 million
for the year ended
December 31, 2017
. Crude steel production declined in particular in the second half of 2018, primarily due to market slowdown and blast furnace reline delay in Mexico.
Crude steel production increased 5.7% for the year ended December 31, 2017 as compared to the year ended December 31, 2016 driven by improved operational performance.
Steel shipments increased
1.0%
for the year ended December 31, 2018 as compared to the year ended December 31, 2017 reflecting improved demand in the first half and a slowdown and the impact of the blast furnace delay in the second half. Shipments were 11.4 million tonnes for the first half of 2018, an increase of 3% from 11 million tonnes in the first half of 2017, in line with available inventory. Shipments decreased
1.1%
to
10.7 million
tonnes in the second half of 2018 as compared to
10.8 million
tonnes in the second half of 2017.
Steel shipments increased 2.6% for the year ended December 31, 2017 as compared to the year ended December 31, 2016 in line with improved demand. Shipments were 11 million tonnes for the first half of 2017, an increase of 1.1% from 10.9 million tonnes in the first half of 2016 which included shipments from LaPlace and Vinton which were sold in April 2016. Shipments increased 4.1% to 10.8 million tonnes in the second half of 2017 as compared to 10.4 million tonnes in the second half of 2016.
Average steel selling prices increased
14.8%
for the year ended December 31, 2018 as compared to the year ended December 31, 2017 in particular as a result of imports tariffs on steel implemented in the United States. Average steel selling prices increased 10.5% for the first half of 2018 as compared to the first half of 2017 and
19.4%
for the second half of 2018 as compared to the second half of 2017.
Average steel selling prices increased 10.3% for the year ended December 31, 2017 as compared to the year ended December 31, 2016 in line with international prices. Average steel selling price increased 14% for the first half of 2017 as compared to the
first half of 2016 and 6.4% for the second half of 2017 as compared to the second half of 2016.
|
Brazil
|
|||||
|
Performance for the year ended December 31,
|
|||||
|
(in millions of USD unless otherwise shown)
|
2018
|
2017
|
2016
|
||
|
Sales
|
8,711
|
7,755
|
6,223
|
||
|
Depreciation
|
298
|
293
|
258
|
||
|
Impairments
|
86
|
—
|
—
|
||
|
Operating income
|
1,356
|
697
|
614
|
||
|
Crude steel production (thousand tonnes)
|
12,264
|
11,210
|
11,133
|
||
|
Steel shipments (thousand tonnes)
|
11,464
|
10,840
|
10,753
|
||
|
Average steel selling price (USD/tonne)
|
719
|
667
|
536
|
||
Sales
In the Brazil segment, sales increased
12.3%
to
$8.7 billion
for the year ended December 31, 2018 as compared to the year ended December 31, 2017, primarily due to a
7.7%
increase in average steel selling prices and a 5.8% increase in shipments
. Sales for the year ended
December 31, 2018
were also negatively impacted by hyperinflation accounting in Argentina.
In the Brazil segment, sales increased 24.6% to $7.8 billion for the year ended December 31, 2017 as compared to the year ended December 31, 2016, primarily due to 24.5% higher average steel selling prices.
Operating income
Operating income for the Brazil segment was
$1.4 billion
for the year ended December 31, 2018, representing an increase of
94.6%
as compared to the year ended December 31, 2017, primarily driven by increased shipments and higher average steel selling prices.
Operating income for the year ended
December 31, 2018
was negatively affected by foreign exchange translation impact, hyperinflation in Argentina and
$86 million
impairment related to the agreed remedy package required for the approval of the Votorantim acquisition. It was positively affected by the recognition of
$202 million
additional PIS/Cofins tax credits in
See note 8.3 to the consolidated fin
the period of 2005 to 2013.
See note 8
140
the fourth quarter of 2018 relating to favorable judgments obtained in cases filed by ArcelorMittal Brasil concerning
See note 8.3 to the consolidated financial statements for further information on pending cases related to the PIS/Cofins topic.
ancial statements for further information on pending cases related to the PIS/Cofins topic.
.3 to the consolidated financial statements for further information on pending cases related to the PIS/Cofins topic.
Operating income for the Brazil segment for the year ended December 31, 2017 was $697 million, an increase of 13.5% as compared to the year ended December 31, 2016, primarily driven by positive price-cost effect and gains from the Action 2020 program.
Crude steel production, steel shipments and average steel selling price
Crude steel production increased 9.4% to
12.3 million
tonnes for the year ended December 31, 2018 as compared to
11.2 million
tonnes for the year ended
December 31, 2017
mainly due to an increase in long products following the integration of Votorantim. Excluding Votorantim, crude steel production increased
4.9%
.
Crude steel production increased marginally to 11.2 million tonnes for the year ended December 31, 2017 as compared to the year ended December 31, 2016 due to an increase in flat production offset by long production due to a scheduled reline at Monlevade.
Steel shipments increased to
11.5 million
tonnes for the year ended December 31, 2018 as compared to
10.8 million
tonnes for the year ended December 31, 2017, reflecting the contribution from the acquisition of Votorantim. Excluding Votorantim, steel shipments increased
0.5%
.
Total steel shipments in the Brazil segment increased
9.6%
to
5.3 million
tonnes for the first half of 2018 as compared to
4.8 million
tonnes for the first half of 2017, driven by improved demand in long products and the integration of Votorantim, partially offset by a nationwide truck strike. Total steel shipments in the Brazil segment increased
2.6%
to
6.2
million tonnes in the second half of 2018 as compared to
6.0 million
tonnes for the second half of 2017.
Steel shipments remained stable for the year ended December 31, 2017 and 2016 at 10.8 million tonnes.
Average steel selling prices increased
7.7%
for the year ended December 31, 2018 as compared to the year ended December 31, 2017 in line with international prices.
Average steel selling prices in the Brazil segment increased
11.0%
for the six months ended June 30, 2018 as compared to the six months ended June 30, 2017, in line with domestic and export prices, and
4.9%
during the second half of 2018 as compared to the second half of 2017.
Average steel selling prices increased 24.5% for the year ended December 31, 2017 as compared to the year ended December 31, 2016 in line with international prices.
Average steel selling prices increased 34.4% during the first half of 2017 as compared to the first half of 2016 and
16.6%
during the second half of 2017 as compared to the second half of 2016.
|
Europe
|
|||||
|
Performance for the year ended December 31,
|
|||||
|
(in millions of USD unless otherwise shown)
|
2018
|
2017
|
2016
|
||
|
Sales
|
40,488
|
36,208
|
29,272
|
||
|
Depreciation
|
1,195
|
1,201
|
1,184
|
||
|
Impairments
|
908
|
—
|
49
|
||
|
Operating income
|
1,632
|
2,359
|
1,270
|
||
|
Crude steel production (thousand tonnes)
|
44,693
|
43,768
|
42,635
|
||
|
Steel shipments (thousand tonnes)
|
41,020
|
40,941
|
40,247
|
||
|
Average steel selling price (USD/tonne)
|
787
|
702
|
568
|
||
Sales
Sales in the Europe segment were
$40.5 billion
for the year ended December 31, 2018, representing an
11.8%
increase as compared to sales of $36.2 billion for the year ended December 31, 2017, primarily due to a
12.2%
increase in average steel selling prices, a 0.2% increase in steel shipments and the depreciation of the U.S. dollar against the euro.
141
Sales in the Europe segment were $36.2 billion for the year ended December 31, 2017, representing a 23.7% increase as compared to sales of $29.3 billion for the year ended December 31, 2016, primarily due to a 23.5% increase in average steel selling prices and a 1.7% increase in steel shipments. Spot prices began improving in the second quarter of 2016 which positively impacted sales in the second half of 2016 due to lead times and lagged pricing.
Operating income
Operating income for the Europe segment for the year ended December 31, 2018 decreased to
$1.6 billion
as compared to $2.4 billion for the year ended December 31, 2017, primarily due to the impairment charges of $908 million mainly related to the remedy asset sales for the acquisition of Ilva (reflecting the adjustment to the carrying amount of the disposal group to the expected sale proceeds based on the offers received) as well as charges of $113 million related to blast furnace dismantling in Florange (France) and a charge of $146 million taken for the German Cartel case which settled in July 2018.
Operating income for the Europe segment for the year ended
December 31, 2018
was positively impacted by
$209 million
of bargain purchase gain recognized with respect to the acquisition of Ilva.
Operating income for the Europe segment for the year ended December 31, 2017 increased to $2.4 billion as compared to $1.3 billion for the year ended December 31, 2016, primarily due to higher steel shipments in the flat business, positive price-cost effect in the flat business and gains from the Action 2020 program, partially offset by lower steel shipments and negative price-cost effect in the long business.
Crude steel production, steel shipments and average steel selling price
Crude steel production for the Europe segment increased
2.1%
to
44.7 million
tonnes for the year ended December 31, 2018 as compared to 43.8 million tonnes for the year ended December 31, 2017, due primarily to the consolidation of Ilva as from November 1, 2018, partially offset by production issues including floods in Asturias (Spain) and blast furnace reline in ArcelorMittal Zenica (Bosnia) in the second quarter and a power outage in ArcelorMittal Méditerranée (Fos-sur-Mer, France) and a slower ramp up following a blast furnace repair in Poland in the third quarter of 2018.
Crude steel production for the Europe segment increased 2.7% to 43.8 million tonnes for the year ended December 31, 2017 as compared to 42.6 million tonnes for the year ended December 31, 2016, reflecting better operational performance.
Steel shipments were
41.0 million
tonnes for the year ended December 31, 2018, a
0.2%
increase from steel shipments of
40.9 million
for the year ended December 31, 2017. In the first half of 2018, steel shipments increased 2.6% to 21.2 million tonnes, from 20.7 million tonnes in the first half of 2017, both for flat and long products partially offset by the operational issues described above, while steel shipments in the second half of 2018 decreased
2.3%
to
19.8 million
tonnes from
20.3 million
tonnes in the second half of 2017 due to weak market conditions in the fourth quarter of 2018, particularly in long products, and the operational issues described above, partially offset by the consolidation of Ilva as from November 1, 2018.
Steel shipments were 40.9 million tonnes for the year ended December 31, 2017, a 1.7% increase from steel shipments for the year ended December 31, 2016. In the first half of 2017, steel shipments decreased 3.1% to 20.7 million tonnes, from 21.3 million tonnes in the first half of 2016, due to weaknesses in long market demand while steel shipments in the second half of 2017 increased 7.1% as compared to the second half of 2016. The decrease in shipments in the first half of 2017 includes the effect of the disposal of ArcelorMittal Zaragoza and the idling of Zumarraga.
Average steel selling prices increased
12.2%
for the year ended December 31, 2018 as compared to the year ended December 31, 2017 in line with higher international prices.
Average steel selling prices increased
18.8%
during the first half of 2018 as compared to the first half of 2017 in line with higher international prices and the depreciation of the U.S. dollar against the euro and
6.0%
during the second half of 2018 as compared to the second half of 2017.
Average steel selling prices increased 23.5% for the year ended December 31, 2017 as compared to the year ended December 31, 2016 in line with higher international prices.
Average steel selling prices increased
23.0%
both during the first half of 2017 as compared to the first half of 2016 and during the second half of 2017 as compared to the second half of 2016.
142
|
ACIS
|
|||||
|
Performance for the year ended December 31,
|
|||||
|
(in millions of USD unless otherwise shown)
|
2018
|
2017
|
2016
|
||
|
Sales
|
7,961
|
7,621
|
5,885
|
||
|
Depreciation
|
311
|
313
|
311
|
||
|
Impairments
|
—
|
206
|
156
|
||
|
Operating income
|
1,094
|
508
|
211
|
||
|
Crude steel production (thousand tonnes)
|
13,022
|
14,678
|
14,792
|
||
|
Steel shipments (thousand tonnes)
|
11,741
|
13,094
|
13,271
|
||
|
Average steel selling price (USD/tonne)
|
598
|
515
|
395
|
||
Sales
Sales in the ACIS segment were
$8.0 billion
for the year ended December 31, 2018, representing an increase of
4.5%
as compared to the year ended December 31, 2017, primarily due to a
16.1%
increase in average steel selling prices, partially offset by a
10.3%
decrease in steel shipments.
Sales in the ACIS segment were $7.6 billion for the year ended December 31, 2017, representing an increase of 29.5% as compared to the year ended December 31, 2016, primarily due to a 30.5% increase in average steel selling prices, partially offset by a 1.3% decrease in steel shipments.
Operating income
Operating income for the ACIS segment for the year ended December 31, 2018 was
$1.1 billion
as compared to $508 million for the year ended December 31, 2017, increasing primarily due to a positive price-cost effect and partially offset by the decrease in shipments in 2018.
Operating income for the ACIS segment for the year ended December 31, 2017 was $508 million as compared to $211 million for the year ended December 31, 2016, the increase is primarily driven by a positive price-cost effect in the CIS business including gains from the Action 2020 program, partially offset by negative price-cost effect in ArcelorMittal South Africa and impairment charges of $206 million related to a downward revision of cash flow projections across all steel facilities in ArcelorMittal South Africa.
Crude steel production, steel shipments and average steel selling price
Crude steel production for the ACIS segment decreased by
11.3%
to
13.0 million
tonnes for the year ended December 31, 2018, from
14.7 million
tonnes for the year ended December 31, 2017, primarily due to planned (blast furnace #9) and unplanned maintenance in Ukraine in the first half of 2018 and an explosion at a gas pipeline at Temirtau (Kazakhstan) in the fourth quarter of 2018.
Crude steel production for the ACIS segment decreased marginally by 0.8% to 14.7 million tonnes for the year ended December 31, 2017, from 14.8 million tonnes for the year ended December 31, 2016.
Steel shipments for the year ended December 31, 2018 decreased by
10.3%
to
11.7 million
t
onnes as compared to 13.1 million tonnes for the year ended December 31, 2017 reflecting the operational issues mentioned above. In the first half of 2018, steel shipments decreased
6.1%
to
6.1 million
tonnes from 6.5 million tonnes in the first half of 2017 due to lower CIS shipments partially offset by higher steel shipments in South Africa, while steel shipments in the second half of 2018 decreased
14.5%
to
5.7 million
as compared to
6.6 million
in the second half of 2017, primarily due to lower steel shipments in CIS following the incidents mentioned above
.
Steel shipments for the year ended December 31, 2017 decreased by 1.3% to 13.1 million tonnes as compared to 13.3 million tonnes for the year ended December 31, 2016.
Steel shipments decreased
4.3%
in the first half of 2017 to
6.5 million
tonnes as compared to
6.8 million
tonnes for the first half of 2016. In the second half of 2017, steel shipments increased
1.7%
to
6.6 million
as compared to
6.5 million
in the second half of 2016.
143
Average steel selling prices increased
16.1%
for the year ended December 31, 2018 as compared to the year ended December 31, 2017 in line with international prices. Average steel selling prices increased 23.1% and
9.4%
in the first and second half of 2018, respectively, as compared to the same periods in 2017.
Average steel selling prices increased 30.5% for the year ended December 31, 2017 as compared to the year ended December 31, 2016 in line with international prices. Average steel selling prices increased 36.9% and 24.7% in the first and second half of 2017, respectively as compared to the same periods in 2016.
|
Mining
|
|||||||
|
Performance for the year ended December 31,
|
|||||||
|
(in millions of USD unless otherwise shown)
|
Note
|
2018
|
2017
|
2016
|
|||
|
Sales
|
4,211
|
4,033
|
3,114
|
||||
|
Depreciation
|
418
|
416
|
396
|
||||
|
Operating income
|
860
|
991
|
366
|
||||
|
Own iron ore production (million tonnes)
|
58.5
|
57.4
|
55.2
|
||||
|
Iron ore shipped externally and internally at market price (million tonnes)
|
1,2
|
37.6
|
35.7
|
33.6
|
|||
|
Iron ore shipment - cost plus basis (million tonnes)
|
1
|
20.6
|
22.2
|
22.3
|
|||
|
Own coal production (million tonnes)
|
5.9
|
6.3
|
6.3
|
||||
|
Coal shipped externally and internally at market price (million tonnes)
|
1,2
|
2.5
|
2.8
|
3.4
|
|||
|
Coal shipment - cost plus basis (million tonnes)
|
1
|
3.3
|
3.5
|
3.4
|
|||
|
1.
|
There are three categories of sales: (1) “External sales”: mined product sold to third parties at market price; (2) “Market-priced tonnes”: internal sales of mined product to ArcelorMittal facilities reported at prevailing market prices; (3) “Cost-plus tonnes”: internal sales of mined product to ArcelorMittal facilities on a cost-plus basis. The determinant of whether internal sales are reported at market price or reported at cost-plus is whether or not the raw material could practically be sold to third parties (i.e., there is a potential market for the product and logistics exist to access that market).
|
|
2.
|
Market-priced tonnes represent amounts of iron ore and coal from ArcelorMittal mines that could practically be sold to third parties. Market-priced tonnes that are transferred from the Mining segment to the Company’s steel producing segments are reported at the prevailing market price. Shipments of raw materials that do not constitute market-priced tonnes are transferred internally on a cost-plus basis.
|
|
Note
|
Year ended December 31,
|
||||||||||
|
Iron ore production (million metric tonnes)
|
1
|
Type
|
Product
|
2018
|
2017
|
2016
|
|||||
|
Own mines
|
|||||||||||
|
North America
|
2
|
Open pit
|
Concentrate, lump, fines and pellets
|
36.9
|
38.1
|
35.9
|
|||||
|
South America
|
Open pit
|
Lump and fines
|
2.8
|
3.2
|
3.1
|
||||||
|
Europe
|
Open pit
|
Concentrate and lump
|
1.4
|
1.6
|
1.8
|
||||||
|
Africa
|
Open pit / Underground
|
Fines
|
4.6
|
2.0
|
2.1
|
||||||
|
Asia, CIS & Other
|
Open pit / Underground
|
Concentrate, lump, fines and sinter feed
|
12.8
|
12.5
|
12.3
|
||||||
|
Total own iron ore production
|
58.5
|
57.4
|
55.2
|
||||||||
|
Strategic long-term contracts - iron ore
|
|||||||||||
|
North America
|
3
|
Open pit
|
Pellets
|
—
|
0.9
|
6.1
|
|||||
|
Africa
|
|
Open pit
|
Lump and fines
|
|
—
|
0.8
|
|||||
|
Total strategic long-term contracts - iron ore
|
—
|
0.9
|
6.9
|
||||||||
|
Total
|
58.5
|
58.3
|
62.1
|
||||||||
144
|
1.
|
Total of all finished production of fines, concentrate, pellets and lumps.
|
|
2.
|
Includes own mines and share of production from Hibbing (United States, 62.30%) and Peña (Mexico, 50%).
|
|
3.
|
Consists of a long-term supply contract with Cleveland-Cliffs Inc. which expired in the first quarter of 2017.
|
|
Note
|
Year ended December 31,
|
||||||
|
Coal production (million metric tonnes)
|
2018
|
2017
|
2016
|
||||
|
Own mines
|
|||||||
|
North America
|
2.09
|
2.06
|
1.80
|
||||
|
Asia, CIS & Other
|
3.82
|
4.25
|
4.45
|
||||
|
Total own coal production
|
5.91
|
6.31
|
6.25
|
||||
Sales
Sales in the Mining segment were
$4.2 billion
for the year ended December 31, 2018, representing an increase of
4.4%
as compared to the year ended December 31, 2017. Sales were
2.2%
higher at $2.1 billion and
6.7%
higher at $2.1 billion for the first and second half of 2018, respectively as compared to the same periods in 2017.
Sales in the Mining segment were $4.0 billion for the year ended December 31, 2017, representing an increase of 29.5% as compared to the year ended December 31, 2016. Sales were 45.1% higher at $2.0 billion and 16.6% higher at $2.0 billion for the first and second half of 2017, respectively as compared to the same periods in 2016.
Sales to external customers were $1,009
million for the year ended December 31, 2018, representing an increase of 2.4% as compared to the year ended December 31, 2017, primarily due to the increase in prices. Iron ore shipments were
58.3 million
tonnes for the year ended December 31, 2018, representing a marginal
0.7%
increase as compared to
57.9 million
for the year ended December 31, 2017. Iron ore shipments to external parties were
12.7 million
tonnes for the year ended December 31, 2018 as compared to 11.8 million tonnes for the year ended December 31, 2017. Coal shipments were
5.8 million
tonnes for the year ended December 31, 2018 as compared with 6.3 million tonnes for the year ended December 31, 2017.
Sales to external customers were $985 million for the year ended December 31, 2017, representing a 26.1% increase as compared to the year ended December 31, 2016, primarily due to the increase in prices. Iron ore shipments were 57.9 million tonnes for the year ended December 31, 2017, representing an increase of 3.5% as compared to the year ended December 31, 2016, primarily due to the restart of Volcan in Mexico that delivered 1.7 million tonnes in 2017. Iron ore shipments to external parties were 11.8 million tonnes for the year ended December 31, 2017 as compared to 12.3 million tonnes for the year ended December 31, 2016. Coal shipments were 6.3 million tonnes for the year ended December 31, 2017 as compared with 6.8 million tonnes for the year ended December 31, 2016. Shipments in 2016 were higher from Princeton in the U.S. from liquidation of inventory.
The average reference iron ore price was $69.7per tonne in 2018, $71.39 per tonne in 2017 and $58.36 per tonne in 2016 (delivered to China, normalized to Qingdao and 62% Fe US $ per tonne, Metal Bulletin) and the average reference price for hard coking coal increased to $206.62 per tonne in 2018, $187.28 per tonne in 2017 and $142.44 per tonne in 2016 (Premium HCC FOB Aus, Metal Bulletin). The increase in the average reference hard coking coal price, accelerated in the second half of 2016 and continued significant increases in 2017 and 2018. However, there may not be a direct correlation between reference prices and actual selling prices in various regions at a given time.
Operating income
Operating income for the Mining segment was
$860 million
for the year ended December 31, 2018 as compared to $991 million for the year ended December 31, 2017, primarily driven by the decrease in the iron ore reference prices and lower coal volumes.
Operating income for the Mining segment was $991 million for the year ended December 31, 2017 as compared to $366 million for the year ended December 31, 2016, primarily driven by higher shipments and the increases in the iron ore and coal reference prices.
Production
145
ArcelorMittal had own iron ore production of
58.5 million
tonnes for the year ended December 31, 2018, an increase of
1.9%
compared to the year ended December 31, 2017, primarily due to Liberia (production of 4.6 million tonnes in 2018 which, although above the 2017 level, was slightly below the 5 million tonne full year capacity, due to handling/logistical issues at the new Gangra deposit during the wet season in the second half of 2018), offset in part by lower production in Canada (lower yield from a new mix of ore bodies following a pit wall instability issue which first occurred in the fourth quarter of 2017) and Mexico.
ArcelorMittal had own iron ore production of 57.4 million tonnes for the year ended December 31, 2017, an increase of 4.0% compared to the year ended December 31, 2016, primarily attributed to an increase in production in Mexico (following the restart of the Volcan mine in 2017) and Canada. Liberia production was 2 million tonnes for the year ended December 31, 2017.
ArcelorMittal had own coking coal production of
5.9 million
tonnes for the year ended December 31, 2018, a decrease of
6.3%
compared to the year ended December 31, 2017 mainly due to lower production in the Kazakhstan mines following operational and geological issues..
ArcelorMittal had own coking coal production of 6.3 million tonnes for the year ended December 31, 2017, an increase of 0.9% compared to the year ended December 31, 2016.
Income or loss from investments in associates, joint ventures and other investments
ArcelorMittal recorded income of
$652 million
from investments in associates, joint ventures and other investments for the year ended
December 31, 2018
, as compared to
$448 million
for the year ended
December 31, 2017
and includes a
dividend income from Erdemir of
$87 million
as compared to
$45 million
in 2017.
ArcelorMittal recorded income of $448 million from investments in associates, joint ventures and other investments for the year ended December 31, 2017, as compared to $615 million for the year ended December 31, 2016 and includes a $133 million gain from disposal of ArcelorMittal USA's 21% stake in the Empire Iron Mining Partnership and improved performance of Calvert and Chinese investees, offset in part by a loss on dilution of the Company's stake in China Oriental and the recycling of cumulative foreign exchange translation losses to the consolidated statement of operations following the disposal of the Company's 50% stake in Kalagadi ($187 million).
Financing costs-net
Financing costs-net include net interest expense, revaluation of financial instruments, net foreign exchange income/expense (i.e., the net effects of transactions in a foreign currency other than the functional currency of a subsidiary) and other net financing costs (which mainly include bank fees, accretion of defined benefit obligations and other long-term liabilities).
Net financing costs were higher at
$2.2 billion
for the year ended December 31, 2018 as compared to $0.9 billion for the year ended December 31, 2017. Net interest expense (interest expense less interest income) was lower at
$0.6 billion
for the year ended December 31, 2018 as compared to $0.8 billion for the year ended December 31, 2017, driven by debt reduction including early bond repayments and lower cost of debt.
Foreign exchange losses were
$235 million
as compared to a gain of $546 million for the years ended December 31, 2018 and 2017, respectively. The foreign exchange losses were primarily due to the effect of the depreciation of the U.S. dollar against the euro on the Company's euro denominated debt in the first quarter of 2018. As of April 1, 2018, the Company designated a portfolio of euro denominated debt (€5,169 million as of December 31, 2018) as a hedge of certain euro denominated investments (€7,804 million as of December 31, 2018) in order to mitigate the foreign currency risk arising from certain euro denominated subsidiaries' net assets. The risk arises from the fluctuation in spot exchange rates between the U.S. dollar and euro, which causes the amount of the net investments to vary. The hedged risk in the hedge of net investments is a risk of a weakening euro against the U.S. dollar that will result in a reduction in the carrying amount of the Company's net investments in the subsidiaries subject to the hedge. The euro denominated debt is designated as a hedging instrument for the change in the value of the net investments that is attributable to changes in the euro/U.S. dollar spot rate. As a result
,
the Company's statement of operations no longer includes foreign exchange exposure on such euro denominated debt .
Other net financing costs (including expenses related to true sale of receivables, bank fees, interest on pensions and fair value adjustments of the call option of the mandatorily convertible bond and derivative instruments) were
$1.4 billion
for the
146
year ended December 31, 2018 compared to $0.6 billion for the year ended December 31, 2017, and included mark-to-market losses related to the mandatory convertible bond call option totaling $0.5 billion as compared to gains of $0.8 billion for the year ended December 31, 2017. Other net financing costs for the year ended December 31, 2018 also included $0.1 billion premium expense on the early redemption of bonds as compared to $0.4 billion for the year ended December 31, 2017. Other net financing costs in 2017 were negatively affected by
mark-to-market losses relating to a derivative embedded in a pellet supply agreement in the United States (due to a payment based on the evolution of the price of steel in the United States domestic steel market) of $0.3 billion.
Net financing costs were lower at $0.9 billion for the year ended December 31, 2017 as compared to $2.1 billion for the year ended December 31, 2016. Net interest expense (interest expense less interest income) was lower at $0.8 billion for the year ended December 31, 2017 as compared to $1.1 billion for the year ended December 31, 2016, driven by debt reduction including early bond repayments.
Foreign exchange gains were $546 million as compared to a loss of $3 million for the years ended December 31, 2017 and 2016, respectively. The foreign exchange gains were primarily due to the impact of the U.S. dollar depreciation on euro denominated deferred tax assets, partially offset by foreign exchange losses on euro denominated debt. The U.S. dollar depreciated 13.8% against the euro in 2017.
Other net financing costs (including expenses related to true sale of receivables, bank fees, interest on pensions and fair value adjustments of the call option of the mandatorily convertible bond and derivative instruments) was $0.6 billion for the year ended December 31, 2017 compared to $0.9 billion for the year ended December 31, 2016, and included $0.8 billion mark-to-market gains on derivatives (primarily the call option of the mandatory convertible bond following the market price increase in the underlying shares), mark-to-market losses relating to a derivative embedded in a pellet supply agreement in the United States (due to a payment based on the evolution of the price of steel in the United States domestic steel market) of $0.3 billion, $0.4 billion for premium expense on the early redemption of bonds and an expense of $92 million relating to the extension of the mandatory convertible bond.
Other net financing costs in 2016 were negatively affected by premiums and fees of
$0.4 billion
relating to early redeemed bonds in 2016 and
$0.1 billion
non-cash expense in connection with the issuance of shares in the context of a B-BBEE transaction in South Africa, partially offset by the fair value adjustment for the mandatory convertible bonds for
$0.2 billion
.
147
Income tax expense (benefit)
ArcelorMittal recorded an income tax benefit of
$0.3 billion
for the year ended December 31, 2018 as compared to income tax expense of $0.4 billion for the year ended December 31, 2017. The current income tax expense of $928 million for the year ended December 31, 2018 as compared to $583 million for the year ended December 31, 2017 was primarily driven by improved results in a number of countries. The deferred tax benefit of $1,277 million for the year ended December 31, 2018 as compared with a deferred tax benefit of $151 million for the year ended December 31, 2017 included a $1.4 billion deferred tax benefit recorded mainly in Luxembourg, due to the expectation of higher future profits. This benefit included a $0.6 billion deferred tax income in the context of the change in the currency denomination of the Company's tax losses in Luxembourg as the revised taxable income projections in U.S. dollar terms reflect a change in the foreign currency exposure of the different income streams. Following the May 16, 2018 approval of the extraordinary general meeting ("EGM") to change the share capital of the ArcelorMittal parent company from euro to U.S. dollar, the parent company will file consolidated tax returns in U.S. dollar for the main Luxembourg tax integration going forward. The euro denominated tax losses and the related deferred tax asset held by the ArcelorMittal parent company in Luxembourg were translated into U.S. dollar effective as of January 1, 2018.
ArcelorMittal recorded an income tax expense of $0.4 billion for the year ended December 31, 2017 as compared to $1.0 billion for the year ended December 31, 2016. The tax expense for the year ended December 31, 2016 included a derecognition of deferred tax assets for $0.7 billion in Luxembourg largely due to the change in tax rate, while in 2017 a deferred tax asset of $0.3 billion was recorded in Luxembourg following increased expectation of future profits.
ArcelorMittal’s consolidated income tax expense (benefit) is affected by the income tax laws and regulations in effect in the various countries in which it operates and the pre-tax results of its subsidiaries in each of these countries, which can change from year to year. ArcelorMittal operates in jurisdictions, mainly in Eastern Europe and Asia, which have a structurally lower corporate income tax rate than the statutory tax rate as enacted in Luxembourg (26.01%), as well as in jurisdictions, mainly in Brazil and Mexico, which have a structurally higher corporate income tax rate.
The statutory income tax expense (benefit) and the statutory income tax rates of the countries that most significantly resulted in the tax expense (benefit) at statutory rate for each of the years ended December 31, 2018, 2017 and 2016 are as set forth below:
148
|
2018
|
2017
|
2016
|
|||||||||
|
Statutory income tax
|
Statutory income tax rate
|
Statutory income tax
|
Statutory income tax rate
|
Statutory income tax
|
Statutory income tax rate
|
||||||
|
United States
|
44
|
21.00%
|
(98)
|
21.00%
|
224
|
35.00%
|
|||||
|
Argentina
|
6
|
25.00%
|
15
|
25.00%
|
22
|
35.00%
|
|||||
|
France
|
48
|
25.82%
|
112
|
25.82%
|
17
|
28.92%
|
|||||
|
Brazil
|
271
|
34.00%
|
69
|
34.00%
|
86
|
34.00%
|
|||||
|
Belgium
|
55
|
25.00%
|
105
|
25.00%
|
71
|
33.99%
|
|||||
|
Germany
|
(22)
|
30.30%
|
7
|
30.30%
|
(37)
|
30.30%
|
|||||
|
Spain
|
18
|
25.00%
|
(4)
|
25.00%
|
(47)
|
25.00%
|
|||||
|
Luxembourg
|
123
|
26.01%
|
1,139
|
26.01%
|
196
|
26.01%
|
|||||
|
Mexico
|
73
|
30.00%
|
(18)
|
30.00%
|
53
|
30.00%
|
|||||
|
South Africa
|
19
|
28.00%
|
(115)
|
28.00%
|
(96)
|
28.00%
|
|||||
|
Canada
|
359
|
25.90%
|
190
|
25.90%
|
98
|
26.10%
|
|||||
|
Kazakhstan
|
65
|
20.00%
|
77
|
20.00%
|
36
|
20.00%
|
|||||
|
Czech Republic
|
(51)
|
19.00%
|
(21)
|
19.00%
|
3
|
19.00%
|
|||||
|
Poland
|
45
|
19.00%
|
30
|
19.00%
|
33
|
19.00%
|
|||||
|
Romania
|
(44)
|
16.00%
|
(7)
|
16.00%
|
(11)
|
16.00%
|
|||||
|
Ukraine
|
69
|
18.00%
|
47
|
18.00%
|
20
|
18.00%
|
|||||
|
Trinidad & Tobago
|
—
|
25.00%
|
—
|
25.00%
|
66
|
25.00%
|
|||||
|
Liberia
|
(3)
|
25.00%
|
(18)
|
25.00%
|
6
|
25.00%
|
|||||
|
United Kingdom
|
8
|
17.00%
|
(1)
|
17.00%
|
15
|
17.00%
|
|||||
|
Switzerland
|
17
|
7.83%
|
(67)
|
7.83%
|
(13)
|
7.83%
|
|||||
|
Others
|
(57)
|
(35)
|
(65)
|
||||||||
|
Total
|
1,043
|
1,407
|
677
|
||||||||
Note: The statutory tax rates are the (future) rates enacted or substantively enacted by the end of the respective period.
Non-controlling interests
Net income attributable to non-controlling interests was
$181 million
for the year ended December 31, 2018 as compared to $7 million for the year ended December 31, 2017. Net income attributable to non-controlling interests increased in 2018 primarily as a result of the improved operating performance of ArcelorMittal South Africa.
Net income attributable to non-controlling interests was $7 million for the year ended December 31, 2017 as compared with net loss attributable to non-controlling interests of $45 million for the year ended December 31, 2016. Net income attributable to non-controlling interests for 2017 was primarily related to income generated by ArcelorMittal Mines and Infrastructure Canada and Belgo Bekaert Arames in Brazil partly offset by losses including impairment losses generated by ArcelorMittal South Africa.
Net income attributable to equity holders of the parent
ArcelorMittal’s net income attributable to equity holders of the parent was
$5.1 billion
,
$4.6 billion and $1.8 billion for the years ended December 31, 2018, 2017 and 2016, respectively.
B.
Liquidity and capital resources
ArcelorMittal’s principal sources of liquidity are cash generated from its operations and its credit facilities at the corporate level.
Because ArcelorMittal is a holding company, it is dependent upon the earnings and cash flows of, as well as dividends and distributions from, its operating subsidiaries to pay expenses and meet its debt service obligations. Significant cash or cash equivalent balances may be held from time to time at the Company’s international operating subsidiaries, in particular those in France and in the United States, where the Company maintains cash management systems under which most of its cash and cash
149
equivalents are centralized, and in Brazil, Canada, India, Kazakhstan, South Africa and Ukraine. Some of these operating subsidiaries have debt outstanding or are subject to acquisition agreements that impose restrictions on such operating subsidiaries’ ability to pay dividends, but such restrictions are not significant in the context of ArcelorMittal’s overall liquidity. Repatriation of funds from operating subsidiaries may also be affected by tax and foreign exchange policies in place from time to time in the various countries where the Company operates, though none of these policies is currently significant in the context of ArcelorMittal’s overall liquidity.
In management’s opinion, ArcelorMittal’s credit facilities are adequate for its present requirements.
As of December 31, 2018, ArcelorMittal’s cash and cash equivalents, including restricted cash of $182 million, amounted to
$2.4 billion
as compared to $2.8 billion as of December 31, 2017. In addition, ArcelorMittal had available borrowing capacity of $5.5 billion under its $5.5 billion revolving credit facility as of December 31, 2018 and 2017.
As of December 31, 2018, ArcelorMittal’s total debt, which includes long-term debt and short-term debt (including debt classified as held for sale) was
$12.6 billion
, compared to $12.9 billion as of December 31, 2017.
Net debt (defined as long-term debt (
$9.3 billion
) plus short-term debt (
$3.2 billion
) including debt classified as held for sale ($0.1 billion), less cash and cash equivalents and restricted cash (
$2.4 billion
) was
$10.2 billion
as of December 31, 2018, up from $10.1 billion at December 31, 2017, comprised of long-term debt ($10.1 billion) plus short-term debt ($2.8 billion), less cash and cash equivalents and restricted cash ($2.8 billion). Most of the external debt is borrowed by the parent company on an unsecured basis and bears interest at varying levels based on a combination of fixed and variable interest rates. Gearing (defined as net debt divided by total equity) at December 31, 2018 was
23%
as compared to 25% at December 31, 2017.
The margin applicable to ArcelorMittal’s principal credit facilities ($5.5 billion revolving credit facility and certain other credit facilities) and the coupons on certain of its outstanding bonds are subject to adjustment in the event of a change in its long-term credit ratings. On February 1, 2018, Standard & Poor's upgraded ArcelorMittal’s credit rating to BBB- and placed ArcelorMittal on stable outlook. On June 22, 2018, Moody's upgraded ArcelorMittal’s credit rating to Baa3 and placed it on stable outlook. On July 13, 2018, Fitch upgraded ArcelorMittal’s credit rating to BBB- and placed it on stable outlook. These upgrades resulted in reduced interest expense.
ArcelorMittal’s $5.5 billion revolving credit facility signed on December 19, 2018 and maturing on December 19, 2023 (with two one-year extension options (i.e. the options to extend are in the first and second years, so at end 2019 and at end 2020)), contains restrictive covenants. Among other things, these covenants limit encumbrances on the assets of ArcelorMittal and its subsidiaries, the ability of ArcelorMittal’s subsidiaries to incur debt and the ability of ArcelorMittal and its subsidiaries to dispose of assets in certain circumstances. The agreement also requires compliance with a financial covenant, as summarized below.
The Company must ensure that the ratio of “Consolidated Total Net Borrowings” (consolidated total borrowings less consolidated cash and cash equivalents) to “Consolidated EBITDA” (the consolidated net pre-taxation profits of the ArcelorMittal group for a Measurement Period, subject to certain adjustments as set out in the facility) does not, at the end of each “Measurement Period” (each period of 12 months ending on the last day of a financial half-year or a financial year of the Company), exceed a certain ratio, referred to by the Company as the “Leverage ratio”. ArcelorMittal’s principal credit facilities set this ratio to 4.25 to 1. The Term Facilities Agreement entered into on November 20, 2018 also includes this financial covenant (see “—Financings—Other loans and facilities” below). As of December 31, 2018, the Company was in compliance with the ratio.
Non-compliance with the covenants in the Company’s borrowing agreements would entitle the lenders under such facilities to accelerate the Company’s repayment obligations. The Company was in compliance with the financial covenants in the agreements related to all of its borrowings as of December 31, 2018 and December 31, 2017.
As of December 31, 2018, ArcelorMittal had guaranteed $99 million of debt of its operating subsidiaries. See also note 8.4 to the consolidated financial statements for all other ArcelorMittal guarantees for associates and joint ventures. ArcelorMittal’s debt facilities have provisions whereby the acceleration of the debt of another borrower within the ArcelorMittal group could, under certain circumstances, lead to acceleration under such facilities.
The following table summarizes the repayment schedule of ArcelorMittal’s outstanding indebtedness, which includes short-term and long-term debt, as of December 31, 2018.
150
|
Repayment amounts per year (in billions of $)
|
|||||||||||||||
|
Type of indebtedness as of December 31, 2018
|
2019
|
2020
|
2021
|
2022
|
2023
|
>2023
|
Total
|
||||||||
|
Bonds
|
0.9
|
|
1.9
|
|
1.3
|
|
1.5
|
|
0.5
|
|
1.6
|
|
7.7
|
|
|
|
Commercial paper
|
1.3
|
|
—
|
|
—
|
|
—
|
|
—
|
|
—
|
|
1.3
|
|
|
|
Other loans
|
1.0
|
|
1.3
|
|
0.5
|
|
0.2
|
|
0.3
|
|
0.3
|
|
3.6
|
|
|
|
Total gross debt
|
3.2
|
|
3.2
|
|
1.8
|
|
1.7
|
|
0.8
|
|
1.9
|
|
12.6
|
|
|
As of December 31, 2018, the $5.5 billion revolving credit facility was fully available.
The average debt maturity of the Company was 4.0 years as of December 31, 2018, as compared to 5.5 years as of December 31, 2017.
Further information regarding ArcelorMittal’s outstanding short-term and long-term indebtedness as of December 31, 2018, including the breakdown between fixed rate and variable rate debt, is set forth in note 6 to the consolidated financial statements. Further information regarding ArcelorMittal’s use of financial instruments for hedging purposes is set forth in note 6 to the consolidated financial statements.
Financings
The principal financings of ArcelorMittal and its subsidiaries are summarized below by category. Further information regarding ArcelorMittal’s short-term and long-term indebtedness is provided in note 6 to the consolidated financial statements.
Principal credit facilities
On December 19, 2018, ArcelorMittal signed an agreement for a $5.5 billion revolving credit facility (the "Facility"). This Facility replaced the $5.5 billion revolving credit facility dated April 30, 2015, which was amended and extended on December 21, 2016. The agreement incorporates a single tranche of $5.5 billion maturing on December 19, 2023 , with two one-year extension options (i.e. the options to extend are in the first and second years end of 2019 and end of 2020). The Facility may be used for general corporate purposes. As of December 31, 2018, the $5.5 billion revolving credit facility was fully available. The Company makes drawdowns from and repayments on this Facility in the framework of its cash management.
On September 30, 2010, ArcelorMittal entered into the $500 million revolving multi-currency letter of credit facility (the “Letter of Credit Facility”). The Letter of Credit Facility is used by the Company and its subsidiaries for the issuance of letters of credit and other instruments. The terms of the letters of credit and other instruments contain certain restrictions as to duration. The Letter of Credit Facility was amended on October 26, 2012, to reduce its amount to $450 million. On September 30, 2014, the Company refinanced its Letter of Credit Facility by entering into a $350 million revolving multi-currency letter of credit facility, which matures on May 31, 2019.
2018 and early 2019 capital markets, liability management transactions and debt repayments
On March 29, 2018, at maturity, ArcelorMittal repaid the €334 million ($411 million) principal amount that remained outstanding, following the cash tender offers in April 2016 of its €500 million 4.5% unsecured bonds.
On April 9, 2018, at maturity, ArcelorMittal repaid its €400 million ($491 million) 2018 Floating Rate Notes.
On August 7, 2018, pursuant to cash tender offers and financed with existing cash and liquidity, ArcelorMittal purchased:
|
•
|
$432 million of its U.S. dollar denominated 7.00% Notes due October 15, 2039 (the “2039 Notes”) for a total aggregate purchase price (including premiums and accrued interest) of $505 million. Following this purchase, $686 million principal amount of the 2039 Notes remained outstanding.
|
|
•
|
$195 million of its U.S. dollar denominated 6.75% Notes due March 1, 2041 (the “2041 Notes”) for a total aggregate purchase price (including premiums and accrued interest) of $224 million. Following this purchase, $434 million principal amount of the 2041 Notes remained outstanding.
|
On January 17, 2019, ArcelorMittal issued €750 million 2.250% Notes due 2024. The Notes were issued under ArcelorMittal’s €10 billion wholesale Euro Medium Term Notes Program.
151
Mandatory convertible bond
On December 14, 2017, the Company extended the conversion date for the $1 billion privately placed mandatory convertible bond (the “MCB”) issued by Hera Ermac, a wholly-owned Luxembourg subsidiary. The MCB is mandatorily convertible into preferred shares of such subsidiary. The mandatory conversion date of the bond has been extended to January 29, 2021. The Company has the option to call the mandatory convertible bond until 10 business days before the maturity date. Hera Ermac invested the proceeds of the bond issuance and an equity contribution by the Company in notes issued by subsidiaries of the Company linked to the values of shares of Erdemir and China Oriental. The bond was privately placed with Credit Agricole Corporate and Investment Bank and is not listed. In connection with the extension of the conversion date of the MCB, ArcelorMittal also extended the maturities of the equity-linked notes in which the proceeds of the MCB issuances are invested. The other main features of the MCB remain unchanged. See note 10.2 to the consolidated financial statements for additional details.
Commercial paper program
ArcelorMittal has a commercial paper program enabling borrowings of up to €1.5 billion. As of December 31, 2018, the outstanding amount was $1,295 million, compared to $1,125 million as of December 31, 2017.
Other loans and facilities
On December 18, 2018, ArcelorMittal entered into an agreement for financing with a financial institution for net proceeds of CAD 292 million ($214 million) with repayment over several dates in 2019 and 2020. As of December 31, 2018, CAD 295 million ($216 million) was outstanding.
On November 20, 2018, ArcelorMittal entered into a $7 billion term facility agreement with a group of lenders in connection with the acquisition of ESIL. The agreement has a term of one year (until November 20, 2019), subject to ArcelorMittal’s option to extend the term by six months. The facility may be used for certain payments by ArcelorMittal as well as by the joint venture through which the Company expects jointly to own and operate ESIL in partnership with Nippon Steel & Sumitomo Metal Corporation (the “Joint Venture”). Any amounts borrowed by the Joint Venture under the agreement are irrevocably and unconditionally guaranteed by ArcelorMittal.
The agreement includes the same Leverage Ratio financial covenant as that included in the Company’s $5.5 billion revolving credit facility and is also subject to certain mandatory prepayment events, including the use of proceeds from debt capital market issuances by the Group or capital raising by the Joint Venture and certain disposals, in each case above $1 billion.
See
"Item 4.A—Information on the Company—History and development of the Company—
Key transactions and events in 2018
" for further information.
On August 10, 2018, ArcelorMittal entered into a €300 million ($344 million) term loan with a financial institution maturing on April 30, 2019.
On May 14, 2018, ArcelorMittal entered into a term facility agreement in the amount of $1 billion to make a payment to the financial creditors of Uttam Galva and KSS Petron to clear overdue debts in order that the offer the Company submitted for ESIL on April 2, 2018 would be eligible and considered by ESIL’s Committee of Creditors. The facility was drawn on May 14, 2018 in connection with the subsequent payment and was repaid on November 29, 2018 via a drawing under the above-referenced $7 billion term facility.
On January 16, 2018, the Company entered into a fully drawn bilateral term loan due July 16, 2018, for an amount of €400 million ($466 million). The bilateral term loan was fully repaid on July 16, 2018.
On December 21, 2017, ArcelorMittal Kryvyi Rih entered into a $175 million loan agreement with the European Bank for Reconstruction and Development in order to support the upgrade of its production facilities, energy efficiency improvement and environmental impact reduction. The loan agreement also provides for an additional $175 million in loan facilities which are currently uncommitted. As of December 31, 2018, $50 million was drawn under the agreement and the remainder remained fully available.
On October 9, 2017, ArcelorMittal issued a €300 million ($344 million) variable rate loan in the German Schuldschein market. The proceeds of the issuance were used to repay or prepay existing indebtedness.
On May 25, 2017, ArcelorMittal South Africa signed a 4.5 billion South African rand revolving borrowing base finance facility maturing on May 25, 2020. Any borrowings under the facility are secured by certain eligible inventory and receivables, as well as certain other working capital and related assets of ArcelorMittal South Africa. The facility is used for general
152
corporate purposes. The facility is not guaranteed by ArcelorMittal. As of December 31, 2018, 0.3 billion South African rand ($21 million) was drawn.
On December 16, 2016, ArcelorMittal signed a €350 million finance contract with the European Investment Bank in order to finance European research, development and innovation projects over the period 2017-2020 within the European Union, namely predominantly France, Belgium and Spain, but also in Czech Republic, Poland, Luxembourg and Romania. This operation benefits from a guarantee from the European Union under the European Fund for Strategic Investments. As of December 31, 2018, €350 million ($401 million) was fully drawn.
On May 23, 2016, ArcelorMittal USA LLC signed a $1 billion senior secured asset-based revolving credit facility maturing on May 23, 2021. Borrowings under the facility are secured by inventory and certain other working capital and related assets of ArcelorMittal USA and certain of its subsidiaries in the United States. The facility may be used for general corporate purposes. The facility is not guaranteed by ArcelorMittal. As of December 31, 2018, the facility was fully available.
In 2014, ArcelorMittal entered into certain short-term committed bilateral credit facilities. The facilities were extended in 2015, 2016, 2017 and 2018. As of December 31, 2018, the facilities, totaling approximately $0.9 billion, remained fully available.
True sale of receivables (“TSR”) programs
The Company has established a number of programs for sales without recourse of trade accounts receivable to various financial institutions (referred to as true sale of receivables (“TSR”)). As of December 31, 2018, the total amount of trade accounts receivables sold amounted to $4,980 million. Through the TSR programs, certain operating subsidiaries of ArcelorMittal surrender the control, risks and benefits associated with the accounts receivable sold; therefore, the amount of receivables sold is recorded as a sale of financial assets and the balances are removed from the consolidated statements of financial position at the moment of sale.
Earnings distribution
On November 6, 2015, ArcelorMittal’s Board of Directors proposed the suspension of the dividend for the financial year 2015. This proposal was approved by the shareholders at the annual general meeting held on May 4, 2016. The Company had indicated that a dividend will not be proposed until its leverage had further improved.
ArcelorMittal held 8.3 million shares in treasury as of December 31, 2018, as compared to 2.0 million shares as of December 31, 2017. As of December 31, 2018, the number of shares held by the Company in treasury represented approximately 0.82% of the Company’s total issued share capital.
On January 31, 2018, the Company announced that the Board had agreed on a new dividend policy which was approved by the shareholders at the annual general meeting of shareholders in May 2018. Given the current de-leveraging focus, dividends begin at $0.10/share in 2018 (paid from 2017 results). The Company intends to progressively increase the base dividend paid to its shareholders, and, on attainment of the net debt target, return a percentage of net cash provided by operating activities annually. Accordingly, the Board is proposing an increase in the base dividend for 2019 (paid from 2018 earnings) to $0.20 per share to the shareholders at the annual shareholders meeting in May 2019.
Pension/OPEB liabilities
The defined benefit liabilities for employee benefits decreased $0.6 billion to $6.9 billion as of December 31, 2018, as compared to $7.5 billion as of December 31, 2017. The decrease is mainly due to the decrease in the defined benefit obligation due to higher discount rates during 2018. For ad
ditional information with respect to the Company’s pension plan and OPEB liabilities, including a breakdown by region and by typ
e of plan, see note 7.2 to the consolidated financial statements.
153
IFRS 16
As described in note 1.3.2. to the consolidated financial statements, IFRS 16 “Leases” applies from January 1, 2019. At December 31, 2018 and 2017, the Company had non-cancellable operating lease commitments on an undiscounted basis of $1,869 million and $1,311 million, respectively (see note 8.4 to the consolidated financial statements). A review and assessment of the Company's lease arrangements indicates that most of these arrangements will meet the definition of a lease under IFRS 16 and the Company’s gross debt and net debt will increase accordingly.
As at December 31, 2018, the Company expects to recognize on January 1, 2019 additional lease liabilities (discounted at the incremental borrowing rates at that date) and right-of-use assets for an amount of $1.1 billion.
IFRS 9
In connection with the initial application of IFRS 9, as of January 1, 2018, equity instruments with a carrying amount of $1,471 million were reclassified from assets available-for-sale to financial assets at fair value through other comprehensive income. As a result, unrealized gains and losses of investment in such equity instruments are no longer recycled to the consolidated statement of operations upon disposal but are now reclassified from other comprehensive income to retained earnings within equity upon disposal. The $608 million loss recorded in comprehensive income in 2018 was mainly related to the decrease in the share price of Erdemir.
Sources and uses of cash
Years ended December 31, 2018, 2017 and 2016
The following table presents a summary of cash flow of ArcelorMittal:
|
Summary of cash flow
|
For the year ended December 31,
|
||||
|
(in $ millions)
|
2018
|
2017
|
2016
|
||
|
Net cash provided by operating activities
|
4,196
|
4,563
|
2,708
|
||
|
Net cash used in investing activities
|
(3,759)
|
(2,830)
|
(1,143)
|
||
|
Net cash used in financing activities
|
(689)
|
(1,731)
|
(2,926)
|
||
Net cash provided by operating activities
For the year ended December 31, 2018, net cash provided by operating activities decreased to
$4.2 billion
, as compared with $4.6 billion for the year ended December 31, 2017. The decrease in net cash provided by operating activities was mainly due to an investment in operating working capital of $4.38 billion which represented an outflow for trade accounts receivable of
$0.65 billion
, an outflow for inventories of
$4.65 billion
and an inflow for trade accounts payable and other of
$0.91 billion
, partially offset by an increase in operating income driven by the increase in average steel selling prices offset by lower steel shipments. The operating working capital investment for the year ended December 31, 2018 largely reflected the price effect of improved market conditions which impacted operating working capital through higher inventories and higher trade receivables. The investment in operating working capital for the year ended December 31, 2018 reflected a lower than anticipated release of working capital in the fourth quarter of 2018 due to the weaker apparent demand conditions leading to an accumulation of metal stock and raw material volumes.
For the year ended December 31, 2017, net cash provided by operating activities increased to $4.6 billion, as compared with $2.7 billion for the year ended December 31, 2016. The increase in net cash provided by operating activities is mainly due to an increase in operating income driven by the increase in average steel selling prices partially offset by increases in the raw material costs and an investment in operating working capital of $1.88 billion which represented an outflow for trade accounts receivable of $0.62 billion, an outflow for inventories of $2.35 billion and an inflow for trade accounts payable and other of $1.09 billion.
154
Net cash used in investing activities
Net cash used in investing activities was
$3.8 billion
for the year ended December 31, 2018 as compared to $2.8 billion for the year ended December 31, 2017. Capital expenditures increased to
$3.3 billion
for the year ended December 31, 2018 as compared to $2.8 billion for the year ended December 31, 2017. Capital expenditures for the year ended December 31, 2018 was lower than expected due to underspending in certain strategic projects (see “Item 4.D—Information on the Company—Property, plant and equipment—Capital expenditure projects”) and at Ilva due to the acquisition only being completed in November 2018. Cash used in investing activities for the year ended December 31, 2018 included the acquisition of the Uttam Galva and KSS Petron debt for $1,001 million in the context of the ESIL bidding process, offset in part by the proceeds from the sale of Go Steel Frýdek Místek ($39 million), the second installment of proceeds of $44 million from the disposal of ArcelorMittal USA’s 21% stake in the Empire Iron Mining Partnership, $220 million of sale proceeds following the disposal of the Company's 50% interest in Macsteel and $55 million relating to the release of restricted cash related to the mandatory convertible bond following contractual renegotiation.
Net cash used in investing activities was $2.8 billion for the year ended December 31, 2017 as compared to $1.1 billion for the year ended December 31, 2016. Cash from investing activities for the year ended December 31, 2017 included tangible asset disposals and proceeds from the disposal of U.S. long products Georgetown, the first installment of proceeds of $44 million from the disposal of ArcelorMittal USA’s 21% stake in the Empire Iron Mining Partnership offset by $44 million cash consideration (net of cash acquired for $14 million and $5 million to be paid upon conclusion of certain business restructuring measures) for the acquisition of a 55.5% stake in Bekaert Sumaré and $110 million deposited in a restricted cash account in ArcelorMittal South Africa in connection with various environmental obligations and true sales of receivables programs.
ArcelorMittal’s major capital expenditures in the year ended December 31, 2018 included the following projects: the Mexico hot strip mill, the new LF&CC 2&3 in ArcelorMittal Kryvyi Rih, the modernization of ArcelorMittal Dofasco's hot strip mill, the footprint optimization project at Indiana Harbor and the new walking beam furnaces at Burns Harbor, along with other ongoing projects.
See “Item 4.D—Information on the Company—Property, plant and equipment—Capital expenditure projects” for a summary of these and other projects.
In 2019, capital expenditure is expected to be approximately $4.3 billion reflecting carry over from underspend in 2018 (approximately $0.4 billion), the impact of Ilva and the continued high return investments in Mexico and Brazil and other strategic projects (largely cost optimization).
See “Item 4.D—Information on the Company—Property, plant and equipment—Capital expenditure projects”.
Net cash used in financing activities
Net cash used in financing activities was
$0.7 billion
for the year ended December 31, 2018, as compared to $1.7 billion in 2017. In 2018, net cash used by financing activities included $0.2 billion net payments/proceeds for short and long-term debt, dividend payments of $220 million and $226 million outflow related to the share buyback program. Net cash used by financing activities for the year ended December 31, 2017 included net payments/proceeds for short and long-term debt of
$1.5 billion
.
Net cash used by financing activities for the year ended December 31, 2017 included
$1.2 billion
of bonds repurchased pursuant to cash tender offers,
$0.6 billion
repayment at maturity of the euro denominated
4.625%
Notes,
$0.6 billion
used to early redeem the
6.125%
Notes due June 1, 2018 and
$1.0 billion
used to early redeem the
9.85%
Notes due June 1, 2019, offset in part by a new
$0.4 billion
Schuldschein loan, a
$0.4 billion
loan from the European Investment Bank,
$0.3 billion
drawdown on the
4.5 billion
South African rand revolving borrowing base finance facility and $0.6 billion proceeds from the issuance of euro denominated
0.95%
Notes due January 17, 2023.
For further details related to capital markets, liability management transactions and debt repayments in 2018, see “Item 5.B—Operating and financial review and prospects—Liquidity and capital resources” above.
Net cash used by financing activities was $1.7 billion for the year ended December 31, 2017, as compared to $2.9 billion in 2016. In 2016, net cash used in financing activities included $6.0 billion net payments/proceeds for short and long-term debt, partially offset by the $3.1 billion proceeds from the Company’s equity offering, while for the year ended December 31, 2017, net payment/proceeds for short and long-term debt was $1.5 billion.
Dividends paid during the year ended December 31, 2018 were $220 million, including $101 million paid to ArcelorMittal shareholders and $119 million paid to non-controlling shareholders in subsidiaries
. Dividends paid to non-controlling shareholders in subsidiaries during the year ended December 31, 2017 were $141 million.
Dividends paid during the year ended December 31, 2016 were $61 million.
155
Equity
Equity attributable to the equity holders of the parent increased to
$42.1 billion
at December 31, 2018, as compared to $38.8 billion at December 31, 2017, primarily due to net income attributable to the equity holders of the parent of
$5.1 billion
and $0.6 billion actuarial gains
partly offset by $2.2 billion foreign exchange losses. See note 10 to ArcelorMittal’s consolidated financial statements for the year ended December 31, 2018.
Equity attributable to the equity holders of the parent increased to $38.8 billion at December 31, 2017, as compared to $30.1 billion at December 31, 2016, primarily due to net income attributable to the equity holders of the parent of $4.6 billion, $2.6 billion foreign exchange gains and $1.2 billion in actuarial gains.
C.
Research and development, patents and licenses
For information on the Company’s research and development policies, see "Item 4.B—Information on the Company—Business overview—Competitive strengths—Research and development" above for further details.
D.
Trend information
All of the statements in this “Trend Information” section are subject to and qualified by the information set forth under the “Cautionary Statement Regarding Forward-Looking Statements”. See also
“Item 5—Operating and financial review and prospects—Key factors affecting results of operations”.
Outlook
Based on the current economic outlook, ArcelorMittal expects a slight expansion in global ASC in 2019 by +0.5% to +1% (versus growth of +2.8% in 2018). By region: ASC in the United States is expected to grow +0.5% to +1.5% in 2019, with automotive demand to remain broadly stable, growth is driven by continued albeit weaker demand in machinery and construction (a moderation of growth versus +1.7% in 2018). In Europe, continued strength in construction is balanced by stable automotive demand and slower growth in machinery and is expected to support ASC growth of approximately +0.5% to +1.0% in 2019 (a moderation of growth versus +2.9% in 2018). In Brazil, ASC growth in 2019 is forecasted in the range of +3.5% to +4.5% (a moderation of growth versus +7.3% in 2018) as growth in automotive and machinery slows but construction activity grows for the first time since 2013. In the CIS, ASC is expected to grow +1.0% to +2.0% in 2019 (versus +1.8% in 2018). Overall, World ex-China ASC is expected to grow by approximately +2.0% to +3.0% in 2019, slight stronger than in 2018 due to stabilization in Turkey after a significant decline in 2018 (versus +2.1% in 2018). In China, overall demand is expected to decline by between -0.5% to -1.5% in 2019 (versus growth of +3.5% in 2018) as relatively stable demand from automotive and construction is offset by declining machinery output. Given these demand expectations, as well as the expectation that operational disruptions (both controllable and uncontrollable) that negatively impacted 2018 shipments will not recur, the Company's steel shipments are expected to increase in 2019 versus 2018.
Market-priced iron ore shipments for 2019 are expected to be broadly stable as compared to 2018 with increases in Liberia and AMMC to be offset by lower volume in Mexico (in part due to the end of life of the Volcan mine).
The Company expects capital expenditures to increase by $1.0 billion to $4.3 billion in 2019 from $3.3 billion in 2018, including $0.4 billion carryover from underspend from 2018, the impact of Ilva ($0.4 billion) and the continued investment in higher return projects in Mexico and Brazil. Interest is expected to be stable at $0.6 billion, and cash taxes are expected to increase primarily on account of certain cash tax settlements deferred from 2018.
Due to a smaller than anticipated release in the fourth quarter of 2018, the Company invested more in working capital than expected in 2018 ($4.4 billion versus guidance of $3.0-3.5 billion). The Company expects this additional investment to be released over the course of 2019. The extent of this release will be dictated by market conditions, particularly the price and volume environment in the final weeks.
E. Off-balance sheet arrangements
156
As of December 31, 2018, the Company had no off-balance sheet arrangements that have, or are reasonably likely to have, a material effect on its financial condition, revenues or expenses, results of operations, liquidity, capital expenditures or capital resources.
F. Tabular disclosure of contractual obligations
ArcelorMittal has various purchase commitments for materials, supplies and items of permanent investment incidental to the ordinary course of business. As of December 31, 2018, ArcelorMittal’s management believes that these commitments are not in excess of current market prices and reflect normal business operations.
ArcelorMittal had outstanding, as of December 31, 2018, various long-term obligations that will become due in 2019 and beyond. These various purchase commitments and long-term obligations will have an effect on ArcelorMittal’s future liquidity and capital resources. The table below shows, by major category of commitment and obligations outstanding as of December 31, 2018, ArcelorMittal’s current estimate of their annual maturities (undiscounted except for environmental commitments and asset retirement obligations).
|
(amounts in $ millions)
|
Total
|
Less than 1 year
|
1-3 years
|
3-5 years
|
More than 5 years
|
||||||||||
|
Debt obligations—scheduled repayments—note 6.1.2 to the consolidated financial statements
|
12,483
|
|
3,167
|
|
4,932
|
|
2,498
|
|
1,886
|
|
|||||
|
Operating lease obligations—note 8.4 to the consolidated financial statements
|
1,869
|
|
322
|
|
414
|
|
262
|
|
871
|
|
|||||
|
Environmental commitments and asset retirement obligations—note 8.1 and note 8.3 to the consolidated financial statements
1
|
1,650
|
|
256
|
|
456
|
|
291
|
|
647
|
|
|||||
|
Purchase obligations—note 8.4 to the consolidated financial statements
|
24,594
|
|
8,173
|
|
6,573
|
|
3,863
|
|
5,985
|
|
|||||
|
Funding contribution to the pension and post-employment plans
2
|
425
|
|
425
|
|
—
|
|
—
|
|
—
|
|
|||||
|
Scheduled interest payments
|
2,755
|
|
455
|
|
645
|
|
308
|
|
1,347
|
|
|||||
|
Other long-term liabilities
|
346
|
|
102
|
|
164
|
|
2
|
|
78
|
|
|||||
|
Acquisition/investment commitments—note 8.4 to the consolidated financial statements
|
697
|
|
411
|
|
284
|
|
1
|
|
1
|
|
|||||
|
Total
|
44,819
|
|
13,311
|
|
13,468
|
|
7,225
|
|
10,815
|
|
|||||
|
1
|
ArcelorMittal may be subject to additional environmental liabilities not included in the table above.
|
|
2
|
The funding contributions to the pension and post-retirement plans are presented for the following year and to the extent known.
|
Estimated payments for long-term obligations have been determined by ArcelorMittal based on payment schedules for those long-term obligations where set payments exist. For long-term obligations with no set payment schedules, estimates have been made by ArcelorMittal based on the most likely timing of cash payments based on the facts and circumstances that exist as of December 31, 2018. Also included are liabilities related to environmental matters, which are further discussed in notes 8.1 and 8.3 to the consolidated financial statements. For further details on commitments, please refer to note 8.4 to the consolidated financial statements.
G. Safe harbor
All information that is not historical in nature and disclosed under “Item 5—Operating and financial review and prospects” is deemed to be a forward-looking statement. See “Cautionary Statement Regarding Forward-Looking Statements”.
|
ITEM 6.
|
DIRECTORS, SENIOR MANAGEMENT AND EMPLOYEES
|
157
A.
Directors and senior management
Board of Directors
ArcelorMittal places a strong emphasis on corporate governance. ArcelorMittal has five independent directors on its nine member Board of Directors. The Board’s Audit & Risk Committee and Appointments, Remuneration, Corporate Governance and Sustainability Committee (“ARCGS Committee”) are each comprised exclusively of independent directors.
The annual general meeting of shareholders on May 9, 2018 acknowledged the expiration of the terms of office of Mrs. Karyn Ovelmen and Mr. Tye Burt.
At the same meeting, the shareholders re-elected Mrs. Karyn Ovelmen and Mr. Tye Burt for a new term of three years each.
The Board of Directors is composed of nine directors, of which eight are non-executive directors and five are independent directors. The Board of Directors comprises only one executive director, Mr. Lakshmi N. Mittal, the Chairman and Chief Executive Officer of ArcelorMittal.
Mr. Bruno Lafont is the Lead Independent Director. In the most recent assessment of the Company’s leadership structure, the ARCGS Committee reviewed the key duties and responsibilities of the Company’s Chairman and Chief Executive Officer and its Lead Independent Director as follows:
|
Chairman
|
Lead Independent Director
|
|
* Chairs the Board of Directors' and shareholders' meetings
|
* Provides independent leadership to the Board of Directors
|
|
* Works with the Lead Independent Director to set agenda for the Board of Directors and reviews the schedule of the meetings
|
* Presides at executive sessions of independent directors
|
|
* Serves as a public face of the Board of Directors and of the Company
|
* Advises the Chairman of any decisions reached and suggestions made at the executive sessions, as appropriate
|
|
* Serves as a resource for the Board of Directors
|
* Coordinates the activities of the other independent directors
|
|
* Guides discussions at the Board of Directors meetings and encourages directors to express their positions
|
* Oversees Board of Directors' governance processes, including succession planning and other governance-related matters
|
|
* Communicates significant business developments and time-sensitive matters to the Board of Directors
|
* Liaison between the Chairman and the other independent directors
|
|
* Is responsible for managing day-to-day business and affairs of the Company
|
* Calls meetings of the independent directors when necessary and appropriate
|
|
* Interacts with the CEO Office and Executive Officers of the Company and frequently meets stakeholders and provides feedback to the Board of Directors
|
* Leads the Board of Directors’ self-evaluation process and such other duties as are assigned from time to time by the Board of Directors
|
The members of the Board of Directors are set out below:
158
|
Name
|
Age
4
|
Date of joining the Board
5
|
End of Term
|
Position within ArcelorMittal
|
||||
|
Lakshmi N. Mittal
|
68
|
May 1997
|
May 2020
|
Chairman of the Board of Directors and Chief Executive Officer
|
||||
|
Vanisha Mittal Bhatia
|
38
|
December 2004
|
May 2019
|
Director
|
||||
|
Jeannot Krecké
|
68
|
January 2010
|
May 2019
|
Director
|
||||
|
Suzanne P. Nimocks
2 3
|
59
|
January 2011
|
May 2019
|
Director
|
||||
|
Bruno Lafont
1 2 3
|
62
|
May 2011
|
May 2020
|
Lead Independent Director
|
||||
|
Tye Burt
2 3
|
61
|
May 2012
|
May 2021
|
Director
|
||||
|
Michel Wurth
|
64
|
May 2014
|
May 2020
|
Director
|
||||
|
Karyn Ovelmen
1 3
|
55
|
May 2015
|
May 2021
|
Director
|
||||
|
Karel de Gucht
1 3
|
64
|
May 2016
|
May 2019
|
Director
|
||||
|
1.
|
Member of the Audit & Risk Committee.
|
|
2.
|
Member of the Appointments, Remuneration, Corporate Governance and Sustainability Committee.
|
|
3.
|
Non-executive and independent director.
|
|
4.
|
Age as of December 31, 2018.
|
|
5.
|
Date of joining the Board of ArcelorMittal or, if prior to 2006, its predecessor Mittal Steel Company NV.
|
Henk Scheffer is the Company Secretary and, accordingly, acts as secretary of the Board of Directors.
159
Lakshmi N. Mittal
68, is the Chairman and Chief Executive of ArcelorMittal, a renowned global businessman who serves on the boards of various advisory councils, and an active philanthropist engaged in the fields of education and child health. Mr. Mittal was born in Sadulpur in Rajasthan in 1950. He graduated from St Xavier’s College in Kolkata, where he received a Bachelor of Commerce degree. Having completed his education in India, Mr. Mittal began his career working in his family’s steelmaking business in India before moving to Indonesia in 1976 to set up a small steel company that over time grew to become ArcelorMittal, the world’s leading steel company and one of the foremost industrial companies in the world. He is widely recognized for the role he played in restructuring the steel industry towards a more consolidated and globalized model, pursuing and successfully integrating many acquisitions in North America, South America, Europe, South Africa and the CIS. Today ArcelorMittal continues to be the largest and most global steel manufacturer. "Mittal Steel" became the world’s leading steel producer in 2004 following the merger of Ispat International and LNM Holdings, and the simultaneous acquisition of International Steel Group. Shortly after, in 2006, Mittal Steel launched an ambitious bid to merge with Arcelor which created ArcelorMittal. Mr. Mittal’s contribution to business and global industry has been widely recognized. In 1996 he was awarded “Steelmaker of the Year” by New Steel in the United States and in 1998 the “Willy Korf Steel Vision Award” by World Steel Dynamics for outstanding vision, entrepreneurship, leadership and success in global steel development. He was named Fortune magazine’s “European Businessman of the Year” in 2004 and “Business Person of the year” by the Sunday Times, “International Newsmaker of the Year” by Time Magazine and “Person of the Year” by the Financial Times in 2006 for his outstanding business achievements. In January 2007, Mr. Mittal was presented with a Fellowship from King’s College London, the college’s highest award. In 2007 he also received the Dwight D. Eisenhower Global Leadership Award, the Grand Cross of Civil Merit from Spain and was named AIST Steelmaker of the year. In January 2008, Mr. Mittal was awarded the Padma Vibhushan, India’s second highest civilian honor, by the President of India. In September 2008, Mr. Mittal was chosen for the third “Forbes Lifetime Achievement Award.” In October 2010, he was awarded World Steel Association’s medal in recognition of his services to the Association as its Chairman and also for his contribution to the sustainable development of the global steel industry. In January 2013, Mr. Mittal was awarded a Doctor Honoris Causa by the AGH University of Science and Technology in Krakow, Poland. In April 2018, Mr. Mittal was awarded by the American Iron and Steel Institute with the Gary medal award recognizing his great contribution to the steel industry. In addition to his role at ArcelorMittal, Mr. Mittal is an active participant of various boards and advisory councils. He is Chairman of the board of Aperam and a member of the board of Goldman Sachs. He previously sat on the board of Airbus N.V. He is a member of the Foreign Investment Council in Kazakhstan, the National Investment Council of Ukraine, the Global CEO Council of the Chinese People’s Association for Friendship with Foreign Countries, the World Economic Forum’s International Business Council, the World Steel Association’s Executive Committee, the European Round Table of Industrialists, the Indian School of Business and a member of the board of Trustees of Cleveland Clinic. Mr. Mittal, with his wife Usha Mittal, is also an active philanthropist. The Mittal family recently made a significant gift to Harvard to support the Lakshmi Mittal South Asia Institute and Mr. Mittal is a member of the Global Advisory Council of Harvard University. The Mittal family has also made important gifts to Great Ormond Street Hospital, supporting the Mittal Children’s Medical Centre which formally opened in January 2018, and UNICEF, specifically on the topic of child malnutrition in India. Mr. Mittal and his wife Usha Mittal have a son, Aditya Mittal (who is President and Chief Financial Officer of ArcelorMittal), and a daughter, Vanisha Mittal Bhatia (who is a Director of ArcelorMittal). Mr. Mittal is a citizen of India
.
,
68, is the Chairman and Chief Executive of ArcelorMittal, a renowned global businessman who serves on the boards of various advisory councils, and an active philanthropist engaged in the fields of education and child health. Mr. Mittal was born in Sadulpur in Rajasthan in 1950. He graduated from St Xavier’s College in Kolkata, where he received a Bachelor of Commerce degree. Having completed his education in India, Mr. Mittal began his career working in his family’s steelmaking business in India before moving to Indonesia in 1976 to set up a small steel company that over time grew to become ArcelorMittal, the world’s leading steel company and one of the foremost industrial companies in the world. He is widely recognized for the role he played in restructuring the steel industry towards a more consolidated and globalized model, pursuing and successfully integrating many acquisitions in North America, South America, Europe, South Africa and the CIS. Today ArcelorMittal continues to be the largest and most global steel manufacturer. "Mittal Steel" became the world’s leading steel producer in 2004 following the merger of Ispat International and LNM Holdings, and the simultaneous acquisition of International Steel Group. Shortly after, in 2006, Mittal Steel launched an ambitious bid to merge with Arcelor which created ArcelorMittal. Mr. Mittal’s contribution to business and global industry has been widely recognized. In 1996 he was awarded “Steelmaker of the Year” by New Steel in the United States and in 1998 the “Willy Korf Steel Vision Award” by World Steel Dynamics for outstanding vision, entrepreneurship, leadership and success in global steel development. He was named Fortune magazine’s “European Businessman of the Year” in 2004 and “Business Person of the year” by the Sunday Times, “International Newsmaker of the Year” by Time Magazine and “Person of the Year” by the Financial Times in 2006 for his outstanding business achievements. In January 2007, Mr. Mittal was presented with a Fellowship from King’s College London, the college’s highest award. In 2007 he also received the Dwight D. Eisenhower Global Leadership Award, the Grand Cross of Civil Merit from Spain and was named AIST Steelmaker of the year. In January 2008, Mr. Mittal was awarded the Padma Vibhushan, India’s second highest civilian honor, by the President of India. In September 2008, Mr. Mittal was chosen for the third “Forbes Lifetime Achievement Award.” In October 2010, he was awarded World Steel Association’s medal in recognition of his services to the Association as its Chairman and also for his contribution to the sustainable development of the global steel industry. In January 2013, Mr. Mittal was awarded a Doctor Honoris Causa by the AGH University of Science and Technology in Krakow, Poland. In April 2018, Mr. Mittal was awarded by the American Iron and Steel Institute with the Gary medal award recognizing his great contribution to the steel industry. In addition to his role at ArcelorMittal, Mr. Mittal is an active participant of various boards and advisory councils. He is Chairman of the board of Aperam and a member of the board of Goldman Sachs. He previously sat on the board of Airbus N.V. He is a member of the Foreign Investment Council in Kazakhstan, the National Investment Council of Ukraine, the Global CEO Council of the Chinese People’s Association for Friendship with Foreign Countries, the World Economic Forum’s International Business Council, the World Steel Association’s Executive Committee, the European Round Table of Industrialists, the Indian School of Business and a member of the board of Trustees of Cleveland Clinic. Mr. Mittal, with his wife Usha Mittal, is also an active philanthropist. The Mittal family recently made a significant gift to Harvard to support the Lakshmi Mittal South Asia Institute and Mr. Mittal is a member of the Global Advisory Council of Harvard University. The Mittal family has also made important gifts to Great Ormond Street Hospital, supporting the Mittal Children’s Medical Centre which formally opened in January 2018, and UNICEF, specifically on the topic of child malnutrition in India. Mr. Mittal and his wife Usha Mittal have a son, Aditya Mittal (who is President and Chief Financial Officer of ArcelorMittal), and a daughter, Vanisha Mittal Bhatia (who is a Director of ArcelorMittal). Mr. Mittal is a citizen of India
.
Vanisha Mittal Bhatia
,
38, is a non-independent Director of ArcelorMittal. She was appointed as a member of the LNM Holdings Board of Directors in June 2004. Ms. Vanisha Mittal Bhatia was appointed to Mittal Steel’s Board of Directors in December 2004, where she worked in the Procurement department leading various initiatives including "total cost of ownership program". She joined Aperam in April 2011 and since has held the position of Chief Strategy Officer. She has a Bachelor of Sciences from the European Business School. She is also the daughter of Mr. Lakshmi N. Mittal and sister of Mr. Aditya Mittal. Ms. Mittal Bhatia is a citizen of India.
160
Jeannot Krecké
68, is a non-executive and non-independent Director of ArcelorMittal. He started his university studies at the Université Libre de Bruxelles (ULB) in Belgium in 1969, from where he obtained a degree in physical and sports education. He decided in 1983 to change professional direction. His interests led him to retrain in economics, accounting and taxation. He enrolled in various courses, in particular in the United States. Following the legislative elections of June 13, 2004, Mr. Krecké was appointed Minister of the Economy and Foreign Trade of Luxembourg on July 13, 2004. Upon the return of the coalition government formed by the Christian Social Party (CSV) and the Luxembourg Socialist Workers’ Party (LSAP) as a result of the legislative elections of June 7, 2009, Mr. Krecké retained the portfolio of Minister of the Economy and Foreign Trade on July 23, 2009. As of July 2004, Mr. Krecké represented the Luxembourg government at the Council of Ministers of the EU in the Internal Market and Industry sections of its Competitiveness configuration, as well as in the Economic and Financial Affairs Council, and in the Energy section of its Transport, Telecommunications and Energy configuration. He was also a member of the Eurogroup from July 2004 to June 2009. On February 1, 2012, Mr. Krecké retired from government and decided to end his active political career in order to pursue a range of different projects. Mr. Krecké is currently the CEO of Key International Strategy Services. He is a member of the boards of JSFC Sistema, of East West United Bank, of Calzedonia Finanziara S.A., Jan De Nul S.A. and Novenergia Holding Company S.A. Mr. Krecké is a citizen of Luxembourg.
,
68, is a non-executive and non-independent Director of ArcelorMittal. He started his university studies at the Université Libre de Bruxelles (ULB) in Belgium in 1969, from where he obtained a degree in physical and sports education. He decided in 1983 to change professional direction. His interests led him to retrain in economics, accounting and taxation. He enrolled in various courses, in particular in the United States. Following the legislative elections of June 13, 2004, Mr. Krecké was appointed Minister of the Economy and Foreign Trade of Luxembourg on July 13, 2004. Upon the return of the coalition government formed by the Christian Social Party (CSV) and the Luxembourg Socialist Workers’ Party (LSAP) as a result of the legislative elections of June 7, 2009, Mr. Krecké retained the portfolio of Minister of the Economy and Foreign Trade on July 23, 2009. As of July 2004, Mr. Krecké represented the Luxembourg government at the Council of Ministers of the EU in the Internal Market and Industry sections of its Competitiveness configuration, as well as in the Economic and Financial Affairs Council, and in the Energy section of its Transport, Telecommunications and Energy configuration. He was also a member of the Eurogroup from July 2004 to June 2009. On February 1, 2012, Mr. Krecké retired from government and decided to end his active political career in order to pursue a range of different projects. Mr. Krecké is currently the CEO of Key International Strategy Services. He is a member of the boards of JSFC Sistema, of East West United Bank, of Calzedonia Finanziara S.A., Jan De Nul S.A. and Novenergia Holding Company S.A. Mr. Krecké is a citizen of Luxembourg.
Suzanne P. Nimocks
,
59, is a non-executive and independent Director of ArcelorMittal and a member of the Appointments, Remuneration, Corporate Governance and Sustainability Committee. She was previously a director (senior partner) with McKinsey & Company, a global management consulting firm, from June 1999 to March 2010, and was with the firm in various other capacities beginning in 1989, including as a leader in the firm’s Global Petroleum Practice, Electric Power & Natural Gas Practice, Organization Practice, and Risk Management Practice. Ms. Nimocks chaired the Environmental Committee of the Greater Houston Partnership, the primary advocate of Houston’s business community, until December 31, 2010. She holds a Bachelor of Arts in Economics from Tufts University and a Masters in Business Administration from the Harvard Graduate School of Business. Ms. Nimocks is currently a board member for Encana Corporation, Rowan Companies Plc, and Owens Corning, all listed companies. Encana is a major natural gas exploration and production company, Rowan Companies provides drilling services for the oil and gas industry and Owens Corning is a manufacturer of building products. In the non-profit sector, she is a member of the board of directors of the Houston Zoo and serves as a Trustee of the Texas Children’s Hospital. Ms. Nimocks is a citizen of the United States of America.
Bruno Lafont
,
62, is Lead Independent Director of ArcelorMittal, a member of the Audit & Risk Committee and chairman of the Appointments, Remuneration, Corporate Governance Committee and Sustainability Committee. He began his career at Lafarge in 1983 and has held numerous positions in finance and international operations with the same company. In 1995, Mr. Lafont was appointed Group Executive Vice President, Finance, and thereafter, Executive Vice President of the Gypsum Division in 1998. Mr. Lafont joined Lafarge’s General Management as Chief Operating Officer between May 2003 and December 2005, Chief Executive Officer in January 2006, and he was appointed Chairman and Chief Executive Officer in May 2007. In July 2015 Mr. Lafont was appointed Honorary Chairman of Lafarge. He was co-Chairman of the Board of Directors of LafargeHolcim between July 2015 and May 2017. He is presently a board member of EDF and a member of the Executive Committee of the World Business Council for Sustainable Development (WBCSD). Born in 1956, Mr. Lafont is a graduate from the Hautes Etudes Commerciales business school (HEC 1977, Paris) and the Ecole Nationale d’Administration (ENA 1982, Paris). Mr. Lafont is a citizen of France. Mr. Lafont has informed the Company that, on December 8, 2017, he (along with five other former Lafarge officers) was placed under formal investigation (mis en examen) in his capacity as former CEO of Lafarge SA, in relation to alleged payments made by a subsidiary of Lafarge SA (Lafarge Cement Syria) to terrorist groups in Syria, and that alleged violations of EU economic sanctions and French labor law are also being investigated.
Tye Burt
61, is a non-executive and independent Director of ArcelorMittal and a member of the Appointments, Remuneration, Corporate Governance Committee and Sustainability Committee. He was appointed President and Chief Executive Officer of Kinross Gold Corporation in March 2005. He held this position until August 1, 2012. Kinross is listed on the New York Stock Exchange and the Toronto Stock Exchange. Mr. Burt was also a member of the board of directors of Kinross. Mr. Burt has broad experience in the global mining industry, specializing in corporate finance, business strategy and mergers and acquisitions. Prior to joining Kinross, he held the position of Vice Chairman and Executive Director of Corporate Development at Barrick Gold Corporation. He was President of the Cartesian Capital Group from 2000 to 2002; Chairman of Deutsche Bank Canada and Deutsche Bank Securities Canada; Global Managing Director of Global Metals and Mining for Deutsche Bank AG from 1997 to 2000; and Managing Director and Co-Head of the Global Mining Group at BMO Nesbitt Burns from 1995 to 1997, holding various other positions at BMO Nesbitt Burns from 1986 to 1995. Mr. Burt is the Chair and Principal at Carbon Arc Capital Investments Corp. and the Life Sciences Research Campaign Chair of the University of Guelph's Better Planet Project. Mr. Burt is a member of the Duke of Edinburgh's Award Charter for Business Board of Governors and is Vice-Chair of the Governors of the Royal Ontario Museum Foundation. He is a graduate of Osgoode Hall L
,
61, is a non-executive and independent Director of ArcelorMittal and a member of the Appointments, Remuneration, Corporate Governance Committee and Sustainability Committee. He was appointed President and Chief Executive Officer of Kinross Gold Corporation in March 2005. He held this position until August 1, 2012. Kinross is listed on the New York Stock Exchange and the Toronto Stock Exchange. Mr. Burt was also a member of the board of directors of Kinross. Mr. Burt has broad experience in the global mining industry, specializing in corporate finance, business strategy and mergers and acquisitions. Prior to joining Kinross, he held the position of Vice Chairman and Executive Director of Corporate Development at Barrick Gold Corporation. He was President of the Cartesian Capital Group from 2000 to 2002; Chairman of Deutsche Bank Canada and Deutsche Bank Securities Canada; Global Managing Director of Global Metals and Mining for Deutsche Bank AG from 1997 to 2000; and Managing Director and Co-Head of the Global Mining Group at BMO Nesbitt Burns from 1995 to 1997, holding various other positions at BMO Nesbitt Burns from 1986 to 1995. Mr. Burt is the Chair and Principal at Carbon Arc Capital Investments Corp. and the Life Sciences Research Campaign Chair of the University of Guelph's Better Planet Project. Mr. Burt is a member of the Duke of Edinburgh's Award Charter for Business Board of Governors and is Vice-Chair of the Governors of the Royal Ontario Museum Foundation. He is a graduate of Osgoode Hall Law Scho
161
aw School, a member of the Law Society of Upper Canada, and he holds a Bachelor of Arts degree from the University of Guelph. Mr. Burt is a citizen of Canada.
ol, a member of the Law Society of Upper Canada, and he holds a Bachelor of Arts degree from the University of Guelph. Mr. Burt is a citizen of Canada.
Michel Wurth
,
64, is a non-independent Director of ArcelorMittal. He joined Arbed in 1979 and held a variety of functions before joining the Arbed Group Management Board and becoming its chief financial officer in 1996. The merger of Aceralia, Arbed and Usinor, leading to the creation of Arcelor in 2002, led to Mr. Wurth’s appointment as senior executive vice president and CFO of Arcelor. He became a member of ArcelorMittal’s Group Management Board in 2006, responsible for Flat Carbon Europe, Global R&D, Distribution Solutions and Long Carbon Worldwide respectively. Michel Wurth retired from the GMB in April 2014 and was elected to ArcelorMittal’s board of directors in May 2014. He holds a Law degree from the University of Grenoble, France, and a degree in Political Science from the Institut d’Études Politiques de Grenoble as well as a Master’s of Economics from the London School of Economics, UK. Mr. Wurth is also doctor of laws honoris causa of the Sacred Heart University, Luxembourg. Mr. Wurth is Chairman of ArcelorMittal Luxembourg S.A. (a wholly owned subsidiary of ArcelorMittal S.A.) as well as Vice Chairman of the supervisory board of Dillinger Hütte AG and Dillinger Hütte Saarstahl AG (associates of ArcelorMittal). Mr. Wurth has served as Chairman of the Luxembourg Chamber of Commerce since 2004 and is member of the Council of the Central Bank of Luxembourg. He is also non-executive Chairman of Paul Wurth S.A. and member of the supervisory board of SMS Group (the controlling shareholder of Paul Wurth S.A.) as well as non-executive Chairman of BIP Investment Partners S.A., non-executive Director of BGL BNP Paribas S.A., of SMS Group and of Brasserie Nationale. Paul Wurth S.A. is controlled by SMS Group, a leading family owned equipment and engineering supplier for the steel and non-ferrous metal producing industry. BIP Investment Partners is a Luxembourg based company, mainly invested in private equity, BGL BNP Paribas is a Luxembourg bank, majority owned by BNP of France and Brasserie Nationale is a privately owned brewery based in Luxembourg. Mr. Wurth is a citizen of Luxembourg.
Karyn Ovelmen
,
55, is a non-executive and independent Director of ArcelorMittal as well as the chairman of the Audit & Risk Committee. Since January 2019, Mrs. Ovelmen has been the Gas Power Transformation Leader for the General Electric Company. Prior to that, she served as Executive Vice President and Chief Financial Officer of Flowserve, a position that she held from June 2015 to February 2017. Previously, she also served as Chief Financial Officer and Executive Vice President of LyondellBasell Industries NV from 2011 to May 2015, as Executive Vice President and Chief Financial Officer of Petroplus Holdings AG from May 2006 to September 2010 and as Executive Vice President and Chief Financial Officer of Argus Services Corporation from 2005 to 2006. Prior to that, she was Vice President of External Reporting and Investor Relations for Premcor Refining Group Inc. She also spent 12 years with PricewaterhouseCoopers, primarily serving energy industry accounts. Mrs. Ovelmen is a member of the Gates Industrial Corporation plc. Board of Directors as a non-executive director and is a member of their Audit Committee since December 2017. Mrs. Ovelmen holds a Bachelor of Arts degree from the University of Connecticut, USA, and is a Certified Public Accountant ("CPA"). Mrs. Ovelmen is a citizen of the United States of America.
Karel de Gucht
,
64, is a non-executive and independent Director. Mr. de Gucht is a Belgian Minister of State. He was the European Commissioner for Trade in the 2nd Barroso Commission from 2010 to 2014 and for Development and Humanitarian Aid in the 1st Barroso Commission from 2009 to 2010. Previously, Mr. De Gucht served as Belgium's Minister of Foreign Affairs from 2004 to 2009 and Vice Prime Minister of Belgium from 2008 to 2009. In addition, in 2006, he was the Chairman in Office of the Organization for Security and Cooperation in Europe (OSCE) and Member of the Security Council of the United Nations from 2007 to 2008. Since 1991, Mr. De Gucht has been a Professor of Law at the VUB (the Dutch-speaking Free University Brussels). He is currently a member of the European Advisory Board of CVC Capital Partners, a member of the board of directors of the listed company Proximus NV and the president of the IES, the Institute of European Studies at the VUB. Mr. de Gucht holds a Master of Law degree from the VUB. Mr. de Gucht is a Belgian citizen.
Senior management
On December 15, 2015, the Company announced that it would simplify its management structure in-line with the ongoing drive to promote a performance-driven culture, empowering the segments to deliver optimum business results. As a result the GMB, which was established to ensure a smooth integration following the creation of ArcelorMittal, was replaced, effective January 1, 2016, with a more flexible structure. As of December 31, 2018, ArcelorMittal’s senior management is comprised of the CEO Office supported by five other Executive Officers. ArcelorMittal’s CEO Office is comprised of the Chief Executive Officer (“CEO”), Mr. Lakshmi N. Mittal, and the President and Chief Financial Officer (“CFO”), Mr. Aditya Mittal. Together, the Executive Officers are responsible for the implementation of the Company strategy, overall management of the business and all operational decisions.
162
|
Name
|
Age
1
|
Position
|
||
|
Lakshmi N. Mittal
|
68
|
Chairman and Chief Executive Officer of ArcelorMittal
|
||
|
Aditya Mittal
|
42
|
President and Chief Financial Officer of ArcelorMittal, Investor Relations, and Chief Executive Officer of ArcelorMittal Europe
|
||
|
Brian Aranha
|
63
|
Executive vice president, head of strategy, CTO, R&D, CCM, and global automotive
|
||
|
|
|
|
||
|
Jefferson de Paula
|
60
|
Executive vice president, CEO ArcelorMittal South America Long
|
||
|
|
|
|
||
|
Geert Van Poelvoorde
|
53
|
Executive vice president, CEO ArcelorMittal Europe Flat
|
||
|
Simon C. Wandke
|
59
|
Executive vice president, CEO ArcelorMittal Mining
|
||
|
Bart Wille
|
57
|
Executive vice president, head of HR
|
||
|
1.
|
Age as of December 31, 2018.
|
Lakshmi N. Mittal
(See “–Board of Directors”).
Aditya Mittal
,
42, is the President and Chief Financial Officer of ArcelorMittal. He is also the Chief Executive Officer of ArcelorMittal Europe. Following the formation of ArcelorMittal in 2006, Aditya Mittal held various senior leadership roles, including managerial oversight of the Group's flat carbon steel businesses in the Americas and Europe, in addition to his role as CFO and membership in the Group Management Board. Aditya Mittal joined Mittal Steel in January 1997, serving in various finance and management roles. In 1999, he was appointed Head of Mergers and Acquisitions. In his position, he led the Company's acquisition strategy, resulting in Mittal Steel's expansion into Central Europe, Africa and the United States. Subsequently, he was also involved in post-merger integration, turnaround and improvement strategies of the acquired companies. Between 2004 and 2006, Aditya Mittal was the President and CFO of Mittal Steel. In 2006, he initiated and led Mittal Steel's offer for Arcelor, creating the world's first 100 million tonnes plus steel company. In 2008, Aditya Mittal was named 'European Business Leader of the Future' by CNBC Europe and was ranked fourth in Fortune magazine's '40 under 40' list in 2011. He is an active philanthropist with a particular interest in child health. Together with his wife Megha, he is a significant supporter of the Great Ormond Street Children’s Hospital in London, having funded the Mittal Children’s Medical Centre, and in India, the couple work closely with UNICEF, having funded the first ever country-wide survey into child nutrition, the result of which will be used by the Government of India to inform relevant policy. Aditya Mittal serves on the board of Aperam, Iconiq Capital and Wharton School and is Chairman of India’s second largest refinery, HPCL-Mittal Energy Limited (HMEL). He is also a trustee at Brookings Institute and an alumni of the World Economic Forum Young Global Leader’s Programme. Aditya Mittal holds a Bachelor’s degree in Economics with concentrations in Strategic Management and Corporate Finance from the Wharton School in Pennsylvania, United States. Aditya Mittal is the son of Mr. Lakshmi N. Mittal and brother of Ms. Vanisha Mittal Bhatia. Aditya Mittal is a citizen of India.
Brian Aranha
,
63, is a member of the Group management committee . He joined Dofasco in 1979 as a member of the company's Research and Development Department. In 1989, he was assigned to the American Iron & Steel Institute (AISI) in Washington, D.C. and in 1991 he was part of a Canadian consortium conducting a study for the World Bank on restructuring the Polish steel industry. In 1992, Brian returned to Dofasco where he held various positions in Supply Chain, Quality, Technology and Commercial sections until 2003 when he was named Vice President - Commercial. Mr. Aranha took up additional responsibilities as Vice President, NAFTA automotive, after integration into ArcelorMittal in 2007. He moved to Europe as CMO and head of Global Automotive in 2009 followed by other assignments in NAFTA region in 2012. Currently based in Luxembourg, Mr. Aranha has responsibility for Global Automotive, R&D, Strategy, Commercial Coordination, Corporate Capital Goods Procurement, Corporate Communications and CSR as well as ArcelorMittal's automotive joint ventures in China and the tubular joint venture in Saudi Arabia. Mr. Aranha holds a Bachelor of Applied Science degree from the University of Toronto, Canada. In addition, he has completed the Executive Development Program at Queen's University, School of Business, Canada. Mr. Aranha is a citizen of Canada.
Jefferson de Paula
60, is a member of the Group management committee who joined the group in 1991 as Meltshop Manager of Cariacica’s plant (Brazil) and became the plant’s General Manager in 1998. In 2001, he moved to Acindar in Argentina as COO and was appointed its Industrial and Commercial Vice President in 2006. In 2008, he joined Long Carbon Europe as COO of the Sections, Rails and Piles business division, later becoming CEO of Long Carbon Europe - South D
,
60, is a member of the Group management committee who joined the group in 1991 as Meltshop Manager of Cariacica’s plant (Brazil) and became the plant’s General Manager in 1998. In 2001, he moved to Acindar in Argentina as COO and was appointed its Industrial and Commercial Vice President in 2006. In 2008, he joined Long Carbon Europe as COO of the Sections, Rails and Piles business division, later becoming CEO of Long Carbon Europe - South Division. In 2011,
163
ivision. In 2011, he was named CEO of Long Carbon Americas, which in 2014 became Long Carbon Central & South America. Mr. de Paula holds a Bachelor’s Degree in metallurgical engineering from Universidade Federal Fluminense (Brazil), a Master’s Degree in finance and marketing from Universidad Austral (Argentina) and has attended to senior executive courses from Insead (France) and from Kellogg - Northwestern University (USA). In addition to his position in the Group, Mr. de Paula is the current vice president and member of the strategic board of Minas Gerais State Industry Association (FIEMG), he sits in the board of directors of Brazil’s Steel Association (Aço Brasil) and is the former president and member of Latin American Steel Association board (Alacero). Mr. de Paula is a citizen of Brazil.
he was named CEO of Long Carbon Americas, which in 2014 became Long Carbon Central & South America. Mr. de Paula holds a Bachelor’s Degree in metallurgical engineering from Universidade Federal Fluminense (Brazil), a Master’s Degree in finance and marketing from Universidad Austral (Argentina) and has attended to senior executive courses from Insead (France) and from Kellogg - Northwestern University (USA). In addition to his position in the Group, Mr. de Paula is the current vice president and member of the strategic board of Minas Gerais State Industry Association (FIEMG), he sits in the board of directors of Brazil’s Steel Association (Aço Brasil) and is the former president and member of Latin American Steel Association board (Alacero). Mr. de Paula is a citizen of Brazil.
Geert Van Poelvoorde
,
53, is a member of the Group management committee. He started his career in 1989 as a project engineer at the Sidmar Gent hot strip mill, where he held several senior positions in the automation and process computer department. He moved to Stahlwerke Bremen in 1995 as senior project manager. Between 1998 and 2002, he headed a number of departments, and in 2003 he was appointed director of Stahlwerke Bremen, responsible for operations and engineering. In 2005, Mr. Van Poelvoorde returned to ArcelorMittal Gent to take up the position of Chief Operating Officer. In 2008, he became Chief Executive Officer of ArcelorMittal Gent with direct responsibility for primary operations. He was appointed Chief Executive Officer of the Business Division North within Flat Carbon Europe in 2009 and in January 2014, he was appointed Chief Executive Officer of Flat Carbon Europe and Purchasing. Since November 2015 he is also president of Eurofer, the European steel federation. He graduated from the University of Ghent with a degree in civil engineering and electronics. Mr. Van Poelvoorde is a citizen of Belgium.
Simon C. Wandke
,
59, is a member of the Group management committee and the Chief Executive Officer of ArcelorMittal Mining. He joined ArcelorMittal in January 2011 as chief commercial officer of ArcelorMittal Mining. He has over 30 years’ experience in the mining and minerals industry, starting his career in 1981 at BHP, where he held positions in mines in Australia and Indonesia and held other commercial offices globally until 2002. He then joined Destra Consulting Group as Partner before becoming Chief Marketing Officer for Ferrexpo plc in 2006 based in Hong Kong, Switzerland & United Kingdom. Simon is a graduate of the Australian Institute of Company Directors with a diploma in Company Directorship. He also holds a post graduate diploma in Corporate Finance from Swinburne University as well as a B.A., Psych, Marketing (Comm) from the University of Melbourne. Mr. Wandke holds dual citizenship in Australia and the United Kingdom.
Bart Wille
,
57, is a member of the Group management committee. He was appointed head of human resources in January 2018. He joined ArcelorMittal after more than 30 years of global human resources management experience in various multinational companies. Mr. Wille joined Unilever in 1985 with 22 years of service and positions held in Belgium, the United Kingdom, Brazil and the Netherlands. After having joined Puratos (food ingredients) for a short period, Mr. Wille pursued his career with Bekaert as chief human resources officer at the beginning of 2009. As a member of the Bekaert Group Executive Board, Mr. Wille was responsible for human resources and the reorganization agenda of the company worldwide. In this role, he supported the international expansion of the company and he participated in the restructuring and change of the company's organization, as well as the continuous transformation of its culture. Mr. Wille is a graduate in international business administration of UFSIA, the University of Antwerp. Mr. Wille is a citizen of Belgium.
164
B. Compensation
|
Content
|
|
|
Annual statement by the ARCGS Committee Chairman
|
|
|
Board of Directors
|
|
|
Remuneration at a glance - senior management
|
Overview of the Company's remuneration policy and rationale of each performance metric
|
|
Remuneration at a glance - 2018 pay outcomes
|
Comparison of pay outcomes 2018 vs. 2017
Explanation of results for 2017 short-term incentives paid in 2018
|
|
Remuneration
|
|
|
Remuneration strategy
|
Explanation of what informs the ARCGS's decision on pay
|
|
Remuneration policy
|
Explanation of policies applied to senior management
|
|
Remuneration mix
|
Overview of the remuneration mix for senior management
|
|
2018 Total remuneration
|
Overview of 2018 outcomes
|
|
Short-term incentives
|
Description of short-term incentives plan ("STI")
|
|
Long-term incentive plan
|
Description of long-term incentive plan ("LTIP" or "LTI"s)
|
|
Global stock option plan
|
Description of global stock option plan
|
|
Other benefits
|
Description of other benefits
|
|
SOX 304 and Clawback
|
Explanation of SOX section 304 rules regarding clawbacks of CEO/CFO remuneration
|
|
Abbreviations
|
|
|
EBITDA
|
Operating income plus depreciation, impairment expenses and exceptional items
|
|
FCF
|
Free cash flow
|
|
STI
|
Short-term incentives
|
|
LTI/LTIP
|
Long-term incentives (plans)
|
|
EPS
|
Earnings per share
|
|
PSU
|
Performance share units
|
|
RSU
|
Restricted share units
|
|
ROCE
|
Return on capital employed
|
|
TSR
|
Total shareholder return
|
165
Annual statement by the ARCGS Committee Chairman
Dear Shareholders,
Description of the year:
Business and results
ArcelorMittal's 2018 net income of $5.1 billion was substantially higher, as compared to its net income of $4.6 billion for 2017. The strong financial performance is in line with ArcelorMittal’s strategic plan, Action 2020, that aims at making the Company stronger with structural improvements to optimize cost, capture volume opportunities in attractive markets and increase the share of high added value products. Although operational issues had an impact on the Company's progress on Action 2020 during 2018, we are confident that these will be resolved and that ArcelorMittal will deliver its full potential, through focused and effective leadership. This should enable the Company to outperform the competition in its different market environments.
Board and Committee composition
During its meeting of May 8, 2018, the Board renewed its emphasis on four key areas (Health & Safety, Environment and Community Relations, Climate Change and Social issues) and added these to the scope of the ARCG Committee to ensure a Board level review of these important topics. Accordingly, the ARCG Committee was renamed the ARCGS Committee ("Appointments, Remuneration, Corporate Governance and Sustainability Committee") to highlight the Company’s focus on these key areas. As a result, ArcelorMittal complies with the new Principle 9 on companies' corporate social responsibility introduced subsequently to the revision of the 10 Principles of the Luxembourg Stock Exchange. According to Recommendation 9.3 under the Principles, the Board shall regularly consider the Company's non-financial risks, including social and environmental risks. To this end, the ARCGS oversees the Company's sustainable development plans and associated management systems, to ensure that ArcelorMittal is well positioned to meet the evolving expectations of stakeholders including investors, customers, regulators, employees and communities.
Executive remuneration
In preparation for the General Meeting held in May 2018, the ARCGS Committee found that in general the Company’s remuneration policy, including the base remuneration and short- and long-term incentives for the most senior executives was well supported by our shareholders and stakeholders in 2018. The ARCGS Committee believes that the Long-Term Incentive Plan achieves its objective of being competitive and properly incentivizes management in line with shareholder priorities. Going forward, the ARCGS Committee will continue to interact with proxy advisors and shareholders on remuneration and corporate governance related matters and welcomes their questions and comments.
Activities
Throughout 2018, the ARCGS Committee conducted the Annual Self-Assessment of the Board of Directors, reviewed and approved bonus proposals for senior management and approved the remuneration report for 2018. The ARCGS Committee also reviewed remuneration and governance related proposals for the General Meeting of Shareholders. The ARCGS Committee revised succession plans for the Board, the CEO office and senior executives. The ARCGS Committee also reviewed the salaries for the CEO, CFO and the Executive Vice Presidents. It reviewed the grant and vesting criteria for future grants, reviewed and selected performance and compensation peer groups under the Long-Term Incentive Plan and confirmed the vesting of existing plans in accordance with the criteria set in advance. The ARCGS Committee also considered the need for additional retention plans. Furthermore, the Committee integrated Sustainability in its Charter and had discussions in the context of environmental and social improvement, supply chain and health and safety topics.
Going forward
The integration of Ilva and the potential acquisition of Essar Steel India remain important strategic steps for ArcelorMittal. The successful HR integration forms the greatest challenge in our M&A transactions, strong management capabilities and engagement are critical for organizational success. Hence, a thorough and objective leadership selection process, as well as robust succession planning discussion are important priorities for the coming year. Going forward, the ARCGS Committee will continue to focus on the global challenges of sustainability, and what they mean for us as the world’s largest steel company. The
166
ARCGS Committee intends to progress a positive dialogue in 2019 and to put even more focus on sustainability. The ARCGS Committee looks forward to discussing its activities at the upcoming Annual General Meeting in May 2019.
Sincerely yours,
Bruno Lafont
Board of Directors
Directors’ fees
The ARCGS Committee of the Board of Directors prepares proposals on the remuneration to be paid annually to the members of the Board of Directors.
At the May 9, 2018 annual general meeting of shareholders, the shareholders approved the annual remuneration for non-executive directors for the 2017 financial year, based on the following annual fees (euro denominated amounts are translated into U.S. dollars as of December 31, 2018) :
|
•
|
Basic director’s remuneration: €144,720 ($165,704);
|
|
•
|
Lead Independent Director’s remuneration: €204,120 ($233,717);
|
|
•
|
Additional remuneration for the Chair of the Audit & Risk Committee: €28,080 ($32,152);
|
|
•
|
Additional remuneration for the other Audit & Risk Committee members: €17,280 ($19,786);
|
|
•
|
Additional remuneration for the Chairs of the other committees: €16,200 ($18,549); and
|
|
•
|
Additional remuneration for the members of the other committees: €10,800 ($12,366).
|
The total annual remuneration of the members of the Board of Directors paid in 2018 and 2017 was as follows:
|
Year ended December 31,
|
|||||
|
(Amounts in $ thousands except Long-term incentives information)
|
2018
|
2017
|
|||
|
Base salary
1
|
1,604
|
|
1,505
|
|
|
|
Director fees
|
1,509
|
|
1,744
|
|
|
|
Short-term performance-related bonus
1
|
2,775
|
|
2,333
|
|
|
|
Long-term incentives
1, 2
|
70,302
|
|
49,431
|
|
|
|
1
|
Chairman and CEO only. Slight differences between the years are possible, due to foreign currency effects.
|
|
2
|
See “Item 6.B—Directors, senior management and employees—Compensation—Remuneration—Long-term incentive plan.”
|
167
The annual remuneration paid for 2018 and 2017 to the current and former members of the Board of Directors for services in all capacities was as follows:
|
2018
|
2017
|
2018
|
2017
|
|||||||||
|
(Amounts in $ thousands except share information)
|
2018
1
|
2017
1
|
Short-term Incentives
|
Short-term Incentives
|
Long-term Number of PSUs
|
Long-term Number of PSUs
|
||||||
|
Lakshmi N. Mittal
|
1,604
|
1,505
|
2,775
|
2,333
|
70,302
|
49,431
|
||||||
|
Vanisha Mittal Bhatia
|
166
|
174
|
—
|
—
|
—
|
—
|
||||||
|
Narayanan Vaghul
|
_
|
69
|
—
|
—
|
—
|
—
|
||||||
|
Suzanne P. Nimocks
|
178
|
187
|
—
|
—
|
—
|
—
|
||||||
|
Wilbur L. Ross, Jr.
|
_
|
32
|
—
|
—
|
—
|
—
|
||||||
|
Lewis B. Kaden
|
_
|
95
|
—
|
—
|
—
|
—
|
||||||
|
Bruno Lafont
|
272
|
255
|
—
|
—
|
—
|
—
|
||||||
|
Tye Burt
|
178
|
187
|
—
|
—
|
—
|
—
|
||||||
|
Karyn Ovelmen
|
198
|
203
|
—
|
—
|
—
|
—
|
||||||
|
Jeannot Krecké
|
166
|
174
|
—
|
—
|
—
|
—
|
||||||
|
Michel Wurth
|
166
|
174
|
—
|
—
|
—
|
—
|
||||||
|
Karel de Gucht
|
185
|
194
|
—
|
—
|
—
|
—
|
||||||
|
Total
|
3,113
|
3,249
|
2,775
|
2,333
|
70,302
|
49,431
|
||||||
|
1.
|
Remuneration for non-executive Directors with respect to 2018 (subject to shareholder approval at the annual general meeting to be held on May 7, 2019) will be paid in 2019 and is included in the 2018 column. Remuneration for non-executive Directors with respect to 2017 (paid after shareholder approval at the annual general meeting held on May 9, 2018) is included in the 2017 column. Remuneration for non-executive Directors with respect to 2018 and paid after shareholder approval at the annual general meeting held on May 10, 2017 is included in the 2017 column. Slight differences between the years are possible, due to foreign currency effects.
|
As of December 31, 2018, ArcelorMittal did not have any loans or advances outstanding to members of its Board of Directors and ArcelorMittal had not given any guarantees in favor of any member of its Board of Directors.
None of the members of the Board of Directors, including the Chairman and CEO, benefit from an ArcelorMittal pension plan.
The policy of the Company is not to grant any share-based remuneration to members of the Board of Directors who are not executives of the Company.
The following tables provide a summary of the options and the exercise price of options and PSUs granted to the Chairman and CEO, who is the sole executive director on the Board of Directors, as of December 31, 2018.
|
Options granted in 2010
|
Options granted in 2009
|
Options Total
|
Weighted Average Exercise Price of Options
|
||||
|
Lakshmi N. Mittal
1
|
18,833
|
20,000
|
38,833
|
$100.82
|
|||
|
Exercise price
|
91.98
|
109.14
|
—
|
$100.82
|
|||
|
Term (in years)
|
10
|
10
|
—
|
—
|
|||
|
Expiration date
|
Aug. 3, 2020
|
Aug. 4, 2019
|
—
|
—
|
|||
|
1.
|
The options granted in the table above were revised following the completion of the Company's share consolidation of each three existing shares into one share without nominal value on May 22, 2017.
|
168
|
|
PSUs granted in 2018
|
PSUs granted in 2017
|
PSUs granted in 2016
|
|
|
|
Lakshmi N. Mittal
2
|
70,302
|
49,431
|
168,214
|
|
|
|
Term (in years)
|
3
|
3
|
3+2
|
|
|
|
Vesting date
1
|
January 1, 2022
|
January 1, 2021
|
January 1, 2020 and January 1, 2022
|
|
|
|
1.
|
See “Item 6.B—Directors, senior management and employees—Compensation—Remuneration—Long-term incentive plan", for vesting conditions.
|
|
2.
|
The options granted in the table above were revised following the completion of the Company's share consolidation of each three existing shares into one share without nominal value on May 22, 2017.
|
The PSUs granted in 2015 gave the right to receive ArcelorMittal shares at the end of the vesting period as the performance conditions set at the date of the grant have been partially met. See “—2018 LTI vesting (2015 grants)” below for more information.
169
Remuneration at a glance - senior management
The following table provides a brief overview of the Company’s remuneration policy for senior management. Additional information is provided below.
|
ArcelorMittal's Remuneration Policy
|
||||
|
Remuneration
|
Period
|
Strategy
|
Characteristic
|
|
|
Salary
|
2018
|
Recruitment and retention
|
l
|
Reviewed annually by the ARCGS Committee considering market data
|
|
l
|
Increases based on Company performance and individual performance
|
|||
|
STI
|
2018
|
Delivery of strategic priorities and financial success
|
l
|
Maximum STI award of 270% of base salary for the CEO, 225% of base salary for the CFO and 135% of base salary for other
Executive Officers
|
|
l
|
100% STI paid in cash
|
|||
|
l
|
ArcelorMittal's first priority Health and Safety is part of the STI
|
|||
|
l
|
Overperformance towards competition
|
|||
|
LTIP
|
2019-2021
|
Encourages long term shareholder return
|
l
|
Performance share units granted with a face value of 100% of base salary for the CEO and CFO and between 50-60% for Executive Officers
|
|
l
|
Shares vest after a three-year performance period
|
|||
|
l
|
Performance related vesting
|
|||
|
Key Performance Metrics from 2018
|
|||
|
Metrics
|
Scheme
|
Rationale
|
|
|
EBITDA
|
STI
|
l
|
Demonstrates growth and operational performance of the underlying businesses
|
|
FCF
|
STI
|
||
|
ROCE
|
STI
|
l
|
Critical factor for long-term success and sustainability of the Company
|
|
Gap to competition
|
STI / LTIP
|
l
|
Outperform peers
|
|
Health & Safety
|
STI
|
l
|
Employee health and safety is a core value for the Company
|
|
Business Specific measures
|
STI
|
l
|
For corporate functions, links reward to strategic priorities of their functions
|
|
EPS
|
LTIP
|
l
|
Links reward to delivery of underlying equity returns to shareholders
|
|
TSR
|
LTIP
|
l
|
Creates a direct link between executive pay and shareholder value
|
|
l
|
Measure is split equally between comparison against S&P 500 index and a peer group of companies
|
||
170
Remuneration at a glance - 2018 Pay outcomes
The following graphics compare the compensation paid to the CEO, CFO and other Executive Officers in 2018 and 2017 in thousands of U.S. dollars. Information with respect to total remuneration paid is provided under “—Renumeration—2018 Total remuneration” below.
171
2017 short-term incentives paid in 2018
|
Executive
|
Realization as % of business target
|
|
|
CEO office
|
Lakshmi Mittal
Aditya Mittal |
134%
|
|
Corporate
|
Brian Aranha
|
146%
|
|
Corporate
|
Henri Blaffart
1
|
145%
|
|
Flat Carbon Europe
|
Geert van Poelvoorde
|
135%
|
|
Long Carbon South America
|
Jefferson de Paula
|
113%
|
|
Mining
|
Simon Wandke
|
85%
|
|
50% NAFTA
50% Calvert |
Robrecht Himpe
2
|
84%
|
Note: Individual performance not included in the percent of realization.
1
Mr. Blaffart retired from the Company on April 1, 2018.
2
Mr. Himpe retired from the Company on July 1, 2018.
2018 LTI vesting (2015 grants)
The following tables provide information about the vesting in 2018 of long-term incentives granted to senior management in prior years. See also note 7.3 to the consolidated financial statements.
CEO office
|
TSR Vesting - 50% of overall opportunity
|
EPS Vesting - 50% of overall opportunity
|
||
|
l
|
The Company’s TSR performance was 36.9% for the three-year performance period
|
l
|
The Company’s EPS performance was higher than 2,000% for the three-year performance period
|
|
l
|
This was above the target compared to the S&P 500 and the peer group performance
|
l
|
This was an over-performance
|
|
l
|
As a result, 105.8% of the TSR component of the 2015 LTIP has vested
|
l
|
As a result, 150% of the EPS component of the 2015 LTIP has vested (as set forth in the table below)
|
|
Number of PSUs granted in 2015 outstanding in 2018
|
Number of shares vested
|
|
|
CEO
|
59,773
|
76,450
|
|
President and CFO and other ex-GMB members
1
|
94,994
|
70,389
|
172
Executive Officers
In 2018, the following long-term incentives vested:
|
Vehicle
|
Date of vesting
|
Date of Grant
|
Number of PSUs/RSUs granted to the Executive Officers and outstanding
|
Number of Shares acquired by the Executive Officers
|
|
PSUs
|
January 1, 2018
Performance approved by ARCGS Committee on March 6, 2018
|
December 17, 2014
|
14,668
|
16,174
|
|
RSUs
|
December 18, 2018
|
December 18, 2015
|
16,002
|
14,948
|
Remuneration
Remuneration strategy
The ARCGS Committee assists the Board of Directors to maintain a formal and transparent procedure for setting policy on senior management's remuneration and to determine an appropriate remuneration package for senior management. The ARCGS Committee should ensure that remuneration arrangements support the strategic aims of the business and enable the recruitment, motivation and retention of senior executives while complying with applicable rules and regulations.
Board oversight
To this end, the Board of Directors has established the ARCGS Committee to assist it in making decisions affecting employee remuneration. All members of the ARCGS Committee are required to be independent under the Company’s corporate governance guidelines, the NYSE standards and the 10 Principles of Corporate Governance of the Luxembourg Stock Exchange.
The members are appointed by the Board of Directors each year after the annual general meeting of shareholders. The members have relevant expertise or experience relating to the purposes of the ARCGS Committee. The ARCGS Committee makes decisions by a simple majority with no member having a casting vote and is chaired by Mr. Bruno Lafont, Lead Independent Director.
Appointments, remuneration, corporate governance and sustainability committee
The primary function of the ARCGS Committee is to assist the Board of Directors with respect to the following:
|
•
|
review and approve corporate goals and objectives regarding remuneration relevant to the CEO Office and Executive Officers and other members of executive management as deemed appropriate by the committee, and assess performance against goals and objectives;
|
|
•
|
make recommendations to the Board with respect to incentive remuneration plans and equity-based plans;
|
|
•
|
identify candidates qualified to serve as members of the Board, the CEO Office and Executive Officers;
|
|
•
|
recommend candidates to the Board for appointment by the general meeting of shareholders or for appointment by the Board to fulfill interim Board vacancies;
|
|
•
|
develop, monitor and review corporate governance principles applicable to the Company;
|
|
•
|
facilitate the evaluation of the Board;
|
|
•
|
review the succession planning and the executive development of the members of the CEO Office and Executive Officers;
|
|
•
|
submit proposals to the Board on the remuneration of the members of the CEO Office and Executive Officers, and on the appointment of new members thereto and new directors; and
|
173
|
•
|
make recommendations to the Board of Directors in respect of the Company’s framework of remuneration for the members of the CEO Office and Executive Officers and such other members of the executive management as designated by the committee. In making such recommendations, the committee may take into account factors that it deems necessary. This may include a member’s total cost of employment (factoring in equity/long term incentives, any perquisites and benefits in kind and pension contributions).
|
The ARCGS Committee met six times in 2018. Its members comprise Mr. Bruno Lafont (Chairman), Mrs. Suzanne Nimocks and Mr. Tye Burt.
Regular invitees include Mr. Lakshmi N. Mittal (CEO and Chairman) and Mr. Bart Wille (Head of Group Human Resources and Corporate Services). Mr. Henk Scheffer (Company Secretary) acts as secretary.
Individual remuneration is discussed by the ARCGS Committee without the person concerned being present. The ARCGS Committee Chairman presents its decisions and findings to the Board of Directors after each ARCGS Committee meeting.
Remuneration policy
The ARCGS Committee set policies applied to Senior Management on base salary, short-term incentives and long-term incentives.
Scope
ArcelorMittal’s remuneration philosophy and framework apply to the following groups of senior management:
|
•
|
the CEO and the President and CFO; and
|
|
•
|
the other Executive Officers.
|
The remuneration philosophy and governing principles also apply, with certain limitations, to a wider group of employees including Executive Vice Presidents, Vice Presidents, General Managers and Managers.
Remuneration philosophy
ArcelorMittal’s remuneration philosophy for its senior management is based on the following principles:
|
•
|
provide total remuneration competitive with executive remuneration levels of peers of similar size, scope and industry;
|
|
•
|
encourage and reward performance that will lead to long-term enhancement of shareholder value; and
|
|
•
|
promote internal pay equity by providing base pay and total remuneration levels that reflect the role, job size and responsibility as well as the performance and effectiveness of the individual.
|
Remuneration framework
The ARCGS Committee develops proposals for senior management remuneration annually for the Board of Directors' consideration. Such proposals include the following components:
|
•
|
fixed annual salary;
|
|
•
|
short-term incentives (i.e., performance-based bonus); and
|
|
•
|
long-term incentives (i.e., stock options (prior to May 2011), RSUs and PSUs (after May 2011), PSUs only as from 2016).
|
The Company does not have any deferred compensation plans for senior management, including the Chairman and CEO.
174
The following table provides an overview of the remuneration policy applied by the ARCGS:
|
Remuneration component and link to strategy
|
Operational and performance framework
|
Opportunity
|
|
Fixed annual salary
Competitive base salary to attract and retain high-quality and experienced senior executives |
* Base salary levels are reviewed annually with effect from April 1 (except promotion) compared to the market to ensure that ArcelorMittal remains
competitive with market median base pay levels * Reviews are based on market information obtained but not led by benchmarking to comparable roles, changes in responsibility and general economic conditions |
The ARCGS does not set a maximum salary, instead when determining any salary increases it takes into account a number of reference points including salary increases across the Company
|
|
Benefits
Competitive level to ensure coverage of the executives |
* May include costs of health insurance, death and disability insurances, company car, tax return preparation, etc.
* Relocation benefits may be provided where a change of location is made at Company’s request |
The cost to the Company of providing benefits can change from year to year. The level of benefit provided is intended to remain competitive
|
|
Pension
Competitive level of post-employment benefit to attract and retain executives |
* Local benchmark of pension contributions for comparable roles
|
|
|
Short term incentives (STI)
Motivate the senior executives to achieve stretch performance on strategic priorities |
* Scorecard is set at the commencement of each financial year
* Measures and relative weights are chosen by the ARCGS Committee to drive overall performance for the coming year * STI calculations for each executive reflect the performance of ArcelorMittal and /or the performance of the relevant business units, the achievement of specific objectives of the department and the individual executive’s overall performance * No STI is paid for a performance below threshold 80%; 100% STI payout for performance achieved at 100%; 150% STI payout for performance achieved at 120% or above |
Range for CEO: 0 to 270% with a target at 120% of base salary
Range for President and CFO: 0 to 225% with a target at 100% of base salary Range for Executive Officers: 0 to 135% with a target at 60% of base salary |
|
LTIP
Sustain shareholder wealth creation in excess of performance of a peer group and incentivize executives to achieve strategy |
CEO Office LTIP
* The vesting is subject to a relative TSR (Total Shareholder Return) compared to the S&P 500 and a peer group and to a relative EPS of a peer group over a three year- period *The peer group is determined by the ARCGS Committee * No vesting will occur below the median for all grants as from 2016 * Performance is determined by the ARCGS Committee Executive Officers LTIP - The vesting is subject to a relative TSR compared to a peer group and eventually an additional strategic priority in some business units (such as Gap to competition or TCOE) in 2018 - The peer group is determined by the ARCGS Committee - No vesting will occur below the median for all grants for the TSR portion - Performance is determined by the ARCGS Committee |
Maximum value at grant:
100% of base salary for CEO and President and CFO 50 to 60% of base salary for Executive Officers |
175
Remuneration mix
The total remuneration target of the CEO and the President and CFO is structured to attract and retain executives; the amount of the remuneration received is dependent on the achievement of superior business and individual performance and on generating sustained shareholder value from relative performance.
The following remuneration charts, which illustrate the various elements of the CEO, the President and CFO and the other Executive Officers' compensation, are applicable for 2018. For each of the charts below, the columns on the left, middle and on the right, respectively, reflect the breakdown of compensation if targets are not met, met and exceeded.

Note: no pension contribution
176
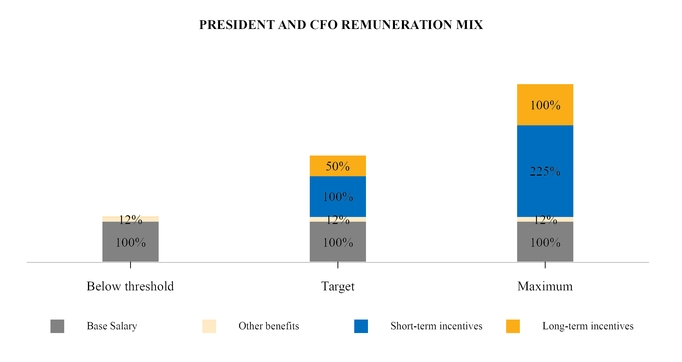
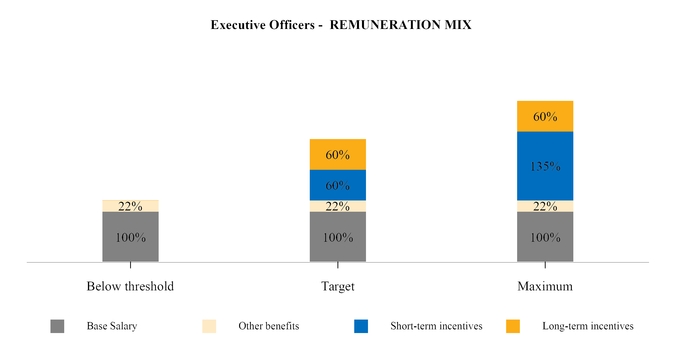
Note: Other benefits, as shown above, do not include international mobility incentives that may be provided.
2018 Total remuneration
The total remuneration paid in 2018 to members of ArcelorMittal’s senior management
listed in “Item 6.A—Directors, senior management and employees—Directors and senior management”
(including Mr. Lakshmi N. Mittal in his capacity as CEO) was $7.3 million in base salary and other benefits paid in cash (such as health, other insurances, lunch allowances, financial services, gasoline and car allowance) and $8.3 million in short-term performance-related variable remuneration
177
consisting of a short-term incentive linked to the Company’s 2017 results. During 2018, approximately $0.9 million was accrued by ArcelorMittal to provide pension benefits to senior management (other than Mr. Mittal).
No loans or advances to ArcelorMittal’s senior management were made during 2018, and no such loans or advances were outstanding as of December 31, 2018.
The following table shows the remuneration received by the CEO, the President and CFO and the Executive Officers as determined by the ARCGS Committee in relation to 2018 and 2017 including all remuneration components:
|
Chief Executive Officer
|
President and Chief Financial Officer and Executive Officers
|
|||||||||
|
(Amounts in $ thousands except for Long-term incentives)
|
2018
|
2017
|
2018
5
|
2017
|
||||||
|
Base salary
1
|
1,604
|
1,505
|
5,371
|
4,709
|
||||||
|
Retirement benefits
|
—
|
—
|
862
|
849
|
||||||
|
Other benefits
2
|
—
|
41
|
314
|
250
|
||||||
|
Short-term incentives
3
|
2,775
|
2,333
|
5,495
|
4,468
|
||||||
|
Long-term incentives
|
- fair value in $ thousands
4
|
1,166
|
1,130
|
2,702
|
1,922
|
|||||
|
- number of share units
|
70,302
|
49,431
|
141,109
|
94,553
|
||||||
|
1.
|
The base salaries of the CEO and President and CFO were increased by 7.5% in 2018, including as a result of the promotion of the CFO and CEO ArcelorMittal Europe to President of ArcelorMittal.
|
|
2.
|
Other benefits comprise benefits paid in cash such as lunch allowances, financial services, gasoline and car allowances. Health insurance and other insurances are also included.
|
|
3.
|
Short-term incentives are entirely performance-based and are fully paid in cash. The short-term incentive for a given year relates to the Company’s results in the previous year.
|
|
4.
|
Fair value determined at the grant date is recorded as an expense using the straight line method over the vesting period and adjusted for the effect of non-market based vesting conditions. The remuneration expenses recognized for the PSUs granted to the CEO and to the President and CFO and Executive Officers was $4 million (net of reversal of expenses relating to unvested PSUs) for the year ended December 31, 2018. The remuneration expenses recognized for the PSUs granted to the CEO and to the President and CFO and Executive Officers was $3 million (net of reversal of expenses relating to unvested PSUs) for the year ended December 31, 2017.
|
|
5.
|
Henri Blaffart is included until March 31, 2018, Robrecht Himpe is included until June 30, 2018.
|
Short-term incentives
Targets associated with ArcelorMittal’s 2018 performance short-term incentive were aligned with its strategic objectives of improving health and safety performance and overall competitiveness.
For the CEO and the President and CFO, the 2018 short-term incentive formula is based on:
|
•
|
EBITDA at the
Group level: 30% (this acts as “circuit breaker” with respect to group-level financial performance
|
measures as explained below);
|
•
|
FCF at the Group level: 20%;
|
|
•
|
ROCE at the Group level: 20%;
|
|
•
|
Gap to competition at the Group level: 20%; and
|
|
•
|
Health and safety performance at the Group level: 10%.
|
EBITDA operating as a “circuit breaker” for financial measures means that at least 80% of target must be met to trigger any short-term incentive payment with respect to the EBITDA and FCF performance measures.
For the CEO , the performance short-term incentive at 100% achievement of performance targets linked to the business plan is equal to 120% of his base salary. For the CFO, the performance short-term incentive at 100% achievement of performance targets linked to the business plan is equal to 100% of his base salary.
The different performance measures are combined through a cumulative system: each measure is calculated separately and is added up for the performance short-term incentive calculation.
178
Performance below threshold will result in zero performance short-term incentive payout.
For the other Executive Officers, the 2018 short-term incentive formula has been tailored for their respective positions and is generally based on the following:
|
•
|
EBITDA at the Group, segment and / or Business unit level: this acts as the “circuit breaker” with respect to financial performance measures except for Mining where the Mining volume is the “circuit breaker”;
|
|
•
|
FCF at the Group, segment or Business unit level;
|
|
•
|
ROCE at the Group level, segment or Business unit level;
|
|
•
|
Gap to competition at the Group level, segment or Business unit level;
|
|
•
|
Health and safety performance; and
|
|
•
|
Business specific measures for corporate functions.
|
For the other Executive Officers, the performance short-term incentive at 100% achievement of performance targets linked to the business plan is equal to 60% of their base salary.
Individual performance and assessment ratings define the individual short-term incentive multiplier that will be applied to the performance short-term incentive calculated based on actual performance against the performance measures. Those individuals who consistently perform at expected levels will have an individual multiplier of 1. For outstanding performers, an individual multiplier of up to 1.5 may cause the performance short-term incentive pay-out to be higher than 150% of the target short-term incentive, up to 270% of the target short-term incentive being the absolute maximum for the CEO. Similarly, a reduction factor will be applied for those at the lower end.
The achievement level of performance for the short-term incentive for the CEO, the President and CFO and the other Executive Officers is summarized as follows:
|
Functional level
|
Target achievement threshold @ 80%
|
Target achievement @ 100%
|
Target achievement ≥ ceiling @ 120%
|
|||
|
Chief Executive Officer
|
60% of base pay
|
120% of base pay
|
180% of base pay
|
|||
|
President and Chief Financial Officer
|
50% of base pay
|
100% of base pay
|
150% of base pay
|
|||
|
Executive Officers
|
30% of base pay
|
60% of base pay
|
90% of base pay
|
|||
Long-term incentive plan
ArcelorMittal operates a long-term incentive plan to incentivize shareholder wealth creation in excess of performance of a peer group and incentivize executives to achieve strategy.
On May 10, 2011, the annual general meeting of shareholders approved the ArcelorMittal Equity Incentive Plan, a new equity-based incentive plan that replaced the Global Stock Option Plan (see below and note 7.3 to the consolidated financial statements for a description of the Global Stock Option Plan). The ArcelorMittal Equity Incentive Plan is intended to align the interests of the Company’s shareholders and eligible employees by allowing them to participate in the success of the Company. The ArcelorMittal Equity Incentive Plan provides for the grant of RSUs and PSUs to eligible Company employees (including the Executive Officers) and is designed to incentivize employees, improve the Company’s long-term performance and retain key employees. On May 8, 2013, the annual general meeting of shareholders approved the GMB PSU Plan, which provides for the grant of PSUs to GMB members (and is now applicable to the CEO Office). Until the introduction of the GMB PSU Plan in 2013, GMB members were eligible to receive RSUs and PSUs under the ArcelorMittal Equity Incentive Plan. In 2016, a special grant was approved in order to align the grant with the Action 2020 plan put in place by ArcelorMittal.
The maximum number of PSUs (and RSUs previously) available for grant during any given year is subject to the prior approval of the Company’s shareholders at the annual general meeting. The annual shareholders’ meeting on May 4, 2016 approved the maximum to be granted until the next annual shareholders’ meeting. For the period from the May 2016 annual general shareholders’ meeting to the May 2017 annual general shareholders’ meeting, a maximum of 30,000,000 PSUs (10,000,000 after the reverse stock split) may be allocated to eligible employees under the ArcelorMittal Equity Incentive Plan and the GMB PSU Plan combined. The 2017 Cap for the number of PSUs that may be allocated to the CEO Office and other retention based grants below the CEO Office was approved at the annual shareholders' meeting on May 10, 2017 at a maximum of 3,000,000 shares (9,000,000 before the reverse stock split). The 2018 Cap for the number of PSUs that may be allocated to
179
the CEO Office and other retention based grants below the CEO Office level was approved at the annual shareholders’ meeting on May 9, 2018 at a maximum of 1,500,000 (one million five hundred thousand) shares.
In 2016, ArcelorMittal adapted the plan:
|
•
|
To consider the comments of shareholders that vesting should not happen below the median and
|
|
•
|
To adapt to Action 2020 (Special grant)
|
Conditions of the 2018 grant were as follows:
|
|
|
CEO Office
|
|
Executive Officers
|
||||||
|
2018 Grant
|
l
|
PSUs with a three year performance period
|
|
PSUs with a three year performance period
|
||||||
|
|
|
|
|
|||||||
|
l
|
Value at grant 100% of base salary for the CEO and the President and CFO
|
|
|
|||||||
|
l
|
Vesting conditions:
|
l
|
Vesting conditions
|
|||||||
|
|
Threshold
|
Target
|
|
|
|
Target
|
||||
|
|
TSR/EPS vs. peer group
|
100% median
|
≥120% median
|
|
ROCE
|
|
100% target
100% vesting |
|||
|
|
TSR vs. S&P 500
|
Performance equal to Index
|
≥Performance equal to Index + 2% outperformance
|
|
Gap to competition (where applicable)
|
|
100% target
100% vesting |
|||
|
|
Vesting percentage
|
50%
|
100%
|
|
|
|||||
180
Awards made in previous financial years which have not yet reached the end of the vesting period
The Company's Long-Term Incentive Plan for senior management including Executive Officers follows the Company's strategy.
In 2015, the Company's goal was to achieve ROCE and Mining volumes for the Mining segment and therefore the target was based on these performance measures.
In 2016, a special grant was deployed on a five-year performance period to achieve the Company's Action 2020 plan. ROCE remained a key target and Gap to Competition was added as performing against competition is essential.
The plans in 2015, 2016 and 2017 are summarized below.
181
|
|
|
CEO Office
|
|
Other Executive Officers
|
||||||||
|
2015 Grant
|
l
|
PSUs with a three-year performance period
|
l
|
RSUs with a three-year vesting period (2015 grant vested in December 2018)
|
||||||||
|
l
|
Performance criteria: 50% TSR (½ vs. S&P 500 and ½ vs. peer group) and 50% EPS vs. peer group
|
l
|
PSUs with a three-year performance period
|
|||||||||
|
l
|
Value at grant: 100% of base salary for the CEO and 80% for the President and CFO
|
l
|
Performance target: mainly ROCE and mining volume plan for the Mining segment
|
|||||||||
|
|
|
l
|
One PSU can give right to 0 through up to 1.5 share
|
|||||||||
|
l
|
Vesting conditions:
|
l
|
Vesting conditions:
|
|||||||||
|
|
|
Threshold
|
Target
|
Stretch
|
|
Performance
|
Threshold
|
Target
|
Stretch
|
|||
|
|
TSR/EPS vs. peer group
|
80% median
|
100% median
|
≥120% median
|
|
Performance
|
80%
|
100%
|
≥120%
|
|||
|
|
TSR vs. S&P 500
|
Performance equal to 80% of Index
|
Performance equal to Index
|
≥Performance equal to Index + 2% outperformance
|
|
Vesting
|
50%
|
100%
|
150%
|
|||
|
|
Vesting percentage
|
50%
|
100%
|
150%
|
|
|
||||||
|
2016 Special Grant
|
l
|
PSUs with a five-year performance period, 50% vesting after three-year performance period and 50% after additional two-year performance period
|
l
|
PSUs with a five-year performance period, 50% vesting after three-year performance period and 50% after additional two-year performance period
|
||||||||
|
l
|
Performance criteria: 50% TSR (½ vs. S&P 500 and ½ vs. peer group) and 50% EPS vs. peer group
|
l
|
Performance criteria: ROCE and Gap to competition in some areas
one target grant: a share will vest if performance is met at target one overperformance grant: a share will vest if performance exceeds 120% |
|||||||||
|
l
|
Value at grant: 150% of base salary for the CEO and the President and CFO
|
l
|
Vesting conditions:
|
|||||||||
|
l
|
Vesting conditions:
|
|
|
|||||||||
|
|
|
|
Threshold
|
Target
|
|
Performance
|
|
100%
|
≥120%
|
|||
|
|
TSR/EPS vs. peer group
|
|
100% median
|
≥120% median
|
|
Target award vesting
|
100%
|
100%
|
||||
|
|
TSR vs. S&P 500
|
|
Performance equal to Index
|
≥Performance equal to Index + 2% outperformance
|
|
Overperformance award (=20% of target award)
|
-
|
100%
|
||||
|
|
Vesting percentage
|
|
50%
|
100%
|
|
|
||||||
|
2017 Grant
|
l
|
PSUs with a three-year performance period
|
|
l
|
PSUs with a three-year performance period
|
|
||||||
|
l
|
Performance criteria: 50% TSR (½ vs. S&P 500 and ½ vs. peer group) and 50% EPS vs. peer group
|
l
|
Performance criteria: TSR and Gap to competition in some areas
|
|||||||||
|
l
|
Value at grant: 100% of base salary for the CEO and the President and CFO
|
|
|
|
||||||||
|
l
|
Vesting conditions:
|
|
l
|
Vesting conditions:
|
|
|||||||
|
|
|
Threshold
|
Target
|
|
Performance
|
|
Threshold
|
Target
|
||||
|
|
TSR/EPS vs. peer group
|
100% median
|
≥120% median
|
|
TSR vs. peer group
|
100% median 50% vesting
|
≥120% median 100% vesting
|
|||||
|
|
TSR vs. S&P 500
|
Performance equal to Index
|
≥Performance equal to Index + 2% outperformance
|
|
Gap to competition (where applicable)
|
-
|
100% target
100% vesting |
|||||
|
|
Vesting percentage
|
50%
|
100%
|
|
|
|
||||||
182
See note 7.3 to the consolidated financial statements for further details on RSUs and PSUs.
Global Stock Option Plan
Prior to the May 2011 annual general shareholders’ meeting adoption of the ArcelorMittal Equity Incentive Plan described above, ArcelorMittal’s equity-based incentive plan took the form of a stock option plan known as the Global Stock Option Plan.
See note 7.3 to the consolidated financial statements for further details on stock options
.
Other benefits
In addition to the remuneration described above, other benefits may be provided to senior management and, in certain cases, other employees. These other benefits can include insurance, housing (in cases of international transfers), car allowances and tax assistance.
SOX 304 and clawback policy
Under Section 304 of the Sarbanes-Oxley Act, the SEC may seek to recover remuneration from the CEO and CFO of the Company in the event that it is required to restate accounting information due to any material misstatement thereof or as a result of misconduct in respect of a financial reporting requirement under the U.S. securities laws (the “SOX Clawback”).
Under the SOX Clawback, the CEO and the CFO may have to reimburse ArcelorMittal for any short-term incentive or other incentive- or equity-based remuneration received during the 12-month period following the first public issuance or filing with the SEC (whichever occurs first) of the relevant filing, and any profits realized from the sale of ArcelorMittal securities during that 12-month period.
The Board of Directors, through its ARCGS Committee, decided in 2012 to adopt its own clawback policy (the “Clawback Policy”) that applies to the members of the former GMB and to the Executive Vice President of Finance of ArcelorMittal. In 2016, the Clawback Policy was updated to reflect the Company’s structural changes and now applies to the CEO Office and the Executive Officers.
The Clawback Policy comprises cash short-term incentives and any other incentive-based or equity-based remuneration, as well as profits from the sale of the Company’s securities received during the 12-month period following the first public issuance or filing with the SEC (whichever first occurs) of the filing that contained the material misstatement of accounting information.
For purposes of determining whether the Clawback Policy should be applied, the Board of Directors will evaluate the circumstances giving rise to the restatement (in particular, whether there was any fraud or misconduct), determine when any such misconduct occurred and determine the amount of remuneration that should be recovered by the Company. In the event that the Board of Directors determines that remuneration should be recovered, it may take appropriate action on behalf of the Company, including, but not limited to, demanding repayment or cancellation of cash short-term incentives, incentive-based or equity-based remuneration or any gains realized as the result of options being exercised or awarded or long-term incentives vesting. The Board may also choose to reduce future remuneration as a means of recovery.
C.
Board practices/corporate governance
This section describes the corporate governance practices of ArcelorMittal for the year ended December 31, 2018.
Board of Directors and senior management
ArcelorMittal is governed by a Board of Directors and managed by the senior management.
As described in Item 6A above,
ArcelorMittal’s senior management is comprised of the CEO Office - comprising the CEO, Mr. Lakshmi N. Mittal and the President and CFO, Mr. Aditya Mittal. The CEO Office is supported by a team of five other Executive Officers, who together encompass the key regions and corporate functions.
A number of corporate governance provisions in the Articles of Association of ArcelorMittal reflect provisions of the Memorandum of Understanding signed on June 25, 2006 (prior to Mittal Steel Company N.V.’s merger with Arcelor), amended
183
in April 2008 and which mostly expired on August 1, 2009. For more information about the Memorandum of Understanding, see
“Item 10.C—Additional information—Material contracts—Memorandum of Understanding”.
ArcelorMittal fully complies with the 10 Principles of Corporate Governance of the Luxembourg Stock Exchange.
This is explained in more detail in “—Other corporate governance practices” below.
ArcelorMittal also complies with the New York Stock Exchange Listed Company Manual as applicable to foreign private issuers.
Board of Directors
Composition
The Board of Directors is in charge of the overall governance and direction of ArcelorMittal. It is responsible for the performance of all acts of administration necessary or useful in furtherance of the corporate purpose of ArcelorMittal, except for matters reserved by Luxembourg law or the Articles of Association to the general meeting of shareholders. The Articles of Association provide that the Board of Directors is composed of a minimum of three and a maximum of 18 members, all of whom, except the CEO, must be non-executive directors. None of the members of the Board of Directors, except for the CEO, may hold an executive position or executive mandate within ArcelorMittal or any entity controlled by ArcelorMittal.
The Articles of Association provide that directors are elected and removed by the general meeting of shareholders by a simple majority of votes cast. Other than as set out in the Company’s Articles of Association, no shareholder has any specific right to nominate, elect or remove directors. Directors are elected by the general meeting of shareholders for three-year terms. In the event that a vacancy arises on the Board of Directors for any reason, the remaining members of the Board of Directors may by a simple majority elect a new director to temporarily fulfill the duties attaching to the vacant post until the next general meeting of the shareholders.
The Board of Directors is comprised of nine members, of which 8 are non-executive directors and one is an executive director. The CEO of ArcelorMittal is the sole executive director. For further information on the composition of the Board of Directors, including the expiration of each Director’s term and the period during which each Director has served, see Item 6.A above.
Mr. Lakshmi N. Mittal was elected Chairman of the Board of Directors on May 13, 2008. Mr. Mittal is also ArcelorMittal’s CEO. Mr. Mittal was re-elected to the Board of Directors for a three-year term at the annual general meeting of shareholders on May 10, 2017.
Five of the 9 members of the Board of Directors are independent. The non-independent directors are Mr. Lakshmi N. Mittal, Ms. Vanisha Mittal Bhatia, Mr. Jeannot Krecké and Mr. Michel Wurth. A director is considered “independent” if:
|
(a)
|
he or she is independent within the meaning of the New York Stock Exchange Listed Company Manual, as applicable to foreign private issuers,
|
|
(b)
|
he or she is unaffiliated with any shareholder owning or controlling more than two percent of the total issued share capital of ArcelorMittal, and
|
|
(c)
|
the Board of Directors makes an affirmative determination to this effect.
|
For these purposes, a person is deemed affiliated to a shareholder if he or she is an executive officer, a director who also is an employee, a general partner, a managing member or a controlling shareholder of such shareholder. The 10 Principles of Governance of the Luxembourg Stock Exchange, which constitute ArcelorMittal's domestic corporate governance code, require ArcelorMittal to define the independence criteria that apply to its directors, which are described in article 8.1 of its Articles of Association.
184
Specific characteristics of the director role
The Company’s Articles of Association do not require directors to be shareholders of the Company. The Board of Directors nevertheless adopted a share ownership policy on October 30, 2012, that was amended on November 7, 2017, considering that it is in the best interests of all shareholders for all non-executive directors to acquire and hold a minimum number of ArcelorMittal ordinary shares in order to better align their long-term interests with those of ArcelorMittal’s shareholders. The Board of Directors believes that this share ownership policy will result in a meaningful holding of ArcelorMittal shares by each non-executive director, while at the same time taking into account the fact that the share ownership requirement should not be excessive in order not to unnecessarily limit the pool of available candidates for appointment to the Board of Directors. Directly or indirectly, and as sole or joint beneficiary owner (e.g., with a spouse or minor children), within five years of the earlier of October 30, 2012 or the relevant person’s election to the Board of Directors, the Lead Independent Director should own a minimum of 6,000 ordinary shares and each other non-executive director should own a minimum of 4,000 ordinary shares. Each director will hold the shares acquired on the basis of this policy for so long as he or she serves on the Board of Directors. Directors purchasing shares in compliance with this policy must comply with the ArcelorMittal Insider Dealing Regulations and, in particular, refrain from trading during any restricted period, including any such period that may apply immediately after the Director’s departure from the Board of Directors for any reason.
On October 30, 2012, the Board of Directors also adopted a policy that places limitations on the terms of independent directors as well as the number of directorships that directors may hold in order to align the Company’s corporate governance practices with best practices in this area. The policy provides that an independent director may not serve on the Board of Directors for more than 12 consecutive years, although the Board of Directors may, by way of exception to this rule, make an affirmative determination, on a case-by-case basis, that he or she may continue to serve beyond the 12-year rule if the Board of Directors considers it to be in the best interest of the Company based on the contribution of the Director involved and the balance between the knowledge, skills, experience and need for renewal of the Board.
As membership of the Board of Directors represents a significant time commitment, the policy requires both executive and non-executive directors to devote sufficient time to the discharge of their duties as a director of ArcelorMittal. Directors are therefore required to consult with the Chairman and the Lead Independent Director before accepting any additional commitment that could conflict with or impact the time they can devote to their role as a Director of ArcelorMittal. Furthermore, a non-executive director may not serve on the boards of directors of more than four publicly listed companies in addition to the ArcelorMittal Board of Directors. However, a non-executive Director’s service on the board of directors of any subsidiary or affiliate of ArcelorMittal or of any non-publicly listed company is not taken into account for purposes of complying with the foregoing limitation.
Although non-executive directors of ArcelorMittal who change their principal occupation or business association are not necessarily required to leave the Board of Directors, the policy requires each non-executive director, in such circumstances, promptly to inform the Board of Directors of the action he or she is contemplating. Should the Board of Directors determine that the contemplated action would generate a conflict of interest, such non-executive director would be asked to tender his or her resignation to the Chairman of the Board of Directors, who would decide to accept the resignation or not.
None of the members of the Board of Directors, including the executive director, have entered into service contracts with ArcelorMittal or any of its subsidiaries that provide for any form of remuneration or for benefits upon the termination of their term. All non-executive Directors of the Company signed the Company’s Appointment Letter, which confirms the conditions of their appointment by the General Meeting of the Shareholders including compliance with certain non-compete provisions, the 10 Principles of Corporate Governance of the Luxembourg Stock Exchange and the Company’s Code of Business Conduct.
All members of the Board of Directors are required to sign the Company’s Code of Business Conduct upon first joining the Board of Directors and confirm their adherence thereto on an annual basis thereafter.
The remuneration of the members of the Board of Directors is determined on a yearly basis by the annual general meeting of shareholders.
Share transactions by management
In compliance with laws prohibiting insider dealing, the Board of Directors of ArcelorMittal has adopted insider dealing regulations, which apply throughout the ArcelorMittal group. These regulations are designed to ensure that insider information is treated appropriately within the Company and avoid insider dealing and market manipulation. Any breach of the rules set out in this procedure may lead to criminal or civil charges against the individuals involved, as well as disciplinary action by the Company.
185
Shareholding requirement for non-executive directors
In consideration of corporate governance trends indicating that a reasonable amount of share ownership helps better align the interests of the directors with those of all shareholders, the Board of Directors adopted on October 30, 2012 share ownership guidelines for non-executive directors as described above under “—Specific characteristics of the director role”. These share ownership guidelines have been amended on November 7, 2017.
Operation
General
The Board of Directors and the Board committees may engage the services of external experts or advisers as well as take all actions necessary or useful to implement the Company’s corporate purpose. The Board of Directors (including its two committees) has its own budget, which covers functioning costs such as external consultants, continuing education activities for directors and travel expenses.
Meetings
The Board of Directors meets when convened by the Chairman of the Board or any two members of the Board of Directors. The Board of Directors holds physical meetings at least on a quarterly basis as five regular meetings are scheduled per year. The Board of Directors holds additional meetings if and when circumstances require, in person or by teleconference and can take decisions by written circulation, provided that all members of the Board of Directors agree.
The Board of Directors held twelve meetings in 2018. The average attendance rate of the directors at the Board of Directors’ meetings was 92.59%.
In order for a meeting of the Board of Directors to be validly held, a majority of the directors must be present or represented, including at least a majority of the independent directors. In the absence of the Chairman, the Board of Directors will appoint by majority vote a chairman for the meeting in question. The Chairman may decide not to participate in a Board of Directors’ meeting, provided he has given a proxy to one of the directors who will be present at the meeting. For any meeting of the Board of Directors, a director may designate another director to represent him or her and vote in his or her name, provided that the director so designated may not represent more than one of his or her colleagues at any time.
Each director has one vote and none of the directors, including the Chairman, has a casting vote. Decisions of the Board of Directors are made by a majority of the directors present and represented at a validly constituted meeting, except for the decisions of the Board of Directors relating to the issue of any financial instruments carrying or potentially carrying a right to equity pursuant to the authorization conferred by article 5.5 of the Articles of Association, which shall be taken by a majority of two-thirds of the directors present or represented at a validly constituted meeting.
Lead Independent Director
In April 2008, the Board of Directors created the role of Lead Independent Director. His or her function is highlighted above
in Item 6A.
Mr. Bruno Lafont was elected by the Board of Directors as ArcelorMittal's second Lead Independent Director and re-elected as a director for a three-year term at ArcelorMittal annual general shareholder's meeting held on May 10, 2017.
The agenda of each meeting of the Board of Directors is decided jointly by the Chairman of the Board of Directors and the Lead Independent Director.
Separate meetings of independent directors
The independent members of the Board of Directors may schedule meetings outside the presence of non-independent directors. Five meetings of the independent directors outside the presence of management were held in 2018.
186
Annual self-evaluation
The Board of Directors decided in 2008 to start conducting an annual self-evaluation of its functioning in order to identify potential areas for improvement. The first self-evaluation process was carried out in early 2009. The self-evaluation process includes structured interviews between the Lead Independent Director and each director and covers the overall performance of the Board of Directors, its relations with senior management, the performance of individual directors, and the performance of the committees. The process is supported by the Company Secretary under the supervision of the Chairman and the Lead Independent Director. The findings of the self-evaluation process are examined by the ARCGS Committee and presented with recommendations from the ARCGS Committee to the Board of Directors for adoption and implementation. Suggestions for improvement of the Board of Directors’ process based on the prior year’s performance and functioning are implemented during the following year.
The 2018 Board of Directors’ self-evaluation was completed by the Board on February 5, 2019. The Board of Directors was of the opinion that it and the management had cooperated successfully during 2018 on important matters including operational and financial performance, the acquisition of Ilva and of Essar Steel, the ongoing strengthening of the balance sheet, strategy, especially on short term strategic planning, sustainability, labor relations and health and safety. The extension of the role of Audit Committee to Risk and of the role of ARCGS Committee to environment and sustainability is proving to be effective. The Board of Directors reviewed the practical implementation of the governance structure and thought it was working well. The Board set new priorities for discussion and review and identified a number of priority topics for 2019.
The Board of Directors believes that its members have the appropriate range of skills, knowledge and experience, as well as the degree of diversity necessary to enable it to effectively govern the business. The Board of Directors composition is reviewed on a regular basis and additional skills and experience are actively searched for in line with the expected development of ArcelorMittal’s business as and when appropriate.
Required skills, experience and other personal characteristics
Diverse skills, backgrounds, knowledge, experience, geographic location, nationalities and gender are required in order to effectively govern a global business the size of the Company’s operations. The Board of Directors and its committees are therefore required to ensure that the Board has the right balance of skills, experience, independence and knowledge necessary to perform its role in accordance with the highest standards of governance.
The Company’s directors must demonstrate unquestioned honesty and integrity, preparedness to question, challenge and critique constructively, and a willingness to understand and commit to the highest standards of governance. They must be committed to the collective decision-making process of the Board of Directors and must be able to debate issues openly and constructively, and question or challenge the opinions of others. Directors must also commit themselves to remain actively involved in Board decisions and apply strategic thought to matters at issue. They must be clear communicators and good listeners who actively contribute to the Board in a collegial manner. Each director must also ensure that no decision or action is taken that places his or her interests before the interests of the business. Each director has an obligation to protect and advance the interests of the Company and must refrain from any conduct that would harm it.
In order to govern effectively, non-executive directors must have a clear understanding of the Company’s strategy, and a thorough knowledge of the ArcelorMittal group and the industries in which it operates. Non-executive directors must be sufficiently familiar with the Company’s core business to effectively contribute to the development of strategy and monitor performance.
With specific regard to the non-executive directors of the Company, the composition of the group of non-executive directors should be such that the combination of experience, knowledge and independence of its members allows the Board to fulfill its obligations towards the Company and other stakeholders in the best possible manner.
The ARCGS Committee ensures that the Board of Directors is comprised of high-caliber individuals whose background, skills, experience and personal characteristics enhance the overall profile of the Board and meets its needs and diversity aspirations by nominating high quality candidates for election to the Board by the general meeting of shareholders.
Board profile
The key skills and experience of the directors, and the extent to which they are represented on the Board of Directors and its committees, are set out below. In summary, the non-executive directors contribute:
|
•
|
international and operational experience;
|
187
|
•
|
understanding of the industry sectors in which ArcelorMittal operates;
|
|
•
|
knowledge of world capital markets and being a company listed in several jurisdictions; and
|
|
•
|
an understanding of the health, safety, environmental, political and community challenges that ArcelorMittal faces.
|
Each director is required to adhere to the values set out in, and sign, the ArcelorMittal Code of Business Conduct.
Renewal
The Board of Directors plans for its own succession, with the assistance of the ARCGS Committee. In doing this, the Board of Directors:
|
•
|
considers the skills, backgrounds, knowledge, experience and diversity of geographic location, nationality and gender necessary to allow it to meet the corporate purpose;
|
|
•
|
assesses the skills, backgrounds, knowledge, experience and diversity currently represented;
|
|
•
|
identifies any inadequate representation of those attributes and agrees the process necessary to ensure a candidate is selected who brings them to the Board of Directors; and
|
|
•
|
reviews how Board performance might be enhanced, both at an individual director level and for the Board as a whole.
|
The Board believes that orderly succession and renewal is achieved through careful planning and by continuously reviewing the composition of the Board.
When considering new appointments to the Board, the ARCGS Committee oversees the preparation of a position specification that is provided to an independent recruitment firm retained to conduct a global search, taking into account, among other factors, geographic location, nationality and gender. In addition to the specific skills, knowledge and experience required of the candidate, the specification contains the criteria set out in the ArcelorMittal Board profile.
Diversity
In line with the worldwide effort to increase gender diversity on the boards of directors of listed and unlisted companies, the Board met its goal of increasing the number of women on the Board to at least three by the end of 2015 with the election of Mrs. Karyn Ovelmen in May 2015. Out of 9 members of the Board of Directors, women represent 33.33% in 2018. The ArcelorMittal Board’s diversity not only relates to gender, but also to the region, background and industry of its members.
Director induction, training and development
The Board considers that the development of the directors’ knowledge of the Company, the steel-making and mining industries, and the markets in which the Company operates is an ongoing process. To further bolster the skills and knowledge of directors, the Company set up a continuous development program in 2009.
Upon his or her election, each new non-executive director undertakes an induction program specifically tailored to his or her needs and includes ArcelorMittal’s long-term vision centered on the concept of “Safe Sustainable Steel”.
The Board’s development activities include the provision of regular updates to directors on each of the Company’s products and markets. Non-executive directors may also participate in training programs designed to maximize the effectiveness of the directors throughout their tenure and link in with their individual performance evaluations. The training and development program may cover not only matters of a business nature, but also matters falling into the environmental, social and governance area.
Structured opportunities are provided to build knowledge through initiatives such as visits to plants and mine sites and business briefings provided at Board meetings. Non-executive directors also build their Company and industry knowledge through the involvement of the CEO Office and other senior employees in Board meetings. Business briefings, site visits and development sessions underpin and support the Board’s work in monitoring and overseeing progress towards the corporate purpose of creating long-term shareholder value through the development of the ArcelorMittal business in steel and mining. The Company therefore continuously builds directors’ knowledge to ensure that the Board remains up-to-date with developments within the Company’s segments, as well as developments in the markets in which the Company operates.
188
During the year, non-executive directors participated in the following activities:
|
•
|
comprehensive business briefings intended to provide each director with a deeper understanding of the Company’s activities, environment, key issues and strategy of the Company’s segments. These briefings are provided to the Board of Directors by senior executives, including CEO Office members. The briefings provided during the course of 2018 covered health and safety processes, HR, legal and compliance, corporate responsibility, marketing, steel-making, strategy, international trade trends in steel industry in Europe. Certain business briefings were combined with site visits and thus took place on-site and, in other cases, they took place at Board meetings;
|
|
•
|
briefing meetings with Company executives in charge of specific business segments or markets;
|
|
•
|
site visits to plants and R&D centers; and
|
|
•
|
development sessions on specific topics of relevance, such as health and safety, commodity markets, HR, investor relations, accounting, the world economy, changes in corporate governance standards, directors’ duties and shareholder feedback.
|
The ARCGS Committee oversees director training and development. This approach allows induction and learning opportunities to be tailored to the directors’ committee memberships, as well as the Board of Directors' specific areas of focus. In addition, this approach ensures a coordinated process in relation to succession planning, Board renewal, training, development and committee composition, all of which are relevant to the ARCGS Committee’s role in securing the supply of talent to the Board.
Board of Directors committees
The Board of Directors has two committees:
|
•
|
the Audit & Risk Committee, and
|
|
•
|
the ARCGS Committee.
|
Audit & Risk Committee
In 2015, the Board decided to combine the Audit Committee with the Risk Management Committee in order to provide their members with a more holistic view of ArcelorMittal’s current governance, risks and control systems.
The primary function of the Audit & Risk Committee is to assist the Board in fulfilling its oversight responsibilities by reviewing:
|
•
|
the integrity of the financial reports and other financial information provided by the Company to any governmental body or the public;
|
|
•
|
the Company’s compliance with legal and regulatory requirements;
|
|
•
|
the registered public accounting firm’s (Independent Auditor) qualifications and independence;
|
|
•
|
the Company’s system of internal control regarding finance, accounting, legal compliance, ethics and risk management that management and the Board have established;
|
|
•
|
the Company’s auditing, accounting and financial reporting processes generally; and
|
|
•
|
the identification and management of risks to which the ArcelorMittal group is exposed.
|
The Audit & Risk Committee must be composed solely of independent members of the Board of Directors. The members are appointed by the Board of Directors each year after the annual general meeting of shareholders. The Audit & Risk Committee comprises three members, all of whom must be independent under the company’s corporate governance guidelines, the New York Stock Exchange (NYSE) standards as applicable to foreign private issuers and the 10 Principles of Corporate Governance of the Luxembourg Stock Exchange. The Audit & Risk Committee makes decisions by a simple majority with no member having a casting vote.
At least one member must qualify as an Audit & Risk Committee “financial expert” as defined by the SEC and determined by the Board.
At least one member must qualify as an Audit & Risk Committee “risk management expert” having experience in identifying, assessing, and managing risk exposures of large, complex companies.
189
The Audit & Risk Committee currently consists of 3 members: Mrs. Karyn Ovelmen, Mr. Bruno Lafont and Mr. Karel de Gucht, each of whom is an independent Director according to the NYSE standards and the 10 Principles of Corporate Governance of the Luxembourg Stock Exchange. The Chairman of the Audit & Risk Committee is Mrs. Ovelmen.
According to its charter, the Audit & Risk Committee is required to meet at least four times a year. During 2018, the Audit & Risk Committee met seven times. The Audit & Risk Committee performs an annual self-evaluation and completed its 2018 self-evaluation on February 5, 2019. The charter of the Audit & Risk Committee is available from ArcelorMittal upon request.
Appointments, Remuneration, Corporate Governance and Sustainability Committee (former ARCG Committee)
The ARCGS Committee is comprised of three directors, each of whom is independent under the New York Stock Exchange standards as applicable to foreign private issuers and the 10 Principles of Corporate Governance of the Luxembourg Stock Exchange.
The members are appointed by the Board of Directors each year after the annual general meeting of shareholders. The ARCGS Committee makes decisions by a simple majority with no member having a casting vote.
The Board of Directors has established the ARCGS Committee to:
|
•
|
determine, on its behalf and on behalf of the shareholders within agreed terms of reference, ArcelorMittal’s compensation framework, including short and long term incentives for the CEO, the President and CFO and for the five other Executive Officers;
|
|
•
|
review and approve succession and contingency plans for key managerial positions at the level of the Executive Officers;
|
|
•
|
consider any candidate for appointment or reappointment to the Board of Directors at the request of the Board of Directors and provide advice and recommendations to it regarding the same;
|
|
•
|
evaluate the functioning of the Board of Directors and monitor the Board of Directors’ self-evaluation process;
|
|
•
|
assess the roles of the Chairman and CEO and deliberate on the merits of the Board’s leadership structure to ensure that the most efficient and appropriate structure is in place; and
|
|
•
|
develop, monitor and review corporate governance principles and corporate responsibility policies applicable to ArcelorMittal, as well as their application in practice.
|
During its meeting of May 8, 2018, the Board renewed its emphasis on four key areas (health & safety, environment and community relations, climate change and social issues) and added these to the scope of the ARCG Committee to ensure a Board level review of these important topics. Accordingly, the ARCG Committee was renamed the ARCGS Committee ("Appointments, Remuneration, Corporate Governance and Sustainability Committee
")
to highlight the Company’s focus on these key areas
.
As a result, ArcelorMittal complies with the new Principle 9 on companies' corporate social responsibility introduced subsequently to the revision of the 10 Principles of the Luxembourg Stock Exchange. According to Recommendation 9.3 under the Principles, the Board shall regularly consider the Company's non-financial risks, including social and environmental risks. To this end, the ARCGS Committee oversees the Company's sustainable development plan and associated management systems to ensure that ArcelorMittal is well positioned to meet the evolving expectations of stakeholders including investors, customers, regulators, employees and communities.
The ARCGS Committee’s principal criteria in determining the compensation of executives is to encourage and reward performance that will lead to long-term enhancement of shareholder value. The ARCGS Committee may seek the advice of outside experts.
The three members of the ARCGS Committee are Mr. Bruno Lafont, Mrs. Suzanne P. Nimocks and Mr. Tye Burt, each of whom is independent in accordance with the NYSE standards applicable to foreign private issuers and the 10 Principles of Corporate Governance of the Luxembourg Stock Exchange. The Chairman of the ARCGS Committee is Mr. Lafont.
The ARCGS Committee is required to meet at least twice a year. During 2018, this committee met six times.
The ARCGS Committee performs an annual self-evaluation and completed its 2018 self-evaluation on February 5, 2019.
The charter of the ARCGS Committee is available from ArcelorMittal upon request.
190
Succession management
Succession management at ArcelorMittal is a systematic, structured process for identifying and preparing employees with potential to fill key organizational positions, should the position become vacant. This process applies to all ArcelorMittal key positions up to and including the CEO Office. Succession management aims to ensure the continued effective performance of the organization by providing for the availability of experienced and capable employees who are prepared to assume these roles as they become available. For each position, candidates are identified based on performance, potential and an assessment of leadership capabilities and their “years to readiness”. Development needs linked to the succession plans are discussed, after which “Personal Development Plans” are put in place, to accelerate development and prepare candidates. Regular reviews of succession plans are conducted at different levels of the organization to ensure that they are accurate and up to date, leading to at least once yearly a formal review by the CEO Office, of all key positions. Succession management is a necessary process to reduce risk of vacant positions or skill gap transitions, create a pipeline of future leaders, ensure smooth business continuity and improve employee motivation and engagement. This process has been in place for several years and reinforced, widened and made more systematic in all regions of the organization. The responsibility to review and approve succession plans and contingency plans at the highest level rests with the Board’s ARCGS Committee.
Other corporate governance practices
ArcelorMittal is committed to adhere to best practices in terms of corporate governance in its dealings with shareholders and aims to ensure good corporate governance by applying rules on transparency, quality of reporting and the balance of powers. ArcelorMittal continually monitors U.S., EU and Luxembourg legal requirements and best practices in order to make adjustments to its corporate governance controls and procedures when necessary, as evidenced by the new policies adopted by the Board of Directors in 2012.
ArcelorMittal complies with the 10 Principles of Corporate Governance of the Luxembourg Stock Exchange in all respects. However, in respect of Recommendation 1.3 under the Principles, which advocates separating the roles of chairman of the board and the head of the executive management body, the Company has made a different choice. This is permitted, however, as, unlike the 10 Principles themselves with which ArcelorMittal must comply, the Recommendations are subject to a more flexible “comply or explain” standard.
The nomination of the same person to both positions was approved by the shareholders (with Lumen and Nuavam, companies controlled by the Significant Shareholder abstaining). Since that date, the rationale for combining the positions of CEO and Chairman of the Board of Directors has become even more compelling. The Board of Directors is of the opinion that Mr. Mittal’s strategic vision for the steel industry in general and for ArcelorMittal in particular in his role as CEO is a key asset to the Company, while the fact that he is fully aligned with the interests of the Company’s shareholders means that he is uniquely positioned to lead the Board of Directors in his role as Chairman. The combination of these roles was revisited at the Annual General Meeting of Shareholders of the Company held in May 2017, when Mr. Lakshmi N. Mittal was re-elected to the Board of Directors for another three year term by a strong majority.
Ethics and conflicts of interest
Ethics and conflicts of interest are governed by ArcelorMittal’s Code of Business Conduct, which establishes the standards for ethical behavior that are to be followed by all employees and Directors of ArcelorMittal in the exercise of their duties. Each employee of ArcelorMittal is required to sign and acknowledge the Code of Conduct upon joining the Company. This also applies to the members of the Board of Directors of ArcelorMittal, who signed the Company’s Appointment Letter in which they acknowledged their duties and obligations. Any new member of the Board of Directors must sign and acknowledge the Code of Conduct upon appointment.
Employees must always act in the best interests of ArcelorMittal and must avoid any situation in which their personal interests conflict, or could conflict, with their obligations to ArcelorMittal. Employees are prohibited from acquiring any financial or other interest in any business or participating in any activity that could deprive ArcelorMittal of the time or the attention needed to devote to the performance of their duties. Any behavior that deviates from the Code of Business Conduct is to be reported to the employee’s supervisor, a member of the management, the head of the legal department or the head of the internal assurance department.
Code of Business Conduct training is offered throughout ArcelorMittal on a regular basis in the form of face-to-face trainings, webinars and online trainings. Employees are periodically trained about the Code of Business Conduct in each location where ArcelorMittal has operations. The Code of Business Conduct is available in the “Corporate Governance-Our Policies-Code of Business Conduct” section of ArcelorMittal’s website at www.arcelormittal.com.
191
In addition to the Code of Business Conduct, ArcelorMittal has developed a Human Rights Policy and a number of other compliance policies in more specific areas, such as antitrust, anti-corruption, economic sanctions, insider dealing and data protection. In all these areas, specifically targeted groups of employees are required to undergo specialized compliance training. Furthermore, ArcelorMittal’s compliance program also includes a quarterly compliance certification process covering all business segments and entailing reporting to the Audit & Risk Committee.
Process for Handling Complaints on Accounting Matters
As part of the procedures of the Board of Directors for handling complaints or concerns about accounting, internal controls and auditing issues, ArcelorMittal’s Anti-Fraud Policy and Code of Business Conduct encourage all employees to bring such issues to the Audit & Risk Committee’s attention on a confidential basis. In accordance with ArcelorMittal’s Anti-Fraud and Whistleblower Policy, concerns with regard to possible fraud or irregularities in accounting, auditing or banking matters or bribery within ArcelorMittal or any of its subsidiaries or other controlled entities may also be communicated through the “Corporate Governance — Whistleblower” section of the ArcelorMittal website at www.arcelormittal.com, where ArcelorMittal’s Anti-Fraud Policy and Code of Business Conduct are also available in each of the main working languages used within the Group. In recent years, ArcelorMittal has implemented local whistleblowing facilities, as needed.
During 2018, there were 145 complaints received relating to alleged fraud, which were referred to and duly reviewed by the Company’s Internal Assurance Department. Following review by the Audit & Risk Committee, none of these complaints was found to be significant.
Internal assurance
ArcelorMittal has an Internal Assurance function that, through its Head of Internal Assurance, reports to the Audit & Risk Committee. The function is staffed by full-time professional staff located within each of the principal operating subsidiaries and at the corporate level. Recommendations and matters relating to internal control and processes are made by the Internal Assurance function and their implementation is regularly reviewed by the Audit & Risk Committee.
Independent auditors
The appointment and determination of fees of the independent auditors is the direct responsibility of the Audit & Risk Committee. The Audit & Risk Committee is further responsible for obtaining, at least once each year, a written statement from the independent auditors that their independence has not been impaired. The Audit & Risk Committee has also obtained a confirmation from ArcelorMittal’s principal independent auditors to the effect that none of its former employees are in a position within ArcelorMittal that may impair the principal auditors’ independence.
Measures to prevent insider dealing and market manipulation
The Board of Directors of ArcelorMittal has adopted Insider Dealing Regulations (“IDR”), which are updated when necessary (most recently in January 2019) and in relation to which training is conducted throughout the Group. The IDR’s most recent version has been updated in light of the new Market Abuse Regulation and is available on ArcelorMittal’s website, www.arcelormittal.com.
The IDR apply to the worldwide operations of ArcelorMittal. The compliance and data protection officer of ArcelorMittal is also the IDR compliance officer and answers questions that members of senior management, the Board of Directors, or employees may have about the IDR’s interpretation. The IDR compliance officer maintains a list of insiders as required by Regulation No 596/2014 of the European Parliament and the Council dated 16 April 2014 on market abuse or “MAR” and the Commission Implementing Regulation 2016/347 of 10 March 2016 laying down technical standards with regard to the precise format of insider lists and for updating insider lists in accordance with MAR. The IDR compliance officer may assist senior executives and directors with the filing of notices required by Luxembourg law to be filed with the Luxembourg financial regulator, the CSSF (Commission de Surveillance du Secteur Financier). Furthermore, the IDR compliance officer has the power to conduct investigations in connection with the application and enforcement of the IDR, in which any employee or member of senior management or of the Board of Directors is required to cooperate.
192
Selected new employees of ArcelorMittal are required to participate in a training course about the IDR upon joining ArcelorMittal and every three years thereafter. The individuals who must participate in the IDR training include the members of senior management, employees who work in finance, legal, sales, mergers and acquisitions and other areas that the Company may determine from time to time. In addition, ArcelorMittal’s Code of Business Conduct contains a section on “Trading in the Securities of the Company” that emphasizes the prohibition to trade on the basis of inside information, as amended in July 2016. An online interactive training tool based on the IDR was developed in 2010 and deployed across the group through ArcelorMittal’s intranet, with the aim to enhance the staff’s awareness of the risks of sanctions applicable to insider dealing. The importance of the IDR was again reiterated in the Group Policies and Procedures Manual in 2013.
D. Employees
As of December 31, 2018, ArcelorMittal employs approximately 209,000 people directly, as well as a large number of contractors and part-time workers.
The table below sets forth the total number of employees by segment for the past three years.
|
Segment
|
2018
|
2017
|
2016
|
|
NAFTA
|
26,550
|
26,324
|
27,233
|
|
Brazil
|
19,555
|
18,058
|
18,380
|
|
Europe
|
88,768
|
78,643
|
80,975
|
|
ACIS
|
41,544
|
42,451
|
41,989
|
|
Mining
|
30,579
|
30,088
|
28,455
|
|
Other activities
|
1,587
|
1,544
|
1,485
|
|
Total
|
208,583
|
197,108
|
198,517
|
ArcelorMittal employees in various parts of the world are represented by trade unions and ArcelorMittal is a party to collective bargaining agreements with employee organizations in certain locations. The following description summarizes the status of certain of these agreements and relationships.
The Company is committed to open, respectful and transparent social dialogue at all of its operations, to strong employee relations, and safe, healthy and quality working lives for all its workers.
Employee relations and engagement
Finding and developing the right people is a strategic priority to build a high-performing organization. We recognize that the world of work has changed and that the expectations of employees and potential employees have changed with it. There is a strong demand for the best talent and the Company wants to ensure it is considered as an aspirational place to work.
That means ensuring employees feel safe, respected and valued. It also means building a culture that constantly keeps employees committed, motivated and eager to perform at their best. In 2018, ArcelorMittal surveyed a wide group of managers at all levels in the organization to gather feedback on how it can continue to develop its employer brand. The results of this project will enable the Company to better communicate the value proposition of ArcelorMittal and to ensure that opportunities for employees are better understood both among existing employees and amongst potential recruits of ArcelorMittal.
Employee engagement is key and feedback is integrated into action plans, to address employees’ concerns. Every two years, a Company-wide engagement survey gauges employees’ opinions, attitudes and levels of satisfaction. This "Speak up!" survey seeks feedback in a range of areas, including organizational direction, leadership and professional deployment and development. It allows employees to relay feedback anonymously to the executive leadership and the Company to build specific action plans to address employee’s concerns. A representative, random sample of Company employees is also included in ArcelorMittal's reputation surveys, which canvas the views of a wide range of stakeholders. Other surveys, conducted at a country level to gauge the most important issues for stakeholders, also include employee samples and in 2018, these were conducted in the United States and Luxembourg, where the results have led to concrete follow-up plans.
ArcelorMittal conducts an open and continuous dialogue with its employees to create a working environment based on mutual trust, understanding and respect and to ensure that the rights of its workers are protected. It prides itself on productive working relationships with unions and it works to maintain collective bargaining agreements with employees in all countries of production.
193
Diversity and inclusion
ArcelorMittal values diversity as a way of bringing fresh perspectives and experiences to the business and as part of its ambition to be an employer of choice. The Company has a presence in over 60 countries and employees from many more and its diversity and inclusion policy aims to encompass different cultures, generations, genders, ethnic groups, nationalities, abilities and social backgrounds. In November 2018, the Company was one of some 50 leading companies from the European Roundtable of Industrialists (ERT), to sign the #EmbraceDifference pledge, to promote diversity and inclusion in the workplace.
ArcelorMittal’s senior management is committed to building a more inclusive culture and recruiting, retaining and promoting more talented women. It also recognizes the increasing expectations of stakeholders, including employees and investors, to report on progress in this area. In 2018, the Company developed KPIs to support this commitment, which it will report against in its Integrated Annual Review. It also began an internal benchmarking project to compare the diversity and inclusion policies and initiatives in place at 11 sites, alongside consultation with employees.
In 2018, women held 12.4% of management positions; this comprised 6% of Vice-President positions, 6% at General Manager level and 14% of Managers. 11.4% of senior succession plan candidates - those who are foreseen to take over senior manager positions at General Managers level and above - are women.
In line with the worldwide effort to increase gender diversity in company boards, ArcelorMittal met its goal of increasing the number of women on the Board of Directors to at least three by the end of 2015. In 2018, 3 of the 9 positions on the Board of Directors were held by women.
A number of programs are in place to develop women as leaders. These are supported by initiatives including training programs for women employees, mentoring and coaching, networking and role model involvement. This is aligned with a commitment to support future leaders in science, technology, engineering and maths ("STEM"). In 2018, the Company ran initiatives in a number of countries, including France and the United States, specifically designed to attract women applicants with STEM backgrounds.
In 2017, the ArcelorMittal University launched Women@ArcelorMittal, a program which includes an online learning channel, webinars and face-to-face training; 84 employees attended in 2018. To help foster a broader inclusive culture, the ArcelorMittal University also runs training programs for employees to build their understanding of how cultural orientations affect attitudes and actions and how they can manage interactions between different cultural perspectives and communication styles.
Initiatives in a number of countries support people with disabilities in the workplace. In France, the seven sites of ArcelorMittal Atlantique & Lorraine have an agreement with three unions to promote the vocational integration of workers with disabilities and they run a dedicated awareness week for the workforce. In its Fos-sur-Mer site, the Company runs a training program aimed at qualifying unemployed people with disabilities to work in metallurgical roles in partnership with Agefiph (Fund for the Integration of the Disabled). Also in Brazil, an inclusion program includes a workforce target for people with disabilities.
Employee development
Employee development, including succession planning and the development of young talent, is also crucial in building a high-performing organization. It goes to the heart of the Company's aspiration to engage and retain employees, as described above. The Company aims to have a clear career pathway for employees, supported with ongoing initiatives to build their technical capabilities through training. ArcelorMittal has programs designed to spot people with potential and manage the succession of key roles, as part of its overall strategic workforce planning process, which is overseen by the Appointments, Remuneration and Corporate Governance Committee. Strategic workforce planning is a key element of business unit quarterly reviews.
Employees chart their personal and professional progress through a performance review process with their line managers. This is tracked centrally for non-hourly employees, of whom 96.7 % had twice yearly reviews in 2018, compared to 97.2% in 2017.
Employees can select online and classroom training courses from the ArcelorMittal University, as well as a range of leadership, management, functional, technical and bespoke programs for lifelong learning and professional progression. The ArcelorMittal University is based in Esch-sur-Alzette (Luxembourg) and it has campuses in Temirtau and Karaganda (Kazakhstan), Hamilton (Canada), Aviles (Spain), Ostrava (Czech Republic), Vanderbijlpark (South Africa), Kryvyi Rih (Ukraine) and Tubarão (Brazil). Career committees oversee the management and development of individuals, the improvement
194
of competency levels across the organization and the availability of a pipeline of talent for all key positions. Every year, top management reviews individual succession plans for around 300 key positions worldwide.
Collective Labor Agreements
The Joint Global Health and Safety Agreement signed in 2008 between the Company and the IndustriALL union at the European and international level (formerly European and International Metalworkers Federations, respectively) and United Steelworkers Union in North America remained in effect in 2018. This agreement, which is the first of its kind in the steel industry, recognizes the vital role played by trade unions in improving health and safety. It sets out minimum standards for every site the Group operates with the objective of achieving world-class performance. These standards include the commitment to form joint management of union health and safety committees, as well as training and education programs at the facility level in order to make a meaningful impact on health and safety across the Group. The creation of a joint global health and safety committee is also included in the agreement. This committee consists of representatives of management and the unions and focuses on helping ArcelorMittal steel and mining activities to further improve their health and safety performance. This committee meets regularly to support improvements in the efficiency of local committees. In 2018, meetings took place in February in Poland and in October in South Africa. In addition, several other safety training programs, including the Take Care Training, were rolled out in 2018 to support the “Journey to Zero” program aimed at reducing the amount of injuries and fatalities in the Group to zero. See “Item 4B—Information on the Company—Business overview—Competitive strengths—Sustainable development—Outcome 1: Safe, healthy, quality working lives for ArcelorMittal’s people.”
In 2018, collective labor agreements (“CLAs”) were entered into or renewed in the United States, Argentina, Brazil, Liberia, Mexico, South Africa, and most European countries.
ArcelorMittal USA renewed a CLA in 2018 which covers most of the Company’s unionized employees in the United States. After the existing CLA expired on September 1, 2018, an agreement for a new labor contract was achieved in November 2018 and will be effective until it expires on September 1, 2022.
At ArcelorMittal Long Products Canada, unionized employees at Contrecoeur West continue to work under an agreement with the United Steel Workers ("USW") expiring in July 2020. The six-year labor agreements ratified in February 2016, covering Contrecoeur East and Longueuil facilities remains valid until January 2022. The collective agreement with USW covering the Contrecoeur Scrap Recycling Center employees, renewed in April 2016 for a six-year term expiring on March 31, 2022 remains valid. The collective agreement with USW at Hamilton-East Wire, renewed in 2016 for a five-year term expiring July 31, 2021 and the agreement with USW at St-Patrick Wire was renewed in 2017 for a six-year term expiring on December 31, 2023 also remain valid.
ArcelorMittal Mexico and the National Miners Union agreed to a new, one-year contract effective August 1, 2018. ArcelorMittal Mexico continues to explore opportunities with the union to improve workforce productivity, efficiency and competitiveness in light of the significant market challenges for 2019. At ArcelorMittal Tubular Products Monterrey the collective agreement with the National Federation of Independent Unions expired on February 15, 2019 and negotiations for a renewal are in progress.
In Brazil, the 2017 “Labor Reform” had an important impact on labor negotiations, including an immediate decrease of employment related litigations. In 2018, the number of cases decreased by 40% as compared to 2017. The post-"Labor Reform" environment was more peaceful for negotiation with the trade unions. The Company’s CLA negotiations vary from one plant to another as these are located in different cities and states throughout the country. Seventeen CLA negotiations took place between May and November, of which fifteen were signed and concluded without undue delay, while two negotiations are still ongoing. The main criteria for the adjustment of salaries takes into account the rate of inflation registered in the 12 months period preceding the date of the CLA.
The Argentinian economy continues to suffer from economic recession and financial volatility. There is high uncertainty, due to interest rates increases of up to 70% annually and the 2018 GDP falling between 2% to 2.5% and inflation rate ending the year at around 47.5%. In the context, Acindar signed a CLA with the Union UOM in October 2018 to adjust salaries, and a further adjustment will be agreed to in the first quarter of 2019.
In Venezuela, the economic collapse continues its course in the absence of corrective measures, hyperinflation has decimated the buying power of the population. GDP fell in 2018 for the fifth consecutive year and there is still a lot of volatility in the country. No CLA was signed in 2018 but - with hyperinflation continuing - frequent increases of employee salaries have taken place to account for the impact of inflation.
195
In response to weak market conditions in Europe since 2011, ArcelorMittal has reviewed its footprint and adapted its operations to respond to changing demands and to optimize its costs and capacity utilization. Management and unions have been engaged in constructive social dialogue to better face the challenging economic environment.
In France, a one-year salary agreement covering 2019 was concluded for three of the major entities representing approximately 60% of the Company’s French employees, namely ArcelorMittal Méditerranée, ArcelorMittal Atlantique & Lorraine and Industeel. All other French legal entities have started their negotiations, targeting agreement dates within the first quarter of 2019. During 2018, successful negotiations were reached with three trade unions regarding the Company's pension scheme.
Regular meetings have been held with national representatives of the main trade unions, to share all relevant information on various topics, including key challenges for the steel industry. These meetings are aimed at sharing views and reinforcing social dialogue at all levels. As the French law on employee representative bodies has changed, ArcelorMittal has entered (or will enter) into negotiations in order to adapt to the new framework to its different legal entities. Some agreements have already been successfully concluded and others are expected to be reached throughout 2019.
In Luxembourg, the Company continued the implementation of the « PostLux2016 » agreement signed in September 2016, which is aimed at securing investments on production sites on the one hand, while enabling pre-retirement and maintaining the talent pool resulting from previous reorganizations. This agreement will be valid until July 1, 2019. As of September 2018, the Company entered, upon request from trade unions, into negotiations for renewal of a CLA in steel, as well as of an agreement for free hours for delegates in view of the social elections that are to take place on March 12, 2019.
In Belgium, 2018 was the second year of the 2017-2018 CLA period. No new CLA negotiations took place and there were zero salary increases. Significant efforts were exerted across management levels to complete the Gent-Liège cluster organization. Intensive social dialogue was conducted relating to the carve out of certain Liège production facilities in the context of the remedies for the acquisition of Ilva. Political tensions related to elections in May 2019 and upcoming CLA negotiations for the 2019-2020 period are expected to bring challenges during the year.
In Romania, negotiations for the 2019 CLA began in November 2018 and were finalized in January. The negotiating context also changed for several reasons, including the increase in minimum base salary, the introduction of a minimum salary for university degree employees with one year of seniority, and further changes and minimum wage increases expected during the 2019 election year.
In Germany, employee relations were managed in a calm and prudent manner. Social partners met twice in the social dialogue group, comprised of both employer and employee representatives. The focus was on the European Works Council’s (EWC) work in relation to the Ilva acquisition, as well as on local health and safety topics. Throughout the year, the union supported the Company in its demand for safeguard measures and the implementation of the emissions trading system (ETS) or lower costs of energy to maintain the competitiveness of the steel industry in Germany and Europe. At the end of 2018, the existing CLA expired and the union published steep demands. Negotiations for the renewal of the CLA are ongoing.
In the Czech Republic, the CLA signed in 2016 for 3 years remained valid and only amendments on salaries negotiated on a yearly basis were negotiated. A deal was reached in December 2018 which included a permanent salary increase of 1830 CZK on average per employee per month. The CLA's of ArcelorMittal Ostrava's subsidiaries remain under discussion. In terms of the scope of labor activities, ArcelorMittal Frýdek-Místek (with 466 employees) was sold at the end of February 2018 to Stalprodukt S.A.
At ArcelorMittal Poland, the current CLA will remain valid until one of the parties terminates it. Salary increases are agreed during the annual negotiations as the CLA does not provide for any automatic renewal mechanism. In 2018, for the first time in history, ArcelorMittal Poland reached a salary agreement covering a 2-year period (2018 and 2019). An agreement with trade unions on general rules that conditional bonuses partially depend on profitability were also concluded. Regular meetings were held with the main trade unions in order to share all relevant information on various topics connected with maintenance of ArcelorMittal Poland's production installations. These meetings are aimed at sharing views and reinforcing social dialogue at new levels. In the area of remuneration and employment, employee relations were managed in the context of decreasing unemployment in the country and rising wages in Poland (with the minimum wage increasing by 7.1% in 2019). The focus of discussions with social partners on enhancing a culture of cooperation based on mutual respect and supporting creative ideas that bring added value and support the labor market.
196
In Spain, ArcelorMittal's policy aims at promoting social dialogue. Accordingly, management and unions have consistently worked together in efforts to find solutions to regain competitiveness and to maintain social dialogue. With this objective, a framework agreement was used between 2016 to 2018 for flat products and some specific companies of ArcelorMittal Downstream Solutions, which included a defined but moderate base salary increase. An additional variable premium linked to productivity and financial objectives of the Company was included in the framework agreement. All other Spanish legal entities from Long Products have extended their CLA covering 2017 and 2018 and negotiations for 2019 are ongoing.
Additionally, the Temporary Layoff Plan, in force since June 2009 and designed to adapt the available human resources to the levels of activity in the facilities was extended until the end of 2020. It is being applied on a plant-by-plant basis depending on the activity.
ArcelorMittal remains committed to a strong and continuous social dialogue in sensitive contexts. Continuous and high-level conversation, a reactive process based on the exchange of views and fully transparent discussions underlies ArcelorMittal's fundamental approach to anticipating and managing change within the Company. In 2018, the European Works Council (EWC) experienced an extraordinarily intensive level of activity due to the acquisition of Ilva; the number of meetings doubled to ensure updated information on the acquisition and the remedies was available to the employee representatives.
Meanwhile, the EWC meetings also represented an opportunity to review ArcelorMittal activities in Europe and to identify and highlight the Company’s key challenges. The Company regularly presented and commented on safety, financial results, market outlooks, quality, industrial performance, human resources topics, recent developments or projects maintaining the proximity with the top-level management and employee representative bodies. As part of the EWC missions, three working groups on health and safety, employment and social responsibility have met during the year on the common topic of subcontractor management.
In November 2018, a three-day training session on environment and health and safety topics, was organized by management and was attended by more than 50 employee representatives. In December, the plenary session was dedicated to the review of the segments’ key information such as health and safety, employment, financial results and business perspective with the participation of the respective CEOs of the businesses operating in Europe.
In Ukraine, five collective labor disputes were registered at Kryviy rih, of which two were suspended pending court decision (one registered in 2017 and one in 2018). Three collective labor disputes (one registered in 2016 and two in 2017) are under review.
I
n South Africa, the Company’s operations are currently covered by the CLA concluded in August 2018 with the two recognized trade unions, Solidarity and NUMSA, for a period of three years ending March 31, 2021. The focus on productivity will remain integral to the Business Transformation Project, which was initiated in June 2018, as well as the Strategic Workforce Planning process that commenced in January 2019. Formal engagements with labor, as part of these processes, will be initiated if required as per the relevant South African legislation. A further factor affecting the labor relations landscape relates to the treatment under South African law of different categories of temporary labor and related rulings in South African courts, including the Constitutional Court. The Company is currently reviewing the implications thereof, as well as measures it may be required to take.
In Kazakhstan, all the requirements, terms and conditions of the CLA were fulfilled in 2018. Social dialogue with trade unions is stable. The current CLA was concluded for 3 years covering 2018, 2019 and 2020.
In 2018, the mining segment has maintained productive social dialogue and relationships with its trade unions and communities where there are operations. Like every year, the annual negotiations with SINDEXTRA Union in Serra Azul in Brazil were concluded within the mandate. Similarly, the CLA in Liberia with the UWUL union, a 3 year collective agreement, was successfully concluded within mandate during November 2018. In Canada, the implementation of a 3 years CLA agreed to in 2017 with USW Union is currently under way.
E. Share ownership
As of December 31, 2018, the aggregate beneficial share ownership of ArcelorMittal directors and senior management (15 individuals) totaled 370,557 ArcelorMittal shares (excluding shares beneficially owned by the Significant Shareholder), including options to acquire 138,384 ArcelorMittal ordinary shares that are exercisable within 60 days of December 31, 2018, representing 0.04% of the total issued share capital of ArcelorMittal. Excluding options to acquire ArcelorMittal ordinary shares (and excluding shares beneficially owned by the Significant Shareholder), these 15 individuals beneficially own 232,173 ArcelorMittal ordinary shares. Other than Mr. Lakshmi Mittal, each director and member of senior management beneficially
197
owns less than 1% of ArcelorMittal’s shares. For purposes of this Item 6.E, ordinary shares held directly by Mr. Lakshmi Mittal and his wife, Mrs. Usha Mittal, and options held directly by Mr. Lakshmi Mittal are aggregated with those ordinary shares beneficially owned by the Significant Shareholder. In addition, see “Item 7.A—Major shareholders and related party transactions—Major shareholders” for the beneficial share ownership of Mr. Aditya Mittal and Ms. Vanisha Mittal Bhatia.
On April 27, 2015, ArcelorMittal adopted share ownership guidelines for its CEO. The share ownership policy aims to demonstrate to ArcelorMittal’ shareholders, the investing public and the Company’s employees, the commitment of the CEO to the Company and directly aligns his interests with those of the Company’s shareholders. Accordingly, the CEO should, within 5 years of the end of the current calendar year, own shares of the Company’s common shares at least equal to 3 times his annual salary and hold the purchased shares for so long as he serves the Company.
In accordance with the Luxembourg Stock Exchange’s 10 Principles of Corporate Governance, independent non-executive members of ArcelorMittal's Board of Directors do not receive share options, RSUs or PSUs, and the policy of the Company is not to grant any share-based remuneration to members of the Board of Directors who are not executives of the Company.
See “Item 6.B—Directors, senior management and employees—Compensation” for a description of options, RSUs and PSUs held by members of ArcelorMittal’s senior management, including the Chairman and CEO.
The following tables summarize outstanding share options, as of December 31, 2018, granted to the members of the ex-GMB and Executive Officers of ArcelorMittal:
|
Options granted in 2010
|
Options granted in 2009
|
Options Total
|
Weighted Average Exercise Price of Options
|
||||||
|
Ex-GMB (Including Chief Executive Officer)
|
56,967
|
61,333
|
118,300
|
—
|
|||||
|
Exercise price
1
|
$91.98
|
$109.14
|
—
|
$100.88
|
|||||
|
Term (in years)
|
10
|
10
|
—
|
—
|
|||||
|
Expiration date
|
Aug. 3, 2020
|
Aug. 4, 2019
|
—
|
—
|
|||||
|
1
|
The options granted in the table above were revised following the completion of the Company’s share consolidation of each three existing shares into one share without nominal value on May 22, 2017.
|
|
Options granted in 2010
|
Options granted in 2009
|
Options Total
|
Weighted Average Exercise Price of Options
|
||||||
|
Executive Officers
1
|
29,250
|
29,667
|
58,917
|
—
|
|||||
|
Exercise price
2
|
$91.98
|
$109.14
|
—
|
$100,62
|
|||||
|
Term (in years)
|
10
|
10
|
—
|
—
|
|||||
|
Expiration date
|
Aug. 3, 2020
|
Aug. 4, 2019
|
—
|
—
|
|||||
|
1
|
Any Executive Officer who has been a GMB member is included in the Ex-GMB members in the prior table.
|
|
2
|
The options granted in the table above were revised following the completion of the Company’s share consolidation of each three existing shares into one share without nominal value on May 22, 2017.
|
The following tables summarize outstanding PSUs and RSUs granted to the members of the ex-GMB and Executive Officers of ArcelorMittal in 2018, 2017, 2016 and 2015.
|
PSUs granted in 2018
|
PSUs granted in 2017
|
PSUs granted in 2016
|
||||
|
Ex-GMB (Including Chief Executive Officer)
|
134,861
|
90,084
|
306,536
|
|||
|
Term (in years)
|
3
|
3
|
3+2
|
|||
|
Vesting date
1
|
January 1, 2022
|
January1, 2021
|
January 1, 2020 - January 1, 2022
|
|||
|
1
|
See “Item 6.B—Directors, senior management and employees—Compensation
—
Remuneration—Long-term incentives plans”, for vesting conditions.
|
198
|
PSUs granted in 2018
|
PSUs granted in 2017
|
PSUs granted in 2016
|
PSUs granted in 2015
|
|||
|
Executive Officers
2
|
76,550
|
44,720
|
445,560
|
10,668
|
||
|
Term (in years)
|
3
|
3
|
3+2
|
3
|
||
|
Vesting date
1
|
January 1, 2022
|
January 1, 2021
|
January 1, 2019 -January 1, 2021
|
January 1, 2019
|
||
|
1
|
See note 7.3 to the consolidated financial statements, for vesting conditions.
|
|
2
|
Any Executive Officer who has been a GMB member is included in the Ex-GMB members in the prior table.
|
See note 7.3 of the consolidated financial statements for a description of ArcelorMittal’s equity-settled share-based payments to certain employees, including stock options, RSUs and PSUs.
|
ITEM 7.
|
MAJOR SHAREHOLDERS AND RELATED PARTY TRANSACTIONS
|
A.
Major shareholders
The following table sets out information as of December 31, 2018 with respect to the beneficial ownership of ArcelorMittal ordinary shares by each person who is known to be the beneficial owner of more than 5% of the shares and all directors and senior management as a group.
|
ArcelorMittal
Ordinary Shares 1 |
|||||
|
Number
|
%
|
||||
|
Significant Shareholder
2
|
382,297,751
|
|
37.41
|
%
|
|
|
Treasury Shares
3
|
8,335,365
|
|
0.82
|
%
|
|
|
Other Public Shareholders
4
|
631,270,507
|
|
61.77
|
%
|
|
|
Total
|
1,021,903,623
|
|
100.00
|
%
|
|
|
Of which: Directors and Senior Management
5
|
370,557
|
|
0.04
|
%
|
|
|
1
|
For purposes of this table, a person or group of persons is deemed to have beneficial ownership of any ArcelorMittal ordinary shares as of a given date on which such person or group of persons has the right to acquire such shares within 60 days after December 31, 2018 upon exercise of vested portions of stock options. All stock options that have been granted to date by ArcelorMittal have vested.
|
|
2
|
For purposes of this table, ordinary shares owned directly by Mr. Lakshmi Mittal and his wife, Mrs. Usha Mittal, and options held directly by Mr. Lakshmi Mittal, are aggregated with those ordinary shares beneficially owned by the Significant Shareholder. At December 31, 2018, Mr. Lakshmi Mittal and his wife, Mrs. Usha Mittal, had direct ownership of ArcelorMittal ordinary shares and beneficial ownership (within the meaning set forth in Rule 13d-3 of the Exchange Act), through the Significant Shareholder, of the outstanding equity of two holding companies that own ArcelorMittal ordinary shares—Nuavam Investments S.à r.l. (“Nuavam”) and Lumen Investments S.à r.l. (“Lumen”). Nuavam, a limited liability company organized under the laws of Luxembourg, was the owner of 63,658,348 ArcelorMittal ordinary shares. Lumen, a limited liability company organized under the laws of Luxembourg, was the owner of 318,288,328 ArcelorMittal ordinary shares. Mr. Mittal was the direct owner of 286,742 ArcelorMittal ordinary shares and held options to acquire an additional 38,833 ArcelorMittal ordinary shares, all of which are, for the purposes of this table, deemed to be beneficially owned by Mr. Mittal due to the fact that these options are exercisable within 60 days. Mrs. Mittal was the direct owner of 25,500 ArcelorMittal ordinary shares. Mr. Mittal, Mrs. Mittal and the Significant Shareholder shared beneficial ownership of 100% of the outstanding equity of each of Nuavam and Lumen (within the meaning set forth in Rule 13d-3 of the Exchange Act). Accordingly, Mr. Mittal was the beneficial owner of 382,272,251 ArcelorMittal ordinary shares, Mrs. Mittal was the beneficial owner of 381,972,176 ordinary shares and the Significant Shareholder (when aggregated with ordinary shares of ArcelorMittal and options to acquire ordinary shares of ArcelorMittal held directly by Mr. and Mrs. Mittal) was the beneficial owner of 382,297,751 ordinary shares. Excluding options, Mr. Lakshmi Mittal and Mrs. Usha Mittal together beneficially owned 382,258,918 ArcelorMittal ordinary shares at such date. As of December 31, 2017 and 2016 , the Significant Shareholder (together with Mr. Mittal and Mrs. Mittal) held 37.41% and 37.40% of the Company’s ordinary shares respectively.
|
|
3
|
Represents ArcelorMittal ordinary shares repurchased pursuant to share repurchase programs, fractional shares returned in various transactions, and the use of treasury shares in various transactions; includes (1) 138,384 stock options that can be exercised by senior management (other than Mr. Mittal) and (2) 38,833 stock options that can be exercised by Mr. Mittal, in each case within 60 days of December 31, 2018, i.e. 0.02% of the total amount of outstanding shares. If exercised, the shares underlying these options will either have to be delivered out of Treasury shares or by the issuance of additional shares.
|
199
|
4
|
The Capital Group Companies Inc.’s shareholding increased to 168,541,781 shares, corresponding to an interest of 5.49% on April 11, 2016 and subsequently decreased to 147,321,072 on January 25, 2017, corresponding to an interest of 4.8%. Following the reverse stock split in May 2017, the Capital Group Companies Inc. was the owner of 49,107,024 ArcelorMittal shares on December 31, 2018.
|
|
5
|
Includes shares beneficially owned by directors and members of senior management
listed in Item 6.E of this annual report;
excludes shares beneficially owned by Mr. Mittal. Note that (i) stock options included in this item that are exercisable within 60 days are excluded from “Treasury Shares” above (see also note 3 above) and (ii) ordinary shares included in this item are included in “Other Public Shareholders” above.
|
Aditya Mittal is the direct owner of 120,413 ArcelorMittal ordinary shares and holds options to acquire an additional 31,067 ArcelorMittal ordinary shares, together representing 0.1% of the ArcelorMittal ordinary shares outstanding. Aditya Mittal holds a total of 243,534 PSUs of which 40,653 may vest in 2021, 64,559 may vest in 2022 and 138,322 of which 50% may vest after 3 years in 2020 and 50% may vest after five years in 2022. As the vesting of PSUs is dependent on company performance criteria not fully within the control of the PSU holder, Aditya Mittal does not beneficially own ArcelorMittal ordinary shares by virtue of his ownership of the PSUs. Aditya Mittal is the son of Mr. Mittal and Mrs. Mittal and is Group President and CFO and CEO of ArcelorMittal Europe. Vanisha Mittal Bhatia is the direct owner of 8,500 ArcelorMittal ordinary shares, representing less than 0.1% of the ArcelorMittal ordinary shares outstanding. Vanisha Mittal Bhatia is the daughter of Mr. Mittal and Mrs. Mittal and a member of the Company’s Board of Directors.
As of December 31, 2015, 1,817,869 Mandatorily Convertible Notes had been converted at the option of their holders. On January 15, 2016, ArcelorMittal issued 137,967,116 (45,989,039 after reverse stock split mentioned below) new ordinary shares of the Company upon conversion as at such date of the 88,182,131 outstanding Mandatorily Convertible Notes at a conversion ratio of 1.56457. Following this issuance, the share capital of the Company was comprised of 1,803,359,338 (601,119,779 after reverse stock split mentioned below) shares and the Significant Shareholder (when aggregated with ordinary shares of ArcelorMittal and options to acquire ordinary shares of ArcelorMittal held directly by Mr. and Mrs. Mittal) held 37.41% of the outstanding shares.
Following the Company’s equity offering authorized by the EGM which closed on April 8, 2016, the Company’s issued share capital was increased from 1,803,359,338 (601,119,779 after reverse stock split mentioned below) ordinary shares to 3,065,710,869 (1,021,903,623 after reverse stock split mentioned below) ordinary shares.
The EGM of ArcelorMittal shareholders held on May 10, 2017 approved a reverse stock split. Following this approval, on May 22, 2017 ArcelorMittal completed the consolidation of each three existing shares in ArcelorMittal without nominal value into one share without nominal value. As a result, the aggregate number of shares issued and fully paid up decreased from 3,065,710,869 to 1,021,903,623.
The ArcelorMittal ordinary shares may be held in registered form on the Company’s register only. Registered shares are fully fungible and may consist of:
|
a.
|
ArcelorMittal Registry Shares, which are registered directly on ArcelorMittal’s Luxembourg shareholder register,
|
|
b.
|
shares traded on Euronext Amsterdam, Euronext Paris, the regulated market of the Luxembourg Stock Exchange and the Spanish Stock Exchanges, which are held in Euroclear, or
|
|
c.
|
shares traded on the NYSE, named New York Registry Shares, which are registered (including in the name of the nominee of DTC) in a register kept by or on behalf of ArcelorMittal by its New York transfer agent.
|
Under Luxembourg law, the ownership of registered shares is evidenced by the inscription of the name of the shareholder, the number of shares held by such shareholder and the amount paid up on each share in the shareholder register of ArcelorMittal.
At December 31, 2018, 2,709 shareholders other than the Significant Shareholder, holding an aggregate of 21,821,253 ArcelorMittal ordinary shares were registered in ArcelorMittal’s shareholder register, representing approximately 2.14% of the ordinary shares issued (including treasury shares).
At December 31, 2018, there were 200 registered shareholders holding an aggregate of 57,620,574 New York Shares, representing approximately 5.64% of the ordinary shares issued (including treasury shares). ArcelorMittal’s knowledge of the number of New York Shares held by U.S. holders is based solely on the records of its New York transfer agent regarding registered ArcelorMittal ordinary shares.
At December 31, 2018, 571,154,196 ArcelorMittal ordinary shares were held through the Euroclear/Iberclear clearing system in The Netherlands, France, Luxembourg and Spain.
200
Voting rights
Each share entitles the holder to one vote at the general meeting of shareholders, and no shareholder benefits from specific voting rights. For more information relating to ArcelorMittal shares, see
“Item 10.B—Additional information—Memorandum and Articles of Association—Voting and information rights”.
B.
Related party transactions
ArcelorMittal engages in certain commercial and financial transactions with related parties, including associates and joint ventures of ArcelorMittal. Please refer to note 11 of ArcelorMittal’s consolidated financial statements.
Shareholder’s Agreement
Mr. Lakshmi Mittal and ArcelorMittal are parties to a shareholder and registration rights agreement (the “Shareholder’s Agreement”) dated August 13, 1997. Pursuant to the Shareholder’s Agreement and subject to the terms and conditions thereof, ArcelorMittal shall, upon the request of certain holders of restricted ArcelorMittal shares, use its reasonable efforts to register under the Securities Act of 1933, as amended, the sale of ArcelorMittal shares intended to be sold by those holders. By its terms, the Shareholder’s Agreement may not be amended, other than for manifest error, except by approval of a majority of ArcelorMittal’s shareholders (other than the Significant Shareholder and certain permitted transferees) at a general shareholders’ meeting.
Memorandum of Understanding
The Memorandum of Understanding entered into in connection with the Mittal Steel acquisition of Arcelor, certain provisions of which expired in August 2009 and August 2011, is described under
“Item 10.C—Additional information—Material contracts—Memorandum of Understanding”.
Agreements with Aperam SA post-Stainless Steel Spin-Off
In connection with the spin-off of its stainless steel division into a separately focused company, Aperam SA (“Aperam”), which was completed on January 25, 2011, ArcelorMittal entered into several agreements with Aperam and/ or certain Aperam subsidiaries which are still in force: a purchasing services agreement for negotiation services from ArcelorMittal Purchasing (the “Purchasing Services Agreement”) as well as certain commitments regarding cost-sharing in Brazil and certain other ancillary arrangements governing the relationship between Aperam and ArcelorMittal following the spin-off, as well as certain agreements relating to financing.
The parties agreed to renew a limited number of services where expertise and bargaining power created value for each party. ArcelorMittal will continue to provide certain services in 2019 relating to areas including environmental and technical support.
In the area of research and development at the time of the spin-off, Aperam entered into a framework arrangement with ArcelorMittal to establish a structure for future cooperation in relation to certain ongoing or new research and development programs. Currently, only limited research and development support is implemented through this agreement, but new collaborative endeavors are foreseen in 2019.
Under the terms of the Purchasing Services Agreement, Aperam still relies on ArcelorMittal for services in relation to the negotiation of certain contracts with global or large regional suppliers, including those relating to the following key categories: operating materials (rolls, electrodes and refractory materials), spare parts, transport, industrial products and services. The Purchasing Services Agreement also permits Aperam to avail itself of the services and expertise of ArcelorMittal for certain capital expenditure items. The Purchasing Services Agreement was entered into for an initial term of two years, which was to expire on January 24, 2013. However, since that date, the Purchasing Services Agreement has been extended successively and will remain in force until 2021. Specific IT service agreements have been put in place with Aperam, one for Asset Reliability Maintenance Program (ARMP) in its Brazilian entities, and two others for the use in Europe of ARMP and for the use of the global wide area network (WAN). In Europe, Aperam purchased most of its electricity and natural gas though energy supply contracts put in place for the period 2014-2019 with ArcelorMittal Energy SCA and ArcelorMittal Purchasing SAS.
201
Purchasing activities will continue to be provided to Aperam pursuant to existing contracts with ArcelorMittal entities that it has specifically elected to assume. In addition, since 2011, a services agreement has been concluded between ArcelorMittal Shared Service Center Europe Sp z.o.o. Sp.k. and Aperam for accounting services.
In connection with the spin-off, management also renegotiated an existing Brazilian cost-sharing agreement between ArcelorMittal Brasil and Aperam Inox América do Sul S.A. (formerly known as ArcelorMittal Inox Brasil), pursuant to which, starting as of April 1, 2011, ArcelorMittal Brasil continued to perform purchasing for the benefit of certain of Aperam’s Brazilian subsidiaries, with costs being shared on the basis of cost allocation parameters agreed between the parties.
C. Interest of experts and counsel
Not applicable.
|
ITEM 8.
|
FINANCIAL INFORMATION
|
A. Consolidated statements and other financial information
Export sales
Because ArcelorMittal’s customers are mainly based outside its home country of Luxembourg, all of its sales are considered to be export sales. Annual sales to a single individual customer did not exceed 5% of sales in any of the periods presented.
Legal proceedings
ArcelorMittal is currently and may in the future be involved in litigation, arbitration or other legal proceedings. Provisions related to legal and arbitration proceedings are recorded in accordance with the principles described in note 8.1 to ArcelorMittal’s consolidated financial statements. Please refer to note 8.3 for a description of contingencies, including legal proceedings.
Dividend distributions
Based on Luxembourg law and its Articles of Association, ArcelorMittal allocates at least five percent of its net profits to the creation of a reserve. This allocation ceases to be compulsory when the reserve reaches ten percent (10%) of its issued share capital, and becomes compulsory once again when the reserve falls below that percentage. Under Luxembourg law, the amount of any dividends paid to shareholders may not exceed the amount of the profits at the end of the last financial year plus any profits carried forward and any amounts drawn from reserves that are available for that purpose, less any losses carried forward and sums to be placed in reserve in accordance with Luxembourg law or the Articles of Association. A company may not pay dividends to shareholders when, on the closing date of the last financial year, the net assets are, or following the payment of such dividend would become, lower than the amount of the subscribed capital plus the reserves that may not be distributed by law or by virtue of the articles of association. ArcelorMittal’s Articles of Association provide that the portion of annual net profit that remains unreserved is allocated as follows by the general meeting of shareholders upon the proposal of the Board of Directors:
|
•
|
a global amount is allocated to the Board of Directors by way of directors’ fees (“tantièmes”). This amount may not be less than €1,000,000. In the event that the profits are insufficient, the amount of €1,000,000 shall be imputed in whole or in part to charges. The distribution of this amount among the members of the Board of Directors shall be effected in accordance with the Board of Directors’ rules of procedure; and
|
|
•
|
the balance is distributed as dividends to the shareholders or placed in the reserves or carried forward.
|
Interim dividends may be distributed under the conditions set forth in Luxembourg law by decision of the Board of Directors.
No interest is paid on dividends declared but not paid which are held by the Company on behalf of shareholders.
On November 6, 2015, ArcelorMittal’s Board of Directors proposed the suspension of the dividend for the financial year 2015. This proposal was approved by the shareholders at the annual general meeting held on May 4, 2016.
202
The Board of Directors reviewed the progress made in 2016, and although not concerned by the sustainability of the Company’s performance, it nevertheless wanted to see further progress. As such, deleveraging remained the near-term priority for surplus cash flow and the Board of Directors decided against proposing a dividend from 2016 earnings. This proposal was approved by the shareholders at the annual general meeting held on May 10, 2017.
On January 31, 2018, the Company announced that the Board has agreed on a new dividend policy which was proposed to shareholders at the annual general meeting of shareholders in May 2018. Given the current deleveraging focus, dividends were proposed to begin at $0.10/share in 2018 (paid from 2017 results) and were approved at the annual general meeting of shareholders on May 9, 2018 . They amounted to $101 million and were paid on June 13, 2018. Furthermore, the Board proposes an increase in the base dividend for 2019 (paid from 2018 earnings) to $0.20 per share which will be proposed to the shareholders at the AGM in May 2019.
Once the Company achieves net debt at or below its $6 billion target, then the Company is committed to returning a portion of the amount of annual net cash provided by operating activities less capital expenditures to shareholders.
B. Significant changes
Not applicable.
|
ITEM 9.
|
THE OFFER AND LISTING
|
A. Offer and listing details
Nature of trading market
ArcelorMittal shares are listed and traded on the NYSE (symbol "MT"). ArcelorMittal shares are listed and traded (through a single order book as from January 14, 2009) on the Euronext European markets (Paris and Amsterdam) (symbol “MT”), are admitted to trading on the Luxembourg Stock Exchange’s regulated market and listed on the Official List of the Luxembourg Stock Exchange (symbol “MT”) and are listed and traded on the Spanish Stock Exchanges (symbol “MTS”).
B. Plan of distribution
Not applicable.
C. Markets
ArcelorMittal shares are listed and traded (through a single order book as from January 14, 2009) on the Euronext European markets (Paris and Amsterdam) (symbol “MT”), are admitted to trading on the Luxembourg Stock Exchange’s regulated market and listed on the Official List of the Luxembourg Stock Exchange (symbol “MT”) and are listed and traded on the Spanish Stock Exchanges (symbol “MTS”). ArcelorMittal shares are also listed and traded on the NYSE (symbol “MT”).
D. Selling shareholders
Not applicable.
E. Dilution
Not applicable.
F. Expenses of the issue
Not applicable.
|
ITEM 10.
|
ADDITIONAL INFORMATION
|
A. Share capital
203
As of December 31, 2018, the Company’s issued share capital was $364 million represented by 1,021,903,623 ordinary shares without nominal value. The Company's issued share capital changed as described below in 2016, 2017 and 2018.
Out of the total of 1,021,903,623 shares in issue, 8,335,365 shares were held in treasury by ArcelorMittal at December 31, 2018, representing approximately (0.82)% of its issued share capital.
The Company’s authorized share capital, including the issued share capital, was $411 million represented by 1,151,576,921 ordinary shares without nominal value as of December 31, 2018.
On January 15, 2016, following the maturity of the $2.25 billion 6% Mandatorily Convertible Subordinated Notes due 2016 (the “Notes”), the Company’s issued share capital increased by €570 million from €6,883 million, represented by 1,665,392,222 shares without nominal value, as of December 31, 2015 to €7,453 million represented by 1,803,359,338 shares without nominal value. For the 1,817,869 Notes converted at the option of their holders during the fourth quarter of 2015, the Company delivered a total of 2,275,026 treasury shares.
On February 5, 2016, the Company announced its intention to increase its capital through a rights issue with shareholders benefiting from non-statutory preferential subscription rights on terms to be determined by the Company. At its meeting on February 3, 2016, the Board of Directors resolved, among other things and subject to approval by an extraordinary general meeting of shareholders, to authorize the issue of up to 30,000,000,000 new ordinary shares, to cancel the statutory preferential subscription rights of the existing shareholders and to authorize the granting of preferential subscription rights to existing shareholders on terms to be determined based on market practice and conditions (the “equity offering”).
The extraordinary general meeting (the “EGM”) of ArcelorMittal shareholders, held on March 10, 2016, approved the two resolutions on its agenda:
|
•
|
to reduce the share capital of the Company without distribution to shareholders, in order to reduce the par value of the shares in the Company to an amount of 10 euro cents per share and
|
|
•
|
to increase the Company’s authorized share capital including the authorization to limit or cancel the shareholders’ preferential subscription rights.
|
Following such approval, the Company’s share capital decreased on March 10, 2016 from €7,453 million to €180 million represented by 1,803,359,338 ordinary shares without nominal value. The Company’s authorized share capital decreased from €8,249 million as of December 31, 2015 represented by 1,995,857,213 shares to €200 million with an unchanged number of shares and subsequently increased to €3,200 million represented by 31,995,857,213 shares.
As a result of the Company’s equity offering authorized by the EGM and which closed on April 8, 2016 at a price of €2.20 per share, the Company’s issued share capital increased from €180 million to €306 million represented by 3,065,710,869 ordinary shares without nominal value. The Company’s authorized share capital including the issued share capital decreased from €3,200 million represented by 31,995,857,213 shares to €337 million represented by 3,372,281,956 ordinary shares without nominal value.
The EGM of ArcelorMittal shareholders held on May 10, 2017 approved a reverse stock split and an increase of the Company’s authorized share capital from €337 million to €345 million. Following this approval, on May 22, 2017 ArcelorMittal completed the consolidation of each three existing shares in ArcelorMittal without nominal value into one share without nominal value. As a result, the authorized share capital increased from €337 million represented by 3,372,281,956 ordinary shares without nominal value as of December 31, 2016 to €345 million represented by 1,151,576,921 ordinary shares without nominal value. There was no change in the issued share capital of ArcelorMittal which continues to amount to €306 million but the aggregate number of shares issued and fully paid up decreased from 3,065,710,869 to 1,021,903,623.
The EGM of ArcelorMittal shareholders held on May 16, 2018 approved the change of currency of the Company's share capital from euro to U.S. dollar based on the exchange rate published by the European Central Bank on May 15, 2018. As a result, the issued share capital amounts to $364 million at December 31, 2018. There was no change in the aggregate number of shares issued which continues to amount to 1,021,903,623 ordinary shares fully paid without nominal value. The Company’s authorized share capital, including the issued share capital, amounts to $411 million at December 31, 2018 represented by 1,151,576,921 ordinary shares without nominal value.
Over the years, ArcelorMittal has issued equity-settled share-based payments to certain employees, including stock options, restricted share units and performance share units. See Note 7.3 to the consolidated financial statements.
204
B.
Memorandum and Articles of Association
Below is a summary of ArcelorMittal’s Articles of Association, filed as an exhibit to this annual report on Form 20-F and incorporated by reference herein. The full text of the Company’s Articles of Association is also available on www.arcelormittal.com under “Investors—Corporate Governance—Board of Directors.”
Corporate purpose
Article 3 of the Articles of Association provides that the corporate purpose of ArcelorMittal is the manufacture, processing and marketing of steel, steel products and all other metallurgical products, as well as all products and materials used in their manufacture, their processing and their marketing, and all industrial and commercial activities connected directly or indirectly with those objects, including mining and research activities and the creation, acquisition, holding, exploitation and sale of patents, licenses, know-how and, more generally, intellectual and industrial property rights.
The Company may realize its corporate purpose either directly or through the creation of companies, the acquisition, holding or acquisition of interests in any companies or partnerships, membership in any associations, consortia and joint ventures.
In general, the Company’s corporate purpose comprises the participation, in any form whatsoever, in companies and partnerships and the acquisition by purchase, subscription or in any other manner as well as the transfer by sale, exchange or in any other manner of shares, bonds, debt securities, warrants and other securities and instruments of any kind.
It may grant assistance to any affiliated company and take any measure for the control and supervision of such companies.
It may carry out any commercial, financial or industrial operation or transaction that it considers to be directly or indirectly necessary or useful in order to achieve or further its corporate purpose.
Form and transfer of shares
The shares of ArcelorMittal are issued in registered form only and are freely transferable. There are no restrictions on the rights of Luxembourg or non-Luxembourg residents to own ArcelorMittal shares.
Under Luxembourg law, the ownership of registered shares is evidenced by the inscription of the name of the shareholder and the number of shares held by such shareholder in the shareholders’ register. Each transfer of shares is made by a written declaration of transfer recorded in the shareholders’ register of ArcelorMittal, dated and signed by the transferor and the transferee or by their duly appointed agent. ArcelorMittal may accept and enter into its shareholders’ register any transfer based on an agreement between the transferor and the transferee provided a true and complete copy of the agreement is provided to ArcelorMittal.
The Articles of Association provide that shares may be held through a securities settlement (clearing) system or a professional depositary of securities. Shares held in this manner have the same rights and obligations as the registered shares. Shares held through a securities settlement system or a professional depositary of securities may be transferred in accordance with customary procedures for the transfer of securities in book-entry form.
The ArcelorMittal ordinary shares may be held in registered form on the Company’s register only. Registered shares are fully fungible and may consist of:
|
a.
|
ArcelorMittal Registry Shares, which are registered directly on ArcelorMittal’s Luxembourg shareholder register,
|
|
b.
|
shares traded on Euronext Amsterdam, Euronext Paris, the regulated market of the Luxembourg Stock Exchange and the Spanish Stock Exchanges, which are held in Euroclear, or
|
|
c.
|
shares traded on the NYSE, named New York Registry Shares, which are registered in a register (including in the name of the nominee of DTC) kept by or on behalf of ArcelorMittal by its New York transfer agent.
|
Since March 2009, ArcelorMittal has used the services of BNP Paribas Securities Services to assist it with certain administrative tasks relating to the day-to-day administrative management of the shareholders’ register.
205
The law of April 6, 2013 concerning dematerialized securities allows Luxembourg issuers to opt for the full dematerialization of shares. The EGM of ArcelorMittal shareholders held on May 10, 2017 authorized and empowered the Board of Directors to give effect to such dematerialization and to determine its effective date, following which new shares in the Company may only be issued in dematerialized form (the “Effective Date”). Notice of the compulsory dematerialization will be given in accordance with Article 6.9 (i) of the Company’s Articles of Association. As from the Effective Date,
shareholders would be required to hold their shares in a securities account at a bank or other financial intermediary, which would in turn hold the shares via an account with a securities depository such as Clearstream or Euroclear. Dematerialized securities would be solely represented by account entries with the securities depositary and would therefore exist only in electronic form. It would then no longer be possible for shareholders to hold shares through a direct, nominative registration in the Company’s register of shareholders as is currently the case.
Issuance of shares
The issuance of shares by ArcelorMittal requires either an amendment of the Articles of Association approved by an EGM or a decision of the Board of Directors that is within the limits of the authorized share capital set out in the Articles of Association. In the latter case, the Board of Directors may determine the conditions for the issuance of shares, including the consideration (cash or in kind) payable for such shares.
The EGM may not validly deliberate unless at least half of the share capital is present or represented upon the first call. If the quorum is not met, the meeting may be reconvened as described in “–General meeting of shareholders” below. The second meeting will be held regardless of the proportion of share capital represented. At both meetings, resolutions, in order to be adopted, must be carried by at least two-thirds of the votes cast.
Following the mandatory conversion on January 15, 2016 of outstanding Notes of the Company’s $2.25 billion 6% Mandatorily Convertible Subordinated Notes due 2016, the Company’s issued share capital increased by €570 million from €6,883 million to €7,453 million represented by 1,803,359,338 shares without nominal value.
On February 5, 2016, the Company announced its intention to increase its capital through a rights issue with shareholders benefiting from non-statutory preferential subscription rights on terms to be determined by the Company. At its meeting on February 3, 2016, the Board of Directors resolved among others and subject to approval by an EGM, to authorize the issue of up to 30,000,000,000 new ordinary shares, to cancel the statutory preferential subscription rights of the existing shareholders and to authorize the granting of preferential subscription rights to existing shareholders on terms to be determined based on market practice and conditions (the “equity offering”).
The EGM of ArcelorMittal shareholders, held on March 10, 2016, approved the two resolutions on its agenda:
|
•
|
to reduce the share capital of the Company without distribution to shareholders, in order to reduce the par value of the shares in the Company to an amount of 10 euro cents per share and
|
|
•
|
to increase the Company’s authorized share capital including the authorization to limit or cancel the shareholders’ preferential subscription rights.
|
The above authorization expires five years from the date of publication of the EGM minutes in the Official Luxembourg Gazette Mémorial C, which occurred on March 23, 2016. This authorization may be renewed from time to time by an EGM for periods not to exceed five years each.
Following such approval, the Company’s share capital decreased on March 10, 2016 from €7,453 million to €180 million represented by 1,803,359,338 ordinary shares without nominal value. The Company’s authorized share capital, including the issued share capital, amounted to €3,200 million represented by 31,995,857,213 ordinary shares without nominal value.
As a result of the Company’s equity offering authorized by the EGM and which closed on April 8, 2016 at a price of €2.20 per share, the Company’s issued share capital increased from €180 million to €306 million represented by 3,065,710,869 ordinary shares without nominal value and remained unchanged at December 31, 2016. The Company’s authorized share capital, including the issued share capital, amounted to €337 million represented by 3,372,281,956 ordinary shares without nominal value.
206
The EGM of ArcelorMittal shareholders held on May 10, 2017 approved a reverse stock split and an increase of the Company’s authorized share capital from €337 million to €345 million. Following this approval, on May 22, 2017 ArcelorMittal completed the consolidation of every three existing shares in ArcelorMittal without nominal value into one share without nominal value. As a result, the authorized share capital increased from €337 million represented by 3,372,281,956 ordinary shares without nominal value to €345 million represented by 1,151,576,921 ordinary shares without nominal value. There was no change in the issued share capital of ArcelorMittal but the aggregate number of shares issued and fully paid up decreased from 3,065,710,869 to 1,021,903,623.
Articles 4, 5, 7, 8, 9, 11, 13, 14 and 15 of the Articles of Association have been amended to reflect the recent changes in Luxembourg law. Such amendments to the Articles of Association were filed with the Luxembourg Register of Commerce and Companies on May 18, 2017.
The EGM of ArcelorMittal shareholders held on May 16, 2018 approved the change of the currency of the share capital of the Company from euro into U.S. dollar (the “Change of Currency”) based on the EUR/USD exchange rate of 1.1883 published by the European Central Bank at about 4 pm CET on May 15, 2018, the day preceding the EGM. As a result, the issued share capital amounts to $364 million represented by 1,021,903,623 ordinary shares fully paid without nominal value. The Company’s authorized share capital, including the issued share capital, amounts to $411 million represented by 1,151,576,921 ordinary shares without nominal value.
Articles 5.1, 5.2 and the second paragraph of article 17 of the Articles of Association of the Company have been amended to reflect the Change of Currency.
Such amendments to the Articles of Association were filed with the Luxembourg Register of Commerce and Companies on May 31, 2018.
Preemptive rights
Unless limited or cancelled by the Board of Directors as described below or by an EGM, holders of ArcelorMittal shares have a pro rata preemptive right to subscribe for newly issued shares, except for shares issued for consideration other than cash (i.e., in kind).
The Articles of Association provide that preemptive rights may be limited or cancelled by the Board of Directors in the event of an increase in the Company’s issued share capital until the date being five years from the date of publication via the online platform called
Recueil électronique des sociétés et associations
(“RESA”) which replaced as of June 1, 2016 the Luxembourg official legal gazette, the
Mémorial, Recueil des Sociétés et Associations,
of the relevant meeting minutes, which publication occurred on May 18, 2017 with respect to the minutes of the EGM held on May 10, 2017. This power of the Board of Directors may from time to time be renewed by an EGM for subsequent periods not to exceed five years each.
Repurchase of shares
ArcelorMittal is prohibited by Luxembourg law from subscribing for its own shares. ArcelorMittal may, however, repurchase its own shares or have another person repurchase shares on its behalf, subject to certain conditions, including:
|
•
|
a prior authorization of the general meeting of shareholders setting out the terms and conditions of the proposed repurchase, including the maximum number of shares to be repurchased, the duration of the period for which the authorization is given (which may not exceed five years) and the minimum and maximum consideration per share;
|
|
•
|
the repurchase may not reduce the net assets of ArcelorMittal on a non-consolidated basis to a level below the aggregate of the issued share capital and the reserves that ArcelorMittal must maintain pursuant to Luxembourg law or its Articles of Association;
|
|
•
|
only fully paid-up shares may be repurchased. At December 31, 2018, all of ArcelorMittal’s issued ordinary shares were fully paid-up; and
|
|
•
|
the acquisition offer is made on the same terms and conditions to all the shareholders who are in the same position, it being noted however that listed companies may repurchase their own shares on the stock exchange without an acquisition offer having to be made to the shareholders.
|
207
In addition, Luxembourg law allows the Board of Directors to approve the repurchase of ArcelorMittal shares without the prior approval of the general meeting of shareholders if necessary to prevent serious and imminent harm to ArcelorMittal. In such a case, the next general meeting of shareholders must be informed by the Board of Directors of the reasons for and the purpose of the acquisitions made, the number and nominal values, or in the absence thereof, the accounting par value of the shares acquired, the proportion of the issued share capital that they represent, and the consideration paid for them.
The general meeting of shareholders held on May 5, 2015 (the “General Meeting”) decided (a) to cancel with effect as of the date of the General Meeting the authorization granted to the Board of Directors by the general meeting of shareholders held on May 11, 2010 with respect to the share buy-back program, and (b) to authorize, effective immediately after the General Meeting, the Board of Directors, with the option to delegate to the corporate bodies of the other companies in the ArcelorMittal group in accordance with the Luxembourg law of August 10, 1915 on commercial companies, as amended (the “Law”), to acquire and sell shares in the Company in accordance with the Law and any other applicable laws and regulations, including but not limited to entering into off-market and over-the-counter transactions and to acquire shares in the Company through derivative financial instruments.
Any acquisitions, disposals, exchanges, contributions or transfers of shares by the Company or other companies in the ArcelorMittal group must be in accordance with Luxembourg laws transposing Directive 2003/6/EC regarding insider dealing and market manipulation as repealed and replaced by Regulation (EU) No. 596/2014 of the European Parliament and of the Council of April 16, 2014 on market abuse and Commission Delegated Regulation (EU) No. 2016/1052 of March 8, 2016 with regard to regulatory technical standards for the conditions applicable to buy-back programs and stabilization measures.
Such transactions may be carried out at any time, including during a tender offer period, subject to applicable laws and regulations including Section 10(b) and Section 9(a)(2) of the Securities Exchange Act of 1934, as amended (the “Exchange Act”), and Rule 10b-5 promulgated under the Exchange Act.
The authorization is valid for a period of five years, i.e., until the annual general meeting of shareholders to be held in May 2020, or until the date of its renewal by a resolution of the general meeting of shareholders if such renewal date is prior to the expiration of the five-year period.
The maximum number of shares that may be acquired is the maximum allowed by the Luxembourg law of 10 August 1915 on commercial companies in such manner that the accounting par value of the Company’s shares held by the Company do not in any event exceed 10% of the Company’s issued share capital.
The maximum number of own shares that the Company may hold at any time directly or indirectly may not have the effect of reducing its net assets (“actif net”) below the amount mentioned in paragraphs 1 and 2 of Article 461-2 of the Law. The purchase price per share to be paid shall not represent more than 110% of the trading price of the shares on the New York Stock Exchange and on the Euronext markets where the Company is listed, the Luxembourg Stock Exchange or the Spanish stock exchanges of Barcelona, Bilbao, Madrid and Valencia, depending on the market on which the purchases are made, and no less than one cent. For off-market transactions, the maximum purchase price shall be 110% of the reference price on the Euronext markets where the Company is listed. The reference price will be deemed to be the average of the final listing prices per share on the relevant stock exchange during 30 consecutive days on which the relevant stock exchange is open for trading preceding the three trading days prior to the date of purchase. In the event of a share capital increase by incorporation of reserves or issue premiums and the free allotment of shares as well as in the event of the division or regrouping of the shares, the purchase price indicated above shall be adjusted by a multiplying coefficient equal to the ratio between the number of shares comprising the issued share capital prior to the transaction and such number following the transaction. The total amount allocated for the Company’s share repurchase program may not in any event exceed the amount of the Company’s then available equity.
Capital reduction
The Articles of Association provide that the issued share capital of ArcelorMittal may be reduced subject to the approval of at least two-thirds of the votes cast at an extraordinary general meeting of shareholders where, at first call, at least 50% of the issued share capital is required to be represented, with no quorum being required at a reconvened meeting.
General meeting of shareholders
The shareholders’ rights law of May 24, 2011, which transposes into Luxembourg law Directive 2007/36/EC of the European Parliament and of the Council of July 11, 2007 on the exercise of certain rights of shareholders in listed companies of July 14, 2007 came into force on July 1, 2011 (the “Shareholder’s Rights Law”).
208
The Shareholders’ Rights Law abolished the blocking period and introduced the record date system into Luxembourg law. As set out in the Articles of Association, the record date applicable to ArcelorMittal is the 14
th
day at midnight before the general meeting date. Only the votes of shareholders who are shareholders of the Company on the record date will be taken into account, regardless of whether they remain shareholders on the general meeting date. Shareholders who intend to participate in the general meeting must notify the Company at the latest on the date indicated in the convening notice of their intention to participate (by proxy or in person).
Ordinary general meetings of shareholders.
At an ordinary general meeting of shareholders there is no quorum requirement and resolutions are adopted by a simple majority, irrespective of the number of shares represented. Ordinary general meetings deliberate on any matter that does not require the convening of an extraordinary general meeting.
Extraordinary general meetings of shareholders
.
An extraordinary general meeting must be convened to deliberate on the following types of matters:
|
•
|
an increase or decrease of the authorized or issued share capital,
|
|
•
|
a limitation or exclusion of existing shareholders’ preemptive rights,
|
|
•
|
the acquisition by any person of 25% or more of the issued share capital of ArcelorMittal,
|
|
•
|
approving a merger or similar transaction such as a spin-off, and
|
|
•
|
any transaction or matter requiring an amendment of the Articles of Association.
|
The extraordinary general meeting must reach a quorum of shares present or represented at the meeting of 50% of the share capital in order to validly deliberate. If this quorum is not reached, the meeting may be reconvened and the second meeting will not be subject to any quorum requirement. In order to be adopted by the extraordinary general meeting (on the first or the second call), any resolution submitted must be approved by at least two-thirds of the votes cast except for certain limited matters where the Articles of Association require a higher majority (see “—Amendment of the Articles of Association”). Votes cast do not include votes attaching to shares with respect to which the shareholder has not taken part in the vote, has abstained or has returned a blank or invalid vote.
Voting and information rights
The voting and information rights of ArcelorMittal’s shareholders have been further expanded since the entry into force of the Shareholders’ Rights Law on July 1, 2011.
There are no restrictions on the rights of Luxembourg or non-Luxembourg residents to vote ArcelorMittal shares. Each share entitles the shareholder to attend a general meeting of shareholders in person or by proxy, to address the general meeting of shareholders and to vote. Each share entitles the holder to one vote at the general meeting of shareholders. There is no minimum shareholding (beyond owning a single share or representing the owner of a single share) required to be able to attend or vote at a general meeting of shareholders.
The Board of Directors may also decide to allow shareholders to vote by correspondence by means of a form providing for a positive or negative vote or an abstention on each agenda item. The conditions for voting by correspondence are set out in the Articles of Association and in the convening notice.
The Board of Directors may decide to arrange for shareholders to be able to participate in the general meeting by electronic means by way, among others, of (i) real-time transmission to the public of the general meeting, (ii) two-way communication enabling shareholders to address the general meeting from a remote location, or (iii) a mechanism allowing duly identified shareholders to cast their votes before or during the general meeting without the need for them to appoint a proxyholder who would be physically present at the meeting.
A shareholder may act at any general meeting of shareholders by appointing another person (who need not be a shareholder) as his or her attorney by means of a written proxy using the form made available on the website of the Company. The completed and signed proxy must be sent to the Company in accordance with the instructions set out in the convening notice.
209
General meetings of shareholders are convened by the publication of a notice at least 30 days before the meeting date in a Luxembourg newspaper, via the RESA, and by way of press release sent to the major news agencies. Ordinary general meetings are not subject to any minimum shareholder participation level. Extraordinary general meetings, however, are subject to a minimum quorum of 50% of the share capital. In the event the 50% quorum is not met upon the first call, the meeting may be reconvened by way of convening notice published in the same manner as the first notice, at least 17 days before the meeting date. No quorum is required upon the second call.
Shareholders whose share ownership is directly registered in the shareholders’ register of the Company must receive the convening notice by regular mail, unless they have accepted to receive it through other means (i.e., electronically). In addition, all materials relating to a general meeting of shareholders must be made available on the website of ArcelorMittal from the first date of publication of the convening notice.
Based on an amendment voted by the extraordinary general meeting of shareholders on May 10, 2017, the Articles of Association provide that the annual general meeting of shareholders is held each year within six months from the end of the previous financial year at the Company’s registered office or at any other place in the Grand Duchy of Luxembourg as determined by the Board of Directors and indicated in the convening notice.
Luxembourg law requires the Board of Directors to convene a general meeting of shareholders if shareholders representing in the aggregate 10% of the issued share capital so require in writing with an indication of the requested agenda. In this case, the general meeting of shareholders must be held within one month of the request. If the requested general meeting of shareholders is not so convened, the relevant shareholder or group of shareholders may petition the competent court in Luxembourg to have a court appointee convene the general meeting.
Shareholders representing in the aggregate 5% of the issued share capital may also request that additional items be added to the agenda of a general meeting and may draft alternative resolutions to be submitted to the general meeting regarding existing agenda items. The request must be made in writing and sent either to the electronic address or to the Company’s postal address set out in the convening notice.
The Shareholders’ Rights Law provides that a company’s articles of association may allow shareholders to ask questions prior to the general meeting which will be answered by management during the general meeting’s questions and answers session prior to the vote on the agenda items. Although the Articles of Association do not specifically address this point, shareholders may ask questions in writing ahead of a general meeting, which are taken into account in preparing the general meeting’s questions and answers session. With regard to the May 9, 2018 general meeting, shareholders were expressly encouraged to send questions and comments to the Company in advance by writing to a dedicated e-mail address indicated in the convening notice.
Election and removal of directors
.
Members of the Board of Directors are elected by simple majority of the represented shareholders at an ordinary general meeting of shareholders. Directors are elected for a period ending on a date determined at the time of their appointment. The directors of ArcelorMittal are elected for three-year terms. Any director may be removed with or without cause by a simple majority vote at any general meeting of shareholders.
(a) a director’s power to vote on a proposal, arrangement or contract in which the director is materially interested;
If a Director has directly or indirectly a financial interest in a transaction that is submitted to the Board of Directors for approval and this interest conflicts with that of ArcelorMittal (other than transactions which are ordinary business operations and are entered into under normal conditions), the Director must advise the Board of Directors of the existence and nature of the conflict and cause a record of his/her statement to be included in the minutes of the meeting. In addition, the Director may not take part in the discussions on and may not vote on the relevant transaction and he or she shall not be counted for the purposes of whether the quorum is present, in which case the Board of Directors may validly deliberate if at least the majority of the non-conflicted directors are present or represented. At the next following general meeting of shareholders of ArcelorMittal, before any other resolution is put to a vote, a special report will be made by the Board of Directors to the shareholders’ meeting on any such transaction.
(b) the directors’ power, in the absence of an independent quorum, to vote compensation to themselves or any members of their body;
210
The remuneration of the Directors is determined each year by the annual general meeting of shareholders subject to Article 17 of the Articles of Association. The annual shareholders meeting of the Company decides on the directors’ remuneration. The Chairman & CEO is not remunerated for his membership on the Board of Directors. The remuneration of the Chairman & CEO is determined by the Board’s ARCGS Committee, which consists solely of independent directors.
For more information, see “Item 6.B—Directors, senior management and employees—Compensation”.
(c) borrowing powers exercisable by the directors and how such borrowing powers can be varied;
Any transaction between ArcelorMittal or a subsidiary of ArcelorMittal and a Director (or an affiliate of a Director) must be conducted on arm’s length terms and, if material, must obtain the approval of the Independent Directors.
(d) retirement or non-retirement of directors under an age limit requirement
There is no retirement or non-retirement of directors under an age limit requirement. However
,
on October 30, 2012, the Board of Directors adopted a policy that places limitations on the terms of independent directors as well as the number of directorships Directors may hold in order to align the Company’s corporate governance practices with best practices in this area. The policy provides that an independent director may not serve on the Board of Directors for more than 12 consecutive years, although the Board of Directors may, by way of exception to this rule, make an affirmative determination, on a case-by-case basis, that he or she may continue to serve beyond the 12 years rule if the Board of Directors considers it to be in the best interest of the Company based on the contribution of the Director involved and the balance between the knowledge, skills, experience and need for renewal of the Board.
(e) number of shares, if any, required for director’s qualification.
Article 8.2 of the Articles of Association states that the members of the Board of Directors do not have to be shareholders in the Company. However, the Board of Directors introduced on April 27, 2015 a policy that requires members of the Board of Directors to hold 10,000 shares in the Company (15,000 for the Lead Independent Director).
For more information, see “Item 6.C—Directors, senior management and employees—Board practices/corporate governance—Specific characteristics of the director role”.
ArcelorMittal’s Articles of Association provide that the Significant Shareholder is entitled to nominate a number of candidates for election by the shareholders to the Board of Directors in proportion to its shareholding. The Significant Shareholder has not exercised this right to date.
Amendment of the Articles of Association
Any amendments to the Articles of Association must be approved by an extraordinary general meeting of shareholders held in the presence of a Luxembourg notary, followed by the publications required by Luxembourg law.
In order to be adopted, amendments of the Articles of Association relating to the size and the requisite minimum number of independent and non-executive directors of the Board of Directors, the composition of the Audit & Risk Committee, and the nomination rights to the Board of Directors of the Significant Shareholder require a majority of votes representing two-thirds of the voting rights attached to the shares in ArcelorMittal. The same majority rule would apply to amendments of the provisions of the Articles of Association that set out the foregoing rule.
Annual accounts
Each year before submission to the annual ordinary general meeting of shareholders, the Board of Directors approves the stand-alone audited annual accounts for ArcelorMittal, the parent company of the ArcelorMittal group as well as the consolidated annual accounts of the ArcelorMittal group, each of which are prepared in accordance with IFRS. The Board of Directors also approves the management reports on each of the stand-alone audited annual accounts and the consolidated annual accounts, and in respect of each of these sets of accounts a report must be issued by the independent auditors.
The stand-alone audited annual accounts, the consolidated annual accounts, the management reports and the auditor’s reports will be available on request from the Company and on the Company’s website from the date of publication of the convening notice for the annual ordinary general meeting of shareholders.
211
The stand-alone audited annual accounts and the consolidated annual accounts, after their approval by the annual ordinary general meeting of shareholders, are filed with the Luxembourg Register of Commerce and Companies.
Dividends
Except for shares held in treasury by the Company, each ArcelorMittal share is entitled to participate equally in dividends if and when declared out of funds legally available for such purposes. The Articles of Association provide that the annual ordinary general meeting of shareholders may declare a dividend and that the Board of Directors may declare interim dividends within the limits set by Luxembourg law.
Declared and unpaid dividends held by ArcelorMittal for the account of its shareholders do not bear interest. Under Luxembourg law, claims for dividends lapse in favor of ArcelorMittal five years after the date on which the dividends have been declared.
Merger and division
A merger whereby the Luxembourg company being acquired transfers to an existing or newly incorporated Luxembourg company all of its assets and liabilities in exchange for the issuance to the shareholders of the company being acquired of shares in the acquiring company, and a division whereby a company (the company being divided) transfers all its assets and liabilities to two or more existing or newly incorporated companies in exchange for the issuance of shares in the beneficiary companies to the shareholders of the company being divided or to such company, and certain similar restructurings must be approved by an extraordinary general meeting of shareholders of the relevant companies held in the presence of a notary. These transactions require the approval of at least two-thirds of the votes cast at a general meeting of shareholders of each of the companies where at least 50% of the share capital is represented upon first call, with no such quorum being required at a reconvened meeting.
Liquidation
In the event of the liquidation, dissolution or winding-up of ArcelorMittal, the assets remaining after allowing for the payment of all liabilities will be paid out to the shareholders pro rata to their respective shareholdings. The decision to liquidate, dissolve or wind-up requires the approval of at least two-thirds of the votes cast at a general meeting of shareholders where at first call at least 50% of the share capital is represented, with no quorum being required at a reconvened meeting. Irrespective of whether the liquidation is subject to a vote at the first or a subsequent extraordinary general meeting of shareholders, it requires the approval of at least two-thirds of the votes cast at the extraordinary general meeting of shareholders.
Mandatory bid—squeeze-out right—sell-out right
Mandatory bid.
The Luxembourg law of May 19, 2006 implementing Directive 2004/25/EC of the European Parliament and the Council of April 21, 2004 on takeover bids ( the “Takeover Law”), provides that, if a person acting alone or in concert acquires securities of ArcelorMittal which, when added to any existing holdings of ArcelorMittal securities, give such person voting rights representing at least one third of all of the voting rights attached to the issued shares in ArcelorMittal, this person is obliged to make an offer for the remaining shares in ArcelorMittal. In a mandatory bid situation the “fair price” is in principle considered to be the highest price paid by the offeror or a person acting in concert with the offeror for the securities during the 12–month period preceding the mandatory bid.
ArcelorMittal’s Articles of Association provide that any person who acquires shares giving them 25% or more of the total voting rights of ArcelorMittal must make or cause to be made, in each country where ArcelorMittal’s securities are admitted to trading on a regulated or other market and in each of the countries in which ArcelorMittal has made a public offering of its shares, an unconditional public offer of acquisition for cash to all shareholders for all of their shares and also to all holders of securities giving access to capital or linked to capital or whose rights are dependent on the profits of ArcelorMittal. The price offered must be fair and equitable and must be based on a report drawn up by a leading international financial institution or other internationally recognized expert.
Squeeze-out right
The Takeover Law provides that, when an offer (mandatory or voluntary) is made to all of the holders of voting securities of ArcelorMittal and after such offer the offeror holds at least 95% of the securities carrying voting rights and 95% of the voting rights, the offeror may require the holders of the remaining securities to sell those securities (of the same class) to the offeror. The price offered for such securities must be a fair price. The price offered in a voluntary offer would be considered a fair price in the squeeze-out proceedings if the offeror acquired at least 90% of the ArcelorMittal shares carrying voting rights that were the subject of the offer. The price paid in a mandatory offer is deemed a fair price. The consideration p
.
The Takeover Law provides that, when an offer (mandatory or voluntary) is made to all of the holders of voting securities of ArcelorMittal and after such offer the offeror holds at least 95% of the securities carrying voting rights and 95% of the voting rights, the offeror may require the holders of the remaining securities to sell those securities (of the same class) to the offeror. The price offered for such securities must be a fair price. The price offered in a voluntary offer would be considered a fair price in the squeeze-out proceedings if the offeror acquired at least 90% of the ArcelorMittal shares carrying voting rights that were the subject of the offer. The price paid in a mandatory offer is deemed a fair price. The consideration paid in the squee
212
aid in the squeeze-out proceedings must take the same form as the consideration offered in the offer or consist solely of cash. Moreover, an all-cash option must be offered to the remaining ArcelorMittal shareholders. Finally, the right to initiate squeeze-out proceedings must be exercised within three months following the expiration of the offer.
ze-out proceedings must take the same form as the consideration offered in the offer or consist solely of cash. Moreover, an all-cash option must be offered to the remaining ArcelorMittal shareholders. Finally, the right to initiate squeeze-out proceedings must be exercised within three months following the expiration of the offer.
Sell-out right.
The Takeover Law provides that, when an offer (mandatory or voluntary) is made to all of the holders of voting securities of ArcelorMittal and if after such offer the offeror holds securities carrying more than 90% of the voting rights, the remaining security holders may require that the offeror purchase the remaining securities of the same class. The price offered in a voluntary offer would be considered “fair” in the sell-out proceedings if the offeror acquired at least 90% of the ArcelorMittal shares carrying voting rights and which were the subject of the offer. The price paid in a mandatory offer is deemed a fair price. The consideration paid in the sell-out proceedings must take the same form as the consideration offered in the offer or consist solely of cash.
Moreover, an all-cash option must be offered to the remaining ArcelorMittal shareholders. Finally, the right to initiate sell-out proceedings must be exercised within three months following the expiration of the offer.
Disclosure of significant ownership in ArcelorMittal shares
Holders of ArcelorMittal shares and derivatives or other financial instruments linked to ArcelorMittal shares may be subject to the notification obligations of the Luxembourg law of January 11, 2008, as last amended by the law dated May 10, 2016, on transparency requirements regarding information about issuers whose securities are admitted to trading on a regulated market (the “Transparency Law”). The following description summarizes these obligations. ArcelorMittal shareholders are advised to consult with their own legal advisers to determine whether the notification obligations apply to them.
The Transparency Law provides that, if a person acquires or disposes of a shareholding in ArcelorMittal, and if following the acquisition or disposal the proportion of voting rights held by the person reaches, exceeds or falls below one of the thresholds of 5%, 10%, 15%, 20%, 25%, one-third, 50% or two-thirds of the total voting rights existing when the situation giving rise to a declaration occurs, the relevant person must simultaneously notify ArcelorMittal and the CSSF (the Luxembourg securities regulator) of the proportion of voting rights held by it further to such event within four Luxembourg Stock Exchange trading days of the day of execution of the transaction triggering the threshold crossing.
A person must also notify ArcelorMittal of the proportion of his or her voting rights if that proportion reaches, exceeds or falls below the above mentioned thresholds as a result of events changing the breakdown of voting rights.
The above notification obligations also apply to persons who directly or indirectly hold financial instruments linked to ArcelorMittal shares. Pursuant to article 12 a. of the Transparency Law, persons who hold ArcelorMittal shares and financial instruments linked to ArcelorMittal Shares must aggregate their holding.
ArcelorMittal’s Articles of Association also provide that the above disclosure obligations also apply to:
|
•
|
any acquisition or disposal of shares resulting in the threshold of 2.5% of voting rights in ArcelorMittal being crossed upwards or downwards,
|
|
•
|
any acquisition or disposal of shares resulting in the threshold of 3.0% of voting rights in ArcelorMittal being crossed upwards or downwards, and
|
|
•
|
with respect to any shareholder holding at least 3.0% of the voting rights in ArcelorMittal, to any acquisition or disposal of shares resulting in successive thresholds of 1.0% of voting rights being crossed upwards or downwards.
|
Pursuant to the Articles of Association, any person who acquires shares giving him or her 5% or more or a multiple of 5% or more of the voting rights must inform ArcelorMittal within 10 Luxembourg Stock Exchange trading days following the date on which the threshold was crossed by registered letter with return receipt requested as to whether he or she intends to acquire or dispose of shares in ArcelorMittal within the next 12 months or intends to seek to obtain control over ArcelorMittal or to appoint a member to ArcelorMittal’s Board of Directors.
The sanction of suspension of voting rights automatically applies, subject to limited exceptions set out in the Transparency Law as amended from time to time, to any shareholder (or group of shareholders) who has (or have) crossed the thresholds set out in article 7 of the Articles of Association and articles 8 to 15 of the Luxembourg law of 11 January 2008 on the transparency requirements regarding issuers of securities (the “Transparency Law”) but have not notified the Company accordingly. The sanction of suspension of voting rights will apply until such time as the notification has been properly made by the relevant shareholder(s).
213
For the purposes of calculating the percentage of a shareholder’s voting rights in ArcelorMittal, the following are taken into account:
|
•
|
voting rights held by a third party with whom that person or entity has concluded an agreement and which obliges them to adopt, by concerted exercise of the voting rights they hold, a lasting common policy towards ArcelorMittal;
|
|
•
|
voting rights held by a third party under an agreement concluded with that person or entity providing for the temporary transfer for consideration of the voting rights in question;
|
|
•
|
voting rights attaching to shares pledged as collateral with that person or entity, provided the person or entity controls the voting rights and declares its intention to exercise them;
|
|
•
|
voting rights attaching to shares in which a person or entity holds a life interest;
|
|
•
|
voting rights which are held or may be exercised within the meaning of the four foregoing points by an undertaking controlled by that person or entity;
|
|
•
|
voting rights attaching to shares deposited with that person or entity which the person or entity may exercise at its discretion in the absence of specific instructions from the shareholders;
|
|
•
|
voting rights held by a third party in its own name on behalf of that person or entity; and
|
|
•
|
voting rights which that person or entity may exercise as a proxy where the person or entity may exercise the voting rights in its sole discretion.
|
In addition, the Articles of Association provide that, for the purposes of calculating a person’s voting rights in ArcelorMittal, the voting rights attached to shares underlying any other financial instruments owned by that person (such as convertible notes) must be taken into account for purposes of the calculation described above.
Disclosure of insider dealing transactions
Members of the Board of Directors and the members of the CEO Office, Executive Officers and other executives fulfilling senior management responsibilities within ArcelorMittal and falling with the definition of “Persons Discharging Senior Managerial Responsibilities” set out below and persons closely associated with them must disclose to the CSSF and to ArcelorMittal all transactions relating to shares or debt instruments of ArcelorMittal or derivatives or other financial instruments linked to any shares or debt instruments of ArcelorMittal (together the “Financial Instruments”) conducted by them or for their account.
Such notifications shall be made promptly and not later than three business days after the date of the transaction.
“Persons Discharging Senior Managerial Responsibilities” within ArcelorMittal are the members of the Board of Directors, and the CEO Office, the Executive Officers, and other executives occupying a high level management position with regular access to non-public material information relating, directly or indirectly, to ArcelorMittal and have the authority to make management decisions about the future development of the Company and its business strategy (see
“Item 6.A—Directors, senior management and employees— Directors and senior management"
for a description of senior management). Persons closely associated with them include their respective family members.
Both information on trading in Financial Instruments by “Persons Discharging Senior Managerial Responsibilities” and ArcelorMittal’s Insider Dealing Regulations are available on www.arcelormittal.com
under “Investors—Corporate Governance—Share Transactions by Management”.
For more information, see “Item 6.A—Directors, senior management and employees—Directors and senior management”.
In 2018, nine notifications were received by ArcelorMittal from such persons and filed with the CSSF.
214
Publication of regulated information
Since January 2009, disclosure to the public of “regulated information” (within the meaning of the Luxembourg Transparency Law) concerning ArcelorMittal has been made by publishing the information through the centralized regulated information filing and storage system managed by the Luxembourg Stock Exchange and accessible in English and French on www.bourse.lu, in addition to the publication by ArcelorMittal of the information by way of press release. All news and press releases issued by the Company are available on www.arcelormittal.com
in the “News and Media” section.
Limitation of directors’ liability/indemnification of Directors and the members of the CEO Office
The Articles of Association provide that ArcelorMittal will, to the broadest extent permitted by Luxembourg law, indemnify every director and member of the CEO Office as well as every former director or member of the CEO Office for fees, costs and expenses reasonably incurred in the defense or resolution (including a settlement) of all legal actions or proceedings, whether civil, criminal or administrative, he or she has been involved in his or her role as former or current director or member of the CEO Office.
The right to indemnification does not exist in the case of gross negligence, fraud, fraudulent inducement, dishonesty or for a criminal offense, or if it is ultimately determined that the director or members of the CEO Office has not acted honestly, in good faith and with the reasonable belief that he or she was acting in the best interests of ArcelorMittal.
The Company also maintains liability insurance for its directors and officers, including insurance against liabilities arising under the U.S. Securities Act of 1933, as amended.
C.
Material contracts
The following are material contracts, not entered into in the ordinary course of business, to which ArcelorMittal has been a party during the past two years.
ArcelorMittal Equity Incentive Plan, Performance Share Unit Plan and Special Grant
For a description of such plans, please refer to “
Item 6B—Directors, senior management and employees—
Compensation.”
Memorandum of Understanding
Mr. Lakshmi Mittal, Mrs. Usha Mittal, Lumen Investments S.à r.l., Nuavam Investments S.à r.l. (together, the “MoU Group”) and the Company are parties to a Memorandum of Understanding (“MoU”), dated June 25, 2006, to combine Mittal Steel and Arcelor in order to create the world’s leading steel company. (Lumen Investments S.à r.l. and Nuavam Investments S.à r.l. became parties following the assumption of the obligations of original parties to the MoU that have since ceased to hold Company shares). In April 2008, the Board of Directors approved resolutions amending certain provisions of the MoU in order to adapt it to the Company’s needs in the post-merger and post-integration phase, as described under
“Item 6.C.—Directors, senior management and employees—Board practices/corporate governance—Operation—Lead Independent Director”.
On the basis of the MoU, Arcelor’s Board of Directors recommended Mittal Steel’s offer for Arcelor, and the parties to the MoU agreed to certain corporate governance and other matters relating to the combined ArcelorMittal group. Certain provisions of the MoU relating to corporate governance were incorporated into the Articles of Association of ArcelorMittal at the extraordinary general meeting of the shareholders on November 5, 2007.
Certain additional provisions of the MoU expired effective August 1, 2009 and on August 1, 2011. ArcelorMittal’s corporate governance rules will continue to reflect, subject to those provisions of the MoU that have been incorporated into the Articles of Association, the best standards of corporate governance for comparable companies and to conform with the corporate governance aspects of the NYSE listing standards applicable to non-U.S. companies and Ten Principles of Corporate Governance of the Luxembourg Stock Exchange.
The following summarizes the main provisions of the MoU that remain in effect or were in effect in 2018.
215
Standstill
The MoU Group agreed not to acquire, directly or indirectly, ownership or control of an amount of shares in the capital stock of the Company exceeding the percentage of shares in the Company that it will own or control following completion of the Offer (as defined in the MoU) for Arcelor and any subsequent offer or compulsory buy-out, except with the prior written consent of a majority of the independent directors on the Company’s Board of Directors. Any shares acquired in violation of this restriction will be deprived of voting rights and shall be promptly sold by the MoU Group. Notwithstanding the above, if (and whenever) the MoU Group holds, directly and indirectly, less than 45% of the then-issued Company shares, the MoU Group may purchase (in the open market or otherwise) Company shares up to such 45% limit. In addition, the MoU Group is also permitted to own and vote shares in excess of the threshold mentioned in the immediately preceding paragraph or the 45% limit mentioned above, if such ownership results from (1) subscription for shares or rights in proportion to its existing shareholding in the Company where other shareholders have not exercised the entirety of their rights or (2) any passive crossing of this threshold resulting from a reduction of the number of Company shares (e.g., through self-tender offers or share buy-backs) if, in respect of (2) only, the decisions to implement such measures were taken at a shareholders’ meeting in which the MoU Group did not vote or by the Company’s Board of Directors with a majority of independent directors voting in favor.
Once the MoU Group exceeds the threshold mentioned in the first paragraph of this “Standstill” subsection or the 45% limit, as the case may be, as a consequence of any corporate event set forth in (1) or (2) above, it shall not be permitted to increase the percentage of shares it owns or controls in any way except as a result of subsequent occurrences of the corporate events described in (1) or (2) above, or with the prior written consent of a majority of the independent directors on the Company’s Board of Directors.
If subsequently the MoU Group sells down below the threshold mentioned in the first paragraph of this “Standstill” subsection or the 45% limit, as the case may be, it shall not be permitted to exceed the threshold mentioned in the first paragraph of this “Standstill” subsection or the 45% limit, as the case may be, other than as a result of any corporate event set out in (1) or (2) above or with the prior written consent of a majority of the independent directors.
Finally, the MoU Group is permitted to own and vote shares in excess of the threshold mentioned in the first paragraph of this “Standstill” subsection or the 45% limit mentioned above if it acquires the excess shares in the context of a takeover bid by a third party and (1) a majority of the independent directors of the Company’s Board of Directors consents in writing to such acquisition by the MoU Group or (2) the MoU Group acquires such shares in an offer for all of the shares of the Company.
Non-compete
For so long as the MoU Group holds and controls at least 15% of the outstanding shares of the Company or has representatives on the Company’s Board of Directors or CEO Office, the MoU Group and its affiliates will not be permitted to invest in, or carry on, any business competing with the Company, except for PT ISPAT Indo.
D. Exchange controls
There are no legislative or other legal provisions currently in force in Luxembourg or arising under ArcelorMittal’s Articles of Association that restrict the payment of dividends to holders of ArcelorMittal shares not resident in Luxembourg, except for regulations restricting the remittance of dividends and other payments in compliance with United Nations and EU sanctions. There are no limitations, either under the laws of Luxembourg or in the Articles of Association, on the right of non-Luxembourg nationals to hold or vote ArcelorMittal shares.
E. Taxation
United States taxation
The following discussion is a summary of the material U.S. federal income tax consequences that are likely to be relevant to U.S. Holders (as defined below) in respect of the ownership and disposition of ArcelorMittal common shares (hereinafter the “ArcelorMittal shares”) that are held as capital assets (such as for investment purposes). This summary does not purport to address all material tax consequences that may be relevant to a particular U.S. Holder. This summary also does not take into account the specific circumstances of particular investors, some of which (such as tax-exempt entities, banks, insurance companies, broker-dealers, traders in securities that elect to use a mark-to-market method of accounting for their securities
216
holdings, regulated investment companies, real estate investment trusts, partnerships and other pass-through entities, investors liable for the U.S. alternative minimum tax, investors that own or are treated as owning 10% or more of the total combined voting power or value of ArcelorMittal’s shares, investors that hold ArcelorMittal shares as part of a straddle, hedge, conversion, constructive sale or other integrated transaction, and U.S. Holders (as defined below) whose functional currency is not the U.S. dollar) may be subject to special tax rules. This summary is based on the U.S. Internal Revenue Code of 1986, as amended (the “Code”), the Treasury regulations issued thereunder, judicial decisions, and published rulings and administrative pronouncements of the U.S. Internal Revenue Service (“IRS”), all as in effect on the date hereof, and all of which are subject to change (possibly with retroactive effect) or to differing interpretations.
For purposes of this discussion, a “U.S. Holder” is a beneficial owner of ArcelorMittal shares that is, for U.S. federal income tax purposes:
|
•
|
an individual citizen or resident of the United States;
|
|
•
|
a corporation (or other entity taxable as a corporation for U.S. federal income tax purposes) organized in or under the laws of the United States, any state thereof, or the District of Columbia; or
|
|
•
|
any other person that is subject to U.S. federal income tax on a net income basis in respect of the ArcelorMittal shares.
|
The U.S. federal income tax consequences of a partner in a partnership holding ArcelorMittal shares generally will depend on the status of the partner and the activities of the partnership. The Company recommends that partners in such a partnership consult their own tax advisors.
Except where specifically described below, this discussion assumes that ArcelorMittal is not a passive foreign investment company (“PFIC”) for U.S. federal income tax purposes. See “—Passive foreign investment company ("PFIC") status”. This summary does not address any aspects of U.S. federal tax law other than income taxation, or any state, local, or non-U.S. tax considerations that may be applicable to investors. Additionally, this summary does not apply to an investor that is not a U.S. Holder or that holds ArcelorMittal shares other than as a capital asset. Investors are urged to consult their tax advisors regarding the U.S. federal, state, local and other tax consequences of acquiring, owning and disposing of ArcelorMittal shares.
(a) Taxation of distributions
Cash distributions made by ArcelorMittal in respect of ArcelorMittal shares will constitute a taxable dividend when such distribution is actually or constructively received, to the extent such distribution is paid out of the current or accumulated earnings and profits of ArcelorMittal (as determined under U.S. federal income tax principles). The amount of any distribution will include the amount of any applicable Luxembourg withholding tax. To the extent the amount of any distribution received by a U.S. Holder in respect of ArcelorMittal shares exceeds the current or accumulated earnings and profits of ArcelorMittal, the distribution (1) will be treated as a non-taxable return of the U.S. Holder’s adjusted tax basis in those ArcelorMittal shares and (2) thereafter will be treated as U.S.-source capital gain. Because ArcelorMittal does not maintain calculations of earnings and profits under U.S. federal income tax principles, it is expected that distributions generally will be reported to U.S. Holders as dividends. Distributions of additional ArcelorMittal shares that are made to U.S. Holders with respect to their ArcelorMittal shares, and that are part of a pro rata distribution to all ArcelorMittal shareholders, generally will not be subject to U.S. federal income tax.
The U.S. dollar amount of a taxable dividend generally will be included in the gross income of a U.S. Holder as ordinary income derived from sources outside the United States for U.S. foreign tax credit purposes and generally will be passive category income for purposes of the foreign tax credit limitation. Dividends paid in euro will be included in a U.S. Holder’s income in a U.S. dollar amount calculated by reference to the exchange rate in effect on the date the dividend is received; a recipient of such dividends that converts such euro to dollars upon receipt generally should not be required to recognize foreign currency gain or loss in respect of the dividend income. Fluctuations in the U.S. dollar-euro exchange rate between the date that U.S. Holders receive a dividend and the date that they receive any related refund of Luxembourg withholding tax may give rise to foreign currency gain or loss. Such gain or loss will generally be treated as ordinary income or loss for U.S. tax purposes. Dividends paid by ArcelorMittal will not be eligible for the dividends-received deduction generally allowed to U.S. corporations in respect of dividends received from U.S. corporations.
Subject to certain exceptions for short-term or hedged positions, taxable dividends received by certain non-corporate U.S. Holders (including individuals) with respect to the ArcelorMittal shares will be subject to U.S. federal income taxation at rates that are lower than the rates applicable to ordinary income if the dividends represent “qualified dividend income”. Dividends
217
paid on the ArcelorMittal shares will be treated as qualified dividend income if ArcelorMittal is not a PFIC in the year in which the dividend was paid or in the year prior thereto. As discussed further below, ArcelorMittal believes that it was not a PFIC for U.S. federal income tax purposes with respect to its 2018 taxable year, and ArcelorMittal does not anticipate being a PFIC for its 2019 taxable year. See “—Passive foreign investment company ("PFIC") status”.
U.S. Holders of ArcelorMittal shares should consult their own tax advisors regarding the availability of the reduced rate of U.S. federal income tax on dividends in light of their own particular circumstances.
Subject to the limitations and conditions provided in the Code and the applicable U.S. Treasury Regulations, a U.S. Holder of ArcelorMittal shares may be able to claim a foreign tax credit against its U.S. federal income tax liability in respect of any Luxembourg income taxes withheld at the appropriate rate applicable to the U.S. Holder from a dividend paid by ArcelorMittal to such U.S. Holder and paid to the Luxembourg government. Alternatively, the U.S. Holder may deduct such Luxembourg income taxes from its U.S. federal taxable income, provided that the U.S. Holder elects to deduct rather than credit all foreign income taxes for the relevant taxable year. The rules with respect to foreign tax credits are complex and involve the application of rules that depend on a U.S. Holder’s particular circumstances. Accordingly, U.S. Holders are urged to consult their tax advisors regarding the availability of the foreign tax credit under their particular circumstances.
(b) Taxation of sales, exchanges, or other dispositions of ArcelorMittal shares
Sales or other taxable dispositions by U.S. Holders of ArcelorMittal shares generally will give rise to gain or loss equal to the difference between the amount realized on the disposition and the U.S. Holder’s tax basis in such ArcelorMittal shares. A U.S. Holder generally will have an initial tax basis in each ArcelorMittal share equal to its U.S. dollar cost to the U.S. Holder.
In general, gain or loss recognized on the sale or exchange of ArcelorMittal shares will be capital gain or loss and, if the U.S. Holder’s holding period for such ArcelorMittal shares exceeds one year, will be long-term capital gain or loss. Certain U.S. Holders, including individuals, are eligible for preferential rates of U.S. federal income tax in respect of long-term capital gains. The deduction of capital losses against ordinary income is subject to limitations under the Code.
Passive foreign investment company (“PFIC”) status
Special U.S. federal income tax rules apply to U.S. Holders owning stock of a PFIC. ArcelorMittal believes that it currently is not a PFIC for U.S. federal income tax purposes, and ArcelorMittal does not expect to become a PFIC in the future. This conclusion is based upon an annual analysis of its financial position and an interpretation of the PFIC provisions that ArcelorMittal believes is correct. No assurances can be made, however, that the applicable tax law or relevant factual circumstances will not change in a manner that affects the determination of ArcelorMittal’s PFIC status. If, contrary to the foregoing, ArcelorMittal were classified as a PFIC, a U.S. Holder of ArcelorMittal shares would be subject to an increased tax liability upon the gain realized on a sale or other disposition of ArcelorMittal shares or upon the receipt of certain distributions treated as “excess distributions”. Any gain realized would not be treated as a capital gain but would be treated as if the U.S. Holder had realized its gain and certain “excess distributions”, as applicable, ratably over its holding period for ArcelorMittal shares and would be taxed at the highest tax rate in effect for each such year to which the gain was allocated, together with an interest charge in respect of the tax attributable to each such year. In addition, if ArcelorMittal were a PFIC and its shares constitute “marketable stock”, a U.S. Holder may elect to be taxed annually on a mark-to-market basis with respect to its ArcelorMittal shares and mitigate the adverse tax consequences. U.S. Holders should consult their tax advisors as to the availability and consequences of a mark-to-market election with respect to their shares of ArcelorMittal.
Foreign Financial Asset Reporting.
Certain U.S. Holders that own “specified foreign financial assets” with an aggregate value in excess of U.S.$50,000 are generally required to file an information statement along with their tax returns, currently on Form 8938, with respect to such assets. “Specified foreign financial assets” include any financial accounts held at a non-U.S. financial institution, as well as securities issued by a non-U.S. issuer that are not held in accounts maintained by financial institutions. The understatement of income attributable to “specified foreign financial assets” in excess of U.S.$5,000 extends the statute of limitations with respect to the tax return to six years after the return was filed. U.S. Holders who fail to report the required information could be subject to substantial penalties. Prospective investors are encouraged to consult with their own tax advisers regarding the possible application of these rules, including the application of the rules to their particular circumstances.
Backup withholding and information reporting
218
The payment of proceeds received upon the sale, exchange or redemption of ArcelorMittal shares by U.S. Holders within the United States (or through certain U.S.-related financial intermediaries), and dividends on ArcelorMittal shares paid to U.S. Holders in the United States (or through certain U.S.-related financial intermediaries), will be subject to information reporting and may be subject to backup withholding unless the U.S. Holder (1) is an exempt recipient, and establishes that exemption if required or (2) in the case of backup withholding, provides an IRS Form W-9 (or an acceptable substitute form) that contains the U.S. Holder’s taxpayer identification number and that certifies that no loss of exemption from backup withholding has occurred.
Backup withholding is not an additional tax. The amount of backup withholding imposed on a payment to a U.S. Holder will be allowed as a credit against the holder’s U.S. federal income tax liability, if any, or as a refund, so long as the required information is properly furnished to the IRS. Holders that are not U.S. Holders may need to comply with certification procedures to establish their non-U.S. status in order to avoid information reporting and backup withholding tax requirements.
THE SUMMARY OF U.S. FEDERAL INCOME TAX CONSEQUENCES SET OUT ABOVE IS INTENDED FOR GENERAL INFORMATION PURPOSES ONLY. EACH INVESTOR IN ARCELORMITTAL ORDINARY SHARES IS URGED TO CONSULT ITS OWN TAX ADVISOR WITH RESPECT TO THE PARTICULAR TAX CONSEQUENCES OF THE ACQUISITION, OWNERSHIP AND DISPOSITION OF ARCELORMITTAL SHARES BASED ON THE INVESTOR’S PARTICULAR CIRCUMSTANCES.
Luxembourg taxation
The following is a summary addressing certain material Luxembourg tax consequences that are likely to be relevant to holders of shares in respect of the ownership and disposition of shares in ArcelorMittal.
This summary does not purport to address all material tax considerations that may be relevant to a holder or prospective holder of ArcelorMittal shares. This summary also does not take into account the specific circumstances of particular investors some of which may be subject to special tax rules, including dealers in securities, financial institutions, insurance companies, investment funds, and of current or prior holders (directly or indirectly) of five percent or more of the shares of ArcelorMittal.
This summary is based on the laws, regulations and applicable tax treaties as in effect on the date hereof in Luxembourg, all of which are subject to change, possibly with retroactive effect. Holders of ArcelorMittal shares should consult their own tax advisers as to the particular tax consequences, under the tax laws of the country of which they are residents for tax purposes of the ownership or disposition of ArcelorMittal shares.
This summary does not address the terms of employee stock options or other incentive plans implemented by ArcelorMittal and its subsidiaries and does not purport to provide the holders of stock subscription options or other comparable instruments (including shares acquired under employee share ownership programs) with a description of the possible tax and social security implications for them, nor to determine under which conditions these options or other instruments are or may become exercisable. These holders are therefore urged to consult their own tax advisers as to the potential tax and social security implications of an exercise of their options or other instruments.
As used herein, a “Luxembourg individual” means an individual resident in Luxembourg who is subject to personal income tax (
impôt sur le revenu
) on his or her worldwide income from Luxembourg or foreign sources, and a “Luxembourg company” means a company or another entity resident in Luxembourg subject to corporate income tax (
impôt sur le revenu des collectivités
) on its worldwide income from Luxembourg or foreign sources. For the purposes of this summary, Luxembourg individuals and Luxembourg companies are collectively referred to as “Luxembourg Holders”. A “non-Luxembourg Holder” means any investor in ArcelorMittal shares other than a Luxembourg Holder.
(a) Luxembourg withholding tax on dividends paid on ArcelorMittal shares
Dividends distributed by ArcelorMittal will in principle be subject to Luxembourg withholding tax at the rate of 15%.
Luxembourg resident corporate holders
No dividend withholding tax applies on dividends paid by ArcelorMittal to a Luxembourg company (that is, a fully taxable entity within the meaning of Article 159 of the Luxembourg Income Tax Law) holding shares (or a Luxembourg permanent establishment/representative of a qualifying foreign entity to which the shares are attributable), which meets the qualifying participation test (that is, a shareholding in ArcelorMittal of at least 10% or having an acquisition cost of at least EUR
219
1.2 million held or committed to be held for a minimum one year holding period, per Article 147 of the Luxembourg Income Tax Law). If such exemption from dividend withholding tax does not apply, a Luxembourg company may be entitled to a tax credit.
Luxembourg resident individual holders
Luxembourg withholding tax on dividends paid by ArcelorMittal to a Luxembourg resident individual holder may entitle such Luxembourg Holder to a tax credit for the tax withheld.
Non-Luxembourg Holders
Non-Luxembourg Holders of ArcelorMittal shares who have held a shareholding in ArcelorMittal representing at least 10% of ArcelorMittal’s share capital (or shares with an acquisition cost of at least EUR 1.2 million) for an uninterrupted period of at least 12 months (or where held for a shorter period, where the holder takes the commitment to hold the qualifying shareholding for such period) may benefit from an exemption from the dividend withholding tax if they are: (i) entities which fall within the scope of Article 2 of the European Council Directive 2011/96/EU, as amended (the “EU Parent-Subsidiary Directive”) and which are not excluded to benefit from the EU Parent-Subsidiary Directive under its mandatory general anti-avoidance rule (“GAAR”) in each case as implemented in Luxembourg, or (ii) corporates subject to a tax comparable to Luxembourg corporate income tax and which are resident of a country having concluded a double tax avoidance treaty with Luxembourg, or (iii) corporates subject to a tax comparable to Luxembourg corporate income tax and which are resident in a State being part of the European Economic Area (EEA) other than a Member State of the European Union, or (iv) corporates resident in Switzerland subject to corporate income tax in Switzerland without benefiting from an exemption.
Non-Luxembourg Holders of ArcelorMittal shares who are tax resident in a country having a double tax avoidance treaty with Luxembourg may claim for a reduced withholding tax rate or a withholding tax relief under the conditions and subject to the limitations set forth in the relevant treaty.
(b) Luxembourg income tax on dividends paid on ArcelorMittal shares and capital gains
Luxembourg resident individual holders
For Luxembourg individuals, income in the form of dividends or capital gains derived from ArcelorMittal shares will normally be subject to individual income tax at the applicable progressive rate with a current top effective marginal rate of 45.78% including the unemployment fund contribution at the maximum rate of 9%. Such dividends may benefit from the 50% exemption set forth in Article 115(15a) of the Luxembourg Income Tax Law, subject to fulfillment of the conditions set out therein. Capital gains will only be taxable if they are realized on a sale of ArcelorMittal shares, which takes place within the first six months following their acquisition, or if the relevant holder (alone or together with his/her spouse or registered partner and his/her underage children), directly or indirectly, holds or has held more than 10% of the ArcelorMittal shares at any time during the past five years.
Luxembourg resident corporate holders
For Luxembourg companies, which do not benefit from a special tax regime, income in the form of dividends or capital gains derived from ArcelorMittal shares will be subject to corporate income tax and municipal business tax. The combined rate for these two taxes (including an unemployment fund contribution of 7%) for Luxembourg companies with registered office in Luxembourg City is 26.01% in 2018. Such dividends may benefit either from the 50% exemption set forth in Article 115(15a) of the Luxembourg Income Tax Law or from the full exemption set forth in Article 166 of the Luxembourg Income Tax Law, subject in each case to fulfillment of the respective conditions set out therein. Capital gains realized on the sale of ArcelorMittal shares may benefit from the full exemption provided for by the Grand Ducal Decree of December 21, 2001, as amended, subject to fulfillment of the conditions set out therein.
Non-Luxembourg Holders
An individual or corporate non-Luxembourg Holder of ArcelorMittal shares who/which realizes a gain on disposal thereof (and who/which does not have a permanent establishment in Luxembourg to which the ArcelorMittal shares would be attributable) will only be subject to Luxembourg taxation on capital gains arising upon disposal of such shares if such holder has (if an individual, alone or together with his or her spouse or registered partner and underage children) directly or indirectly held more than 10% of the capital of ArcelorMittal, at any time during the past five years, and either (1) such holder has been a
220
resident of Luxembourg for tax purposes for at least 15 years and has become a non-resident within the last five years preceding the realization of the gain, subject to any applicable tax treaty, or (2) the disposal of ArcelorMittal shares occurs within six months from their acquisition, subject to any applicable tax treaty.
A corporate non-Luxembourg Holder, which has a permanent establishment or a permanent representative in Luxembourg to which ArcelorMittal shares would be attributable, will bear corporate income tax and municipal business tax on dividends received and/or a gain realized on a disposal of such shares under the same conditions as are applicable to a Luxembourg resident corporate holder, as described above.
(c) Other taxes
Net wealth tax
Luxembourg net wealth tax will not be levied on a Luxembourg Holder unless:
|
•
|
the Luxembourg Holder is a legal entity subject to net wealth tax in Luxembourg; or
|
|
•
|
ArcelorMittal shares are attributable to an enterprise or part thereof which is carried on through a permanent establishment or a permanent representative in Luxembourg of a non-resident entity.
|
Net wealth tax is levied annually at a digressive rate depending on the amount of the net wealth of the above holders, as determined for net wealth tax purposes (i.e. 0.5% on an amount up to EUR 500 million and 0.05% on the amount of taxable net wealth exceeding EUR 500 million).
ArcelorMittal shares may be exempt from net wealth tax subject to the conditions set forth by Article 60 of the Law of October 16, 1934 on the valuation of assets (Bewertungsgesetz), as amended.
Estate and gift tax
Luxembourg inheritance tax may be levied on the transfer of ArcelorMittal shares upon the death of a Luxembourg individual.
Luxembourg gift tax will be levied in the event that a gift of ArcelorMittal shares is made pursuant to a notarial deed signed before a Luxembourg notary.
Other Luxembourg tax considerations
No registration tax will be payable by a holder of shares upon the issue, subscription or acquisition of shares in ArcelorMittal or upon the disposal of shares by sale or exchange.
F. Dividends and paying agents
The paying agent for shareholders who hold shares listed on the NYSE is Citibank and the paying agent for shareholders who hold shares listed on Euronext Amsterdam, Euronext Paris, Luxembourg Stock Exchange and Spanish Stock Exchanges is BNP Paribas Securities Services. For more information see, “Item 8.A—Financial Information—Consolidated statements and other financial information—Dividend distributions.”
G. Statements by experts
Please refer to “Item 4.D—Information on the Company—Property, plant and equipment—Reserves (iron ore and coal),” and Item 19.
H. Documents on display
A copy of any or all of the documents deemed to be incorporated in this report by reference, unless such documents have been modified or superseded as specified herein, may be obtained by sending a request to: company.secretary@arcelormittal.com or at ArcelorMittal’s registered office as set out in “Item 4.A—Information on the Company—History and development of the Company—Other information” of this annual report.
221
I. Subsidiary information
Not applicable.
|
ITEM 11.
|
QUANTITATIVE AND QUALITATIVE
|
ArcelorMittal is exposed to a number of different market risks arising from its normal business activities. Market risk is the possibility that changes in raw materials prices, foreign currency exchange rates, interest rates, base metal prices (zinc, nickel, aluminum and tin) and energy prices (oil, natural gas and power) will adversely affect the value of ArcelorMittal’s financial assets, liabilities or expected future cash flows.
The fair value information presented below is based on the information available to management as of the date of the consolidated statements of financial position. Although ArcelorMittal is not aware of any factors that would significantly affect the estimated fair value amounts, such amounts have not been comprehensively revalued for purposes of this annual report since that date, and therefore, the current estimates of fair value may differ significantly from the amounts presented. The estimated fair values of certain financial instruments have been determined using available market information or other valuation methodologies that require considerable judgment in interpreting market data and developing estimates.
See note 6 to ArcelorMittal’s consolidated financial statements for quantitative information about risks relating to financial instruments, including financial instruments entered into pursuant to the Company’s risk management policies.
Risk management
ArcelorMittal has implemented strict policies and procedures to manage and monitor financial market risks. Organizationally, supervisory functions are separated from operational functions, with proper segregation of duties. Financial market activities are overseen by the President and CFO, the Corporate Finance and Tax Committee and the CEO Office.
All financial market risks are managed in accordance with the Treasury and Financial Risk Management Policy. These risks are managed centrally through Group Treasury by a group specializing in foreign exchange, interest rate, commodity, internal and external funding and cash and liquidity management.
All financial market hedges are governed by ArcelorMittal’s Treasury and Financial Risk Management Policy, which includes a delegated authority and approval framework, sets the boundaries for all hedge activities and dictates the required approvals for all Treasury activities. Hedging activity and limits are monitored on an ongoing basis. ArcelorMittal enters into transactions with numerous counterparties, mainly banks and financial institutions, as well as brokers, major energy producers and consumers.
As part of its financial risk management activities, ArcelorMittal uses derivative instruments to manage its exposure to changes in interest rates, foreign exchange rates and commodities prices. These instruments are principally interest rate, currency and commodity swaps, spots and forwards. ArcelorMittal may also use futures and options contracts.
Counterparty risk
ArcelorMittal has established detailed counterparty limits to mitigate the risk of default by its counterparties. The limits restrict the exposure ArcelorMittal may have to any single counterparty. Counterparty limits are calculated taking into account a range of factors that govern the approval of all counterparties. The factors include an assessment of the counterparty’s financial soundness and its ratings by the major rating agencies, which must be of a high quality. Counterparty limits are monitored on a periodic basis.
All counterparties and their respective limits require the prior approval of the Corporate Finance and Tax Committee. Standard agreements, such as those published by the International Swaps and Derivatives Association, Inc. (ISDA) are negotiated with all ArcelorMittal trading counterparties.
Currency exposure
222
ArcelorMittal seeks to manage each of its entities’ exposure to its operating currency. For currency exposure generated by activities, the conversion and hedging of revenues and costs in foreign currencies is typically performed using currency transactions on the spot market and forward market. For some of its business segments, ArcelorMittal hedges future cash flows.
Because a substantial portion of ArcelorMittal’s assets, liabilities, sales and earnings are denominated in currencies other than the U.S. dollar (its reporting currency), ArcelorMittal has exposure to fluctuations in the values of these currencies relative to the U.S. dollar. These currency fluctuations, especially the fluctuation of the value of the U.S. dollar relative to the euro, the Canadian dollar, Brazilian real, South African rand, Argentine peso, Kazakh tenge and Ukrainian hryvnia, as well as fluctuations in the currencies of the other countries in which ArcelorMittal has significant operations and/or sales, could have a material impact on its results of operations.
ArcelorMittal faces transaction risk, where its businesses generate sales in one currency but incur costs relating to that revenue in a different currency. For example, ArcelorMittal’s non-U.S. subsidiaries may purchase raw materials, including iron ore and coking coal, in U.S. dollars, but may sell finished steel products in other currencies. Consequently, an appreciation of the U.S. dollar will increase the cost of raw materials, thereby negatively impacting the Company’s operating margins, unless the Company is able to pass along the higher cost in the form of higher selling prices.
ArcelorMittal faces foreign currency translation risk, which arises when ArcelorMittal translates the financial statements of its subsidiaries, denominated in currencies other than the U.S. dollar for inclusion in ArcelorMittal’s consolidated financial statements.
The tables below illustrate the impact of an appreciation and a depreciation of the U.S. dollar of 10% against the euro, on the conversion of the net debt of ArcelorMittal into U.S. dollars as of December 31, 2018 and December 31, 2017. The impact on net debt denominated in a currency different than the euro, is computed based on historical data of how such currency would move against the U.S. dollar when the U.S. dollar appreciates/depreciates 10% against the euro. A positive sign means an increase in the net debt.
|
Currency
|
Impact on net debt translation of a 10% appreciation of the
U.S. dollar against the euro |
Impact on net debt translation of a 10% depreciation of the
U.S. dollar against the euro |
||
|
In 2018
|
in $ equivalent
(in millions) |
in $ equivalent
(in millions) |
||
|
Argentine peso
|
7
|
(23)
|
||
|
Canadian dollar
|
(9)
|
10
|
||
|
Euro
|
(564)
|
564
|
||
|
Indian rupee
|
33
|
(42)
|
||
|
South African rand
|
25
|
(38)
|
||
|
Swiss franc
|
(12)
|
14
|
||
|
Other
|
10
|
(8)
|
||
|
Currency
|
Impact on net debt translation of a 10% appreciation of the
U.S. dollar against the euro |
Impact on net debt translation of a 10% depreciation of the
U.S. dollar against the euro |
||
|
In 2017
|
in $ equivalent
(in millions) |
in $ equivalent
(in millions) |
||
|
Argentine peso
|
(6)
|
5
|
||
|
Bosnia and Herzegovina convertible mark
|
2
|
(3)
|
||
|
Chinese renminbi
|
(8)
|
9
|
||
|
Euro
|
(597)
|
597
|
||
|
Moroccan dirham
|
3
|
(4)
|
||
|
Swiss franc
|
(6)
|
7
|
||
|
Other
|
2
|
(1)
|
||
Derivative instruments
223
ArcelorMittal uses derivative instruments to manage its exposure to movements in interest rates, foreign exchange rates and commodity prices. Changes in the fair value of derivative instruments are recognized in the consolidated statements of operations or in equity according to nature and effectiveness of the hedge.
Derivatives used are non-exchange-traded derivatives such as over-the-counter swaps, options and forward contracts.
For the Company’s tabular presentation of information related to its market risk sensitive instruments, please see note 6 to the consolidated financial statements.
Interest rate sensitivity
Cash balances, which are primarily composed of euros and U.S. dollars, are managed according to the short term (up to one year) guidelines established by senior management on the basis of a daily interest rate benchmark, primarily through short-term currency swaps, without modifying the currency exposure.
Interest rate risk on debt
ArcelorMittal’s policy consists of incurring debt at fixed and floating interest rates, primarily in U.S. dollars and euros according to general corporate needs. Interest rate and currency swaps are utilized to manage the currency and/or interest rate exposure of the debt.
For the Company’s tabular presentation of the fair values of its short and long term debt, please see note 6 to the consolidated financial statements.
Commodity price risk
ArcelorMittal utilizes a number of exchange-traded commodities in the steel-making process. In certain instances, ArcelorMittal is the leading consumer worldwide of certain commodities. In some businesses and in certain situations, ArcelorMittal is able to pass this exposure on to its customers. The residual exposures are managed as appropriate.
Financial instruments related to commodities (base metals, energy, freight and emission rights) are utilized to manage ArcelorMittal’s exposure to price fluctuations.
Hedges in the form of swaps and options are utilized to manage the exposure to commodity price fluctuations.
For the Company’s tabular presentation of information related to its market risk sensitive instruments, please see note 6 to the consolidated financial statements.
In respect of non-exchange traded commodities, ArcelorMittal is exposed to volatility in the prices of raw materials such as iron ore (which is generally correlated with steel prices with a time lag) and coking coal. This exposure is almost entirely managed through long-term contracts, however some hedging of iron ore exposures is made through derivative contracts. For a more detailed discussion of ArcelorMittal’s iron ore and coking coal purchases, see
“Item 5—Operating and financial review and prospects—Key factors affecting results of operation—Raw materials”.
|
ITEM 12.
|
DESCRIPTION OF SECURITIES OTHER THAN EQUITY SECURITIES
|
A. Debt securities
Not applicable.
B. Warrants and rights
Not applicable.
C. Other securities
Not applicable.
224
D. American depositary shares
The Company does not have any American Depositary Receipts. As described under “Item 10.B—Additional information—Memorandum and Articles of Association—Form and transfer of shares”, the Company maintains a New York share register with Citibank, N.A. for its shares that trade on the NYSE. As of December 31, 2018, 57,620,574 shares (or approximately 5.64% of ArcelorMittal’s total issued shares) were ArcelorMittal New York Registry Shares. Holders of ArcelorMittal New York Registry Shares do not pay fees to Citibank as a general matter, but do incur costs of up to $5 per 100 shares for transactions that require canceling or issuing New York Registry Shares, such as cross-border trades where New York Registry Shares are cancelled in exchange for shares held in ArcelorMittal’s European register, or vice-versa. Subject to certain conditions, Citibank reimburses the Company on an annual basis for expenses incurred by the Company in relation to the ongoing maintenance of the New York share facility (e.g., investor relations expenses, NYSE listing fees, etc.). In 2018, Citibank paid the Company $600,000 in respect of reimbursements of expenses incurred by the Company in 2018.
225
|
ITEM 13.
|
DEFAULTS, DIVIDEND ARREARAGES AND DELINQUENCIES
|
None.
|
ITEM 14.
|
MATERIAL MODIFICATIONS TO THE RIGHTS OF SECURITY HOLDERS AND USE OF PROCEEDS
|
None.
|
ITEM 15.
|
|
Disclosure controls and procedures
Management maintains disclosure controls and procedures that are designed to ensure that information required to be disclosed in the Company’s reports under the Securities Exchange Act of 1934, as amended (the “Exchange Act”) is recorded, processed, summarized and reported within time periods specified in the SEC’s rules and forms, and that such information is accumulated and communicated to management, including the Chief Executive Officer and Chief Financial Officer, as appropriate, to allow timely decisions regarding required disclosures. ArcelorMittal’s controls and procedures are designed to provide reasonable assurance of achieving their objectives.
Management carried out an evaluation, under the supervision and with the participation of its Chief Executive Officer and Chief Financial Officer, of the effectiveness of the design and operation of the Company’s disclosure controls and procedures (as defined in Exchange Act Rule 13a-15(e)) as of December 31, 2018. Based upon that evaluation, the Company’s Chief Executive Officer and Chief Financial Officer concluded that the Company’s disclosure controls and procedures were effective as of December 31, 2018 so as to provide reasonable assurance that (1) information required to be disclosed by the Company in the reports that the Company files under the Exchange Act is recorded, processed, summarized and reported within the time periods specified in the SEC’s rules and forms, and (2) that such information is accumulated and communicated to the Company’s management, including its Chief Executive Officer and its Chief Financial Officer, as appropriate, to allow timely decisions regarding required disclosures.
There are inherent limitations to the effectiveness of any system of disclosure controls and procedures, including the possibility of human error and the circumvention or overriding of the controls and procedures. Accordingly, even effective disclosure controls and procedures can only provide reasonable assurance of achieving their control objectives.
Management’s Annual Report on Internal Control Over Financial Reporting
Management is responsible for establishing and maintaining adequate internal control over financial reporting. Internal control over financial reporting is a process designed to provide reasonable assurance regarding the reliability of financial reporting and the preparation of financial statements for external purposes in accordance with generally accepted accounting principles.
The Company’s internal control over financial reporting includes those policies and procedures that:
|
•
|
pertain to the maintenance of records that, in reasonable detail, accurately and fairly reflect the transactions and dispositions of the assets of ArcelorMittal;
|
|
•
|
provide reasonable assurance that transactions are recorded, as necessary, to permit preparation of financial statements in accordance with IFRS;
|
|
•
|
provide reasonable assurance that receipts and expenditures of ArcelorMittal are made in accordance with authorizations of ArcelorMittal's management and directors; and
|
226
|
•
|
provide reasonable assurance that unauthorized acquisition, use or disposition of ArcelorMittal’s assets that could have a material effect on the financial statements would be prevented or detected on a timely basis.
|
Because of its inherent limitations, internal control over financial reporting is not intended to provide absolute assurance that a misstatement of the Company’s financial statements would be prevented or detected. In addition, projections of any evaluation of effectiveness to future periods are subject to the risk that controls may become inadequate because of changes in conditions, or that the degree of compliance with the policies or procedures may deteriorate.
Management assessed the effectiveness of internal control over financial reporting as of December 31, 2018 based upon the framework in
Internal Control—Integrated Framework
(2013) issued by the Committee of Sponsoring Organizations of the Treadway Commission (“COSO”). Based on this assessment, management concluded that ArcelorMittal’s internal control over financial reporting was effective as of December 31, 2018.
On November 1, 2018, ArcelorMittal completed the acquisition of Ilva S.p.A. and certain of its subsidiaries ("Ilva"). Management acknowledges that it is responsible for establishing and maintaining a system of internal controls over financial reporting for Ilva. ArcelorMittal is in the process of integrating Ilva and accordingly a number of processes and controls will be changed.
In accordance with SEC staff guidance permitting a company to exclude an acquired business from management’s assessment of the effectiveness of internal control over financial reporting for the year in which the acquisition is completed,
ArcelorMittal excluded Ilva from its assessment of the effectiveness of internal controls over financial reporting as of December 31, 2018. Ilva represents 3% of the Company’s total assets as of December 31, 2018 and less than 1% of the Company’s sales and consolidated net income for the year ended December 31, 2018. The transaction has not materially affected nor is expected to materially affect ArcelorMittal's internal control over financial reporting. The Company expects its internal control system to be fully implemented at Ilva in 2019 and, accordingly, to evaluate it for effectiveness at that time.
The effectiveness of management’s internal control over financial reporting as of December 31, 2018 has been audited by the Company’s independent registered public accounting firm, Deloitte Audit, and their report as of February 22, 2019 below expresses an unqualified opinion on the Company’s internal control over financial reporting.
Changes in Internal Control over Financial Reporting
There have been no changes in the Company’s internal control over financial reporting that occurred during the year ending December 31, 2018 that have materially affected or are reasonably likely to have materially affected the Company’s internal control over financial reporting.
227
REPORT OF INDEPENDENT REGISTERED PUBLIC ACCOUNTING FIRM
To the shareholders and the Board of Directors of ArcelorMittal
Opinion on Internal Control over Financial Reporting
We have audited the internal control over financial reporting of ArcelorMittal and subsidiaries (the “Company”) as of December 31, 2018, based on criteria established in
Internal Control - Integrated Framework (2013)
issued by the Committee of Sponsoring Organizations of the Treadway Commission (COSO). In our opinion, the Company maintained, in all material respects, effective internal control over financial reporting as of December 31, 2018, based on criteria established in
Internal Control - Integrated Framework (2013)
issued by COSO.
We have also audited, in accordance with the standards of the Public Company Accounting Oversight Board (United States) (PCAOB), the consolidated financial statements as of and for the year ended December 31, 2018, of the Company and our report dated February 22, 2019, expressed an unqualified opinion on those consolidated financial statements.
As described in Management’s Annual Report on Internal Control Over Financial Reporting, management excluded from its assessment the internal control over financial reporting at Ilva S.p.A. and certain of its subsidiaries ("Ilva"), which was acquired on November 1, 2018 and whose financial statements constitute 3% of total assets and less than 1% of sales and net income (including non-controlling interests) of the consolidated financial statement amounts as of and for the year ended December 31, 2018. Accordingly, our audit did not include the internal control over financial reporting at Ilva.
Basis for Opinion
The Company’s management is responsible for maintaining effective internal control over financial reporting and for its assessment of the effectiveness of internal control over financial reporting, included in the accompanying Management’s Annual Report on Internal Control over Financial Reporting. Our responsibility is to express an opinion on the Company’s internal control over financial reporting based on our audit. We are a public accounting firm registered with the PCAOB and are required to be independent with respect to the Company in accordance with the U.S. federal securities laws and the applicable rules and regulations of the Securities and Exchange Commission and the PCAOB.
We conducted our audit in accordance with the standards of the PCAOB. Those standards require that we plan and perform the audit to obtain reasonable assurance about whether effective internal control over financial reporting was maintained in all material respects. Our audit included obtaining an understanding of internal control over financial reporting, assessing the risk that a material weakness exists, testing and evaluating the design and operating effectiveness of internal control based on the assessed risk, and performing such other procedures as we considered necessary in the circumstances. We believe that our audit provides a reasonable basis for our opinion.
Definition and Limitations of Internal Control over Financial Reporting
A company’s internal control over financial reporting is a process designed to provide reasonable assurance regarding the reliability of financial reporting and the preparation of financial statements for external purposes in accordance with generally accepted accounting principles. A company’s internal control over financial reporting includes those policies and procedures that (1) pertain to the maintenance of records that, in reasonable detail, accurately and fairly reflect the transactions and dispositions of the assets of the company; (2) provide reasonable assurance that transactions are recorded as necessary to permit preparation of financial statements in accordance with generally accepted accounting principles, and that receipts and expenditures of the company are being made only in accordance with authorizations of management and directors of the company; and (3) provide reasonable assurance regarding prevention or timely detection of unauthorized acquisition, use, or disposition of the company’s assets that could have a material effect on the financial statements.
Because of its inherent limitations, internal control over financial reporting may not prevent or detect misstatements. Also, projections of any evaluation of effectiveness to future periods are subject to the risk that controls may become inadequate because of changes in conditions, or that the degree of compliance with the policies or procedures may deteriorate.
/s/ Deloitte Audit S.à r.l.
Luxembourg, Grand Duchy of Luxembourg
February 22, 2019
228
|
ITEM 16A.
|
AUDIT & RISK COMMITTEE FINANCIAL EXPERT
|
Mrs. Karyn Ovelmen is the Chairman of the Audit & Risk Committee. Mrs. Ovelmen is an “Audit & Risk committee financial expert” as defined by the SEC regulations for Item 16A of Form 20-F.
Mrs. Ovelmen and each of the other members of the Audit & Risk Committee are “independent directors” as defined under the NYSE listing standards.
Please see “Item 6.A—Directors, senior management and employees—Directors and senior management—–Board of Directors” for Mrs. Ovelmen's experience.
|
ITEM 16B.
|
CODE OF ETHICS
|
ArcelorMittal has adopted a “Code of Business Conduct” applicable to all directors and to senior management, including the Company’s Chief Executive Officer and Chief Financial Officer, and employees of ArcelorMittal. The Code has been disseminated through company-wide communications and is posted on ArcelorMittal’s website at www.arcelormittal.com.
ArcelorMittal intends to disclose any amendment to or waiver from the Code of Business Conduct applicable to any of ArcelorMittal’s directors, its Chief Executive Officer, Chief Financial Officer or any other person who is an executive officer of ArcelorMittal on ArcelorMittal’s website at www.arcelormittal.com.
For more information refer to “Item 6.C—Directors, senior management and employees—Board practices/Corporate governance—Ethics and conflicts of interest”.
|
ITEM 16C.
|
PRINCIPAL ACCOUNTANT FEES AND SERVICES
|
Deloitte Audit S.à r.l. acted as the principal independent registered public accounting firm for ArcelorMittal for the fiscal years ended December 31, 2018 and 2017. Set forth below is a breakdown of fees for services rendered in 2018 and 2017.
Audit Fees
. Audit fees in 2018 and 2017 included $26.7 million and $23.6 million, respectively, for the audits of financial statements, and $0.5 million and $0.2 million in 2018 and 2017, respectively, for regulatory filings.
Audit-Related Fees
. Audit-related fees in 2018 and 2017 were $0.9 million and $1.0 million, respectively. Audit-related fees primarily include fees for employee benefit plan audits.
Tax Fees
. Fees relating to tax planning, advice and compliance in 2018 and 2017 were $0.4 million and $0.4 million, respectively.
All Other Fees
. Fees in 2018 and 2017 for all other services were $0.2 million and $0.2 million, respectively. All other fees relate to services not included in the first three categories.
The Audit & Risk Committee has reviewed and approved all of the audit, audit-related, tax and other services provided by the principal independent registered public accounting firm in 2018 within its scope, prior to commencement of the engagements. None of the services provided in 2018 were approved under the de minimis exception allowed under the Exchange Act.
The Audit & Risk Committee pre-approves all permissible non-audit service engagements rendered by the principal independent registered public accounting firm. The Audit & Risk Committee has delegated pre-approval powers on a case-by-case basis to the Audit & Risk Committee Chairman, for instances where the Committee is not in session and the pre-approved services are reviewed in the subsequent Committee meeting.
In making its recommendation to appoint Deloitte Audit S.à r.l. as our principal independent registered public accounting firm for the fiscal year ended December 31, 2018, the Audit & Risk Committee has considered whether the services provided are compatible with maintaining Deloitte Audit S.à r.l. independence and has determined that such services do not interfere with Deloitte Audit S.à r.l. independence.
229
|
ITEM 16D.
|
EXEMPTIONS FROM THE LISTING STANDARDS FOR AUDIT COMMITTEES
|
None.
|
ITEM 16E.
|
PURCHASES OF EQUITY SECURITIES BY THE ISSUER AND AFFILIATED PURCHASERS
|
|
2018
|
Total Number of Shares Purchased
|
Average Price Paid Per Share
|
Total Number of Shares Purchased as Part of Publicly Announced Plan or Program
|
Maximum Number of Shares that May Yet Be Purchased Under the Plans or Programs
(1)(2)
|
|
January 1 - January 31
|
-
|
-
|
-
|
-
|
|
February 1 - February 28
|
-
|
-
|
-
|
-
|
|
March 1 - March 31
|
7,000,000
(1
)
|
$32.36
|
7,000,000
(1)
|
-(1)
|
|
April 1 - April 30
|
-
|
-
|
-
|
-
|
|
May 1 - May 31
|
-
|
-
|
-
|
-
|
|
June 1 - June 30
|
-
|
-
|
-
|
-
|
|
July 1 - July 31
|
-
|
-
|
-
|
-
|
|
August 1 - August 31
|
-
|
-
|
-
|
-
|
|
September 1 - September 30
|
-
|
-
|
-
|
-
|
|
October 1 - October 31
|
-
|
-
|
-
|
-
|
|
November 1 - November 30
|
-
|
-
|
-
|
-
|
|
December 1 - December 31
|
-
|
-
|
-
|
-
|
(1) In accordance with the authorization provided by the annual general meeting of shareholders of May 5, 2015 as described in “Item 10.B—Additional Information—Memorandum and Articles of Association”, on March 13, 2018, ArcelorMittal announced a share buyback program with the intent to acquire shares intended to meet the Company’s obligations arising from share option programs, or other allocations of shares, to employees or to members of management including the CEO Office of ArcelorMittal or group companies. ArcelorMittal announced its intent to repurchase an aggregate maximum amount of US$280,000,000 in accordance with the resolution of the annual general meeting of shareholders held on May 5, 2015 and applicable market abuse regulations for a maximum of 7,000,000 shares to be acquired during the period from March 13, 2018 to May 5, 2020. On March 28, 2018, ArcelorMittal announced the completion of its share buyback program on March 26, 2018. Following this share buy-back program, the Company may still buy back shares up to approximately 9.3% of its issued share capital as of December 31, 2018. See “Item 4.A—Information on the Company—History and development of the Company—Recent Developments.” about the 2019 Program.
(2) As described in “Item 10.B—Additional Information—Memorandum and Articles of Association”, the maximum number of shares that may be acquired is the maximum allowed by the Luxembourg law of 10 August 1915 on commercial companies in such manner that the accounting par value of the Company’s shares held by the Company do not in any event exceed 10% of the Company’s issued share capital. The maximum number of own shares that the Company may hold at any time directly or indirectly may not have the effect of reducing its net assets (“actif net”) below the amount mentioned in paragraphs 1 and 2 of Article 461-272-1 of the Grand-Ducal Regulation coordinating the amended law of 10 August 1915 on commercial companies Law.
|
ITEM 16F.
|
CHANGE IN REGISTRANT’S CERTIFYING ACCOUNTANT
|
Not applicable.
|
ITEM 16G.
|
CORPORATE GOVERNANCE
|
230
There are no significant differences between the corporate governance practices of ArcelorMittal and those required of a U.S. domestic issuer under the Listed Company Manual of the New York Stock Exchange.
|
ITEM 16H.
|
MINE SAFETY DISCLOSURE
|
The information concerning mine safety violations and other regulatory matters required by Section 1503(a) of the Dodd-Frank Wall Street Reform and Consumer Protection Act is included in Exhibit 16.1 to this annual report on Form 20-F.
231
|
ITEM 17.
|
FINANCIAL STATEMENTS
|
The Company has responded to Item 18 in lieu of responding to this Item.
|
ITEM 18.
|
FINANCIAL STATEMENTS
|
Reference is made to pages F-1 to F-134.
|
ITEM 19.
|
EXHIBITS
|
EXHIBIT INDEX
|
Exhibit
|
Description
|
|
Number
|
|
|
1.1
|
Amended and Restated Articles of Association of ArcelorMittal dated May 16, 2018 and available at
Exhibit 1.1
.
|
|
2.1
|
The total amount of long-term debt securities authorized under any instrument does not exceed 10% of the total assets of ArcelorMittal and its subsidiaries on a consolidated basis. ArcelorMittal hereby agrees to furnish to the SEC, upon its request, a copy of any instrument defining the rights of holders of long-term debt of ArcelorMittal or of its subsidiaries for which consolidated or unconsolidated financial statements are required to be filed.
|
|
4.1*
|
Shareholder’s agreement dated as of August 13, 1997 among Ispat International N.V., LNM Holdings S.L. (renamed Ispat International Investments S.L.) and Mr. Lakshmi N. Mittal (filed as Exhibit 4.3 to Mittal Steel Company N.V.’s annual report on Form 20-F for the year ended December 31, 2004 (File No. 001-14666), and incorporated by reference herein) and available at:
http://www.sec.gov/Archives/edgar/data/1041989/000095012305003893/y07225exv4w3.txt
.
|
|
4.2*
|
Memorandum of Understanding dated June 25, 2006 among Arcelor, Mittal Steel Company N.V. and Mr. and Mrs. Lakshmi N. Mittal (filed as Exhibit 99.1 to Mittal Steel Company N.V.’s report on Form 6-K (File No. 001-14666) filed with the Commission on June 29, 2006, and incorporated by reference herein) and available at:
http://www.sec.gov/Archives/edgar/data/1041989/000090342306000774/mittal6k-ex991_0629.htm.
|
|
4.3*
|
Supplemental Terms for 2015-2016 to the ArcelorMittal Equity Incentive Plan effective May 5, 2015 (filed as Exhibit 4.4 to the annual report on Form 20-F filed on February 22, 2016 (File No. 001-35788) and incorporated by reference herein) and available at:
http://www.sec.gov/Archives/edgar/data/1243429/000124342916000008/exhibit44.htm
.
|
|
4.4*
|
Restricted Share Units and Performance Share Units Plan effective May 10, 2011 (filed as Exhibit 4.5 to ArcelorMittal’s annual report on Form 20-F filed on February 22, 2012 (File No. 333-146371), and incorporated by reference herein) and available at:
http://www.sec.gov/Archives/edgar/data/1243429/000124342912000008/Exhibit4.5.htm
.
|
|
4.5*
|
Supplemental Terms for 2013-2014 Restricted Share Units and Performance Share Units Plan to the ArcelorMittal Equity Incentive Plan effective May 8, 2013 (filed as Exhibit 4.6 to the annual report on Form 20-F filed on February 25, 2014 (File No. 001-35788) and incorporated by reference herein) and available at:
http://www.sec.gov/Archives/edgar/data/1243429/000124342914000002/exhibit46.htm
.
|
|
4.6*
|
ArcelorMittal Group Management Board Performance Share Unit Plan effective May 8, 2013 (filed as Exhibit 4.7 to the annual report on Form 20-F filed on February 25, 2014 (File No. 001-35788) and incorporated by reference herein) and available at:
http://www.sec.gov/Archives/edgar/data/1243429/000124342914000002/exhibit47.htm
.
|
|
4.7*
|
Supplemental Terms for 2014-2015 Restricted Share Units and Performance Share Units Plan to the ArcelorMittal Equity Incentive Plan effective May 8, 2014 (filed as Exhibit 4.8 to ArcelorMittal’s annual report on Form 20-F for the year ended December 31, 2014 (File No. 001-35788), and incorporated by reference herein) and available at:
http://www.sec.gov/Archives/edgar/data/1243429/000124342915000002/Exhibit48.htm
.
|
232
|
4.8*
|
Supplemental Terms for 2015-2016 to the GMB PSU Plan effective May 5, 2015 (filed as Exhibit 4.9 to the annual report on Form 20-F filed on February 22, 2016 (File No. 001-35788) and incorporated by reference herein) and available at:
http://www.sec.gov/Archives/edgar/data/1243429/000124342916000008/exhibit49.htm
.
|
|
4.9*
|
Supplemental Terms for 2016-2017 to the GMB PSU Plan effective May 4, 2016 (filed as Exhibit 5.0 to the annual report on Form 20-F filed on February 23, 2017 (File No. 001-35788) and incorporated by reference herein) and available at:
http://www.sec.gov/Archives/edgar/data/1243429/000124342917000002/ex50.htm
.
|
|
4.10*
|
Supplemental Terms for 2016-2017 to the ArcelorMittal Equity Incentive Plan effective May 4, 2016 (filed as Exhibit 5.1 to the annual report on Form 20-F filed on February 23, 2017 (File No. 001-35788) and incorporated by reference herein) and available at:
http://www.sec.gov/Archives/edgar/data/1243429/000124342917000002/ex51.htm
.
|
|
4.11*
|
Supplemental Terms for 2017-2018 to the GMB PSU Plan effective May 10, 2017, filed as Exhibit 4.12 to the annual report on Form 20-F filed on February 15, 2018) and available at
http://www.sec.gov/Archives/edgar/data/1243429/000124342918000007/a2017exhibit412.htm
.
|
|
4.12*
|
Supplemental Terms for 2017-2018 to the ArcelorMittal Equity Incentive Plan effective May 10, 2017, filed as Exhibit 4.13 to the annual report on Form 20-F filed on February 15, 2018) and available at
http://www.sec.gov/Archives/edgar/data/1243429/000124342918000007/a2017exhibit413.htm
|
|
4.13
|
Supplemental Terms for 2018-2019 to the GMB PSU Plan effective May 9, 2018 and available at
Exhibit 4.13
|
|
4.14
|
Supplemental Terms for 2018-2019 to the ArcelorMittal Equity Incentive Plan effective May 9, 2018 available at
Exhibit 4.14
|
|
8.1
|
|
|
12.1
|
Certifications of ArcelorMittal’s Chief Executive Officer and Chief Financial Officer pursuant to Rule 13a-14(a) under the Exchange Act and available at
Exhibit 12.1
.
|
|
13.1
|
Certifications of ArcelorMittal’s Chief Executive Officer and Chief Financial Officer pursuant to Rule 13a-14(b) under the Exchange Act and Section 1350 of Chapter 63 of Title 18 of the United States Code and available at
Exhibit 13.1
.
|
|
15.1
|
|
|
15.2
|
|
|
15.3
|
|
|
15.4
|
|
|
15.5
|
Consent of SRK Consulting (Canada) Inc. and available at
Exhibit 15.5.
|
|
15.6
|
|
|
16.1
|
|
|
101.INS
|
XBRL Instance Document
|
|
101.SCH
|
XBRL Taxonomy Extension Schema Document
|
|
101.CAL
|
XBRL Taxonomy Extension Calculation Linkbase Document
|
|
101.DEF
|
XBRL Taxonomy Extension Definition Linkbase Document
|
|
101.LAB
|
XBRL Taxonomy Extension Label Linkbase Document
|
|
101.PRE
|
XBRL Taxonomy Extension Presentation Linkbase Document
|
|
*
|
Previously filed
|
233
SIGNATURES
The registrant hereby certifies that it meets all of the requirements for filing on Form 20-F and that it has duly caused and authorized the undersigned to sign this annual report on its behalf.
|
ARCELORMITTAL
|
|
/s/ Henk Scheffer
|
|
Henk Scheffer
|
|
Company Secretary
|
Date: February 22, 2019
234
ARCELORMITTAL AND SUBSIDIARIES
CONSOLIDATED FINANCIAL STATEMENTS
as of December 31, 2018 and 2017 and
for each of the three years in the period ended December 31, 2018
INDEX
|
Page
|
|
|
Report of Independent Registered Public Accounting Firm
|
|
|
Consolidated Statements of Operations
|
|
|
Consolidated Statements of Other Comprehensive Income
|
|
|
Consolidated Statements of Financial Position
|
|
|
Consolidated Statements of Changes in Equity
|
|
|
Consolidated Statements of Cash Flows
|
|
|
Notes to Consolidated Financial Statements
|
|
F-1
REPORT OF INDEPENDENT REGISTERED PUBLIC ACCOUNTING FIRM
To the shareholders
and the Board of Directors of ArcelorMittal
Opinion on the Financial Statements
We have audited the accompanying consolidated statements of financial position of ArcelorMittal and subsidiaries (the "Company") as of December 31, 2018 and 2017, the related consolidated statements of operations, other comprehensive income, changes in equity and cash flows, for each of the three years in the period ended December 31, 2018, and the related notes (collectively referred to as the "consolidated financial statements"). In our opinion, the consolidated financial statements present fairly, in all material respects, the financial position of the Company as of December 31, 2018 and 2017, and the results of its operations and its cash flows for each of the three years in the period ended December 31, 2018, in conformity with International Financial Reporting Standards as issued by the International Accounting Standards Board.
We have also audited, in accordance with the standards of the Public Company Accounting Oversight Board (United States) (PCAOB), the Company's internal control over financial reporting as of December 31, 2018, based on criteria established in
Internal Control - Integrated Framework (2013)
issued by the Committee of Sponsoring Organizations of the Treadway Commission and our report dated February 22, 2019, expressed an unqualified opinion on the Company's internal control over financial reporting.
Basis for Opinion
These consolidated financial statements are the responsibility of the Company's management. Our responsibility is to express an opinion on the Company's consolidated financial statements based on our audits. We are a public accounting firm registered with the PCAOB and are required to be independent with respect to the Company in accordance with the U.S. federal securities laws and the applicable rules and regulations of the Securities and Exchange Commission and the PCAOB.
We conducted our audits in accordance with the standards of the PCAOB. Those standards require that we plan and perform the audit to obtain reasonable assurance about whether the consolidated financial statements are free of material misstatement, whether due to error or fraud. Our audits included performing procedures to assess the risks of material misstatement of the consolidated financial statements, whether due to error or fraud, and performing procedures that respond to those risks. Such procedures included examining, on a test basis, evidence regarding the amounts and disclosures in the consolidated financial statements. Our audits also included evaluating the accounting principles used and significant estimates made by management, as well as evaluating the overall presentation of the consolidated financial statements. We believe that our audits provide a reasonable basis for our opinion.
/s/ Deloitte Audit S.à r.l.
Luxembourg, Grand Duchy of Luxembourg
February 22, 2019
We have served as the Company's auditor since 2007.
F-2
ARCELORMITTAL AND SUBSIDIARIES
Consolidated Statements of Operations
(millions of U.S. dollars, except share and per share data)
|
Year Ended December 31,
|
||||||||||
|
Notes
|
2018
|
|
2017
|
|
2016
|
|||||
|
Sales
|
4.1 and 11.1
|
|
|
|
|
|
|
|||
|
(including 8,259, 7,503 and 5,634 of sales to related parties for 2018, 2017 and 2016, respectively)
|
||||||||||
|
Cost of sales
|
4.2 and 11.2
|
|
|
|
|
|
|
|||
|
(including 1,116, 1,033 and 1,390 of purchases from related parties for 2018, 2017 and 2016, respectively)
|
||||||||||
|
Gross margin
|
|
|
|
|
|
|
||||
|
Selling, general and administrative expenses
|
|
|
|
|
|
|
||||
|
Operating income
|
|
|
|
|
|
|
||||
|
Income from investments in associates, joint ventures and other investments
|
2.6
|
|
|
|
|
|
|
|||
|
Financing costs - net
|
6.2
|
(
|
)
|
(
|
)
|
(
|
)
|
|||
|
Income before taxes
|
|
|
|
|
|
|
||||
|
Income tax (benefit) / expense
|
9.1
|
(
|
)
|
|
|
|
|
|||
|
Net income (including non-controlling interests)
|
|
|
|
|
|
|
||||
|
Net income attributable to equity holders of the parent
|
|
|
|
|
|
|
||||
|
Net income / (loss) attributable to non-controlling interests
|
|
|
|
|
(
|
)
|
||||
|
Net income (including non-controlling interests)
|
|
|
|
|
|
|
||||
|
Year Ended December 31,
|
||||||||||
|
2018
|
|
2017
|
|
2016
|
||||||
|
Earnings per common share (in U.S. dollars)
1
|
||||||||||
|
Basic
|
|
|
|
|
|
|
||||
|
Diluted
|
|
|
|
|
|
|
||||
|
Weighted average common shares outstanding (in millions)
|
10.3
|
|||||||||
|
Basic
|
|
|
|
|
|
|
||||
|
Diluted
|
|
|
|
|
|
|
||||
|
1
|
|
The accompanying notes are an integral part of these consolidated financial statements.
F-3
ARCELORMITTAL AND SUBSIDIARIES
Consolidated Statements of Other Comprehensive Income
(millions of U.S. dollars, except share and per share data)
|
Year Ended December 31,
|
|||||||||||||||||
|
2018
|
2017
|
2016
|
|||||||||||||||
|
Net income (including non-controlling interests)
|
|
|
|
|
|
|
|||||||||||
|
Items that can be recycled to the consolidated statements of operations
|
|||||||||||||||||
|
Available-for-sale-investments:
|
|||||||||||||||||
|
Gain arising during the period
|
|
|
|
|
|
|
|||||||||||
|
Reclassification adjustments for loss (gain) included in the consolidated statements of operations
|
|
|
|
|
(
|
)
|
|||||||||||
|
|
|
|
|
|
|
||||||||||||
|
Derivative financial instruments:
|
|||||||||||||||||
|
Gain (loss) arising during the period
|
|
|
(
|
)
|
|
|
|||||||||||
|
Reclassification adjustments for loss (gain) included in the consolidated statements of operations
|
|
|
|
|
(
|
)
|
|||||||||||
|
|
|
(
|
)
|
|
|
||||||||||||
|
Exchange differences arising on translation of foreign operations:
|
|||||||||||||||||
|
(Loss) gain arising during the period
|
(
|
)
|
|
|
(
|
)
|
|||||||||||
|
Reclassification adjustments for gain included in the consolidated statements of operations
|
(
|
)
|
(
|
)
|
(
|
)
|
|||||||||||
|
(
|
)
|
|
|
(
|
)
|
||||||||||||
|
Share of other comprehensive income (loss) related to associates and joint ventures
|
|||||||||||||||||
|
(Loss) gain arising during the period
|
(
|
)
|
|
|
(
|
)
|
|||||||||||
|
Reclassification adjustments for (gain) loss included in the consolidated statements of operations
|
(
|
)
|
|
|
|
|
|||||||||||
|
(
|
)
|
|
|
|
|
||||||||||||
|
Income tax benefit (expense) related to components of other comprehensive income (loss) that can be recycled to the consolidated statements of operations
|
(
|
)
|
|
|
(
|
)
|
|||||||||||
|
Items that cannot be recycled to the consolidated statements of operations
|
|||||||||||||||||
|
Investments in equity instruments at FVOCI:
|
|
||||||||||||||||
|
Loss arising during the period
|
(
|
)
|
|
|
|
|
|||||||||||
|
Share of other comprehensive loss related to associates and joint ventures
|
(
|
)
|
|
|
|
|
|||||||||||
|
|
(
|
)
|
|
|
|
|
|||||||||||
|
Employee benefits - Recognized actuarial gains
|
|
|
|
|
|
|
|||||||||||
|
Share of other comprehensive income (loss) related to associates and joint ventures
|
|
|
|
|
(
|
)
|
|||||||||||
|
Income tax benefit related to components of other comprehensive income that cannot be recycled to the consolidated statements of operations
|
|
|
|
|
|
|
|||||||||||
|
Total other comprehensive (loss) income
|
(
|
)
|
|
|
(
|
)
|
|||||||||||
|
Total other comprehensive (loss) income attributable to:
|
|||||||||||||||||
|
Equity holders of the parent
|
(
|
)
|
|
|
(
|
)
|
|||||||||||
|
Non-controlling interests
|
(
|
)
|
|
|
|
|
|||||||||||
|
(
|
)
|
|
|
(
|
)
|
||||||||||||
|
Total comprehensive income
|
|
|
|
|
|
|
|||||||||||
|
Total comprehensive income attributable to:
|
|||||||||||||||||
|
Equity holders of the parent
|
|
|
|
|
|
|
|||||||||||
|
Non-controlling interests
|
|
|
|
|
(
|
)
|
|||||||||||
|
Total comprehensive income
|
|
|
|
|
|
|
|||||||||||
The accompanying notes are an integral part of these consolidated financial statements.
F-4
ARCELORMITTAL AND SUBSIDIARIES
Consolidated Statements of Financial Position
(millions of U.S. dollars, except share data)
|
December 31,
|
|||||||
|
Notes
|
2018
|
2017
|
|||||
|
ASSETS
|
|||||||
|
Current assets:
|
|||||||
|
Cash and cash equivalents
|
6.1.3
|
|
|
|
|
||
|
Restricted cash
|
6.1.3
|
|
|
|
|
||
|
Trade accounts receivable and other (including 366 and 406 from related parties at December 31, 2018 and 2017, respectively)
|
4.3 and 11.1
|
|
|
|
|
||
|
Inventories
|
4.4
|
|
|
|
|
||
|
Prepaid expenses and other current assets
|
4.5
|
|
|
|
|
||
|
Assets held for sale
|
2.3.2
|
|
|
|
|
||
|
Total current assets
|
|
|
|
|
|||
|
Non-current assets:
|
|||||||
|
Goodwill and intangible assets
|
5.1
|
|
|
|
|
||
|
Property, plant and equipment and biological assets
|
5.2
|
|
|
|
|
||
|
Investments in associates and joint ventures
|
2.4
|
|
|
|
|
||
|
Other investments
|
2.5
|
|
|
|
|
||
|
Deferred tax assets
|
9.4
|
|
|
|
|
||
|
Other assets
|
4.6
|
|
|
|
|
||
|
Total non-current assets
|
|
|
|
|
|||
|
Total assets
|
|
|
|
|
|||
|
LIABILITIES AND EQUITY
|
|||||||
|
Current liabilities:
|
|||||||
|
Short-term debt and current portion of long-term debt
|
6.1.2.1
|
|
|
|
|
||
|
Trade accounts payable and other (including 201 and 260 to related parties at December 31, 2018 and 2017, respectively)
|
4.7 and 11.2
|
|
|
|
|
||
|
Short-term provisions
|
8.1
|
|
|
|
|
||
|
Accrued expenses and other liabilities
|
4.8
|
|
|
|
|
||
|
Income tax liabilities
|
|
|
|
|
|||
|
Liabilities held for sale
|
2.3.2
|
|
|
|
|
||
|
Total current liabilities
|
|
|
|
|
|||
|
Non-current liabilities:
|
|||||||
|
Long-term debt, net of current portion
|
6.1.2.2
|
|
|
|
|
||
|
Deferred tax liabilities
|
9.4
|
|
|
|
|
||
|
Deferred employee benefits
|
7.2
|
|
|
|
|
||
|
Long-term provisions
|
8.1
|
|
|
|
|
||
|
Other long-term obligations
|
8.2
|
|
|
|
|
||
|
Total non-current liabilities
|
|
|
|
|
|||
|
Total liabilities
|
|
|
|
|
|||
|
Contingencies and commitments
|
8.3 and 8.4
|
||||||
|
Equity:
|
10
|
||||||
|
Common shares (no par value, 1,151,576,921 and 1,151,576,921 shares authorized, 1,021,903,623 and 1,021,903,623 shares issued, and 1,013,568,258 and 1,019,916,787 shares outstanding at December 31, 2018 and 2017, respectively)
|
|
|
|
|
|||
|
Treasury shares (8,335,365 and 1,986,836 common shares at December 31, 2018 and 2017, respectively, at cost)
|
(
|
)
|
(
|
)
|
|||
|
Additional paid-in capital
|
|
|
|
|
|||
|
Retained earnings
|
|
|
|
|
|||
|
Reserves
|
(
|
)
|
(
|
)
|
|||
|
Equity attributable to the equity holders of the parent
|
|
|
|
|
|||
|
Non-controlling interests
|
|
|
|
|
|||
|
Total equity
|
|
|
|
|
|||
|
Total liabilities and equity
|
|
|
|
|
|||
The accompanying notes are an integral part of these consolidated financial statements.
F-5
ARCELORMITTAL AND SUBSIDIARIES
Consolidated Statements of Changes in Equity
(millions of U.S. dollars, except share and per share data)
|
|
|
|
|
|
|
|
|
|
|
|
|
|
Reserves
|
|
|
|
|
|
|
|||||||||||||||||||
|
|
|
|
|
|
|
|
|
|
|
|
|
|
Items that can be recycled to the Consolidated Statements of Operations
|
|
Items that cannot be recycled to the Consolidated Statements of Operations
|
|
|
|
|
|
|
|||||||||||||||||
|
|
Shares
1
|
|
Share capital
|
|
Treasury Shares
|
|
Mandatorily convertible notes
|
|
Additional Paid-in Capital
|
|
Retained Earnings
|
|
Foreign
Currency Translation Adjustments |
|
Unrealized Gains (Losses) on Derivative Financial Instruments
|
|
Unrealized Gains (Losses) on Investments in Equity Instruments at FVOCI
|
|
Recognized actuarial (losses) gains
|
|
Equity attributable to the equity holders of the parent
|
|
Non-controlling interests
|
|
Total
Equity |
|||||||||||||
|
Balance at December 31, 2015
|
|
|
|
|
|
|
(
|
)
|
|
|
|
|
|
|
|
|
|
|
(
|
)
|
|
|
|
|
|
|
|
(
|
)
|
|
|
|
|
|
|
|
|
|
|
Net income (including non-controlling interests)
|
—
|
|
|
—
|
|
|
—
|
|
|
—
|
|
|
—
|
|
|
|
|
|
—
|
|
|
—
|
|
|
—
|
|
|
—
|
|
|
|
|
|
(
|
)
|
|
|
|
|
Other comprehensive income (loss)
|
—
|
|
|
—
|
|
|
—
|
|
|
—
|
|
|
—
|
|
|
|
|
|
(
|
)
|
|
|
|
|
|
|
|
(
|
)
|
|
(
|
)
|
|
|
|
|
(
|
)
|
|
Total comprehensive income (loss)
|
—
|
|
|
—
|
|
|
—
|
|
|
—
|
|
|
—
|
|
|
|
|
|
(
|
)
|
|
|
|
|
|
|
|
(
|
)
|
|
|
|
|
(
|
)
|
|
|
|
|
Equity offering (note 10.1)
|
|
|
|
|
|
|
—
|
|
|
—
|
|
|
|
|
|
—
|
|
|
—
|
|
|
—
|
|
|
—
|
|
|
—
|
|
|
|
|
|
—
|
|
|
|
|
|
Reduction of the share capital par value (note 10.1)
|
—
|
|
|
(
|
)
|
|
—
|
|
|
—
|
|
|
|
|
|
—
|
|
|
—
|
|
|
—
|
|
|
—
|
|
|
—
|
|
|
—
|
|
|
—
|
|
|
|
|
|
Conversion of the mandatorily convertible notes (note 10.2)
|
|
|
|
|
|
|
—
|
|
|
(
|
)
|
|
|
|
|
—
|
|
|
—
|
|
|
—
|
|
|
—
|
|
|
—
|
|
|
—
|
|
|
—
|
|
|
|
|
|
Recognition of share-based payments (note 7.3)
|
—
|
|
|
—
|
|
|
|
|
|
—
|
|
|
|
|
|
—
|
|
|
—
|
|
|
—
|
|
|
—
|
|
|
—
|
|
|
|
|
|
—
|
|
|
|
|
|
Dividend (note 10.4)
|
—
|
|
|
—
|
|
|
—
|
|
|
—
|
|
|
—
|
|
|
—
|
|
|
—
|
|
|
—
|
|
|
—
|
|
|
—
|
|
|
—
|
|
|
(
|
)
|
|
(
|
)
|
|
Equity offering in ArcelorMittal South Africa ("AMSA") (note 10.5.2)
|
—
|
|
|
—
|
|
|
—
|
|
|
—
|
|
|
—
|
|
|
|
|
|
(
|
)
|
|
—
|
|
|
—
|
|
|
—
|
|
|
|
|
|
(
|
)
|
|
|
|
|
Equity share option plan in AMSA (note 10.5.2)
|
—
|
|
|
—
|
|
|
—
|
|
|
—
|
|
|
—
|
|
|
(
|
)
|
|
|
|
|
—
|
|
|
—
|
|
|
—
|
|
|
(
|
)
|
|
|
|
|
|
|
|
AMSA B-BBEE transaction (note 10.5.2)
|
—
|
|
|
—
|
|
|
—
|
|
|
—
|
|
|
—
|
|
|
|
|
|
—
|
|
|
—
|
|
|
—
|
|
|
—
|
|
|
|
|
|
|
|
|
|
|
|
Other movements
|
—
|
|
|
—
|
|
|
—
|
|
|
—
|
|
|
—
|
|
|
(
|
)
|
|
—
|
|
|
—
|
|
|
—
|
|
|
|
|
|
(
|
)
|
|
|
|
|
(
|
)
|
|
Balance at December 31, 2016
|
|
|
|
|
|
|
(
|
)
|
|
|
|
|
|
|
|
|
|
|
(
|
)
|
|
|
|
|
|
|
|
(
|
)
|
|
|
|
|
|
|
|
|
|
|
Net income (including non-controlling interests)
|
—
|
|
|
—
|
|
|
—
|
|
|
—
|
|
|
—
|
|
|
|
|
|
—
|
|
|
—
|
|
|
—
|
|
|
—
|
|
|
|
|
|
|
|
|
|
|
|
Other comprehensive income (loss)
|
—
|
|
|
—
|
|
|
—
|
|
|
—
|
|
|
—
|
|
|
—
|
|
|
|
|
|
(
|
)
|
|
|
|
|
|
|
|
|
|
|
|
|
|
|
|
|
Total comprehensive income (loss)
|
—
|
|
|
—
|
|
|
—
|
|
|
—
|
|
|
—
|
|
|
|
|
|
|
|
|
(
|
)
|
|
|
|
|
|
|
|
|
|
|
|
|
|
|
|
|
Recognition of share-based payments (note 7.3)
|
—
|
|
|
—
|
|
|
|
|
|
—
|
|
|
|
|
|
—
|
|
|
—
|
|
|
—
|
|
|
—
|
|
|
—
|
|
|
|
|
|
—
|
|
|
|
|
|
Dividend (note 10.4)
|
—
|
|
|
—
|
|
|
—
|
|
|
—
|
|
|
—
|
|
|
—
|
|
|
—
|
|
|
—
|
|
|
—
|
|
|
—
|
|
|
—
|
|
|
(
|
)
|
|
(
|
)
|
|
Acquisition of Sumaré (note 2.2.4)
|
—
|
|
|
—
|
|
|
—
|
|
|
—
|
|
|
—
|
|
|
—
|
|
|
—
|
|
|
—
|
|
|
—
|
|
|
—
|
|
|
—
|
|
|
|
|
|
|
|
|
Mandatory convertible bonds extension (note 10.2)
|
—
|
|
|
—
|
|
|
—
|
|
|
—
|
|
|
—
|
|
|
—
|
|
|
—
|
|
|
—
|
|
|
—
|
|
|
—
|
|
|
—
|
|
|
(
|
)
|
|
(
|
)
|
|
Other movements
|
—
|
|
|
—
|
|
|
—
|
|
|
—
|
|
|
—
|
|
|
|
|
|
—
|
|
|
—
|
|
|
—
|
|
|
—
|
|
|
|
|
|
|
|
|
|
|
|
Balance at December 31, 2017
|
|
|
|
|
|
|
(
|
)
|
|
|
|
|
|
|
|
|
|
|
(
|
)
|
|
(
|
)
|
|
|
|
|
(
|
)
|
|
|
|
|
|
|
|
|
|
|
Net income (including non-controlling interests)
|
—
|
|
|
—
|
|
|
—
|
|
|
—
|
|
|
—
|
|
|
|
|
|
—
|
|
|
—
|
|
|
—
|
|
|
—
|
|
|
|
|
|
|
|
|
|
|
|
Other comprehensive income (loss)
|
—
|
|
|
—
|
|
|
—
|
|
|
—
|
|
|
—
|
|
|
—
|
|
|
(
|
)
|
|
|
|
|
(
|
)
|
|
|
|
|
(
|
)
|
|
(
|
)
|
|
(
|
)
|
|
Total comprehensive income (loss)
|
—
|
|
|
—
|
|
|
—
|
|
|
—
|
|
|
—
|
|
|
|
|
|
(
|
)
|
|
|
|
|
(
|
)
|
|
|
|
|
|
|
|
|
|
|
|
|
|
Recognition of share-based payments (note 7.3)
|
—
|
|
|
—
|
|
|
|
|
|
—
|
|
|
|
|
|
—
|
|
|
—
|
|
|
—
|
|
|
—
|
|
|
—
|
|
|
|
|
|
—
|
|
|
|
|
|
Dividend (note 10.4)
|
—
|
|
|
—
|
|
|
—
|
|
|
—
|
|
|
—
|
|
|
(
|
)
|
|
—
|
|
|
—
|
|
|
—
|
|
|
—
|
|
|
(
|
)
|
|
(
|
)
|
|
(
|
)
|
|
Share buyback (note 10.1)
|
(
|
)
|
|
—
|
|
|
(
|
)
|
|
—
|
|
|
—
|
|
|
—
|
|
|
—
|
|
|
—
|
|
|
—
|
|
|
—
|
|
|
(
|
)
|
|
—
|
|
|
(
|
)
|
|
Change in share capital currency (note 10.1)
|
—
|
|
|
(
|
)
|
|
—
|
|
|
—
|
|
|
|
|
|
—
|
|
|
—
|
|
|
—
|
|
|
—
|
|
|
—
|
|
|
—
|
|
|
—
|
|
|
|
|
|
Acquisition of non-controlling interests (note 10.5)
|
—
|
|
—
|
|
—
|
|
—
|
|
—
|
|
(
|
)
|
—
|
|
—
|
|
—
|
|
—
|
|
(
|
)
|
(
|
)
|
(
|
)
|
||||||||||||
|
Other movements
|
|
|
|
—
|
|
|
—
|
|
|
—
|
|
|
—
|
|
|
(
|
)
|
|
—
|
|
|
—
|
|
|
(
|
)
|
|
—
|
|
|
(
|
)
|
|
|
|
|
(
|
)
|
|
Balance at December 31, 2018
|
|
|
|
|
|
|
(
|
)
|
|
|
|
|
|
|
|
|
|
|
(
|
)
|
|
|
|
|
|
|
|
(
|
)
|
|
|
|
|
|
|
|
|
|
|
1.
|
|
The accompanying notes are an integral part of these consolidated financial statements.
F-6
ARCELORMITTAL AND SUBSIDIARIES
(millions of U.S. dollars, except share and per share data)
|
Year Ended December 31,
|
||||||||||
|
Notes
|
2018
|
2017
|
2016
|
|||||||
|
Operating activities:
|
||||||||||
|
Net income (including non-controlling interests)
|
|
|
|
|
|
|
||||
|
Adjustments to reconcile net income to net cash provided by operations:
|
||||||||||
|
Depreciation and amortization
|
5.1 and 5.2
|
|
|
|
|
|
|
|||
|
Impairment
|
5.2 and 5.3
|
|
|
|
|
|
|
|||
|
Bargain purchase gain
|
2.2.4
|
|
(
|
)
|
|
|
|
|
|
|
|
Interest expense
|
6.2
|
|
|
|
|
|
|
|||
|
Interest income
|
6.2
|
(
|
)
|
(
|
)
|
(
|
)
|
|||
|
Income tax (benefit)/ expense
|
9.1
|
(
|
)
|
|
|
|
|
|||
|
Remeasurement loss (gain) relating to US deferred employee benefits
|
7.2
|
|
|
|
|
(
|
)
|
|||
|
Net gain on disposal of subsidiaries
|
2.3.1
|
(
|
)
|
(
|
)
|
(
|
)
|
|||
|
Income from investments in associates, joint ventures and other investments
|
2.6
|
(
|
)
|
(
|
)
|
(
|
)
|
|||
|
Provision on pensions and OPEB
|
7.2
|
|
|
|
|
|
|
|||
|
Change in fair value adjustment on call option on mandatory convertible bonds and pellet purchase agreement
|
6.2
|
|
|
(
|
)
|
(
|
)
|
|||
|
Unrealized foreign exchange effects
|
|
|
(
|
)
|
|
|
||||
|
Write-downs (reversal) of inventories to net realizable value, provisions and other non-cash operating expenses net
|
4.4
|
|
|
|
|
(
|
)
|
|||
|
Changes in assets and liabilities that provided (required) cash, net of acquisitions:
|
||||||||||
|
Trade accounts receivable
|
(
|
)
|
(
|
)
|
(
|
)
|
||||
|
Inventories
|
4.4
|
(
|
)
|
(
|
)
|
(
|
)
|
|||
|
Trade accounts payable and other
|
4.7
|
|
|
|
|
|
|
|||
|
Interest paid
|
(
|
)
|
(
|
)
|
(
|
)
|
||||
|
Interest received
|
|
|
|
|
|
|
||||
|
Income taxes paid
|
(
|
)
|
(
|
)
|
(
|
)
|
||||
|
Dividends received from associates, joint ventures and other investments
|
|
|
|
|
|
|
||||
|
Cash contributions to plan assets and benefits paid for pensions and OPEB
|
7.2
|
(
|
)
|
(
|
)
|
(
|
)
|
|||
|
VAT and other amounts received (paid) from/to public authorities
|
(
|
)
|
(
|
)
|
|
|
||||
|
Other working capital and provisions movements
|
|
|
(
|
)
|
(
|
)
|
||||
|
Net cash provided by operating activities
|
|
|
|
|
|
|
||||
|
Investing activities:
|
||||||||||
|
Purchase of property, plant and equipment and intangibles
|
(
|
)
|
(
|
)
|
(
|
)
|
||||
|
Disposals of net assets of subsidiaries, net of cash disposed of 1, 13 and nil in 2018, 2017 and 2016, respectively
|
2.3.1
|
|
|
|
|
|
|
|||
|
Acquisitions of net assets of subsidiaries, net of cash acquired of 13, 617 and 63 in 2018, 2017 and 2016, respectively
|
2.2.4
|
(
|
)
|
|
|
|
|
|||
|
Acquisition of Uttam Galva and KSS Petron debt
|
4.6
|
(
|
)
|
|
|
|
|
|||
|
Disposals of associates and joint ventures
|
2.4.1 and 2.5
|
|
|
|
|
|
|
|||
|
Disposals of financial assets
|
2.6
|
|
|
|
|
|
|
|||
|
Other investing activities net
|
|
|
(
|
)
|
(
|
)
|
||||
|
Net cash used in investing activities
|
(
|
)
|
(
|
)
|
(
|
)
|
||||
|
Financing activities:
|
||||||||||
|
(Acquisition)/ Disposal of non-controlling interests
|
10.5.2
|
(
|
)
|
|
|
|
|
|||
|
Proceeds from put and call option on shares
|
2.2.4
|
|
|
|
|
|
|
|||
|
Proceeds from short-term debt
|
6.1.3
|
|
|
|
|
|
|
|||
|
Proceeds from long-term debt
|
6.1.3
|
|
|
|
|
|
|
|||
|
Payments of short-term debt
|
6.1.3
|
(
|
)
|
(
|
)
|
(
|
)
|
|||
|
Payments of long-term debt
|
6.1.3
|
(
|
)
|
(
|
)
|
(
|
)
|
|||
|
Equity offering
|
10.1
|
|
|
|
|
|
|
|||
|
Share buyback
|
10.1
|
(
|
)
|
|
|
|
|
|||
|
Dividends paid (includes 119, 141 and 61 of dividends paid to non-controlling shareholders in 2018, 2017 and 2016, respectively)
|
(
|
)
|
(
|
)
|
(
|
)
|
||||
|
Other financing activities net
|
6.1.3
|
(
|
)
|
(
|
)
|
(
|
)
|
|||
|
Net cash used in financing activities
|
(
|
)
|
(
|
)
|
(
|
)
|
||||
|
Net increase (decrease) in cash and cash equivalents
|
(
|
)
|
|
|
(
|
)
|
||||
|
Effect of exchange rate changes on cash
|
(
|
)
|
|
|
(
|
)
|
||||
|
Cash and cash equivalents:
|
||||||||||
|
At the beginning of the year
|
|
|
|
|
|
|
||||
|
Reclassification of the period-end cash and cash equivalents from (to) held for sale
|
2.3
|
(
|
)
|
|
|
(
|
)
|
|||
|
At the end of the year
|
|
|
|
|
|
|
||||
The accompanying notes are an integral part of these consolidated financial statements.
F-7
ARCELORMITTAL AND SUBSIDIARIES
Notes to Consolidated Financial Statements
(millions of U.S. dollars, except share and per share data)
SUMMARY OF NOTES TO CONSOLIDATED FINANCIAL STATEMENTS
|
|
|
|
1.1
|
Basis of presentation
|
|
1.2
|
Use of judgment and estimates
|
|
1.3
|
Accounting standards applied
|
|
|
|
|
2.1
|
Basis of consolidation
|
|
2.2
|
Investments in subsidiaries
|
|
2.3
|
Divestments and assets held for sale
|
|
2.4
|
Investments in associates and joint arrangements
|
|
2.5
|
Other investments
|
|
2.6
|
Income (loss) from investments in associates, joint ventures and other investments
|
|
|
|
|
3.1
|
Reportable segments
|
|
3.2
|
Geographical information
|
|
3.3
|
Sales by type of products
|
|
|
|
|
4.1
|
Revenue
|
|
4.2
|
Cost of sales
|
|
4.3
|
Trade accounts receivable and other
|
|
4.4
|
Inventories
|
|
4.5
|
Prepaid expenses and other current assets
|
|
4.6
|
Other assets
|
|
4.7
|
Trade accounts payable and other
|
|
4.8
|
Accrued expenses and other liabilities
|
|
|
|
|
5.1
|
Goodwill and intangible assets
|
|
5.2
|
Property, plant and equipment and biological assets
|
|
5.3
|
Impairment of intangible assets, including goodwill, and tangible assets
|
|
|
|
|
6.1
|
Financial assets and liabilities
|
|
6.2
|
Financing costs - net
|
|
6.3
|
Risk management policy
|
|
|
|
|
7.1
|
Employees and key management personnel
|
|
7.2
|
Deferred employee benefits
|
|
7.3
|
Share-based payments
|
|
|
|
|
8.1
|
Provisions overview
|
|
8.2
|
Other long-term obligations
|
|
8.3
|
Environmental liabilities, asset retirement obligations and legal proceedings
|
|
8.4
|
Commitments
|
|
|
|
|
9.1
|
Income tax expense (benefit)
|
|
9.2
|
Income tax recorded directly in equity
|
|
9.3
|
Uncertain tax positions
|
|
9.4
|
Deferred tax assets and liabilities
|
|
9.5
|
Tax losses, tax credits and other tax benefits carried forward
|
|
|
|
|
10.1
|
Share details
|
|
10.2
|
Equity instruments and hybrid instruments
|
|
10.3
|
Earnings per common share
|
|
10.4
|
Dividends
|
|
10.5
|
Non-controlling interests
|
|
|
|
|
11.1
|
Sales and trade receivables
|
|
11.2
|
Purchases and trade payables
|
|
11.3
|
Other transactions with related parties
|
|
|
|
F-8
ARCELORMITTAL AND SUBSIDIARIES
Notes to Consolidated Financial Statements
(millions of U.S. dollars, except share and per share data)
The preparation of consolidated financial statements in conformity with IFRS recognition and measurement principles and, in particular, making the critical accounting judgments requires the use of estimates and assumptions that affect the reported amounts of assets, liabilities, revenues and expenses. Management reviews its estimates on an ongoing basis using currently available information. Changes in facts and circumstances or obtaining new information or more experience may result in revised estimates, and actual results could differ from those estimates.
|
•
|
Deferred tax assets (note 9.4): The Company assesses the recoverability of deferred tax assets based on future taxable income projections, which are inherently uncertain and may be subject to changes over time. Judgment is required to assess the impact of such changes on the measurement of these assets and the time frame for their utilization. In addition, the Company applies judgment to recognize income tax liabilities when they are probable and can be reasonably estimated depending on the interpretation, which may be uncertain, of applicable tax laws and regulations. ArcelorMittal periodically reviews its estimates to reflect changes in facts and circumstances.
|
|
•
|
Provisions for pensions and other post-employment benefits (note 7.2): Benefit obligations and plan assets can be subject to significant volatility, in particular due to changes in market conditions and actuarial assumptions. Such assumptions differ by plan, take local conditions into account and include discount rates, expected rates of compensation increases, health care cost trend rates, mortality and retirement rates. They are determined following a formal process involving the Company's expertise and independent actuaries. Assumptions are reviewed annually and adjusted following actuarial and experience changes.
|
|
•
|
Provisions (note 8): Provisions, which result from legal or constructive obligations arising as a result of past events, are recognized based on the Company's, and in certain instances, third-party's best estimate of costs when the obligation arises. They are reviewed periodically to take into consideration changes in laws and regulations and underlying facts and circumstances.
|
|
•
|
Impairment of tangible and intangible assets, including goodwill (note 5.3): In the framework of the determination of the recoverable amount of assets, the estimates, judgments and assumptions applied for the value in use calculations relate primarily to growth rates, expected changes to average selling prices, shipments and direct costs.
|
F-9
ARCELORMITTAL AND SUBSIDIARIES
Notes to Consolidated Financial Statements
(millions of U.S. dollars, except share and per share data)
Assumptions for average selling prices and shipments are based on historical experience and expectations of future changes in the market. Discount rates are reviewed annually.
|
•
|
Business combinations (note 2.2.4): Assets acquired and liabilities assumed as part of a business combination are recorded at their acquisition-date fair values. Similarly, consideration including consideration receivable and contingent consideration is measured at fair value. Determining the fair value of identifiable assets and liabilities requires the use of valuation techniques which may include judgment and estimates and which may affect the allocation of the amount of consideration paid to the assets and liabilities acquired and goodwill or gain from a bargain purchase recorded as part of the business combination.
|
|
•
|
Financial instruments (note 6.1.5) and financial amounts receivable (note 4.6): Certain of the Company's financial instruments are classified as Level 3 as they include unobservable inputs. In particular, the Company uses estimates to compute unobservable historical volatility based on movements of stock market prices for the fair valuation of the call option on the 1,000 mandatory convertible bonds and unobservable inputs such as discounted cash flow model for the fair valuation of financial amounts receivable relating to Uttam Galva and KSS Petron.
|
|
•
|
|
|
|
|
On January 1, 2018, the Company adopted the following standards which have an impact on the disclosures in the consolidated financial statements of the Company:
|
•
|
IFRS 9 “Financial Instruments” issued on July 24, 2014, which replaces IAS 39 and modifies substantially the classification and measurement of financial instruments. The final version of the standard contains requirements in the following areas:
|
|
•
|
Classification and measurement: Financial assets are classified and measured by reference to the business model within which they are held and their contractual cash flow characteristics. Financial liabilities are classified in a similar manner to IAS 39, however there are differences in the requirements regarding the recognition of an entity's own credit risk for financial liabilities designated as FVTPL.
|
|
•
|
Impairment: The standard introduces an 'expected credit loss' model replacing the current incurred loss model for the measurement of the impairment of financial assets; it is therefore no longer necessary for a credit event to have occurred before a credit loss is recognized.
|
|
•
|
Hedge accounting: The standard introduces a new hedge accounting model that is designed to more closely align with how entities undertake risk management activities when hedging financial and non-financial risk exposures, which may result in the increased application of hedge accounting.
|
|
•
|
Derecognition: The requirements for derecognition of financial assets and liabilities are carried forward from IAS 39. Accordingly, the Company has applied the requirements of IFRS 9 to instruments that have not been derecognized at January 1, 2018 and has not applied the requirements to instruments that have already been
|
F-10
ARCELORMITTAL AND SUBSIDIARIES
Notes to Consolidated Financial Statements
(millions of U.S. dollars, except share and per share data)
derecognized at January 1, 2018. Comparative amounts in relation to instruments that have not been derecognized at January 1, 2018 have been recast where appropriate.
The classification, measurement and impairment requirements of IFRS 9 have been applied retrospectively while hedge accounting requirements have been applied prospectively. The adoption of IFRS 9 did not result in a material impact on the consolidated financial statements of the Company. Unrealized gains and losses from investments in equity instruments at FVOCI are no longer recycled to the consolidated statement of operations upon disposal. Furthermore, trade receivables subject to programs for sales without recourse (see note 4.3) have changed from loans and receivables measured at amortized cost to fair value through other comprehensive income. Additional required disclosures are presented in note 6. As permitted by the transition provisions of IFRS 9, the Company has not restated comparatives.
|
•
|
IFRS 15 “Revenue from Contracts with Customers” issued on May 28, 2014, which provides a unified five-step model for determining the timing, measurement and recognition of revenue. The focus of the new standard is to recognize revenue as performance obligations are met rather than based on the transfer of risks and rewards. IFRS 15 includes a comprehensive set of disclosure requirements including qualitative and quantitative information about contracts with customers to understand the nature, amount, timing and uncertainty of revenue. The standard supersedes IAS 18 “Revenue”, IAS 11 “Construction Contracts” and a number of revenue-related interpretations. On April 12, 2016, the IASB issued amendments to IFRS 15 which clarify how to identify a performance obligation, determine whether a company is a principal or an agent. The Company’s revenue is predominantly derived from the single performance obligation to transfer steel and mining products under arrangements in which the transfer of risks and rewards of ownership and the fulfillment of the Company’s performance obligation occur at the same time. As part of the adoption process, the Company established revised processes and controls and assessed its performance obligations underlying the revenue recognition, estimation of variable considerations including rebates, methods for estimating warranties, customized products and principal versus agent considerations. The adoption of this standard did not have a material impact on the consolidated financial statements of the Company. The additional required disclosures are presented in note 3.4 and 4.1.
|
On January 1, 2018, the Company adopted the following amendments which did not have any material impact on the consolidated financial statements of the Company:
|
•
|
Amendments to IFRS 2 “Share-based Payment” issued on June 20, 2016, which clarify the effects of vesting and non-vesting conditions on the measurement of cash-settled share-based payments; the treatment of share-based payment transactions with a net settlement feature for withholding tax obligations; and the treatment of a modification to the terms and conditions of a share-based payment that changes the classification of the transaction from cash-settled to equity-settled.
|
|
•
|
Amendments to IFRS 4 “Insurance Contracts” issued on September 12, 2016, which propose two approaches (an overlay approach and a deferral approach) in order to address temporary volatility in reported results arising from the timing difference between the implementation of IFRS 9 and IFRS 17 "Insurance Contracts" that will replace IFRS 4. These amendments to IFRS 4 supplement existing options in the standard that can already be used to address the temporary volatility.
|
|
•
|
|
On January 13, 2016, the IASB issued IFRS 16 “Leases” which will replace IAS 17 “Leases”. This new standard specifies how to recognize, measure, present and disclose leases. The standard provides a single lessee accounting model, requiring lessees to recognize assets and liabilities for all leases unless the lease term is 12 months or less or the underlying asset has a low value. This standard is effective for annual periods beginning on or after January 1, 2019, with early application permitted if IFRS 15 "Revenue from Contracts with Customers" has also been applied. At
December 31, 2018
and 2017, the Company has non-cancellable operating lease commitments on an undiscounted basis of
1,869
and
1,311
, respectively (see note 8.4). A review and assessment of the Company's lease arrangements indicates that most of these arrangements will meet the definition of a lease under IFRS 16. The Company will apply the modified retrospective transition approach with right-of-use
F-11
ARCELORMITTAL AND SUBSIDIARIES
Notes to Consolidated Financial Statements
(millions of U.S. dollars, except share and per share data)
assets measured at an amount equal to the lease liability recognized at January 1, 2019. In addition, it will apply the practical expedient to grandfather the definition of a lease on transition and accordingly apply IFRS 16 to all contracts entered into before January 1, 2019 and identified as leases in accordance with IAS 17 and IFRIC 4. Hence, the Company will recognize a right-of-use asset and corresponding liability in respect of the net present value of these leases unless they qualify for short-term leases or relate to low-value assets upon the application of IFRS 16.
As at December 31, 2018 the above mentioned operating lease commitments of
1,869
includes undiscounted amounts of
20
for short-term leases and
58
of leases of low-value assets that will remain being recognized on a straight-line basis as expenses in profit and loss. For the remaining undiscounted operating lease commitments of
1,791
(of which
29
relating to entities presented as held for sale)
, the Company expects to recognize on January 1, 2019 additional lease liabilities (discounted at the incremental borrowing rates at that date) and right-of-use assets for an amount of
1.1
billion
.
On May 18, 2017, the IASB issued IFRS 17 "Insurance Contracts", which is designed to achieve the goal of a consistent, principle-based accounting for insurance contracts. IFRS 17 requires insurance liabilities to be measured at a current fulfillment value and provides a more uniform measurement and presentation approach for all insurance contracts. IFRS 17 supersedes IFRS 4 "Insurance Contracts" and related interpretations and is effective for periods beginning on or after January 1, 2021, with earlier adoption permitted if both IFRS 15 "Revenue from Contracts with Customers" and IFRS 9 "Financial Instruments" have also been applied. The Company does not expect that the adoption of this interpretation will have a material impact to its consolidated financial statements.
On June 7, 2017, the IASB issued IFRIC 23 “Uncertainty over Income Tax Treatments”. This interpretation addresses the determination of taxable profit (tax loss), tax bases, unused tax losses, unused tax credits and tax rates when there is uncertainty over income tax treatments under IAS 12. This interpretation is effective for annual periods beginning on or after January 1, 2019, with early application permitted. The Company does not expect that the adoption of this interpretation will have a material impact to its consolidated financial statements.
On October 12, 2017, the IASB issued an amendment to IFRS 9 in respect of prepayment features with negative compensation, which amends the existing requirements in IFRS 9 regarding termination rights in order to allow measurement at amortized cost (or, depending on the business model, at fair value through other comprehensive income) even in the case of negative compensation payments. This amendment is effective for annual periods beginning on or after January 1, 2019, with early application permitted. The Company does not expect that the adoption of this interpretation will have a material impact to its consolidated financial statements.
Also, on October 12, 2017, the IASB issued an amendment to IAS 28 “Investments in Associates and Joint Ventures” in relation to long-term interests in associates and joint ventures. The amendment clarifies that an entity applies IFRS 9 to long-term interests in an associate or joint venture that form part of the net investment in the associate or joint venture but to which the equity method is not applied. This amendment is effective for annual periods beginning on or after January 1, 2019, with early application permitted. The Company does not expect that the adoption of this amendment will have a material impact to its consolidated financial statements.
On December 12, 2017 the IASB issued Annual Improvements 2015–2017 to make amendments to the following standards:
|
•
|
IFRS 3 "Business Combinations" clarifies that when an entity obtains control of a business that is a joint operation, it remeasures previously held interests in that business.
|
|
•
|
IFRS 11 "Joint Arrangements" clarifies that when an entity obtains joint control of a business that is a joint operation, the entity does not remeasure previously held interests in that business.
|
|
•
|
IAS 12 "Income Taxes" clarifies that an entity shall recognize the income tax consequences of dividends in profit or loss, other comprehensive income or equity according to where the entity originally recognized those past transactions or events.
|
|
•
|
IAS 23 "Borrowing Costs" clarifies that if any specific borrowing remains outstanding after the related asset is ready for its intended use or sale, that borrowing becomes part of the funds that an entity borrows generally when calculating the capitalization rate on general borrowings.
|
F-12
ARCELORMITTAL AND SUBSIDIARIES
Notes to Consolidated Financial Statements
(millions of U.S. dollars, except share and per share data)
These amendments are effective for annual periods beginning on or after January 1, 2019, with early application permitted. The Company does not expect that the adoption of these amendments will have a material impact to its consolidated financial statements.
On February 7, 2018, the IASB issued amendments to IAS 19 “Employee benefits” which clarify that current service cost and net interest after a remeasurement resulting from a plan amendment, curtailment or settlement should be determined using the assumptions applied for the remeasurement. In addition, the amendments clarify the effect of a plan amendment, curtailment or settlement on the requirements regarding the asset ceiling. These amendments are effective for annual periods beginning on or after January 1, 2019, with early application permitted. The Company does not expect that the adoption of these amendments will have a material impact to its consolidated financial statements.
On March 29, 2018, the IASB published its revised 'Conceptual Framework for Financial Reporting', which includes revised definitions of an asset and a liability as well as new guidance on measurement and derecognition, presentation and disclosure. The Company does not expect that the adoption of this amendment, which are effective for annual periods beginning on or after January 1, 2020, will have a material impact to its consolidated financial statements.
On October 22, 2018, the IASB issued amendments to IFRS 3 'Business Combinations', which includes the definition of a business aimed at resolving the difficulties that arise when an entity determines whether it has acquired a business or a group of assets. The Company does not expect that the adoption of these amendments, which are effective for annual periods beginning on or after January 1, 2020, will have a material impact to its consolidated financial statements.
On October 31, 2018, the IASB issued amendments to IAS 1 'Presentation of Financial Statements' and IAS 8 'Accounting Policies, Changes in Accounting Estimates and Errors' to clarify the definition of ‘material’ and to align the definition used in the Conceptual Framework and the standards themselves. The Company does not expect that the adoption of these amendments, which are effective for annual periods beginning on or after January 1, 2020, will have a material impact to its consolidated financial statements.
F-13
ARCELORMITTAL AND SUBSIDIARIES
Notes to Consolidated Financial Statements
(millions of U.S. dollars, except share and per share data)
The Company assesses the recoverability of its investments accounted for under the equity method whenever there is an indication of impairment. In determining the value in use of its investments, the Company estimates its share in the present value of the projected future cash flows expected to be generated by operations of associates and joint ventures. The amount of any impairment is included in income (loss) from investments in associates, joint ventures and other investments in the consolidated statements of operations (see also note 2.6).
While there are certain limitations on the Company’s operating and financial flexibility arising from the restrictive and financial covenants of the Company’s principal credit facilities described in note 6.1.2, there are no significant restrictions resulting from borrowing agreements or regulatory requirements on the ability of consolidated subsidiaries, associates and jointly controlled entities to transfer funds to the parent in the form of cash dividends to pay commitments as they come due.
F-14
ARCELORMITTAL AND SUBSIDIARIES
Notes to Consolidated Financial Statements
(millions of U.S. dollars, except share and per share data)
2.2.1 List of subsidiaries
|
Name of Subsidiary
|
Country
|
% of Ownership
|
|||
|
NAFTA
|
|||||
|
ArcelorMittal Dofasco G.P.
|
Canada
|
|
|||
|
ArcelorMittal México S.A. de C.V.
|
Mexico
|
|
|||
|
ArcelorMittal USA LLC
|
United States
|
|
|||
|
ArcelorMittal Long Products Canada G.P.
|
Canada
|
|
|||
|
Brazil and neighboring countries ("Brazil")
|
|||||
|
ArcelorMittal Brasil S.A.
|
Brazil
|
|
1
|
||
|
Acindar Industria Argentina de Aceros S.A.
|
Argentina
|
|
|||
|
Europe
|
|||||
|
ArcelorMittal Atlantique et Lorraine S.A.S.
|
France
|
|
|||
|
ArcelorMittal Belgium N.V.
|
Belgium
|
|
|||
|
ArcelorMittal España S.A.
|
Spain
|
|
|||
|
ArcelorMittal Flat Carbon Europe S.A.
|
Luxembourg
|
|
|||
|
ArcelorMittal Galati S.A.
|
Romania
|
|
2
|
||
|
ArcelorMittal Poland S.A.
|
Poland
|
|
|||
|
ArcelorMittal Eisenhüttenstadt GmbH
|
Germany
|
|
|||
|
ArcelorMittal Bremen GmbH
|
Germany
|
|
|||
|
ArcelorMittal Méditerranée S.A.S.
|
France
|
|
|||
|
ArcelorMittal Belval & Differdange S.A.
|
Luxembourg
|
|
|||
|
ArcelorMittal Hamburg GmbH
|
Germany
|
|
|||
|
ArcelorMittal Ostrava a.s.
|
Czech Republic
|
|
2
|
||
|
ArcelorMittal Duisburg GmbH
|
Germany
|
|
|||
|
ArcelorMittal International Luxembourg S.A.
|
Luxembourg
|
|
|||
|
ArcelorMittal Italia S.p.A.
|
Italy
|
|
3
|
||
|
Africa and Commonwealth of Independent States ("ACIS")
|
|||||
|
ArcelorMittal South Africa Ltd. ("AMSA")
|
South Africa
|
|
|
||
|
JSC ArcelorMittal Temirtau
|
Kazakhstan
|
|
|||
|
PJSC ArcelorMittal Kryvyi Rih ("AM Kryvyi Rih")
|
Ukraine
|
|
|||
|
Mining
|
|||||
|
ArcelorMittal Mining Canada G.P. and ArcelorMittal Infrastructure G.P.("AMMIC")
|
Canada
|
|
|||
|
ArcelorMittal Liberia Ltd
|
Liberia
|
|
|||
|
JSC ArcelorMittal Temirtau
|
Kazakhstan
|
|
|||
|
PJSC ArcelorMittal Kryvyi Rih
|
Ukraine
|
|
|||
|
1.
|
On April 1, 2018, ArcelorMittal Brasil issued preferred shares to Votorantim S.A. representing a
|
|
2.
|
ArcelorMittal Galati S.A. and ArcelorMittal Ostrava a.s. are classified held for sale as of December 31, 2018. See note 2.3.2.
|
|
3.
|
|
F-15
ARCELORMITTAL AND SUBSIDIARIES
Notes to Consolidated Financial Statements
(millions of U.S. dollars, except share and per share data)
Transactions in currencies other than the functional currency of a subsidiary are recorded at the rates of exchange prevailing at the date of the transaction. Monetary assets and liabilities in currencies other than the functional currency are remeasured at the rates of exchange prevailing on the date of the consolidated statements of financial position and the related translation gains and losses are reported within financing costs in the consolidated statements of operations. Non-monetary items that are carried at cost are translated using the rate of exchange prevailing at the date of the transaction. Non-monetary items that are carried at fair value are translated using the exchange rate prevailing when the fair value was determined and the related translation gains and losses are reported in the consolidated statements of comprehensive income.
As of July 1, 2018, Argentina has been considered a highly inflationary country and therefore the financial statements of the Company's long production facilities Acindar Industria Argentina de Aceros S.A. ("Acindar") in Argentina, using a historical cost approach, are adjusted prospectively to reflect the changes in the general purchasing power of the local currency before being translated into U.S. dollars at the year end exchange rate. The Company used an estimated general price index (Consumer Price Index "IPC") of
47.9
%
for the year ended December 31, 2018 for this purpose. As a result of the inflation-related adjustments on non-monetary items, a gain of
45
was recognized in net financing costs for the year ended December 31, 2018.
Since 2010 Venezuela has been considered a hyperinflationary economy and therefore the financial statements of Unicon are adjusted to reflect the changes in the general purchasing power of the local currency before being translated into U.S. dollars. The Company used estimated general price indices of
213,605
%
,
2,056
%
and
534
%
for the years ended
December 31, 2018
,
2017
and
2016
, respectively, for this purpose. As a result of the inflation-related adjustments on non-monetary items, losses of
6
,
31
and
8
were recognized in net financing costs for the years ended
December 31, 2018
,
2017
and
2016
, respectively.
Effective January 1, 2016, the Company applied the DICOM rate to translate its Venezuelan operations. As a result of this change, ArcelorMittal’s net equity in Unicon decreased from
628
to
43
at January 1, 2016. The DICOM rate was originally set at
206
bolivars per U.S. dollar on March 10, 2016, before falling to
674
bolivars per U.S. dollar at December 31, 2016. The DICOM rate continued to weaken during 2017 to
3,345
bolivars per U.S. dollar on August 31, 2017, when the Venezuelan government temporarily suspended the sale of U.S. dollars through its DICOM auction system. On February 5, 2018, the Venezuelan government reopened the auction at the new DICOM rate of
30,987
bolivars per euro (
25,000
bolivars per U.S. dollar).
On August 20, 2018, the Venezuelan government launched the new bolivar soberano currency, with one bolivar soberano worth
100,000
previous bolivars.
F-16
ARCELORMITTAL AND SUBSIDIARIES
Notes to Consolidated Financial Statements
(millions of U.S. dollars, except share and per share data)
The Company measures goodwill at the acquisition date as the total of the fair value of consideration transferred, plus the proportionate amount of any non-controlling interest, plus the fair value of any previously held equity interest in the acquiree, if any, less the net recognized amount (generally at fair value) of the identifiable assets acquired and liabilities assumed.
In a business combination in which the fair value of the identifiable net assets acquired exceeds the cost of the acquired business, the Company reassesses the fair value of the assets acquired and liabilities assumed. If, after reassessment, ArcelorMittal’s interest in the net fair value of the acquiree’s identifiable assets, liabilities and contingent liabilities exceeds the cost of the business combination, the excess (bargain purchase) is recognized immediately as a reduction of cost of sales in the consolidated statements of operations.
Ilva
On November 1, 2018, ArcelorMittal completed the acquisition of Ilva S.p.A. and certain of its subsidiaries ("Ilva") following the signature on June 28, 2017 of a lease agreement with an obligation to purchase between the Italian Government and AM InvestCo Italy S.r.l. ("AM InvestCo"), a consortium formed by ArcelorMittal and Intesa San Paolo S.p.A. ("ISP") with respective interests of
94.45
%
and
5.55
%
.
The completion of the acquisition followed ArcelorMittal's notification to the European Commission of AM InvestCo's proposed acquisition of Ilva on September 21, 2017 and the submission of commitments on October 19, 2017. The European Commission initiated a Phase II review of AM InvestCo’s proposed acquisition of Ilva on November 8, 2017 and approved the transaction on May 7, 2018 subject to the fulfillment of divestment commitments (see note 2.3.2) and the exit of Marcegaglia from AM InvestCo (Marcegaglia held initially a
15
%
interest in AM InvestCo) completed on November 9, 2018 (see note 10.5.2).
Ilva is Europe’s largest single steel site and only integrated steelmaker in Italy with its main production facility based in Taranto. Ilva also has significant steel finishing capacity in Taranto, Novi Ligure and Genova. As a result of the lease agreement, the assets and liabilities subject to the transaction are leased by subsidiaries of AM InvestCo, including ArcelorMittal Italia S.p.A., which combines the sites of Taranto, Novi Ligure and Genova. The nominal purchase price amounts to
€
1.8
billion
(
2.1
billion
) subject to certain adjustments including working capital adjustment, with annual leasing costs of
€
180
million
(
206
) to be paid in quarterly installments resulting in a present value of
1,540
at acquisition date. The total consideration includes a
54
liability corresponding to environmental capital expenditures already completed by Ilva and which will be refunded by ArcelorMittal to Ilva. In September 2018, Ilva's trade unions ratified a labour agreement following which ArcelorMittal committed to initially hire
10,700
workers based on their existing contractual terms of employment. In addition, between 2023 and 2025, the Company has committed to hire any workers who remain under Ilva’s extraordinary administration. Ilva’s business units are initially leased with rental payments qualifying as down payments against the purchase price and are part of the Europe reportable segment. The lease period is for a minimum of
four years
followed by a subsequent purchase obligation
. The Company accounted for this transaction as a business combination as it obtained control of the business subject to the lease.
ISP's interest is subject to put and call option arrangements exercisable by ArcelorMittal and ISP between November 1, 2020 and November 1, 2025 and between November 1, 2021 and November 1, 2025, respectively. The Company determined that it has a present ownership interest in the shares subject to the put option. Accordingly, it recognized at acquisition date a
122
financial liability measured at the present value of the redemption amount.
Following the recent closing of the transaction, the acquisition-date fair value of the identifiable assets and liabilities of Ilva has been determined on a provisional basis, in particular with respect to property, plant and equipment, environmental provisions, indemnification asset, tax implications and working capital balances at closing date. The Company expects to complete its accounting during the first half of 2019. ArcelorMittal recognized provisions of
517
in connection with environmental remediation obligations. As the latter will be funded with funds seized by the Italian Government from the former shareholder, the Company recognized an indemnification asset for the same amount, of which
365
classified as non-current assets. Current assets include trade receivables of
439
with gross contract amounts receivable of
503
and contractual cash flows not expected to be collected of
64
. Intangible assets include
201
relating to CO
2
emission rights held by Ilva at acquisition date (the Company also recognized liabilities of
158
relating to estimated emissions for the first 10 months of 2018) and favorable land lease contracts for
76
. ArcelorMittal recognized a
209
bargain purchase gain in cost of sales mainly as a
F-17
ARCELORMITTAL AND SUBSIDIARIES
Notes to Consolidated Financial Statements
(millions of U.S. dollars, except share and per share data)
result of the preliminary
€
0.4
billion
(
0.5
billion
) working capital reduction while the total fair value of net assets acquired remained substantially driven by the economic obsolescence applied to property, plant and equipment. Revenue and net loss of Ilva since acquisition date were
398
and
(
49
)
, respectively.
The Company recognized acquisition-related costs of
25
in selling, general and administrative expenses. The agreement includes industrial capital expenditure commitments of approximately
€
1.3
billion
(
1.4
billion
) over a
seven
-year period focused on blast furnaces, steel shops and finishing lines and environmental capital expenditure commitments of approximately
€
0.8
billion
(
0.9
billion
).
Votorantim
On April 1, 2018, ArcelorMittal completed the acquisition of Votorantim Siderurgia (subsequently renamed ArcelorMittal Sul Fluminense "AMSF"), Votorantim S.A.'s long steel business in Brazil pursuant to which Votorantim Siderurgia became a wholly-owned subsidiary of ArcelorMittal Brasil. The combination of ArcelorMittal Brasil's long steel business and AMSF
aims to create cost, logistical and operational synergies. The combined operations include ArcelorMittal Brasil’s production
sites at Monlevade, Juiz de Fora and Piracicaba, and AMSF’s production sites at Barra Mansa, Resende and its
50
%
interest in
the joint venture Sitrel in Três Lagoas. On February 7, 2018, the Brazilian antitrust authority CADE approved the transaction,
conditioned to the fulfillment of divestment commitments by ArcelorMittal Brasil (see note 2.3).
The acquisition was completed through the issuance of preferred shares to Votorantim S.A. representing a
2.99
%
interest in ArcelorMittal Brasil. Pursuant to the shareholders' agreement, such preferred shares are subject to put and call option arrangements exercisable by Votorantim S.A. and ArcelorMittal Brasil between July 1, 2019 and December 31, 2022 and between January 1, 2023 and December 31, 2024, respectively. The Company determined that it has a present ownership interest in the preferred shares subject to the put option. Accordingly, it recognized at acquisition date a
328
financial liability at amortized cost and measured at the present value of the redemption amount. Following the recent closing of the transaction, the acquisition-date fair value of the identifiable assets and liabilities of AMSF has been determined on a provisional basis as of December 31, 2018, in particular with respect to unfavorable contracts and contingent liabilities. Other non-current assets include an
83
indemnification asset towards Votorantim S.A. relating to contingent liabilities of
85
and an
82
investment in Sitrel. Other liabilities include unfavorable contracts for
293
and borrowings of
211
. Current assets include cash and receivables for
13
and
141
, respectively (including trade receivable of
92
with gross contractual amounts of
108
and contractual cash flows not expected to be collected of
16
). The Company expects to complete its accounting during the first quarter of 2019. Revenue and net loss of AMSF since acquisition date were
285
and
(
108
)
, respectively. The Company recognized acquisition-related costs of
8
in selling, general and administrative expenses.
Revenue and net income attributable to the equity holders of the parent of the Company for the year ended December 31, 2018 were
79,192
and
4,801
respectively, as though the acquisition date for Ilva and Votorantim had been as of January 1, 2018.
Other
On December 21, 2017, the Company acquired from Alcatel Lucent the reinsurance company Electro-Re S.A. for total consideration of
€
246
million
(
290
; cash inflow was
35
net of cash acquired of
325
).
On June 21, 2017, as a result of the extension of the partnership between ArcelorMittal and Bekaert Group ("Bekaert") in the steel cord business in Brazil, the Company completed the acquisition from Bekaert of a
55.5
%
controlling interest in Bekaert Sumaré Ltda. subsequently renamed ArcelorMittal Bekaert Sumaré Ltda. ("Sumaré"), which subsequently merged into Belgo-Mineira Bekaert Artefatos de Arames Ltda. a manufacturer of metal ropes for automotive tires located in the municipality of Sumaré/SP, Brazil. The Company agreed to pay total cash consideration of
€
56
million
(
63
;
49
,
net of cash acquired of
14
) of which
€
52
million
(
58
) settled on closing date and
€
4
million
(
5
) to be paid subsequently upon conclusion of certain business restructuring measures by Bekaert. Sumaré is part of the Brazil reportable segment.
On May 18, 2017, the Company acquired from Crédit Agricole Assurances the reinsurance company Crédit Agricole Reinsurance S.A. for consideration of
€
186
million
(
208
; cash inflow was
20
, net of cash acquired of
228
).
On January 18, 2017, the Company acquired from Parfinada B.V. the reinsurance company Artzare S.A. for total consideration of €
43
million
(
45
; cash inflow was
5
, net of cash acquired of
50
)
. The reinsurance company is incorporated in Luxembourg and operates through a series of reinsurance agreements with the Company’s subsidiaries.
F-18
ARCELORMITTAL AND SUBSIDIARIES
Notes to Consolidated Financial Statements
(millions of U.S. dollars, except share and per share data)
On December 21, 2016, ArcelorMittal acquired from Skanska Financial Services AB the reinsurance company SCEM Reinsurance S.A. (“SCEM”) for total consideration of
€
54
million
(
56
; cash inflow was
7
, net of cash acquired of
63
).
The Company concluded that the acquisitions of Electro-Re S.A., SCEM, Artzare S.A. and Crédit Agricole Reinsurance S.A. were not business combinations mainly as the transactions did not include the acquisition of any strategic management processes, operational processes and resource management processes.
|
2018
|
2017
|
|||||||
|
AMSF
|
Ilva
|
Sumaré
|
||||||
|
Current assets
|
|
|
|
|
|
|
||
|
Property, plant and equipment
|
|
|
|
|
|
|
||
|
Intangible assets
|
|
|
|
|
|
|
||
|
Other non-current assets
|
|
|
|
|
|
|
||
|
Total assets acquired
|
|
|
|
|
|
|
||
|
Deferred tax liabilities
|
(
|
)
|
|
|
(
|
)
|
||
|
Other liabilities
|
(
|
)
|
(
|
)
|
(
|
)
|
||
|
Total liabilities acquired
|
(
|
)
|
(
|
)
|
(
|
)
|
||
|
Net assets acquired
|
|
|
|
|
|
|
||
|
Non-controlling interests
|
|
|
|
|
(
|
)
|
||
|
Consideration paid, net
|
|
|
|
|
|
|
||
|
Consideration payable
|
|
|
|
|
|
|
||
|
Goodwill/(bargain purchase gain)
|
|
|
(
|
)
|
|
|
||
Divestments in 2018
On February 28, 2018, ArcelorMittal completed the sale of Go Steel Frýdek Místek ("Frýdek Místek"), for consideration of
49
(net of cash disposed of
1
) of which
10
remained outstanding at December 31, 2018. Frýdek Místek was part of the Europe segment. The fair value measurement was determined using the contract price, a Level 3 unobservable input.
On February 7, 2018, the Brazilian Antitrust Authority (CADE) approved the acquisition of Votorantim subject to divestment commitments (see note 2.2.4). Accordingly, in May 2018, ArcelorMittal Brasil disposed of its two production sites Cariacica and Itaúna as well as some wire drawing equipment in Brazil (the “Votorantim remedies”), which were part of the Brazil reportable segment. Prior to the disposal, the Company recorded an impairment charge in cost of sales of
86
to adjust the carrying amount of the disposal group to the sale proceeds of
84
(net of cash disposed of
1
) of which
58
remained outstanding
F-19
ARCELORMITTAL AND SUBSIDIARIES
Notes to Consolidated Financial Statements
(millions of U.S. dollars, except share and per share data)
as of December 31, 2018. The fair value measurement of these Votorantim remedies was determined using the contract price, a Level 3 unobservable input.
Divestments in 2017
On December 15, 2017, ArcelorMittal completed the sale of its
100
%
shareholding in ArcelorMittal Georgetown Inc. ("Georgetown"), a wire rod mill in Georgetown in the United States for total cash consideration of
19
and the result on disposal was
18
. The fair value measurement of Georgetown, which was part of the NAFTA reportable segment, was determined using the contract price, a Level 3 unobservable input.
On March 13, 2017, ArcelorMittal and the management of ArcelorMittal Tailored Blanks Americas (“AMTBA”), comprising the Company’s tailored blanks operations in Canada, Mexico and the United States, entered into a joint venture agreement following which the Company recognized an investment of
65
in AMTBA accounted for under the equity method. AMTBA was part of the NAFTA reportable segment and was classified as held for sale at December 31, 2016.
On February 10, 2017, ArcelorMittal completed the sale of certain ArcelorMittal Downstream Solutions entities in the Europe segment following its commitment to sell such operations in December 2015. The Company recorded an impairment charge of
18
in cost of sales in 2015. The assets and liabilities subject to the sale were classified as held for sale at December 31, 2016. The fair value measurement of these operations, which were part of the Europe reportable segment, was determined using the contract price, a Level 3 unobservable input.
Divestments in 2016
On September 30, 2016, ArcelorMittal completed the sale of its wholly owned subsidiary ArcelorMittal Zaragoza in Spain to Megasa Siderúrgica S.L. for total consideration of €
80
million
(
89
). Prior to the disposal, the Company recorded an impairment charge of
49
(of which
2
related to allocated goodwill) in cost of sales to write the net carrying amount down to the net proceeds from the sale. The fair value measurement of ArcelorMittal Zaragoza was determined using the contract price, a Level 3 unobservable input. ArcelorMittal Zaragoza was part of the Europe reportable segment.
On August 7, 2016, ArcelorMittal completed the sale of the Company’s
49
%
interest in its associates ArcelorMittal Algérie and ArcelorMittal Tebessa and its
70
%
interest in its subsidiary ArcelorMittal Pipes and Tubes Algeria, which was announced on October 7, 2015 as part of an outline agreement for restructuring the shareholding of its Algerian activities. As part of the agreement, ArcelorMittal transferred such interests to IMETAL, an Algerian state-owned entity. ArcelorMittal Pipes and Tubes Algeria and ArcelorMittal Algérie were part of the ACIS reportable segment while ArcelorMittal Tebessa was part of the Mining reportable segment.
On April 4, 2016, ArcelorMittal completed the sale of the LaPlace and Vinton Long Carbon facilities in the United States. The total consideration was
96
and the result on disposal was
nil
. In 2015, the Company recorded an impairment charge of
231
(of which
13
relating to allocated goodwill) in cost of sales to write the carrying amount of the LaPlace, Steelton and Vinton facilities down to the expected net proceeds from the sale. The fair value measurement of the Long Carbon facilities in the United States was determined using the contract price, a Level 3 unobservable input. These facilities were part of the NAFTA reportable segment. The assets and liabilities of the Steelton facility remained classified as held for sale at December 31, 2017 and 2016 (see note 2.3.2).
F-20
ARCELORMITTAL AND SUBSIDIARIES
Notes to Consolidated Financial Statements
(millions of U.S. dollars, except share and per share data)
|
2018
|
2017
|
2016
|
|||||||||||||||||||||
|
Frýdek M
í
stek
|
Votorantim remedies
|
AMTBA
|
Downstream Solutions Europe
|
Georgetown
|
ArcelorMittal Zaragoza
|
ArcelorMittal Tubular Products Algeria
|
LaPlace and Vinton
Long Carbon facilities |
||||||||||||||||
|
Cash and cash equivalents
|
|
|
|
|
|
|
|
|
|
|
|
|
|
|
|
|
|||||||
|
Other current assets
|
|
|
|
|
|
|
|
|
|
|
|
|
|
|
|
|
|||||||
|
Property, plant and equipment
|
|
|
|
|
|
|
|
|
|
|
|
|
|
|
|
|
|||||||
|
Other assets
|
|
|
|
|
|
|
|
|
|
|
|
|
|
|
|
|
|||||||
|
Total assets
|
|
|
|
|
|
|
|
|
|
|
|
|
|
|
|
|
|||||||
|
Current liabilities
|
|
|
|
|
|
|
|
|
|
|
|
|
|
|
|
|
|||||||
|
Other long-term liabilities
|
|
|
|
|
|
|
|
|
|
|
|
|
|
|
|
|
|||||||
|
Total liabilities
|
|
|
|
|
|
|
|
|
|
|
|
|
|
|
|
|
|||||||
|
Total net assets/(liabilities)
|
|
|
|
|
|
|
|
|
|
|
|
|
(
|
)
|
|
|
|||||||
|
% of net assets sold
|
|
%
|
|
%
|
|
%
|
|
%
|
|
%
|
|
%
|
|
%
|
|
%
|
|||||||
|
Total net assets/(liabilities) disposed of
|
|
|
|
|
|
|
|
|
|
|
|
|
(
|
)
|
|
|
|||||||
|
Cash consideration
|
|
|
|
|
|
|
|
|
|
|
|
|
|
|
|
|
|||||||
|
Consideration receivable
|
|
|
|
|
|
|
|
|
|
|
|
|
|
|
|
|
|||||||
|
Reclassification of foreign exchange translation difference
|
|
|
|
|
|
|
|
|
|
|
|
|
|
|
|
|
|||||||
|
Gain on disposal
|
|
|
|
|
|
|
|
|
|
|
|
|
|
|
|
|
|||||||
On May 7, 2018, the European Commission approved the acquisition of Ilva (see note 2.2.4). As part of the approval, ArcelorMittal agreed to divest certain of its European assets (“Ilva remedies”) which are part of the Europe reportable segment.
The Ilva remedies are comprised of the following three divestment packages.
The Dudelange and Liège divestment package is composed of ArcelorMittal Dudelange and certain finishing facilities including the hot dipped galvanizing lines 4 and 5 in Flémalle, hot-rolled pickling, cold rolling and tin packaging lines in Tilleur of ArcelorMittal Liège in Belgium.
The Galati divestment package is mainly composed of the integrated steel making site of ArcelorMittal Galati S.A., ArcelorMittal Tubular Products Galati SRL, both in Romania, ArcelorMittal Skopje AD in North Macedonia and ArcelorMittal Piombino S.p.A. in Italy, the Company’s only galvanizing steel plant in Italy.
The Ostrava divestment package is mainly composed of the integrated steel making site of ArcelorMittal Ostrava a.s. and its subsidiaries, ArcelorMittal Tubular Products Ostrava a.s.
On October 12, 2018 and November 2, 2018, ArcelorMittal received
two
binding offers from Liberty House Group ("Liberty") for the acquisition of the combined Ostrava and Galati divestment package and the Dudelange and Liège divestment package, respectively. The European Commission is currently reviewing revised offers from Liberty submitted by the Company on January 23, 2019.
Transaction closing is conditional on EU approval and the conclusion of information consultations with local and European Works Councils.
At December 31, 2018, the carrying amount of assets and liabilities subject to the Ilva remedies was classified as held for sale. Based on the offers received, the Company recorded an impairment charge (see note 5.3) in cost of sales of
888
to adjust the carrying amount of the disposal group to the expected sale proceeds. The fair value measurement was determined using the selling price, a Level 3 unobservable input. The Company expects to complete the disposal of the divestment packages during the first half of 2019.
F-21
ARCELORMITTAL AND SUBSIDIARIES
Notes to Consolidated Financial Statements
(millions of U.S. dollars, except share and per share data)
In addition, the assets and liabilities of the Steelton facility in the United States remained classified as held for sale at December 31, 2018 (see note 2.3.1).
The details for the entities classified as held for sale as at December 31, 2017, which have been disposed during 2018 are disclosed in note 2.3.1.
|
December 31, 2018
|
|||||||||
|
Ilva remedies
|
Steelton
|
Total
|
|||||||
|
Current Assets:
|
|||||||||
|
Cash and cash equivalents
|
|
|
|
|
|
|
|||
|
Trade accounts receivable, prepaid expenses and other current assets
|
|
|
|
|
|
|
|||
|
Inventories
|
|
|
|
|
|
|
|||
|
Total Current Assets
|
|
|
|
|
|
|
|||
|
Non-current Assets:
|
—
|
|
|||||||
|
Property, plant and equipment
|
|
|
|
|
|
|
|||
|
Other assets
|
|
|
|
|
|
|
|||
|
Total Non-current Assets
|
|
|
|
|
|
|
|||
|
Total Assets
|
|
|
|
|
|
|
|||
|
|
|||||||||
|
Current Liabilities:
|
|
||||||||
|
Trade accounts payables, accrued expenses and other liabilities
|
|
|
|
|
|
|
|||
|
Total Current Liabilities
|
|
|
|
|
|
|
|||
|
Non-current Liabilities:
|
|
||||||||
|
Long-term debt
|
|
|
|
|
|
|
|||
|
Other long-term liabilities
|
|
|
|
|
|
|
|||
|
Total Non-current Liabilities
|
|
|
|
|
|
|
|||
|
Total Liabilities
|
|
|
|
|
|
|
|||
F-22
ARCELORMITTAL AND SUBSIDIARIES
Notes to Consolidated Financial Statements
(millions of U.S. dollars, except share and per share data)
The tables below provide details of the assets and liabilities held for sale after elimination of intra-group balances in the consolidated statements of financial position:
|
December 31, 2017
|
||||||||
|
Fr
ý
dek Místek
|
Steelton
|
Total
|
||||||
|
ASSETS
|
||||||||
|
Current assets:
|
||||||||
|
Trade accounts receivable and other
|
|
|
|
|
|
|
||
|
Inventories
|
|
|
|
|
|
|
||
|
Total current assets
|
|
|
|
|
|
|
||
|
Non-current assets:
|
||||||||
|
Property, plant and equipment
|
|
|
|
|
|
|
||
|
Total non-current assets
|
|
|
|
|
|
|
||
|
Total assets
|
|
|
|
|
|
|
||
|
LIABILITIES
|
||||||||
|
Current liabilities:
|
||||||||
|
Trade accounts payable and other
|
|
|
|
|
|
|
||
|
Accrued expenses and other liabilities
|
|
|
|
|
|
|
||
|
Total current liabilities
|
|
|
|
|
|
|
||
|
Non-current liabilities:
|
||||||||
|
Long-term provisions
|
|
|
|
|
|
|
||
|
Total non-current liabilities
|
|
|
|
|
|
|
||
|
Total liabilities
|
|
|
|
|
|
|
||
|
December 31,
|
|||||
|
Category
|
2018
|
2017
|
|||
|
Joint ventures
|
|
|
|
|
|
|
Associates
|
|
|
|
|
|
|
Individually immaterial joint ventures and associates
1
|
|
|
|
|
|
|
Total
|
|
|
|
|
|
|
1.
|
|
F-23
ARCELORMITTAL AND SUBSIDIARIES
Notes to Consolidated Financial Statements
(millions of U.S. dollars, except share and per share data)
|
December 31, 2018
|
|||||||||||||||
|
Joint Ventures
|
Calvert
|
VAMA
|
Tameh
|
Borçelik
|
Total
|
||||||||||
|
Place of incorporation and operation
1
|
United States
|
China
|
Poland
|
Turkey
|
|||||||||||
|
Principal Activity
|
Automotive steel finishing
|
Automotive steel finishing
|
Energy production and supply
|
Manufacturing and sale of steel
2,3,4
|
|||||||||||
|
Ownership and voting rights at December 31, 2018
|
|
|
|
|
|||||||||||
|
Current assets
|
|
|
|
|
|
|
|
|
|
|
|||||
|
of which cash and cash equivalents
|
|
|
|
|
|
|
|
|
|
|
|||||
|
Non-current assets
|
|
|
|
|
|
|
|
|
|
|
|||||
|
Current liabilities
|
|
|
|
|
|
|
|
|
|
|
|||||
|
of which trade and other payables and provisions
|
|
|
|
|
|
|
|
|
|
|
|||||
|
Non-current liabilities
|
|
|
|
|
|
|
|
|
|
|
|||||
|
of which trade and other payables and provisions
|
|
|
|
|
|
|
|
|
|
|
|||||
|
Net assets
|
|
|
|
|
|
|
|
|
|
|
|||||
|
Company's share of net assets
|
|
|
|
|
|
|
|
|
|
|
|||||
|
Adjustments for differences in accounting policies and other
|
|
|
|
|
|
|
(
|
)
|
(
|
)
|
|||||
|
Carrying amount in the statements of financial position
|
|
|
|
|
|
|
|
|
|
|
|||||
|
Revenue
|
|
|
|
|
|
|
|
|
|
|
|||||
|
Depreciation and amortization
|
(
|
)
|
(
|
)
|
(
|
)
|
(
|
)
|
(
|
)
|
|||||
|
Interest income
|
|
|
|
|
|
|
|
|
|
|
|||||
|
Interest expense
|
(
|
)
|
(
|
)
|
(
|
)
|
(
|
)
|
(
|
)
|
|||||
|
Income tax benefit (expense)
|
|
|
(
|
)
|
(
|
)
|
(
|
)
|
(
|
)
|
|||||
|
Profit or loss from continuing operations
|
|
|
|
|
|
|
|
|
|
|
|||||
|
Other comprehensive income (loss)
|
|
|
|
|
|
|
|
|
|
|
|||||
|
Total comprehensive income (loss)
|
|
|
|
|
|
|
|
|
|
|
|||||
|
Cash dividends received by the Company
|
|
|
|
|
|
|
|
|
|
|
|||||
|
1.
|
The country of incorporation corresponds to the country of operation except for Tameh whose country of operation is also the Czech Republic.
|
|
2.
|
Ownership interest in Borçelik was
|
|
3.
|
The non-current liabilities include
|
|
4.
|
Adjustment in Borçelik relates primarily to differences in accounting policies regarding revaluation of fixed assets.
|
F-24
ARCELORMITTAL AND SUBSIDIARIES
Notes to Consolidated Financial Statements
(millions of U.S. dollars, except share and per share data)
|
December 31, 2017
|
||||||||||||||||||
|
Joint Ventures
|
Calvert
|
Macsteel
|
VAMA
|
Tameh
|
Borçelik
|
Total
|
||||||||||||
|
Place of incorporation and operation
1
|
United States
|
Netherlands
|
China
|
Poland
|
Turkey
|
|||||||||||||
|
Principal Activity
|
Automotive steel finishing
|
Steel trading and shipping
|
Automotive steel finishing
|
Energy production and supply
|
Manufacturing and sale of steel
2, 3
|
|||||||||||||
|
Ownership and voting rights at December 31, 2017
|
|
|
|
|
|
|||||||||||||
|
Current assets
|
|
|
|
|
|
|
|
|
|
|
|
|
||||||
|
of which cash and cash equivalents
|
|
|
|
|
|
|
|
|
|
|
|
|
||||||
|
Non-current assets
|
|
|
|
|
|
|
|
|
|
|
|
|
||||||
|
Current liabilities
|
|
|
|
|
|
|
|
|
|
|
|
|
||||||
|
of which trade and other payables and provisions
|
|
|
|
|
|
|
|
|
|
|
|
|
||||||
|
Non-current liabilities
|
|
|
|
|
|
|
|
|
|
|
|
|
||||||
|
of which trade and other payables and provisions
|
|
|
|
|
|
|
|
|
|
|
|
|
||||||
|
Net assets
|
|
|
|
|
|
|
|
|
|
|
|
|
||||||
|
Company's share of net assets
|
|
|
|
|
|
|
|
|
|
|
|
|
||||||
|
Adjustments for differences in accounting policies and other
|
|
|
(
|
)
|
|
|
|
|
(
|
)
|
(
|
)
|
||||||
|
Carrying amount in the statements of financial position
|
|
|
|
|
|
|
|
|
|
|
|
|
||||||
|
Revenue
|
|
|
|
|
|
|
|
|
|
|
|
|
||||||
|
Depreciation and amortization
|
(
|
)
|
(
|
)
|
(
|
)
|
(
|
)
|
(
|
)
|
(
|
)
|
||||||
|
Interest income
|
|
|
|
|
|
|
|
|
|
|
|
|
||||||
|
Interest expense
|
(
|
)
|
(
|
)
|
(
|
)
|
|
|
(
|
)
|
(
|
)
|
||||||
|
Income tax benefit (expense)
|
|
|
(
|
)
|
|
|
(
|
)
|
(
|
)
|
(
|
)
|
||||||
|
Profit or loss from continuing operations
|
|
|
|
|
|
|
|
|
|
|
|
|
||||||
|
Other comprehensive income (loss)
|
|
|
|
|
|
|
(
|
)
|
(
|
)
|
|
|
||||||
|
Total comprehensive income (loss)
|
|
|
|
|
|
|
|
|
|
|
|
|
||||||
|
Cash dividends received by the Company
|
|
|
|
|
|
|
|
|
|
|
|
|
||||||
|
1.
|
The country of incorporation corresponds to the country of operation except for Tameh whose country of operation is also the Czech Republic and Macsteel whose countries of operation are mainly the United States, the United Arab Emirates and China.
|
|
2.
|
The non-current liabilities include
|
|
3.
|
Adjustment in Borçelik relates primarily to differences in accounting policies regarding revaluation of fixed assets.
|
F-25
ARCELORMITTAL AND SUBSIDIARIES
Notes to Consolidated Financial Statements
(millions of U.S. dollars, except share and per share data)
|
|
December 31, 2016
|
|||||||||||||||||||
|
Joint Ventures
|
Calvert
|
Macsteel
|
Baffinland
|
VAMA
|
Tameh
|
Borçelik
|
Total
|
|||||||||||||
|
Place of incorporation and operation
1
|
United States
|
Netherlands
|
Canada
|
China
|
Poland
|
Turkey
|
||||||||||||||
|
Principal Activity
|
Automotive steel finishing
|
Steel trading and shipping
|
Extraction of iron ore
2
|
Automotive steel finishing
|
Energy production and supply
|
Manufacturing and sale of steel
|
||||||||||||||
|
Ownership and voting rights at December 31, 2016
|
|
|
|
|
|
|
||||||||||||||
|
Revenue
|
|
|
|
|
|
|
|
|
|
|
|
|
|
|||||||
|
Depreciation and amortization
|
(
|
|
(
|
|
(
|
|
(
|
|
(
|
|
(
|
|
(
|
|||||||
|
Interest income
|
|
|
|
|
|
|
|
|
|
|
|
|
|
|||||||
|
Interest expense
|
(
|
|
(
|
|
(
|
|
(
|
|
(
|
|
(
|
|
(
|
|||||||
|
Income tax benefit (expense)
|
|
|
(
|
|
(
|
|
|
|
(
|
|
(
|
|
(
|
|||||||
|
Profit or loss from continuing operations
|
|
|
|
|
(
|
|
(
|
|
|
|
|
|
|
|||||||
|
Other comprehensive income (loss)
|
|
|
|
|
|
|
|
|
|
|
|
|
|
|||||||
|
Total comprehensive income (loss)
|
|
|
|
|
(
|
|
(
|
|
|
|
|
|
|
|||||||
|
Cash dividends received by the Company
|
|
|
|
|
|
|
|
|
|
|
|
|
|
|||||||
|
1.
|
The country of incorporation corresponds to the country of operation except for Tameh whose country of operation is also the Czech Republic and Macsteel whose countries of operation are mainly the United States, the United Arab Emirates and China.
|
|
2.
|
During 2017, ArcelorMittal lost joint control but maintained significant influence over Baffinland and as such the investment was reclassified to an associate (refer to note 2.4.2)
|
Macsteel
On May 28, 2018, ArcelorMittal announced the sale of its
50
%
shareholding in Macsteel International Holdings B.V. (“Macsteel”), a joint venture between Macsteel Holdings Luxembourg S.à r.l. and ArcelorMittal South Africa, which provided the Company with an international network of traders and trading channels including the shipping of steel. The Company recorded a
132
impairment to adjust the carrying amount of the investment to the expected sale proceeds partially offset by a
142
gain following the recycling upon closing of the sale on October 31, 2018 of accumulated foreign exchange translation gains from other comprehensive income to income (loss) from investments in associates, joint ventures and other investments. The fair value measurement was determined using the contract price, a Level 3 unobservable input.
VAMA
Valin ArcelorMittal Automotive Steel (“VAMA”) is a joint venture between ArcelorMittal and Hunan Valin which produces steel for high-end applications in the automobile industry. VAMA supplies international automakers and first-tier suppliers as well as Chinese car manufacturers and their supplier networks.
Calvert
AM/NS Calvert ("Calvert"), a joint venture between the Company and Nippon Steel & Sumitomo Metal Corporation ("NSSMC"), is a steel processing plant in Calvert, Alabama, United States. Calvert had a
6
-year agreement to purchase
2
million tonnes of slabs annually from ThyssenKrupp Steel USA ("TK CSA"), an integrated steel mill complex located in Rio de Janeiro, Brazil, using a market-based price formula. TK CSA had an option to extend the agreement for an additional
3
years
on terms that are more favorable to the joint venture, as compared with the initial
6
-year period. In December 2017 and in connection with the acquisition of TK CSA by Ternium S.A., the agreement was amended to (i) extend the term of the agreement to December 31, 2020, (ii) make a corresponding reduction in the annual slab purchase obligation so that the aggregate slab purchase obligation over the full term of the agreement remained the same and (iii) eliminate TK CSA’s extension option. The remaining slabs for Calvert's operations are sourced from ArcelorMittal plants in the United States, Brazil and Mexico. ArcelorMittal is principally responsible for marketing the product on behalf of the joint venture. Calvert serves the automotive, construction, pipe and tube, service center, and appliance/ HVAC industries.
F-26
ARCELORMITTAL AND SUBSIDIARIES
Notes to Consolidated Financial Statements
(millions of U.S. dollars, except share and per share data)
Tameh
Tameh is a joint venture between ArcelorMittal and Tauron Group including four energy production facilities located in Poland and the Czech Republic. Tameh’s objective is to ensure energy supply to the Company’s steel plants in these countries as well as the utilization of steel plant gases for energy production processes.
Borçelik
|
December 31, 2018
|
|||||||||||||||
|
Associates
|
China Oriental
|
DHS Group
|
Gonvarri Steel Industries
|
Baffinland
|
Total
|
||||||||||
|
Financial statements reporting date
|
June 30, 2018
|
September 30, 2018
|
September 30, 2018
|
December 31, 2018
|
|||||||||||
|
Place of incorporation and operation
1
|
Bermuda
|
Germany
|
Spain
|
Canada
|
|||||||||||
|
Principal Activity
|
Iron and steel manufacturing
|
Steel manufacturing
3
|
Steel manufacturing
4
|
Extraction of iron ore
5
|
|||||||||||
|
Ownership and voting rights at December 31, 2018
|
|
|
|
|
|||||||||||
|
Current assets
|
|
|
|
|
|
|
|
|
|
|
|||||
|
Non-current assets
|
|
|
|
|
|
|
|
|
|
|
|||||
|
Current liabilities
|
|
|
|
|
|
|
|
|
|
|
|||||
|
Non-current liabilities
|
|
|
|
|
|
|
|
|
|
|
|||||
|
Non-controlling interests
|
|
|
|
|
|
|
|
|
|
|
|||||
|
Net assets attributable to equity holders of the parent
|
|
|
|
|
|
|
|
|
|
|
|||||
|
Company's share of net assets
|
|
|
|
|
|
|
|
|
|
|
|||||
|
Adjustments for differences in accounting policies and other
|
|
|
|
|
(
|
)
|
|
|
(
|
)
|
|||||
|
Other adjustments
2
|
|
|
(
|
)
|
(
|
)
|
|
|
|
|
|||||
|
Carrying amount in the statements of financial position
|
|
|
|
|
|
|
|
|
|
|
|||||
|
Revenue
|
|
|
|
|
|
|
|
|
|
|
|||||
|
Profit or loss from continuing operations
|
|
|
|
|
|
|
(
|
)
|
|
|
|||||
|
Other comprehensive income (loss)
|
|
|
|
|
(
|
)
|
|
|
(
|
)
|
|||||
|
Total comprehensive income (loss)
|
|
|
|
|
|
|
(
|
)
|
|
|
|||||
|
Cash dividends received by the Company
|
|
|
|
|
|
|
|
|
|
|
|||||
|
1.
|
The country of incorporation corresponds to the country of operation except for China Oriental whose country of operation is China.
|
|
2.
|
Other adjustments correspond to the difference between the carrying amount at
December 31, 2018
and the net assets situation corresponding to the latest financial statements ArcelorMittal is permitted to disclose as of the reporting dates described in the table above.
|
|
3.
|
The amount for DHS Group includes an adjustment to align the German GAAP financial information with the Company’s accounting policies and is mainly linked to property, plant and equipment, inventory and pension.
|
|
4.
|
Adjustments in Gonvarri Steel Industries primarily relate to differences in accounting policies regarding revaluation of fixed assets.
|
|
5.
|
Adjustments in Baffinland primarily relate to differences in accounting policies regarding revaluation of fixed assets and locally recognized goodwill.
|
F-27
ARCELORMITTAL AND SUBSIDIARIES
Notes to Consolidated Financial Statements
(millions of U.S. dollars, except share and per share data)
|
|
December 31, 2017
|
||||||||||||||
|
Associates
|
China Oriental
|
DHS Group
|
Gonvarri Steel Industries
|
Baffinland
|
Total
|
||||||||||
|
Financial statements reporting date
|
June 30, 2017
|
September 30, 2017
|
September 30, 2017
|
December 31, 2017
|
|||||||||||
|
Place of incorporation and operation
1
|
Bermuda
|
Germany
|
Spain
|
Canada
|
|||||||||||
|
Principal Activity
|
Iron and steel manufacturing
|
Steel manufacturing
3
|
Steel manufacturing
4
|
Extraction of iron ore
5
|
|||||||||||
|
Ownership and voting rights at December 31, 2017
|
|
|
|
|
|||||||||||
|
Current assets
|
|
|
|
|
|
|
|
|
|
|
|||||
|
Non-current assets
|
|
|
|
|
|
|
|
|
|
|
|||||
|
Current liabilities
|
|
|
|
|
|
|
|
|
|
|
|||||
|
Non-current liabilities
|
|
|
|
|
|
|
|
|
|
|
|||||
|
Non-controlling interests
|
|
|
|
|
|
|
|
|
|
|
|||||
|
Net assets attributable to equity holders of the parent
|
|
|
|
|
|
|
|
|
|
|
|||||
|
Company's share of net assets
|
|
|
|
|
|
|
|
|
|
|
|||||
|
Adjustments for differences in accounting policies and other
|
|
|
|
|
(
|
)
|
|
|
|
|
|||||
|
Other adjustments
2
|
|
|
|
|
(
|
)
|
|
|
|
|
|||||
|
Carrying amount in the statements of financial position
|
|
|
|
|
|
|
|
|
|
|
|||||
|
Revenue
|
|
|
|
|
|
|
|
|
|
|
|||||
|
Profit or loss from continuing operations
|
|
|
(
|
)
|
|
|
(
|
)
|
|
|
|||||
|
Other comprehensive income (loss)
|
(
|
)
|
(
|
)
|
(
|
)
|
|
|
(
|
)
|
|||||
|
Total comprehensive income (loss)
|
|
|
(
|
)
|
|
|
(
|
)
|
|
|
|||||
|
Cash dividends received by the Company
|
|
|
|
|
|
|
|
|
|
|
|||||
|
1.
|
The country of incorporation corresponds to the country of operation except for China Oriental whose country of operation is China.
|
|
2.
|
Other adjustments correspond to the difference between the carrying amount at
December 31, 2017
and the net assets situation corresponding to the latest financial statements ArcelorMittal is permitted to disclose.
|
|
3.
|
The amount for DHS Group includes an adjustment to align the German GAAP financial information with the Company’s accounting policies, and is mainly linked to property, plant and equipment, inventory and pension.
|
|
4.
|
Adjustments in Gonvarri Steel Industries primarily relate to differences in accounting policies regarding revaluation of fixed assets.
|
|
5.
|
Adjustments in Baffinland primarily relate to differences in accounting policies regarding revaluation of fixed assets and locally recognized goodwill.
|
|
December 31, 2016
|
||||||||||||
|
Associates
|
China Oriental
|
DHS Group
|
Gonvarri Steel Industries
|
Total
|
||||||||
|
Financial statements reporting date
|
June 30, 2016
|
September 30, 2016
|
September 30, 2016
|
|
||||||||
|
Place of incorporation and operation
1
|
Bermuda
|
Germany
|
Spain
|
|
||||||||
|
Principal Activity
|
Iron and steel manufacturing
|
Steel manufacturing
|
Steel manufacturing
|
|
||||||||
|
Ownership and voting rights at December 31, 2016
|
|
|
|
|||||||||
|
Revenue
|
|
|
|
|
|
|
|
|
||||
|
Profit or loss from continuing operations
|
|
|
(
|
)
|
|
|
|
|
||||
|
Other comprehensive income (loss)
|
|
|
(
|
)
|
|
|
|
|
||||
|
Total comprehensive income (loss)
|
|
|
(
|
)
|
|
|
|
|
||||
|
Cash dividends received by the Company
|
|
|
|
|
|
|
|
|
||||
|
1.
|
The country of incorporation corresponds to the country of operation except for China Oriental whose country of operation is China.
|
F-28
ARCELORMITTAL AND SUBSIDIARIES
Notes to Consolidated Financial Statements
(millions of U.S. dollars, except share and per share data)
China Oriental Group Company Limited (“China Oriental”) is a Chinese integrated iron and steel company listed on the Hong Kong Stock Exchange (“HKEx”).
On January 27, 2017, in order to restore the minimum free float requirement, China Oriental issued
586,284,000
new shares resulting in a decrease of the Company’s interest from
46.99
%
to
39.02
%
. As a result, ArcelorMittal recorded a loss of
67
upon dilution partially offset by a gain of
23
following the recycling of accumulated foreign exchange translation gains from other comprehensive income to income from investments in associates, joint ventures and other investments. The trading of China Oriental’s shares, which had been suspended since April 29, 2014, resumed on February 1, 2017.
In January 2018, China Oriental issued
192
million
new shares to fulfill its obligations under its share-based compensation plans. As a result, ArcelorMittal’s interest in China Oriental decreased to
37.02
%
.
ArcelorMittal recorded a loss of
20
upon dilution partially offset by a gain of
8
following the recycling of accumulated foreign exchange translation gains in income from investments in associates, joint ventures and other investments.
DHS Group
DHS - Dillinger Hütte Saarstahl AG (“DHS Group”), incorporated and located in Germany, is a leading producer of heavy steel plates, cast slag pots and semi-finished products, such as pressings, pressure vessel heads and shell sections in Europe. The DHS Group also includes a further rolling mill operated by Dillinger France in Dunkirk (France).
Gonvarri Steel Industries
Holding Gonvarri SL (“Gonvarri Steel Industries”) is dedicated to the processing of steel. The entity is a European leader in steel service centers and renewable energy components, with strong presence in Europe and Latin America.
Baffinland
|
December 31, 2018
|
December 31, 2017
|
|||||||||||||
|
Associates
|
Joint Ventures
|
Total
|
Associates
|
Joint Ventures
|
Total
|
|||||||||
|
Carrying amount of interests in associates and joint ventures
|
|
|
|
|
|
|
|
|
||||||
|
Share of:
|
||||||||||||||
|
Income (loss) from continuing operations
|
|
|
|
|
|
|
|
|
||||||
|
Other comprehensive income (loss)
|
(
|
|
(
|
)
|
|
|
|
|
||||||
|
Total comprehensive income (loss)
|
|
|
|
|
|
|
|
|
||||||
F-29
ARCELORMITTAL AND SUBSIDIARIES
Notes to Consolidated Financial Statements
(millions of U.S. dollars, except share and per share data)
For the years ended December 31, 2018 and 2017, the Company identified an impairment indicator with respect to its shareholder loans in Al Jubail. Accordingly, it performed a value in use calculation and concluded the carrying amount of the investment and shareholder loans was recoverable. For the remaining investments, the Company concluded there were no impairment triggers.
For the year ended December 31, 2016
, the Company recorded an impairment charge of
14
of its shareholder loan to Kalagadi Manganese (Proprietary) Ltd ("Kalagadi Manganese"). The Company sold its
50
%
interest in this joint venture with Kalahari Resource (Proprietary) Ltd that is engaged in exploring, mining, ore processing and smelting manganese in the Kalahari Basin in South Africa in 2017. In addition, the Company recorded an impairment charge of
14
of its
28.24
%
interest in Comvex, a deep sea harbor facility on the Black Sea in Romania.
For the remaining investments, the Company concluded there were no impairment triggers.
For the year ended December 31, 2016, the Company’s unrecognized share of accumulated losses in Kalagadi Manganese was
9
.
The Company had investments in the following joint operations as of
December 31, 2018
and
2017
:
Peña Colorada
Peña Colorada is an iron ore mine located in Mexico in which ArcelorMittal holds a
50.00
%
interest. Peña Colorada operates an open pit mine as well as concentrating facility and two-line pelletizing facility.
Hibbing Taconite Mines
The Hibbing Taconite Mines in which the Company holds a
62.31
%
interest are iron ore mines located in the USA and operations consist of open pit mining, crushing, concentrating and pelletizing.
I/N Tek
I/N Tek in which the Company holds a
60.00
%
interest operates a cold-rolling mill in the United States.
Double G Coatings
ArcelorMittal holds a
50.00
%
interest in Double G Coating, a hot dip galvanizing and Galvalume facility in the United States.
F-30
ARCELORMITTAL AND SUBSIDIARIES
Notes to Consolidated Financial Statements
(millions of U.S. dollars, except share and per share data)
1). Other investments include the following:
|
December 31,
|
|||||
|
|
2018
|
2017
1
|
|||
|
Erdemir
|
|
|
|
|
|
|
Stalprodukt S.A.
|
|
|
|
|
|
|
Gerdau
|
|
|
|
|
|
|
Other investments
|
|
|
|
|
|
|
Investments in equity instruments at FVOCI
|
|
|
|
|
|
|
Erdemir
|
|
|
|
|
|
|
Stalprodukt S.A.
|
|
|
|
|
|
|
Gerdau
|
|
|
|
|
|
|
Other investments
|
|
|
|
|
|
|
Available-for-sale securities (at fair value)
|
|
|
|
|
|
|
Investments in equity instruments at cost
|
|
|
|
|
|
|
Total
|
|
|
|
|
|
The Company’s significant equity instruments at FVOCI at
December 31, 2018
and
2017
are the following:
Ereĝli Demir ve Çelik Fabrikalari T.A.S. (“Erdemir”)
Erdermir is the leading steel producer in Turkey and produces plates, hot and cold rolled, tin chromium and zinc coated flat steel and supplies basic inputs to automotive, white goods, pipes and tubes, rolling, manufacturing, electrics-electronics, mechanical engineering, energy, heating equipment, shipbuilding, defense and packaging industries.
Unrealized gains (losses) recognized in other comprehensive income were
127
and
658
for the year ended
December 31, 2018
and
2017
, respectively.
Stalprodukt S.A.
Stalprodukt S.A. is a leading manufacturer and exporter of highly processed steel products based in Poland.
Following the sale of
729,643
shares including the subsequent capital reduction of Stalprodukt S.A. during the first six months of 2016, for total cash consideration of
46
, ArcelorMittal’s ownership interest and voting rights in Stalprodukt S.A. decreased from
28.47
%
to
21.20
%
and from
28.26
%
to
11.61
%
, respectively.
As of
December 31, 2018
and
2017
, the fair value of ArcelorMittal’s stake in Stalprodukt S.A. was
101
and
171
, respectively. Unrealized gains recognized in other comprehensive income were
11
and
77
for the year ended
December 31, 2018
and
2017
, respectively.
Gerdau
Gerdau is the largest producer of long steel in the Americas and is headquartered in Brazil.
Unrealized gains recognized in other comprehensive income were
48
and
42
for the year ended
December 31, 2018
and
2017
, respectively.
Unconsolidated structured entities
ArcelorMittal has operating lease arrangements for two
vessels (Panamax Bulk Carriers) involving structured entities whose main purpose is to hold legal title of the
two
vessels and to lease them to the Company. Such entities are wholly-owned and controlled by a financial institution and are funded through equity instruments by the financial institution. Operating lease arrangements began for
one
vessel in 2013 and for the second vessel in 2014.
F-31
ARCELORMITTAL AND SUBSIDIARIES
Notes to Consolidated Financial Statements
(millions of U.S. dollars, except share and per share data)
l options to buy each of the
two
vessels from the structured entities at pre-determined dates and prices as presented in the table below. The structured entities hold put options enabling them to sell each of the vessels at the end of the lease terms at
6
each to the Company.
|
Call option strike prices
|
|||||||||||||||||||||||
|
Exercise dates
|
at the 60th month
|
at the 72nd month
|
at the 84th month
|
at the 96th month
|
at the 108th month
|
at the 120th month
|
at the 132nd month
|
at the 144th month
|
|||||||||||||||
|
Amounts per vessel
1
|
|||||||||||||||||||||||
|
First vessel
|
|
|
|
|
|
|
|
|
|
|
|
|
|
|
|
|
|||||||
|
Second vessel
|
|
|
|
|
|
|
|
|
|
|
|
|
|
|
|
|
|||||||
|
Year Ended December 31,
|
||||||||
|
2018
|
2017
|
2016
|
||||||
|
Share in net earnings of equity-accounted companies
|
|
|
|
|
|
|
||
|
Impairment charges
|
(
|
)
|
(
|
)
|
(
|
)
|
||
|
Gain (loss) on disposal
|
|
|
(
|
)
|
|
|
||
|
Dividend income
|
|
|
|
|
|
|
||
|
Total
|
|
|
|
|
|
|
||
For the year ended December 31, 2018, impairment charges include
132
relating to Macsteel in connection with the sale completed on October 31, 2018 (see note 2.4.1).
For the year ended December 31, 2017, impairment charges include
17
and
9
relating to the write down of receivables from associates and joint ventures
.
For the year ended December 31, 2016, impairment charges include
14
and
14
relating to Kalagadi Manganese and Comvex, respectively (see note 2.4.4).
For the year ended December 31, 2018, gain (loss) on disposal included mainly a
142
gain from the recycling of the currency translation reserve following the sale of Macsteel and a
12
loss on the dilution of the Company's interest from
39.02
%
to
37.02
%
in China Oriental
(see note 2.4).
For the year ended December 31, 2017, gain (loss) on disposal includes a gain of
133
(the cash settlement occurs through three annual installments of
44
of which one is outstanding as of December 31, 2018) on the disposal of the Company's
21
%
shareholding in Empire Iron Mining Partnership ("EIMP"), a loss of
44
on dilution of the Company's share in China Oriental (see note 2.4), a loss of
22
on dilution of the Company's interest in Baffinland (see note 2.4), a loss of
187
as a result of the reclassification of the accumulated foreign exchange translation losses from other comprehensive income to the statements of operations following the completion of the sale of the Company's
50
%
shareholding in Kalagadi Manganese to Kgalagadi Alloys (Proprietary) Ltd on August 25, 2017. As per sales agreement signed on October 21, 2016, ArcelorMittal received a contingent consideration to be paid during the life of the mine, which is capped at
150
and contingent upon the financial performance of the mine and cash flow availability.
For the year ended December 31, 2016, gain (loss) on disposal mainly includes a gain of
329
relating to the disposal of Gestamp (see note 2.4), a loss of
26
relating to the disposal of Stalprodukt S.A. shares (see note 2.5) and a gain of
74
following
F-32
ARCELORMITTAL AND SUBSIDIARIES
Notes to Consolidated Financial Statements
(millions of U.S. dollars, except share and per share data)
These operating segments include the attributable goodwill, intangible assets, property, plant and equipment, and certain equity method investments. They do not include cash and short-term deposits, short-term investments, tax assets and other current financial assets. Attributable liabilities are also those resulting from the normal activities of the segment, excluding tax liabilities and indebtedness but including post retirement obligations where directly attributable to the segment. The treasury function is managed centrally for the Company and is not directly attributable to individual operating segments or geographical areas.
ArcelorMittal’s segments are structured as follows:
|
•
|
NAFTA represents the flat, long and tubular facilities of the Company located in North America (Canada, United States and Mexico). NAFTA produces flat products such as slabs, hot-rolled coil, cold-rolled coil, coated steel and plate. These products are sold primarily to customers in the following sectors: automotive, energy, construction, packaging and appliances and via distributors or processors. NAFTA also produces long products such as wire rod, sections, rebar, billets, blooms and wire drawing, and tubular products;
|
|
•
|
Brazil includes the flat operations of Brazil and the long and tubular operations of Brazil and neighboring countries including Argentina, Costa Rica and Venezuela. Flat products include slabs, hot-rolled coil, cold-rolled coil and coated steel. Long products consist of wire rod, sections, bar and rebar, billets, blooms and wire drawing;
|
|
•
|
Europe is the largest flat steel producer in Europe, with operations that range from Spain in the west to Romania in the east, and covering the flat carbon steel product portfolio in all major countries and markets. Europe produces hot-rolled coil, cold-rolled coil, coated products, tinplate, plate and slab. These products are sold primarily to customers in the automotive, general and packaging sectors. Europe also produces long products consisting of sections, wire rod, rebar, billets, blooms and wire drawing, and tubular products. In addition, it includes Downstream Solutions, primarily an in-house trading and distribution arm of ArcelorMittal. Downstream Solutions also provides value-added and customized steel solutions through further steel processing to meet specific customer requirements;
|
|
•
|
ACIS produces a combination of flat, long and tubular products. Its facilities are located in Africa and the Commonwealth of Independent States; and
|
|
•
|
|
F-33
ARCELORMITTAL AND SUBSIDIARIES
Notes to Consolidated Financial Statements
(millions of U.S. dollars, except share and per share data)
|
|
NAFTA
|
Brazil
|
Europe
|
ACIS
|
Mining
|
Others
1
|
Elimination
|
Total
|
|||||||||||||||
|
Year ended December 31, 2016
|
|
|
|
|
|
|
|
|
|
|
|
|
|
|
|
|
|||||||
|
Sales to external customers
|
|
|
|
|
|
|
|
|
|
|
|
|
—
|
|
|
|
|||||||
|
Intersegment sales
2
|
|
|
|
|
|
|
|
|
|
|
|
|
(
|
)
|
—
|
|
|||||||
|
Operating income (loss)
|
|
|
|
|
|
|
|
|
|
|
(
|
)
|
(
|
)
|
|
|
|||||||
|
Depreciation and amortization
|
(
|
)
|
(
|
)
|
(
|
)
|
(
|
)
|
(
|
)
|
(
|
)
|
—
|
|
(
|
)
|
|||||||
|
Impairment
|
|
|
|
|
(
|
)
|
(
|
)
|
|
|
|
|
—
|
|
(
|
)
|
|||||||
|
Capital expenditures
|
|
|
|
|
|
|
|
|
|
|
|
|
—
|
|
|
|
|||||||
|
Year ended December 31, 2017
|
|
|
|
|
|
|
|
|
|
|
|
|
|
|
|
|
|||||||
|
Sales to external customers
|
|
|
|
|
|
|
|
|
|
|
|
|
—
|
|
|
|
|||||||
|
Intersegment sales
2
|
|
|
|
|
|
|
|
|
|
|
|
|
(
|
)
|
—
|
|
|||||||
|
Operating income (loss)
|
|
|
|
|
|
|
|
|
|
|
(
|
)
|
(
|
)
|
|
|
|||||||
|
Depreciation and amortization
|
(
|
)
|
(
|
)
|
(
|
)
|
(
|
)
|
(
|
)
|
(
|
)
|
—
|
|
(
|
)
|
|||||||
|
Impairment
|
|
|
|
|
|
|
(
|
)
|
|
|
|
|
—
|
|
(
|
)
|
|||||||
|
Capital expenditures
|
|
|
|
|
|
|
|
|
|
|
|
|
—
|
|
|
|
|||||||
|
Year ended December 31, 2018
|
|
|
|
|
|
|
|
|
|
|
|
|
|
|
|
|
|||||||
|
Sales to external customers
|
|
|
|
|
|
|
|
|
|
|
|
|
—
|
|
|
|
|||||||
|
Intersegment sales
2
|
|
|
|
|
|
|
|
|
|
|
|
|
(
|
)
|
—
|
|
|||||||
|
Operating income (loss)
|
|
|
|
|
|
|
|
|
|
|
(
|
)
|
(
|
)
|
|
|
|||||||
|
Depreciation and amortization
|
(
|
)
|
(
|
)
|
(
|
)
|
(
|
)
|
(
|
)
|
(
|
)
|
—
|
|
(
|
)
|
|||||||
|
Bargain purchase gain
3
|
|
|
|
|
|
|
|
|
|
|
|
|
—
|
|
|
|
|||||||
|
Impairment
|
|
|
(
|
)
|
(
|
)
|
|
|
|
|
|
|
—
|
|
(
|
)
|
|||||||
|
Capital expenditures
|
|
|
|
|
|
|
|
|
|
|
|
|
—
|
|
|
|
|||||||
1. Others include all other operational and non-operational items which are not segmented, such as corporate and shared services, financial activities, and shipping and logistics.
2. Transactions between segments are reported on the same basis of accounting as transactions with third parties except for certain mining products shipped internally and reported on a cost plus basis.
|
|
Year ended December 31,
|
|||||||
|
|
2018
|
2017
|
2016
|
|||||
|
Operating income
|
|
|
|
|
|
|
||
|
Income from investments in associates and joint ventures
|
|
|
|
|
|
|
||
|
Financing costs - net
|
(
|
)
|
(
|
)
|
(
|
)
|
||
|
Income before taxes
|
|
|
|
|
|
|
||
|
Income tax expense (benefit)
|
(
|
)
|
|
|
|
|
||
|
Net income (including non-controlling interests)
|
|
|
|
|
|
|
||
Geographical information, by country or region, is separately disclosed and represents ArcelorMittal’s most significant regional markets. Attributed assets are operational assets employed in each region and include items such as pension balances that are specific to a country. Unless otherwise stated in the table heading as a segment disclosure, these disclosures are specific to the country or region stated. They do not include goodwill, deferred tax assets, other investments or receivables and other non-current financial assets. Attributed liabilities are those arising within each region, excluding indebtedness.
F-34
ARCELORMITTAL AND SUBSIDIARIES
Notes to Consolidated Financial Statements
(millions of U.S. dollars, except share and per share data)
|
|
Year ended December 31,
|
|||||||
|
|
2018
|
2017
|
2016
|
|||||
|
Americas
|
|
|
|
|||||
|
United States
|
|
|
|
|
|
|
||
|
Brazil
|
|
|
|
|
|
|
||
|
Canada
|
|
|
|
|
|
|
||
|
Mexico
|
|
|
|
|
|
|
||
|
Argentina
|
|
|
|
|
|
|
||
|
Others
|
|
|
|
|
|
|
||
|
Total Americas
|
|
|
|
|
|
|
||
|
Europe
|
|
|
|
|
|
|
||
|
Germany
|
|
|
|
|
|
|
||
|
Poland
|
|
|
|
|
|
|
||
|
France
|
|
|
|
|
|
|
||
|
Spain
|
|
|
|
|
|
|
||
|
Italy
|
|
|
|
|
|
|
||
|
Czech Republic
|
|
|
|
|
|
|
||
|
Turkey
|
|
|
|
|
|
|
||
|
United Kingdom
|
|
|
|
|
|
|
||
|
Belgium
|
|
|
|
|
|
|
||
|
Netherlands
|
|
|
|
|
|
|
||
|
Russia
|
|
|
|
|
|
|
||
|
Romania
|
|
|
|
|
|
|
||
|
Others
|
|
|
|
|
|
|
||
|
Total Europe
|
|
|
|
|
|
|
||
|
Asia & Africa
|
||||||||
|
South Africa
|
|
|
|
|
|
|
||
|
Morocco
|
|
|
|
|
|
|
||
|
Egypt
|
|
|
|
|
|
|
||
|
Rest of Africa
|
|
|
|
|
|
|
||
|
China
|
|
|
|
|
|
|
||
|
Kazakhstan
|
|
|
|
|
|
|
||
|
South Korea
|
|
|
|
|
|
|
||
|
India
|
|
|
|
|
|
|
||
|
Rest of Asia
|
|
|
|
|
|
|
||
|
Total Asia & Africa
|
|
|
|
|
|
|
||
|
Total
|
|
|
|
|
|
|
||
Revenues from external customers attributed to the country of domicile (Luxembourg) were
162
,
111
and
88
for the years ended
December 31, 2018
,
2017
and
2016
, respectively.
F-35
ARCELORMITTAL AND SUBSIDIARIES
Notes to Consolidated Financial Statements
(millions of U.S. dollars, except share and per share data)
|
|
December 31,
|
||||
|
|
2018
|
|
2017
|
||
|
Americas
|
|
|
|
||
|
Canada
|
|
|
|
|
|
|
Brazil
|
|
|
|
|
|
|
United States
|
|
|
|
|
|
|
Mexico
|
|
|
|
|
|
|
Argentina
|
|
|
|
|
|
|
Venezuela
|
|
|
|
|
|
|
Others
|
|
|
|
|
|
|
Total Americas
|
|
|
|
|
|
|
|
|
|
|
||
|
Europe
|
|
|
|
||
|
France
|
|
|
|
|
|
|
Germany
|
|
|
|
|
|
|
Belgium
3
|
|
|
|
|
|
|
Poland
|
|
|
|
|
|
|
Ukraine
|
|
|
|
|
|
|
Spain
|
|
|
|
|
|
|
Italy
2
|
|
|
|
|
|
|
Luxembourg
|
|
|
|
|
|
|
Bosnia and Herzegovina
|
|
|
|
|
|
|
Romania
3
|
|
|
|
|
|
|
Czech Republic
3
|
|
|
|
|
|
|
Others
|
|
|
|
|
|
|
Total Europe
|
|
|
|
|
|
|
|
|
|
|
||
|
Asia & Africa
|
|
|
|
||
|
Kazakhstan
|
|
|
|
|
|
|
South Africa
|
|
|
|
|
|
|
Liberia
|
|
|
|
|
|
|
Morocco
|
|
|
|
|
|
|
Others
|
|
|
|
|
|
|
Total Asia & Africa
|
|
|
|
|
|
|
|
|
|
|
||
|
Unallocated assets
|
|
|
|
|
|
|
Total
|
|
|
|
|
|
|
|
December 31,
|
||||
|
|
2018
|
|
2017
|
||
|
Americas
|
|
|
|
||
|
Canada
|
|
|
|
|
|
|
Brazil
|
|
|
|
|
|
|
United States
|
|
|
|
|
|
|
Mexico
|
|
|
|
|
|
|
Argentina
|
|
|
|
|
|
|
Venezuela
|
|
|
|
|
|
|
Others
|
|
|
|
|
|
|
Total Americas
|
|
|
|
|
|
|
|
|
|
|
||
|
Europe
|
|
|
|
||
|
France
|
|
|
|
|
|
|
Germany
|
|
|
|
|
|
|
Belgium
3
|
|
|
|
|
|
|
Poland
|
|
|
|
|
|
|
Ukraine
|
|
|
|
|
|
|
Spain
|
|
|
|
|
|
|
Italy
2
|
|
|
|
|
|
|
Luxembourg
|
|
|
|
|
|
|
Bosnia and Herzegovina
|
|
|
|
|
|
|
Romania
3
|
|
|
|
|
|
|
Czech Republic
3
|
|
|
|
|
|
|
Others
|
|
|
|
|
|
|
Total Europe
|
|
|
|
|
|
|
|
|
|
|
||
|
Asia & Africa
|
|
|
|
||
|
Kazakhstan
|
|
|
|
|
|
|
South Africa
|
|
|
|
|
|
|
Liberia
|
|
|
|
|
|
|
Morocco
|
|
|
|
|
|
|
Others
|
|
|
|
|
|
|
Total Asia & Africa
|
|
|
|
|
|
|
|
|
|
|
||
|
Unallocated assets
|
|
|
|
|
|
|
Total
|
|
|
|
|
|
|
1.
|
Non-current assets do not include goodwill (as it is not allocated to the individual countries), deferred tax assets, investments in associates and joint ventures, other investments and other non-current financial assets. Such assets are presented under the caption “Unallocated assets”.
|
|
2.
|
Increase relates mainly to the Ilva acquisition (see note 2.2.4).
|
|
3.
|
|
F-36
ARCELORMITTAL AND SUBSIDIARIES
Notes to Consolidated Financial Statements
(millions of U.S. dollars, except share and per share data)
|
|
Year ended December 31,
|
|||||||
|
|
2018
|
2017
|
2016
|
|||||
|
Flat products
|
|
|
|
|
|
|
||
|
Long products
|
|
|
|
|
|
|
||
|
Tubular products
|
|
|
|
|
|
|
||
|
Mining products
|
|
|
|
|
|
|
||
|
Others
|
|
|
|
|
|
|
||
|
Total
|
|
|
|
|
|
|
||
Disaggregated revenue
|
Year ended December 31, 2018
|
NAFTA
|
Brazil
|
Europe
|
ACIS
|
Mining
|
Others
|
Total
|
|||||||||||||
|
Steel sales
|
|
|
|
|
|
|
|
|
|
|
|
|
|
|
||||||
|
Non-steel sales
1
|
|
|
|
|
|
|
|
|
|
|
|
|
|
|
||||||
|
By-product sales
2
|
|
|
|
|
|
|
|
|
|
|
|
|
|
|
||||||
|
Other sales
3
|
|
|
|
|
|
|
|
|
|
|
|
|
|
|
||||||
|
Total
|
|
|
|
|
|
|
|
|
|
|
|
|
|
|
||||||
|
Year ended December 31, 2017
|
NAFTA
|
Brazil
|
Europe
|
ACIS
|
Mining
|
Others
|
Total
|
|||||||||||||
|
Steel sales
|
|
|
|
|
|
|
|
|
|
|
|
|
|
|
||||||
|
Non-steel sales
1
|
|
|
|
|
|
|
|
|
|
|
|
|
|
|
||||||
|
By-product sales
2
|
|
|
|
|
|
|
|
|
|
|
|
|
|
|
||||||
|
Other sales
3
|
|
|
|
|
|
|
|
|
|
|
|
|
|
|
||||||
|
Total
|
|
|
|
|
|
|
|
|
|
|
|
|
|
|
||||||
|
Year ended December 31, 2016
|
NAFTA
|
Brazil
|
Europe
|
ACIS
|
Mining
|
Others
|
Total
|
|||||||||||||
|
Steel sales
|
|
|
|
|
|
|
|
|
|
|
|
|
|
|
||||||
|
Non-steel sales
1
|
|
|
|
|
|
|
|
|
|
|
|
|
|
|
||||||
|
By-product sales
2
|
|
|
|
|
|
|
|
|
|
|
|
|
|
|
||||||
|
Other sales
3
|
|
|
|
|
|
|
|
|
|
|
|
|
|
|
||||||
|
Total
|
|
|
|
|
|
|
|
|
|
|
|
|
|
|
||||||
1.
Non-steel sales mainly relate to iron ore, coal, scrap and electricity;
2.
By-product sales mainly relate to slag, waste and coke by-products;
F-37
ARCELORMITTAL AND SUBSIDIARIES
Notes to Consolidated Financial Statements
(millions of U.S. dollars, except share and per share data)
f the goods to the buyer and the buyer obtains the benefits from the goods, the potential cash flows and the amount of revenue (the transaction price) can be measured reliably, and it is probable that the Company will collect the consideration to which it is entitled to in exchange for the goods.
Whether the customer has obtained control over the asset depends on when the goods are made available to the carrier or the buyer takes possession of the goods, depending on the delivery terms. For the Company’s steel producing operations, generally the criteria to recognize revenue has been met when its products are delivered to its customers or to a carrier who will transport the goods to its customers, this is the point in time when the Company has completed its performance obligations. Revenue is measured at the transaction price of the consideration received or receivable, the amount the Company expects to be entitled to.
Additionally, the Company identifies when goods have left its premises, not when the customer receives the goods. Therefore, the Company estimates, based on its historical experience, the amount of goods in-transit when the transfer of control occurs at the destination and defers the revenue recognition.
The Company’s products must meet customer specifications. A certain portion of the Company’s products are returned or have claims filed against the sale because the products contained quality defects or other problems. Claims may be either of the following:
|
–
|
Product Rejection - Product shipped and billed to an end customer that did not meet previously agreed customer specifications. Claims typically result from physical defects in the goods, goods shipped to the wrong location, goods produced with incorrect specifications and goods shipped outside acceptable time parameters.
|
|
–
|
Consequential Damages - Damages reported by the customer not directly related to the value of the rejected goods (for example: customer processing cost or mill down time, sampling, storage, sorting, administrative cost, replacement cost, etc.).
|
The Company estimates the variable consideration for such claims using the expected value method and reduces the
amount of revenue recognized.
Warranties:
The warranties and claims arise when the product fails on the criteria mentioned above. Sales‑related warranties associated with the goods cannot be purchased separately and they serve as an assurance that the products sold comply with agreed‑upon specifications. Accordingly, the Company accounts for warranties in accordance with IAS 37 Provisions, Contingent Liabilities and Contingent Assets (see note 8)
.
Periodically, the Company enters into volume or other rebate programs where once a certain volume or other conditions are met, it refunds the customer some portion of the amounts previously billed or paid. For such arrangements, the Company only recognizes revenue for the amounts it ultimately expects to realize from the customer. The Company estimates the variable consideration for these programs using the most likely amount method or the expected value method, whichever approach best predicts the amount of the consideration based on the terms of the contract and available information and updates its estimates each reporting period.
The Company’s payment terms range from
30 to 90 days
from date of delivery, depending on the market and product sold. The Company has applied the practical expedient in IFRS 15 (C5) (d). In
2018
, the Company received
364
as advances from its customers which are classified as unsatisfied performance obligations and recognized as liabilities in line with IFRS 15. The Company expects
100
%
of the unsatisfied performance obligations as of
December 31, 2018
to be recognized as revenue during 2019 as the Company’s contracts have an original expected duration of one year or less.
F-38
ARCELORMITTAL AND SUBSIDIARIES
Notes to Consolidated Financial Statements
(millions of U.S. dollars, except share and per share data)
|
|
Year ended December 31,
|
|||||||
|
|
2018
|
|
2017
|
|
2016
|
|||
|
Trade accounts receivable and other - opening balance
|
|
|
|
|
|
|
|
|
|
Performance obligations satisfied
|
|
|
|
|
|
|
|
|
|
Payments received
|
(
|
)
|
|
(
|
)
|
|
(
|
)
|
|
Impairment of receivables (net of write backs)
|
(
|
)
|
|
|
|
|
(
|
)
|
|
Reclassification of the period-end receivables to held for sale
|
(
|
)
|
|
|
(
|
)
|
||
|
Acquisitions through business combinations
|
|
|
|
|
|
|
||
|
Foreign exchange and others
|
(
|
)
|
|
|
|
|
(
|
)
|
|
Trade accounts receivable and other - closing balance
|
|
|
|
|
|
|
|
|
|
|
Year ended December 31,
|
|||||||
|
|
2018
|
2017
|
2016
|
|||||
|
Materials
|
|
|
|
|
|
|
||
|
Labor costs
1
|
|
|
|
|
|
|
||
|
Logistic expenses
|
|
|
|
|
|
|
||
|
Depreciation and amortization
|
|
|
|
|
|
|
||
|
Gain on bargain purchase
2
|
(
|
)
|
|
|
|
|
|
|
|
Impairment
|
|
|
|
|
|
|
||
|
Other
|
|
|
|
|
|
|
||
|
Total
|
|
|
|
|
|
|
||
|
1.
|
In 2016, labor costs included an
|
|
2.
|
|
ArcelorMittal’s policy is to record an allowance for expected lifetime credit losses and a charge in selling, general and administrative expense when a specific account is deemed uncollectible. The Company concluded that a trade receivable is in default when they are overdue by more than
180
days. Based on historical experience and analysis, the Company concluded that there is a risk of default as such receivables are generally not recoverable and therefore provided for, unless it can be clearly demonstrated that the receivable is still collectible.
F-39
ARCELORMITTAL AND SUBSIDIARIES
Notes to Consolidated Financial Statements
(millions of U.S. dollars, except share and per share data)
Trade accounts receivable and allowance for lifetime
expected credit losses
|
|
December 31,
|
||||
|
|
2018
|
2017
|
|||
|
Gross amount
|
|
|
|
|
|
|
Allowance for lifetime expected credit losses
|
(
|
)
|
(
|
)
|
|
|
Total
|
|
|
|
|
|
|
|
December 31,
|
||||
|
|
2018
|
2017
|
|||
|
Gross amount
|
|
|
|
|
|
|
Allowance for lifetime expected credit losses
|
(
|
)
|
(
|
)
|
|
|
Total
|
|
|
|
|
|
expected credit losses
|
|
December 31,
|
||||
|
|
2018
|
2017
|
|||
|
Gross amount
|
|
|
|
|
|
|
Allowance for lifetime expected credit losses
|
(
|
)
|
(
|
)
|
|
|
Total
|
|
|
|
|
|
The carrying amount of the trade accounts receivable and other approximates their fair value. Before granting credit to any new customer, ArcelorMittal uses an internally developed credit scoring system to assess the potential customer’s credit quality and to define credit limits by customer. For all significant customers the credit terms must be approved by the credit committees of each reportable segment. Limits and scoring attributed to customers are reviewed periodically. There are no customers who represent more than 5% of the total balance of trade accounts receivable
.
Exposure to credit risk by reportable segment
|
|
December 31,
|
||||
|
|
2018
|
2017
|
|||
|
NAFTA
|
|
|
|
|
|
|
Brazil
|
|
|
|
|
|
|
Europe
|
|
|
|
|
|
|
ACIS
|
|
|
|
|
|
|
Mining
|
|
|
|
|
|
|
Total
|
|
|
|
|
|
|
|
December 31,
|
December 31,
|
|||||||||||||||
|
|
2018
|
2017
|
|||||||||||||||
|
|
Gross
|
Allowance under lifetime expected credit loss model (IFRS 9)
|
Total
|
Gross
|
Allowance under incurred loss model (IAS 39)
|
Total
|
|||||||||||
|
Not past due
|
|
|
(
|
)
|
|
|
|
|
(
|
)
|
|
|
|||||
|
Overdue 1-30 days
|
|
|
(
|
)
|
|
|
|
|
(
|
)
|
|
|
|||||
|
Overdue 31-60 days
|
|
|
(
|
)
|
|
|
|
|
(
|
)
|
|
|
|||||
|
Overdue 61-90 days
|
|
|
(
|
)
|
|
|
|
|
|
|
|
|
|||||
|
Overdue 91-180 days
|
|
|
(
|
)
|
|
|
|
|
(
|
)
|
|
|
|||||
|
More than 180 days
|
|
|
(
|
)
|
|
|
|
|
(
|
)
|
|
|
|||||
|
Total
|
|
|
(
|
)
|
|
|
|
|
(
|
)
|
|
|
|||||
|
Balance as of December 31, 2015
|
Additions
|
Deductions/
Releases |
Foreign exchange and others
|
Balance as of December 31, 2016
|
||||
|
|
|
(
|
|
|
||||
|
Balance as of December 31, 2016
|
Additions
|
Deductions/
Releases |
Foreign exchange and others
|
Balance as of December 31, 2017
|
||||
|
|
|
(
|
|
|
||||
|
Balance as of December 31, 2017
|
Additions
|
Deductions/
Releases |
Foreign exchange and others
|
Balance as of December 31, 2018
|
||||
|
|
|
(
|
(
|
|
||||
The Company has established a number of programs for sales without recourse of trade accounts receivable to various financial institutions (referred to as true sale of receivables (“TSR”)). Through the TSR programs, certain operating subsidiaries
F-40
ARCELORMITTAL AND SUBSIDIARIES
Notes to Consolidated Financial Statements
(millions of U.S. dollars, except share and per share data)
Net realizable value represents the estimated selling price at which the inventories can be realized in the normal course of business after allowing for the cost of conversion from their existing state to a finished condition and for the cost of marketing, selling, and distribution. Net realizable value is estimated based on the most reliable evidence available at the time the estimates were made of the amount that the inventory is expected to realize, taking into account the purpose for which the inventory is held.
|
|
December 31,
|
||||
|
|
2018
|
2017
|
|||
|
Finished products
|
|
|
|
|
|
|
Production in process
|
|
|
|
|
|
|
Raw materials
|
|
|
|
|
|
|
Manufacturing supplies, spare parts and other
1
|
|
|
|
|
|
|
Total
|
|
|
|
|
|
|
1.
|
|
|
Balance as of December 31, 2015
|
Additions
1
|
Deductions / Releases
2
|
Foreign exchange and others
|
Balance as of December 31, 2016
|
||||
|
|
|
(
|
(
|
|
||||
|
Balance as of December 31, 2016
|
Additions
1
|
Deductions / Releases
2
|
Foreign exchange and others
|
Balance as of December 31, 2017
|
||||
|
|
|
(
|
|
|
||||
|
Balance as of December 31, 2017
|
Additions
1
|
Deductions / Releases
2
|
Foreign exchange and others
|
Balance as of December 31, 2018
|
||||
|
|
|
(
|
(
|
|
||||
|
1.
|
Additions refer to write-downs of inventories including those utilized or written back during the same financial year.
|
|
2.
|
|
F-41
ARCELORMITTAL AND SUBSIDIARIES
Notes to Consolidated Financial Statements
(millions of U.S. dollars, except share and per share data)
|
December 31,
|
|||||
|
2018
|
2017
|
||||
|
VAT receivables
|
|
|
|
|
|
|
Prepaid expenses and non-trade receivables
|
|
|
|
|
|
|
Financial amounts receivable
|
|
|
|
|
|
|
Income tax receivable
|
|
|
|
|
|
|
Receivables from public authorities
|
|
|
|
|
|
|
Receivables from sale of financial and intangible assets
|
|
|
|
|
|
|
Derivative financial instruments
|
|
|
|
|
|
|
Other
1
|
|
|
|
|
|
|
Total
|
|
|
|
|
|
|
1.
|
|
|
|
December 31,
|
||||
|
|
2018
|
2017
|
|||
|
Derivative financial instruments
|
|
|
|
|
|
|
Financial amounts receivable
|
|
|
|
|
|
|
Long-term VAT receivables
|
|
|
|
|
|
|
Cash guarantees and deposits
|
|
|
|
|
|
|
Receivables from public authorities
|
|
|
|
|
|
|
Accrued interest
|
|
|
|
|
|
|
Receivables from sale of financial and intangible assets
|
|
|
|
|
|
|
Income tax receivable
|
|
|
|
|
|
|
Other
1
|
|
|
|
|
|
|
Total
|
|
|
|
|
|
|
1.
|
|
F-42
ARCELORMITTAL AND SUBSIDIARIES
Notes to Consolidated Financial Statements
(millions of U.S. dollars, except share and per share data)
|
December 31,
|
|||||
|
2018
|
2017
|
||||
|
Accrued payroll and employee related expenses
|
|
|
|
|
|
|
Accrued interest and other payables
|
|
|
|
|
|
|
Payable from acquisition of intangible, tangible & financial assets
|
|
|
|
|
|
|
Other amounts due to public authorities
|
|
|
|
|
|
|
Derivative financial instruments
|
|
|
|
|
|
|
Unearned revenue and accrued payables
|
|
|
|
|
|
|
Total
|
|
|
|
|
|
F-43
ARCELORMITTAL AND SUBSIDIARIES
Notes to Consolidated Financial Statements
(millions of U.S. dollars, except share and per share data)
|
|
December 31,
|
||||
|
|
2018
|
2017
|
|||
|
Goodwill on acquisitions
|
|
|
|
|
|
|
Concessions, patents and licenses
|
|
|
|
|
|
|
Customer relationships and trade marks
|
|
|
|
|
|
|
Other
1
|
|
|
|
|
|
|
Total
|
|
|
|
|
|
Goodwill
Goodwill arising on an acquisition is recognized as previously described within the business combinations section in note 2.2.3. Goodwill is allocated to those groups of cash-generating units that are expected to benefit from the business combination in which the goodwill arose and in all cases is at the operating segment level, which represents the lowest level at which goodwill is monitored for internal management purposes.
|
|
December 31, 2016
|
Divestments and assets held for sale
|
Foreign exchange differences and other movements
1
|
December 31, 2017
|
|||||||
|
NAFTA
|
|
|
|
|
|
|
|
|
|||
|
Brazil
|
|
|
|
|
(
|
)
|
|
|
|||
|
Europe
|
|
|
|
|
|
|
|
|
|||
|
ACIS
|
|
|
|
|
(
|
)
|
|
|
|||
|
Total
|
|
|
|
|
|
|
|
|
|||
1. The movements for Brazil includes
2
related to Sumaré acquisition (please refer to note 2.2.4)
|
|
December 31, 2017
|
Divestments and assets held for sale
2
|
Foreign exchange differences and other movements
1
|
December 31, 2018
|
|||||||
|
NAFTA
|
|
|
|
|
(
|
)
|
|
|
|||
|
Brazil
|
|
|
(
|
)
|
(
|
)
|
|
|
|||
|
Europe
|
|
|
(
|
)
|
(
|
)
|
|
|
|||
|
ACIS
|
|
|
|
|
|
|
|
|
|||
|
Total
|
|
|
(
|
)
|
(
|
)
|
|
|
|||
1. The movements for Brazil includes
24
related to Votorontim Siderurgia acquisition (please refer to note 2.2.4)
Intangible assets
Intangible assets are recognized only when it is probable that the expected future economic benefits attributable to the assets will accrue to the Company and the cost can be reliably measured. Intangible assets acquired separately by ArcelorMittal are initially recorded at cost and those acquired in a business combination are initially recorded at fair value at the date of the business combination. These primarily include the cost of technology and licenses purchased from third parties and operating authorizations granted by governments or other public bodies (concessions). Intangible assets are amortized on a straight-line basis over their estimated economic useful lives, which typically do not exceed
five years
. Amortization is included in the consolidated statements of operations as part of cost of sales.
F-44
ARCELORMITTAL AND SUBSIDIARIES
Notes to Consolidated Financial Statements
(millions of U.S. dollars, except share and per share data)
ArcelorMittal’s industrial sites which are regulated by the European Directive 2003/87/EC of October 13, 2003 on carbon dioxide (“CO
2
”) emission rights, effective as of January 1, 2005, are located primarily in Belgium, Czech Republic, France, Germany, Luxembourg, Poland, Romania, Spain and Italy. ArcelorMittal's operations in Ontario, Canada are subject to the “Climate Change Mitigation and Low-carbon Economy Act, 2016”, a cap and trade program regulation effective from July 1, 2016. The emission rights allocated to the Company on a no-charge basis pursuant to the annual national allocation plan are recorded at nil value and purchased emission rights are recorded at cost.
|
|
Concessions, patents and licenses
|
|
Customer relationships and trade marks
|
|
Other
|
|
Total
|
||||
|
Cost
|
|
|
|
|
|
|
|
||||
|
At December 31, 2016
|
|
|
|
|
|
|
|
|
|
|
|
|
Acquisitions
|
|
|
|
|
|
|
|
|
|
|
|
|
Disposals
|
(
|
)
|
|
|
|
|
|
|
|
(
|
)
|
|
Foreign exchange differences
|
|
|
|
|
|
|
|
|
|
|
|
|
Transfers and other movements
1
|
|
|
|
(
|
)
|
|
(
|
)
|
|
|
|
|
Fully amortized intangible assets
2
|
(
|
)
|
|
(
|
)
|
|
|
|
|
(
|
)
|
|
At December 31, 2017
|
|
|
|
|
|
|
|
|
|
|
|
|
Acquisitions
|
|
|
|
|
|
|
|
|
|
|
|
|
Acquisitions through business combinations (note 2.2.4)
|
|
|
|
|
|
|
|
|
|
|
|
|
Disposal
|
|
|
|
|
|
|
(
|
)
|
|
(
|
)
|
|
Foreign exchange differences
|
(
|
)
|
|
(
|
)
|
|
(
|
)
|
|
(
|
)
|
|
Transfers to assets held for sale (note 2.3)
|
(
|
)
|
|
|
|
|
|
|
|
(
|
)
|
|
Transfers and other movements
1
|
|
|
|
|
|
|
|
|
|
|
|
|
Fully amortized intangible assets
2
|
(
|
)
|
|
(
|
)
|
|
|
|
|
(
|
)
|
|
At December 31, 2018
|
|
|
|
|
|
|
|
|
|
|
|
|
|
|
|
|
|
|
|
|
|
|
|
|
|
Accumulated amortization and impairment losses
|
|
|
|
|
|
|
|
|
|
|
|
|
At December 31, 2016
|
|
|
|
|
|
|
|
|
|
|
|
|
Amortization charge
|
|
|
|
|
|
|
|
|
|
|
|
|
Foreign exchange differences
|
|
|
|
|
|
|
|
|
|
|
|
|
Transfers and other movements
1
|
(
|
)
|
|
(
|
)
|
|
|
|
|
(
|
)
|
|
Fully amortized intangible assets
2
|
(
|
)
|
|
(
|
)
|
|
|
|
|
(
|
)
|
|
At December 31, 2017
|
|
|
|
|
|
|
|
|
|
|
|
|
Amortization charge
|
|
|
|
|
|
|
|
|
|
|
|
|
Foreign exchange differences
|
(
|
)
|
|
(
|
)
|
|
(
|
)
|
|
(
|
)
|
|
Transfers to assets held for sale (note 2.3)
|
(
|
)
|
|
|
|
|
|
|
|
(
|
)
|
|
Transfers and other movements
1
|
|
|
|
|
|
|
(
|
)
|
|
|
|
|
Fully amortized intangible assets
2
|
(
|
)
|
|
(
|
)
|
|
|
|
|
(
|
)
|
|
At December 31, 2018
|
|
|
|
|
|
|
|
|
|
|
|
|
|
|
|
|
|
|
|
|
|
|
|
|
|
Carrying amount
|
|
|
|
|
|
|
|
|
|
|
|
|
At December 31, 2017
|
|
|
|
|
|
|
|
|
|
|
|
|
At December 31, 2018
|
|
|
|
|
|
|
|
|
|
|
|
|
1.
|
Transfers and other movements correspond mainly to transfer from assets under construction into patents and licenses in 2018 and 2017
.
|
|
2.
|
Fully amortized assets correspond mainly to licenses in
2018
and
2017
.
|
F-45
ARCELORMITTAL AND SUBSIDIARIES
Notes to Consolidated Financial Statements
(millions of U.S. dollars, except share and per share data)
|
Asset Category
|
Useful Life Range
|
|
|
Land
|
Not depreciated
|
|
|
Buildings
|
10 to 50 years
|
|
|
Property plant & equipment
|
15 to 50 years
|
|
|
Auxiliary facilities
|
15 to 45 years
|
|
|
Other facilities
|
5 to 20 years
|
|
The Company’s annual review of useful lives leverages on the experience gained from an in-depth review performed every five years, any significant change in the expected pattern of consumption embodied in the asset, and the specialized knowledge of ArcelorMittal’s network of chief technical officers. The chief technical officer network includes engineers with facility-specific expertise related to plant and equipment used in the principal production units of the Company’s operations. The most recent in-depth review took place in 2014, during which the Company performed a review of the useful lives of its assets and determined its maintenance and operating practices enabled an extension of the useful lives of plant and equipment. In performing this review, the Company gathered and evaluated data, including commissioning dates, designed capacities, maintenance records and programs, and asset performance history, among other attributes. In accordance with IAS 16, Property, Plant and Equipment, the Company considered this information at the level of components significant in relation to the total cost of the item of plant and equipment. Other factors the Company considered in its determination of useful lives included the expected use of the assets, technical or commercial obsolescence, and operational factors that led to improvements in monitoring and process control that contribute to longer asset lives. In addition, the Company considered the accumulated technical experience and knowledge sharing programs that allowed for the exchange of best practices within the chief technical officer network and the deployment of these practices across the Company’s principal production units.
Major improvements, which add to productive capacity or extend the life of an asset, are capitalized, while repairs and maintenance are expensed as incurred. Where a tangible fixed asset comprises major components having different useful lives, these components are accounted for as separate items.
Property, plant and equipment under construction is recorded as construction in progress until it is ready for its intended use; thereafter it is transferred to the related class of property, plant and equipment and depreciated over its estimated useful life. Interest incurred during construction is capitalized if the borrowing cost is directly attributable to the construction. Gains and losses on retirement or disposal of assets are recognized in cost of sales.
Property, plant and equipment acquired by way of finance leases is stated at an amount equal to the lower of the fair value and the present value of the minimum lease payments at the inception of the lease. Each lease payment is allocated between the finance charges and a reduction of the lease liability. The interest element of the finance cost is charged to the consolidated statements of operations over the lease period so as to achieve a constant rate of interest on the remaining balance of the liability.
The residual values and useful lives of property, plant and equipment are reviewed at each reporting date and adjusted if expectations differ from previous estimates. Depreciation methods applied to property, plant and equipment are reviewed at each reporting date and changed if there has been a significant change in the expected pattern of consumption of the future economic benefits embodied in the asset.
Mining assets comprise:
|
•
|
Mineral rights acquired;
|
|
•
|
Capitalized developmental stripping (as described below in “—Stripping and overburden removal costs”).
|
F-46
ARCELORMITTAL AND SUBSIDIARIES
Notes to Consolidated Financial Statements
(millions of U.S. dollars, except share and per share data)
Property, plant and equipment used in mining activities is depreciated over its useful life or over the remaining life of the mine, if shorter, and if there is no alternative use. For the majority of assets used in mining activities, the economic benefits from the asset are consumed in a pattern which is linked to the production level and accordingly, assets used in mining activities are primarily depreciated on a units-of-production basis. A unit-of-production is based on the available estimate of proven and probable reserves.
Capitalization of pre-production expenditures ceases when the mining property is capable of commercial production as it is intended by management. General administration costs that are not directly attributable to a specific exploration area are charged to the consolidated statements of operations.
Mining Reserves
Reserves are estimates of the amount of product that can be economically and legally extracted from the Company’s properties. In order to estimate reserves, estimates are required for a range of geological, technical and economic factors, including quantities, grades, production techniques, recovery rates, production costs, transport costs, commodity demand, commodity prices and exchange rates.
Estimating the quantity and/or grade of reserves requires the size, shape and depth of ore bodies to be determined by analyzing geological data such as drilling samples. This process may require complex and difficult geological judgments to interpret the data.
Because the economic assumptions used to estimate reserves change from period to period, and because additional geological data is generated during the course of operations, estimates of reserves may change from period to period. Changes in reported reserves may affect the Company’s financial results and financial position in a number of ways, including the following:
|
•
|
Asset carrying amounts may be affected due to changes in estimated future cash flows.
|
|
•
|
Depreciation, depletion and amortization charged in the consolidated statements of operations may change where such charges are determined by the units of production basis, or where the useful economic lives of assets change.
|
|
•
|
Overburden removal costs recognized in the consolidated statements of financial position or charged to the consolidated statements of operations may change due to changes in stripping ratios or the units of production basis of depreciation.
|
|
•
|
Decommissioning, site restoration and environmental provisions may change where changes in estimated reserves affect expectations about the timing or cost of these activities.
|
Stripping and overburden removal costs
In open pit and underground mining operations, it is often necessary to remove overburden and other waste materials to access the deposit from which minerals can be extracted. This process is referred to as stripping. Stripping costs can be incurred before the mining production commences (“developmental stripping”) or during the production stage (“production stripping”).
A mine can operate several open pits that are regarded as separate operations for the purpose of mine planning and production. In this case, stripping costs are accounted for separately, by reference to the ore extracted from each separate pit. If, however, the pits are highly integrated for the purpose of mine planning and production, stripping costs are aggregated.
The determination of whether multiple pit mines are considered separate or integrated operations depends on each mine’s specific circumstances. The following factors would point towards the stripping costs for the individual pits being accounted for separately:
|
•
|
If mining of the second and subsequent pits is conducted consecutively with that of the first pit, rather than concurrently.
|
|
•
|
If separate investment decisions are made to develop each pit, rather than a single investment decision being made at the outset.
|
F-47
ARCELORMITTAL AND SUBSIDIARIES
Notes to Consolidated Financial Statements
(millions of U.S. dollars, except share and per share data)
|
•
|
If the pits are operated as separate units in terms of mine planning and the sequencing of overburden and ore mining, rather than as an integrated unit.
|
|
•
|
If expenditures for additional infrastructure to support the second and subsequent pits are relatively large.
|
|
•
|
If the pits extract ore from separate and distinct ore bodies, rather than from a single ore body.
|
The relative importance of each factor is considered by local management to determine whether the stripping costs should be attributed to the individual pit or to the combined output from several pits.
Developmental stripping costs contribute to the future economic benefits of mining operations when the production begins and so are capitalized as tangible assets (construction in progress), whereas production stripping is a part of on-going activities and commences when the production stage of mining operations begins and continues throughout the life of a mine.
Capitalization of developmental stripping costs ends when the commercial production of the minerals commences.
Production stripping costs are incurred to extract the ore in the form of inventories and/or to improve access to an additional component of an ore body or deeper levels of material. Production stripping costs are accounted for as inventories to the extent the benefit from production stripping activity is realized in the form of inventories. Production stripping costs are recognized as a non-current asset (“stripping activity assets”) to the extent it is probable that future economic benefit in terms of improved access to ore will flow to the Company, the components of the ore body for which access has been improved can be identified and the costs relating to the stripping activity associated with that component can be measured reliably.
All stripping costs assets (either stripping activity assets or capitalized developmental stripping costs) are presented within a specific “mining assets” class of property, plant and equipment and then depreciated on a units-of-production basis.
Exploration and evaluation expenditure
Exploration and evaluation activities involve the search for iron ore and coal resources, the determination of technical feasibility and the assessment of commercial viability of an identified resource. Exploration and evaluation activities include:
|
•
|
researching and analyzing historical exploration data;
|
|
•
|
conducting topographical, geological, geochemical and geophysical studies;
|
|
•
|
carrying out exploratory drilling, trenching and sampling activities;
|
|
•
|
drilling, trenching and sampling activities to determine the quantity and grade of the deposit;
|
|
•
|
examining and testing extraction methods and metallurgical or treatment processes; and
|
|
•
|
detailed economic feasibility evaluations to determine whether development of the reserves is commercially justified and to plan methods for mine development.
|
Exploration and evaluation expenditure is charged to the consolidated statements of operations as incurred except in the following circumstances, in which case the expenditure is capitalized: (i) the exploration and evaluation activity is within an area of interest which was previously acquired in a business combination and measured at fair value on acquisition; or (ii) when management has a high degree of confidence in the project’s economic viability and it is probable that future economic benefits will flow to the Company.
Capitalized exploration and evaluation expenditures are generally recorded as a component of property, plant and equipment at cost less impairment charges, unless their nature requires them to be recorded as an intangible asset. As the asset is not available for use, it is not depreciated and all capitalized exploration and evaluation expenditure is monitored for indications of impairment. To the extent that capitalized expenditure is not expected to be recovered, it is recognized as an expense in the consolidated statements of operations.
Cash flows associated with exploration and evaluation expenditure are classified as operating activities when they are related to expenses or as an investing activity when they are related to a capitalized asset in the consolidated statements of cash flows.
F-48
ARCELORMITTAL AND SUBSIDIARIES
Notes to Consolidated Financial Statements
(millions of U.S. dollars, except share and per share data)
Development expenditure
Development is the establishment of access to the mineral reserve and other preparations for commercial production. Development activities often continue during production and include:
|
•
|
sinking shafts and underground drifts (often called mine development);
|
|
•
|
making permanent excavations;
|
|
•
|
developing passageways and rooms or galleries;
|
|
•
|
building roads and tunnels; and
|
|
•
|
advance removal of overburden and waste rock.
|
Development (or construction) also includes the installation of infrastructure (e.g., roads, utilities and housing), machinery, equipment and facilities.
Biological assets are part of the Brazil operating segment and consist of eucalyptus forests located in the Brazilian state of Minas Gerais exclusively from renewable plantations and intended for the production of charcoal to be utilized as fuel and a source of carbon in the direct reduction process of pig iron production in some of the Company’s blast furnaces in Brazil.
F-49
ARCELORMITTAL AND SUBSIDIARIES
Notes to Consolidated Financial Statements
(millions of U.S. dollars, except share and per share data)
|
|
Land, buildings and
Improvements |
Machinery, equipment and other
2
|
Construction in progress
|
Mining
Assets |
Total
|
|||||||||
|
Cost
|
|
|
|
|
|
|||||||||
|
At December 31, 2016
|
|
|
|
|
|
|
|
|
|
|
||||
|
Additions
|
|
|
|
|
|
|
|
|
|
|
||||
|
Foreign exchange differences
|
|
|
|
|
|
|
|
|
|
|
||||
|
Disposals
|
(
|
)
|
(
|
)
|
(
|
)
|
(
|
)
|
(
|
)
|
||||
|
Divestments (note 2.3)
|
(
|
)
|
(
|
)
|
|
|
|
|
(
|
)
|
||||
|
Transfers to assets held for sale (note 2.3)
|
(
|
)
|
(
|
)
|
|
|
|
|
(
|
)
|
||||
|
Other movements
1
|
|
|
|
|
(
|
)
|
|
|
|
|
||||
|
At December 31, 2017
|
|
|
|
|
|
|
|
|
|
|
||||
|
Additions
|
|
|
|
|
|
|
|
|
|
|
||||
|
Acquisitions through business combinations (see note 2.2.4)
|
|
|
|
|
|
|
|
|
|
|
|
|
|
|
|
Foreign exchange differences
|
(
|
)
|
(
|
)
|
(
|
)
|
(
|
)
|
(
|
)
|
||||
|
Disposals
|
(
|
)
|
(
|
)
|
(
|
)
|
(
|
)
|
(
|
)
|
||||
|
Divestments (note 2.3)
|
(
|
)
|
(
|
)
|
(
|
)
|
|
|
(
|
)
|
||||
|
Transfers to assets held for sale (note 2.3)
|
(
|
)
|
(
|
)
|
(
|
)
|
|
|
(
|
)
|
||||
|
Other movements
1
|
|
|
|
|
(
|
)
|
|
|
(
|
)
|
||||
|
At December 31, 2018
|
|
|
|
|
|
|
|
|
|
|
||||
|
Accumulated depreciation and impairment
|
||||||||||||||
|
At December 31, 2016
|
|
|
|
|
|
|
|
|
|
|
||||
|
Depreciation charge for the year
|
|
|
|
|
|
|
|
|
|
|
||||
|
Impairment (note 5.3)
|
|
|
|
|
|
|
|
|
|
|
||||
|
Disposals
|
(
|
)
|
(
|
)
|
(
|
)
|
|
|
(
|
)
|
||||
|
Foreign exchange differences
|
|
|
|
|
|
|
|
|
|
|
||||
|
Divestments (note 2.3)
|
(
|
)
|
(
|
)
|
|
|
|
|
(
|
)
|
||||
|
Transfers to assets held for sale (note 2.3)
|
(
|
)
|
(
|
)
|
|
|
|
|
(
|
)
|
||||
|
Other movements
1
|
|
|
|
|
(
|
)
|
|
|
|
|
||||
|
At December 31, 2017
|
|
|
|
|
|
|
|
|
|
|
||||
|
Depreciation charge for the year
|
|
|
|
|
|
|
|
|
|
|
||||
|
Impairment (note 5.3)
|
|
|
|
|
|
|
|
|
|
|
||||
|
Disposals
|
(
|
)
|
(
|
)
|
|
|
(
|
)
|
(
|
)
|
||||
|
Foreign exchange differences
|
(
|
)
|
(
|
)
|
(
|
)
|
(
|
)
|
(
|
)
|
||||
|
Divestments (note 2.3)
|
(
|
)
|
(
|
)
|
|
|
|
|
(
|
)
|
||||
|
Transfers to assets held for sale (note 2.3)
|
(
|
)
|
(
|
)
|
(
|
)
|
|
|
(
|
)
|
||||
|
Other movements
1
|
(
|
)
|
(
|
)
|
|
|
(
|
)
|
(
|
)
|
||||
|
At December 31, 2018
|
|
|
|
|
|
|
|
|
|
|
||||
|
Carrying amount
|
||||||||||||||
|
At December 31, 2017
|
|
|
|
|
|
|
|
|
|
|
||||
|
At December 31, 2018
|
|
|
|
|
|
|
|
|
|
|
||||
|
|
Land, buildings and
Improvements |
Machinery, equipment and other
2
|
Construction in progress
|
Mining
Assets |
Total
|
|||||||||
|
Cost
|
|
|
|
|
|
|||||||||
|
At December 31, 2016
|
|
|
|
|
|
|
|
|
|
|
||||
|
Additions
|
|
|
|
|
|
|
|
|
|
|
||||
|
Foreign exchange differences
|
|
|
|
|
|
|
|
|
|
|
||||
|
Disposals
|
(
|
)
|
(
|
)
|
(
|
)
|
(
|
)
|
(
|
)
|
||||
|
Divestments (note 2.3)
|
(
|
)
|
(
|
)
|
|
|
|
|
(
|
)
|
||||
|
Transfers to assets held for sale (note 2.3)
|
(
|
)
|
(
|
)
|
|
|
|
|
(
|
)
|
||||
|
Other movements
1
|
|
|
|
|
(
|
)
|
|
|
|
|
||||
|
At December 31, 2017
|
|
|
|
|
|
|
|
|
|
|
||||
|
Additions
|
|
|
|
|
|
|
|
|
|
|
||||
|
Acquisitions through business combinations (see note 2.2.4)
|
|
|
|
|
|
|
|
|
|
|
|
|
|
|
|
Foreign exchange differences
|
(
|
)
|
(
|
)
|
(
|
)
|
(
|
)
|
(
|
)
|
||||
|
Disposals
|
(
|
)
|
(
|
)
|
(
|
)
|
(
|
)
|
(
|
)
|
||||
|
Divestments (note 2.3)
|
(
|
)
|
(
|
)
|
(
|
)
|
|
|
(
|
)
|
||||
|
Transfers to assets held for sale (note 2.3)
|
(
|
)
|
(
|
)
|
(
|
)
|
|
|
(
|
)
|
||||
|
Other movements
1
|
|
|
|
|
(
|
)
|
|
|
(
|
)
|
||||
|
At December 31, 2018
|
|
|
|
|
|
|
|
|
|
|
||||
|
Accumulated depreciation and impairment
|
||||||||||||||
|
At December 31, 2016
|
|
|
|
|
|
|
|
|
|
|
||||
|
Depreciation charge for the year
|
|
|
|
|
|
|
|
|
|
|
||||
|
Impairment (note 5.3)
|
|
|
|
|
|
|
|
|
|
|
||||
|
Disposals
|
(
|
)
|
(
|
)
|
(
|
)
|
|
|
(
|
)
|
||||
|
Foreign exchange differences
|
|
|
|
|
|
|
|
|
|
|
||||
|
Divestments (note 2.3)
|
(
|
)
|
(
|
)
|
|
|
|
|
(
|
)
|
||||
|
Transfers to assets held for sale (note 2.3)
|
(
|
)
|
(
|
)
|
|
|
|
|
(
|
)
|
||||
|
Other movements
1
|
|
|
|
|
(
|
)
|
|
|
|
|
||||
|
At December 31, 2017
|
|
|
|
|
|
|
|
|
|
|
||||
|
Depreciation charge for the year
|
|
|
|
|
|
|
|
|
|
|
||||
|
Impairment (note 5.3)
|
|
|
|
|
|
|
|
|
|
|
||||
|
Disposals
|
(
|
)
|
(
|
)
|
|
|
(
|
)
|
(
|
)
|
||||
|
Foreign exchange differences
|
(
|
)
|
(
|
)
|
(
|
)
|
(
|
)
|
(
|
)
|
||||
|
Divestments (note 2.3)
|
(
|
)
|
(
|
)
|
|
|
|
|
(
|
)
|
||||
|
Transfers to assets held for sale (note 2.3)
|
(
|
)
|
(
|
)
|
(
|
)
|
|
|
(
|
)
|
||||
|
Other movements
1
|
(
|
)
|
(
|
)
|
|
|
(
|
)
|
(
|
)
|
||||
|
At December 31, 2018
|
|
|
|
|
|
|
|
|
|
|
||||
|
Carrying amount
|
||||||||||||||
|
At December 31, 2017
|
|
|
|
|
|
|
|
|
|
|
||||
|
At December 31, 2018
|
|
|
|
|
|
|
|
|
|
|
||||
1. Other movements predominantly represent transfers from construction in progress to other categories and retirement of fully amortized assets.
F-50
ARCELORMITTAL AND SUBSIDIARIES
Notes to Consolidated Financial Statements
(millions of U.S. dollars, except share and per share data)
The carrying amount of temporarily idle property, plant and equipment at
December 31, 2018
and
2017
was
260
and
325
including
244
and
297
in Brazil,
14
and
6
in NAFTA and
2
and
22
in the Europe segment, respectively.
The carrying amount of property, plant and equipment retired from active use and not classified as held for sale was
51
and
51
at
December 31, 2018
and
2017
, respectively. Such assets are carried at their recoverable amount.
The Company may enter into arrangements that do not take the legal form of a lease, but may contain a lease. This will be the case if the following two criteria are met:
|
•
|
The fulfillment of the arrangement depends on the use of a specific asset and
|
|
•
|
The arrangement conveys a right to use the asset.
|
Assets under lease arrangements which transfer substantially all of the risks and rewards of ownership to the Company are classified as finance leases. On initial recognition, the leased asset and its related liability are measured at an amount equal to the lower of its fair value and the present value of the minimum lease payments. Subsequent to initial recognition, the asset is accounted for in accordance with the accounting policy applicable to that asset while the minimum lease payments are apportioned between financing costs and reduction of the lease liability.
The carrying amount of capitalized leases was
363
and
415
as of
December 31, 2018
and
2017
,
respectively including
232
and
364
related to machinery and equipment,
93
and
51
to buildings and
38
and
0
to land, respectively.
|
2019
|
|
|
|
2020 – 2023
|
|
|
|
2024 and beyond
|
|
|
|
Total minimum lease commitments
|
|
|
|
Less: future finance charges
|
|
|
|
Present value of minimum lease payments
|
|
|
|
2018
|
|
|
|
2019 – 2022
|
|
|
|
2023 and beyond
|
|
|
|
Total minimum lease commitments
|
|
|
|
Less: future finance charges
|
|
|
|
Present value of minimum lease payments
|
|
|
F-51
ARCELORMITTAL AND SUBSIDIARIES
Notes to Consolidated Financial Statements
(millions of U.S. dollars, except share and per share data)
|
|
Year ended December 31,
|
||||||||
|
Type of asset
|
2018
|
2017
|
2016
|
||||||
|
Goodwill
|
|
|
|
|
|
|
|||
|
Tangible assets
|
|
|
|
|
|
|
|||
|
Total
|
|
|
|
|
|
|
|||
The recoverable amounts of the GCGUs are mainly determined based on their value in use. The value in use of each GCGU is determined by estimating future cash flows. The
2018
impairment test of goodwill did not include the GCGU corresponding to the Mining segment as goodwill allocated to this GCGU was fully impaired in
2015
. The key assumptions for the value in use calculations are primarily the discount rates, growth rates, expected changes to average selling prices, shipments and direct costs during the period. Assumptions for average selling prices and shipments are based on historical experience and expectations of future changes in the market. In addition, with respect to raw material price assumptions, the Company applied a range of
$
60
per tonne to
$
65
per tonne for iron ore and
$
130
per tonne to
$
192
per tonne for coking coal. Cash flow forecasts adjusted for the risks specific to the tested assets are derived from the most recent financial plans approved by management for the next five years. Beyond the specifically forecasted period, the Company extrapolates cash flows for the remaining years based on an estimated growth rate of
2
%
. This rate does not exceed the average long-term growth rate for the relevant markets.
|
|
NAFTA
|
|
Brazil
|
|
Europe
|
|
ACIS
|
|
GCGU weighted average pre-tax discount rate used in 2018 (in %)
|
|
|
|
|
|
|
|
|
GCGU weighted average pre-tax discount rate used in 2017 (in %)
|
|
|
|
|
|
|
|
Once recognized, impairment losses for goodwill are not reversed.
There was
no
impairment charge recognized with respect to goodwill following the Company’s impairment test as of October 1, 2018. The total value in use calculated for all GCGUs increased overall in
2018
as compared to
2017
.
The Company recognized a
18
and
16
impairment loss in connection with the sale of the Votorantim remedies (see note 2.3.1.) and the intended sale of the Ilva remedies (see note 2.3.2.).
In validating the value in use determined for the GCGUs, the Company performed a sensitivity analysis of key assumptions used in the discounted cash-flow model (such as discount rates, average selling prices, shipments and terminal growth rate).
F-52
ARCELORMITTAL AND SUBSIDIARIES
Notes to Consolidated Financial Statements
(millions of U.S. dollars, except share and per share data)
|
2017
|
|||
|
|
ACIS
|
Brazil
|
|
|
Excess of recoverable amount over carrying amount
|
|
|
|
|
Increase in pre-tax discount rate (change in basis points)
|
72
|
140
|
|
|
Decrease in average selling price (change in %)
|
|
|
|
|
Decrease in shipments (change in %)
|
|
|
|
In 2018, given the overall increase in value in use, the Company did not identify any reasonably possible change in key assumptions which could cause an impairment loss to be recognized.
At each reporting date, ArcelorMittal reviews the carrying amounts of its intangible assets (excluding goodwill) and tangible assets to determine whether there is any indication that the carrying amount of those assets may not be recoverable through continuing use. If any such indication exists, the recoverable amount of the asset (or cash generating unit) is reviewed in order to determine the amount of the impairment, if any. The recoverable amount is the higher of its net selling price (fair value reduced by selling costs) and its value in use.
In estimating its value in use, the estimated future cash flows are discounted to their present value using a pre-tax discount rate that reflects current market assessments of the time value of money and the risks specific to the asset (or cash-generating unit). For an asset that does not generate cash inflows largely independent of those from other assets, the recoverable amount is determined for the cash-generating unit to which the asset belongs. The cash-generating unit is the smallest identifiable group of assets corresponding to operating units that generate cash inflows. If the recoverable amount of an asset (or cash-generating unit) is estimated to be less than its carrying amount, an impairment loss is recognized. An impairment loss is recognized as an expense immediately as part of operating income in the consolidated statements of operations.
In the case of permanently idled assets, the impairment is measured at the individual asset level. Otherwise, the Company’s assets are measured for impairment at the cash-generating unit level. In certain instances, the cash-generating unit is an integrated manufacturing facility which may also be an operating subsidiary. Further, a manufacturing facility may be operated in concert with another facility with neither facility generating cash flows that are largely independent from the cash flows of the other. In this instance, the two facilities are combined for purposes of testing for impairment. As of
December 31, 2018
, the Company determined it has
61
cash-generating units.
Impairment charges relating to property, plant and equipment were as follows for the years ended
December 31, 2018
,
2017
and
2016
:
2018
In 2018, the Company recognized a total impairment charge related to property, plant and equipment of
960
including
872
in connection with the intended sale of the Ilva remedies (see note 2.3.2) and
68
in relation to the sale of the Votorantim remedies (see note 2.3.1).
2017
In 2017, the Company recognized a total impairment charge related to property, plant and equipment in AMSA (ACIS) amounting to
206
.
F-53
ARCELORMITTAL AND SUBSIDIARIES
Notes to Consolidated Financial Statements
(millions of U.S. dollars, except share and per share data)
he Company recognized an impairment charge of
46
consisting of the following:
|
Cash-Generating Unit
|
Country
|
Operating Segment
|
Impairment Recorded
|
2017 Pre-Tax Discount Rate
|
2016 Pre-Tax Discount Rate
|
Carrying amount of property, plant and equipment as of June 30, 2017
|
||||||||||
|
Long Steel Products
|
South Africa
|
ACIS
|
|
|
|
%
|
|
%
|
|
|
||||||
|
Cash-Generating Unit
|
Country
|
Operating Segment
|
Impairment Recorded
|
2017 Pre-Tax Discount Rate
|
2016 Pre-Tax Discount Rate
|
Carrying amount of property, plant and equipment as of December 31, 2017
|
||||||||||
|
Vanderbijlpark facility
|
South Africa
|
ACIS
|
|
|
|
%
|
|
%
|
|
|
||||||
|
Long Steel Products
|
South Africa
|
ACIS
|
|
|
|
%
|
|
%
|
|
|
||||||
2016
In 2016, the Company recognized a total impairment charge of property, plant and equipment amounting to
205
.
This charge included
49
in connection with the sale of the ArcelorMittal Zaragoza facility in Spain (Europe segment) on September 30, 2016 (see note 2.3.1).
|
Cash-Generating Unit
|
Country
|
Operating Segment
|
Impairment Recorded
|
2016 Pre-Tax Discount Rate
|
2015 Pre-Tax Discount Rate
|
Carrying amount of property, plant and equipment as of December 31, 2016
|
||||||||||
|
Vanderbijlpark facility
|
South Africa
|
ACIS
|
|
|
|
%
|
|
%
|
|
|
||||||
Financial assets and liabilities mainly comprise:
|
•
|
fair values versus carrying amounts (see note 6.1.1)
|
|
•
|
gross debt (see note 6.1.2)
|
|
•
|
cash and cash equivalents, restricted cash and reconciliations of cash flows (see note 6.1.3)
|
|
•
|
net debt (see note 6.1.4)
|
|
•
|
derivative financial instruments (see note 6.1.5)
|
|
•
|
|
The estimated fair values of certain financial instruments have been determined using available market information or other valuation methodologies that require judgment in interpreting market data and developing estimates. On January 1, 2018 (the date of initial application of IFRS 9), the Company has assessed which business model applies to the financial assets held
F-54
ARCELORMITTAL AND SUBSIDIARIES
Notes to Consolidated Financial Statements
(millions of U.S. dollars, except share and per share data)
by the Company and has classified its financial instruments into the appropriate IFRS 9 categories.
The Company has applied IFRS 9 in accordance with the transition provisions set out in IFRS 9.
Classification and measurement of financial assets
The date of initial application (i.e. the date on which the Company has assessed its existing financial assets and financial liabilities in terms of IFRS 9 requirements) is January 1, 2018. Accordingly, the Company has applied the requirements of IFRS 9 to instruments that continue to be recognized at January 1, 2018 and has not applied the requirements to instruments that have already been derecognized at January 1, 2018. Comparative amounts in relation to instruments that continue to be recognized at January 1, 2018 have been reclassified where appropriate.
Equity investments previously classified as available-for-sale and at cost
The Company elected to present in OCI changes in the fair value of all its equity investments previously classified as available-for-sale and at cost, because these investments are held as long-term strategic investments that are not expected to be sold in the short to medium term. As a result, on January 1, 2018, assets with a carrying amount of
1,444
and
27
were reclassified from assets available-for-sale and investments at cost, respectively, to financial assets at FVOCI.
Trade accounts receivable previously classified as loans and receivables
Trade receivables subject to TSR programs with a carrying amount of
594
were reclassified on January 1, 2018 from loans and receivables at amortized cost to financial assets at FVOCI (see note 4.3).
|
|
Measurement category
|
Carrying amount
|
|||||||||
|
Original (IAS 39)
|
New (IFRS 9)
|
Original
|
New
|
Change
|
|||||||
|
Current financial assets
|
|||||||||||
|
Trade accounts receivable and other
|
Loans and receivables
|
Amortized cost
|
|
|
|
|
|
||||
|
Trade accounts receivable and other subject to TSR programs
|
Loans and receivables
|
FVOCI
|
|
|
|
|
|
||||
|
Cash and cash equivalents
|
Loans and receivables
|
Amortized cost
|
|
|
|
|
|
||||
|
Restricted cash
|
Loans and receivables
|
Amortized cost
|
|
|
|
|
|
||||
|
Prepaid expenses and other current assets
|
Loans and receivables
|
Amortized cost
|
|
|
|
|
|
||||
|
Derivatives
|
Fair value recognized in profit or loss
|
Fair value recognized in profit or loss
|
|
|
|
|
|
||||
|
Non-current financial assets
|
|||||||||||
|
Other assets
|
Loans and receivables
|
Amortized cost
|
|
|
|
|
|
||||
|
Other investments
|
Available-for-sale
|
FVOCI
|
|
|
|
|
|
||||
|
Other investments
|
Investments at cost
|
FVOCI
|
|
|
|
|
|
||||
|
Derivatives
|
Fair value recognized in profit or loss
|
Fair value recognized in profit or loss
|
|
|
|
|
|
||||
F-55
ARCELORMITTAL AND SUBSIDIARIES
Notes to Consolidated Financial Statements
(millions of U.S. dollars, except share and per share data)
The following tables summarize assets and liabilities based on their categories
.
|
|
December 31, 2018
|
||||||||||||||||
|
|
Carrying amount in the consolidated statements of financial position
|
|
Non-financial assets and liabilities
|
|
Assets/Liabilities at amortized cost
|
|
Fair value recognized in profit or loss
|
|
Fair value recognized in OCI
|
|
Derivatives
|
||||||
|
ASSETS
|
|
|
|
|
|
|
|
|
|
|
|
||||||
|
Current assets:
|
|
|
|
|
|
|
|
|
|
|
|
||||||
|
Cash and cash equivalents
|
|
|
|
|
|
|
|
|
|
|
|
|
|
|
|
|
|
|
Restricted cash
|
|
|
|
|
|
|
|
|
|
|
|
|
|
|
|
|
|
|
Trade accounts receivable and other
|
|
|
|
|
|
|
|
|
|
|
|
|
|
|
|
|
|
|
Inventories
|
|
|
|
|
|
|
|
|
|
|
|
|
|
|
|
|
|
|
Prepaid expenses and other current assets
|
|
|
|
|
|
|
|
|
|
|
|
|
|
|
|
|
|
|
Assets held for sale
|
|
|
|
|
|
|
|
|
|
|
|
|
|
|
|
|
|
|
Total current assets
|
|
|
|
|
|
|
|
|
|
|
|
|
|
|
|
|
|
|
|
|
|
|
|
|
|
|
|
|
|
|
|
|
|
|
|
|
|
Non-current assets:
|
|
|
|
|
|
|
|
|
|
|
|
|
|
|
|
|
|
|
Goodwill and intangible assets
|
|
|
|
|
|
|
|
|
|
|
|
|
|
|
|
|
|
|
Property, plant and equipment and biological assets
|
|
|
|
|
|
|
|
|
|
|
|
|
|
|
|
|
|
|
Investments in associates and joint ventures
|
|
|
|
|
|
|
|
|
|
|
|
|
|
|
|
|
|
|
Other investments
|
|
|
|
|
|
|
|
|
|
|
|
|
|
|
|
|
|
|
Deferred tax assets
|
|
|
|
|
|
|
|
|
|
|
|
|
|
|
|
|
|
|
Other assets
|
|
|
|
|
|
|
|
|
|
|
|
|
|
|
|
|
|
|
Total non-current assets
|
|
|
|
|
|
|
|
|
|
|
|
|
|
|
|
|
|
|
Total assets
|
|
|
|
|
|
|
|
|
|
|
|
|
|
|
|
|
|
|
|
|
|
|
|
|
|
|
|
|
|
|
|
|
|
|
|
|
|
LIABILITIES AND EQUITY
|
|
|
|
|
|
|
|
|
|
|
|
|
|
|
|
|
|
|
Current liabilities:
|
|
|
|
|
|
|
|
|
|
|
|
|
|
|
|
|
|
|
Short-term debt and current portion of long-term debt
|
|
|
|
|
|
|
|
|
|
|
|
|
—
|
|
|
|
|
|
Trade accounts payable and other
|
|
|
|
|
|
|
|
|
|
|
|
|
—
|
|
|
|
|
|
Short-term provisions
|
|
|
|
|
|
|
|
|
|
|
|
|
—
|
|
|
|
|
|
Accrued expenses and other liabilities
|
|
|
|
|
|
|
|
|
|
|
|
|
—
|
|
|
|
|
|
Income tax liabilities
|
|
|
|
|
|
|
|
|
|
|
|
|
—
|
|
|
|
|
|
Liabilities held for sale
|
|
|
|
|
|
|
|
|
|
|
|
|
—
|
|
|
|
|
|
Total current liabilities
|
|
|
|
|
|
|
|
|
|
|
|
|
—
|
|
|
|
|
|
|
|
|
|
|
|
|
|
|
|
|
|
|
|
|
|
|
|
|
Non-current liabilities:
|
|
|
|
|
|
|
|
|
|
|
|
|
|
|
|
|
|
|
Long-term debt, net of current portion
|
|
|
|
|
|
|
|
|
|
|
|
|
—
|
|
|
|
|
|
Deferred tax liabilities
|
|
|
|
|
|
|
|
|
|
|
|
|
—
|
|
|
|
|
|
Deferred employee benefits
|
|
|
|
|
|
|
|
|
|
|
|
|
—
|
|
|
|
|
|
Long-term provisions
|
|
|
|
|
|
|
|
|
|
|
|
|
—
|
|
|
|
|
|
Other long-term obligations
|
|
|
|
|
|
|
|
|
|
|
|
|
—
|
|
|
|
|
|
Total non-current liabilities
|
|
|
|
|
|
|
|
|
|
|
|
|
—
|
|
|
|
|
|
|
|
|
|
|
|
|
|
|
|
|
|
|
|
|
|
|
|
|
Equity:
|
|
|
|
|
|
|
|
|
|
|
|
|
|
|
|
|
|
|
Equity attributable to the equity holders of the parent
|
|
|
|
|
|
|
—
|
|
|
—
|
|
|
—
|
|
|
—
|
|
|
Non-controlling interests
|
|
|
|
|
|
|
—
|
|
|
—
|
|
|
—
|
|
|
—
|
|
|
Total equity
|
|
|
|
|
|
|
—
|
|
|
—
|
|
|
—
|
|
|
—
|
|
|
Total liabilities and equity
|
|
|
|
|
|
|
|
|
|
—
|
|
|
—
|
|
|
|
|
F-56
ARCELORMITTAL AND SUBSIDIARIES
Notes to Consolidated Financial Statements
(millions of U.S. dollars, except share and per share data)
|
|
December 31, 2017
|
||||||||||||||||
|
|
Carrying amount in the consolidated statements of financial position
|
Non-financial assets and liabilities
|
Assets/Liabilities at amortized cost
|
Fair value recognized in profit or loss
|
Available-for-sale assets
|
Derivatives
|
|||||||||||
|
ASSETS
|
|||||||||||||||||
|
Current assets:
|
|||||||||||||||||
|
Cash and cash equivalents
|
|
|
|
|
|
|
|
|
|
|
|
|
|||||
|
Restricted cash
|
|
|
|
|
|
|
|
|
|
|
|
|
|||||
|
Trade accounts receivable and other
|
|
|
|
|
|
|
|
|
|
|
|
|
|||||
|
Inventories
|
|
|
|
|
|
|
|
|
|
|
|
|
|||||
|
Prepaid expenses and other current assets
|
|
|
|
|
|
|
|
|
|
|
|
|
|||||
|
Assets held for sale
|
|
|
|
|
|
|
|
|
|
|
|
|
|||||
|
Total current assets
|
|
|
|
|
|
|
|
|
|
|
|
|
|||||
|
Non-current assets:
|
|
|
|
|
|
|
|
|
|
|
|
|
|||||
|
Goodwill and intangible assets
|
|
|
|
|
|
|
|
|
|
|
|
|
|||||
|
Property, plant and equipment and biological assets
|
|
|
|
|
|
|
|
|
|
|
|
|
|||||
|
Investments in associates and joint ventures
|
|
|
|
|
|
|
|
|
|
|
|
|
|||||
|
Other investments
|
|
|
|
|
|
|
|
|
|
|
|
|
|||||
|
Deferred tax assets
|
|
|
|
|
|
|
|
|
|
|
|
|
|||||
|
Other assets
|
|
|
|
|
|
|
|
|
|
|
|
|
|||||
|
Total non-current assets
|
|
|
|
|
|
|
|
|
|
|
|
|
|||||
|
Total assets
|
|
|
|
|
|
|
|
|
|
|
|
|
|||||
|
LIABILITIES AND EQUITY
|
|
|
|
|
|
|
|
|
|
|
|
|
|||||
|
Current liabilities:
|
|
|
|
|
|
|
|
|
|
|
|
|
|||||
|
Short-term debt and current portion of long-term debt
|
|
|
|
|
|
|
|
|
—
|
|
|
|
|||||
|
Trade accounts payable and other
|
|
|
|
|
|
|
|
|
—
|
|
|
|
|||||
|
Short-term provisions
|
|
|
|
|
|
|
|
|
—
|
|
|
|
|||||
|
Accrued expenses and other liabilities
|
|
|
|
|
|
|
|
|
—
|
|
|
|
|||||
|
Income tax liabilities
|
|
|
|
|
|
|
|
|
—
|
|
|
|
|||||
|
Liabilities held for sale
|
|
|
|
|
|
|
|
|
—
|
|
|
|
|||||
|
Total current liabilities
|
|
|
|
|
|
|
|
|
—
|
|
|
|
|||||
|
Non-current liabilities:
|
|
|
|
|
|
|
|
|
|
|
|
|
|||||
|
Long-term debt, net of current portion
|
|
|
|
|
|
|
|
|
—
|
|
|
|
|||||
|
Deferred tax liabilities
|
|
|
|
|
|
|
|
|
—
|
|
|
|
|||||
|
Deferred employee benefits
|
|
|
|
|
|
|
|
|
—
|
|
|
|
|||||
|
Long-term provisions
|
|
|
|
|
|
|
|
|
—
|
|
|
|
|||||
|
Other long-term obligations
|
|
|
|
|
|
|
|
|
—
|
|
|
|
|||||
|
Total non-current liabilities
|
|
|
|
|
|
|
|
|
—
|
|
|
|
|||||
|
Equity:
|
|
|
|
|
|
|
|
|
|
|
|||||||
|
Equity attributable to the equity holders of the parent
|
|
|
|
|
—
|
|
—
|
|
—
|
|
—
|
|
|||||
|
Non-controlling interests
|
|
|
|
|
—
|
|
—
|
|
—
|
|
—
|
|
|||||
|
Total equity
|
|
|
|
|
—
|
|
—
|
|
—
|
|
—
|
|
|||||
|
Total liabilities and equity
|
|
|
|
|
|
|
—
|
|
—
|
|
|
|
|||||
F-57
ARCELORMITTAL AND SUBSIDIARIES
Notes to Consolidated Financial Statements
(millions of U.S. dollars, except share and per share data)
The levels are as follows:
Level 1: Quoted prices in active markets for identical assets or liabilities that the entity can access at the measurement date;
Level 2: Significant inputs other than within Level 1 that are observable for the asset or liability, either directly (i.e.: as prices) or indirectly (i.e.: derived from prices);
|
As of December 31, 2018
|
|
|
|
|
||||||||
|
|
Level 1
|
Level 2
|
Level 3
|
Total
|
||||||||
|
Assets at fair value:
|
|
|
|
|
||||||||
|
Investments in equity instruments at FVOCI
|
|
|
|
|
|
|
|
|
||||
|
Trade accounts receivable and other subject to TSR programs*
|
|
|
|
|
|
|
|
|
||||
|
Derivative financial current assets
|
|
|
|
|
|
|
|
|
||||
|
Derivative financial non-current assets
|
|
|
|
|
|
|
|
|
||||
|
Total assets at fair value
|
|
|
|
|
|
|
|
|
||||
|
Liabilities at fair value:
|
|
|
|
|
|
|
|
|
||||
|
Derivative financial current liabilities
|
|
|
|
|
|
|
|
|
||||
|
Derivative financial non-current liabilities
|
|
|
|
|
|
|
|
|
||||
|
Total liabilities at fair value
|
|
|
|
|
|
|
|
|
||||
*The fair value of TSR program receivables equals carrying amount due to the short time frame between the initial recognition and time of sale.
|
As of December 31, 2017
|
|
|
|
|
||||||||
|
|
Level 1
|
Level 2
|
Level 3
|
Total
|
||||||||
|
Assets at fair value:
|
|
|
|
|
||||||||
|
Available-for-sale financial assets
|
|
|
|
|
|
|
|
|
||||
|
Derivative financial current assets
|
|
|
|
|
|
|
|
|
||||
|
Derivative financial non-current assets
|
|
|
|
|
|
|
|
|
||||
|
Total assets at fair value
|
|
|
|
|
|
|
|
|
||||
|
Liabilities at fair value:
|
|
|
|
|
|
|
|
|
||||
|
Derivative financial current liabilities
|
|
|
|
|
|
|
|
|
||||
|
Derivative financial non-current liabilities
|
|
|
|
|
|
|
|
|
||||
|
Total liabilities at fair value
|
|
|
|
|
|
|
|
|
||||
I
nvestments in equity instruments at FVOCI classified as Level 1 refer to listed securities quoted in active markets. A quoted market price in an active market provides the most reliable evidence of fair value and is used without adjustment to measure fair value whenever available, with limited exceptions. The total fair value is either the price of the most recent trade at the time of the market close or the official close price as defined by the exchange on which the asset is most actively traded on the last trading day of the period, multiplied by the number of units held without consideration of transaction costs. The decrease in investments in equity instruments at FVOCI in 2018 is mainly related to the decrease in the share price of Erdemir and China Oriental.
Derivative financial assets and liabilities classified as Level 2 refer to instruments to hedge fluctuations in interest rates, foreign exchange rates, raw materials (base metals), freight, energy and emission rights, see note 6.1.5 for further information.
F-58
ARCELORMITTAL AND SUBSIDIARIES
Notes to Consolidated Financial Statements
(millions of U.S. dollars, except share and per share data)
|
December 31,
|
|||||
|
2018
|
2017
|
||||
|
Short-term bank loans and other credit facilities including commercial paper
1
|
|
|
|
|
|
|
Current portion of long-term debt
|
|
|
|
|
|
|
Lease obligations
|
|
|
|
|
|
|
Total
|
|
|
|
|
|
|
1.
|
|
In 2014, ArcelorMittal entered into certain short-term committed bilateral credit facilities. The facilities were extended in
2016,
2017
and
2018
. As of
December 31, 2018
, the facilities, totaling approximately
0.9
billion
, remain fully available.
On January 16, 2018, the Company entered into a fully drawn bilateral term loan due July 16, 2018, for an amount of
€
400
million
(
466
). The bilateral term loan was fully repaid at maturity on July 16, 2018.
On August 10, 2018, the Company entered into a
€
300
million
(
344
) term loan with a financial institution maturing on April 30, 2019.
On
December 18, 2018
, ArcelorMittal entered into an agreement for financing with a financial institution for net proceeds of CAD
292
million (
214
) with repayment over several dates in
2019
and
2020
. As of
December 31, 2018
, CAD
295
million (
216
) was outstanding.
Commercial paper
The Company has a commercial paper program enabling borrowings of up to
€
1.5
billion
. As of
December 31, 2018
and 2017, the outstanding amount was
1,295
and
1,125
, respectively.
F-59
ARCELORMITTAL AND SUBSIDIARIES
Notes to Consolidated Financial Statements
(millions of U.S. dollars, except share and per share data)
6.1.2.2
Long-term debt
|
December 31,
|
|||||||||||
|
Year of maturity
|
Type of Interest
|
Interest rate
1
|
2018
|
2017
|
|||||||
|
Corporate
|
|||||||||||
|
5.5 billion Revolving Credit Facility
|
2023
|
Floating
|
|
|
|
|
|||||
|
€500 million Unsecured Notes
2
|
2018
|
Fixed
|
|
|
|
|
|
||||
|
€400 million Unsecured Notes
3
|
2018
|
Floating
|
|
|
|
|
|
||||
|
€750 million Unsecured Notes
|
2019
|
Fixed
|
|
|
|
|
|
||||
|
500 Unsecured Notes
|
2020
|
Fixed
|
|
|
|
|
|
||||
|
CHF 225 million Unsecured Notes
|
2020
|
Fixed
|
|
|
|
|
|
||||
|
€600 million Unsecured Notes
|
2020
|
Fixed
|
|
|
|
|
|
||||
|
1.0 billion Unsecured Bonds
|
2020
|
Fixed
|
|
|
|
|
|
||||
|
1.5 billion Unsecured Notes
|
2021
|
Fixed
|
|
|
|
|
|
||||
|
€500 million Unsecured Notes
|
2021
|
Fixed
|
|
|
|
|
|
||||
|
€750 million Unsecured Notes
|
2022
|
Fixed
|
|
|
|
|
|
||||
|
1.1 billion Unsecured Notes
4
|
2022
|
Fixed
|
|
|
|
|
|
||||
|
€500 million Unsecured Notes
|
2023
|
Fixed
|
|
|
|
|
|
||||
|
500 Unsecured Notes
|
2025
|
Fixed
|
|
|
|
|
|
||||
|
1.5 billion Unsecured Bonds
4
|
2039
|
Fixed
|
|
|
|
|
|
||||
|
1.0 billion Unsecured Notes
4
|
2041
|
Fixed
|
|
|
|
|
|
||||
|
Other loans
|
2019-2021
|
Fixed
|
1.25% - 3.46%
|
|
|
|
|
||||
|
EIB loan
|
2025
|
Fixed
|
|
|
|
|
|
||||
|
7 billion Term Facility
|
2020
|
|
Floating
|
|
|
|
|
|
|
|
|
|
Other loans
|
2019 - 2035
|
Floating
|
0.0% - 5.03%
|
|
|
|
|
||||
|
Total Corporate
|
|
|
|
|
|||||||
|
Americas
|
|||||||||||
|
Other loans
|
2019 - 2025
|
Fixed/Floating
|
2.25% - 10.00%
|
|
|
|
|
||||
|
Total Americas
|
|
|
|
|
|||||||
|
|
|
|
|
|
|
|
|||||
|
Europe, Asia & Africa
|
|||||||||||
|
EBRD Facility
|
2024
|
Floating
|
4.77% - 5.07%
|
|
|
|
|
||||
|
Other loans
|
2019 - 2029
|
Fixed/Floating
|
0.00% - 2.62%
|
|
|
|
|
||||
|
Total Europe, Asia & Africa
|
|
|
|
|
|||||||
|
Total
|
|
|
|
|
|||||||
|
Less current portion of long-term debt
|
(
|
)
|
(
|
)
|
|||||||
|
Total long-term debt (excluding lease obligations)
|
|
|
|
|
|||||||
|
Long-term lease obligations
5
|
|
|
|
|
|||||||
|
Total long-term debt, net of current portion
|
|
|
|
|
|||||||
|
1.
|
Rates applicable to balances outstanding a
t
December 31, 2018
, including the effect of step-downs following rating changes. For debt that has been redeemed in its entirety during
2018
, the interest rates refer to the rates at repayment date.
|
|
2.
|
Amount outstanding was repaid at the original maturity,
March 29, 2018.
|
|
3.
|
Amount outstanding was repaid at the original maturity, April 9, 2018.
|
|
4.
|
Bonds or Notes partially repurchased on August 22, 2018 and September 6, 2018, pursuant to cash tender offer.
|
|
5.
|
Net of current portion of
|
F-60
ARCELORMITTAL AND SUBSIDIARIES
Notes to Consolidated Financial Statements
(millions of U.S. dollars, except share and per share data)
Corporate
5.5 billion Revolving Credit Facility
On December 19, 2018, ArcelorMittal signed an agreement for a
5.5
billion
revolving credit facility (the "Facility"). This Facility amends and restates the
5.5
billion
revolving credit facility dated April 30, 2015 and which was amended and extended on December 21, 2016. The new agreement incorporates a single tranche of
5.5
billion
maturing on December 19, 2023.
The Facility may be used for general corporate purposes. As of
December 31, 2018
, the
5.5
billion
revolving credit facility was fully available.
The Company makes drawdowns from and repayments on this Facility in the framework of its cash management.
Bonds
On March 29, 2018, at maturity, ArcelorMittal repaid the
€
334
million
(
411
) principal amount that remained outstanding,
following the cash tender offers in April 2016 of its
€
500
million
4.5
%
unsecured bonds.
On April 9, 2018, at maturity, ArcelorMittal repaid its
€
400
million
(
491
) 2018 Floating Rate Notes.
On August 7, 2018, pursuant to cash tender offers and financed with existing cash and liquidity, ArcelorMittal purchased:
|
•
|
|
|
•
|
|
As a result of the above mentioned early redemptions, net financing costs for the year ended
December 31, 2018
included
104
of premiums.
On January 17, 2019, ArcelorMittal issued
€
750
million
(
854
)
2.25
%
Notes due 2024. The Notes were issued under ArcelorMittal’s
€
10
billion
wholesale Euro Medium Term Notes Program.
F-61
ARCELORMITTAL AND SUBSIDIARIES
Notes to Consolidated Financial Statements
(millions of U.S. dollars, except share and per share data)
|
Nominal value
|
Date of issuance
|
Repayment date
|
Original/Current interest rate
1
|
Issued at
|
||||
|
€750 million Unsecured Notes
|
Mar 25, 2014
|
Mar 25, 2019
|
|
|
||||
|
500 million Unsecured Notes
|
Jun 1, 2015
|
Jun 1, 2020
|
|
|
||||
|
CHF 225 million Unsecured Notes
|
Jul 3, 2015
|
Jul 3, 2020
|
|
|
||||
|
€600 million Unsecured Notes
|
Jul 4, 2014
|
Jul 6, 2020
|
|
|
||||
|
1.0 billion Unsecured Bonds
|
Aug 5, 2010
|
Aug 5, 2020
|
|
|
||||
|
1.5 billion Unsecured Notes
|
Mar 7, 2011
|
Mar 1, 2021
|
|
|
||||
|
€500 million Unsecured Notes
|
Apr 9, 2015
|
Apr 9, 2021
|
|
|
||||
|
€750 million Unsecured Notes
|
Jan 14, 2015
|
Jan 14, 2022
|
|
|
||||
|
1.1 billion Unsecured Notes
|
Feb 28, 2012
|
Feb 25, 2022
|
|
|
||||
|
€500 million Unsecured Notes
|
Dec 4, 2017
|
Jan 17, 2023
|
|
|
||||
|
500 million Unsecured Notes
|
Jun 1, 2015
|
Jun 1, 2025
|
|
|
||||
|
1.0 billion Unsecured Bonds
|
Oct 8, 2009
|
Oct 15, 2039
|
|
|
||||
|
500 million Unsecured Bonds
|
Aug 5, 2010
|
Oct 15, 2039
|
|
|
||||
|
1.0 billion Unsecured Notes
|
Mar 7, 2011
|
Mar 1, 2041
|
|
|
||||
|
1.
|
Rates applicable at December 31, 2018.
|
European Investment Bank (“EIB”) Loan
On December 16, 2016, ArcelorMittal signed a
€
350
million
finance contract with the European Investment Bank in order to finance European research, development and innovation projects over the period 2017-2020 within the European Union, namely predominantly France, Belgium and Spain, but also in Czech Republic, Poland, Luxembourg and Romania. This operation benefits from a guarantee from the European Union under the European Fund for Strategic Investments. As of
December 31, 2018
,
€
350
million
(
401
)
was fully drawn.
Other loans
On
November 20, 2018
, ArcelorMittal entered into a
7
billion
term facility agreement with a group of lenders in connection with the acquisition of ESIL. The agreement has a term of
one year
(until
November 20, 2019
), subject to ArcelorMittal’s option to extend the term by
six months
. The facility may be used for certain payments by ArcelorMittal as well as by the joint venture through which the Company expects jointly to own and operate ESIL in partnership with Nippon Steel & Sumitomo Metal Corporation (the “Joint Venture”). Any amounts borrowed by the Joint Venture under the agreement are irrevocably and unconditionally guaranteed by ArcelorMittal. The Term Facilities Agreement includes the same Leverage Ratio financial covenant as that included in the Company’s
5.5
billion
revolving credit facility. The Term Facilities Agreement is also subject to certain mandatory prepayment events, including the use of proceeds from debt capital market issuances by the Group or capital raising by the JV group and certain disposals, in each case above
1
billion
.
On
May 14, 2018
, ArcelorMittal entered into a term facility agreement in the amount of 1 billion to make a payment to the financial creditors of Uttam Galva and KSS Petron to clear overdue debts in order that the offer the Company submitted for ESIL on
April 2, 2018
would be eligible and considered by ESIL’s Committee of Creditors. The facility was drawn on
May 14, 2018
in connection with the payment and was repaid on
November 29, 2018
via a drawing under the above-referenced
7
billion
term facility.
Other loans relate to various debt with banks and public institutions.
On October 9, 2017, ArcelorMittal completed the offering of
a
€
300
million
(
344
) variable rate loan in the German Schuldschein market. The proceeds of the issuance were used to repay or prepay existing indebtedness.
F-62
ARCELORMITTAL AND SUBSIDIARIES
Notes to Consolidated Financial Statements
(millions of U.S. dollars, except share and per share data)
Americas
1 billion senior secured asset-based revolving credit facility
On May 23, 2016, ArcelorMittal USA LLC signed a
1
billion
senior secured asset-based revolving credit facility maturing on May 23, 2021. Borrowings under the facility are secured by inventory and certain other working capital and related assets of ArcelorMittal USA and certain of its subsidiaries in the United States. The facility may be used for general corporate purposes. The facility is not guaranteed by ArcelorMittal. As of
December 31, 2018
, the facility is fully available.
Other loans
Other loans relate mainly to loans contracted by ArcelorMittal Brazil with different counterparties.
Europe, Asia and Africa
On December 21, 2017, ArcelorMittal Kryvyi Rih entered into a
175
loan agreement with the European Bank for Reconstruction and Development in order to support the upgrade of its production facilities, energy efficiency improvement and environmental impact reduction. The loan agreement also provides for an additional
175
in loan facilities which are currently uncommitted. As of
December 31, 2018
,
50
was drawn under the agreement and the remainder remains fully available.
On May 25, 2017, ArcelorMittal South Africa signed a
4.5
billion
South African rand revolving borrowing base finance facility maturing on May 25, 2020. Any borrowings under the facility are secured by certain eligible inventory and receivables, as well as certain other working capital and related assets of ArcelorMittal South Africa. The facility is used for general corporate purposes. The facility is not guaranteed by ArcelorMittal. As of December 31, 2018,
0.3
billion
South African rand (
21
) was drawn.
Other loans
Other loans mainly relate to loans contracted by ArcelorMittal in Spain with different counterparties.
Other
Certain debt agreements of the Company or its subsidiaries contain certain restrictive covenants. Among other things, these covenants limit encumbrances on the assets of ArcelorMittal and its subsidiaries, the ability of ArcelorMittal’s subsidiaries to incur debt and the ability of ArcelorMittal and its subsidiaries to dispose of assets in certain circumstances. Certain of these agreements also require compliance with a financial covenant.
Hedge of net investments
As of
April 1, 2018
, the Company designated a portfolio of euro denominated debt (
€
5,169
million
as of
December 31, 2018
) as a hedge of certain euro denominated investments (
€
7,804
million
as of
December 31, 2018
) in order to mitigate the foreign currency risk arising from certain euro denominated subsidiaries' net assets. The risk arises from the fluctuation in spot exchange rates between the U.S. dollar and euro, which causes the amount of the net investments to vary. The hedged risk in the hedge of net investments is a risk of a weakening euro against the U.S. dollar that will result in a reduction in the carrying amount of the Company's net investments in the subsidiaries subject to the hedge. The euro denominated debt is designated as a hedging instrument for the change in the value of the net investments that is attributable to changes in the euro/U.S. dollar spot rate.
To assess the hedge effectiveness, the Company determines the economic relationship between the hedging instrument and the hedged item by comparing changes in the carrying amount of the debt portfolio that are attributable to a change in the spot rate with changes in the net investments in the foreign operations due to movements in the spot rate.
As of
December 31, 2018
, the Company recognized
474
foreign exchange gains arising on the translation of the euro denominated debt designated as a hedge of the euro denominated net investments in foreign operations in other comprehensive income within the foreign exchange translation reserve.
F-63
ARCELORMITTAL AND SUBSIDIARIES
Notes to Consolidated Financial Statements
(millions of U.S. dollars, except share and per share data)
|
Year of maturity
|
Amount
|
||
|
2019
|
|
|
|
|
2020
|
|
|
|
|
2021
|
|
|
|
|
2022
|
|
|
|
|
2023
|
|
|
|
|
Subsequent years
|
|
|
|
|
Total
|
|
|
|
|
December 31, 2018
|
December 31, 2017
|
||||||||||
|
Carrying Amount
|
Estimated Fair Value
|
Carrying Amount
|
Estimated Fair Value
|
||||||||
|
Instruments payable bearing interest at fixed rates
|
|
|
|
|
|
|
|
|
|||
|
Instruments payable bearing interest at variable rates
|
|
|
|
|
|
|
|
|
|||
|
Total long-term debt, including current portion
|
|
|
|
|
|
|
|
|
|||
|
Short term bank loans and other credit facilities including commercial paper
|
|
|
|
|
|
|
|
|
|||
The following tables summarize the Company’s bases used to estimate its debt at fair value. Fair value measurement has been classified into three levels based upon a fair value hierarchy that reflects the significance of the inputs used in making the measurements.
|
As of December 31, 2018
|
Carrying amount
|
Fair Value
|
||||||||||||
|
Level 1
|
Level 2
|
Level 3
|
Total
|
|||||||||||
|
Instruments payable bearing interest at fixed rates
|
|
|
|
|
|
|
|
|
|
|
||||
|
Instruments payable bearing interest at variable rates
|
|
|
|
|
|
|
|
|
|
|
||||
|
Total long-term debt, including current portion
|
|
|
|
|
|
|
|
|
|
|
||||
|
Short term bank loans and other credit facilities including commercial paper
|
|
|
|
|
|
|
|
|
|
|
||||
|
As of December 31, 2017
|
Carrying amount
|
Fair Value
|
||||||||||||
|
Level 1
|
Level 2
|
Level 3
|
Total
|
|||||||||||
|
Instruments payable bearing interest at fixed rates
|
|
|
|
|
|
|
|
|
|
|
||||
|
Instruments payable bearing interest at variable rates
|
|
|
|
|
|
|
|
|
|
|
||||
|
Total long-term debt, including current portion
|
|
|
|
|
|
|
|
|
|
|
||||
|
Short term bank loans and other credit facilities including commercial paper
|
|
|
|
|
|
|
|
|
|
|
||||
Instruments payable classified as Level 1 refer to the Company’s listed bonds quoted in active markets. The total fair value is the official closing price as defined by the exchange on which the instrument is most actively traded on the last trading day of the period, multiplied by the number of units held without consideration of transaction costs.
Instruments payable classified as Level 2 refer to all debt instruments not classified as Level 1. The fair value of the debt is based on estimated future cash flows converted into U.S. dollar at the forward rate and discounted using current U.S. dollar zero coupon rates and ArcelorMittal’s credit spread quotations for the relevant maturities.
F-64
ARCELORMITTAL AND SUBSIDIARIES
Notes to Consolidated Financial Statements
(millions of U.S. dollars, except share and per share data)
|
December 31,
|
|||||
|
2018
|
2017
|
||||
|
Cash at bank
|
|
|
|
|
|
|
Term deposits
|
|
|
|
|
|
|
Money market funds
1
|
|
|
|
|
|
|
Total
|
|
|
|
|
|
|
1
|
|
F-65
ARCELORMITTAL AND SUBSIDIARIES
Notes to Consolidated Financial Statements
(millions of U.S. dollars, except share and per share data)
|
Long-term debt, net of current portion
|
Short-term debt and current portion of long term debt
|
||||
|
Balance as of December 31, 2016
|
|
|
|
|
|
|
Proceeds from long-term debt
|
|
|
—
|
|
|
|
Payments of long-term debt
|
(
|
)
|
—
|
|
|
|
Amortized cost
|
|
|
|
|
|
|
Unrealized foreign exchange effects
|
|
|
|
|
|
|
Proceeds from short-term debt
|
—
|
|
|
|
|
|
Payments of short-term debt
1
|
—
|
|
(
|
)
|
|
|
Current portion of long-term debt
|
(
|
)
|
|
|
|
|
Other movements
2
|
|
|
|
|
|
|
Balance as of December 31, 2017 (note 6.1.2)
|
|
|
|
|
|
|
Proceeds from long-term debt
|
|
|
—
|
|
|
|
Payments of long-term debt
|
(
|
)
|
—
|
|
|
|
Amortized cost
|
|
|
|
|
|
|
Unrealized foreign exchange effects
|
(
|
)
|
(
|
)
|
|
|
Proceeds from short-term debt
|
—
|
|
|
|
|
|
Payments of short-term debt
1
|
—
|
|
(
|
)
|
|
|
Current portion of long-term debt
|
(
|
)
|
|
|
|
|
Debt acquired through business combinations
|
|
|
|
|
|
|
Debt classified as held for sale (2.3.2)
|
(
|
)
|
—
|
|
|
|
Other movements
2
|
|
|
|
|
|
|
Balance as of December 31, 2018 (note 6.1.2)
|
|
|
|
|
|
|
1.
|
Cash payments decreasing the outstanding liability relating to finance leases are classified under other financing activities in the Company's consolidated statements of cash flows.
|
|
2.
|
|
|
As of December 31, 2018
|
Total USD
|
|
EUR
|
|
USD
|
|
CHF
|
|
INR
|
|
CAD
|
|
Other
(in USD) |
|
||||||
|
Short-term debt and current portion of long-term debt
|
|
|
|
|
|
|
|
|
|
|
|
|
|
|
||||||
|
Long-term debt, net of current portion
|
|
|
|
|
|
|
|
|
|
|
|
|
|
|
||||||
|
Cash and cash equivalents including restricted cash
|
(
|
)
|
(
|
)
|
(
|
)
|
(
|
)
|
(
|
)
|
(
|
)
|
(
|
)
|
||||||
|
Net debt
|
|
|
|
|
|
|
|
|
(
|
)
|
|
|
(
|
)
|
||||||
|
As of December 31, 2017
|
Total USD
|
|
EUR
|
|
USD
|
|
CHF
|
|
ZAR
|
|
CAD
|
|
Other
(in USD) |
|
||||||
|
Short-term debt and current portion of long-term debt
|
|
|
|
|
|
|
|
|
|
|
|
|
|
|
||||||
|
Long-term debt, net of current portion
|
|
|
|
|
|
|
|
|
|
|
|
|
|
|
||||||
|
Cash and cash equivalents including restricted cash
|
(
|
)
|
(
|
)
|
(
|
)
|
(
|
)
|
(
|
)
|
(
|
)
|
(
|
)
|
||||||
|
Net debt
|
|
|
|
|
|
|
|
|
|
|
|
|
(
|
)
|
||||||
F-66
ARCELORMITTAL AND SUBSIDIARIES
Notes to Consolidated Financial Statements
(millions of U.S. dollars, except share and per share data)
Changes in the fair value of a derivative that is designated and qualifies as a cash flow hedge are recorded in other comprehensive income. Amounts deferred in equity are recorded in the consolidated statements of operations in the periods when the hedged item is recognized in the consolidated statements of operations and within the same line item (see note 6.3 Cash flow hedges).
The Company formally assesses, both at the hedge’s inception and on an ongoing basis, whether the derivatives that are used in hedging transactions are effective in offsetting changes in fair values or cash flows of hedged items. When a hedging instrument is sold, terminated, expired or exercised, the accumulated unrealized gain or loss on the hedging instrument is maintained in equity until the forecasted transaction occurs. If the hedged transaction is no longer probable, the cumulative unrealized gain or loss, which had been recognized in equity, is reported immediately in the consolidated statements of operations.
Foreign currency differences arising on the translation of a financial liability designated as a hedge of a net investment in a foreign operation are recognized directly as a separate component of equity, to the extent that the hedge is effective. To the extent that the hedge is ineffective, such differences are recognized in the consolidated statements of operations (see note 6.3 Net investment hedge).
F-67
ARCELORMITTAL AND SUBSIDIARIES
Notes to Consolidated Financial Statements
(millions of U.S. dollars, except share and per share data)
Derivative financial instruments classified as Level 2:
|
December 31, 2018
|
|||||||||||
|
Assets
|
Liabilities
|
||||||||||
|
Notional Amount
|
Fair Value
|
Notional Amount
|
Fair Value
|
||||||||
|
Foreign exchange rate instruments
|
|
|
|
|
|
|
|
|
|||
|
Forward purchase contracts
|
|
|
|
|
|
|
(
|
)
|
|||
|
Forward sale contracts
|
|
|
|
|
|
|
(
|
)
|
|||
|
Currency swaps purchases
|
|
|
|
|
|
|
|
|
|||
|
Currency swaps sales
|
|
|
|
|
|
|
(
|
)
|
|||
|
Exchange option purchases
|
|
|
|
|
|
|
|
|
|||
|
Exchange options sales
|
|
|
|
|
|
|
(
|
)
|
|||
|
Total foreign exchange rate instruments
|
|
|
|
|
|
|
(
|
)
|
|||
|
|
|
|
|
|
|
|
|
||||
|
Raw materials (base metals), freight, energy, emission rights
|
|
|
|
|
|
|
|
|
|||
|
Term contracts sales
|
|
|
|
|
|
|
(
|
)
|
|||
|
Term contracts purchases
|
|
|
|
|
|
|
(
|
)
|
|||
|
Total raw materials (base metals), freight, energy, emission rights
|
|
|
|
|
|
|
(
|
)
|
|||
|
Total
|
|
|
|
|
|
|
(
|
)
|
|||
|
December 31, 2017
|
||||||||||||||
|
Assets
|
Liabilities
|
|||||||||||||
|
Notional Amount
|
Fair Value
|
Average Rate
1
|
Notional Amount
|
Fair Value
|
Average Rate
1
|
|||||||||
|
Interest rate swaps - fixed rate borrowing/loans
|
|
|
|
|
|
%
|
—
|
|
|
%
|
||||
|
Foreign exchange rate instruments
|
|
|
|
|
|
|
|
|
||||||
|
Forward purchase contracts
|
|
|
|
|
|
|
(
|
)
|
||||||
|
Forward sale contracts
|
|
|
|
|
|
|
(
|
)
|
||||||
|
Currency swaps purchases
|
|
|
|
|
|
|
(
|
)
|
||||||
|
Currency swaps sales
|
|
|
|
|
|
|
(
|
)
|
||||||
|
Exchange option purchases
|
|
|
|
|
|
|
(
|
)
|
||||||
|
Exchange options sales
|
|
|
|
|
|
|
(
|
)
|
||||||
|
Total foreign exchange rate instruments
|
|
|
|
|
|
|
(
|
)
|
||||||
|
|
|
|
|
|
|
|
|
|||||||
|
Raw materials (base metals), freight, energy, emission rights
|
|
|
|
|
|
|
|
|
||||||
|
Term contracts sales
|
|
|
|
|
|
|
(
|
)
|
||||||
|
Term contracts purchases
|
|
|
|
|
|
|
(
|
)
|
||||||
|
Option sales/purchases
|
|
|
|
|
|
|
|
|
||||||
|
Total raw materials (base metals), freight, energy, emission rights
|
|
|
|
|
|
|
(
|
)
|
||||||
|
Total
|
|
|
|
|
|
|
(
|
)
|
||||||
1. The average rate is determined for fixed rate instruments on basis of the U.S. dollar and foreign currency rates and for variable rate instruments generally
Derivative financial assets and liabilities classified as Level 2 refer to instruments to hedge fluctuations in interest rates, foreign exchange rates, raw materials (base metals), freight, energy and emission rights. The total fair value is based on the price a dealer would pay or receive for the security or similar securities, adjusted for any terms specific to that asset or liability. Market inputs are obtained from well-established and recognized vendors of market data and the fair value is calculated using standard industry models based on significant observable market inputs such as foreign exchange rates, commodity prices, swap rates and interest rates.
F-68
ARCELORMITTAL AND SUBSIDIARIES
Notes to Consolidated Financial Statements
(millions of U.S. dollars, except share and per share data)
Derivative financial instruments classified as Level 3:
Derivative financial non-current assets classified as Level 3 refer to the call option on the
1,000
mandatory convertible bonds (see note 10.2). The fair valuation of Level 3 derivative instruments is established at each reporting date and compared to the prior period. ArcelorMittal’s valuation policies for Level 3 derivatives are an integral part of its internal control procedures and have been reviewed and approved according to the Company’s principles for establishing such procedures. In particular, such procedures address the accuracy and reliability of input data, the accuracy of the valuation model and the knowledge of the staff performing the valuations.
ArcelorMittal establishes the fair valuation of the call option on the
1,000
mandatory convertible bonds through the use of binomial valuation models based on the estimated values of the underlying equity spot price of
$
219
and volatility of
24.33
%
. Binomial valuation models use an iterative procedure to price options, allowing for the specification of nodes, or points in time, during the time span between the valuation date and the option’s expiration date. In contrast to the Black-Scholes model, which provides a numerical result based on inputs, the binomial model allows for the calculation of the asset and the option for multiple periods along with the range of possible results for each period.
Observable input data used in the valuations include zero coupon yield curves, stock market prices of Erdemir and China Oriental, European Central Bank foreign exchange fixing rates and Libor interest rates. Unobservable inputs are used to measure fair value to the extent that relevant observable inputs are not available. Specifically the Company computes unobservable volatility data based mainly on the movement of Erdemir and China Oriental stock market prices observable in the active market over 90 working days, which is particularly sensitive for the valuation resulting from the model. A
10%
increase or decrease in Hera Ermac share prices would result in a
28
%
and
26
%
increase and decrease of the fair value of the call option at
December 31, 2018
, respectively.
Derivative financial liabilities classified as Level 3 relate to a pellet purchase agreement that contains a special payment that varies according to the price of steel in the United States domestic market (“domestic steel price”). The Company concluded that this payment feature was an embedded derivative not closely related to the host contract. ArcelorMittal establishes the fair valuation of the special payment by comparing the current forecasted domestic steel price to the projected domestic steel price at the inception of the contract. Observable input data includes third-party forecasted domestic steel prices. Unobservable inputs are used to measure fair value to the extent that relevant observable inputs are not available or not consistent with the Company’s views on future prices and refer specifically to domestic steel prices beyond the timeframe of available third-party forecasts. A U.S. dollar one
cha
nge per metric ton in the price of hot rolled steel would result in a
U.S. dollar
ten cents
per metric ton change in the price of iron ore. Any significant increase in the steel price would result in a significant increase in fair value, and vice versa. As of December 31, 2018, the fair valuation of the pellet purchase agreement was based on the future average US domestic steel price of
$
633
per metric ton.
Derivative financial liabilities classified as Level 3 relate also to the put option granted to ISP in the context of the acquisition of Ilva (see note 2.2.4). The option exercise price is the higher of a reference operating income projection and the net present value of ISP's initial
€
100
million
equity contribution bearing interest at a contractually agreed rate at the put option exercise date. The fair value of the put option liability is sensitive to unobservable inputs such as ArcelorMittal Italia's future cash flow projections. Observable inputs include ISP's credit rating.
|
|
Put option with ISP
1
|
|
Call option on 1,000 mandatory convertible bonds
|
|
Special payment in pellet purchase agreement
|
|
Total
|
||||
|
Balance as of December 31, 2016
|
|
|
|
|
|
|
(
|
)
|
|
|
|
|
Change in fair value
|
|
|
|
|
|
|
(
|
)
|
|
|
|
|
Balance as of December 31, 2017
|
|
|
|
|
|
|
(
|
)
|
|
|
|
|
Change in fair value
|
(
|
)
|
|
(
|
)
|
|
(
|
)
|
|
(
|
)
|
|
Balance as of December 31, 2018
|
(
|
)
|
|
|
|
|
(
|
)
|
|
(
|
)
|
|
1.
|
|
F-69
ARCELORMITTAL AND SUBSIDIARIES
Notes to Consolidated Financial Statements
(millions of U.S. dollars, except share and per share data)
In relation to the impairment of financial assets, IFRS 9 requires an expected credit loss (ECL) model as opposed to an incurred credit loss model under IAS 39. The ECL model requires the Group to account for expected credit losses and changes in those ECL at each reporting date to reflect changes in credit risk since initial recognition of the financial assets. In particular, IFRS 9 requires the Group to measure the loss allowance for a financial instrument at an amount equal to the lifetime ECL if the credit risk on that financial instrument has increased significantly since initial recognition.
In the case of investments in equity instruments at FVOCI, all fair value movements, including the difference between the acquisition cost and the current fair value are recorded in OCI and are no longer reclassified to the consolidated statements of operations. Equity investments at FVOCI are exempted from the annual impairment test under IFRS 9 because the fair value of the equity investments recorded in OCI are not recycled to Profit and Loss.
|
Year ended December 31,
|
||||||||
|
2018
|
2017
|
2016
|
||||||
|
Interest expense
|
(
|
)
|
(
|
)
|
(
|
)
|
||
|
Interest income
|
|
|
|
|
|
|
||
|
Change in fair value adjustment on call option on mandatory convertible bonds and pellet purchase agreement (note 6.1.5)
|
(
|
)
|
|
|
|
|
||
|
Accretion of defined benefit obligations and other long term liabilities
|
(
|
)
|
(
|
)
|
(
|
)
|
||
|
Net foreign exchange result
|
(
|
)
|
|
|
(
|
)
|
||
|
Other
1
|
(
|
)
|
(
|
)
|
(
|
)
|
||
|
Total
|
(
|
)
|
(
|
)
|
(
|
)
|
||
|
1.
|
|
F-70
ARCELORMITTAL AND SUBSIDIARIES
Notes to Consolidated Financial Statements
(millions of U.S. dollars, except share and per share data)
The Company's operations expose it to a variety of financial risks: interest rate risk, foreign exchange risk, liquidity risk and risks in fluctuations in prices of raw materials, freight and energy. The Company actively monitors and seeks to reduce volatility of these exposures through a diversity of financial instruments, where considered appropriate. The Company has formalized how it manages these risks within the Treasury and Financial Risk Management Policy, which has been approved by Management.
Capital management
The Company's objective when managing capital is to safeguard continuity, maintain a strong credit rating and healthy capital ratios to support its business and provide adequate return to shareholders through continuing growth.
The Company sets the amount of capital required on the basis of annual business and long-term operating plans which include capital and other strategic investments. The funding requirement is met through a combination of equity, bonds and other long-term and short-term borrowings.
|
|
December 31,
|
||||
|
|
2018
|
|
2017
|
||
|
Total equity
|
|
|
|
|
|
|
Net debt (including 67 cash and debt classified as held for sale as of December 31, 2018)
|
|
|
|
|
|
|
Gearing
|
|
%
|
|
|
%
|
Interest rate risk
The Company is exposed to interest rate risk on short-term and long-term floating rate instruments and on refinancing of fixed rate debt. The Company's policy is to maintain a balance of fixed and floating interest rate borrowings, which is adjusted depending on the prevailing market interest rates and outlook. As at December 31, 2018, the long-term debt was comprised of
83
%
fixed rate debt and
17
%
variable rate debt (note 6.1.2). The Company utilizes certain instruments to manage interest rate risks. Interest rate instruments allow the Company to borrow long-term at fixed or variable rates, and to swap the rate of this debt either at inception or during the lifetime of the borrowing. The Company and its counterparties exchange, at predefined intervals, the difference between the agreed fixed rate and the variable rate, calculated on the basis of the notional amount of the swap. Similarly, swaps may be used for the exchange of variable rates against other variable rates.
Foreign exchange rate risk
The Company is exposed to changes in values arising from foreign exchange rate fluctuations generated by its operating activities. Because a substantial portion of ArcelorMittal’s assets, liabilities, sales and earnings are denominated in currencies other than the U.S. dollar (its reporting currency), ArcelorMittal has an exposure to fluctuations and depreciation in the values of these currencies relative to the U.S. dollar. These currency fluctuations, especially the fluctuation of the value of the U.S. dollar relative to the euro, the Canadian dollar, Brazilian real, Polish Zloty, Kazakh tenge, South African rand and Ukrainian hryvnia, as well as fluctuations in the other countries’ currencies in which ArcelorMittal has significant operations and/or sales, could have a material impact on its financial position, cash flows and results of operations.
ArcelorMittal faces transaction risk, where its businesses generate sales in one currency but incur costs relating to that revenue in a different currency. For example, ArcelorMittal’s non-U.S. subsidiaries may purchase raw materials, including iron ore and coking coal, in U.S. dollars, but may sell finished steel products in other currencies. Consequently, an appreciation of the U.S. dollar will increase the cost of raw materials; thereby having a negative impact on the Company’s operating margins, unless the Company is able to pass along the higher cost in the form of higher selling prices.
Following its Treasury and Financial Risk Management Policy, the Company hedges a portion of its net exposure to foreign exchange rates through forwards, options and swaps.
F-71
ARCELORMITTAL AND SUBSIDIARIES
Notes to Consolidated Financial Statements
(millions of U.S. dollars, except share and per share data)
ArcelorMittal also faces foreign currency translation risk, which arises when ArcelorMittal translates the statements of operations of its subsidiaries, its corporate net debt (note 6.1.4) and other items denominated in currencies other than the U.S. dollar, for inclusion in the consolidated financial statements. The Company manages translation risk arising from its investments in subsidiaries by monitoring the currency mix of the consolidated statements of financial position. The Company may enter into derivative transactions to hedge the residual exposure, and currently designated an
EUR/USD cross currency swap with a notional of
1,000
to hedge euro denominated net investments in foreign operations (see “—Net investment hedge”).
The Company also uses the derivative instruments, described above, at the corporate level to hedge debt recorded in foreign currency other than the functional currency or the balance sheet risk associated with certain monetary assets denominated in a foreign currency other than the functional currency.
In October 2018, the Company entered into hedging programs including non deliverable forwards and non deliverable options for a nominal amount of
$
5.9
billion
in order to hedge the volatility between Indian Rupee and U.S. dollar in relation to the proposed acquisition of ESIL.
Foreign currency sensitivity analysis
|
December 31, 2018
|
|||||
|
Trade receivables
|
Trade payables
|
||||
|
USD
|
|
|
|
|
|
|
EUR
|
|
|
|
|
|
|
BRL
|
|
|
|
|
|
|
CAD
|
|
|
|
|
|
|
KZT
|
|
|
|
|
|
|
ZAR
|
|
|
|
|
|
|
MXN
|
|
|
|
|
|
|
UAH
|
|
|
|
|
|
|
PLN
|
|
|
|
|
|
|
ARS
|
|
|
|
|
|
|
Other (non-USD)
|
|
|
|
|
|
|
Total
|
|
|
|
|
|
|
|
10% increase
|
|
10% decrease
|
||||||||
|
|
Trade receivables
|
|
Trade payables
|
|
Trade receivables
|
|
Trade payables
|
||||
|
EUR
|
|
|
|
|
|
|
|
|
|
|
|
|
BRL
|
|
|
|
|
|
|
|
|
|
|
|
|
CAD
|
|
|
|
|
|
|
|
|
|
|
|
|
KZT
|
|
|
|
|
|
|
|
|
|
|
|
|
ZAR
|
|
|
|
|
|
|
|
|
|
|
|
|
MXN
|
|
|
|
|
|
|
|
|
|
|
|
|
UAH
|
|
|
|
|
|
|
|
|
|
|
|
|
PLN
|
|
|
|
|
|
|
|
|
|
|
|
|
ARS
|
|
|
|
|
|
|
|
|
|
|
|
F-72
ARCELORMITTAL AND SUBSIDIARIES
Notes to Consolidated Financial Statements
(millions of U.S. dollars, except share and per share data)
The use of a
10
%
sensitivity rate is used when reporting foreign currency exposure internally to key management personnel and represents management’s assessment of the reasonably possible change in foreign exchange rates. The sensitivity analysis includes trade receivables and trade payables denominated in a currency other than the U.S. dollar and adjusts their translation at the period end for a
10
%
change in foreign currency rates. A positive number indicates an increase in profit, and a negative number a decrease in profit.
The Company determines the economic relationship between the hedged item and the hedging instrument by analyzing the critical terms of the hedge relationship. In case critical terms do not match and fair value changes in the hedging instrument cannot be expected to perfectly offset changes in the fair value of the hedged item, further qualitative analysis may be performed. Such analysis serves to establish whether the economic relationship is sufficiently strong to comply with the Company’s risk management policies.
The hedge ratio is set out in the Company's risk management strategy and may be individually tailored for each hedging program in the risk management objective. Hedge ratios below 100% would usually be applied on hedging of forecast exposures with the hedge ratio typically reducing where there is uncertainty due to long hedging tenors or volatility in the underlying exposure.
Liquidity Risk
Liquidity risk is the risk that the Company may encounter difficulties in meeting its obligations associated with financial liabilities that are settled by delivering cash. ArcelorMittal Treasury is responsible for the Company's funding and liquidity management. ArcelorMittal’s principal sources of liquidity are cash generated from its operations, its credit lines at the corporate level and various working capital credit lines at the level of its operating subsidiaries. The Company actively manages its liquidity. Following the Company's Treasury and Financial Risk Management Policy, the levels of cash, credit lines and debt are closely monitored and appropriate actions are taken in order to comply with the covenant ratios, leverage, fixed/floating ratios, maturity profile and currency mix.
|
December 31, 2018
|
|||||||||||||||||
|
Carrying amount
|
Contractual Cash Flow
|
2019
|
2020
|
from 2021 to 2023
|
After 2023
|
||||||||||||
|
Non-derivative financial liabilities
|
|||||||||||||||||
|
Bonds
|
(
|
)
|
(
|
)
|
(
|
)
|
(
|
)
|
(
|
)
|
(
|
)
|
|||||
|
Loans over 100
|
(
|
)
|
(
|
)
|
(
|
)
|
(
|
)
|
(
|
)
|
(
|
)
|
|||||
|
Trade and other payables
|
(
|
)
|
(
|
)
|
(
|
)
|
|
|
|
|
|
|
|||||
|
Other loans
|
(
|
)
|
(
|
)
|
(
|
)
|
(
|
)
|
(
|
)
|
(
|
)
|
|||||
|
Total
|
(
|
)
|
(
|
)
|
(
|
)
|
(
|
)
|
(
|
)
|
(
|
)
|
|||||
|
Derivative financial liabilities
|
|
|
|
|
|
|
|
|
|
|
|
|
|
|
|
|
|
|
Equity contracts (Put options)
|
(
|
)
|
|
(
|
)
|
|
|
|
|
|
|
|
(
|
)
|
|
|
|
|
Foreign exchange contracts
|
(
|
)
|
|
(
|
)
|
|
(
|
)
|
|
(
|
)
|
|
(
|
)
|
|
(
|
)
|
|
Other commodities contracts
1
|
(
|
)
|
|
(
|
)
|
|
(
|
)
|
|
(
|
)
|
|
(
|
)
|
|
(
|
)
|
|
Total
|
(
|
)
|
|
(
|
)
|
|
(
|
)
|
|
(
|
)
|
|
(
|
)
|
|
(
|
)
|
|
1.
|
Commodity contracts include base metals, freight, energy and emission rights.
|
F-73
ARCELORMITTAL AND SUBSIDIARIES
Notes to Consolidated Financial Statements
(millions of U.S. dollars, except share and per share data)
|
December 31, 2017
|
|||||||||||||||||
|
Carrying amount
|
Contractual Cash Flow
|
2018
|
2019
|
from 2020 to 2022
|
After 2022
|
||||||||||||
|
Non-derivative financial liabilities
|
|||||||||||||||||
|
Bonds
|
(
|
)
|
(
|
)
|
(
|
)
|
(
|
)
|
(
|
)
|
(
|
)
|
|||||
|
Loans over 100
|
(
|
)
|
(
|
)
|
(
|
)
|
(
|
)
|
(
|
)
|
(
|
)
|
|||||
|
Trade and other payables
|
(
|
)
|
(
|
)
|
(
|
)
|
|
|
|
|
|
|
|||||
|
Other loans
|
(
|
)
|
(
|
)
|
(
|
)
|
(
|
)
|
(
|
)
|
(
|
)
|
|||||
|
Total
|
(
|
)
|
(
|
)
|
(
|
)
|
(
|
)
|
(
|
)
|
(
|
)
|
|||||
|
Derivative financial liabilities
|
|||||||||||||||||
|
Foreign exchange contracts
|
(
|
)
|
(
|
)
|
(
|
)
|
|
|
(
|
)
|
(
|
)
|
|||||
|
Other commodities contracts
1
|
(
|
)
|
(
|
)
|
(
|
)
|
(
|
)
|
(
|
)
|
(
|
)
|
|||||
|
Total
|
(
|
)
|
(
|
)
|
(
|
)
|
(
|
)
|
(
|
)
|
(
|
)
|
|||||
|
1.
|
|
The sensitivity analysis carried out by the Company considers the effects on its trade receivables and trade payables of a
10
%
increase or decrease between the relevant foreign currencies and the U.S. dollar.
The use of a
10
%
sensitivity rate is used when reporting foreign currency exposure internally to key management personnel and represents management’s assessment of the reasonably possible change in foreign exchange rates. The sensitivity analysis includes trade receivables and trade payables denominated in a currency other than the U.S. dollar and adjusts their translation at the period end for a
10
%
change in foreign currency rates. A positive number indicates an increase in profit, and a negative number a decrease in profit.
F-74
ARCELORMITTAL AND SUBSIDIARIES
Notes to Consolidated Financial Statements
(millions of U.S. dollars, except share and per share data)
Cash flow hedges
|
December 31, 2018
|
|||||||||||||||||
|
Assets/ (liabilities)
|
(Outflows)/inflows
|
||||||||||||||||
|
Fair value
|
3 months and less
|
3-6 months
|
6-12 months
|
2020
|
After 2020
|
||||||||||||
|
Foreign exchange contracts
|
|
|
|
|
|
|
|
|
(
|
)
|
(
|
)
|
|||||
|
Commodities
|
(
|
)
|
(
|
)
|
(
|
)
|
|
|
(
|
)
|
(
|
)
|
|||||
|
Emission rights
|
|
|
|
|
|
|
|
|
|
|
|
|
|||||
|
Total
|
|
|
|
|
|
|
|
|
|
|
(
|
)
|
|||||
|
December 31, 2017
|
|||||||||||||||||
|
Assets/ (liabilities)
|
(Outflows)/inflows
|
||||||||||||||||
|
Fair value
|
3 months and less
|
3-6 months
|
6-12 months
|
2019
|
After 2019
|
||||||||||||
|
Foreign exchange contracts
|
(
|
)
|
(
|
)
|
(
|
)
|
(
|
)
|
|
|
|
|
|||||
|
Commodities
|
|
|
|
|
|
|
|
|
|
|
|
|
|||||
|
Emission rights
|
(
|
)
|
|
|
|
|
(
|
)
|
|
|
|
|
|||||
|
Total
|
(
|
)
|
(
|
)
|
(
|
)
|
(
|
)
|
|
|
|
|
|||||
Associated gains or losses that were recognized in other comprehensive income are reclassified from equity to the consolidated statements of operations in the same period during which the hedged forecasted cash flow affects the consolidated statements of operations. The following table presents the periods in which the realized and unrealized gains or losses on derivatives designated as cash flows hedges recognized in other comprehensive income, net of tax, are expected to impact the consolidated statements of operations:
|
December 31, 2018
|
|||||||||||||||||
|
Assets/ (liabilities)
|
(Expense)/income
|
||||||||||||||||
|
Carrying amount
|
3 months and less
|
3-6 months
|
6-12 months
|
2020
|
After 2020
|
||||||||||||
|
Foreign exchange contracts
|
|
|
|
|
|
|
|
|
|
|
|
|
|||||
|
Commodity contracts
|
(
|
)
|
(
|
)
|
(
|
)
|
(
|
)
|
(
|
)
|
(
|
)
|
|||||
|
Emission rights
|
|
|
|
|
|
|
|
|
|
|
|
|
|||||
|
Total
|
|
|
|
|
|
|
|
|
(
|
)
|
|
|
|||||
|
December 31, 2017
|
|||||||||||||||||
|
Assets/ (liabilities)
|
(Expense)/income
|
||||||||||||||||
|
Carrying amount
|
3 months and less
|
3-6 months
|
6-12 months
|
2019
|
After 2019
|
||||||||||||
|
Foreign exchange contracts
|
(
|
)
|
(
|
)
|
(
|
)
|
(
|
)
|
|
|
|
|
|||||
|
Commodity contracts
|
|
|
|
|
|
|
|
|
|
|
|
|
|||||
|
Emission rights
|
|
|
|
|
|
|
|
|
|
|
|
|
|||||
|
Total
|
(
|
)
|
(
|
)
|
(
|
)
|
(
|
)
|
|
|
|
|
|||||
F-75
ARCELORMITTAL AND SUBSIDIARIES
Notes to Consolidated Financial Statements
(millions of U.S. dollars, except share and per share data)
|
|
December 31, 2018
|
||||||||||||||
|
Hedging Instruments
|
Nominal amount of the hedging instrument
|
|
Assets carrying amount
|
|
Liabilities carrying amount
|
|
Line item in the statement of financial position where the hedging instrument is located
|
|
Changes in fair value used for calculated hedge ineffectiveness
|
Line item in the statement of comprehensive income that includes the recognized hedge ineffectiveness
|
|||||
|
Cash flow hedges
|
|
|
|
|
|
|
|
|
|
||||||
|
Foreign exchange risk - Option/Forward contracts
|
|
|
|
|
|
|
|
|
|
Prepaid expenses and other current assets
|
|
|
|
n/a
|
|
|
Price risk - Commodities forwards
|
|
|
|
|
|
|
(
|
)
|
|
Accrued expenses and other liabilities
|
|
|
|
n/a
|
|
|
Price risk - Commodities forwards
|
|
|
|
|
(
|
)
|
Other long-term obligations
|
|
|
n/a
|
|||||
|
Price risk - Energy forwards
|
|
|
|
|
(
|
)
|
Other long-term obligations
|
|
|
n/a
|
|||||
|
Price risk - Emission rights forwards
|
|
|
|
|
|
|
Prepaid expenses and other current assets
|
(
|
)
|
Financing costs - net
|
|||||
|
Price risk - Emission rights forwards
|
|
|
|
|
|
|
|
|
|
Other assets
|
|
|
|
n/a
|
|
|
Total
|
|
|
|
|
|
|
(
|
)
|
|
|
|
(
|
)
|
||
|
|
December 31, 2018
|
|||||||||
|
Hedging Instruments
|
Hedging gains or losses of the reporting period that were recognized in OCI
|
|
Change in value used for calculating hedge ineffectiveness for 2018
|
Line item in the statement of comprehensive income that includes the recognized hedge ineffectiveness
|
Cash flow hedge reserve
|
|||||
|
|
|
|||||||||
|
Cash flow hedges
|
|
|
|
|
|
|||||
|
Foreign exchange risk - Option/Forward contracts
|
|
|
|
|
|
n/a
|
|
|
||
|
Price risk - Commodities forwards
|
(
|
)
|
|
|
|
n/a
|
(
|
)
|
||
|
Price risk - Energy forwards
|
(
|
)
|
|
|
n/a
|
(
|
)
|
|||
|
Price risk - Emission rights forwards
|
|
|
|
(
|
)
|
Financing costs - net
|
|
|
||
|
Total
|
|
|
|
(
|
)
|
|
|
|
||
|
|
December 31, 2017
|
||||||||||||||
|
Hedging Instruments
|
Nominal amount of the hedging instrument
|
|
Assets carrying amount
|
|
Liabilities carrying amount
|
|
Line item in the statement of financial position where the hedging instrument is located
|
|
Changes in fair value used for calculated hedge ineffectiveness
|
Line item in the statement of comprehensive income that includes the recognized hedge ineffectiveness
|
|||||
|
Cash flow hedges
|
|
|
|
|
|
|
|
|
|
||||||
|
Foreign exchange risk - Option contracts
|
|
|
|
|
|
|
(
|
)
|
|
Accrued expenses and other liabilities
|
|
|
|
n/a
|
|
|
Price risk - Option/Commodities forwards
|
|
|
|
|
|
|
(
|
)
|
|
Accrued expenses and other liabilities
|
|
|
|
n/a
|
|
|
Price risk - Emission rights forwards
|
|
|
|
|
|
|
(
|
)
|
|
Accrued expenses and other liabilities
|
|
(
|
)
|
Financing costs - net
|
|
|
Total
|
|
|
|
|
|
|
(
|
)
|
|
|
|
(
|
)
|
||
F-76
ARCELORMITTAL AND SUBSIDIARIES
Notes to Consolidated Financial Statements
(millions of U.S. dollars, except share and per share data)
|
|
December 31, 2017
|
|||||||||
|
Hedging Instruments
|
Hedging gains or losses of the reporting period that were recognized in OCI
|
Change in value used for calculating hedge ineffectiveness for 2017
|
Line item in the statement of comprehensive income that includes the recognized hedge ineffectiveness
|
Cash flow hedge reserve
|
||||||
|
|
||||||||||
|
Cash flow hedges
|
||||||||||
|
Foreign exchange risk - Option contracts
|
(
|
)
|
|
|
n/a
|
(
|
)
|
|||
|
Price risk - Commodities forwards
|
(
|
)
|
|
|
n/a
|
|
|
|||
|
Price risk - Emission rights forwards
|
|
|
(
|
)
|
Financing costs - net
|
|
|
|||
|
Total
|
(
|
)
|
(
|
)
|
(
|
)
|
||||
Net investment hedge
In December 2014, the Company entered into euro/U.S. dollar cross currency swaps (“CCS”) to hedge an euro denominated net investment in foreign operations amounting to
€
303
million
, and designated them as a net investment hedge. The euro/U.S. dollar CCS with a notional of
375
were unwound on January 14, 2016. A deferred gain of
83
, net of a deferred tax expense of
24
, will be recycled to the consolidated statements of operations when the hedged assets are disposed of.
On May 27, 2015, the Company entered into additional euro/U.S. dollar CCS with a notional of
1,000
to hedge an euro denominated net investment in foreign operations amounting to
€
918
million
, and designated them as a net investment hedge. As of
December 31, 2018
and
2017
, the euro/U.S. dollar CCS have a fair value loss of
101
, net of a deferred tax of
28
, and a fair value loss of
157
, net of a deferred tax of
44
, respectively. Fair value movements have been recorded in the consolidated statements of other comprehensive income. The fair value of the CCS is included in other long-term obligations in the consolidated statements of financial position. The CCS is categorized as Level 2.
As of April 1, 2018, the Company designated a portfolio of euro denominated debt (
€
5,169
million
as of December 31,
2018
) as a hedge of certain euro denominated investments (
€
7,804
million
as of December 31,
2018
) in order to mitigate the foreign currency risk arising from certain euro denominated subsidiaries net assets. The risk arises from the fluctuation of the euro/U.S dollar spot rate, which causes the amount of the net investments to vary. The euro denominated debt is designated as hedging instrument for the change in the value of the net investments that is attributable to changes in the euro/U.S dollar spot rate. As of December 31,
2018
, the Company recognized
474
foreign exchange gains ari
sing on the translation of the euro denominated debt designated as a hedge of the euro denominated net investments in foreign operations in other comprehensive income within the foreign exchange translation reserve.
The hedge is categorized as Level 2.
|
December 31, 2018
|
||||||||||
|
Derivatives
|
Notional amount
|
Date traded
|
Fair value at
December 31, 2017 |
Change in fair value
|
Fair value as of December 31, 2018
1
|
|||||
|
CCS 5Y
|
|
May 27, 2015
|
(
|
|
(
|
|||||
|
CCS 10Y
|
|
May 27, 2015
|
(
|
|
(
|
|||||
|
CCS 10Y
|
|
May 27, 2015
|
(
|
|
(
|
|||||
|
CCS 10Y
|
|
May 27, 2015
|
(
|
|
(
|
|||||
|
Total
|
|
|
(
|
|
(
|
|||||
|
1.
|
|
F-77
ARCELORMITTAL AND SUBSIDIARIES
Notes to Consolidated Financial Statements
(millions of U.S. dollars, except share and per share data)
|
|
December 31, 2018
|
|||||||||||||||||
|
Hedging Instruments
|
Nominal amount of the hedging instrument
|
Assets carrying amount
|
Liabilities carrying amount
|
Line item in the statement of financial position where the hedging instrument is located
|
Change in value used for calculating hedge ineffectiveness for 2018
|
Line item in the statement of comprehensive income that includes the recognized hedge ineffectiveness
|
Cash flow hedge reserve
|
|||||||||||
|
Net investment hedges
|
||||||||||||||||||
|
Foreign exchange risk - Cross Currency Swap
|
|
|
|
|
(
|
)
|
Other long-term obligations
|
|
|
n/a
|
|
|
||||||
|
Foreign exchange risk - EUR debt
|
|
|
|
|
(
|
)
|
Short-term debt and current portion of long-term debt; long-term debt, net of current portion
|
|
|
n/a
|
|
|
||||||
|
Total
|
|
|
|
|
(
|
)
|
|
|
|
|
||||||||
|
December 31, 2017
|
||||||||||
|
Derivatives
|
Notional amount
|
Date traded
|
Fair value at
December 31, 2016 |
Change in fair value
|
Fair value as of December 31, 2017
1
|
|||||
|
CCS 5Y
|
|
May 27, 2015
|
|
(
|
(
|
|||||
|
CCS 10Y
|
|
May 27, 2015
|
(
|
(
|
(
|
|||||
|
CCS 10Y
|
|
May 27, 2015
|
(
|
(
|
(
|
|||||
|
CCS 10Y
|
|
May 27, 2015
|
(
|
(
|
(
|
|||||
|
Total
|
|
(
|
(
|
(
|
||||||
|
1.
|
|
|
|
December 31, 2017
|
|||||||||||||||||
|
Hedging Instrument
|
Nominal amount of the hedging instrument
|
Assets carrying amount
|
Liabilities carrying amount
|
Line item in the statement of financial position in which the hedged item is located
|
Change in value used for calculating hedge ineffectiveness for 2017
|
Line item in the statement of comprehensive income that includes the recognized hedge ineffectiveness
|
Cash flow hedge reserve
|
|||||||||||
|
Net investment hedge
|
||||||||||||||||||
|
Foreign exchange risk - Cross Currency Swap
|
|
|
|
|
(
|
)
|
Other long-term obligations
|
|
|
n/a
|
(
|
)
|
||||||
|
Total
|
|
|
|
|
(
|
)
|
|
|
(
|
)
|
||||||||
Raw materials, freight, energy risks and emission rights
The Company is exposed to risks in fluctuations in prices of raw materials (including base metals such as zinc, nickel, aluminum, tin, copper and iron ore), freight and energy, both through the purchase of raw materials and through sales contracts. The Company uses financial instruments such as forward purchases or sales, options and swaps in order to manage the volatility of prices of certain raw materials, freight and energy.
F-78
ARCELORMITTAL AND SUBSIDIARIES
Notes to Consolidated Financial Statements
(millions of U.S. dollars, except share and per share data)
|
December 31,
|
|||
|
2018
|
2017
|
||
|
Base metals
|
(
|
|
|
|
Freight
|
|
|
|
|
Energy (oil, gas, electricity)
|
(
|
|
|
|
Emission rights
|
|
(
|
|
|
Total
|
|
(
|
|
|
Derivative assets associated with raw materials, energy, freight and emission rights
|
|
|
|
|
Derivative liabilities associated with raw materials, energy, freight and emission rights
|
(
|
(
|
|
|
Total
|
|
(
|
|
ArcelorMittal consumes large amounts of raw materials (the prices of which are related to the London Metals Exchange price index, the Steel Index and Platts Index), ocean freight (the price of which is related to a Baltic Exchange Index), and energy (the prices of which are mainly related to the New York Mercantile Exchange energy index (NYMEX), the European Energy Exchange (EEX) power indexes, the powernext gas indexes). As a general matter, ArcelorMittal is exposed to price volatility with respect to its purchases in the spot market and under its long-term supply contracts. In accordance with its risk management policy, ArcelorMittal hedges a part of its exposure related to raw materials procurements.
Emission rights
Pursuant to the application of the European Directive 2003/87/EC of October 13, 2003, as amended by the European Directive 2009/29/EC of April 23, 2009, establishing a scheme for emission allowance trading, the Company enters into certain types of derivatives (mainly forward transactions and options) in order to implement its management policy for associated risks. As of
December 31, 2018
and
2017
, the Company had a net notional position of
1,170
with a net positive fair value of
317
and a net notional position of
484
with a net negative fair value of
37
, respectively.
Credit risk
The Company’s treasury department monitors various market data regarding the credit standings and overall reliability of the financial institutions for all countries where the Company’s subsidiaries operate. The choice of the financial institution for the financial transactions must be approved by the treasury department. Credit risk related to customers, customer credit terms and receivables are discussed in note 4.3.
Sensitivity analysis
Foreign currency sensitivity
The sensitivity analysis includes the Company’s complete portfolio of foreign currency derivatives outstanding. The impact on the non €/$ derivatives reflects the estimated move of such currency pairs, when the U.S. dollar appreciates or depreciates
10
%
against the euro, based on computations of correlations in the foreign exchange markets in
2018
and
2017
.
|
December 31, 2018
|
|||
|
Income
|
Other Equity
|
||
|
10% strengthening in U.S. dollar
|
|
(
|
|
|
10% weakening in U.S. dollar
|
(
|
|
|
F-79
ARCELORMITTAL AND SUBSIDIARIES
Notes to Consolidated Financial Statements
(millions of U.S. dollars, except share and per share data)
|
December 31, 2017
|
|||
|
Income
|
Other Equity
|
||
|
10% strengthening in U.S. dollar
|
(
|
|
|
|
10% weakening in U.S. dollar
|
|
(
|
|
Cash flow sensitivity analysis for variable rate instruments
|
December 31, 2018
|
|||
|
Floating porting of net debt
1
|
Interest Rate Swaps/Forward Rate Agreements
|
||
|
100 bp increase
|
|
|
|
|
100 bp decrease
|
(
|
|
|
|
December 31, 2017
|
|||
|
Floating porting of net debt
1
|
Interest Rate Swaps/Forward Rate Agreements
|
||
|
100 bp increase
|
|
|
|
|
100 bp decrease
|
(
|
|
|
|
1.
|
|
Base metals, energy, freight, emissions rights
|
|
December 31, 2018
|
||
|
|
Income
|
|
Other Equity Cash Flow Hedging Reserves
|
|
+10% in prices
|
|
|
|
|
Base Metals
|
(
|
|
|
|
Iron Ore
|
|
|
|
|
Freight
|
|
|
|
|
Emission rights
|
|
|
|
|
Energy
|
|
|
|
|
-10% in prices
|
|
|
|
|
Base Metals
|
|
|
(
|
|
Iron Ore
|
|
|
(
|
|
Freight
|
(
|
|
|
|
Emission rights
|
|
|
(
|
|
Energy
|
|
|
(
|
F-80
ARCELORMITTAL AND SUBSIDIARIES
Notes to Consolidated Financial Statements
(millions of U.S. dollars, except share and per share data)
|
December 31, 2017
|
|||
|
Income
|
Other Equity Cash Flow Hedging Reserves
|
||
|
+10% in prices
|
|||
|
Base Metals
|
|
|
|
|
Iron Ore
|
|
|
|
|
Emission rights
|
|
|
|
|
Energy
|
|
|
|
|
-10% in prices
|
|||
|
Base Metals
|
(
|
(
|
|
|
Iron Ore
|
|
|
|
|
Emission rights
|
|
(
|
|
|
Energy
|
(
|
|
|
|
|
Year Ended December 31,
|
|||||||
|
Employee Information
|
2018
|
2017
|
2016
|
|||||
|
Wages and salaries
|
|
|
|
|
|
|
||
|
Pension cost (see note 7.2)
|
|
|
|
|
|
|
||
|
Loss/(gain) following new labor agreement in the U.S. (see note 7.2)
|
|
|
|
|
(
|
)
|
||
|
Other staff expenses
|
|
|
|
|
|
|
||
|
Total
|
|
|
|
|
|
|
||
|
|
Year Ended December 31,
|
||||
|
|
2018
|
2017
|
2016
|
||
|
Base salary and directors fees
|
|
|
|
||
|
Short-term performance-related bonus
|
|
|
|
||
|
Post-employment benefits
|
|
|
|
||
|
Share-based compensation
|
|
|
|
||
The fair value of the stock options granted and shares allocated based on Restricted Share Unit (“RSU”) and Preference Share Unit (“PSU”) plans to the ArcelorMittal’s key management personnel is recorded as an expense in the consolidated statements of operations over the relevant vesting periods.
F-81
ARCELORMITTAL AND SUBSIDIARIES
Notes to Consolidated Financial Statements
(millions of U.S. dollars, except share and per share data)
Defined contribution plans are those plans where ArcelorMittal pays fixed or determinable contributions to external life insurance or other funds for certain categories of employees. Contributions are paid in return for services rendered by the employees during the period. Contributions are expensed as incurred consistent with the recognition of wages and salaries.
Defined benefit plans are those plans that provide guaranteed benefits to certain categories of employees, either by way of contractual obligations or through a collective agreement. For defined benefit plans, the cost of providing benefits is determined using the projected unit credit method, with actuarial valuations being carried out each fiscal year.
The retirement benefit obligation recognized in the consolidated statements of financial position represents the present value of the defined benefit obligation less the fair value of plan assets. The present value of the defined benefit obligation is determined by discounting the estimated future cash outflows using interest rates of high quality corporate bonds that are denominated in the currency in which the benefits will be paid, and that have terms to maturity approximating the terms of the related pension obligation. In countries where there is no deep market in such bonds, the market rates on government bonds are used. Remeasurement arising from experience adjustments and changes in actuarial assumptions are charged or credited to other comprehensive income in the period in which they arise. Any asset resulting from this calculation is limited to the present value of available refunds and reductions in future contributions to the plan.
Current service cost, which is the increase of the present value of the defined benefit obligation resulting from the employee service in the current period, is recorded as an expense as part of cost of sales and selling, general and administrative expenses in the consolidated statements of operations. The net interest cost, which is the change during the period in the net defined benefit liability or asset that arises from the passage of time, is recognized as part of financing costs net in the consolidated statements of operations.
The Company recognizes gains and losses on the settlement of a defined benefit plan when the settlement occurs. The gain or loss on settlement comprises any resulting change in the fair value of plan assets and any change in the present value of the defined benefit obligation. Past service cost is the change in the present value of the defined benefit obligation resulting from a plan amendment or a curtailment. Past service cost is recognized immediately in the consolidated statements of operations in the period in which it arises.
Voluntary retirement plans primarily correspond to the practical implementation of social plans or are linked to collective agreements signed with certain categories of employees.
Early retirement plans are those plans that primarily correspond to terminating an employee’s contract following the decision of the employee before the normal retirement date. Liabilities for early retirement plans are recognized when the affected employees have formally been informed and when amounts owed have been determined using an appropriate actuarial calculation. Liabilities relating to the early retirement plans are calculated annually on the basis of the number of employees that have taken or contractually agreed to take early retirement and are discounted using an interest rate that corresponds to that of high quality bonds that have maturity dates similar to the terms of the Company’s early retirement obligations. Termination benefits are provided in connection with voluntary separation plans. The Company recognizes a liability and expense when it can no longer withdraw the offer or, if earlier, when it has a detailed formal plan which has been communicated to employees or their representatives.
Other long-term employee benefits include various plans that depend on the length of service, such as long service and sabbatical awards, disability benefits and long-term compensated absences such as sick leave. The amount recognized as a liability is the present value of benefit obligations at the consolidated statements of financial position date, and all changes in the provision (including actuarial gains and losses or past service costs) are recognized in the consolidated statements of operations in the period in which they arise.
F-82
ARCELORMITTAL AND SUBSIDIARIES
Notes to Consolidated Financial Statements
(millions of U.S. dollars, except share and per share data)
The expense associated with the above pension plans and post-employment benefits, as well as the carrying amount of the related liability/asset on the consolidated statements of financial position are based on a number of assumptions and factors such as discount rates, expected rate of compensation increase, healthcare cost trend rates, mortality rates and retirement rates.
|
•
|
Discount rates – The discount rate is based on several high quality corporate bond indexes and yield curves in the appropriate jurisdictions (rated AA by a recognized rating agency). In countries where there is no deep market in such bonds, the market rates on government bonds are used. Nominal interest rates vary worldwide due to exchange rates and local inflation rates.
|
|
•
|
Rate of compensation increase – The rate of compensation increase reflects actual experience and the Company’s long-term outlook, including contractually agreed wage rate increases for represented hourly employees.
|
|
•
|
Healthcare cost trend rate – The healthcare cost trend rate is based on historical retiree cost data, near-term healthcare outlook, including appropriate cost control measures implemented by the Company, and industry benchmarks and surveys.
|
|
•
|
|
Statements of Financial Position
|
|
December 31,
|
||||
|
|
2018
|
2017
|
|||
|
Pension plan benefits
|
|
|
|
|
|
|
Other post-employment benefits
|
|
|
|
|
|
|
Early retirement benefits
|
|
|
|
|
|
|
Defined benefit liabilities
|
|
|
|
|
|
|
Termination benefits
|
|
|
|
|
|
|
Total
|
|
|
|
|
|
The early retirement benefits and termination benefits are mainly related to European countries (Belgium, Spain, Germany and Luxembourg).
Pension plans
A summary of the significant defined benefit pension plans is as follows:
U.S.
ArcelorMittal USA’s pension plan is a non-contributory defined benefit plan covering approximately
13
%
of its employees. Certain non-represented salaried employees hired before 2003 receive pension benefits which are determined under a “Cash Balance” formula as an account balance which grows with interest credits and allocations based on a percentage of pay. Certain wage and salaried employees represented by a union hired before November 2005 receive a monthly benefit at retirement based on a fixed rate and years of service. These plans are closed to new participants.
Represented employees hired after November 2005 and employees at locations which were acquired from International Steel Group Inc. receive defined pension benefits through a multi-employer pension plan that is accounted for as a defined contribution plan, due to the limited information made available to each of the
483
(as of
December 31, 2017
) different participating employers. ArcelorMittal USA’s labor agreement with the United Steelworkers (“USW”) on September 1, 2018 increased the contributions to the multi-employer plan to
$
3.50
per contributory hour from
$
2.80
.
Changes to the defined pension plan under the new labor agreement, principally for a higher monthly benefit rate for certain periods of service, resulted in an expense of
25
recorded in cost of sales in the consolidated statements of operations in 2018
.
F-83
ARCELORMITTAL AND SUBSIDIARIES
Notes to Consolidated Financial Statements
(millions of U.S. dollars, except share and per share data)
Canada
The primary pension plans are those of ArcelorMittal Dofasco, AMMIC and ArcelorMittal Long Products Canada.
The ArcelorMittal Dofasco pension plan is a hybrid plan providing the benefits of both a defined benefit and defined contribution pension plan. The defined contribution component is financed by both employer and employee contributions. The employer’s defined contribution is based on a percentage of company profits. The defined benefit pension plan was closed for new hires on December 31, 2010 and replaced by a new defined contribution pension plan with contributions related to age, service and earnings.
At the end of 2012, ArcelorMittal Dofasco froze and capped benefits for the majority of its hourly and salaried employees who were still accruing service under the defined benefit plan and began transitioning these employees to the new defined contribution pension plan for future pension benefits.
The AMMIC defined benefit plan provides salary related benefit for non-union employees and a flat dollar pension depending on an employee’s length of service for union employees. This plan was closed for new non-union hires on December 31, 2009 and replaced by a defined contribution pension plan with contributions related to age and service. Effective January 1, 2015, AMMIC implemented a plan to transition its non-union employees who were still benefiting under the defined benefit plan to a defined contribution pension plan. Transition dates can extend up to January 1, 2025 depending on the age and service of each member.
ArcelorMittal Long Products Canada sponsors several defined benefit and defined contribution pension plans for its various groups of employees, with most defined benefit plans closed to new entrants several years ago. The primary defined benefit pension plan sponsored by ArcelorMittal Long Products Canada provides certain unionized employees with a flat dollar pension depending on an employee’s length of service.
ArcelorMittal Long Products Canada entered into a six-year collective labor agreement during the third quarter of 2014 with its Contrecoeur-West union group. The defined benefit plan was closed to new hires. A new defined contribution type arrangement was established for new hires.
Brazil
The primary defined benefit plans, financed through trust funds, have been closed to new entrants. Brazilian entities have all established defined contribution plans that are financed by employer and employee contributions. On December 28, 2018, the Brazilian Autarchy that oversees pension funds called PREVIC (Complementary Pension National Superintendence) approved a planned settlement of the major defined benefit plans. This settlement is expected to be effective in 2019
.
Europe
Certain European operating subsidiaries maintain primarily unfunded defined benefit pension plans for a certain number of employees. Benefits are based on such employees’ length of service and applicable pension table under the terms of individual agreements. Some of these unfunded plans have been closed to new entrants and replaced by defined contribution pension plans for active members financed by employer and employee contributions.
As from December 2015 new Belgian legislation modifies the minimum guaranteed rates of return applicable to Belgian defined contribution plans. For insured plans, the rates of
3.25
%
on employer contributions and
3.75
%
on employee contributions will continue to apply to the accumulated pre-2016 contributions. For contributions paid as from January 1, 2016, a new variable minimum guaranteed rate of return applies. For 2016, 2017 and 2018, the minimum guaranteed rate of return was
1.75
%
and this is also the best estimate for 2019. Due to the statutory minimum guaranteed return, Belgian defined contribution plans do not meet the definition of defined contribution plans under IFRS. Therefore, the Belgian defined contribution plans are classified as defined benefit plans.
On April 25, 2016, the Company agreed with unions in France to cap the annual indexation of the IRUS pension plan until 2026 and to pay a lump sum amount to cover the indexation obligation for subsequent years. These changes resulted in a gain of
96
recorded in cost of sales and selling, general and administrative expenses in the statements of operations.
F-84
ARCELORMITTAL AND SUBSIDIARIES
Notes to Consolidated Financial Statements
(millions of U.S. dollars, except share and per share data)
Others
A very limited number of defined benefit plans are in place in other countries (such as South Africa, Mexico, Kazakhstan, Ukraine and Morocco).
On January 1, 2018, ArcelorMittal South Africa settled its defined benefit plan. This discontinued its participation in the fund and, therefore, ArcelorMittal South Africa no longer has any financial obligation to ensure the funding of the remaining plan. Accordingly, the related benefit obligation, the plan assets and unrecoverable surplus were derecognized from the 2018 consolidated statements of financial position. The only remaining pension plans for ArcelorMittal South Africa are defined contribution pension plans that are financed by employer and employee contributions.
The majority of the funded defined benefit pension plans described earlier provide benefit payments from trustee-administered funds. ArcelorMittal also sponsors a number of unfunded plans where the Company meets the benefit payment obligation as it falls due. Plan assets held in trusts are legally separated from the Company and are governed by local regulations and practice in each country, as is the nature of the relationship between the Company and the governing bodies and their composition. In general terms, governing bodies are required by law to act in the best interest of the plan members and are responsible for certain tasks related to the plan (e.g. setting the plan's investment policy).
In case of the funded pension plans, the investment positions are managed within an asset-liability matching ("ALM") framework that has been developed to achieve long-term investments that are in line with the obligations of the pension plans.
A long-term investment strategy has been set for ArcelorMittal’s major funded pension plans, with its asset allocation comprising of a mixture of equity securities, fixed income securities, real estate and other appropriate assets. This recognizes that different asset classes are likely to produce different long-term returns and some asset classes may be more volatile than others. The long-term investment strategy ensures, in particular, that investments are adequately diversified.
F-85
ARCELORMITTAL AND SUBSIDIARIES
Notes to Consolidated Financial Statements
(millions of U.S. dollars, except share and per share data)
|
|
Year ended December 31, 2018
|
||||||||||||||||
|
|
Total
|
|
United States
|
|
Canada
|
|
Brazil
|
|
Europe
|
|
Other
|
||||||
|
Change in benefit obligation
|
|
|
|
|
|
|
|
|
|
|
|
||||||
|
Benefit obligation at beginning of the period
|
|
|
|
|
|
|
|
|
|
|
|
|
|
|
|
|
|
|
Current service cost
|
|
|
|
|
|
|
|
|
|
|
|
|
|
|
|
|
|
|
Interest cost on DBO
|
|
|
|
|
|
|
|
|
|
|
|
|
|
|
|
|
|
|
Past service cost - Plan amendments
|
|
|
|
|
|
|
|
|
|
|
|
|
|
|
|
|
|
|
Plan participants’ contribution
|
|
|
|
|
|
|
|
|
|
|
|
|
|
|
|
|
|
|
Settlements
|
(
|
)
|
|
|
|
|
(
|
)
|
|
|
|
|
|
|
|
(
|
)
|
|
Actuarial (gain) loss
|
(
|
)
|
|
(
|
)
|
|
(
|
)
|
|
|
|
|
(
|
)
|
|
(
|
)
|
|
Demographic assumptions
|
|
|
|
|
|
|
|
|
|
|
|
|
|
|
|
|
|
|
Financial assumptions
|
(
|
)
|
|
(
|
)
|
|
(
|
)
|
|
|
|
|
(
|
)
|
|
(
|
)
|
|
Experience adjustment
|
|
|
|
(
|
)
|
|
|
|
|
|
|
|
(
|
)
|
|
|
|
|
Benefits paid
|
(
|
)
|
|
(
|
)
|
|
(
|
)
|
|
(
|
)
|
|
(
|
)
|
|
(
|
)
|
|
Termination benefits
|
|
|
|
|
|
|
|
|
|
|
|
|
|
|
|
|
|
|
Foreign currency exchange rate differences and other movements
|
(
|
)
|
|
|
|
|
(
|
)
|
|
(
|
)
|
|
(
|
)
|
|
|
|
|
Benefit obligation at end of the period
|
|
|
|
|
|
|
|
|
|
|
|
|
|
|
|
|
|
|
|
|
|
|
|
|
|
|
|
|
|
|
|
|
|
|
|
|
|
Change in plan assets
|
|
|
|
|
|
|
|
|
|
|
|
|
|
|
|
|
|
|
Fair value of plan assets at beginning of the period
|
|
|
|
|
|
|
|
|
|
|
|
|
|
|
|
|
|
|
Interest income on plan assets
|
|
|
|
|
|
|
|
|
|
|
|
|
|
|
|
|
|
|
Return on plan assets greater/(less) than discount rate
|
(
|
)
|
|
(
|
)
|
|
(
|
)
|
|
|
|
|
(
|
)
|
|
|
|
|
Employer contribution
|
|
|
|
|
|
|
|
|
|
|
|
|
|
|
|
|
|
|
Plan participants’ contribution
|
|
|
|
|
|
|
|
|
|
|
|
|
|
|
|
|
|
|
Settlement
|
(
|
)
|
|
|
|
|
(
|
)
|
|
|
|
|
|
|
|
(
|
)
|
|
Benefits paid
|
(
|
)
|
|
(
|
)
|
|
(
|
)
|
|
(
|
)
|
|
(
|
)
|
|
|
|
|
Foreign currency exchange rate differences and other movements
|
(
|
)
|
|
|
|
|
(
|
)
|
|
(
|
)
|
|
(
|
)
|
|
(
|
)
|
|
Fair value of plan assets at end of the period
|
|
|
|
|
|
|
|
|
|
|
|
|
|
|
|
|
|
|
|
|
|
|
|
|
|
|
|
|
|
|
|
|
|
|
|
|
|
Present value of the wholly or partly funded obligation
|
(
|
)
|
|
(
|
)
|
|
(
|
)
|
|
(
|
)
|
|
(
|
)
|
|
(
|
)
|
|
Fair value of plan assets
|
|
|
|
|
|
|
|
|
|
|
|
|
|
|
|
|
|
|
Net present value of the wholly or partly funded obligation
|
(
|
)
|
|
(
|
)
|
|
(
|
)
|
|
(
|
)
|
|
(
|
)
|
|
(
|
)
|
|
Present value of the unfunded obligation
|
(
|
)
|
|
(
|
)
|
|
(
|
)
|
|
(
|
)
|
|
(
|
)
|
|
(
|
)
|
|
Prepaid due to unrecoverable surpluses
|
(
|
)
|
|
|
|
|
(
|
)
|
|
(
|
)
|
|
(
|
)
|
|
|
|
|
Net amount recognized
|
(
|
)
|
|
(
|
)
|
|
(
|
)
|
|
(
|
)
|
|
(
|
)
|
|
(
|
)
|
|
|
|
|
|
|
|
|
|
|
|
|
|
|
|
|
|
|
|
|
Net assets related to funded obligations
|
|
|
|
|
|
|
|
|
|
|
|
|
|
|
|
|
|
|
Recognized liabilities
|
(
|
)
|
|
(
|
)
|
|
(
|
)
|
|
(
|
)
|
|
(
|
)
|
|
(
|
)
|
|
|
|
|
|
|
|
|
|
|
|
|
|
||||||
|
Change in unrecoverable surplus
|
|
|
|
|
|
|
|
|
|
|
|
||||||
|
Unrecoverable surplus at beginning of the period
|
(
|
)
|
|
|
|
|
(
|
)
|
|
(
|
)
|
|
(
|
)
|
|
(
|
)
|
|
Interest cost on unrecoverable surplus
|
(
|
)
|
|
|
|
|
(
|
)
|
|
|
|
|
|
|
|
|
|
|
Change in unrecoverable surplus in excess of interest
|
|
|
|
|
|
|
|
|
|
(
|
)
|
|
|
|
|
|
|
|
Exchange rates changes
|
|
|
|
|
|
|
|
|
|
|
|
|
|
|
|
|
|
|
Unrecoverable surplus at end of the period
|
(
|
)
|
|
|
|
|
(
|
)
|
|
(
|
)
|
|
(
|
)
|
|
|
|
F-86
ARCELORMITTAL AND SUBSIDIARIES
Notes to Consolidated Financial Statements
(millions of U.S. dollars, except share and per share data)
|
Year ended December 31, 2017
|
|||||||||||||||||
|
Total
|
United States
|
Canada
|
Brazil
|
Europe
|
Other
|
||||||||||||
|
Change in benefit obligation
|
|||||||||||||||||
|
Benefit obligation at beginning of the period
|
|
|
|
|
|
|
|
|
|
|
|
|
|||||
|
Current service cost
|
|
|
|
|
|
|
|
|
|
|
|
|
|||||
|
Interest cost on DBO
|
|
|
|
|
|
|
|
|
|
|
|
|
|||||
|
Past service cost - Plan amendments
|
|
|
|
|
|
|
|
|
|
|
|
|
|||||
|
Plan participants’ contribution
|
|
|
|
|
|
|
|
|
|
|
|
|
|||||
|
Actuarial (gain) loss
|
|
|
(
|
)
|
|
|
|
|
|
|
|
|
|||||
|
Demographic assumptions
|
(
|
)
|
(
|
)
|
|
|
|
|
(
|
)
|
|
|
|||||
|
Financial assumptions
|
|
|
|
|
|
|
|
|
|
|
|
|
|||||
|
Experience adjustment
|
|
|
(
|
)
|
|
|
|
|
|
|
|
|
|||||
|
Benefits paid
|
(
|
)
|
(
|
)
|
(
|
)
|
(
|
)
|
(
|
)
|
(
|
)
|
|||||
|
Foreign currency exchange rate differences and other movements
|
|
|
|
|
|
|
|
(
|
)
|
|
|
|
|
|
|||
|
Benefit obligation at end of the period
|
|
|
|
|
|
|
|
|
|
|
|
|
|||||
|
|
|||||||||||||||||
|
Change in plan assets
|
|||||||||||||||||
|
Fair value of plan assets at beginning of the period
|
|
|
|
|
|
|
|
|
|
|
|
|
|||||
|
Interest income on plan assets
|
|
|
|
|
|
|
|
|
|
|
|
|
|||||
|
Return on plan assets greater/(less) than discount rate
|
|
|
|
|
|
|
|
|
|
|
(
|
)
|
|||||
|
Employer contribution
|
|
|
|
|
|
|
|
|
|
|
|
|
|||||
|
Plan participants’ contribution
|
|
|
|
|
|
|
|
|
|
|
|
|
|||||
|
Benefits paid
|
(
|
)
|
(
|
)
|
(
|
)
|
(
|
)
|
(
|
)
|
(
|
)
|
|||||
|
Foreign currency exchange rate differences and other movements
|
|
|
|
|
|
|
|
(
|
)
|
|
|
|
|
|
|||
|
Fair value of plan assets at end of the period
|
|
|
|
|
|
|
|
|
|
|
|
|
|||||
|
|
|||||||||||||||||
|
Present value of the wholly or partly funded obligation
|
(
|
)
|
(
|
)
|
(
|
)
|
(
|
)
|
(
|
)
|
(
|
)
|
|||||
|
Fair value of plan assets
|
|
|
|
|
|
|
|
|
|
|
|
|
|||||
|
Net present value of the wholly or partly funded obligation
|
(
|
)
|
(
|
)
|
(
|
)
|
(
|
)
|
(
|
)
|
|
|
|||||
|
Present value of the unfunded obligation
|
(
|
)
|
(
|
)
|
(
|
)
|
(
|
)
|
(
|
)
|
(
|
)
|
|||||
|
Prepaid due to unrecoverable surpluses
|
(
|
)
|
|
|
(
|
)
|
(
|
)
|
(
|
)
|
(
|
)
|
|||||
|
Net amount recognized
|
(
|
)
|
(
|
)
|
(
|
)
|
(
|
)
|
(
|
)
|
(
|
)
|
|||||
|
|
|||||||||||||||||
|
Net assets related to funded obligations
|
|
|
|
|
|
|
|
|
|
|
|
|
|||||
|
Recognized liabilities
|
(
|
)
|
(
|
)
|
(
|
)
|
(
|
)
|
(
|
)
|
(
|
)
|
|||||
|
Change in unrecoverable surplus
|
|||||||||||||||||
|
Unrecoverable surplus at beginning of the period
|
(
|
)
|
|
|
(
|
)
|
(
|
)
|
(
|
)
|
(
|
)
|
|||||
|
Interest cost on unrecoverable surplus
|
(
|
)
|
|
|
(
|
)
|
|
|
|
|
|
|
|||||
|
Change in unrecoverable surplus in excess of interest
|
|
|
|
|
(
|
)
|
|
|
(
|
)
|
|
|
|||||
|
Exchange rates changes
|
(
|
)
|
|
|
(
|
)
|
|
|
|
|
|
|
|||||
|
Unrecoverable surplus at end of the period
|
(
|
)
|
|
|
(
|
)
|
(
|
)
|
(
|
)
|
(
|
)
|
|||||
F-87
ARCELORMITTAL AND SUBSIDIARIES
Notes to Consolidated Financial Statements
(millions of U.S. dollars, except share and per share data)
|
|
Year ended December 31, 2018
|
||||||||||||||||
|
Net periodic pension cost (benefit)
|
Total
|
|
United States
|
|
Canada
|
|
Brazil
|
|
Europe
|
|
Others
|
||||||
|
Current service cost
|
|
|
|
|
|
|
|
|
|
|
|
|
|
|
|
|
|
|
Past service cost - Plan amendments
|
|
|
|
|
|
|
|
|
|
|
|
|
|
|
|
|
|
|
Past service cost - Settlements
|
|
|
|
|
|
|
|
|
|
|
|
|
|
|
|
|
|
|
Cost of termination benefits
|
|
|
|
|
|
|
|
|
|
|
|
|
|
|
|
|
|
|
Net interest cost/(income) on net DB liability/(asset)
|
|
|
|
|
|
|
|
|
|
|
|
|
|
|
|
|
|
|
Total
|
|
|
|
|
|
|
|
|
|
|
|
|
|
|
|
|
|
|
|
Year ended December 31, 2017
|
||||||||||||||||
|
Net periodic pension cost (benefit)
|
Total
|
United States
|
Canada
|
Brazil
|
Europe
|
Others
|
|||||||||||
|
Current service cost
|
|
|
|
|
|
|
|
|
|
|
|
|
|||||
|
Past service cost - Plan amendments
|
|
|
|
|
|
|
|
|
|
|
|
|
|||||
|
Net interest cost/(income) on net DB liability/(asset)
|
|
|
|
|
|
|
|
|
|
|
|
|
|||||
|
Total
|
|
|
|
|
|
|
|
|
|
|
|
|
|||||
|
|
Year ended December 31, 2016
|
||||||||||||||||
|
Net periodic pension cost (benefit)
|
Total
|
United States
|
Canada
|
Brazil
|
Europe
|
Others
|
|||||||||||
|
Current service cost
|
|
|
|
|
|
|
|
|
|
|
|
|
|||||
|
Past service cost - Plan amendments
|
(
|
)
|
|
|
|
|
|
|
(
|
)
|
|
|
|||||
|
Past service cost - Curtailments
|
(
|
)
|
|
|
|
|
|
|
|
|
(
|
)
|
|||||
|
Net interest cost/(income) on net DB liability/(asset)
|
|
|
|
|
|
|
|
|
|
|
|
|
|||||
|
Total
|
|
|
|
|
|
|
|
|
(
|
)
|
|
|
|||||
Other post-employment benefits and other long-term employee benefits ("OPEB")
ArcelorMittal’s principal operating subsidiaries in the United States, Canada, Europe and certain other countries, provide other post-employment benefits and other long-term employee benefits, including medical benefits and life insurance benefits, work medals and retirement indemnity plans, to employees and retirees. Substantially all union-represented ArcelorMittal USA employees hired before June 2016 are covered under post-employment life insurance and medical benefit plans that require a level of cost sharing from retirees. The post-employment life insurance benefit formula used in the determination of post-employment benefit cost is primarily based on a specific amount for hourly employees. ArcelorMittal USA does not pre-fund most of these post-employment benefits.
ArcelorMittal’s USA labor agreement with the United Steelworkers (“USW”) was ratified in 2016. This labor agreement is valid until September 1, 2018. ArcelorMittal performed a number of changes mainly related to healthcare post-employment benefits in its subsidiary ArcelorMittal USA. Also, in accordance with the new agreement, required payments into an existing Voluntary Employee Beneficiary Association (“VEBA”) trust were fixed at
5
%
of ArcelorMittal USA’s operating income after the first quarter of 2018. The changes resulted in a gain of
832
recorded in cost of sales in the consolidated statements of operations in 2016.
ArcelorMittal’s USA new labor agreement with the USW was ratified in 2018. This labor agreement is in effect until September 1, 2022. There were minor changes for OPEB in the new contract mainly related to healthcare post-employment premiums paid by participants. The changes resulted in a gain of
10
recorded in cost of sales in the consolidated statement of operations in
2018
.
The Company has significant assets mostly in the VEBA post-employment benefit plan. These assets consist of
71
%
in fixed income and
29
%
in equities. The total fair value of the assets in the VEBA trust was
451
as of
December 31, 2018
.
F-88
ARCELORMITTAL AND SUBSIDIARIES
Notes to Consolidated Financial Statements
(millions of U.S. dollars, except share and per share data)
|
|
Year ended December 31, 2018
|
|||||||||||||
|
|
Total
|
|
United States
|
|
Canada
|
|
Europe
|
|
Others
|
|||||
|
Change in benefit obligation
|
|
|
|
|
|
|
|
|
|
|||||
|
Benefit obligation at beginning of the period
|
|
|
|
|
|
|
|
|
|
|
|
|
|
|
|
Current service cost
|
|
|
|
|
|
|
|
|
|
|
|
|
|
|
|
Interest cost on DBO
|
|
|
|
|
|
|
|
|
|
|
|
|
|
|
|
Past service cost - Plan amendments
|
(
|
)
|
|
(
|
)
|
|
(
|
)
|
|
(
|
)
|
|
|
|
|
Past service cost - Curtailments
|
(
|
)
|
|
|
|
|
|
|
|
(
|
)
|
|
|
|
|
Plan participants’ contribution
|
|
|
|
|
|
|
|
|
|
|
|
|
|
|
|
Actuarial (gain) loss
|
(
|
)
|
|
(
|
)
|
|
(
|
)
|
|
|
|
|
(
|
)
|
|
Demographic assumptions
|
(
|
)
|
|
(
|
)
|
|
|
|
|
|
|
|
|
|
|
Financial assumptions
|
(
|
)
|
|
(
|
)
|
|
(
|
)
|
|
(
|
)
|
|
(
|
)
|
|
Experience adjustment
|
(
|
)
|
|
(
|
)
|
|
(
|
)
|
|
|
|
|
|
|
|
Benefits paid
|
(
|
)
|
|
(
|
)
|
|
(
|
)
|
|
(
|
)
|
|
(
|
)
|
|
Foreign currency exchange rate differences and other movements
|
(
|
)
|
|
|
|
|
(
|
)
|
|
(
|
)
|
|
(
|
)
|
|
Benefit obligation at end of the period
|
|
|
|
|
|
|
|
|
|
|
|
|
|
|
|
|
|
|
|
|
|
|
|
|
|
|||||
|
Change in plan assets
|
|
|
|
|
|
|
|
|
|
|||||
|
Fair value of plan assets at beginning of the period
|
|
|
|
|
|
|
|
|
|
|
|
|
|
|
|
Interest income on plan assets
|
|
|
|
|
|
|
|
|
|
|
|
|
|
|
|
Return on plan assets greater/(less) than discount rate
|
(
|
)
|
|
(
|
)
|
|
|
|
|
(
|
)
|
|
|
|
|
Employer contribution
|
(
|
)
|
|
(
|
)
|
|
|
|
|
|
|
|
|
|
|
Plan participants’ contribution
|
|
|
|
|
|
|
|
|
|
|
|
|
|
|
|
Benefits paid
|
(
|
)
|
|
(
|
)
|
|
|
|
|
(
|
)
|
|
|
|
|
Foreign currency exchange rate differences and other movements
|
|
|
|
|
|
|
|
|
|
|
|
|
|
|
|
Fair value of plan assets at end of the period
|
|
|
|
|
|
|
|
|
|
|
|
|
|
|
|
|
|
|
|
|
|
|
|
|
|
|||||
|
Present value of the wholly or partly funded obligation
|
(
|
)
|
|
(
|
)
|
|
|
|
|
(
|
)
|
|
|
|
|
Fair value of plan assets
|
|
|
|
|
|
|
|
|
|
|
|
|
|
|
|
Net present value of the wholly or partly funded obligation
|
(
|
)
|
|
(
|
)
|
|
|
|
|
(
|
)
|
|
|
|
|
Present value of the unfunded obligation
|
(
|
)
|
|
(
|
)
|
|
(
|
)
|
|
(
|
)
|
|
(
|
)
|
|
Net amount recognized
|
(
|
)
|
|
(
|
)
|
|
(
|
)
|
|
(
|
)
|
|
(
|
)
|
F-89
ARCELORMITTAL AND SUBSIDIARIES
Notes to Consolidated Financial Statements
(millions of U.S. dollars, except share and per share data)
|
|
Year ended December 31, 2017
|
|||||||||||||
|
|
Total
|
|
United States
|
|
Canada
|
|
Europe
|
|
Others
|
|||||
|
Change in benefit obligation
|
|
|
|
|
|
|
|
|
|
|||||
|
Benefit obligation at beginning of the period
|
|
|
|
|
|
|
|
|
|
|
|
|
|
|
|
Current service cost
|
|
|
|
|
|
|
|
|
|
|
|
|
|
|
|
Interest cost on DBO
|
|
|
|
|
|
|
|
|
|
|
|
|
|
|
|
Past service cost - Plan amendments
|
|
|
|
|
|
|
|
|
|
|
|
|
|
|
|
Plan participants’ contribution
|
|
|
|
|
|
|
|
|
|
|
|
|
|
|
|
Actuarial (gain) loss
|
(
|
)
|
|
(
|
)
|
|
|
|
|
|
|
|
|
|
|
Demographic assumptions
|
(
|
)
|
|
(
|
)
|
|
|
|
|
|
|
|
|
|
|
Financial assumptions
|
(
|
)
|
|
(
|
)
|
|
|
|
|
|
|
|
(
|
)
|
|
Experience adjustment
|
(
|
)
|
|
(
|
)
|
|
|
|
|
(
|
)
|
|
|
|
|
Benefits paid
|
(
|
)
|
|
(
|
)
|
|
(
|
)
|
|
(
|
)
|
|
(
|
)
|
|
Foreign currency exchange rate differences and other movements
|
|
|
|
|
|
|
|
|
|
|
|
|
|
|
|
Benefit obligation at end of the period
|
|
|
|
|
|
|
|
|
|
|
|
|
|
|
|
|
|
|
|
|
|
|
|
|
|
|||||
|
Change in plan assets
|
|
|
|
|
|
|
|
|
|
|||||
|
Fair value of plan assets at beginning of the period
|
|
|
|
|
|
|
|
|
|
|
|
|
|
|
|
Interest income on plan assets
|
|
|
|
|
|
|
|
|
|
|
|
|
|
|
|
Return on plan assets greater/(less) than discount rate
|
|
|
|
|
|
|
|
|
|
|
|
|
|
|
|
Employer contribution
|
(
|
)
|
|
(
|
)
|
|
|
|
|
|
|
|
|
|
|
Plan participants’ contribution
|
|
|
|
|
|
|
|
|
|
|
|
|
|
|
|
Benefits paid
|
(
|
)
|
|
(
|
)
|
|
|
|
|
(
|
)
|
|
|
|
|
Foreign currency exchange rate differences and other movements
|
|
|
|
|
|
|
|
|
|
|
|
|
|
|
|
Fair value of plan assets at end of the period
|
|
|
|
|
|
|
|
|
|
|
|
|
|
|
|
|
|
|
|
|
|
|
|
|
|
|||||
|
Present value of the wholly or partly funded obligation
|
(
|
)
|
|
(
|
)
|
|
|
|
|
(
|
)
|
|
|
|
|
Fair value of plan assets
|
|
|
|
|
|
|
|
|
|
|
|
|
|
|
|
Net present value of the wholly or partly funded obligation
|
(
|
)
|
|
(
|
)
|
|
|
|
|
(
|
)
|
|
|
|
|
Present value of the unfunded obligation
|
(
|
)
|
|
(
|
)
|
|
(
|
)
|
|
(
|
)
|
|
(
|
)
|
|
Net amount recognized
|
(
|
)
|
|
(
|
)
|
|
(
|
)
|
|
(
|
)
|
|
(
|
)
|
F-90
ARCELORMITTAL AND SUBSIDIARIES
Notes to Consolidated Financial Statements
(millions of U.S. dollars, except share and per share data)
|
|
Year ended December 31, 2018
|
|||||||||||||
|
Components of net periodic OPEB cost (benefit)
|
Total
|
|
United States
|
|
Canada
|
|
Europe
|
|
Others
|
|||||
|
Current service cost
|
|
|
|
|
|
|
|
|
|
|
|
|
|
|
|
Past service cost - Plan amendments
|
(
|
)
|
|
(
|
)
|
|
(
|
)
|
|
(
|
)
|
|
|
|
|
Past service cost - Curtailments
|
(
|
)
|
|
|
|
|
|
|
|
(
|
)
|
|
|
|
|
Net interest cost/(income) on net DB liability/(asset)
|
|
|
|
|
|
|
|
|
|
|
|
|
|
|
|
Actuarial (gains)/losses recognized during the year
|
|
|
|
|
|
|
|
|
|
|
|
|
|
|
|
Total
|
|
|
|
|
|
|
|
|
|
|
|
|
|
|
|
|
Year ended December 31, 2017
|
|||||||||||||
|
Components of net periodic OPEB cost (benefit)
|
Total
|
United States
|
Canada
|
Europe
|
Others
|
|||||||||
|
Current service cost
|
|
|
|
|
|
|
|
|
|
|
||||
|
Past service cost - Plan amendments
|
|
|
|
|
|
|
|
|
|
|
||||
|
Net interest cost/(income) on net DB liability/(asset)
|
|
|
|
|
|
|
|
|
|
|
||||
|
Actuarial (gains)/losses recognized during the year
|
|
|
|
|
|
|
|
|
|
|
||||
|
Total
|
|
|
|
|
|
|
|
|
|
|
||||
|
|
Year ended December 31, 2016
|
|||||||||||||
|
Components of net periodic OPEB cost (benefit)
|
Total
|
United States
|
Canada
|
Europe
|
Others
|
|||||||||
|
Current service cost
|
|
|
|
|
|
|
|
|
|
|
||||
|
Past service cost - Plan amendments
|
(
|
)
|
(
|
)
|
(
|
)
|
(
|
)
|
|
|
||||
|
Net interest cost/(income) on net DB liability/(asset)
|
|
|
|
|
|
|
|
|
|
|
||||
|
Actuarial (gains)/losses recognized during the year
|
|
|
|
|
|
|
|
|
|
|
||||
|
Total
|
(
|
)
|
(
|
)
|
|
|
|
|
|
|
||||
|
|
Year ended December 31,
|
|||||||
|
|
2018
|
2017
|
2016
|
|||||
|
Net periodic pension cost
|
|
|
|
|
|
|
||
|
Net periodic OPEB cost
|
|
|
|
|
(
|
)
|
||
|
Total
|
|
|
|
|
(
|
)
|
||
|
Cost of sales
|
|
|
|
|
(
|
)
|
||
|
Selling, general and administrative expenses
|
|
|
|
|
|
|
||
|
Financing costs - net
|
|
|
|
|
|
|
||
|
Total
|
|
|
|
|
(
|
)
|
||
F-91
ARCELORMITTAL AND SUBSIDIARIES
Notes to Consolidated Financial Statements
(millions of U.S. dollars, except share and per share data)
Plan Assets
|
|
December 31, 2018
|
|||||||||||
|
United States
|
Canada
|
Brazil
|
Europe
|
|||||||||
|
Equity Securities
|
|
%
|
|
%
|
|
|
|
%
|
||||
|
- Asset classes that have a quoted market price in an active market
|
|
%
|
|
%
|
|
|
|
%
|
||||
|
- Asset classes that do not have a quoted market price in an active market
|
|
%
|
|
%
|
|
|
|
|
||||
|
Fixed Income Securities (including cash)
|
|
%
|
|
%
|
|
%
|
|
%
|
||||
|
- Asset classes that have a quoted market price in an active market
|
|
|
|
%
|
|
%
|
|
%
|
||||
|
- Asset classes that do not have a quoted market price in an active market
|
|
%
|
|
%
|
|
|
|
%
|
||||
|
Real Estate
|
|
%
|
|
%
|
|
%
|
|
|
||||
|
- Asset classes that have a quoted market price in an active market
|
|
|
|
|
|
%
|
|
|
||||
|
- Asset classes that do not have a quoted market price in an active market
|
|
%
|
|
%
|
|
|
|
|
||||
|
Other
|
|
%
|
|
%
|
|
%
|
|
%
|
||||
|
- Asset classes that have a quoted market price in an active market
|
|
%
|
|
%
|
|
%
|
|
%
|
||||
|
- Asset classes that do not have a quoted market price in an active market
|
|
%
|
|
|
|
|
|
%
|
1
|
|||
|
Total
|
|
%
|
|
%
|
|
%
|
|
%
|
||||
1. The percentage consists primarily of assets from insurance contracts in Belgium.
|
|
December 31, 2017
|
|||||||||||||
|
United States
|
Canada
|
Brazil
|
Europe
|
Others
|
||||||||||
|
Equity Securities
|
|
%
|
|
%
|
|
|
|
%
|
|
%
|
||||
|
- Asset classes that have a quoted market price in an active market
|
|
%
|
|
%
|
|
|
|
%
|
|
%
|
||||
|
- Asset classes that do not have a quoted market price in an active market
|
|
%
|
|
%
|
|
|
|
|
|
|
||||
|
Fixed Income Securities (including cash)
|
|
%
|
|
%
|
|
%
|
|
%
|
|
%
|
||||
|
- Asset classes that have a quoted market price in an active market
|
|
%
|
|
%
|
|
%
|
|
%
|
|
%
|
||||
|
- Asset classes that do not have a quoted market price in an active market
|
|
%
|
|
%
|
|
|
|
%
|
|
|
||||
|
Real Estate
|
|
|
|
%
|
|
%
|
|
|
|
%
|
||||
|
- Asset classes that have a quoted market price in an active market
|
|
|
|
|
|
%
|
|
|
|
%
|
||||
|
- Asset classes that do not have a quoted market price in an active market
|
|
|
|
%
|
|
|
|
|
|
|
||||
|
Other
|
|
%
|
|
|
|
%
|
|
%
|
|
%
|
||||
|
- Asset classes that have a quoted market price in an active market
|
|
%
|
|
|
|
%
|
|
%
|
|
%
|
||||
|
- Asset classes that do not have a quoted market price in an active market
|
|
%
|
|
|
|
|
|
%
|
1
|
|
|
|||
|
Total
|
|
%
|
|
%
|
|
%
|
|
%
|
|
%
|
||||
|
1.
|
|
These assets include investments in ArcelorMittal stock of approximately
1
, but not in property or other assets occupied or used by ArcelorMittal. These assets may also include ArcelorMittal shares held by mutual fund investments. The invested assets produced an actual loss of
82
in 2018
and a return of
799
in 2017.
F-92
ARCELORMITTAL AND SUBSIDIARIES
Notes to Consolidated Financial Statements
(millions of U.S. dollars, except share and per share data)
|
December 31, 2018
|
||||||||||||
|
|
United States
|
Canada
|
Brazil
|
Europe
|
||||||||
|
Equity Securities
|
|
%
|
|
%
|
|
|
|
%
|
||||
|
Fixed Income Securities (including cash)
|
|
%
|
|
%
|
|
%
|
|
%
|
||||
|
Real Estate
|
|
%
|
|
%
|
|
%
|
|
|
||||
|
Other
|
|
%
|
|
%
|
|
%
|
|
%
|
1
|
|||
|
Total
|
|
%
|
|
%
|
|
%
|
|
%
|
||||
|
1.
|
The percentage consists primarily of assets from insurance contracts in Belgium.
|
|
|
Pension Plans
|
Other Post-employment Benefits
|
|||||||||
|
|
2018
|
2017
|
2016
|
2018
|
2017
|
2016
|
|||||
|
Discount rate
|
|
|
|
|
|
|
|||||
|
Range
|
1.75% - 16.00%
|
1.50% - 15.00%
|
1.60% - 16.00%
|
1.75% - 9.50%
|
1.30% - 7.65%
|
0.90% - 7.65%
|
|||||
|
Weighted average
|
|
|
|
|
|
|
|||||
|
Rate of compensation increase
|
|
|
|
|
|
|
|||||
|
Range
|
2.00% - 10.00%
|
1.80% - 9.00%
|
1.80% - 10.00%
|
2.00% - 4.80%
|
2.00% - 4.50%
|
2.00% - 32.00%
|
|||||
|
Weighted average
|
|
|
|
|
|
|
|||||
|
|
Other Post-employment Benefits
|
||||
|
|
2018
|
2017
|
2016
|
||
|
Healthcare cost trend rate assumed
|
|
|
|
||
|
Range
|
1.80% - 8.00%
|
1.80% - 5.00%
|
1.80% - 5.60%
|
||
|
Weighted average
|
|
|
|
||
Cash contributions and maturity profile of the plans
In 2019, the Company expects its cash contributions to amount to
194
for pension plans,
231
for other post-employment benefits plans,
116
for defined contribution plans and
67
for United States multi-employer plans. Cash contributions to defined contribution plans and to United States multi-employer plans sponsored by the Company, were respectively
123
and
65
in 2018.
At December 31, 2018, the weighted average duration of the liabilities related to the pension and other post-employment benefits plans were
12
years
(2017:
12
years
) and
14
years
(2017:
14
years
), respectively.
Risks associated with defined benefit plans
Through its defined benefit pension plans and OPEB plans, ArcelorMittal is exposed to a number of risks, the most significant of which are detailed below:
Changes in bond yields
A decrease in corporate bond yields will increase plan liabilities, although this will be partially offset by an increase in the value of the plans’ bond holdings.
Asset volatility
The plan liabilities are calculated using a discount rate set with reference to corporate bond yields; if plan assets underperform this yield, this will create a deficit. In most countries with funded plans, plan assets hold a significant portion of equities, which are expected to outperform corporate bonds in the long-term but contribute to volatility and risk in the short-term. As the plans mature, ArcelorMittal intends to reduce the level of investment risk by investing more in assets that better
F-93
ARCELORMITTAL AND SUBSIDIARIES
Notes to Consolidated Financial Statements
(millions of U.S. dollars, except share and per share data)
match the liabilities. However, ArcelorMittal believes that due to the long-term nature of the plan liabilities, a level of continuing equity investment is an appropriate element of a long-term strategy to manage the plans efficiently.
Life expectancy
Most plans provide benefits for the life of the covered members, so increases in life expectancy will result in an increase in the plans’ benefit obligations.
Assumptions regarding future mortality rates have been set considering published statistics and, where possible, ArcelorMittal’s own experience. In 2017, ArcelorMittal USA updated the company specific tables it uses to value most of its postretirement liabilities. These tables were projected forward using the most recent projection scales issued by the Society of Actuaries. Use of these new mortality assumptions resulted in reducing the 2017 pension and OPEB liabilities by
95
and
51
, respectively.
The current longevities at retirement underlying the values of the defined benefit obligation were approximately
22
.
Healthcare cost trend rate
The majority of the OPEB plans’ benefit obligations are linked to the change in the cost of various health care components. Future healthcare cost will vary based on several factors including price inflation, utilization rate, technology advances, cost shifting and cost containing mechanisms. A higher healthcare cost trend would lead to higher OPEB plan benefit obligations.
In 2017, the Company changed its provider of insured coverage of Medicare eligible participants in the United States. This resulted in significantly lowering the premiums and resulted in reducing the OPEB defined benefit obligations by
1,061
. In 2017, the healthcare cost trend rate assumption in the United States was adjusted, which resulted in increasing the OPEB defined benefit obligations by
117
.
Sensitivity analysis
|
Effect on 2019 Pre-Tax Pension Expense (sum of service cost and interest cost)
|
Effect on December 31, 2018 DBO
|
||
|
Change in assumption
|
|
|
|
|
100 basis points decrease in discount rate
|
(
|
|
|
|
100 basis points increase in discount rate
|
|
(
|
|
|
100 basis points decrease in rate of compensation
|
(
|
(
|
|
|
100 basis points increase in rate of compensation
|
|
|
|
|
1 year increase of the expected life of the beneficiaries
|
|
|
|
|
Effect on 2019 Pre-Tax OPEB Expense (sum of service cost and interest cost)
|
Effect on December 31, 2018 DBO
|
||
|
Change in assumption
|
|
|
|
|
100 basis points decrease in discount rate
|
|
|
|
|
100 basis points increase in discount rate
|
|
(
|
|
|
100 basis points decrease in healthcare cost trend rate
|
(
|
(
|
|
|
100 basis points increase in healthcare cost trend rate
|
|
|
|
|
1 year increase of the expected life of the beneficiaries
|
|
|
|
The above sensitivities reflect the effect of changing one assumption at a time. Actual economic factors and conditions often affect multiple assumptions simultaneously, and the effects of changes in key assumptions are not necessarily linear.
F-94
ARCELORMITTAL AND SUBSIDIARIES
Notes to Consolidated Financial Statements
(millions of U.S. dollars, except share and per share data)
Multi-employer plans
On May 22, 2017, ArcelorMittal completed the consolidation of each three existing shares in ArcelorMittal without nominal value into one share without nominal value. As a result of this reverse stock split, the outstanding number of stock options, PSUs and RSUs per employee has been recast for prior periods.
Stock Option Plans
Prior to the May 2011 annual general shareholders’ meeting adoption of the ArcelorMittal Equity Incentive Plan described below, ArcelorMittal’s equity-based incentive plan took the form of a stock option plan known as the Global Stock Option Plan.
Under the terms of the ArcelorMittal Global Stock Option Plan 2009-2018 (which replaced the ArcelorMittal Shares plan that expired in 2009), ArcelorMittal may grant options to purchase common shares to senior management of ArcelorMittal and its associates for up to
100,000,000
(
33,333,333
shares after reverse stock split) shares of common shares. The exercise price of each option equals not less than the fair market value of ArcelorMittal shares on the grant date, with a maximum term of
10
years
. Options are granted at the discretion of ArcelorMittal’s Appointments, Remuneration and Corporate Governance ("ARCG") Committee, or its delegate. The options vest either ratably upon each of the first three anniversaries of the grant date, or, in total, upon the death, disability or retirement of the participant.
|
Date of grant
|
Exercise prices
(per option) |
|
August 2010
|
$
|
|
August 2009
|
|
No options were granted during the years ended
December 31, 2018
,
2017
, and
2016
.
The compensation expense recognized for stock option plans was nil for each of the years ended
December 31, 2018
,
2017
and
2016
.
F-95
ARCELORMITTAL AND SUBSIDIARIES
Notes to Consolidated Financial Statements
(millions of U.S. dollars, except share and per share data)
|
|
Number of Options
|
|
Range of Exercise Prices
(per option) |
|
Weighted Average Exercise Price
(per option) |
|
|
|
Outstanding, December 31, 2015
|
|
|
|
63.42 – 235.32
|
|
|
Outstanding,
|
|
Expired
|
(
|
)
|
|
91.98 – 235.32
|
|
|
|
|
Outstanding, December 31, 2016
|
|
|
|
63.42 – 235.32
|
|
|
Outstanding,
|
|
Expired
|
(
|
)
|
|
63.42 – 235.32
|
|
|
|
|
Outstanding, December 31, 2017
|
|
|
|
63.42 – 235.32
|
|
|
Outstanding,
|
|
Expired
|
(
|
)
|
|
63.42 – 235.32
|
|
|
|
|
Outstanding, December 31, 2018
|
|
|
|
91.98 – 109.14
|
|
|
Outstanding,
|
|
|
|
|
|
|
|
|
|
|
Exercisable, December 31, 2016
|
|
|
|
63.42 – 235.32
|
|
|
Exercisable,
|
|
Exercisable, December 31, 2017
|
|
|
|
63.42 – 235.32
|
|
|
Exercisable,
|
|
Exercisable, December 31, 2018
|
|
|
|
91.98 – 109.14
|
|
|
Exercisable,
|
|
Options Outstanding
|
||||||||||
|
Exercise Prices
(per option) |
|
Number of
options |
|
Weighted average contractual life
(in years) |
|
Options exercisable (number of options)
|
|
Maturity
|
||
|
$
|
|
|
|
|
|
|
|
|
|
August 3, 2020
|
|
|
|
|
|
|
|
|
|
|
|
August 4, 2019
|
|
$91.98 - $109.14
|
|
|
|
|
|
|
|
|
|
|
Long-Term Incentives: Equity-Based Incentives (Share Unit Plans)
On May 10, 2011, the annual general meeting of shareholders approved the ArcelorMittal Equity Incentive Plan, a new equity-based incentive plan that replaced the Global Stock Option Plan. The ArcelorMittal Equity Incentive Plan is intended to align the interests of the Company’s shareholders and eligible employees by allowing them to participate in the success of the Company. The ArcelorMittal Equity Incentive Plan provides for the grant of RSUs and PSUs to eligible Company employees (including the Executive Officers) and is designed to incentivize employees, improve the Company’s long-term performance and retain key employees. On May 8, 2013, the annual general meeting of shareholders approved the GMB PSU Plan, which provides for the grant of PSUs to GMB members (and is now applicable to the CEO Office). Until the introduction of the GMB PSU Plan in 2013, GMB members were eligible to receive RSUs and PSUs under the ArcelorMittal Equity Incentive Plan. In 2016, a special grant was approved in order to align the grant with the Action 2020 plan put in place by ArcelorMittal.
The maximum number of PSUs (and RSUs previously) available for grant during any given year is subject to the prior approval of the Company’s shareholders at the annual general meeting. The annual shareholders’ meeting on May 4, 2016 approved the maximum to be granted until the next annual shareholders’ meeting. For the period from the May 2016 annual general shareholders’ meeting to the May 2017 annual general shareholders’ meeting, a maximum of
30,000,000
PSUs (
10,000,000
PSU's after the reverse stock split) may be allocated to eligible employees under the ArcelorMittal Equity Incentive Plan and the GMB PSU Plan combined. The 2017 Cap for the number of PSUs that may be allocated to the CEO Office and other retention based grants below the CEO Office level was approved at the annual shareholders' meeting on May 10, 2017 at a maximum of
3,000,000
shares.
The 2018 Cap for the number of PSUs that may be allocated to the CEO Office and other retention based grants below the CEO Office level, was approved at the annual shareholders’ meeting on May 9, 2018 at a maximum of
1,500,000
shares.
ArcelorMittal Equity Incentive Plan
RSUs granted under the ArcelorMittal Equity Incentive Plan are designed to provide a retention incentive to eligible employees. RSUs are subject to “cliff vesting” after
three years
, with
100
%
of the grant vesting on the third anniversary of the grant contingent upon the continued active employment of the eligible employee within the Company.
F-96
ARCELORMITTAL AND SUBSIDIARIES
Notes to Consolidated Financial Statements
(millions of U.S. dollars, except share and per share data)
The grant of PSUs under the ArcelorMittal Equity Incentive Plan aims to serve as an effective performance-enhancing scheme based on the employee’s contribution to the eligible achievement of the Company’s strategy. Awards in connection with PSUs are subject to the fulfillment of cumulative performance criteria (such as return on capital employed ("ROCE"), total shareholders return ("TSR"), earnings per share ("EPS") and gap to competition) over a three year period from the date of the PSU grant. The employees eligible to receive PSUs are a sub-set of the group of employees eligible to receive RSUs. The target group for PSU grants initially included the Chief Executive Officer and the other GMB members. However, from 2013 onwards, the Chief Executive Officer and other GMB members (and in 2016, the CEO Office) received PSU grants only under the GMB PSU Plan instead of the ArcelorMittal Equity Incentive Plan.
|
CEO Office
|
Executive Officers and other qualifying employees
|
|||||||||
|
2018 Grant
|
l
|
PSUs with a three year performance period
|
|
PSUs with a three year performance period
|
||||||
|
|
|
|
|
|||||||
|
l
|
Value at grant 100% of base salary for the CEO and the President and CFO
|
|
|
|||||||
|
l
|
Vesting conditions:
|
Vesting conditions
|
||||||||
|
Threshold
|
Target
|
|
Target
|
|||||||
|
TSR/EPS vs. peer group
|
100% median
|
≥120% median
|
ROCE
|
|
100% target
100% vesting |
|||||
|
TSR vs. S&P 500
|
Performance equal to Index
|
≥Performance equal to Index + 2% outperformance
|
Gap to competition (where applicable)
|
|
100% target
100% vesting |
|||||
|
Vesting percentage
|
50%
|
100%
|
||||||||
Awards made in previous financial years which have not yet reached the end of the vesting period
The Company's Long-Term Incentive Plan for senior management including Executive Officers follows the Company's strategy.
In 2014 and 2015, the Company's goal was to achieve ROCE and Mining volume for the Mining segment and therefore the target was based on these performance measures.
In 2016, in order to ensure achievement of the Action 2020 plan, ArcelorMittal made a special grant (“Special Grant”) to qualifying employees (including the Executive Officers), instead of the standard grant. The value of the Special Grant at grant date is based generally on a specified percentage of the base salary depending on the position of the employee at grant date. The vesting is subject to continued active employment within the ArcelorMittal group and to yearly performance of ROCE targets and other strategic objectives within the business units.
F-97
ARCELORMITTAL AND SUBSIDIARIES
Notes to Consolidated Financial Statements
(millions of U.S. dollars, except share and per share data)
|
CEO Office
|
Other Executive Officers
|
|||||||||||
|
2015 Grant
|
l
|
PSUs with a three-year performance period
|
l
|
RSUs with a three-year vesting period (2015 grant vested in December 2018)
|
||||||||
|
l
|
Performance criteria: 50% TSR (½ vs. S&P 500 and ½ vs. peer group) and 50% EPS vs. peer group
|
l
|
PSUs with a three-year performance period
|
|||||||||
|
l
|
Value at grant: 100% of base salary for the CEO and 80% for the President and CFO
|
l
|
Performance target: mainly ROCE and mining volume plan for the Mining segment
|
|||||||||
|
l
|
One PSU can give right to 0 up to 1.5 share
|
|||||||||||
|
l
|
Vesting conditions:
|
l
|
Vesting conditions:
|
|||||||||
|
Threshold
|
Target
|
Stretch
|
Performance
|
Threshold
|
Target
|
Stretch
|
||||||
|
TSR/EPS vs. peer group
|
80% median
|
100% median
|
≥120% median
|
Performance
|
80%
|
100%
|
≥120%
|
|||||
|
TSR vs. S&P 500
|
Performance equal to 80% of Index
|
Performance equal to Index
|
≥Performance equal to Index + 2% outperformance
|
Vesting
|
50%
|
100%
|
150%
|
|||||
|
Vesting percentage
|
50%
|
100%
|
150%
|
|||||||||
|
2016 Special Grant
|
l
|
PSUs with a five-year performance period, 50% vesting after three-year performance period and 50% after additional two-year performance period
|
l
|
PSUs with a five-year performance period, 50% vesting after three-year performance period and 50% after additional two-year performance period
|
||||||||
|
l
|
Performance criteria: 50% TSR (½ vs. S&P 500 and ½ vs. peer group) and 50% EPS vs. peer group
|
l
|
Performance criteria: ROCE and Gap to competition in some areas
one target grant: a share will vest if performance is met at target one overperformance grant: a share will vest if performance exceeds 120% |
|||||||||
|
l
|
Value at grant: 150% of base salary for the CEO and the President and CFO
|
l
|
Vesting conditions:
|
|||||||||
|
l
|
Vesting conditions:
|
|||||||||||
|
Threshold
|
Target
|
Performance
|
100%
|
≥120%
|
||||||||
|
TSR/EPS vs. peer group
|
100% median
|
≥120% median
|
Target award vesting
|
100%
|
100%
|
|||||||
|
TSR vs. S&P 500
|
Performance equal to Index
|
≥Performance equal to Index + 2% outperformance
|
Overperformance award (=20% of target award)
|
-
|
100%
|
|||||||
|
Vesting percentage
|
50%
|
100%
|
||||||||||
|
2017 Grant
|
l
|
PSUs with a three-year performance period
|
l
|
PSUs with a three-year performance period
|
||||||||
|
l
|
Performance criteria: 50% TSR (½ vs. S&P 500 and ½ vs. peer group) and 50% EPS vs. peer group
|
l
|
Performance criteria: TSR and Gap to competition in some areas
|
|||||||||
|
l
|
Value at grant: 100% of base salary for the CEO and the President and CFO
|
|||||||||||
|
l
|
Vesting conditions:
|
l
|
Vesting conditions:
|
|||||||||
|
Threshold
|
Target
|
Threshold
|
Target
|
|||||||||
|
TSR/EPS vs. peer group
|
100% median
|
≥120% median
|
TSR vs. peer group
|
100% median 50% vesting
|
≥120% median 100% vesting
|
|||||||
|
TSR vs. S&P 500
|
Performance equal to Index
|
≥Performance equal to Index + 2% outperformance
|
Gap to competition (where applicable)
|
-
|
100% target
100% vesting |
|||||||
|
Vesting percentage
|
50%
|
100%
|
||||||||||
F-98
ARCELORMITTAL AND SUBSIDIARIES
Notes to Consolidated Financial Statements
(millions of U.S. dollars, except share and per share data)
|
At Grant date
|
|
Number of shares issued as of December 31, 2018
|
|||||||||||||||||||
|
Grant date
|
|
Type of plan
|
|
Number of shares
|
|
Number of beneficiaries
|
|
Maturity
|
|
Fair value
per share |
|
Shares outstanding
|
|
Shares exited
|
|
Shares forfeited
|
|||||
|
December 20, 2018
|
|
PSU
|
|
|
|
|
|
|
|
January 1, 2022
|
|
|
|
|
|
|
|
|
|
|
|
|
December 20, 2018
|
|
CEO Office
|
|
|
|
|
|
|
|
January 1, 2022
|
|
|
|
|
|
|
|
|
|
|
|
|
December 20, 2017
|
|
PSU
|
|
|
|
|
|
|
|
January 1, 2021
|
|
|
|
|
|
|
|
|
|
|
|
|
December 20, 2017
|
|
CEO Office
|
|
|
|
|
|
|
|
January 1, 2021
|
|
|
|
|
|
|
|
|
|
|
|
|
June 30, 2016
|
|
PSU II
|
|
|
|
|
|
|
|
January 1, 2021
|
|
|
|
|
|
|
|
|
|
|
|
|
June 30, 2016
|
|
CEO PSU II
|
|
|
|
|
|
|
|
January 1, 2022
|
|
|
|
|
|
|
|
|
|
|
|
|
June 30, 2016
|
|
PSU I
|
|
|
|
|
|
|
|
January 1, 2019
|
|
|
|
|
|
|
|
|
|
|
|
|
June 30, 2016
|
|
CEO PSU I
|
|
|
|
|
|
|
|
January 1, 2020
|
|
|
|
|
|
|
|
|
|
|
|
|
December 18, 2015
|
|
PSU
|
|
|
|
|
|
|
|
January 1, 2019
|
|
|
|
|
|
|
|
|
|
|
|
|
Total
|
|
|
|
|
|
|
|
|
|
|
|
$10.68 – $22.85
|
|
|
|
|
|
|
|
|
|
The compensation expense recognized for RSUs and PSUs was
31
,
31
and
13
for the years ended
December 31, 2018
,
2017
and
2016
.
|
|
RSUs
|
|
PSUs
|
||||||
|
|
Number of shares
|
|
Fair value per share
|
|
Number of shares
|
|
Fair value per share
|
||
|
Outstanding, December 31, 2015
|
|
|
|
|
|
|
|
|
|
|
Granted
2
|
|
|
|
|
|
|
|
|
|
|
Exited
|
(
|
)
|
|
|
|
(
|
)
|
|
|
|
Forfeited
|
(
|
)
|
|
|
|
(
|
)
|
|
|
|
Outstanding, December 31, 2016
|
|
|
|
|
|
|
|
|
|
|
Granted
2
|
|
|
|
|
|
|
|
|
|
|
Exited
|
(
|
)
|
|
|
|
(
|
)
|
|
|
|
Forfeited
|
(
|
)
|
|
|
|
(
|
)
|
|
|
|
Outstanding, December 31, 2017
|
|
|
|
|
|
|
|
|
|
|
Granted
1
|
|
|
|
|
|
|
|
|
|
|
Exited
|
(
|
)
|
|
|
|
(
|
)
|
|
|
|
Forfeited
|
(
|
)
|
|
|
|
(
|
)
|
|
|
|
Outstanding, December 31, 2018
|
|
|
|
|
|
|
|
|
|
|
1.
|
Including
|
|
2.
|
|
Provisions for onerous contracts are recorded in the consolidated statements of operations when it becomes known that the unavoidable costs of meeting the obligations under the contract exceed the economic benefits expected to be received.
F-99
ARCELORMITTAL AND SUBSIDIARIES
Notes to Consolidated Financial Statements
(millions of U.S. dollars, except share and per share data)
Assets dedicated to the onerous contracts are tested for impairment before recognizing a separate provision for the onerous contract.
Provisions for restructuring are recognized when and only when a detailed formal plan exists and a valid expectation in those affected by the restructuring has been raised, by starting to implement the plan or announcing its main features.
ArcelorMittal records asset retirement obligations (“ARO”) initially at the fair value of the legal or constructive obligation in the period in which it is incurred and capitalizes the ARO by increasing the carrying amount of the related non-current asset. The fair value of the obligation is determined as the discounted value of the expected future cash flows. The liability is accreted to its present value through net financing cost and the capitalized cost is depreciated in accordance with the Company’s depreciation policies for property, plant and equipment. Subsequently, when reliably measurable, ARO is recorded on the consolidated statements of financial position increasing the cost of the asset and the fair value of the related obligation. Foreign exchange gains or losses on AROs denominated in foreign currencies are recorded in the consolidated statements of operations.
ArcelorMittal is subject to changing and increasingly stringent environmental laws and regulations concerning air emissions, water discharges and waste disposal, as well as certain remediation activities that involve the clean-up of soil and groundwater. ArcelorMittal is currently engaged in the investigation and remediation of environmental contamination at a number of its facilities. Most of these are legacy obligations arising from acquisitions.
Environmental costs that relate to current operations or to an existing condition caused by past operations, and which do not contribute to future revenue generation or cost reduction, are expensed. Liabilities are recorded when environmental assessments and/or remedial efforts are probable and the cost can be reliably estimated based on ongoing engineering studies, discussions with the environmental authorities and other assumptions relevant to the nature and extent of the remediation that may be required. The ultimate cost to ArcelorMittal is dependent upon factors beyond its control such as the scope and methodology of the remedial action requirements to be established by environmental and public health authorities, new laws or government regulations, rapidly changing technology and the outcome of any potential related litigation. Environmental liabilities are discounted if the aggregate amount of the obligation and the amount and timing of the cash payments are fixed or reliably determinable.
The estimates of loss contingencies for environmental matters and other contingencies are based on various judgments and assumptions including the likelihood, nature, magnitude and timing of assessment, remediation and/or monitoring activities and the probable cost of these activities. In some cases, judgments and assumptions are made relating to the obligation or willingness and ability of third parties to bear a proportionate or allocated share of cost of these activities, including third parties who sold assets to ArcelorMittal or purchased assets from it subject to environmental liabilities. ArcelorMittal also considers, among other things, the activity to date at particular sites, information obtained through consultation with applicable regulatory authorities and third-party consultants and contractors and its historical experience with other circumstances judged to be comparable. Due to the numerous variables associated with these judgments and assumptions, and the effects of changes in governmental regulation and environmental technologies, both the precision and reliability of the resulting estimates of the related contingencies are subject to substantial uncertainties. As estimated costs to remediate change, the Company will reduce or increase the recorded liabilities through write backs or additional provisions in the consolidated statements of operations. ArcelorMittal does not expect these environmental issues to affect the utilization of its plants, now or in the future.
ArcelorMittal is currently and may in the future be involved in litigation, arbitration or other legal proceedings. Provisions related to legal and arbitration proceedings are recorded in accordance with the principles described above.
Most of these claims involve highly complex issues. Often these issues are subject to substantial uncertainties and, therefore, the probability of loss and an estimation of damages are difficult to ascertain. Consequently, ArcelorMittal may be unable to make a reliable estimate of the expected financial effect that will result from ultimate resolution of the proceeding. In those cases, ArcelorMittal has disclosed information with respect to the nature of the contingency. ArcelorMittal has not accrued a provision for the potential outcome of these cases.
For cases in which the Company was able to make a reliable estimate of the expected loss or range of probable loss and has accrued a provision for such loss, it believes that publication of this information on a case-by-case basis would seriously prejudice the Company’s position in the ongoing legal proceedings or in any related settlement discussions. Accordingly, in these cases, the Company has disclosed information with respect to the nature of the contingency, but has not disclosed its estimate of the range of potential loss.
F-100
ARCELORMITTAL AND SUBSIDIARIES
Notes to Consolidated Financial Statements
(millions of U.S. dollars, except share and per share data)
In the cases in which quantifiable fines and penalties have been assessed, the Company has indicated the amount of such fine or penalty or the amount of provision accrued that is the estimate of the probable loss.
|
|
Balance at December 31, 2017
|
|
Additions
1
|
|
Deductions/
Payments |
|
|
Effects of foreign exchange and other movements
|
|
|
Balance at December 31, 2018
|
|||||
|
Environmental (see note 8.3)
|
|
|
|
|
|
|
(
|
)
|
|
|
|
|
2
|
|
|
|
|
Asset retirement obligations (see note 8.3)
|
|
|
|
|
|
|
(
|
)
|
|
|
(
|
)
|
|
|
|
|
|
Site restoration
|
|
|
|
|
|
|
(
|
)
|
|
|
(
|
)
|
|
|
|
|
|
Staff related obligations
|
|
|
|
|
|
|
(
|
)
|
|
|
(
|
)
|
|
|
|
|
|
Voluntary separation plans
|
|
|
|
|
|
|
(
|
)
|
|
|
|
|
|
|
|
|
|
Litigation and other (see note 8.3)
|
|
|
|
|
|
|
(
|
)
|
|
|
|
|
|
|
|
|
|
Tax claims
|
|
|
|
|
|
|
(
|
)
|
|
|
(
|
)
|
|
|
|
|
|
Other legal claims
|
|
|
|
|
|
|
(
|
)
|
|
|
|
|
|
|
|
|
|
Commercial agreements and onerous contracts
|
|
|
|
|
|
|
(
|
)
|
|
|
|
|
|
|
|
|
|
Other
|
|
|
|
|
|
|
(
|
)
|
|
|
(
|
)
|
|
|
|
|
|
|
|
|
|
|
|
|
(
|
)
|
|
|
|
|
|
|
|
|
|
Short-term provisions
|
|
|
|
|
|
|
|
|
|
|
|
|
|
|
|
|
|
Long-term provisions
|
|
|
|
|
|
|
|
|
|
|
|
|
|
|
|
|
|
|
|
|
|
|
|
|
|
|
|
|
|
|
|
|
|
|
|
Balance at December 31, 2016
|
Additions
1
|
Deductions/
Payments |
Effects of foreign exchange and other movements
|
Balance at December 31, 2017
|
||||||||||||
|
Environmental (see note 8.3)
|
|
|
|
|
(
|
)
|
|
|
|
|
||||||
|
Asset retirement obligations (see note 8.3)
|
|
|
|
|
(
|
)
|
|
|
|
|
||||||
|
Site restoration
|
|
|
|
|
(
|
)
|
|
|
|
|
||||||
|
Staff related obligations
|
|
|
|
|
(
|
)
|
|
|
|
|
||||||
|
Voluntary separation plans
|
|
|
|
|
(
|
)
|
|
|
|
|
||||||
|
Litigation and other (see note 8.3)
|
|
|
|
|
(
|
)
|
|
|
|
|
||||||
|
Tax claims
|
|
|
|
|
(
|
)
|
|
|
|
|
||||||
|
Other legal claims
|
|
|
|
|
(
|
)
|
|
|
|
|
||||||
|
Commercial agreements and onerous contracts
|
|
|
|
|
(
|
)
|
3
|
|
|
|
|
|||||
|
Other
|
|
|
|
|
(
|
)
|
|
|
|
|
||||||
|
|
|
|
|
(
|
)
|
|
|
|
|
|||||||
|
Short-term provisions
|
|
|
|
|
||||||||||||
|
Long-term provisions
|
|
|
|
|
||||||||||||
|
|
|
|
|
|||||||||||||
|
1.
|
Additions exclude provisions reversed or utilized during the same year.
|
|
2.
|
Other movements primarily relate to the provisions in connection with environmental remediation obligations in Italy (see note 8.3).
|
|
3.
|
|
There are uncertainties regarding the timing and amount of the provisions above. Changes in underlying facts and circumstances for each provision could result in differences in the amounts provided for and the actual outflows. In general,
F-101
ARCELORMITTAL AND SUBSIDIARIES
Notes to Consolidated Financial Statements
(millions of U.S. dollars, except share and per share data)
provisions are presented on a non-discounted basis due to the uncertainties regarding the timing or the short period of their expected consumption.
Environmental provisions have been estimated based on internal and third-party estimates of contaminations, available remediation technology, and environmental regulations. Estimates are subject to revision as further information develops or circumstances change.
Provisions for site restoration are related to costs incurred for dismantling of site facilities, mainly in France. In the fourth quarter of 2018, the agreement between ArcelorMittal and the French government regarding a six year idling period of the Florange liquid phase expired. The Company will proceed with the definitive closure of the facility and recorded accordingly a
113
provision for the dismantling of the facility.
Provisions for staff related obligations primarily concern the United States and Brazil and are related to various employees’ compensation.
Provisions for voluntary separation plans primarily concern plans in Spain, Czech Republic, Belgium and the United States which are expected to be settled within one year.
Provisions for litigation include losses relating to a present legal obligation that are considered to be probable. Further detail regarding legal matters is provided in note 8.3.
|
|
December 31,
|
||||
|
|
2018
|
2017
|
|||
|
Derivative financial instruments
|
|
|
|
|
|
|
Payable from acquisitions
|
|
|
|
|
|
|
Unfavorable contracts
|
|
|
|
|
|
|
Other
|
|
|
|
|
|
|
Total
|
|
|
|
|
|
Derivative financial instruments include
124
as of
December 31, 2018
relating to the fair value of the put option granted to ISP in the framework of the acquisition of Ilva (see note 2.2.4).
Payable from acquisitions include
1,245
relating to the non-current portion of the consideration payable with respect to the acquisition of Ilva and
253
relating to the financial liability with respect to the acquisition of Votorantim (see note 2.2.4).
Environmental Liabilities
ArcelorMittal’s operations are subject to a broad range of laws and regulations relating to the protection of human health and the environment at its multiple locations and operating subsidiaries. As of
December 31, 2018
, excluding asset retirement obligations, ArcelorMittal had established provisions of
1,228
for environmental remedial activities and liabilities. The provisions for all operations by geographic area were
930
in Europe,
132
in the United States,
135
in South Africa and
31
in Canada. In addition, ArcelorMittal and the previous owners of its facilities have expended substantial amounts to achieve or maintain ongoing compliance with applicable environmental laws and regulations. ArcelorMittal expects to continue to expend resources in this respect in the future.
F-102
ARCELORMITTAL AND SUBSIDIARIES
Notes to Consolidated Financial Statements
(millions of U.S. dollars, except share and per share data)
United States
ArcelorMittal’s operations in the United States have environmental provisions of
132
(exclusive of asset retirement obligations) to address existing environmental liabilities, of which
15
is expected to be spent in 2019. The environmental provisions principally relate to the investigation, monitoring and remediation of soil and groundwater at ArcelorMittal’s current and former facilities. ArcelorMittal USA continues to have significant environmental provisions relating to investigation and remediation at Indiana Harbor, Lackawanna, and its closed coal mining operations in southwestern Pennsylvania. ArcelorMittal USA’s environmental provisions also include
33
, with anticipated spending of
2
during 2019, to specifically address the removal and disposal of asbestos-containing materials and polychlorinated biphenyls (“PCBs”).
All of ArcelorMittal’s major operating and former operating sites in the United States are or may be subject to a corrective action program or other laws and regulations relating to environmental remediation, including projects relating to the reclamation of industrial properties. In some cases, soil or groundwater contamination requiring remediation is present at both currently operating and historical sites where ArcelorMittal has a continuing obligation. In other cases, ArcelorMittal USA is required to conduct studies to determine the extent of contamination, if any, that exists at these sites.
ArcelorMittal USA’s Indiana Harbor facility was party to a lawsuit filed by the United States Environmental Protection Agency (the “EPA”) under the United States Resource Conservation and Recovery Act (“RCRA”). An ArcelorMittal USA predecessor company entered into a Consent Decree, which, among other things, requires facility-wide RCRA Corrective Action and sediment assessment and remediation in the adjacent Indiana Harbor Ship Canal. ArcelorMittal USA entered into a Consent Decree Amendment defining the objectives for limited sediment assessment and remediation of a small portion of the Indiana Harbor Ship Canal. The provisions for environmental liabilities include
7
for such sediment assessment and remediation, and
5
for RCRA Corrective Action at the Indiana Harbor facility itself. Remediation ultimately may be necessary for other contamination that may be present at Indiana Harbor, but the potential costs of any such remediation cannot yet be reasonably estimated at this time.
ArcelorMittal USA’s properties in Lackawanna, New York are subject to an Administrative Order on Consent with the EPA requiring facility-wide RCRA Corrective Action. The Administrative Order requires the Company to perform a Remedial Facilities Investigation (“RFI”), a Corrective Measures Study, to implement appropriate interim and final remedial measures, and to perform required post-remedial closure activities. The New York State Department of Environmental Conservation and the EPA conditionally approved the RFI. ArcelorMittal USA has executed Orders on Consent to perform certain interim corrective measures while advancing the Corrective Measures Study. These include installation and operation of a ground water treatment system and dredging of a local waterway known as Smokes Creek. A Corrective Measure Order on Consent was executed for other site remediation activities. ArcelorMittal USA’s provisions for environmental liabilities include
29
for anticipated remediation and post-remediation activities at this site. The provisioned amount is based on the extent of soil and groundwater contamination identified by the RFI and the CMS remedial measures likely to be required, including excavation and consolidation of containment structures in an on-site landfill and continuation of groundwater pump and treatment systems.
ArcelorMittal USA is required to prevent acid mine drainage from discharging to surface waters at its closed mining operations in southwestern Pennsylvania. ArcelorMittal USA entered into a revised Consent Order and Agreement outlining a schedule for implementation of capital improvements and requiring the establishment of a treatment trust, estimated by the PaDEP to be the net present value of all future treatment cost. ArcelorMittal USA has been funding the treatment trust, which reached the target value in 2017. This target value is based on average spending over the last three years. The trust had a market value of
45
as of
December 31, 2018
. ArcelorMittal can be reimbursed from the fund for the continuing cost of treatment of acid mine drainage. ArcelorMittal USA’s provisions for environmental liabilities include
32
for this matter.
In 2011, the United States EPA Region V issued Notices of Violations ("NOVs") to Indiana Harbor, Burns Harbor and Cleveland alleging operational noncompliance based primarily on self-reported Title V permit concerns. Comprehensive settlement discussions with the United States EPA and affected state agencies involving all NOVs are ongoing and a comprehensive settlement with the United States EPA and affected state agencies, which is anticipated to encompass self-reported non-compliance through September 30, 2018 was finalized pending approvals by the government parties which are anticipated in early 2019. The settlement will include payment of penalties and injunctive relief. Liabilities associated with this comprehensive settlement are estimated at
7
.
In 2014, the ArcelorMittal Monessen coke plant was re-started after having been idled since 2008. Since re-start, state regulatory authorities (“PADEP”) issued numerous NOVs, the majority of which concerns Clean Air Act violations. United States EPA Region 3 also issued an NOV and, in addition, issued an information request seeking detailed testing and
F-103
ARCELORMITTAL AND SUBSIDIARIES
Notes to Consolidated Financial Statements
(millions of U.S. dollars, except share and per share data)
information concerning air compliance related issues. PADEP issued a proposed penalty assessment of
1
for alleged violations occurring from April 2014 through May 2015. Penalties were finalized as part of comprehensive Consent Decree negotiations with PADEP and United States EPA enforcement officials and with Penn Environment, a local environmental group which filed a Citizen Suit under the Clean Air Act in 2015. The litigation was stayed in 2016. A Consent Decree was executed on February 2, 2018 requiring civil penalty payment and injunctive relief. The total payment of
2
was paid and injunctive relief requirements, including a caustic scrubber demonstration, are being performed.
Europe
Environmental provisions for ArcelorMittal’s operations in Europe total
930
and are mainly related to the investigation and remediation of environmental contamination at current and former operating sites in France (
74
), Belgium (
229
), Luxembourg (
47
), Poland (
25
), Germany (
25
), Italy (
523
) and Spain (
7
). This investigation and remediation work relates to various matters such as decontamination of water discharges, waste disposal, cleaning water ponds and remediation activities that involve the clean-up of soil and groundwater. These provisions also relate to human health protection measures such as fire prevention and additional contamination prevention measures to comply with local health and safety regulations.
France
In France, there is an environmental provision of
74
, principally relating to the remediation of former sites, including several coke plants, and the capping and monitoring of landfills or basins previously used for residues and secondary materials.
The remediation of the coke plants concerns mainly the Thionville, Moyeuvre Grande, Homecourt, Hagondange and Micheville sites, and is related to treatment of soil and groundwater. At Moyeuvre Petite, the recovery process of the slag is ongoing and ArcelorMittal is responsible for closure and final rehabilitation of the rest of the site. At other sites, ArcelorMittal is responsible for monitoring the concentration of heavy metals in soil and groundwater.
ArcelorMittal Atlantique et Lorraine has an environmental provision that principally relates to the remediation and improvement of storage of secondary materials, the disposal of waste at different ponds and landfills and an action plan for removing asbestos from the installations and mandatory financial guarantees to cover risks of major accident hazard or for gasholders and waste storage. Most of the provision relates to the stocking areas at the Dunkirk site that will need to be restored to comply with local law and to the mothballing of the liquid phase in Florange (prior to the dismantling of the facility see note 8.1), including study and surveillance of soil and water to prevent environmental damage, treatment and elimination of waste and financial guarantees demanded by Public Authorities. The environmental provisions also include treatment of slag dumps at Florange and Dunkirk sites as well as removal and disposal of asbestos-containing material at the Dunkirk and Mardyck sites.
ArcelorMittal Atlantique et Lorraine also has an environmental provision that principally relates to the remediation and improvement of storage of secondary materials, the disposal of waste at different ponds and landfills: the stocking areas at the Dunkirk site need to be restored to comply with local law.
Industeel France has an environmental provision that principally relates to ground remediation at the Le Creusot site and to the rehabilitation of waste disposal areas at the Châteauneuf site.
Belgium
In Belgium, there is an environmental provision of
229
of which the most significant elements are legal site remediation obligations linked to the closure of the primary installations at ArcelorMittal Belgium (Liège). The provisions also concern the external recovery and disposal of waste, residues or by-products that cannot be recovered internally on the ArcelorMittal Gent and Liège sites and the removal and disposal of asbestos-containing material.
Luxembourg
In Luxembourg, there is an environmental provision of
47
, which relates to the post-closure monitoring and remediation of former production sites, waste disposal areas, slag deposits and mining sites.
In 2007, ArcelorMittal Luxembourg sold the former Ehlerange slag deposit (
93
hectares) to the State of Luxembourg. ArcelorMittal Luxembourg is contractually liable to clean the site and move approximately
400,000
cubic meters of material to other sites. ArcelorMittal Luxembourg also has an environmental provision to secure, stabilize and conduct waterproofing treatment on mining galleries and entrances and various dumping areas in Mondercange, Differdange and Dommeldange. In
F-104
ARCELORMITTAL AND SUBSIDIARIES
Notes to Consolidated Financial Statements
(millions of U.S. dollars, except share and per share data)
addition, ArcelorMittal Luxembourg has secured the disposal of laddle slag, sludge and certain other residues coming from different sites at the Differdange dump
for a total volume of
1,300,000
cubic meters until mid 2023. A provision of
40
covers these obligations.
ArcelorMittal Belval and Differdange has an environmental provision of
7
to clean historical landfills in order to meet the requirements of the Luxembourg Environment Administration and to cover dismantling and soil cleaning costs of the former PRIMOREC installation.
Poland
ArcelorMittal Poland S.A.’s environmental provision of
25
mainly relates to the obligation to reclaim a landfill site and to dispose of the residues which cannot be internally recycled or externally recovered. The provision also concerns the storage and disposal of iron-bearing sludge which cannot be reused in the manufacturing process under the new environmental law; waste storage time cannot exceed 1 year.
Germany
In Germany, the environmental provision of
25
essentially relates to ArcelorMittal Bremen’s post-closure obligations mainly established for soil remediation, groundwater treatment and monitoring at the Prosper coke plant in Bottrop.
Italy
In Italy, ArcelorMittal Italia has environmental provisions of
523
.
A provision of
309
relates to remediation activities to be carried out in the site of Taranto derived from obligations on the previous operator that have been transferred to ArcelorMittal Italia through the environmental permit, the most significant elements being the waterproofing of certain areas to confine historical pollution, the removal of historical accumulation of process materials mainly consisting of blast furnace ("BF") and basic oxygen furnace ("BOF") dusts and sludges and scales, an action plan for the removal and disposal of asbestos-containing materials present on site, the dismantling of several installations no longer in operation, the dredging of the discharge channel and disposal of the sludge removed, the decontamination of high depth groundwater in the primary yards area and the capping of an exhausted landfill.
Provisions of
214
are allocated to the implementation of preventive measures, permanent safety measures and clean up measures in relation to historical pollution of soil and groundwater, not derived from obligations in the environmental permit, but that ArcelorMittal Italia undertook to implement as a contractual obligation vis-a-vis the previous operator.
Spain
In Spain, ArcelorMittal España has environmental provisions of
7
due to obligations of sealing landfills basically located in the Asturias site and post-closure obligations in accordance with national legislation. These obligations include the collection and treatment of leachates that can be generated during the operational phase and a period of
30
years after the closure.
South Africa
AMSA has environmental provisions of
135
to be used over
18
years, mainly relating to environmental remediation obligations attributable to historical or legacy settling/evaporation dams and waste disposal activities. An important determinant in the final timing of the remediation work relates to the obtaining of the necessary environmental authorizations.
A provision of
37
relates to the decommissioned Pretoria Works site. This site is in a state of partial decommissioning and rehabilitation with one coke battery and a small-sections rolling facility still in operation. AMSA transformed this old plant into an industrial hub for light industry since the late 1990s. Particular effort is directed to landfill sites, with sales of slag from legacy disposal sites to vendors in the construction industry continuing unabated, but other remediation works continued at a slow pace as remediation actions for these sites are long-term in nature due to a complex legal process that needs to be followed with authorities and surrounding landowners.
The Vanderbijlpark Works site, the main flat carbon steel operation of AMSA
, contains a number of legacy facilities and areas requiring remediation. The remediation entails the implementation of rehabilitation and decontamination measures of waste disposal sites, waste water dams, ground water and historically contaminated open areas.
19
of the provision is allocated to this site.
F-105
ARCELORMITTAL AND SUBSIDIARIES
Notes to Consolidated Financial Statements
(millions of U.S. dollars, except share and per share data)
The Newcastle Works site is the main long carbon steel operation of AMSA
.
A provision of
20
is allocated to this site. As with all operating sites of AMSA, the above retirement and remediation actions dovetail with numerous large capital expenditure projects dedicated to environmental management. In the case of the Newcastle site, the major current environmental capital project is for air quality improvements.
A provision of
51
relates to the environmental rehabilitation of the Thabazimbi Mine. On November 1, 2018, the Thabazimbi mine was acquired from Sishen Iron Ore Company (Pty) Ltd, enabling AMSA to control the environmental rehabilitation process. In terms of the sales agreement, AMSA is liable for all environmental remediation obligations. The acquisition did not have a significant impact on the environmental obligations of AMSA as it has always been contractually responsible for the majority of the rehabilitation cost relating to the Thabazimbi Mine. As part of the acquisition, AMSA acquired an asset in the form of an environmental trust which holds investments for a value of
22
. These investments will be used for rehabilitation purposes
.
The remainder of the obligation of
8
relates to Vereeniging site for the historical pollution that needs to be remediated at waste disposal sites, waste water dams and groundwater aquifers.
Canada
In Canada, ArcelorMittal Dofasco has an environmental provision of
27
for the expected cost of remediating toxic sediment located in the Company’s East Boatslip site, of which
5
is expected to be spent in 2019. ArcelorMittal Long Products Canada has an environmental provision of
4
for future disposal of sludge left in ponds after flat mills closure at Contrecoeur.
Asset Retirement Obligations (“AROs”)
AROs arise from legal requirements and represent management’s best estimate of the present value of the costs that will be required to retire plant and equipment or to restore a site at the end of its useful life. As of
December 31, 2018
, ArcelorMittal had established provisions for asset retirement obligations of
422
, including mainly
42
for Ukraine,
121
for Canada,
80
for the United States,
57
for Mexico,
15
for Belgium,
37
for Germany,
14
for South Africa,
12
for Spain,
13
for Brazil,
12
for Kazakhstan and
17
for Liberia.
The AROs in Ukraine are legal obligations for site rehabilitation at the iron ore mining site in Kryvyi Rih, upon closure of the mine pursuant to its restoration plan.
The AROs in Canada are legal obligations for site restoration and dismantling of the facilities near the mining sites in Mont-Wright and Fire Lake, and the accumulation area of mineral substances at the facility of Port-Cartier in Quebec, upon closure of the mine pursuant to the restoring plan of the mines.
The AROs in the United States principally relate to mine closure costs of the Hibbing and Minorca iron ore mines and Princeton coal mines.
The AROs in Mexico relate to the restoration costs following the closure of the Las Truchas, El Volcan and the joint operation of Pena Colorada iron ore mines.
In Belgium, the AROs are to cover the demolition costs for primary facilities at the Liège sites.
In Spain, the AROs relate to the discontinuance of the activities of various assets within the upstream installations.
In Germany, AROs principally relate to the Hamburg site, which operates on leased land with the contractual obligation to remove all buildings and other facilities upon the termination of the lease, and to the Prosper coke plant in Bottrop for filling the basin, restoring the layer and stabilizing the shoreline at the harbor.
The AROs in South Africa are for the Pretoria, Vanderbijlpark, Saldanha, Newcastle as well as the Coke and Chemical sites, and relate to the closure and clean-up of the plant associated with decommissioned tank farms, tar plants, chemical stores, railway lines, pipelines and defunct infrastructure.
In Brazil, the AROs relate to legal obligations to clean and restore the mining areas of Serra Azul and Andrade, both located in the State of Minas Gerais. The related provisions are expected to be settled in 2024 and 2029, respectively.
In Kazakhstan, the AROs relate to the restoration obligations of the iron ore and coal mines.
F-106
ARCELORMITTAL AND SUBSIDIARIES
Notes to Consolidated Financial Statements
(millions of U.S. dollars, except share and per share data)
In Liberia, the AROs relate to iron ore mine and associated infrastructure and mine related environmental damage and compensation. They cover the closure and rehabilitation plan under both the current operating phase and the not yet completed Phase 2 expansion project.
Tax Claims
ArcelorMittal is a party to various tax claims. As of
December 31, 2018
, ArcelorMittal had recorded provisions in the aggregate of
120
for tax claims in respect of which it considers the risk of loss to be probable. Set out below is a summary description of the tax claims (i) in respect of which ArcelorMittal had recorded a provision as of
December 31, 2018
, (ii) that constitute a contingent liability, (iii) that were resolved in
2018
or (iv) that were resolved and had a financial impact in 2017 or 2016, in each case involving amounts deemed material by ArcelorMittal. The Company is vigorously defending against the pending claims discussed below.
Brazil
In 2003, the Federal Revenue Service granted ArcelorMittal Brasil (through its predecessor company, then known as CST) a tax benefit for certain investments. ArcelorMittal Brasil had received certificates from SUDENE, the former Agency for the Development of the Northeast Region of Brazil, confirming ArcelorMittal Brasil’s entitlement to this benefit. In September 2004, ArcelorMittal Brasil was notified of the annulment of these certificates. ArcelorMittal Brasil has pursued its right to this tax benefit through the courts against both ADENE, the successor to SUDENE, and against the Federal Revenue Service. The Federal Revenue Service issued a tax assessment in this regard for
451
in December 2007. In December 2008, the administrative tribunal of first instance upheld the amount of the assessment. ArcelorMittal Brasil appealed to the administrative tribunal of second instance, and, on August 8, 2012, the administrative tribunal of the second instance found in favor of ArcelorMittal invalidating the tax assessment, thereby ending this case except for
6
, which is still pending a final decision. On April 16, 2011, ArcelorMittal Brasil received a further tax assessment for the periods of March, June and September 2007, which, taking into account interest and currency fluctuations, amounted to
163
as of
December 31, 2018
. In October 2011, the administrative tribunal of first instance upheld the tax assessment received by ArcelorMittal Brasil on April 16, 2011, but decided that no penalty (amounting to
77
at that time) was due. Both parties have filed an appeal with the administrative tribunal of second instance. In February 2018, the administrative tribunal of second instance found in favor of ArcelorMittal Brasil and, in June 2018, the Federal Revenue Service filed an appeal with the administrative tribunal of the third instance. In January 2019, the administrative tribunal of the third instance found in favor of ArcelorMittal Brasil.
In 2011, ArcelorMittal Brasil (at the time SOL Coqueria Tubarão S.A.) received
21
tax assessments from the Revenue Service of the State of Espirito Santo for ICMS (a value-added tax) in the total amount of
30
relating to a tax incentive (INVEST) it used. The dispute concerns the definition of fixed assets. In August 2015, the administrative tribunal of first instance upheld
21
of the tax assessments.
In September 2015, ArcelorMittal Brasil filed appeals with respect to each of the administrative tribunal’s decisions.
As of December 31, 2018
, there have been final unfavorable decisions at the administrative tribunal level in
15
of the
21
cases, each of which ArcelorMittal Brasil has appealed to the judicial instance.
In March 2018, the administrative tribunal of third instance found in favor of ArcelorMittal Brasil sending the
six
other cases back to the administrative tribunal of second instance.
In 2011, ArcelorMittal Brasil received a tax assessment for corporate income tax (known as IRPJ) and social contributions on net profits (known as CSL) in relation to (i) the amortization of goodwill on the acquisition of Mendes Júnior Siderurgia (for the 2006 and 2007 fiscal years), (ii) the amortization of goodwill arising from the mandatory tender offer (MTO) made by ArcelorMittal to minority shareholders of Arcelor Brasil following the two-step merger of Arcelor and Mittal Steel N.V. (for the 2007 tax year), (iii) expenses related to pre-export financing used to finance the MTO, which were deemed by the tax authorities to be unnecessary for ArcelorMittal Brasil since the expenses were incurred to buy shares of its own company and (iv) CSL over profits of controlled companies in Argentina and Costa Rica. The amount claimed totals
524. On January 31, 2014, the administrative tribunal of first instance found in partial favor of ArcelorMittal Brasil, reducing the penalty component of the assessment from, according to ArcelorMittal Brasil’s calculations,
266
to
141
(as calculated at the time of the assessment), while upholding the remainder of the assessment. The Federal Revenue Service has appealed the administrative tribunal’s decision to reduce the amount of the original penalty. ArcelorMittal Brasil has also appealed the administrative tribunal’s decision to uphold the tax authority’s assessment (including the revised penalty component). In September 2017, the administrative tribunal of second instance found largely in favor of the Federal Revenue Service. In January 2018, ArcelorMittal Brasil filed a motion for clarification of this decision. In February 2018, the motion for clarification was rejected and, in March 2018, an appeal was filed to the administrative tribunal of third instance.
F-107
ARCELORMITTAL AND SUBSIDIARIES
Notes to Consolidated Financial Statements
(millions of U.S. dollars, except share and per share data)
In 2013, ArcelorMittal Brasil received a tax assessment in relation to the 2008-2010 tax years for IRPJ and CSL in relation to (i) the amortization of goodwill on the acquisition of Mendes Júnior Siderurgia, Dedini Siderurgia and CST, (ii) the amortization of goodwill arising from the mandatory tender offer made by ArcelorMittal to minority shareholders of Arcelor Brasil following the two-step merger of Arcelor and Mittal Steel N.V. and (iii) CSL and IRPJ over profits of controlled companies in Argentina, Costa Rica, Venezuela and the Netherlands. The amount claimed totals
457
. In October 2014, the administrative tribunal of first instance found in favor of the Federal Revenue Service and ArcelorMittal Brasil filed its appeal in November 2014. In September 2017, the administrative tribunal of second instance found in favor of the Federal Revenue Service. ArcelorMittal Brasil filed a motion for clarification with respect to this decision, which was denied, and thereafter filed an appeal to the administrative tribunal of third instance.
In April 2016, ArcelorMittal Brasil received a tax assessment in relation to (i) the amortization of goodwill resulting from Mittal Steel’s mandatory tender offer to the minority shareholders of Arcelor Brasil following Mittal Steel’s merger with Arcelor in 2007 and (ii) the amortization of goodwill resulting from ArcelorMittal Brasil’s acquisition of CST in 2008. While the assessment, if upheld, would not result in a cash payment as ArcelorMittal Brasil did not have any tax liability for the fiscal years in question (2011 and 2012), it would result in the write-off of
249
worth of ArcelorMittal Brasil’s net operating loss carryforwards and as a result could have an effect on net income over time. In May 2016, ArcelorMittal Brasil filed its defense, which was not accepted at the first administrative instance. On March 10, 2017, ArcelorMittal Brasil filed an appeal to the second administrative instance.
In December 2018, ArcelorMittal Brasil received a tax assessment for
151
for the 2013-2014 tax years, principally in relation to the amortization of goodwill resulting from Mittal Steel’s mandatory tender offer to the minority shareholders of Arcelor Brasil following Mittal Steel’s merger with Arcelor in 2007. ArcelorMittal Brasil filed a defense in the first administrative instance in January 2019.
In 2013, ArcelorMittal Brasil filed a lawsuit against the Federal Revenue Service disputing the basis of calculation of a tax called
additional freight for the renewal of the Brazilian Merchant Navy
("AFRMM"), amounting to
55
. The dispute is related to the inclusion of the unloading and land transport costs of the imported goods after landing to calculate AFRMM.
In
June 2013, ArcelorMittal Brasil obtained a preliminary decision allowing the Company not to pay such amount until a final decision was rendered
.
In February 2017, ArcelorMittal Brasil obtained a favorable decision at the judicial first instance but this decision is subject to further mandatory review.
In November 2018, a related tax assessment was received from the Federal Revenue Service claiming
22
as a penalty for alleged failure to comply with formal requirements in the import declarations delivered by the Company in the years 2013-2018, which were the subject matter of the preliminary decision of June 2013. In December 2018, ArcelorMittal Brasil presented its defense in the first administrative instance.
In February 2019, the Judicial Court of Appeals upheld the favorable first instance decision. The decision is subject to further appeals.
For over
18
years, ArcelorMittal Brasil has been challenging the basis of the calculation of the Brazilian COFINS and PIS social security taxes (specifically, whether Brazilian VAT may be deducted from the base amount on which the COFINS and PIS taxes are calculated), in an amount of
4
. ArcelorMittal Brasil deposited the disputed amount in escrow with the relevant Brazilian judicial branch when it became due. Since the principal amount bears interest at a rate applicable to judicial deposits, the amount stood at
49
as of
December 31, 2018
. In March 2017, the Supreme Court decided a separate case, not involving ArcelorMittal Brasil, on the same subject in favor of the relevant taxpayers. Such separate Supreme Court decision, which is of binding precedential value with respect to all similar cases, including those of ArcelorMittal Brasil, is being appealed by the Federal Revenue Service.
In July 2018, the second judicial instance found in favor of ArcelorMittal Brasil after applying the Supreme Court’s precedent. In December 2018, the Federal Revenue Service brought an appeal of the second judicial instance’s decision to the Supreme Court.
In the period from 2014 to 2018, ArcelorMittal Brasil received
four
tax assessments from the Federal Revenue Service in the amount of
51
disputing its use of credits for PIS and COFINS social security taxes in 2010, 2011 and 2013. The dispute relates to the concept of production inputs in the context of these taxes. In 2017, in the first and second
cases, the administrative tribunal of second instance found partially in favor of ArcelorMittal Brasil, and ArcelorMittal Brasil filed an appeal to the administrative tribunal of third instance. In the third case, the administrative tribunal of first instance upheld the tax assessment, and ArcelorMittal Brasil appealed to the administrative tribunal of second instance.
In the fourth case, ArcelorMittal Brasil filed a defense in March 2018. In March, 2018, the Superior Court decided a leading case, not involving ArcelorMittal Brasil, that established that the restrictive concept of inputs adopted by the tax authorities is illegal and that credits over inputs must be accepted on the basis of the criteria of essentiality or relevance towards the production process of each taxpayer. In September 2018, the Federal Union published an internal orientation for its attorneys, expressing a restrictive view of the Superior Court’s decision and determining that each individual case would be analyzed in order to decide whether the items are essential or not.
F-108
ARCELORMITTAL AND SUBSIDIARIES
Notes to Consolidated Financial Statements
(millions of U.S. dollars, except share and per share data)
In that sense, ArcelorMittal Brasil’s cases will be submitted for review by the Federal Union Attorney’s office before further decisions are taken.
In May 2014, ArcelorMittal Comercializadora de Energia received a tax assessment from the state of Minas Gerais alleging that the Company did not correctly calculate tax credits on interstate sales of electricity from February 2012 to December 2013. The amount claimed totals
51
. ArcelorMittal Comercializadora de Energia filed its defense in June 2014. Following an unfavorable administrative decision in November 2014, ArcelorMittal filed an appeal in December 2014. In March 2015, there was a further unfavorable decision at the second administrative level. Following the conclusion of this proceeding at the administrative level, the Company received the tax enforcement notice in December 2015 and filed its defense in February 2016. In April 2016, ArcelorMittal Comercializadora de Energia received an additional tax assessment in the amount, after taking account of a reduction of fines mentioned below, of
57
, regarding the same matter, for infractions which allegedly occurred during the 2014 to 2015 period, and filed its defense in May 2016. In May 2017, there was a further unfavorable decision at the second administrative level in respect of the tax assessment received in April 2016. In June 2017, ArcelorMittal Comercializadora de Energia filed an appeal to the second administrative instance. This appeal was rejected in August 2017. In October and November 2017, the Company appealed in relation to both tax assessments to the judicial instance. In November 2017, the Company received a notice from the tax authority informing it of the reduction of the fines element by
18
, due to the retroactive application of a new law.
In the period from May to July 2015, ArcelorMittal Brasil received
nine
tax assessments from the state of Rio Grande do Sul alleging that the Company, through its branches in that state, had not made advance payments of ICMS on sales in that state covering the period from May 2010 to April 2015. The amount claimed totals
88
. The administrative tribunal of first instance upheld the tax assessments in each of the
nine
cases, and ArcelorMittal Brasil appealed each of the administrative tribunal’s decisions. Each case was decided unfavorably to ArcelorMittal Brasil at the administrative tribunal of second instance, and ArcelorMittal Brasil has appealed the cases to the judicial instance.
On May 17, 2016, ArcelorMittal Brasil received a tax assessment from the state of Santa Catarina in the amount of
138
alleging that it had used improper methods to calculate the amount of its ICMS credits. ArcelorMittal Brasil filed its defense in July 2016. In December 2016, ArcelorMittal Brasil received an unfavorable decision at the first administrative level, in respect of which it filed an appeal.
In March 2018, the administrative tribunal of second instance found against ArcelorMittal Brasil and, in April 2018, ArcelorMittal Brasil filed an appeal to the administrative tribunal of third instance.
France
Following audits for 2006, 2007 and 2008 of ArcelorMittal France and other French ArcelorMittal entities, URSSAF, the French body responsible for collecting social contributions, commenced formal proceedings for these years alleging that the French ArcelorMittal entities owe
69
in social contributions on various payments, the most significant of which relate to profit sharing schemes, professional fees and stock options. Proceedings were commenced in relation to the 2006 claims in December 2009. Proceedings were commenced in relation to the 2007 and 2008 claims in February and March 2010, respectively. In
three
decisions dated December 10, 2012, the arbitration committee hearing the matter found that social contributions in an amount of
17
,
11
and
5
are due in respect of profit-sharing schemes, stock options and professional fees, respectively. These amounts cover the audits for 2006, 2007 and 2008. In March 2013, the Company filed appeals against the decisions relating to the profit-sharing schemes and stock options.
Following audits for 2009, 2010 and 2011 of ArcelorMittal France and other French ArcelorMittal entities, URSSAF commenced formal proceedings in December 2012 for these years alleging that these entities owe
150
in social contributions (including interest and late fees relating thereto) on various payments, the most significant of which relate to voluntary separation schemes, profit sharing schemes, professional fees and stock options. In its decision dated April 24, 2013, the arbitration committee reduced the amount claimed by
29
. The dispute then entered into a judicial phase before the
Tribunal des Affaires de Sécurité Sociale
(“TASS”). At a hearing on January 12, 2017 before the TASS, the parties signed a conciliation agreement settling the audits covered by the above two cases.
F-109
ARCELORMITTAL AND SUBSIDIARIES
Notes to Consolidated Financial Statements
(millions of U.S. dollars, except share and per share data)
Mexico
In 2015, the Mexican Tax Administration Service issued
a tax assessment to ArcelorMittal Mexico, alleging that ArcelorMittal Mexico owes
160
with respect to 2008, principally due to improper interest deductions relating to certain loans, and unpaid corporate income tax for interest payments that the tax authority has categorized as profit. In November 2015, ArcelorMittal Mexico filed an administrative appeal in respect of this assessment, which was dismissed by the tax authority. In November 2017, ArcelorMittal Mexico filed an annulment complaint before a Federal Administrative and Tax Justice Court, which has not been determined.
With respect to 2007 and 2009, the Mexican Tax Administration Service also challenged the interest deduction related to the aforementioned loans and issued tax assessments to ArcelorMittal Mexico for
21
and
25
, respectively. In November 2018, a Federal Administrative and Tax Justice Court ruled against the annulment complaint filed by ArcelorMittal Mexico in relation to the 2007 tax assessment and in December 2018, ArcelorMittal Mexico filed an appeal before the Collegiate Tribunal For Administrative Matters. With respect to the 2009 tax assessment, in November 2016 ArcelorMittal Mexico filed an administrative appeal before the Administrative Authority on Federal Tax Matters, which has not been determined.
In 2013, the Mexican Tax Administration Service issued a tax assessment to ArcelorMittal Las Truchas, alleging that ArcelorMittal Las Truchas owes
63
in respect of (i) non-payment of withholding tax on capitalized interest, (ii) non-deduction of accrued interest regarding certain loans, and (iii) reduction of assets tax taxable basis in 2007. In 2015, ArcelorMittal Las Truchas filed an administrative appeal in respect of the aforementioned assessment, which the tax authority dismissed. In October 2015, ArcelorMittal Las Truchas filed an annulment complaint before the Federal Administrative and Tax Justice Court, which ruled in favor of ArcelorMittal Las Truchas in October 2018. The tax authority filed an application for judicial review in January 2019.
In October 2018, the Mexican Tax Administration Service issued a tax assessment to ArcelorMittal Las Truchas, alleging that ArcelorMittal Las Truchas owes
85
with respect to 2013 due to: (i) improper interest deductions relating to certain loans and (ii) non-deduction of advanced rent payments. In November 2018, ArcelorMittal Las Truchas filed an administrative appeal before the Administrative Authority on Federal Tax Matters.
Competition/Antitrust Claims
ArcelorMittal is a party to various competition/antitrust claims. As of
December 31, 2018
, ArcelorMittal had not recorded
any provisions in respect of such claims. Set out below is a summary description of competition/antitrust claims
(i) that constitute a contingent liability, (ii) that were resolved in 2018 or (iii) that were resolved and had a financial impact in 2017 or 2016, in each case involving amounts deemed material by ArcelorMittal. The Company is vigorously defending against each of the pending claims discussed below.
Brazil
In September 2000, two construction trade organizations filed a complaint with Brazil’s Administrative Council for Economic Defense (“CADE”) against
three
long steel producers, including ArcelorMittal Brasil. The complaint alleged that these producers colluded to raise prices in the Brazilian rebar market, thereby violating applicable antitrust laws. In September 2005, CADE issued its final decision against ArcelorMittal Brasil, imposing a fine of
58
. ArcelorMittal Brasil appealed the decision to the Brazilian Federal Court. In September 2006, ArcelorMittal Brasil offered a guarantee letter and obtained an injunction to suspend enforcement of this decision pending the court’s judgment. In September 2017, the Court found against ArcelorMittal Brasil. In October 2017, ArcelorMittal Brasil filed a motion for clarification of this decision, which was dismissed. In December 2017, ArcelorMittal Brasil filed an appeal to the second judicial instance.
There is also a related class action commenced by the Federal Public Prosecutor of the state of Minas Gerais against ArcelorMittal Brasil for damages in an amount of
62 based on the alleged violations investigated by CADE.
A further related lawsuit was commenced in February 2011 by
four
units of Sinduscons, a civil construction trade organization, in federal court in Brasilia against,
inter alia
, ArcelorMittal Brasil claiming damages based on an alleged cartel in the rebar market as investigated by CADE and as noted above.
Romania
F-110
ARCELORMITTAL AND SUBSIDIARIES
Notes to Consolidated Financial Statements
(millions of U.S. dollars, except share and per share data)
In 2010 and 2011, ArcelorMittal Galati entered into high volume electricity purchasing contracts with Hidroelectrica, a partially state-owned electricity producer. Following allegations by Hidroelectrica’s minority shareholders that ArcelorMittal Galati (and other industrial electricity consumers) benefited from artificially low tariffs, the European Commission opened a formal investigation into alleged state aid in April 2012. The European Commission announced on June 12, 2015 that electricity supply contracts signed by Hidroelectrica with certain electricity traders and industrial customers (including the one entered by ArcelorMittal Galati) did not involve state aid within the meaning of the EU rules. In March 2017, the European Commission's decision was officially published. As no challenge was filed within two months of publication, the decision has become definitive.
South Africa
In February 2007, the complaint previously filed with the South African Competition Commission by Barnes Fencing, a South African producer of galvanized wire, alleging that ArcelorMittal South Africa, as a “dominant firm”, discriminated in pricing its low carbon wire rod was referred to the Competition Tribunal. The Competition Commission sought an order declaring that ArcelorMittal South Africa’s pricing in 2000-2003 in respect of low carbon wire rod amounted to price discrimination and an order that ArcelorMittal South Africa cease its pricing discrimination. In March 2008, the Competition Tribunal accepted the claimants’ application for leave to intervene. In November 2012, a second complaint alleging price discrimination regarding the same product over the 2004 to 2006 period was referred by the Competition Commission to the Competition Tribunal. ArcelorMittal is unable to assess the outcome of these proceedings or the amount of ArcelorMittal South Africa’s potential liability, if any.
On September 1, 2009, the South African Competition Commission referred a complaint against
four
producers of long carbon steel in South Africa, including ArcelorMittal South Africa, and the South African Iron and Steel Institute to the Competition Tribunal. The complaint referral followed an investigation into alleged collusion among the producers initiated in April 2008, on-site inspections conducted at the premises of some of the producers and a leniency application by Scaw South Africa,
one
of the producers under investigation. The Competition Commission recommended that the Competition Tribunal impose an administrative penalty against ArcelorMittal South Africa, Cape Gate and Cape Town Iron Steel Works in the amount of
10
%
of their annual revenues in South Africa (in the year preceding any final decision) and exports from South Africa for 2008. ArcelorMittal filed an application to access the file of the Competition Commission that was rejected. ArcelorMittal appealed the decision to reject the application, and applied for a review of that decision and a suspension of the obligation to respond to the referral on the substance pending final outcome on the application for access to the documents. The appeal was upheld by the Competition Appeals Court (CAC) and the matter was referred back to the Competition Tribunal for a determination of confidentiality and scope of access to the documents. The Competition Commission appealed the decision of the CAC, and, on May 31, 2013, the Supreme Court of Appeal dismissed the appeal of the Competition Commission and confirmed the decision of the CAC. In 2014, ArcelorMittal South Africa requested the documents from the Competition Commission, which provided an index thereof. On July 7, 2011, ArcelorMittal filed an application before the Competition Tribunal to set aside the complaint referral based on procedural irregularities but this application was withdrawn by notice dated August 7, 2014.
In March 2012, the South African Competition Commission referred to the Competition Tribunal an allegation that ArcelorMittal South Africa and steel producer Highveld acted by agreement or concerted practice to fix prices and allocate markets in respect of certain flat carbon steel products over a period of
10
years (1999-2009) in contravention of the South African Competition Act.
In August 2013, the South African Competition Commission referred a complaint against four scrap metal purchasers in South Africa, including ArcelorMittal South Africa, to the South African Competition Tribunal for prosecution. The complaint alleged collusion among the purchasers to fix the price and other trading conditions for the purchase of scrap over a period from 1998 to at least 2008.
In relation to all these cases, following an extensive engagement, ArcelorMittal South Africa reached an agreement on an overall settlement with the Competition Commission for an amount of
1.5
billion
South African rand (approximately
110
). In October 2016, Barnes Fencing filed an application with the Competition Tribunal to review and set aside the said settlement agreement in respect of the Barnes matters. In addition, Barnes filed an objection to the settlement agreement and an application to stay. The settlement agreement, as amended to exclude the Barnes case referred to above, was approved, subject to minor amendments, by the Competition Tribunal, on November 16, 2016.
F-111
ARCELORMITTAL AND SUBSIDIARIES
Notes to Consolidated Financial Statements
(millions of U.S. dollars, except share and per share data)
Germany
In the first half of 2016, the German Federal Cartel Office carried out unannounced investigations of ArcelorMittal Ruhrort GmbH and ArcelorMittal Commercial Long Deutschland GmbH following alleged breaches of antitrust rules.
ArcelorMittal Ruhrort GmbH and ArcelorMittal Commercial Long Deutschland GmbH cooperated with the German Federal Cartel Office in its investigation and, in July 2018, as a result of a settlement process, the Company and the Federal Cartel Office reached agreement as to a
146
fine to be paid by ArcelorMittal Commercial Long Deutschland GmbH. The fine was paid in August 2018 ending the investigation as concerns the ArcelorMittal entities.
In August 2017, the German Federal Cartel Office carried out unannounced investigations of ArcelorMittal Bremen, ArcelorMittal Eisenhüttenstadt GmbH and ArcelorMittal Berlin Holding GmbH principally
relating to alleged breaches of antitrust rules concerning (i) agreement between flat steel producers regarding extras from June 2006 - March 2016 (ii) impermissible exchanges of sensitive information between competitors from 1986 - 2016 and (iii) agreement to continue market and price structure introduced by the European Coal and Steel Community from 2002-2016. ArcelorMittal has not, to the date of this annual report, received subsequent communications from the German Federal Cartel Office in this respect.
Other Legal Claims
ArcelorMittal is a party to various other legal claims. As of
December 31, 2018
, ArcelorMittal had recorded provisions of
249
for other legal claims in respect of which it considers the risk of loss to be probable. Set out below is a summary description of the other legal claims (i) in respect of which ArcelorMittal had recorded a provision as of
December 31, 2018
, (ii) that constitute a contingent liability, (iii) that were resolved in 2018, or (iv) that were resolved and had a financial impact in 2017 or 2016, in each case involving amounts deemed material by ArcelorMittal. The Company is vigorously defending against each of the claims discussed below that remain pending.
Argentina
Over the course of 2007 to 2018, the Argentinian Customs Office Authority (Aduana) notified Acindar, the Company's Argentinian subsidiary, of certain inquiries that it was conducting with respect to prices declared by Acindar related to iron ore imports. The Customs Office Authority was seeking to determine whether Acindar incorrectly declared prices for iron ore imports from several different Brazilian suppliers and from ArcelorMittal Sourcing originally on
39
different claims concerning several shipments made between 2002 and 2014.
The investigations are subject to the administrative procedures of the Customs Office Authority and are at different procedural stages depending on the filing date of the investigation.
In March 2018, the Customs Office Authority issued a general instruction that orders customs to withdraw current claims related to the difference between import prices in Argentina and export prices of iron ore when exiting Brazil. This will have a material impact on the claims made against Acindar although the exact impact cannot be quantified at this stage.
As of
February 2019
, the aggregate amount claimed by the Customs Office Authority in respect of all iron ore shipments is
139
in
26
different cases. Of these
26
cases,
8
are still in the administrative branch of the Customs Office Authority and the other
18
cases, in which the administrative branch of the Customs Office Authority ruled against Acindar, have been appealed to the Argentinian National Fiscal Court.
Canada
In April 2011, a proceeding was commenced before the Ontario (Canada) Superior Court of Justice under the Ontario Class Proceedings Act, 1992, against ArcelorMittal, Baffinland, and certain other parties relating to the January 2011 take-over of Baffinland by ArcelorMittal, Nunavut Iron Ore Holdings and 1843208 Ontario Inc. The action alleges that the tender offer document contained certain misrepresentations and seeks damages in an aggregate amount of
734
(CAD
1
billion
) or
rescission of the transfer of the Baffinland securities by members of a class comprised of all Baffinland securities holders who tendered their Baffinland securities, and whose securities were taken up, in connection with the take-over between September 22, 2010 and February 17, 2011, or otherwise disposed of their Baffinland securities on or after January 14, 2011. The class certification hearings were held in January 2018, and the court certified the class in a decision dated May 18, 2018. The court also certified the statutory circular misrepresentation, insider trading, unjust enrichment and oppression claims. The court included in the class persons who tendered their Baffinland securities to the take-over bid and, for purposes of the oppression claims only, persons who sold their Baffinland securities in the secondary market after January 13, 2011. The court excluded from the class those persons who disposed of their Baffinland securities pursuant to a court ordered plan of arrangement.
F-112
ARCELORMITTAL AND SUBSIDIARIES
Notes to Consolidated Financial Statements
(millions of U.S. dollars, except share and per share data)
Italy
In January 2010, ArcelorMittal received notice of a claim filed by Finmasi S.p.A. relating to a memorandum of agreement (“MoA”) entered into between ArcelorMittal Distribution Services France (“AMDSF”) and Finmasi in 2008. The MoA provided that AMDSF would acquire certain of Finmasi’s businesses for an amount not to exceed
106
, subject to the satisfaction of certain conditions precedent, which, in AMDSF’s view, were not fulfilled. Finmasi sued for (i) enforcement of the MoA, (ii) damages of
16
to
27
or (iii) recovery costs plus quantum damages for Finmasi’s alleged lost opportunity to sell to another buyer. In September 2011, the court rejected Finmasi’s claims other than its second claim. The court appointed an expert to determine the quantum of damages. In May 2013, the expert’s report was issued and valued the quantum of damages in the range of
47
to
68
. ArcelorMittal appealed the decision on the merits. In May 2014, the Court of Appeal issued a decision rejecting ArcelorMittal’s appeal. On June 20, 2014, ArcelorMittal filed an appeal of the Court of Appeal’s judgment with the Italian Court of Cassation. On April 11, 2018, the Court of Cassation rejected the appeal on the merits and upheld the Court of Appeal’s decision. On December 18, 2014, the Court of Milan issued a decision on the quantum of the damages and valued the quantum of damages in the sum of
27
plus interest. In June 2015, both parties served appeals of the decision on the quantum, with ArcelorMittal also seeking the suspension of the enforceability of the decision. On July 1, 2015, Finmasi formally notified to AMDSF the declaration of enforcement of the decision of December 18, 2014. On July 28, 2015, AMDSF filed an appeal against such declaration with the Court of Appeal of Reims in France. At a hearing on December 1, 2015, the Italian Court of Appeal accepted the suspension of the enforcement of the decision of December 18, 2014, following the agreement of AMDSF to provide a guarantee for its value. In March 2016, on the joint application of the parties, the Court of Appeal of Reims ordered the suspension of the proceedings. On July 19, 2018, the Court of Appeal upheld the Court of Milan’s decision on quantum dated December 18, 2014. In September 2018, ArcelorMittal filed an appeal to the Court of Cassation. In January 2019, Finmasi called on the AMDSF guarantee issued in the context of the enforcement proceedings that were suspended in 2015.
Luxembourg
In June 2012, the Company received writs of summons in respect of claims made by
59
former employees of ArcelorMittal Luxembourg. The claimants allege that they are owed compensation based on the complementary pension scheme that went into effect in Luxembourg in January 2000. The aggregate amount claimed by such former employees (bearing in mind that other former employees may bring similar claims) is
68
. Given the similarities in the claims, the parties agreed to limit the pending proceedings to
four
test claims. In April 2013, the Esch-sur-Alzette labor court rejected
two
of these test claims. The relevant plaintiffs are appealing these decisions. In November 2013, the Luxembourg city labor court rejected the
two
other test claims, which are also being appealed.
France
Certain subsidiaries of the ArcelorMittal group are parties to proceedings, dating from 2010, against Engie and Engie Thermique France which claim damages in the amount of
156
or alternatively
165
for an alleged wrongful termination of a contract for the transformation of steel production gas into electricity. The ArcelorMittal subsidiaries have filed a counterclaim in the amount of
139. The contract had been entered into in 2006 for a term of 20 years. ArcelorMittal Méditerranée terminated it in July 2010 on the basis that Engie was solely responsible for the delay in the commissioning of the power plant (which suffered from significant malfunctions) constructed for the transformation of steel production gas into electricity. Engie claims that ArcelorMittal was in breach of the contract at the time of the termination due to certain alleged issues with the furnishing and quality of its steel production gas, and therefore unable to terminate the contract based on the sole breaches of Engie. The case is before the Commercial Court of Nanterre. ArcelorMittal is vigorously defending itself in this matter and vigorously pursuing its counterclaim.
Retired and current employees of certain French subsidiaries of the former Arcelor have initiated lawsuits to obtain compensation for asbestos exposure in excess of the amounts paid by French social security (“Social Security”). Asbestos claims in France initially are made by way of a declaration of a work-related illness by the claimant to the Social Security authorities resulting in an investigation and a level of compensation paid by Social Security. Once the Social Security authorities recognize the work-related illness, the claimant, depending on the circumstances, can also file an action for inexcusable negligence (
faute inexcusable
) to obtain additional compensation from the company before a special tribunal. Where procedural errors are made by Social Security, it is required to assume full payment of damages awarded to the claimants. Due to fewer procedural errors made by Social Security, changes in the regulations and, consequently, fewer rejected cases, ArcelorMittal has been required to pay some amounts in damages since 2011.
F-113
ARCELORMITTAL AND SUBSIDIARIES
Notes to Consolidated Financial Statements
(millions of U.S. dollars, except share and per share data)
The number of claims outstanding for asbestos exposure at
December 31, 2018
was
367
as compared to
404
at
December 31, 2017
. The range of amounts claimed for the year ended
December 31, 2018
was
$
35,000
to
$
745,000
. The aggregate costs and settlements for the year ended
December 31, 2018
were
7.67
, of which
0.27
represented legal fees and
7.4
represented damages paid to the claimant. The aggregate costs and settlements for the year ended
December 31, 2017
were
6.4
, of which
0.25
represented legal fees and
6.1
represented damages paid to the claimant
.
Minority Shareholder Claims Regarding the Exchange Ratio in the Second-Step Merger of ArcelorMittal into Arcelor
ArcelorMittal is the company that results from the acquisition of Arcelor by Mittal Steel N.V. in 2006 and a subsequent two-step merger between Mittal Steel and ArcelorMittal and then ArcelorMittal and Arcelor. Following completion of this merger process, several former minority shareholders of Arcelor or their representatives brought legal proceedings regarding the exchange ratio applied in the second-step merger between ArcelorMittal and Arcelor and the merger process as a whole.
ArcelorMittal believes that the allegations made and claims brought by such minority shareholders are without merit and that the exchange ratio and merger process complied with the requirements of applicable law, were consistent with previous guidance on the principles that would be used to determine the exchange ratio in the second-step merger and that the merger exchange ratio was relevant and reasonable to shareholders of both merged entities.
Set out below is a summary of ongoing matters in this regard. Several other claims brought before other courts and regulators were dismissed and are definitively closed.
On January 8, 2008, ArcelorMittal received a writ of summons on behalf of four hedge fund shareholders of Arcelor to appear before the civil court of Luxembourg. The summons was also served on all natural persons sitting on the Board of Directors of ArcelorMittal at the time of the merger and
including Mr. Lakshmi Mittal, as well as on Mrs. Usha Mittal, among other parties. The plaintiffs alleged in particular that, based on Mittal Steel’s and Arcelor’s disclosure and public statements, investors had a legitimate expectation that the exchange ratio in the second-step merger would be the same as that of the secondary exchange offer component of Mittal Steel’s June 2006 tender offer for Arcelor (i.e.,
11
Mittal Steel shares for
7
Arcelor shares), and that the second-step merger did not comply with certain provisions of Luxembourg company law. They claimed, inter alia, the cancellation of certain resolutions (of the Board of Directors and of the Shareholders meeting) in connection with the merger, the grant of additional shares, or damages in an amount of
216
. By judgment dated November 30, 2011, the Luxembourg civil court declared all of the plaintiffs’ claims inadmissible and dismissed them. The judgment was appealed in May 2012. By judgment dated February 15, 2017, the Luxembourg Court of Appeal declared all but one of the plaintiffs’ claims inadmissible, remanded the proceedings on the merits to the lower court with respect to the admissible claimant and dismissed all other claims. In June 2017, the plaintiffs filed an appeal of this decision to the Court of Cassation. The Court of Cassation confirmed the Court of Appeal’s judgment on May 18, 2018. The proceedings remain pending before the lower court with the admissible claimant who claims inter alia, the cancellation of certain resolutions (of the Board of Directors and of the Shareholders meeting) in connection with the merger, the grant of additional shares, or damages in an amount of
25.
F-114
ARCELORMITTAL AND SUBSIDIARIES
Notes to Consolidated Financial Statements
(millions of U.S. dollars, except share and per share data)
8.4 Commitments
|
December 31,
|
|||||
|
2018
|
2017
|
||||
|
Purchase commitments
|
|
|
|
|
|
|
Guarantees, pledges and other collateral
|
|
|
|
|
|
|
Non-cancellable operating leases
|
|
|
|
|
|
|
Capital expenditure commitments
|
|
|
|
|
|
|
Other commitments
|
|
|
|
|
|
|
Total
|
|
|
|
|
|
Purchase commitments
Purchase commitments consist primarily of major agreements for procuring iron ore, coking coal, coke and hot metal. The Company also has a number of agreements for electricity, industrial and natural gas, scrap and freight. In addition to those purchase commitments disclosed above, the Company enters into purchasing contracts as part of its normal operations which have minimum volume requirements but for which there are no take-or-pay or penalty clauses included in the contract. The Company does not believe these contracts have an adverse effect on its liquidity position.
Purchase commitments include commitments given to associates for
405
and
520
as of
December 31, 2018
and
2017
, respectively. Purchase commitments include commitments given to joint ventures for
2,246
and
1,550
as of
December 31, 2018
and
2017
, respectively. Commitments given to joint ventures include
1,489
and
1,481
related to purchase of the output from Tameh as of
December 31, 2018
and
2017
respectively, and
711
related to purchase of the output from Enerfos as of
December 31, 2018
.
Purchase commitments include commitments given by Ilva remedies classified as held for sale for
910
as of December 31, 2018.
Guarantees, pledges and other collateral
Guarantees related to financial debt and credit lines given on behalf of third parties were
235
and
266
as of
December 31, 2018
and
2017
, respectively. Additionally,
7
and
13
were related to guarantees given on behalf of associates as of
December 31, 2018
and
2017
, respectively. Guarantees of
1,079
and
1,022
were given on behalf of joint ventures as of
December 31, 2018
and
2017
, respectively. Guarantees given on behalf of joint ventures include
348
and
406
for the guarantees issued on behalf of Calvert and
397
and
382
for the guarantees issued on behalf of Al Jubail as of
December 31, 2018
and
2017
, respectively.
Due to the failure of other shareholders to provide requisite equity funding by December 31, 2018, the Al Jubail joint venture’s indebtedness became technically in default as of such date. ArcelorMittal’s guarantee of such indebtedness has not been called by the lenders, and ArcelorMittal does not currently expect it to be called. ArcelorMittal is working with the other shareholders in the joint venture to resolve the situation through their contribution of the requisite equity and currently expects the technical default to be cured in the near term. The technical default relates only to the indebtedness of the joint venture and is not expected to affect the availability or maturity of any borrowings of ArcelorMittal.
Pledges and other collateral mainly relate to inventories and receivables pledged to secure the South African Rand revolving borrowing base finance facility for the amount drawn of
21
, ceded bank accounts to secure environmental obligations, true sale of receivables programs and the revolving base finance facility in South Africa of
122
and mortgages entered into by the Company’s operating subsidiaries.
Pledges of property, plant and equipment were
225
and
282
as of
December 31, 2018
and
2017
, respectively. Other sureties, first demand guarantees, letters of credit, pledges and other collateral included
380
and
419
of commitments given on behalf of associates as of
December 31, 2018
and
2017
, respectively
. Other sureties, first demand guarantees, letters of credit, pledges and other collateral included
154
and
164
of commitments given on behalf of joint ventures as of
December 31, 2018
and
2017
, respectively.
In addition,
other sureties, first demand guarantees, letters of credit, pledges and other collateral included
567
in relation to a performance guarantee provided by the Company for the execution of the ESIL resolution plan as of
December 31, 2018
.
Other sureties, first demand guarantees, letters of credit, pledges and other collateral include commitments given by Ilva remedies classified as held for sale for
18
as of December 31, 2018.
F-115
ARCELORMITTAL AND SUBSIDIARIES
Notes to Consolidated Financial Statements
(millions of U.S. dollars, except share and per share data)
Non-cancellable operating leases
|
December 31,
|
|||||
|
2018
|
2017
|
||||
|
Less than 1 year
|
|
|
|
|
|
|
1-3 years
|
|
|
|
|
|
|
4-5 years
|
|
|
|
|
|
|
More than 5 years
|
|
|
|
|
|
|
Total
|
|
|
|
|
|
Non-cancellable operating leases include time charter arrangements for shipping activities and usufruct of land in Poland. The operating leases expense was
564
,
542
and
521
in
2018
,
2017
and
2016
, respectively out of which
77
,
42
and
98
are related to contingent rents. The non-cancellable operating leases commitments at
December 31, 2018
are related to plant, machinery and equipment (
778
), buildings (
181
), land (
871
) and other (
39
).
Capital expenditure commitments
Capital expenditure commitments mainly relate to commitments associated with investments in expansion and improvement projects by various subsidiaries.
In 2016, AMSA committed to an investment program in connection with the competition commission settlement. The remaining capital expenditure commitment was
171
as of
December 31, 2018
.
Capital expenditure commitments also include
413
for the
1,000
three
-year investment program at the Company's Mexican operations announced in 2017, which is focused on building ArcelorMittal Mexico’s downstream capabilities. The main investment will be the construction of a new hot strip mill with capacity of approximately
2.5
million tonnes.
Other commitments
Other commitments given comprise mainly commitments incurred for gas supply to electricity suppliers.
As of September 21, 2018 an Environmental Commitment Agreement ("ECA") has been executed between ArcelorMittal Brasil, local government and the Brazilian environmental authorities. ArcelorMittal Brasil committed to carry out, over the next 5 years, a series of environmental operational and capital investments with the aim to reduce atmospheric emissions from the Company's Tubarão site. To comply with the ECA requirements, ArcelorMittal Brasil may need to acquire new equipment and change some of its current operating methods and processes. The underlying costs to implement those investments are still being estimated by ArcelorMittal Brasil and the outcome of this estimate could be material. The non-compliance with ECA would lead to fines amounting to a maximum of
26
.
The agreement relating to the Ilva acquisition includes
1,439
industrial capital expenditure commitments over a seven-year period focused on blast furnaces, steel shops and finishing lines and
917
environmental capital expenditure commitments.
Commitments to sell
F-116
ARCELORMITTAL AND SUBSIDIARIES
Notes to Consolidated Financial Statements
(millions of U.S. dollars, except share and per share data)
ed using tax rates that have been enacted or substantively enacted as of the date of the consolidated statements of financial position.
Tax is charged or credited to the consolidated statements of operations, except when it relates to items charged or credited to other comprehensive income or directly to equity, in which case the tax is recognized in other comprehensive income or in equity.
Deferred tax is recognized on differences between the carrying amounts of assets and liabilities, in the consolidated financial statements and the corresponding tax basis used in the computation of taxable profit, and is accounted for using the statements of financial position liability method. Deferred tax liabilities are generally recognized for all taxable temporary differences, and deferred tax assets are generally recognized for all deductible temporary differences and net operating loss carry forwards to the extent that it is probable that taxable profits will be available against which those deductible temporary differences can be utilized. Such assets and liabilities are not recognized if the taxable temporary difference arises from the initial recognition of non-deductible goodwill or if the differences arise from the initial recognition (other than in a business combination) of other assets and liabilities in a transaction that affects neither the taxable profit nor the profit reported in the consolidated statements of operations.
Deferred tax liabilities are recognized for taxable temporary differences associated with investments in subsidiaries, associates and joint ventures, except if the Company is able to control the reversal of the temporary difference and it is probable that the temporary difference will not reverse in the foreseeable future. Deferred tax assets arising from deductible temporary differences associated with such investments are only recognized to the extent that it is probable that there will be sufficient taxable profits against which the benefits of the temporary differences can be utilized and are expected to reverse in the foreseeable future.
Deferred tax assets and liabilities are measured at the tax rates that are expected to apply in the period in which the liability is settled or the asset realized, based on tax rates (and tax laws) that have been enacted or substantively enacted at the consolidated statements of financial position date. The measurement of deferred tax assets and liabilities reflects the tax consequences that would result from the manner in which the Company expects, at the reporting date, to recover or settle the carrying amount of its assets and liabilities.
The carrying amount of deferred tax assets is reviewed at each consolidated statements of financial position date and reduced to the extent that it is no longer probable that sufficient taxable profits will be available to enable all or part of the asset to be recovered. The Company reviews the deferred tax assets in the different jurisdictions in which it operates to assess the possibility of realizing such assets based on projected taxable profit, the expected timing of the reversals of existing temporary differences, the carry forward period of temporary differences and tax losses carried forward and the implementation of planning strategies. Due to the numerous variables associated with these judgments and assumptions, both the precision and reliability of the resulting estimates of the deferred tax assets are subject to substantial uncertainties.
|
|
Year Ended December 31,
|
||||
|
|
2018
|
2017
|
2016
|
||
|
Total current tax expense (benefit)
|
|
|
|
||
|
Total deferred tax expense (benefit)
|
(
|
(
|
|
||
|
Total income tax expense (benefit)
|
(
|
|
|
||
F-117
ARCELORMITTAL AND SUBSIDIARIES
Notes to Consolidated Financial Statements
(millions of U.S. dollars, except share and per share data)
|
|
Year Ended December 31,
|
|||||||
|
|
2018
|
2017
|
2016
|
|||||
|
Net income (loss) (including non-controlling interests)
|
|
|
|
|
|
|
||
|
Income tax expense (benefit)
|
(
|
)
|
|
|
|
|
||
|
Income (loss) before tax
|
|
|
|
|
|
|
||
|
Tax expense (benefit) at the statutory rates applicable to profits (losses) in the countries
1
|
|
|
|
|
|
|
||
|
Permanent items
|
(
|
)
|
(
|
)
|
(
|
)
|
||
|
Rate changes
|
|
|
(
|
)
|
|
|
||
|
Net change in measurement of deferred tax assets
|
(
|
)
|
(
|
)
|
|
|
||
|
Tax effects of foreign currency translation
|
(
|
)
|
(
|
)
|
|
|
||
|
Tax credits
|
(
|
)
|
(
|
)
|
(
|
)
|
||
|
Other taxes
|
|
|
|
|
|
|
||
|
Others
|
|
|
|
|
|
|
||
|
Income tax expense (benefit)
|
(
|
)
|
|
|
|
|
||
|
1.
|
|
ArcelorMittal’s consolidated income tax expense (benefit) is affected by the income tax laws and regulations in effect in the various countries in which it operates and the pre-tax results of its subsidiaries in each of these countries, which can change from year to year. ArcelorMittal operates in jurisdictions, mainly in Eastern Europe and Asia, which have a structurally lower corporate income tax rate than the statutory tax rate as enacted in Luxembourg (
26.01
%
), as well as in jurisdictions, mainly in Brazil and Mexico, which have a structurally higher corporate income tax rate.
|
|
Year Ended December 31,
|
|||||||
|
|
2018
|
|
2017
|
|
2016
|
|||
|
Tax deductible write-downs on shares and receivables
|
(
|
)
|
|
(
|
)
|
|
(
|
)
|
|
Juros sobre o Capital Próprio (“JSCP”)
|
(
|
)
|
|
(
|
)
|
|
(
|
)
|
|
Non taxable gain on bargain purchase
|
(
|
)
|
|
|
|
|
|
|
|
Taxable income (tax loss) of AMTFS
|
|
|
|
(
|
)
|
|
|
|
|
Taxable dividends
|
|
|
|
|
|
|
|
|
|
Other permanent items
|
|
|
|
|
|
|
(
|
)
|
|
Total permanent items
|
(
|
)
|
|
(
|
)
|
|
(
|
)
|
Tax deductible write-downs on shares and receivables: in connection with the Company's impairment test for goodwill and property, plant and equipment (“PP&E”), the recoverability of the carrying amounts of investments in shares and intragroup receivables is also reviewed annually, resulting in tax deductible write-downs of the values of loans and shares of consolidated subsidiaries in Luxembourg.
Juros sobre o Capital Próprio (“JSCP”): Corporate taxpayers in Brazil, which distribute a dividend can benefit from a tax
deduction corresponding to an amount of interest calculated as a yield on capital. The deduction is determined as the lower of the interest as calculated by application of the Brazilian long term interest rate on the opening balance of capital and reserves, and
50%
of the income for the year or accumulated profits from the previous year. For book purposes, this distribution of interest on capital is regarded as a dividend distribution, while for Brazilian tax purposes it is regarded as tax deductible interest.
Non taxable gain on bargain purchase: in 2018 ArcelorMittal recognized a
209
gain on bargain purchase upon acquisition of Ilva (see note 2.2.4).
Taxable income of AMTFS: ArcelorMittal Treasury Financial Services S.à r.l. (“AMTFS”), a subsidiary of ArcelorMittal Treasury Americas LLC (“AMTAUS”), is a limited liability company organized under the laws of Luxembourg
F-118
ARCELORMITTAL AND SUBSIDIARIES
Notes to Consolidated Financial Statements
(millions of U.S. dollars, except share and per share data)
subject to taxation in Luxembourg on its worldwide income. AMTFS has filed an election to be treated as a disregarded entity for United States federal income tax purposes.
Taxable dividends: the dividends received from some of the ArcelorMittal subsidiaries are subject to tax in the receiving countries with the corresponding (foreign) tax credits available.
Rate changes
The 2017 tax benefit from rate changes of
(
94
)
is mainly due to the impact of the decrease in the future income tax rate on deferred tax liabilities in Belgium (
60
), France (
31
), Argentina and USA
.
The 2016 tax expense from rate changes of
593
is mainly due to the impact of the decrease in the future income tax rate on deferred tax assets in Luxembourg resulting in tax expense of
647
, partly offset by a tax benefit of
(
50
)
in France.
Net change in measurement of deferred tax assets
The 2018 net change in measurement of deferred tax assets of
(
1,301
)
primarily consists of tax benefit of
(
1,842
)
due to additional recognition of deferred tax assets for losses and other deductible temporary differences of previous years, and a tax expense of
541
due to non-recognition and derecognition of other deferred tax assets in other tax jurisdictions.
In 2018, the Company recognized
1.3
billion
of previously unrecognized deferred tax assets relating to the Luxembourg tax integration. The recognition in Luxembourg includes a
0.8
billion
increase in projections of future taxable income in Luxembourg driven primarily by the higher operational and financial income, and
0.6
billion
effect of the elimination of the current USD exposure of Luxembourgish deferred tax assets denominated in euro.
The 2017 net change in measurement of deferred tax assets of
(
281
)
primarily consists of tax expense of
652
due to the unrecognized part of deferred tax assets on write-downs of the value of shares and loans of consolidated subsidiaries in Luxembourg, tax expense of
364
due to non-recognition and derecognition of other deferred tax assets in other tax jurisdictions, partially offset by an additional recognition of deferred tax assets for losses and other deductible temporary differences of previous years of
(
1,297
)
. In 2017, the Company recognized
1.1
billion
of previously unrecognized deferred tax assets relating to the Luxembourg tax integration. The recognition in Luxembourg includes a
0.3
billion
increase in projections of future taxable income in Luxembourg driven primarily by the improved market conditions of the steel industry and higher financial income mainly from further reduction in the forecasted interest expense following improved credit rating.
The 2016 net change in measurement of deferred tax assets of
5,344
primarily consists of tax expense of
5,971
due to the unrecognized part of deferred tax assets on write-downs of the value of shares and loans of consolidated subsidiaries in Luxembourg, tax expense of
285
due to non-recognition and derecognition of other deferred tax assets in other tax jurisdictions, partially offset by additional recognition of deferred tax assets for losses and other deductible temporary differences of previous years of
(
912
)
. In 2016, the Company recognized
0.4
billion
of previously unrecognized deferred tax assets relating to the Luxembourg tax integration. The recognition in Luxembourg includes a
0.8
billion
increase in projections of future taxable income in Luxembourg driven primarily by the improved market conditions of the steel industry and higher interest income from favorable foreign exchange rate relating to the funding of the Group subsidiaries as well as further reduction in the forecasted interest expense following debt repayment. This recognition is partially offset by a derecognition of
0.7
billion
related to revised expectations of euro denominated deferred tax assets recoverability in U.S. dollars terms.
Tax effects of foreign currency translation
The tax effects of foreign currency translation of
(
47
)
,
(
157
)
and
73
at
December 31, 2018
,
2017
and
2016
respectively, refer mainly to deferred tax assets and liabilities of certain entities with a different functional currency than the currency applied for tax filing purposes. The 2018 effect is impacted by the elimination of the currency exposure on the deferred tax assets in ArcelorMittal parent company following the change in the currency denomination of the tax losses. In 2017, the effects are mainly due to the depreciation of the U.S. dollar against the euro.
Tax credits
The tax credits are mainly attributable to the Company’s operating subsidiaries in Brazil, Mexico and Spain. They relate to credits claimed on foreign investments, credits for research and development and tax sparing credits.
Other taxes
Other taxes mainly include withholding taxes on dividends, services, royalties and interests as well as mining duties in Canada and Mexico, and state tax and Base Erosion and Anti-Abuse Tax ("BEAT") in the United States.
F-119
ARCELORMITTAL AND SUBSIDIARIES
Notes to Consolidated Financial Statements
(millions of U.S. dollars, except share and per share data)
|
Year Ended December 31,
|
||||||||
|
2018
|
2017
|
2016
|
||||||
|
Tax contingencies/settlements
|
|
|
|
|
|
|
||
|
Prior period taxes
|
|
|
(
|
)
|
(
|
)
|
||
|
Others
|
|
|
|
|
|
|
||
|
Total
|
|
|
|
|
|
|
||
|
|
Year Ended December 31,
|
||||||||
|
|
2018
|
2017
|
2016
|
||||||
|
Recognized in other comprehensive income on:
|
|
|
|
||||||
|
Deferred tax expense (benefit)
|
|
|
|
|
|
|
|||
|
Unrealized gain (loss) on derivative financial instruments
|
|
|
(
|
)
|
(
|
)
|
|||
|
Recognized actuarial gain (loss)
|
(
|
)
|
(
|
)
|
(
|
)
|
|||
|
Foreign currency translation adjustments
|
(
|
)
|
(
|
)
|
|
|
|||
|
|
|
(
|
)
|
|
|
||||
|
Recognized directly in equity on:
|
|||||||||
|
Deferred tax expense (benefit)
|
|||||||||
|
Others
|
|
|
|
|
|
|
|||
|
|
|
|
|
|
|
|
|||
|
Total
|
|
|
(
|
)
|
|
|
|||
F-120
ARCELORMITTAL AND SUBSIDIARIES
Notes to Consolidated Financial Statements
(millions of U.S. dollars, except share and per share data)
|
|
Assets
|
Liabilities
|
Net
|
||||||||||||||
|
|
2018
|
2017
|
2018
|
2017
|
2018
|
2017
|
|||||||||||
|
Intangible assets
|
|
|
|
|
(
|
)
|
(
|
)
|
(
|
)
|
(
|
)
|
|||||
|
Property, plant and equipment
|
|
|
|
|
(
|
)
|
(
|
)
|
(
|
)
|
(
|
)
|
|||||
|
Inventories
|
|
|
|
|
(
|
)
|
(
|
)
|
|
|
|
|
|||||
|
Financial instruments
|
|
|
|
|
(
|
)
|
(
|
)
|
(
|
)
|
(
|
)
|
|||||
|
Other assets
|
|
|
|
|
(
|
)
|
(
|
)
|
(
|
)
|
(
|
)
|
|||||
|
Provisions
|
|
|
|
|
(
|
)
|
(
|
)
|
|
|
|
|
|||||
|
Other liabilities
|
|
|
|
|
(
|
)
|
(
|
)
|
|
|
|
|
|||||
|
Tax losses and other tax benefits carried forward
|
|
|
|
|
|
|
|
|
|
|
|
|
|||||
|
Tax credits carried forward
|
|
|
|
|
|
|
|
|
|
|
|
|
|||||
|
Untaxed reserves
|
|
|
|
|
(
|
)
|
(
|
)
|
(
|
)
|
(
|
)
|
|||||
|
Deferred tax assets / (liabilities)
|
|
|
|
|
(
|
)
|
(
|
)
|
|
|
|
|
|||||
|
Deferred tax assets
|
|
|
|
|
|||||||||||||
|
Deferred tax liabilities
|
(
|
)
|
(
|
)
|
|||||||||||||
The deferred tax assets recognized by the Company as of
December 31, 2018
are analyzed as follows:
|
Gross amount
|
Total deferred tax assets
|
Recognized deferred tax assets
|
Unrecognized deferred tax assets
|
||||
|
Tax losses and other tax benefits carried forward
|
|
|
|
|
|||
|
Tax credits carried forward
|
|
|
|
|
|||
|
Other temporary differences
|
|
|
|
|
|||
|
Total
|
|
|
|
|
|||
|
Gross amount
|
Total deferred tax assets
|
Recognized deferred tax assets
|
Unrecognized deferred tax assets
|
||||
|
Tax losses and other tax benefits carried forward
|
|
|
|
|
|||
|
Tax credits carried forward
|
|
|
|
|
|||
|
Other temporary differences
|
|
|
|
|
|||
|
Total
|
|
|
|
||||
As of
December 31, 2018
, the majority of the deferred tax assets not recognized relates to tax losses carried forward attributable to various subsidiaries located in different jurisdictions (primarily Germany, Luxembourg, Spain, South Africa and the United States) with different statutory tax rates. As of each reporting date, ArcelorMittal considers existing evidence, both positive and negative, including the earnings history and results of recent operations, reversals of deferred tax liabilities, projected future taxable income, and planning strategies, that could impact the view with regard to future realization of these deferred tax assets. Given the current and anticipated future earnings of the ArcelorMittal U.S. operations, there is a reasonable possibility that within the next 12 months, sufficient positive evidence may become available to allow ArcelorMittal to reach a conclusion that a significant portion of the unrecognized deferred tax assets of the U.S. operations, related to tax losses and temporary differences, may be recognized.
F-121
ARCELORMITTAL AND SUBSIDIARIES
Notes to Consolidated Financial Statements
(millions of U.S. dollars, except share and per share data)
The amount of the total deferred tax assets is the aggregate amount of the various deferred tax assets recognized and unrecognized at the various subsidiaries and not the result of a computation with a given blended rate. The utilization of tax losses carried forward is restricted to the taxable income of the subsidiary or tax consolidation group to which it belongs. The utilization of tax losses carried forward also may be restricted by the character of the income, expiration dates and limitations on the yearly use of tax losses against taxable income.
As at
December 31, 2018
,
the total amount of accumulated tax losses in Luxembourg with respect to the main tax consolidation amounted to approximately
80.6
billion
, of which
34.1
billion
was considered realizable, resulting in the recognition of
8.9
billion
of deferred tax assets at the applicable income tax rate in Luxembourg. As at
December 31, 2017
, the total amount of accumulated tax losses in Luxembourg with respect to the main tax consolidation amounted to approximately
80.8
billion
, of this amount
30.8
billion
was considered realizable, resulting in the recognition of
7.6
billion
of deferred tax assets at the applicable income tax rate in Luxembourg. Under the Luxembourg tax legislation, tax losses generated before
2017
can be carried forward indefinitely and are not subject to any specific yearly loss utilization limitations. The tax losses carried forward relate primarily to tax deductible write-down charges taken on investments in shares of consolidated subsidiaries recorded by certain of ArcelorMittal’s holding companies in Luxembourg. Of the total tax losses carried forward,
28.8
billion
may be subject to recapture in the future if the write-downs that caused them are reversed creating taxable income unless the Company converts them to permanent through sales or other organizational restructuring activities.
The Company believes that it is probable that sufficient future taxable profits will be generated to support the recognized deferred tax asset for tax losses carried forward in Luxembourg. As part of its recoverability assessment the Company has taken into account (i) its most recent forecast approved by management and the Board of Directors, (ii) the likelihood that the factors that have contributed to past losses in Luxembourg will not recur, (iii) the fact that ArcelorMittal in Luxembourg is the main provider of funding to the Company’s consolidated subsidiaries, leading to significant amounts of taxable interest income, (iv) the implementation of an Industrial Franchising Arrangement between ArcelorMittal and numerous worldwide operating subsidiaries, and (v) other significant and reliable sources of operational income earned from ArcelorMittal’s European and worldwide operating subsidiaries for centralized distribution and procurement activities performed in Luxembourg. In performing the assessment, the Company estimates at which point in time its earnings projections are no longer reliable, and thus taxable profits are no longer probable. Accordingly, the Company has established consistent forecast periods for its different income streams for estimating probable future taxable profits, against which the unused tax losses can be utilized in Luxembourg.
At
December 31, 2018
, based upon the level of historical taxable income and projections for future taxable income over the periods in which the deductible temporary differences are anticipated to reverse, management believes it is probable that ArcelorMittal will realize the benefits of the deferred tax assets of
8.3
billion
recognized. The amount of future taxable income required to be generated by ArcelorMittal’s subsidiaries to utilize the deferred tax assets of
8.3
billion
is at least
32
billion
. Historically, the Company has been able to generate sufficient taxable income and believes that it will generate sufficient levels of taxable income in the coming years to allow the Company to utilize tax benefits associated with tax losses carried forward and other deferred tax assets that have been recognized in its consolidated financial statements. Where the Company has had a history of recent losses, it relied on convincing other evidence such as the character of (historical) losses and planning opportunities to support the deferred tax assets recognized.
At
December 31, 2018
, the Company had total estimated tax losses carried forward and other tax benefits of
110.8
billion
.
F-122
ARCELORMITTAL AND SUBSIDIARIES
Notes to Consolidated Financial Statements
(millions of U.S. dollars, except share and per share data)
|
Year expiring
|
Recognized
|
Unrecognized
|
Total
|
|||
|
2019
|
|
|
|
|||
|
2020
|
|
|
|
|||
|
2021
|
|
|
|
|||
|
2022
|
|
|
|
|||
|
2023
|
|
|
|
|||
|
2024 - 2038
|
|
|
|
|||
|
Total
|
|
|
|
|||
The remaining tax losses carried forward and other tax benefits for an amount of
103.3
billion
(of which
39.3
billion
are recognized and
64
billion
are unrecognized) are carried forward for unlimited period of time and primarily relate to the Company’s operations in Brazil, France, Germany, Luxembourg and Spain.
At
December 31, 2018
, the Company also had total estimated tax credits carried forward of
722
.
|
Year expiring
|
Recognized
|
Unrecognized
|
Total
|
|||
|
2019
|
|
|
|
|||
|
2020
|
|
|
|
|||
|
2021
|
|
|
|
|||
|
2022
|
|
|
|
|||
|
2023
|
|
|
|
|||
|
2024 - 2038
|
|
|
|
|||
|
Total
|
|
|
|
|||
The remaining tax credits for an amount of
154
(of which
55
are recognized and
99
are unrecognized) are indefinite and primarily attributable to the Company’s operations in Brazil, Spain and the United States.
F-123
ARCELORMITTAL AND SUBSIDIARIES
Notes to Consolidated Financial Statements
(millions of U.S. dollars, except share and per share data)
On May 22, 2017, ArcelorMittal completed the consolidation of each
three
existing shares in ArcelorMittal without nominal value into one share without nominal value. As a result of this reverse stock split, the number of issued shares decreased from
3,065,710,869
to
1,021,903,623
and all prior periods have been recast in accordance with IFRS.
|
December 31, 2016
|
Movement in year
|
December 31, 2017
|
Movement in year
|
December 31, 2018
|
||||||||||
|
Issued shares
|
|
|
|
|
|
|
|
|
|
|
||||
|
Treasury shares
|
(
|
)
|
|
|
(
|
)
|
(
|
)
|
(
|
)
|
||||
|
Total outstanding shares
|
|
|
|
|
|
|
(
|
)
|
|
|
||||
On January 15, 2016, following the maturity of the mandatorily convertible notes (see 10.2 below), the Company increased share capital by
€
570
million
(
622
) from
€
6,883
million
(
10,011
) to
€
7,453
million
(
10,633
) through the issuance of
137,967,116
(
45,989,039
after reverse stock split) new shares fully paid up. The aggregate number of shares issued and fully paid up increased to
1,803,359,338
(
601,119,779
after reverse stock split).
Following the extraordinary general meeting held on March 10, 2016, ArcelorMittal decreased share capital by
€
7,273
million
(
10,376
) from
€
7,453
million
(
10,633
) to
€
180
million
(
257
) through a reduction of the accounting par value per share to
€
0.10
without any distribution to shareholders, the balance being allocated to additional paid-in capital.
On April 8, 2016, ArcelorMittal completed an equity offering with net proceeds of
3,115
(net of transaction costs of
40
) by way of the issuance of
1,803,359,338
(
601,119,779
after reverse stock split) non-statutory preferential subscription rights with a subscription price of
€
2.20
per share at a ratio of
7
shares for
10
rights subsequently to the adoption of enabling resolutions by the extraordinary general meeting of shareholders on March 10, 2016. The Company increased share capital by
€
126
million
(
144
) from
€
180
million
(
257
) to
€
306
million
(
401
) through the issuance of
1,262,351,531
(
420,783,844
after reverse stock split) new shares fully paid up. The aggregate number of shares issued and fully paid up increased to
3,065,710,869
(
1,021,903,623
after reverse stock split).
Authorized shares
At the Extraordinary General Meeting held on May 8, 2012, the shareholders approved an increase of the authorized share capital of ArcelorMittal by
€
643
million
represented by
156
million
shares (
52
after reverse stock split), or approximately
10
%
of ArcelorMittal’s outstanding capital. Following this approval, which is valid for
5
years, the total authorized share capital was
€
7.7
billion
represented by
1,773,091,461
(
591,030,487
after reverse stock split) shares without par value.
At the Extraordinary General Meeting held on May 8, 2013, the shareholders approved an increase of the authorized share capital of ArcelorMittal by
€
524
million
represented by
223
million
shares (
74
after reverse stock split), or approximately
8
%
of ArcelorMittal’s outstanding capital. Following this approval, which is valid for
five years
,
the total authorized share capital was
€
8.2
billion
represented by
1,995,857,213
(
665,285,738
after reverse stock split) shares without par value.
At the Extraordinary General Meeting held on March 10, 2016, the shareholders approved a decrease of the authorized share capital of the Company by
€
8,049
million
through a reduction of the accounting par value per share to
€
0.10
and a subsequent increase by
€
3
billion
. Following the completion of the equity offering on April 8, 2016, the Company’s authorized share capital was decreased by
€
2.9
billion
. As a result of the approval given by the shareholders on March 10, 2016 and which is valid for
five years
, the total authorized share capital was
€
337
million
represented by
3,372,281,956
(
1,124,093,985
after reverse stock split) shares without par value
.
At the Extraordinary General Meeting held on May 10, 2017, the shareholders approved a reverse stock split and an increase of the authorized share capital to
€
345
million
. Following this approval, on May 22, 2017 ArcelorMittal completed the consolidation of each
three
existing shares in ArcelorMittal without nominal value into
one
share without nominal value. As a result, the authorized share capital increased with a decrease in representative shares from
€
337
million
represented by
3,372,281,956
ordinary shares without nominal value as of December 31, 2016 to
€
345
million
represented by
1,151,576,921
ordinary shares without nominal value.
F-124
ARCELORMITTAL AND SUBSIDIARIES
Notes to Consolidated Financial Statements
(millions of U.S. dollars, except share and per share data)
At the Extraordinary General Meeting of shareholders held on May 16, 2018, the shareholders approved the change of currency of the Company's share capital from euro to U.S. dollar. Following this approval, the authorized share capital amounts to
411
represented by
1,151,576,921
ordinary shares without nominal value. As a result of this change, the issued share capital amounts to
364
as of December 31, 2018, based on the exchange rate published by the European Central Bank on May 15, 2018. The difference has been transferred to additional paid-in capital. There was no change in the aggregate number of shares issued and fully paid up which continues to amount to
1,021,903,623
as of December 31, 2018 and December 31, 2017.
Share buyback
On March 26, 2018, ArcelorMittal completed a share buyback program under the authorization given at the annual general meeting of shareholders held on May 5, 2015. ArcelorMittal repurchased
7
million
shares for a total value of
€
184
million
(
226
) at an average price per share of
€
26.34
(equivalent to
$
32.36
). The buyback shares as part of buyback program are accounted as the part of the treasury share.
Treasury shares
Mandatorily convertible notes
Mandatorily convertible notes issued by the Company were accounted for as compound financial instruments. The net present value of the coupon payments at issuance date was recognized as a long-term obligation and carried at amortized cost. The value of the equity component was determined based upon the difference of the cash proceeds received from the issuance of the notes and the net present value of the financial liability component on the date of issuance and was included in equity.
On January 16, 2013, ArcelorMittal issued mandatorily convertible subordinated notes (“MCNs”) with net proceeds of
2,222
. The notes had a maturity of
3
years
, were issued at
100
%
of the principal amount and were mandatorily converted into ordinary shares of ArcelorMittal at maturity unless converted earlier at the option of the holders or ArcelorMittal or upon specified events in accordance with the terms of the MCNs. The MCNs paid a coupon of
6.00
%
per annum, payable quarterly in arrears. The minimum conversion price of the MCNs was set at
$
16.75
(prior to reverse stock split), corresponding to the placement price of shares in the concurrent ordinary shares offering as described above, and the maximum conversion price was set at approximately
125
%
of the minimum conversion price (corresponding to
$
20.94
,
prior to reverse stock split). The minimum and maximum conversion prices were subject to adjustment upon the occurrence of certain events, and were, as of December 31, 2015,
$
15.98
and
$
19.98
, respectively (prior to reverse stock split). The Company determined the notes met the definition of a compound financial instrument and as such determined the fair value of the financial liability component of the bond was
384
on the date of issuance and recognized it as a long-term obligation. The value of the equity component of
1,838
was determined based upon the difference of the cash proceeds received from the issuance of the bond and the fair value of the financial liability component on the date of issuance and was included in equity.
During the fourth quarter of 2015, the Company delivered
2,275,026
treasury shares (
758,342
after reverse stock split) against
1,817,869
notes converted at the option of their holders. As a result of such voluntary conversions, the carrying amount of MCNs decreased by
38
. On January 15, 2016, upon final maturity of the MCNs, the remaining outstanding
88,182,131
notes were converted into
137,967,116
new common shares (
45,989,039
after reverse stock split). Accordingly, share capital and additional paid-in-capital increased by
622
and
1,178
, respectively and the carrying amount of MCNs decreased by
1,800
.
Mandatory convertible bonds
On December 28, 2009, the Company issued through Hera Ermac, a wholly-owned subsidiary,
750
unsecured and unsubordinated bonds mandatorily convertible into preferred shares of such subsidiary. The bonds were placed privately with a Luxembourg affiliate of Crédit Agricole (formerly Calyon) and are not listed. The Company has the option to call the mandatory convertible bonds until
10
business days before the maturity date. Hera Ermac invested the proceeds of the bonds issuance and an equity contribution by the Company in notes issued by subsidiaries of the Company linked to the values of shares of Erdemir and China Oriental. On April 20, 2011, the Company signed an agreement for an extension of the conversion date of the mandatory convertible bonds to January 31, 2013. On September 27, 2011, the Company increased the mandatory
F-125
ARCELORMITTAL AND SUBSIDIARIES
Notes to Consolidated Financial Statements
(millions of U.S. dollars, except share and per share data)
convertible bonds from
750
to
1,000
. The Company further extended the conversion date for the mandatory convertible bonds on December 18, 2012 and January 17, 2014 to January 31, 2014 and January 29, 2016, respectively.
On November 20, 2015, the conversion date of the
1,000
mandatory convertible bonds was extended from January 29, 2016 to January 31, 2018. The other main features of the mandatory convertible bonds remained unchanged. The Company determined that this transaction led to the extinguishment of the existing compound instrument and the recognition of a new compound instrument including non-controlling interests for
880
(net of cumulative tax and fees) and other liabilities for
106
. The derecognition of the previous instrument and the recognition at fair value of the new instrument resulted in a
79
expense included in financing costs-net in the consolidated statement of operations and a
20
decrease in non-controlling interests.
On April 8, 2016, the Company issued
1,262,351,531
(
420,783,844
after reverse stock split) new shares at a subscription price of
€
2.20
(prior to reverse stock split) per share representing a
35
%
discount compared to the theoretical ex-right price (“TERP”) of
€
3.40
(prior to reverse stock split) based on the closing price of ArcelorMittal’s shares on Euronext Amsterdam on March 10, 2016. In accordance with IFRS, such a rights issue includes a bonus element increasing the number of ordinary shares outstanding to be used in calculating basic and diluted earnings per share for all periods before the rights issue.
On May 22, 2017, ArcelorMittal completed the consolidation of each
three
existing shares in ArcelorMittal without nominal value into
one
share without nominal value. As a result of this reverse stock split, the number of outstanding shares for the prior periods have been recast in accordance with IFRS.
|
|
Year Ended December 31,
|
|||||||
|
|
2018
|
|
2017
|
|
2016
|
|||
|
Net income (loss) attributable to equity holders of the parent
|
|
|
|
|
|
|
|
|
|
Weighted average common shares outstanding (in millions) for the purposes of basic earnings per share
|
|
|
|
|
|
|
|
|
|
Incremental shares from assumed conversion of restricted share units and performance share units (in millions)
|
|
|
|
|
|
|
|
|
|
Weighted average common shares outstanding (in millions) for the purposes of diluted earnings per share
|
|
|
|
|
|
|
|
|
Calculations to determine the amounts available for dividends are based on ArcelorMittal’s financial statements (“ArcelorMittal SA”) which are prepared in accordance with IFRS, as endorsed by the European Union. ArcelorMittal SA has no significant manufacturing operations of its own and generates its own profit mostly from financing activities and the management fees / industrial franchise agreements within Group Companies. Accordingly, it can only pay dividends or distributions to the extent it is entitled to receive cash dividend distributions from its subsidiaries’ recognized gains, profit generated by its own activities, from the sale of its assets or records share premium from the issuance of common shares.
F-126
ARCELORMITTAL AND SUBSIDIARIES
Notes to Consolidated Financial Statements
(millions of U.S. dollars, except share and per share data)
Dividends are declared in U.S. dollars and are payable in either U.S. dollars or in euros.
|
Description
|
Approved by
|
|
Dividend per
share (in $) |
|
Payout date
|
|
Total (in
millions of $) |
|
Dividend for financial year 2015
|
Annual General Shareholders’ meeting on May 4, 2016
|
|
|
|
—
|
|
|
|
Dividend for financial year 2016
|
Annual General Shareholders’ meeting on May 4, 2017
|
|
|
|
—
|
|
|
|
Dividend for financial year 2017
|
Annual General Shareholders’ meeting on May 9, 2018
|
|
|
|
June 13, 2018
|
|
|
10.5 Non-controlling interests
|
Name of Subsidiary
|
Country of incorporation and operation
|
% of non-controlling interests and non- controlling voting rights at December 31, 2018
|
% of non-controlling interests and non- controlling voting rights at December 31, 2017
|
Net income (loss) attributable to non- controlling interests for the year ended December 31, 2018
|
Non-controlling interests at December 31, 2018
|
Net income (loss) attributable to non- controlling interests for the year ended December 31, 2017
|
Non-controlling interests at December 31, 2017
|
Net income (loss) attributable to non- controlling interests for the year ended December 31, 2016
|
|||||||||||||
|
AMSA
|
South Africa
|
|
|
|
|
|
|
(
|
)
|
|
|
(
|
)
|
||||||||
|
Sonasid
1
|
Morocco
|
|
|
|
|
|
|
|
|
|
|
(
|
)
|
||||||||
|
ArcelorMittal Kryvyi Rih
|
Ukraine
|
|
|
|
|
|
|
|
|
|
|
|
|
||||||||
|
Belgo Bekaert Arames ("BBA")
|
Brazil
|
|
|
|
|
|
|
|
|
|
|
|
|
||||||||
|
Hera Ermac
2
|
Luxembourg
|
|
|
|
|
|
|
|
|
|
|
|
|
||||||||
|
AMMIC
3
|
Canada
|
|
|
|
|
|
|
|
|
|
|
|
|
||||||||
|
Arceo
4
|
Belgium
|
|
|
|
|
|
|
|
|
|
|
|
|
||||||||
|
ArcelorMittal Liberia Ltd
|
Liberia
|
|
|
(
|
)
|
(
|
)
|
(
|
)
|
(
|
)
|
(
|
)
|
||||||||
|
Other
|
|
|
|
|
|
|
|
|
|
|
|
|
|
||||||||
|
Total
|
|
|
|
|
|
|
|
|
|
|
|
(
|
)
|
||||||||
|
1.
|
Sonasid -
ArcelorMittal holds a controlling stake of
|
|
2.
|
Hera Ermac
- The non-controlling interests correspond to the equity component of the mandatory convertible bonds maturing on January 29, 2021 (see note 10.2)
.
|
|
3.
|
AMMIC
- On March 15, 2013 and May 30, 2013, a consortium led by POSCO and China Steel Corporation acquired a
|
|
4.
|
|
F-127
ARCELORMITTAL AND SUBSIDIARIES
Notes to Consolidated Financial Statements
(millions of U.S. dollars, except share and per share data)
Summarized statements of financial position
|
|
December 31, 2018
|
||||||||||||||||||||||
|
|
AMSA
|
Sonasid
|
AM Kryvyi Rih
|
BBA
|
Hera Ermac
|
AMMIC
|
Arceo
|
AM Liberia
|
|||||||||||||||
|
Current assets
|
|
|
|
|
|
|
|
|
|
|
|
|
|
|
|
|
|||||||
|
Non-current assets
|
|
|
|
|
|
|
|
|
|
|
|
|
|
|
|
|
|||||||
|
Total assets
|
|
|
|
|
|
|
|
|
|
|
|
|
|
|
|
|
|||||||
|
Current liabilities
|
|
|
|
|
|
|
|
|
|
|
|
|
|
|
|
|
|||||||
|
Non-current liabilities
|
|
|
|
|
|
|
|
|
|
|
|
|
|
|
|
|
|||||||
|
Net assets
|
|
|
|
|
|
|
|
|
|
|
|
|
|
|
(
|
)
|
|||||||
Summarized statements of operations
|
|
December 31, 2018
|
||||||||||||||||||||||
|
|
AMSA
|
Sonasid
|
AM Kryvyi Rih
|
BBA
|
Hera Ermac
|
AMMIC
|
Arceo
|
AM Liberia
|
|||||||||||||||
|
Revenue
|
|
|
|
|
|
|
|
|
|
|
|
|
|
|
|
|
|||||||
|
Net income (loss)
|
|
|
|
|
|
|
|
|
(
|
)
|
|
|
|
|
(
|
)
|
|||||||
|
Total comprehensive income (loss)
|
(
|
)
|
|
|
|
|
|
|
(
|
)
|
|
|
|
|
(
|
)
|
|||||||
F-128
ARCELORMITTAL AND SUBSIDIARIES
Notes to Consolidated Financial Statements
(millions of U.S. dollars, except share and per share data)
Summarized statements of cash flows
|
|
December 31, 2018
|
||||||||||||||||||||||
|
|
AMSA
|
Sonasid
|
AM Kryvyi Rih
|
BBA
|
Hera Ermac
|
AMMIC
|
Arceo
|
AM Liberia
|
|||||||||||||||
|
Net cash provided by / (used in) operating activities
|
|
|
|
|
|
|
|
|
|
|
|
|
|
|
(
|
)
|
|||||||
|
Net cash provided by / (used in) investing activities
|
|
|
(
|
)
|
(
|
)
|
(
|
)
|
(
|
)
|
(
|
)
|
|
|
(
|
)
|
|||||||
|
Net cash provided by / (used in) financing activities
|
(
|
)
|
|
|
|
|
(
|
)
|
|
|
(
|
)
|
(
|
)
|
|
|
|||||||
|
Impact of currency movements on cash
|
(
|
)
|
|
|
(
|
)
|
|
|
|
|
|
|
(
|
)
|
|
|
|||||||
|
Cash and cash equivalents:
|
|
|
|
|
|
|
|
|
|||||||||||||||
|
At the beginning of the year
|
|
|
|
|
|
|
|
|
|
|
|
|
|
|
|
|
|||||||
|
At the end of the year
|
|
|
|
|
|
|
|
|
|
|
|
|
|
|
|
|
|||||||
|
Dividend to non-controlling interests
|
|
|
|
|
|
|
(
|
)
|
|
|
(
|
)
|
(
|
)
|
|
|
|||||||
Summarized statements of financial position
|
|
December 31, 2017
|
||||||||||||||||||||||
|
|
AMSA
|
Sonasid
|
AM Kryvyi Rih
|
BBA
|
Hera Ermac
|
AMMIC
|
Arceo
|
AM Liberia
|
|||||||||||||||
|
Current assets
|
|
|
|
|
|
|
|
|
|
|
|
|
|
|
|
|
|||||||
|
Non-current assets
|
|
|
|
|
|
|
|
|
|
|
|
|
|
|
|
|
|||||||
|
Total assets
|
|
|
|
|
|
|
|
|
|
|
|
|
|
|
|
|
|||||||
|
Current liabilities
|
|
|
|
|
|
|
|
|
|
|
|
|
|
|
|
|
|||||||
|
Non-current liabilities
|
|
|
|
|
|
|
|
|
|
|
|
|
|
|
|
|
|||||||
|
Net assets
|
|
|
|
|
|
|
|
|
|
|
|
|
|
|
(
|
)
|
|||||||
Summarized statements of operations
|
|
December 31, 2017
|
||||||||||||||||||||||
|
|
AMSA
|
Sonasid
|
AM Kryvyi Rih
|
BBA
|
Hera Ermac
|
AMMIC
|
Arceo
|
AM Liberia
|
|||||||||||||||
|
Revenue
|
|
|
|
|
|
|
|
|
|
|
|
|
|
|
|
|
|||||||
|
Net income (loss)
|
(
|
)
|
|
|
|
|
|
|
|
|
|
|
|
|
(
|
)
|
|||||||
|
Total comprehensive income (loss)
|
(
|
)
|
|
|
|
|
|
|
|
|
|
|
|
|
(
|
)
|
|||||||
F-129
ARCELORMITTAL AND SUBSIDIARIES
Notes to Consolidated Financial Statements
(millions of U.S. dollars, except share and per share data)
Summarized statements of cash flows
|
|
December 31, 2017
|
||||||||||||||||||||||
|
|
AMSA
|
Sonasid
|
AM Kryvyi Rih
|
BBA
|
Hera Ermac
|
AMMIC
|
Arceo
|
AM Liberia
|
|||||||||||||||
|
Net cash provided by / (used in) operating activities
|
(
|
)
|
(
|
)
|
|
|
|
|
(
|
)
|
|
|
|
|
(
|
)
|
|||||||
|
Net cash provided by / (used in) investing activities
|
(
|
)
|
(
|
)
|
(
|
)
|
(
|
)
|
|
|
(
|
)
|
|
|
(
|
)
|
|||||||
|
Net cash provided by / (used in) financing activities
|
|
|
(
|
)
|
|
|
(
|
)
|
|
|
(
|
)
|
(
|
)
|
|
|
|||||||
|
Impact of currency movements on cash
|
|
|
|
|
(
|
)
|
|
|
|
|
|
|
|
|
|
|
|||||||
|
Cash and cash equivalents:
|
|||||||||||||||||||||||
|
At the beginning of the year
|
|
|
|
|
|
|
|
|
|
|
|
|
|
|
|
|
|||||||
|
At the end of the year
|
|
|
|
|
|
|
|
|
|
|
|
|
|
|
|
|
|||||||
|
Dividend to non-controlling interests
|
|
|
(
|
)
|
|
|
(
|
)
|
|
|
(
|
)
|
(
|
)
|
|
|
|||||||
Summarized statements of operations
|
|
December 31, 2016
|
||||||||||||||||||||||
|
|
AMSA
|
Sonasid
|
AM Kryvyi Rih
|
BBA
|
Hera Ermac
|
AMMIC
|
Arceo
|
AM Liberia
|
|||||||||||||||
|
Revenue
|
|
|
|
|
|
|
|
|
|
|
|
|
|
|
|
|
|||||||
|
Net income (loss)
|
(
|
)
|
(
|
)
|
|
|
|
|
|
|
(
|
)
|
|
|
(
|
)
|
|||||||
|
Total comprehensive income (loss)
|
(
|
)
|
(
|
)
|
|
|
|
|
|
|
(
|
)
|
|
|
(
|
)
|
|||||||
|
|
December 31, 2016
|
||||||||||||||||||||||
|
|
AMSA
|
Sonasid
|
AM Kryvyi Rih
|
BBA
|
Hera Ermac
|
AMMIC
|
Arceo
|
AM Liberia
|
|||||||||||||||
|
Net cash provided by / (used in) operating activities
|
|
|
|
|
|
|
|
|
|
|
|
|
|
|
(
|
)
|
|||||||
|
Net cash provided by / (used in) investing activities
|
(
|
)
|
(
|
)
|
(
|
)
|
(
|
)
|
(
|
)
|
(
|
)
|
(
|
)
|
(
|
)
|
|||||||
|
Net cash provided by / (used in) financing activities
|
|
|
(
|
)
|
|
|
(
|
)
|
|
|
(
|
)
|
|
|
|
|
|||||||
|
Impact of currency movements on cash
|
|
|
|
|
(
|
)
|
|
|
|
|
|
|
|
|
|
|
|||||||
|
Cash and cash equivalents:
|
|
|
|
|
|
|
|
|
|
|
|
|
|||||||||||
|
At the beginning of the year
|
|
|
|
|
|
|
|
|
|
|
|
|
|
|
|
|
|||||||
|
At the end of the year
|
|
|
|
|
|
|
|
|
|
|
|
|
|
|
|
|
|||||||
|
Dividend to non-controlling interests
|
|
|
(
|
)
|
|
|
(
|
)
|
|
|
(
|
)
|
|
|
|
|
|||||||
F-130
ARCELORMITTAL AND SUBSIDIARIES
Notes to Consolidated Financial Statements
(millions of U.S. dollars, except share and per share data)
Transactions with non-controlling interests in 2018 were as follows:
On November 9, 2018, ArcelorMittal completed the acquisition of Marcegaglia's
15
%
non-controlling interest in AM InvestCo and
11
%
non-controlling interest in BRE.M.A Warmwalz GmbH & Co KG for a
28
and
40
consideration, respectively. The Company recorded a decrease of
55
directly in equity.
Transactions with non-controlling interests in 2016 were as follows:
AMSA
On January 15, 2016, AMSA completed a rights offering fully underwritten by ArcelorMittal. The total cash proceeds amounted to ZAR
4.5
billion
. ArcelorMittal subscribed the capital increase through repayment of an outstanding intragroup loan of ZAR
3.2
billion
and an additional cash injection of ZAR
0.5
billion
. As a result of the rights issue, ArcelorMittal’s shareholding in AMSA increased from
52
%
to
70.55
%
and non-controlling interests decreased by
80
.
Effective October 17, 2016, ArcelorMittal’s interest in AMSA decreased to
69.22
%
. In the framework of AMSA’s transformation initiatives in order to maximize its score under the Broad-Based Black Economic Empowerment (“B-BBEE”) Codes of Good Practice, it launched on October 1, 2015 an employee share ownership plan following which the Ikageng Broad-Based Employee Share Trust obtained an ownership interest of
1.33
%
in AMSA to be attributed to qualifying employees upon vesting date of the plan.
In addition, on September 28, 2016, AMSA announced that it had entered into agreements to implement a transaction which includes the issuance of a
17
%
shareholding in AMSA using a new class of notionally funded shares to a special purpose vehicle owned by Likamva Resources Proprietary Limited (“Likamva”). Likamva has undertaken to introduce broad-based social and community development organizations as shareholders to hold an effective
5
%
interest (of the
17
%
, leaving Likamva with a
12
%
shareholding) within
24
months. The transaction also includes the issuance of a
5.1
%
shareholding in AMSA using another new class of notionally funded shares to the ArcelorMittal South Africa Employee Empowerment Share Trust for the benefit of AMSA employees and AMSA management. All the shares have certain restrictions on disposal for a period of
10
years
thereby promoting long-term sustainable B-BBEE in AMSA. The shares were issued on December 7, 2016. The Company concluded that the transaction does not correspond to a share issue but qualifies as an in substance option (resulting in the recognition of an expense of
63
, which is recognized in financing costs - net and corresponds to the fair value at inception). The shares give the holders rights to notional dividends which will be used to repay the notional funding and voting rights for up to
10
years
, resulting in a decrease of ArcelorMittal's voting rights to
53.92
%
. The Company will recognize non-controlling interests at the end of the
10
year period depending on the value of the shares based on a pre-defined formula.
|
2016
|
|||
|
Non-controlling interests
|
|
||
|
Purchase price (selling price), net
1
|
(
|
)
|
|
|
Adjustment to equity attributable to the equity holders of the parent
|
|
||
|
1.
|
Amount paid in by non-controlling shareholders in AMSA following the rights issue
|
The related parties of the Group are predominately subsidiaries, joint operations, joint ventures, associates and key management personnel (see note 7.1) of the Group. Transactions between the parent company, its subsidiaries and joint operations are eliminated on consolidation and are not disclosed in this note. Related parties include the Significant Shareholder, which is a trust of which Mr. Lakshmi N. Mittal, Mrs. Usha Mittal and their children are the beneficiaries and which owns
37.4
%
of ArcelorMittal’s ordinary shares.
F-131
ARCELORMITTAL AND SUBSIDIARIES
Notes to Consolidated Financial Statements
(millions of U.S. dollars, except share and per share data)
|
Year Ended December 31,
|
December 31,
|
|||||||||||||||
|
Sales
|
Trade receivables
|
|||||||||||||||
|
Related parties and their subsidiaries where applicable
|
Category
|
2018
|
2017
|
2016
|
2018
|
2017
|
||||||||||
|
Calvert
|
Joint Venture
|
|
|
|
|
|
|
|
|
|
|
|||||
|
Gonvarri Steel Industries
1
|
Associate
|
|
|
|
|
|
|
|
|
|
|
|||||
|
Macsteel
4
|
Other
|
|
|
|
|
|
|
|
|
|
|
|||||
|
ArcelorMittal CLN Distribuzione Italia S.r.l.
|
Joint Venture
|
|
|
|
|
|
|
|
|
|
|
|||||
|
Borçelik
|
Joint Venture
|
|
|
|
|
|
|
|
|
|
|
|||||
|
Bamesa
|
Associate
|
|
|
|
|
|
|
|
|
|
|
|||||
|
I/N Kote L.P.
|
Joint Venture
|
|
|
|
|
|
|
|
|
|
|
|||||
|
Aperam Société Anonyme ("Aperam")
|
Other
|
|
|
|
|
|
|
|
|
|
|
|||||
|
AM RZK
|
Joint Venture
|
|
|
|
|
|
|
|
|
|
|
|||||
|
C.L.N. Coils Lamiere Nastri S.p.A.
|
Associate
|
|
|
|
|
|
|
|
|
|
|
|||||
|
Tuper S.A.
2
|
Joint Venture
|
|
|
|
|
|
|
|
|
|
|
|||||
|
WDI
3
|
Associate
|
|
|
|
|
|
|
|
|
|
|
|||||
|
Tameh
|
Joint Venture
|
|
|
|
|
|
|
|
|
|
|
|||||
|
Al Jubail
|
Joint Venture
|
|
|
|
|
|
|
|
|
|
|
|||||
|
Other
|
|
|
|
|
|
|
|
|
|
|
||||||
|
Total
|
|
|
|
|
|
|
|
|
|
|
||||||
|
1.
|
Gonvarri Steel Industries includes ArcelorMittal Gonvarri Brasil Productos Siderúrgicos which is a joint venture.
|
|
2.
|
The joint venture Tuper S.A. was acquired on October 6, 2016.
|
|
3.
|
WDI includes Westfälische Drahtindustrie Verwaltungsgesellschaft mbH & Co. KG and Westfälische Drahtindustrie GmbH.
|
|
4.
|
|
F-132
ARCELORMITTAL AND SUBSIDIARIES
Notes to Consolidated Financial Statements
(millions of U.S. dollars, except share and per share data)
|
Year Ended December 31,
|
December 31,
|
|||||||||||||||
|
Purchases
|
Trade payables
|
|||||||||||||||
|
Related parties and their subsidiaries where applicable
|
Category
|
2018
|
2017
|
2016
|
2018
|
2017
|
||||||||||
|
Tameh
|
Joint Venture
|
|
|
|
|
|
|
|
|
|
|
|||||
|
Baffinland
1
|
Associate
|
|
|
|
|
|
|
|
|
|
|
|||||
|
Aperam
|
Other
|
|
|
|
|
|
|
|
|
|
|
|||||
|
Calvert
|
Joint Venture
|
|
|
|
|
|
|
|
|
|
|
|||||
|
CFL Cargo S.A.
|
Associate
|
|
|
|
|
|
|
|
|
|
|
|||||
|
Exeltium S.A.S.
|
Associate
|
|
|
|
|
|
|
|
|
|
|
|||||
|
Baycoat Limited Partnership
|
Joint Venture
|
|
|
|
|
|
|
|
|
|
|
|||||
|
EIMP
2
|
Other
|
|
|
|
|
|
|
|
|
|
|
|||||
|
Gonvarri Steel Industries
3
|
Associate
|
|
|
|
|
|
|
|
|
|
|
|||||
|
Other
|
|
|
|
|
|
|
|
|
|
|
|
|||||
|
Total
|
|
|
|
|
|
|
|
|
|
|
|
|||||
|
1.
|
Baffinland was classified as an associate as of October 31, 2017 (see note 2).
|
|
2.
|
In addition to trade payables and purchases with related parties as defined by IAS 24, the Company also discloses this information for EIMP due to the close relationship with this entity.
The Company's
|
|
3.
|
|
At December 31, 2018, the shareholder loans granted by the Company to Al Jubail, with various maturity dates
, had a carrying value of
131
(see note 2.4.3).
As of March 13, 2017, the Company granted a credit facility to AMTBA bearing compound interest (Libor 3 months + margin) maturing on February 28, 2018 for a maximum aggregated amount of
35
. The facility was fully repaid during the year.
As of December 3, 2014, ArcelorMittal Calvert LLC signed a member capital expenditure loan agreement with the joint venture Calvert and as of
December 31, 2018
, the loans amounted to
149
including accrued interest. The loans bear interest from
3
%
to
3.95
%
and have various maturity dates range from less than
1
to
25
years
.
In May 2014, ArcelorMittal entered into a
5
-year off take agreement with its associate Baffinland (the "AM Sourcing Contract"), whereby it will buy the lesser of
50
%
of the annual quantity of iron ore produced by Baffinland or
2
million
tonnes of iron ore per year. The AM Sourcing Contract has been extended to December 31, 2021 and the maximum quantity shall increase to the lesser of
50
%
of the annual quantity of iron ore produced by Baffinland or
4
million
tonnes per contract year, after completion of the Rail Expansion project. The purchase price includes a premium to reference prices based on high iron ore content. ArcelorMittal paid advances to Baffinland for an amount equivalent to
the value of iron ore stockpiled by Baffinland outside the salable season until August 31, 2017. From September 1, 2017 to December 31, 2021, ArcelorMittal will not pay advances to Baffinland anymore as payments for the purchases will occur upon loading on vessel for shipment at port of Milne.
In May 2014, ArcelorMittal also entered into an additional contract with Baffinland whereby it agreed to act as a sales agent (“Marketing agreement”) for all of Baffinland’s iron ore (excluding the shipments subject to the offtake agreement mentioned above). The Company also entered into an agreement to advance
80
%
of the lesser of
50
%
of the annual quantity of iron ore produced by Baffinland or
1.5
million
tonnes of iron ore per year. The contract expired on the extended maturity at April 30, 2016. On August 24, 2016, Baffinland entered into an agreement with a bank to finance an amount which does not exceed the lesser of
50
%
of iron ore stockpiled by Baffinland outside the salable season and
2.3
million
tonnes in any contract year. This agreement expired on the extended maturity at October 20, 2017. On December 1, 2017, Baffinland entered into a new agreement with a bank to finance up to
4
million
tonnes at
78
%
of the value of the iron ore produced and hauled to the por
F-133
ARCELORMITTAL AND SUBSIDIARIES
Notes to Consolidated Financial Statements
(millions of U.S. dollars, except share and per share data)
On March 2, 2018, ArcelorMittal signed a joint venture formation agreement with NSSMC in relation to its offer to acquire ESIL, which was subsequently amended and restated on January 22, 2019. On April 2, 2018, ArcelorMittal submitted an offer in the re-bidding process for ESIL. The offer has faced various legal challenges at the National Company Law Tribunal and more recently at the National Company Law Appellate Tribunal ("NCLAT").
On October 26, 2018, ArcelorMittal announced that ESIL Committee of Creditors (‘CoC’) has voted to approve the Company’s acquisition of ESIL. ESIL’s Resolution Professional, on behalf of the CoC, issued the Company with a Letter of Intent (''LOI'') stating that the Company has been identified as the ‘Successful Applicant’. Further to ArcelorMittal being named the H1 Resolution Applicant (the preferred bidder) on October 19, 2018, ESIL’s CoC approved the Company’s acquisition plan for ESIL (the "Resolution Plan"), with the ''LOI'' identifying it as the ‘Successful Resolution Plan’. The Resolution Plan set out a detailed industrial plan for ESIL aimed at improving its performance and profitability and ensuring it can participate in the anticipated growth of steel demand in India. It includes an upfront payment of
42,000
crore rupees (approx.
$
5.7
billion
) towards ESIL’s debt resolution, with a further
8,000
crore rupees (approx.
$
1.1
billion
) of capital injection into ESIL to support operational improvement, increase production levels and deliver enhanced levels of profitability.
The process to restore ESIL would involve a multi-staged approach: initial steps would be to stabilize the operations and increase production of finished steel goods
to
6.5
million
tonnes per annum in the medium-term followed by an increase to
8.5 million
tonnes per annum by the end of 2024 and ultimately have long-term aspirations to produce between
12
-
15
million
tonnes per annum.
In line with ESIL’s corporate insolvency process, ArcelorMittal’s Resolution Plan must now be formally accepted by India’s National Company Law Tribunal (“NCLT”) before completion. The NCLT has completed hearing the CoC's application for the approval of the Resolution Plan, as well as objections and challenges from different parties, including creditors of ESIL and the current shareholder. While it is difficult to predict the timing of an NCLT approval, a decision is expected in the first quarter of 2019 and the amounts of debt payment and capital injection specified in the Resolution Plan would become payable promptly after such approval is obtained.
F-134
TABLE OF CONTENTS
Part IItem 1. Identity Of Directors, Senior Management and AdvisersItem 2. Offer Statistics and Expected TimetableItem 3. Key InformationNote 8. 3 To Arcelormittal S Consolidated Financial StatementsItem 4. Information on The CompanyItem 4A. Unresolved Staff CommentsItem 5. Operating and Financial Review and ProspectsItem 6. Directors, Senior Management and EmployeesItem 7. Major Shareholders and Related Party TransactionsItem 8. Financial InformationItem 9. The Offer and ListingItem 10. Additional InformationItem 6B Directors, Senior Management and EmployeesItem 11. Quantitative and QualitativeItem 12. Description Of Securities Other Than Equity SecuritiesPart IIItem 13. Defaults, Dividend Arrearages and DelinquenciesItem 14. Material Modifications To The Rights Of Security Holders and Use Of ProceedsItem 16A. Audit & Risk Committee Financial ExpertItem 16B. Code Of EthicsItem 16C. Principal Accountant Fees and ServicesItem 16D. Exemptions From The Listing Standards For Audit CommitteesItem 16E. Purchases Of Equity Securities By The Issuer and Affiliated PurchasersItem 16F. Change in Registrant S Certifying AccountantItem 16G. Corporate GovernanceItem 16H. Mine Safety DisclosurePart IIIItem 17. Financial StatementsItem 18. Financial StatementsItem 19. ExhibitsNote 1: Accounting PrinciplesNote 2: Scope Of ConsolidationNote 3: Segment ReportingNote 4: Operating DataNote 5: Goodwill, Intangible and Tangible AssetsNote 6: Financing and Financial InstrumentsNote 7: Personnel Expenses and Deferred Employee BenefitsNote 8: Provisions, Contingencies and CommitmentsNote 9: Income TaxesNote 10: EquityNote 11: Related PartiesNote 12: Subsequent EventNote 4. 2 Discloses The Cost Of Inventories (materials) Recognized As An Expense During The YearNote 12: Subsequent Events