|
|
|
|
|
|
|
|
|
|
|
|
|
|
|
|
|
|
|
|
|
|
|
|
|
|
|
|
|
|
|
|
|
|
|
|
|
|
|
|
|
|
|
|
|
|
|
|
|
|
|
|
|
|
|
|
Table of Contents
UNITED STATES SECURITIES AND EXCHANGE COMMISSION
Washington, D.C. 20549
Form 10-K
| þ | ANNUAL REPORT PURSUANT TO SECTION 13 OR 15(d) OF THE SECURITIES EXCHANGE ACT OF 1934 |
For the fiscal year ended December 31, 2015
or
| ¨ | TRANSITION REPORT PURSUANT TO SECTION 13 OR 15(d) OF THE SECURITIES EXCHANGE ACT OF 1934 |
Commission file number 1-9861
M&T BANK CORPORATION
(Exact name of registrant as specified in its charter)
| New York | 16-0968385 | |
| (State of incorporation) | (I.R.S. Employer Identification No.) | |
| One M&T Plaza, Buffalo, New York | 14203 | |
| (Address of principal executive offices) | (Zip Code) | |
Registrant’s telephone number, including area code:
716-635-4000
Securities registered pursuant to Section 12(b) of the Act:
|
Title of Each Class |
Name of Each Exchange on Which Registered |
|
| Common Stock, $.50 par value | New York Stock Exchange | |
|
6.375% Cumulative Perpetual Preferred Stock, Series A, $1,000 liquidation preference per share |
New York Stock Exchange | |
|
6.375% Cumulative Perpetual Preferred Stock, Series C, $1,000 liquidation preference per share |
New York Stock Exchange | |
|
Warrants to purchase shares of Common Stock (expiring December 23, 2018) |
New York Stock Exchange |
Indicate by check mark if the registrant is a well-known seasoned issuer, as defined in Rule 405 of the Securities Act. Yes þ No ¨
Indicate by check mark if the registrant is not required to file reports pursuant to Section 13 or Section 15(d) of the Act. Yes ¨ No þ
Indicate by check mark whether the registrant (1) has filed all reports required to be filed by Section 13 or 15(d) of the Securities Exchange Act of 1934 during the preceding 12 months, and (2) has been subject to such filing requirements for the past 90 days. Yes þ No ¨
Indicate by check mark whether the registrant has submitted electronically and posted on its corporate Web site, if any, every Interactive Data File required to be submitted and posted pursuant to Rule 405 of Regulation S-T during the preceding 12 months (or for such shorter period that the registrant was required to submit and post such files). Yes þ No ¨
Indicate by check mark if disclosure of delinquent filers pursuant to Item 405 of Regulation S-K is not contained herein, and will not be contained, to the best of registrant’s knowledge, in definitive proxy or information statements incorporated by reference in Part III of this Form 10-K or any amendment to this Form 10-K. ¨
Indicate by check mark whether the registrant is a large accelerated filer, an accelerated filer, a non-accelerated filer, or a smaller reporting company. See the definitions of “large accelerated filer,” “accelerated filer,” and “smaller reporting company” in Rule 12b-2 of the Exchange Act. (Check one):
| Large accelerated filer | þ | Accelerated filer ¨ | ||||||
| Non-accelerated filer | ¨ | Smaller reporting company ¨ | ||||||
| (Do not check if a smaller reporting company) | ||||||||
Indicate by check mark whether the registrant is a shell company (as defined in Rule 12b-2 of the Act). Yes ¨ No þ
Aggregate market value of the Common Stock, $0.50 par value, held by non-affiliates of the registrant, computed by reference to the closing price as of the close of business on June 30, 2015: $14,816,451,138.
Number of shares of the Common Stock, $0.50 par value, outstanding as of the close of business on February 12, 2016: 159,094,858 shares.
Documents Incorporated By Reference:
(1) Portions of the Proxy Statement for the 2016 Annual Meeting of Shareholders of M&T Bank Corporation in Parts II and III.
Table of Contents
Form 10-K for the year ended December 31, 2015
CROSS-REFERENCE SHEET
|
Form 10-K
Page |
||||||||||||
| PART I | ||||||||||||
| 4 | ||||||||||||
|
Statistical disclosure pursuant to Guide 3 |
||||||||||||
| I. |
|
Distribution of assets, liabilities, and shareholders’ equity; interest
rates and interest differential |
||||||||||
| A. | Average balance sheets | 48 | ||||||||||
| B. | Interest income/expense and resulting yield or rate on average interest-earning assets (including non-accrual loans) and interest-bearing liabilities | 48 | ||||||||||
| C. | Rate/volume variances | 22 | ||||||||||
| II. | Investment portfolio | |||||||||||
| A. | Year-end balances | 20,119 | ||||||||||
| B. | Maturity schedule and weighted average yield | 84 | ||||||||||
| C. | Aggregate carrying value of securities that exceed ten percent of shareholders’ equity | 120 | ||||||||||
| III. | Loan portfolio | |||||||||||
| A. | Year-end balances | 20,123 | ||||||||||
| B. | Maturities and sensitivities to changes in interest rates | 82 | ||||||||||
| C. | Risk elements | |||||||||||
|
Nonaccrual, past due and renegotiated loans |
63,125-129 | |||||||||||
|
Actual and pro forma interest on certain loans |
125,134 | |||||||||||
|
Nonaccrual policy |
111-112 | |||||||||||
|
Loan concentrations |
73 | |||||||||||
| IV. | Summary of loan loss experience | |||||||||||
| A. | Analysis of the allowance for loan losses | 60,131-137 | ||||||||||
| Factors influencing management’s judgment concerning the adequacy of the allowance and provision | 59-73,112,131-137 | |||||||||||
| B. | Allocation of the allowance for loan losses | 72,131,135-136 | ||||||||||
| V. | Deposits | |||||||||||
| A. | Average balances and rates | 48 | ||||||||||
| B. | Maturity schedule of domestic time deposits with balances of $100,000 or more | 85 | ||||||||||
| VI. | Return on equity and assets | 22,42,88,91 | ||||||||||
| VII. | Short-term borrowings | 141 | ||||||||||
|
Item 1A. |
Risk Factors | 22-32 | ||||||||||
|
Item 1B. |
Unresolved Staff Comments . | 32 | ||||||||||
|
Item 2. |
Properties | 32 | ||||||||||
|
Item 3. |
Legal Proceedings | 32-34 | ||||||||||
|
Item 4. |
Mine Safety Disclosures | 34 | ||||||||||
| 34-35 | ||||||||||||
| PART II | ||||||||||||
|
Item 5. |
|
Market for Registrant’s Common Equity, Related Stockholder
Matters and Issuer Purchases of Equity Securities |
36-38 | |||||||||
| A. | Principal market | 36 | ||||||||||
| Market prices | 100 | |||||||||||
| B. | Approximate number of holders at year-end | 20 | ||||||||||
2
Table of Contents
|
Form 10-K
Page |
||||||||
| C. | Frequency and amount of dividends declared | 21-22,100,109 | ||||||
| D. | Restrictions on dividends | 8-13 | ||||||
| E. | Securities authorized for issuance under equity compensation plans | 36-37 | ||||||
| F. | Performance graph | 37 | ||||||
| G. | Repurchases of common stock | 37-38 | ||||||
|
Item 6. |
Selected Financial Data | 38 | ||||||
| A. | Selected consolidated year-end balances | 20 | ||||||
| B. | Consolidated earnings, etc. | 21 | ||||||
|
Item 7. |
Management’s Discussion and Analysis of Financial Condition and Results of Operations | 38-101 | ||||||
|
Item 7A. |
Quantitative and Qualitative Disclosures About Market Risk | 102 | ||||||
|
Item 8. |
Financial Statements and Supplementary Data | 102 | ||||||
| A. | Report on Internal Control Over Financial Reporting | 103 | ||||||
| B. | Report of Independent Registered Public Accounting Firm | 104 | ||||||
| C. | Consolidated Balance Sheet — December 31, 2015 and 2014 | 105 | ||||||
| D. | Consolidated Statement of Income — Years ended December 31, 2015, 2014 and 2013 | 106 | ||||||
| E. | Consolidated Statement of Comprehensive Income — Years ended December 31, 2015, 2014 and 2013 | 107 | ||||||
| F. | Consolidated Statement of Cash Flows — Years ended December 31, 2015, 2014 and 2013 | 108 | ||||||
| G. | Consolidated Statement of Changes in Shareholders’ Equity — Years ended December 31, 2015, 2014 and 2013 | 109 | ||||||
| H. | Notes to Financial Statements | 110-184 | ||||||
| I. | Quarterly Trends | 100 | ||||||
|
Item 9. |
Changes in and Disagreements with Accountants on Accounting and Financial Disclosure | 185 | ||||||
|
Item 9A. |
Controls and Procedures | 185 | ||||||
| A. | Conclusions of principal executive officer and principal financial officer regarding disclosure controls and procedures | 185 | ||||||
| B. | Management’s annual report on internal control over financial reporting | 185 | ||||||
| C. | Attestation report of the registered public accounting firm | 185 | ||||||
| D. | Changes in internal control over financial reporting | 185 | ||||||
|
Item 9B. |
Other Information | 185 | ||||||
| PART III | ||||||||
|
Item 10. |
Directors, Executive Officers and Corporate Governance | 185 | ||||||
|
Item 11. |
Executive Compensation | 185 | ||||||
|
Item 12. |
Security Ownership of Certain Beneficial Owners and Management and Related Stockholder Matters | 186 | ||||||
|
Item 13. |
Certain Relationships and Related Transactions, and Director Independence | 186 | ||||||
|
Item 14. |
Principal Accountant Fees and Services | 186 | ||||||
| PART IV | ||||||||
|
Item 15. |
Exhibits and Financial Statement Schedules | 186 | ||||||
| 187-188 | ||||||||
| 189-191 | ||||||||
3
Table of Contents
| Item 1. | Business. |
M&T Bank Corporation (“Registrant” or “M&T”) is a New York business corporation which is registered as a financial holding company under the Bank Holding Company Act of 1956, as amended (“BHCA”) and as a bank holding company (“BHC”) under Article III-A of the New York Banking Law (“Banking Law”). The principal executive offices of M&T are located at One M&T Plaza, Buffalo, New York 14203. M&T was incorporated in November 1969. M&T and its direct and indirect subsidiaries are collectively referred to herein as the “Company.” As of December 31, 2015 the Company had consolidated total assets of $122.8 billion, deposits of $92.0 billion and shareholders’ equity of $16.2 billion. The Company had 16,331 full-time and 1,145 part-time employees as of December 31, 2015.
At December 31, 2015, M&T had two wholly owned bank subsidiaries: M&T Bank and Wilmington Trust, National Association (“Wilmington Trust, N.A.”). The banks collectively offer a wide range of retail and commercial banking, trust and wealth management, and investment services to their customers. At December 31, 2015, M&T Bank represented 99% of consolidated assets of the Company.
The Company from time to time considers acquiring banks, thrift institutions, branch offices of banks or thrift institutions, or other businesses within markets currently served by the Company or in other locations that would complement the Company’s business or its geographic reach. The Company has pursued acquisition opportunities in the past, continues to review different opportunities, including the possibility of major acquisitions, and intends to continue this practice.
Subsidiaries
M&T Bank is a banking corporation that is incorporated under the laws of the State of New York. M&T Bank is a member of the Federal Reserve System and the Federal Home Loan Bank System, and its deposits are insured by the Federal Deposit Insurance Corporation (“FDIC”) up to applicable limits. M&T acquired all of the issued and outstanding shares of the capital stock of M&T Bank in December 1969. The stock of M&T Bank represents a major asset of M&T. M&T Bank operates under a charter granted by the State of New York in 1892, and the continuity of its banking business is traced to the organization of the Manufacturers and Traders Bank in 1856. The principal executive offices of M&T Bank are located at One M&T Plaza, Buffalo, New York 14203. As of December 31, 2015, M&T Bank had 807 domestic banking offices located in New York State, Maryland, New Jersey, Pennsylvania, Delaware, Connecticut, Virginia, West Virginia, and the District of Columbia, a full-service commercial banking office in Ontario, Canada, and an office in George Town, Cayman Islands. As of December 31, 2015, M&T Bank had consolidated total assets of $122.1 billion, deposits of $93.1 billion and shareholder’s equity of $15.1 billion. The deposit liabilities of M&T Bank are insured by the FDIC through its Deposit Insurance Fund (“DIF”). As a commercial bank, M&T Bank offers a broad range of financial services to a diverse base of consumers, businesses, professional clients, governmental entities and financial institutions located in its markets. Lending is largely focused on consumers residing in New York State, Maryland, New Jersey, Pennsylvania, Delaware, Connecticut, Virginia, West Virginia, and Washington, D.C., and on small and medium-size businesses based in those areas, although loans are originated through offices in other states and in Ontario, Canada. In addition, the Company conducts lending activities in various states through other subsidiaries. Trust and other fiduciary services are offered by M&T Bank and through its wholly owned subsidiary, Wilmington Trust Company. M&T Bank and certain of its subsidiaries also offer commercial mortgage loans secured by income producing properties or properties used by borrowers in a trade or business. Additional financial services are provided through other operating subsidiaries of the Company.
Wilmington Trust, N.A., a national banking association and a member of the Federal Reserve System and the FDIC, commenced operations on October 2, 1995. The deposit liabilities of Wilmington Trust, N.A. are insured by the FDIC through the DIF. The main office of Wilmington Trust, N.A. is located at 1100 North Market Street, Wilmington, Delaware, 19890. Wilmington Trust, N.A. offers various trust and wealth management services. Historically, Wilmington Trust, N.A. offered selected deposit and loan products on a nationwide basis, through direct mail, telephone marketing techniques and the Internet. As of December 31, 2015, Wilmington Trust, N.A. had total assets of $1.9 billion, deposits of $1.4 billion and shareholder’s equity of $476 million.
4
Table of Contents
Wilmington Trust Company, a wholly owned subsidiary of M&T Bank, was incorporated as a Delaware bank and trust company in March 1901 and amended its charter in July 2011 to become a nondepository trust company. Wilmington Trust Company provides a variety of Delaware based trust, fiduciary and custodial services to its clients. As of December 31, 2015, Wilmington Trust Company had total assets of $1.1 billion and shareholder’s equity of $545 million. Revenues of Wilmington Trust Company were $115 million in 2015. The headquarters of Wilmington Trust Company are located at 1100 North Market Street, Wilmington, Delaware 19890.
M&T Insurance Agency, Inc. (“M&T Insurance Agency”), a wholly owned insurance agency subsidiary of M&T Bank, was incorporated as a New York corporation in March 1955. M&T Insurance Agency provides insurance agency services principally to the commercial market. As of December 31, 2015, M&T Insurance Agency had assets of $30 million and shareholder’s equity of $16 million. M&T Insurance Agency recorded revenues of $27 million during 2015. The headquarters of M&T Insurance Agency are located at 285 Delaware Avenue, Buffalo, New York 14202.
M&T Real Estate Trust (“M&T Real Estate”) is a Maryland Real Estate Investment Trust that was formed through the merger of two separate subsidiaries, but traces its origin to the incorporation of M&T Real Estate, Inc. in July 1995. M&T Real Estate engages in commercial real estate lending and provides loan servicing to M&T Bank. As of December 31, 2015, M&T Real Estate had assets of $20.5 billion, common shareholder’s equity of $17.9 billion, and preferred shareholders’ equity, consisting of 9% fixed-rate preferred stock (par value $1,000), of $1 million. All of the outstanding common stock and 89% of the preferred stock of M&T Real Estate is owned by M&T Bank. The remaining 11% of M&T Real Estate’s outstanding preferred stock is owned by officers or former officers of the Company. M&T Real Estate recorded $798 million of revenue in 2015. The headquarters of M&T Real Estate are located at M&T Center, One Fountain Plaza, Buffalo, New York 14203.
M&T Realty Capital Corporation (“M&T Realty Capital”), a wholly owned subsidiary of M&T Bank, was incorporated as a Maryland corporation in October 1973. M&T Realty Capital engages in multifamily commercial real estate lending and provides loan servicing to purchasers of the loans it originates. As of December 31, 2015, M&T Realty Capital serviced $11.0 billion of commercial mortgage loans for non-affiliates and had assets of $420 million and shareholder’s equity of $102 million. M&T Realty Capital recorded revenues of $109 million in 2015. The headquarters of M&T Realty Capital are located at 25 South Charles Street, Baltimore, Maryland 21202.
M&T Securities, Inc. (“M&T Securities”) is a wholly owned subsidiary of M&T Bank that was incorporated as a New York business corporation in November 1985. M&T Securities is registered as a broker/dealer under the Securities Exchange Act of 1934, as amended, and as an investment advisor under the Investment Advisors Act of 1940, as amended (the “Investment Advisors Act”). M&T Securities is licensed as a life insurance agent in each state where M&T Bank operates branch offices and in a number of other states. It provides securities brokerage, investment advisory and insurance services. As of December 31, 2015, M&T Securities had assets of $49 million and shareholder’s equity of $37 million. M&T Securities recorded $98 million of revenue during 2015. The headquarters of M&T Securities are located at One M&T Plaza, Buffalo, New York 14203.
Wilmington Trust Investment Advisors, Inc. (“WT Investment Advisors”), a wholly owned subsidiary of M&T Bank, was incorporated as a Maryland corporation on June 30, 1995. WT Investment Advisors, a registered investment advisor under the Investment Advisors Act, serves as an investment advisor to the Wilmington Funds, a family of proprietary mutual funds, and institutional clients. As of December 31, 2015, WT Investment Advisors had assets of $43 million and shareholder’s equity of $38 million. WT Investment Advisors recorded revenues of $41 million in 2015. The headquarters of WT Investment Advisors are located at 100 East Pratt Street, Baltimore, Maryland 21202.
Wilmington Funds Management Corporation (“Wilmington Funds Management”) is a wholly owned subsidiary of M&T that was incorporated in September 1981 as a Delaware corporation. Wilmington Funds Management is registered as an investment advisor under the Investment Advisors Act and serves as an investment advisor to the Wilmington Funds. Wilmington Funds Management had assets of $17 million and shareholder’s equity of $16 million as of December 31, 2015. Wilmington Funds Management recorded revenues of $17 million in 2015. The headquarters of Wilmington Funds Management are located at 1100 North Market Street, Wilmington, Delaware 19890.
5
Table of Contents
Wilmington Trust Investment Management, LLC (“WTIM”) is a wholly owned subsidiary of M&T and was incorporated in December 2001 as a Georgia limited liability company. WTIM is a registered investment advisor under the Investment Advisors Act and provides investment management services to clients, including certain private funds. As of December 31, 2015, WTIM has assets and shareholder’s equity of $26 million each. WTIM recorded revenues of $4 million in 2015. WTIM’s headquarters is located at Terminus 27 th Floor, 3280 Peachtree Road N.E., Atlanta, Georgia 30305.
The Registrant and its banking subsidiaries have a number of other special-purpose or inactive subsidiaries. These other subsidiaries did not represent, individually and collectively, a significant portion of the Company’s consolidated assets, net income and shareholders’ equity at December 31, 2015.
Segment Information, Principal Products/Services and Foreign Operations
Information about the Registrant’s business segments is included in note 22 of Notes to Financial Statements filed herewith in Part II, Item 8, “Financial Statements and Supplementary Data” and is further discussed in Part II, Item 7, “Management’s Discussion and Analysis of Financial Condition and Results of Operations.” The Registrant’s reportable segments have been determined based upon its internal profitability reporting system, which is organized by strategic business unit. Certain strategic business units have been combined for segment information reporting purposes where the nature of the products and services, the type of customer and the distribution of those products and services are similar. The reportable segments are Business Banking, Commercial Banking, Commercial Real Estate, Discretionary Portfolio, Residential Mortgage Banking and Retail Banking. The Company’s international activities are discussed in note 17 of Notes to Financial Statements filed herewith in Part II, Item 8, “Financial Statements and Supplementary Data.”
The only activities that, as a class, contributed 10% or more of the sum of consolidated interest income and other income in any of the last three years were interest on loans and trust income. The amount of income from such sources during those years is set forth on the Company’s Consolidated Statement of Income filed herewith in Part II, Item 8, “Financial Statements and Supplementary Data.”
Supervision and Regulation of the Company
M&T and its subsidiaries are subject to the comprehensive regulatory framework applicable to bank and financial holding companies and their subsidiaries. Regulation of financial institutions such as M&T and its subsidiaries is intended primarily for the protection of depositors, the FDIC’s Deposit Insurance Fund and the banking and financial system as a whole, and generally is not intended for the protection of shareholders, investors or creditors other than insured depositors.
Proposals to change the applicable regulatory framework may be introduced in the United States Congress and state legislatures, as well as by regulatory agencies. Such initiatives may include proposals to expand or contract the powers of bank holding companies and depository institutions or proposals to substantially change the financial institution regulatory system. Such legislation could change banking statutes and the operating environment of the Company in substantial and unpredictable ways. If enacted, such legislation could increase or decrease the cost of doing business, limit or expand permissible activities or affect the competitive balance among banks, savings associations, credit unions, and other financial institutions. A change in statutes, regulations or regulatory policies applicable to M&T or any of its subsidiaries could have a material effect on the business, financial condition or results of operations of the Company.
Significant changes in this regulatory scheme arising from the 2010 Dodd-Frank Wall Street Reform and Consumer Protection Act (“Dodd-Frank Act”) has affected the lending, deposit, investment, trading and operating activities of financial institutions and their holding companies, and the system of regulatory oversight of the Company. As required by the Dodd-Frank Act, various federal regulatory agencies have proposed or adopted a broad range of implementing rules and regulations and have prepared numerous studies and reports for Congress. However, given that many of these regulatory changes are highly complex and are not fully implemented, the full impact of the Dodd-Frank Act regulatory reform will not be known until the rules are implemented and market practices develop under the final regulations.
6
Table of Contents
Described below are material elements of selected laws and regulations applicable to M&T and its subsidiaries. The descriptions are not intended to be complete and are qualified in their entirety by reference to the full text of the statutes and regulations described.
Overview
M&T is registered with the Board of Governors of the Federal Reserve System (“Federal Reserve Board”) as a BHC under the BHCA. As such, M&T and its subsidiaries are subject to the supervision, examination and reporting requirements of the BHCA and the regulations of the Federal Reserve Board. Its investment advisor subsidiaries are subject to SEC regulation.
In general, the BHCA limits the business of a BHC to banking, managing or controlling banks, and other activities that the Federal Reserve Board has determined to be so closely related to banking as to be a proper incident thereto. In addition, bank holding companies are to serve as a managerial and financial source of strength to their subsidiary depository institutions, including committing resources to support its subsidiary banks. This support may be required at times when M&T may not be inclined or able to provide it. In addition, any capital loans by a BHC to a subsidiary bank are subordinate in right of payment to deposits and to certain other indebtedness of such subsidiary bank. In the event of a BHC’s bankruptcy, any commitment by the BHC to a federal bank regulatory agency to maintain the capital of a subsidiary bank will be assumed by the bankruptcy trustee and entitled to a priority of payment.
Bank holding companies that qualify and elect to be financial holding companies may engage in any activity, or acquire and retain the shares of a company engaged in any activity, that is either (i) financial in nature or incidental to such financial activity (as determined by the Federal Reserve Board, by regulation or order, in consultation with the Secretary of the Treasury) or (ii) complementary to a financial activity and does not pose a substantial risk to the safety and soundness of depository institutions or the financial system generally (as solely determined by the Federal Reserve Board). Activities that are financial in nature include securities underwriting and dealing, insurance underwriting and making merchant banking investments. In order for a financial holding company to commence any new activity or to acquire a company engaged in any activity pursuant to the financial holding company provisions of the BHCA, each insured depository institution subsidiary of the financial holding company also must have at least a “satisfactory” rating under the Community Reinvestment Act of 1977 (the “CRA”). See the section captioned “Community Reinvestment Act” included elsewhere in this item.
To maintain financial holding company status, a financial holding company and all of its depository institution subsidiaries must be “well capitalized” and “well managed.” M&T became a financial holding company on March 1, 2011. The failure to meet such requirements could result in material restrictions on the activities of M&T and may also adversely affect the Company’s ability to enter into certain transactions or obtain necessary approvals in connection therewith, as well as loss of financial holding company status.
Current federal law also establishes a system of functional regulation under which, in addition to the broad supervisory authority that the Federal Reserve Board has over both the banking and non-banking activities of bank holding companies, the federal banking agencies regulate the banking activities of bank holding companies, banks and savings associations and subsidiaries of the foregoing, the U.S. Securities and Exchange Commission (“SEC”) regulates their securities activities, and state insurance regulators regulate their insurance activities.
M&T Bank is a New York chartered bank and a member of the Federal Reserve Bank of New York. As a result, it is subject to extensive regulation, examination and oversight by the New York State Department of Financial Services and the Federal Reserve. New York laws and regulations govern many aspects of M&T Bank’s operations, including branching, dividends, subsidiary activities, fiduciary activities, lending, and deposit taking. M&T Bank is also subject to Federal Reserve regulations and guidance, including oversight of capital levels. Its deposits are insured by the FDIC to $250,000 per depositor, which also exercises regulatory oversight over certain aspects of M&T Bank’s operations. Certain subsidiaries of M&T Bank are subject to regulation by other federal and state regulators as well. For example, M&T Securities is regulated by the SEC, the Financial Industry Regulatory Authority and state securities regulators, and WT Investment Advisors is also subject to SEC regulation.
7
Table of Contents
Wilmington Trust, N.A. is a national bank with operations that include fiduciary and related activities with some limited lending and deposit business. It is subject to extensive regulation, examination and oversight by the Office of the Comptroller of the Currency, which governs many aspects of the operations, including fiduciary activities, capital levels, office locations, dividends and subsidiary activities. Its deposits are insured by the FDIC to $250,000 per depositor, which also exercises regulatory oversight over certain aspects of the operations of Wilmington Trust, N.A. Certain subsidiaries of Wilmington Trust, N.A. are subject to regulation by other federal and state regulators as well.
The Dodd-Frank Act broadened the base for FDIC insurance assessments which are based on average consolidated total assets less average Tier 1 capital and certain allowable deductions of a financial institution. The Dodd-Frank Act also permanently increased the maximum amount of deposit insurance for banks, savings institutions and credit unions.
Dividends
M&T is a legal entity separate and distinct from its banking and other subsidiaries. Historically, the majority of M&T’s revenue has been from dividends paid to M&T by its subsidiary banks. M&T Bank and Wilmington Trust, N.A. are subject to laws and regulations imposing restrictions on the amount of dividends they may declare and pay. Future dividend payments to M&T by its subsidiary banks will be dependent on a number of factors, including the earnings and financial condition of each such bank, and are subject to the limitations referred to in note 23 of Notes to Financial Statements filed herewith in Part II, Item 8, “Financial Statements and Supplementary Data,” and to other statutory powers of bank regulatory agencies.
An insured depository institution is prohibited from making any capital distribution to its owner, including any dividend, if, after making such distribution, the depository institution fails to meet the required minimum level for any relevant capital measure, including the risk-based capital adequacy and leverage standards discussed herein.
Dividend payments by M&T to its shareholders and stock repurchases by M&T are subject to the oversight of the Federal Reserve Board. As described below in this section under “Stress Testing and Capital Plan Review,” dividends and stock repurchases (net of any new stock issuances as per a capital plan) generally may only be paid or made under a capital plan as to which the Federal Reserve Board has not objected.
Capital Requirements
M&T and its subsidiary banks are required to comply with applicable capital adequacy standards established by the federal banking agencies. Beginning on January 1, 2015, M&T and its subsidiary banks became subject to a new comprehensive capital framework for U.S. banking organizations that was issued by the federal banking agencies in July 2013 (the “New Capital Rules”), subject to phase-in periods for certain components and other provisions.
The New Capital Rules generally implement the Basel Committee’s December 2010 final capital framework referred to as “Basel III” for strengthening international capital standards. The New Capital Rules substantially revised the risk-based capital requirements applicable to bank holding companies and their depository institution subsidiaries, including M&T, M&T Bank and Wilmington Trust, N.A., as compared to the U.S. general risk-based capital rules that were applicable to the Company through December 31, 2014. The New Capital Rules revised the definitions and the components of regulatory capital, as well as address other issues affecting the numerator in banking institutions’ regulatory capital ratios. The New Capital Rules also address asset risk weights and other matters affecting the denominator in banking institutions’ regulatory capital ratios.
Among other matters, the New Capital Rules: (i) introduce a capital measure called “Common Equity Tier 1” (“CET1”) and related regulatory capital ratio of CET1 to risk-weighted assets; (ii) specify that Tier 1 capital consists of CET1 and “Additional Tier 1 capital” instruments meeting certain revised requirements; (iii) mandate that most deductions/adjustments to regulatory capital measures be made to CET1 and not to the other components of capital; and (iv) expand the scope of the deductions from and adjustments to capital as compared to the previous regulations. Under the New Capital Rules, for most banking organizations, including M&T, the most common form of Additional Tier 1 capital is non-cumulative perpetual preferred stock and the most common forms of Tier 2 capital are subordinated notes and a portion of the allowance for loan and lease losses, in each case, subject to the New Capital Rules’ specific requirements.
8
Table of Contents
Pursuant to the New Capital Rules, the minimum capital ratios are as follows:
| ● |
4.5% CET1 to risk-weighted assets; |
| ● |
6.0% Tier 1 capital (that is, CET1 plus Additional Tier 1 capital) to risk-weighted assets; |
| ● |
8.0% Total capital (that is, Tier 1 capital plus Tier 2 capital) to risk-weighted assets; and |
| ● |
4.0% Tier 1 capital to average consolidated assets as reported on consolidated financial statements (known as the “leverage ratio”). |
The New Capital Rules also introduce a new “capital conservation buffer,” composed entirely of CET1, on top of these minimum risk-weighted asset ratios. The capital conservation buffer is designed to absorb losses during periods of economic stress. Banking institutions with a ratio of CET1 to risk-weighted assets above the minimum but below the capital conservation buffer will face constraints on dividends, equity and other capital instrument repurchases and compensation based on the amount of the shortfall. Thus, when fully phased-in on January 1, 2019, the capital standards applicable to M&T will include an additional capital conservation buffer of 2.5% of CET1, effectively resulting in minimum ratios inclusive of the capital conservation buffer of (i) CET1 to risk-weighted assets of at least 7%, (ii) Tier 1 capital to risk-weighted assets of at least 8.5%; (iii) Total capital to risk-weighted assets of at least 10.5% and (iv) a minimum leverage ratio of 4%, calculated as the ratio of Tier 1 capital to average assets. In addition, M&T is also subject to the Federal Reserve Board’s capital plan rule and supervisory Capital Analysis and Review (“CCAR”) process, pursuant to which its ability to make capital distributions and repurchase or redeem capital securities may be limited unless M&T is able to demonstrate its ability to meet applicable minimum capital ratios and currently a 5% minimum Tier 1 common equity ratio, as well as other requirements, over a nine quarter planning horizon under a “severely adverse” macroeconomic scenario generated yearly by the federal bank regulators. See “Stress Testing and Capital Plan Review” below.
The New Capital Rules provide for a number of deductions from and adjustments to CET1. These include, for example, the requirement that mortgage servicing rights, deferred tax assets arising from temporary differences that could not be realized through net operating loss carrybacks, and significant investments in non-consolidated financial entities be deducted from CET1 to the extent that any one such category exceeds 10% of CET1 or all such items, in the aggregate, exceed 15% of CET1.
In addition, under the risk-based capital rules applicable to the Company through December 31, 2014, the effects of accumulated other comprehensive income or loss (“AOCI”) items included in shareholders’ equity (for example, marks-to-market of securities held in the available-for-sale portfolio) under U.S. GAAP were reversed for the purposes of determining regulatory capital ratios. Pursuant to the New Capital Rules, the effects of certain AOCI items are not excluded; however, non-advanced approaches banking organizations, including M&T, may make a one-time permanent election to continue to exclude these items. M&T made such election in 2015. The New Capital Rules also preclude certain hybrid securities, such as trust preferred securities, from inclusion in bank holding companies’ Tier 1 capital, subject to phase-out in the case of bank holding companies, such as M&T, that had $15 billion or more in total consolidated assets as of December 31, 2009. As a result, beginning in 2015 25% of M&T’s trust preferred securities were includable in Tier 1 capital, and in 2016, none of M&T’s trust preferred securities will be includable in Tier 1 capital. Trust preferred securities no longer included in M&T’s Tier 1 capital may nonetheless be included as a component of Tier 2 capital on a permanent basis without phase-out and irrespective of whether such securities otherwise meet the revised definition of Tier 2 capital set forth in the New Capital Rules. Management believes that M&T is in compliance with the targeted capital ratios. M&T’s regulatory capital ratios are presented in note 23 of Notes to Financial Statements filed herewith in Part II, Item 8, “Financial Statements and Supplementary Data.”
Stress Testing and Capital Plan Review
As part of the enhanced prudential requirements applicable to systemically important financial institutions, the Federal Reserve Board conducts annual analyses of bank holding companies with at least $50 billion in assets, such as M&T, to determine whether the companies have sufficient capital on a consolidated basis necessary to absorb losses in three economic and financial scenarios generated by the Federal Reserve Board: baseline, adverse and severely adverse scenarios. M&T is also required to conduct its own semi-annual stress analysis (together with the Federal Reserve Board’s stress analysis, the “stress tests”) to assess the potential impact on M&T of the economic and
9
Table of Contents
financial conditions used as part of the Federal Reserve Board’s annual stress analysis. The Federal Reserve Board may also use, and require companies to use, additional components in the adverse and severely adverse scenarios or additional or more complex scenarios designed to capture salient risks to specific business groups. M&T Bank is also required to conduct annual stress testing using the same economic and financial scenarios as M&T and report the results to the Federal Reserve Board. A summary of results of the Federal Reserve Board’s analysis under the adverse and severely adverse stress scenarios are publicly disclosed, and bank holding companies subject to the rules, including M&T, must disclose a summary of the company-run severely adverse stress test results. M&T is required to include in its disclosure a summary of the severely adverse scenario stress test conducted by M&T Bank.
In addition, bank holding companies with total consolidated assets of $50 billion or more, such as M&T, must submit annual capital plans for approval as part of the Federal Reserve Board’s CCAR process. Covered bank holding companies may execute capital actions, such as paying dividends and repurchasing stock, only in accordance with a capital plan that has been reviewed and approved by the Federal Reserve Board (or any approved amendments to such plan). The comprehensive capital plans include a view of capital adequacy under four scenarios — a BHC-defined baseline scenario, a baseline scenario provided by the Federal Reserve Board, at least one BHC-defined stress scenario, and a stress scenario provided by the Federal Reserve Board. The CCAR process is intended to help ensure that these bank holding companies have robust, forward-looking capital planning processes that account for each company’s unique risks and that permit continued operations during times of economic and financial stress. Each of the bank holding companies participating in the CCAR process is also required to collect and report certain related data to the Federal Reserve Board on a quarterly basis to allow the Federal Reserve Board to monitor progress against the approved capital plans. Each capital plan must include a view of capital adequacy under the stress test scenarios described above. The Federal Reserve Board may object to a capital plan if the plan does not show that the covered bank holding company will maintain a Tier 1 common equity ratio (as defined under the Basel I framework) of at least 5% on a pro forma basis under expected and stressful conditions throughout the nine-quarter planning horizon covered by the capital plan. Even if such quantitative thresholds are met, the Federal Reserve Board could object to a capital plan for qualitative reasons, including inadequate assumptions in the plan, other unresolved supervisory issues or an insufficiently robust capital adequacy process, or if the capital plan would otherwise constitute an unsafe or unsound practice or violate law. The rules also provide that a covered BHC may not make a capital distribution unless after giving effect to the distribution it will meet all minimum regulatory capital ratios and have a ratio of Tier 1 common equity to risk-weighted assets of at least 5%. The CCAR rules, consistent with prior Federal Reserve Board guidance, also provide that capital plans contemplating dividend payout ratios exceeding 30% of net income will receive particularly close scrutiny. M&T’s most recent CCAR capital plan was filed with the Federal Reserve Board on January 5, 2015, and the next submission is due on April 5, 2016.
The Federal Reserve Board generally limits a BHC’s ability to make quarterly capital distributions – that is, dividends and share repurchases, if the amount of the BHC’s actual cumulative quarterly capital issuances of instruments that qualify as regulatory capital are less than the BHC had indicated in its submitted capital plan as to which it received a non-objection from the Federal Reserve Board. For example, if the BHC issued a smaller amount of additional common stock than it had stated in its capital plan, it would be required to reduce common dividends and/or the amount of common stock repurchases so that the dollar amount of capital distributions, net of the dollar amount of additional common stock issued (“net distributions”), is no greater than the dollar amount of net distributions relating to its common stock included in its capital plan, as measured on an aggregate basis beginning in the third quarter of the nine-quarter planning horizon through the end of the then current quarter. However, not raising sufficient amounts of common stock as planned would not affect distributions related to Additional Tier 1 Capital instruments and/ or Tier 2 Capital. These limitations also contain several important qualifications and exceptions, including that scheduled dividend payments on (as opposed to repurchases of) a BHC’s Additional Tier 1 Capital and Tier 2 Capital instruments are not restricted if the BHC fails to issue a sufficient amount of such instruments as planned, as well as provisions for certain de minimis excess distributions.
10
Table of Contents
Liquidity
Historically, regulation and monitoring of bank and BHC liquidity has been addressed as a supervisory matter, both in the U.S. and internationally, without required formulaic measures. However, beginning in January 2016 M&T is subject to final rules adopted by the Federal Reserve and other banking regulators (“Final LCR Rule”) implementing a U.S. version of the Basel Committee’s Liquidity Coverage Ratio requirement (“LCR”). The LCR is intended to ensure that banks hold sufficient amounts of so-called “high quality liquid assets” (“HQLA”) to cover the anticipated net cash outflows during a hypothetical acute 30-day stress scenario. The LCR is the ratio of an institution’s amount of HQLA (the numerator) over projected net cash out-flows over the 30-day horizon (the denominator), in each case, as calculated pursuant to the Final LCR Rule. Once fully phased-in, a subject institution must maintain an LCR equal to at least 100% in order to satisfy this regulatory requirement. Only specific classes of assets, including U.S. Treasury securities, other U.S. government obligations and agency mortgaged-backed securities, qualify under the rule as HQLA, with classes of assets deemed relatively less liquid and/or subject to greater degree of credit risk subject to certain haircuts and caps for purposes of calculating the numerator under the Final LCR Rule. The total net cash outflows amount is determined under the rule by applying certain hypothetical outflow and inflow rates, which reflect certain standardized stressed assumptions, against the balances of the banking organization’s funding sources, obligations, transactions and assets over the 30-day stress period. Inflows that can be included to offset outflows are limited to 75% of outflows (which effectively means that banking organizations must hold high-quality liquid assets equal to 25% of outflows even if outflows perfectly match inflows over the stress period). The total net cash outflow amount for the modified LCR applicable to M&T is capped at 70% of the outflow rate that applies to the full LCR. The initial compliance date for the modified LCR was January 1, 2016, with the requirement fully phased-in by January 1, 2017.
The Basel III framework also included a second standard, referred to as the net stable funding ratio (“NSFR”), which is designed to promote more medium-and long-term funding of the assets and activities of banks over a one-year time horizon. Although the Basel Committee finalized its formulation of the NSFR in 2014, the U.S. banking agencies have not yet proposed an NSFR for application to U.S. banking organizations or addressed the scope of banking organizations to which it will apply. The Basel Committee’s final NSFR document states that the NSFR applies to internationally active banks, as did its final LCR document as to that ratio.
Cross-Guarantee Provisions
Each insured depository institution “controlled” (as defined in the BHCA) by the same BHC can be held liable to the FDIC for any loss incurred, or reasonably expected to be incurred, by the FDIC due to the default of any other insured depository institution controlled by that holding company and for any assistance provided by the FDIC to any of those banks that are in danger of default. The FDIC’s claim under the cross-guarantee provisions is superior to claims of shareholders of the insured depository institution or its holding company and to most claims arising out of obligations or liabilities owed to affiliates of the institution, but is subordinate to claims of depositors, secured creditors and holders of subordinated debt (other than affiliates) of the commonly controlled insured depository institution. The FDIC may decline to enforce the cross-guarantee provisions if it determines that a waiver is in the best interest of the DIF.
Enhanced Supervision and Prudential Standards
The Dodd-Frank Act directed the Federal Reserve Board to enact enhanced prudential standards applicable to foreign banking organizations and bank holding companies with total consolidated assets of $50 billion or more, such as M&T. The Federal Reserve Board adopted amendments to Regulation YY to implement certain of the required enhanced prudential standards. Those amendments, which are intended to help increase the resiliency of the operations of these organizations, include liquidity requirements, requirements for overall risk management (including establishing a risk committee), and a 15-to-1 debt-to-equity limit for companies that the Financial Stability Oversight Council has determined pose a grave threat to financial stability. The liquidity requirements and risk management requirements became effective as to M&T on January 1, 2015. The Federal Reserve Board has not yet adopted final single counterparty credit limits or early remediation requirements.
11
Table of Contents
Volcker Rule
On December 10, 2013, the federal banking regulators and the SEC adopted the so-called Volcker Rule to implement the provisions of the Dodd-Frank Act limiting proprietary trading and investing in and sponsoring certain hedge funds and private equity funds (defined as covered funds in the Volcker Rule). The Company does not engage in any significant amount of proprietary trading as defined in the Volcker Rule and has implemented the required procedures for those areas in which trading does occur. The covered funds limits are imposed through a conformance period that is expected to end in July 2017. The Company is required to divest of certain assets that constitute covered funds; however these divestitures are not expected to have a material impact on the Company’s consolidated financial condition or results of operations.
Safety and Soundness Standards
Guidelines adopted by the federal bank regulatory agencies pursuant to the Federal Deposit Insurance Act, as amended (the “FDIA”), establish general standards relating to internal controls, information systems, internal audit systems, loan documentation, credit underwriting, interest rate exposure, asset growth, compensation, fees and benefits. In general, these guidelines require, among other things, appropriate systems and practices to identify and manage the risk and exposures specified in the guidelines. Additionally, the agencies adopted regulations that authorize, but do not require, an agency to order an institution that has been given notice by an agency that it is not satisfying any of such safety and soundness standards to submit a compliance plan. If, after being so notified, an institution fails to submit an acceptable compliance plan or fails in any material respect to implement an acceptable compliance plan, the agency must issue an order directing action to correct the deficiency and may issue an order directing other actions of the types to which an undercapitalized institution is subject. If an institution fails to comply with such an order, the agency may seek to enforce such order in judicial proceedings and to impose civil money penalties.
Limits on Undercapitalized Depository Institutions
The FDIA establishes a system of regulatory remedies to resolve the problems of undercapitalized institutions, referred to as the prompt corrective action. The federal banking regulators have established five capital categories (“well-capitalized,” “adequately capitalized,” “undercapitalized,” “significantly undercapitalized” and “critically undercapitalized”) and must take certain mandatory supervisory actions, and are authorized to take other discretionary actions, with respect to institutions which are undercapitalized, significantly undercapitalized or critically undercapitalized. The severity of these mandatory and discretionary supervisory actions depends upon the capital category in which the institution is placed. Generally, subject to a narrow exception, the FDIA requires the banking regulator to appoint a receiver or conservator for an institution that is critically undercapitalized. The FDIC has specified by regulation the relevant capital levels for each category. The Federal Reserve Board and the OCC have specified the same or similar levels for each category. Effective January 1, 2015, the New Capital Rules created new prompt corrective action requirements by (i) introducing a CET1 ratio requirement at each level (other than critically undercapitalized), with the required CET1 ratio being 6.5% for well-capitalized status; (ii) increasing the minimum Tier 1 capital ratio requirement for each category (other than critically undercapitalized), with the minimum Tier 1 capital ratio for well-capitalized status being 8%; and (iii) eliminating the provision that provided that a bank with a composite supervisory rating of 1 may have a 3% leverage ratio and still be adequately capitalized.
An institution that is classified as well-capitalized based on its capital levels may be classified as adequately capitalized, and an institution that is adequately capitalized or undercapitalized based upon its capital levels may be treated as though it were undercapitalized or significantly undercapitalized, respectively, if the appropriate federal banking agency, after notice and opportunity for hearing, determines that an unsafe or unsound condition or an unsafe or unsound practice warrants such treatment.
An institution that is categorized as undercapitalized, significantly undercapitalized or critically undercapitalized is required to submit an acceptable capital restoration plan to its appropriate federal banking regulator. Under the FDIA, in order for the capital restoration plan to be accepted by the appropriate federal banking agency, a BHC must guarantee that a subsidiary depository institution will comply with its capital restoration plan, subject to certain limitations. The
12
Table of Contents
BHC must also provide appropriate assurances of performance. The obligation of a controlling BHC under the FDIA to fund a capital restoration plan is limited to the lesser of 5.0% of an undercapitalized subsidiary’s assets or the amount required to meet regulatory capital requirements. An undercapitalized institution is also generally prohibited from increasing its average total assets, making acquisitions, establishing any branches or engaging in any new line of business, except in accordance with an accepted capital restoration plan or with the approval of the FDIC. Institutions that are significantly undercapitalized or undercapitalized and either fail to submit an acceptable capital restoration plan or fail to implement an approved capital restoration plan may be subject to a number of requirements and restrictions, including orders to sell sufficient voting stock to become adequately capitalized, requirements to reduce total assets and cessation of receipt of deposits from correspondent banks. Critically undercapitalized depository institutions failing to submit or implement an acceptable capital restoration plan are subject to appointment of a receiver or conservator.
Transactions with Affiliates
There are various legal restrictions on the extent to which M&T and its non-bank subsidiaries may borrow or otherwise obtain funding from M&T Bank and Wilmington Trust, N.A. In general, Sections 23A and 23B of the Federal Reserve Board Act and Federal Reserve Board Regulation W require that any “covered transaction” by M&T Bank and Wilmington Trust, N.A. (or any of their respective subsidiaries) with an affiliate must in certain cases be secured by designated amounts of specified collateral and must be limited as follows: (a) in the case of any single such affiliate, the aggregate amount of covered transactions of the insured depository institution and its subsidiaries may not exceed 10% of the capital stock and surplus of such insured depository institution, and (b) in the case of all affiliates, the aggregate amount of covered transactions of an insured depository institution and its subsidiaries may not exceed 20% of the capital stock and surplus of such insured depository institution. The Dodd-Frank Act significantly expanded the coverage and scope of the limitations on affiliate transactions within a banking organization, including for example, the requirement that the 10% of capital limit on covered transactions begin to apply to financial subsidiaries. “Covered transactions” are defined by statute to include, among other things, a loan or extension of credit, as well as a purchase of securities issued by an affiliate, a purchase of assets (unless otherwise exempted by the Federal Reserve Board) from the affiliate, certain derivative transactions that create a credit exposure to an affiliate, the acceptance of securities issued by the affiliate as collateral for a loan, and the issuance of a guarantee, acceptance or letter of credit on behalf of an affiliate. All covered transactions, including certain additional transactions (such as transactions with a third party in which an affiliate has a financial interest), must be conducted on market terms.
FDIC Insurance Assessments
Deposit Insurance Assessments . M&T Bank and Wilmington Trust, N.A. pay deposit insurance premiums to the FDIC based on an assessment rate established by the FDIC. Deposit insurance assessments are based on average total assets minus average tangible equity. For larger institutions, such as M&T Bank, the FDIC uses a performance score and a loss-severity score that are used to calculate an initial assessment rate. In calculating these scores, the FDIC uses a bank’s capital level and supervisory ratings and certain financial measures to assess an institution’s ability to withstand asset-related stress and funding-related stress. The FDIC has the ability to make discretionary adjustments to the total score based upon significant risk factors that are not adequately captured in the calculations.
The initial base assessment rate ranges from 5 to 35 basis points on an annualized basis. After the effect of potential base-rate adjustments, the total base assessment rate could range from 2.5 to 45 basis points on an annualized basis. As the DIF reserve ratio grows, the rate schedule will be adjusted downward. Additionally, an institution must pay an additional premium equal to 50 basis points on every dollar (above 3% of an institution’s Tier 1 capital) of long-term, unsecured debt held that was issued by another insured depository institution.
In its DIF restoration plan, the FDIC designated that the DIF reserve ratio should be 1.35% by September 2020. The FDIC will, at least semi-annually, update its income and loss projections for the DIF and, if necessary, propose rules to further increase assessment rates.
13
Table of Contents
Under the FDIA, insurance of deposits may be terminated by the FDIC upon a finding that the institution has engaged in unsafe and unsound practices, is in an unsafe or unsound condition to continue operations, or has violated any applicable law, regulation, rule, order or condition imposed by the FDIC.
FICO Assessments . In addition, the Deposit Insurance Funds Act of 1996 authorized the Financing Corporation (“FICO”) to impose assessments on DIF applicable deposits in order to service the interest on FICO’s bond obligations from deposit insurance fund assessments. The amount assessed on individual institutions by FICO is in addition to the amount, if any, paid for deposit insurance according to the FDIC’s risk-related assessment rate schedules. FICO assessment rates may be adjusted quarterly to reflect a change in assessment base. M&T Bank recognized $5 million of expense related to its FICO assessments and Wilmington Trust, N.A. recognized $73 thousand of such expense in 2015.
Acquisitions
The BHCA requires every BHC to obtain the prior approval of the Federal Reserve Board before: (1) it may acquire direct or indirect ownership or control of any voting shares of any bank or savings and loan association, if after such acquisition, the BHC will directly or indirectly own or control 5% or more of the voting shares of the institution; (2) it or any of its subsidiaries, other than a bank, may acquire all or substantially all of the assets of any bank or savings and loan association; or (3) it may merge or consolidate with any other BHC. Since July 2011, financial holding companies and bank holding companies with consolidated assets exceeding $50 billion, such as M&T, have been required to (i) obtain prior approval from the Federal Reserve Board before acquiring certain nonbank financial companies with assets exceeding $10 billion and (ii) provide prior written notice to the Federal Reserve Board before acquiring direct or indirect ownership or control of any voting shares of any company having consolidated assets of $10 billion or more.
The BHCA further provides that the Federal Reserve Board may not approve any transaction that would result in a monopoly or would be in furtherance of any combination or conspiracy to monopolize or attempt to monopolize the business of banking in any section of the United States, or the effect of which may be substantially to lessen competition or to tend to create a monopoly in any section of the country, or that in any other manner would be in restraint of trade, unless the anticompetitive effects of the proposed transaction are clearly outweighed by the public interest in meeting the convenience and needs of the community to be served. The Federal Reserve Board is also required to consider the financial and managerial resources and future prospects of the bank holding companies and banks concerned and the convenience and needs of the community to be served. Consideration of financial resources generally focuses on capital adequacy, and consideration of convenience and needs issues includes the parties’ performance under the CRA and compliance with consumer protection laws. The Federal Reserve Board must take into account the institutions’ effectiveness in combating money laundering. In addition, pursuant to the Dodd-Frank Act, the BHCA was amended to require the Federal Reserve Board, when evaluating a proposed transaction, to consider the extent to which the transaction would result in greater or more concentrated risks to the stability of the United States banking or financial system.
Executive and Incentive Compensation
Guidelines adopted by the federal banking agencies prohibit excessive compensation as an unsafe and unsound practice and describe compensation as excessive when the amounts paid are unreasonable or disproportionate to the services performed by an executive officer, employee, director or principal stockholder. The Federal Reserve Board has issued comprehensive guidance on incentive compensation policies (the “Incentive Compensation Guidance”) intended to ensure that the incentive compensation policies of banking organizations do not undermine the safety and soundness of such organizations by encouraging excessive risk-taking. The Incentive Compensation Guidance, which covers all employees that have the ability to materially affect the risk profile of an organization, either individually or as part of a group, is based upon the key principles that a banking organization’s incentive compensation arrangements should (i) provide incentives that do not encourage risk-taking beyond the organization’s ability to effectively identify and manage risks, (ii) be compatible with effective internal controls and risk management, and (iii) be supported by strong corporate governance, including active and effective oversight by the organization’s board of
14
Table of Contents
directors. These three principles are incorporated into the proposed joint compensation regulations under the Dodd-Frank Act, discussed below. Any deficiencies in compensation practices that are identified may be incorporated into the organization’s supervisory ratings, which can affect its ability to make acquisitions or perform other actions. The Incentive Compensation Guidance provides that enforcement actions may be taken against a banking organization if its incentive compensation arrangements or related risk-management control or governance processes pose a risk to the organization’s safety and soundness and the organization is not taking prompt and effective measures to correct the deficiencies.
The Dodd-Frank Act requires the federal bank regulatory agencies and the SEC to establish joint regulations or guidelines prohibiting incentive-based payment arrangements at specified regulated entities, such as M&T and M&T Bank, having at least $1 billion in total assets that encourage inappropriate risks by providing an executive officer, employee, director or principal shareholder with excessive compensation, fees, or benefits or that could lead to material financial loss to the entity. In addition, these regulators must establish regulations or guidelines requiring enhanced disclosure to regulators of incentive-based compensation arrangements. The agencies proposed such regulations in April 2011, and if the final regulations are adopted in the form initially proposed, they will impose limitations on the manner in which M&T may structure compensation for its executives.
The scope and content of the U.S. banking regulators’ policies on incentive compensation are continuing to develop and are likely to continue evolving in the future. It cannot be determined at this time whether compliance with such policies will adversely affect the ability of M&T and its subsidiaries to hire, retain and motivate their key employees.
Resolution Planning
Bank holding companies with consolidated assets of $50 billion or more, such as M&T, are required to report periodically to regulators a resolution plan for their rapid and orderly resolution in the event of material financial distress or failure. M&T’s resolution plan must, among other things, ensure that its depository institution subsidiaries are adequately protected from risks arising from its other subsidiaries. The regulation adopted by the Federal Reserve and FDIC sets specific standards for the resolution plans, including requiring a strategic analysis of the plan’s components, a description of the range of specific actions the company proposes to take in resolution, and a description of the company’s organizational structure, material entities, interconnections and interdependencies, and management information systems, among other elements. In addition, insured depository institutions with $50 billion or more in total assets, such as M&T Bank, are required to submit to the FDIC periodic plans for resolution in the event of the institution’s failure. M&T and M&T Bank submitted updated resolution plans in December 2015.
Insolvency of an Insured Depository Institution or a Bank Holding Company
If the FDIC is appointed as conservator or receiver for an insured depository institution such as M&T Bank or Wilmington Trust, N.A., upon its insolvency or in certain other events, the FDIC has the power:
| ● |
to transfer any of the depository institution’s assets and liabilities to a new obligor, including a newly formed “bridge” bank without the approval of the depository institution’s creditors; |
| ● |
to enforce the terms of the depository institution’s contracts pursuant to their terms without regard to any provisions triggered by the appointment of the FDIC in that capacity; or |
| ● |
to repudiate or disaffirm any contract or lease to which the depository institution is a party, the performance of which is determined by the FDIC to be burdensome and the disaffirmance or repudiation of which is determined by the FDIC to promote the orderly administration of the depository institution. |
In addition, under federal law, the claims of holders of domestic deposit liabilities and certain claims for administrative expenses against an insured depository institution would be afforded a priority over other general unsecured claims against such an institution, including claims of debt holders of the institution, in the “liquidation or other resolution” of such an institution by any receiver. As a result, whether or not the FDIC ever sought to repudiate any debt obligations of M&T Bank or Wilmington Trust, N.A., the debt holders would be treated differently from, and could
15
Table of Contents
receive, if anything, substantially less than, the depositors of the bank. The Dodd-Frank Act created a new resolution regime (known as “orderly liquidation authority”) for systemically important financial companies, including bank holding companies and their affiliates. Under the orderly liquidation authority, the FDIC may be appointed as receiver for the systemically important institution, and its failed subsidiaries, for purposes of liquidating the entity if, among other conditions, it is determined at the time of the institution’s failure that it is in default or in danger of default and the failure poses a risk to the stability of the U.S. financial system.
If the FDIC is appointed as receiver under the orderly liquidation authority, then the powers of the receiver, and the rights and obligations of creditors and other parties who have dealt with the institution, would be determined under the Dodd-Frank Act provisions, and not under the insolvency law that would otherwise apply. The powers of the receiver under the orderly liquidation authority were based on the powers of the FDIC as receiver for depository institutions under the FDIA. However, the provisions governing the rights of creditors under the orderly liquidation authority were modified in certain respects to reduce disparities with the treatment of creditors’ claims under the U.S. Bankruptcy Code as compared to the treatment of those claims under the new authority. Nonetheless, substantial differences in the rights of creditors exist as between these two regimes, including the right of the FDIC to disregard the strict priority of creditor claims in some circumstances, the use of an administrative claims procedure to determine creditors’ claims (as opposed to the judicial procedure utilized in bankruptcy proceedings), and the right of the FDIC to transfer claims to a “bridge” entity.
An orderly liquidation fund will fund such liquidation proceedings through borrowings from the Treasury Department and risk-based assessments made, first, on entities that received more in the resolution than they would have received in liquidation to the extent of such excess, and second, if necessary, on bank holding companies with total consolidated assets of $50 billion or more, such as M&T. If an orderly liquidation is triggered, M&T could face assessments for the orderly liquidation fund.
The FDIC has developed a strategy under the orderly liquidation authority referred to as the “single point of entry” strategy, under which the FDIC would resolve a failed financial holding company by transferring its assets (including shares of its operating subsidiaries) and, potentially, very limited liabilities to a “bridge” holding company; utilize the resources of the failed financial holding company to recapitalize the operating subsidiaries; and satisfy the claims of unsecured creditors of the failed financial holding company and other claimants in the receivership by delivering securities of one or more new financial companies that would emerge from the bridge holding company. Under this strategy, management of the failed financial holding company would be replaced and shareholders and creditors of the failed financial holding company would bear the losses resulting from the failure.
Depositor Preference
Under federal law, depositors and certain claims for administrative expenses and employee compensation against an insured depository institution would be afforded a priority over other general unsecured claims against such an institution in the “liquidation or other resolution” of such an institution by any receiver. If an insured depository institution fails, insured and uninsured depositors, along with the FDIC, will have priority in payment ahead of unsecured, non-deposit creditors, including depositors whose deposits are payable only outside of the United States and the parent BHC, with respect to any extensions of credit they have made to such insured depository institution.
Financial Privacy
The federal banking regulators have adopted rules that limit the ability of banks and other financial institutions to disclose non-public information about consumers to non-affiliated third parties. These limitations require disclosure of privacy policies to consumers and, in some circumstances, allow consumers to prevent disclosure of certain personal information to a non-affiliated third party. These regulations affect how consumer information is transmitted through diversified financial companies and conveyed to outside vendors. In addition, consumers may also prevent disclosure of certain information among affiliated companies that is assembled or used to determine eligibility for a product or service, such as that shown on consumer credit reports and asset and income information
16
Table of Contents
from applications. Consumers also have the option to direct banks and other financial institutions not to share information about transactions and experiences with affiliated companies for the purpose of marketing products or services. Federal law makes it a criminal offense, except in limited circumstances, to obtain or attempt to obtain customer information of a financial nature by fraudulent or deceptive means.
Consumer Protection Laws and the Consumer Financial Protection Bureau Supervision
In connection with their respective lending and leasing activities, M&T Bank, Wilmington Trust, N.A. and certain of their subsidiaries, are each subject to a number of federal and state laws designed to protect borrowers and promote lending to various sectors of the economy. These laws include the Equal Credit Opportunity Act, the Fair Credit Reporting Act, the Fair and Accurate Credit Transactions Act, the Truth in Lending Act, the Home Mortgage Disclosure Act, and the Real Estate Settlement Procedures Act, and various state law counterparts. They are also subject to consumer protections laws governing their deposit taking activities, as well securities and insurance laws governing certain aspects of their consolidated operations. The CFPB issued new integrated disclosure requirements under the Truth-in-Lending Act and the Real Estate Settlement Procedures Act that became effective in October 2015. These requirements impose new timelines for the provision of disclosures to borrowers.
The Dodd-Frank Act established the Bureau of Consumer Financial Protection (“CFPB”) with broad powers to supervise and enforce most federal consumer protection laws. The CFPB has broad rule-making authority for a wide range of consumer protection laws that apply to all banks and savings institutions, including the authority to prohibit “unfair, deceptive or abusive” acts and practices. The CFPB has examination and enforcement authority over all banks and savings institutions with more than $10 billion in assets, including M&T Bank.
The CFPB has focused on:
| ● |
risks to consumers and compliance with the federal consumer financial laws, when it evaluates the policies and practices of a financial institution; |
| ● |
the markets in which firms operate and risks to consumers posed by activities in those markets; |
| ● |
depository institutions that offer a wide variety of consumer financial products and services; |
| ● |
depository institutions with a more specialized focus; and |
| ● |
non-depository companies that offer one or more consumer financial products or services. |
The Electronic Fund Transfer Act prohibits financial institutions from charging consumers fees for paying overdrafts on automated teller machines (“ATM”) and one-time debit card transactions, unless a consumer consents, or opts in, to the overdraft service for those type of transactions. If a consumer does not opt in, any ATM transaction or debit that overdraws the consumer’s account will be denied. Overdrafts on the payment of checks and regular electronic bill payments are not covered by this rule. Before opting in, the consumer must be provided a notice that explains the financial institution’s overdraft services, including the fees associated with the service, and the consumer’s choices. Financial institutions must provide consumers who do not opt in with the same account terms, conditions and features (including pricing) that they provide to consumers who do opt in.
Community Reinvestment Act
M&T Bank and Wilmington Trust, N.A. are subject to the provisions of the CRA. Under the terms of the CRA, each appropriate federal bank regulatory agency is required, in connection with its examination of a bank, to assess such bank’s record in assessing and meeting the credit needs of the communities served by that bank, including low- and moderate-income neighborhoods. During these examinations, the regulatory agency rates such bank’s compliance with the CRA as “Outstanding,” “Satisfactory,” “Needs to Improve” or “Substantial Noncompliance.” The regulatory agency’s assessment of the institution’s record is part of the regulatory agency’s consideration of applications to acquire, merge or consolidate with another banking institution or its holding company, or to open or relocate a branch office. Currently, M&T Bank has a CRA rating of “Outstanding” and Wilmington Trust, N.A. has a CRA rating of “Satisfactory.” In the case of a BHC applying for approval to acquire a bank or BHC, the Federal Reserve Board will assess the record of each subsidiary bank of the
17
Table of Contents
applicant BHC in considering the application, and such records may be the basis for denying the application. The Banking Law contains provisions similar to the CRA which are applicable to New York-chartered banks. Currently, M&T Bank has a CRA rating of “Outstanding” as determined by the New York State Department of Financial Services.
Bank Secrecy and Anti-Money Laundering
Federal laws and regulations impose obligations on U.S. financial institutions, including banks and broker/dealer subsidiaries, to implement and maintain appropriate policies, procedures and controls which are reasonably designed to prevent, detect and report instances of money laundering and the financing of terrorism and to verify the identity of their customers. In addition, these provisions require the federal financial institution regulatory agencies to consider the effectiveness of a financial institution’s anti-money laundering activities when reviewing bank mergers and BHC acquisitions. Failure of a financial institution to maintain and implement adequate programs to combat money laundering and terrorist financing could have serious legal and reputational consequences for the institution. As a result of an inspection by the Federal Reserve Bank of New York (“Federal Reserve Bank”), M&T and M&T Bank entered into a written agreement with the Federal Reserve Bank related to M&T Bank’s Bank Secrecy Act/Anti-Money Laundering Program. Additional information is included in Part II, Item 7 under the caption “Regulatory Oversight.”
Office of Foreign Assets Control Regulation
The United States has imposed economic sanctions that affect transactions with designated foreign countries, nationals and others. These are typically known as the “OFAC” rules based on their administration by the U.S. Treasury Department Office of Foreign Assets Control (“OFAC”). The OFAC-administered sanctions targeting countries take many different forms. Generally, however, they contain one or more of the following elements: (i) restrictions on trade with or investment in a sanctioned country, including prohibitions against direct or indirect imports from and exports to a sanctioned country and prohibitions on “U.S. persons” engaging in financial transactions relating to making investments in, or providing investment-related advice or assistance to, a sanctioned country; and (ii) a blocking of assets in which the government or specially designated nationals of the sanctioned country have an interest, by prohibiting transfers of property subject to U.S. jurisdiction (including property in the possession or control of U.S. persons). Blocked assets (e.g. property and bank deposits) cannot be paid out, withdrawn, set off or transferred in any manner without a license from OFAC. Failure to comply with these sanctions could have serious legal and reputational consequences.
Regulation of Insurers and Insurance Brokers
The Company’s operations in the areas of insurance brokerage and reinsurance of credit life insurance are subject to regulation and supervision by various state insurance regulatory authorities. Although the scope of regulation and form of supervision may vary from state to state, insurance laws generally grant broad discretion to regulatory authorities in adopting regulations and supervising regulated activities. This supervision generally includes the licensing of insurance brokers and agents and the regulation of the handling of customer funds held in a fiduciary capacity. Certain of M&T’s insurance company subsidiaries are subject to extensive regulatory supervision and to insurance laws and regulations requiring, among other things, maintenance of capital, record keeping, reporting and examinations.
Federal Reserve Policies
The earnings of the Company are significantly affected by the monetary and fiscal policies of governmental authorities, including the Federal Reserve Board. Among the instruments of monetary policy used by the Federal Reserve Board to implement these objectives are open-market operations in U.S. Government securities and federal funds, changes in the discount rate on member bank borrowings and changes in reserve requirements against member bank deposits. These instruments of monetary policy are used in varying combinations to influence the overall level of bank loans, investments and deposits, and the interest rates charged on loans and paid for deposits. The Federal Reserve Board frequently uses these instruments of monetary policy, especially its open-market operations and the discount rate, to influence the level of interest rates and to affect the strength of
18
Table of Contents
the economy, the level of inflation or the price of the dollar in foreign exchange markets. The monetary policies of the Federal Reserve Board have had a significant effect on the operating results of banking institutions in the past and are expected to continue to do so in the future. It is not possible to predict the nature of future changes in monetary and fiscal policies, or the effect which they may have on the Company’s business and earnings.
Competition
The Company competes in offering commercial and personal financial services with other banking institutions and with firms in a number of other industries, such as thrift institutions, credit unions, personal loan companies, sales finance companies, leasing companies, securities firms and insurance companies. Furthermore, diversified financial services companies are able to offer a combination of these services to their customers on a nationwide basis. The Company’s operations are significantly impacted by state and federal regulations applicable to the banking industry. Moreover, the provisions of the Gramm-Leach-Bliley Act of 1999, the Interstate Banking Act and the Banking Law have allowed for increased competition among diversified financial services providers.
Other Information
Through a link on the Investor Relations section of M&T’s website at www.mtb.com, copies of M&T’s Annual Reports on Form 10-K, Quarterly Reports on Form 10-Q and Current Reports on Form 8-K, and amendments to those reports filed or furnished pursuant to Section 13(a) or 15(d) of the Exchange Act, are made available, free of charge, as soon as reasonably practicable after electronically filing such material with, or furnishing it to, the SEC. Copies of such reports and other information are also available at no charge to any person who requests them or at www.sec.gov. Such requests may be directed to M&T Bank Corporation, Shareholder Relations Department, One M&T Plaza, 8th Floor, Buffalo, NY 14203-2399 (Telephone: (716) 842-5138). The public may read and copy any materials that M&T files with the SEC at the SEC’s Public Reference Room at 100 F Street, N.E., Washington D.C. 20549. The public may obtain information about the operation of the Public Reference Room by calling the SEC at 1-800-SEC-0330.
Corporate Governance
M&T’s Corporate Governance Standards and the following corporate governance documents are also available on M&T’s website at the Investor Relations link: Disclosure and Regulation FD Policy; Executive Committee Charter; Nomination, Compensation and Governance Committee Charter; Audit Committee Charter; Risk Committee Charter; Financial Reporting and Disclosure Controls and Procedures Policy; Code of Ethics for CEO and Senior Financial Officers; Code of Business Conduct and Ethics; Employee Complaint Procedures for Accounting and Auditing Matters; and Excessive or Luxury Expenditures Policy. Copies of such governance documents are also available, free of charge, to any person who requests them. Such requests may be directed to M&T Bank Corporation, Shareholder Relations Department, One M&T Plaza, 8th Floor, Buffalo, NY 14203-2399 (Telephone: (716) 842-5138).
Statistical Disclosure Pursuant to Guide 3
See cross-reference sheet for disclosures incorporated elsewhere in this Annual Report on Form 10-K. Additional information is included in the following tables.
19
Table of Contents
Table 1
SELECTED CONSOLIDATED YEAR-END BALANCES
| 2015 | 2014 | 2013 | 2012 | 2011 | ||||||||||||||||
| (In thousands) | ||||||||||||||||||||
|
Interest-bearing deposits at banks |
$ | 7,594,350 | $ | 6,470,867 | $ | 1,651,138 | $ | 129,945 | $ | 154,960 | ||||||||||
|
Federal funds sold |
— | 83,392 | 99,573 | 3,000 | 2,850 | |||||||||||||||
|
Trading account |
273,783 | 308,175 | 376,131 | 488,966 | 561,834 | |||||||||||||||
|
Investment securities |
||||||||||||||||||||
|
U.S. Treasury and federal agencies |
14,540,237 | 12,042,390 | 7,770,767 | 4,007,725 | 5,200,489 | |||||||||||||||
|
Obligations of states and political subdivisions |
124,459 | 157,159 | 180,495 | 203,004 | 228,949 | |||||||||||||||
|
Other |
991,743 | 793,993 | 845,235 | 1,863,632 | 2,243,716 | |||||||||||||||
|
|
|
|
|
|
|
|
|
|
|
|||||||||||
|
Total investment securities |
15,656,439 | 12,993,542 | 8,796,497 | 6,074,361 | 7,673,154 | |||||||||||||||
|
Loans and leases |
||||||||||||||||||||
|
Commercial, financial, leasing, etc. |
20,576,737 | 19,617,253 | 18,876,166 | 17,973,140 | 15,952,105 | |||||||||||||||
|
Real estate — construction |
5,183,313 | 5,061,269 | 4,457,650 | 3,772,413 | 4,203,324 | |||||||||||||||
|
Real estate — mortgage |
50,374,837 | 31,250,968 | 30,711,440 | 33,494,359 | 28,202,217 | |||||||||||||||
|
Consumer |
11,584,347 | 10,969,879 | 10,280,527 | 11,550,274 | 12,020,229 | |||||||||||||||
|
|
|
|
|
|
|
|
|
|
|
|||||||||||
|
Total loans and leases |
87,719,234 | 66,899,369 | 64,325,783 | 66,790,186 | 60,377,875 | |||||||||||||||
|
Unearned discount |
(229,735 | ) | (230,413 | ) | (252,624 | ) | (219,229 | ) | (281,870 | ) | ||||||||||
|
|
|
|
|
|
|
|
|
|
|
|||||||||||
|
Loans and leases, net of unearned discount |
87,489,499 | 66,668,956 | 64,073,159 | 66,570,957 | 60,096,005 | |||||||||||||||
|
Allowance for credit losses |
(955,992 | ) | (919,562 | ) | (916,676 | ) | (925,860 | ) | (908,290 | ) | ||||||||||
|
|
|
|
|
|
|
|
|
|
|
|||||||||||
|
Loans and leases, net |
86,533,507 | 65,749,394 | 63,156,483 | 65,645,097 | 59,187,715 | |||||||||||||||
|
Goodwill |
4,593,112 | 3,524,625 | 3,524,625 | 3,524,625 | 3,524,625 | |||||||||||||||
|
Core deposit and other intangible assets |
140,268 | 35,027 | 68,851 | 115,763 | 176,394 | |||||||||||||||
|
Real estate and other assets owned |
195,085 | 63,635 | 66,875 | 104,279 | 156,592 | |||||||||||||||
|
Total assets |
122,787,884 | 96,685,535 | 85,162,391 | 83,008,803 | 77,924,287 | |||||||||||||||
|
Noninterest-bearing deposits |
29,110,635 | 26,947,880 | 24,661,007 | 24,240,802 | 20,017,883 | |||||||||||||||
|
Interest-checking deposits |
2,939,274 | 2,307,815 | 1,989,441 | 1,979,619 | 1,912,226 | |||||||||||||||
|
Savings deposits |
46,627,370 | 41,085,803 | 36,621,580 | 33,783,947 | 31,001,083 | |||||||||||||||
|
Time deposits |
13,110,392 | 3,063,973 | 3,523,838 | 4,562,366 | 6,107,530 | |||||||||||||||
|
Deposits at Cayman Islands office |
170,170 | 176,582 | 322,746 | 1,044,519 | 355,927 | |||||||||||||||
|
|
|
|
|
|
|
|
|
|
|
|||||||||||
|
Total deposits |
91,957,841 | 73,582,053 | 67,118,612 | 65,611,253 | 59,394,649 | |||||||||||||||
|
Short-term borrowings |
2,132,182 | 192,676 | 260,455 | 1,074,482 | 782,082 | |||||||||||||||
|
Long-term borrowings |
10,653,858 | 9,006,959 | 5,108,870 | 4,607,758 | 6,686,226 | |||||||||||||||
|
Total liabilities |
106,614,595 | 84,349,639 | 73,856,859 | 72,806,210 | 68,653,078 | |||||||||||||||
|
Shareholders’ equity |
16,173,289 | 12,335,896 | 11,305,532 | 10,202,593 | 9,271,209 | |||||||||||||||
Table 2
SHAREHOLDERS, EMPLOYEES AND OFFICES
|
Number at Year-End |
2015 | 2014 | 2013 | 2012 | 2011 | |||||||||||||||
|
Shareholders |
20,693 | 14,551 | 15,015 | 15,623 | 15,959 | |||||||||||||||
|
Employees |
17,476 | 15,782 | 15,893 | 14,943 | 15,666 | |||||||||||||||
|
Offices |
863 | 766 | 796 | 799 | 849 | |||||||||||||||
20
Table of Contents
Table 3
CONSOLIDATED EARNINGS
| 2015 | 2014 | 2013 | 2012 | 2011 | ||||||||||||||||
| (In thousands) | ||||||||||||||||||||
|
Interest income |
||||||||||||||||||||
|
Loans and leases, including fees |
$ | 2,778,151 | $ | 2,596,586 | $ | 2,734,708 | $ | 2,704,156 | $ | 2,522,567 | ||||||||||
|
Investment securities |
||||||||||||||||||||
|
Fully taxable |
372,162 | 340,391 | 209,244 | 227,116 | 256,057 | |||||||||||||||
|
Exempt from federal taxes |
4,263 | 5,356 | 6,802 | 8,045 | 9,142 | |||||||||||||||
|
Deposits at banks |
15,252 | 13,361 | 5,201 | 1,221 | 2,934 | |||||||||||||||
|
Other |
1,016 | 1,183 | 1,379 | 1,147 | 1,387 | |||||||||||||||
|
|
|
|
|
|
|
|
|
|
|
|||||||||||
|
Total interest income |
3,170,844 | 2,956,877 | 2,957,334 | 2,941,685 | 2,792,087 | |||||||||||||||
|
|
|
|
|
|
|
|
|
|
|
|||||||||||
|
Interest expense |
||||||||||||||||||||
|
Interest-checking deposits |
1,404 | 1,404 | 1,287 | 1,343 | 1,145 | |||||||||||||||
|
Savings deposits |
44,736 | 45,465 | 54,948 | 68,011 | 84,314 | |||||||||||||||
|
Time deposits |
27,059 | 15,515 | 26,439 | 46,102 | 71,014 | |||||||||||||||
|
Deposits at Cayman Islands office |
615 | 699 | 1,018 | 1,130 | 962 | |||||||||||||||
|
Short-term borrowings |
1,677 | 101 | 430 | 1,286 | 1,030 | |||||||||||||||
|
Long-term borrowings |
252,766 | 217,247 | 199,983 | 225,297 | 243,866 | |||||||||||||||
|
|
|
|
|
|
|
|
|
|
|
|||||||||||
|
Total interest expense |
328,257 | 280,431 | 284,105 | 343,169 | 402,331 | |||||||||||||||
|
|
|
|
|
|
|
|
|
|
|
|||||||||||
|
Net interest income |
2,842,587 | 2,676,446 | 2,673,229 | 2,598,516 | 2,389,756 | |||||||||||||||
|
Provision for credit losses |
170,000 | 124,000 | 185,000 | 204,000 | 270,000 | |||||||||||||||
|
|
|
|
|
|
|
|
|
|
|
|||||||||||
|
Net interest income after provision for credit losses |
2,672,587 | 2,552,446 | 2,488,229 | 2,394,516 | 2,119,756 | |||||||||||||||
|
|
|
|
|
|
|
|
|
|
|
|||||||||||
|
Other income |
||||||||||||||||||||
|
Mortgage banking revenues |
375,738 | 362,912 | 331,265 | 349,064 | 166,021 | |||||||||||||||
|
Service charges on deposit accounts |
420,608 | 427,956 | 446,941 | 446,698 | 455,095 | |||||||||||||||
|
Trust income |
470,640 | 508,258 | 496,008 | 471,852 | 332,385 | |||||||||||||||
|
Brokerage services income |
64,770 | 67,212 | 65,647 | 59,059 | 56,470 | |||||||||||||||
|
Trading account and foreign exchange gains |
30,577 | 29,874 | 40,828 | 35,634 | 27,224 | |||||||||||||||
|
Gain (loss) on bank investment securities |
(130 | ) | — | 56,457 | 9 | 150,187 | ||||||||||||||
|
Total other-than-temporary impairment (“OTTI”) losses |
— | — | (1,884 | ) | (32,067 | ) | (72,915 | ) | ||||||||||||
|
Portion of OTTI losses recognized in other comprehensive income (before taxes) |
— | — | (7,916 | ) | (15,755 | ) | (4,120 | ) | ||||||||||||
|
|
|
|
|
|
|
|
|
|
|
|||||||||||
|
Net OTTI losses recognized in earnings |
— | — | (9,800 | ) | (47,822 | ) | (77,035 | ) | ||||||||||||
|
Equity in earnings of Bayview Lending Group LLC |
(14,267 | ) | (16,672 | ) | (16,126 | ) | (21,511 | ) | (24,231 | ) | ||||||||||
|
Other revenues from operations |
477,101 | 399,733 | 453,985 | 374,287 | 496,796 | |||||||||||||||
|
|
|
|
|
|
|
|
|
|
|
|||||||||||
|
Total other income |
1,825,037 | 1,779,273 | 1,865,205 | 1,667,270 | 1,582,912 | |||||||||||||||
|
|
|
|
|
|
|
|
|
|
|
|||||||||||
|
Other expense |
||||||||||||||||||||
|
Salaries and employee benefits |
1,549,530 | 1,404,950 | 1,355,178 | 1,314,540 | 1,203,993 | |||||||||||||||
|
Equipment and net occupancy |
272,539 | 269,299 | 264,327 | 257,551 | 249,514 | |||||||||||||||
|
Printing, postage and supplies |
38,491 | 38,201 | 39,557 | 41,929 | 40,917 | |||||||||||||||
|
Amortization of core deposit and other intangible assets |
26,424 | 33,824 | 46,912 | 60,631 | 61,617 | |||||||||||||||
|
FDIC assessments |
52,113 | 55,531 | 69,584 | 101,110 | 100,230 | |||||||||||||||
|
Other costs of operations |
883,835 | 887,669 | 812,308 | 693,990 | 785,608 | |||||||||||||||
|
|
|
|
|
|
|
|
|
|
|
|||||||||||
|
Total other expense |
2,822,932 | 2,689,474 | 2,587,866 | 2,469,751 | 2,441,879 | |||||||||||||||
|
|
|
|
|
|
|
|
|
|
|
|||||||||||
|
Income before income taxes |
1,674,692 | 1,642,245 | 1,765,568 | 1,592,035 | 1,260,789 | |||||||||||||||
|
Income taxes |
595,025 | 575,999 | 627,088 | 562,537 | 401,310 | |||||||||||||||
|
|
|
|
|
|
|
|
|
|
|
|||||||||||
|
Net income |
$ | 1,079,667 | $ | 1,066,246 | $ | 1,138,480 | $ | 1,029,498 | $ | 859,479 | ||||||||||
|
|
|
|
|
|
|
|
|
|
|
|||||||||||
|
Dividends declared |
||||||||||||||||||||
|
Common |
$ | 374,912 | $ | 371,137 | $ | 365,171 | $ | 357,862 | $ | 350,196 | ||||||||||
|
Preferred |
81,270 | 75,878 | 53,450 | 53,450 | 48,203 | |||||||||||||||
21
Table of Contents
Table 4
COMMON SHAREHOLDER DATA
| 2015 | 2014 | 2013 | 2012 | 2011 | ||||||||||||||||
|
Per share |
||||||||||||||||||||
|
Net income |
||||||||||||||||||||
|
Basic |
$ | 7.22 | $ | 7.47 | $ | 8.26 | $ | 7.57 | $ | 6.37 | ||||||||||
|
Diluted |
7.18 | 7.42 | 8.20 | 7.54 | 6.35 | |||||||||||||||
|
Cash dividends declared |
2.80 | 2.80 | 2.80 | 2.80 | 2.80 | |||||||||||||||
|
Common shareholders’ equity at year-end |
93.60 | 83.88 | 79.81 | 72.73 | 66.82 | |||||||||||||||
|
Tangible common shareholders’ equity at year-end |
64.28 | 57.06 | 52.45 | 44.61 | 37.79 | |||||||||||||||
|
Dividend payout ratio |
37.56 | % | 37.49 | % | 33.94 | % | 36.98 | % | 44.15 | % | ||||||||||
Table 5
CHANGES IN INTEREST INCOME AND EXPENSE(a)
| 2015 Compared with 2014 | 2014 Compared with 2013 | |||||||||||||||||||||||
|
Total
Change |
Resulting from
Changes in: |
Total
Change |
Resulting from
Changes in: |
|||||||||||||||||||||
| Volume | Rate | Volume | Rate | |||||||||||||||||||||
| (Increase (decrease) in thousands) | ||||||||||||||||||||||||
|
Interest income |
||||||||||||||||||||||||
|
Loans and leases, including fees |
$ | 182,975 | 248,119 | (65,144 | ) | $ | (138,676 | ) | (16,282 | ) | (122,394 | ) | ||||||||||||
|
Deposits at banks |
1,891 | 1,267 | 624 | 8,160 | 7,938 | 222 | ||||||||||||||||||
|
Federal funds sold and agreements to resell securities |
(29 | ) | (48 | ) | 19 | (50 | ) | (29 | ) | (21 | ) | |||||||||||||
|
Trading account |
(134 | ) | 169 | (303 | ) | (101 | ) | (27 | ) | (74 | ) | |||||||||||||
|
Investment securities |
||||||||||||||||||||||||
|
U.S. Treasury and federal agencies |
32,695 | 77,565 | (44,870 | ) | 138,299 | 158,630 | (20,331 | ) | ||||||||||||||||
|
Obligations of states and political subdivisions |
(1,724 | ) | (1,052 | ) | (672 | ) | (1,884 | ) | (1,395 | ) | (489 | ) | ||||||||||||
|
Other |
(886 | ) | (20 | ) | (866 | ) | (7,534 | ) | (19,986 | ) | 12,452 | |||||||||||||
|
|
|
|
|
|||||||||||||||||||||
|
Total interest income |
$ | 214,788 | $ | (1,786 | ) | |||||||||||||||||||
|
|
|
|
|
|||||||||||||||||||||
|
Interest expense |
||||||||||||||||||||||||
|
Interest-bearing deposits |
||||||||||||||||||||||||
|
Interest-checking deposits |
$ | — | 323 | (323 | ) | $ | 117 | 117 | — | |||||||||||||||
|
Savings deposits |
(729 | ) | 2,708 | (3,437 | ) | (9,483 | ) | 5,494 | (14,977 | ) | ||||||||||||||
|
Time deposits |
11,544 | 7,356 | 4,188 | (10,924 | ) | (4,401 | ) | (6,523 | ) | |||||||||||||||
|
Deposits at Cayman Islands office |
(84 | ) | (273 | ) | 189 | (319 | ) | (319 | ) | — | ||||||||||||||
|
Short-term borrowings |
1,576 | 363 | 1,213 | (329 | ) | (149 | ) | (180 | ) | |||||||||||||||
|
Long-term borrowings |
35,519 | 71,014 | (35,495 | ) | 17,264 | 84,315 | (67,051 | ) | ||||||||||||||||
|
|
|
|
|
|||||||||||||||||||||
|
Total interest expense |
$ | 47,826 | $ | (3,674 | ) | |||||||||||||||||||
|
|
|
|
|
|||||||||||||||||||||
| (a) | Interest income data are on a taxable-equivalent basis. The apportionment of changes resulting from the combined effect of both volume and rate was based on the separately determined volume and rate changes. |
| Item 1A. | Risk Factors. |
M&T and its subsidiaries could be adversely impacted by various risks and uncertainties which are difficult to predict. As a financial institution, the Company has significant exposure to market risk, including interest-rate risk, liquidity risk and credit risk, among others. Adverse experience with
22
Table of Contents
these or other risks could have a material impact on the Company’s financial condition and results of operations, as well as on the value of the Company’s financial instruments in general, and M&T’s common stock, in particular.
Weakness in the economy has adversely affected the Company in the past and may adversely affect the Company in the future.
Poor business and economic conditions in general or specifically in markets served by the Company could have one or more of the following adverse effects on the Company’s business:
| ● |
A decrease in the demand for loans and other products and services offered by the Company. |
| ● |
A decrease in net interest income derived from the Company’s lending and deposit gathering activities. |
| ● |
A decrease in the value of the Company’s investment securities, loans held for sale or other assets secured by residential or commercial real estate. |
| ● |
Other-than-temporary impairment of investment securities in the Company’s investment securities portfolio. |
| ● |
A decrease in fees from the Company’s brokerage and trust businesses associated with declines or lack of growth in stock market prices. |
| ● |
Potential higher FDIC assessments due to the DIF falling below minimum required levels. |
| ● |
An impairment of certain intangible assets, such as goodwill. |
| ● |
An increase in the number of customers and counterparties who become delinquent, file for protection under bankruptcy laws or default on their loans or other obligations to the Company. An increase in the number of delinquencies, bankruptcies or defaults could result in higher levels of nonperforming assets, net charge-offs, provision for credit losses and valuation adjustments on loans held for sale . |
The Company’s business and financial performance is impacted significantly by market interest rates and movements in those rates. The monetary, tax and other policies of governmental agencies, including the Federal Reserve, have a significant impact on interest rates and overall financial market performance over which the Company has no control and which the Company may not be able to anticipate adequately .
As a result of the high percentage of the Company’s assets and liabilities that are in the form of interest-bearing or interest-related instruments, changes in interest rates, in the shape of the yield curve or in spreads between different market interest rates, can have a material effect on the Company’s business and profitability and the value of the Company’s assets and liabilities. For example:
| ● |
Changes in interest rates or interest rate spreads can affect the difference between the interest that the Company earns on assets and the interest that the Company pays on liabilities, which impacts the Company’s overall net interest income and profitability. |
| ● |
Such changes can affect the ability of borrowers to meet obligations under variable or adjustable rate loans and other debt instruments, and can, in turn, affect the Company’s loss rates on those assets. |
| ● |
Such changes may decrease the demand for interest rate based products and services, including loans and deposits. |
| ● |
Such changes can also affect the Company’s ability to hedge various forms of market and interest rate risk and may decrease the profitability or protection or increase the risk or cost associated with such hedges. |
| ● |
Movements in interest rates also affect mortgage prepayment speeds and could result in the impairment of capitalized mortgage servicing assets, reduce the value of loans held for sale and increase the volatility of mortgage banking revenues, potentially adversely affecting the Company’s results of operations. |
The monetary, tax and other policies of the government and its agencies, including the Federal Reserve, have a significant impact on interest rates and overall financial market performance. These governmental policies can thus affect the activities and results of operations of banking companies such as the Company. An important function of the Federal Reserve is to regulate the national supply
23
Table of Contents
of bank credit and certain interest rates. The actions of the Federal Reserve influence the rates of interest that the Company charges on loans and that the Company pays on borrowings and interest-bearing deposits and can also affect the value of the Company’s on-balance sheet and off-balance sheet financial instruments. Also, due to the impact on rates for short-term funding, the Federal Reserve’s policies also influence, to a significant extent, the Company’s cost of such funding. In addition, the Company is routinely subject to examinations from various governmental taxing authorities. Such examinations may result in challenges to the tax return treatment applied by the Company to specific transactions. Management believes that the assumptions and judgment used to record tax-related assets or liabilities have been appropriate. Should tax laws change or the tax authorities determine that management’s assumptions were inappropriate, the result and adjustments required could have a material effect on the Company’s results of operations. M&T cannot predict the nature or timing of future changes in monetary, tax and other policies or the effect that they may have on the Company’s business activities, financial condition and results of operations.
The Company’s business and performance is vulnerable to the impact of volatility in debt and equity markets.
As most of the Company’s assets and liabilities are financial in nature, the Company’s performance tends to be sensitive to the performance of the financial markets. Turmoil and volatility in U.S. and global financial markets can be a major contributory factor to overall weak economic conditions, leading to some of the risks discussed herein, including the impaired ability of borrowers and other counterparties to meet obligations to the Company. Financial market volatility also can have some of the following adverse effects on the Company and its business, including adversely affecting the Company’s financial condition and results of operations:
| ● |
It can affect the value or liquidity of the Company’s on-balance sheet and off-balance sheet financial instruments. |
| ● |
It can affect the value of capitalized servicing assets. |
| ● |
It can affect M&T’s ability to access capital markets to raise funds. Inability to access capital markets if needed, at cost effective rates, could adversely affect the Company’s liquidity and results of operations. |
| ● |
It can affect the value of the assets that the Company manages or otherwise administers or services for others. Although the Company is not directly impacted by changes in the value of such assets, decreases in the value of those assets would affect related fee income and could result in decreased demand for the Company’s services. |
| ● |
In general, it can impact the nature, profitability or risk profile of the financial transactions in which the Company engages. |
Volatility in the markets for real estate and other assets commonly securing financial products has been and may continue to be a significant contributor to overall volatility in financial markets.
The Company’s regional concentrations expose it to adverse economic conditions in its primary retail banking office footprint.
The Company’s core banking business is largely concentrated within the Company’s retail banking office network footprint, located principally in New York, Maryland, New Jersey, Pennsylvania, Delaware, Connecticut, Virginia, West Virginia and the District of Columbia. Therefore, the Company is, or in the future may be, particularly vulnerable to adverse changes in economic conditions in the Northeast and Mid-Atlantic regions.
Risks Relating to the Regulatory Environment
The Company is subject to extensive government regulation and supervision and this regulatory environment is being significantly impacted by the financial regulatory reform initiatives in the United States, including the Dodd-Frank Act and related regulations.
The Company is subject to extensive federal and state regulation and supervision. Banking regulations are primarily intended to protect depositors’ funds, federal deposit insurance funds and the financial system as a whole, not stockholders. These regulations and supervisory guidance affect
24
Table of Contents
the Company’s lending practices, capital structure, amounts of capital, investment practices, dividend policy and growth, among other things. Failure to comply with laws, regulations, policies or supervisory guidance could result in civil or criminal penalties, including monetary penalties, the loss of FDIC insurance, the revocation of a banking charter, other sanctions by regulatory agencies, and/or reputation damage, which could have a material adverse effect on the Company’s business, financial condition and results of operations. In this regard, government authorities, including the bank regulatory agencies, are pursuing aggressive enforcement actions with respect to compliance and other legal matters involving financial activities, which heightens the risks associated with actual and perceived compliance failures and may also adversely affect the Company’s ability to enter into certain transactions or engage in certain activities, or obtain necessary regulatory approvals in connection therewith.
The United States government and others have recently undertaken major reforms of the regulatory oversight structure of the financial services industry. M&T expects to face increased regulation of its industry as a result of current and possible future initiatives. M&T also expects more intense scrutiny in the examination process and more aggressive enforcement of regulations on both the federal and state levels. Compliance with these new regulations and supervisory initiatives will likely increase the Company’s costs, reduce its revenue and may limit its ability to pursue certain desirable business opportunities.
Not all of the rules required or expected to be implemented under the Dodd-Frank Act have been proposed or adopted, and certain of the rules that have been proposed or adopted under the Dodd-Frank Act are subject to phase-in or transitional periods. Reforms, both under the Dodd-Frank Act and otherwise, will have a significant effect on the entire financial services industry. Although it is difficult to predict the magnitude and extent of these effects, M&T believes compliance with new regulations and other initiatives will likely negatively impact revenue and increase the cost of doing business, both in terms of transition expenses and on an ongoing basis, and may also limit M&T’s ability to pursue certain desirable business opportunities. Any new regulatory requirements or changes to existing requirements could require changes to the Company’s businesses, result in increased compliance costs and affect the profitability of such businesses. Additionally, reform could affect the behaviors of third parties that the Company deals with in the course of its business, such as rating agencies, insurance companies and investors. Heightened regulatory practices, requirements or expectations could affect the Company in substantial and unpredictable ways, and, in turn, could have a material adverse effect on the Company’s business, financial condition and results of operations.
New capital and liquidity standards adopted by the U.S. banking regulators have resulted in banks and bank holding companies needing to maintain more and higher quality capital and greater liquidity than has historically been the case.
New capital standards, both as a result of the Dodd-Frank Act and the new U.S. Basel III-based capital rules have had a significant effect on banks and bank holding companies, including M&T. The new U.S. capital rules require bank holding companies and their bank subsidiaries to maintain substantially more capital, with a greater emphasis on common equity. For additional information, see “Capital Requirements” under Part I, Item 1 “Business.”
The need to maintain more and higher quality capital, as well as greater liquidity, going forward than historically has been required, and generally increased regulatory scrutiny with respect to capital levels, could limit the Company’s business activities, including lending, and its ability to expand, either organically or through acquisitions. It could also result in M&T being required to take steps to increase its regulatory capital that may be dilutive to shareholders or limit its ability to pay dividends or otherwise return capital to shareholders, or sell or refrain from acquiring assets, the capital requirements for which are not justified by the assets’ underlying risks.
In addition, the new U.S. final Basel III-based liquidity coverage ratio requirement and the liquidity-related provisions of the Federal Reserve’s liquidity-related enhanced prudential supervision requirements adopted pursuant to Section 165 of Dodd-Frank require the Company to hold increased levels of unencumbered highly liquid investments, thereby reducing the Company’s ability to invest in other longer-term assets even if deemed more desirable from a balance sheet management perspective. Moreover, U.S. federal banking agencies have been taking into account expectations regarding the ability of banks to meet these new requirements, including under stressed
25
Table of Contents
conditions, in approving actions that represent uses of capital, such as dividend increases, share repurchases and acquisitions.
The effect of resolution plan requirements may have a material adverse impact on M&T.
Bank holding companies with consolidated assets of $50 billion or more, such as M&T, are required to report periodically to regulators a resolution plan for their rapid and orderly resolution in the event of material financial distress or failure. M&T’s resolution plan must, among other things, ensure that its depository institution subsidiaries are adequately protected from risks arising from its other subsidiaries. The regulation adopted by the Federal Reserve and FDIC sets specific standards for the resolution plans, including requiring a strategic analysis of the plan’s components, a description of the range of specific actions the Company proposes to take in resolution, and a description of the Company’s organizational structure, material entities, interconnections and interdependencies, and management information systems, among other elements. To address effectively any shortcomings in the Company’s resolution plan, the Federal Reserve and the FDIC could require the Company to change its business structure or dispose of businesses, which could have a material adverse effect on its liquidity and ability to pay dividends on its stock or interest and principal on its debt.
Risks Relating to the Company’s Business
Deteriorating credit quality could adversely impact the Company.
As a lender, the Company is exposed to the risk that customers will be unable to repay their loans in accordance with the terms of the agreements, and that any collateral securing the loans may be insufficient to assure full repayment. Credit losses are inherent in the business of making loans.
Factors that influence the Company’s credit loss experience include overall economic conditions affecting businesses and consumers, generally, but also residential and commercial real estate valuations, in particular, given the size of the Company’s real estate loan portfolios. Factors that can influence the Company’s credit loss experience include: (i) the impact of residential real estate values on loans to residential real estate builders and developers and other loans secured by residential real estate; (ii) the concentrations of commercial real estate loans in the Company’s loan portfolio; (iii) the amount of commercial and industrial loans to businesses in areas of New York State outside of the New York City area and in central Pennsylvania that have historically experienced less economic growth and vitality than many other regions of the country; (iv) the repayment performance associated with first and second lien loans secured by residential real estate; and (v) the size of the Company’s portfolio of loans to individual consumers, which historically have experienced higher net charge-offs as a percentage of loans outstanding than loans to other types of borrowers.
Commercial real estate valuations can be highly subjective as they are based upon many assumptions. Such valuations can be significantly affected over relatively short periods of time by changes in business climate, economic conditions, interest rates and, in many cases, the results of operations of businesses and other occupants of the real property. Similarly, residential real estate valuations can be impacted by housing trends, the availability of financing at reasonable interest rates, governmental policy regarding housing and housing finance and general economic conditions affecting consumers.
The Company maintains an allowance for credit losses which represents, in management’s judgment, the amount of losses inherent in the loan and lease portfolio. The allowance is determined by management’s evaluation of the loan and lease portfolio based on such factors as the differing economic risks associated with each loan category, the current financial condition of specific borrowers, the economic environment in which borrowers operate, the level of delinquent loans, the value of any collateral and, where applicable, the existence of any guarantees or indemnifications. The effects of probable decreases in expected principal cash flows on loans acquired at a discount are also considered in the establishment of the allowance for credit losses.
Management believes that the allowance for credit losses appropriately reflects credit losses inherent in the loan and lease portfolio. However, there is no assurance that the allowance will be sufficient to cover such credit losses, particularly if housing and employment conditions worsen or the economy experiences a downturn. In those cases, the Company may be required to increase the allowance through an increase in the provision for credit losses, which would reduce net income.
26
Table of Contents
The Company must maintain adequate sources of funding and liquidity.
The Company must maintain adequate funding sources in the normal course of business to support its operations and fund outstanding liabilities, as well as meet regulatory expectations. The Company primarily relies on deposits to be a low cost and stable source of funding for the loans it makes and the operations of its business. Core customer deposits, which include noninterest-bearing deposits, interest-bearing transaction accounts, savings deposits and time deposits of $250,000 or less, have historically provided the Company with a sizeable source of relatively stable and low-cost funds. In addition to customer deposits, sources of liquidity include borrowings from third party banks, securities dealers, various Federal Home Loan Banks and the Federal Reserve Bank of New York.
The Company’s liquidity and ability to fund and run the business could be materially adversely affected by a variety of conditions and factors, including financial and credit market disruptions and
volatility or a lack of market or customer confidence in financial markets in general, which may result in a loss of customer deposits or outflows of cash or collateral and/or ability to access capital markets on favorable terms.
Other conditions and factors that could materially adversely affect the Company’s liquidity and funding include a lack of market or customer confidence in, or negative news about, the Company or the financial services industry generally which also may result in a loss of deposits and/or negatively affect the ability to access the capital markets; the loss of customer deposits to alternative investments; inability to sell or securitize loans or other assets; and downgrades in one or more of the Company’s credit ratings. A downgrade in the Company’s credit ratings, which could result from general industry-wide or regulatory factors not solely related to the Company, could adversely affect the Company’s ability to borrow funds and raise the cost of borrowings substantially and could cause creditors and business counterparties to raise collateral requirements or take other actions that could adversely affect M&T’s ability to raise capital. Many of the above conditions and factors may be caused by events over which M&T has little or no control. There can be no assurance that significant disruption and volatility in the financial markets will not occur in the future.
Recent regulatory changes relating to liquidity and risk management have also negatively impacted the Company’s results of operations and competitive position. These regulations address, among other matters, liquidity stress testing, minimum liquidity requirements and restrictions on short-term debt issued by top-tier holding companies.
If the Company is unable to continue to fund assets through customer bank deposits or access funding sources on favorable terms or if the Company suffers an increase in borrowing costs or otherwise fails to manage liquidity effectively, the Company’s liquidity, operating margins, financial condition and results of operations may be materially adversely affected.
The financial services industry is highly competitive and creates competitive pressures that could adversely affect the Company’s revenue and profitability.
The financial services industry in which the Company operates is highly competitive. The Company competes not only with commercial and other banks and thrifts, but also with insurance companies, mutual funds, hedge funds, securities brokerage firms and other companies offering financial services in the U.S., globally and over the Internet. The Company competes on the basis of several factors, including capital, access to capital, revenue generation, products, services, transaction execution, innovation, reputation and price. Over time, certain sectors of the financial services industry have become more concentrated, as institutions involved in a broad range of financial services have been acquired by or merged into other firms. These developments could result in the Company’s competitors gaining greater capital and other resources, such as a broader range of products and services and geographic diversity. The Company may experience pricing pressures as a result of these factors and as some of its competitors seek to increase market share by reducing prices or paying higher rates of interest on deposits. Finally, technological change is influencing how individuals and firms conduct their financial affairs and changing the delivery channels for financial services, with the result that the Company may have to contend with a broader range of competitors including many that are not located within the geographic footprint of its banking office network.
27
Table of Contents
M&T may be adversely affected by the soundness of other financial institutions.
Financial services institutions are interrelated as a result of trading, clearing, counterparty, or other relationships. The Company has exposure to many different industries and counterparties, and routinely executes transactions with counterparties in the financial services industry, including commercial banks, brokers and dealers, investment banks, and other institutional clients. Many of these transactions expose the Company to credit risk in the event of a default by a counterparty or client. In addition, the Company’s credit risk may be exacerbated when the collateral held by the Company cannot be realized or is liquidated at prices not sufficient to recover the full amount of the credit or derivative exposure due to the Company. Any such losses could have a material adverse effect on the Company’s financial condition and results of operations.
M&T relies on dividends from its subsidiaries for its liquidity.
M&T is a separate and distinct legal entity from its subsidiaries. M&T typically receives substantially all of its revenue from subsidiary dividends. These dividends are the principal source of funds to pay dividends on M&T stock and interest and principal on its debt. Various federal and/or state laws and regulations, as well as regulatory expectations, limit the amount of dividends that M&T’s banking subsidiaries and certain nonbank subsidiaries may pay. Regulatory scrutiny of capital levels at bank holding companies and insured depository institution subsidiaries has increased in recent years and has resulted in increased regulatory focus on all aspects of capital planning, including dividends and other distributions to shareholders of banks, such as parent bank holding companies. See “Item 1. Business — Dividends” for a discussion of regulatory and other restrictions on dividend declarations. Also, M&T’s right to participate in a distribution of assets upon a subsidiary’s liquidation or reorganization is subject to the prior claims of that subsidiary’s creditors. Limitations on M&T’s ability to receive dividends from its subsidiaries could have a material adverse effect on its liquidity and ability to pay dividends on its stock or interest and principal on its debt.
M&T’s ability to pay dividends on common stock may be adversely affected by market and other factors outside of its control and will depend, in part, on a review of its capital plan by the Federal Reserve.
Federal Reserve capital planning and stress testing rules generally limit a bank holding company’s ability to make quarterly capital distributions – that is, dividends and share repurchases – if the amount of actual cumulative quarterly capital issuances of instruments that qualify as regulatory capital are less than the bank holding company had indicated in its submitted capital plan as to which it received a non-objection from the Federal Reserve. Under these rules, for example, if a bank holding company issued a smaller amount of additional common stock than it had stated in its capital plan, it would be required to reduce common dividends and/or the amount of common stock repurchases so that the dollar amount of capital distributions, net of the dollar amount of additional common stock issued (“net distributions”), is no greater than the dollar amount of net distributions relating to its common stock included in its capital plan, as measured on an aggregate basis beginning in the third quarter of the nine-quarter planning horizon through the end of the then current quarter. As such, M&T’s ability to declare and pay dividends on its common stock, as well as the amount of such dividends, will depend, in part, on its ability to issue stock as per its capital plan or to otherwise remain in compliance with its capital plan, which may be adversely affected by market and other factors outside of M&T’s control.
The Company is subject to operational risk.
Like all businesses, the Company is subject to operational risk, which represents the risk of loss resulting from human error, inadequate or failed internal processes and systems, and external events. Operational risk also encompasses reputational risk and compliance and legal risk, which is the risk of loss from violations of, or noncompliance with, laws, rules, regulations, prescribed practices or ethical standards, as well as the risk of noncompliance with contractual and other obligations. The Company is also exposed to operational risk through outsourcing arrangements, and the effect that changes in circumstances or capabilities of its outsourcing vendors can have on the Company’s ability to continue to perform operational functions necessary to its business. In addition, along with
28
Table of Contents
other participants in the financial services industry, the Company frequently attempts to introduce new technology-driven products and services that are aimed at allowing the Company to better serve customers and to reduce costs. The Company may not be able to effectively implement new technology-driven products and services that allows it to remain competitive or be successful in marketing these products and services to its customers. Although the Company seeks to mitigate operational risk through a system of internal controls that are reviewed and updated, no system of controls, however well designed and maintained, is infallible. Control weaknesses or failures or other operational risks could result in charges, increased operational costs, harm to the Company’s reputation or foregone business opportunities.
Changes in accounting standards could impact the Company’s financial condition and results of operations.
The accounting standard setters, including the Financial Accounting Standards Board (“FASB”), the SEC and other regulatory bodies, periodically change the financial accounting and reporting standards that govern the preparation of the Company’s consolidated financial statements. These changes can be hard to predict and can materially impact how the Company records and reports its financial condition and results of operations. In some cases, the Company could be required to apply a new or revised standard retroactively, which would result in the restating of the Company’s prior period financial statements.
M&T’s accounting policies and processes are critical to the reporting of the Company’s financial condition and results of operations. They require management to make estimates about matters that are uncertain.
Accounting policies and processes are fundamental to the Company’s reported financial condition and results of operations. Some of these policies require use of estimates and assumptions that may affect the reported amounts of assets or liabilities and financial results. Several of M&T’s accounting policies are critical because they require management to make difficult, subjective and complex judgments about matters that are inherently uncertain and because it is likely that materially different amounts would be reported under different conditions or using different assumptions. Pursuant to generally accepted accounting principles (“GAAP”), management is required to make certain assumptions and estimates in preparing the Company’s financial statements. If assumptions or estimates underlying the Company’s financial statements are incorrect, the Company may experience material losses.
Management has identified certain accounting policies as being critical because they require management’s judgment to ascertain the valuations of assets, liabilities, commitments and contingencies. A variety of factors could affect the ultimate value that is obtained either when earning income, recognizing an expense, recovering an asset, valuing an asset or liability, or recognizing or reducing a liability. M&T has established detailed policies and control procedures that are intended to ensure these critical accounting estimates and judgments are well controlled and applied consistently. In addition, the policies and procedures are intended to ensure that the process for changing methodologies occurs in an appropriate manner. Because of the uncertainty surrounding judgments and the estimates pertaining to these matters, M&T could be required to adjust accounting policies or restate prior period financial statements if those judgments and estimates prove to be incorrect. For additional information, see Part II, Item 7, Management’s Discussion and Analysis of Financial Condition and Results of Operations, “Critical Accounting Estimates” and Note 1, “Significant Accounting Policies,” of Notes to Financial Statements in Part II, Item 8.
Difficulties in combining the operations of acquired entities with the Company’s own operations may prevent M&T from achieving the expected benefits from its acquisitions.
M&T has recently expanded its business through acquisition and may do so in the future. Inherent uncertainties exist when integrating the operations of an acquired entity. M&T may not be able to fully achieve its strategic objectives and planned operating efficiencies in an acquisition. In addition, the markets and industries in which the Company and its actual or potential acquisition targets operate are highly competitive. The Company may lose customers or fail to retain the customers of
29
Table of Contents
acquired entities as a result of an acquisition. Acquisition and integration activities require M&T to devote substantial time and resources, and as a result M&T may not be able to pursue other business opportunities while integrating acquired entities with the Company.
After completing an acquisition, the Company may not realize the expected benefits of the acquisition due to lower financial results pertaining to the acquired entity. For example, the Company could experience higher credit losses, incur higher operating expenses or realize less revenue than originally anticipated related to an acquired entity.
M&T could suffer if it fails to attract and retain skilled personnel.
M&T’s success depends, in large part, on its ability to attract and retain key individuals. Competition for qualified candidates in the activities and markets that the Company serves is significant and the Company may not be able to hire candidates and retain them. Growth in the Company’s business, including through acquisitions, may increase its need for additional qualified personnel. If the Company is not able to hire or retain these key individuals, it may be unable to execute its business strategies and may suffer adverse consequences to its business, financial condition and results of operations.
The federal banking agencies have issued joint guidance on executive compensation designed to help ensure that a banking organization’s incentive compensation policies do not encourage imprudent risk taking and are consistent with the safety and soundness of the organization. In addition, the Dodd-Frank Act required those agencies, along with the SEC, to adopt rules to require reporting of incentive compensation and to prohibit certain compensation arrangements. If as a result of complying with such rules the Company is unable to attract and retain qualified employees, or do so at rates necessary to maintain its competitive position, or if the compensation costs required to attract and retain employees become more significant, the Company’s performance, including its competitive position, could be materially adversely affected.
Severe weather, natural disasters, acts of war or terrorism and other external events could significantly impact the Company’s business.
Severe weather, natural disasters, acts of war or terrorism and other adverse external events could have a significant impact on the Company’s ability to conduct business. Such events could affect the stability of the Company’s deposit base, impair the ability of borrowers to repay outstanding loans, impair the value of collateral securing loans, cause significant property damage, result in loss of revenue and/or cause the Company to incur additional expenses. Although the Company has established disaster recovery plans and procedures, and monitors for significant environmental effects on its properties or its investments, the occurrence of any such event could have a material adverse effect on the Company.
The Company’s information systems may experience interruptions or breaches in security.
The Company relies heavily on communications and information systems to conduct its business. Any failure, interruption or breach in security of these systems could result in disruptions to its accounting, deposit, loan and other systems, and adversely affect the Company’s customer relationships. While the Company has policies and procedures designed to prevent or limit the effect of these possible events, there can be no assurance that any such failure, interruption or security breach will not occur or, if any does occur, that it can be sufficiently or timely remediated.
There have been increasing efforts on the part of third parties, including through cyber attacks, to breach data security at financial institutions or with respect to financial transactions. There have been several instances involving financial services and consumer-based companies reporting unauthorized access to and disclosure of client or customer information or the destruction or theft of corporate data, including by executive impersonation and third party vendors. In addition, because the techniques used to cause such security breaches change frequently, often are not recognized until launched against a target and may originate from less regulated and remote areas around the world, the Company may be unable to proactively address these techniques or to implement adequate preventative measures. The ability of the Company’s customers to bank remotely, including online and through mobile devices, requires secure transmission of confidential information and increases the risk of data security breaches.
30
Table of Contents
The occurrence of any failure, interruption or security breach of the Company’s systems, particularly if widespread or resulting in financial losses to customers, could damage the Company’s reputation, result in a loss of customer business, subject it to additional regulatory scrutiny, or expose it to civil litigation and financial liability.
The Company is or may become involved from time to time in suits, legal proceedings, information-gathering requests, investigations and proceedings by governmental and self-regulatory agencies that may lead to adverse consequences.
Many aspects of the Company’s business involve substantial risk of legal liability. M&T and/or its subsidiaries have been named or threatened to be named as defendants in various lawsuits arising from its or its subsidiaries’ business activities (and in some cases from the activities of companies M&T has acquired). In addition, from time to time, M&T is, or may become, the subject of governmental and self-regulatory agency information-gathering requests, reviews, investigations and proceedings and other forms of regulatory inquiry, including by bank and other regulatory agencies, the SEC and law enforcement authorities. The SEC has announced a policy of seeking admissions of liability in certain settled cases, which could adversely impact the defense of private litigation. M&T is also at risk when it has agreed to indemnify others for losses related to legal proceedings, including for litigation and governmental investigations and inquiries, such as in connection with the purchase or sale of a business or assets. The results of such proceedings could lead to significant civil or criminal penalties, including monetary penalties, damages, adverse judgments, settlements, fines, injunctions, restrictions on the way in which the Company conducts its business, or reputational harm.
Although the Company establishes accruals for legal proceedings when information related to the loss contingencies represented by those matters indicates both that a loss is probable and that the amount of loss can be reasonably estimated, the Company does not have accruals for all legal proceedings where it faces a risk of loss. In addition, due to the inherent subjectivity of the assessments and unpredictability of the outcome of legal proceedings, amounts accrued may not represent the ultimate loss to the Company from the legal proceedings in question. Thus, the Company’s ultimate losses may be higher, and possibly significantly so, than the amounts accrued for legal loss contingencies, which could adversely affect the Company’s financial condition and results of operations.
M&T relies on other companies to provide key components of the Company’s business infrastructure.
Third parties provide key components of the Company’s business infrastructure such as banking services, processing, and Internet connections and network access. Any disruption in such services provided by these third parties or any failure of these third parties to handle current or higher volumes of use could adversely affect the Company’s ability to deliver products and services to clients and otherwise to conduct business. Technological or financial difficulties of a third party service provider could adversely affect the Company’s business to the extent those difficulties result in the interruption or discontinuation of services provided by that party. The Company may not be insured against all types of losses as a result of third party failures and insurance coverage may be inadequate to cover all losses resulting from system failures or other disruptions. Failures in the Company’s business infrastructure could interrupt the operations or increase the costs of doing business.
Detailed discussions of the specific risks outlined above and other risks facing the Company are included within this Annual Report on Form 10-K in Part I, Item 1 “Business,” and Part II, Item 7 “Management’s Discussion and Analysis of Financial Condition and Results of Operations.” Furthermore, in Part II, Item 7 under the heading “Forward-Looking Statements” is included a description of certain risks, uncertainties and assumptions identified by management that are difficult to predict and that could materially affect the Company’s financial condition and results of operations, as well as the value of the Company’s financial instruments in general, and M&T common stock, in particular.
In addition, the market price of M&T common stock may fluctuate significantly in response to a number of other factors, including changes in securities analysts’ estimates of financial performance, volatility of stock market prices and volumes, rumors or erroneous information,
31
Table of Contents
changes in market valuations of similar companies and changes in accounting policies or procedures as may be required by the FASB or other regulatory agencies.
| Item 1B. | Unresolved Staff Comments. |
None.
| Item 2. | Properties. |
Both M&T and M&T Bank maintain their executive offices at One M&T Plaza in Buffalo, New York. This twenty-one story headquarters building, containing approximately 300,000 rentable square feet of space, is owned in fee by M&T Bank and was completed in 1967. M&T, M&T Bank and their subsidiaries occupy approximately 98% of the building and the remainder is leased to non-affiliated tenants. At December 31, 2015, the cost of this property (including improvements subsequent to the initial construction), net of accumulated depreciation, was $11.2 million.
M&T Bank owns an additional facility in Buffalo, New York (known as M&T Center) with approximately 395,000 rentable square feet of space. Approximately 89% of this facility is occupied by M&T Bank and its subsidiaries, with the remainder leased to non-affiliated tenants. At December 31, 2015, the cost of this building (including improvements subsequent to acquisition), net of accumulated depreciation, was $8.8 million.
M&T Bank also owns and occupies three separate facilities in the Buffalo area which support certain back-office and operations functions of the Company. The total square footage of these facilities approximates 290,000 square feet and their combined cost (including improvements subsequent to acquisition), net of accumulated depreciation, was $27.0 million at December 31, 2015.
M&T Bank also owns a facility in Syracuse, New York with approximately 160,000 rentable square feet of space. Approximately 46% of this facility is occupied by M&T Bank. At December 31, 2015, the cost of this building (including improvements subsequent to acquisition), net of accumulated depreciation, was $2.0 million.
M&T Bank owns facilities in Wilmington, Delaware, with approximately 340,000 (known as Wilmington Center) and 295,000 (known as Wilmington Plaza) rentable square feet of space, respectively. M&T Bank occupies approximately 93% of Wilmington Center. Wilmington Plaza is 100% occupied by a tenant. At December 31, 2015, the cost of these buildings (including improvements subsequent to acquisition), net of accumulated depreciation, was $43.0 million and $13.0 million, respectively.
M&T Bank also owns facilities in Harrisburg, Pennsylvania and Millsboro, Delaware with approximately 220,000 and 325,000 rentable square feet of space, respectively. M&T Bank occupies approximately 32% and 89% of these facilities, respectively. At December 31, 2015, the cost of these buildings (including improvements subsequent to acquisition), net of accumulated depreciation, was $10.5 million and $7.4 million, respectively.
No other properties owned by M&T Bank have more than 100,000 square feet of space. The cost, net of accumulated depreciation and amortization, of the Company’s premises and equipment is detailed in note 6 of Notes to Financial Statements filed herewith in Part II, Item 8, “Financial Statements and Supplementary Data.”
Of the 809 domestic banking offices of M&T’s subsidiary banks at December 31, 2015, 318 are owned in fee and 491 are leased.
| Item 3. | Legal Proceedings. |
M&T and its subsidiaries are subject in the normal course of business to various pending and threatened legal proceedings and other matters in which claims for monetary damages are asserted. On an on-going basis management, after consultation with legal counsel, assesses the Company’s liabilities and contingencies in connection with such proceedings. For those matters where it is probable that the Company will incur losses and the amounts of the losses can be reasonably estimated, the Company records an expense and corresponding liability in its consolidated financial statements. To the extent the pending or threatened litigation could result in exposure in excess of that liability, the amount of such excess is not currently estimable. Although not considered probable, the range of reasonably possible losses for such matters in the aggregate, beyond the
32
Table of Contents
existing recorded liability, was between $0 and $40 million. Although the Company does not believe that the outcome of pending litigations will be material to the Company’s consolidated financial position, it cannot rule out the possibility that such outcomes will be material to the consolidated results of operations for a particular reporting period in the future.
Wilmington Trust Corporation Investigative and Litigation Matters
M&T’s Wilmington Trust Corporation subsidiary is the subject of certain governmental investigations arising from actions undertaken by Wilmington Trust Corporation prior to M&T’s acquisition of Wilmington Trust Corporation and its subsidiaries, as set forth below.
DOJ Investigation: Prior to M&T’s acquisition of Wilmington Trust Corporation, the Department of Justice (“DOJ”) commenced an investigation of Wilmington Trust Corporation, relating to Wilmington Trust Corporation’s financial reporting and securities filings, as well as certain commercial real estate lending relationships involving its subsidiary bank, Wilmington Trust Company, all of which relate to filings and activities occurring prior to the acquisition of Wilmington Trust Corporation by M&T. On January 6, 2016, the U.S. Attorney for the District of Delaware obtained an indictment against Wilmington Trust Corporation relating to alleged conduct that occurred prior to M&T’s acquisition of Wilmington Trust Corporation in May 2011. M&T strongly believes that this unprecedented action is unjustified and Wilmington Trust Corporation will vigorously defend itself.
The indictment of Wilmington Trust Corporation could result in potential criminal remedies, or criminal or non-criminal resolutions or settlements, including, among other things, enforcement actions, potential statutory or regulatory restrictions on the ability to conduct certain businesses (for which waivers may or may not be available), fines, penalties, restitution, reputational damage or additional costs and expenses.
In Re Wilmington Trust Securities Litigation (U.S. District Court, District of Delaware, Case No. 10-CV-0990-SLR): Beginning on November 18, 2010, a series of parties, purporting to be class representatives, commenced a putative class action lawsuit against Wilmington Trust Corporation, alleging that Wilmington Trust Corporation’s financial reporting and securities filings were in violation of securities laws. The cases were consolidated and Wilmington Trust Corporation moved to dismiss. The Court issued an order denying Wilmington Trust Corporation’s motion to dismiss on March 20, 2014. A motion to stay the case is currently pending before the Court.
Other Matters
The Company is the subject of an investigation by government agencies relating to the origination of Federal Housing Administration (“FHA”) insured residential home loans and residential home loans sold to The Federal Home Loan Mortgage Corporation (“Freddie Mac”) and The Federal National Mortgage Association (“Fannie Mae”). A number of other U.S. financial institutions have announced similar investigations. Regarding FHA loans, the U.S. Department of Housing and Urban Development (“HUD”) Office of Inspector General and the DOJ (collectively, the “Government”) are investigating whether the Company complied with underwriting guidelines concerning certain loans where HUD paid FHA insurance claims. The Company is fully cooperating with the investigation. The Government has advised the Company that based upon its review of a sample of loans for which an FHA insurance claim was paid by HUD, some of the loans do not meet underwriting guidelines. The Company, based on its own review of the sample, does not agree with the sampling methodology and loan analysis employed by the Government. Regarding loans originated by the Company and sold to Freddie Mac and Fannie Mae, the investigation concerns whether the mortgages sold to Freddie Mac and Fannie Mae comply with applicable underwriting guidelines. The Company is also cooperating with that portion of the investigation. The investigation could lead to claims by the Government under the False Claims Act and the Financial Institutions Reform, Recovery, and Enforcement Act of 1989, which allow treble and other special damages substantially in excess of actual losses. Remedies in these proceedings or settlements may include restitution, fines, penalties, or alterations in the Company’s business practices. The Company and the Government continue settlement discussions regarding the investigation and although progress has been made, the parties have not yet reached a definitive agreement. Based upon the current status of these negotiations, management expects that this potential settlement should not have a material impact on the Company’s consolidated financial condition or results of operations in future periods.
33
Table of Contents
Due to their complex nature, it is difficult to estimate when litigation and investigatory matters such as these may be resolved. As set forth in the introductory paragraph to this Item 3 — Legal Proceedings, losses from current litigation and regulatory matters which the Company is subject to that are not currently considered probable are within a range of reasonably possible losses for such matters in the aggregate, beyond the existing recorded liability, and are included in the range of reasonably possible losses set forth above.
| Item 4. | Mine Safety Disclosures . |
Not applicable.
Executive Officers of the Registrant
Information concerning M&T’s executive officers is presented below as of February 19, 2016. The year the officer was first appointed to the indicated position with M&T or its subsidiaries is shown parenthetically. In the case of each entity noted below, officers’ terms run until the first meeting of the board of directors after such entity’s annual meeting, which in the case of M&T takes place immediately following the Annual Meeting of Shareholders, and until their successors are elected and qualified.
Robert G. Wilmers, age 81, is chief executive officer (2007), chairman of the board (2000) and a director (1982) of M&T. From April 1998 until July 2000, he served as president and chief executive officer of M&T and from July 2000 until June 2005 he served as chairman, president (1988) and chief executive officer (1983). He is chief executive officer (2007), chairman of the board (2005) and a director (1982) of M&T Bank, and previously served as chairman of the board of M&T Bank from March 1983 until July 2003 and as president of M&T Bank from March 1984 until June 1996.
Mark J. Czarnecki, age 60, is president (2007), chief operating officer (2014) and a director (2007) of M&T and of M&T Bank. Previously, he was an executive vice president of M&T (1999) and M&T Bank (1997) and was responsible for the M&T Investment Group and the Company’s Retail Banking network. Mr. Czarnecki is chairman of the board, president and chief executive officer (2007) and a director (2005) of Wilmington Trust, N.A.
Robert J. Bojdak, age 60, is an executive vice president and chief credit officer (2004) of M&T and M&T Bank. In addition to managing the Company’s credit risk, Mr. Bojdak was also responsible for managing the Company’s enterprise-wide risk, including operational, compliance and investment risk, until February 2013. From April 2002 to April 2004, Mr. Bojdak served as senior vice president and credit deputy for M&T Bank. He is an executive vice president and a director of Wilmington Trust, N.A. (2004).
Janet M. Coletti, age 52, is an executive vice president (2015) of M&T and M&T Bank, and is in charge of the Company’s Human Resources Division. Ms. Coletti previously served as senior vice president of M&T Bank, most recently responsible for the Business Banking Division, and has held a number of management positions within M&T Bank since 1985.
William J. Farrell II, age 58, is an executive vice president (2011) of M&T and M&T Bank, and is responsible for managing M&T’s Wealth and Institutional Services Division, which includes Wealth Advisory Services, Institutional Client Services, Asset Management, M&T Securities and M&T Insurance Agency. Mr. Farrell joined M&T through the Wilmington Trust acquisition. He joined Wilmington Trust in 1976 and held a number of senior management positions, most recently as executive vice president and head of the Corporate Client Services business. Mr. Farrell is president, chief executive officer and a director (2012) of Wilmington Trust Company, an executive vice president and a director (2011) of Wilmington Trust, N.A. and a director (2013) of M&T Securities.
Richard S. Gold, age 55, is an executive vice president (2007) and chief risk officer (2014) of M&T. He is a vice chairman and chief risk officer of M&T Bank (2014). Mr. Gold is responsible for managing the Company’s enterprise-wide risk, including operational, compliance and investment risk. He is also responsible for the Office of Regulatory Affairs. Previously, Mr. Gold was responsible for managing the Company’s Residential Mortgage and Business Banking Divisions. Mr. Gold served as senior vice president of M&T Bank from 2000 to 2006, most recently responsible for the Retail Banking Division, including M&T Securities. Mr. Gold is an executive vice president (2006) and chief risk officer (2014) of Wilmington Trust, N.A.
34
Table of Contents
Brian E. Hickey, age 63, is an executive vice president of M&T (1997) and M&T Bank (1996). He is a member of the Directors Advisory Council (1994) of the Rochester Division of M&T Bank. Mr. Hickey is responsible for managing all of the non-retail banking segments in Upstate New York and in the Northern and Central/Western Pennsylvania regions. Mr. Hickey is also responsible for the Auto Floor Plan lending business.
René F. Jones, age 51, is an executive vice president (2006) and chief financial officer (2005) of M&T. He is a vice chairman (2014) and chief financial officer (2005) of M&T Bank. Mr. Jones is also responsible for Wilmington Trust’s wealth and institutional services businesses and for M&T’s Treasury Division. Previously, Mr. Jones was a senior vice president in charge of the Financial Performance Measurement department within M&T Bank’s Finance Division. Mr. Jones has held a number of management positions within M&T Bank’s Finance Division since 1992. Mr. Jones is an executive vice president and chief financial officer (2005) and a director (2007) of Wilmington Trust, N.A., and he is chairman of the board, president (2009) and a trustee (2005) of M&T Real Estate. He is chairman of the board and a director (2014) of Wilmington Trust Investment Advisors, and is a director of M&T Insurance Agency (2007). Mr. Jones is chairman of the board and a director (2014) of Wilmington Trust Company.
Darren J. King, age 46, is an executive vice president of M&T (2010) and M&T Bank (2009), and is in charge of the Retail Banking Division, the Consumer Lending Division, the Business Banking Division and the Marketing and Communications Division. Mr. King previously served as senior vice president of M&T Bank and has held a number of management positions within M&T Bank since 2000. Mr. King is an executive vice president of Wilmington Trust, N.A. (2009).
Gino A. Martocci, age 50, is an executive vice president (2014) of M&T and M&T Bank, and is responsible for M&T’s non-retail banking segments in the metropolitan New York City, New Jersey, Baltimore and Washington, D.C. markets. He also is responsible for M&T Realty Capital. Mr. Martocci was a senior vice president of M&T Bank from 2002 to 2013, serving in a number of management positions. He is an executive vice president (2015) and a director (2009) of M&T Realty Capital, and an executive vice president of M&T Real Estate. Mr. Martocci is also the chairman of the Directors Advisory Council (2013) of the New York City/Long Island Division of M&T Bank, and a member of the Directors Advisory Council (2015) of the New Jersey Division of M&T Bank.
Kevin J. Pearson, age 54, is an executive vice president (2002) of M&T and is a vice chairman (2014) of M&T Bank. He is a member of the Directors Advisory Council (2006) of the New York City/Long Island Division of M&T Bank. Mr. Pearson is responsible for M&T’s Credit Division and for managing all of M&T Bank’s commercial banking lines of business. Previously, he was responsible for all of the non-retail banking segments in the New York City, Philadelphia, Connecticut, New Jersey, Tarrytown, Greater Washington D.C. and Northern Virginia, Southern Pennsylvania and Delaware markets of M&T Bank, as well as the Company’s commercial real estate business, Commercial Marketing and Treasury Management. He is an executive vice president (2003) and a trustee (2014) of M&T Real Estate, chairman of the board (2009) and a director (2003) of M&T Realty Capital, and an executive vice president and a director of Wilmington Trust, N.A. (2014). Mr. Pearson served as senior vice president of M&T Bank from 2000 to 2002.
Michael J. Todaro, age 54, is an executive vice president (2015) of M&T and M&T Bank, and is responsible for the Mortgage and Customer Asset Management Division. Mr. Todaro previously served as senior vice president of M&T Bank and has held a number of management positions within M&T Bank’s Mortgage Division since 1995. He is an executive vice president (2015) of Wilmington Trust, N.A.
Michele D. Trolli, age 54, is an executive vice president and chief information officer (2005) of M&T and M&T Bank. She is in charge of the Company’s Technology and Banking Operations, which includes banking services, corporate services, digital and telephone banking, the enterprise data office, enterprise security and enterprise technology. Previously, Ms. Trolli was in charge of the Technology and Banking Operations Division, the Retail Banking Division and the Corporate Services Group of M&T Bank.
D. Scott N. Warman, age 50, is an executive vice president (2009) and treasurer (2008) of M&T and M&T Bank. He is responsible for managing the Company’s Treasury Division. Mr. Warman previously served as senior vice president of M&T Bank and has held a number of management positions within M&T Bank since 1995. He is an executive vice president and treasurer of Wilmington Trust, N.A. (2008), a trustee of M&T Real Estate (2009), and is treasurer of Wilmington Trust Company (2012).
35
Table of Contents
| Item 5. | Market for Registrant’s Common Equity, Related Stockholder Matters and Issuer Purchases of Equity Securities. |
M&T’s common stock is traded under the symbol MTB on the New York Stock Exchange. See cross-reference sheet for disclosures incorporated elsewhere in this Annual Report on Form 10-K for market prices of M&T’s common stock, approximate number of common shareholders at year-end, frequency and amounts of dividends on common stock and restrictions on the payment of dividends.
During the fourth quarter of 2015, M&T did not issue any shares of its common stock that were not registered under the Securities Act of 1933.
Equity Compensation Plan Information
The following table provides information as of December 31, 2015 with respect to shares of common stock that may be issued under M&T’s existing equity compensation plans. M&T’s existing equity compensation plans include the M&T Bank Corporation 2001 Stock Option Plan, the 2005 Incentive Compensation Plan, which replaced the 2001 Stock Option Plan, and the 2009 Equity Incentive Compensation Plan, each of which has been previously approved by shareholders, and the M&T Bank Corporation 2008 Directors’ Stock Plan and the M&T Bank Corporation Deferred Bonus Plan, each of which did not require shareholder approval.
The table does not include information with respect to shares of common stock subject to outstanding options and rights assumed by M&T in connection with mergers and acquisitions of the companies that originally granted those options and rights. Footnote (1) to the table sets forth the total number of shares of common stock issuable upon the exercise of such assumed options and rights as of December 31, 2015, and their weighted-average exercise price.
|
Plan Category |
Number of
Securities to be Issued Upon Exercise of Outstanding Options or Rights |
Weighted-Average
Exercise Price of Outstanding Options or Rights |
Number of Securities
Remaining Available for Future Issuance Under Equity Compensation Plans (Excluding Securities Reflected in Column A) |
|||||||||
| (A) | (B) | (C) | ||||||||||
|
Equity compensation plans approved by security holders: |
||||||||||||
|
2005 Incentive Compensation Plan |
2,363,583 | 103.43 | 3,442,092 | |||||||||
|
2009 Equity Incentive Compensation Plan |
3,700 | 79.21 | 512,620 | |||||||||
|
Equity compensation plans not approved by security holders: |
||||||||||||
|
2008 Directors’ Stock Plan |
3,904 | 121.18 | 70,270 | |||||||||
|
Deferred Bonus Plan |
26,365 | 66.74 | — | |||||||||
|
|
|
|
|
|
|
|||||||
|
Total |
2,397,552 | $ | 103.02 | 4,024,982 | ||||||||
|
|
|
|
|
|
|
|||||||
| (1) | As of December 31, 2015, a total of 1,866,706 shares of M&T common stock were issuable upon exercise of outstanding options or rights assumed by M&T in connection with merger and acquisition transactions. The weighted-average exercise price of those outstanding options or rights is $155.76 per common share. |
Equity compensation plans adopted without the approval of shareholders are described below:
2008 Directors’ Stock Plan. M&T maintains a plan for non-employee members of the Board of Directors of M&T and the members of its Directors Advisory Council, and the non-employee members of the Board of Directors of M&T Bank and the members of its regional Directors Advisory Councils, which allows such directors, advisory directors and members of regional Directors Advisory Councils to receive all or a portion of their directorial compensation in shares of M&T common stock.
36
Table of Contents
Deferred Bonus Plan. M&T maintains a deferred bonus plan which was frozen effective January 1, 2010 and did not allow any deferrals after that date. Prior to January 1, 2010, the plan allowed eligible officers of M&T and its subsidiaries to elect to defer all or a portion of their annual incentive compensation awards and allocate such awards to several investment options, including M&T common stock. At the time of the deferral election, participants also elected the timing of distributions from the plan. Such distributions are payable in cash, with the exception of balances allocated to M&T common stock which are distributable in the form of shares of common stock.
Performance Graph
The following graph contains a comparison of the cumulative shareholder return on M&T common stock against the cumulative total returns of the KBW Nasdaq Bank Index, compiled by Keefe, Bruyette & Woods, Inc., and the S&P 500 Index, compiled by Standard & Poor’s Corporation, for the five-year period beginning on December 31, 2010 and ending on December 31, 2015. The KBW Nasdaq Bank Index is a market capitalization index consisting of 24 companies representing leading national money centers and regional banks or thrifts.
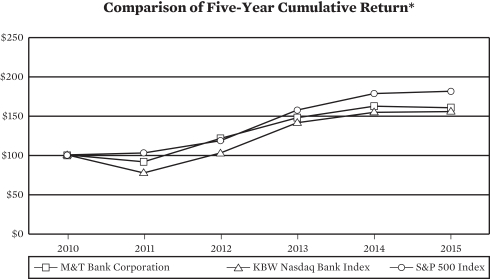
Shareholder Value at Year End*
| 2010 | 2011 | 2012 | 2013 | 2014 | 2015 | |||||||||||||||||
|
M&T Bank Corporation |
100 | 91 | 121 | 147 | 162 | 160 | ||||||||||||||||
|
KBW Nasdaq Bank Index |
100 | 77 | 102 | 141 | 154 | 155 | ||||||||||||||||
|
S&P 500 Index |
100 | 102 | 118 | 157 | 178 | 181 | ||||||||||||||||
| * | Assumes a $100 investment on December 31, 2010 and reinvestment of all dividends. |
In accordance with and to the extent permitted by applicable law or regulation, the information set forth above under the heading “Performance Graph” shall not be incorporated by reference into any future filing under the Securities Act of 1933, as amended (the “Securities Act”), or the Exchange Act and shall not be deemed to be “soliciting material” or to be “filed” with the SEC under the Securities Act or the Exchange Act.
Issuer Purchases of Equity Securities
On November 17, 2015, M&T announced that it had been authorized by its Board of Directors to purchase up to $200 million of shares of its common stock. The 2015 repurchase program rescinded and replaced a similar plan that was authorized by the M&T Board of Directors in February 2007. M&T did not repurchase any shares pursuant to either plan during 2015.
37
Table of Contents
During the fourth quarter of 2015, M&T purchased shares of its common stock as follows:
|
Period |
(a)Total
Number of Shares (or Units) Purchased(1) |
(b)Average
Price Paid per Share (or Unit) |
(c)Total
Number of Shares (or Units) Purchased as Part of Publicly Announced Plans or Programs |
(d)Maximum
Number (or Approximate Dollar Value) of Shares (or Units) that may yet be Purchased Under the Plans or Programs(2) |
||||||||||||
|
October 1 - October 31, 2015 |
2,764 | $ | 120.97 | — | 2,181,500 | |||||||||||
|
November 1 - November 30, 2015 |
1,901 | 124.45 | — | $ | 200,000,000 | |||||||||||
|
December 1 - December 31, 2015 |
7,124 | 124.42 | — | $ | 200,000,000 | |||||||||||
|
|
|
|
|
|
|
|||||||||||
|
Total |
11,789 | $ | 123.61 | — | ||||||||||||
|
|
|
|
|
|
|
|||||||||||
| (1) | The total number of shares purchased during the periods indicated reflects shares deemed to have been received from employees who exercised stock options by attesting to previously acquired common shares in satisfaction of the exercise price or shares received from employees upon the vesting of restricted stock awards in satisfaction of applicable tax withholding obligations, as is permitted under M&T’s stock-based compensation plans. |
| (2) | On February 22, 2007, M&T announced a program to purchase up to 5,000,000 shares of its common stock. That program was replaced by a program announced on November 17, 2015 to purchase up to $200,000,000 of M&T’s common stock. No shares were purchased under either program during the periods indicated. |
| Item 6. | Selected Financial Data. |
See cross-reference sheet for disclosures incorporated elsewhere in this Annual Report on Form 10-K.
| Item 7. | Management’s Discussion and Analysis of Financial Condition and Results of Operations . |
Corporate Profile and Significant Developments
M&T Bank Corporation (“M&T”) is a bank holding company headquartered in Buffalo, New York with consolidated assets of $122.8 billion at December 31, 2015. The consolidated financial information presented herein reflects M&T and all of its subsidiaries, which are referred to collectively as “the Company.” M&T’s wholly owned bank subsidiaries are M&T Bank and Wilmington Trust, National Association (“Wilmington Trust, N.A.”).
M&T Bank, with total assets of $122.1 billion at December 31, 2015, is a New York-chartered commercial bank with 807 domestic banking offices in New York State, Maryland, New Jersey, Pennsylvania, Delaware, Connecticut, Virginia, West Virginia, and the District of Columbia, a full-service commercial banking office in Ontario, Canada, and an office in the Cayman Islands. M&T Bank and its subsidiaries offer a broad range of financial services to a diverse base of consumers, businesses, professional clients, governmental entities and financial institutions located in their markets. Lending is largely focused on consumers residing in the states noted above and on small and medium size businesses based in those areas, although loans are originated through offices in other states and in Ontario, Canada. Certain lending activities are also conducted in other states through various subsidiaries. Trust and other fiduciary services are offered by M&T Bank and through its wholly owned subsidiary, Wilmington Trust Company. Other subsidiaries of M&T Bank include: M&T Real Estate Trust, a commercial mortgage lender; M&T Realty Capital Corporation, a multifamily commercial mortgage lender; M&T Securities, Inc., which provides brokerage, investment advisory and insurance services; Wilmington Trust Investment Advisors, Inc., which serves as an investment advisor to the Wilmington Funds, a family of proprietary mutual funds, and other funds and institutional clients; and M&T Insurance Agency, Inc., an insurance agency.
Wilmington Trust, N.A. is a national bank with total assets of $1.9 billion at December 31, 2015. Wilmington Trust, N.A. and its subsidiaries offer various trust and wealth management services.
38
Table of Contents
Wilmington Trust, N.A. also offered selected deposit and loan products on a nationwide basis, largely through telephone, Internet and direct mail marketing techniques.
On November 1, 2015, M&T completed its acquisition of Hudson City Bancorp, Inc. (“Hudson City”). Immediately following completion of the merger, Hudson City Savings Bank merged with and into M&T Bank. At the effective time of the merger, pursuant to the Merger Agreement, each share of Hudson City common stock was converted into the right to receive either 0.08403 of a share of M&T common stock (the “exchange ratio”) or cash having a value equal to the product of the exchange ratio multiplied by the average closing price of M&T common stock for the ten trading days immediately prior to the completion of the merger (such stock or cash, the “merger consideration”), depending on the election of the holder of such share of Hudson City common stock and subject to the proration and adjustment procedures as specified in the Merger Agreement. As a result, M&T paid cash consideration of $2.1 billion and issued 25,953,950 shares of M&T common stock in exchange for Hudson City shares outstanding at the time of acquisition.
The Hudson City transaction has been accounted for using the acquisition method of accounting and, accordingly, assets acquired, liabilities assumed and consideration exchanged were recorded at estimated fair value on the acquisition date. Assets acquired totaled approximately $36.7 billion, including $19.0 billion of loans and leases (including approximately $234 million of commercial real estate loans, $18.6 billion of residential real estate loans and $162 million of consumer loans). Liabilities assumed aggregated $31.5 billion, including $17.9 billion of deposits and $13.2 billion of borrowings. Immediately following the acquisition, the Company restructured its balance sheet by selling $5.8 billion of investment securities obtained in the acquisition and repaying $10.6 billion of borrowings assumed in the transaction. The common stock issued added $3.1 billion to M&T’s common shareholders’ equity. In connection with the acquisition, the Company recorded $1.1 billion of goodwill and $132 million of core deposit intangible asset. The core deposit intangible asset is being amortized over 7 years using an accelerated method. The acquisition of Hudson City expanded the Company’s presence in New Jersey, Connecticut and New York.
Net acquisition and integration-related expenses (included herein as merger-related expenses) associated with the Hudson City acquisition totaled $61 million after tax-effect, or $.44 of diluted earnings per common share during 2015 and $8 million after tax-effect, or $.06 of diluted earnings per common share in 2013. There were no merger-related expenses in 2014. The Company expects to incur additional merger-related expenses during 2016. As of December 31, 2015, the remaining unpaid portion of incurred merger-related expenses was $56 million.
Effective January 1, 2015, the Company elected to account for its investments in qualified affordable housing projects using the proportional amortization method as allowed by the Financial Accounting Standards Board (“FASB”). Under that method, an entity amortizes the initial cost of the investment in proportion to the tax credits and other tax benefits received and recognizes the net investment performance in the income statement as a component of income tax expense. The adoption was required to be applied retrospectively. As a result, financial statements for periods prior to 2015 have been restated. The adoption did not have a significant effect on the Company’s consolidated financial position or results of operations, but the restatement of the consolidated statement of income for the years ended December 31, 2014 and 2013 resulted in the removal of $53 million and $48 million, respectively, of losses associated with qualified affordable housing projects from “other costs of operations” and added the amortization of the initial cost of the investment of a similar amount to income tax expense.
Regulatory Oversight
M&T and its subsidiaries are subject to a comprehensive regulatory framework applicable to financial holding companies and their bank and non-bank subsidiaries. Significant changes in regulatory requirements arising from the 2010 Dodd-Frank Wall Street Reform and Consumer Protection Act (“Dodd-Frank Act”) have affected the lending, deposit, investment, trading and operating activities of financial institutions and their holding companies, including the Company. As required by the Dodd-Frank Act, various federal regulatory agencies have proposed or adopted a broad range of implementing rules and regulations and have prepared numerous studies and reports for Congress. The implications of the Dodd-Frank Act for the Company’s businesses will continue to depend to a large extent on the ultimate implementation of the legislation by the Federal Reserve and other agencies. A discussion of the provisions of the Dodd-Frank and other regulatory requirements is included in Part I, Item 1 of this Form 10-K.
39
Table of Contents
The Company is subject to the Federal Reserve’s revised comprehensive risk-based capital and leverage framework for U.S. banking organizations (the “New Capital Rules”), subject to certain transitional provisions. The New Capital Rules, which became effective for the Company on January 1, 2015, substantially revised the risk-based capital requirements applicable to bank holding companies and their depository institution subsidiaries, including M&T and M&T Bank, as compared to the U.S. general risk-based capital rules that were applicable to M&T and M&T Bank through December 31, 2014.
The New Capital Rules also preclude certain hybrid securities, such as trust preferred securities, from inclusion in bank holding companies’ Tier 1 capital, subject to phase-out in the case of bank holding companies, such as M&T, that had $15 billion or more in total consolidated assets as of December 31, 2009. As a result, beginning in 2015 only 25% of M&T’s trust preferred securities were includable in Tier 1 capital, and in 2016 and thereafter, none of M&T’s trust preferred securities are includable in Tier 1 capital. Trust preferred securities no longer included in M&T’s Tier 1 capital may nonetheless be included as a component of Tier 2 capital on a permanent basis without phase-out and irrespective of whether such securities otherwise meet the revised definition of Tier 2 capital set forth in the New Capital Rules. On April 15, 2015, in accordance with its 2015 capital plan, M&T redeemed the junior subordinated debentures associated with $310 million of trust preferred securities of M&T Capital Trust I, II and III. A detailed discussion of the New Capital Rules is included in Part I, Item 1 of this Form 10-K under the heading “Capital Requirements.” A further discussion of the Company’s regulatory capital is presented herein under the heading “Capital” and in note 23 of Notes to Financial Statements.
On September 3, 2014, various federal banking regulators adopted final rules (“Final LCR Rule”) implementing a U.S. version of the Basel Committee’s Liquidity Coverage Ratio requirement (“LCR”) including the modified version applicable to bank holding companies, including M&T, with $50 billion in total consolidated assets that are not “advanced approaches” institutions. The LCR is intended to ensure that banks hold a sufficient amount of “high quality liquid assets” (“HQLA”) to cover the anticipated net cash outflows during a hypothetical acute 30-day stress scenario. The LCR is the ratio of an institution’s amount of HQLA (the numerator) over projected net cash outflows over the 30-day period (the denominator), in each case, as calculated pursuant to the Final LCR Rule. Once fully phased-in, a subject institution must maintain an LCR equal to at least 100% in order to satisfy this regulatory requirement. Only specific classes of assets, including U.S. Treasury securities, other U.S. government obligations and agency mortgage-backed securities, qualify under the rule as HQLA, with classes of assets deemed relatively less liquid and/or subject to a greater degree of credit risk subject to certain haircuts and caps for purposes of calculating the numerator under the Final LCR Rule. The initial compliance date for the Company for the modified LCR was January 1, 2016, with the requirement fully phased-in by January 1, 2017. The Company believes that it is in compliance with the LCR Rule. A detailed discussion of the LCR is included in Part I, Item 1 of this Form 10-K under the heading “Liquidity.”
The Company is also subject to the provisions of the Dodd-Frank Act commonly referred to as the “Volcker Rule” which became effective in July 2015 (subject to a conformance period, as applicable). Pursuant to the Volcker Rule, banking entities are generally prohibited from engaging in proprietary trading and owning or sponsoring private equity or hedge funds, which are “covered funds” under that rule. Under the Volcker Rule, the Company is now required to be in compliance with the prohibition on proprietary trading and covered funds established after December 31, 2013. The Federal Reserve extended the compliance period to July 21, 2016 for investments in and relationships with covered funds that existed prior to January 1, 2014. The Federal Reserve has indicated that it intends to further extend that compliance period to July 21, 2017. The Company believes that it has not engaged in any significant amount of proprietary trading as defined in the Volcker Rule. A review of the Company’s investments was undertaken to determine if any meet the Volcker Rule’s definition of covered funds. Based on that review, the Company believes that any impact related to investments considered to be covered funds would not have a material effect on the Company’s consolidated financial condition or its results of operations. Nevertheless, the Company may be required to divest certain investments subject to the Volcker Rule by the end of the compliance period, as extended.
On June 17, 2013, M&T and M&T Bank entered into a written agreement with the Federal Reserve Bank of New York. Under the terms of the agreement, M&T and M&T Bank were required
40
Table of Contents
to submit to the Federal Reserve Bank of New York a revised compliance risk management program designed to ensure compliance with the Bank Secrecy Act and anti-money-laundering laws and regulations (“BSA/AML”) and to take certain other steps to enhance their compliance practices. M&T and M&T Bank have since made substantial progress in implementing a BSA/AML program with significantly expanded scale and scope, as recognized by the Board of Governors of the Federal Reserve System in its Order approving M&T and M&T Bank’s applications to acquire Hudson City and Hudson City Savings Bank. M&T and M&T Bank are continuing to work towards the resolution of all outstanding issues in the written agreement.
Critical Accounting Estimates
The Company’s significant accounting policies conform with generally accepted accounting principles (“GAAP”) and are described in note 1 of Notes to Financial Statements. In applying those accounting policies, management of the Company is required to exercise judgment in determining many of the methodologies, assumptions and estimates to be utilized. Certain of the critical accounting estimates are more dependent on such judgment and in some cases may contribute to volatility in the Company’s reported financial performance should the assumptions and estimates used change over time due to changes in circumstances. Some of the more significant areas in which management of the Company applies critical assumptions and estimates include the following:
| ● |
Accounting for credit losses — The allowance for credit losses represents the amount that in management’s judgment appropriately reflects credit losses inherent in the loan and lease portfolio as of the balance sheet date. A provision for credit losses is recorded to adjust the level of the allowance as deemed necessary by management. In estimating losses inherent in the loan and lease portfolio, assumptions and judgment are applied to measure amounts and timing of expected future cash flows, collateral values and other factors used to determine the borrowers’ abilities to repay obligations. Historical loss trends are also considered, as are economic conditions, industry trends, portfolio trends and borrower-specific financial data. In accounting for loans acquired at a discount that is, in part, attributable to credit quality which are initially recorded at fair value with no carry-over of an acquired entity’s previously established allowance for credit losses, the cash flows expected at acquisition in excess of estimated fair value are recognized as interest income over the remaining lives of the loans. Subsequent decreases in the expected principal cash flows require the Company to evaluate the need for additions to the Company’s allowance for credit losses. Subsequent improvements in expected cash flows result first in the recovery of any applicable allowance for credit losses and then in the recognition of additional interest income over the remaining lives of the loans. Changes in the circumstances considered when determining management’s estimates and assumptions could result in changes in those estimates and assumptions, which may result in adjustment of the allowance or, in the case of loans acquired at a discount, increases in interest income in future periods. A detailed discussion of facts and circumstances considered by management in determining the allowance for credit losses is included herein under the heading “Provision for Credit Losses” and in note 5 of Notes to Financial Statements. |
| ● |
Valuation methodologies — Management of the Company applies various valuation methodologies to assets and liabilities which often involve a significant degree of judgment, particularly when liquid markets do not exist for the particular items being valued. Quoted market prices are referred to when estimating fair values for certain assets, such as trading assets, most investment securities, and residential real estate loans held for sale and related commitments. However, for those items for which an observable liquid market does not exist, management utilizes significant estimates and assumptions to value such items. Examples of these items include loans, deposits, borrowings, goodwill, core deposit and other intangible assets, other assets and liabilities obtained or assumed in business combinations, capitalized servicing assets, pension and other postretirement benefit obligations, estimated residual values of property associated with leases, and certain derivative and other financial instruments. These valuations require the use of various assumptions, including, among others, discount rates, rates of return on assets, repayment rates, cash flows, default rates, costs of servicing and liquidation values. The use of different assumptions could produce significantly different results, which could have material positive or negative effects on the Company’s results of operations, financial condition or disclosures of fair value information. |
41
Table of Contents
|
In addition to valuation, the Company must assess whether there are any declines in value below the carrying value of assets that should be considered other than temporary or otherwise require an adjustment in carrying value and recognition of a loss in the consolidated statement of income. Examples include investment securities, other investments, mortgage servicing rights, goodwill, core deposit and other intangible assets, among others. Specific assumptions and estimates utilized by management are discussed in detail herein in management’s discussion and analysis of financial condition and results of operations and in notes 1, 3, 4, 7, 8, 12, 18, 19 and 20 of Notes to Financial Statements. |
| ● |
Commitments, contingencies and off-balance sheet arrangements — Information regarding the Company’s commitments and contingencies, including guarantees and contingent liabilities arising from litigation, and their potential effects on the Company’s results of operations is included in note 21 of Notes to Financial Statements. In addition, the Company is routinely subject to examinations from various governmental taxing authorities. Such examinations may result in challenges to the tax return treatment applied by the Company to specific transactions. Management believes that the assumptions and judgment used to record tax-related assets or liabilities have been appropriate. Should tax laws change or the tax authorities determine that management’s assumptions were inappropriate, the result and adjustments required could have a material effect on the Company’s results of operations. Information regarding the Company’s income taxes is presented in note 13 of Notes to Financial Statements. The recognition or de-recognition in the Company’s consolidated financial statements of assets and liabilities held by so-called variable interest entities is subject to the interpretation and application of complex accounting pronouncements or interpretations that require management to estimate and assess the relative significance of the Company’s financial interests in those entities and the degree to which the Company can influence the most important activities of the entities. Information relating to the Company’s involvement in such entities and the accounting treatment afforded each such involvement is included in note 19 of Notes to Financial Statements. |
Overview
Net income of the Company during 2015 was $1.08 billion or $7.18 of diluted earnings per common share, compared with $1.07 billion or $7.42 of diluted earnings per common share in 2014. Basic earnings per common share were $7.22 in 2015 and $7.47 in 2014. Net income in 2013 totaled $1.14 billion, while diluted and basic earnings per common share were $8.20 and $8.26, respectively. The after-tax impact of merger-related expenses associated with the Hudson City transaction was $61 million ($97 million pre-tax) or $.44 of diluted earnings per common share in 2015. There were no merger-related expenses in 2014. In 2013, the after-tax impact of merger-related expenses associated with the then-pending Hudson City transaction was $8 million ($12 million pre-tax) or $.06 of diluted earnings per common share. Expressed as a rate of return on average assets, net income in 2015 was 1.06%, compared to 1.16% in 2014 and 1.36% in 2013. The return on average common shareholders’ equity was 8.32% in 2015, 9.08% in 2014 and 10.93% in 2013.
Financial results associated with assets acquired and liabilities assumed in the acquisition of Hudson City have been reflected in the Company’s consolidated statement of income since the November 1, 2015 acquisition date adding approximately $110 million to net interest income, $21 million to the provision for credit losses, and $116 million to other expense, including $76 million of merger-related other expense. In addition to the impact of the acquisition, the Company’s financial performance in 2015 as compared with 2014 reflected a further increase in net interest income that was largely attributable to higher average balances of loans and leases, higher noninterest income that reflected a pre-tax gain of $45 million ($23 million after taxes) related to the April 2015 sale of the Company’s trade processing business within the retirement services division of its Institutional Client Services business, and increased operating expenses, in part reflecting higher salaries and benefits costs and cash contributions to The M&T Charitable Foundation. The Company’s financial performance in 2014 as compared with 2013 reflected a significantly lower provision for credit losses and higher mortgage banking revenues, offset by lower net gains from investment securities and loan securitization transactions and higher operating expenses largely resulting from increased costs for professional services and salaries. During 2013, the Company sold the majority of its privately issued mortgage-backed securities that had been held in the available-for-sale investment securities portfolio for an after-tax loss of $28 million ($46 million pre-tax), or $.22 per diluted common share.
42
Table of Contents
In addition, the Company’s holdings of Visa and MasterCard shares were sold in 2013 for an after-tax gain of $62 million ($103 million pre-tax), or $.48 per diluted common share. Also reflected in 2013’s results were after-tax gains from loan securitization transactions of $38 million ($63 million pre-tax), or $.29 per diluted common share. The Company securitized during the second and third quarters of 2013 approximately $1.3 billion of one-to-four family residential real estate loans previously held in the Company’s loan portfolio into guaranteed mortgage-backed securities with Ginnie Mae and recognized gains of $42 million. The Company retained the substantial majority of those securities in its investment securities portfolio. In addition, the Company securitized and sold in September 2013 approximately $1.4 billion of automobile loans held in its loan portfolio, resulting in a gain of $21 million.
Taxable-equivalent net interest income totaled $2.87 billion in 2015 and $2.70 billion in each of 2014 and 2013. Average earning assets increased $9.5 billion, or 12%, in 2015 as compared with 2014 due predominantly to higher average balances of loans and leases of $6.2 billion and investment securities of $2.9 billion. Loans and investment securities obtained in the acquisition of Hudson City added approximately $3.1 billion and $409 million, respectively, to average earning assets in 2015. Offsetting the impact of higher earning assets was a 17 basis point (hundredths of one percent) narrowing of the net interest margin, or taxable-equivalent net interest income expressed as a percentage of average earning assets, from 3.31% in 2014 to 3.14% in 2015. Lower yields on investment securities and loans and leases outstanding led to that narrowing. Average earning assets grew $7.7 billion, or 10%, in 2014 due to higher balances of investment securities and interest-bearing deposits at banks. Offsetting the impact of higher earning assets was a 34 basis point narrowing of the net interest margin, from 3.65% in 2013 to 3.31% in 2014.
The provision for credit losses in 2015 increased 37% to $170 million from $124 million in 2014. The pre-merger Hudson City allowance for credit losses was eliminated in acquisition accounting and as provided for by GAAP, a $21 million provision for credit losses was recorded for incurred credit losses in connection with the $18.3 billion of loans acquired at a premium that were not individually identifiable as impaired at the acquisition date. Net charge-offs were $134 million in 2015 compared with $121 million in the prior year. Net charge-offs as a percentage of average loans and leases were .19% in each of 2015 and 2014. The provision for credit losses was $185 million in 2013, when net charge-offs were $183 million, or .28% of average loans and leases.
Other income totaled $1.83 billion in 2015, compared with $1.78 billion in 2014 and $1.87 billion in 2013. Higher commercial mortgage banking revenues, loan syndication fees and the aforementioned gain on the sale of the trade processing business in 2015 were partially offset by lower trust income associated with the divested business, decreased residential mortgage banking revenues and a decline in service charges on deposit accounts. The Hudson City transaction did not have a significant impact on other income. Reflected in other income in 2013 were net gains on investment securities of $47 million. Excluding gains and losses on investment securities and the previously noted $63 million of gains from loan securitization transactions in 2013, other income in 2014 was up $24 million from $1.76 billion in 2013. Higher mortgage banking revenues and trust income in 2014 were partially offset by a decline in service charges on deposit accounts. Reflected in gains and losses on investment securities in 2013 were other-than-temporary impairment charges of $10 million on certain privately issued collateralized mortgage obligations (“CMOs”).
Reflecting the impact of the Hudson City acquisition and the previously noted application of new accounting guidance for investments in qualified affordable housing projects, other expense increased 5% to $2.82 billion in 2015 from $2.69 billion in 2014. During 2013, other expense totaled $2.59 billion. Included in those amounts are expenses considered by M&T to be “nonoperating” in nature, consisting of amortization of core deposit and other intangible assets of $26 million, $34 million and $47 million in 2015, 2014 and 2013, respectively, and merger-related expenses of $76 million and $12 million in 2015 and 2013, respectively. Exclusive of those nonoperating expenses, noninterest operating expenses aggregated $2.72 billion in 2015, compared with $2.66 billion in 2014 and $2.53 billion in 2013. The increase in such expenses in 2015 as compared with 2014 was largely due to higher costs for salaries and employee benefits and charitable contributions, partially offset by lower professional services costs. Reflected in operating expenses for 2015 were approximately $40 million of operating expenses associated with Hudson City. In addition to the impact of Hudson City, the increase in salaries and employee benefits expense was largely attributable to annual merit increases for employees and higher pension expense. The rise in noninterest operating expenses
43
Table of Contents
from 2013 to 2014 was largely attributable to higher costs for professional services and salaries associated with BSA/AML activities, compliance, capital planning and stress testing, and risk management activities.
The efficiency ratio measures the relationship of operating expenses to revenues. The Company’s efficiency ratio, or noninterest operating expenses (as previously defined) divided by the sum of taxable-equivalent net interest income and noninterest income (exclusive of gains and losses from bank investment securities), was 58.0% in 2015, compared with 59.3% and 56.0% in 2014 and 2013, respectively. The calculations of the efficiency ratio are presented in table 2.
Table 1
EARNINGS SUMMARY
Dollars in millions
| Increase (Decrease)(a) |
Compound
Growth Rate
|
|||||||||||||||||||||||||||||||||||||||
| 2014 to 2015 | 2013 to 2014 | |||||||||||||||||||||||||||||||||||||||
| Amount | % | Amount | % | 2015 | 2014 | 2013 | 2012 | 2011 | 2010 to 2015 | |||||||||||||||||||||||||||||||
| $ | 214.8 | 7 | $ | (1.8 | ) | — | Interest income(b) | $ | 3,195.3 | 2,980.5 | 2,982.3 | 2,968.1 | 2,817.9 | 3 | % | |||||||||||||||||||||||||
| 47.8 | 17 | (3.7 | ) | (1 | ) | Interest expense | 328.3 | 280.4 | 284.1 | 343.2 | 402.3 | (7 | ) | |||||||||||||||||||||||||||
|
|
|
|
|
|
|
|
|
|
|
|
|
|
|
|||||||||||||||||||||||||||
| 167.0 | 6 | 1.9 | — | Net interest income(b) | 2,867.0 | 2,700.1 | 2,698.2 | 2,624.9 | 2,415.6 | 5 | ||||||||||||||||||||||||||||||
| 46.0 | 37 | (61.0 | ) | (33 | ) | Less: provision for credit losses | 170.0 | 124.0 | 185.0 | 204.0 | 270.0 | (14 | ) | |||||||||||||||||||||||||||
| — | — | (46.7 | ) | — | Gain (loss) on bank investment securities(c) | — | — | 46.7 | (47.8 | ) | 73.2 | — | ||||||||||||||||||||||||||||
| 45.8 | 3 | (39.2 | ) | (2 | ) | Other income | 1,825.1 | 1,779.3 | 1,818.5 | 1,715.1 | 1,509.8 | 9 | ||||||||||||||||||||||||||||
| Less: | ||||||||||||||||||||||||||||||||||||||||
| 144.6 | 10 | 49.8 | 4 |
Salaries and employee benefits |
1,549.5 | 1,405.0 | 1,355.2 | 1,314.6 | 1,204.0 | 9 | ||||||||||||||||||||||||||||||
| (11.1 | ) | (1 | ) | 51.8 | 4 |
Other expense |
1,273.4 | 1,284.5 | 1,232.7 | 1,155.2 | 1,237.9 | 8 | ||||||||||||||||||||||||||||
|
|
|
|
|
|
|
|
|
|
|
|
|
|
|
|||||||||||||||||||||||||||
| 33.3 | 2 | (124.6 | ) | (7 | ) | Income before income taxes | 1,699.2 | 1,665.9 | 1,790.5 | 1,618.4 | 1,286.7 | 8 | ||||||||||||||||||||||||||||
| Less: | ||||||||||||||||||||||||||||||||||||||||
| .9 | 3 | (1.3 | ) | (5 | ) |
Taxable-equivalent adjustment(b) |
24.5 | 23.7 | 25.0 | 26.4 | 25.9 | — | ||||||||||||||||||||||||||||
| 19.0 | 3 | (51.0 | ) | (8 | ) |
Income taxes |
595.0 | 576.0 | 627.0 | 562.5 | 401.3 | 9 | ||||||||||||||||||||||||||||
|
|
|
|
|
|
|
|
|
|
|
|
|
|
|
|||||||||||||||||||||||||||
| $ | 13.4 | 1 | $ | (72.3 | ) | (6 | ) | Net income | $ | 1,079.7 | 1,066.2 | 1,138.5 | 1,029.5 | 859.5 | 8 | % | ||||||||||||||||||||||||
|
|
|
|
|
|
|
|
|
|
|
|
|
|
|
|||||||||||||||||||||||||||
| (a) | Changes were calculated from unrounded amounts. |
| (b) | Interest income data are on a taxable-equivalent basis. The taxable-equivalent adjustment represents additional income taxes that would be due if all interest income were subject to income taxes. This adjustment, which is related to interest received on qualified municipal securities, industrial revenue financings and preferred equity securities, is based on a composite income tax rate of approximately 39%. |
| (c) | Includes other-than-temporary impairment losses, if any. |
Supplemental Reporting of Non-GAAP Results of Operations
As a result of business combinations and other acquisitions, the Company had intangible assets consisting of goodwill and core deposit and other intangible assets totaling $4.7 billion at December 31, 2015 and $3.6 billion at each of December 31, 2014 and 2013. Included in such intangible assets was goodwill of $4.6 billion at December 31, 2015 and $3.5 billion at December 31, 2014 and 2013. Amortization of core deposit and other intangible assets, after tax effect, totaled $16 million, $21 million and $29 million during 2015, 2014 and 2013, respectively.
M&T consistently provides supplemental reporting of its results on a “net operating” or “tangible” basis, from which M&T excludes the after-tax effect of amortization of core deposit and other intangible assets (and the related goodwill, core deposit intangible and other intangible asset balances, net of applicable deferred tax amounts) and gains and expenses associated with merging
44
Table of Contents
acquired operations into the Company, since such items are considered by management to be “nonoperating” in nature. Those merger-related expenses generally consist of professional services and other temporary help fees associated with the actual or planned conversion of systems and/or integration of operations; costs related to branch and office consolidations; costs related to termination of existing contractual arrangements to purchase various services; initial marketing and promotion expenses designed to introduce M&T Bank to its new customers; severance; incentive compensation costs; travel costs; and printing, supplies and other costs of completing the transactions and commencing operations in new markets and offices. Those expenses totaled $76 million ($48 million after-tax) in 2015 and $12 million ($8 million after-tax) in 2013. Also considered as a merger-related expense in 2015 was a provision for credit losses of $21 million. GAAP provides that an allowance for credit losses associated with probable incurred losses on loans acquired at a premium be recognized. Given the recognition of such losses above and beyond the impact of forecasted losses used in determining the fair value of acquired loans, the Company considers that provision to be a merger-related expense. There were no merger-related expenses in 2014. Although “net operating income” as defined by M&T is not a GAAP measure, M&T’s management believes that this information helps investors understand the effect of acquisition activity in reported results.
Net operating income was $1.16 billion in 2015, compared with $1.09 billion in 2014 and $1.17 billion in 2013. Diluted net operating earnings per common share were $7.74 in 2015, $7.57 in 2014 and $8.48 in 2013.
Net operating income expressed as a rate of return on average tangible assets was 1.18% in 2015, compared with 1.23% in 2014 and 1.47% in 2013. Net operating income represented a return on average tangible common equity of 13.00% in 2015, 13.76% in 2014 and 17.79% in 2013.
Reconciliations of GAAP amounts with corresponding non-GAAP amounts are presented in table 2.
45
Table of Contents
Table 2
RECONCILIATION OF GAAP TO NON-GAAP MEASURES
| 2015 | 2014 | 2013 | ||||||||||
|
Income statement data |
||||||||||||
|
In thousands, except per share |
||||||||||||
|
Net income |
||||||||||||
|
Net income |
$ | 1,079,667 | $ | 1,066,246 | $ | 1,138,480 | ||||||
|
Amortization of core deposit and other intangible assets(a) |
16,150 | 20,657 | 28,644 | |||||||||
|
Merger-related expenses(a) |
60,820 | — | 7,511 | |||||||||
|
|
|
|
|
|
|
|||||||
|
Net operating income |
$ | 1,156,637 | $ | 1,086,903 | $ | 1,174,635 | ||||||
|
|
|
|
|
|
|
|||||||
|
Earnings per common share |
||||||||||||
|
Diluted earnings per common share |
$ | 7.18 | $ | 7.42 | $ | 8.20 | ||||||
|
Amortization of core deposit and other intangible assets(a) |
.12 | .15 | .22 | |||||||||
|
Merger-related expenses(a) |
.44 | — | .06 | |||||||||
|
|
|
|
|
|
|
|||||||
|
Diluted net operating earnings per common share |
$ | 7.74 | $ | 7.57 | $ | 8.48 | ||||||
|
|
|
|
|
|
|
|||||||
|
Other expense |
||||||||||||
|
Other expense |
$ | 2,822,932 | $ | 2,689,474 | $ | 2,587,866 | ||||||
|
Amortization of core deposit and other intangible assets |
(26,424 | ) | (33,824 | ) | (46,912 | ) | ||||||
|
Merger-related expenses |
(75,976 | ) | — | (12,364 | ) | |||||||
|
|
|
|
|
|
|
|||||||
|
Noninterest operating expense |
$ | 2,720,532 | $ | 2,655,650 | $ | 2,528,590 | ||||||
|
|
|
|
|
|
|
|||||||
|
Merger-related expenses |
||||||||||||
|
Salaries and employee benefits |
$ | 51,287 | $ | — | $ | 836 | ||||||
|
Equipment and net occupancy |
3 | — | 690 | |||||||||
|
Printing, postage and supplies |
504 | — | 1,825 | |||||||||
|
Other costs of operations |
24,182 | — | 9,013 | |||||||||
|
|
|
|
|
|
|
|||||||
|
Other expense |
75,976 | — | 12,364 | |||||||||
|
Provision for credit losses |
21,000 | — | — | |||||||||
|
|
|
|
|
|
|
|||||||
|
Total |
$ | 96,976 | $ | — | $ | 12,364 | ||||||
|
|
|
|
|
|
|
|||||||
|
Efficiency ratio |
||||||||||||
|
Noninterest operating expense (numerator) |
$ | 2,720,532 | $ | 2,655,650 | $ | 2,528,590 | ||||||
|
|
|
|
|
|
|
|||||||
|
Taxable-equivalent net interest income |
2,867,050 | 2,700,088 | 2,698,200 | |||||||||
|
Other income |
1,825,037 | 1,779,273 | 1,865,205 | |||||||||
|
Less: Gain (loss) on bank investment securities |
(130 | ) | — | 56,457 | ||||||||
|
Net OTTI losses recognized in earnings |
— | — | (9,800 | ) | ||||||||
|
|
|
|
|
|
|
|||||||
|
Denominator |
$ | 4,692,217 | $ | 4,479,361 | $ | 4,516,748 | ||||||
|
|
|
|
|
|
|
|||||||
|
Efficiency ratio |
57.98 | % | 59.29 | % | 55.98 | % | ||||||
|
|
|
|
|
|
|
|||||||
|
Balance sheet data |
||||||||||||
|
In millions |
||||||||||||
|
Average assets |
||||||||||||
|
Average assets |
$ | 101,780 | $ | 92,143 | $ | 83,662 | ||||||
|
Goodwill |
(3,694 | ) | (3,525 | ) | (3,525 | ) | ||||||
|
Core deposit and other intangible assets |
(45 | ) | (50 | ) | (90 | ) | ||||||
|
Deferred taxes |
16 | 15 | 27 | |||||||||
|
|
|
|
|
|
|
|||||||
|
Average tangible assets |
$ | 98,057 | $ | 88,583 | $ | 80,074 | ||||||
|
|
|
|
|
|
|
|||||||
|
Average common equity |
||||||||||||
|
Average total equity |
$ | 13,228 | $ | 12,097 | $ | 10,722 | ||||||
|
Preferred stock |
(1,232 | ) | (1,192 | ) | (878 | ) | ||||||
|
|
|
|
|
|
|
|||||||
|
Average common equity |
11,996 | 10,905 | 9,844 | |||||||||
|
Goodwill |
(3,694 | ) | (3,525 | ) | (3,525 | ) | ||||||
|
Core deposit and other intangible assets |
(45 | ) | (50 | ) | (90 | ) | ||||||
|
Deferred taxes |
16 | 15 | 27 | |||||||||
|
|
|
|
|
|
|
|||||||
|
Average tangible common equity |
$ | 8,273 | $ | 7,345 | $ | 6,256 | ||||||
|
|
|
|
|
|
|
|||||||
|
At end of year |
||||||||||||
|
Total assets |
||||||||||||
|
Total assets |
$ | 122,788 | $ | 96,686 | $ | 85,162 | ||||||
|
Goodwill |
(4,593 | ) | (3,525 | ) | (3,525 | ) | ||||||
|
Core deposit and other intangible assets |
(140 | ) | (35 | ) | (69 | ) | ||||||
|
Deferred taxes |
54 | 11 | 21 | |||||||||
|
|
|
|
|
|
|
|||||||
|
Total tangible assets |
$ | 118,109 | $ | 93,137 | $ | 81,589 | ||||||
|
|
|
|
|
|
|
|||||||
|
Total common equity |
||||||||||||
|
Total equity |
$ | 16,173 | $ | 12,336 | $ | 11,306 | ||||||
|
Preferred stock |
(1,232 | ) | (1,231 | ) | (882 | ) | ||||||
|
Undeclared dividends — cumulative preferred stock |
(2 | ) | (3 | ) | (3 | ) | ||||||
|
|
|
|
|
|
|
|||||||
|
Common equity, net of undeclared cumulative preferred dividends |
14,939 | 11,102 | 10,421 | |||||||||
|
Goodwill |
(4,593 | ) | (3,525 | ) | (3,525 | ) | ||||||
|
Core deposit and other intangible assets |
(140 | ) | (35 | ) | (69 | ) | ||||||
|
Deferred taxes |
54 | 11 | 21 | |||||||||
|
|
|
|
|
|
|
|||||||
|
Total tangible common equity |
$ | 10,260 | $ | 7,553 | $ | 6,848 | ||||||
|
|
|
|
|
|
|
|||||||
| (a) | After any related tax effect. |
46
Table of Contents
Net Interest Income/Lending and Funding Activities
Net interest income expressed on a taxable-equivalent basis totaled $2.87 billion in 2015, up 6% from $2.70 billion in 2014. That increase was the result of higher average earning assets in 2015, including $3.7 billion of average earning assets obtained in the acquisition of Hudson City. Average earning assets rose 12% to $91.2 billion in 2015 from $81.7 billion in 2014. That growth, however, was partially offset by a 17 basis point narrowing of the net interest margin to 3.14% in 2015 from 3.31% in 2014. That narrowing was largely the result of lower average yields on investment securities and loans and leases outstanding.
Average loans and leases increased $6.2 billion or 10% to $70.8 billion in 2015 from $64.7 billion in 2014, due in part to $3.1 billion of average loans obtained in the acquisition of Hudson City. Loans associated with Hudson City totaled $19.0 billion on the acquisition date, consisting of approximately $234 million of commercial real estate loans, $18.6 billion of residential real estate loans and $162 million of consumer loans. Including the impact of the acquired loan balances, average balances of residential real estate loans increased 31% or $2.7 billion to $11.5 billion in 2015 from $8.7 billion in the previous year. Reflected in those amounts were residential real estate loans held for sale, which averaged $415 million in 2015 and $403 million in 2014. Commercial loans and leases averaged $19.9 billion in 2015, up $1.0 billion or 5% from $18.9 billion in 2014. Average commercial real estate loans increased 7% or $1.8 billion to $28.3 billion in 2015 from $26.5 billion in 2014. Average consumer loans totaled $11.2 billion in 2015, up $584 million or 6% from $10.6 billion in the prior year predominantly due to growth in average automobile loan balances.
Taxable-equivalent net interest income totaled $2.70 billion in each of 2014 and 2013. Growth in average earning assets in 2014 was also offset by a narrowing of the net interest margin. Average earning assets rose 10% to $81.7 billion in 2014 from $74.0 billion in 2013, the result of higher average balances of investment securities and interest-bearing deposits at the Federal Reserve Bank of New York. The net interest margin narrowed to 3.31% in 2014 from 3.65% in 2013. Contributing to that decline was a 19 basis point reduction in the average yield on loans and leases and the lower yielding cash balances on deposit with the Federal Reserve Bank of New York.
Average loans and leases declined $388 million or 1% to $64.7 billion in 2014 from $65.1 billion in 2013. Commercial loans and leases averaged $18.9 billion in 2014, $1.1 billion or 6% higher than in the prior year. That growth reflected increased demand by customers. Average balances of commercial real estate loans increased 1% or $379 million to $26.5 billion in 2014 from $26.1 billion in 2013. Average residential real estate balances declined to $8.7 billion in 2014 from $10.1 billion in the preceding year. Included in that portfolio were loans originated for sale, which averaged $403 million in 2014 and $909 million in 2013. Excluding loans held for sale, average residential real estate loans decreased $911 million from 2013 to 2014, resulting largely from the full-year impact of the securitizations during mid-2013 of $1.3 billion of loans held in the loan portfolio. Average consumer loans totaled $10.6 billion in 2014, down $480 million or 4% from $11.1 billion in 2013 due to the full-year impact of a $1.4 billion automobile loan securitization transaction completed during the third quarter of 2013.
47
Table of Contents
Table 3
| 2015 | 2014 | 2013 | 2012 | 2011 | ||||||||||||||||||||||||||||||||||||||||||||||||||||||||
|
Average
Balance |
Interest |
Average
Rate |
Average
Balance |
Interest |
Average
Rate |
Average
Balance |
Interest |
Average
Rate |
Average
Balance |
Interest |
Average
Rate |
Average
Balance |
Interest |
Average
Rate |
||||||||||||||||||||||||||||||||||||||||||||||
| (Average balance in millions; interest in thousands) | ||||||||||||||||||||||||||||||||||||||||||||||||||||||||||||
|
Assets |
||||||||||||||||||||||||||||||||||||||||||||||||||||||||||||
|
Earning assets |
||||||||||||||||||||||||||||||||||||||||||||||||||||||||||||
|
Loans and leases, net of unearned discount(a) |
||||||||||||||||||||||||||||||||||||||||||||||||||||||||||||
|
Commercial, financial, etc. |
$ | 19,899 | $ | 638,199 | 3.21 | % | 18,867 | 624,487 | 3.31 | % | 17,736 | 628,154 | 3.54 | % | 16,336 | 606,495 | 3.71 | % | 14,655 | 564,787 | 3.85 | % | ||||||||||||||||||||||||||||||||||||||
|
Real estate — commercial |
28,276 | 1,193,271 | 4.16 | 26,461 | 1,142,939 | 4.26 | 26,083 | 1,198,400 | 4.53 | 24,907 | 1,138,723 | 4.50 | 22,901 | 1,051,772 | 4.59 | |||||||||||||||||||||||||||||||||||||||||||||
|
Real estate — consumer |
11,458 | 468,790 | 4.09 | 8,719 | 368,632 | 4.23 | 10,136 | 418,095 | 4.12 | 9,727 | 421,516 | 4.33 | 6,778 | 334,421 | 4.93 | |||||||||||||||||||||||||||||||||||||||||||||
|
Consumer |
11,203 | 499,650 | 4.46 | 10,618 | 480,877 | 4.53 | 11,098 | 510,962 | 4.60 | 11,732 | 559,253 | 4.77 | 11,865 | 592,386 | 4.99 | |||||||||||||||||||||||||||||||||||||||||||||
|
|
|
|
|
|
|
|
|
|
|
|
|
|
|
|
|
|
|
|
|
|
|
|
|
|
|
|
|
|
|
|||||||||||||||||||||||||||||||
|
Total loans and leases, net |
70,836 | 2,799,910 | 3.95 | 64,665 | 2,616,935 | 4.05 | 65,053 | 2,755,611 | 4.24 | 62,702 | 2,725,987 | 4.35 | 56,199 | 2,543,366 | 4.53 | |||||||||||||||||||||||||||||||||||||||||||||
|
|
|
|
|
|
|
|
|
|
|
|
|
|
|
|
|
|
|
|
|
|
|
|
|
|
|
|
|
|
|
|||||||||||||||||||||||||||||||
|
Interest-bearing deposits at banks |
5,775 | 15,252 | .26 | 5,342 | 13,361 | .25 | 2,139 | 5,201 | .24 | 528 | 1,221 | .23 | 1,195 | 2,934 | .25 | |||||||||||||||||||||||||||||||||||||||||||||
|
Federal funds sold and agreements to resell securities |
34 | 35 | .10 | 89 | 64 | .07 | 128 | 114 | .09 | 4 | 21 | .55 | 180 | 189 | .11 | |||||||||||||||||||||||||||||||||||||||||||||
|
Trading account |
86 | 1,247 | 1.44 | 76 | 1,381 | 1.81 | 78 | 1,482 | 1.91 | 96 | 1,394 | 1.45 | 94 | 1,411 | 1.50 | |||||||||||||||||||||||||||||||||||||||||||||
|
Investment securities(b) |
||||||||||||||||||||||||||||||||||||||||||||||||||||||||||||
|
U.S. Treasury and federal agencies |
13,514 | 336,873 | 2.49 | 10,543 | 304,178 | 2.88 | 5,123 | 165,879 | 3.24 | 4,538 | 150,500 | 3.32 | 4,165 | 155,339 | 3.73 | |||||||||||||||||||||||||||||||||||||||||||||
|
Obligations of states and political subdivisions |
143 | 6,391 | 4.46 | 166 | 8,115 | 4.89 | 194 | 9,999 | 5.15 | 220 | 11,638 | 5.29 | 244 | 13,704 | 5.61 | |||||||||||||||||||||||||||||||||||||||||||||
|
Other |
799 | 35,599 | 4.45 | 800 | 36,485 | 4.56 | 1,298 | 44,019 | 3.39 | 2,211 | 77,315 | 3.50 | 2,655 | 101,020 | 3.80 | |||||||||||||||||||||||||||||||||||||||||||||
|
|
|
|
|
|
|
|
|
|
|
|
|
|
|
|
|
|
|
|
|
|
|
|
|
|
|
|
|
|
|
|||||||||||||||||||||||||||||||
|
Total investment securities |
14,456 | 378,863 | 2.62 | 11,509 | 348,778 | 3.03 | 6,615 | 219,897 | 3.32 | 6,969 | 239,453 | 3.44 | 7,064 | 270,063 | 3.82 | |||||||||||||||||||||||||||||||||||||||||||||
|
|
|
|
|
|
|
|
|
|
|
|
|
|
|
|
|
|
|
|
|
|
|
|
|
|
|
|
|
|
|
|||||||||||||||||||||||||||||||
|
Total earning assets |
91,187 | 3,195,307 | 3.50 | 81,681 | 2,980,519 | 3.65 | 74,013 | 2,982,305 | 4.03 | 70,299 | 2,968,076 | 4.22 | 64,732 | 2,817,963 | 4.35 | |||||||||||||||||||||||||||||||||||||||||||||
|
|
|
|
|
|
|
|
|
|
|
|
|
|
|
|
|
|
|
|
|
|
|
|
|
|
|
|
|
|
|
|||||||||||||||||||||||||||||||
|
Allowance for credit losses |
(935 | ) | (923 | ) | (932 | ) | (922 | ) | (916 | ) | ||||||||||||||||||||||||||||||||||||||||||||||||||
|
Cash and due from banks |
1,242 | 1,277 | 1,380 | 1,384 | 1,207 | |||||||||||||||||||||||||||||||||||||||||||||||||||||||
|
Other assets |
10,286 | 10,108 | 9,201 | 9,222 | 8,954 | |||||||||||||||||||||||||||||||||||||||||||||||||||||||
|
|
|
|
|
|
|
|
|
|
|
|||||||||||||||||||||||||||||||||||||||||||||||||||
|
Total assets |
$ | 101,780 | 92,143 | 83,662 | 79,983 | 73,977 | ||||||||||||||||||||||||||||||||||||||||||||||||||||||
|
|
|
|
|
|
|
|
|
|
|
|||||||||||||||||||||||||||||||||||||||||||||||||||
|
Liabilities and Shareholders’ Equity |
||||||||||||||||||||||||||||||||||||||||||||||||||||||||||||
|
Interest-bearing liabilities |
||||||||||||||||||||||||||||||||||||||||||||||||||||||||||||
|
Interest-bearing deposits |
||||||||||||||||||||||||||||||||||||||||||||||||||||||||||||
|
Interest-checking deposits |
$ | 1,275 | 1,404 | .11 | 1,034 | 1,404 | .14 | 923 | 1,287 | .14 | 856 | 1,343 | .16 | 753 | 1,145 | .15 | ||||||||||||||||||||||||||||||||||||||||||||
|
Savings deposits |
42,610 | 44,736 | .10 | 40,474 | 45,465 | .11 | 36,739 | 54,948 | .15 | 33,398 | 68,011 | .20 | 30,403 | 84,314 | .28 | |||||||||||||||||||||||||||||||||||||||||||||
|
Time deposits |
4,641 | 27,059 | .58 | 3,290 | 15,515 | .47 | 4,045 | 26,439 | .65 | 5,347 | 46,102 | .86 | 6,480 | 71,014 | 1.10 | |||||||||||||||||||||||||||||||||||||||||||||
|
Deposits at Cayman Islands office |
216 | 615 | .28 | 327 | 699 | .21 | 496 | 1,018 | .21 | 605 | 1,130 | .19 | 779 | 962 | .12 | |||||||||||||||||||||||||||||||||||||||||||||
|
|
|
|
|
|
|
|
|
|
|
|
|
|
|
|
|
|
|
|
|
|
|
|
|
|
|
|
|
|
|
|||||||||||||||||||||||||||||||
|
Total interest-bearing deposits |
48,742 | 73,814 | .15 | 45,125 | 63,083 | .14 | 42,203 | 83,692 | .20 | 40,206 | 116,586 | .29 | 38,415 | 157,435 | .41 | |||||||||||||||||||||||||||||||||||||||||||||
|
|
|
|
|
|
|
|
|
|
|
|
|
|
|
|
|
|
|
|
|
|
|
|
|
|
|
|
|
|
|
|||||||||||||||||||||||||||||||
|
Short-term borrowings |
548 | 1,677 | .31 | 215 | 101 | .05 | 390 | 430 | .11 | 839 | 1,286 | .15 | 827 | 1,030 | .12 | |||||||||||||||||||||||||||||||||||||||||||||
|
Long-term borrowings |
10,217 | 252,766 | 2.47 | 7,492 | 217,247 | 2.90 | 4,941 | 199,983 | 4.05 | 5,527 | 225,297 | 4.08 | 6,959 | 243,866 | 3.50 | |||||||||||||||||||||||||||||||||||||||||||||
|
|
|
|
|
|
|
|
|
|
|
|
|
|
|
|
|
|
|
|
|
|
|
|
|
|
|
|
|
|
|
|||||||||||||||||||||||||||||||
|
Total interest-bearing liabilities |
59,507 | 328,257 | .55 | 52,832 | 280,431 | .53 | 47,534 | 284,105 | .60 | 46,572 | 343,169 | .74 | 46,201 | 402,331 | .87 | |||||||||||||||||||||||||||||||||||||||||||||
|
|
|
|
|
|
|
|
|
|
|
|
|
|
|
|
|
|
|
|
|
|
|
|
|
|
|
|
|
|
|
|||||||||||||||||||||||||||||||
|
Noninterest-bearing deposits |
27,324 | 25,715 | 23,721 | 21,761 | 17,273 | |||||||||||||||||||||||||||||||||||||||||||||||||||||||
|
Other liabilities |
1,721 | 1,499 | 1,685 | 1,947 | 1,499 | |||||||||||||||||||||||||||||||||||||||||||||||||||||||
|
|
|
|
|
|
|
|
|
|
|
|||||||||||||||||||||||||||||||||||||||||||||||||||
|
Total liabilities |
88,552 | 80,046 | 72,940 | 70,280 | 64,973 | |||||||||||||||||||||||||||||||||||||||||||||||||||||||
|
|
|
|
|
|
|
|
|
|
|
|||||||||||||||||||||||||||||||||||||||||||||||||||
|
Shareholders’ equity |
13,228 | 12,097 | 10,722 | 9,703 | 9,004 | |||||||||||||||||||||||||||||||||||||||||||||||||||||||
|
|
|
|
|
|
|
|
|
|
|
|||||||||||||||||||||||||||||||||||||||||||||||||||
|
Total liabilities and shareholders’ equity |
$ | 101,780 | 92,143 | 83,662 | 79,983 | 73,977 | ||||||||||||||||||||||||||||||||||||||||||||||||||||||
|
|
|
|
|
|
|
|
|
|
|
|||||||||||||||||||||||||||||||||||||||||||||||||||
|
Net interest spread |
2.95 | 3.12 | 3.43 | 3.48 | 3.48 | |||||||||||||||||||||||||||||||||||||||||||||||||||||||
|
Contribution of interest-free funds |
.19 | .19 | .22 | .25 | .25 | |||||||||||||||||||||||||||||||||||||||||||||||||||||||
|
|
|
|
|
|
|
|
|
|
|
|
|
|
|
|
|
|
|
|
|
|||||||||||||||||||||||||||||||||||||||||
|
Net interest income/margin on earning assets |
$ | 2,867,050 | 3.14 | % | 2,700,088 | 3.31 | % | 2,698,200 | 3.65 | % | 2,624,907 | 3.73 | % | 2,415,632 | 3.73 | % | ||||||||||||||||||||||||||||||||||||||||||||
|
|
|
|
|
|
|
|
|
|
|
|
|
|
|
|
|
|
|
|
|
|||||||||||||||||||||||||||||||||||||||||
| (a) | Includes nonaccrual loans. |
| (b) | Includes available-for-sale investment securities at amortized cost. |
48
Table of Contents
Table 4 summarizes average loans and leases outstanding in 2015 and percentage changes in the major components of the portfolio over the past two years.
Table 4
AVERAGE LOANS AND LEASES
(Net of unearned discount)
|
Percent Increase
(Decrease) from |
||||||||||||
| 2015 | 2014 to 2015 | 2013 to 2014 | ||||||||||
| (In millions) | ||||||||||||
|
Commercial, financial, etc. |
$ | 19,899 | 5 | % | 6 | % | ||||||
|
Real estate — commercial |
28,276 | 7 | 1 | |||||||||
|
Real estate — consumer |
11,458 | 31 | (14 | ) | ||||||||
|
Consumer |
||||||||||||
|
Automobile |
2,216 | 32 | (23 | ) | ||||||||
|
Home equity lines and loans |
5,913 | (2 | ) | (2 | ) | |||||||
|
Other |
3,074 | 7 | 5 | |||||||||
|
|
|
|
|
|
|
|||||||
|
Total consumer |
11,203 | 6 | (4 | ) | ||||||||
|
|
|
|
|
|
|
|||||||
|
Total |
$ | 70,836 | 10 | % | (1 | )% | ||||||
|
|
|
|
|
|
|
|||||||
Commercial loans and leases, excluding loans secured by real estate, aggregated $20.4 billion at December 31, 2015, representing 23% of total loans and leases. Table 5 presents information on commercial loans and leases as of December 31, 2015 relating to geographic area, size, borrower industry and whether the loans are secured by collateral or unsecured. Of the $20.4 billion of commercial loans and leases outstanding at the end of 2015, approximately $18.0 billion, or 88%, were secured, while 42%, 26% and 21% were granted to businesses in New York State, Pennsylvania and the Mid-Atlantic area (which includes Delaware, Maryland, New Jersey, Virginia, West Virginia and the District of Columbia), respectively. The Company provides financing for leases to commercial customers, primarily for equipment. Commercial leases included in total commercial loans and leases at December 31, 2015 aggregated $1.2 billion, of which 50% were secured by collateral located in New York State, 16% were secured by collateral in Pennsylvania and another 14% were secured by collateral in the Mid-Atlantic area.
49
Table of Contents
Table 5
COMMERCIAL LOANS AND LEASES, NET OF UNEARNED DISCOUNT
(Excludes Loans Secured by Real Estate)
December 31, 2015
| New York | Pennsylvania | Mid-Atlantic(a) | Other | Total | Percent of Total | |||||||||||||||||||
| (Dollars in millions) | ||||||||||||||||||||||||
|
Automobile dealerships |
$ | 1,645 | $ | 868 | $ | 441 | $ | 747 | $ | 3,701 | 18 | % | ||||||||||||
|
Manufacturing |
1,727 | 1,024 | 531 | 319 | 3,601 | 18 | ||||||||||||||||||
|
Services |
1,139 | 707 | 1,069 | 276 | 3,191 | 16 | ||||||||||||||||||
|
Wholesale |
774 | 498 | 497 | 109 | 1,878 | 9 | ||||||||||||||||||
|
Real estate investors |
742 | 230 | 242 | 87 | 1,301 | 6 | ||||||||||||||||||
|
Financial and insurance |
595 | 308 | 211 | 139 | 1,253 | 6 | ||||||||||||||||||
|
Transportation, communications, utilities |
304 | 394 | 257 | 265 | 1,220 | 6 | ||||||||||||||||||
|
Health services |
509 | 206 | 378 | 95 | 1,188 | 6 | ||||||||||||||||||
|
Construction |
394 | 260 | 188 | 50 | 892 | 4 | ||||||||||||||||||
|
Retail |
217 | 233 | 213 | 85 | 748 | 4 | ||||||||||||||||||
|
Public administration |
166 | 69 | 39 | 1 | 275 | 1 | ||||||||||||||||||
|
Agriculture, forestry, fishing, etc. |
22 | 138 | 33 | 1 | 194 | 1 | ||||||||||||||||||
|
Other |
419 | 273 | 277 | 11 | 980 | 5 | ||||||||||||||||||
|
|
|
|
|
|
|
|
|
|
|
|
|
|||||||||||||
|
Total |
$ | 8,653 | $ | 5,208 | $ | 4,376 | $ | 2,185 | $ | 20,422 | 100 | % | ||||||||||||
|
|
|
|
|
|
|
|
|
|
|
|
|
|||||||||||||
|
Percent of total |
42 | % | 26 | % | 21 | % | 11 | % | 100 | % | ||||||||||||||
|
|
|
|
|
|
|
|
|
|
|
|||||||||||||||
|
Percent of dollars outstanding |
||||||||||||||||||||||||
|
Secured |
82 | % | 80 | % | 84 | % | 80 | % | 82 | % | ||||||||||||||
|
Unsecured |
11 | 16 | 12 | 9 | 12 | |||||||||||||||||||
|
Leases |
7 | 4 | 4 | 11 | 6 | |||||||||||||||||||
|
|
|
|
|
|
|
|
|
|
|
|||||||||||||||
|
Total |
100 | % | 100 | % | 100 | % | 100 | % | 100 | % | ||||||||||||||
|
|
|
|
|
|
|
|
|
|
|
|||||||||||||||
|
Percent of dollars outstanding by size of loan |
||||||||||||||||||||||||
|
Less than $1 million |
24 | % | 20 | % | 28 | % | 9 | % | 23 | % | ||||||||||||||
|
$1 million to $5 million |
26 | 24 | 21 | 22 | 23 | |||||||||||||||||||
|
$5 million to $10 million |
15 | 17 | 17 | 21 | 16 | |||||||||||||||||||
|
$10 million to $20 million |
16 | 22 | 17 | 26 | 19 | |||||||||||||||||||
|
$20 million to $30 million |
7 | 9 | 7 | 10 | 8 | |||||||||||||||||||
|
$30 million to $50 million |
5 | 8 | 9 | 7 | 7 | |||||||||||||||||||
|
Greater than $50 million |
7 | — | 1 | 5 | 4 | |||||||||||||||||||
|
|
|
|
|
|
|
|
|
|
|
|||||||||||||||
|
Total |
100 | % | 100 | % | 100 | % | 100 | % | 100 | % | ||||||||||||||
|
|
|
|
|
|
|
|
|
|
|
|||||||||||||||
| (a) | Includes Delaware, Maryland, New Jersey, Virginia, West Virginia and the District of Columbia. |
International loans included in commercial loans and leases totaled $191 million and $167 million at December 31, 2015 and 2014, respectively. Included in such loans were $64 million and $61 million, respectively, of loans at M&T Bank’s commercial banking office in Ontario, Canada. The remaining international loans are predominantly to domestic companies with foreign operations.
Loans secured by real estate, including outstanding balances of home equity loans and lines of credit which the Company classifies as consumer loans, represented approximately 64% of the loan and lease portfolio during 2015 and 2014, compared with 65% in 2013. At December 31, 2015, the Company held approximately $29.2 billion of commercial real estate loans, $26.3 billion of consumer real estate loans secured by one-to-four family residential properties (including $353 million of loans originated for sale) and $6.0 billion of outstanding balances of home equity loans and lines of credit, compared with $27.6 billion, $8.7 billion and $6.0 billion, respectively, at December 31, 2014. The substantial increase in the residential real estate loans reflects $18.0 billion of remaining loans obtained in the acquisition of Hudson City. Those loans totaled $18.6 billion on November 1, 2015.
50
Table of Contents
Included in commercial real estate loans at December 31, 2015 and 2014 were construction loans of $5.1 billion and $5.0 billion, respectively, including amounts due from builders and developers of residential real estate aggregating $1.6 billion and $1.5 billion at December 31, 2015 and 2014, respectively.
Commercial real estate loans originated by the Company include fixed-rate instruments with monthly payments and a balloon payment of the remaining unpaid principal at maturity, in many cases five years after origination. For borrowers in good standing, the terms of such loans may be extended by the customer for an additional five years at the then-current market rate of interest. The Company also originates fixed-rate commercial real estate loans with maturities of greater than five years, generally having original maturity terms of approximately seven to ten years, and adjustable-rate commercial real estate loans. Adjustable-rate commercial real estate loans represented approximately 69% of the commercial real estate loan portfolio at the 2015 year-end. Table 6 presents commercial real estate loans by geographic area, type of collateral and size of the loans outstanding at December 31, 2015. New York City area commercial real estate loans totaled $8.3 billion at December 31, 2015. The $6.8 billion of investor-owned commercial real estate loans in the New York City area were largely secured by multifamily residential properties, retail space, and office space. The Company’s experience has been that office, retail and service-related properties tend to demonstrate more volatile fluctuations in value through economic cycles and changing economic conditions than do multifamily residential properties. Approximately 39% of the aggregate dollar amount of New York City area loans were for loans with outstanding balances of $10 million or less, while loans of more than $50 million made up approximately 13% of the total.
51
Table of Contents
Table 6
COMMERCIAL REAL ESTATE LOANS, NET OF UNEARNED DISCOUNT
December 31, 2015
| New York State | ||||||||||||||||||||||||||||
|
New York
City |
Other | Pennsylvania |
Mid-
Atlantic(a) |
Other | Total |
Percent of
Total |
||||||||||||||||||||||
| (Dollars in millions) | ||||||||||||||||||||||||||||
|
Investor-owned |
||||||||||||||||||||||||||||
|
Permanent finance by property type |
||||||||||||||||||||||||||||
|
Office |
$ | 1,168 | $ | 900 | $ | 532 | $ | 1,380 | $ | 446 | $ | 4,426 | 15 | % | ||||||||||||||
|
Apartments/Multifamily |
1,866 | 640 | 333 | 765 | 371 | 3,975 | 14 | |||||||||||||||||||||
|
Retail/Service |
1,378 | 460 | 436 | 924 | 489 | 3,687 | 13 | |||||||||||||||||||||
|
Hotel |
648 | 426 | 263 | 627 | 283 | 2,247 | 8 | |||||||||||||||||||||
|
Industrial/Warehouse |
213 | 224 | 292 | 272 | 274 | 1,275 | 4 | |||||||||||||||||||||
|
Health facilities |
37 | 81 | 21 | 86 | 12 | 237 | 1 | |||||||||||||||||||||
|
Other |
197 | 30 | 11 | 27 | 19 | 284 | 1 | |||||||||||||||||||||
|
|
|
|
|
|
|
|
|
|
|
|
|
|
|
|||||||||||||||
|
Total permanent |
5,507 | 2,761 | 1,888 | 4,081 | 1,894 | 16,131 | 56 | % | ||||||||||||||||||||
|
|
|
|
|
|
|
|
|
|
|
|
|
|
|
|||||||||||||||
|
Construction/Development |
||||||||||||||||||||||||||||
|
Commercial |
||||||||||||||||||||||||||||
|
Construction |
418 | 400 | 361 | 827 | 421 | 2,427 | 8 | % | ||||||||||||||||||||
|
Land/Land development |
309 | 24 | 46 | 190 | 78 | 647 | 3 | |||||||||||||||||||||
|
Residential builder and developer |
||||||||||||||||||||||||||||
|
Construction |
585 | 1 | 131 | 223 | 242 | 1,182 | 4 | |||||||||||||||||||||
|
Land/Land development |
10 | 17 | 21 | 193 | 162 | 403 | 1 | |||||||||||||||||||||
|
|
|
|
|
|
|
|
|
|
|
|
|
|
|
|||||||||||||||
|
Total construction/development |
1,322 | 442 | 559 | 1,433 | 903 | 4,659 | 16 | % | ||||||||||||||||||||
|
|
|
|
|
|
|
|
|
|
|
|
|
|
|
|||||||||||||||
|
Total investor-owned |
6,829 | 3,203 | 2,447 | 5,514 | 2,797 | 20,790 | 72 | % | ||||||||||||||||||||
|
|
|
|
|
|
|
|
|
|
|
|
|
|
|
|||||||||||||||
|
Owner-occupied by industry(b) |
||||||||||||||||||||||||||||
|
Health services |
453 | 453 | 378 | 796 | 320 | 2,400 | 8 | % | ||||||||||||||||||||
|
Other services |
185 | 387 | 278 | 653 | 82 | 1,585 | 5 | |||||||||||||||||||||
|
Retail |
156 | 171 | 201 | 308 | 59 | 895 | 3 | |||||||||||||||||||||
|
Automobile dealerships |
96 | 181 | 229 | 192 | 156 | 854 | 3 | |||||||||||||||||||||
|
Manufacturing |
75 | 204 | 160 | 149 | 32 | 620 | 2 | |||||||||||||||||||||
|
Wholesale |
70 | 59 | 153 | 263 | 55 | 600 | 2 | |||||||||||||||||||||
|
Real estate investors |
38 | 60 | 69 | 67 | 2 | 236 | 1 | |||||||||||||||||||||
|
Other |
383 | 212 | 257 | 360 | 5 | 1,217 | 4 | |||||||||||||||||||||
|
|
|
|
|
|
|
|
|
|
|
|
|
|
|
|||||||||||||||
|
Total owner-occupied |
1,456 | 1,727 | 1,725 | 2,788 | 711 | 8,407 | 28 | % | ||||||||||||||||||||
|
|
|
|
|
|
|
|
|
|
|
|
|
|
|
|||||||||||||||
|
Total commercial real estate |
$ | 8,285 | $ | 4,930 | $ | 4,172 | $ | 8,302 | $ | 3,508 | $ | 29,197 | 100 | % | ||||||||||||||
|
|
|
|
|
|
|
|
|
|
|
|
|
|
|
|||||||||||||||
|
Percent of total |
28 | % | 17 | % | 14 | % | 29 | % | 12 | % | 100 | % | ||||||||||||||||
|
|
|
|
|
|
|
|
|
|
|
|
|
|||||||||||||||||
|
Percent of dollars outstanding by size of loan |
||||||||||||||||||||||||||||
|
Less than $1 million |
4 | % | 20 | % | 17 | % | 12 | % | 9 | % | 11 | % | ||||||||||||||||
|
$1 million to $5 million |
19 | 34 | 27 | 23 | 17 | 24 | ||||||||||||||||||||||
|
$5 million to $10 million |
16 | 19 | 18 | 16 | 19 | 17 | ||||||||||||||||||||||
|
$10 million to $30 million |
33 | 24 | 31 | 27 | 35 | 30 | ||||||||||||||||||||||
|
$30 million to $50 million |
15 | 3 | 4 | 10 | 11 | 10 | ||||||||||||||||||||||
|
$50 million to $100 million |
12 | — | 3 | 12 | 9 | 8 | ||||||||||||||||||||||
|
Greater than $100 million |
1 | — | — | — | — | — | ||||||||||||||||||||||
|
|
|
|
|
|
|
|
|
|
|
|
|
|||||||||||||||||
|
Total |
100 | % | 100 | % | 100 | % | 100 | % | 100 | % | 100 | % | ||||||||||||||||
|
|
|
|
|
|
|
|
|
|
|
|
|
|||||||||||||||||
| (a) | Includes Delaware, Maryland, New Jersey, Virginia, West Virginia and the District of Columbia. |
| (b) | Includes $472 million of construction loans |
52
Table of Contents
Commercial real estate loans secured by properties located in other parts of New York State, Pennsylvania and the Mid-Atlantic area tend to have a greater diversity of collateral types and include a significant amount of lending to customers who use the mortgaged property in their trade or business (owner-occupied). Approximately 73% of the aggregate dollar amount of commercial real estate loans in New York State secured by properties located outside of the New York City area were for loans with outstanding balances of $10 million or less. Of the outstanding balances of commercial real estate loans in Pennsylvania and the Mid-Atlantic area, approximately 62% and 51%, respectively, were for loans with outstanding balances of $10 million or less.
Commercial real estate loans secured by properties located outside of Pennsylvania, the Mid-Atlantic area and New York State comprised 12% of total commercial real estate loans as of December 31, 2015.
Commercial real estate construction and development loans made to investors presented in table 6 totaled $4.7 billion at December 31, 2015, or 5% of total loans and leases. Approximately 95% of those construction loans had adjustable interest rates. Included in such loans at the 2015 year-end were $1.6 billion of loans to developers of residential real estate properties. Information about the credit performance of the Company’s loans to builders and developers of residential real estate properties is included herein under the heading “Provision For Credit Losses.” The remainder of the commercial real estate construction loan portfolio was comprised of loans made for various purposes, including the construction of office buildings, multifamily residential housing, retail space and other commercial development.
M&T Realty Capital Corporation, a commercial real estate lending subsidiary of M&T Bank, participates in the Delegated Underwriting and Servicing (“DUS”) program of Fannie Mae, pursuant to which commercial real estate loans are originated in accordance with terms and conditions specified by Fannie Mae and sold. Under this program, loans are sold with partial credit recourse to M&T Realty Capital Corporation. The amount of recourse is generally limited to one-third of any credit loss incurred by the purchaser on an individual loan, although in some cases the recourse amount is less than one-third of the outstanding principal balance. The Company’s maximum credit risk for recourse associated with sold commercial real estate loans was approximately $2.5 billion and $2.4 billion at December 31, 2015 and 2014, respectively. There have been no material losses incurred as a result of those recourse arrangements. Commercial real estate loans held for sale at December 31, 2015 and 2014 aggregated $39 million and $308 million, respectively. At December 31, 2015 and 2014, commercial real estate loans serviced by the Company for other investors were $11.0 billion and $11.3 billion, respectively. Those serviced loans are not included in the Company’s consolidated balance sheet.
Real estate loans secured by one-to-four family residential properties were $26.3 billion at December 31, 2015, including approximately 33% secured by properties located in New York State, 7% secured by properties located in Pennsylvania, 31% secured by properties in New Jersey and 10% secured by properties located in other Mid-Atlantic areas. At December 31, 2015, $353 million of residential real estate loans had been originated for sale, compared with $435 million at December 31, 2014. The Company’s portfolio of alternative (“Alt-A”) residential real estate loans (referred to as “limited documentation loans”) held for investment increased by $3.9 billion to $4.3 billion at December 31, 2015 from $339 million at December 31, 2014. The increase was due to the portfolio of limited documentation loans acquired with the Hudson City transaction which totaled $4.0 billion at December 31, 2015. Alt-A loans represent loans that at origination typically included some form of limited borrower documentation requirements as compared with more traditional residential real estate loans. Hudson City loans that were eligible for limited documentation processing were available in amounts up to 65% of the lower of the appraised value or purchase price of the property. Hudson City discontinued its limited documentation loan program in January 2014. Loans in the Company’s Alt-A portfolio prior to the Hudson City transaction were originated by the Company prior to 2008. Loans to individuals to finance the construction of one-to-four family residential properties totaled $34 million at December 31, 2015 and $35 million at December 31, 2014, or less than .1% of total loans and leases at each of those dates. Information about the credit performance of the Company’s residential real estate loans is included herein under the heading “Provision For Credit Losses.”
Consumer loans comprised approximately 13% of total loans and leases at December 31, 2015 and 16% at December 31, 2014. Outstanding balances of home equity loans and lines of credit
53
Table of Contents
represent the largest component of the consumer loan portfolio. Such balances represented approximately 7% of total loans and leases at December 31, 2015 and 9% at December 31, 2014. No other consumer loan product represented at least 3% of loans outstanding at December 31, 2015. Approximately 39% of home equity loans and lines of credit outstanding at December 31, 2015 were secured by properties in New York State, 21% in Pennsylvania, 27% in Maryland and 3% in New Jersey. Outstanding automobile loan balances rose to $2.5 billion at December 31, 2015 from $2.0 billion at December 31, 2014. That increase reflects consumer demand for motor vehicles.
Table 7 presents the composition of the Company’s loan and lease portfolio at the end of 2015, including outstanding balances to businesses and consumers in New York State, Pennsylvania, the Mid-Atlantic area and other states. Approximately 39% of total loans and leases at December 31, 2015 were to New York State customers, while 16% and 31% were to Pennsylvania and the Mid-Atlantic area customers, respectively.
Table 7
LOANS AND LEASES, NET OF UNEARNED DISCOUNT
December 31, 2015
| Percent of Dollars Outstanding | ||||||||||||||||||||||||||||
| Mid-Atlantic | ||||||||||||||||||||||||||||
| Outstandings | New York |
Penn-
sylvania |
Maryland |
New
Jersey |
Other(a) | Other | ||||||||||||||||||||||
| (In millions) | ||||||||||||||||||||||||||||
|
Real estate |
||||||||||||||||||||||||||||
|
Residential |
$ | 26,270 | 33 | % | 7 | % | 5 | % | 31 | % | 5 | % | 19 | % | ||||||||||||||
|
Commercial |
29,197 | 45 | 14 | 13 | 6 | 10 | 12 | |||||||||||||||||||||
|
|
|
|
|
|
|
|
|
|
|
|
|
|
|
|||||||||||||||
|
Total real estate |
55,467 | 40 | % | 11 | % | 9 | % | 17 | % | 8 | % | 15 | % | |||||||||||||||
|
|
|
|
|
|
|
|
|
|
|
|
|
|
|
|||||||||||||||
|
Commercial, financial, etc. |
19,213 | 42 | % | 26 | % | 12 | % | 4 | % | 6 | % | 10 | % | |||||||||||||||
|
Consumer |
||||||||||||||||||||||||||||
|
Home equity lines and loans |
5,953 | 39 | % | 21 | % | 27 | % | 3 | % | 9 | % | 1 | % | |||||||||||||||
|
Automobile |
2,519 | 29 | 23 | 10 | 7 | 8 | 23 | |||||||||||||||||||||
|
Other secured or guaranteed |
2,409 | 23 | 13 | 7 | 7 | 4 | 46 | |||||||||||||||||||||
|
Other unsecured |
719 | 39 | 23 | 23 | — | 3 | 12 | |||||||||||||||||||||
|
|
|
|
|
|
|
|
|
|
|
|
|
|
|
|||||||||||||||
|
Total consumer |
11,600 | 34 | % | 20 | % | 19 | % | 4 | % | 7 | % | 16 | % | |||||||||||||||
|
|
|
|
|
|
|
|
|
|
|
|
|
|
|
|||||||||||||||
|
Total loans |
86,280 | 39 | % | 16 | % | 11 | % | 13 | % | 7 | % | 14 | % | |||||||||||||||
|
|
|
|
|
|
|
|
|
|
|
|
|
|
|
|||||||||||||||
|
Commercial leases |
1,209 | 50 | % | 16 | % | 9 | % | 3 | % | 2 | % | 20 | % | |||||||||||||||
|
|
|
|
|
|
|
|
|
|
|
|
|
|
|
|||||||||||||||
|
Total loans and leases |
$ | 87,489 | 39 | % | 16 | % | 11 | % | 13 | % | 7 | % | 14 | % | ||||||||||||||
|
|
|
|
|
|
|
|
|
|
|
|
|
|
|
|||||||||||||||
| (a) | Includes Delaware, Virginia, West Virginia and the District of Columbia. |
Balances of investment securities averaged $14.5 billion in 2015, up from $11.5 billion and $6.6 billion in 2014 and 2013, respectively. The significant rise in such balances since 2013 reflects the net effect of purchases of mortgage-backed securities and the impact of investment securities sales and securitizations. Beginning in the second quarter of 2013, the Company undertook certain actions to improve its regulatory capital and liquidity positions in response to evolving regulatory requirements, including the requirements of the LCR that became effective in January 2016. Purchases of Fannie Mae and Ginnie Mae mortgage-backed securities totaled $3.5 billion in 2015, $5.2 billion in 2014 and $2.2 billion in 2013. Additionally, mortgage-backed securities retained from the acquisition of Hudson City were $1.2 billion at December 31, 2015. Furthermore, in the second quarter of 2013 approximately $1.0 billion of privately issued mortgage-backed securities held in the available-for-sale portfolio were sold, as were the Company’s holdings of Visa and MasterCard common stock. In the second and third quarters of 2013, the Company securitized approximately $1.3 billion of residential real estate loans guaranteed by the Federal Housing Administration
54
Table of Contents
(“FHA”) that were held in its loan portfolio. A substantial majority of the Ginnie Mae securities resulting from those securitizations were retained by the Company. During the second quarter of 2013, the Company also began originating FHA residential real estate loans for purposes of securitizing such loans into Ginnie Mae mortgage-backed securities to be retained in the Company’s investment securities portfolio. Mortgage-backed securities added to the investment portfolio through these origination activities were $65 million in 2015, $135 million in 2014 and $1.7 billion in 2013.
The investment securities portfolio is largely comprised of residential mortgage-backed securities, debt securities issued by municipalities, trust preferred securities issued by certain financial institutions, and shorter-term U.S. Treasury and federal agency notes. When purchasing investment securities, the Company considers its liquidity position and its overall interest-rate risk profile as well as the adequacy of expected returns relative to risks assumed, including prepayments. In managing its investment securities portfolio, the Company occasionally sells investment securities as a result of changes in interest rates and spreads, actual or anticipated prepayments, credit risk associated with a particular security, or as a result of restructuring its investment securities portfolio in connection with a business combination. As noted above, in 2013 the Company sold investment securities to reduce its exposure to higher risk securities in response to changing regulatory capital and liquidity standards. Furthermore, as mentioned previously, immediately following the acquisition of Hudson City, the Company restructured its balance sheet by selling $5.8 billion of investment securities obtained in the transaction.
The Company regularly reviews its investment securities for declines in value below amortized cost that might be characterized as “other than temporary.” Nevertheless, there were no other-than-temporary impairment charges recognized in 2015 or 2014. Pre-tax other-than-temporary impairment charges of $10 million were recognized during 2013 related to certain privately issued mortgage-backed securities. Persistently high unemployment, loan delinquencies and foreclosures that led to a backlog of homes held for sale by financial institutions and others were significant factors contributing to the recognition of the other-than-temporary impairment charges related to those securities. As noted earlier, substantially all of the privately issued mortgage-backed securities held in the available-for-sale portfolio were sold in the second quarter of 2013. The impairment charges recognized during 2013 related to a subset of those sold securities. Based on management’s assessment of future cash flows associated with individual investment securities as of December 31, 2015, the Company concluded that declines in value below amortized cost associated with the investment securities portfolio were temporary in nature. A further discussion of fair values of investment securities is included herein under the heading “Capital.” Additional information about the investment securities portfolio is included in notes 3 and 20 of Notes to Financial Statements.
Other earning assets include interest-bearing deposits at the Federal Reserve Bank of New York and other banks, trading account assets, federal funds sold and agreements to resell securities. Those other earning assets in the aggregate averaged $5.9 billion in 2015, $5.5 billion in 2014 and $2.3 billion in 2013. Interest-bearing deposits at banks averaged $5.8 billion in 2015, compared with $5.3 billion and $2.1 billion in 2014 and 2013, respectively. The higher levels of average interest-bearing deposits at banks in 2014 when compared with 2013 were due, in part, to higher Wilmington Trust-related customer deposits. The amounts of investment securities and other earning assets held by the Company are influenced by such factors as demand for loans, which generally yield more than investment securities and other earning assets, ongoing repayments, the levels of deposits, and management of liquidity (including the LCR) and balance sheet size and resulting capital ratios.
The most significant source of funding for the Company is core deposits. The Company considers noninterest-bearing deposits, interest-bearing transaction accounts, savings deposits and time deposits of $250,000 or less as core deposits. The Company’s branch network is its principal source of core deposits, which generally carry lower interest rates than wholesale funds of comparable maturities. Average core deposits totaled $74.2 billion in 2015, up from $69.1 billion in 2014 and $63.8 billion in 2013. The Hudson City acquisition added approximately $17.0 billion of core deposits on November 1, 2015, including $9.7 billion of time deposits, $6.6 billion of savings deposits and $691 million of noninterest-bearing deposits. The Hudson City acquisition contributed approximately $2.8 billion to the Company’s average core deposits in 2015. Excluding the impact of the merger, growth in average core deposits from the prior year reflects an increase of approximately $1.6 billion in commercial customer deposits. The growth in average core deposits from 2013 to 2014
55
Table of Contents
reflects increases of approximately $2.6 billion of deposits from trust customers and $1.7 billion in commercial customer deposits. Funding provided by core deposits represented 81% of average earning assets in 2015, compared with 85% and 86% in 2014 and 2013, respectively. Table 8 summarizes average core deposits in 2015 and percentage changes in the components of such deposits over the past two years. Core deposits aggregated $89.3 billion and $72.0 billion at December 31, 2015 and 2014, respectively.
Table 8
AVERAGE CORE DEPOSITS
|
Percentage Increase
(Decrease) from |
||||||||||||
| 2015 | 2014 to 2015 | 2013 to 2014 | ||||||||||
| (In millions) | ||||||||||||
|
Interest-checking deposits |
$ | 1,250 | 24 | % | 12 | % | ||||||
|
Savings deposits |
41,522 | 5 | 10 | |||||||||
|
Time deposits |
4,103 | 40 | (15 | ) | ||||||||
|
Noninterest-bearing deposits |
27,324 | 6 | 8 | |||||||||
|
|
|
|
|
|
|
|||||||
|
Total |
$ | 74,199 | 7 | % | 8 | % | ||||||
|
|
|
|
|
|
|
|||||||
The Company also receives funding from other deposit sources, including branch-related time deposits over $250,000, deposits associated with the Company’s Cayman Islands office, and brokered deposits. Time deposits over $250,000, excluding brokered certificates of deposit, averaged $501 million in 2015, $366 million in 2014 and $325 million in 2013. Cayman Islands office deposits averaged $216 million in 2015, $327 million in 2014 and $496 million in 2013. Brokered time deposits averaged $37 million in 2015, compared with $4 million in 2014 and $279 million in 2013. The Company also had brokered interest-bearing transaction and brokered money-market deposit accounts, which in the aggregate averaged $1.1 billion in each of 2015, 2014 and 2013. The levels of brokered deposit accounts reflect the demand for such deposits, largely resulting from the desire of brokerage firms to earn reasonable yields while ensuring that customer deposits are fully insured. The level of Cayman Islands office deposits is also reflective of customer demand. Additional amounts of Cayman Islands office deposits or brokered deposits may be added in the future depending on market conditions, including demand by customers and other investors for those deposits, and the cost of funds available from alternative sources at the time.
The Company also uses borrowings from banks, securities dealers, various Federal Home Loan Banks, the Federal Reserve Bank of New York and others as sources of funding. Short-term borrowings represent borrowing arrangements that at the time they were entered into had a contractual maturity of less than one year. Average short-term borrowings were $548 million in 2015, $215 million in 2014 and $390 million in 2013. The increase in 2015 was predominantly due to short-term borrowings from the Federal Home Loan Bank (“FHLB”) of New York of $2.0 billion assumed in the Hudson City acquisition. Those short-term fixed-rate borrowings have various maturity dates throughout 2016 and contributed $361 million to the increase in the average balances of short-term borrowings in 2015. There were no short-term borrowings from the Federal Home Loan Banks in 2014 or 2013. Also included in short-term borrowings were unsecured federal funds borrowings, which generally mature on the next business day, that averaged $138 million, $156 million and $284 million in 2015, 2014 and 2013, respectively. Overnight federal funds borrowings totaled $99 million at December 31, 2015 and $135 million at December 31, 2014.
Long-term borrowings averaged $10.2 billion in 2015, $7.5 billion in 2014 and $4.9 billion in 2013. M&T Bank has a Bank Note Program whereby M&T Bank may offer unsecured senior and subordinated notes. Through December 31, 2015, only unsecured senior notes totaling $5.5 billion have been issued. Average balances of notes issued under that program were $5.3 billion in 2015, $2.9 billion in 2014 and $657 million in 2013. During March 2013, $300 million of three-year floating rate notes and $500 million of three-year fixed rate notes were issued. During 2014, M&T Bank issued $550 million of three-year floating rate, $1.25 billion of three-year fixed rate and $1.4 billion of five-year fixed rate notes. During 2015, M&T Bank issued $1.5 billion of fixed rate notes of which $750
56
Table of Contents
million mature in 2020 and $750 million mature in 2025. The proceeds from the issuances of borrowings under the Bank Note Program have been predominantly utilized to purchase high quality liquid assets that meet the requirements of the LCR. Also included in average long-term borrowings were amounts borrowed from the Federal Home Loan Banks of New York, Atlanta and Pittsburgh of $1.2 billion in 2015, $692 million in 2014 and $30 million in 2013, and subordinated capital notes of $1.5 billion in 2015 and $1.6 billion in each of 2014 and 2013. During the second quarter of 2014, M&T Bank borrowed approximately $1.1 billion from the FHLB of New York. Those borrowings were split between three-year and five-year terms at fixed rates of interest. In 2013, $250 million of 4.875% subordinated notes of the Company matured and were redeemed. In November 2014, M&T Bank redeemed $50 million of 9.50% subordinated notes that were due to mature in 2018. In the first quarter of 2014, M&T redeemed $350 million of 8.50% junior subordinated debentures associated with trust preferred securities. In accordance with its 2015 capital plan, on April 15, 2015 M&T redeemed the junior subordinated debentures associated with the $310 million of trust preferred securities of M&T Capital Trusts I, II and III. Those borrowings had a weighted-average interest rate of 8.24%. Junior subordinated debentures associated with trust preferred securities that were included in average long-term borrowings were $605 million in 2015, $889 million in 2014 and $1.2 billion in 2013. Additional information regarding junior subordinated debentures, as well as information regarding contractual maturities of long-term borrowings, is provided in note 9 of Notes to Financial Statements. Also included in long-term borrowings were agreements to repurchase securities, which averaged $1.5 billion in 2015 and $1.4 billion during each of 2014 and 2013. Agreements to repurchase securities assumed in connection with the Hudson City acquisition totaled $6.9 billion at November 1, 2015. Immediately following the November 1, 2015 Hudson City acquisition date the balance sheet was restructured and $6.4 billion of the assumed repurchase agreements were repaid. The agreements held at December 31, 2015 have various repurchase dates through 2020, however, the contractual maturities of the underlying securities extend beyond such repurchase dates. The Company has utilized interest rate swap agreements to modify the repricing characteristics of certain components of long-term debt. As of December 31, 2015, interest rate swap agreements were used to hedge approximately $1.4 billion of outstanding fixed rate long-term borrowings. Further information on interest rate swap agreements is provided in note 18 of Notes to Financial Statements.
Changes in the composition of the Company’s earning assets and interest-bearing liabilities, as discussed herein, as well as changes in interest rates and spreads, can impact net interest income. Net interest spread, or the difference between the taxable-equivalent yield on earning assets and the rate paid on interest-bearing liabilities, was 2.95% in 2015, compared with 3.12% in 2014 and 3.43% in 2013. The yield on the Company’s earning assets declined 15 basis points to 3.50% in 2015 from 3.65% in 2014, while the rate paid on interest-bearing liabilities increased 2 basis points to .55% in 2015 from .53% in 2014. The yield on earning assets during 2014 decreased 38 basis points from 4.03% in 2013, while the rate paid on interest-bearing liabilities declined 7 basis points from .60% in 2013. The narrowing of the net interest spread in 2015 and 2014 reflects the ongoing impact of the low interest rate environment on the yields earned on investments and loans, higher average balances of investment securities and long-term borrowings, and the higher levels of deposits held at the Federal Reserve Bank of New York.
Net interest-free funds consist largely of noninterest-bearing demand deposits and shareholders’ equity, partially offset by bank owned life insurance and non-earning assets, including goodwill and core deposit and other intangible assets. Net interest-free funds averaged $31.7 billion in 2015, compared with $28.8 billion in 2014 and $26.5 billion in 2013. The increases in average net interest-free funds in 2015 and 2014 reflect higher balances of noninterest-bearing deposits, which averaged $27.3 billion in 2015, $25.7 billion in 2014 and $23.7 billion in 2013. The increase in average noninterest-bearing deposits in 2015 reflects an increase in commercial customer deposits of $1.5 billion. The growth from 2013 to 2014 includes an increase in commercial customer deposits of $1.4 billion. In connection with the Hudson City acquisition, the Company added noninterest-bearing deposits of $691 million at the acquisition date. Goodwill and core deposit and other intangible assets averaged $3.7 billion in 2015 and $3.6 billion in each of 2014 and 2013. Goodwill of $1.1 billion and core deposit intangible of $132 million resulted from the Hudson City acquisition. The cash surrender value of bank owned life insurance averaged $1.7 billion in each of 2015 and 2014 and $1.6 billion in 2013. Increases in the cash surrender value of bank owned life insurance are not included in
57
Table of Contents
interest income, but rather are recorded in “other revenues from operations.” The contribution of net interest-free funds to net interest margin was .19% in each of 2015 and 2014 and .22% in 2013.
Reflecting the changes to the net interest spread and the contribution of net interest-free funds as described herein, the Company’s net interest margin was 3.14% in 2015, 3.31% in 2014 and 3.65% in 2013. Future changes in market interest rates or spreads, as well as changes in the composition of the Company’s portfolios of earning assets and interest-bearing liabilities that result in reductions in spreads, could adversely impact the Company’s net interest income and net interest margin.
Management assesses the potential impact of future changes in interest rates and spreads by projecting net interest income under several interest rate scenarios. In managing interest rate risk, the Company has utilized interest rate swap agreements to modify the repricing characteristics of certain portions of its interest-bearing liabilities. Periodic settlement amounts arising from these agreements are reflected in the rates paid on interest-bearing liabilities. The notional amount of interest rate swap agreements entered into for interest rate risk management purposes was $1.4 billion at each of December 31, 2015 and 2014. Under the terms of those interest rate swap agreements, the Company received payments based on the outstanding notional amount of the agreements at fixed rates and made payments at variable rates. Those interest rate swap agreements were designated as fair value hedges of certain fixed rate long-term borrowings. There were no interest rate swap agreements designated as cash flow hedges at those respective dates.
In a fair value hedge, the fair value of the derivative (the interest rate swap agreement) and changes in the fair value of the hedged item are recorded in the Company’s consolidated balance sheet with the corresponding gain or loss recognized in current earnings. The difference between changes in the fair value of the interest rate swap agreements and the hedged items represents hedge ineffectiveness and is recorded in “other revenues from operations” in the Company’s consolidated statement of income. The amounts of hedge ineffectiveness recognized in 2015, 2014 and 2013 were not material to the Company’s results of operations. The estimated aggregate fair value of interest rate swap agreements designated as fair value hedges represented gains of approximately $44 million at December 31, 2015 and $73 million at December 31, 2014. The fair values of such interest rate swap agreements were substantially offset by changes in the fair values of the hedged items. The changes in the fair values of the interest rate swap agreements and the hedged items primarily result from the effects of changing interest rates and spreads. The Company’s credit exposure as of December 31, 2015 with respect to the estimated fair value of interest rate swap agreements used for managing interest rate risk has been substantially mitigated through master netting arrangements with trading account interest rate contracts with the same counterparty as well as counterparty postings of $22 million of collateral with the Company. Additional information about interest rate swap agreements and the items being hedged is included in note 18 of Notes to Financial Statements. The average notional amounts of interest rate swap agreements entered into for interest rate risk management purposes, the related effect on net interest income and margin, and the weighted-average interest rates paid or received on those swap agreements are presented in table 9.
58
Table of Contents
Table 9
INTEREST RATE SWAP AGREEMENTS
| Year Ended December 31 | ||||||||||||||||||||||||
| 2015 | 2014 | 2013 | ||||||||||||||||||||||
| Amount | Rate(a) | Amount | Rate(a) | Amount | Rate(a) | |||||||||||||||||||
| (Dollars in thousands) | ||||||||||||||||||||||||
|
Increase (decrease) in: |
||||||||||||||||||||||||
|
Interest income |
$ | — | — | % | $ | — | — | % | $ | — | — | % | ||||||||||||
|
Interest expense |
(44,219 | ) | (.07 | ) | (44,996 | ) | (.09 | ) | (41,326 | ) | (.09 | ) | ||||||||||||
|
|
|
|
|
|
|
|
|
|
|
|
|
|||||||||||||
|
Net interest income/margin |
$ | 44,219 | .04 | % | $ | 44,996 | .06 | % | $ | 41,326 | .06 | % | ||||||||||||
|
|
|
|
|
|
|
|
|
|
|
|
|
|||||||||||||
|
Average notional amount |
$ | 1,412,340 | $ | 1,400,000 | $ | 1,160,274 | ||||||||||||||||||
|
Rate received(b) |
4.42 | % | 4.42 | % | 5.03 | % | ||||||||||||||||||
|
Rate paid(b) |
1.28 | % | 1.19 | % | 1.47 | % | ||||||||||||||||||
| (a) | Computed as a percentage of average earning assets or interest-bearing liabilities. |
| (b) | Weighted-average rate paid or received on interest rate swap agreements in effect during year. |
Provision for Credit Losses
The Company maintains an allowance for credit losses that in management’s judgment appropriately reflects losses inherent in the loan and lease portfolio. A provision for credit losses is recorded to adjust the level of the allowance as deemed necessary by management. The provision for credit losses was $170 million in 2015, compared with $124 million in 2014 and $185 million in 2013. Net loan charge-offs aggregated $134 million in 2015, $121 million in 2014 and $183 million in 2013. Net loan charge-offs as a percentage of average loans outstanding were .19% in each of 2015 and 2014, compared with .28% in 2013. A summary of the Company’s loan charge-offs, provision and allowance for credit losses is presented in table 10 and in note 5 of Notes to Financial Statements.
59
Table of Contents
Table 10
LOAN CHARGE-OFFS, PROVISION AND ALLOWANCE FOR CREDIT LOSSES
| 2015 | 2014 | 2013 | 2012 | 2011 | ||||||||||||||||
| (Dollars in thousands) | ||||||||||||||||||||
|
Allowance for credit losses beginning balance |
$ | 919,562 | $ | 916,676 | $ | 925,860 | $ | 908,290 | $ | 902,941 | ||||||||||
|
Charge-offs during year |
||||||||||||||||||||
|
Commercial, financial, leasing, etc. |
60,983 | 58,943 | 109,329 | 41,148 | 55,021 | |||||||||||||||
|
Real estate — construction |
3,221 | 1,882 | 9,137 | 27,687 | 63,529 | |||||||||||||||
|
Real estate — mortgage |
26,382 | 33,527 | 49,079 | 58,572 | 81,691 | |||||||||||||||
|
Consumer |
107,787 | 84,390 | 85,965 | 103,348 | 109,246 | |||||||||||||||
|
|
|
|
|
|
|
|
|
|
|
|||||||||||
|
Total charge-offs |
198,373 | 178,742 | 253,510 | 230,755 | 309,487 | |||||||||||||||
|
|
|
|
|
|
|
|
|
|
|
|||||||||||
|
Recoveries during year |
||||||||||||||||||||
|
Commercial, financial, leasing, etc. |
30,284 | 22,188 | 11,773 | 11,375 | 10,224 | |||||||||||||||
|
Real estate — construction |
6,308 | 4,725 | 18,800 | 3,693 | 5,930 | |||||||||||||||
|
Real estate — mortgage |
7,626 | 14,640 | 13,718 | 8,847 | 10,444 | |||||||||||||||
|
Consumer |
20,585 | 16,075 | 26,035 | 20,410 | 18,238 | |||||||||||||||
|
|
|
|
|
|
|
|
|
|
|
|||||||||||
|
Total recoveries |
64,803 | 57,628 | 70,326 | 44,325 | 44,836 | |||||||||||||||
|
|
|
|
|
|
|
|
|
|
|
|||||||||||
|
Net charge-offs |
133,570 | 121,114 | 183,184 | 186,430 | 264,651 | |||||||||||||||
|
Provision for credit losses |
170,000 | 124,000 | 185,000 | 204,000 | 270,000 | |||||||||||||||
|
Allowance related to loans sold or securitized |
— | — | (11,000 | ) | — | — | ||||||||||||||
|
|
|
|
|
|
|
|
|
|
|
|||||||||||
|
Allowance for credit losses ending balance |
$ | 955,992 | $ | 919,562 | $ | 916,676 | $ | 925,860 | $ | 908,290 | ||||||||||
|
|
|
|
|
|
|
|
|
|
|
|||||||||||
|
Net charge-offs as a percent of: |
||||||||||||||||||||
|
Provision for credit losses |
78.57 | % | 97.67 | % | 99.02 | % | 91.39 | % | 98.02 | % | ||||||||||
|
Average loans and leases, net of unearned discount |
.19 | % | .19 | % | .28 | % | .30 | % | .47 | % | ||||||||||
|
Allowance for credit losses as a percent of loans and leases, net of unearned discount, at year-end |
1.09 | % | 1.38 | % | 1.43 | % | 1.39 | % | 1.51 | % | ||||||||||
Loans acquired in connection with acquisition transactions subsequent to 2008 were recorded at fair value with no carry-over of any previously recorded allowance for credit losses. Determining the fair value of acquired loans requires estimating cash flows expected to be collected on the loans and discounting those cash flows at then-current interest rates. For acquired loans where fair value was less than outstanding principal as of the acquisition date and the resulting discount was due, at least in part, to credit deterioration, the excess of expected cash flows over the carrying value of the loans is recognized as interest income over the lives of the loans. The difference between contractually required payments and the cash flows expected to be collected is referred to as the nonaccretable balance and is not recorded on the consolidated balance sheet. The nonaccretable balance reflects estimated future credit losses and other contractually required payments that the Company does not expect to collect. The Company regularly evaluates the reasonableness of its cash flow projections associated with such loans. Any decreases to the expected cash flows require the Company to evaluate the need for an additional allowance for credit losses and could lead to charge-offs of loan balances. Any significant increases in expected cash flows result in additional interest income to be recognized over the then-remaining lives of the loans. The carrying amount of loans
60
Table of Contents
acquired at a discount subsequent to 2008 and accounted for based on expected cash flows was $2.5 billion and $2.6 billion at December 31, 2015 and 2014, respectively. The decrease is largely attributable to payments received offset by the addition of $688 million of purchased impaired loans from Hudson City on November 1, 2015. The nonaccretable balance related to remaining principal losses as of December 31, 2015 and 2014 is presented in table 11. The addition of purchased impaired loans from Hudson City added $116 million to the nonaccretable balance related to principal losses at the time of acquisition. The Company regularly reviews its cash flow projections for loans acquired at a discount, including its estimates of lifetime principal losses. During each of the last three years, based largely on improving economic conditions and borrower repayment performance, the Company’s estimates of cash flows expected to be generated by loans acquired at a discount and accounted for based on expected cash flows improved, resulting in increases in the accretable yield. Excluding expected cash flows on the purchased impaired loans acquired from Hudson City, in 2015 estimated cash flows expected to be generated increased by $77 million, or approximately 3%. That improvement reflected a lowering of estimated principal losses by approximately $58 million, primarily due to a $42 million decrease in expected principal losses in the commercial real estate loan portfolios, as well as interest and other recoveries. Similarly, in 2014 the estimates of cash flows expected to be generated increased by approximately 2%, or $98 million. That improvement also reflected a lowering of estimated principal losses, largely driven by a $47 million decrease in expected principal losses that was predominantly in the acquired commercial real estate loan portfolios. In 2013, estimated cash flows expected to be generated increased by $179 million, or approximately 3%. That improvement was also largely driven by a reduction of estimated principal losses, including a $160 million decrease in expected principal losses in the commercial real estate loan portfolios.
Table 11
NONACCRETABLE BALANCE — PRINCIPAL
| Remaining Balance | ||||||||
|
December 31,
2015 |
December 31,
2014 |
|||||||
| (In thousands) | ||||||||
|
Commercial, financing, leasing, etc. |
$ | 10,806 | $ | 19,589 | ||||
|
Commercial real estate |
48,173 | 70,261 | ||||||
|
Residential real estate |
113,478 | 15,958 | ||||||
|
Consumer |
17,952 | 29,582 | ||||||
|
|
|
|
|
|||||
|
Total |
$ | 190,409 | $ | 135,390 | ||||
|
|
|
|
|
|||||
For acquired loans where the fair value exceeds the outstanding principal balance, the resulting premium is recognized as a reduction of interest income over the lives of the loans. Immediately following the acquisition date and thereafter, an allowance for credit losses is recorded for incurred losses inherent in the portfolio, consistent with the accounting for originated loans and leases. The carrying amount of Hudson City loans acquired at a premium was $17.8 billion at December 31, 2015. As noted previously, a $21 million provision for credit losses was recorded in 2015 for incurred losses inherent in those loans. GAAP does not allow the credit loss component of the net premium associated with those loans to be bifurcated and accounted for as a nonaccreting balance as is the case with purchased impaired loans and other loans acquired at a discount. Despite the fact that the determination of aggregate fair value reflects the impact of expected credit losses, GAAP provides that incurred losses in a portfolio of loans acquired at a premium be recognized even though in a relatively homogenous portfolio of residential mortgage loans the specific loans to which the losses relate cannot be individually identified at the acquisition date.
Nonaccrual loans totaled $799 million at each of December 31, 2015 and 2014, improved from $874 million at December 31, 2013. As a percentage of loans outstanding, nonaccrual loans represented .91%, 1.20% and 1.36% at the end of 2015, 2014 and 2013, respectively. Improving economic conditions in the U.S. have generally had a favorable impact on borrower repayment
61
Table of Contents
performance. The decline in nonaccrual loans since the 2013 year-end was largely due to lower commercial real estate and residential real estate loans on nonaccrual status. Since December 31, 2013, additions to nonaccrual loans were more than offset by the impact on such loans from payments received and charge-offs.
Accruing loans past due 90 days or more (excluding loans acquired at a discount) totaled $317 million or .36% of total loans and leases at December 31, 2015, compared with $245 million or .37% at December 31, 2014 and $369 million or .58% at December 31, 2013. Those loans included loans guaranteed by government-related entities of $276 million, $218 million and $298 million at December 31, 2015, 2014 and 2013, respectively. Approximately $44 million of such guaranteed loans were obtained in the acquisition of Hudson City. Guaranteed loans also included one-to-four family residential mortgage loans serviced by the Company that were repurchased to reduce servicing costs, including a requirement to advance principal and interest payments that had not been received from individual mortgagors. Despite the loans being purchased by the Company, the insurance or guarantee by the applicable government-related entity remains in force. The outstanding principal balances of the repurchased loans that are guaranteed by government-related entities totaled $221 million at December 31, 2015, $196 million at December 31, 2014 and $255 million at December 31, 2013. The remaining accruing loans past due 90 days or more not guaranteed by government-related entities were loans considered to be with creditworthy borrowers that were in the process of collection or renewal. A summary of nonperforming assets and certain past due, renegotiated and impaired loan data and credit quality ratios is presented in table 12.
62
Table of Contents
Table 12
NONPERFORMING ASSET AND PAST DUE, RENEGOTIATED AND IMPAIRED LOAN DATA
|
December 31 |
2015 | 2014 | 2013 | 2012 | 2011 | |||||||||||||||
| (Dollars in thousands) | ||||||||||||||||||||
|
Nonaccrual loans |
$ | 799,409 | $ | 799,151 | $ | 874,156 | $ | 1,013,176 | $ | 1,097,581 | ||||||||||
|
Real estate and other foreclosed assets |
195,085 | 63,635 | 66,875 | 104,279 | 156,592 | |||||||||||||||
|
|
|
|
|
|
|
|
|
|
|
|||||||||||
|
Total nonperforming assets |
$ | 994,494 | $ | 862,786 | $ | 941,031 | $ | 1,117,455 | $ | 1,254,173 | ||||||||||
|
|
|
|
|
|
|
|
|
|
|
|||||||||||
|
Accruing loans past due 90 days or more(a) |
$ | 317,441 | $ | 245,020 | $ | 368,510 | $ | 358,397 | $ | 287,876 | ||||||||||
|
|
|
|
|
|
|
|
|
|
|
|||||||||||
|
Government guaranteed loans included in totals above: |
||||||||||||||||||||
|
Nonaccrual loans |
$ | 47,052 | $ | 69,095 | $ | 63,647 | $ | 57,420 | $ | 40,529 | ||||||||||
|
Accruing loans past due 90 days or more |
276,285 | 217,822 | 297,918 | 316,403 | 252,503 | |||||||||||||||
|
|
|
|
|
|
|
|
|
|
|
|||||||||||
|
Renegotiated loans |
$ | 182,865 | $ | 202,633 | $ | 257,092 | $ | 271,971 | $ | 214,379 | ||||||||||
|
|
|
|
|
|
|
|
|
|
|
|||||||||||
|
Accruing loans acquired at a discount past due 90 days or more(b) |
$ | 68,473 | $ | 110,367 | $ | 130,162 | $ | 166,554 | $ | 163,738 | ||||||||||
|
|
|
|
|
|
|
|
|
|
|
|||||||||||
|
Purchased impaired loans(c): |
||||||||||||||||||||
|
Outstanding customer balance |
$ | 1,204,004 | $ | 369,080 | $ | 579,975 | $ | 828,571 | $ | 1,267,762 | ||||||||||
|
Carrying amount |
768,329 | 197,737 | 330,792 | 447,114 | 653,362 | |||||||||||||||
|
Nonaccrual loans to total loans and leases, net of unearned discount |
.91 | % | 1.20 | % | 1.36 | % | 1.52 | % | 1.83 | % | ||||||||||
|
Nonperforming assets to total net loans and leases and real estate and other foreclosed assets |
1.13 | % | 1.29 | % | 1.47 | % | 1.68 | % | 2.08 | % | ||||||||||
|
Accruing loans past due 90 days or more(a) to total loans and leases, net of unearned discount |
.36 | % | .37 | % | .58 | % | .54 | % | .48 | % | ||||||||||
| (a) | Excludes loans acquired at a discount. Predominantly residential mortgage loans. |
| (b) | Loans acquired at a discount that were recorded at fair value at acquisition date. This category does not include purchased impaired loans that are presented separately. |
| (c) | Accruing loans acquired at a discount that were impaired at acquisition date and recorded at fair value. |
Purchased impaired loans are loans obtained in acquisition transactions subsequent to 2008 that as of the acquisition date were specifically identified as displaying signs of credit deterioration and for which the Company did not expect to collect all outstanding principal and contractually required interest payments. Those loans were impaired at the date of acquisition, were recorded at estimated fair value and were generally delinquent in payments, but, in accordance with GAAP, the Company continues to accrue interest income on such loans based on the estimated expected cash flows associated with the loans. The carrying amount of such loans was $768 million at December 31, 2015, or .9% of total loans. Of that amount, $658 million is related to the Hudson City acquisition. Purchased impaired loans totaled $198 million at December 31, 2014.
Accruing loans acquired at a discount past due 90 days or more are loans that could not be specifically identified as impaired as of the acquisition date, but were recorded at estimated fair value as of such date. Such loans totaled $68 million at December 31, 2015 and $110 million at December 31, 2014.
63
Table of Contents
In an effort to assist borrowers, the Company modified the terms of select loans. If the borrower was experiencing financial difficulty and a concession was granted, the Company considered such modifications as troubled debt restructurings. Loan modifications included such actions as the extension of loan maturity dates and the lowering of interest rates and monthly payments. The objective of the modifications was to increase loan repayments by customers and thereby reduce net charge-offs. In accordance with GAAP, the modified loans are included in impaired loans for purposes of determining the level of the allowance for credit losses. Information about modifications of loans that are considered troubled debt restructurings is included in note 4 of Notes to Financial Statements.
Residential real estate loans modified under specified loss mitigation programs prescribed by government guarantors have not been included in renegotiated loans because the loan guarantee remains in full force and, accordingly, the Company has not granted a concession with respect to the ultimate collection of the original loan balance. Such loans aggregated $147 million and $149 million at December 31, 2015 and December 31, 2014, respectively.
Charge-offs of commercial loans and leases, net of recoveries, were $31 million in 2015, $37 million in 2014 and $98 million in 2013. Reflected in net charge-offs of commercial loans and leases in 2013 were $49 million of charge-offs for a relationship with a motor vehicle-related parts wholesaler. In 2015, the Company recovered $10 million relating to this relationship. Commercial loans and leases in nonaccrual status totaled $242 million at December 31, 2015, $177 million at December 31, 2014 and $111 million at December 31, 2013. The December 31, 2015 balances for the largest individual commercial loans placed in nonaccrual status during 2015 were $22 million with a commercial maintenance service provider with operations in New Jersey and Pennsylvania and $15 million with a multi-regional automobile rental agency. The increase in nonaccrual commercial loans from the 2013 year-end to December 31, 2014 also was not concentrated in any particular industry group and no individual borrower relationship exceeded $14 million of the increase in commercial loans and leases.
Net charge-offs of commercial real estate loans during 2015, 2014 and 2013 totaled $7 million, $3 million and $12 million, respectively. Reflected in such charge-offs were net recoveries of $2 million in each of 2015 and 2014 and $12 million in 2013 of loans to residential real estate builders and developers. Commercial real estate loans classified as nonaccrual totaled $224 million at December 31, 2015, compared with $239 million at December 31, 2014 and $305 million at December 31, 2013. The decline in such nonaccrual loans since December 31, 2013 was due, in part, to improving economic conditions. Nonaccrual commercial real estate loans included construction-related loans of $45 million, $97 million and $132 million at the end of 2015, 2014 and 2013, respectively. Those nonaccrual construction loans included loans to residential builders and developers of $28 million at December 31, 2015, $72 million at December 31, 2014 and $96 million at December 31, 2013. Information about the location of nonaccrual and charged-off loans to residential real estate builders and developers as of and for the year ended December 31, 2015 is presented in table 13.
64
Table of Contents
Table 13
RESIDENTIAL BUILDER AND DEVELOPER LOANS, NET OF UNEARNED DISCOUNT
| December 31, 2015 |
Year Ended
December 31, 2015 |
|||||||||||||||||||
| Nonaccrual | Net Charge-offs (Recoveries) | |||||||||||||||||||
|
Outstanding
Balances(b) |
Balances |
Percent of
Outstanding Balances |
Balances |
Percent of Average
Outstanding Balances |
||||||||||||||||
| (Dollars in thousands) | ||||||||||||||||||||
|
New York |
$ | 622,489 | $ | 3,132 | .50 | % | $ | 2,215 | .32 | % | ||||||||||
|
Pennsylvania |
154,627 | 25,533 | 16.51 | 822 | .58 | |||||||||||||||
|
Mid-Atlantic(a) |
424,774 | 1,344 | .32 | (4,577 | ) | (1.04 | ) | |||||||||||||
|
Other |
404,544 | 1,304 | .32 | — | — | |||||||||||||||
|
|
|
|
|
|
|
|
|
|
|
|||||||||||
|
Total |
$ | 1,606,434 | $ | 31,313 | 1.95 | % | $ | (1,540 | ) | (.09 | )% | |||||||||
|
|
|
|
|
|
|
|
|
|
|
|||||||||||
| (a) | Includes Delaware, Maryland, New Jersey, Virginia, West Virginia and the District of Columbia. |
| (b) | Includes approximately $21 million of loans not secured by real estate, of which approximately $3 million are in nonaccrual status |
Net charge-offs of residential real estate loans aggregated $9 million in 2015 and $13 million in each of 2014 and 2013. Residential real estate loans in nonaccrual status at December 31, 2015 were $215 million, compared with $258 million and $334 million at December 31, 2014 and 2013, respectively. The decrease in residential real estate loans classified as nonaccrual in 2015 reflects improved repayment performance by customers, in general, and in 2014 the payoff of $64 million of loans to one customer that were secured by residential real estate. Net charge-offs of limited documentation first mortgage loans were $1 million in 2015, $4 million in 2014 and $8 million in 2013. Nonaccrual limited documentation first mortgage loans totaled $62 million at December 31, 2015, compared with $78 million and $81 million at December 31, 2014 and 2013, respectively. Residential real estate loans past due 90 days or more and accruing interest (excluding loans acquired at a discount) aggregated $284 million (including $44 million obtained in the acquisition of Hudson City) at December 31, 2015, $216 million at December 31, 2014 and $295 million at December 31, 2013. A substantial portion of such amounts related to guaranteed loans repurchased from government-related entities. Information about the location of nonaccrual and charged-off residential real estate loans as of and for the year ended December 31, 2015 is presented in table 14.
65
Table of Contents
Table 14
SELECTED RESIDENTIAL REAL ESTATE-RELATED LOAN DATA
|
Year Ended
December 31, 2015 |
||||||||||||||||||||
| December 31, 2015 | Net Charge-offs (Recoveries) | |||||||||||||||||||
| Nonaccrual |
Percent of
Average
|
|||||||||||||||||||
|
Outstanding
Balances |
Balances |
Percent of
Outstanding Balances |
Balances | |||||||||||||||||
| (Dollars in thousands) | ||||||||||||||||||||
|
Residential mortgages |
||||||||||||||||||||
|
New York |
$ | 6,908,655 | $ | 60,990 | .88 | % | $ | 2,884 | .07 | % | ||||||||||
|
Pennsylvania |
1,849,675 | 15,904 | .86 | 591 | .04 | |||||||||||||||
|
Maryland |
1,313,586 | 14,963 | 1.14 | 1,367 | .10 | |||||||||||||||
|
New Jersey |
6,345,909 | 7,862 | .12 | 537 | .07 | |||||||||||||||
|
Other Mid-Atlantic(a) |
1,156,451 | 14,353 | 1.24 | 866 | .08 | |||||||||||||||
|
Other |
4,402,423 | 37,606 | .85 | 937 | .06 | |||||||||||||||
|
|
|
|
|
|
|
|
|
|
|
|||||||||||
|
Total |
$ | 21,976,699 | $ | 151,678 | .69 | % | $ | 7,182 | .07 | % | ||||||||||
|
|
|
|
|
|
|
|
|
|
|
|||||||||||
|
Residential construction loans |
||||||||||||||||||||
|
New York |
$ | 6,383 | $ | 142 | 2.22 | % | $ | 64 | .93 | % | ||||||||||
|
Pennsylvania |
4,821 | 808 | 16.75 | 16 | .42 | |||||||||||||||
|
Maryland |
5,536 | — | — | — | — | |||||||||||||||
|
New Jersey |
672 | — | — | 2 | .21 | |||||||||||||||
|
Other Mid-Atlantic(a) |
2,867 | — | — | — | — | |||||||||||||||
|
Other |
13,295 | 653 | 4.91 | 170 | 1.50 | |||||||||||||||
|
|
|
|
|
|
|
|
|
|
|
|||||||||||
|
Total |
$ | 33,574 | $ | 1,603 | 4.77 | % | $ | 252 | .77 | % | ||||||||||
|
|
|
|
|
|
|
|
|
|
|
|||||||||||
|
Limited documentation first mortgages |
||||||||||||||||||||
|
New York |
$ | 1,793,036 | $ | 16,671 | .93 | % | $ | 919 | .05 | % | ||||||||||
|
Pennsylvania |
92,558 | 1,962 | 2.12 | 183 | .20 | |||||||||||||||
|
Maryland |
52,336 | 3,438 | 6.57 | (354 | ) | (.65 | ) | |||||||||||||
|
New Jersey |
1,656,719 | 2,145 | .13 | (40 | ) | (.01 | ) | |||||||||||||
|
Other Mid-Atlantic(a) |
46,853 | 3,467 | 7.40 | 15 | .03 | |||||||||||||||
|
Other |
618,328 | 34,267 | 5.54 | 648 | .10 | |||||||||||||||
|
|
|
|
|
|
|
|
|
|
|
|||||||||||
|
Total |
$ | 4,259,830 | $ | 61,950 | 1.45 | % | $ | 1,371 | .03 | % | ||||||||||
|
|
|
|
|
|
|
|
|
|
|
|||||||||||
|
First lien home equity loans and lines of credit |
||||||||||||||||||||
|
New York |
$ | 1,352,335 | $ | 16,741 | 1.24 | % | $ | 2,032 | .15 | % | ||||||||||
|
Pennsylvania |
874,170 | 9,876 | 1.13 | 1,301 | .15 | |||||||||||||||
|
Maryland |
713,750 | 6,420 | .90 | 713 | .10 | |||||||||||||||
|
New Jersey |
39,983 | 234 | .59 | (2 | ) | (.01 | ) | |||||||||||||
|
Other Mid-Atlantic(a) |
210,693 | 528 | .25 | 8 | .01 | |||||||||||||||
|
Other. |
20,959 | 1,321 | 6.30 | 13 | .07 | |||||||||||||||
|
|
|
|
|
|
|
|
|
|
|
|||||||||||
|
Total |
$ | 3,211,890 | $ | 35,120 | 1.09 | % | $ | 4,065 | .13 | % | ||||||||||
|
|
|
|
|
|
|
|
|
|
|
|||||||||||
|
Junior lien home equity loans and lines of credit |
||||||||||||||||||||
|
New York |
$ | 962,533 | $ | 29,332 | 3.05 | % | $ | 4,562 | .48 | % | ||||||||||
|
Pennsylvania |
391,369 | 4,507 | 1.15 | 1,560 | .39 | |||||||||||||||
|
Maryland |
871,569 | 8,825 | 1.01 | 4,140 | .46 | |||||||||||||||
|
New Jersey |
137,326 | 2,191 | 1.60 | (27 | ) | (.07 | ) | |||||||||||||
|
Other Mid-Atlantic(a) |
323,553 | 1,334 | .41 | 268 | .08 | |||||||||||||||
|
Other |
45,225 | 2,679 | 5.92 | 288 | .68 | |||||||||||||||
|
|
|
|
|
|
|
|
|
|
|
|||||||||||
|
Total |
$ | 2,731,575 | $ | 48,868 | 1.79 | % | $ | 10,791 | .40 | % | ||||||||||
|
|
|
|
|
|
|
|
|
|
|
|||||||||||
|
Limited documentation junior lien |
||||||||||||||||||||
|
New York |
$ | 848 | $ | — | — | % | $ | 128 | 12.94 | % | ||||||||||
|
Pennsylvania |
345 | 34 | 9.87 | — | — | |||||||||||||||
|
Maryland |
1,608 | 83 | 5.20 | (1 | ) | (.06 | ) | |||||||||||||
|
New Jersey |
391 | — | — | (1 | ) | (.18 | ) | |||||||||||||
|
Other Mid-Atlantic(a) |
746 | — | — | (33 | ) | (3.52 | ) | |||||||||||||
|
Other. |
5,373 | 362 | 6.73 | 387 | 6.56 | |||||||||||||||
|
|
|
|
|
|
|
|
|
|
|
|||||||||||
|
Total. |
$ | 9,311 | $ | 479 | 5.15 | % | $ | 480 | 4.65 | % | ||||||||||
|
|
|
|
|
|
|
|
|
|
|
|||||||||||
| (a) | Includes Delaware, Virginia, West Virginia and the District of Columbia. |
66
Table of Contents
Consumer loan net charge-offs during 2015 totaled $87 million, compared with $68 million in 2014 and $60 million in 2013. The increase from 2014 to 2015 reflects a $20 million charge-off of a single personal usage loan obtained in a previous acquisition. Included in net charge-offs of consumer loans were: automobile loans of $12 million in 2015, $14 million in 2014 and $11 million in 2013; recreational vehicle loans of $12 million, $13 million and $15 million during 2015, 2014 and 2013, respectively; and home equity loans and lines of credit secured by one-to-four family residential properties of $15 million in 2015, $19 million in 2014 and $12 million in 2013. Reflected in net charge-offs of home equity loans and lines of credit in 2013 were $9 million of recoveries of previously charged-off loans related to a portfolio of loans acquired in 2007. Nonaccrual consumer loans totaled $118 million at December 31, 2015, compared with $125 million at each of December 31, 2014 and 2013. Included in nonaccrual consumer loans at the 2015, 2014 and 2013 year-ends were: automobile loans of $17 million, $18 million and $21 million, respectively; recreational vehicle loans of $9 million, $11 million and $12 million, respectively; and outstanding balances of home equity loans and lines of credit of $84 million, $89 million and $79 million, respectively. Information about the location of nonaccrual and charged-off home equity loans and lines of credit as of and for the year ended December 31, 2015 is presented in table 14.
Information about past due and nonaccrual loans as of December 31, 2015 and 2014 is also included in note 4 of Notes to Financial Statements.
Real estate and other foreclosed assets aggregated $195 million at December 31, 2015, compared with $64 million at December 31, 2014 and $67 million at December 31, 2013. Reflected in real estate and other foreclosed assets at December 31, 2015 were $126 million of assets obtained in the Hudson City acquisition. Gains or losses resulting from sales of real estate and other foreclosed assets were not material in 2015, 2014 or 2013. At December 31, 2015, the Company’s holding of residential real estate-related properties comprised approximately 88% of foreclosed assets.
Management determined the allowance for credit losses by performing ongoing evaluations of the loan and lease portfolio, including such factors as the differing economic risks associated with each loan category, the financial condition of specific borrowers, the economic environment in which borrowers operate, the level of delinquent loans, the value of any collateral and, where applicable, the existence of any guarantees or indemnifications. Management evaluated the impact of changes in interest rates and overall economic conditions on the ability of borrowers to meet repayment obligations when quantifying the Company’s exposure to credit losses and the allowance for such losses as of each reporting date. Factors also considered by management when performing its assessment, in addition to general economic conditions and the other factors described above, included, but were not limited to: (i) the impact of residential real estate values on the Company’s portfolio of loans to residential real estate builders and developers and other loans secured by residential real estate; (ii) the concentrations of commercial real estate loans in the Company’s loan portfolio; (iii) the amount of commercial and industrial loans to businesses in areas of New York State outside of the New York City metropolitan area and in central Pennsylvania that have historically experienced less economic growth and vitality than the vast majority of other regions of the country; (iv) the expected repayment performance associated with the Company’s first and second lien loans secured by residential real estate, including loans obtained in the acquisition of Hudson City that were not classified as purchased impaired; and (v) the size of the Company’s portfolio of loans to individual consumers, which historically have experienced higher net charge-offs as a percentage of loans outstanding than other loan types. The level of the allowance is adjusted based on the results of management’s analysis.
Management cautiously and conservatively evaluated the allowance for credit losses as of December 31, 2015 in light of: (i) residential real estate values and the level of delinquencies of loans secured by residential real estate; (ii) economic conditions in the markets served by the Company; (iii) slower growth in private sector employment in upstate New York and central Pennsylvania than in other regions served by the Company and nationally; (iv) the significant subjectivity involved in commercial real estate valuations; and (v) the amount of loan growth experienced by the Company. While there has been general improvement in economic conditions, concerns continue to exist about the strength and sustainability of such improvements; the troubled state of global commodity and export markets, including the impact international economic conditions could have on the U.S. economy; Federal Reserve positioning of monetary policy; and continued stagnant population growth in the upstate New York and central Pennsylvania regions (approximately 55% of the Company’s loans are to customers in New York State and Pennsylvania).
67
Table of Contents
The Company utilizes a loan grading system which is applied to all commercial and commercial real estate loans. Loan grades are utilized to differentiate risk within the portfolio and consider the expectations of default for each loan. Commercial loans and commercial real estate loans with a lower expectation of default are assigned one of ten possible “pass” loan grades and are generally ascribed lower loss factors when determining the allowance for credit losses. Loans with an elevated level of credit risk are classified as “criticized” and are ascribed a higher loss factor when determining the allowance for credit losses. Criticized loans may be classified as “nonaccrual” if the Company no longer expects to collect all amounts according to the contractual terms of the loan agreement or the loan is delinquent 90 days or more. Criticized commercial loans and commercial real estate loans were $2.1 billion at December 31, 2015 and $1.8 billion at December 31, 2014. Increases in criticized loan balances since December 31, 2014 included approximately $133 million categorized as commercial real estate loans and $214 million as commercial loans. Approximately 98% of loan balances added to the criticized category during 2015 were less than 90 days past due and 94% had a current payment status. Given payment performance, amount of supporting collateral, and, in certain instances, the existence of loan guarantees, the Company still expects to collect the full outstanding principal balance on most of these loans. The borrower industries most significantly impacting the higher level of criticized loans were services and manufacturing. The New York City area was most affected by the increases.
Loan officers with the support of loan review personnel in different geographic locations are responsible to continuously review and reassign loan grades to pass and criticized loans based on their detailed knowledge of individual borrowers and their judgment of the impact on such borrowers resulting from changing conditions in their respective geographic regions. At least annually, updated financial information is obtained from commercial borrowers associated with pass grade loans and additional analysis is performed. On a quarterly basis, the Company’s centralized loan review department reviews all criticized commercial and commercial real estate loans greater than $1 million to determine the appropriateness of the assigned loan grade, including whether the loan should be reported as accruing or nonaccruing. For criticized nonaccrual loans, additional meetings are held with loan officers and their managers, workout specialists and senior management to discuss each of the relationships. In analyzing criticized loans, borrower-specific information is reviewed, including operating results, future cash flows, recent developments and the borrower’s outlook, and other pertinent data. The timing and extent of potential losses, considering collateral valuation and other factors, and the Company’s potential courses of action are reviewed. To the extent that these loans are collateral-dependent, they are evaluated based on the fair value of the loan’s collateral as estimated at or near the financial statement date. As the quality of a loan deteriorates to the point of classifying the loan as “criticized,” the process of obtaining updated collateral valuation information is usually initiated, unless it is not considered warranted given factors such as the relative size of the loan, the characteristics of the collateral or the age of the last valuation. In those cases where current appraisals may not yet be available, prior appraisals are utilized with adjustments, as deemed necessary, for estimates of subsequent declines in value as determined by line of business and/or loan workout personnel in the respective geographic regions. Those adjustments are reviewed and assessed for reasonableness by the Company’s loan review department. Accordingly, for real estate collateral securing larger commercial and commercial real estate loans, estimated collateral values are based on current appraisals and estimates of value. For non-real estate loans, collateral is assigned a discounted estimated liquidation value and, depending on the nature of the collateral, is verified through field exams or other procedures. In assessing collateral, real estate and non-real estate values are reduced by an estimate of selling costs. With regard to residential real estate loans, the Company’s loss identification and estimation techniques make reference to loan performance and house price data in specific areas of the country where collateral securing the Company’s residential real estate loans is located. For residential real estate-related loans, including home equity loans and lines of credit, the excess of the loan balance over the net realizable value of the property collateralizing the loan is charged-off when the loan becomes 150 days delinquent. That charge-off is based on recent indications of value from external parties that are generally obtained shortly after a loan becomes nonaccrual. At December 31, 2015, approximately 54% of the Company’s home equity portfolio consisted of first lien loans and lines of credit. Of the remaining junior lien loans in the portfolio, approximately 73% (or approximately 34% of the aggregate home equity portfolio) consisted of junior lien loans that were behind a first lien mortgage
68
Table of Contents
loan that was not owned or serviced by the Company. To the extent known by the Company, if a senior lien loan would be on nonaccrual status because of payment delinquency, even if such senior lien loan was not owned by the Company, the junior lien loan or line that is owned by the Company is placed on nonaccrual status. At December 31, 2015, the balance of junior lien loans and lines that were in nonaccrual status solely as a result of first lien loan performance was $22 million, compared with $24 million at December 31, 2014. In monitoring the credit quality of its home equity portfolio for purposes of determining the allowance for credit losses, the Company reviews delinquency and nonaccrual information and considers recent charge-off experience. When evaluating individual home equity loans and lines of credit for charge off, if the Company does not know the amount of the remaining first lien mortgage loan (typically because the Company does not own or service the first lien loan), the Company assumes that the first lien mortgage loan has had no principal amortization since the origination of the junior lien loan. Similarly, data used in estimating incurred losses for purposes of determining the allowance for credit losses also assumes no reductions in outstanding principal of first lien loans since the origination of the junior lien loan. Home equity line of credit terms vary but such lines are generally originated with an open draw period of ten years followed by an amortization period of up to twenty years. At December 31, 2015, approximately 87% of all outstanding balances of home equity lines of credit related to lines that were still in the draw period, the weighted-average remaining draw periods were approximately five years, and approximately 10% were making contractually allowed payments that do not include any repayment of principal.
Factors that influence the Company’s credit loss experience include overall economic conditions affecting businesses and consumers, generally, but also residential and commercial real estate valuations, in particular, given the size of the Company’s real estate loan portfolios. Commercial real estate valuations can be highly subjective, as they are based upon many assumptions. Such valuations can be significantly affected over relatively short periods of time by changes in business climate, economic conditions, interest rates, and, in many cases, the results of operations of businesses and other occupants of the real property. Similarly, residential real estate valuations can be impacted by housing trends, the availability of financing at reasonable interest rates, and general economic conditions affecting consumers.
In determining the allowance for credit losses, the Company estimates losses attributable to specific troubled credits identified through both normal and detailed or intensified credit review processes and also estimates losses inherent in other loans and leases. In quantifying incurred losses, the Company considers the factors and uses the techniques described herein and in note 5 of Notes to Financial Statements. For purposes of determining the level of the allowance for credit losses, the Company segments its loan and lease portfolio by loan type. The amount of specific loss components in the Company’s loan and lease portfolios is determined through a loan-by-loan analysis of commercial loans and commercial real estate loans in nonaccrual status. Measurement of the specific loss components is typically based on expected future cash flows, collateral values or other factors that may impact the borrower’s ability to pay. Losses associated with residential real estate loans and consumer loans are generally determined by reference to recent charge-off history and are evaluated (and adjusted if deemed appropriate) through consideration of other factors including near-term forecasted loss estimates developed by the Company’s credit department. These forecasts give consideration to overall borrower repayment performance and current geographic region changes in collateral values using third party published historical price indices or automated valuation methodologies. With regard to collateral values, the realizability of such values by the Company contemplates repayment of any first lien position prior to recovering amounts on a junior lien position. Approximately 46% of the Company’s home equity portfolio consists of junior lien loans and lines of credit. Except for consumer loans and residential real estate loans that are considered smaller balance homogeneous loans and are evaluated collectively and loans obtained at a discount in acquisition transactions, the Company considers a loan to be impaired when, based on current information and events, it is probable that the Company will be unable to collect all amounts according to the contractual terms of the loan agreement or the loan is delinquent 90 days or more and has been placed in nonaccrual status. Those impaired loans are evaluated for specific loss components. Modified loans, including smaller balance homogenous loans, that are considered to be troubled debt restructurings are evaluated for impairment giving consideration to the impact of the modified loan terms on the present value of the loan’s expected cash flows. Loans less than 90 days delinquent are deemed to have a minimal delay in payment and are generally not considered to be
69
Table of Contents
impaired. Loans acquired in connection with acquisition transactions subsequent to 2008 were recorded at fair value with no carry-over of any previously recorded allowance for credit losses. Determining the fair value of the acquired loans required estimating cash flows expected to be collected on the loans and discounting those cash flows at then-current interest rates. For loans acquired at a discount, the impact of estimated future credit losses represents the predominant difference between contractually required payments at acquisition and the cash flows expected to be collected at acquisition. Subsequent decreases to those expected cash flows require the Company to evaluate the need for an additional allowance for credit losses and could lead to charge-offs of such acquired loan balances.
The inherent base level loss components of the Company’s allowance for credit losses are generally determined by applying loss factors to specific loan balances based on loan type and management’s classification of such loans under the Company’s loan grading system. The Company utilizes a loan grading system which is applied to all commercial loans and commercial real estate loans. As previously described, loan officers are responsible for continually assigning grades to these loans based on standards outlined in the Company’s Credit Policy. Internal loan grades are also extensively monitored by the Company’s loan review department to ensure consistency and strict adherence to the prescribed standards. Loan balances utilized in the inherent base level loss component computations exclude loans and leases for which specific allocations are maintained. Loan grades are assigned loss component factors that reflect the Company’s loss estimate for each group of loans and leases. Factors considered in assigning loan grades and loss component factors include borrower-specific information related to expected future cash flows and operating results, collateral values, financial condition, payment status, and other information; levels of and trends in portfolio charge-offs and recoveries; levels of and trends in portfolio delinquencies and impaired loans; changes in the risk profile of specific portfolios; trends in volume and terms of loans; effects of changes in credit concentrations; and observed trends and practices in the banking industry. In determining the allowance for credit losses, management also gives consideration to such factors as customer, industry and geographic concentrations, as well as national and local economic conditions, including: (i) the comparatively poorer economic conditions and unfavorable business climate in many market regions served by the Company, including upstate New York and central Pennsylvania, that result in such regions generally experiencing significantly poorer economic growth and vitality as compared with much of the rest of the country; (ii) portfolio concentrations regarding loan type, collateral type and geographic location, in particular the large concentrations of commercial real estate loans secured by properties in the New York City area and other areas of New York State; and (iii) risk associated with the Company’s portfolio of consumer loans, in particular automobile loans and leases, which generally have higher rates of loss than other types of collateralized loans.
The inherent base level loss components related to residential real estate loans and consumer loans are generally determined by applying loss factors to portfolio balances after consideration of payment performance and recent loss experience and trends, which are mainly driven by current collateral values in the market place as well as the amount of loan defaults. Loss rates for loans secured by residential real estate, including home equity loans and lines of credit, are determined by reference to recent charge-off history and are evaluated (and adjusted if deemed appropriate) through consideration of other factors as previously described.
In evaluating collateral, the Company relies on internally and externally prepared valuations. Residential real estate valuations are usually based on sales of comparable properties in the respective location. Commercial real estate valuations also refer to sales of comparable properties but oftentimes are based on calculations that utilize many assumptions and, as a result, can be highly subjective. Specifically, commercial real estate values can be significantly affected over relatively short periods of time by changes in business climate, economic conditions and interest rates, and, in many cases, the results of operations of businesses and other occupants of the real property. Additionally, management is aware that there is oftentimes a delay in the recognition of credit quality changes in loans and, as a result, in changes to assigned loan grades due to time delays in the manifestation and reporting of underlying events that impact credit quality. Accordingly, loss estimates derived from the inherent base level loss component computation are adjusted for current national and local economic conditions and trends. The Federal Reserve stated in December 2015 that the U.S. economic recovery had continued, although there was room for further improvement in the labor markets and inflation continued to run below the Federal Reserve’s longer-run objective.
70
Table of Contents
Economic indicators in the most significant market regions served by the Company also showed improvement in 2015. For example, in 2015, average private sector employment in areas served by the Company was 1.9% above year-ago levels, but trailed the 2.1% U.S. average growth rate. Private sector employment increased 0.7% in upstate New York, 1.2% in areas of Pennsylvania served by the Company, 1.5% in New Jersey, 2.1% in Maryland, 1.7% in Greater Washington D.C. and 1.4% in the State of Delaware. In New York City, private sector employment increased by 2.8% in 2015. Nevertheless, the U.S. economy remains susceptible to slow global economic growth, a strong U.S. dollar and its impact on trade, and international market turbulence.
The specific loss components and the inherent base level loss components together comprise the total base level or “allocated” allowance for credit losses. Such allocated portion of the allowance represents management’s assessment of losses existing in specific larger balance loans that are reviewed in detail by management and pools of other loans that are not individually analyzed. In addition, the Company has always provided an inherent unallocated portion of the allowance that is intended to recognize probable losses that are not otherwise identifiable. The inherent unallocated allowance includes management’s subjective determination of amounts necessary for such things as the possible use of imprecise estimates in determining the allocated portion of the allowance and other risks associated with the Company’s loan portfolio which may not be specifically allocable.
A comparative allocation of the allowance for credit losses for each of the past five year-ends is presented in table 15. Amounts were allocated to specific loan categories based on information available to management at the time of each year-end assessment and using the methodology described herein. Variations in the allocation of the allowance by loan category as a percentage of those loans reflect changes in management’s estimate of specific loss components and inherent base level loss components, including the impact of delinquencies and nonaccrual loans. As described in note 5 of Notes to Financial Statements, loans considered impaired were $781 million and $762 million at December 31, 2015 and December 31, 2014, respectively. The allocated portion of the allowance for credit losses related to impaired loans totaled $90 million at December 31, 2015 and $83 million at December 31, 2014. The unallocated portion of the allowance for credit losses was equal to .09% and .11% of gross loans outstanding at December 31, 2015 and 2014, respectively. That relative decline reflects the impact of loans obtained in the Hudson City acquisition that were recorded at fair value amounts that reflected anticipated credit losses and was not considered significant. Considering the inherent imprecision in the many estimates used in the determination of the allocated portion of the allowance, management deliberately remained cautious and conservative in establishing the overall allowance for credit losses. Given the Company’s high concentration of real estate loans and considering the other factors already discussed herein, management considers the allocated and unallocated portions of the allowance for credit losses to be prudent and reasonable. Furthermore, the Company’s allowance is general in nature and is available to absorb losses from any loan or lease category. Additional information about the allowance for credit losses is included in note 5 of Notes to Financial Statements.
71
Table of Contents
Table 15
ALLOCATION OF THE ALLOWANCE FOR CREDIT LOSSES TO LOAN CATEGORIES
|
December 31 |
2015 | 2014 | 2013 | 2012 | 2011 | |||||||||||||||
| (Dollars in thousands) | ||||||||||||||||||||
|
Commercial, financial, leasing, etc. |
$ | 300,404 | $ | 288,038 | $ | 273,383 | $ | 246,759 | $ | 234,022 | ||||||||||
|
Real estate |
399,069 | 369,837 | 403,634 | 425,908 | 459,552 | |||||||||||||||
|
Consumer |
178,320 | 186,033 | 164,644 | 179,418 | 143,121 | |||||||||||||||
|
Unallocated |
78,199 | 75,654 | 75,015 | 73,775 | 71,595 | |||||||||||||||
|
|
|
|
|
|
|
|
|
|
|
|||||||||||
|
Total |
$ | 955,992 | $ | 919,562 | $ | 916,676 | $ | 925,860 | $ | 908,290 | ||||||||||
|
|
|
|
|
|
|
|
|
|
|
|||||||||||
|
As a Percentage of Gross Loans and Leases Outstanding |
||||||||||||||||||||
|
Commercial, financial, leasing, etc. |
1.46 | % | 1.47 | % | 1.45 | % | 1.37 | % | 1.47 | % | ||||||||||
|
Real estate |
.72 | 1.02 | 1.15 | 1.14 | 1.42 | |||||||||||||||
|
Consumer |
1.54 | 1.70 | 1.60 | 1.55 | 1.19 | |||||||||||||||
Management believes that the allowance for credit losses at December 31, 2015 appropriately reflected credit losses inherent in the portfolio as of that date. The allowance for credit losses was $956 million or 1.09% of total loans and leases at December 31, 2015, compared with $920 million or 1.38% at December 31, 2014 and $917 million or 1.43% at December 31, 2013. The ratio of the allowance to total loans and leases at each respective year-end reflects the impact of loans obtained in acquisition transactions subsequent to 2008 that have been recorded at estimated fair value. As noted earlier, GAAP prohibits any carry-over of an allowance for credit losses for acquired loans recorded at fair value. However, for loans acquired at a premium, GAAP provides that an allowance for credit losses be recognized for incurred losses inherent in the portfolio at the acquisition date. The declines in the ratio of the allowance to total loans and leases and the ratio of the allowance allocated to real estate loans at December 31, 2015 from December 31, 2014 reflects the impact of loans obtained in the acquisition of Hudson City, including $18.0 billion of residential real estate loans of which $652 million were considered purchased impaired loans recorded at a discount and $17.4 billion were acquired loans recorded at a premium. The decline in the ratio of the allowance to total loans and leases since December 31, 2013 also reflects the impact of improvement in the levels of nonaccrual loans, net charge-offs and overall repayment performance by customers. During 2013, the allowance for credit losses was reduced by $11 million as a result of the $1.4 billion automobile loan securitization previously noted. The level of the allowance reflects management’s evaluation of the loan and lease portfolio using the methodology and considering the factors as described herein. Should the various credit factors considered by management in establishing the allowance for credit losses change and should management’s assessment of losses inherent in the loan portfolios also change, the level of the allowance as a percentage of loans could increase or decrease in future periods. The ratio of the allowance to nonaccrual loans at the end of 2015, 2014 and 2013 was 120%, 115% and 105%, respectively. Given the Company’s position as a secured lender and its practice of charging-off loan balances when collection is deemed doubtful, that ratio and changes in that ratio are generally not an indicative measure of the adequacy of the Company’s allowance for credit losses, nor does management rely upon that ratio in assessing the adequacy of the allowance. The level of the allowance reflects management’s evaluation of the loan and lease portfolio as of each respective date.
In establishing the allowance for credit losses, management follows the methodology described herein, including taking a conservative view of borrowers’ abilities to repay loans. The establishment of the allowance is extremely subjective and requires management to make many judgments about borrower, industry, regional and national economic health and performance. In order to present examples of the possible impact on the allowance from certain changes in credit quality factors, the Company assumed the following scenarios for possible deterioration of credit quality:
| ● |
For consumer loans and leases considered smaller balance homogenous loans and evaluated collectively, a 50 basis point increase in loss factors; |
72
Table of Contents
| ● |
For residential real estate loans and home equity loans and lines of credit, also considered smaller balance homogenous loans and evaluated collectively, a 25% increase in estimated inherent losses; and |
| ● |
For commercial loans and commercial real estate loans, a migration of loans to lower-ranked risk grades resulting in a 30% increase in the balance of classified credits in each risk grade. |
For possible improvement in credit quality factors, the scenarios assumed were:
| ● |
For consumer loans and leases, a 20 basis point decrease in loss factors; |
| ● |
For residential real estate loans and home equity loans and lines of credit, a 10% decrease in estimated inherent losses; and |
| ● |
For commercial loans and commercial real estate loans, a migration of loans to higher-ranked risk grades resulting in a 5% decrease in the balance of classified credits in each risk grade. |
The scenario analyses resulted in an additional $75 million that could be identifiable under the assumptions for credit deterioration, whereas under the assumptions for credit improvement a $41 million reduction could occur. These examples are only a few of numerous reasonably possible scenarios that could be utilized in assessing the sensitivity of the allowance for credit losses based on changes in assumptions and other factors.
The Company had no concentrations of credit extended to any specific industry that exceeded 10% of total loans at December 31, 2015, however residential real estate loans comprised approximately 30% of the loan portfolio. Outstanding loans to foreign borrowers were $265 million at December 31, 2015, or .3% of total loans and leases.
Other Income
Other income aggregated $1.83 billion and $1.78 billion in 2015 and 2014, respectively. Reflected in that improvement were higher commercial mortgage banking revenues and a $45 million gain from the sale of the trade processing business within the retirement services business of the Company that was largely offset by lower trust income associated with that divested business. The acquisition of Hudson City did not have a significant impact on other income. Other income in 2013 was $1.87 billion and included net gains on investment securities (including other-than-temporary impairment losses) of $47 million and gains from securitization activities of $63 million. Excluding those specific items, noninterest income in 2014 rose $24 million from $1.76 billion in 2013. Higher residential mortgage banking revenues and trust income in 2014 were partially offset by lower service charges on deposit accounts and trading account and foreign exchange gains.
Mortgage banking revenues were $376 million in 2015, $363 million in 2014 and $331 million in 2013. Mortgage banking revenues are comprised of both residential and commercial mortgage banking activities. The Company’s involvement in commercial mortgage banking activities includes the origination, sales and servicing of loans under the multifamily loan programs of Fannie Mae, Freddie Mac and the U.S. Department of Housing and Urban Development.
Residential mortgage banking revenues, consisting of realized gains from sales of residential real estate loans and loan servicing rights, unrealized gains and losses on residential real estate loans held for sale and related commitments, residential real estate loan servicing fees, and other residential real estate loan-related fees and income, totaled $281 million in 2015, $287 million in 2014 and $251 million in 2013. The decrease in residential mortgage banking revenues from 2014 to 2015 reflects a decline in revenues associated with servicing residential real estate loans for others. The increase in residential mortgage banking revenues from 2013 to 2014 reflected a significant increase in revenues from servicing residential real estate loans for others, partially offset by lower gains from origination activities due to decreased volumes of loans originated for sale.
New commitments to originate residential real estate loans to be sold totaled approximately $3.5 billion in 2015, compared with $3.2 billion in 2014 and $5.6 billion in 2013. Included in those commitments to originate residential real estate loans to be sold were commitments of approximately $235 million in 2015, $337 million in 2014 and $1.1 billion in 2013 related to the U.S. government’s Home Affordable Refinance Program (“HARP 2.0”), which began in December 2011 and allows homeowners to refinance their Fannie Mae or Freddie Mac mortgages when the value of their home has fallen such that they have little or no equity. The HARP 2.0 program was originally set to expire on December 31, 2013, but was extended and is now available to borrowers through December 31, 2016. Nevertheless, volumes associated with that program have declined since mid-
73
Table of Contents
2013. Realized gains from sales of residential real estate loans and loan servicing rights and recognized net unrealized gains or losses attributable to residential real estate loans held for sale, commitments to originate loans for sale and commitments to sell loans totaled to a gain of $74 million in 2015, compared with gains of $75 million in 2014 and $123 million in 2013.
The Company is contractually obligated to repurchase previously sold loans that do not ultimately meet investor sale criteria related to underwriting procedures or loan documentation. When required to do so, the Company may reimburse purchasers for losses incurred or may repurchase certain loans. The Company reduces residential mortgage banking revenues for losses related to its obligations to loan purchasers. The amount of those charges varies based on the volume of loans sold, the level of reimbursement requests received from loan purchasers and estimates of losses that may be associated with previously sold loans. Residential mortgage banking revenues during 2015, 2014 and 2013 were reduced by approximately $5 million, $4 million and $17 million, respectively, related to the actual or anticipated settlement of repurchase obligations.
Loans held for sale that were secured by residential real estate totaled $353 million and $435 million at December 31, 2015 and 2014, respectively. Commitments to sell residential real estate loans and commitments to originate residential real estate loans for sale at pre-determined rates were $687 million and $489 million, respectively, at December 31, 2015, $717 million and $432 million, respectively, at December 31, 2014 and $725 million and $470 million, respectively, at December 31, 2013. Net recognized unrealized gains on residential real estate loans held for sale, commitments to sell loans and commitments to originate loans for sale were $16 million and $19 million at December 31, 2015 and 2014, respectively, and $20 million at December 31, 2013. Changes in such net unrealized gains are recorded in mortgage banking revenues and resulted in net decreases in revenue of $3 million, $1 million and $63 million in 2015, 2014 and 2013, respectively.
Revenues from servicing residential real estate loans for others totaled $206 million in 2015, $212 million in 2014 and $128 million in 2013. Residential real estate loans serviced for others totaled $61.7 billion at December 31, 2015, $67.2 billion a year earlier and $72.4 billion at December 31, 2013 and included certain small-balance commercial real estate loans. Reflected in residential real estate loans serviced for others were loans sub-serviced for others of $37.8 billion, $42.1 billion and $46.6 billion at December 31, 2015, 2014 and 2013, respectively. Revenues earned for sub-servicing loans were $116 million in each of 2015 and 2014, compared with $35 million in 2013. The contractual servicing rights associated with loans sub-serviced by the Company were predominantly held by affiliates of Bayview Lending Group LLC (“BLG”). During the third quarter of 2013, the Company added approximately $38 billion of residential real estate loans to its portfolio of loans sub-serviced for affiliates of BLG. Similar additions were $4.3 billion in 2015 and $3.2 billion in 2014. Capitalized servicing rights consist largely of servicing associated with loans sold by the Company. Capitalized residential mortgage servicing assets totaled $118 million at December 31, 2015, compared with $111 million and $129 million at December 31, 2014 and 2013, respectively. Included in capitalized residential mortgage servicing assets noted above were purchased servicing rights associated with the small-balance commercial real estate loans. Additional information about the Company’s capitalized residential mortgage servicing assets, including information about the calculation of estimated fair value, is presented in note 7 of Notes to Financial Statements.
Commercial mortgage banking revenues aggregated $95 million in 2015, $76 million in 2014 and $80 million in 2013. Included in such amounts were revenues from loan origination and sales activities of $53 million in 2015, $41 million in 2014 and $48 million in 2013. Commercial real estate loans originated for sale to other investors totaled approximately $2.0 billion in 2015, compared with $1.5 billion in 2014 and $1.9 billion in 2013. Loan servicing revenues were $42 million in 2015, $35 million in 2014 and $32 million in 2013. Capitalized commercial mortgage servicing assets totaled $84 million at December 31, 2015, $73 million at December 31, 2014 and $72 million at December 31, 2013. Commercial real estate loans serviced for other investors totaled $11.0 billion at December 31, 2015, $11.3 billion at December 31, 2014 and $11.4 billion at December 31, 2013, and included $2.5 billion, $2.4 billion and $2.3 billion, respectively, of loan balances for which investors had recourse to the Company if such balances are ultimately uncollectible. Commitments to sell commercial real estate loans and commitments to originate commercial real estate loans for sale were $96 million and $58 million, respectively, at December 31, 2015, $520 million and $212 million, respectively, at December 31, 2014 and $130 million and $62 million, respectively, at December 31, 2013. Commercial real estate loans held for sale totaled $39 million, $308 million and $68 million at December 31, 2015, 2014 and 2013, respectively.
74
Table of Contents
Service charges on deposit accounts aggregated $421 million in 2015, compared with $428 million in 2014 and $447 million in 2013. The lower levels of fees since 2013 resulted from declines in consumer service charges, particularly overdraft fees.
Trust income includes fees related to two significant businesses. The Institutional Client Services (“ICS”) business provides a variety of trustee, agency, investment management and administrative services for corporations and institutions, investment bankers, corporate tax, finance and legal executives, and other institutional clients who: (i) use capital markets financing structures; (ii) use independent trustees to hold retirement plan and other assets; and (iii) need investment and cash management services. The Wealth Advisory Services (“WAS”) business helps high net worth clients grow their wealth, protect it, and transfer it to their heirs. A comprehensive array of wealth management services are offered, including asset management, fiduciary services and family office services. Trust income declined to $471 million in 2015, compared with $508 million in 2014 and $496 million in 2013. Revenues attributable to the ICS business were approximately $220 million in 2015, $244 million in 2014 and $234 million in 2013. The ICS revenue decline in 2015 reflects the April 2015 divestiture of the trade processing business within the retirement services division. Revenues related to that business reflected in trust income (in the ICS business) during 2015, 2014 and 2013 were approximately $9 million, $34 million and $38 million, respectively. After considering related expenses, including the portion of those revenues paid to sub-advisors, net income attributable to the sold business during those years was not material to the consolidated results of operations of the Company. The sale resulted in an after-tax gain of $23 million ($45 million pre-tax) that was recorded in “other revenues from operations” in the consolidated statement of income. Revenues attributable to WAS were approximately $218 million, $224 million and $214 million in 2015, 2014 and 2013, respectively. Total trust assets, which include assets under management and assets under administration, aggregated $199.2 billion at December 31, 2015, compared with $287.9 billion at December 31, 2014. The decline in trust assets at December 31, 2015 as compared with a year earlier was predominantly due to the customer account balances included in the April 2015 sale of the trade processing business. Trust assets under management were $66.7 billion and $68.2 billion at December 31, 2015 and 2014, respectively. The Company’s proprietary mutual funds held assets of $12.2 billion and $13.3 billion at December 31, 2015 and 2014, respectively.
Brokerage services income, which includes revenues from the sale of mutual funds and annuities and securities brokerage fees, totaled $65 million in 2015, $67 million in 2014 and $66 million in 2013. Trading account and foreign exchange activity resulted in gains of $31 million in 2015, $30 million in 2014 and $41 million in 2013. As compared with 2014, higher activity in 2015 related to interest rate swap transactions executed on behalf of commercial customers was largely offset by decreased market values of trading account assets held in connection with deferred compensation arrangements and lower gains associated with foreign exchange activities. The decrease in trading account and foreign exchange gains from 2013 to 2014 largely reflects lower levels of interest rate swap transactions executed on behalf of commercial customers. The decline in those gains in 2014 was also due to decreased market values of trading account assets held in connection with deferred compensation arrangements. The Company enters into interest rate and foreign exchange contracts with customers who need such services and concomitantly enters into offsetting trading positions with third parties to minimize the risks involved with these types of transactions. Information about the notional amount of interest rate, foreign exchange and other contracts entered into by the Company for trading account purposes is included in note 18 of Notes to Financial Statements and herein under the heading “Liquidity, Market Risk, and Interest Rate Sensitivity.”
Including other-than-temporary impairment losses, the Company recognized net gains on investment securities of $47 million during 2013. There were no significant gains or losses on investment securities in 2014 or 2015. During 2013, the Company sold its holdings of Visa Class B shares for a gain of approximately $90 million and its holdings of MasterCard Class B shares for a gain of $13 million. The shares of Visa and MasterCard were sold as a result of favorable market conditions and to enhance the Company’s capital and liquidity. In addition, the Company sold substantially all of its privately issued mortgage-backed securities held in the available-for-sale investment securities portfolio. In total, $1.0 billion of such securities were sold for a net loss of approximately $46 million. The mortgage-backed securities were sold to reduce the Company’s exposure to such relatively higher risk securities in favor of lower risk Ginnie Mae securities in
75
Table of Contents
response to changing regulatory capital and liquidity standards. Other-than-temporary impairment losses of $10 million were recorded in 2013. Those losses related to a subset of the privately issued mortgage-backed securities that were sold in 2013. There were no other-than-temporary impairment losses in 2015 or 2014. Each reporting period the Company reviews its investment securities for other-than-temporary impairment. For equity securities, the Company considers various factors to determine if the decline in value is other than temporary, including the duration and extent of the decline in value, the factors contributing to the decline in fair value, including the financial condition of the issuer as well as the conditions of the industry in which it operates, and the prospects for a recovery in fair value of the equity security. For debt securities, the Company analyzes the creditworthiness of the issuer or reviews the credit performance of the underlying collateral supporting the bond. For debt securities backed by pools of loans, such as privately issued mortgage-backed securities, the Company estimates the cash flows of the underlying loan collateral using forward-looking assumptions for default rates, loss severities and prepayment speeds. Estimated collateral cash flows are then utilized to estimate bond-specific cash flows to determine the ultimate collectibility of the bond. If the present value of the cash flows indicates that the Company should not expect to recover the entire amortized cost basis of a bond or if the Company intends to sell the bond or it more likely than not will be required to sell the bond before recovery of its amortized cost basis, an other-than-temporary impairment loss is recognized. If an other-than-temporary impairment loss is deemed to have occurred, the investment security’s cost basis is adjusted, as appropriate for the circumstances. Additional information about other-than-temporary impairment losses is included herein under the heading “Capital.”
M&T’s share of the operating losses of BLG was $14 million in 2015, compared with $17 million and $16 million in 2014 and 2013, respectively. The operating losses of BLG in the respective years reflect provisions for losses associated with securitized loans and other loans held by BLG and loan servicing and other administrative costs. Under GAAP, such losses are required to be recognized by BLG despite the fact that many of the securitized loan losses will ultimately be borne by the underlying third party bond holders. As these loan losses are realized through later foreclosure and still later sale of real estate collateral, the underlying bonds will be charged-down leading to BLG’s future recognition of debt extinguishment gains. The timing of such debt extinguishment is difficult to predict and given ongoing loan loss provisioning, it is not possible to project when BLG will return to profitability. As a result of credit and liquidity disruptions, BLG ceased its originations of small-balance commercial real estate loans in 2008. However, as a result of past securitization activities, BLG is entitled to cash flows from mortgage assets that it owns or that are owned by its affiliates and is also entitled to receive distributions from affiliates that provide asset management and other services. Accordingly, the Company believes that BLG is capable of realizing positive cash flows that could be available for distribution to its owners, including M&T, despite a lack of positive GAAP-earnings from its core mortgage activities. To this point, BLG’s affiliates have largely reinvested their earnings to generate additional servicing and asset management activities, further contributing to the value of those affiliates. Information about the Company’s relationship with BLG and its affiliates is included in note 24 of Notes to Financial Statements.
Other revenues from operations totaled $477 million in 2015, compared with $400 million in 2014 and $454 million in 2013. The increase in 2015 as compared with 2014 reflects the $45 million gain from the sale of the trade processing business, $15 million of gains from the sale of equipment previously leased to commercial customers and higher loan syndication fees. Reflected in other revenues from operations in 2013 were gains from securitization transactions of $63 million. During 2013, the Company securitized approximately $1.3 billion of one-to-four family residential real estate loans held in the Company’s loan portfolio in guaranteed mortgage securitizations with Ginnie Mae and recognized gains of $42 million. In addition, during the third quarter of 2013 the Company securitized and sold approximately $1.4 billion of automobile loans held in its loan portfolio, resulting in a gain of $21 million. The Company securitized those loans to improve its regulatory capital ratios and strengthen its liquidity and risk profile as a result of changing regulatory requirements. Loan servicing fees associated with the mortgage loan securitizations are included in mortgage banking revenues, but servicing fees associated with the automobile loan securitization are included in other revenues from operations. Those latter fees totaled $6 million in 2015, $11 million in 2014 and $4 million in 2013.
76
Table of Contents
Included in other revenues from operations were the following significant components. Letter of credit and other credit-related fees were $134 million, $129 million and $132 million in 2015, 2014 and 2013, respectively. Tax-exempt income earned from bank owned life insurance, which includes increases in the cash surrender value of life insurance policies and benefits received, totaled $53 million in 2015, compared with $50 million in 2014 and $56 million in 2013. Revenues from merchant discount and credit card fees were $105 million in 2015, $96 million in 2014 and $84 million in 2013. The continued trend of higher revenues since 2013 was largely attributable to increased transaction volumes related to merchant activity and usage of the Company’s credit card products. Insurance-related sales commissions and other revenues aggregated $38 million in 2015 compared with $42 million in each of 2014 and 2013. Automated teller machine usage fees totaled $14 million, $15 million and $17 million in 2015, 2014 and 2013, respectively. Gains from sales of equipment previously leased to commercial customers were $17 million in 2015 and $2 million in 2014. Similar gains in 2013 were less than $1 million.
Other Expense
Effective January 1, 2015, M&T adopted amended guidance from the FASB for accounting for investments in qualified affordable housing projects under which the initial cost of such investments is amortized to income tax expense in proportion to the tax benefit received. The adoption of this accounting guidance did not have a significant effect on the Company’s consolidated financial position or results of operations, but did result in the restatement of the consolidated financial statements for 2014 and earlier years to remove net costs associated with qualified affordable housing projects from other expense and include the amortization of the investments in income tax expense. As a result, the amortization included in income tax expense was $47 million, $53 million, and $48 million in 2015, 2014 and 2013, respectively.
Reflecting the application of the new accounting guidance, other expense totaled $2.82 billion in 2015, compared with $2.69 billion in 2014 and $2.59 billion in 2013. Included in such amounts are expenses considered to be “nonoperating” in nature consisting of amortization of core deposit and other intangible assets of $26 million, $34 million and $47 million in 2015, 2014 and 2013, respectively, and merger-related expenses of $76 million in 2015 and $12 million in 2013. There were no merger-related expenses during 2014. Exclusive of those nonoperating expenses, noninterest operating expenses aggregated $2.72 billion in 2015, $2.66 billion in 2014 and $2.53 billion in 2013. The most significant factors contributing to the increase in 2015 were costs associated with the operations obtained in the Hudson City acquisition, higher costs for salaries and employee benefits and increased contributions to The M&T Charitable Foundation, partially offset by lower professional services costs. The increase in such expenses in 2014 as compared with 2013 was largely attributable to higher costs for professional services and salaries associated with BSA/AML activities, compliance, capital planning and stress-testing, and risk management initiatives, partially offset by lower FDIC assessments.
Salaries and employee benefits expense in 2015 totaled $1.55 billion, compared with $1.40 billion and $1.36 billion in 2014 and 2013, respectively. Excluding $51 million of merger-related expenses predominantly related to severance for former Hudson City employees, the higher expense level in 2015 as compared to 2014 was largely attributable to the impact of annual merit increases for employees, higher pension and incentive compensation costs, and the impact of the additional employees formerly associated with Hudson City. The increase in such expenses in 2014 as compared with 2013 was primarily due to costs involving the Company’s initiatives related to BSA/AML activities, compliance, capital planning and stress testing, and risk management. Stock-based compensation aggregated $67 million in 2015, $65 million in 2014 and $55 million in 2013. Reflecting employees associated with the operations obtained from Hudson City, the number of full-time equivalent employees rose to 16,979 at December 31, 2015, compared with 15,312 and 15,368 at December 31, 2014 and 2013, respectively.
The Company provides pension and other postretirement benefits (including a retirement savings plan) for its employees. Expenses related to such benefits totaled $100 million in 2015, $63 million in 2014 and $87 million in 2013. The Company sponsors both defined benefit and defined contribution pension plans. Pension benefit expense for those plans was $63 million in 2015, $28 million in 2014 and $53 million in 2013. Included in those amounts are $23 million in 2015, $22 million in 2014 and $21 million in 2013 for a defined contribution pension plan that the Company
77
Table of Contents
began on January 1, 2006. The increase in pension and other postretirement benefits expense in 2015 as compared with 2014 was largely reflective of a $31 million increase in amortization of actuarial losses accumulated in the defined benefit pension plans. Similarly, the decline in pension and other postretirement benefits expense in 2014 as compared with 2013 was the result of a $27 million decrease in amortization of actuarial losses accumulated in the defined benefit pension plans at the end of 2013. No contributions were required or made to the qualified defined benefit pension plan in 2015, 2014 or 2013. The determination of pension expense and the recognition of net pension assets and liabilities for defined benefit pension plans requires management to make various assumptions that can significantly impact the actuarial calculations related thereto. Those assumptions include the expected long-term rate of return on plan assets, the rate of increase in future compensation levels and the discount rate. Changes in any of those assumptions will impact the Company’s pension expense. The expected long-term rate of return assumption is determined by taking into consideration asset allocations, historical returns on the types of assets held and current economic factors. Returns on invested assets are periodically compared with target market indices for each asset type to aid management in evaluating such returns. The discount rate used by the Company to determine the present value of the Company’s future benefit obligations reflects specific market yields for a hypothetical portfolio of highly rated corporate bonds that would produce cash flows similar to the Company’s benefit plan obligations and the level of market interest rates in general as of the year-end. In 2014 the Society of Actuaries released new mortality tables that were used in the determination of the benefit obligation beginning with December 31, 2014. The impact of that revision was to increase the benefit obligations as of December 31, 2014 of the qualified and non-qualified defined benefit pension plans by approximately $122 million and $10 million, respectively. Other factors used to estimate the projected benefit obligations include actuarial assumptions for turnover rate, retirement age and disability rate. Those other factors do not tend to change significantly over time. The Company reviews its pension plan assumptions annually to ensure that such assumptions are reasonable and adjusts those assumptions, as necessary, to reflect changes in future expectations. The Company utilizes actuaries and others to aid in that assessment.
The Company’s 2015 pension expense for its defined benefit plans was determined using the following assumptions: a long-term rate of return on assets of 6.50%; a rate of future compensation increase of 4.39%; and a discount rate of 4.00%. To demonstrate the sensitivity of pension expense to changes in the Company’s pension plan assumptions, 25 basis point increases in: the rate of return on plan assets would have resulted in a decrease in pension expense of $4 million; the rate of increase in compensation would have resulted in an increase in pension expense of $350,000; and the discount rate would have resulted in a decrease in pension expense of $7 million. Decreases of 25 basis points in those assumptions would have resulted in similar changes in amount, but in the opposite direction from the changes presented in the preceding sentence. The accounting guidance for defined benefit pension plans reflects the long-term nature of benefit obligations and the investment horizon of plan assets, and has the effect of reducing expense volatility related to short-term changes in interest rates and market valuations. Actuarial gains and losses include the impact of plan amendments, in addition to various gains and losses resulting from changes in assumptions and investment returns which are different from that which was assumed. As of December 31, 2015, the Company had cumulative unrecognized actuarial losses of approximately $494 million that could result in an increase in the Company’s future pension expense depending on several factors, including whether such losses at each measurement date exceed ten percent of the greater of the projected benefit obligation or the market-related value of plan assets. In accordance with GAAP, net unrecognized gains or losses that exceed that threshold are required to be amortized over the expected service period of active employees, and are included as a component of net pension cost. Amortization of those net unrealized losses had the effect of increasing the Company’s pension expense by approximately $45 million in 2015, $14 million in 2014 and $41 million in 2013. The decrease in the cumulative unrecognized actuarial losses from $512 million at December 31, 2014 was primarily attributable to the aforementioned amortization of unrealized losses in 2015 and the actuarial gain resulting from a 25 basis point increase in the discount rate used to measure the benefit obligation as of December 31, 2015. Offsetting those gains in 2015 were actuarial losses resulting from investment returns on the qualified plan assets that were lower than the expected return on those assets.
GAAP requires an employer to recognize in its balance sheet as an asset or liability the overfunded or underfunded status of a defined benefit postretirement plan, measured as the
78
Table of Contents
difference between the fair value of plan assets and the benefit obligation. For a pension plan, the benefit obligation is the projected benefit obligation; for any other postretirement benefit plan, such as a retiree health care plan, the benefit obligation is the accumulated postretirement benefit obligation. Gains or losses and prior service costs or credits that arise during the period, but are not included as components of net periodic benefit cost, are to be recognized as a component of other comprehensive income. As of December 31, 2015, the combined benefit obligations of the Company’s defined benefit postretirement plans exceeded the fair value of the assets of such plans by approximately $501 million. Of that amount, $283 million was related to the non-qualified pension and other postretirement benefit plans (including $92 million associated with acquired Hudson City plans) that are generally not funded until benefits are paid. In the Company’s qualified defined benefit pension plan, the projected benefit obligation exceeded the fair value of assets by approximately $218 million as of December 31, 2015 and $172 million as of December 31, 2014. Contributing to that change in the funded status was the acquisition of Hudson City in which the projected benefit obligation of the acquired qualified plan exceeded the fair value of assets by approximately $28 million. The remaining change was the result of lower asset balances at the end of 2015 partially offset by a reduction in the projected benefit obligation as a result of increasing the discount rate used to measure such obligation to 4.25% at December 31, 2015 from 4.00% at December 31, 2014. The Company was required to have a net pension and postretirement benefit liability for the pension and other postretirement benefit plans that was equal to $501 million at December 31, 2015. Accordingly, as of December 31, 2015 the Company recorded an additional postretirement benefit adjustment of $490 million. After applicable tax effect, that adjustment reduced accumulated other comprehensive income (and thereby shareholders’ equity) by $297 million. The result of this was a year-over-year decrease of $13 million to the additional minimum postretirement benefit liability from $503 million recorded at December 31, 2014. After applicable tax effect, the $13 million decrease in the additional required liability adjustment increased other comprehensive income in 2015 by $9 million from the prior year-end amount of $306 million. In determining the benefit obligation for defined benefit postretirement plans the Company used a discount rate of 4.25% at December 31, 2015 and 4.00% at December 31, 2014. A 25 basis point decrease in the assumed discount rate as of December 31, 2015 to 4.00% would have resulted in increases in the combined benefit obligations of all defined benefit postretirement plans (including pension and other plans) of $79 million. Under that scenario, the minimum postretirement liability adjustment at December 31, 2015 would have been $569 million, rather than the $490 million that was actually recorded, and the corresponding after tax-effect charge to accumulated other comprehensive income at December 31, 2015 would have been $345 million, rather than the $297 million that was actually recorded. A 25 basis point increase in the assumed discount rate to 4.50% would have decreased the combined benefit obligations of all defined benefit postretirement plans by $75 million. Under this latter scenario, the aggregate minimum liability adjustment at December 31, 2015 would have been $415 million rather than the $490 million actually recorded and the corresponding after tax-effect charge to accumulated other comprehensive income would have been $252 million rather than $297 million. Information about the Company’s pension plans, including significant assumptions utilized in completing actuarial calculations for the plans, is included in note 12 of Notes to Financial Statements.
The Company also provides a retirement savings plan (“RSP”) that is a defined contribution plan in which eligible employees of the Company may defer up to 50% of qualified compensation via contributions to the plan. The Company makes an employer matching contribution in an amount equal to 75% of an employee’s contribution, up to 4.5% of the employee’s qualified compensation. RSP expense totaled $34 million in 2015 and $32 million in each of 2014 and 2013.
Expenses associated with the defined benefit and defined contribution pension plans and the RSP totaled $97 million in 2015, $60 million in 2014 and $85 million in 2013. Expenses associated with providing medical and other postretirement benefits were $3 million in 2015 and $2 million in each of 2014 and 2013.
Excluding the nonoperating expense items already noted, nonpersonnel operating expenses totaled $1.22 billion in 2015, compared with $1.25 billion in 2014 and $1.17 billion in 2013. The decline in nonpersonnel operating expenses in 2015 as compared with 2014 was predominantly attributable to lower expenses for professional services and litigation-related costs, offset, in part, by higher charitable contributions of $28 million. Professional services costs related to BSA/AML activities,
79
Table of Contents
compliance, capital planning and stress testing, risk management and other operational initiatives were elevated throughout 2014. Litigation-related charges in 2014 were associated with pre-acquisition activities of M&T’s Wilmington Trust entities. Similarly, the higher level of nonpersonnel operating expenses in 2014 as compared with 2013 was predominantly the result of increased costs for professional services, reflecting the Company’s investments in BSA/AML activities, compliance, capital planning and stress testing, risk management, and other operational initiatives. Those higher expenses were partially offset by lower FDIC assessments.
Income Taxes
The provision for income taxes was $595 million in 2015, $576 million in 2014 and $627 million in 2013. The effective tax rates were 35.5% in 2015, 35.1% in 2014 and 35.5% in 2013. As noted earlier, effective January 1, 2015 the Company adopted amended guidance from the FASB for accounting for investments in qualified affordable housing projects, which resulted in the restatement of the consolidated financial statements for 2014 and earlier years. The adoption of the guidance resulted in higher effective tax rates than existed prior to such adoption. Income tax expense in 2015 reflected two largely offsetting items. The Company attributed $11 million of non-deductible goodwill to the basis of the trade processing business sold in April 2015, which reduced the recorded gain, but did not result in an income tax benefit. During the fourth quarter of 2015, the provision for income taxes was reduced by $5 million to reflect technology research credits related to 2011 through 2014 that were accepted by the Internal Revenue Service in December 2015. During the second quarter of 2014, the Company resolved with tax authorities previously uncertain tax positions associated with pre-acquisition activities of M&T’s Wilmington Trust entities, resulting in a reduction of the provision for income taxes of $8 million. Excluding that reduction of income tax expense, the effective tax rate for 2014 would have been 35.6%. The effective tax rate is affected by the level of income earned that is exempt from tax relative to the overall level of pre-tax income, the level of income allocated to the various state and local jurisdictions where the Company operates, because tax rates differ among such jurisdictions, and the impact of any large but infrequently occurring items.
The Company’s effective tax rate in future periods will be affected by the results of operations allocated to the various tax jurisdictions within which the Company operates, any change in income tax laws or regulations within those jurisdictions, and interpretations of income tax regulations that differ from the Company’s interpretations by any of various tax authorities that may examine tax returns filed by M&T or any of its subsidiaries. Information about amounts accrued for uncertain tax positions and a reconciliation of income tax expense to the amount computed by applying the statutory federal income tax rate to pre-tax income is provided in note 13 of Notes to Financial Statements.
International Activities
Assets and revenues associated with international activities represent less than 1% of the Company’s consolidated assets and revenues. International assets included $265 million and $213 million of loans to foreign borrowers at December 31, 2015 and 2014, respectively. Deposits in the Company’s office in the Cayman Islands totaled $170 million at December 31, 2015 and $177 million at December 31, 2014. The Company uses such deposits to facilitate customer demand and as an alternative to short-term borrowings when the costs of such deposits seem reasonable. Loans and deposits at M&T Bank’s commercial banking office in Ontario, Canada as of December 31, 2015 were $95 million and $35 million, respectively, compared with $93 million and $41 million, respectively, at December 31, 2014. The Company also offers trust-related services in Europe. Revenues from providing such services during 2015, 2014 and 2013 were approximately $26 million, $31 million and $26 million, respectively.
Liquidity, Market Risk, and Interest Rate Sensitivity
As a financial intermediary, the Company is exposed to various risks, including liquidity and market risk. Liquidity refers to the Company’s ability to ensure that sufficient cash flow and liquid assets are available to satisfy current and future obligations, including demands for loans and deposit withdrawals, funding operating costs, and other corporate purposes. Liquidity risk arises whenever the maturities of financial instruments included in assets and liabilities differ.
80
Table of Contents
The most significant source of funding for the Company is core deposits, which are generated from a large base of consumer, corporate and institutional customers. That customer base has, over the past several years, become more geographically diverse as a result of acquisitions and expansion of the Company’s businesses. Nevertheless, the Company faces competition in offering products and services from a large array of financial market participants, including banks, thrifts, mutual funds, securities dealers and others. Core deposits financed 81% of the Company’s earning assets at December 31, 2015, compared with 83% and 88% at December 31, 2014 and 2013, respectively.
The Company supplements funding provided through core deposits with various short-term and long-term wholesale borrowings, including federal funds purchased and securities sold under agreements to repurchase, brokered deposits, Cayman Islands office deposits and longer-term borrowings. At December 31, 2015, M&T Bank had short-term and long-term credit facilities with the FHLBs aggregating $20.5 billion. Outstanding borrowings under FHLB credit facilities totaled $3.1 billion and $1.2 billion at December 31, 2015 and 2014, respectively. Such borrowings were secured by loans and investment securities. As a result of the Hudson City acquisition, the Company assumed $2.0 billion of short-term borrowings from the FHLB of New York. Such borrowings have fixed rates of interest and mature at various dates during 2016. M&T Bank and Wilmington Trust, N.A. had available lines of credit with the Federal Reserve Bank of New York that aggregated approximately $11.9 billion at December 31, 2015. The amounts of those lines are dependent upon the balances of loans and securities pledged as collateral. There were no borrowings outstanding under such lines of credit at December 31, 2015 or December 31, 2014. During 2013, M&T Bank initiated a Bank Note Program whereby M&T Bank may offer unsecured senior and subordinated notes. Notes issued under that program totaled $5.5 billion at December 31, 2015 and $4.0 billion at December 31, 2014. The proceeds of the issuances of borrowings under the Bank Note Program have been predominantly utilized to purchase high-quality liquid assets to meet the requirements of the LCR.
From time to time, the Company has issued subordinated capital notes and junior subordinated debentures associated with trust preferred securities to provide liquidity and enhance regulatory capital ratios. However, pursuant to the Dodd-Frank Act, the Company’s junior subordinated debentures associated with trust preferred securities have been phased-out of the definition of Tier 1 capital. Effective January 1, 2015, 75% of such securities were excluded from the Company’s Tier 1 capital, and beginning January 1, 2016, 100% were excluded. The amounts excluded from Tier 1 capital are includable in total capital. In accordance with its 2015 capital plan, in April 2015 M&T redeemed the junior subordinated debentures associated with the $310 million of trust preferred securities of M&T Capital Trusts I, II and III. In February 2014, the Company redeemed $350 million of 8.50% junior subordinated debentures associated with trust preferred securities and issued $350 million of preferred stock that qualifies as regulatory capital. Information about the Company’s borrowings is included in note 9 of Notes to Financial Statements.
The Company has informal and sometimes reciprocal sources of funding available through various arrangements for unsecured short-term borrowings from a wide group of banks and other financial institutions. Short-term federal funds borrowings were $99 million and $135 million at December 31, 2015 and 2014, respectively. In general, those borrowings were unsecured and matured on the next business day. In addition to satisfying customer demand, Cayman Islands office deposits may be used by the Company as an alternative to short-term borrowings. Cayman Islands office deposits totaled $170 million and $177 million at December 31, 2015 and 2014, respectively. The Company has also benefited from the placement of brokered deposits. The Company has brokered interest-bearing transaction and brokered money-market deposit accounts which totaled $1.2 billion and $1.1 billion at December 31, 2015 and 2014, respectively. Brokered time deposits were not a significant source of funding as of those dates.
The Company’s ability to obtain funding from these or other sources could be negatively impacted should the Company experience a substantial deterioration in its financial condition or its debt ratings, or should the availability of short-term funding become restricted due to a disruption in the financial markets. The Company attempts to quantify such credit-event risk by modeling scenarios that estimate the liquidity impact resulting from a short-term ratings downgrade over various grading levels. Such impact is estimated by attempting to measure the effect on available unsecured lines of credit, available capacity from secured borrowing sources and securitizable assets. Information about the credit ratings of M&T and M&T Bank is presented in table 16. Additional information regarding the terms and maturities of all of the Company’s short-term and long-term
81
Table of Contents
borrowings is provided in note 9 of Notes to Financial Statements. In addition to deposits and borrowings, other sources of liquidity include maturities of investment securities and other earning assets, repayments of loans and investment securities, and cash generated from operations, such as fees collected for services.
Table 16
| Moody’s |
Standard
and Poor’s |
Fitch | ||||||||||
|
M&T Bank Corporation |
||||||||||||
|
Senior debt |
A3 | A– | A | |||||||||
|
Subordinated debt |
A3 | BBB+ | A– | |||||||||
|
M&T Bank |
||||||||||||
|
Short-term deposits |
Prime-1 | A-1 | F1 | |||||||||
|
Long-term deposits |
Aa2 | A | A+ | |||||||||
|
Senior debt |
A2 | A | A | |||||||||
|
Subordinated debt |
A3 | A– | A– | |||||||||
Certain customers of the Company obtain financing through the issuance of variable rate demand bonds (“VRDBs”). The VRDBs are generally enhanced by letters of credit provided by M&T Bank. M&T Bank oftentimes acts as remarketing agent for the VRDBs and, at its discretion, may from time-to-time own some of the VRDBs while such instruments are remarketed. When this occurs, the VRDBs are classified as trading account assets in the Company’s consolidated balance sheet. Nevertheless, M&T Bank is not contractually obligated to purchase the VRDBs. There were no VRDBs in the Company’s trading account at December 31, 2014 and less than $1 million were held at December 31, 2015. The total amount of VRDBs outstanding backed by M&T Bank letters of credit was $1.7 billion and $2.0 billion at December 31, 2015 and 2014, respectively. M&T Bank also serves as remarketing agent for most of those bonds.
Table 17
MATURITY DISTRIBUTION OF SELECTED LOANS(a)
|
December 31, 2015 |
Demand | 2016 | 2017-2020 | After 2020 | ||||||||||||
| (In thousands) | ||||||||||||||||
|
Commercial, financial, etc. |
$ | 6,698,123 | $ | 2,793,943 | $ | 8,591,155 | $ | 910,574 | ||||||||
|
Real estate — construction |
228,312 | 2,254,510 | 2,390,705 | 263,313 | ||||||||||||
|
|
|
|
|
|
|
|
|
|||||||||
|
Total |
$ | 6,926,435 | $ | 5,048,453 | $ | 10,981,860 | $ | 1,173,887 | ||||||||
|
|
|
|
|
|
|
|
|
|||||||||
|
Floating or adjustable interest rates |
$ | 9,490,265 | $ | 859,983 | ||||||||||||
|
Fixed or predetermined interest rates |
1,491,595 | 313,904 | ||||||||||||||
|
|
|
|
|
|||||||||||||
|
Total |
$ | 10,981,860 | $ | 1,173,887 | ||||||||||||
|
|
|
|
|
|||||||||||||
| (a) | The data do not include nonaccrual loans. |
The Company enters into contractual obligations in the normal course of business which require future cash payments. The contractual amounts and timing of those payments as of December 31, 2015 are summarized in table 18. Off-balance sheet commitments to customers may impact liquidity, including commitments to extend credit, standby letters of credit, commercial letters of credit, financial guarantees and indemnification contracts, and commitments to sell real estate loans. Because many of these commitments or contracts expire without being funded in whole or in part, the contract amounts are not necessarily indicative of future cash flows. Further
82
Table of Contents
discussion of these commitments is provided in note 21 of Notes to Financial Statements. Table 18 summarizes the Company’s other commitments as of December 31, 2015 and the timing of the expiration of such commitments.
Table 18
CONTRACTUAL OBLIGATIONS AND OTHER COMMITMENTS
|
December 31, 2015 |
Less Than One
Year |
One to Three
Years |
Three to Five
Years |
Over Five
Years |
Total | |||||||||||||||
| (In thousands) | ||||||||||||||||||||
|
Payments due for contractual obligations |
||||||||||||||||||||
|
Time deposits |
$ | 9,298,958 | $ | 2,842,903 | $ | 959,123 | $ | 9,408 | $ | 13,110,392 | ||||||||||
|
Deposits at Cayman Islands office |
170,170 | — | — | — | 170,170 | |||||||||||||||
|
Federal funds purchased and agreements to repurchase securities |
150,546 | — | — | — | 150,546 | |||||||||||||||
|
Other short-term borrowings |
1,981,636 | — | — | — | 1,981,636 | |||||||||||||||
|
Long-term borrowings |
1,106,613 | 4,171,994 | 3,578,887 | 1,796,364 | 10,653,858 | |||||||||||||||
|
Operating leases |
96,308 | 173,921 | 111,408 | 110,533 | 492,170 | |||||||||||||||
|
Other |
79,549 | 41,057 | 26,177 | 45,076 | 191,859 | |||||||||||||||
|
|
|
|
|
|
|
|
|
|
|
|||||||||||
|
Total |
$ | 12,883,780 | $ | 7,229,875 | $ | 4,675,595 | $ | 1,961,381 | $ | 26,750,631 | ||||||||||
|
|
|
|
|
|
|
|
|
|
|
|||||||||||
|
Other commitments |
||||||||||||||||||||
|
Commitments to extend credit |
$ | 9,373,814 | $ | 6,232,926 | $ | 4,462,044 | $ | 4,074,516 | $ | 24,143,300 | ||||||||||
|
Standby letters of credit |
1,602,143 | 1,243,397 | 372,002 | 112,471 | 3,330,013 | |||||||||||||||
|
Commercial letters of credit |
10,851 | 274 | 44,434 | — | 55,559 | |||||||||||||||
|
Financial guarantees and indemnification contracts |
182,607 | 255,678 | 524,204 | 1,831,833 | 2,794,322 | |||||||||||||||
|
Commitments to sell real estate loans |
782,885 | — | — | — | 782,885 | |||||||||||||||
|
|
|
|
|
|
|
|
|
|
|
|||||||||||
|
Total |
$ | 11,952,300 | $ | 7,732,275 | $ | 5,402,684 | $ | 6,018,820 | $ | 31,106,079 | ||||||||||
|
|
|
|
|
|
|
|
|
|
|
|||||||||||
M&T’s primary source of funds to pay for operating expenses, shareholder dividends and treasury stock repurchases has historically been the receipt of dividends from its banking subsidiaries, which are subject to various regulatory limitations. Dividends from any banking subsidiary to M&T are limited by the amount of earnings of the banking subsidiary in the current year and the two preceding years. For purposes of that test, at December 31, 2015 approximately $1.7 billion was available for payment of dividends to M&T from banking subsidiaries. Information regarding the long-term debt obligations of M&T is included in note 9 of Notes to Financial Statements.
83
Table of Contents
Table 19
MATURITY AND TAXABLE-EQUIVALENT YIELD OF INVESTMENT SECURITIES
|
December 31, 2015 |
One Year
or Less |
One to Five
Years |
Five to Ten
Years |
Over Ten
Years |
Total | |||||||||||||||
| (Dollars in thousands) | ||||||||||||||||||||
|
Investment securities available for sale(a) |
||||||||||||||||||||
|
U.S. Treasury and federal agencies |
||||||||||||||||||||
|
Carrying value |
$ | 103,274 | $ | 196,723 | $ | — | $ | — | $ | 299,997 | ||||||||||
|
Yield |
.17 | % | 1.15 | % | — | — | .81 | % | ||||||||||||
|
Obligations of states and political subdivisions |
||||||||||||||||||||
|
Carrying value |
365 | 2,436 | 1,239 | 1,988 | 6,028 | |||||||||||||||
|
Yield |
7.37 | % | 7.01 | % | 1.33 | % | 3.62 | % | 4.70 | % | ||||||||||
|
Mortgage-backed securities(b) |
||||||||||||||||||||
|
Government issued or guaranteed |
||||||||||||||||||||
|
Carrying value |
576,694 | 2,447,729 | 3,452,726 | 5,209,479 | 11,686,628 | |||||||||||||||
|
Yield |
2.50 | % | 2.51 | % | 2.51 | % | 2.44 | % | 2.48 | % | ||||||||||
|
Privately issued |
||||||||||||||||||||
|
Carrying value |
25 | 49 | — | — | 74 | |||||||||||||||
|
Yield |
3.05 | % | 4.60 | % | — | — | 4.06 | % | ||||||||||||
|
Other debt securities |
||||||||||||||||||||
|
Carrying value |
2,744 | 4,076 | 1,702 | 157,751 | 166,273 | |||||||||||||||
|
Yield |
2.17 | % | 4.03 | % | 6.18 | % | 5.13 | % | 5.07 | % | ||||||||||
|
Equity securities |
||||||||||||||||||||
|
Carrying value |
— | — | — | — | 83,671 | |||||||||||||||
|
Yield |
— | — | — | — | .52 | % | ||||||||||||||
|
|
|
|
|
|
|
|
|
|
|
|||||||||||
|
Total investment securities available for sale |
||||||||||||||||||||
|
Carrying value |
683,102 | 2,651,013 | 3,455,667 | 5,369,218 | 12,242,671 | |||||||||||||||
|
Yield |
2.15 | % | 2.41 | % | 2.51 | % | 2.52 | % | 2.46 | % | ||||||||||
|
|
|
|
|
|
|
|
|
|
|
|||||||||||
|
Investment securities held to maturity |
||||||||||||||||||||
|
Obligations of states and political subdivisions |
||||||||||||||||||||
|
Carrying value |
34,174 | 72,120 | 12,137 | — | 118,431 | |||||||||||||||
|
Yield |
3.89 | % | 5.34 | % | 6.09 | % | — | 5.00 | % | |||||||||||
|
Mortgage-backed securities(b) |
||||||||||||||||||||
|
Government issued or guaranteed |
||||||||||||||||||||
|
Carrying value |
88,108 | 385,686 | 530,756 | 1,549,062 | 2,553,612 | |||||||||||||||
|
Yield |
2.82 | % | 2.83 | % | 2.83 | % | 2.79 | % | 2.81 | % | ||||||||||
|
Privately issued |
||||||||||||||||||||
|
Carrying value |
6,366 | 26,131 | 34,699 | 113,895 | 181,091 | |||||||||||||||
|
Yield |
2.34 | % | 2.37 | % | 2.42 | % | 2.65 | % | 2.56 | % | ||||||||||
|
Other debt securities |
||||||||||||||||||||
|
Carrying value |
— | — | — | 6,575 | 6,575 | |||||||||||||||
|
Yield |
— | — | — | 5.73 | % | 5.73 | % | |||||||||||||
|
|
|
|
|
|
|
|
|
|
|
|||||||||||
|
Total investment securities held to maturity |
||||||||||||||||||||
|
Carrying value |
128,648 | 483,937 | 577,592 | 1,669,532 | 2,859,709 | |||||||||||||||
|
Yield |
3.08 | % | 3.18 | % | 2.87 | % | 2.80 | % | 2.89 | % | ||||||||||
|
|
|
|
|
|
|
|
|
|
|
|||||||||||
|
Other investment securities |
— | — | — | — | 554,059 | |||||||||||||||
|
|
|
|
|
|
|
|
|
|
|
|||||||||||
|
Total investment securities |
||||||||||||||||||||
|
Carrying value |
$ | 811,750 | $ | 3,134,950 | $ | 4,033,259 | $ | 7,038,750 | $ | 15,656,439 | ||||||||||
|
Yield |
2.30 | % | 2.53 | % | 2.56 | % | 2.59 | % | 2.45 | % | ||||||||||
|
|
|
|
|
|
|
|
|
|
|
|||||||||||
| (a) | Investment securities available for sale are presented at estimated fair value. Yields on such securities are based on amortized cost. |
| (b) | Maturities are reflected based upon contractual payments due. Actual maturities are expected to be significantly shorter as a result of loan repayments in the underlying mortgage pools. |
84
Table of Contents
Table 20
MATURITY OF DOMESTIC CERTIFICATES OF DEPOSIT AND TIME DEPOSITS
WITH BALANCES OF $100,000 OR MORE
| December 31, 2015 | ||||
| (In thousands) | ||||
|
Under 3 months |
$ | 1,122,133 | ||
|
3 to 6 months |
746,727 | |||
|
6 to 12 months |
1,846,740 | |||
|
Over 12 months |
1,571,492 | |||
|
|
|
|||
|
Total |
$ | 5,287,092 | ||
|
|
|
|||
Management closely monitors the Company’s liquidity position on an ongoing basis for compliance with internal policies and believes that available sources of liquidity are adequate to meet funding needs anticipated in the normal course of business. Management does not anticipate engaging in any activities, either currently or in the long-term, for which adequate funding would not be available and would therefore result in a significant strain on liquidity at either M&T or its subsidiary banks. Banking regulators have finalized rules requiring a banking company to maintain a minimum amount of liquid assets to withstand a standardized supervisory liquidation stress scenario. The effective date for those rules for the Company was January 1, 2016, subject to a phase-in period. The Company has taken steps as noted herein to enhance its liquidity and is in compliance with the phase-in requirements of the rules.
Market risk is the risk of loss from adverse changes in the market prices and/or interest rates of the Company’s financial instruments. The primary market risk the Company is exposed to is interest rate risk. Interest rate risk arises from the Company’s core banking activities of lending and deposit-taking, because assets and liabilities reprice at different times and by different amounts as interest rates change. As a result, net interest income earned by the Company is subject to the effects of changing interest rates. The Company measures interest rate risk by calculating the variability of net interest income in future periods under various interest rate scenarios using projected balances for earning assets, interest-bearing liabilities and derivatives used to hedge interest rate risk. Management’s philosophy toward interest rate risk management is to limit the variability of net interest income. The balances of financial instruments used in the projections are based on expected growth from forecasted business opportunities, anticipated prepayments of loans and investment securities, and expected maturities of investment securities, loans and deposits. Management uses a “value of equity” model to supplement the modeling technique described above. Those supplemental analyses are based on discounted cash flows associated with on- and off-balance sheet financial instruments. Such analyses are modeled to reflect changes in interest rates and provide management with a long-term interest rate risk metric. The Company has entered into interest rate swap agreements to help manage exposure to interest rate risk. At December 31, 2015, the aggregate notional amount of interest rate swap agreements entered into for interest rate risk management purposes was $1.4 billion. Information about interest rate swap agreements entered into for interest rate risk management purposes is included herein under the heading “Net Interest Income/Lending and Funding Activities” and in note 18 of Notes to Financial Statements.
The Company’s Asset-Liability Committee, which includes members of senior management, monitors the sensitivity of the Company’s net interest income to changes in interest rates with the aid of a computer model that forecasts net interest income under different interest rate scenarios. In modeling changing interest rates, the Company considers different yield curve shapes that consider both parallel (that is, simultaneous changes in interest rates at each point on the yield curve) and non-parallel (that is, allowing interest rates at points on the yield curve to vary by different amounts) shifts in the yield curve. In utilizing the model, projections of net interest income calculated under the varying interest rate scenarios are compared to a base interest rate scenario that is reflective of current interest rates. The model considers the impact of ongoing lending and deposit-gathering activities, as well as interrelationships in the magnitude and timing of the repricing of financial instruments, including the effect of changing interest rates on expected prepayments and maturities.
85
Table of Contents
When deemed prudent, management has taken actions to mitigate exposure to interest rate risk through the use of on- or off-balance sheet financial instruments and intends to do so in the future. Possible actions include, but are not limited to, changes in the pricing of loan and deposit products, modifying the composition of earning assets and interest-bearing liabilities, and adding to, modifying or terminating existing interest rate swap agreements or other financial instruments used for interest rate risk management purposes.
Table 21 displays as of December 31, 2015 and 2014 the estimated impact on net interest income from non-trading financial instruments in the base scenario described above resulting from parallel changes in interest rates across repricing categories during the first modeling year.
Table 21
SENSITIVITY OF NET INTEREST INCOME TO CHANGES IN INTEREST RATES
|
Calculated Increase
(Decrease) in Projected Net Interest Income December 31 |
||||||||
|
Changes in Interest Rates |
2015 | 2014 | ||||||
| (In thousands) | ||||||||
|
+ 200 basis points |
$ | 243,958 | $ | 246,028 | ||||
|
+ 100 basis points |
145,169 | 134,393 | ||||||
|
– 50 basis points |
(99,603 | ) | — | (a) | ||||
|
– 100 basis points |
(145,106 | ) | (74,634 | ) | ||||
| (a) | The Company did not analyze this scenario as of December 31, 2014. |
The Company utilized many assumptions to calculate the impact that changes in interest rates may have on net interest income. The more significant of those assumptions included the rate of prepayments of mortgage-related assets, cash flows from derivative and other financial instruments held for non-trading purposes, loan and deposit volumes and pricing, and deposit maturities. In the scenarios presented, the Company also assumed gradual increases in interest rates during a twelve-month period of 100 and 200 basis points, as compared with the assumed base scenario, as well as gradual decreases of 50 and 100 basis points. In the declining rate scenario, the rate changes may be limited to lesser amounts such that interest rates remain positive at all points of the yield curve. In 2015, the Company suspended the -200 basis point scenario due to the persistent low level of interest rates. This scenario will be reinstated if and when interest rates rise sufficiently to make the analysis more meaningful. The assumptions used in interest rate sensitivity modeling are inherently uncertain and, as a result, the Company cannot precisely predict the impact of changes in interest rates on net interest income. Actual results may differ significantly from those presented due to the timing, magnitude and frequency of changes in interest rates and changes in market conditions and interest rate differentials (spreads) between maturity/repricing categories, as well as any actions, such as those previously described, which management may take to counter such changes.
Table 22 presents cumulative totals of net assets (liabilities) repricing on a contractual basis within the specified time frames, as adjusted for the impact of interest rate swap agreements entered into for interest rate risk management purposes. Management believes that this measure does not appropriately depict interest rate risk since changes in interest rates do not necessarily affect all categories of earning assets and interest-bearing liabilities equally nor, as assumed in the table, on the contractual maturity or repricing date. Furthermore, this static presentation of interest rate risk fails to consider the effect of ongoing lending and deposit gathering activities, projected changes in balance sheet composition or any subsequent interest rate risk management activities the Company is likely to implement.
86
Table of Contents
Table 22
CONTRACTUAL REPRICING DATA
|
December 31, 2015 |
Three Months
or Less |
Four to Twelve
Months |
One to
Five Years |
After
Five Years |
Total | |||||||||||||||
| (Dollars in thousands) | ||||||||||||||||||||
|
Loans and leases, net |
$ | 46,877,145 | $ | 5,585,890 | $ | 18,463,915 | $ | 16,562,549 | $ | 87,489,499 | ||||||||||
|
Investment securities |
642,272 | 789,077 | 3,502,020 | 10,723,070 | 15,656,439 | |||||||||||||||
|
Other earning assets |
7,655,272 | 775 | — | — | 7,656,047 | |||||||||||||||
|
|
|
|
|
|
|
|
|
|
|
|||||||||||
|
Total earning assets |
55,174,689 | 6,375,742 | 21,965,935 | 27,285,619 | 110,801,985 | |||||||||||||||
|
|
|
|
|
|
|
|
|
|
|
|||||||||||
|
Interest-checking deposits |
2,939,274 | — | — | — | 2,939,274 | |||||||||||||||
|
Savings deposits |
46,627,370 | — | — | — | 46,627,370 | |||||||||||||||
|
Time deposits |
2,977,150 | 6,321,808 | 3,802,026 | 9,408 | 13,110,392 | |||||||||||||||
|
Deposits at Cayman Islands office |
170,170 | — | — | — | 170,170 | |||||||||||||||
|
|
|
|
|
|
|
|
|
|
|
|||||||||||
|
Total interest-bearing deposits |
52,713,964 | 6,321,808 | 3,802,026 | 9,408 | 62,847,206 | |||||||||||||||
|
|
|
|
|
|
|
|
|
|
|
|||||||||||
|
Short-term borrowings |
554,220 | 1,577,962 | — | — | 2,132,182 | |||||||||||||||
|
Long-term borrowings |
1,783,880 | 804,967 | 6,766,051 | 1,298,960 | 10,653,858 | |||||||||||||||
|
|
|
|
|
|
|
|
|
|
|
|||||||||||
|
Total interest-bearing liabilities |
55,052,064 | 8,704,737 | 10,568,077 | 1,308,368 | 75,633,246 | |||||||||||||||
|
|
|
|
|
|
|
|
|
|
|
|||||||||||
|
Interest rate swap agreements |
(1,400,000 | ) | 500,000 | 900,000 | — | — | ||||||||||||||
|
|
|
|
|
|
|
|
|
|
|
|||||||||||
|
Periodic gap |
$ | (1,277,375 | ) | $ | (1,828,995 | ) | $ | 12,297,858 | $ | 25,977,251 | ||||||||||
|
Cumulative gap |
(1,277,375 | ) | (3,106,370 | ) | 9,191,488 | 35,168,739 | ||||||||||||||
|
Cumulative gap as a % of total earning assets |
(1.2 | )% | (2.8 | )% | 8.3 | % | 31.7 | % | ||||||||||||
Changes in fair value of the Company’s financial instruments can also result from a lack of trading activity for similar instruments in the financial markets. That impact is most notable on the values assigned to some of the Company’s investment securities. Information about the fair valuation of investment securities is presented herein under the heading “Capital” and in notes 3 and 20 of Notes to Financial Statements.
The Company engages in limited trading account activities to meet the financial needs of customers and to fund the Company’s obligations under certain deferred compensation plans. Financial instruments utilized in trading account activities consist predominantly of interest rate contracts, such as swap agreements, and forward and futures contracts related to foreign currencies. The Company generally mitigates the foreign currency and interest rate risk associated with trading account activities by entering into offsetting trading positions that are also included in the trading account. The fair values of the offsetting trading account positions associated with interest rate contracts and foreign currency and other option and futures contracts are presented in note 18 of Notes to Financial Statements. The amounts of gross and net trading account positions, as well as the type of trading account activities conducted by the Company, are subject to a well-defined series of potential loss exposure limits established by management and approved by M&T’s Board of Directors. However, as with any non-government guaranteed financial instrument, the Company is exposed to credit risk associated with counterparties to the Company’s trading account activities.
The notional amounts of interest rate contracts entered into for trading account purposes aggregated $18.4 billion at December 31, 2015 and $17.6 billion at December 31, 2014. The notional amounts of foreign currency and other option and futures contracts entered into for trading account purposes were $1.6 billion and $1.3 billion at December 31, 2015 and 2014, respectively. Although the
87
Table of Contents
notional amounts of these contracts are not recorded in the consolidated balance sheet, the fair values of all financial instruments used for trading account activities are recorded in the consolidated balance sheet. The fair values of all trading account assets and liabilities were $274 million and $161 million, respectively, at December 31, 2015 and $308 million and $203 million, respectively, at December 31, 2014. Included in trading account assets at December 31, 2015 and 2014 were $24 million and $27 million, respectively, of assets related to deferred compensation plans. Changes in the fair value of such assets are recorded as “trading account and foreign exchange gains” in the consolidated statement of income. Included in “other liabilities” in the consolidated balance sheet at December 31, 2015 and 2014 were $28 million and $30 million, respectively, of liabilities related to deferred compensation plans. Changes in the balances of such liabilities due to the valuation of allocated investment options to which the liabilities are indexed are recorded in “other costs of operations” in the consolidated statement of income. Also included in the trading account were investments in mutual funds and other assets that the Company was required to hold under terms of certain non-qualified supplemental retirement and other benefit plans that were assumed by the Company in various acquisitions. Those assets totaled $33 million and $25 million at December 31, 2015 and 2014, respectively.
Given the Company’s policies, limits and positions, management believes that the potential loss exposure to the Company resulting from market risk associated with trading account activities was not material, however, as previously noted, the Company is exposed to credit risk associated with counterparties to transactions related to the Company’s trading account activities. Additional information about the Company’s use of derivative financial instruments in its trading account activities is included in note 18 of Notes to Financial Statements.
Capital
Shareholders’ equity was $16.2 billion at December 31, 2015 and represented 13.17% of total assets, compared with $12.3 billion or 12.76% at December 31, 2014 and $11.3 billion or 13.28% at December 31, 2013.
Included in shareholders’ equity was preferred stock with financial statement carrying values of $1.2 billion at December 31, 2015 and 2014. On February 11, 2014, M&T issued 350,000 shares of Series E Perpetual Fixed-to-Floating Rate Non-cumulative Preferred Stock, par value $1.00 per share and liquidation preference of $1,000 per share. Dividends, if and when declared, are paid semi-annually at a rate of 6.45% through February 14, 2024 and thereafter will be paid quarterly at a rate of the three-month London Interbank Offered Rate plus 361 basis points. The shares are redeemable in whole or in part on or after February 15, 2024. Notwithstanding M&T’s option to redeem the shares, if an event occurs such that the shares no longer qualify as Tier 1 regulatory capital, M&T may redeem all of the shares within 90 days following that occurrence. Further information concerning M&T’s preferred stock can be found in note 10 of Notes to Financial Statements.
Common shareholders’ equity was $14.9 billion or $93.60 per share, at December 31, 2015 compared with $11.1 billion, or $83.88 per share, at December 31, 2014 and $10.4 billion, or $79.81 per share, at December 31, 2013. In conjunction with the acquisition of Hudson City, M&T issued 25,953,950 common shares, which added $3.1 billion to common shareholders’ equity on November 1, 2015. Tangible equity per common share, which excludes goodwill and core deposit and other intangible assets and applicable deferred tax balances, was $64.28 at December 31, 2015, compared with $57.06 and $52.45 at December 31, 2014 and 2013, respectively. The Company’s ratio of tangible common equity to tangible assets was 8.69% at December 31, 2015, compared with 8.11% and 8.39% at December 31, 2014 and 2013, respectively. Reconciliations of total common shareholders’ equity and tangible common equity and total assets and tangible assets as of December 31, 2015, 2014 and 2013 are presented in table 2. During 2015, 2014 and 2013, the ratio of average total shareholders’ equity to average total assets was 13.00%, 13.13% and 12.82%, respectively. The ratio of average common shareholders’ equity to average total assets was 11.79%, 11.83% and 11.77% in 2015, 2014 and 2013, respectively.
Shareholders’ equity reflects accumulated other comprehensive income or loss, which includes the net after-tax impact of unrealized gains or losses on investment securities classified as available for sale, unrealized losses on held-to-maturity securities for which an other-than-temporary impairment charge has been recognized, gains or losses associated with interest rate swap agreements designated as cash flow hedges, foreign currency translation adjustments and
88
Table of Contents
adjustments to reflect the funded status of defined benefit pension and other postretirement plans. Net unrealized gains on investment securities reflected in shareholders’ equity, net of applicable tax effect, were $48 million, or $.30 per common share, at December 31, 2015, compared with $127 million, or $.96 per common share, at December 31, 2014 and $34 million, or $.26 per common share, at December 31, 2013. Information about unrealized gains and losses as of December 31, 2015 and 2014 is included in note 3 of Notes to Financial Statements.
Reflected in net unrealized gains at December 31, 2015 were pre-tax effect unrealized losses of $71 million on available-for-sale investment securities with an amortized cost of $4.4 billion and pre-tax effect unrealized gains of $175 million on securities with an amortized cost of $7.7 billion. The pre-tax effect unrealized losses reflect $20 million of losses on trust preferred securities issued by financial institutions having an amortized cost of $124 million and an estimated fair value of $104 million (generally considered Level 2 valuations). Further information concerning the Company’s valuations of available-for-sale investment securities is provided in note 20 of Notes to Financial Statements.
As of December 31, 2015, based on a review of each of the securities in the investment securities portfolio, the Company concluded that the declines in the values of any securities containing an unrealized loss were temporary and that any additional other-than-temporary impairment charges were not appropriate. It is likely that the Company will be required to sell certain of its collateralized debt obligations backed by trust preferred securities held in the available-for-sale portfolio to comply with the provisions of the Volcker Rule. However, the amortized cost and fair value of those collateralized debt obligations were $24 million and $29 million, respectively, at December 31, 2015 and the Company does not expect that it would realize any material losses if it ultimately was required to sell such securities. As of that date, the Company did not intend to sell nor is it anticipated that it would be required to sell any of its other impaired securities, that is, where fair value is less than the cost basis of the security. The Company intends to continue to closely monitor the performance of its securities because changes in their underlying credit performance or other events could cause the cost basis of those securities to become other-than-temporarily impaired. However, because the unrealized losses on available-for-sale investment securities have generally already been reflected in the financial statement values for investment securities and shareholders’ equity, any recognition of an other-than-temporary decline in value of those investment securities would not have a material effect on the Company’s consolidated financial condition. Any other-than-temporary impairment charge related to held-to-maturity securities would result in reductions in the financial statement values for investment securities and shareholders’ equity. Additional information concerning fair value measurements and the Company’s approach to the classification of such measurements is included in note 20 of the Notes to Financial Statements.
The Company assessed impairment losses on privately issued mortgage-backed securities in the held-to-maturity portfolio by performing internal modeling to estimate bond-specific cash flows considering recent performance of the mortgage loan collateral and utilizing assumptions about future defaults and loss severity. These bond-specific cash flows also reflect the placement of the bond in the overall securitization structure and the remaining subordination levels. In total, at December 31, 2015 and 2014, the Company had in its held-to-maturity portfolio privately issued mortgage-backed securities with an amortized cost basis of $181 million and $202 million, respectively, and a fair value of $142 million and $158 million, respectively. At December 31, 2015, 87% of the mortgage-backed securities were in the most senior tranche of the securitization structure with 28% being independently rated as investment grade. The mortgage-backed securities are generally collateralized by residential and small-balance commercial real estate loans originated between 2004 and 2008 and had a weighted-average credit enhancement of 16% at December 31, 2015, calculated by dividing the remaining unpaid principal balance of bonds subordinate to the bonds owned by the Company plus any overcollateralization remaining in the securitization structure by the remaining unpaid principal balance of all bonds in the securitization structure. All mortgage-backed securities in the held-to-maturity portfolio had a current payment status as of December 31, 2015. The weighted-average default percentage and loss severity assumptions utilized in the Company’s internal modeling were 33% and 81%, respectively. The Company has concluded that as of December 31, 2015, its privately issued mortgage-backed securities were not other-than-temporarily impaired. Nevertheless, it is possible that adverse changes in the future performance of mortgage loan collateral underlying such securities could impact the Company’s conclusions.
89
Table of Contents
Adjustments to reflect the funded status of defined benefit pension and other postretirement plans, net of applicable tax effect, reduced accumulated other comprehensive income by $297 million, or $1.86 per common share, at December 31, 2015, $306 million, or $2.31 per common share, at December 31, 2014 and $98 million, or $.75 per common share, at December 31, 2013. The decrease in such adjustment at December 31, 2015 as compared with December 31, 2014 was a result of several factors including a 25 basis point increase in the discount rate used to measure the benefit obligations of the defined benefit plans at December 31, 2015 as compared with a year earlier, along with the amortization during 2015, as required under GAAP, of unrealized losses previously recorded in accumulated other comprehensive income as of December 31, 2014. Both of these factors had the effect of decreasing the required adjustment, but were largely offset by investment returns on plan assets that were less than the assumed rate of return. The increase in the adjustment at December 31, 2014 as compared with December 31, 2013 was the result of two main factors: a 75 basis point decrease in the discount rate used to measure the benefit obligations of the defined benefit plans at December 31, 2014 as compared with a year earlier, and the use of updated mortality tables for the U.S. published in 2014 by the Society of Actuaries. Information about the funded status of the Company’s pension and other postretirement benefit plans is included in note 12 of Notes to Financial Statements.
On March 12, 2015, M&T announced that the Federal Reserve did not object to M&T’s proposed 2015 Capital Plan. Accordingly, M&T was allowed to maintain a quarterly common stock dividend of $.70 per share; continue to pay dividends and interest on other equity and debt instruments included in regulatory capital, including preferred stock, trust preferred securities and subordinated debt that were outstanding at December 31, 2014, consistent with the contractual terms of those instruments; repurchase up to $200 million of common shares during the first half of 2016; and redeem or repurchase up to $310 million of trust preferred securities. As previously noted, those latter securities were redeemed in April 2015. Common and preferred dividends are subject to approval by M&T’s Board of Directors in the ordinary course of business.
Cash dividends declared on M&T’s common stock totaled $375 million in 2015, compared with $371 million and $365 million in 2014 and 2013, respectively. Dividends per common share totaled $2.80 in each of 2015, 2014 and 2013. Dividends of $81 million in 2015, $76 million in 2014 and $53 million in 2013 were declared on preferred stock in accordance with the terms of each series. The Company did not repurchase any shares of its common stock in 2015, 2014 or 2013. However, M&T commenced a program to repurchase its common shares in accordance with the approved 2015 Capital Plan, and in January 2016 repurchased 948,545 shares for $100 million.
M&T and its subsidiary banks are required to comply with applicable capital adequacy standards established by the federal banking agencies. In July 2013, the Federal Reserve Board, the OCC and the FDIC approved New Capital Rules establishing a new comprehensive capital framework for U.S. banking organizations. These rules went into effect as to M&T and its subsidiary banks on January 1, 2015, subject to phase-in periods for certain components and other provisions.
The New Capital Rules substantially revise the risk-based capital requirements applicable to bank holding companies and their depository institution subsidiaries, including M&T and its subsidiaries, M&T Bank and Wilmington Trust, N.A., as compared to the U.S. general risk-based capital rules that were applicable to the Company through December 31, 2014. The New Capital Rules revise the definitions and the components of regulatory capital, as well as address other issues affecting the numerator in banking institutions’ regulatory capital ratios. The New Capital Rules also address asset risk weights and other matters affecting the denominator in banking institutions’ regulatory capital ratios. In addition, the New Capital Rules implement certain provisions of the Dodd-Frank Act, including the requirements of Section 939A to remove references to credit ratings from the federal agencies’ rules.
Among other matters, the New Capital Rules: (i) introduce a new capital measure called “Common Equity Tier 1” (“CET1”) and related regulatory capital ratio of CET1 to risk-weighted assets; (ii) specify that Tier 1 capital consists of CET1 and “Additional Tier 1 capital” instruments meeting certain revised requirements; (iii) mandate that most deductions/adjustments to regulatory capital measures be made to CET1 and not to the other components of capital; and (iv) expand the scope of the deductions from and adjustments to capital as compared to the previous regulations. Under the New Capital Rules, for most banking organizations, including M&T, the most common form of Additional Tier 1 capital is non-cumulative perpetual preferred stock and the most common
90
Table of Contents
forms of Tier 2 capital are subordinated notes and a portion of the allowance for loan and lease losses, in each case, subject to the New Capital Rules’ specific requirements.
Pursuant to the New Capital Rules, the minimum capital ratios as of January 1, 2015 are as follows:
| • |
4.5% CET1 to risk-weighted assets; |
| • |
6.0% Tier 1 capital (that is, CET1 plus Additional Tier 1 capital) to risk-weighted assets; |
| • |
8.0% Total capital (that is, Tier 1 capital plus Tier 2 capital) to risk-weighted assets; and |
| • |
4.0% Tier 1 capital to average consolidated assets as reported on consolidated financial statements (known as the “leverage ratio”), as defined in the regulation. |
Pursuant to the New Capital Rules, non-advanced approaches banking organizations, including M&T, were allowed to make a one-time permanent election to exclude the effects of certain accumulated other comprehensive income or loss items reflected in shareholders’ equity under U.S. GAAP. M&T made that election during the first quarter of 2015. The New Capital Rules also preclude certain hybrid securities, such as trust preferred securities, from inclusion in bank holding companies’ Tier 1 capital, subject to phase-out in the case of bank holding companies, such as M&T, that had $15 billion or more in total consolidated assets as of December 31, 2009. As a result, in 2015 only 25% of M&T’s trust preferred securities were includable in Tier 1 capital, and in 2016, none of M&T’s trust preferred securities will be includable in Tier 1 capital. Trust preferred securities no longer included in M&T’s Tier 1 capital may nonetheless be included as a component of Tier 2 capital on a permanent basis without phase-out and irrespective of whether such securities otherwise meet the revised definition of Tier 2 capital set forth in the New Capital Rules. A detailed discussion of the new regulatory capital rules is included in Part I, Item 1 of this Form 10-K under the heading “Capital Requirements.”
The regulatory capital requirements applicable to M&T and its bank subsidiaries as of December 31, 2015 are presented in note 23 of Notes to Financial Statements.
Fourth Quarter Results
Reflecting the impact of merger-related expenses associated with the acquisition of Hudson City, net income during the fourth quarter of 2015 was $271 million, down from $278 million in the year-earlier quarter. Diluted and basic earnings per common share were each $1.65 in the final quarter of 2015, compared with $1.92 and $1.93 of diluted and basic earnings per common share, respectively, in the corresponding 2014 quarter. The annualized rates of return on average assets and average common shareholders’ equity for the fourth quarter of 2015 were .93% and 7.22%, respectively, compared with 1.12% and 9.10%, respectively, in the year-earlier quarter.
Net operating income aggregated $338 million in the fourth quarter of 2015, compared with $282 million in 2014’s final quarter. Diluted net operating earnings per common share were $2.09 and $1.95 in the fourth quarters of 2015 and 2014, respectively. The annualized net operating returns on average tangible assets and average tangible common equity in the fourth quarter of 2015 were 1.21% and 13.26%, respectively, compared with 1.18% and 13.55%, respectively, in the similar quarter of 2014. Reconciliations of GAAP results with non-GAAP results for the quarterly periods of 2015 and 2014 are provided in table 24.
Net interest income expressed on a taxable-equivalent basis totaled $813 million in the final 2015 quarter, 18% above $688 million earned in the year-earlier period. The growth in such income resulted predominantly from an increase in average loans outstanding, which rose $15.3 billion or 23% to $81.1 billion in the final 2015 quarter from $65.8 billion in the year-earlier quarter. Also contributing to the improvement was a 2 basis point widening of the net interest margin, to 3.12% in the fourth quarter of 2015 from 3.10% in the year-earlier quarter. The increase in average loan balances was largely attributable to loans obtained on November 1, 2015 associated with the acquisition of Hudson City, which added $12.5 billion to average loans in 2015’s final quarter. Average commercial loan and lease balances were $20.2 billion in the recent quarter, up $1.1 billion or 6% from $19.1 billion in the final quarter of 2014. Commercial real estate loans averaged $29.0 billion in the fourth quarter of 2015, up $1.9 billion or 7% from $27.1 billion in the year-earlier quarter. The Hudson City transaction added $151 million to average commercial real estate loans in the final 2015 quarter. The growth in commercial loans and commercial real estate loans reflects higher loan demand by customers. Average residential real estate loans outstanding rose $11.7 billion to $20.4 billion in the recent quarter from $8.7 billion in the fourth quarter of 2014. That increase
91
Table of Contents
reflects the impact of the $18.6 billion of residential real estate loans obtained with the Hudson City acquisition on November 1, 2015, which added $12.2 billion to average loans during the fourth quarter. Included in the residential real estate loan portfolio were average balances of loans held for sale, which totaled $368 million in the recent quarter, compared with $435 million in the fourth quarter of 2014. Consumer loans averaged $11.5 billion in the recent quarter, up $614 million from $10.9 billion in the fourth quarter of 2014. That increase was largely due to higher average balances of automobile loans and also reflects $110 million of average consumer loans added in the Hudson City transaction. Total loans at December 31, 2015 increased $18.9 billion to $87.5 billion from $68.5 billion at September 30, 2015. That growth reflects the $19.0 billion of loans obtained with the Hudson City acquisition on November 1, 2015, of which $18.4 billion remained at December 31, 2015. The net interest spread for the fourth quarter of 2015 was 2.94%, up 2 basis points from 2.92% in the year-earlier period. The yield on earning assets was 3.48% in the final 2015 quarter, up 4 basis points from the fourth quarter of 2014. That improvement was predominantly due to significantly higher average balances of loans. The rate paid on interest-bearing liabilities in the fourth quarter of 2015 and 2014 was .54% and .52%, respectively. The contribution of net interest-free funds to the Company’s net interest margin was .18% in each of the fourth quarters of 2015 and 2014. As a result, the Company’s net interest margin widened to 3.12% in the final quarter of 2015 from 3.10% in the year-earlier period.
The provision for credit losses was $58 million during the final 2015 quarter, compared with $33 million in the year-earlier period. A $21 million provision for credit losses was recorded in the fourth quarter of 2015, in accordance with GAAP, related to loans obtained in the Hudson City acquisition that had a fair value in excess of outstanding principal. GAAP provides that an allowance for credit losses on such loans be recorded beyond the recognition of the fair value of the loans at the acquisition date. Net charge-offs of loans were $36 million in the fourth quarter of 2015, representing an annualized .18% of average loans and leases outstanding, compared with $32 million or .19% during the fourth quarter of 2014. Net charge-offs included: residential real estate loans of $2 million in the recently completed quarter, compared with $3 million in 2014’s fourth quarter; net recoveries of commercial real estate loans of $2 million (including recoveries of $5 million on loans to builders and developers of residential real estate properties) in the final 2015 quarter, compared with net charge-offs of less than $1 million in the year-earlier quarter; net recoveries on commercial loans of $3 million in 2015, compared with net charge-offs of $9 million in 2014; and net charge-offs of consumer loans of $39 million in the recent quarter, compared with $19 million 2014’s fourth quarter. Reflected in net recoveries on commercial loans and leases in the fourth quarter of 2015 were $10 million of recoveries of previously charged-off loan balances with a motor vehicle-related parts wholesaler. Net charge-offs of consumer loans in 2015’s final quarter included a $20 million charge-off associated with a personal usage loan obtained in a previous acquisition.
Other income totaled $448 million in the recent quarter, down from $452 million in the final quarter of 2014. That modest decline resulted from lower trust income and residential mortgage banking revenues associated with loan servicing activities, partially offset by higher loan syndication fees and commercial mortgage banking revenues. The decline in trust income was predominantly attributable to the impact of the second quarter 2015 divestiture of the Company’s trade processing business within its retirement services business.
Other expense in the fourth quarter of 2015 totaled $786 million, compared with $666 million in the year-earlier quarter. Included in such amounts are expenses considered to be “nonoperating” in nature consisting of amortization of core deposit and other intangible assets of $10 million and $7 million in the fourth quarters of 2015 and 2014, respectively, and merger-related expenses of $76 million in the fourth quarter of 2015. There were no merger-related expenses in the fourth quarter of 2014. Exclusive of those nonoperating expenses, noninterest operating expenses were $701 million in the fourth quarter of 2015, compared with $659 million in the corresponding quarter of 2014. Substantially all of the increase came from the impact of the operations obtained in the Hudson City acquisition. Excluding the impact of the acquisition, higher expenses for salaries and employee benefits, reflecting the impact of merit increases and higher pension expense, were offset by lower professional services and other costs. The Company’s efficiency ratio during the fourth quarters of 2015 and 2014 was 55.5% and 57.8%, respectively. Table 24 includes a reconciliation of other expense to noninterest operating expense and the calculation of the efficiency ratio for each of the quarters of 2015 and 2014.
92
Table of Contents
Segment Information
In accordance with GAAP, the Company’s reportable segments have been determined based upon its internal profitability reporting system, which is organized by strategic business unit. Certain strategic business units have been combined for segment information reporting purposes where the nature of the products and services, the type of customer, and the distribution of those products and services are similar. The reportable segments are Business Banking, Commercial Banking, Commercial Real Estate, Discretionary Portfolio, Residential Mortgage Banking and Retail Banking.
The financial information of the Company’s segments was compiled utilizing the accounting policies described in note 22 of Notes to Financial Statements. The management accounting policies and processes utilized in compiling segment financial information are highly subjective and, unlike financial accounting, are not based on authoritative guidance similar to GAAP. As a result, reported segments and the financial information of the reported segments are not necessarily comparable with similar information reported by other financial institutions. During 2015, certain methodology and organizational changes were made and, accordingly, the financial information for the Company’s reportable segments for 2014 and 2013 has been restated to conform with the methods and assumptions used in 2015. Financial information about the Company’s segments, including the impact of the changes noted above, is presented in note 22 of Notes to Financial Statements.
The Business Banking segment provides a wide range of services to small businesses and professionals within markets served by the Company through the Company’s branch network, business banking centers and other delivery channels such as telephone banking, Internet banking and automated teller machines. Services and products offered by this segment include various business loans and leases, including loans guaranteed by the Small Business Administration, business credit cards, deposit products, and financial services such as cash management, payroll and direct deposit, merchant credit card and letters of credit. The Business Banking segment contributed net income of $99 million in each of the years ended December 31, 2015 and 2014. Declines in 2015 in net interest income of $7 million and service charges on deposit accounts of $2 million were offset by a $3 million decrease in the provision for credit losses, due to lower net charge-offs, a $4 million increase in merchant discount and credit card fees and lower costs for FDIC assessments of $2 million. The decline in net interest income resulted from a narrowing of the net interest margin on deposits of 18 basis points offset, in part, by an increase in average outstanding deposit balances of $615 million. Net income for this segment aggregated $101 million in 2013. The modest decline in net income in 2014 as compared with 2013 reflected lower net interest income of $20 million, largely offset by an $8 million decrease in the provision for credit losses, due to lower net charge-offs, higher merchant discount and credit card fees of $4 million and a decline in other operating costs. The lower net interest income reflected a 42 basis point narrowing of the net interest margin on deposits, partially offset by a $478 million increase in average deposit balances.
The Commercial Banking segment provides a wide range of credit products and banking services for middle-market and large commercial customers, mainly within the markets served by the Company. Services provided by this segment include commercial lending and leasing, letters of credit, deposit products, and cash management services. The Commercial Banking segment recorded net income of $431 million in 2015, up from $403 million in 2014. That 7% improvement resulted from: a $7 million rise in net interest income, reflecting growth in average outstanding loan and deposit balances of $1.3 billion and $569 million, respectively, partially offset by a narrowing of the net interest margin on loans and deposits of 8 basis points and 6 basis points, respectively; increased gains from the sale of equipment previously leased to commercial customers of $15 million; higher credit-related and other fees of $8 million; and an $8 million decline in the provision for credit losses, reflecting a partial recovery of $10 million related to a relationship with a motor vehicle-related parts wholesaler previously charged-off in 2013. Net income for the Commercial Banking segment in 2013 was $407 million. The modest decline in 2014 as compared with 2013 was largely due to a $40 million decrease in net interest income and lower credit-related fees of $10 million, largely offset by a $44 million decline in the provision for credit losses, the result of higher net charge-offs in 2013 predominantly related to the relationship with the motor vehicle-related parts wholesaler previously noted. The lower net interest income was predominantly attributable to a narrowing of the net interest margin on deposits and loans of 48 basis points and 8 basis points, respectively, partially offset by higher average outstanding balances of loans and deposits of $1.2 billion and $826 million, respectively.
93
Table of Contents
The Commercial Real Estate segment provides credit and deposit services to its customers. Real estate securing loans in this segment is generally located in New York State, Maryland, New Jersey, Pennsylvania, Delaware, Connecticut, Virginia, West Virginia, the District of Columbia and the western portion of the United States. Commercial real estate loans may be secured by apartment/multifamily buildings; office, retail and industrial space; or other types of collateral. Activities of this segment also include the origination, sales and servicing of commercial real estate loans through the Fannie Mae DUS program and other programs. Net income recorded by the Commercial Real Estate segment was $341 million in 2015, 8% above the $316 million recorded in 2014. That improvement reflects increases in net interest income and mortgage banking revenues. The $23 million rise in net interest income resulted largely from increases in average outstanding loan and deposit balances of $1.4 billion and $393 million, respectively, partially offset by a narrowing of the net interest margin on deposits and loans of 11 basis points and 6 basis points, respectively. The increase in mortgage banking revenues of $13 million was largely reflective of an increase in loans originated for sale and higher servicing revenues. Net income contributed by the Commercial Real estate segment totaled $329 million in 2013. The lower net income in 2014 as compared to 2013 was predominantly attributable to a $35 million decrease in net interest income, resulting from a narrowing of the net interest margin on deposits and loans of 52 basis points and 12 basis points, respectively, offset, in part, by higher average outstanding balances of deposits and loans of $402 million and $131 million, respectively. The lower net interest income was partially offset by a $14 million decrease in the provision for credit losses, primarily due to lower net charge-offs, and a lower FDIC assessment allocation.
The Discretionary Portfolio segment includes investment and trading account securities, residential real estate loans and other assets; short-term and long-term borrowed funds; brokered deposits; and Cayman Islands office deposits. This segment also provides foreign exchange services to customers. Net contribution from the Discretionary Portfolio segment totaled $52 million in 2015, 8% higher than $48 million in 2014. That improvement reflected the impact of residential real estate loans obtained in the acquisition of Hudson City. Partially offsetting the favorable impact of those loans on net interest income was a 27 basis point narrowing of the net interest margin on investment securities, resulting from the Company’s allocation of funding charges associated with those assets. A $9 million year-over-year decrease in the provision for credit losses also contributed to the improvement in the segment’s net income. Those favorable factors were partially offset by higher loan servicing and other costs. Net income for the Discretionary Portfolio segment in 2013 was $32 million. Reflected in this segment’s results for 2013 were net losses from investment securities of $56 million (pre-tax), including $46 million associated with the sale of approximately $1.0 billion of privately issued mortgage-backed securities that had been held in the available-for-sale investment securities portfolio and $10 million of other-than-temporary impairment charges, predominantly related to certain of those privately issued mortgage-backed securities. Partially offsetting those losses were $42 million of gains recorded in 2013 from securitization transactions associated with one-to-four family residential real estate loans previously held in the Company’s loan portfolio. Also contributing to the improvement from 2013 to 2014 was a decrease in intersegment charges due to a lower proportion of residential real estate loans being retained and originated for portfolio rather than being sold and a $5 million increase in net interest income. The higher net interest income was largely attributable to a $4.9 billion increase in average balances of investment securities and a 14 basis point widening of the net interest margin on loans.
The Residential Mortgage Banking segment originates and services residential mortgage loans and sells substantially all of those loans in the secondary market to investors or to the Discretionary Portfolio segment. In addition to the geographic regions served by or contiguous with the Company’s branch network, the Company maintains mortgage loan origination offices in several states throughout the western United States. The Company periodically purchases the rights to service loans and also sub-services residential real estate loans for others. Residential real estate loans held for sale are included in this segment. Net income for the Residential Mortgage Banking segment was $89 million in 2015, up 5% from $85 million in 2014. The improved performance in 2015 resulted from lower amortization of capitalized servicing rights of $19 million (reflecting lower prepayment trends), partially offset by increased professional services, personnel costs and centrally-allocated loan servicing expenses. Net income contributed by the Residential Mortgage Banking segment was $92 million in 2013. The $8 million decline in net income in 2014 as compared to 2013 was due to the following significant factors: a $71 million decline in loan origination and sales revenues (including
94
Table of Contents
intersegment revenues) due to lower volumes of loans originated for sale; a $9 million increase in the provision for credit losses, as 2013 included $12 million of net recoveries of previously charged-off loans; and a $16 million decline in net interest income, attributable to a $637 million decrease in average loan balances and a 46 basis point narrowing of the net interest margin on deposits. Largely offsetting those unfavorable factors was an $80 million increase in revenues from servicing residential real estate loans (including intersegment revenues), predominantly the result of sub-servicing activities.
The Retail Banking segment offers a variety of services to consumers through several delivery channels which include branch offices, automated teller machines, telephone banking and Internet banking. The Company has branch offices in New York State, Maryland, New Jersey, Pennsylvania, Delaware, Connecticut, Virginia, West Virginia and the District of Columbia. Credit services offered by this segment include consumer installment loans, automobile loans (originated both directly and indirectly through dealers), home equity loans and lines of credit and credit cards. The segment also offers to its customers deposit products, including demand, savings and time accounts; investment products, including mutual funds and annuities; and other services. Also included in this segment are consumer loans and deposits obtained in the acquisition of Hudson City. Net income for the Retail Banking segment totaled $268 million in 2015, compared with $273 million in 2014. An $8 million rise in net interest income, largely due to increases in average outstanding loan balances, and a $4 million decline in the provision for credit losses, largely due to lower net charge-offs, were more than offset by a $6 million decline in fees earned for providing deposit account services, a $5 million decrease in servicing revenues related to securitized automobile loans, and higher operating expenses, including expenses associated with operations added in the Hudson City acquisition. This segment’s net income declined 15% in 2014 from $321 million in 2013. The primary contributors to that decline were: a $53 million decrease in net interest income, largely due to a 15 basis point narrowing of the net interest margin on deposits and a $537 million decrease in average outstanding loan balances; a $17 million decline in service fee income resulting predominantly from lower service charges on deposit accounts; and a $21 million gain recognized in 2013 on the securitization and sale of approximately $1.4 billion of automobile loans previously held in the Company’s loan portfolio.
The “All Other” category reflects other activities of the Company that are not directly attributable to the reported segments. Reflected in this category are the amortization of core deposit and other intangible assets resulting from the acquisitions of financial institutions, including the November 2015 Hudson City transaction, M&T’s share of the operating losses of BLG, merger-related expenses resulting from acquisitions and the net impact of the Company’s allocation methodologies for internal transfers for funding charges and credits associated with the earning assets and interest-bearing liabilities of the Company’s reportable segments and the provision for credit losses. The “All Other” category also includes the trust income of the Company that reflects the ICS and WAS business activities. The various components of the “All Other” category resulted in net losses of $199 million, $158 million and $145 million in 2015, 2014 and 2013, respectively. The most significant factors contributing to the unfavorable performance in 2015 as compared with 2014 include: higher personnel-related expenses, including the impact of merger-related expenses and increased pension costs; a decline in trust income, predominantly due to the impact of the sale of the trade processing business within the retirement services division of ICS in April 2015; and higher charitable contributions. Those unfavorable factors were offset, in part, by lower professional services costs, largely related to elevated 2014 costs associated with BSA/AML and other company-wide initiatives, the $45 million (pre-tax) gain from the sale of the trade processing business in April 2015, and the favorable impact from the Company’s allocation methodologies. Results for the 2013 period included realized gains on the sale of the Company’s holdings of Visa and MasterCard shares totaling $103 million and the reversal of an accrual for a contingent compensation obligation of $26 million assumed in the May 2011 acquisition of Wilmington Trust that expired. Partially offsetting those factors were higher litigation-related charges in 2013 that reflected a $40 million litigation-related accrual associated with issues that were alleged to occur at Wilmington Trust prior to its acquisition by M&T in 2011. Also contributing to the unfavorable performance in 2014 as compared to 2013 were increases in personnel-related and professional service costs related to BSA/AML and other company-wide initiatives offset, in part, by higher trust income and the favorable impact from the Company’s allocation methodologies for internal transfers for funding charges and credits associated with earning assets and interest-bearing liabilities of the Company’s reportable segments and the provision for credit losses.
95
Table of Contents
Recent Accounting Developments
As previously noted, the Company adopted amended accounting guidance for investments in qualified affordable housing projects under which the initial cost of investments in qualified affordable housing projects is amortized in proportion to the tax credits and other tax benefits received from such projects and recognized in the income statement as a component of income tax expense. As required, the guidance was applied retrospectively to all periods presented. The adoption of this guidance did not have a significant effect on the Company’s consolidated financial position or results of operations, but did result in the restatement of the consolidated statement of income for the years ended December 31, 2014 and 2013 to remove $53 million and $48 million, respectively, of losses associated with qualified affordable housing projects from “other costs of operations” and include the amortization of the initial cost of the investment in income tax expense. The Company amortized $47 million of its investments in qualified affordable housing projects to income tax expense during the year ended December 31, 2015.
In the first quarter of 2015, the Company adopted amended accounting guidance from the FASB related to the classification of certain government-guaranteed mortgage loans upon foreclosure. This guidance requires that a mortgage loan be derecognized and that a separate other receivable be recognized upon foreclosure if the following conditions are met: (1) the loan has a government guarantee that is not separable from the loan before foreclosure; (2) at the time of foreclosure, the creditor has the intent to convey the real estate property to the guarantor and make a claim on the guarantee, and the creditor has the ability to recover under that claim; and (3) at the time of foreclosure, any amount of the claim that is determined on the basis of the fair value of the real estate is fixed. Upon foreclosure, the separate other receivable should be measured based upon the amount of the loan balance (principal and interest) expected to be recovered from the guarantor. The adoption of this guidance did not have a significant effect on the Company’s consolidated financial position or results of operations.
Effective January 1, 2015, the Company adopted amended accounting guidance for repurchase-to-maturity transactions and repurchase financings. The adoption had no impact on the Company’s consolidated financial position or results of operations. The Company has made the required disclosures in note 9 of Notes to Financial Statements.
In January 2015, the Company also adopted amended accounting and disclosure guidance for reclassification of residential real estate collateralized consumer mortgage loans upon foreclosure. The amended guidance clarifies that an in-substance repossession or foreclosure occurs and a creditor is considered to have received physical possession of residential real estate property collateralizing a consumer mortgage loan upon either (1) the creditor obtaining legal title to the residential real estate property upon completion of a foreclosure or (2) the borrower conveying all interest in the residential real estate property to the creditor to satisfy that loan through completion of a deed in lieu of foreclosure or through a similar legal agreement. The amended guidance also requires interim and annual disclosure of both (1) the amount of foreclosed residential real estate property held by the creditor and (2) the recorded investment in consumer mortgage loans collateralized by residential real estate that are in the process of foreclosure according to local requirements of the applicable jurisdiction. The Company’s adoption of this guidance on January 1, 2015 did not have a significant effect on the Company’s consolidated financial position or results of operations. The Company has made the required disclosures in note 4 of Notes to Financial Statements.
In January 2016, the FASB issued amended guidance related to recognition and measurement of financial assets and liabilities. The amended guidance requires that equity investments (excluding those accounted for under the equity method of accounting or those that result in consolidation of the investee) to be measured at fair value with changes in fair value recognized in net income. An entity can elect to measure equity investments that do not have readily determinable fair values at cost less impairment, plus or minus changes resulting from observable price changes in orderly transactions for the identical or similar investment of the same issuer. The impairment assessment of equity investments without readily determinable fair values is simplified by requiring a qualitative assessment to identify impairment. When a qualitative assessment indicates impairment exists, an entity is required to measure the investment at fair value. The guidance eliminates the requirement for public business entities to disclose the method and significant assumptions used to estimate the fair value that is required to be disclosed for financial instruments measured at amortized cost on the balance sheet. Further, the guidance requires public entities to use the exit price when measuring the
96
Table of Contents
fair value of financial instruments for disclosure purposes. The guidance also requires an entity to present separately in other comprehensive income, a change in the instrument-specific credit risk when the entity has elected to measure a liability at fair value in accordance with the fair value option. Separate presentation of financial assets and financial liabilities by measurement category and type of instrument on the balance sheet or accompanying notes to the financial statements is required. The guidance also clarifies that an entity should evaluate the need for a valuation allowance on a deferred tax asset related to available-for-sale securities in combination with the entity’s other deferred tax assets. This guidance is effective for annual periods and interim periods within those annual periods beginning after December 15, 2017. The Company is evaluating the impact the guidance could have on its consolidated financial statements.
In September 2015, the FASB issued amended guidance for measurement-period adjustments related to business combinations. The amended guidance requires that an acquirer recognize adjustments to provisional amounts that are identified during the measurement period in the reporting period in which the adjustment amounts are determined. The acquirer will be required to record, in the same period’s financial statements, the effect on earnings of changes in depreciation, amortization, or other income effects, if any, as a result of the change to the provisional amounts, calculated as if the accounting had been completed at the acquisition date. This guidance is effective for adjustments to provisional amounts that occur in annual periods and interim periods within those annual periods beginning after December 15, 2015. The Company does not expect the amended guidance to have a material impact on its consolidated financial statements.
In May 2015, the FASB issued amended disclosure guidance for investments in certain entities that calculate net asset value per share (or its equivalent). The amended guidance removes the requirement to categorize within the fair value hierarchy all investments for which fair value is measured using the net asset value per share practical expedient. The amendments also remove the requirement to make certain disclosures for all investments that are eligible to be measured at fair value using the net asset value per share practical expedient. Instead, those disclosures are limited to investments for which the entity has elected to measure the fair value using that practical expedient. This guidance is effective for annual periods and interim periods within those annual periods beginning after December 15, 2015. The Company does not expect the amended guidance to have a material impact on its consolidated financial statements.
In April 2015, the FASB issued amended accounting guidance for debt issuance costs. The amended guidance requires that debt issuance costs related to a recognized debt liability be presented in the balance sheet as a direct deduction from the carrying amount of that debt liability. This guidance is effective for annual periods and interim periods within those annual periods beginning after December 15, 2015. The Company does not expect a material change in the presentation of its consolidated financial position upon adoption of this amended guidance.
In February 2015, the FASB issued amended accounting guidance relating to the consolidation of variable interest entities to modify the evaluation of whether limited partnerships and similar legal entities are variable interest entities or voting interest entities and to eliminate the presumption that a general partner should consolidate a limited partnership. The amended guidance also eliminates certain conditions in the assessment of whether fees paid by a legal entity to a decision maker or a service provider represent a variable interest in the legal entity and reduces the extent to which related party arrangements cause an entity to be considered a primary beneficiary. The new guidance eliminates the indefinite deferral of existing consolidation guidance for certain investment funds, but provides a scope exception for reporting entities with interests in legal entities that are required to comply with or operate in accordance with requirements similar to those in Rule 2a-7 of the Investment Company Act of 1940 for registered money market funds. This guidance is effective for annual and interim periods within those annual periods beginning after December 15, 2015. The Company does not expect the amended guidance to have a material impact on its consolidated financial statements.
In June 2014, the FASB issued amended accounting guidance for share-based payments when the terms of an award provide that a performance target could be achieved after the requisite service period. The amended guidance requires that a performance target that affects vesting and that could be achieved after the requisite service period be treated as a performance condition. The performance target should not be reflected in estimating the grant-date fair value of the award. Compensation cost should be recognized in the period in which it becomes probable that the performance target will be
97
Table of Contents
achieved and should represent the compensation cost attributable to the period(s) for which the requisite service has already been rendered. If the performance target becomes probable of being achieved before the end of the requisite service period, the remaining unrecognized compensation cost should be recognized prospectively over the remaining requisite service period. The total amount of compensation cost recognized during and after the requisite service period should reflect the number of awards that are expected to vest and should be adjusted to reflect those awards that ultimately vest. The requisite service period ends when the employee can cease rendering service and still be eligible to vest in the award if the performance target is achieved. This guidance is effective for annual periods and interim periods within those annual periods beginning after December 31, 2015, with earlier adoption permitted. The Company does not expect the amended guidance to have a material impact on its consolidated financial position or results of operations.
In May 2014, the FASB issued amended accounting and disclosure guidance for revenue from contracts with customers. The core principle of the accounting guidance is that an entity should recognize revenue to depict the transfer of promised goods or services to customers in an amount that reflects the consideration to which the entity expects to be entitled in exchange for those goods or services. To achieve that core principle, an entity should apply the following steps: (1) identify the contract(s) with a customer; (2) identify the performance obligations in the contract; (3) determine the transaction price; (4) allocate the transaction price to the performance obligations in the contract; (5) recognize revenue when (or as) the entity satisfies a performance obligation. The guidance also specifies the accounting for some costs to obtain or fulfill a contract with a customer. The amended disclosure guidance requires sufficient information to enable users of financial statements to understand the nature, amount, timing, and uncertainty of revenue and cash flows arising from contracts with customers. In August 2015, the FASB deferred the effective date of this guidance by one year. The amended guidance is now effective for annual reporting periods beginning after December 15, 2017, including interim periods within that reporting period. The guidance should be applied either retrospectively to each prior reporting period presented or retrospectively with the cumulative effect of initially applying this guidance recognized at the date of initial application. The Company is still evaluating the impact the guidance could have on its consolidated financial statements.
Forward-Looking Statements
Management’s Discussion and Analysis of Financial Condition and Results of Operations and other sections of this Annual Report contain forward-looking statements that are based on current expectations, estimates and projections about the Company’s business, management’s beliefs and assumptions made by management. Forward-looking statements are typically identified by words such as “believe,” “expect,” “anticipate,” “intend,” “target,” “estimate,” “continue,” “positions,” “prospects” or “potential,” by future conditional verbs such as “will,” “would,” “should,” “could,” or “may,” or by variations of such words or by similar expressions. These statements are not guarantees of future performance and involve certain risks, uncertainties and assumptions (“Future Factors”) which are difficult to predict. Therefore, actual outcomes and results may differ materially from what is expressed or forecasted in such forward-looking statements. Forward-looking statements speak only as of the date they are made and the Company assumes no duty to update forward-looking statements.
Future Factors include changes in interest rates, spreads on earning assets and interest-bearing liabilities, and interest rate sensitivity; prepayment speeds, loan originations, credit losses and market values of loans, collateral securing loans and other assets; sources of liquidity; common shares outstanding; common stock price volatility; fair value of and number of stock-based compensation awards to be issued in future periods; the impact of changes in market values on trust-related revenues; legislation and/or regulation affecting the financial services industry as a whole, and M&T and its subsidiaries individually or collectively, including tax legislation or regulation; regulatory supervision and oversight, including monetary policy and capital requirements; changes in accounting policies or procedures as may be required by the FASB or regulatory agencies; increasing price and product/service competition by competitors, including new entrants; rapid technological developments and changes; the ability to continue to introduce competitive new products and services on a timely, cost-effective basis; the mix of products/services; containing costs and expenses; governmental and public policy changes; protection and validity of intellectual
98
Table of Contents
property rights; reliance on large customers; technological, implementation and cost/financial risks in large, multi-year contracts; the outcome of pending and future litigation and governmental proceedings, including tax-related examinations and other matters; continued availability of financing; financial resources in the amounts, at the times and on the terms required to support M&T and its subsidiaries’ future businesses; and material differences in the actual financial results of merger, acquisition and investment activities compared with M&T’s initial expectations, including the full realization of anticipated cost savings and revenue enhancements.
These are representative of the Future Factors that could affect the outcome of the forward-looking statements. In addition, such statements could be affected by general industry and market conditions and growth rates, general economic and political conditions, either nationally or in the states in which M&T and its subsidiaries do business, including interest rate and currency exchange rate fluctuations, changes and trends in the securities markets, and other Future Factors.
99
Table of Contents
Table 23
QUARTERLY TRENDS
| 2015 Quarters | 2014 Quarters | |||||||||||||||||||||||||||||||
| Earnings and dividends | Fourth | Third | Second | First | Fourth | Third | Second | First | ||||||||||||||||||||||||
|
Amounts in thousands, except per share |
||||||||||||||||||||||||||||||||
|
Interest income (taxable-equivalent basis) |
$ | 908,734 | $ | 776,274 | $ | 766,374 | $ | 743,925 | $ | 762,619 | $ | 748,864 | $ | 740,139 | $ | 728,897 | ||||||||||||||||
|
Interest expense |
95,333 | 77,199 | 77,226 | 78,499 | 74,772 | 73,964 | 65,176 | 66,519 | ||||||||||||||||||||||||
|
|
|
|
|
|
|
|
|
|
|
|
|
|
|
|
|
|||||||||||||||||
|
Net interest income |
813,401 | 699,075 | 689,148 | 665,426 | 687,847 | 674,900 | 674,963 | 662,378 | ||||||||||||||||||||||||
|
Less: provision for credit losses |
58,000 | 44,000 | 30,000 | 38,000 | 33,000 | 29,000 | 30,000 | 32,000 | ||||||||||||||||||||||||
|
Other income |
448,108 | 439,699 | 497,027 | 440,203 | 451,643 | 451,111 | 456,412 | 420,107 | ||||||||||||||||||||||||
|
Less: other expense |
786,113 | 653,816 | 696,628 | 686,375 | 666,221 | 665,359 | 667,660 | 690,234 | ||||||||||||||||||||||||
|
|
|
|
|
|
|
|
|
|
|
|
|
|
|
|
|
|||||||||||||||||
|
Income before income taxes |
417,396 | 440,958 | 459,547 | 381,254 | 440,269 | 431,652 | 433,715 | 360,251 | ||||||||||||||||||||||||
|
Applicable income taxes |
140,074 | 154,309 | 166,839 | 133,803 | 156,713 | 150,467 | 143,530 | 125,289 | ||||||||||||||||||||||||
|
Taxable-equivalent adjustment |
6,357 | 6,248 | 6,020 | 5,838 | 6,007 | 5,841 | 5,849 | 5,945 | ||||||||||||||||||||||||
|
|
|
|
|
|
|
|
|
|
|
|
|
|
|
|
|
|||||||||||||||||
|
Net income |
$ | 270,965 | $ | 280,401 | $ | 286,688 | $ | 241,613 | $ | 277,549 | $ | 275,344 | $ | 284,336 | $ | 229,017 | ||||||||||||||||
|
|
|
|
|
|
|
|
|
|
|
|
|
|
|
|
|
|||||||||||||||||
|
Net income available to common shareholders-diluted |
$ | 248,059 | $ | 257,346 | $ | 263,481 | $ | 218,837 | $ | 254,239 | $ | 251,917 | $ | 260,695 | $ | 211,731 | ||||||||||||||||
|
Per common share data |
||||||||||||||||||||||||||||||||
|
Basic earnings |
$ | 1.65 | $ | 1.94 | $ | 1.99 | $ | 1.66 | $ | 1.93 | $ | 1.92 | $ | 1.99 | $ | 1.63 | ||||||||||||||||
|
Diluted earnings |
1.65 | 1.93 | 1.98 | 1.65 | 1.92 | 1.91 | 1.98 | 1.61 | ||||||||||||||||||||||||
|
Cash dividends |
$ | .70 | $ | .70 | $ | .70 | $ | .70 | $ | .70 | $ | .70 | $ | .70 | $ | .70 | ||||||||||||||||
|
Average common shares outstanding |
||||||||||||||||||||||||||||||||
|
Basic |
150,027 | 132,630 | 132,356 | 132,049 | 131,450 | 131,265 | 130,856 | 130,212 | ||||||||||||||||||||||||
|
Diluted |
150,718 | 133,376 | 133,116 | 132,769 | 132,278 | 132,128 | 131,828 | 131,126 | ||||||||||||||||||||||||
|
Performance ratios, annualized |
||||||||||||||||||||||||||||||||
|
Return on |
||||||||||||||||||||||||||||||||
|
Average assets |
.93 | % | 1.13 | % | 1.18 | % | 1.02 | % | 1.12 | % | 1.17 | % | 1.27 | % | 1.07 | % | ||||||||||||||||
|
Average common shareholders’ equity |
7.22 | % | 8.93 | % | 9.37 | % | 7.99 | % | 9.10 | % | 9.18 | % | 9.79 | % | 8.22 | % | ||||||||||||||||
|
Net interest margin on average earning assets (taxable-equivalent basis) |
3.12 | % | 3.14 | % | 3.17 | % | 3.17 | % | 3.10 | % | 3.23 | % | 3.40 | % | 3.52 | % | ||||||||||||||||
|
Nonaccrual loans to total loans and leases, net of unearned discount |
.91 | % | 1.15 | % | 1.17 | % | 1.18 | % | 1.20 | % | 1.29 | % | 1.36 | % | 1.39 | % | ||||||||||||||||
|
Net operating (tangible) results(a) |
||||||||||||||||||||||||||||||||
|
Net operating income (in thousands) |
$ | 337,613 | $ | 282,907 | $ | 290,341 | $ | 245,776 | $ | 281,929 | $ | 279,838 | $ | 289,974 | $ | 235,162 | ||||||||||||||||
|
Diluted net operating income per common share |
2.09 | 1.95 | 2.01 | 1.68 | 1.95 | 1.94 | 2.02 | 1.66 | ||||||||||||||||||||||||
|
Annualized return on |
||||||||||||||||||||||||||||||||
|
Average tangible assets |
1.21 | % | 1.18 | % | 1.24 | % | 1.08 | % | 1.18 | % | 1.24 | % | 1.35 | % | 1.15 | % | ||||||||||||||||
|
Average tangible common shareholders’ equity |
13.26 | % | 12.98 | % | 13.76 | % | 11.90 | % | 13.55 | % | 13.80 | % | 14.92 | % | 12.76 | % | ||||||||||||||||
|
Efficiency ratio(b) |
55.53 | % | 57.05 | % | 58.23 | % | 61.46 | % | 57.84 | % | 58.44 | % | 58.20 | % | 62.83 | % | ||||||||||||||||
|
Balance sheet data |
||||||||||||||||||||||||||||||||
|
In millions, except per share |
||||||||||||||||||||||||||||||||
|
Average balances |
||||||||||||||||||||||||||||||||
|
Total assets(c) |
$ | 115,052 | $ | 98,515 | $ | 97,598 | $ | 95,892 | $ | 98,644 | $ | 93,245 | $ | 89,873 | $ | 86,665 | ||||||||||||||||
|
Total tangible assets(c) |
110,772 | 94,989 | 94,067 | 92,346 | 95,093 | 89,689 | 86,311 | 83,096 | ||||||||||||||||||||||||
|
Earning assets |
103,587 | 88,446 | 87,333 | 85,212 | 87,965 | 82,776 | 79,556 | 76,288 | ||||||||||||||||||||||||
|
Investment securities |
15,786 | 14,441 | 14,195 | 13,376 | 12,978 | 12,780 | 10,959 | 9,265 | ||||||||||||||||||||||||
|
Loans and leases, net of unearned discount |
81,110 | 67,849 | 67,670 | 66,587 | 65,767 | 64,763 | 64,343 | 63,763 | ||||||||||||||||||||||||
|
Deposits |
85,657 | 73,821 | 72,958 | 71,698 | 75,515 | 70,772 | 69,659 | 67,327 | ||||||||||||||||||||||||
|
Common shareholders’ equity(c) |
13,775 | 11,555 | 11,404 | 11,227 | 11,211 | 11,015 | 10,808 | 10,576 | ||||||||||||||||||||||||
|
Tangible common shareholders’ equity(c) |
9,495 | 8,029 | 7,873 | 7,681 | 7,660 | 7,459 | 7,246 | 7,007 | ||||||||||||||||||||||||
|
At end of quarter |
||||||||||||||||||||||||||||||||
|
Total assets(c) |
$ | 122,788 | $ | 97,797 | $ | 97,080 | $ | 98,378 | $ | 96,686 | $ | 97,228 | $ | 90,835 | $ | 88,530 | ||||||||||||||||
|
Total tangible assets(c) |
118,109 | 94,272 | 93,552 | 94,834 | 93,137 | 93,674 | 87,276 | 84,965 | ||||||||||||||||||||||||
|
Earning assets |
110,802 | 87,807 | 86,990 | 87,959 | 86,278 | 86,751 | 80,062 | 77,950 | ||||||||||||||||||||||||
|
Investment securities |
15,656 | 14,495 | 14,752 | 14,393 | 12,994 | 13,348 | 12,120 | 10,364 | ||||||||||||||||||||||||
|
Loans and leases, net of unearned discount |
87,489 | 68,540 | 68,131 | 67,099 | 66,669 | 65,572 | 64,748 | 64,135 | ||||||||||||||||||||||||
|
Deposits |
91,958 | 72,945 | 72,630 | 73,594 | 73,582 | 74,342 | 69,829 | 68,699 | ||||||||||||||||||||||||
|
Common shareholders’ equity, net of undeclared cumulative preferred dividends(c) |
14,939 | 11,687 | 11,433 | 11,294 | 11,102 | 11,099 | 10,934 | 10,652 | ||||||||||||||||||||||||
|
Tangible common shareholders’ equity(c) |
10,260 | 8,162 | 7,905 | 7,750 | 7,553 | 7,545 | 7,375 | 7,087 | ||||||||||||||||||||||||
|
Equity per common share |
93.60 | 87.67 | 85.90 | 84.95 | 83.88 | 83.99 | 82.86 | 81.05 | ||||||||||||||||||||||||
|
Tangible equity per common share |
64.28 | 61.22 | 59.39 | 58.29 | 57.06 | 57.10 | 55.89 | 53.92 | ||||||||||||||||||||||||
|
Market price per common share |
||||||||||||||||||||||||||||||||
|
High |
$ | 127.39 | $ | 134.00 | $ | 128.70 | $ | 129.58 | $ | 128.96 | $ | 128.69 | $ | 125.90 | $ | 123.04 | ||||||||||||||||
|
Low |
111.50 | 111.86 | 117.86 | 111.78 | 112.42 | 118.51 | 116.10 | 109.16 | ||||||||||||||||||||||||
|
Closing |
121.18 | 121.95 | 124.93 | 127.00 | 125.62 | 123.29 | 124.05 | 121.30 | ||||||||||||||||||||||||
| (a) | Excludes amortization and balances related to goodwill and core deposit and other intangible assets and merger-related expenses which, except in the calculation of the efficiency ratio, are net of applicable income tax effects. A reconciliation of net income and net operating income appears in Table 24. |
| (b) | Excludes impact of merger-related expenses and net securities transactions. |
| (c) | The difference between total assets and total tangible assets, and common shareholders’ equity and tangible common shareholders’ equity, represents goodwill, core deposit and other intangible assets, net of applicable deferred tax balances. A reconciliation of such balances appears in Table 24. |
100
Table of Contents
Table 24
RECONCILIATION OF QUARTERLY GAAP TO NON-GAAP MEASURES
| 2015 Quarters | 2014 Quarters | |||||||||||||||||||||||||||||||
| Fourth | Third | Second | First | Fourth | Third | Second | First | |||||||||||||||||||||||||
|
Income statement data |
||||||||||||||||||||||||||||||||
|
In thousands, except per share |
||||||||||||||||||||||||||||||||
|
Net income |
||||||||||||||||||||||||||||||||
|
Net income |
$ | 270,965 | $ | 280,401 | $ | 286,688 | $ | 241,613 | $ | 277,549 | $ | 275,344 | $ | 284,336 | $ | 229,017 | ||||||||||||||||
|
Amortization of core deposit and other intangible assets(a) |
5,828 | 2,506 | 3,653 | 4,163 | 4,380 | 4,494 | 5,638 | 6,145 | ||||||||||||||||||||||||
|
Merger-related expenses(a) |
60,820 | — | — | — | — | — | — | — | ||||||||||||||||||||||||
|
|
|
|
|
|
|
|
|
|
|
|
|
|
|
|
|
|||||||||||||||||
|
Net operating income |
$ | 337,613 | $ | 282,907 | $ | 290,341 | $ | 245,776 | $ | 281,929 | $ | 279,838 | $ | 289,974 | $ | 235,162 | ||||||||||||||||
|
|
|
|
|
|
|
|
|
|
|
|
|
|
|
|
|
|||||||||||||||||
|
Earnings per common share |
||||||||||||||||||||||||||||||||
|
Diluted earnings per common share |
$ | 1.65 | $ | 1.93 | $ | 1.98 | $ | 1.65 | $ | 1.92 | $ | 1.91 | $ | 1.98 | $ | 1.61 | ||||||||||||||||
|
Amortization of core deposit and other intangible assets(a) |
.04 | .02 | .03 | .03 | .03 | .03 | .04 | .05 | ||||||||||||||||||||||||
|
Merger-related expenses(a) |
.40 | — | — | — | — | — | — | — | ||||||||||||||||||||||||
|
|
|
|
|
|
|
|
|
|
|
|
|
|
|
|
|
|||||||||||||||||
|
Diluted net operating earnings per common share |
$ | 2.09 | $ | 1.95 | $ | 2.01 | $ | 1.68 | $ | 1.95 | $ | 1.94 | $ | 2.02 | $ | 1.66 | ||||||||||||||||
|
|
|
|
|
|
|
|
|
|
|
|
|
|
|
|
|
|||||||||||||||||
|
Other expense |
||||||||||||||||||||||||||||||||
|
Other expense |
$ | 786,113 | $ | 653,816 | $ | 696,628 | $ | 686,375 | $ | 666,221 | $ | 665,359 | $ | 667,660 | $ | 690,234 | ||||||||||||||||
|
Amortization of core deposit and other intangible assets |
(9,576 | ) | (4,090 | ) | (5,965 | ) | (6,793 | ) | (7,170 | ) | (7,358 | ) | (9,234 | ) | (10,062 | ) | ||||||||||||||||
|
Merger-related expenses |
(75,976 | ) | — | — | — | — | — | — | — | |||||||||||||||||||||||
|
|
|
|
|
|
|
|
|
|
|
|
|
|
|
|
|
|||||||||||||||||
|
Noninterest operating expense |
$ | 700,561 | $ | 649,726 | $ | 690,663 | $ | 679,582 | $ | 659,051 | $ | 658,001 | $ | 658,426 | $ | 680,172 | ||||||||||||||||
|
|
|
|
|
|
|
|
|
|
|
|
|
|
|
|
|
|||||||||||||||||
|
Merger-related expenses |
||||||||||||||||||||||||||||||||
|
Salaries and employee benefits |
$ | 51,287 | $ | — | $ | — | $ | — | $ | — | $ | — | $ | — | $ | — | ||||||||||||||||
|
Equipment and net occupancy |
3 | — | — | — | — | — | — | — | ||||||||||||||||||||||||
|
Printing, postage and supplies |
504 | — | — | — | — | — | — | — | ||||||||||||||||||||||||
|
Other costs of operations |
24,182 | — | — | — | — | — | — | — | ||||||||||||||||||||||||
|
|
|
|
|
|
|
|
|
|
|
|
|
|
|
|
|
|||||||||||||||||
|
Other expense |
75,976 | — | — | — | — | — | — | — | ||||||||||||||||||||||||
|
Provision for credit losses |
21,000 | — | — | — | — | — | — | — | ||||||||||||||||||||||||
|
|
|
|
|
|
|
|
|
|
|
|
|
|
|
|
|
|||||||||||||||||
|
Total |
$ | 96,976 | $ | — | $ | — | $ | — | $ | — | $ | — | $ | — | $ | — | ||||||||||||||||
|
|
|
|
|
|
|
|
|
|
|
|
|
|
|
|
|
|||||||||||||||||
|
Efficiency ratio |
||||||||||||||||||||||||||||||||
|
Noninterest operating expense (numerator) |
$ | 700,561 | $ | 649,726 | $ | 690,663 | $ | 679,582 | $ | 659,051 | $ | 658,001 | $ | 658,426 | $ | 680,172 | ||||||||||||||||
|
|
|
|
|
|
|
|
|
|
|
|
|
|
|
|
|
|||||||||||||||||
|
Taxable-equivalent net interest income |
813,401 | 699,075 | 689,148 | 665,426 | 687,847 | 674,900 | 674,963 | 662,378 | ||||||||||||||||||||||||
|
Other income |
448,108 | 439,699 | 497,027 | 440,203 | 451,643 | 451,111 | 456,412 | 420,107 | ||||||||||||||||||||||||
|
Less: Loss on bank investment securities |
(22 | ) | — | (10 | ) | (98 | ) | — | — | — | — | |||||||||||||||||||||
|
|
|
|
|
|
|
|
|
|
|
|
|
|
|
|
|
|||||||||||||||||
|
Denominator |
$ | 1,261,531 | $ | 1,138,774 | $ | 1,186,185 | $ | 1,105,727 | $ | 1,139,490 | $ | 1,126,011 | $ | 1,131,375 | $ | 1,082,485 | ||||||||||||||||
|
|
|
|
|
|
|
|
|
|
|
|
|
|
|
|
|
|||||||||||||||||
|
Efficiency ratio |
55.53 | % | 57.05 | % | 58.23 | % | 61.46 | % | 57.84 | % | 58.44 | % | 58.20 | % | 62.83 | % | ||||||||||||||||
|
|
|
|
|
|
|
|
|
|
|
|
|
|
|
|
|
|||||||||||||||||
|
Balance sheet data |
||||||||||||||||||||||||||||||||
|
In millions |
||||||||||||||||||||||||||||||||
|
Average assets |
||||||||||||||||||||||||||||||||
|
Average assets |
$ | 115,052 | $ | 98,515 | $ | 97,598 | $ | 95,892 | $ | 98,644 | $ | 93,245 | $ | 89,873 | $ | 86,665 | ||||||||||||||||
|
Goodwill |
(4,218 | ) | (3,513 | ) | (3,514 | ) | (3,525 | ) | (3,525 | ) | (3,525 | ) | (3,525 | ) | (3,525 | ) | ||||||||||||||||
|
Core deposit and other intangible assets |
(101 | ) | (20 | ) | (25 | ) | (31 | ) | (38 | ) | (45 | ) | (53 | ) | (64 | ) | ||||||||||||||||
|
Deferred taxes |
39 | 7 | 8 | 10 | 12 | 14 | 16 | 20 | ||||||||||||||||||||||||
|
|
|
|
|
|
|
|
|
|
|
|
|
|
|
|
|
|||||||||||||||||
|
Average tangible assets |
$ | 110,772 | $ | 94,989 | $ | 94,067 | $ | 92,346 | $ | 95,093 | $ | 89,689 | $ | 86,311 | $ | 83,096 | ||||||||||||||||
|
|
|
|
|
|
|
|
|
|
|
|
|
|
|
|
|
|||||||||||||||||
|
Average common equity |
||||||||||||||||||||||||||||||||
|
Average total equity |
$ | 15,007 | $ | 12,787 | $ | 12,636 | $ | 12,459 | $ | 12,442 | $ | 12,247 | $ | 12,039 | $ | 11,648 | ||||||||||||||||
|
Preferred stock |
(1,232 | ) | (1,232 | ) | (1,232 | ) | (1,232 | ) | (1,231 | ) | (1,232 | ) | (1,231 | ) | (1,072 | ) | ||||||||||||||||
|
|
|
|
|
|
|
|
|
|
|
|
|
|
|
|
|
|||||||||||||||||
|
Average common equity |
13,775 | 11,555 | 11,404 | 11,227 | 11,211 | 11,015 | 10,808 | 10,576 | ||||||||||||||||||||||||
|
Goodwill |
(4,218 | ) | (3,513 | ) | (3,514 | ) | (3,525 | ) | (3,525 | ) | (3,525 | ) | (3,525 | ) | (3,525 | ) | ||||||||||||||||
|
Core deposit and other intangible assets |
(101 | ) | (20 | ) | (25 | ) | (31 | ) | (38 | ) | (45 | ) | (53 | ) | (64 | ) | ||||||||||||||||
|
Deferred taxes |
39 | 7 | 8 | 10 | 12 | 14 | 16 | 20 | ||||||||||||||||||||||||
|
|
|
|
|
|
|
|
|
|
|
|
|
|
|
|
|
|||||||||||||||||
|
Average tangible common equity |
$ | 9,495 | $ | 8,029 | $ | 7,873 | $ | 7,681 | $ | 7,660 | $ | 7,459 | $ | 7,246 | $ | 7,007 | ||||||||||||||||
|
|
|
|
|
|
|
|
|
|
|
|
|
|
|
|
|
|||||||||||||||||
|
At end of quarter |
||||||||||||||||||||||||||||||||
|
Total assets |
||||||||||||||||||||||||||||||||
|
Total assets |
$ | 122,788 | $ | 97,797 | $ | 97,080 | $ | 98,378 | $ | 96,686 | $ | 97,228 | $ | 90,835 | $ | 88,530 | ||||||||||||||||
|
Goodwill |
(4,593 | ) | (3,513 | ) | (3,513 | ) | (3,525 | ) | (3,525 | ) | (3,525 | ) | (3,525 | ) | (3,525 | ) | ||||||||||||||||
|
Core deposit and other intangible assets |
(140 | ) | (18 | ) | (22 | ) | (28 | ) | (35 | ) | (42 | ) | (49 | ) | (59 | ) | ||||||||||||||||
|
Deferred taxes |
54 | 6 | 7 | 9 | 11 | 13 | 15 | 19 | ||||||||||||||||||||||||
|
|
|
|
|
|
|
|
|
|
|
|
|
|
|
|
|
|||||||||||||||||
|
Total tangible assets |
$ | 118,109 | $ | 94,272 | $ | 93,552 | $ | 94,834 | $ | 93,137 | $ | 93,674 | $ | 87,276 | $ | 84,965 | ||||||||||||||||
|
|
|
|
|
|
|
|
|
|
|
|
|
|
|
|
|
|||||||||||||||||
|
Total common equity |
||||||||||||||||||||||||||||||||
|
Total equity |
$ | 16,173 | $ | 12,922 | $ | 12,668 | $ | 12,528 | $ | 12,336 | $ | 12,333 | $ | 12,169 | $ | 11,887 | ||||||||||||||||
|
Preferred stock |
(1,232 | ) | (1,232 | ) | (1,232 | ) | (1,232 | ) | (1,231 | ) | (1,232 | ) | (1,232 | ) | (1,232 | ) | ||||||||||||||||
|
Undeclared dividends-cumulative preferred stock |
(2 | ) | (3 | ) | (3 | ) | (2 | ) | (3 | ) | (2 | ) | (3 | ) | (3 | ) | ||||||||||||||||
|
|
|
|
|
|
|
|
|
|
|
|
|
|
|
|
|
|||||||||||||||||
|
Common equity, net of undeclared cumulative preferred dividends |
14,939 | 11,687 | 11,433 | 11,294 | 11,102 | 11,099 | 10,934 | 10,652 | ||||||||||||||||||||||||
|
Goodwill |
(4,593 | ) | (3,513 | ) | (3,513 | ) | (3,525 | ) | (3,525 | ) | (3,525 | ) | (3,525 | ) | (3,525 | ) | ||||||||||||||||
|
Core deposit and other intangible assets |
(140 | ) | (18 | ) | (22 | ) | (28 | ) | (35 | ) | (42 | ) | (49 | ) | (59 | ) | ||||||||||||||||
|
Deferred taxes |
54 | 6 | 7 | 9 | 11 | 13 | 15 | 19 | ||||||||||||||||||||||||
|
|
|
|
|
|
|
|
|
|
|
|
|
|
|
|
|
|||||||||||||||||
|
Total tangible common equity |
$ | 10,260 | $ | 8,162 | $ | 7,905 | $ | 7,750 | $ | 7,553 | $ | 7,545 | $ | 7,375 | $ | 7,087 | ||||||||||||||||
|
|
|
|
|
|
|
|
|
|
|
|
|
|
|
|
|
|||||||||||||||||
| (a) | After any related tax effect. |
101
Table of Contents
| Item 7A. | Quantitative and Qualitative Disclosures About Market Risk. |
Incorporated by reference to the discussion contained in Part II, Item 7, “Management’s Discussion and Analysis of Financial Condition and Results of Operations,” under the captions “Liquidity, Market Risk, and Interest Rate Sensitivity” (including Table 21) and “Capital.”
| Item 8. | Financial Statements and Supplementary Data. |
Financial Statements and Supplementary Data consist of the financial statements as indexed and presented below and Table 23 “Quarterly Trends” presented in Part II, Item 7, “Management’s Discussion and Analysis of Financial Condition and Results of Operations.”
| Index to Financial Statements and Financial Statement Schedules | ||||
| 103 | ||||
| 104 | ||||
| 105 | ||||
|
Consolidated Statement of Income — Years ended December 31, 2015, 2014 and 2013 |
106 | |||
|
Consolidated Statement of Comprehensive Income — Years ended December 31, 2015, 2014 and 2013 |
107 | |||
|
Consolidated Statement of Cash Flows — Years ended December 31, 2015, 2014 and 2013 |
108 | |||
| 109 | ||||
| 110 | ||||
102
Table of Contents
Report on Internal Control Over Financial Reporting
Management is responsible for establishing and maintaining adequate internal control over financial reporting at M&T Bank Corporation and subsidiaries (“the Company”). Management has assessed the effectiveness of the Company’s internal control over financial reporting as of December 31, 2015 based on criteria described in “Internal Control — Integrated Framework (2013)” issued by the Committee of Sponsoring Organizations of the Treadway Commission. Based on that assessment, management concluded that the Company maintained effective internal control over financial reporting as of December 31, 2015.
The consolidated financial statements of the Company have been audited by PricewaterhouseCoopers LLP, an independent registered public accounting firm, that was engaged to express an opinion as to the fairness of presentation of such financial statements. PricewaterhouseCoopers LLP was also engaged to assess the effectiveness of the Company’s internal control over financial reporting. The report of PricewaterhouseCoopers LLP follows this report.
| M&T BANK CORPORATION | ||

|
||
| R OBERT G. W ILMERS | ||
| Chairman of the Board and Chief Executive Officer | ||

|
||
| R ENÉ F. J ONES | ||
| Executive Vice President and Chief Financial Officer | ||
103
Table of Contents
Report of Independent Registered Public Accounting Firm
To the Board of Directors and Shareholders of
M&T Bank Corporation
In our opinion, the accompanying consolidated balance sheets and the related consolidated statements of income, comprehensive income, cash flows, and changes in shareholders’ equity present fairly, in all material respects, the financial position of M&T Bank Corporation and its subsidiaries (the “Company”) at December 31, 2015 and December 31, 2014, and the results of its operations and its cash flows for each of the three years in the period ended December 31, 2015 in conformity with accounting principles generally accepted in the United States of America. Also in our opinion, the Company maintained, in all material respects, effective internal control over financial reporting as of December 31, 2015, based on criteria established in Internal Control — Integrated Framework (2013) issued by the Committee of Sponsoring Organizations of the Treadway Commission (COSO). The Company’s management is responsible for these financial statements, for maintaining effective internal control over financial reporting and for its assessment of the effectiveness of internal control over financial reporting, included in the accompanying Report on Internal Control over Financial Reporting. Our responsibility is to express opinions on these financial statements and on the Company’s internal control over financial reporting based on our integrated audits. We conducted our audits in accordance with the standards of the Public Company Accounting Oversight Board (United States). Those standards require that we plan and perform the audits to obtain reasonable assurance about whether the financial statements are free of material misstatement and whether effective internal control over financial reporting was maintained in all material respects. Our audits of the financial statements included examining, on a test basis, evidence supporting the amounts and disclosures in the financial statements, assessing the accounting principles used and significant estimates made by management, and evaluating the overall financial statement presentation. Our audit of internal control over financial reporting included obtaining an understanding of internal control over financial reporting, assessing the risk that a material weakness exists, and testing and evaluating the design and operating effectiveness of internal control based on the assessed risk. Our audits also included performing such other procedures as we considered necessary in the circumstances. We believe that our audits provide a reasonable basis for our opinions.
A company’s internal control over financial reporting is a process designed to provide reasonable assurance regarding the reliability of financial reporting and the preparation of financial statements for external purposes in accordance with generally accepted accounting principles. A company’s internal control over financial reporting includes those policies and procedures that (i) pertain to the maintenance of records that, in reasonable detail, accurately and fairly reflect the transactions and dispositions of the assets of the company; (ii) provide reasonable assurance that transactions are recorded as necessary to permit preparation of financial statements in accordance with generally accepted accounting principles, and that receipts and expenditures of the company are being made only in accordance with authorizations of management and directors of the company; and (iii) provide reasonable assurance regarding prevention or timely detection of unauthorized acquisition, use, or disposition of the company’s assets that could have a material effect on the financial statements.
Because of its inherent limitations, internal control over financial reporting may not prevent or detect misstatements. Also, projections of any evaluation of effectiveness to future periods are subject to the risk that controls may become inadequate because of changes in conditions, or that the degree of compliance with the policies or procedures may deteriorate.

Buffalo, New York
February 19, 2016
104
Table of Contents
M&T BANK CORPORATION AND SUBSIDIARIES
Consolidated Balance Sheet
| (Dollars in thousands, except per share) | December 31 | |||||||
| 2015 | 2014 | |||||||
|
Assets |
||||||||
|
Cash and due from banks |
$ | 1,368,040 | $ | 1,289,965 | ||||
|
Interest-bearing deposits at banks |
7,594,350 | 6,470,867 | ||||||
|
Federal funds sold |
— | 83,392 | ||||||
|
Trading account |
273,783 | 308,175 | ||||||
|
Investment securities (includes pledged securities that can be sold or repledged of $2,136,712 at December 31, 2015; $1,631,267 at December 31, 2014) |
||||||||
|
Available for sale (cost: $12,138,636 at December 31, 2015; $8,919,324 at December 31, 2014) |
12,242,671 | 9,156,932 | ||||||
|
Held to maturity (fair value: $2,864,147 at December 31, 2015; $3,538,282 at December 31, 2014) |
2,859,709 | 3,507,868 | ||||||
|
Other (fair value: $554,059 at December 31, 2015; $328,742 at December 31, 2014) |
554,059 | 328,742 | ||||||
|
|
|
|
|
|||||
|
Total investment securities |
15,656,439 | 12,993,542 | ||||||
|
|
|
|
|
|||||
|
Loans and leases |
87,719,234 | 66,899,369 | ||||||
|
Unearned discount |
(229,735 | ) | (230,413 | ) | ||||
|
|
|
|
|
|||||
|
Loans and leases, net of unearned discount |
87,489,499 | 66,668,956 | ||||||
|
Allowance for credit losses |
(955,992 | ) | (919,562 | ) | ||||
|
|
|
|
|
|||||
|
Loans and leases, net |
86,533,507 | 65,749,394 | ||||||
|
|
|
|
|
|||||
|
Premises and equipment |
666,682 | 612,984 | ||||||
|
Goodwill |
4,593,112 | 3,524,625 | ||||||
|
Core deposit and other intangible assets |
140,268 | 35,027 | ||||||
|
Accrued interest and other assets |
5,961,703 | 5,617,564 | ||||||
|
|
|
|
|
|||||
|
Total assets |
$ | 122,787,884 | $ | 96,685,535 | ||||
|
|
|
|
|
|||||
|
Liabilities |
||||||||
|
Noninterest-bearing deposits |
$ | 29,110,635 | $ | 26,947,880 | ||||
|
Interest-checking deposits |
2,939,274 | 2,307,815 | ||||||
|
Savings deposits |
46,627,370 | 41,085,803 | ||||||
|
Time deposits |
13,110,392 | 3,063,973 | ||||||
|
Deposits at Cayman Islands office |
170,170 | 176,582 | ||||||
|
|
|
|
|
|||||
|
Total deposits |
91,957,841 | 73,582,053 | ||||||
|
|
|
|
|
|||||
|
Federal funds purchased and agreements to repurchase securities |
150,546 | 192,676 | ||||||
|
Other short-term borrowings |
1,981,636 | — | ||||||
|
Accrued interest and other liabilities |
1,870,714 | 1,567,951 | ||||||
|
Long-term borrowings |
10,653,858 | 9,006,959 | ||||||
|
|
|
|
|
|||||
|
Total liabilities |
106,614,595 | 84,349,639 | ||||||
|
|
|
|
|
|||||
|
Shareholders’ equity |
||||||||
|
Preferred stock, $1.00 par, 1,000,000 shares authorized; Issued and outstanding: Liquidation preference of $1,000 per share: 731,500 shares at December 31, 2015 and December 31, 2014; Liquidation preference of $10,000 per share: 50,000 shares at December 31, 2015 and December 31, 2014 |
1,231,500 | 1,231,500 | ||||||
|
Common stock, $.50 par, 250,000,000 shares authorized, 159,563,512 shares issued at December 31, 2015; 132,312,931 shares issued at December 31, 2014 |
79,782 | 66,157 | ||||||
|
Common stock issuable, 36,644 shares at December 31, 2015; 41,330 shares at December 31, 2014 |
2,364 | 2,608 | ||||||
|
Additional paid-in capital |
6,680,768 | 3,409,506 | ||||||
|
Retained earnings |
8,430,502 | 7,807,119 | ||||||
|
Accumulated other comprehensive income (loss), net |
(251,627 | ) | (180,994 | ) | ||||
|
|
|
|
|
|||||
|
Total shareholders’ equity |
16,173,289 | 12,335,896 | ||||||
|
|
|
|
|
|||||
|
Total liabilities and shareholders’ equity |
$ | 122,787,884 | $ | 96,685,535 | ||||
|
|
|
|
|
|||||
See accompanying notes to financial statements.
105
Table of Contents
M&T BANK CORPORATION AND SUBSIDIARIES
| (In thousands, except per share) | Year Ended December 31 | |||||||||||
| 2015 | 2014 | 2013 | ||||||||||
|
Interest income |
||||||||||||
|
Loans and leases, including fees |
$ | 2,778,151 | $ | 2,596,586 | $ | 2,734,708 | ||||||
|
Investment securities |
||||||||||||
|
Fully taxable |
372,162 | 340,391 | 209,244 | |||||||||
|
Exempt from federal taxes |
4,263 | 5,356 | 6,802 | |||||||||
|
Deposits at banks |
15,252 | 13,361 | 5,201 | |||||||||
|
Other |
1,016 | 1,183 | 1,379 | |||||||||
|
|
|
|
|
|
|
|||||||
|
Total interest income |
3,170,844 | 2,956,877 | 2,957,334 | |||||||||
|
|
|
|
|
|
|
|||||||
|
Interest expense |
||||||||||||
|
Interest-checking deposits |
1,404 | 1,404 | 1,287 | |||||||||
|
Savings deposits |
44,736 | 45,465 | 54,948 | |||||||||
|
Time deposits |
27,059 | 15,515 | 26,439 | |||||||||
|
Deposits at Cayman Islands office |
615 | 699 | 1,018 | |||||||||
|
Short-term borrowings |
1,677 | 101 | 430 | |||||||||
|
Long-term borrowings |
252,766 | 217,247 | 199,983 | |||||||||
|
|
|
|
|
|
|
|||||||
|
Total interest expense |
328,257 | 280,431 | 284,105 | |||||||||
|
|
|
|
|
|
|
|||||||
|
Net interest income |
2,842,587 | 2,676,446 | 2,673,229 | |||||||||
|
Provision for credit losses |
170,000 | 124,000 | 185,000 | |||||||||
|
|
|
|
|
|
|
|||||||
|
Net interest income after provision for credit losses |
2,672,587 | 2,552,446 | 2,488,229 | |||||||||
|
|
|
|
|
|
|
|||||||
|
Other income |
||||||||||||
|
Mortgage banking revenues |
375,738 | 362,912 | 331,265 | |||||||||
|
Service charges on deposit accounts |
420,608 | 427,956 | 446,941 | |||||||||
|
Trust income |
470,640 | 508,258 | 496,008 | |||||||||
|
Brokerage services income |
64,770 | 67,212 | 65,647 | |||||||||
|
Trading account and foreign exchange gains |
30,577 | 29,874 | 40,828 | |||||||||
|
Gain (loss) on bank investment securities |
(130 | ) | — | 56,457 | ||||||||
|
Total other-than-temporary impairment (“OTTI”) losses |
— | — | (1,884 | ) | ||||||||
|
Portion of OTTI losses recognized in other comprehensive income (before taxes) |
— | — | (7,916 | ) | ||||||||
|
|
|
|
|
|
|
|||||||
|
Net OTTI losses recognized in earnings |
— | — | (9,800 | ) | ||||||||
|
Equity in earnings of Bayview Lending Group LLC |
(14,267 | ) | (16,672 | ) | (16,126 | ) | ||||||
|
Other revenues from operations |
477,101 | 399,733 | 453,985 | |||||||||
|
|
|
|
|
|
|
|||||||
|
Total other income |
1,825,037 | 1,779,273 | 1,865,205 | |||||||||
|
|
|
|
|
|
|
|||||||
|
Other expense |
||||||||||||
|
Salaries and employee benefits |
1,549,530 | 1,404,950 | 1,355,178 | |||||||||
|
Equipment and net occupancy |
272,539 | 269,299 | 264,327 | |||||||||
|
Printing, postage and supplies |
38,491 | 38,201 | 39,557 | |||||||||
|
Amortization of core deposit and other intangible assets |
26,424 | 33,824 | 46,912 | |||||||||
|
FDIC assessments |
52,113 | 55,531 | 69,584 | |||||||||
|
Other costs of operations |
883,835 | 887,669 | 812,308 | |||||||||
|
|
|
|
|
|
|
|||||||
|
Total other expense |
2,822,932 | 2,689,474 | 2,587,866 | |||||||||
|
|
|
|
|
|
|
|||||||
|
Income before taxes |
1,674,692 | 1,642,245 | 1,765,568 | |||||||||
|
Income taxes |
595,025 | 575,999 | 627,088 | |||||||||
|
|
|
|
|
|
|
|||||||
|
Net income |
$ | 1,079,667 | $ | 1,066,246 | $ | 1,138,480 | ||||||
|
|
|
|
|
|
|
|||||||
|
Net income available to common shareholders |
||||||||||||
|
Basic |
$ | 987,689 | $ | 978,531 | $ | 1,062,429 | ||||||
|
Diluted |
987,724 | 978,581 | 1,062,496 | |||||||||
|
Net income per common share |
||||||||||||
|
Basic |
$ | 7.22 | $ | 7.47 | $ | 8.26 | ||||||
|
Diluted |
7.18 | 7.42 | 8.20 | |||||||||
See accompanying notes to financial statements.
106
Table of Contents
M&T BANK CORPORATION AND SUBSIDIARIES
Consolidated Statement of Comprehensive Income
| (In thousands) | Year Ended December 31 | |||||||||||
| 2015 | 2014 | 2013 | ||||||||||
|
Net income |
$ | 1,079,667 | $ | 1,066,246 | $ | 1,138,480 | ||||||
|
Other comprehensive income, net of tax and reclassification adjustments: |
||||||||||||
|
Net unrealized gains (losses) on investment securities |
(79,114 | ) | 93,275 | (2,865 | ) | |||||||
|
Unrealized gains (losses) on cash flow hedges |
796 | (96 | ) | — | ||||||||
|
Foreign currency translation adjustment |
(925 | ) | (2,607 | ) | 381 | |||||||
|
Defined benefit plans liability adjustments |
8,610 | (207,407 | ) | 178,589 | ||||||||
|
|
|
|
|
|
|
|||||||
|
Total other comprehensive income (loss) |
(70,633 | ) | (116,835 | ) | 176,105 | |||||||
|
|
|
|
|
|
|
|||||||
|
Total comprehensive income |
$ | 1,009,034 | $ | 949,411 | $ | 1,314,585 | ||||||
|
|
|
|
|
|
|
|||||||
See accompanying notes to financial statements.
107
Table of Contents
M&T BANK CORPORATION AND SUBSIDIARIES
| (In thousands) | Year Ended December 31 | |||||||||||
| 2015 | 2014 | 2013 | ||||||||||
|
Cash flows from operating activities |
||||||||||||
|
Net income |
$ | 1,079,667 | $ | 1,066,246 | $ | 1,138,480 | ||||||
|
Adjustments to reconcile net income to net cash provided by operating activities |
||||||||||||
|
Provision for credit losses |
170,000 | 124,000 | 185,000 | |||||||||
|
Depreciation and amortization of premises and equipment |
99,019 | 96,496 | 91,469 | |||||||||
|
Amortization of capitalized servicing rights |
49,906 | 68,410 | 65,354 | |||||||||
|
Amortization of core deposit and other intangible assets |
26,424 | 33,824 | 46,912 | |||||||||
|
Provision for deferred income taxes |
396,596 | 92,848 | 139,785 | |||||||||
|
Asset write-downs |
9,029 | 6,593 | 17,918 | |||||||||
|
Net gain on sales of assets |
(67,759 | ) | (6,859 | ) | (127,890 | ) | ||||||
|
Net change in accrued interest receivable, payable |
(46,338 | ) | 15,163 | (10,523 | ) | |||||||
|
Net change in other accrued income and expense |
(289,139 | ) | (68,722 | ) | 71,523 | |||||||
|
Net change in loans originated for sale |
323,330 | (350,581 | ) | (674,062 | ) | |||||||
|
Net change in trading account assets and liabilities |
(8,327 | ) | 21,623 | (11,642 | ) | |||||||
|
|
|
|
|
|
|
|||||||
|
Net cash provided by operating activities |
1,742,408 | 1,099,041 | 932,324 | |||||||||
|
|
|
|
|
|
|
|||||||
|
Cash flows from investing activities |
||||||||||||
|
Proceeds from sales of investment securities |
||||||||||||
|
Available for sale |
5,654,850 | 16 | 1,081,802 | |||||||||
|
Other |
183,892 | 23,445 | 13,172 | |||||||||
|
Proceeds from maturities of investment securities |
||||||||||||
|
Available for sale |
2,392,331 | 998,413 | 1,034,564 | |||||||||
|
Held to maturity |
662,959 | 468,999 | 287,837 | |||||||||
|
Purchases of investment securities |
||||||||||||
|
Available for sale |
(3,614,324 | ) | (5,347,145 | ) | (197,931 | ) | ||||||
|
Held to maturity |
(29,431 | ) | (21,283 | ) | (1,977,064 | ) | ||||||
|
Other |
(99,317 | ) | (53,606 | ) | (9,105 | ) | ||||||
|
Net (increase) decrease in loans and leases |
(2,326,744 | ) | (2,421,162 | ) | 123,120 | |||||||
|
Net (increase) decrease in interest-bearing deposits at banks |
6,445,451 | (4,819,729 | ) | (1,521,193 | ) | |||||||
|
Capital expenditures, net |
(81,936 | ) | (73,161 | ) | (129,563 | ) | ||||||
|
Net (increase) decrease in loan servicing advances |
448,271 | (484,689 | ) | (1,004,923 | ) | |||||||
|
Acquisition, net of cash acquired
|
(1,932,596 | ) | — | — | ||||||||
|
Other, net |
10,876 | 19,531 | 95,706 | |||||||||
|
|
|
|
|
|
|
|||||||
|
Net cash provided (used) by investing activities |
7,714,282 | (11,710,371 | ) | (2,203,578 | ) | |||||||
|
|
|
|
|
|
|
|||||||
|
Cash flows from financing activities |
||||||||||||
|
Net increase in deposits |
504,393 | 6,466,697 | 1,513,884 | |||||||||
|
Net decrease in short-term borrowings |
(2,167,405 | ) | (67,779 | ) | (814,027 | ) | ||||||
|
Proceeds from long-term borrowings |
1,500,000 | 4,345,478 | 799,760 | |||||||||
|
Payments on long-term borrowings |
(8,912,474 | ) | (426,275 | ) | (261,212 | ) | ||||||
|
Dividends paid — common |
(375,017 | ) | (371,199 | ) | (365,349 | ) | ||||||
|
Dividends paid — preferred |
(81,270 | ) | (70,234 | ) | (53,450 | ) | ||||||
|
Proceeds from issuance of preferred stock |
— | 346,500 | — | |||||||||
|
Other, net |
69,766 | 88,565 | 137,967 | |||||||||
|
|
|
|
|
|
|
|||||||
|
Net cash provided (used) by financing activities |
(9,462,007 | ) | 10,311,753 | 957,573 | ||||||||
|
|
|
|
|
|
|
|||||||
|
Net decrease in cash and cash equivalents |
(5,317 | ) | (299,577 | ) | (313,681 | ) | ||||||
|
Cash and cash equivalents at beginning of year |
1,373,357 | 1,672,934 | 1,986,615 | |||||||||
|
|
|
|
|
|
|
|||||||
|
Cash and cash equivalents at end of year |
$ | 1,368,040 | $ | 1,373,357 | $ | 1,672,934 | ||||||
|
|
|
|
|
|
|
|||||||
|
Supplemental disclosure of cash flow information |
||||||||||||
|
Interest received during the year |
$ | 3,134,311 | $ | 2,893,153 | $ | 2,894,699 | ||||||
|
Interest paid during the year |
400,329 | 257,553 | 301,734 | |||||||||
|
Income taxes paid during the year |
378,660 | 411,912 | 389,008 | |||||||||
|
Supplemental schedule of noncash investing and financing activities |
||||||||||||
|
Real estate acquired in settlement of loans |
$ | 67,753 | $ | 43,821 | $ | 44,804 | ||||||
|
Acquisition of bank and bank holding company |
||||||||||||
|
Common stock issued |
3,110,581 | — | — | |||||||||
|
Common stock awards converted |
28,243 | — | — | |||||||||
|
Fair value of |
||||||||||||
|
Assets acquired (noncash) |
36,567,632 | — | — | |||||||||
|
Liabilities assumed |
31,496,212 | — | — | |||||||||
|
Securitization of residential mortgage loans allocated to |
||||||||||||
|
Available-for-sale investment securities |
65,023 | 134,698 | 1,690,490 | |||||||||
|
Held-to-maturity investment securities |
— | — | 1,245,444 | |||||||||
|
Capitalized servicing rights |
646 | 1,760 | 30,879 | |||||||||
See accompanying notes to financial statements.
108
Table of Contents
M&T BANK CORPORATION AND SUBSIDIARIES
Consolidated Statement of Changes in Shareholders’ Equity
| (In thousands, except per share) |
Preferred
Stock |
Common
Stock |
Common
Stock Issuable |
Additional
Paid-in Capital |
Retained
Earnings |
Accumulated
Other Comprehensive Income (Loss), Net |
Total | |||||||||||||||||||||
|
2013 |
||||||||||||||||||||||||||||
|
Balance — January 1, 2013 |
$ | 872,500 | 64,088 | 3,473 | 3,025,520 | 6,477,276 | (240,264 | ) | $ | 10,202,593 | ||||||||||||||||||
|
Total comprehensive income |
— | — | — | — | 1,138,480 | 176,105 | 1,314,585 | |||||||||||||||||||||
|
Preferred stock cash dividends |
— | — | — | — | (53,450 | ) | — | (53,450 | ) | |||||||||||||||||||
|
Amortization of preferred stock discount |
9,000 | — | — | — | (9,000 | ) | — | — | ||||||||||||||||||||
|
Exercise of 407,542 Series C stock warrants into 186,589 shares of common stock |
— | 93 | — | (93 | ) | — | — | — | ||||||||||||||||||||
|
Exercise of 69,127 Series A stock warrants into 25,427 shares of common stock |
— | 13 | — | (13 | ) | — | — | — | ||||||||||||||||||||
|
Stock-based compensation plans: |
||||||||||||||||||||||||||||
|
Compensation expense, net |
— | 137 | — | 37,890 | — | — | 38,027 | |||||||||||||||||||||
|
Exercises of stock options, net |
— | 914 | — | 163,891 | — | — | 164,805 | |||||||||||||||||||||
|
Directors’ stock plan |
— | 8 | — | 1,636 | — | — | 1,644 | |||||||||||||||||||||
|
Deferred compensation plans, net, including dividend equivalents |
— | 5 | (558 | ) | 575 | (131 | ) | — | (109 | ) | ||||||||||||||||||
|
Other |
— | — | — | 2,608 | — | — | 2,608 | |||||||||||||||||||||
|
Common stock cash dividends — $2.80 per share |
— | — | — | — | (365,171 | ) | — | (365,171 | ) | |||||||||||||||||||
|
|
|
|
|
|
|
|
|
|
|
|
|
|
|
|||||||||||||||
|
Balance — December 31, 2013 |
$ | 881,500 | 65,258 | 2,915 | 3,232,014 | 7,188,004 | (64,159 | ) | $ | 11,305,532 | ||||||||||||||||||
|
2014 |
||||||||||||||||||||||||||||
|
Total comprehensive income |
— | — | — | — | 1,066,246 | (116,835 | ) | 949,411 | ||||||||||||||||||||
|
Preferred stock cash dividends |
— | — | — | — | (75,878 | ) | — | (75,878 | ) | |||||||||||||||||||
|
Issuance of Series E preferred stock |
350,000 | — | — | (3,500 | ) | — | — | 346,500 | ||||||||||||||||||||
|
Exercise of 427,905 Series A stock warrants into 169,543 shares of common stock |
— | 85 | — | (85 | ) | — | — | — | ||||||||||||||||||||
|
Stock-based compensation plans: |
||||||||||||||||||||||||||||
|
Compensation expense, net |
— | 128 | — | 45,306 | — | — | 45,434 | |||||||||||||||||||||
|
Exercises of stock options, net |
— | 633 | — | 122,476 | — | — | 123,109 | |||||||||||||||||||||
|
Stock purchase plan |
— | 43 | — | 9,545 | — | — | 9,588 | |||||||||||||||||||||
|
Directors’ stock plan |
— | 7 | — | 1,658 | — | — | 1,665 | |||||||||||||||||||||
|
Deferred compensation plans, net, including dividend equivalents |
— | 3 | (307 | ) | 345 | (116 | ) | — | (75 | ) | ||||||||||||||||||
|
Other |
— | — | — | 1,747 | — | — | 1,747 | |||||||||||||||||||||
|
Common stock cash dividends — $2.80 per share |
— | — | — | — | (371,137 | ) | — | (371,137 | ) | |||||||||||||||||||
|
|
|
|
|
|
|
|
|
|
|
|
|
|
|
|||||||||||||||
|
Balance — December 31, 2014 |
$ | 1,231,500 | 66,157 | 2,608 | 3,409,506 | 7,807,119 | (180,994 | ) | $ | 12,335,896 | ||||||||||||||||||
|
2015 |
||||||||||||||||||||||||||||
|
Total comprehensive income |
— | — | — | — | 1,079,667 | (70,633 | ) | 1,009,034 | ||||||||||||||||||||
|
Acquisition of Hudson City Bancorp, Inc.: |
||||||||||||||||||||||||||||
|
Common stock issued |
— | 12,977 | — | 3,097,604 | — | — | 3,110,581 | |||||||||||||||||||||
|
Common stock awards converted |
— | — | — | 28,243 | — | — | 28,243 | |||||||||||||||||||||
|
Preferred stock cash dividends |
— | — | — | — | (81,270 | ) | — | (81,270 | ) | |||||||||||||||||||
|
Exercise of 2,315 Series A stock warrants into 904 shares of common stock |
— | 1 | — | (1 | ) | — | — | — | ||||||||||||||||||||
|
Stock-based compensation plans: |
||||||||||||||||||||||||||||
|
Compensation expense, net |
— | 155 | — | 43,040 | — | — | 43,195 | |||||||||||||||||||||
|
Exercises of stock options, net |
— | 438 | — | 88,455 | — | — | 88,893 | |||||||||||||||||||||
|
Stock purchase plan |
— | 45 | — | 10,301 | — | — | 10,346 | |||||||||||||||||||||
|
Directors’ stock plan |
— | 7 | — | 1,754 | — | — | 1,761 | |||||||||||||||||||||
|
Deferred compensation plans, net, including dividend equivalents |
— | 2 | (244 | ) | 293 | (102 | ) | — | (51 | ) | ||||||||||||||||||
|
Other |
— | — | — | 1,573 | — | — | 1,573 | |||||||||||||||||||||
|
Common stock cash dividends — $2.80 per share |
— | — | — | — | (374,912 | ) | — | (374,912 | ) | |||||||||||||||||||
|
|
|
|
|
|
|
|
|
|
|
|
|
|
|
|||||||||||||||
|
Balance — December 31, 2015 |
$ | 1,231,500 | 79,782 | 2,364 | 6,680,768 | 8,430,502 | (251,627 | ) | $ | 16,173,289 | ||||||||||||||||||
|
|
|
|
|
|
|
|
|
|
|
|
|
|
|
|||||||||||||||
See accompanying notes to financial statements.
109
Table of Contents
M&T BANK CORPORATION AND SUBSIDIARIES
Notes to Financial Statements
1. Significant accounting policies
M&T Bank Corporation (“M&T”) is a bank holding company headquartered in Buffalo, New York. Through subsidiaries, M&T provides individuals, corporations and other businesses, and institutions with commercial and retail banking services, including loans and deposits, trust, mortgage banking, asset management, insurance and other financial services. Banking activities are largely focused on consumers residing in New York State, Maryland, New Jersey, Pennsylvania, Delaware, Connecticut, Virginia, West Virginia and the District of Columbia and on small and medium-size businesses based in those areas. Certain subsidiaries also conduct activities in other areas.
The accounting and reporting policies of M&T and subsidiaries (“the Company”) conform to generally accepted accounting principles (“GAAP”) and to general practices within the banking industry. The preparation of financial statements in conformity with GAAP requires management to make estimates and assumptions that affect the reported amounts of assets and liabilities and disclosure of contingent assets and liabilities at the date of the financial statements and the reported amounts of revenues and expenses during the reporting period. Actual results could differ from those estimates. The more significant accounting policies are as follows:
Consolidation
The consolidated financial statements include M&T and all of its subsidiaries. All significant intercompany accounts and transactions of consolidated subsidiaries have been eliminated in consolidation. The financial statements of M&T included in note 25 report investments in subsidiaries under the equity method. Information about some limited purpose entities that are affiliates of the Company but are not included in the consolidated financial statements appears in note 19.
Consolidated Statement of Cash Flows
For purposes of this statement, cash and due from banks and federal funds sold are considered cash and cash equivalents.
Securities purchased under agreements to resell and securities sold under agreements to repurchase
Securities purchased under agreements to resell and securities sold under agreements to repurchase are treated as collateralized financing transactions and are recorded at amounts equal to the cash or other consideration exchanged. It is generally the Company’s policy to take possession of collateral pledged to secure agreements to resell.
Trading account
Financial instruments used for trading purposes are stated at fair value. Realized gains and losses and unrealized changes in fair value of financial instruments utilized in trading activities are included in “trading account and foreign exchange gains” in the consolidated statement of income.
Investment securities
Investments in debt securities are classified as held to maturity and stated at amortized cost when management has the positive intent and ability to hold such securities to maturity. Investments in other debt securities and equity securities having readily determinable fair values are classified as available for sale and stated at estimated fair value. Amortization of premiums and accretion of discounts for investment securities available for sale and held to maturity are included in interest income.
Other securities are stated at cost and include stock of the Federal Reserve Bank of New York and the Federal Home Loan Bank (“FHLB”) of New York.
The cost basis of individual securities is written down through a charge to earnings when declines in value below amortized cost are considered to be other than temporary. In cases where
110
Table of Contents
fair value is less than amortized cost and the Company intends to sell a debt security, it is more likely than not to be required to sell a debt security before recovery of its amortized cost basis, or the Company does not expect to recover the entire amortized cost basis of a debt security, an other-than-temporary impairment is considered to have occurred. If the Company intends to sell the debt security or more likely than not will be required to sell the security before recovery of its amortized cost basis, the other-than-temporary impairment is recognized in earnings equal to the entire difference between the debt security’s amortized cost basis and its fair value. If the Company does not expect to recover the entire amortized cost basis of the security, the Company does not intend to sell the security and it is not more likely than not that the Company will be required to sell the security before recovery of its amortized cost basis, the other-than-temporary impairment is separated into (a) the amount representing the credit loss and (b) the amount related to all other factors. The amount of the other-than-temporary impairment related to the credit loss is recognized in earnings while the amount related to other factors is recognized in other comprehensive income, net of applicable taxes. Subsequently, the Company accounts for the other-than-temporarily impaired debt security as if the security had been purchased on the measurement date of the other-than-temporary impairment at an amortized cost basis equal to the previous amortized cost basis less the other-than-temporary impairment recognized in earnings. The cost basis of individual equity securities is written down to estimated fair value through a charge to earnings when declines in value below cost are considered to be other than temporary. Realized gains and losses on the sales of investment securities are determined using the specific identification method.
Loans and leases
The Company’s accounting methods for loans depends on whether the loans were originated by the Company or were acquired in a business combination.
Originated loans and leases
Interest income on loans is accrued on a level yield method. Loans are placed on nonaccrual status and previously accrued interest thereon is charged against income when principal or interest is delinquent 90 days, unless management determines that the loan status clearly warrants other treatment. Nonaccrual commercial loans and commercial real estate loans are returned to accrual status when borrowers have demonstrated an ability to repay their loans and there are no delinquent principal and interest payments. Consumer loans not secured by residential real estate are returned to accrual status when all past due principal and interest payments have been paid by the borrower. Loans secured by residential real estate are returned to accrual status when they are deemed to have an insignificant delay in payments of 90 days or less. Loan balances are charged off when it becomes evident that such balances are not fully collectible. For commercial loans and commercial real estate loans, charge-offs are recognized after an assessment by credit personnel of the capacity and willingness of the borrower to repay, the estimated value of any collateral, and any other potential sources of repayment. A charge-off is recognized when, after such assessment, it becomes evident that the loan balance is not fully collectible. For loans secured by residential real estate, the excess of the loan balances over the net realizable value of the property collateralizing the loan is charged-off when the loan becomes 150 days delinquent. Consumer loans are generally charged-off when the loans are 91 to 180 days past due, depending on whether the loan is collateralized and the status of repossession activities with respect to such collateral. Loan fees and certain direct loan origination costs are deferred and recognized as an interest yield adjustment over the life of the loan. Net deferred fees have been included in unearned discount as a reduction of loans outstanding. Commitments to sell real estate loans are utilized by the Company to hedge the exposure to changes in fair value of real estate loans held for sale. The carrying value of hedged real estate loans held for sale recorded in the consolidated balance sheet includes changes in estimated fair market value during the hedge period, typically from the date of close through the sale date. Valuation adjustments made on these loans and commitments are included in “mortgage banking revenues.”
Except for consumer and residential mortgage loans that are considered smaller balance homogenous loans and are evaluated collectively, the Company considers a loan to be impaired for purposes of applying GAAP when, based on current information and events, it is probable that the Company will be unable to collect all amounts according to the contractual terms of the loan
111
Table of Contents
agreement or the loan is delinquent 90 days. Regardless of loan type, the Company considers a loan to be impaired if it qualifies as a troubled debt restructuring. Impaired loans are classified as either nonaccrual or as loans renegotiated at below market rates which continue to accrue interest, provided that a credit assessment of the borrower’s financial condition results in an expectation of full repayment under the modified contractual terms. Certain loans greater than 90 days delinquent are not considered impaired if they are well-secured and in the process of collection. Loans less than 90 days delinquent are deemed to have an insignificant delay in payment and are generally not considered impaired. Impairment of a loan is measured based on the present value of expected future cash flows discounted at the loan’s effective interest rate, the loan’s observable market price, or the fair value of collateral if the loan is collateral-dependent. Interest received on impaired loans placed on nonaccrual status is generally applied to reduce the carrying value of the loan or, if principal is considered fully collectible, recognized as interest income.
Residual value estimates for commercial leases are generally determined through internal or external reviews of the leased property. The Company reviews commercial lease residual values at least annually and recognizes residual value impairments deemed to be other than temporary.
Loans and leases acquired in a business combination
Loans acquired in a business combination subsequent to December 31, 2008 are recorded at fair value with no carry-over of an acquired entity’s previously established allowance for credit losses. Purchased impaired loans represent specifically identified loans with evidence of credit deterioration for which it was probable at acquisition that the Company would be unable to collect all contractual principal and interest payments. For purchased impaired loans and other loans acquired at a discount that was, in part, attributable to credit quality, the excess of cash flows expected at acquisition over the estimated fair value of acquired loans is recognized as interest income over the remaining lives of the loans. Subsequent decreases in the expected principal cash flows require the Company to evaluate the need for additions to the Company’s allowance for credit losses. Subsequent improvements in expected cash flows result first in the recovery of any related allowance for credit losses and then in recognition of additional interest income over the then-remaining lives of the loans.
For all other acquired loans, the difference between the fair value and outstanding principal balance of the loans is recognized as an adjustment to interest income over the lives of those loans. Those loans are then accounted for in a manner that is similar to originated loans.
Allowance for credit losses
The allowance for credit losses represents, in management’s judgment, the amount of losses inherent in the loan and lease portfolio as of the balance sheet date. The allowance is determined by management’s evaluation of the loan and lease portfolio based on such factors as the differing economic risks associated with each loan category, the current financial condition of specific borrowers, the economic environment in which borrowers operate, the level of delinquent loans, the value of any collateral and, where applicable, the existence of any guarantees or indemnifications. The effects of probable decreases in expected principal cash flows on loans acquired at a discount are also considered in the establishment of the allowance for credit losses.
Assets taken in foreclosure of defaulted loans
Assets taken in foreclosure of defaulted loans are primarily comprised of commercial and residential real property and are included in “other assets” in the consolidated balance sheet. Upon acquisition of assets taken in satisfaction of a defaulted loan, the excess of the remaining loan balance over the asset’s estimated fair value less costs to sell is charged-off against the allowance for credit losses. Subsequent declines in value of the assets are recognized as “other costs of operations” in the consolidated statement of income.
Effective January 1, 2015, the Company adopted amended accounting and disclosure guidance for reclassification of residential real estate collateralized consumer mortgage loans upon foreclosure. The amended guidance clarifies that an in-substance repossession or foreclosure occurs and a creditor is considered to have received physical possession of residential real estate property collateralizing a consumer mortgage loan upon either (1) the creditor obtaining legal title to the residential real estate property upon completion of a foreclosure or (2) the borrower conveying all
112
Table of Contents
interest in the residential real estate property to the creditor to satisfy that loan through completion of a deed in lieu of foreclosure or through a similar legal agreement. The adoption resulted in an insignificant increase in other real estate owned.
Premises and equipment
Premises and equipment are stated at cost less accumulated depreciation. Depreciation expense is computed principally using the straight-line method over the estimated useful lives of the assets.
Capitalized servicing rights
Capitalized servicing assets are included in “other assets” in the consolidated balance sheet. Separately recognized servicing assets are initially measured at fair value. The Company uses the amortization method to subsequently measure servicing assets. Under that method, capitalized servicing assets are charged to expense in proportion to and over the period of estimated net servicing income.
To estimate the fair value of servicing rights, the Company considers market prices for similar assets and the present value of expected future cash flows associated with the servicing rights calculated using assumptions that market participants would use in estimating future servicing income and expense. Such assumptions include estimates of the cost of servicing loans, loan default rates, an appropriate discount rate, and prepayment speeds. For purposes of evaluating and measuring impairment of capitalized servicing rights, the Company stratifies such assets based on the predominant risk characteristics of the underlying financial instruments that are expected to have the most impact on projected prepayments, cost of servicing and other factors affecting future cash flows associated with the servicing rights. Such factors may include financial asset or loan type, note rate and term. The amount of impairment recognized is the amount by which the carrying value of the capitalized servicing rights for a stratum exceeds estimated fair value. Impairment is recognized through a valuation allowance.
Sales and securitizations of financial assets
Transfers of financial assets for which the Company has surrendered control of the financial assets are accounted for as sales. Interests in a sale of financial assets that continue to be held by the Company, including servicing rights, are measured at fair value. The fair values of retained debt securities are generally determined through reference to independent pricing information. The fair values of retained servicing rights and any other retained interests are determined based on the present value of expected future cash flows associated with those interests and by reference to market prices for similar assets.
Securitization structures typically require the use of special-purpose trusts that are considered variable interest entities. A variable interest entity is included in the consolidated financial statements if the Company has the power to direct the activities that most significantly impact the variable interest entity’s economic performance and has the obligation to absorb losses or the right to receive benefits of the variable interest entity that could potentially be significant to that entity.
Goodwill and core deposit and other intangible assets
Goodwill represents the excess of the cost of an acquired entity over the fair value of the identifiable net assets acquired. Goodwill is not amortized, but rather is tested for impairment at least annually at the reporting unit level, which is either at the same level or one level below an operating segment. Other acquired intangible assets with finite lives, such as core deposit intangibles, are initially recorded at estimated fair value and are amortized over their estimated lives. Core deposit and other intangible assets are generally amortized using accelerated methods over estimated useful lives of five to ten years. The Company periodically assesses whether events or changes in circumstances indicate that the carrying amounts of core deposit and other intangible assets may be impaired.
113
Table of Contents
Derivative financial instruments
The Company accounts for derivative financial instruments at fair value. If certain conditions are met, a derivative may be specifically designated as (a) a hedge of the exposure to changes in the fair value of a recognized asset or liability or an unrecognized firm commitment, (b) a hedge of the exposure to variable cash flows of a forecasted transaction or (c) a hedge of the foreign currency exposure of a net investment in a foreign operation, an unrecognized firm commitment, an available-for-sale security, or a foreign currency denominated forecasted transaction.
The Company utilizes interest rate swap agreements as part of the management of interest rate risk to modify the repricing characteristics of certain portions of its portfolios of earning assets and interest-bearing liabilities. For such agreements, amounts receivable or payable are recognized as accrued under the terms of the agreement and the net differential is recorded as an adjustment to interest income or expense of the related asset or liability. Interest rate swap agreements may be designated as either fair value hedges or cash flow hedges. In a fair value hedge, the fair values of the interest rate swap agreements and changes in the fair values of the hedged items are recorded in the Company’s consolidated balance sheet with the corresponding gain or loss recognized in current earnings. The difference between changes in the fair values of interest rate swap agreements and the hedged items represents hedge ineffectiveness and is recorded in “other revenues from operations” in the consolidated statement of income. In a cash flow hedge, the effective portion of the derivative’s unrealized gain or loss is initially recorded as a component of other comprehensive income and subsequently reclassified into earnings when the forecasted transaction affects earnings. The ineffective portion of the unrealized gain or loss is reported in “other revenues from operations” immediately.
The Company utilizes commitments to sell real estate loans to hedge the exposure to changes in the fair value of real estate loans held for sale. Commitments to originate real estate loans to be held for sale and commitments to sell real estate loans are generally recorded in the consolidated balance sheet at estimated fair value.
Derivative instruments not related to mortgage banking activities, including financial futures commitments and interest rate swap agreements, that do not satisfy the hedge accounting requirements are recorded at fair value and are generally classified as trading account assets or liabilities with resultant changes in fair value being recognized in “trading account and foreign exchange gains” in the consolidated statement of income.
Stock-based compensation
Stock-based compensation expense is recognized over the vesting period of the stock-based grant based on the estimated grant date value of the stock-based compensation that is expected to vest, except that the recognition of compensation costs is accelerated for stock-based awards granted to retirement-eligible employees and employees who will become retirement-eligible prior to full vesting of the award because the Company’s incentive compensation plan allows for vesting at the time an employee retires.
Income taxes
Deferred tax assets and liabilities are recognized for the future tax effects attributable to differences between the financial statement value of existing assets and liabilities and their respective tax bases and carryforwards. Deferred tax assets and liabilities are measured using enacted tax rates and laws.
The Company evaluates uncertain tax positions using the two-step process required by GAAP. The first step requires a determination of whether it is more likely than not that a tax position will be sustained upon examination, including resolution of any related appeals or litigation processes, based on the technical merits of the position. Under the second step, a tax position that meets the more-likely-than-not recognition threshold is measured at the largest amount of benefit that is greater than fifty percent likely of being realized upon ultimate settlement.
Effective January 1, 2015, the Company made an accounting policy election in accordance with amended accounting guidance issued by the Financial Accounting Standards Board to account for its investments in qualified affordable housing projects using the proportional amortization method. Under the proportional amortization method, the Company amortizes the initial cost of the investment in proportion to the tax credits and other tax benefits received and recognizes the net
114
Table of Contents
investment performance in the income statement as a component of income tax expense. The adoption of the amended guidance did not have a significant effect on the Company’s financial position or results of operations, but did result in the restatement of the consolidated statement of income for the years ended December 31, 2014 and 2013 to remove $53 million and $48 million, respectively, of losses associated with qualified affordable housing projects from “other costs of operations” and include the amortization of the initial cost of the investment in income tax expense. The cumulative effect adjustment associated with adopting the amended guidance was not material as of the beginning of any period presented in these consolidated financial statements.
Earnings per common share
Basic earnings per common share exclude dilution and are computed by dividing income available to common shareholders by the weighted-average number of common shares outstanding (exclusive of shares represented by the unvested portion of restricted stock and restricted stock unit grants) and common shares issuable under deferred compensation arrangements during the period. Diluted earnings per common share reflect shares represented by the unvested portion of restricted stock and restricted stock unit grants and the potential dilution that could occur if securities or other contracts to issue common stock were exercised or converted into common stock or resulted in the issuance of common stock that then shared in earnings. Proceeds assumed to have been received on such exercise or conversion are assumed to be used to purchase shares of M&T common stock at the average market price during the period, as required by the “treasury stock method” of accounting.
GAAP requires that unvested share-based payment awards that contain nonforfeitable rights to dividends or dividend equivalents (whether paid or unpaid) shall be considered participating securities and shall be included in the computation of earnings per common share pursuant to the two-class method. The Company has issued stock-based compensation awards in the form of restricted stock and restricted stock units that contain such rights and, accordingly, the Company’s earnings per common share are calculated using the two-class method.
Treasury stock
Repurchases of shares of M&T common stock are recorded at cost as a reduction of shareholders’ equity. Reissuances of shares of treasury stock are recorded at average cost.
2. Acquisition and divestiture
Hudson City Bancorp, Inc.
On November 1, 2015, M&T completed the acquisition of Hudson City Bancorp, Inc. (“Hudson City”), headquartered in Paramus, New Jersey. On that date, Hudson City Savings Bank, the banking subsidiary of Hudson City, was merged into M&T Bank, a wholly owned banking subsidiary of M&T. Hudson City Savings Bank operated 135 banking offices in New Jersey, Connecticut and New York at the date of acquisition. The results of operations acquired in the Hudson City transaction have been included in the Company’s financial results since November 1, 2015. After application of the election, allocation and proration procedures contained in the merger agreement with Hudson City, M&T paid $2.1 billion in cash and issued 25,953,950 shares of M&T common stock in exchange for Hudson City shares outstanding at the time of the acquisition. The purchase price was approximately $5.2 billion based on the cash paid to Hudson City shareholders, the fair value of M&T stock exchanged and the estimated fair value of Hudson City stock awards converted into M&T stock awards. The acquisition of Hudson City expanded the Company’s presence in New Jersey, Connecticut and New York, and management expects that the Company will benefit from greater geographic diversity and the advantages of scale associated with a larger company.
115
Table of Contents
The Hudson City transaction has been accounted for using the acquisition method of accounting and, accordingly, assets acquired, liabilities assumed and consideration exchanged were recorded at estimated fair value on the acquisition date. The consideration paid for Hudson City’s common equity and the amounts of acquired identifiable assets and liabilities assumed as of the acquisition date were as follows:
| (In thousands) | ||||
|
Identifiable assets: |
||||
|
Cash and due from banks |
$ | 131,688 | ||
|
Interest-bearing deposits at banks |
7,568,934 | |||
|
Investment securities |
7,929,014 | |||
|
Loans |
19,015,013 | |||
|
Goodwill |
1,079,787 | |||
|
Core deposit intangible |
131,665 | |||
|
Other assets |
843,219 | |||
|
|
|
|||
|
Total identifiable assets |
36,699,320 | |||
|
|
|
|||
|
Liabilities: |
||||
|
Deposits |
17,879,589 | |||
|
Borrowings |
13,211,598 | |||
|
Other liabilities |
405,025 | |||
|
|
|
|||
|
Total liabilities |
31,496,212 | |||
|
|
|
|||
|
Total consideration |
$ | 5,203,108 | ||
|
|
|
|||
|
Cash paid |
$ | 2,064,284 | ||
|
Common stock issued (25,953,950 shares) |
3,110,581 | |||
|
Common stock awards converted |
28,243 | |||
|
|
|
|||
|
Total consideration |
$ | 5,203,108 | ||
|
|
|
|||
In early November 2015, the Company sold $5.8 billion of investment securities obtained in the acquisition and repaid $10.6 billion of borrowings assumed in the transaction.
In connection with the acquisition, the Company recorded approximately $1.1 billion of goodwill and $132 million of core deposit intangible. The core deposit intangible asset is being amortized over a period of 7 years using an accelerated method. Information regarding the allocation of goodwill recorded as a result of the acquisition to the Company’s reportable segments, as well as the carrying amounts and amortization of core deposit and other intangible assets, is provided in note 8.
116
Table of Contents
In many cases, determining the fair value of the acquired assets and assumed liabilities required the Company to estimate cash flows expected to result from those assets and liabilities and to discount those cash flows at appropriate rates of interest. The most significant of these determinations related to the fair valuation of acquired loans. Approximately $688 million of the loans acquired from Hudson City had specific evidence of credit deterioration at the acquisition date and it was deemed probable that the Company would be unable to collect all contractually required principal and interest payments (“purchased impaired loans”). Such loans were acquired at a discount from outstanding customer principal balance of $1.0 billion. For purchased impaired loans, the excess of cash flows expected at acquisition over the estimated fair value is recognized as interest income over the remaining lives of the loans. The difference between contractually required payments at acquisition and the cash flows expected to be collected at acquisition, as shown in the following table, reflects the impact of estimated credit losses and other factors, such as prepayments.
|
November 1,
2015 |
||||
| (In thousands) | ||||
|
Contractually required principal and interest at acquisition |
$ | 1,304,366 | ||
|
Contractual cash flows not expected to be collected |
(498,919 | ) | ||
|
|
|
|||
|
Expected cash flows at acquisition |
805,447 | |||
|
Interest component of expected cash flows |
(117,251 | ) | ||
|
|
|
|||
|
Estimated fair value |
$ | 688,196 | ||
|
|
|
|||
The remaining acquired loans had a fair value of $18.3 billion and outstanding principal of $18.0 billion, resulting in a premium which will be amortized over the remaining lives of the loans as a reduction of interest income. In accordance with GAAP, there was no carry-over of Hudson City’s previously established allowance for credit losses.
The following table discloses the impact of Hudson City since the acquisition on November 1, 2015 through the end of 2015. The table also presents certain pro forma information as if Hudson City had been acquired on January 1, 2014. These results combine the historical results of Hudson City into the Company’s consolidated statement of income and, while certain adjustments were made for the estimated impact of certain fair valuation adjustments and other acquisition-related activity, they are not indicative of what would have occurred had the acquisition taken place on the indicated date. In particular, no adjustments have been made to eliminate the impact of gains on securities transactions of $102 million in 2015 and $104 million in 2014 that may not have been recognized had the investment securities been recorded at fair value as of the beginning of 2014. Furthermore, expenses related to systems conversions and other costs of integration of $97 million are included in the 2015 periods in which such costs were incurred. Additionally, the Company expects to achieve further operating cost savings and other business synergies as a result of the acquisition which are not reflected in the pro forma amounts that follow.
|
Actual Since
Acquisition Through December 31, 2015 |
Pro Forma
Year Ended December 31 |
|||||||||||
| 2015 | 2014 | |||||||||||
| (In thousands) | ||||||||||||
|
Total revenues(a) |
$ | 111,168 | $ | 5,132,662 | $ | 5,406,291 | ||||||
|
Net income (loss) |
(21,175 | ) | 1,011,463 | 1,445,779 | ||||||||
| (a) | Represents net interest income plus other income. |
In connection with the Hudson City acquisition, the Company incurred merger-related expenses related to systems conversions and other costs of integrating and conforming acquired operations with and into the Company. Those expenses consisted largely of professional services and other temporary help fees associated with preparing for systems conversions and/or integration of operations; costs related to termination of existing contractual arrangements for various services; initial marketing and promotion expenses designed to introduce M&T Bank to its new customers; severance (for former Hudson City employees); travel costs; and other costs of completing the transaction and commencing operations in new markets and offices. The Company expects that
117
Table of Contents
there will be additional merger-related expenses in 2016. There were no merger-related expenses during 2014. As of December 31, 2015, the remaining unpaid portion of incurred merger-related expenses was $56 million. The Company also recognized a $21 million provision for credit losses related to the $18.3 billion of Hudson City loans acquired at a premium. GAAP does not allow the credit loss component of the net premium associated with those loans to be bifurcated and accounted for as a nonaccreting difference as is the case with purchased impaired loans and other loans acquired at a discount. Neverthless, GAAP requires that an allowance for credit losses be recognized for incurred losses in loans acquired at a premium even though in a relatively homogenous portfolio of residential mortgage loans the specific loans to which the losses relate cannot be individually identified at the acquisition date. Given the recognition of such losses above and beyond the impact of forecasted losses used in determining the fair value of the loans acquired at a premium, the initial $21 million provision for credit losses has been noted as a merger-related expense.
A summary of merger-related expenses included in the consolidated statement of income for the years ended December 31, 2015 and 2013 follows:
| 2015 | 2013 | |||||||
| (In thousands) | ||||||||
|
Salaries and employee benefits |
$ | 51,287 | $ | 836 | ||||
|
Equipment and net occupancy |
3 | 690 | ||||||
|
Printing, postage and supplies |
504 | 1,825 | ||||||
|
Other cost of operations |
24,182 | 9,013 | ||||||
|
|
|
|
|
|||||
|
Other expense |
75,976 | 12,364 | ||||||
|
Provision for credit losses |
21,000 | — | ||||||
|
|
|
|
|
|||||
|
Total |
$ | 96,976 | $ | 12,364 | ||||
|
|
|
|
|
|||||
Sale of trust accounts
In April 2015, the Company sold the trade processing business within the retirement services division of its Institutional Client Services business. That sale resulted in an after-tax gain of $23 million ($45 million pre-tax) that reflected the allocation of approximately $11 million of previously recorded goodwill to the divested business. Revenues of the sold business had been included in “trust income” and were $9 million, $34 million and $38 million during 2015, 2014 and 2013, respectively. After considering related expenses, net income attributable to the business that was sold was not material to the consolidated results of operations of the Company in any of those periods.
118
Table of Contents
3. Investment securities
The amortized cost and estimated fair value of investment securities were as follows:
|
Amortized
Cost |
Gross
Unrealized Gains |
Gross
Unrealized Losses |
Estimated
Fair Value |
|||||||||||||
| (In thousands) | ||||||||||||||||
|
December 31, 2015 |
||||||||||||||||
|
Investment securities available for sale: |
||||||||||||||||
|
U.S. Treasury and federal agencies |
$ | 299,890 | $ | 294 | $ | 187 | $ | 299,997 | ||||||||
|
Obligations of states and political subdivisions |
5,924 | 146 | 42 | 6,028 | ||||||||||||
|
Mortgage-backed securities: |
||||||||||||||||
|
Government issued or guaranteed |
11,592,959 | 142,370 | 48,701 | 11,686,628 | ||||||||||||
|
Privately issued |
74 | 2 | 2 | 74 | ||||||||||||
|
Collateralized debt obligations |
28,438 | 20,143 | 1,188 | 47,393 | ||||||||||||
|
Other debt securities |
137,556 | 1,514 | 20,190 | 118,880 | ||||||||||||
|
Equity securities |
73,795 | 10,230 | 354 | 83,671 | ||||||||||||
|
|
|
|
|
|
|
|
|
|||||||||
| 12,138,636 | 174,699 | 70,664 | 12,242,671 | |||||||||||||
|
|
|
|
|
|
|
|
|
|||||||||
|
Investment securities held to maturity: |
||||||||||||||||
|
Obligations of states and political subdivisions |
118,431 | 1,003 | 421 | 119,013 | ||||||||||||
|
Mortgage-backed securities: |
||||||||||||||||
|
Government issued or guaranteed |
2,553,612 | 50,936 | 7,817 | 2,596,731 | ||||||||||||
|
Privately issued |
181,091 | 2,104 | 41,367 | 141,828 | ||||||||||||
|
Other debt securities |
6,575 | — | — | 6,575 | ||||||||||||
|
|
|
|
|
|
|
|
|
|||||||||
| 2,859,709 | 54,043 | 49,605 | 2,864,147 | |||||||||||||
|
|
|
|
|
|
|
|
|
|||||||||
|
Other securities |
554,059 | — | — | 554,059 | ||||||||||||
|
|
|
|
|
|
|
|
|
|||||||||
|
Total |
$ | 15,552,404 | $ | 228,742 | $ | 120,269 | $ | 15,660,877 | ||||||||
|
|
|
|
|
|
|
|
|
|||||||||
|
December 31, 2014 |
||||||||||||||||
|
Investment securities available for sale: |
||||||||||||||||
|
U.S. Treasury and federal agencies |
$ | 161,408 | $ | 544 | $ | 5 | $ | 161,947 | ||||||||
|
Obligations of states and political subdivisions |
8,027 | 224 | 53 | 8,198 | ||||||||||||
|
Mortgage-backed securities: |
||||||||||||||||
|
Government issued or guaranteed |
8,507,571 | 223,889 | 337 | 8,731,123 | ||||||||||||
|
Privately issued |
104 | 2 | 3 | 103 | ||||||||||||
|
Collateralized debt obligations |
30,073 | 21,276 | 1,033 | 50,316 | ||||||||||||
|
Other debt securities |
138,240 | 1,896 | 18,648 | 121,488 | ||||||||||||
|
Equity securities |
73,901 | 11,020 | 1,164 | 83,757 | ||||||||||||
|
|
|
|
|
|
|
|
|
|||||||||
| 8,919,324 | 258,851 | 21,243 | 9,156,932 | |||||||||||||
|
|
|
|
|
|
|
|
|
|||||||||
|
Investment securities held to maturity: |
||||||||||||||||
|
Obligations of states and political subdivisions |
148,961 | 2,551 | 189 | 151,323 | ||||||||||||
|
Mortgage-backed securities: |
||||||||||||||||
|
Government issued or guaranteed |
3,149,320 | 78,485 | 7,000 | 3,220,805 | ||||||||||||
|
Privately issued |
201,733 | 1,143 | 44,576 | 158,300 | ||||||||||||
|
Other debt securities |
7,854 | — | — | 7,854 | ||||||||||||
|
|
|
|
|
|
|
|
|
|||||||||
| 3,507,868 | 82,179 | 51,765 | 3,538,282 | |||||||||||||
|
|
|
|
|
|
|
|
|
|||||||||
|
Other securities |
328,742 | — | — | 328,742 | ||||||||||||
|
|
|
|
|
|
|
|
|
|||||||||
|
Total |
$ | 12,755,934 | $ | 341,030 | $ | 73,008 | $ | 13,023,956 | ||||||||
|
|
|
|
|
|
|
|
|
|||||||||
119
Table of Contents
No investment in securities of a single non-U.S. Government or government agency issuer exceeded ten percent of shareholders’ equity at December 31, 2015.
As of December 31, 2015, the latest available investment ratings of all obligations of states and political subdivisions, privately issued mortgage-backed securities, collateralized debt obligations and other debt securities were:
|
Amortized
Cost |
Estimated
Fair Value |
Average Credit Rating of Fair Value Amount | ||||||||||||||||||||||||||
|
A or
Better |
BBB | BB | B or Less |
Not
Rated |
||||||||||||||||||||||||
| (In thousands) | ||||||||||||||||||||||||||||
|
Obligations of states and political subdivisions |
$ | 124,355 | $ | 125,041 | $ | 95,246 | $ | — | $ | — | $ | — | $ | 29,795 | ||||||||||||||
|
Privately issued mortgage-backed securities |
181,165 | 141,902 | 39,020 | 17 | — | 102,821 | 44 | |||||||||||||||||||||
|
Collateralized debt obligations |
28,438 | 47,393 | 9,629 | 1,485 | 1,175 | 35,104 | — | |||||||||||||||||||||
|
Other debt securities |
144,131 | 125,455 | 8,411 | 61,379 | 29,354 | 18,600 | 7,711 | |||||||||||||||||||||
|
|
|
|
|
|
|
|
|
|
|
|
|
|
|
|||||||||||||||
|
Total |
$ | 478,089 | $ | 439,791 | $ | 152,306 | $ | 62,881 | $ | 30,529 | $ | 156,525 | $ | 37,550 | ||||||||||||||
|
|
|
|
|
|
|
|
|
|
|
|
|
|
|
|||||||||||||||
The amortized cost and estimated fair value of collateralized mortgage obligations included in mortgage-backed securities were as follows:
| December 31 | ||||||||
| 2015 | 2014 | |||||||
| (In thousands) | ||||||||
|
Collateralized mortgage obligations: |
||||||||
|
Amortized cost |
$ | 188,819 | $ | 209,107 | ||||
|
Estimated fair value |
149,632 | 165,860 | ||||||
Gross realized gains from sales of investment securities were $116,490,000 in 2013. During 2013, the Company sold its holdings of Visa Class B shares for a gain of $89,545,000 and its holdings of MasterCard Class B shares for a gain of $13,208,000. Gross realized losses on investment securities were $60,033,000 in 2013. The Company sold substantially all of its privately issued mortgage-backed securities held in the available-for-sale investment securities portfolio during 2013. In total, $1.0 billion of such securities were sold for a net loss of approximately $46,302,000. There were no significant gross realized gains or losses from the sale of investment securities in 2015 or 2014.
The Company recognized $10 million of pre-tax other-than-temporary impairment losses related to privately issued mortgage-backed securities in 2013. The impairment charges were recognized in light of deterioration of real estate values and a rise in delinquencies and charge-offs of underlying mortgage loans collateralizing those securities. The other-than-temporary impairment losses represented management’s estimate of credit losses inherent in the debt securities considering projected cash flows using assumptions for delinquency rates, loss severities, and other estimates of future collateral performance. There were no other-than-temporary impairment losses in 2015 or 2014.
120
Table of Contents
At December 31, 2015, the amortized cost and estimated fair value of debt securities by contractual maturity were as follows:
|
Amortized
Cost |
Estimated
Fair Value |
|||||||
| (In thousands) | ||||||||
|
Debt securities available for sale: |
||||||||
|
Due in one year or less |
$ | 106,349 | $ | 106,383 | ||||
|
Due after one year through five years |
202,864 | 203,235 | ||||||
|
Due after five years through ten years |
2,729 | 2,941 | ||||||
|
Due after ten years |
159,866 | 159,739 | ||||||
|
|
|
|
|
|||||
| 471,808 | 472,298 | |||||||
|
Mortgage-backed securities available for sale |
11,593,033 | 11,686,702 | ||||||
|
|
|
|
|
|||||
| $ | 12,064,841 | $ | 12,159,000 | |||||
|
|
|
|
|
|||||
|
Debt securities held to maturity: |
||||||||
|
Due in one year or less |
$ | 34,174 | $ | 34,311 | ||||
|
Due after one year through five years |
72,120 | 72,419 | ||||||
|
Due after five years through ten years |
12,137 | 12,283 | ||||||
|
Due after ten years |
6,575 | 6,575 | ||||||
|
|
|
|
|
|||||
| 125,006 | 125,588 | |||||||
|
Mortgage-backed securities held to maturity |
2,734,703 | 2,738,559 | ||||||
|
|
|
|
|
|||||
| $ | 2,859,709 | $ | 2,864,147 | |||||
|
|
|
|
|
|||||
121
Table of Contents
A summary of investment securities that as of December 31, 2015 and 2014 had been in a continuous unrealized loss position for less than twelve months and those that had been in a continuous unrealized loss position for twelve months or longer follows:
| Less Than 12 Months | 12 Months or More | |||||||||||||||
| Fair Value |
Unrealized
Losses |
Fair Value |
Unrealized
Losses |
|||||||||||||
| (In thousands) | ||||||||||||||||
|
December 31, 2015 |
||||||||||||||||
|
Investment securities available for sale: |
||||||||||||||||
|
U.S. Treasury and federal agencies |
$ | 147,508 | $ | (187 | ) | $ | — | $ | — | |||||||
|
Obligations of states and political subdivisions |
865 | (2 | ) | 1,335 | (40 | ) | ||||||||||
|
Mortgage-backed securities: |
||||||||||||||||
|
Government issued or guaranteed |
4,061,899 | (48,534 | ) | 7,216 | (167 | ) | ||||||||||
|
Privately issued |
— | — | 43 | (2 | ) | |||||||||||
|
Collateralized debt obligations |
5,711 | (335 | ) | 2,063 | (853 | ) | ||||||||||
|
Other debt securities |
12,935 | (462 | ) | 93,344 | (19,728 | ) | ||||||||||
|
Equity securities |
18,073 | (207 | ) | 153 | (147 | ) | ||||||||||
|
|
|
|
|
|
|
|
|
|||||||||
| 4,246,991 | (49,727 | ) | 104,154 | (20,937 | ) | |||||||||||
|
|
|
|
|
|
|
|
|
|||||||||
|
Investment securities held to maturity: |
||||||||||||||||
|
Obligations of states and political subdivisions |
42,913 | (335 | ) | 5,853 | (86 | ) | ||||||||||
|
Mortgage-backed securities: |
||||||||||||||||
|
Government issued or guaranteed |
459,983 | (1,801 | ) | 228,867 | (6,016 | ) | ||||||||||
|
Privately issued |
— | — | 112,155 | (41,367 | ) | |||||||||||
|
|
|
|
|
|
|
|
|
|||||||||
| 502,896 | (2,136 | ) | 346,875 | (47,469 | ) | |||||||||||
|
|
|
|
|
|
|
|
|
|||||||||
|
Total |
$ | 4,749,887 | $ | (51,863 | ) | $ | 451,029 | $ | (68,406 | ) | ||||||
|
|
|
|
|
|
|
|
|
|||||||||
|
December 31, 2014 |
||||||||||||||||
|
Investment securities available for sale: |
||||||||||||||||
|
U.S. Treasury and federal agencies |
$ | 6,505 | $ | (5 | ) | $ | — | $ | — | |||||||
|
Obligations of states and political subdivisions |
1,785 | (52 | ) | 121 | (1 | ) | ||||||||||
|
Mortgage-backed securities: |
||||||||||||||||
|
Government issued or guaranteed |
39,001 | (186 | ) | 5,555 | (151 | ) | ||||||||||
|
Privately issued |
— | — | 65 | (3 | ) | |||||||||||
|
Collateralized debt obligations |
2,108 | (696 | ) | 5,512 | (337 | ) | ||||||||||
|
Other debt securities |
14,017 | (556 | ) | 92,661 | (18,092 | ) | ||||||||||
|
Equity securities |
2,138 | (1,164 | ) | — | — | |||||||||||
|
|
|
|
|
|
|
|
|
|||||||||
| 65,554 | (2,659 | ) | 103,914 | (18,584 | ) | |||||||||||
|
|
|
|
|
|
|
|
|
|||||||||
|
Investment securities held to maturity: |
||||||||||||||||
|
Obligations of states and political subdivisions |
29,886 | (184 | ) | 268 | (5 | ) | ||||||||||
|
Mortgage-backed securities: |
||||||||||||||||
|
Government issued or guaranteed |
137,413 | (361 | ) | 446,780 | (6,639 | ) | ||||||||||
|
Privately issued |
— | — | 127,512 | (44,576 | ) | |||||||||||
|
|
|
|
|
|
|
|
|
|||||||||
| 167,299 | (545 | ) | 574,560 | (51,220 | ) | |||||||||||
|
|
|
|
|
|
|
|
|
|||||||||
|
Total |
$ | 232,853 | $ | (3,204 | ) | $ | 678,474 | $ | (69,804 | ) | ||||||
|
|
|
|
|
|
|
|
|
|||||||||
The Company owned 1,007 individual investment securities with aggregate gross unrealized losses of $120 million at December 31, 2015. Based on a review of each of the securities in the investment securities portfolio at December 31, 2015, the Company concluded that it expected to
122
Table of Contents
recover the amortized cost basis of its investment. As of December 31, 2015, the Company does not intend to sell nor is it anticipated that it would be required to sell any of its impaired investment securities at a loss. At December 31, 2015, the Company has not identified events or changes in circumstances which may have a significant adverse effect on the fair value of the $554 million of cost method investment securities.
At December 31, 2015, investment securities with a carrying value of $4,245,300,000, including $3,333,653,000 of investment securities available for sale, were pledged to secure borrowings from various FHLBs, repurchase agreements, governmental deposits, interest rate swap agreements and available lines of credit as described in note 9.
Investment securities pledged by the Company to secure obligations whereby the secured party is permitted by contract or custom to sell or repledge such collateral totaled $2,136,712,000 at December 31, 2015. The pledged securities included securities of the U.S. Treasury and federal agencies and mortgage-backed securities.
4. Loans and leases
Total loans and leases outstanding were comprised of the following:
| December 31 | ||||||||
| 2015 | 2014 | |||||||
| (In thousands) | ||||||||
|
Loans |
||||||||
|
Commercial, financial, etc. |
$ | 19,223,419 | $ | 18,280,049 | ||||
|
Real estate: |
||||||||
|
Residential |
26,249,059 | 8,636,794 | ||||||
|
Commercial |
24,125,778 | 22,614,174 | ||||||
|
Construction |
5,183,313 | 5,061,269 | ||||||
|
Consumer |
11,584,347 | 10,969,879 | ||||||
|
|
|
|
|
|||||
|
Total loans |
86,365,916 | 65,562,165 | ||||||
|
Leases |
||||||||
|
Commercial |
1,353,318 | 1,337,204 | ||||||
|
|
|
|
|
|||||
|
Total loans and leases |
87,719,234 | 66,899,369 | ||||||
|
Less: unearned discount |
(229,735 | ) | (230,413 | ) | ||||
|
|
|
|
|
|||||
|
Total loans and leases, net of unearned discount |
$ | 87,489,499 | $ | 66,668,956 | ||||
|
|
|
|
|
|||||
One-to-four family residential mortgage loans held for sale were $353 million at December 31, 2015 and $435 million at December 31, 2014. Commercial real estate loans held for sale were $39 million at December 31, 2015 and $308 million at December 31, 2014.
During 2013, the Company securitized approximately $1.3 billion of one-to-four family residential real estate loans previously held in the Company’s loan portfolio into guaranteed mortgage-backed securities with the Government National Mortgage Association (“Ginnie Mae”) and recognized gains of $42,382,000. In addition, the Company securitized and sold in 2013 approximately $1.4 billion of automobile loans held in its loan portfolio, resulting in a gain of $20,683,000.
As of December 31, 2015, approximately $2.5 billion of commercial real estate loan balances serviced for others had been sold with recourse in conjunction with the Company’s participation in the Federal National Mortgage Association (“Fannie Mae”) Delegated Underwriting and Servicing (“DUS”) program. At December 31, 2015, the Company estimated that the recourse obligations described above were not material to the Company’s consolidated financial position. There have been no material losses incurred as a result of those credit recourse arrangements.
In addition to recourse obligations, as described in note 21, the Company is contractually obligated to repurchase previously sold residential real estate loans that do not ultimately meet investor sale criteria related to underwriting procedures or loan documentation. When required to do so, the Company may reimburse loan purchasers for losses incurred or may repurchase certain
123
Table of Contents
loans. Charges incurred for such obligation, which are recorded as a reduction of mortgage banking revenues, were $5 million, $4 million and $17 million in 2015, 2014 and 2013, respectively.
The outstanding principal balance and the carrying amount of loans acquired at a discount that were recorded at fair value at the acquisition date that is included in the consolidated balance sheet were as follows:
| December 31 | ||||||||
| 2015 | 2014 | |||||||
| (In thousands) | ||||||||
|
Outstanding principal balance |
$ | 3,122,935 | $ | 3,070,268 | ||||
|
Carrying amount: |
||||||||
|
Commercial, financial, leasing, etc. |
78,847 | 247,820 | ||||||
|
Commercial real estate |
644,284 | 961,828 | ||||||
|
Residential real estate |
1,016,129 | 453,360 | ||||||
|
Consumer |
725,807 | 933,537 | ||||||
|
|
|
|
|
|||||
| $ | 2,465,067 | $ | 2,596,545 | |||||
|
|
|
|
|
|||||
Purchased impaired loans included in the table above totaled $768 million at December 31, 2015 and $198 million at December 31, 2014, representing less than 1% of the Company’s assets as of each date. A summary of changes in the accretable yield for loans acquired at a discount for the years ended December 31, 2015, 2014 and 2013 follows:
|
For Year Ended December 31, |
2015 | 2014 | 2013 | |||||||||||||||||||||
| Purchased | Other | Purchased | Other | Purchased | Other | |||||||||||||||||||
| Impaired | Acquired | Impaired | Acquired | Impaired | Acquired | |||||||||||||||||||
| (In thousands) | ||||||||||||||||||||||||
|
Balance at beginning of period |
$ | 76,518 | $ | 397,379 | $ | 37,230 | $ | 538,633 | $ | 42,252 | $ | 638,272 | ||||||||||||
|
Additions |
117,251 | — | — | — | — | — | ||||||||||||||||||
|
Interest income |
(28,551 | ) | (158,260 | ) | (21,263 | ) | (178,670 | ) | (36,727 | ) | (247,295 | ) | ||||||||||||
|
Reclassifications from nonaccretable balance, net |
19,400 | 49,930 | 60,551 | 24,907 | 31,705 | 149,595 | ||||||||||||||||||
|
Other(a) |
— | 7,385 | — | 12,509 | — | (1,939 | ) | |||||||||||||||||
|
|
|
|
|
|
|
|
|
|
|
|
|
|||||||||||||
|
Balance at end of period |
$ | 184,618 | $ | 296,434 | $ | 76,518 | $ | 397,379 | $ | 37,230 | $ | 538,633 | ||||||||||||
|
|
|
|
|
|
|
|
|
|
|
|
|
|||||||||||||
| (a) | Other changes in expected cash flows including changes in interest rates and prepayment assumptions. |
124
Table of Contents
A summary of current, past due and nonaccrual loans as of December 31, 2015 and 2014 follows:
| Current |
30-89 Days
Past Due |
Accruing
Loans Past Due 90 Days or More(a) |
Accruing
Loans Acquired at a Discount Past Due 90 Days or More(b) |
Purchased
Impaired(c) |
Nonaccrual | Total | ||||||||||||||||||||||
| (In thousands) | ||||||||||||||||||||||||||||
|
December 31, 2015 |
||||||||||||||||||||||||||||
|
Commercial, financial, leasing, etc. |
$ | 20,122,648 | $ | 52,868 | $ | 2,310 | $ | 693 | $ | 1,902 | $ | 241,917 | $ | 20,422,338 | ||||||||||||||
|
Real estate: |
||||||||||||||||||||||||||||
|
Commercial |
23,645,354 | 172,439 | 12,963 | 8,790 | 46,790 | 179,606 | 24,065,942 | |||||||||||||||||||||
|
Residential builder and developer |
1,507,856 | 7,969 | 5,760 | 6,925 | 28,734 | 28,429 | 1,585,673 | |||||||||||||||||||||
|
Other commercial construction |
3,428,939 | 65,932 | 7,936 | 2,001 | 24,525 | 16,363 | 3,545,696 | |||||||||||||||||||||
|
Residential |
20,507,551 | 560,312 | 284,451 | 16,079 | 488,599 | 153,281 | 22,010,273 | |||||||||||||||||||||
|
Residential-limited documentation |
3,885,073 | 137,289 | — | — | 175,518 | 61,950 | 4,259,830 | |||||||||||||||||||||
|
Consumer: |
||||||||||||||||||||||||||||
|
Home equity lines and loans |
5,805,222 | 45,604 | — | 15,222 | 2,261 | 84,467 | 5,952,776 | |||||||||||||||||||||
|
Automobile |
2,446,473 | 56,181 | — | 6 | — | 16,597 | 2,519,257 | |||||||||||||||||||||
|
Other |
3,051,435 | 36,702 | 4,021 | 18,757 | — | 16,799 | 3,127,714 | |||||||||||||||||||||
|
|
|
|
|
|
|
|
|
|
|
|
|
|
|
|||||||||||||||
|
Total |
$ | 84,400,551 | $ | 1,135,296 | $ | 317,441 | $ | 68,473 | $ | 768,329 | $ | 799,409 | $ | 87,489,499 | ||||||||||||||
|
|
|
|
|
|
|
|
|
|
|
|
|
|
|
|||||||||||||||
|
December 31, 2014 |
||||||||||||||||||||||||||||
|
Commercial, financial, leasing, etc. |
$ | 19,228,265 | $ | 37,246 | $ | 1,805 | $ | 6,231 | $ | 10,300 | $ | 177,445 | $ | 19,461,292 | ||||||||||||||
|
Real estate: |
||||||||||||||||||||||||||||
|
Commercial |
22,208,491 | 118,704 | 22,170 | 14,662 | 51,312 | 141,600 | 22,556,939 | |||||||||||||||||||||
|
Residential builder and developer |
1,273,607 | 11,827 | 492 | 9,350 | 98,347 | 71,517 | 1,465,140 | |||||||||||||||||||||
|
Other commercial construction |
3,484,932 | 17,678 | — | — | 17,181 | 25,699 | 3,545,490 | |||||||||||||||||||||
|
Residential |
7,640,368 | 226,932 | 216,489 | 35,726 | 18,223 | 180,275 | 8,318,013 | |||||||||||||||||||||
|
Residential-limited documentation |
249,810 | 11,774 | — | — | — | 77,704 | 339,288 | |||||||||||||||||||||
|
Consumer: |
||||||||||||||||||||||||||||
|
Home equity lines and loans |
5,859,378 | 42,945 | — | 27,896 | 2,374 | 89,291 | 6,021,884 | |||||||||||||||||||||
|
Automobile |
1,931,138 | 30,500 | — | 133 | — | 17,578 | 1,979,349 | |||||||||||||||||||||
|
Other |
2,909,791 | 33,295 | 4,064 | 16,369 | — | 18,042 | 2,981,561 | |||||||||||||||||||||
|
|
|
|
|
|
|
|
|
|
|
|
|
|
|
|||||||||||||||
|
Total |
$ | 64,785,780 | $ | 530,901 | $ | 245,020 | $ | 110,367 | $ | 197,737 | $ | 799,151 | $ | 66,668,956 | ||||||||||||||
|
|
|
|
|
|
|
|
|
|
|
|
|
|
|
|||||||||||||||
| (a) | Excludes loans acquired at a discount. |
| (b) | Loans acquired at a discount that were recorded at fair value at acquisition date. This category does not include purchased impaired loans that are presented separately. |
| (c) | Accruing loans that were impaired at acquisition date and were recorded at fair value. |
If nonaccrual and renegotiated loans had been accruing interest at their originally contracted terms, interest income on such loans would have amounted to $56,784,000 in 2015, $58,314,000 in 2014 and $62,010,000 in 2013. The actual amounts included in interest income during 2015, 2014 and 2013 on such loans were $30,735,000, $28,492,000 and $31,987,000, respectively.
125
Table of Contents
During the normal course of business, the Company modifies loans to maximize recovery efforts. If the borrower is experiencing financial difficulty and a concession is granted, the Company considers such modifications as troubled debt restructurings and classifies those loans as either nonaccrual loans or renegotiated loans. The types of concessions that the Company grants typically include principal deferrals and interest rate concessions, but may also include other types of concessions.
The table below summarizes the Company’s loan modification activities that were considered troubled debt restructurings for the year ended December 31, 2015:
| Recorded Investment |
Financial Effects of
Modification |
|||||||||||||||||||
| Number |
Pre-
modifica- tion |
Post-
modifica- tion |
Recorded
Investment (a) |
Interest
(b) |
||||||||||||||||
| (Dollars in thousands) | ||||||||||||||||||||
|
Commercial, financial, leasing, etc. |
||||||||||||||||||||
|
Principal deferral |
114 | $ | 55,621 | $ | 50,807 | $ | (4,814 | ) | $ | — | ||||||||||
|
Interest rate reduction |
1 | 99 | 99 | — | (19 | ) | ||||||||||||||
|
Other |
3 | 12,965 | 12,827 | (138 | ) | — | ||||||||||||||
|
Combination of concession types |
9 | 32,444 | 31,439 | (1,005 | ) | (245 | ) | |||||||||||||
|
Real estate: |
||||||||||||||||||||
|
Commercial |
||||||||||||||||||||
|
Principal deferral |
49 | 49,486 | 48,388 | (1,098 | ) | — | ||||||||||||||
|
Other |
3 | 4,169 | 4,087 | (82 | ) | — | ||||||||||||||
|
Combination of concession types |
6 | 3,238 | 3,242 | 4 | (159 | ) | ||||||||||||||
|
Residential builder and developer |
||||||||||||||||||||
|
Principal deferral |
2 | 10,650 | 10,598 | (52 | ) | — | ||||||||||||||
|
Other commercial construction |
||||||||||||||||||||
|
Principal deferral |
4 | 368 | 460 | 92 | — | |||||||||||||||
|
Combination of concession types |
2 | 10,375 | 10,375 | — | (49 | ) | ||||||||||||||
|
Residential |
||||||||||||||||||||
|
Principal deferral |
58 | 6,194 | 6,528 | 334 | — | |||||||||||||||
|
Other |
1 | 267 | 267 | — | — | |||||||||||||||
|
Combination of concession types |
26 | 4,024 | 4,277 | 253 | (483 | ) | ||||||||||||||
|
Residential-limited documentation |
||||||||||||||||||||
|
Principal deferral |
2 | 426 | 437 | 11 | — | |||||||||||||||
|
Combination of concession types |
9 | 1,536 | 1,635 | 99 | (121 | ) | ||||||||||||||
|
Consumer: |
||||||||||||||||||||
|
Home equity lines and loans |
||||||||||||||||||||
|
Principal deferral |
8 | 2,175 | 2,175 | — | — | |||||||||||||||
|
Combination of concession types |
63 | 5,203 | 5,204 | 1 | (677 | ) | ||||||||||||||
|
Automobile |
||||||||||||||||||||
|
Principal deferral |
192 | 1,818 | 1,818 | — | — | |||||||||||||||
|
Interest rate reduction |
7 | 137 | 137 | — | (10 | ) | ||||||||||||||
|
Other |
46 | 150 | 150 | — | — | |||||||||||||||
|
Combination of concession types |
57 | 948 | 948 | — | (43 | ) | ||||||||||||||
|
Other |
||||||||||||||||||||
|
Principal deferral |
102 | 1,995 | 1,995 | — | — | |||||||||||||||
|
Other |
13 | 116 | 116 | — | — | |||||||||||||||
|
Combination of concession types |
40 | 396 | 396 | — | (45 | ) | ||||||||||||||
|
|
|
|
|
|
|
|
|
|
|
|||||||||||
|
Total |
817 | $ | 204,800 | $ | 198,405 | $ | (6,395 | ) | $ | (1,851 | ) | |||||||||
|
|
|
|
|
|
|
|
|
|
|
|||||||||||
| (a) | Financial effects impacting the recorded investment included principal payments or advances, charge-offs and capitalized escrow arrearages. |
| (b) | Represents the present value of interest rate concessions discounted at the effective rate of the original loan. |
126
Table of Contents
The table below summarizes the Company’s loan modification activities that were considered troubled debt restructurings for the year ended December 31, 2014:
| Recorded Investment |
Financial Effects of
Modification |
|||||||||||||||||||
| Number |
Pre-
modifica- tion |
Post-
modifica- tion |
Recorded
Investment (a) |
Interest
(b) |
||||||||||||||||
| (Dollars in thousands) | ||||||||||||||||||||
|
Commercial, financial, leasing, etc. |
||||||||||||||||||||
|
Principal deferral |
95 | $ | 29,035 | $ | 23,628 | $ | (5,407 | ) | $ | — | ||||||||||
|
Other |
3 | 29,912 | 31,604 | 1,692 | — | |||||||||||||||
|
Combination of concession types |
7 | 19,167 | 19,030 | (137 | ) | (20 | ) | |||||||||||||
|
Real estate: |
||||||||||||||||||||
|
Commercial |
||||||||||||||||||||
|
Principal deferral |
39 | 19,077 | 18,997 | (80 | ) | — | ||||||||||||||
|
Interest rate reduction |
1 | 255 | 252 | (3 | ) | (48 | ) | |||||||||||||
|
Other |
1 | 650 | — | (650 | ) | — | ||||||||||||||
|
Combination of concession types |
7 | 1,152 | 1,198 | 46 | (264 | ) | ||||||||||||||
|
Residential builder and developer |
||||||||||||||||||||
|
Principal deferral |
2 | 1,639 | 1,639 | — | — | |||||||||||||||
|
Other commercial construction |
||||||||||||||||||||
|
Principal deferral |
4 | 6,703 | 6,611 | (92 | ) | — | ||||||||||||||
|
Residential |
||||||||||||||||||||
|
Principal deferral |
28 | 2,710 | 2,905 | 195 | — | |||||||||||||||
|
Interest rate reduction |
11 | 1,146 | 1,222 | 76 | (152 | ) | ||||||||||||||
|
Other |
1 | 188 | 188 | — | — | |||||||||||||||
|
Combination of concession types |
30 | 4,211 | 4,287 | 76 | (483 | ) | ||||||||||||||
|
Residential-limited documentation |
||||||||||||||||||||
|
Principal deferral |
6 | 880 | 963 | 83 | — | |||||||||||||||
|
Combination of concession types |
21 | 3,806 | 3,846 | 40 | (386 | ) | ||||||||||||||
|
Consumer: |
||||||||||||||||||||
|
Home equity lines and loans |
||||||||||||||||||||
|
Principal deferral |
3 | 280 | 280 | — | — | |||||||||||||||
|
Interest rate reduction |
6 | 535 | 535 | — | (120 | ) | ||||||||||||||
|
Combination of concession types |
47 | 5,031 | 5,031 | — | (560 | ) | ||||||||||||||
|
Automobile |
||||||||||||||||||||
|
Principal deferral |
208 | 3,293 | 3,293 | — | — | |||||||||||||||
|
Interest rate reduction |
9 | 152 | 152 | — | (12 | ) | ||||||||||||||
|
Other |
42 | 255 | 255 | — | — | |||||||||||||||
|
Combination of concession types |
81 | 1,189 | 1,189 | — | (100 | ) | ||||||||||||||
|
Other |
||||||||||||||||||||
|
Principal deferral |
33 | 245 | 245 | — | — | |||||||||||||||
|
Interest rate reduction |
4 | 293 | 293 | — | (63 | ) | ||||||||||||||
|
Other |
1 | 45 | 45 | — | — | |||||||||||||||
|
Combination of concession types |
70 | 2,502 | 2,502 | — | (761 | ) | ||||||||||||||
|
|
|
|
|
|
|
|
|
|
|
|||||||||||
|
Total |
760 | $ | 134,351 | $ | 130,190 | $ | (4,161 | ) | $ | (2,969 | ) | |||||||||
|
|
|
|
|
|
|
|
|
|
|
|||||||||||
| (a) | Financial effects impacting the recorded investment included principal payments or advances, charge-offs and capitalized escrow arrearages. |
| (b) | Represents the present value of interest rate concessions discounted at the effective rate of the original loan. |
127
Table of Contents
The table below summarizes the Company’s loan modification activities that were considered troubled debt restructurings for the year ended December 31, 2013:
| Recorded Investment |
Financial Effects of
Modification |
|||||||||||||||||||
| Number |
Pre-
modifica- tion |
Post-
modifica- tion |
Recorded
Investment (a) |
Interest
(b) |
||||||||||||||||
| (Dollars in thousands) | ||||||||||||||||||||
|
Commercial, financial, leasing, etc. |
||||||||||||||||||||
|
Principal deferral |
79 | $ | 16,389 | $ | 16,002 | $ | (387 | ) | $ | — | ||||||||||
|
Interest rate reduction |
1 | 104 | 335 | 231 | (54 | ) | ||||||||||||||
|
Other |
4 | 50,433 | 50,924 | 491 | — | |||||||||||||||
|
Combination of concession types |
11 | 6,229 | 5,578 | (651 | ) | (458 | ) | |||||||||||||
|
Real estate: |
||||||||||||||||||||
|
Commercial |
||||||||||||||||||||
|
Principal deferral |
27 | 40,639 | 40,464 | (175 | ) | — | ||||||||||||||
|
Other |
2 | 449 | 475 | 26 | — | |||||||||||||||
|
Combination of concession types |
9 | 2,649 | 3,040 | 391 | (250 | ) | ||||||||||||||
|
Residential builder and developer |
||||||||||||||||||||
|
Principal deferral |
18 | 21,423 | 20,577 | (846 | ) | — | ||||||||||||||
|
Other |
1 | 4,039 | 3,888 | (151 | ) | — | ||||||||||||||
|
Combination of concession types |
3 | 15,580 | 15,514 | (66 | ) | (535 | ) | |||||||||||||
|
Other commercial construction |
||||||||||||||||||||
|
Principal deferral |
3 | 590 | 521 | (69 | ) | — | ||||||||||||||
|
Residential |
||||||||||||||||||||
|
Principal deferral |
32 | 3,556 | 3,821 | 265 | — | |||||||||||||||
|
Other |
1 | 195 | 195 | — | — | |||||||||||||||
|
Combination of concession types |
61 | 73,940 | 70,854 | (3,086 | ) | (924 | ) | |||||||||||||
|
Residential-limited documentation |
||||||||||||||||||||
|
Principal deferral |
10 | 1,900 | 1,880 | (20 | ) | — | ||||||||||||||
|
Combination of concession types |
19 | 2,826 | 3,148 | 322 | (790 | ) | ||||||||||||||
|
Consumer: |
||||||||||||||||||||
|
Home equity lines and loans |
||||||||||||||||||||
|
Principal deferral |
10 | 859 | 861 | 2 | — | |||||||||||||||
|
Interest rate reduction |
1 | 99 | 99 | — | (8 | ) | ||||||||||||||
|
Other |
1 | 106 | 106 | — | — | |||||||||||||||
|
Combination of concession types |
28 | 2,190 | 2,190 | — | (270 | ) | ||||||||||||||
|
Automobile |
||||||||||||||||||||
|
Principal deferral |
460 | 6,148 | 6,148 | — | — | |||||||||||||||
|
Interest rate reduction |
15 | 235 | 235 | — | (22 | ) | ||||||||||||||
|
Other |
78 | 339 | 339 | — | — | |||||||||||||||
|
Combination of concession types |
225 | 2,552 | 2,552 | — | (191 | ) | ||||||||||||||
|
Other |
||||||||||||||||||||
|
Principal deferral |
36 | 332 | 332 | — | — | |||||||||||||||
|
Interest rate reduction |
1 | 12 | 12 | — | (2 | ) | ||||||||||||||
|
Other |
2 | 14 | 14 | — | — | |||||||||||||||
|
Combination of concession types |
120 | 4,248 | 4,248 | — | (1,187 | ) | ||||||||||||||
|
|
|
|
|
|
|
|
|
|
|
|||||||||||
|
Total |
1,258 | $ | 258,075 | $ | 254,352 | $ | (3,723 | ) | $ | (4,691 | ) | |||||||||
|
|
|
|
|
|
|
|
|
|
|
|||||||||||
| (a) | Financial effects impacting the recorded investment included principal payments or advances, charge-offs and capitalized escrow arrearages. |
| (b) | Represents the present value of interest rate concessions discounted at the effective rate of the original loan. |
128
Table of Contents
Troubled debt restructurings are considered to be impaired loans and for purposes of establishing the allowance for credit losses are evaluated for impairment giving consideration to the impact of the modified loan terms on the present value of the loan’s expected cash flows. Impairment of troubled debt restructurings that have subsequently defaulted may also be measured based on the loan’s observable market price or the fair value of collateral if the loan is collateral-dependent. Charge-offs may also be recognized on troubled debt restructurings that have subsequently defaulted. Loans that were modified as troubled debt restructurings during the twelve months ended December 31, 2015, 2014 and 2013 and for which there was a subsequent payment default during the respective period were not material.
Borrowings by directors and certain officers of M&T and its banking subsidiaries, and by associates of such persons, exclusive of loans aggregating less than $120,000, amounted to $52,152,000 and $49,799,000 at December 31, 2015 and 2014, respectively. During 2015, new borrowings by such persons amounted to $4,425,000 (including any borrowings of new directors or officers that were outstanding at the time of their election) and repayments and other reductions (including reductions resulting from retirements) were $2,072,000.
At December 31, 2015, approximately $11.1 billion of commercial loans and leases, $10.4 billion of commercial real estate loans, $20.9 billion of one-to-four family residential real estate loans, $3.9 billion of home equity loans and lines of credit and $3.6 billion of other consumer loans were pledged to secure outstanding borrowings from the FHLB of New York and available lines of credit as described in note 9.
The Company’s loan and lease portfolio includes commercial lease financing receivables consisting of direct financing and leveraged leases for machinery and equipment, railroad equipment, commercial trucks and trailers, and aircraft. A summary of lease financing receivables follows:
| December 31 | ||||||||
| 2015 | 2014 | |||||||
| (In thousands) | ||||||||
|
Commercial leases: |
||||||||
|
Direct financings: |
||||||||
|
Lease payments receivable |
$ | 1,058,605 | $ | 1,022,133 | ||||
|
Estimated residual value of leased assets |
81,269 | 79,525 | ||||||
|
Unearned income |
(102,723 | ) | (103,777 | ) | ||||
|
|
|
|
|
|||||
|
Investment in direct financings |
1,037,151 | 997,881 | ||||||
|
Leveraged leases: |
||||||||
|
Lease payments receivable |
95,316 | 102,457 | ||||||
|
Estimated residual value of leased assets |
118,128 | 133,089 | ||||||
|
Unearned income |
(41,556 | ) | (44,288 | ) | ||||
|
|
|
|
|
|||||
|
Investment in leveraged leases |
171,888 | 191,258 | ||||||
|
|
|
|
|
|||||
|
Total investment in leases. |
$ | 1,209,039 | $ | 1,189,139 | ||||
|
|
|
|
|
|||||
|
Deferred taxes payable arising from leveraged leases |
$ | 160,603 | $ | 169,101 | ||||
Included within the estimated residual value of leased assets at December 31, 2015 and 2014 were $50 million and $48 million, respectively, in residual value associated with direct financing leases that are guaranteed by the lessees or others.
129
Table of Contents
At December 31, 2015, the minimum future lease payments to be received from lease financings were as follows:
| (In thousands) | ||||
|
Year ending December 31: |
||||
|
2016 |
$ | 277,993 | ||
|
2017 |
245,892 | |||
|
2018 |
193,580 | |||
|
2019 |
143,406 | |||
|
2020 |
95,217 | |||
|
Later years |
197,833 | |||
|
|
|
|||
| $ | 1,153,921 | |||
|
|
|
|||
The amount of foreclosed residential real estate property held by the Company was $172 million and $44 million at December 31, 2015 and 2014, respectively. At December 31, 2015, there were $315 million in loans secured by residential real estate that were in the process of foreclosure.
130
Table of Contents
5. Allowance for credit losses
Changes in the allowance for credit losses for the years ended December 31, 2015, 2014 and 2013 were as follows:
|
Commercial,
Financial, Leasing, etc. |
Real Estate | |||||||||||||||||||||||
|
2015 |
Commercial | Residential | Consumer | Unallocated | Total | |||||||||||||||||||
| (In thousands) | ||||||||||||||||||||||||
|
Beginning balance |
$ | 288,038 | $ | 307,927 | $ | 61,910 | $ | 186,033 | $ | 75,654 | $ | 919,562 | ||||||||||||
|
Provision for credit losses |
43,065 | 25,768 | 19,133 | 79,489 | 2,545 | 170,000 | ||||||||||||||||||
|
Net charge-offs |
||||||||||||||||||||||||
|
Charge-offs |
(60,983 | ) | (16,487 | ) | (13,116 | ) | (107,787 | ) | — | (198,373 | ) | |||||||||||||
|
Recoveries |
30,284 | 9,623 | 4,311 | 20,585 | — | 64,803 | ||||||||||||||||||
|
|
|
|
|
|
|
|
|
|
|
|
|
|||||||||||||
|
Net charge-offs |
(30,699 | ) | (6,864 | ) | (8,805 | ) | (87,202 | ) | — | (133,570 | ) | |||||||||||||
|
|
|
|
|
|
|
|
|
|
|
|
|
|||||||||||||
|
Ending balance |
$ | 300,404 | $ | 326,831 | $ | 72,238 | $ | 178,320 | $ | 78,199 | $ | 955,992 | ||||||||||||
|
|
|
|
|
|
|
|
|
|
|
|
|
|||||||||||||
|
2014 |
||||||||||||||||||||||||
|
Beginning balance |
$ | 273,383 | $ | 324,978 | $ | 78,656 | $ | 164,644 | $ | 75,015 | $ | 916,676 | ||||||||||||
|
Provision for credit losses |
51,410 | (13,779 | ) | (3,974 | ) | 89,704 | 639 | 124,000 | ||||||||||||||||
|
Net charge-offs |
||||||||||||||||||||||||
|
Charge-offs |
(58,943 | ) | (14,058 | ) | (21,351 | ) | (84,390 | ) | — | (178,742 | ) | |||||||||||||
|
Recoveries |
22,188 | 10,786 | 8,579 | 16,075 | — | 57,628 | ||||||||||||||||||
|
|
|
|
|
|
|
|
|
|
|
|
|
|||||||||||||
|
Net charge-offs |
(36,755 | ) | (3,272 | ) | (12,772 | ) | (68,315 | ) | — | (121,114 | ) | |||||||||||||
|
|
|
|
|
|
|
|
|
|
|
|
|
|||||||||||||
|
Ending balance |
$ | 288,038 | $ | 307,927 | $ | 61,910 | $ | 186,033 | $ | 75,654 | $ | 919,562 | ||||||||||||
|
|
|
|
|
|
|
|
|
|
|
|
|
|||||||||||||
|
2013 |
||||||||||||||||||||||||
|
Beginning balance |
$ | 246,759 | $ | 337,101 | $ | 88,807 | $ | 179,418 | $ | 73,775 | $ | 925,860 | ||||||||||||
|
Provision for credit losses |
124,180 | 275 | 3,149 | 56,156 | 1,240 | 185,000 | ||||||||||||||||||
|
Allowance related to loans sold or securitized |
— | — | — | (11,000 | ) | — | (11,000 | ) | ||||||||||||||||
|
Net charge-offs |
||||||||||||||||||||||||
|
Charge-offs |
(109,329 | ) | (34,595 | ) | (23,621 | ) | (85,965 | ) | — | (253,510 | ) | |||||||||||||
|
Recoveries |
11,773 | 22,197 | 10,321 | 26,035 | — | 70,326 | ||||||||||||||||||
|
|
|
|
|
|
|
|
|
|
|
|
|
|||||||||||||
|
Net charge-offs |
(97,556 | ) | (12,398 | ) | (13,300 | ) | (59,930 | ) | — | (183,184 | ) | |||||||||||||
|
|
|
|
|
|
|
|
|
|
|
|
|
|||||||||||||
|
Ending Balance |
$ | 273,383 | $ | 324,978 | $ | 78,656 | $ | 164,644 | $ | 75,015 | $ | 916,676 | ||||||||||||
|
|
|
|
|
|
|
|
|
|
|
|
|
|||||||||||||
Despite the above allocation, the allowance for credit losses is general in nature and is available to absorb losses from any loan or lease type.
In establishing the allowance for credit losses, the Company estimates losses attributable to specific troubled credits identified through both normal and detailed or intensified credit review processes and also estimates losses inherent in other loans and leases on a collective basis. For purposes of determining the level of the allowance for credit losses, the Company evaluates its loan and lease portfolio by loan type. The amounts of loss components in the Company’s loan and lease portfolios are determined through a loan-by-loan analysis of larger balance commercial and commercial real estate loans that are in nonaccrual status and by applying loss factors to groups of loan balances based on loan type and management’s classification of such loans under the Company’s loan grading system. Measurement of the specific loss components is typically based on expected
131
Table of Contents
future cash flows, collateral values and other factors that may impact the borrower’s ability to pay. In determining the allowance for credit losses, the Company utilizes a loan grading system which is applied to commercial and commercial real estate credits on an individual loan basis. Loan officers are responsible for continually assigning grades to these loans based on standards outlined in the Company’s Credit Policy. Internal loan grades are also monitored by the Company’s loan review department to ensure consistency and strict adherence to the prescribed standards. Loan grades are assigned loss component factors that reflect the Company’s loss estimate for each group of loans and leases. Factors considered in assigning loan grades and loss component factors include borrower-specific information related to expected future cash flows and operating results, collateral values, geographic location, financial condition and performance, payment status, and other information; levels of and trends in portfolio charge-offs and recoveries; levels of and trends in portfolio delinquencies and impaired loans; changes in the risk profile of specific portfolios; trends in volume and terms of loans; effects of changes in credit concentrations; and observed trends and practices in the banking industry. As updated appraisals are obtained on individual loans or other events in the market place indicate that collateral values have significantly changed, individual loan grades are adjusted as appropriate. Changes in other factors cited may also lead to loan grade changes at any time. Except for consumer and residential real estate loans that are considered smaller balance homogenous loans and acquired loans that are evaluated on an aggregated basis, the Company considers a loan to be impaired for purposes of applying GAAP when, based on current information and events, it is probable that the Company will be unable to collect all amounts according to the contractual terms of the loan agreement or the loan is delinquent 90 days. Regardless of loan type, the Company considers a loan to be impaired if it qualifies as a troubled debt restructuring. Modified loans, including smaller balance homogenous loans, that are considered to be troubled debt restructurings are evaluated for impairment giving consideration to the impact of the modified loan terms on the present value of the loan’s expected cash flows.
132
Table of Contents
The following tables provide information with respect to loans and leases that were considered impaired as of December 31, 2015 and 2014 and for the years ended December 31, 2015, 2014 and 2013.
| December 31, 2015 | December 31, 2014 | |||||||||||||||||||||||
|
Recorded
Investment |
Unpaid
Principal Balance |
Related
Allowance |
Recorded
Investment |
Unpaid
Principal Balance |
Related
Allowance |
|||||||||||||||||||
| (In thousands) | ||||||||||||||||||||||||
|
With an allowance recorded: |
||||||||||||||||||||||||
|
Commercial, financial, leasing, etc. |
$ | 179,037 | $ | 195,821 | $ | 44,752 | $ | 132,340 | $ | 165,146 | $ | 31,779 | ||||||||||||
|
Real estate: |
||||||||||||||||||||||||
|
Commercial |
85,974 | 95,855 | 18,764 | 83,955 | 96,209 | 14,121 | ||||||||||||||||||
|
Residential builder and developer |
3,316 | 5,101 | 196 | 17,632 | 22,044 | 805 | ||||||||||||||||||
|
Other commercial construction |
3,548 | 3,843 | 348 | 5,480 | 6,484 | 900 | ||||||||||||||||||
|
Residential |
79,558 | 96,751 | 4,727 | 88,970 | 107,343 | 4,296 | ||||||||||||||||||
|
Residential-limited documentation |
90,356 | 104,251 | 8,000 | 101,137 | 114,565 | 11,000 | ||||||||||||||||||
|
Consumer: |
||||||||||||||||||||||||
|
Home equity lines and loans |
25,220 | 26,195 | 3,777 | 19,771 | 20,806 | 6,213 | ||||||||||||||||||
|
Automobile |
22,525 | 22,525 | 4,709 | 30,317 | 30,317 | 8,070 | ||||||||||||||||||
|
Other |
17,620 | 17,620 | 4,820 | 18,973 | 18,973 | 5,459 | ||||||||||||||||||
|
|
|
|
|
|
|
|
|
|
|
|
|
|||||||||||||
| 507,154 | 567,962 | 90,093 | 498,575 | 581,887 | 82,643 | |||||||||||||||||||
|
|
|
|
|
|
|
|
|
|
|
|
|
|||||||||||||
|
With no related allowance recorded: |
||||||||||||||||||||||||
|
Commercial, financial, leasing, etc. |
93,190 | 110,735 | — | 73,978 | 81,493 | — | ||||||||||||||||||
|
Real estate: |
||||||||||||||||||||||||
|
Commercial |
101,340 | 116,230 | — | 66,777 | 78,943 | — | ||||||||||||||||||
|
Residential builder and developer |
27,651 | 47,246 | — | 58,820 | 96,722 | — | ||||||||||||||||||
|
Other commercial construction |
13,221 | 31,477 | — | 20,738 | 41,035 | — | ||||||||||||||||||
|
Residential |
19,621 | 30,940 | — | 16,815 | 26,750 | — | ||||||||||||||||||
|
Residential-limited documentation |
18,414 | 31,113 | — | 26,752 | 46,964 | — | ||||||||||||||||||
|
|
|
|
|
|
|
|
|
|
|
|
|
|||||||||||||
| 273,437 | 367,741 | — | 263,880 | 371,907 | — | |||||||||||||||||||
|
|
|
|
|
|
|
|
|
|
|
|
|
|||||||||||||
|
Total: |
||||||||||||||||||||||||
|
Commercial, financial, leasing, etc. |
272,227 | 306,556 | 44,752 | 206,318 | 246,639 | 31,779 | ||||||||||||||||||
|
Real estate: |
||||||||||||||||||||||||
|
Commercial |
187,314 | 212,085 | 18,764 | 150,732 | 175,152 | 14,121 | ||||||||||||||||||
|
Residential builder and developer |
30,967 | 52,347 | 196 | 76,452 | 118,766 | 805 | ||||||||||||||||||
|
Other commercial construction |
16,769 | 35,320 | 348 | 26,218 | 47,519 | 900 | ||||||||||||||||||
|
Residential |
99,179 | 127,691 | 4,727 | 105,785 | 134,093 | 4,296 | ||||||||||||||||||
|
Residential-limited documentation |
108,770 | 135,364 | 8,000 | 127,889 | 161,529 | 11,000 | ||||||||||||||||||
|
Consumer: |
||||||||||||||||||||||||
|
Home equity lines and loans |
25,220 | 26,195 | 3,777 | 19,771 | 20,806 | 6,213 | ||||||||||||||||||
|
Automobile |
22,525 | 22,525 | 4,709 | 30,317 | 30,317 | 8,070 | ||||||||||||||||||
|
Other |
17,620 | 17,620 | 4,820 | 18,973 | 18,973 | 5,459 | ||||||||||||||||||
|
|
|
|
|
|
|
|
|
|
|
|
|
|||||||||||||
|
Total |
$ | 780,591 | $ | 935,703 | $ | 90,093 | $ | 762,455 | $ | 953,794 | $ | 82,643 | ||||||||||||
|
|
|
|
|
|
|
|
|
|
|
|
|
|||||||||||||
133
Table of Contents
|
Year Ended
December 31, 2015 |
Year Ended
December 31, 2014 |
|||||||||||||||||||||||
|
Average
Recorded Investment |
Interest Income
Recognized |
Average
Recorded Investment |
Interest Income
Recognized |
|||||||||||||||||||||
| Total |
Cash
Basis |
Total |
Cash
Basis |
|||||||||||||||||||||
| (In thousands) | ||||||||||||||||||||||||
|
Commercial, financial, leasing, etc. |
$ | 236,201 | $ | 2,933 | $ | 2,933 | $ | 181,932 | $ | 2,251 | $ | 2,251 | ||||||||||||
|
Real estate: |
||||||||||||||||||||||||
|
Commercial |
166,628 | 6,243 | 6,243 | 184,773 | 4,029 | 4,029 | ||||||||||||||||||
|
Residential builder and developer |
59,457 | 335 | 335 | 91,149 | 142 | 142 | ||||||||||||||||||
|
Other commercial construction |
20,276 | 2,311 | 2,311 | 62,734 | 1,893 | 1,893 | ||||||||||||||||||
|
Residential |
101,483 | 6,188 | 4,037 | 126,005 | 9,180 | 6,978 | ||||||||||||||||||
|
Residential-limited documentation |
118,449 | 6,380 | 2,638 | 133,800 | 6,613 | 2,546 | ||||||||||||||||||
|
Consumer: |
||||||||||||||||||||||||
|
Home equity lines and loans |
21,523 | 905 | 261 | 18,083 | 750 | 248 | ||||||||||||||||||
|
Automobile |
25,675 | 1,619 | 175 | 35,173 | 2,251 | 295 | ||||||||||||||||||
|
Other |
18,809 | 729 | 113 | 18,378 | 690 | 191 | ||||||||||||||||||
|
|
|
|
|
|
|
|
|
|
|
|
|
|||||||||||||
|
Total |
$ | 768,501 | $ | 27,643 | $ | 19,046 | $ | 852,027 | $ | 27,799 | $ | 18,573 | ||||||||||||
|
|
|
|
|
|
|
|
|
|
|
|
|
|||||||||||||
|
Year Ended
December 31, 2013 |
||||||||||||
|
Interest Income
Recognized |
||||||||||||
|
Average
Recorded Investment |
Total |
Cash
Basis |
||||||||||
| (In thousands) | ||||||||||||
|
Commercial, financial, leasing, etc. |
$ | 155,188 | $ | 7,197 | $ | 7,197 | ||||||
|
Real estate: |
||||||||||||
|
Commercial |
197,533 | 4,852 | 4,852 | |||||||||
|
Residential builder and developer |
147,288 | 1,043 | 796 | |||||||||
|
Other commercial construction |
96,475 | 5,248 | 5,248 | |||||||||
|
Residential |
183,059 | 6,203 | 4,111 | |||||||||
|
Residential-limited documentation |
149,461 | 6,784 | 2,341 | |||||||||
|
Consumer: |
||||||||||||
|
Home equity lines and loans |
12,811 | 683 | 183 | |||||||||
|
Automobile |
44,116 | 2,916 | 515 | |||||||||
|
Other |
15,710 | 634 | 208 | |||||||||
|
|
|
|
|
|
|
|||||||
|
Total |
$ | 1,001,641 | $ | 35,560 | $ | 25,451 | ||||||
|
|
|
|
|
|
|
|||||||
In accordance with the previously described policies, the Company utilizes a loan grading system that is applied to all commercial loans and commercial real estate loans. Loan grades are utilized to differentiate risk within the portfolio and consider the expectations of default for each loan. Commercial loans and commercial real estate loans with a lower expectation of default are assigned one of ten possible “pass” loan grades and are generally ascribed lower loss factors when determining the allowance for credit losses. Loans with an elevated level of credit risk are classified as “criticized” and are ascribed a higher loss factor when determining the allowance for credit losses.
134
Table of Contents
Criticized loans may be classified as “nonaccrual” if the Company no longer expects to collect all amounts according to the contractual terms of the loan agreement or the loan is delinquent 90 days or more. All larger balance criticized commercial loans and commercial real estate loans are individually reviewed by centralized loan review personnel each quarter to determine the appropriateness of the assigned loan grade, including whether the loan should be reported as accruing or nonaccruing. Smaller balance criticized loans are analyzed by business line risk management areas to ensure proper loan grade classification. Furthermore, criticized nonaccrual commercial loans and commercial real estate loans are considered impaired and, as a result, specific loss allowances on such loans are established within the allowance for credit losses to the extent appropriate in each individual instance. The following table summarizes the loan grades applied to the various classes of the Company’s commercial loans and commercial real estate loans.
| Real Estate | ||||||||||||||||
|
Commercial,
Financial, Leasing, etc. |
Commercial |
Residential
Builder and Developer |
Other
Commercial Construction |
|||||||||||||
| (In thousands) | ||||||||||||||||
|
December 31, 2015 |
||||||||||||||||
|
Pass |
$ | 19,442,183 | $ | 23,098,856 | $ | 1,497,465 | $ | 3,432,679 | ||||||||
|
Criticized accrual |
738,238 | 787,480 | 59,779 | 96,654 | ||||||||||||
|
Criticized nonaccrual |
241,917 | 179,606 | 28,429 | 16,363 | ||||||||||||
|
|
|
|
|
|
|
|
|
|||||||||
|
Total |
$ | 20,422,338 | $ | 24,065,942 | $ | 1,585,673 | $ | 3,545,696 | ||||||||
|
|
|
|
|
|
|
|
|
|||||||||
|
December 31, 2014 |
||||||||||||||||
|
Pass |
$ | 18,695,440 | $ | 21,837,022 | $ | 1,347,778 | $ | 3,347,522 | ||||||||
|
Criticized accrual |
588,407 | 578,317 | 45,845 | 172,269 | ||||||||||||
|
Criticized nonaccrual |
177,445 | 141,600 | 71,517 | 25,699 | ||||||||||||
|
|
|
|
|
|
|
|
|
|||||||||
|
Total |
$ | 19,461,292 | $ | 22,556,939 | $ | 1,465,140 | $ | 3,545,490 | ||||||||
|
|
|
|
|
|
|
|
|
|||||||||
In determining the allowance for credit losses, residential real estate loans and consumer loans are generally evaluated collectively after considering such factors as payment performance and recent loss experience and trends, which are mainly driven by current collateral values in the market place as well as the amount of loan defaults. Loss rates on such loans are determined by reference to recent charge-off history and are evaluated (and adjusted if deemed appropriate) through consideration of other factors including near-term forecasted loss estimates developed by the Company’s Credit Department. In arriving at such forecasts, the Company considers the current estimated fair value of its collateral based on geographical adjustments for home price depreciation/appreciation and overall borrower repayment performance. With regard to collateral values, the realizability of such values by the Company contemplates repayment of any first lien position prior to recovering amounts on a second lien position. However, residential real estate loans and outstanding balances of home equity loans and lines of credit that are more than 150 days past due are generally evaluated for collectibility on a loan-by-loan basis giving consideration to estimated collateral values. The carrying value of residential real estate loans and home equity loans and lines of credit for which a partial charge-off has been recognized aggregated $55 million and $21 million, respectively, at December 31, 2015 and $63 million and $18 million, respectively, at December 31, 2014. Residential real estate loans and home equity loans and lines of credit that were more than 150 days past due but did not require a partial charge-off because the net realizable value of the collateral exceeded the outstanding customer balance totaled $20 million and $28 million, respectively, at December 31, 2015 and $27 million and $28 million, respectively, at December 31, 2014.
The Company also measures additional losses for purchased impaired loans when it is probable that the Company will be unable to collect all cash flows expected at acquisition plus additional cash flows expected to be collected arising from changes in estimates after acquisition. The determination of the allocated portion of the allowance for credit losses is very subjective. Given that inherent subjectivity and potential imprecision involved in determining the allocated portion of the allowance for credit losses, the Company also provides an inherent unallocated portion of the
135
Table of Contents
allowance. The unallocated portion of the allowance is intended to recognize probable losses that are not otherwise identifiable and includes management’s subjective determination of amounts necessary to provide for the possible use of imprecise estimates in determining the allocated portion of the allowance. Therefore, the level of the unallocated portion of the allowance is primarily reflective of the inherent imprecision in the various calculations used in determining the allocated portion of the allowance for credit losses. Other factors that could also lead to changes in the unallocated portion include the effects of expansion into new markets for which the Company does not have the same degree of familiarity and experience regarding portfolio performance in
changing market conditions, the introduction of new loan and lease product types, and other risks associated with the Company’s loan portfolio that may not be specifically identifiable.
The allocation of the allowance for credit losses summarized on the basis of the Company’s impairment methodology was as follows:
|
Commercial,
Financial, Leasing, etc. |
Real Estate | |||||||||||||||||||
| Commercial | Residential | Consumer | Total | |||||||||||||||||
| (In thousands) | ||||||||||||||||||||
|
December 31, 2015 |
||||||||||||||||||||
|
Individually evaluated for impairment |
$ | 44,752 | $ | 19,175 | $ | 12,727 | $ | 13,306 | $ | 89,960 | ||||||||||
|
Collectively evaluated for impairment |
255,615 | 307,000 | 57,624 | 163,511 | 783,750 | |||||||||||||||
|
Purchased impaired |
37 | 656 | 1,887 | 1,503 | 4,083 | |||||||||||||||
|
|
|
|
|
|
|
|
|
|
|
|||||||||||
|
Allocated |
$ | 300,404 | $ | 326,831 | $ | 72,238 | $ | 178,320 | 877,793 | |||||||||||
|
|
|
|
|
|
|
|
|
|||||||||||||
|
Unallocated |
78,199 | |||||||||||||||||||
|
|
|
|||||||||||||||||||
|
Total |
$ | 955,992 | ||||||||||||||||||
|
|
|
|||||||||||||||||||
|
December 31, 2014 |
||||||||||||||||||||
|
Individually evaluated for impairment |
$ | 31,779 | $ | 15,490 | $ | 14,703 | $ | 19,742 | $ | 81,714 | ||||||||||
|
Collectively evaluated for impairment |
251,607 | 291,244 | 45,061 | 165,140 | 753,052 | |||||||||||||||
|
Purchased impaired |
4,652 | 1,193 | 2,146 | 1,151 | 9,142 | |||||||||||||||
|
|
|
|
|
|
|
|
|
|
|
|||||||||||
|
Allocated |
$ | 288,038 | $ | 307,927 | $ | 61,910 | $ | 186,033 | 843,908 | |||||||||||
|
|
|
|
|
|
|
|
|
|||||||||||||
|
Unallocated |
75,654 | |||||||||||||||||||
|
|
|
|||||||||||||||||||
|
Total |
$ | 919,562 | ||||||||||||||||||
|
|
|
|||||||||||||||||||
136
Table of Contents
The recorded investment in loans and leases summarized on the basis of the Company’s impairment methodology was as follows:
|
Commercial,
Financial, Leasing, etc. |
Real Estate | |||||||||||||||||||
| Commercial | Residential | Consumer | Total | |||||||||||||||||
| (In thousands) | ||||||||||||||||||||
|
December 31, 2015 |
||||||||||||||||||||
|
Individually evaluated for impairment |
$ | 272,227 | $ | 234,132 | $ | 207,949 | $ | 65,365 | $ | 779,673 | ||||||||||
|
Collectively evaluated for impairment |
20,148,209 | 28,863,130 | 25,398,037 | 11,532,121 | 85,941,497 | |||||||||||||||
|
Purchased impaired |
1,902 | 100,049 | 664,117 | 2,261 | 768,329 | |||||||||||||||
|
|
|
|
|
|
|
|
|
|
|
|||||||||||
|
Total |
$ | 20,422,338 | $ | 29,197,311 | $ | 26,270,103 | $ | 11,599,747 | $ | 87,489,499 | ||||||||||
|
|
|
|
|
|
|
|
|
|
|
|||||||||||
|
December 31, 2014 |
||||||||||||||||||||
|
Individually evaluated for impairment |
$ | 206,318 | $ | 252,347 | $ | 232,398 | $ | 69,061 | $ | 760,124 | ||||||||||
|
Collectively evaluated for impairment |
19,244,674 | 27,148,382 | 8,406,680 | 10,911,359 | 65,711,095 | |||||||||||||||
|
Purchased impaired |
10,300 | 166,840 | 18,223 | 2,374 | 197,737 | |||||||||||||||
|
|
|
|
|
|
|
|
|
|
|
|||||||||||
|
Total |
$ | 19,461,292 | $ | 27,567,569 | $ | 8,657,301 | $ | 10,982,794 | $ | 66,668,956 | ||||||||||
|
|
|
|
|
|
|
|
|
|
|
|||||||||||
6. Premises and equipment
The detail of premises and equipment was as follows:
| December 31 | ||||||||
| 2015 | 2014 | |||||||
| (In thousands) | ||||||||
|
Land |
$ | 105,435 | $ | 82,335 | ||||
|
Buildings — owned |
443,507 | 406,522 | ||||||
|
Buildings — capital leases |
1,108 | 1,131 | ||||||
|
Leasehold improvements |
229,919 | 219,152 | ||||||
|
Furniture and equipment — owned |
614,591 | 586,429 | ||||||
|
Furniture and equipment — capital leases |
12,019 | 18,853 | ||||||
|
|
|
|
|
|||||
| 1,406,579 | 1,314,422 | |||||||
|
Less: accumulated depreciation and amortization |
||||||||
|
Owned assets |
732,315 | 686,372 | ||||||
|
Capital leases |
7,582 | 15,066 | ||||||
|
|
|
|
|
|||||
| 739,897 | 701,438 | |||||||
|
|
|
|
|
|||||
|
Premises and equipment, net |
$ | 666,682 | $ | 612,984 | ||||
|
|
|
|
|
|||||
Net lease expense for all operating leases totaled $102,356,000 in 2015, $104,297,000 in 2014 and $103,297,000 in 2013. Minimum lease payments under noncancelable operating leases are presented in note 21. Minimum lease payments required under capital leases are not material.
137
Table of Contents
7. Capitalized servicing assets
Changes in capitalized servicing assets were as follows:
| Residential Mortgage Loans | Commercial Mortgage Loans | |||||||||||||||||||||||
|
For Year Ended December 31, |
2015 | 2014 | 2013 | 2015 | 2014 | 2013 | ||||||||||||||||||
| (In thousands) | ||||||||||||||||||||||||
|
Beginning balance |
$ | 109,871 | $ | 126,377 | $ | 104,855 | $ | 72,939 | $ | 72,499 | $ | 59,978 | ||||||||||||
|
Originations |
35,556 | 28,285 | 52,375 | 29,914 | 15,922 | 26,754 | ||||||||||||||||||
|
Purchases |
243 | 289 | 272 | — | 730 | — | ||||||||||||||||||
|
Recognized in loan securitization transactions |
— | — | 13,696 | — | — | — | ||||||||||||||||||
|
Amortization |
(27,367 | ) | (45,080 | ) | (44,821 | ) | (19,161 | ) | (16,212 | ) | (14,233 | ) | ||||||||||||
|
|
|
|
|
|
|
|
|
|
|
|
|
|||||||||||||
| 118,303 | 109,871 | 126,377 | 83,692 | 72,939 | 72,499 | |||||||||||||||||||
|
Valuation allowance |
— | — | (300 | ) | — | — | — | |||||||||||||||||
|
|
|
|
|
|
|
|
|
|
|
|
|
|||||||||||||
|
Ending balance, net |
$ | 118,303 | $ | 109,871 | $ | 126,077 | $ | 83,692 | $ | 72,939 | $ | 72,499 | ||||||||||||
|
|
|
|
|
|
|
|
|
|
|
|
|
|||||||||||||
| Other | Total | |||||||||||||||||||||||
|
For Year Ended December 31, |
2015 | 2014 | 2013 | 2015 | 2014 | 2013 | ||||||||||||||||||
| (In thousands) | ||||||||||||||||||||||||
|
Beginning balance |
$ | 4,107 | $ | 11,225 | $ | 8,143 | $ | 186,917 | $ | 210,101 | $ | 172,976 | ||||||||||||
|
Originations |
— | — | — | 65,470 | 44,207 | 79,129 | ||||||||||||||||||
|
Purchases |
— | — | — | 243 | 1,019 | 272 | ||||||||||||||||||
|
Recognized in loan securitization transactions |
— | — | 9,382 | — | — | 23,078 | ||||||||||||||||||
|
Amortization |
(3,378 | ) | (7,118 | ) | (6,300 | ) | (49,906 | ) | (68,410 | ) | (65,354 | ) | ||||||||||||
|
|
|
|
|
|
|
|
|
|
|
|
|
|||||||||||||
| 729 | 4,107 | 11,225 | 202,724 | 186,917 | 210,101 | |||||||||||||||||||
|
Valuation allowance |
— | — | — | — | — | (300 | ) | |||||||||||||||||
|
|
|
|
|
|
|
|
|
|
|
|
|
|||||||||||||
|
Ending balance, net |
$ | 729 | $ | 4,107 | $ | 11,225 | $ | 202,724 | $ | 186,917 | $ | 209,801 | ||||||||||||
|
|
|
|
|
|
|
|
|
|
|
|
|
|||||||||||||
Residential mortgage loans serviced for others were $61.7 billion at December 31, 2015, $67.2 billion at December 31, 2014 and $72.4 billion at December 31, 2013. Reflected in residential mortgage loans serviced for others were loans sub-serviced for others of $37.8 billion, $42.1 billion and $46.6 billion at December 31, 2015, 2014, and 2013, respectively. Commercial mortgage loans serviced for others were $11.0 billion at December 31, 2015, $11.3 billion at December 31, 2014 and $11.4 billion at December 31, 2013.
The estimated fair value of capitalized residential mortgage loan servicing assets was approximately $249 million at December 31, 2015 and $228 million at December 31, 2014. The fair value of capitalized residential mortgage loan servicing assets was estimated using weighted-average discount rates of 12.4% and 11.9% at December 31, 2015 and 2014, respectively, and contemporaneous prepayment assumptions that vary by loan type. At December 31, 2015 and 2014, the discount rate represented a weighted-average option-adjusted spread (“OAS”) of 1119 basis points (hundredths of one percent) and 1065 basis points, respectively, over market implied forward London Interbank Offered Rates (“LIBOR”). The estimated fair value of capitalized residential mortgage loan servicing rights may vary significantly in subsequent periods due to changing interest rates and the effect thereof on prepayment speeds. The estimated fair value of capitalized commercial mortgage loan servicing assets was approximately $99 million and $87 million at December 31, 2015 and 2014, respectively. An 18% discount rate was used to estimate the fair value of capitalized commercial mortgage loan servicing rights at December 31, 2015 and 2014 with no prepayment assumptions because, in general, the servicing agreements allow the Company to share in customer loan prepayment fees and thereby recover the remaining carrying value of the capitalized servicing rights associated with such loan. The Company’s ability to realize the carrying value of capitalized commercial mortgage servicing rights is more dependent on the borrowers’ abilities to repay the underlying loans than on prepayments or changes in interest rates.
138
Table of Contents
The key economic assumptions used to determine the fair value of significant portfolios of capitalized servicing rights at December 31, 2015 and the sensitivity of such value to changes in those assumptions are summarized in the table that follows. Those calculated sensitivities are hypothetical and actual changes in the fair value of capitalized servicing rights may differ significantly from the amounts presented herein. The effect of a variation in a particular assumption on the fair value of the servicing rights is calculated without changing any other assumption. In reality, changes in one factor may result in changes in another which may magnify or counteract the sensitivities. The changes in assumptions are presumed to be instantaneous.
| Residential | Commercial | |||||||
|
Weighted-average prepayment speeds |
11.92 | % | ||||||
|
Impact on fair value of 10% adverse change |
$ | (9,208,000 | ) | |||||
|
Impact on fair value of 20% adverse change |
(17,696,000 | ) | ||||||
|
Weighted-average OAS |
11.19 | % | ||||||
|
Impact on fair value of 10% adverse change |
$ | (7,758,000 | ) | |||||
|
Impact on fair value of 20% adverse change |
(15,011,000 | ) | ||||||
|
Weighted-average discount rate |
18.00 | % | ||||||
|
Impact on fair value of 10% adverse change |
$ | (4,302,000 | ) | |||||
|
Impact on fair value of 20% adverse change |
(8,300,000 | ) | ||||||
As described in note 19, during 2013 the Company securitized approximately $1.3 billion of one-to-four family residential mortgage loans formerly held in the Company’s loan portfolio in guaranteed mortgage securitizations with Ginnie Mae and securitized and sold approximately $1.4 billion of automobile loans. In conjunction with these transactions, the Company retained the servicing rights to the loans.
8. Goodwill and other intangible assets
In accordance with GAAP, the Company does not amortize goodwill, however, core deposit and other intangible assets are amortized over the estimated life of each respective asset. Total amortizing intangible assets were comprised of the following:
|
Gross Carrying
Amount |
Accumulated
Amortization |
Net Carrying
Amount |
||||||||||
| (In thousands) | ||||||||||||
|
December 31, 2015 |
||||||||||||
|
Core deposit |
$ | 887,459 | $ | 750,624 | $ | 136,835 | ||||||
|
Other |
177,268 | 173,835 | 3,433 | |||||||||
|
|
|
|
|
|
|
|||||||
|
Total |
$ | 1,064,727 | $ | 924,459 | $ | 140,268 | ||||||
|
|
|
|
|
|
|
|||||||
|
December 31, 2014 |
||||||||||||
|
Core deposit |
$ | 755,794 | $ | 730,188 | $ | 25,606 | ||||||
|
Other |
177,268 | 167,847 | 9,421 | |||||||||
|
|
|
|
|
|
|
|||||||
|
Total |
$ | 933,062 | $ | 898,035 | $ | 35,027 | ||||||
|
|
|
|
|
|
|
|||||||
139
Table of Contents
Amortization of core deposit and other intangible assets was generally computed using accelerated methods over original amortization periods of five to ten years. The weighted-average original amortization period was approximately eight years. The remaining weighted-average amortization period as of December 31, 2015 was approximately six years. Amortization expense for core deposit and other intangible assets was $26,424,000, $33,824,000 and $46,912,000 for the years ended December 31, 2015, 2014 and 2013, respectively. Estimated amortization expense in future years for such intangible assets is as follows:
| (In thousands) | ||||
|
Year ending December 31: |
||||
|
2016 |
$ | 42,185 | ||
|
2017 |
30,733 | |||
|
2018 |
23,462 | |||
|
2019 |
18,026 | |||
|
2020 |
13,323 | |||
|
Later years |
12,539 | |||
|
|
|
|||
| $ | 140,268 | |||
|
|
|
|||
In accordance with GAAP, the Company completed annual goodwill impairment tests as of October 1, 2015, 2014 and 2013. For purposes of testing for impairment, the Company assigned all recorded goodwill to the reporting units originally intended to benefit from past business combinations, which has historically been the Company’s core relationship business reporting units. Goodwill was generally assigned based on the implied fair value of the acquired goodwill applicable to the benefited reporting units at the time of each respective acquisition. The implied fair value of the goodwill was determined as the difference between the estimated incremental overall fair value of the reporting unit and the estimated fair value of the net assets assigned to the reporting unit as of each respective acquisition date. To test for goodwill impairment at each evaluation date, the Company compared the estimated fair value of each of its reporting units to their respective carrying amounts and certain other assets and liabilities assigned to the reporting unit, including goodwill and core deposit and other intangible assets. The methodologies used to estimate fair values of reporting units as of the acquisition dates and as of the evaluation dates were similar. For the Company’s core customer relationship business reporting units, fair value was estimated as the present value of the expected future cash flows of the reporting unit. Based on the results of the goodwill impairment tests, the Company concluded that the amount of recorded goodwill was not impaired at the respective testing dates.
A summary of goodwill assigned to each of the Company’s reportable segments as of December 31, 2015 and 2014 for purposes of testing for impairment is as follows.
| December 31 | 2015 | December 31 | ||||||||||
| 2014 | Transactions(a) | 2015 | ||||||||||
| (In thousands) | ||||||||||||
|
Business Banking |
$ | 748,907 | $ | 115,459 | $ | 864,366 | ||||||
|
Commercial Banking |
907,524 | 494,349 | 1,401,873 | |||||||||
|
Commercial Real Estate |
349,197 | 305,192 | 654,389 | |||||||||
|
Discretionary Portfolio |
— | — | — | |||||||||
|
Residential Mortgage Banking |
— | — | — | |||||||||
|
Retail Banking |
1,144,404 | 164,787 | 1,309,191 | |||||||||
|
All Other |
374,593 | (11,300 | ) | 363,293 | ||||||||
|
|
|
|
|
|
|
|||||||
|
Total |
$ | 3,524,625 | $ | 1,068,487 | $ | 4,593,112 | ||||||
|
|
|
|
|
|
|
|||||||
| (a) | All increases relate to the acquisition of Hudson City on November 1, 2015. The $11 million decrease in “All Other” represents goodwill allocated to the trade processing business sold in April 2015. Further information related to those transactions is provided in note 2. |
140
Table of Contents
9. Borrowings
The amounts and interest rates of short-term borrowings were as follows:
|
Federal Funds
Purchased and Repurchase Agreements |
Other
Short-term Borrowings |
Total | ||||||||||
| (Dollars in thousands) | ||||||||||||
|
At December 31, 2015 |
||||||||||||
|
Amount outstanding |
$ | 150,546 | $ | 1,981,636 | $ | 2,132,182 | ||||||
|
Weighted-average interest rate |
0.06 | % | 0.43 | % | 0.40 | % | ||||||
|
For the year ended December 31, 2015 |
||||||||||||
|
Highest amount at a month-end |
$ | 202,951 | $ | 1,989,257 | ||||||||
|
Daily-average amount outstanding |
187,167 | 360,838 | $ | 548,005 | ||||||||
|
Weighted-average interest rate |
0.08 | % | 0.43 | % | 0.31 | % | ||||||
|
At December 31, 2014 |
||||||||||||
|
Amount outstanding |
$ | 192,676 | — | $ | 192,676 | |||||||
|
Weighted-average interest rate |
0.07 | % | — | 0.07 | % | |||||||
|
For the year ended December 31, 2014 |
||||||||||||
|
Highest amount at a month-end |
$ | 280,350 | — | |||||||||
|
Daily-average amount outstanding |
214,736 | — | $ | 214,736 | ||||||||
|
Weighted-average interest rate |
0.05 | % | — | 0.05 | % | |||||||
|
At December 31, 2013 |
||||||||||||
|
Amount outstanding |
$ | 260,455 | — | $ | 260,455 | |||||||
|
Weighted-average interest rate |
0.04 | % | — | 0.04 | % | |||||||
|
For the year ended December 31, 2013 |
||||||||||||
|
Highest amount at a month-end |
$ | 563,879 | — | |||||||||
|
Daily-average amount outstanding |
390,034 | — | $ | 390,034 | ||||||||
|
Weighted-average interest rate |
0.11 | % | — | 0.11 | % | |||||||
Short-term borrowings have a stated maturity of one year or less at the date the Company enters into the obligation. In general, federal funds purchased and short-term repurchase agreements outstanding at December 31, 2015 matured on the next business day following year-end. Other short-term borrowings at December 31, 2015 represent borrowings from the FHLB of New York that were assumed in the acquisition of Hudson City. Those borrowings mature at various dates in 2016.
At December 31, 2015, the Company had lines of credit under formal agreements as follows:
| M&T Bank |
Wilmington
Trust, N.A. |
|||||||
| (In thousands) | ||||||||
|
Outstanding borrowings |
$ | 3,108,243 | $ | — | ||||
|
Unused |
29,189,620 | 147,739 | ||||||
At December 31, 2015, M&T Bank had borrowing facilities available with the FHLBs whereby M&T Bank could borrow up to approximately $20.5 billion. Additionally, M&T Bank and Wilmington Trust, National Association (“Wilmington Trust, N.A.”), a wholly owned subsidiary of M&T, had available lines of credit with the Federal Reserve Bank of New York totaling approximately $11.9 billion at December 31, 2015. M&T Bank and Wilmington Trust, N.A. are required to pledge loans and investment securities as collateral for these borrowing facilities.
141
Table of Contents
Long-term borrowings were as follows:
| December 31, | ||||||||
| 2015 | 2014 | |||||||
| (In thousands) | ||||||||
|
Senior notes of M&T Bank: |
||||||||
|
Variable rate due 2016 |
$ | 300,000 | $ | 300,000 | ||||
|
Variable rate due 2017 |
550,000 | 550,000 | ||||||
|
1.25% due 2017 |
499,984 | 499,969 | ||||||
|
1.40% due 2017 |
749,851 | 749,756 | ||||||
|
1.45% due 2018 |
503,527 | 503,118 | ||||||
|
2.25% due 2019 |
648,628 | 648,243 | ||||||
|
2.30% due 2019 |
749,219 | 748,965 | ||||||
|
2.10% due 2020 |
749,650 | — | ||||||
|
2.90% due 2025 |
749,236 | — | ||||||
|
Advances from FHLB: |
||||||||
|
Fixed rates |
1,158,216 | 1,161,514 | ||||||
|
Agreements to repurchase securities |
1,899,281 | 1,400,000 | ||||||
|
Subordinated notes of Wilmington Trust Corporation (a wholly owned subsidiary of M&T): |
||||||||
|
8.50% due 2018 |
213,417 | 218,883 | ||||||
|
Subordinated notes of M&T Bank: |
||||||||
|
6.625% due 2017 |
419,800 | 428,627 | ||||||
|
5.585% due 2020, variable rate commenced 2015 |
409,361 | 400,846 | ||||||
|
5.629% due 2021, variable rate commencing 2016 |
518,797 | 538,961 | ||||||
|
Junior subordinated debentures of M&T associated with preferred capital securities: |
||||||||
|
Fixed rates: |
||||||||
|
M&T Capital Trust I — 8.234%, due 2027 |
— | 154,640 | ||||||
|
M&T Capital Trust II — 8.277%, due 2027 |
— | 103,093 | ||||||
|
M&T Capital Trust III — 9.25%, due 2027 |
— | 65,784 | ||||||
|
BSB Capital Trust I — 8.125%, due 2028 |
15,635 | 15,612 | ||||||
|
Provident Trust I — 8.29%, due 2028 |
25,817 | 25,405 | ||||||
|
Southern Financial Statutory Trust I — 10.60%, due 2030 |
6,583 | 6,550 | ||||||
|
Variable rates: |
||||||||
|
First Maryland Capital I — due 2027 |
145,717 | 145,179 | ||||||
|
First Maryland Capital II — due 2027 |
147,291 | 146,627 | ||||||
|
Allfirst Asset Trust — due 2029 |
96,349 | 96,204 | ||||||
|
BSB Capital Trust III — due 2033 |
15,464 | 15,464 | ||||||
|
Provident Statutory Trust III — due 2033 |
53,244 | 52,692 | ||||||
|
Southern Financial Capital Trust III — due 2033 |
7,889 | 7,816 | ||||||
|
Other |
20,902 | 23,011 | ||||||
|
|
|
|
|
|||||
| $ | 10,653,858 | $ | 9,006,959 | |||||
|
|
|
|
|
|||||
The variable rate senior notes of M&T Bank pay interest quarterly at rates that are indexed to the three-month LIBOR. The contractual interest rates for those notes ranged from 0.62% to 0.75% at December 31, 2015 and from 0.54% to 0.61% at December 31, 2014. The weighted-average contractual interest rates payable were 0.69% at December 31, 2015 and 0.56% at December 31, 2014.
142
Table of Contents
Long-term fixed rate advances from the FHLB had contractual interest rates ranging from 1.17% to 7.32% with a weighted-average contractual interest rate of 1.66% at December 31, 2015 and 1.68% at December 31, 2014. Advances from the FHLB mature at various dates through 2035 and are secured by residential real estate loans, commercial real estate loans and investment securities.
Long-term agreements to repurchase securities had contractual interest rates that ranged from 3.61% to 4.58% at December 31, 2015 and from 3.61% to 4.30% at December 31, 2014. The weighted-average contractual interest rates payable were 4.00% at December 31, 2015 and 3.90% at December 31, 2014. The agreements reflect various repurchase dates through 2020, however, the contractual maturities of the underlying investment securities extend beyond such repurchase dates. The agreements are subject to legally enforceable master netting arrangements, however, the Company has not offset any amounts related to these agreements in its consolidated financial statements. The Company posted collateral consisting primarily of government guaranteed mortgage-backed securities of $2.0 billion and $1.5 billion at December 31, 2015 and 2014, respectively.
The subordinated notes of M&T Bank and Wilmington Trust Corporation are unsecured and are subordinate to the claims of other creditors of those entities. The subordinated notes of M&T Bank that mature in 2020 converted to variable rate notes in December 2015. These notes now pay interest monthly at a rate that is indexed to the one-month LIBOR. The contractual interest rate was 1.64% at December 31, 2015. The subordinated notes of M&T Bank that mature in 2021 will convert to variable rate notes in December 2016. These notes will then pay interest quarterly at a rate that is indexed to the three-month LIBOR.
The fixed and variable rate junior subordinated deferrable interest debentures of M&T (“Junior Subordinated Debentures”) are held by various trusts and were issued in connection with the issuance by those trusts of preferred capital securities (“Capital Securities”) and common securities (“Common Securities”). The proceeds from the issuances of the Capital Securities and the Common Securities were used by the trusts to purchase the Junior Subordinated Debentures. The Common Securities of each of those trusts are wholly owned by M&T and are the only class of each trust’s securities possessing general voting powers. The Capital Securities represent preferred undivided interests in the assets of the corresponding trust. Under the Federal Reserve Board’s current risk-based capital guidelines, the Capital Securities were includable in M&T’s Tier 1 capital through December 31, 2014. In 2015, only 25% of then-outstanding securities were included in Tier 1 capital and beginning in 2016 none of the securities will be included in Tier 1 capital. The variable rate Junior Subordinated Debentures pay interest quarterly at rates that are indexed to the three-month LIBOR. Those rates ranged from 1.18% to 3.67% at December 31, 2015 and from 1.08% to 3.58% at December 31, 2014. The weighted-average variable rates payable on those Junior Subordinated Debentures were 1.78% at December 31, 2015 and 1.66% at December 31, 2014.
Holders of the Capital Securities receive preferential cumulative cash distributions unless M&T exercises its right to extend the payment of interest on the Junior Subordinated Debentures as allowed by the terms of each such debenture, in which case payment of distributions on the respective Capital Securities will be deferred for comparable periods. During an extended interest period, M&T may not pay dividends or distributions on, or repurchase, redeem or acquire any shares of its capital stock. In general, the agreements governing the Capital Securities, in the aggregate, provide a full, irrevocable and unconditional guarantee by M&T of the payment of distributions on, the redemption of, and any liquidation distribution with respect to the Capital Securities. The obligations under such guarantee and the Capital Securities are subordinate and junior in right of payment to all senior indebtedness of M&T.
The Capital Securities will remain outstanding until the Junior Subordinated Debentures are repaid at maturity, are redeemed prior to maturity or are distributed in liquidation to the trusts. The Capital Securities are mandatorily redeemable in whole, but not in part, upon repayment at the stated maturity dates (ranging from 2027 to 2033) of the Junior Subordinated Debentures or the earlier redemption of the Junior Subordinated Debentures in whole upon the occurrence of one or more events set forth in the indentures relating to the Capital Securities, and in whole or in part at any time after an optional redemption prior to contractual maturity contemporaneously with the optional redemption of the related Junior Subordinated Debentures in whole or in part, subject to possible regulatory approval. On April 15, 2015, M&T redeemed all of the issued and outstanding Capital Securities issued by M&T Capital Trust I, M&T Capital Trust II and M&T Capital Trust III,
143
Table of Contents
and the related Junior Subordinated Debentures held by those respective trusts. In the aggregate, $323 million of Junior Subordinated Debentures were redeemed.
Long-term borrowings at December 31, 2015 mature as follows:
| (In thousands) | ||||
|
Year ending December 31: |
||||
|
2016 |
$ | 1,106,613 | ||
|
2017 |
3,452,420 | |||
|
2018 |
719,574 | |||
|
2019 |
2,306,326 | |||
|
2020 |
1,272,561 | |||
|
Later years |
1,796,364 | |||
|
|
|
|||
| $ | 10,653,858 | |||
|
|
|
|||
10. Shareholders’ equity
M&T is authorized to issue 1,000,000 shares of preferred stock with a $1.00 par value per share. Preferred shares outstanding rank senior to common shares both as to dividends and liquidation preference, but have no general voting rights.
Issued and outstanding preferred stock of M&T as of December 31, 2015 and 2014 is presented below:
|
Shares
Issued and Outstanding |
Carrying
Value |
|||||||
| (Dollars in thousands) | ||||||||
|
Series A(a) |
||||||||
|
Fixed Rate Cumulative Perpetual Preferred Stock, $1,000 liquidation preference per share |
230,000 | $ | 230,000 | |||||
|
Series C(a) |
||||||||
|
Fixed Rate Cumulative Perpetual Preferred Stock, $1,000 liquidation preference per share |
151,500 | $ | 151,500 | |||||
|
Series D(b) |
||||||||
|
Fixed Rate Non-cumulative Perpetual Preferred Stock, $10,000 liquidation preference per share |
50,000 | $ | 500,000 | |||||
|
Series E(c) |
||||||||
|
Fixed-to-Floating Rate Non-cumulative Perpetual Preferred Stock, $1,000 liquidation preference per share |
350,000 | $ | 350,000 | |||||
| (a) | Dividends, if declared, are paid at 6.375%. Warrants to purchase M&T common stock at $73.86 per share issued in connection with the Series A preferred stock expire in 2018 and totaled 719,175 and 721,490 at December 31, 2015 and 2014, respectively. |
| (b) | Dividends, if declared, are paid semi-annually at a rate of 6.875% per year. The shares are redeemable in whole or in part on or after June 15, 2016. Notwithstanding M&T’s option to redeem the shares, if an event occurs such that the shares no longer qualify as Tier 1 capital, M&T may redeem all of the shares within 90 days following that occurrence. |
| (c) | Dividends, if declared, are paid semi-annually at a rate of 6.45% through February 14, 2024 and thereafter will be paid quarterly at a rate of the three-month LIBOR plus 361 basis points (hundredths of one percent). The shares are redeemable in whole or in part on or after February 15, 2024. Notwithstanding M&T’s option to redeem the shares, if an event occurs such that the shares no longer qualify as Tier 1 capital, M&T may redeem all of the shares within 90 days following that occurrence. |
In addition to the Series A warrants mentioned in (a) above, a warrant to purchase 95,383 shares of M&T common stock at $518.96 per share was outstanding at each of December 31, 2015 and 2014. The obligation under that warrant was assumed by M&T in an acquisition.
144
Table of Contents
11. Stock-based compensation plans
Stock-based compensation expense was $67 million in 2015, $65 million in 2014 and $55 million in 2013. The Company recognized income tax benefits related to stock-based compensation of $29 million in 2015, $31 million in 2014 and $29 million in 2013.
The Company’s equity incentive compensation plan allows for the issuance of various forms of stock-based compensation, including stock options, restricted stock, restricted stock units and performance-based awards. At December 31, 2015 and 2014, respectively, there were 3,954,712 and 4,398,496 shares available for future grant under the Company’s equity incentive compensation plan.
Restricted stock awards
Restricted stock awards are comprised of restricted stock and restricted stock units. Restricted stock awards granted in 2015 and 2014 vest over three years. Restricted stock awards granted prior to 2014 generally vest over four years. A portion of restricted stock awards granted in 2015 and 2014 require a performance condition to be met before such awards vest. Unrecognized compensation expense associated with restricted stock was $14 million as of December 31, 2015 and is expected to be recognized over a weighted-average period of approximately one year. The Company may issue restricted shares from treasury stock to the extent available or issue new shares. The number of restricted shares issued was 218,183 in 2015, 221,822 in 2014 and 269,755 in 2013, with a weighted-average grant date fair value of $24,726,000 in 2015, $24,765,000 in 2014 and $27,716,000 in 2013. Unrecognized compensation expense associated with restricted stock units was $6 million as of December 31, 2015 and is expected to be recognized over a weighted-average period of approximately one year. The number of restricted stock units issued was 324,772 in 2015, 299,525 in 2014 and 315,316 in 2013, with a weighted-average grant date fair value of $37,070,000, $33,406,000 and $32,380,000, respectively.
A summary of restricted stock and restricted stock unit activity follows:
|
Restricted
Stock Units Outstanding |
Weighted-
Average Grant Price |
Restricted
Stock Outstanding |
Weighted-
Average Grant Price |
|||||||||||||
|
Unvested at January 1, 2015 |
789,411 | $ | 99.53 | 761,645 | $ | 96.36 | ||||||||||
|
Granted |
324,772 | 114.14 | 218,183 | 113.33 | ||||||||||||
|
Assumed in acquisition |
215,215 | 119.85 | — | — | ||||||||||||
|
Vested |
(357,457 | ) | 98.35 | (325,518 | ) | 92.68 | ||||||||||
|
Cancelled |
(3,443 | ) | 100.95 | (28,422 | ) | 104.60 | ||||||||||
|
|
|
|
|
|
|
|
|
|||||||||
|
Unvested at December 31, 2015 |
968,498 | $ | 109.38 | 625,888 | $ | 103.82 | ||||||||||
|
|
|
|
|
|
|
|
|
|||||||||
Stock option awards
Stock options issued generally vest over four years and are exercisable over terms not exceeding ten years and one day. The Company used an option pricing model to estimate the grant date present value of stock options granted. Stock options granted in 2015, 2014 and 2013 were not significant.
A summary of stock option activity follows:
|
Stock
Options Outstanding |
Weighted-Average |
Aggregate
Intrinsic Value (In thousands) |
||||||||||||||
|
Exercise
Price |
Life
(In Years) |
|||||||||||||||
|
Outstanding at January 1, 2015 |
3,432,870 | $ | 105.31 | |||||||||||||
|
Granted |
200 | 113.16 | ||||||||||||||
|
Assumed in acquisition |
1,843,159 | 156.82 | ||||||||||||||
|
Exercised |
(954,684 | ) | 107.06 | |||||||||||||
|
Expired |
(97,835 | ) | 137.50 | |||||||||||||
|
|
|
|
|
|||||||||||||
|
Outstanding at December 31, 2015 |
4,223,710 | $ | 126.65 | 1.7 | $ | 43,761 | ||||||||||
|
|
|
|
|
|
|
|
|
|||||||||
|
Exercisable at December 31, 2015 |
4,223,266 | $ | 126.65 | 1.7 | $ | 43,755 | ||||||||||
|
|
|
|
|
|
|
|
|
|||||||||
145
Table of Contents
For 2015, 2014 and 2013, M&T received $93 million, $127 million and $172 million, respectively, in cash and realized tax benefits from the exercise of stock options of $6 million, $9 million and $12 million, respectively. The intrinsic value of stock options exercised during those periods was $17 million, $26 million and $34 million, respectively. As of December 31, 2015, the amount of unrecognized compensation cost related to non-vested stock options was not significant. The total grant date fair value of stock options vested during 2015, 2014 and 2013 was not significant. Upon the exercise of stock options, the Company may issue shares from treasury stock to the extent available or issue new shares.
Stock purchase plan
The stock purchase plan provides eligible employees of the Company with the right to purchase shares of M&T common stock at a discount through accumulated payroll deductions. In connection with the employee stock purchase plan, 2,500,000 shares of M&T common stock were authorized for issuance under a plan adopted in 2013. There were 89,384 shares issued in 2015 and 85,761 shares issued in 2014. No shares were issued in 2013. For 2015 and 2014, M&T received $9,296,000 and $8,607,000, respectively, in cash for shares purchased through the employee stock purchase plan. Compensation expense recognized for the stock purchase plan was not significant in 2015, 2014 or 2013.
Deferred bonus plan
The Company provided a deferred bonus plan pursuant to which eligible employees could elect to defer all or a portion of their annual incentive compensation awards and allocate such awards to several investment options, including M&T common stock. Participants could elect the timing of distributions from the plan. Such distributions are payable in cash with the exception of balances allocated to M&T common stock which are distributable in the form of M&T common stock. Shares of M&T common stock distributable pursuant to the terms of the deferred bonus plan were 26,365 and 29,297 at December 31, 2015 and 2014, respectively. The obligation to issue shares is included in “common stock issuable” in the consolidated balance sheet.
Directors’ stock plan
The Company maintains a compensation plan for non-employee members of the Company’s boards of directors and directors advisory councils that allows such members to receive all or a portion of their compensation in shares of M&T common stock. Through December 31, 2015, 225,763 shares had been issued in connection with the directors’ stock plan.
Through acquisitions, the Company assumed obligations to issue shares of M&T common stock related to deferred directors compensation plans. Shares of common stock issuable under such plans were 10,279 and 12,033 at December 31, 2015 and 2014, respectively. The obligation to issue shares is included in “common stock issuable” in the consolidated balance sheet.
12. Pension plans and other postretirement benefits
The Company provides defined benefit pension and other postretirement benefits (including health care and life insurance benefits) to qualified retired employees. The Company uses a December 31 measurement date for all of its plans.
Net periodic pension expense for defined benefit plans consisted of the following:
| Year Ended December 31 | ||||||||||||
| 2015 | 2014 | 2013 | ||||||||||
| (In thousands) | ||||||||||||
|
Service cost |
$ | 24,372 | $ | 20,520 | $ | 24,360 | ||||||
|
Interest cost on benefit obligation |
72,731 | 69,162 | 60,130 | |||||||||
|
Expected return on plan assets |
(96,155 | ) | (91,568 | ) | (87,353 | ) | ||||||
|
Amortization of prior service credit |
(6,005 | ) | (6,552 | ) | (6,556 | ) | ||||||
|
Recognized net actuarial loss |
44,825 | 14,494 | 41,076 | |||||||||
|
|
|
|
|
|
|
|||||||
|
Net periodic pension expense |
$ | 39,768 | $ | 6,056 | $ | 31,657 | ||||||
|
|
|
|
|
|
|
|||||||
146
Table of Contents
Net other postretirement benefits expense for defined benefit plans consisted of the following:
| Year Ended December 31 | ||||||||||||
| 2015 | 2014 | 2013 | ||||||||||
| (In thousands) | ||||||||||||
|
Service cost |
$ | 914 | $ | 605 | $ | 742 | ||||||
|
Interest cost on benefit obligation |
2,995 | 2,778 | 2,691 | |||||||||
|
Amortization of prior service credit |
(1,359 | ) | (1,359 | ) | (1,359 | ) | ||||||
|
Recognized net actuarial loss |
106 | — | 360 | |||||||||
|
|
|
|
|
|
|
|||||||
|
Net other postretirement benefits expense |
$ | 2,656 | $ | 2,024 | $ | 2,434 | ||||||
|
|
|
|
|
|
|
|||||||
Data relating to the funding position of the defined benefit plans were as follows:
| Pension Benefits |
Other
Postretirement Benefits |
|||||||||||||||
| 2015 | 2014 | 2015 | 2014 | |||||||||||||
| (In thousands) | ||||||||||||||||
|
Change in benefit obligation: |
||||||||||||||||
|
Benefit obligation at beginning of year |
$ | 1,813,409 | $ | 1,484,193 | $ | 67,502 | $ | 60,592 | ||||||||
|
Service cost |
24,372 | 20,520 | 914 | 605 | ||||||||||||
|
Interest cost |
72,731 | 69,162 | 2,995 | 2,778 | ||||||||||||
|
Plan participants’ contributions |
— | — | 2,619 | 3,498 | ||||||||||||
|
Amendments |
— | 4,619 | — | — | ||||||||||||
|
Actuarial (gain) loss |
(83,593 | ) | 300,444 | (2,431 | ) | 7,793 | ||||||||||
|
Business combinations |
247,340 | — | 56,539 | — | ||||||||||||
|
Medicare Part D reimbursement |
— | — | 420 | 495 | ||||||||||||
|
Benefits paid |
(69,728 | ) | (65,529 | ) | (7,061 | ) | (8,259 | ) | ||||||||
|
|
|
|
|
|
|
|
|
|||||||||
|
Benefit obligation at end of year |
2,004,531 | 1,813,409 | 121,497 | 67,502 | ||||||||||||
|
|
|
|
|
|
|
|
|
|||||||||
|
Change in plan assets: |
||||||||||||||||
|
Fair value of plan assets at beginning of year |
1,505,661 | 1,506,684 | — | — | ||||||||||||
|
Actual return on plan assets |
(14,069 | ) | 56,430 | — | — | |||||||||||
|
Employer contributions |
8,367 | 8,076 | 4,022 | 4,266 | ||||||||||||
|
Plan participants’ contributions |
— | — | 2,619 | 3,498 | ||||||||||||
|
Business combinations |
194,903 | — | — | — | ||||||||||||
|
Medicare Part D reimbursement |
— | — | 420 | 495 | ||||||||||||
|
Benefits and other payments |
(69,728 | ) | (65,529 | ) | (7,061 | ) | (8,259 | ) | ||||||||
|
|
|
|
|
|
|
|
|
|||||||||
|
Fair value of plan assets at end of year |
1,625,134 | 1,505,661 | — | — | ||||||||||||
|
|
|
|
|
|
|
|
|
|||||||||
|
Funded status |
$ | (379,397 | ) | $ | (307,748 | ) | $ | (121,497 | ) | $ | (67,502 | ) | ||||
|
|
|
|
|
|
|
|
|
|||||||||
|
Accrued liabilities recognized in the consolidated balance sheet |
$ | (379,397 | ) | $ | (307,748 | ) | $ | (121,497 | ) | $ | (67,502 | ) | ||||
|
|
|
|
|
|
|
|
|
|||||||||
|
Amounts recognized in accumulated other comprehensive income (“AOCI”) were: |
||||||||||||||||
|
Net loss |
$ | 494,279 | $ | 512,473 | $ | 4,200 | $ | 6,737 | ||||||||
|
Net prior service cost |
277 | (5,728 | ) | (9,096 | ) | (10,455 | ) | |||||||||
|
|
|
|
|
|
|
|
|
|||||||||
|
Pre-tax adjustment to AOCI |
494,556 | 506,745 | (4,896 | ) | (3,718 | ) | ||||||||||
|
Taxes. |
(194,608 | ) | (198,897 | ) | 1,927 | 1,459 | ||||||||||
|
|
|
|
|
|
|
|
|
|||||||||
|
Net adjustment to AOCI. |
$ | 299,948 | $ | 307,848 | $ | (2,969 | ) | $ | (2,259 | ) | ||||||
|
|
|
|
|
|
|
|
|
|||||||||
147
Table of Contents
The Company has an unfunded supplemental pension plan for certain key executives and others. The projected benefit obligation and accumulated benefit obligation included in the preceding data related to such plan were $161,657,000 as of December 31, 2015 and $135,891,000 as of December 31, 2014. Included in the amount at December 31, 2015 was $30,439,000 assumed in the Hudson City acquisition.
The accumulated benefit obligation for all defined benefit pension plans was $1,951,425,000 and $1,782,387,000 at December 31, 2015 and 2014, respectively.
GAAP requires an employer to recognize in its balance sheet as an asset or liability the overfunded or underfunded status of a defined benefit postretirement plan, measured as the difference between the fair value of plan assets and the benefit obligation. For a pension plan, the benefit obligation is the projected benefit obligation; for any other postretirement benefit plan, such as a retiree health care plan, the benefit obligation is the accumulated postretirement benefit obligation. Gains or losses and prior service costs or credits that arise during the period, but are not included as components of net periodic benefit expense, are recognized as a component of other comprehensive income. As indicated in the preceding table, as of December 31, 2015 the Company recorded a minimum liability adjustment of $489,660,000 ($494,556,000 related to pension plans and $(4,896,000) related to other postretirement benefits) with a corresponding reduction of shareholders’ equity, net of applicable deferred taxes, of $296,979,000. In aggregate, the benefit plans realized a net gain during 2015 that resulted from several factors, including: an increase in the discount rate used in the measurement of the benefit obligations to 4.25% at December 31, 2015 from 4.00% at December 31, 2014 and the amortization during 2015 of unrealized losses previously recorded in accumulated other comprehensive income as of December 31, 2014. Both of these factors increased other comprehensive income, but were largely offset by losses incurred in the qualified pension plan as a result of investment returns that were less than the expected return. As a result, the Company decreased its minimum liability adjustment from that which was recorded at December 31, 2014 by $13,367,000 with a corresponding increase to shareholders’ equity that, net of applicable deferred taxes, was $8,610,000. The table below reflects the changes in plan assets and benefit obligations recognized in other comprehensive income related to the Company’s postretirement benefit plans.
| Pension Plans |
Other
Postretirement Benefit Plans |
Total | ||||||||||
| (In thousands) | ||||||||||||
|
2015 |
||||||||||||
|
Net loss (gain) |
$ | 26,631 | $ | (2,431 | ) | $ | 24,200 | |||||
|
Amortization of prior service credit |
6,005 | 1,359 | 7,364 | |||||||||
|
Amortization of loss |
(44,825 | ) | (106 | ) | (44,931 | ) | ||||||
|
|
|
|
|
|
|
|||||||
|
Total recognized in other comprehensive income, pre-tax |
$ | (12,189 | ) | $ | (1,178 | ) | $ | (13,367 | ) | |||
|
|
|
|
|
|
|
|||||||
|
2014 |
||||||||||||
|
Net loss |
$ | 335,581 | $ | 7,793 | $ | 343,374 | ||||||
|
Prior service cost |
4,619 | — | 4,619 | |||||||||
|
Amortization of prior service credit |
6,552 | 1,359 | 7,911 | |||||||||
|
Amortization of loss |
(14,494 | ) | — | (14,494 | ) | |||||||
|
|
|
|
|
|
|
|||||||
|
Total recognized in other comprehensive income, pre-tax |
$ | 332,258 | $ | 9,152 | $ | 341,410 | ||||||
|
|
|
|
|
|
|
|||||||
The following table reflects the amortization of amounts in accumulated other comprehensive income expected to be recognized as components of net periodic benefit expense during 2016:
| Pension Plans |
Other
Postretirement Benefit Plans |
|||||||
| (In thousands) | ||||||||
|
Amortization of net prior service credit |
$ | (3,228 | ) | $ | (1,359 | ) | ||
|
Amortization of net loss |
30,912 | 8 | ||||||
148
Table of Contents
The Company also provides a qualified defined contribution pension plan to eligible employees who were not participants in the defined benefit pension plan as of December 31, 2005 and to other employees who have elected to participate in the defined contribution plan. The Company makes contributions to the defined contribution plan each year in an amount that is based on an individual participant’s total compensation (generally defined as total wages, incentive compensation, commissions and bonuses) and years of service. Participants do not contribute to the defined contribution pension plan. Pension expense recorded in 2015, 2014 and 2013 associated with the defined contribution pension plan was approximately $23 million, $22 million and $21 million, respectively.
Assumptions
The assumed weighted-average rates used to determine benefit obligations at December 31 were:
|
Pension
Benefits |
Other
Postretirement Benefits |
|||||||||||||||
| 2015 | 2014 | 2015 | 2014 | |||||||||||||
|
Discount rate |
4.25 | % | 4.00 | % | 4.25 | % | 4.00 | % | ||||||||
|
Rate of increase in future compensation levels |
4.37 | % | 4.39 | % | — | — | ||||||||||
The assumed weighted-average rates used to determine net benefit expense for the years ended December 31 were:
| Pension Benefits |
Other
Postretirement Benefits |
|||||||||||||||||||||||
| 2015 | 2014 | 2013 | 2015 | 2014 | 2013 | |||||||||||||||||||
|
Discount rate |
4.00 | % | 4.75 | % | 3.75 | % | 4.00 | % | 4.75 | % | 3.75 | % | ||||||||||||
|
Long-term rate of return on plan assets |
6.50 | % | 6.50 | % | 6.50 | % | — | — | — | |||||||||||||||
|
Rate of increase in future compensation levels |
4.39 | % | 4.42 | % | 4.50 | % | — | — | — | |||||||||||||||
On November 1, 2015 pension and other benefit obligations were assumed as a result of the acquisition of Hudson City. Initial liabilities and net costs were determined using a 4.25% discount rate, a 3.50% increase in compensation and a 6.50% expected return on assets.
The expected long-term rate of return assumption as of each measurement date was developed through analysis of historical market returns, current market conditions, anticipated future asset allocations, the funds’ past experience, and expectations on potential future market returns. The expected rate of return assumption represents a long-term average view of the performance of the plan assets, a return that may or may not be achieved during any one calendar year.
For measurement of other postretirement benefits, a 6.50% annual rate of increase in the per capita cost of covered health care benefits was assumed for 2016. The rate was assumed to decrease to 5.00% over 27 years. A one-percentage point change in assumed health care cost trend rates would have had the following effects:
| +1% | -1% | |||||||
| (In thousands) | ||||||||
|
Increase (decrease) in: |
||||||||
|
Service and interest cost |
$ | 108 | $ | (96 | ) | |||
|
Accumulated postretirement benefit obligation |
3,180 | (2,729 | ) | |||||
Plan Assets
The Company’s policy is to invest the pension plan assets in a prudent manner for the purpose of providing benefit payments to participants and mitigating reasonable expenses of administration. The Company’s investment strategy is designed to provide a total return that, over the long-term, places an emphasis on the preservation of capital. The strategy attempts to maximize investment returns on assets at a level of risk deemed appropriate by the Company while complying with
149
Table of Contents
applicable regulations and laws. The investment strategy utilizes asset diversification as a principal determinant for establishing an appropriate risk profile while emphasizing total return realized from capital appreciation, dividends and interest income. The target allocations for plan assets are generally 45 to 80 percent equity securities, 5 to 40 percent debt securities, and 5 to 30 percent money-market funds/cash equivalents and other investments, although holdings could be more or less than these general guidelines based on market conditions at the time and actions taken or recommended by the investment managers providing advice to the Company. Equity securities include investments in domestic and international equities, including through mutual funds. Debt securities include investments in corporate bonds of companies from diversified industries, mortgage-backed securities guaranteed by government agencies, U.S. Treasury securities, and mutual funds that invest in debt securities. Additionally, the Company’s defined benefit pension plan held $209,878,000 (12.9% of total assets) of real estate, private investments, hedge funds and other investments at December 31, 2015. Returns on invested assets are periodically compared with target market indices for each asset type to aid management in evaluating such returns. Furthermore, management regularly reviews the investment policy and may, if deemed appropriate, make changes to the target allocations noted above.
The fair values of the Company’s pension plan assets at December 31, 2015, by asset category, were as follows:
| Fair Value Measurement of Plan Assets At December 31, 2015 | ||||||||||||||||
| Total |
Quoted Prices
in Active Markets for Identical Assets (Level 1) |
Significant
Observable Inputs (Level 2) |
Significant
Unobservable Inputs (Level 3) |
|||||||||||||
| (In thousands) | ||||||||||||||||
|
Asset category: |
||||||||||||||||
|
Money-market funds |
$ | 69,634 | $ | 37,958 | $ | 31,676 | $ | — | ||||||||
|
Equity securities: |
||||||||||||||||
|
M&T |
148,800 | 148,800 | — | — | ||||||||||||
|
Domestic(a) |
106,993 | 106,993 | — | — | ||||||||||||
|
International(b) |
9,433 | 9,433 | — | — | ||||||||||||
|
Mutual funds: |
||||||||||||||||
|
Domestic(a) |
445,663 | 445,663 | — | — | ||||||||||||
|
International(b) |
348,869 | 348,869 | — | — | ||||||||||||
|
|
|
|
|
|
|
|
|
|||||||||
| 1,059,758 | 1,059,758 | — | — | |||||||||||||
|
|
|
|
|
|
|
|
|
|||||||||
|
Debt securities: |
||||||||||||||||
|
Corporate(c) |
105,499 | — | 105,499 | — | ||||||||||||
|
Government |
120,346 | — | 120,346 | — | ||||||||||||
|
International |
7,492 | — | 7,492 | — | ||||||||||||
|
Mutual funds: |
||||||||||||||||
|
Domestic(d) |
51,028 | 51,028 | — | — | ||||||||||||
|
|
|
|
|
|
|
|
|
|||||||||
| 284,365 | 51,028 | 233,337 | — | |||||||||||||
|
|
|
|
|
|
|
|
|
|||||||||
|
Other: |
||||||||||||||||
|
Diversified mutual fund |
70,343 | 70,343 | — | — | ||||||||||||
|
Private real estate |
2,787 | — | — | 2,787 | ||||||||||||
|
Private equity |
5,603 | — | — | 5,603 | ||||||||||||
|
Hedge funds |
119,549 | 81,861 | — | 37,688 | ||||||||||||
|
Guaranteed deposit fund |
11,596 | — | — | 11,596 | ||||||||||||
|
|
|
|
|
|
|
|
|
|||||||||
| 209,878 | 152,204 | — | 57,674 | |||||||||||||
|
|
|
|
|
|
|
|
|
|||||||||
|
Total(e) |
$ | 1,623,635 | $ | 1,300,948 | $ | 265,013 | $ | 57,674 | ||||||||
|
|
|
|
|
|
|
|
|
|||||||||
150
Table of Contents
The fair values of the Company’s pension plan assets at December 31, 2014, by asset category, were as follows:
| Fair Value Measurement of Plan Assets At December 31, 2014 | ||||||||||||||||
| Total |
Quoted Prices
in Active Markets for Identical Assets (Level 1) |
Significant
Observable Inputs (Level 2) |
Significant
Unobservable Inputs (Level 3) |
|||||||||||||
| (In thousands) | ||||||||||||||||
|
Asset category: |
||||||||||||||||
|
Money-market funds |
$ | 29,458 | $ | 29,458 | $ | — | $ | — | ||||||||
|
Equity securities: |
||||||||||||||||
|
M&T |
154,252 | 154,252 | — | — | ||||||||||||
|
Domestic(a) |
214,127 | 214,127 | — | — | ||||||||||||
|
International(b) |
16,170 | 16,170 | — | — | ||||||||||||
|
Mutual funds: |
||||||||||||||||
|
Domestic(a) |
305,817 | 305,817 | — | — | ||||||||||||
|
International(b) |
381,101 | 381,101 | — | — | ||||||||||||
|
|
|
|
|
|
|
|
|
|||||||||
| 1,071,467 | 1,071,467 | — | — | |||||||||||||
|
|
|
|
|
|
|
|
|
|||||||||
|
Debt securities: |
||||||||||||||||
|
Corporate(c) |
102,848 | — | 102,848 | — | ||||||||||||
|
Government |
92,772 | — | 92,772 | — | ||||||||||||
|
International |
7,196 | — | 7,196 | — | ||||||||||||
|
Mutual funds: |
||||||||||||||||
|
Domestic(d) |
27,847 | 27,847 | — | — | ||||||||||||
|
|
|
|
|
|
|
|
|
|||||||||
| 230,663 | 27,847 | 202,816 | — | |||||||||||||
|
|
|
|
|
|
|
|
|
|||||||||
|
Other: |
||||||||||||||||
|
Diversified mutual fund |
96,936 | 96,936 | — | — | ||||||||||||
|
Private real estate |
2,162 | — | — | 2,162 | ||||||||||||
|
Private equity |
6,234 | — | — | 6,234 | ||||||||||||
|
Hedge funds |
66,694 | 42,430 | — | 24,264 | ||||||||||||
|
|
|
|
|
|
|
|
|
|||||||||
| 172,026 | 139,366 | — | 32,660 | |||||||||||||
|
|
|
|
|
|
|
|
|
|||||||||
|
Total(e) |
$ | 1,503,614 | $ | 1,268,138 | $ | 202,816 | $ | 32,660 | ||||||||
|
|
|
|
|
|
|
|
|
|||||||||
| (a) | This category is comprised of equities of companies primarily within the mid-cap and large-cap sectors of the U.S. economy and range across diverse industries. |
| (b) | This category is comprised of equities in companies primarily within the mid-cap and large-cap sectors of international markets mainly in developed markets in Europe and the Pacific Rim. |
| (c) | This category represents investment grade bonds of U.S. issuers from diverse industries. |
| (d) | Approximately 33% of the mutual funds were invested in investment grade bonds and 67% in high-yielding bonds at December 31, 2015. Approximately 55% of the mutual funds were invested in investment grade bonds and 45% in high-yielding bonds at December 31, 2014. The holdings within the funds were spread across diverse industries. |
| (e) | Excludes dividends and interest receivable totaling $1,499,000 and $2,047,000 at December 31, 2015 and 2014, respectively. |
Pension plan assets included common stock of M&T with a fair value of $148,800,000 (9.2% of total plan assets) at December 31, 2015 and $154,252,000 (10.2% of total plan assets) at December 31, 2014. No investment in securities of a non-U.S. Government or government agency issuer exceeded
151
Table of Contents
ten percent of plan assets at December 31, 2015. Assets subject to Level 3 valuations did not constitute a significant portion of plan assets at December 31, 2015 or December 31, 2014.
The changes in Level 3 pension plan assets measured at estimated fair value on a recurring basis during the year ended December 31, 2015 were as follows:
|
Balance –
January 1, 2015 |
Purchases
(Sales) |
Total
Realized/ Unrealized Gains (Losses) |
Balance –
December 31, 2015 |
|||||||||||||
| (In thousands) | ||||||||||||||||
|
Other |
||||||||||||||||
|
Private real estate |
$ | 2,162 | $ | (125 | ) | $ | 750 | $ | 2,787 | |||||||
|
Private equity |
6,234 | (975 | ) | 344 | 5,603 | |||||||||||
|
Hedge funds |
24,264 | 14,258 | (834 | ) | 37,688 | |||||||||||
|
Guaranteed deposit fund |
— | 11,407 | 189 | 11,596 | ||||||||||||
|
|
|
|
|
|
|
|
|
|||||||||
|
Total |
$ | 32,660 | $ | 24,565 | $ | 449 | $ | 57,674 | ||||||||
|
|
|
|
|
|
|
|
|
|||||||||
The Company makes contributions to its funded qualified defined benefit pension plan as required by government regulation or as deemed appropriate by management after considering factors such as the fair value of plan assets, expected returns on such assets, and the present value of benefit obligations of the plan. Subject to the impact of actual events and circumstances that may occur in 2016, the Company may make contributions to the qualified defined benefit pension plan in 2016, but the amount of any such contribution has not yet been determined. The Company did not make any contributions to the plan in 2015 or 2014. The Company regularly funds the payment of benefit obligations for the supplemental defined benefit pension and postretirement benefit plans because such plans do not hold assets for investment. Payments made by the Company for supplemental pension benefits were $8,367,000 and $8,076,000 in 2015 and 2014, respectively. Payments made by the Company for postretirement benefits were $4,022,000 and $4,266,000 in 2015 and 2014, respectively. Payments for supplemental pension and other postretirement benefits for 2016 are not expected to differ from those made in 2015 by an amount that will be material to the Company’s consolidated financial position.
Estimated benefits expected to be paid in future years related to the Company’s defined benefit pension and other postretirement benefits plans are as follows:
|
Pension
Benefits |
Other
Postretirement Benefits |
|||||||
| (In thousands) | ||||||||
|
Year ending December 31: |
||||||||
|
2016 |
$ | 77,923 | $ | 8,771 | ||||
|
2017 |
82,899 | 8,834 | ||||||
|
2018 |
87,480 | 8,952 | ||||||
|
2019 |
93,309 | 8,979 | ||||||
|
2020 |
98,138 | 8,973 | ||||||
|
2021 through 2025 |
561,736 | 44,338 | ||||||
The Company has a retirement savings plan (“RSP”) that is a defined contribution plan in which eligible employees of the Company may defer up to 50% of qualified compensation via contributions to the plan. The Company makes an employer matching contribution in an amount equal to 75% of an employee’s contribution, up to 4.5% of the employee’s qualified compensation. Employees’ accounts, including employee contributions, employer matching contributions and accumulated earnings thereon, are at all times fully vested and nonforfeitable. Employee benefits expense resulting from the Company’s contributions to the RSP totaled $34,145,000, $32,466,000 and $31,797,000 in 2015, 2014 and 2013, respectively.
152
Table of Contents
13. Income taxes
The components of income tax expense were as follows:
| Year Ended December 31 | ||||||||||||
| 2015 | 2014 | 2013 | ||||||||||
| (In thousands) | ||||||||||||
|
Current |
||||||||||||
|
Federal |
$ | 130,349 | $ | 378,978 | $ | 371,249 | ||||||
|
State and city |
21,549 | 50,790 | 68,035 | |||||||||
|
|
|
|
|
|
|
|||||||
|
Total current |
151,898 | 429,768 | 439,284 | |||||||||
|
|
|
|
|
|
|
|||||||
|
Deferred |
||||||||||||
|
Federal |
324,317 | 65,503 | 106,537 | |||||||||
|
State and city |
72,279 | 27,345 | 33,248 | |||||||||
|
|
|
|
|
|
|
|||||||
|
Total deferred |
396,596 | 92,848 | 139,785 | |||||||||
|
|
|
|
|
|
|
|||||||
|
Amortization of investments in qualified affordable housing projects |
46,531 | 53,383 | 48,019 | |||||||||
|
|
|
|
|
|
|
|||||||
|
Total income taxes applicable to pre-tax income |
$ | 595,025 | $ | 575,999 | $ | 627,088 | ||||||
|
|
|
|
|
|
|
|||||||
The Company files a consolidated federal income tax return reflecting taxable income earned by all domestic subsidiaries. In prior years, applicable federal tax law allowed certain financial institutions the option of deducting as bad debt expense for tax purposes amounts in excess of actual losses. In accordance with GAAP, such financial institutions were not required to provide deferred income taxes on such excess. Recapture of the excess tax bad debt reserve established under the previously allowed method will result in taxable income if M&T Bank fails to maintain bank status as defined in the Internal Revenue Code or charges are made to the reserve for other than bad debt losses. At December 31, 2015, M&T Bank’s tax bad debt reserve for which no federal income taxes have been provided was $137,121,000. No actions are planned that would cause this reserve to become wholly or partially taxable.
Income taxes attributable to gains or losses on bank investment securities were an expense of $18,313,000 in 2013. There were no significant gains or losses on bank investment securities in 2014 or 2015. No alternative minimum tax expense was recognized in 2015, 2014 or 2013.
Total income taxes differed from the amount computed by applying the statutory federal income tax rate to pre-tax income as follows:
| Year Ended December 31 | ||||||||||||
| 2015 | 2014 | 2013 | ||||||||||
| (In thousands) | ||||||||||||
|
Income taxes at statutory federal income tax rate |
$ | 586,142 | $ | 574,786 | $ | 617,949 | ||||||
|
Increase (decrease) in taxes: |
||||||||||||
|
Tax-exempt income |
(33,102 | ) | (31,752 | ) | (34,747 | ) | ||||||
|
State and city income taxes, net of federal income tax effect |
60,988 | 50,788 | 65,834 | |||||||||
|
Qualified affordable housing project federal tax credits, net |
(15,297 | ) | (14,827 | ) | (17,994 | ) | ||||||
|
Other |
(3,706 | ) | (2,996 | ) | (3,954 | ) | ||||||
|
|
|
|
|
|
|
|||||||
| $ | 595,025 | $ | 575,999 | $ | 627,088 | |||||||
|
|
|
|
|
|
|
|||||||
153
Table of Contents
Deferred tax assets (liabilities) were comprised of the following at December 31:
| 2015 | 2014 | 2013 | ||||||||||
| (In thousands) | ||||||||||||
|
Losses on loans and other assets |
$ | 637,955 | $ | 605,273 | $ | 645,713 | ||||||
|
Postretirement and other employee benefits |
55,962 | 34,052 | 30,023 | |||||||||
|
Incentive and other compensation plans |
60,337 | 36,450 | 37,772 | |||||||||
|
Interest on loans |
57,640 | 79,147 | 100,725 | |||||||||
|
Retirement benefits |
148,722 | 120,222 | — | |||||||||
|
Stock-based compensation |
72,090 | 64,017 | 63,101 | |||||||||
|
Depreciation and amortization |
— | 3,527 | 1,404 | |||||||||
|
Other |
162,086 | 100,999 | 121,561 | |||||||||
|
|
|
|
|
|
|
|||||||
|
Gross deferred tax assets |
1,194,792 | 1,043,687 | 1,000,299 | |||||||||
|
|
|
|
|
|
|
|||||||
|
Leasing transactions |
(285,074 | ) | (280,596 | ) | (284,370 | ) | ||||||
|
Unrealized investment gains |
(31,121 | ) | (82,065 | ) | (21,779 | ) | ||||||
|
Capitalized servicing rights |
(59,171 | ) | (46,393 | ) | (46,041 | ) | ||||||
|
Interest on subordinated note exchange |
— | (3,125 | ) | (6,075 | ) | |||||||
|
Retirement benefits |
— | — | (9,397 | ) | ||||||||
|
Depreciation and amortization |
(56,731 | ) | — | — | ||||||||
|
Other |
(55,611 | ) | (63,814 | ) | (49,450 | ) | ||||||
|
|
|
|
|
|
|
|||||||
|
Gross deferred tax liabilities |
(487,708 | ) | (475,993 | ) | (417,112 | ) | ||||||
|
|
|
|
|
|
|
|||||||
|
Net deferred tax asset |
$ | 707,084 | $ | 567,694 | $ | 583,187 | ||||||
|
|
|
|
|
|
|
|||||||
The Company believes that it is more likely than not that the deferred tax assets will be realized through taxable earnings or alternative tax strategies.
The income tax credits shown in the statement of income of M&T in note 25 arise principally from operating losses before dividends from subsidiaries.
154
Table of Contents
A reconciliation of the beginning and ending amount of unrecognized tax benefits follows:
|
Federal,
State and Local Tax |
Accrued
Interest |
Unrecognized
Income Tax Benefits |
||||||||||
| (In thousands) | ||||||||||||
|
Gross unrecognized tax benefits at January 1, 2013 |
$ | 16,548 | $ | 12,379 | $ | 28,927 | ||||||
|
Increases in unrecognized tax benefits as a result of tax positions taken during 2013 |
2,267 | — | 2,267 | |||||||||
|
Increases in unrecognized tax benefits as a result of tax positions taken in prior years |
— | 4,429 | 4,429 | |||||||||
|
Decreases in unrecognized tax benefits as a result of settlements with taxing authorities |
(1,854 | ) | (487 | ) | (2,341 | ) | ||||||
|
Decreases in unrecognized tax benefits because applicable returns are no longer subject to examination |
(2,350 | ) | (1,625 | ) | (3,975 | ) | ||||||
|
|
|
|
|
|
|
|||||||
|
Gross unrecognized tax benefits at December 31, 2013 |
14,611 | 14,696 | 29,307 | |||||||||
|
Increases in unrecognized tax benefits as a result of tax positions taken during 2014 |
769 | — | 769 | |||||||||
|
Increases in unrecognized tax benefits as a result of tax positions taken in prior years |
— | 453 | 453 | |||||||||
|
Decreases in unrecognized tax benefits as a result of settlements with taxing authorities |
(4,668 | ) | (11,280 | ) | (15,948 | ) | ||||||
|
|
|
|
|
|
|
|||||||
|
Gross unrecognized tax benefits at December 31, 2014 |
10,712 | 3,869 | 14,581 | |||||||||
|
Increases in unrecognized tax benefits as a result of tax positions taken during 2015 |
8,108 | — | 8,108 | |||||||||
|
Increases in unrecognized tax benefits as a result of tax positions taken in prior years |
— | 807 | 807 | |||||||||
|
Decreases in unrecognized tax benefits as a result of settlements with taxing authorities |
(1,515 | ) | (274 | ) | (1,789 | ) | ||||||
|
Unrealized tax benefits acquired in a business combination |
7,232 | 3,567 | 10,799 | |||||||||
|
|
|
|
|
|
|
|||||||
|
Gross unrecognized tax benefits at December 31, 2015 |
$ | 24,537 | $ | 7,969 | 32,506 | |||||||
|
|
|
|
|
|||||||||
|
Less: Federal, state and local income tax benefits |
(11,377 | ) | ||||||||||
|
|
|
|||||||||||
|
Net unrecognized tax benefits at December 31, 2015 that, if recognized, would impact the effective income tax rate |
$ | 21,129 | ||||||||||
|
|
|
|||||||||||
The Company’s policy is to recognize interest and penalties, if any, related to unrecognized tax benefits in income taxes in the consolidated statement of income. The balance of accrued interest at December 31, 2015 is included in the table above. The Company’s federal, state and local income tax returns are routinely subject to examinations from various governmental taxing authorities. Such examinations may result in challenges to the tax return treatment applied by the Company to specific transactions. Management believes that the assumptions and judgment used to record tax-related assets or liabilities have been appropriate. Should determinations rendered by tax authorities ultimately indicate that management’s assumptions were inappropriate, the result and adjustments required could have a material effect on the Company’s results of operations. Examinations by the Internal Revenue Service of the Company’s federal income tax returns have been largely concluded through 2014, although under statute the income tax returns from 2010 through 2014 could be adjusted. The Company also files income tax returns in over forty states and numerous local jurisdictions. Substantially all material state and local matters have been concluded for years through 2011. It is not reasonably possible to estimate when examinations for any subsequent years will be completed.
155
Table of Contents
14. Earnings per common share
The computations of basic earnings per common share follow:
| Year Ended December 31 | ||||||||||||
| 2015 | 2014 | 2013 | ||||||||||
| (In thousands, except per share) | ||||||||||||
|
Income available to common shareholders: |
||||||||||||
|
Net income |
$ | 1,079,667 | $ | 1,066,246 | $ | 1,138,480 | ||||||
|
Less: Preferred stock dividends(a) |
(81,270 | ) | (75,878 | ) | (54,120 | ) | ||||||
|
Amortization of preferred stock discount(a) |
— | — | (7,942 | ) | ||||||||
|
|
|
|
|
|
|
|||||||
|
Net income available to common equity |
998,397 | 990,368 | 1,076,418 | |||||||||
|
Less: Income attributable to unvested stock-based compensation awards |
(10,708 | ) | (11,837 | ) | (13,989 | ) | ||||||
|
|
|
|
|
|
|
|||||||
|
Net income available to common shareholders |
$ | 987,689 | $ | 978,531 | $ | 1,062,429 | ||||||
|
Weighted-average shares outstanding: |
||||||||||||
|
Common shares outstanding (including common stock issuable) and unvested stock-based compensation awards |
138,285 | 132,532 | 130,354 | |||||||||
|
Less: Unvested stock-based compensation awards |
(1,482 | ) | (1,582 | ) | (1,700 | ) | ||||||
|
|
|
|
|
|
|
|||||||
|
Weighted-average shares outstanding |
136,803 | 130,950 | 128,654 | |||||||||
|
Basic earnings per common share |
$ | 7.22 | $ | 7.47 | $ | 8.26 | ||||||
| (a) | Including impact of not as yet declared cumulative dividends. |
The computations of diluted earnings per common share follow:
| Year Ended December 31 | ||||||||||||
| 2015 | 2014 | 2013 | ||||||||||
| (In thousands, except per share) | ||||||||||||
|
Net income available to common equity |
$ | 998,397 | $ | 990,368 | $ | 1,076,418 | ||||||
|
Less: Income attributable to unvested stock-based compensation awards |
(10,673 | ) | (11,787 | ) | (13,922 | ) | ||||||
|
|
|
|
|
|
|
|||||||
|
Net income available to common shareholders |
$ | 987,724 | $ | 978,581 | $ | 1,062,496 | ||||||
|
Adjusted weighted-average shares outstanding: |
||||||||||||
|
Common and unvested stock-based compensation awards |
138,285 | 132,532 | 130,354 | |||||||||
|
Less: Unvested stock-based compensation awards |
(1,482 | ) | (1,582 | ) | (1,700 | ) | ||||||
|
Plus: Incremental shares from assumed conversion of stock-based compensation awards and warrants to purchase common stock |
730 | 894 | 949 | |||||||||
|
|
|
|
|
|
|
|||||||
|
Adjusted weighted-average shares outstanding |
137,533 | 131,844 | 129,603 | |||||||||
|
Diluted earnings per common share |
$ | 7.18 | $ | 7.42 | $ | 8.20 | ||||||
GAAP defines unvested share-based awards that contain nonforfeitable rights to dividends or dividend equivalents (whether paid or unpaid) as participating securities that shall be included in the computation of earnings per common share pursuant to the two-class method. The Company has issued stock-based compensation awards in the form of restricted stock and restricted stock units, which, in accordance with GAAP, are considered participating securities.
Stock-based compensation awards and warrants to purchase common stock of M&T representing common shares of approximately 2,268,000 in 2015, 2,017,000 in 2014 and 3,847,000 in 2013 were not included in the computations of diluted earnings per common share because the effect on those years would have been antidilutive.
156
Table of Contents
15. Comprehensive income
The following tables display the components of other comprehensive income (loss) and amounts reclassified from accumulated other comprehensive income (loss) to net income.
| Investment Securities |
Defined
Benefit Plans |
Other |
Total
Amount Before Tax |
Income
Tax |
Net | |||||||||||||||||||||||
|
With
OTTI |
All
Other |
|||||||||||||||||||||||||||
| (In thousands) | ||||||||||||||||||||||||||||
|
Balance — January 1, 2015 |
$ | 7,438 | 201,828 | (503,027 | ) | (4,082 | ) | (297,843 | ) | 116,849 | $ | (180,994 | ) | |||||||||||||||
|
Other comprehensive income before reclassifications: |
||||||||||||||||||||||||||||
|
Unrealized holding gains (losses), net |
8,921 | (142,623 | ) | — | — | (133,702 | ) | 52,376 | (81,326 | ) | ||||||||||||||||||
|
Foreign currency translation adjustment |
— | — | — | (1,323 | ) | (1,323 | ) | 398 | (925 | ) | ||||||||||||||||||
|
Gains on cash flow hedges |
— | — | — | 1,453 | 1,453 | (572 | ) | 881 | ||||||||||||||||||||
|
Current year benefit plans losses |
— | — | (24,200 | ) | — | (24,200 | ) | 8,612 | (15,588 | ) | ||||||||||||||||||
|
|
|
|
|
|
|
|
|
|
|
|
|
|
|
|||||||||||||||
|
Total other comprehensive income (loss) before reclassifications |
8,921 | (142,623 | ) | (24,200 | ) | 130 | (157,772 | ) | 60,814 | (96,958 | ) | |||||||||||||||||
|
|
|
|
|
|
|
|
|
|
|
|
|
|
|
|||||||||||||||
|
Amounts reclassified from accumulated other comprehensive income that (increase) decrease net income: |
||||||||||||||||||||||||||||
|
Amortization of unrealized holding losses on held-to-maturity (“HTM”) securities |
— | 3,514 | — | — | 3,514 | (a) | (1,383 | ) | 2,131 | |||||||||||||||||||
|
Losses realized in net income |
— | 130 | — | — | 130 | (c) | (49 | ) | 81 | |||||||||||||||||||
|
Accretion of net gain on terminated cash flow hedges |
— | — | — | (141 | ) | (141 | )(d) | 56 | (85 | ) | ||||||||||||||||||
|
Amortization of prior service credit |
— | — | (7,364 | ) | — | (7,364 | )(e) | 2,620 | (4,744 | ) | ||||||||||||||||||
|
Amortization of actuarial losses |
— | — | 44,931 | — | 44,931 | (e) | (15,989 | ) | 28,942 | |||||||||||||||||||
|
|
|
|
|
|
|
|
|
|
|
|
|
|
|
|||||||||||||||
|
Total reclassifications |
— | 3,644 | 37,567 | (141 | ) | 41,070 | (14,745 | ) | 26,325 | |||||||||||||||||||
|
|
|
|
|
|
|
|
|
|
|
|
|
|
|
|||||||||||||||
|
Total gain (loss) during the period |
8,921 | (138,979 | ) | 13,367 | (11 | ) | (116,702 | ) | 46,069 | (70,633 | ) | |||||||||||||||||
|
|
|
|
|
|
|
|
|
|
|
|
|
|
|
|||||||||||||||
|
Balance — December 31, 2015 |
$ | 16,359 | 62,849 | (489,660 | ) | (4,093 | ) | (414,545 | ) | 162,918 | $ | (251,627 | ) | |||||||||||||||
|
|
|
|
|
|
|
|
|
|
|
|
|
|
|
|||||||||||||||
157
Table of Contents
| Investment Securities |
Defined
Benefit Plans |
Other |
Total
Amount Before Tax |
Income
Tax |
Net | |||||||||||||||||||||||
|
With
OTTI |
All
Other |
|||||||||||||||||||||||||||
| (In thousands) | ||||||||||||||||||||||||||||
|
Balance — January 1, 2014 |
$ | 37,255 | 18,450 | (161,617 | ) | 115 | (105,797 | ) | 41,638 | $ | (64,159 | ) | ||||||||||||||||
|
Other comprehensive income before reclassifications: |
||||||||||||||||||||||||||||
|
Unrealized holding gains (losses), net |
(29,818 | ) | 180,005 | — | — | 150,187 | (58,962 | ) | 91,225 | |||||||||||||||||||
|
Foreign currency translation adjustment |
— | — | — | (4,039 | ) | (4,039 | ) | 1,432 | (2,607 | ) | ||||||||||||||||||
|
Unrealized losses on cash flow hedges |
— | — | — | (165 | ) | (165 | ) | 65 | (100 | ) | ||||||||||||||||||
|
Current year benefit plans losses |
— | — | (347,993 | ) | — | (347,993 | ) | 136,587 | (211,406 | ) | ||||||||||||||||||
|
|
|
|
|
|
|
|
|
|
|
|
|
|
|
|||||||||||||||
|
Total other comprehensive income (loss) before reclassifications |
(29,818 | ) | 180,005 | (347,993 | ) | (4,204 | ) | (202,010 | ) | 79,122 | (122,888 | ) | ||||||||||||||||
|
|
|
|
|
|
|
|
|
|
|
|
|
|
|
|||||||||||||||
|
Amounts reclassified from accumulated other comprehensive income that (increase) decrease net income: |
||||||||||||||||||||||||||||
|
Amortization of unrealized holding losses on HTM securities |
1 | 3,373 | — | — | 3,374 | (a) | (1,324 | ) | 2,050 | |||||||||||||||||||
|
Amortization of losses on terminated cash flow hedges |
— | — | — | 7 | 7 | (d) | (3 | ) | 4 | |||||||||||||||||||
|
Amortization of prior service credit |
— | — | (7,911 | ) | — | (7,911 | )(e) | 3,105 | (4,806 | ) | ||||||||||||||||||
|
Amortization of actuarial losses |
— | — | 14,494 | — | 14,494 | (e) | (5,689 | ) | 8,805 | |||||||||||||||||||
|
|
|
|
|
|
|
|
|
|
|
|
|
|
|
|||||||||||||||
|
Total reclassifications |
1 | 3,373 | 6,583 | 7 | 9,964 | (3,911 | ) | 6,053 | ||||||||||||||||||||
|
|
|
|
|
|
|
|
|
|
|
|
|
|
|
|||||||||||||||
|
Total gain (loss) during the period |
(29,817 | ) | 183,378 | (341,410 | ) | (4,197 | ) | (192,046 | ) | 75,211 | (116,835 | ) | ||||||||||||||||
|
|
|
|
|
|
|
|
|
|
|
|
|
|
|
|||||||||||||||
|
Balance — December 31, 2014 |
$ | 7,438 | 201,828 | (503,027 | ) | (4,082 | ) | (297,843 | ) | 116,849 | $ | (180,994 | ) | |||||||||||||||
|
|
|
|
|
|
|
|
|
|
|
|
|
|
|
|||||||||||||||
158
Table of Contents
| Investment Securities |
Defined
Benefit Plans |
Other |
Total
Amount Before Tax |
Income
Tax |
Net | |||||||||||||||||||||||
|
With
OTTI |
All
Other |
|||||||||||||||||||||||||||
| (In thousands) | ||||||||||||||||||||||||||||
|
Balance — January 1, 2013 |
$ | (91,835 | ) | 152,199 | (455,590 | ) | (431 | ) | (395,657 | ) | 155,393 | $ | (240,264 | ) | ||||||||||||||
|
Other comprehensive income before reclassifications: |
||||||||||||||||||||||||||||
|
Unrealized holding gains (losses), net |
77,794 | (129,628 | ) | — | — | (51,834 | ) | 20,311 | (31,523 | ) | ||||||||||||||||||
|
Foreign currency translation adjustment |
— | — | — | 546 | 546 | (165 | ) | 381 | ||||||||||||||||||||
|
Current year benefit plans gains |
— | — | 260,452 | — | 260,452 | (102,227 | ) | 158,225 | ||||||||||||||||||||
|
|
|
|
|
|
|
|
|
|
|
|
|
|
|
|||||||||||||||
|
Total other comprehensive income (loss) before reclassifications |
77,794 | (129,628 | ) | 260,452 | 546 | 209,164 | (82,081 | ) | 127,083 | |||||||||||||||||||
|
|
|
|
|
|
|
|
|
|
|
|
|
|
|
|||||||||||||||
|
Amounts reclassified from accumulated other comprehensive income that (increase) decrease net income: |
||||||||||||||||||||||||||||
|
Amortization of unrealized holding losses on HTM securities |
279 | 4,008 | — | — | 4,287 | (a) | (1,683 | ) | 2,604 | |||||||||||||||||||
|
OTTI charges recognized in net income |
9,800 | — | — | — | 9,800 | (b) | (3,847 | ) | 5,953 | |||||||||||||||||||
|
Losses (gains) realized in net income |
41,217 | (8,129 | ) | — | — | 33,088 | (c) | (12,987 | ) | 20,101 | ||||||||||||||||||
|
Amortization of prior service credit |
— | — | (7,915 | ) | — | (7,915 | )(e) | 3,107 | (4,808 | ) | ||||||||||||||||||
|
Amortization of actuarial losses |
— | — | 41,436 | — | 41,436 | (e) | (16,264 | ) | 25,172 | |||||||||||||||||||
|
|
|
|
|
|
|
|
|
|
|
|
|
|
|
|||||||||||||||
|
Total reclassifications |
51,296 | (4,121 | ) | 33,521 | — | 80,696 | (31,674 | ) | 49,022 | |||||||||||||||||||
|
|
|
|
|
|
|
|
|
|
|
|
|
|
|
|||||||||||||||
|
Total gain (loss) during the period |
129,090 | (133,749 | ) | 293,973 | 546 | 289,860 | (113,755 | ) | 176,105 | |||||||||||||||||||
|
|
|
|
|
|
|
|
|
|
|
|
|
|
|
|||||||||||||||
|
Balance — December 31, 2013 |
$ | 37,255 | 18,450 | (161,617 | ) | 115 | (105,797 | ) | 41,638 | $ | (64,159 | ) | ||||||||||||||||
|
|
|
|
|
|
|
|
|
|
|
|
|
|
|
|||||||||||||||
| (a) | Included in interest income. |
| (b) | Included in OTTI losses recognized in earnings. |
| (c) | Included in gain (loss) on bank investment securities. |
| (d) | Included in interest expense. |
| (e) | Included in salaries and employee benefits expense. |
159
Table of Contents
Accumulated other comprehensive income (loss), net consisted of unrealized gains (losses) as follows:
| Investment Securities |
Defined
Benefit Plans |
Other | Total | |||||||||||||||||
| With OTTI | All Other | |||||||||||||||||||
| (In thousands) | ||||||||||||||||||||
|
Balance at January 1, 2013 |
$ | (55,790 | ) | $ | 92,581 | $ | (276,771 | ) | $ | (284 | ) | $ | (240,264 | ) | ||||||
|
Net gain (loss) during 2013 |
78,422 | (81,287 | ) | 178,589 | 381 | 176,105 | ||||||||||||||
|
|
|
|
|
|
|
|
|
|
|
|||||||||||
|
Balance at December 31, 2013 |
22,632 | 11,294 | (98,182 | ) | 97 | (64,159 | ) | |||||||||||||
|
Net gain (loss) during 2014 |
(18,114 | ) | 111,389 | (207,407 | ) | (2,703 | ) | (116,835 | ) | |||||||||||
|
|
|
|
|
|
|
|
|
|
|
|||||||||||
|
Balance at December 31, 2014 |
4,518 | 122,683 | (305,589 | ) | (2,606 | ) | (180,994 | ) | ||||||||||||
|
Net gain (loss) during 2015 |
5,403 | (84,517 | ) | 8,610 | (129 | ) | (70,633 | ) | ||||||||||||
|
|
|
|
|
|
|
|
|
|
|
|||||||||||
|
Balance at December 31, 2015 |
$ | 9,921 | $ | 38,166 | $ | (296,979 | ) | $ | (2,735 | ) | $ | (251,627 | ) | |||||||
|
|
|
|
|
|
|
|
|
|
|
|||||||||||
16. Other income and other expense
The following items, which exceeded 1% of total interest income and other income in the respective period, were included in either “other revenues from operations” or “other costs of operations” in the consolidated statement of income:
| Year Ended December 31 | ||||||||||||
| 2015 | 2014 | 2013 | ||||||||||
| (In thousands) | ||||||||||||
|
Other income: |
||||||||||||
|
Bank owned life insurance |
$ | 52,984 | $ | 50,004 | $ | 56,120 | ||||||
|
Credit-related fee income |
81,558 | 72,454 | 72,271 | |||||||||
|
Letter of credit fees |
52,724 | 56,708 | 59,889 | |||||||||
|
Gains from loan securitization transactions |
63,066 | |||||||||||
|
Other expense: |
||||||||||||
|
Professional services |
346,840 | 401,946 | 335,794 | |||||||||
|
Amortization of capitalized servicing rights |
49,906 | 68,410 | 65,354 | |||||||||
|
Advertising and promotion |
59,227 | 56,597 | ||||||||||
17. International activities
The Company engages in limited international activities including certain trust-related services in Europe, collecting Eurodollar deposits, engaging in foreign currency trading on behalf of customers, providing credit to support the international activities of domestic companies and holding certain loans to foreign borrowers. Assets and revenues associated with international activities represent less than 1% of the Company’s consolidated assets and revenues. International assets included $265 million and $213 million of loans to foreign borrowers at December 31, 2015 and 2014, respectively. Deposits at M&T Bank’s Cayman Islands office were $170 million and $177 million at December 31, 2015 and 2014, respectively. The Company uses such deposits to facilitate customer demand and as an alternative to short-term borrowings when the costs of such deposits seem reasonable. Revenues from providing international trust-related services were approximately $26 million in 2015, $31 million in 2014 and $26 million in 2013.
18. Derivative financial instruments
As part of managing interest rate risk, the Company enters into interest rate swap agreements to modify the repricing characteristics of certain portions of the Company’s portfolios of earning assets and interest-bearing liabilities. The Company designates interest rate swap agreements utilized in the management of interest rate risk as either fair value hedges or cash flow hedges. Interest rate swap agreements are generally entered into with counterparties that meet established credit standards and most contain master netting and collateral provisions protecting the at-risk party.
160
Table of Contents
Based on adherence to the Company’s credit standards and the presence of the netting and collateral provisions, the Company believes that the credit risk inherent in these contracts was not significant as of December 31, 2015.
The net effect of interest rate swap agreements was to increase net interest income by $44 million in 2015, $45 million in 2014 and $41 million in 2013. The average notional amounts of interest rate swap agreements impacting net interest income that were entered into for interest rate risk management purposes were $1.4 billion in each of 2015 and 2014, and $1.2 billion in 2013.
Information about interest rate swap agreements entered into for interest rate risk management purposes summarized by type of financial instrument the swap agreements were intended to hedge follows:
|
Notional
Amount |
Average
Maturity |
Weighted-Average
Rate |
Estimated Fair
Value Gain |
|||||||||||||||||
| Fixed | Variable | |||||||||||||||||||
| (In thousands) | (In years) | (In thousands) | ||||||||||||||||||
|
December 31, 2015 |
||||||||||||||||||||
|
Fair value hedges: |
||||||||||||||||||||
|
Fixed rate long-term borrowings(a) |
$ | 1,400,000 | 1.7 | 4.42 | % | 1.39 | % | $ | 43,892 | |||||||||||
|
|
|
|
|
|
|
|
|
|
|
|||||||||||
|
December 31, 2014 |
||||||||||||||||||||
|
Fair value hedges: |
||||||||||||||||||||
|
Fixed rate long-term borrowings(a) |
$ | 1,400,000 | 2.7 | 4.42 | % | 1.19 | % | $ | 73,251 | |||||||||||
|
|
|
|
|
|
|
|
|
|
|
|||||||||||
| (a) | Under the terms of these agreements, the Company receives settlement amounts at a fixed rate and pays at a variable rate. |
The notional amount of interest rate swap agreements entered into for risk management purposes that were outstanding at December 31, 2015 mature as follows:
| (In thousands) | ||||
|
Year ending December 31: |
||||
|
2016 |
$ | 500,000 | ||
|
2017 |
400,000 | |||
|
2018 |
500,000 | |||
|
|
|
|||
| $ | 1,400,000 | |||
|
|
|
|||
The Company utilizes commitments to sell residential and commercial real estate loans to hedge the exposure to changes in the fair value of real estate loans held for sale. Such commitments have generally been designated as fair value hedges. The Company also utilizes commitments to sell real estate loans to offset the exposure to changes in fair value of certain commitments to originate real estate loans for sale.
Derivative financial instruments used for trading account purposes included interest rate contracts, foreign exchange and other option contracts, foreign exchange forward and spot contracts, and financial futures. Interest rate contracts entered into for trading account purposes had notional values of $18.4 billion and $17.6 billion at December 31, 2015 and 2014, respectively. The notional amounts of foreign currency and other option and futures contracts entered into for trading account purposes aggregated $1.6 billion and $1.3 billion at December 31, 2015 and 2014, respectively.
161
Table of Contents
Information about the fair values of derivative instruments in the Company’s consolidated balance sheet and consolidated statement of income follows:
|
Asset Derivatives
Fair Value December 31 |
Liability Derivatives
Fair Value December 31 |
|||||||||||||||
| 2015 | 2014 | 2015 | 2014 | |||||||||||||
| (In thousands) | ||||||||||||||||
|
Derivatives designated and qualifying as hedging instruments |
||||||||||||||||
|
Fair value hedges: |
||||||||||||||||
|
Interest rate swap agreements(a) |
$ | 43,892 | $ | 73,251 | $ | — | $ | — | ||||||||
|
Commitments to sell real estate loans(a) |
1,844 | 728 | 656 | 4,217 | ||||||||||||
|
|
|
|
|
|
|
|
|
|||||||||
| 45,736 | 73,979 | 656 | 4,217 | |||||||||||||
|
Derivatives not designated and qualifying as hedging instruments |
||||||||||||||||
|
Mortgage-related commitments to originate real estate loans for sale(a) |
10,282 | 17,396 | 403 | 49 | ||||||||||||
|
Commitments to sell real estate loans(a) |
533 | 754 | 846 | 4,330 | ||||||||||||
|
Trading: |
||||||||||||||||
|
Interest rate contracts(b) |
203,517 | 215,614 | 153,723 | 173,513 | ||||||||||||
|
Foreign exchange and other option and futures contracts(b) |
8,569 | 31,112 | 7,022 | 29,950 | ||||||||||||
|
|
|
|
|
|
|
|
|
|||||||||
| 222,901 | 264,876 | 161,994 | 207,842 | |||||||||||||
|
|
|
|
|
|
|
|
|
|||||||||
|
Total derivatives |
$ | 268,637 | $ | 338,855 | $ | 162,650 | $ | 212,059 | ||||||||
|
|
|
|
|
|
|
|
|
|||||||||
| (a) | Asset derivatives are reported in other assets and liability derivatives are reported in other liabilities. |
| (b) | Asset derivatives are reported in trading account assets and liability derivatives are reported in other liabilities. |
| Amount of Gain (Loss) Recognized | ||||||||||||||||||||||||
|
Year Ended
December 31, 2015 |
Year Ended
December 31, 2014 |
Year Ended
December 31, 2013 |
||||||||||||||||||||||
| Derivative |
Hedged
Item |
Derivative |
Hedged
Item |
Derivative |
Hedged
Item |
|||||||||||||||||||
| (In thousands) | ||||||||||||||||||||||||
|
Derivatives in fair value hedging relationships |
||||||||||||||||||||||||
|
Interest rate swap agreements: |
||||||||||||||||||||||||
|
Fixed rate long-term borrowings(a) |
$ | (29,359 | ) | $ | 28,719 | $ | (29,624 | ) | $ | 28,870 | $ | (40,304 | ) | $ | 38,986 | |||||||||
|
|
|
|
|
|
|
|
|
|
|
|
|
|||||||||||||
|
Derivatives not designated as hedging instruments |
||||||||||||||||||||||||
|
Trading: |
||||||||||||||||||||||||
|
Interest rate contracts(b) |
$ | 10,755 | $ | 3,398 | $ | 9,824 | ||||||||||||||||||
|
Foreign exchange and other option and futures contracts(b) |
9,337 | 7,670 | 8,598 | |||||||||||||||||||||
|
|
|
|
|
|
|
|||||||||||||||||||
|
Total |
$ | 20,092 | $ | 11,068 | $ | 18,422 | ||||||||||||||||||
|
|
|
|
|
|
|
|||||||||||||||||||
| (a) | Reported as other revenues from operations. |
| (b) | Reported as trading account and foreign exchange gains. |
162
Table of Contents
In addition, the Company also has commitments to sell and commitments to originate residential and commercial real estate loans that are considered derivatives. The Company designates certain of the commitments to sell real estate loans as fair value hedges of real estate loans held for sale. The Company also utilizes commitments to sell real estate loans to offset the exposure to changes in the fair value of certain commitments to originate real estate loans for sale. As a result of these activities, net unrealized pre-tax gains related to hedged loans held for sale, commitments to originate loans for sale and commitments to sell loans were approximately $18 million and $28 million at December 31, 2015 and 2014, respectively. Changes in unrealized gains and losses are included in mortgage banking revenues and, in general, are realized in subsequent periods as the related loans are sold and commitments satisfied.
The Company does not offset derivative asset and liability positions in its consolidated financial statements. The Company’s exposure to credit risk by entering into derivative contracts is mitigated through master netting agreements and collateral posting requirements. Master netting agreements covering interest rate and foreign exchange contracts with the same party include a right to set-off that becomes enforceable in the event of default, early termination or under other specific conditions.
The aggregate fair value of derivative financial instruments in a liability position, which are subject to enforceable master netting arrangements, was $59 million and $161 million at December 31, 2015 and 2014, respectively. After consideration of such netting arrangements, the net liability positions with counterparties aggregated $55 million and $103 million at December 31, 2015 and 2014, respectively. The Company was required to post collateral relating to those positions of $52 million and $90 million at December 31, 2015 and 2014, respectively. Certain of the Company’s derivative financial instruments contain provisions that require the Company to maintain specific credit ratings from credit rating agencies to avoid higher collateral posting requirements. If the Company’s debt ratings were to fall below specified ratings, the counterparties to the derivative financial instruments could demand immediate incremental collateralization on those instruments in a net liability position. The aggregate fair value of all derivative financial instruments with such credit risk-related contingent features in a net liability position on December 31, 2015 was $13 million, for which the Company had posted collateral of $6 million in the normal course of business. If the credit risk-related contingent features had been triggered on December 31, 2015, the maximum amount of additional collateral the Company would have been required to post with counterparties was $7 million.
The aggregate fair value of derivative financial instruments in an asset position, which are subject to enforceable master netting arrangements, was $23 million and $104 million at December 31, 2015 and 2014, respectively. After consideration of such netting arrangements, the net asset positions with counterparties aggregated $19 million and $46 million at December 31, 2015 and 2014, respectively. Counterparties posted collateral relating to those positions of $22 million and $46 million at December 31, 2015 and 2014, respectively. Trading account interest rate swap agreements entered into with customers are subject to the Company’s credit risk standards and often contain collateral provisions.
In addition to the derivative contracts noted above, the Company clears certain derivative transactions through a clearinghouse, rather than directly with counterparties. Those transactions cleared through a clearinghouse require initial margin collateral and additional collateral for contracts in a net liability position. The net fair values of derivative instruments cleared through clearinghouses was a net liability position of $50 million and $35 million at December 31, 2015 and 2014, respectively. Collateral posted with clearinghouses was $99 million and $61 million at December 31, 2015 and December 31, 2014, respectively.
19. Variable interest entities and asset securitizations
During the years ended December 31, 2015 and 2014, the Company securitized one-to-four family residential real estate loans that had been originated for sale in guaranteed mortgage securitizations with Ginnie Mae totaling $65 million and $135 million, respectively, and retained those securities in its investment securities portfolio. Pre-tax gains on such transactions were not material. During 2013, the Company securitized approximately $3.0 billion of one-to-four family residential mortgage loans in guaranteed mortgage securitizations with Ginnie Mae. Approximately $1.3 billion of such loans were formerly held in the Company’s loan portfolio, whereas the remaining loans were newly
163
Table of Contents
originated. The Company recognized pre-tax gains of $42 million related to loans previously held for investment, which were recorded in “other revenues from operation,” and pre-tax gains of $28 million on newly originated loans, which were reflected in “mortgage banking revenues.” As a result of the securitization structures, the Company does not have effective control over the underlying loans and expects no material credit-related losses on the retained securities as a result of the guarantees by Ginnie Mae. Additionally, in 2013 the Company securitized and sold approximately $1.4 billion of automobile loans that had been held in its loan portfolio. The Company recognized a gain of $21 million related to the sale, which was recorded in “other revenues from operations.” The Company continues to service the automobile loans, but has no other financial interest in the securitization trust that the loans were sold into. The Company has securitized loans to improve its regulatory capital ratios and strengthen its liquidity and risk profile as a result of changing regulatory liquidity and capital requirements.
In accordance with GAAP, the Company determined that it was the primary beneficiary of a residential mortgage loan securitization trust considering its role as servicer and its retained subordinated interests in the trust. As a result, the Company has included the one-to-four family residential mortgage loans that were included in the trust in its consolidated financial statements. At December 31, 2015 and 2014, the carrying values of the loans in the securitization trust were $81 million and $98 million, respectively. The outstanding principal amount of mortgage-backed securities issued by the qualified special purpose trust that was held by parties unrelated to M&T at December 31, 2015 and 2014 was $13 million and $15 million, respectively. Because the transaction was non-recourse, the Company’s maximum exposure to loss as a result of its association with the trust at December 31, 2015 is limited to realizing the carrying value of the loans less the amount of the mortgage-backed securities held by third parties.
As described in note 9, M&T has issued junior subordinated debentures payable to various trusts that have issued Capital Securities. M&T owns the common securities of those trust entities. The Company is not considered to be the primary beneficiary of those entities and, accordingly, the trusts are not included in the Company’s consolidated financial statements. At December 31, 2015 and 2014, the Company included the junior subordinated debentures as “long-term borrowings” in its consolidated balance sheet and recognized $24 million and $34 million, respectively, in other assets for its “investment” in the common securities of the trusts that will be concomitantly repaid to M&T by the respective trust from the proceeds of M&T’s repayment of the junior subordinated debentures associated with preferred capital securities described in note 9.
The Company has invested as a limited partner in various partnerships that collectively had total assets of approximately $1.1 billion at December 31, 2015 and $1.2 billion at December 31, 2014. Those partnerships generally construct or acquire properties for which the investing partners are eligible to receive certain federal income tax credits in accordance with government guidelines. Such investments may also provide tax deductible losses to the partners. The partnership investments also assist the Company in achieving its community reinvestment initiatives. As a limited partner, there is no recourse to the Company by creditors of the partnerships. However, the tax credits that result from the Company’s investments in such partnerships are generally subject to recapture should a partnership fail to comply with the respective government regulations. The Company’s maximum exposure to loss of its investments in such partnerships was $295 million, including $78 million of unfunded commitments, at December 31, 2015 and $243 million, including $56 million of unfunded commitments, at December 31, 2014. Contingent commitments to provide additional capital contributions to these partnerships were not material at December 31, 2015. The Company has not provided financial or other support to the partnerships that was not contractually required. Management currently estimates that no material losses are probable as a result of the Company’s involvement with such entities. The Company, in its position as limited partner, does not direct the activities that most significantly impact the economic performance of the partnerships and, therefore, in accordance with the accounting provisions for variable interest entities, the partnership entities are not included in the Company’s consolidated financial statements.
As described in note 1, effective January 1, 2015 the Company retrospectively adopted for all periods presented amended accounting guidance on the accounting for investments in qualified affordable housing projects whereby the Company’s investment cost is amortized to income taxes in the consolidated statement of income as tax credits and other tax benefits resulting from deductible losses associated with the projects are received. The Company amortized $47 million, $53 million
164
Table of Contents
and $48 million of its investments in qualified affordable housing projects to income tax expense during 2015, 2014 and 2013, respectively, and recognized $62 million, $68 million and $66 million of federal tax credits and other federal tax benefits during those respective periods.
20. Fair value measurements
GAAP permits an entity to choose to measure eligible financial instruments and other items at fair value. The Company has not made any fair value elections at December 31, 2015.
Pursuant to GAAP, fair value is defined as the price that would be received to sell an asset or paid to transfer a liability in an orderly transaction between market participants at the measurement date. A three-level hierarchy exists in GAAP for fair value measurements based upon the inputs to the valuation of an asset or liability.
| • |
Level 1 — Valuation is based on quoted prices in active markets for identical assets and liabilities. |
| • |
Level 2 — Valuation is determined from quoted prices for similar assets or liabilities in active markets, quoted prices for identical or similar instruments in markets that are not active or by model-based techniques in which all significant inputs are observable in the market. |
| • |
Level 3 — Valuation is derived from model-based and other techniques in which at least one significant input is unobservable and which may be based on the Company’s own estimates about the assumptions that market participants would use to value the asset or liability. |
When available, the Company attempts to use quoted market prices in active markets to determine fair value and classifies such items as Level 1 or Level 2. If quoted market prices in active markets are not available, fair value is often determined using model-based techniques incorporating various assumptions including interest rates, prepayment speeds and credit losses. Assets and liabilities valued using model-based techniques are classified as either Level 2 or Level 3, depending on the lowest level classification of an input that is considered significant to the overall valuation. The following is a description of the valuation methodologies used for the Company’s assets and liabilities that are measured on a recurring basis at estimated fair value.
Trading account assets and liabilities
Trading account assets and liabilities consist primarily of interest rate swap agreements and foreign exchange contracts with customers who require such services with offsetting positions with third parties to minimize the Company’s risk with respect to such transactions. The Company generally determines the fair value of its derivative trading account assets and liabilities using externally developed pricing models based on market observable inputs and, therefore, classifies such valuations as Level 2. Mutual funds held in connection with deferred compensation and other arrangements have been classified as Level 1 valuations. Valuations of investments in municipal and other bonds can generally be obtained through reference to quoted prices in less active markets for the same or similar securities or through model-based techniques in which all significant inputs are observable and, therefore, such valuations have been classified as Level 2.
Investment securities available for sale
The majority of the Company’s available-for-sale investment securities have been valued by reference to prices for similar securities or through model-based techniques in which all significant inputs are observable and, therefore, such valuations have been classified as Level 2. Certain investments in mutual funds and equity securities are actively traded and, therefore, have been classified as Level 1 valuations.
Included in collateralized debt obligations are securities backed by trust preferred securities issued by financial institutions and other entities. The Company could not obtain pricing indications for many of these securities from its two primary independent pricing sources. The Company, therefore, performed internal modeling to estimate the cash flows and fair value of its portfolio of securities backed by trust preferred securities at December 31, 2015 and 2014. The modeling techniques included estimating cash flows using bond-specific assumptions about future collateral defaults and related loss severities. The resulting cash flows were then discounted by reference to market yields observed in the single-name trust preferred securities market. In determining a market yield applicable to the estimated cash flows, a margin over LIBOR, ranging from 4% to 10% with a
165
Table of Contents
weighted-average of 8% was used. Significant unobservable inputs used in the determination of estimated fair value of collateralized debt obligations are included in the accompanying table of significant unobservable inputs to Level 3 measurements. At December 31, 2015, the total amortized cost and fair value of securities backed by trust preferred securities issued by financial institutions and other entities were $28 million and $47 million, respectively, and at December 31, 2014 were $30 million and $50 million, respectively. Privately issued mortgage-backed securities and securities backed by trust preferred securities issued by financial institutions and other entities constituted all of the available-for-sale investment securities classified as Level 3 valuations.
The Company ensures an appropriate control framework is in place over the valuation processes and techniques used for significant Level 3 fair value measurements. Internal pricing models used for significant valuation measurements have generally been subjected to validation procedures including testing of mathematical constructs, review of valuation methodology and significant assumptions used.
Real estate loans held for sale
The Company utilizes commitments to sell real estate loans to hedge the exposure to changes in fair value of real estate loans held for sale. The carrying value of hedged real estate loans held for sale includes changes in estimated fair value during the hedge period. Typically, the Company attempts to hedge real estate loans held for sale from the date of close through the sale date. The fair value of hedged real estate loans held for sale is generally calculated by reference to quoted prices in secondary markets for commitments to sell real estate loans with similar characteristics and, accordingly, such loans have been classified as a Level 2 valuation.
Commitments to originate real estate loans for sale and commitments to sell real estate loans
The Company enters into various commitments to originate real estate loans for sale and commitments to sell real estate loans. Such commitments are considered to be derivative financial instruments and, therefore, are carried at estimated fair value on the consolidated balance sheet. The estimated fair values of such commitments were generally calculated by reference to quoted prices in secondary markets for commitments to sell real estate loans to certain government-sponsored entities and other parties. The fair valuations of commitments to sell real estate loans generally result in a Level 2 classification. The estimated fair value of commitments to originate real estate loans for sale are adjusted to reflect the Company’s anticipated commitment expirations. The estimated commitment expirations are considered significant unobservable inputs contributing to the Level 3 classification of commitments to originate real estate loans for sale. Significant unobservable inputs used in the determination of estimated fair value of commitments to originate real estate loans for sale are included in the accompanying table of significant unobservable inputs to Level 3 measurements.
Interest rate swap agreements used for interest rate risk management
The Company utilizes interest rate swap agreements as part of the management of interest rate risk to modify the repricing characteristics of certain portions of its portfolios of earning assets and interest-bearing liabilities. The Company generally determines the fair value of its interest rate swap agreements using externally developed pricing models based on market observable inputs and, therefore, classifies such valuations as Level 2. The Company has considered counterparty credit risk in the valuation of its interest rate swap agreement assets and has considered its own credit risk in the valuation of its interest rate swap agreement liabilities.
166
Table of Contents
The following tables present assets and liabilities at December 31, 2015 and 2014 measured at estimated fair value on a recurring basis:
|
Fair Value
Measurements at December 31, 2015 |
Level 1(a) | Level 2(a) | Level 3 | |||||||||||||
| (In thousands) | ||||||||||||||||
|
Trading account assets |
$ | 273,783 | $ | 56,763 | $ | 217,020 | $ | — | ||||||||
|
Investment securities available for sale: |
||||||||||||||||
|
U.S. Treasury and federal agencies |
299,997 | — | 299,997 | — | ||||||||||||
|
Obligations of states and political subdivisions |
6,028 | — | 6,028 | — | ||||||||||||
|
Mortgage-backed securities: |
||||||||||||||||
|
Government issued or guaranteed |
11,686,628 | — | 11,686,628 | — | ||||||||||||
|
Privately issued |
74 | — | — | 74 | ||||||||||||
|
Collateralized debt obligations |
47,393 | — | — | 47,393 | ||||||||||||
|
Other debt securities |
118,880 | — | 118,880 | — | ||||||||||||
|
Equity securities |
83,671 | 65,178 | 18,493 | — | ||||||||||||
|
|
|
|
|
|
|
|
|
|||||||||
| 12,242,671 | 65,178 | 12,130,026 | 47,467 | |||||||||||||
|
|
|
|
|
|
|
|
|
|||||||||
|
Real estate loans held for sale |
392,036 | — | 392,036 | — | ||||||||||||
|
Other assets(b) |
56,551 | — | 46,269 | 10,282 | ||||||||||||
|
|
|
|
|
|
|
|
|
|||||||||
|
Total assets |
$ | 12,965,041 | $ | 121,941 | $ | 12,785,351 | $ | 57,749 | ||||||||
|
|
|
|
|
|
|
|
|
|||||||||
|
Trading account liabilities |
$ | 160,745 | — | $ | 160,745 | $ | — | |||||||||
|
Other liabilities(b) |
1,905 | — | 1,502 | 403 | ||||||||||||
|
|
|
|
|
|
|
|
|
|||||||||
|
Total liabilities |
$ | 162,650 | — | $ | 162,247 | $ | 403 | |||||||||
|
|
|
|
|
|
|
|
|
|||||||||
|
Fair Value
Measurements at December 31, 2014 |
Level 1(a) | Level 2(a) | Level 3 | |||||||||||||
| (In thousands) | ||||||||||||||||
|
Trading account assets |
$ | 308,175 | $ | 51,416 | $ | 256,759 | $ | — | ||||||||
|
Investment securities available for sale: |
||||||||||||||||
|
U.S. Treasury and federal agencies |
161,947 | — | 161,947 | — | ||||||||||||
|
Obligations of states and political subdivisions |
8,198 | — | 8,198 | — | ||||||||||||
|
Mortgage-backed securities: |
||||||||||||||||
|
Government issued or guaranteed |
8,731,123 | — | 8,731,123 | — | ||||||||||||
|
Privately issued |
103 | — | — | 103 | ||||||||||||
|
Collateralized debt obligations |
50,316 | — | — | 50,316 | ||||||||||||
|
Other debt securities |
121,488 | — | 121,488 | — | ||||||||||||
|
Equity securities |
83,757 | 64,841 | 18,916 | — | ||||||||||||
|
|
|
|
|
|
|
|
|
|||||||||
| 9,156,932 | 64,841 | 9,041,672 | 50,419 | |||||||||||||
|
|
|
|
|
|
|
|
|
|||||||||
|
Real estate loans held for sale |
742,249 | — | 742,249 | — | ||||||||||||
|
Other assets(b) |
92,129 | — | 74,733 | 17,396 | ||||||||||||
|
|
|
|
|
|
|
|
|
|||||||||
|
Total assets |
$ | 10,299,485 | $ | 116,257 | $ | 10,115,413 | $ | 67,815 | ||||||||
|
|
|
|
|
|
|
|
|
|||||||||
|
Trading account liabilities |
$ | 203,464 | — | $ | 203,464 | $ | — | |||||||||
|
Other liabilities(b) |
8,596 | — | 8,547 | 49 | ||||||||||||
|
|
|
|
|
|
|
|
|
|||||||||
|
Total liabilities |
$ | 212,060 | — | $ | 212,011 | $ | 49 | |||||||||
|
|
|
|
|
|
|
|
|
|||||||||
167
Table of Contents
| (a) | There were no significant transfers between Level 1 and Level 2 of the fair value hierarchy during the years ended December 31, 2015 and 2014. |
| (b) | Comprised predominantly of interest rate swap agreements used for interest rate risk management (Level 2), commitments to sell real estate loans (Level 2) and commitments to originate real estate loans to be held for sale (Level 3). |
The changes in Level 3 assets and liabilities measured at estimated fair value on a recurring basis during the year ended December 31, 2015 were as follows:
| Investment Securities Available for Sale |
Other
Assets and Other Liabilities |
|||||||||||
|
Privately Issued
Mortgage- backed Securities |
Collateralized
Debt Obligations |
|||||||||||
| (In thousands) | ||||||||||||
|
Balance — January 1, 2015 |
$ | 103 | $ | 50,316 | $ | 17,347 | ||||||
|
Total gains realized/unrealized: |
||||||||||||
|
Included in earnings |
— | — | 87,061 | (b) | ||||||||
|
Included in other comprehensive income |
— | 3,254 | (c) | — | ||||||||
|
Settlements |
(29 | ) | (6,177 | ) | — | |||||||
|
Transfers in and/or out of Level 3(a) |
— | — | (94,529 | )(d) | ||||||||
|
|
|
|
|
|
|
|||||||
|
Balance — December 31, 2015 |
$ | 74 | $ | 47,393 | $ | 9,879 | ||||||
|
|
|
|
|
|
|
|||||||
|
Changes in unrealized gains included in earnings related to assets still held at December 31, 2015 |
$ | — | $ | — | $ | 8,850 | (b) | |||||
|
|
|
|
|
|
|
|||||||
The changes in Level 3 assets and liabilities measured at estimated fair value on a recurring basis during the year ended December 31, 2014 were as follows:
| Investment Securities Available for Sale |
Other
Assets and Other Liabilities |
|||||||||||
|
Privately Issued
Mortgage- backed Securities |
Collateralized
Debt Obligations |
|||||||||||
| (In thousands) | ||||||||||||
|
Balance — January 1, 2014 |
$ | 1,850 | $ | 63,083 | $ | 3,941 | ||||||
|
Total gains realized/unrealized: |
||||||||||||
|
Included in earnings |
— | — | 83,417 | (b) | ||||||||
|
Included in other comprehensive income |
271 | (c) | 8,209 | (c) | — | |||||||
|
Settlements |
(2,018 | ) | (20,976 | ) | — | |||||||
|
Transfers in and/or out of Level 3(a) |
— | — | (70,011 | )(d) | ||||||||
|
|
|
|
|
|
|
|||||||
|
Balance — December 31, 2014 |
$ | 103 | $ | 50,316 | $ | 17,347 | ||||||
|
|
|
|
|
|
|
|||||||
|
Changes in unrealized gains included in earnings related to assets still held at December 31, 2014 |
$ | — | $ | — | $ | 18,196 | (b) | |||||
|
|
|
|
|
|
|
|||||||
168
Table of Contents
The changes in Level 3 assets and liabilities measured at estimated fair value on a recurring basis during the year ended December 31, 2013 were as follows:
| Investment Securities Available for Sale |
Other
Assets and Other Liabilities |
|||||||||||
|
Privately Issued
Mortgage- backed Securities |
Collateralized
Debt Obligations |
|||||||||||
| (In thousands) | ||||||||||||
|
Balance — January 1, 2013 |
$ | 1,023,886 | $ | 61,869 | $ | 47,859 | ||||||
|
Total gains (losses) realized/unrealized: |
||||||||||||
|
Included in earnings |
(56,102 | )(e) | — | 97,845 | (b) | |||||||
|
Included in other comprehensive income |
116,359 | (c) | 4,508 | (c) | — | |||||||
|
Sales |
(978,608 | ) | — | — | ||||||||
|
Settlements |
(103,685 | ) | (3,294 | ) | — | |||||||
|
Transfers in and/or out of Level 3(a) |
— | — | (141,763 | )(d) | ||||||||
|
|
|
|
|
|
|
|||||||
|
Balance — December 31, 2013 |
$ | 1,850 | $ | 63,083 | $ | 3,941 | ||||||
|
|
|
|
|
|
|
|||||||
|
Changes in unrealized gains included in earnings related to assets still held at December 31, 2013 |
$ | — | $ | — | $ | 3,431 | (b) | |||||
|
|
|
|
|
|
|
|||||||
| (a) | The Company’s policy for transfers between fair value levels is to recognize the transfer as of the actual date of the event or change in circumstances that caused the transfer. |
| (b) | Reported as mortgage banking revenues in the consolidated statement of income and includes the fair value of commitment issuances and expirations. |
| (c) | Reported as net unrealized gains on investment securities in the consolidated statement of comprehensive income. |
| (d) | Transfers out of Level 3 consist of interest rate locks transferred to closed loans. |
| (e) | Reported as an OTTI impairment loss or as gain (loss) on bank investment securities in the consolidated statement of income. |
The Company is required, on a nonrecurring basis, to adjust the carrying value of certain assets or provide valuation allowances related to certain assets using fair value measurements. The more significant of those assets follow.
Loans
Loans are generally not recorded at fair value on a recurring basis. Periodically, the Company records nonrecurring adjustments to the carrying value of loans based on fair value measurements for partial charge-offs of the uncollectible portions of those loans. Nonrecurring adjustments also include certain impairment amounts for collateral-dependent loans when establishing the allowance for credit losses. Such amounts are generally based on the fair value of the underlying collateral supporting the loan and, as a result, the carrying value of the loan less the calculated valuation amount does not necessarily represent the fair value of the loan. Real estate collateral is typically valued using appraisals or other indications of value based on recent comparable sales of similar properties or assumptions generally observable in the marketplace and the related nonrecurring fair value measurement adjustments have generally been classified as Level 2, unless significant adjustments have been made to the valuation that are not readily observable by market participants. Non-real estate collateral supporting commercial loans generally consists of business assets such as receivables, inventory and equipment. Fair value estimations are typically determined by discounting recorded values of those assets to reflect estimated net realizable value considering specific borrower facts and circumstances and the experience of credit personnel in their dealings with similar borrower collateral liquidations. Such discounts were generally in the range of 10% to 90% at December 31, 2015. As these discounts are not readily observable and are considered significant, the valuations have been classified as Level 3. Loans subject to nonrecurring fair value measurement were $210 million at December 31, 2015, ($106 million and $104 million of which were classified as
169
Table of Contents
Level 2 and Level 3, respectively), $173 million at December 31, 2014 ($94 million and $79 million of which were classified as Level 2 and Level 3, respectively), and $222 million at December 31, 2013 ($173 million and $49 million of which were classified as Level 2 and Level 3, respectively). Changes in fair value recognized during the years ended December 31, 2015, 2014 and 2013 for partial charge-offs of loans and loan impairment reserves on loans held by the Company at the end of each of those years were decreases of $75 million, $55 million and $58 million, respectively.
Assets taken in foreclosure of defaulted loans
Assets taken in foreclosure of defaulted loans are primarily comprised of commercial and residential real property and are generally measured at the lower of cost or fair value less costs to sell. The fair value of the real property is generally determined using appraisals or other indications of value based on recent comparable sales of similar properties or assumptions generally observable in the marketplace, and the related nonrecurring fair value measurement adjustments have generally been classified as Level 2. Assets taken in foreclosure of defaulted loans subject to nonrecurring fair value measurement were $29 million and $19 million at December 31, 2015 and December 31, 2014, respectively. Changes in fair value recognized for those foreclosed assets held by the Company were not material during each of 2015, 2014 and 2013.
Significant unobservable inputs to level 3 measurements
The following tables present quantitative information about significant unobservable inputs used in the fair value measurements for Level 3 assets and liabilities at December 31, 2015 and 2014:
|
Fair Value at
December 31, 2015 |
Valuation Technique |
Unobservable Input/Assumptions |
Range
(Weighted- Average) |
|||||||
| (In thousands) | ||||||||||
|
Recurring fair value measurements: |
||||||||||
|
Privately issued mortgage– backed securities |
$ | 74 | Two independent pricing quotes | — | — | |||||
|
Collateralized debt obligations |
47,393 | Discounted cash flow | Probability of default | 10%-56% (31%) | ||||||
| Loss severity | 100% | |||||||||
|
Net other assets (liabilities)(a) |
9,879 | Discounted cash flow | Commitment expirations | 0%-60% (39%) | ||||||
|
Fair Value at
December 31, 2014 |
Valuation Technique |
Unobservable Input/Assumptions |
Range
(Weighted- Average) |
|||||||
| (In thousands) | ||||||||||
|
Recurring fair value measurements: |
||||||||||
|
Privately issued mortgage– backed securities |
$ | 103 | Two independent pricing quotes | — | — | |||||
|
Collateralized debt obligations |
50,316 | Discounted cash flow | Probability of default | 12%-57% (36%) | ||||||
| Loss severity | 100% | |||||||||
|
Net other assets (liabilities)(a) |
17,347 | Discounted cash flow | Commitment expirations | 0%-96% (17%) | ||||||
| (a) | Other Level 3 assets (liabilities) consist of commitments to originate real estate loans. |
Sensitivity of fair value measurements to changes in unobservable inputs
An increase (decrease) in the probability of default and loss severity for collateralized debt securities would generally result in a lower (higher) fair value measurement.
170
Table of Contents
An increase (decrease) in the estimate of expirations for commitments to originate real estate loans would generally result in a lower (higher) fair value measurement. Estimated commitment expirations are derived considering loan type, changes in interest rates and remaining length of time until closing.
Disclosures of fair value of financial instruments
The carrying amounts and estimated fair value for financial instrument assets (liabilities) are presented in the following table:
| December 31, 2015 | ||||||||||||||||||||
|
Carrying
Amount |
Estimated
Fair Value |
Level 1 | Level 2 | Level 3 | ||||||||||||||||
| (In thousands) | ||||||||||||||||||||
|
Financial assets: |
||||||||||||||||||||
|
Cash and cash equivalents |
$ | 1,368,040 | $ | 1,368,040 | $ | 1,276,678 | $ | 91,362 | $ | — | ||||||||||
|
Interest-bearing deposits at banks |
7,594,350 | 7,594,350 | — | 7,594,350 | — | |||||||||||||||
|
Trading account assets |
273,783 | 273,783 | 56,763 | 217,020 | — | |||||||||||||||
|
Investment securities |
15,656,439 | 15,660,877 | 65,178 | 15,406,404 | 189,295 | |||||||||||||||
|
Loans and leases: |
||||||||||||||||||||
|
Commercial loans and leases |
20,422,338 | 20,146,201 | — | — | 20,146,201 | |||||||||||||||
|
Commercial real estate loans |
29,197,311 | 29,044,244 | — | 38,774 | 29,005,470 | |||||||||||||||
|
Residential real estate loans |
26,270,103 | 26,267,771 | — | 4,727,816 | 21,539,955 | |||||||||||||||
|
Consumer loans |
11,599,747 | 11,550,270 | — | — | 11,550,270 | |||||||||||||||
|
Allowance for credit losses |
(955,992 | ) | — | — | — | — | ||||||||||||||
|
|
|
|
|
|
|
|
|
|
|
|||||||||||
|
Loans and leases, net |
86,533,507 | 87,008,486 | — | 4,766,590 | 82,241,896 | |||||||||||||||
|
Accrued interest receivable |
306,496 | 306,496 | — | 306,496 | — | |||||||||||||||
|
Financial liabilities: |
||||||||||||||||||||
|
Noninterest-bearing deposits |
$ | (29,110,635 | ) | $ | (29,110,635 | ) | — | $ | (29,110,635 | ) | — | |||||||||
|
Savings deposits and interest-checking accounts |
(49,566,644 | ) | (49,566,644 | ) | — | (49,566,644 | ) | — | ||||||||||||
|
Time deposits |
(13,110,392 | ) | (13,135,042 | ) | — | (13,135,042 | ) | — | ||||||||||||
|
Deposits at Cayman Islands office |
(170,170 | ) | (170,170 | ) | — | (170,170 | ) | — | ||||||||||||
|
Short-term borrowings |
(2,132,182 | ) | (2,132,182 | ) | — | (2,132,182 | ) | — | ||||||||||||
|
Long-term borrowings |
(10,653,858 | ) | (10,639,556 | ) | — | (10,639,556 | ) | — | ||||||||||||
|
Accrued interest payable |
(85,145 | ) | (85,145 | ) | — | (85,145 | ) | — | ||||||||||||
|
Trading account liabilities |
(160,745 | ) | (160,745 | ) | — | (160,745 | ) | — | ||||||||||||
|
Other financial instruments: |
||||||||||||||||||||
|
Commitments to originate real estate loans for sale |
$ | 9,879 | $ | 9,879 | — | $ | — | $ | 9,879 | |||||||||||
|
Commitments to sell real estate loans |
875 | 875 | — | 875 | — | |||||||||||||||
|
Other credit-related commitments |
(122,334 | ) | (122,334 | ) | — | — | (122,334 | ) | ||||||||||||
|
Interest rate swap agreements used for interest rate risk management |
43,892 | 43,892 | — | 43,892 | — | |||||||||||||||
171
Table of Contents
| December 31, 2014 | ||||||||||||||||||||
|
Carrying
Amount |
Estimated
Fair Value |
Level 1 | Level 2 | Level 3 | ||||||||||||||||
| (In thousands) | ||||||||||||||||||||
|
Financial assets: |
||||||||||||||||||||
|
Cash and cash equivalents |
$ | 1,373,357 | $ | 1,373,357 | $ | 1,296,923 | $ | 76,434 | $ | — | ||||||||||
|
Interest-bearing deposits at banks |
6,470,867 | 6,470,867 | — | 6,470,867 | — | |||||||||||||||
|
Trading account assets |
308,175 | 308,175 | 51,416 | 256,759 | — | |||||||||||||||
|
Investment securities |
12,993,542 | 13,023,956 | 64,841 | 12,750,396 | 208,719 | |||||||||||||||
|
Loans and leases: |
||||||||||||||||||||
|
Commercial loans and leases |
19,461,292 | 19,188,574 | — | — | 19,188,574 | |||||||||||||||
|
Commercial real estate loans |
27,567,569 | 27,487,818 | — | 307,667 | 27,180,151 | |||||||||||||||
|
Residential real estate loans |
8,657,301 | 8,729,056 | — | 5,189,086 | 3,539,970 | |||||||||||||||
|
Consumer loans |
10,982,794 | 10,909,623 | — | — | 10,909,623 | |||||||||||||||
|
Allowance for credit losses |
(919,562 | ) | — | — | — | — | ||||||||||||||
|
|
|
|
|
|
|
|
|
|
|
|||||||||||
|
Loans and leases, net |
65,749,394 | 66,315,071 | — | 5,496,753 | 60,818,318 | |||||||||||||||
|
Accrued interest receivable |
227,348 | 227,348 | — | 227,348 | — | |||||||||||||||
|
Financial liabilities: |
||||||||||||||||||||
|
Noninterest-bearing deposits |
$ | (26,947,880 | ) | $ | (26,947,880 | ) | — | $ | (26,947,880 | ) | — | |||||||||
|
Savings deposits and interest-checking accounts |
(43,393,618 | ) | (43,393,618 | ) | — | (43,393,618 | ) | — | ||||||||||||
|
Time deposits |
(3,063,973 | ) | (3,086,126 | ) | — | (3,086,126 | ) | — | ||||||||||||
|
Deposits at Cayman Islands office |
(176,582 | ) | (176,582 | ) | — | (176,582 | ) | — | ||||||||||||
|
Short-term borrowings |
(192,676 | ) | (192,676 | ) | — | (192,676 | ) | — | ||||||||||||
|
Long-term borrowings |
(9,006,959 | ) | (9,139,789 | ) | — | (9,139,789 | ) | — | ||||||||||||
|
Accrued interest payable |
(63,372 | ) | (63,372 | ) | — | (63,372 | ) | — | ||||||||||||
|
Trading account liabilities |
(203,464 | ) | (203,464 | ) | — | (203,464 | ) | — | ||||||||||||
|
Other financial instruments: |
||||||||||||||||||||
|
Commitments to originate real estate loans for sale |
$ | 17,347 | $ | 17,347 | — | $ | — | $ | 17,347 | |||||||||||
|
Commitments to sell real estate loans |
(7,065 | ) | (7,065 | ) | — | (7,065 | ) | — | ||||||||||||
|
Other credit-related commitments |
(119,079 | ) | (119,079 | ) | — | — | (119,079 | ) | ||||||||||||
|
Interest rate swap agreements used for interest rate risk management |
73,251 | 73,251 | — | 73,251 | — | |||||||||||||||
With the exception of marketable securities, certain off-balance sheet financial instruments and one-to-four family residential mortgage loans originated for sale, the Company’s financial instruments are not readily marketable and market prices do not exist. The Company, in attempting to comply with the provisions of GAAP that require disclosures of fair value of financial instruments, has not attempted to market its financial instruments to potential buyers, if any exist. Since negotiated prices in illiquid markets depend greatly upon the then present motivations of the buyer
172
Table of Contents
and seller, it is reasonable to assume that actual sales prices could vary widely from any estimate of fair value made without the benefit of negotiations. Additionally, changes in market interest rates can dramatically impact the value of financial instruments in a short period of time. The following assumptions, methods and calculations were used in determining the estimated fair value of financial instruments not measured at fair value in the consolidated balance sheet.
Cash and cash equivalents, interest-bearing deposits at banks, deposits at Cayman Islands office, short-term borrowings, accrued interest receivable and accrued interest payable
Due to the nature of cash and cash equivalents and the near maturity of interest-bearing deposits at banks, deposits at Cayman Islands office, short-term borrowings, accrued interest receivable and accrued interest payable, the Company estimated that the carrying amount of such instruments approximated estimated fair value.
Investment securities
Estimated fair values of investments in readily marketable securities were generally based on quoted market prices. Investment securities that were not readily marketable were assigned amounts based on estimates provided by outside parties or modeling techniques that relied upon discounted calculations of projected cash flows or, in the case of other investment securities, which include capital stock of the Federal Reserve Bank of New York and the Federal Home Loan Bank of New York, at an amount equal to the carrying amount.
Loans and leases
In general, discount rates used to calculate values for loan products were based on the Company’s pricing at the respective period end. A higher discount rate was assumed with respect to estimated cash flows associated with nonaccrual loans. Projected loan cash flows were adjusted for estimated credit losses. However, such estimates made by the Company may not be indicative of assumptions and adjustments that a purchaser of the Company’s loans and leases would seek.
Deposits
Pursuant to GAAP, the estimated fair value ascribed to noninterest-bearing deposits, savings deposits and interest-checking deposits must be established at carrying value because of the customers’ ability to withdraw funds immediately. Time deposit accounts are required to be revalued based upon prevailing market interest rates for similar maturity instruments. As a result, amounts assigned to time deposits were based on discounted cash flow calculations using prevailing market interest rates based on the Company’s pricing at the respective date for deposits with comparable remaining terms to maturity.
The Company believes that deposit accounts have a value greater than that prescribed by GAAP. The Company feels, however, that the value associated with these deposits is greatly influenced by characteristics of the buyer, such as the ability to reduce the costs of servicing the deposits and deposit attrition which often occurs following an acquisition.
Long-term borrowings
The amounts assigned to long-term borrowings were based on quoted market prices, when available, or were based on discounted cash flow calculations using prevailing market interest rates for borrowings of similar terms and credit risk.
Other commitments and contingencies
As described in note 21, in the normal course of business, various commitments and contingent liabilities are outstanding, such as loan commitments, credit guarantees and letters of credit. The Company’s pricing of such financial instruments is based largely on credit quality and relationship, probability of funding and other requirements. Loan commitments often have fixed expiration dates and contain termination and other clauses which provide for relief from funding in the event of significant deterioration in the credit quality of the customer. The rates and terms of the Company’s loan commitments, credit guarantees and letters of credit are competitive with other financial institutions operating in markets served by the Company. The Company believes that the carrying amounts, which are included in other liabilities, are reasonable estimates of the fair value of these financial instruments.
173
Table of Contents
The Company does not believe that the estimated information presented herein is representative of the earnings power or value of the Company. The preceding analysis, which is inherently limited in depicting fair value, also does not consider any value associated with existing customer relationships nor the ability of the Company to create value through loan origination, deposit gathering or fee generating activities.
Many of the estimates presented herein are based upon the use of highly subjective information and assumptions and, accordingly, the results may not be precise. Management believes that fair value estimates may not be comparable between financial institutions due to the wide range of permitted valuation techniques and numerous estimates which must be made. Furthermore, because the disclosed fair value amounts were estimated as of the balance sheet date, the amounts actually realized or paid upon maturity or settlement of the various financial instruments could be significantly different.
21. Commitments and contingencies
In the normal course of business, various commitments and contingent liabilities are outstanding. The following table presents the Company’s significant commitments. Certain of these commitments are not included in the Company’s consolidated balance sheet.
| December 31 | ||||||||
| 2015 | 2014 | |||||||
| (In thousands) | ||||||||
|
Commitments to extend credit |
||||||||
|
Home equity lines of credit |
$ | 5,631,680 | $ | 6,194,516 | ||||
|
Commercial real estate loans to be sold |
57,597 | 212,257 | ||||||
|
Other commercial real estate |
5,949,933 | 5,161,273 | ||||||
|
Residential real estate loans to be sold |
488,621 | 432,352 | ||||||
|
Other residential real estate |
212,619 | 197,825 | ||||||
|
Commercial and other |
11,802,850 | 11,080,856 | ||||||
|
Standby letters of credit |
3,330,013 | 3,706,888 | ||||||
|
Commercial letters of credit |
55,559 | 46,965 | ||||||
|
Financial guarantees and indemnification contracts |
2,794,322 | 2,490,050 | ||||||
|
Commitments to sell real estate loans |
782,885 | 1,237,294 | ||||||
Commitments to extend credit are agreements to lend to customers, generally having fixed expiration dates or other termination clauses that may require payment of a fee. Standby and commercial letters of credit are conditional commitments issued to guarantee the performance of a customer to a third party. Standby letters of credit generally are contingent upon the failure of the customer to perform according to the terms of the underlying contract with the third party, whereas commercial letters of credit are issued to facilitate commerce and typically result in the commitment being funded when the underlying transaction is consummated between the customer and a third party. The credit risk associated with commitments to extend credit and standby and commercial letters of credit is essentially the same as that involved with extending loans to customers and is subject to normal credit policies. Collateral may be obtained based on management’s assessment of the customer’s creditworthiness.
Financial guarantees and indemnification contracts are oftentimes similar to standby letters of credit and include mandatory purchase agreements issued to ensure that customer obligations are fulfilled, recourse obligations associated with sold loans, and other guarantees of customer performance or compliance with designated rules and regulations. Included in financial guarantees and indemnification contracts are loan principal amounts sold with recourse in conjunction with the Company’s involvement in the Fannie Mae DUS program. The Company’s maximum credit risk for recourse associated with loans sold under this program totaled approximately $2.5 billion and $2.4 billion at December 31, 2015 and 2014, respectively.
Since many loan commitments, standby letters of credit, and guarantees and indemnification contracts expire without being funded in whole or in part, the contract amounts are not necessarily indicative of future cash flows.
174
Table of Contents
The Company utilizes commitments to sell real estate loans to hedge exposure to changes in the fair value of real estate loans held for sale. Such commitments are considered derivatives and along with commitments to originate real estate loans to be held for sale are generally recorded in the consolidated balance sheet at estimated fair market value.
The Company occupies certain banking offices and uses certain equipment under noncancelable operating lease agreements expiring at various dates over the next 23 years. Minimum lease payments under noncancelable operating leases are summarized in the following table:
| (In thousands) | ||||
|
Year ending December 31: |
||||
|
2016 |
$ | 96,308 | ||
|
2017 |
93,926 | |||
|
2018 |
79,995 | |||
|
2019 |
64,819 | |||
|
2020 |
46,589 | |||
|
Later years |
110,533 | |||
|
|
|
|||
| $ | 492,170 | |||
|
|
|
|||
The Company is contractually obligated to repurchase previously sold residential real estate loans that do not ultimately meet investor sale criteria related to underwriting procedures or loan documentation. When required to do so, the Company may reimburse loan purchasers for losses incurred or may repurchase certain loans. The Company reduces residential mortgage banking revenues by an estimate for losses related to its obligations to loan purchasers. The amount of those charges is based on the volume of loans sold, the level of reimbursement requests received from loan purchasers and estimates of losses that may be associated with previously sold loans. Subject to the outcome of the matter discussed in the following paragraph, at December 31, 2015, management believes that any further liability arising out of the Company’s obligation to loan purchasers is not material to the Company’s consolidated financial position.
The Company is the subject of an investigation by government agencies relating to the origination of Federal Housing Administration (“FHA”) insured residential home loans and residential home loans sold to The Federal Home Loan Mortgage Corporation (“Freddie Mac”) and Fannie Mae. A number of other U.S. financial institutions have announced similar investigations. Regarding FHA loans, the U.S. Department of Housing and Urban Development (“HUD”) Office of Inspector General and the Department of Justice (collectively, the “Government”) are investigating whether the Company complied with underwriting guidelines concerning certain loans where HUD paid FHA insurance claims. The Company is fully cooperating with the investigation. The Government has advised the Company that based upon its review of a sample of loans for which an FHA insurance claim was paid by HUD, some of the loans do not meet underwriting guidelines. The Company, based on its own review of the sample, does not agree with the sampling methodology and loan analysis employed by the Government. Regarding loans originated by the Company and sold to Freddie Mac and Fannie Mae, the investigation concerns whether the mortgages sold to Freddie Mac and Fannie Mae comply with applicable underwriting guidelines. The Company is also cooperating with that portion of the investigation. The investigation could lead to claims by the Government under the False Claims Act and the Financial Institutions Reform, Recovery, and Enforcement Act of 1989, which allow treble and other special damages substantially in excess of actual losses. Remedies in these proceedings or settlements may include restitution, fines, penalties, or alterations in the Company’s business practices. The Company and the Government continue settlement discussions regarding the investigation and although progress has been made, the parties have not yet reached a definitive agreement. Based upon the current status of these negotiations, management expects that this potential settlement should not have a material impact on the Company’s consolidated financial condition or results of operations in future periods.
M&T and its subsidiaries are subject in the normal course of business to various pending and threatened legal proceedings and other matters in which claims for monetary damages are asserted.
175
Table of Contents
On an on-going basis management, after consultation with legal counsel, assesses the Company’s liabilities and contingencies in connection with such proceedings. For those matters where it is probable that the Company will incur losses and the amounts of the losses can be reasonably estimated, the Company records an expense and corresponding liability in its consolidated financial statements. To the extent the pending or threatened litigation could result in exposure in excess of that liability, the amount of such excess is not currently estimable. Although not considered probable, the range of reasonably possible losses for such matters in the aggregate, beyond the existing recorded liability, was between $0 and $40 million. Although the Company does not believe that the outcome of pending litigations will be material to the Company’s consolidated financial position, it cannot rule out the possibility that such outcomes will be material to the consolidated results of operations for a particular reporting period in the future.
22. Segment information
Reportable segments have been determined based upon the Company’s internal profitability reporting system, which is organized by strategic business unit. Certain strategic business units have been combined for segment information reporting purposes where the nature of the products and services, the type of customer and the distribution of those products and services are similar. The reportable segments are Business Banking, Commercial Banking, Commercial Real Estate, Discretionary Portfolio, Residential Mortgage Banking and Retail Banking.
The financial information of the Company’s segments was compiled utilizing the accounting policies described in note 1 with certain exceptions. The more significant of these exceptions are described herein. The Company allocates interest income or interest expense using a methodology that charges users of funds (assets) interest expense and credits providers of funds (liabilities) with income based on the maturity, prepayment and/or repricing characteristics of the assets and liabilities. The net effect of this allocation is recorded in the “All Other” category. A provision for credit losses is allocated to segments in an amount based largely on actual net charge-offs incurred by the segment during the period plus or minus an amount necessary to adjust the segment’s allowance for credit losses due to changes in loan balances. In contrast, the level of the consolidated provision for credit losses is determined using the methodologies described in notes 1 and 5. Indirect fixed and variable expenses incurred by certain centralized support areas are allocated to segments based on actual usage (for example, volume measurements) and other criteria. Certain types of administrative expenses and bankwide expense accruals (including amortization of core deposit and other intangible assets associated with acquisitions of financial institutions) are generally not allocated to segments. Income taxes are allocated to segments based on the Company’s marginal statutory tax rate adjusted for any tax-exempt income or non-deductible expenses. Equity is allocated to the segments based on regulatory capital requirements and in proportion to an assessment of the inherent risks associated with the business of the segment (including interest, credit and operating risk).
The management accounting policies and processes utilized in compiling segment financial information are highly subjective and, unlike financial accounting, are not based on authoritative guidance similar to GAAP. As a result, reported segment results are not necessarily comparable with similar information reported by other financial institutions. Furthermore, changes in management structure or allocation methodologies and procedures may result in changes in reported segment financial data. Effective January 1, 2015, the Company made certain changes to its methodology for measuring segment profit and loss. Those changes in the measurement of segment profitability were largely the result of updated funds transfer pricing and various cost allocation reviews. The most significant changes to the funds transfer pricing resulted from ascribing a longer duration to non-maturity deposits, which significantly benefitted the Retail Banking segment. The cost allocation review having the largest impact related to a branch cost study. That study consisted of transaction reviews and time studies which resulted in a higher cost allocation from the Retail Banking segment to the Business Banking segment. As described in note 1, effective January 1, 2015, the Company made an accounting policy election to account for its investments in qualified affordable housing projects using the proportional amortization method. That election resulted in the restatement of prior period financial statements to remove losses associated with qualified affordable housing projects from “other noninterest expense” and include the amortization of the initial cost of the investment in income tax expense. In 2015, the Company changed its internal profitability reporting
176
Table of Contents
to move a builder and developer lending unit from the Residential Mortgage Banking segment to the Commercial Real Estate segment. Accordingly, financial information presented herein for 2014 and 2013 has been restated to reflect those changes to provide segment information on a comparable basis, as noted in the following tables.
| Year ended December 31, 2014 | ||||||||||||
|
Net income (loss) as
previously reported |
Impact of
changes |
Net income (loss)
as restated |
||||||||||
| (in thousands) | ||||||||||||
|
Business Banking |
$ | 119,809 | $ | (20,539 | ) | $ | 99,270 | |||||
|
Commercial Banking |
411,139 | (8,211 | ) | 402,928 | ||||||||
|
Commercial Real Estate |
316,129 | (169 | ) | 315,960 | ||||||||
|
Discretionary Portfolio |
48,098 | 245 | 48,343 | |||||||||
|
Residential Mortgage Banking |
95,006 | (10,464 | ) | 84,542 | ||||||||
|
Retail Banking |
119,916 | 153,442 | 273,358 | |||||||||
|
All Other |
(43,851 | ) | (114,304 | ) | (158,155 | ) | ||||||
|
|
|
|
|
|
|
|||||||
|
Total |
$ | 1,066,246 | $ | — | $ | 1,066,246 | ||||||
|
|
|
|
|
|
|
|||||||
| Year ended December 31, 2013 | ||||||||||||
|
Net income (loss) as
previously reported |
Impact of
changes |
Net income (loss)
as restated |
||||||||||
| (in thousands) | ||||||||||||
|
Business Banking |
$ | 111,040 | $ | (9,975 | ) | $ | 101,065 | |||||
|
Commercial Banking |
391,340 | 16,053 | 407,393 | |||||||||
|
Commercial Real Estate |
321,793 | 7,493 | 329,286 | |||||||||
|
Discretionary Portfolio |
29,968 | 2,268 | 32,236 | |||||||||
|
Residential Mortgage Banking |
99,392 | (7,069 | ) | 92,323 | ||||||||
|
Retail Banking |
182,401 | 138,549 | 320,950 | |||||||||
|
All Other |
2,546 | (147,319 | ) | (144,773 | ) | |||||||
|
|
|
|
|
|
|
|||||||
|
Total |
$ | 1,138,480 | $ | — | $ | 1,138,480 | ||||||
|
|
|
|
|
|
|
|||||||
Information about the Company’s segments is presented in the accompanying table. Income statement amounts are in thousands of dollars. Balance sheet amounts are in millions of dollars.
| For the Years Ended December 31, 2015, 2014 and 2013 | ||||||||||||||||||||||||||||||||||||||||||||||||
| Business Banking | Commercial Banking | Commercial Real Estate | Discretionary Portfolio | |||||||||||||||||||||||||||||||||||||||||||||
| 2015 | 2014 | 2013 | 2015 | 2014 | 2013 | 2015 | 2014 | 2013 | 2015 | 2014 | 2013 | |||||||||||||||||||||||||||||||||||||
|
Net interest income(a) |
$ | 338,855 | $ | 345,773 | $ | 365,786 | $ | 753,604 | $ | 746,344 | $ | 785,987 | $ | 577,922 | $ | 555,358 | $ | 590,009 | $ | 86,083 | $ | 74,204 | $ | 69,020 | ||||||||||||||||||||||||
|
Noninterest income |
108,195 | 105,149 | 102,613 | 290,142 | 254,295 | 263,925 | 142,948 | 125,087 | 130,833 | 28,114 | 27,464 | (3,824 | ) | |||||||||||||||||||||||||||||||||||
|
|
|
|
|
|
|
|
|
|
|
|
|
|
|
|
|
|
|
|
|
|
|
|
|
|||||||||||||||||||||||||
| 447,050 | 450,922 | 468,399 | 1,043,746 | 1,000,639 | 1,049,912 | 720,870 | 680,445 | 720,842 | 114,197 | 101,668 | 65,196 | |||||||||||||||||||||||||||||||||||||
|
Provision for credit losses |
15,513 | 18,883 | 26,550 | 25,089 | 33,213 | 76,791 | (8,003 | ) | (7,339 | ) | 6,613 | 7,599 | 16,547 | 17,129 | ||||||||||||||||||||||||||||||||||
|
Amortization of core deposit and other intangible assets |
— | — | — | — | — | — | — | — | — | — | — | — | ||||||||||||||||||||||||||||||||||||
|
Depreciation and other amortization |
407 | 405 | 198 | 566 | 588 | 564 | 19,247 | 16,300 | 14,314 | 679 | 891 | 1,330 | ||||||||||||||||||||||||||||||||||||
|
Other noninterest expense |
264,163 | 263,734 | 270,759 | 288,303 | 284,091 | 289,582 | 169,688 | 169,039 | 173,345 | 49,839 | 33,522 | 27,313 | ||||||||||||||||||||||||||||||||||||
|
|
|
|
|
|
|
|
|
|
|
|
|
|
|
|
|
|
|
|
|
|
|
|
|
|||||||||||||||||||||||||
|
Income (loss) before taxes |
166,967 | 167,900 | 170,892 | 729,788 | 682,747 | 682,975 | 539,938 | 502,445 | 526,570 | 56,080 | 50,708 | 19,424 | ||||||||||||||||||||||||||||||||||||
|
Income tax expense (benefit) |
68,209 | 68,630 | 69,827 | 298,758 | 279,819 | 275,582 | 199,297 | 186,485 | 197,284 | 3,654 | 2,365 | (12,812 | ) | |||||||||||||||||||||||||||||||||||
|
|
|
|
|
|
|
|
|
|
|
|
|
|
|
|
|
|
|
|
|
|
|
|
|
|||||||||||||||||||||||||
|
Net income (loss) |
$ | 98,758 | $ | 99,270 | $ | 101,065 | $ | 431,030 | $ | 402,928 | $ | 407,393 | $ | 340,641 | $ | 315,960 | $ | 329,286 | $ | 52,426 | $ | 48,343 | $ | 32,236 | ||||||||||||||||||||||||
|
|
|
|
|
|
|
|
|
|
|
|
|
|
|
|
|
|
|
|
|
|
|
|
|
|||||||||||||||||||||||||
|
Average total assets (in millions) |
$ | 5,339 | $ | 5,278 | $ | 5,107 | $ | 24,143 | $ | 22,860 | $ | 21,710 | $ | 18,827 | $ | 17,405 | $ | 17,305 | $ | 26,648 | $ | 20,798 | $ | 16,630 | ||||||||||||||||||||||||
|
|
|
|
|
|
|
|
|
|
|
|
|
|
|
|
|
|
|
|
|
|
|
|
|
|||||||||||||||||||||||||
|
Capital expenditures (in millions) |
$ | — | $ | 2 | $ | 1 | $ | — | $ | — | $ | — | $ | — | $ | — | $ | — | $ | — | $ | — | $ | — | ||||||||||||||||||||||||
|
|
|
|
|
|
|
|
|
|
|
|
|
|
|
|
|
|
|
|
|
|
|
|
|
|||||||||||||||||||||||||
177
Table of Contents
| For the Years Ended December 31, 2015, 2014 and 2013 | ||||||||||||||||||||||||||||||||||||||||||||||||
|
Residential Mortgage
Banking |
Retail Banking | All Other | Total | |||||||||||||||||||||||||||||||||||||||||||||
| 2015 | 2014 | 2013 | 2015 | 2014 | 2013 | 2015 | 2014 | 2013 | 2015 | 2014 | 2013 | |||||||||||||||||||||||||||||||||||||
|
Net interest income(a) |
$ | 63,939 | $ | 67,482 | $ | 83,574 | $ | 917,041 | $ | 908,828 | $ | 962,214 | $ | 105,143 | $ | (21,543 | ) | $ | (183,361 | ) | $ | 2,842,587 | $ | 2,676,446 | $ | 2,673,229 | ||||||||||||||||||||||
|
Noninterest income |
336,099 | 331,366 | 325,454 | 324,953 | 336,042 | 373,628 | 594,586 | 599,870 | 672,576 | 1,825,037 | 1,779,273 | 1,865,205 | ||||||||||||||||||||||||||||||||||||
|
|
|
|
|
|
|
|
|
|
|
|
|
|
|
|
|
|
|
|
|
|
|
|
|
|||||||||||||||||||||||||
| 400,038 | 398,848 | 409,028 | 1,241,994 | 1,244,870 | 1,335,842 | 699,729 | 578,327 | 489,215 | 4,667,624 | 4,455,719 | 4,538,434 | |||||||||||||||||||||||||||||||||||||
|
Provision for credit losses |
(5,225 | ) | (1,508 | ) | (10,906 | ) | 72,953 | 77,158 | 72,502 | 62,074 | (12,954 | ) | (3,679 | ) | 170,000 | 124,000 | 185,000 | |||||||||||||||||||||||||||||||
|
Amortization of core deposit and other intangible assets |
— | — | — | — | — | — | 26,424 | 33,824 | 46,912 | 26,424 | 33,824 | 46,912 | ||||||||||||||||||||||||||||||||||||
|
Depreciation and other amortization |
27,883 | 47,086 | 48,698 | 35,291 | 37,788 | 34,599 | 64,852 | 61,848 | 57,120 | 148,925 | 164,906 | 156,823 | ||||||||||||||||||||||||||||||||||||
|
Other noninterest expense |
233,651 | 216,556 | 221,984 | 682,594 | 668,919 | 687,275 | 959,345 | 854,883 | 713,873 | 2,647,583 | 2,490,744 | 2,384,131 | ||||||||||||||||||||||||||||||||||||
|
|
|
|
|
|
|
|
|
|
|
|
|
|
|
|
|
|
|
|
|
|
|
|
|
|||||||||||||||||||||||||
|
Income (loss) before taxes |
143,729 | 136,714 | 149,252 | 451,156 | 461,005 | 541,466 | (412,966 | ) | (359,274 | ) | (325,011 | ) | 1,674,692 | 1,642,245 | 1,765,568 | |||||||||||||||||||||||||||||||||
|
Income tax expense (benefit) |
55,151 | 52,172 | 56,929 | 183,638 | 187,647 | 220,516 | (213,682 | ) | (201,119 | ) | (180,238 | ) | 595,025 | 575,999 | 627,088 | |||||||||||||||||||||||||||||||||
|
|
|
|
|
|
|
|
|
|
|
|
|
|
|
|
|
|
|
|
|
|
|
|
|
|||||||||||||||||||||||||
|
Net income (loss) |
$ | 88,578 | $ | 84,542 | $ | 92,323 | $ | 267,518 | $ | 273,358 | $ | 320,950 | $ | (199,284 | ) | $ | (158,155 | ) | $ | (144,773 | ) | $ | 1,079,667 | $ | 1,066,246 | $ | 1,138,480 | |||||||||||||||||||||
|
|
|
|
|
|
|
|
|
|
|
|
|
|
|
|
|
|
|
|
|
|
|
|
|
|||||||||||||||||||||||||
|
Average total assets (in millions) |
$ | 2,918 | $ | 3,076 | $ | 2,651 | $ | 11,035 | $ | 10,449 | $ | 10,997 | $ | 12,870 | $ | 12,277 | $ | 9,262 | $ | 101,780 | $ | 92,143 | $ | 83,662 | ||||||||||||||||||||||||
|
|
|
|
|
|
|
|
|
|
|
|
|
|
|
|
|
|
|
|
|
|
|
|
|
|||||||||||||||||||||||||
|
Capital expenditures (in millions) |
$ | — | $ | — | $ | — | $ | 14 | $ | 14 | $ | 40 | $ | 68 | $ | 57 | $ | 89 | $ | 82 | $ | 73 | $ | 130 | ||||||||||||||||||||||||
|
|
|
|
|
|
|
|
|
|
|
|
|
|
|
|
|
|
|
|
|
|
|
|
|
|||||||||||||||||||||||||
| (a) | Net interest income is the difference between actual taxable-equivalent interest earned on assets and interest paid on liabilities by a segment and a funding charge (credit) based on the Company’s internal funds transfer pricing methodology. Segments are charged a cost to fund any assets (e.g. loans) and are paid a funding credit for any funds provided (e.g. deposits). The taxable-equivalent adjustment aggregated $24,463,000 in 2015, $23,642,000 in 2014 and $24,971,000 in 2013 and is eliminated in “All Other” net interest income and income tax expense (benefit). |
178
Table of Contents
The Business Banking segment provides deposit, lending, cash management and other financial services to small businesses and professionals through the Company’s banking office network and several other delivery channels, including business banking centers, telephone banking, Internet banking and automated teller machines. The Commercial Banking segment provides a wide range of credit products and banking services to middle-market and large commercial customers, mainly within the markets the Company serves. Among the services provided by this segment are commercial lending and leasing, letters of credit, deposit products and cash management services. The Commercial Real Estate segment provides credit services which are secured by various types of multifamily residential and commercial real estate and deposit services to its customers. Activities of this segment include the origination, sales and servicing of commercial real estate loans. The Discretionary Portfolio segment includes securities; residential real estate loans and other assets; short-term and long-term borrowed funds; brokered deposits; and Cayman Islands branch deposits. This segment also provides foreign exchange services to customers. Residential real estate loans obtained in the Hudson City acquisition on November 1, 2015 have been included in this segment. The Residential Mortgage Banking segment originates and services residential real estate loans for consumers and sells substantially all of those loans in the secondary market to investors or to the Discretionary Portfolio segment. The segment periodically purchases servicing rights to loans that have been originated by other entities. Residential real estate loans held for sale are included in the Residential Mortgage Banking segment. The Retail Banking segment offers a variety of services to consumers through several delivery channels that include banking offices, automated teller machines, telephone banking and Internet banking. Consumer loans and deposits obtained in the acquisition of Hudson City have been included in this segment. The “All Other” category includes other operating activities of the Company that are not directly attributable to the reported segments; the difference between the provision for credit losses and the calculated provision allocated to the reportable segments; goodwill and core deposit and other intangible assets resulting from acquisitions of financial institutions; merger-related gains and expenses resulting from acquisitions; the net impact of the Company’s internal funds transfer pricing methodology; eliminations of transactions between reportable segments; certain nonrecurring transactions; the residual effects of unallocated support systems and general and administrative expenses; and the impact of interest rate risk management strategies. The amount of intersegment activity eliminated in arriving at consolidated totals was included in the “All Other” category as follows:
| Year Ended December 31 | ||||||||||||
| 2015 | 2014 | 2013 | ||||||||||
| (In thousands) | ||||||||||||
|
Revenues |
$ | (48,972 | ) | $ | (49,800 | ) | $ | (50,128 | ) | |||
|
Expenses |
(13,332 | ) | (12,014 | ) | (16,235 | ) | ||||||
|
Income taxes (benefit) |
(14,503 | ) | (15,375 | ) | (13,791 | ) | ||||||
|
Net income (loss) |
(21,137 | ) | (22,411 | ) | (20,102 | ) | ||||||
The Company conducts substantially all of its operations in the United States. There are no transactions with a single customer that in the aggregate result in revenues that exceed ten percent of consolidated total revenues.
23. Regulatory matters
Payment of dividends by M&T’s banking subsidiaries is restricted by various legal and regulatory limitations. Dividends from any banking subsidiary to M&T are limited by the amount of earnings of the banking subsidiary in the current year and the preceding two years. For purposes of this test, at December 31, 2015, approximately $1.7 billion was available for payment of dividends to M&T from banking subsidiaries. Additionally, the Federal Reserve Board requires bank holding companies with $50 billion or more of total consolidated assets to submit annual capital plans. Such bank holding companies may pay dividends and repurchase stock only in accordance with a capital plan that the Federal Reserve Board has not objected to.
Banking regulations prohibit extensions of credit by the subsidiary banks to M&T unless appropriately secured by assets. Securities of affiliates are not eligible as collateral for this purpose.
179
Table of Contents
The bank subsidiaries are required to maintain reserves against certain deposit liabilities. During the maintenance periods that included December 31, 2015 and 2014, cash and due from banks and interest-earning deposits at banks included a daily average of $664,586,000 and $555,575,000, respectively, for such purpose.
Beginning in 2015 new regulatory capital rules applicable to bank holding companies and banks became effective. Failure to meet minimum capital requirements can result in certain mandatory, and possibly additional discretionary, actions by regulators that, if undertaken, could have a material effect on the Company’s financial statements. Pursuant to the rules in effect as of December 31, 2015, the required minimum and well capitalized capital ratios are as follows:
| Minimum | Well capitalized | |||||||
|
● Common equity Tier 1 to risk-weighted assets |
4.5 | % | 6.5 | % | ||||
|
● Tier 1 capital to risk-weighted assets |
6.0 | % | 8.0 | % | ||||
|
● Total capital to risk-weighted assets |
8.0 | % | 10.0 | % | ||||
|
● Leverage — Tier 1 capital to average total assets, as defined |
4.0 | % | 5.0 | % | ||||
Under the previous capital adequacy guidelines, Tier 1 capital and Total capital as a percentage of risk-weighted assets were required to be at least 4% and 8%, respectively. In addition, the required leverage ratio of Tier 1 capital to average total assets was 4%. At December 31, 2014, to be considered “well capitalized,” a banking institution had to maintain Tier 1 risk-based capital, total risk-based capital and leverage ratios at least 6%, 10% and 5%, respectively. As of December 31, 2015, M&T and each of its banking subsidiaries exceeded all applicable capital adequacy requirements.
180
Table of Contents
The capital ratios and amounts of the Company and its banking subsidiaries as of December 31, 2015 and 2014 are presented below:
|
M&T
(Consolidated) |
M&T Bank |
Wilmington
Trust, N.A. |
||||||||||
| (Dollars in thousands) | ||||||||||||
|
December 31, 2015: |
||||||||||||
|
Common equity Tier 1 capital |
||||||||||||
|
Amount |
$ | 10,485,426 | $ | 10,680,827 | $ | 476,106 | ||||||
|
Ratio(a) |
11.08 | % | 11.33 | % | 86.87 | % | ||||||
|
Minimum required amount(b) |
4,259,977 | 4,242,817 | 24,664 | |||||||||
|
Tier 1 capital |
||||||||||||
|
Amount |
12,008,232 | 10,680,827 | 476,106 | |||||||||
|
Ratio(a) |
12.68 | % | 11.33 | % | 86.87 | % | ||||||
|
Minimum required amount(b) |
5,679,969 | 5,657,089 | 32,886 | |||||||||
|
Total capital |
||||||||||||
|
Amount |
14,128,454 | 12,589,917 | 480,415 | |||||||||
|
Ratio(a) |
14.92 | % | 13.35 | % | 87.65 | % | ||||||
|
Minimum required amount(b) |
7,573,292 | 7,542,786 | 43,848 | |||||||||
|
Leverage |
||||||||||||
|
Amount |
12,008,232 | 10,680,827 | 476,106 | |||||||||
|
Ratio(c) |
10.89 | % | 9.75 | % | 22.38 | % | ||||||
|
Minimum required amount(b) |
4,408,971 | 4,381,617 | 85,082 | |||||||||
|
December 31, 2014: |
||||||||||||
|
Tier 1 capital |
||||||||||||
|
Amount |
$ | 9,644,765 | $ | 8,043,185 | $ | 435,558 | ||||||
|
Ratio(a) |
12.47 | % | 10.46 | % | 57.22 | % | ||||||
|
Minimum required amount(b) |
3,093,874 | 3,077,101 | 30,447 | |||||||||
|
Total capital |
||||||||||||
|
Amount |
11,767,308 | 10,048,277 | 439,867 | |||||||||
|
Ratio(a) |
15.21 | % | 13.06 | % | 57.79 | % | ||||||
|
Minimum required amount(b) |
6,187,747 | 6,154,201 | 60,893 | |||||||||
|
Leverage |
||||||||||||
|
Amount |
9,644,765 | 8,043,185 | 435,558 | |||||||||
|
Ratio(c) |
10.17 | % | 8.56 | % | 9.98 | % | ||||||
|
Minimum required amount(b) |
3,793,836 | 3,760,364 | 174,613 | |||||||||
| (a) | The ratio of capital to risk-weighted assets, as defined by regulation. |
| (b) | Minimum amount of capital to be considered adequately capitalized, as defined by regulation. |
| (c) | The ratio of capital to average assets, as defined by regulation. |
24. Relationship with Bayview Lending Group LLC and Bayview Financial Holdings, L.P.
M&T holds a 20% minority interest in Bayview Lending Group LLC (“BLG”), a privately-held commercial mortgage company. M&T recognizes income or loss from BLG using the equity method of accounting. The carrying value of that investment was $30 million at December 31, 2015.
Bayview Financial Holdings, L.P. (together with its affiliates, “Bayview Financial”), a privately-held specialty mortgage finance company, is BLG’s majority investor. In addition to their common investment in BLG, the Company and Bayview Financial conduct other business activities with each other. The Company has obtained loan servicing rights for mortgage loans from BLG and Bayview Financial having outstanding principal balances of $4.1 billion and $4.8 billion at
181
Table of Contents
December 31, 2015 and 2014, respectively. Revenues from those servicing rights were $23 million, $26 million and $31 million during 2015, 2014 and 2013, respectively. The Company sub-services residential real estate loans for Bayview Financial having outstanding principal balances totaling $37.7 billion and $41.3 billion at December 31, 2015 and 2014, respectively. Revenues earned for sub-servicing loans for Bayview Financial were $115 million in each of 2015 and 2014 and $33 million in 2013. In addition, the Company held $181 million and $202 million of mortgage-backed securities in its held-to-maturity portfolio at December 31, 2015 and 2014, respectively, that were securitized by Bayview Financial.
25. Parent company financial statements
Condensed Balance Sheet
| December 31 | ||||||||
| 2015 | 2014 | |||||||
| (In thousands) | ||||||||
|
Assets |
||||||||
|
Cash in subsidiary bank |
$ | 19,874 | $ | 11,306 | ||||
|
Due from consolidated bank subsidiaries |
||||||||
|
Money-market savings |
865,274 | 1,096,533 | ||||||
|
Current income tax receivable |
572 | — | ||||||
|
Other |
10 | 12 | ||||||
|
|
|
|
|
|||||
|
Total due from consolidated bank subsidiaries |
865,856 | 1,096,545 | ||||||
|
Investments in consolidated subsidiaries |
||||||||
|
Banks and bank holding company |
15,714,937 | 11,945,516 | ||||||
|
Other |
16,172 | 16,217 | ||||||
|
Investments in unconsolidated subsidiaries (note 19) |
23,824 | 33,578 | ||||||
|
Investment in Bayview Lending Group LLC |
30,264 | 46,716 | ||||||
|
Other assets |
73,147 | 81,034 | ||||||
|
|
|
|
|
|||||
|
Total assets |
$ | 16,744,074 | $ | 13,230,912 | ||||
|
|
|
|
|
|||||
|
Liabilities |
||||||||
|
Accrued expenses and other liabilities |
$ | 56,796 | $ | 59,950 | ||||
|
Long-term borrowings |
513,989 | 835,066 | ||||||
|
|
|
|
|
|||||
|
Total liabilities |
570,785 | 895,016 | ||||||
|
Shareholders’ equity |
16,173,289 | 12,335,896 | ||||||
|
|
|
|
|
|||||
|
Total liabilities and shareholders’ equity |
$ | 16,744,074 | $ | 13,230,912 | ||||
|
|
|
|
|
|||||
182
Table of Contents
Condensed Statement of Income
| Year Ended December 31 | ||||||||||||
| 2015 | 2014 | 2013 | ||||||||||
| (In thousands, except per share) | ||||||||||||
|
Income |
||||||||||||
|
Dividends from consolidated bank subsidiaries |
$ | 480,000 | $ | 480,000 | $ | 700,000 | ||||||
|
Equity in earnings of Bayview Lending Group LLC |
(14,267 | ) | (16,672 | ) | (16,126 | ) | ||||||
|
Other income |
2,364 | 7,755 | 9,992 | |||||||||
|
|
|
|
|
|
|
|||||||
|
Total income |
468,097 | 471,083 | 693,866 | |||||||||
|
|
|
|
|
|
|
|||||||
|
Expense |
||||||||||||
|
Interest on long-term borrowings |
24,453 | 47,700 | 73,115 | |||||||||
|
Other expense |
16,793 | 15,107 | 15,994 | |||||||||
|
|
|
|
|
|
|
|||||||
|
Total expense |
41,246 | 62,807 | 89,109 | |||||||||
|
|
|
|
|
|
|
|||||||
|
Income before income taxes and equity in undistributed income of subsidiaries |
426,851 | 408,276 | 604,757 | |||||||||
|
Income tax credits |
19,965 | 27,284 | 35,986 | |||||||||
|
|
|
|
|
|
|
|||||||
|
Income before equity in undistributed income of subsidiaries |
446,816 | 435,560 | 640,743 | |||||||||
|
|
|
|
|
|
|
|||||||
|
Equity in undistributed income of subsidiaries |
||||||||||||
|
Net income of subsidiaries |
1,112,851 | 1,110,686 | 1,197,737 | |||||||||
|
Less: dividends received |
(480,000 | ) | (480,000 | ) | (700,000 | ) | ||||||
|
|
|
|
|
|
|
|||||||
|
Equity in undistributed income of subsidiaries |
632,851 | 630,686 | 497,737 | |||||||||
|
|
|
|
|
|
|
|||||||
|
Net income |
$ | 1,079,667 | $ | 1,066,246 | $ | 1,138,480 | ||||||
|
|
|
|
|
|
|
|||||||
|
Net income per common share |
||||||||||||
|
Basic |
$ | 7.22 | $ | 7.47 | $ | 8.26 | ||||||
|
Diluted |
7.18 | 7.42 | 8.20 | |||||||||
183
Table of Contents
Condensed Statement of Cash Flows
| Year Ended December 31 | ||||||||||||
| 2015 | 2014 | 2013 | ||||||||||
| (In thousands) | ||||||||||||
|
Cash flows from operating activities |
||||||||||||
|
Net income |
$ | 1,079,667 | $ | 1,066,246 | $ | 1,138,480 | ||||||
|
Adjustments to reconcile net income to net cash provided by operating activities |
||||||||||||
|
Equity in undistributed income of subsidiaries |
(632,851 | ) | (630,686 | ) | (497,737 | ) | ||||||
|
Provision for deferred income taxes |
(3,655 | ) | (6,522 | ) | 1,535 | |||||||
|
Net change in accrued income and expense |
21,780 | 23,419 | 31,979 | |||||||||
|
Loss on sale of assets |
119 | — | — | |||||||||
|
|
|
|
|
|
|
|||||||
|
Net cash provided by operating activities |
465,060 | 452,457 | 674,257 | |||||||||
|
|
|
|
|
|
|
|||||||
|
Cash flows from investing activities |
||||||||||||
|
Proceeds from sales of investment securities |
755 | — | — | |||||||||
|
Investment in subsidiary |
— | — | (140,000 | ) | ||||||||
|
Other, net |
14,038 | 10,721 | 3,295 | |||||||||
|
|
|
|
|
|
|
|||||||
|
Net cash provided (used) by investing activities |
14,793 | 10,721 | (136,705 | ) | ||||||||
|
|
|
|
|
|
|
|||||||
|
Cash flows from financing activities |
||||||||||||
|
Payments on long-term borrowings |
(322,621 | ) | (350,010 | ) | — | |||||||
|
Dividends paid — common |
(375,017 | ) | (371,199 | ) | (365,349 | ) | ||||||
|
Dividends paid — preferred |
(81,270 | ) | (70,234 | ) | (53,450 | ) | ||||||
|
Proceeds from issuance of preferred stock |
— | 346,500 | — | |||||||||
|
Other, net |
76,364 | 110,601 | 140,799 | |||||||||
|
|
|
|
|
|
|
|||||||
|
Net cash used by financing activities |
(702,544 | ) | (334,342 | ) | (278,000 | ) | ||||||
|
|
|
|
|
|
|
|||||||
|
Net increase (decrease) in cash and cash equivalents |
(222,691 | ) | 128,836 | 259,552 | ||||||||
|
Cash and cash equivalents at beginning of year |
1,107,839 | 979,003 | 719,451 | |||||||||
|
|
|
|
|
|
|
|||||||
|
Cash and cash equivalents at end of year |
$ | 885,148 | $ | 1,107,839 | $ | 979,003 | ||||||
|
|
|
|
|
|
|
|||||||
|
Supplemental disclosure of cash flow information |
||||||||||||
|
Interest received during the year |
$ | 1,905 | $ | 2,094 | $ | 2,224 | ||||||
|
Interest paid during the year |
30,420 | 47,003 | 71,090 | |||||||||
|
Income taxes received during the year |
16,696 | 24,588 | 45,237 | |||||||||
184
Table of Contents
| Item 9. | Changes in and Disagreements with Accountants on Accounting and Financial Disclosure. |
None.
| Item 9A. | Controls and Procedures. |
(a) Evaluation of disclosure controls and procedures. Based upon their evaluation of the effectiveness of M&T’s disclosure controls and procedures (as defined in Exchange Act rules 13a-15(e) and 15d-15(e)), Robert G. Wilmers, Chairman of the Board and Chief Executive Officer, and René F. Jones, Executive Vice President and Chief Financial Officer, concluded that M&T’s disclosure controls and procedures were effective as of December 31, 2015.
(b) Management’s annual report on internal control over financial reporting. Included under the heading “Report on Internal Control Over Financial Reporting” at Item 8 of this Annual Report on Form 10-K.
(c) Attestation report of the registered public accounting firm. Included under the heading “Report of Independent Registered Public Accounting Firm” at Item 8 of this Annual Report on Form 10-K.
(d) Changes in internal control over financial reporting. M&T regularly assesses the adequacy of its internal control over financial reporting and enhances its controls in response to internal control assessments and internal and external audit and regulatory recommendations. No changes in internal control over financial reporting have been identified in connection with the evaluation of disclosure controls and procedures during the quarter ended December 31, 2015 that have materially affected, or are reasonably likely to materially affect, M&T’s internal control over financial reporting.
| Item 9B. | Other Information. |
None.
| Item 10. | Directors, Executive Officers and Corporate Governance. |
The identification of the Registrant’s directors is incorporated by reference to the caption “NOMINEES FOR DIRECTOR” contained in the Registrant’s definitive Proxy Statement for its 2016 Annual Meeting of Shareholders, which will be filed with the Securities and Exchange Commission on or about March 4, 2016.
The identification of the Registrant’s executive officers is presented under the caption “Executive Officers of the Registrant” contained in Part I of this Annual Report on Form 10-K.
Disclosure of compliance with Section 16(a) of the Securities Exchange Act of 1934, as amended, by the Registrant’s directors and executive officers, and persons who are the beneficial owners of more than 10% of the Registrant’s common stock, is incorporated by reference to the caption “Section 16(a) Beneficial Ownership Reporting Compliance” contained in the Registrant’s definitive Proxy Statement for its 2016 Annual Meeting of Shareholders which will be filed with the Securities and Exchange Commission on or about March 4, 2016.
The other information required by Item 10 is incorporated by reference to the captions “CORPORATE GOVERNANCE OF M&T BANK CORPORATION” and “STOCK OWNERSHIP INFORMATION” contained in the Registrant’s definitive Proxy Statement for its 2016 Annual Meeting of Shareholders, which will be filed with the Securities and Exchange Commission on or about March 4, 2016.
| Item 11. | Executive Compensation. |
Incorporated by reference to the captions “DIRECTOR COMPENSATION,” “NOMINATION, COMPENSATION AND GOVERNANCE COMMITTEE INTERLOCKS AND INSIDER PARTICIPATION,” “NOMINATION, COMPENSATION AND GOVERNANCE COMMITTEE REPORT” AND “EXECUTIVE COMPENSATION” contained in the Registrant’s definitive Proxy Statement for its 2016 Annual Meeting of Shareholders, which will be filed with the Securities and Exchange Commission on or about March 4, 2016.
185
Table of Contents
| Item 12. | Security Ownership of Certain Beneficial Owners and Management and Related Stockholder Matters. |
Incorporated by reference to the caption “STOCK OWNERSHIP INFORMATION” contained in the Registrant’s definitive Proxy Statement for its 2016 Annual Meeting of Shareholders, which will be filed with the Securities and Exchange Commission on or about March 4, 2016.
The information required by this item concerning Equity Compensation Plan information is filed as part of this Annual Report on Form 10-K. See Part II, Item 5. “Market for Registrant’s Common Equity, Related Stockholder Matters and Issuer Purchases of Equity Securities.”
| Item 13. | Certain Relationships and Related Transactions, and Director Independence. |
Incorporated by reference to the captions “TRANSACTIONS WITH DIRECTORS AND EXECUTIVE OFFICERS” and “CORPORATE GOVERNANCE OF M&T BANK CORPORATION” contained in the Registrant’s definitive Proxy Statement for its 2016 Annual Meeting of Shareholders, which will be filed with the Securities and Exchange Commission on or about March 4, 2016.
| Item 14. | Principal Accountant Fees and Services. |
Incorporated by reference to the caption “PROPOSAL TO RATIFY THE APPOINTMENT OF PRICEWATERHOUSECOOPERS LLP AS THE INDEPENDENT REGISTERED PUBLIC ACCOUNTING FIRM OF M&T BANK CORPORATION FOR THE YEAR ENDING DECEMBER 31, 2016” contained in the Registrant’s definitive Proxy Statement for its 2016 Annual Meeting of Shareholders, which will be filed with the Securities and Exchange Commission on or about March 4, 2016.
| Item 15. | Exhibits and Financial Statement Schedules. |
(a) Financial statements and financial statement schedules filed as part of this Annual Report on Form 10-K. See Part II, Item 8. “Financial Statements and Supplementary Data.” Financial statement schedules are not required or are inapplicable, and therefore have been omitted.
(b) Exhibits required by Item 601 of Regulation S-K. The exhibits listed on the Exhibit Index of this Annual Report on Form 10-K have been previously filed, are filed herewith or are incorporated herein by reference to other filings.
(c) Additional financial statement schedules. None.
186
Table of Contents
Pursuant to the requirements of Section 13 or 15(d) of the Securities Exchange Act of 1934, the Registrant has duly caused this report to be signed on its behalf by the undersigned, thereunto duly authorized, on the 19th day of February, 2016.
| M&T BANK CORPORATION | ||
| By: |
/ S / R OBERT G. W ILMERS |
|
|
Robert G. Wilmers Chairman of the Board and Chief Executive Officer |
||
Pursuant to the requirements of the Securities Exchange Act of 1934, this report has been signed below by the following persons on behalf of the Registrant and in the capacities and on the dates indicated.
|
Signature |
Title |
Date |
||
| Principal Executive Officer: | ||||
|
/ S / R OBERT G. W ILMERS Robert G. Wilmers |
Chairman of the Board and Chief Executive Officer |
February 19, 2016 | ||
| Principal Financial Officer: | ||||
|
/ S / R ENÉ F. J ONES René F. Jones |
Executive Vice President and Chief Financial Officer |
February 19, 2016 | ||
| Principal Accounting Officer: | ||||
|
/ S / M ICHAEL R. S PYCHALA Michael R. Spychala |
Senior Vice President and Controller |
February 19, 2016 | ||
| A majority of the board of directors: | ||||
|
/ S / B RENT D. B AIRD Brent D. Baird |
February 19, 2016 | |||
|
/ S / C. A NGELA B ONTEMPO C. Angela Bontempo |
February 19, 2016 | |||
|
/ S / R OBERT T. B RADY Robert T. Brady |
February 19, 2016 | |||
|
/ S / T. J EFFERSON C UNNINGHAM III T. Jefferson Cunningham III |
February 19, 2016 | |||
|
/ S / M ARK J. C ZARNECKI Mark J. Czarnecki |
February 19, 2016 | |||
|
/ S / G ARY N. G EISEL Gary N. Geisel |
February 19, 2016 | |||
|
/ S / R ICHARD A. G ROSSI Richard A. Grossi |
February 19, 2016 | |||
187
Table of Contents
|
/ S / J OHN D. H AWKE , J R . John D. Hawke, Jr. |
February 19, 2016 | |||
|
/ S / P ATRICK W.E. H ODGSON Patrick W.E. Hodgson |
February 19, 2016 | |||
|
/ S / R ICHARD G. K ING Richard G. King |
February 19, 2016 | |||
|
Newton P. S. Merrill |
||||
|
Melinda R. Rich |
||||
|
/ S / R OBERT E. S ADLER , J R . Robert E. Sadler, Jr. |
February 19, 2016 | |||
|
/ S / D ENIS J. S ALAMONE Denis J. Salamone |
February 19, 2016 | |||
|
/ S / H ERBERT L. W ASHINGTON Herbert L. Washington |
February 19, 2016 | |||
|
/ S / R OBERT G. W ILMERS Robert G. Wilmers |
February 19, 2016 | |||
188
Table of Contents
| 2.1 | Agreement and Plan of Merger, dated as of August 27, 2012, by and among M&T Bank Corporation, Hudson City Bancorp, Inc. and Wilmington Trust Corporation. Incorporated by reference to Exhibit 2.1 to the Form 8-K dated August 31, 2012 (File No. 1-9861). | |
| 2.2 | Amendment No. 1, dated as of April 13, 2013, to the Agreement and Plan of Merger, dated as of August 27, 2012, by and among M&T Bank Corporation, Hudson City Bancorp, Inc. and Wilmington Trust Corporation. Incorporated by reference to Exhibit 2.1 to the Form 8-K dated April 13, 2013 (File No. 1-9861). | |
| 2.3 | Amendment No. 2, dated as of December 16, 2013, to the Agreement and Plan of Merger, dated as of August 27, 2012, by and among M&T Bank Corporation, Hudson City Bancorp, Inc. and Wilmington Trust Corporation. Incorporated by reference to Exhibit 2.1 to the Form 8-K dated December 17, 2013 (File No. 1-9861). | |
| 2.4 | Amendment No. 3, dated as of December 8, 2014, to the Agreement and Plan of Merger, dated as of August 27, 2012, by and among M&T Bank Corporation, Hudson City Bancorp, Inc. and Wilmington Trust Corporation. Incorporated by reference to Exhibit 2.1 to the Form 8-K dated December 8, 2014 (File No. 1-9861). | |
| 2.5 | Amendment No. 4, dated as of April 16, 2015, to the Agreement and Plan of Merger dated as of August 27, 2012, by and among M&T Bank Corporation, Hudson City Bancorp, Inc. and Wilmington Trust Corporation. Incorporated by reference to Exhibit 2.1 to the Form 8-K dated April 17, 2015 (File No. 1-9861). | |
| 3.1 | Restated Certificate of Incorporation of M&T Bank Corporation dated November 18, 2010. Incorporated by reference to Exhibit 3.1 to the Form 8-K dated November 19, 2010 (File No. 1-9861). | |
| 3.2 | Amended and Restated Bylaws of M&T Bank Corporation, effective November 16, 2010. Incorporated by reference to Exhibit 3.2 to the Form 8-K dated November 19, 2010 (File No. 1-9861). | |
| 3.3 | Certificate of Amendment to Certificate of Incorporation with respect to Perpetual 6.875% Non-Cumulative Preferred Stock, Series D, dated May 26, 2011. Incorporated by reference to Exhibit 3.1 of M&T Bank Corporation’s Form 8-K dated May 26, 2011 (File No. 1-9861). | |
| 3.4 | Certificate of Amendment to Restated Certificate of Incorporation of M&T Bank Corporation, dated April 19, 2013. Incorporated by reference to Exhibit 3.1 to the Form 8-K dated April 22, 2013 (File No. 1-9861). | |
| 3.5 | Certificate of Amendment to Restated Certificate of Incorporation of M&T Bank Corporation, dated February 11, 2014. Incorporated by reference to Exhibit 3.1 to the Form 8-K dated February 11, 2014 (File No. 1-9861). | |
| 4.1 | There are no instruments with respect to long-term debt of M&T Bank Corporation and its subsidiaries that involve securities authorized under the instrument in an amount exceeding 10 percent of the total assets of M&T Bank Corporation and its subsidiaries on a consolidated basis. M&T Bank Corporation agrees to provide the SEC with a copy of instruments defining the rights of holders of long-term debt of M&T Bank Corporation and its subsidiaries on request. | |
| 4.2 | Warrant to purchase shares of M&T Bank Corporation Common Stock dated as of March 26, 2010. Incorporated by reference to Exhibit 4.2 to the Form 10-K for the year ended December 31, 2012 (File No. 1-9861). | |
| 4.3 | Warrant to purchase shares of M&T Bank Corporation Common Stock effective May 16, 2011. Incorporated by reference to Exhibit 4.1 to the Form 8-K dated May 19, 2011 (File No. 1-9861). | |
| 4.4 | Warrant Agreement (including Form of Warrant), dated as of December 11, 2012, between M&T Bank Corporation and Registrar and Transfer Company. Incorporated by reference to Exhibit 4.1 to the Form 8-A 12B dated December 12, 2012 (File No. 1-9861). | |
| 10.1 | M&T Bank Corporation Annual Executive Incentive Plan. Incorporated by reference to Exhibit No. 10.3 to the Form 10-Q for the quarter ended June 30, 1998 (File No. 1-9861).* |
189
Table of Contents
| 10.2 | Supplemental Deferred Compensation Agreement between Manufacturers and Traders Trust Company and Brian E. Hickey dated as of July 21, 1994. Incorporated by reference to Exhibit 10.8 to the Form 10-K for the year ended December 31, 1995 (File No. 1-9861).* | |
| 10.3 | First amendment, dated as of August 1, 2006, to the Supplemental Deferred Compensation Agreement between Manufacturers and Traders Trust Company and Brian E. Hickey dated as of July 21, 1994. Incorporated by reference to Exhibit 10.2 to the Form 10-Q for the quarter ended September 30, 2006 (File No. 1-9861).* | |
| 10.4 | Consulting Agreement, dated as of June 16, 2014, between M&T Bank Corporation and Robert E. Sadler, Jr. Incorporated by reference to Exhibit 10.1 to the Form 10-Q for the quarter ended June 30, 2014 (File No. 1-9861).* | |
| 10.5 | M&T Bank Corporation Supplemental Pension Plan, as amended and restated. Incorporated by reference to Exhibit 10.1 to the Form 8-K dated November 22, 2005 (File No. 1-9861).* | |
| 10.6 | M&T Bank Corporation Supplemental Retirement Savings Plan. Incorporated by reference to Exhibit 10.2 to the Form 8-K dated November 22, 2005 (File No. 1-9861).* | |
| 10.7 | M&T Bank Corporation Deferred Bonus Plan, as amended and restated. Incorporated by reference to Exhibit 10.12 to the Form 10-K for the year ended December 31, 2004 (File No. 1-9861).* | |
| 10.8 | M&T Bank Corporation 2008 Directors’ Stock Plan, as amended. Incorporated by reference to Exhibit 4.1 to the Form S-8 dated October 19, 2012 (File No. 333-184504).* | |
| 10.9 | Keystone Financial, Inc. 1992 Director Fee Plan. Incorporated by reference to Exhibit 10.11 to the Form 10-K of Keystone Financial, Inc. for the year ended December 31, 1999 (File No. 000-11460).* | |
| 10.10 | M&T Bank Corporation Employee Stock Purchase Plan. Incorporated by reference to Exhibit 10.22 to the Form 10-K for the year ended December 31, 2012 (File No. 1-9861).* | |
| 10.11 | M&T Bank Corporation 2005 Incentive Compensation Plan. Incorporated by reference to Appendix A to the definitive Proxy Statement of M&T Bank Corporation dated March 4, 2005 (File No. 1-9861).* | |
| 10.12 | M&T Bank Corporation 2009 Equity Incentive Compensation Plan. Incorporated by reference to Appendix A to the Proxy Statement of M&T Bank Corporation dated March 5, 2015 (File No. 1-9861).* | |
| 10.13 | M&T Bank Corporation Form of Restricted Stock Award Agreement. Incorporated by reference to Exhibit 10.25 to the Form 10-K for the year ended December 31, 2013 (File No. 1-9861).* | |
| 10.14 | M&T Bank Corporation Form of Restricted Stock Unit Award Agreement. Incorporated by reference to Exhibit 10.26 to the Form 10-K for the year ended December 31, 2013 (File No. 1-9861).* | |
| 10.15 | M&T Bank Corporation Form of Performance-Vested Restricted Stock Unit Award Agreement. Incorporated by reference to Exhibit 10.27 to the Form 10-K for the year ended December 31, 2013 (File No. 1-9861).* | |
| 10.16 | M&T Bank Corporation Form of Performance-Vested Restricted Stock Unit Award Agreement (for named executive officers (“NEOs”) subject to Section 162 (m) of the Internal Revenue Code of 1986, as amended from time to time). Incorporated by reference to Exhibit 10.1 to the Form 10-Q for the quarter ended March 31, 2014 (File No. 1-9861).* | |
| 10.17 | M&T Bank Corporation Employee Severance Plan. Incorporated by reference to Exhibit 10.2 to the Form 10-Q for the quarter ended March 31, 2005 (File No. 1-9861).* | |
| 10.18 | Provident Bankshares Corporation Amended and Restated Stock Option Plan. Incorporated by reference to Exhibit 4.1 to M&T Bank Corporation’s Registration Statement on Form S-8 dated June 5, 2009 (File No. 333-159795).* | |
| 10.19 | Provident Bankshares Corporation 2004 Equity Compensation Plan. Incorporated by reference to Exhibit 4.2 to M&T Bank Corporation’s Registration Statement on Form S-8 dated June 5, 2009 (File No. 333-159795).* | |
| 10.20 | Wilmington Trust Corporation Amended and Restated 2002 Long-Term Incentive Plan. Incorporated by reference to Exhibit 10.64 to the Form 10-Q of Wilmington Trust Corporation filed on November 9, 2004 (File No. 1-14659).* |
190
Table of Contents
| 10.21 | Wilmington Trust Corporation Amended and Restated 2005 Long-Term Incentive Plan. Incorporated by reference to Exhibit 10.21 to the Form 10-K of Wilmington Trust Corporation filed on February 29, 2008 (File No. 1-14659).* | |
| 10.22 | Wilmington Trust Corporation 2009 Long-Term Incentive Plan. Incorporated by reference to Exhibit D to the definitive Proxy Statement of Wilmington Trust Corporation filed on March 16, 2009 (File No. 1-14659).* | |
| 10.23 | Hudson City Bancorp, Inc. Amended and Restated 2011 Stock Incentive Plan. Incorporated by reference to Exhibit 4.6 to the Form S-8 dated November 2, 2015 (File No. 333-184411).* | |
| 10.24 | Hudson City Bancorp, Inc. 2006 Stock Incentive Plan. Incorporated by reference to Exhibit 4.7 to the Form S-8 dated November 2, 2015 (File No. 333-184411).* | |
| 11.1 | Statement re: Computation of Earnings Per Common Share. Incorporated by reference to note 14 of Notes to Financial Statements filed herewith in Part II, Item 8, “Financial Statements and Supplementary Data.” | |
| 12.1 | Ratio of Earnings to Fixed Charges. Filed herewith. | |
| 14.1 | M&T Bank Corporation Code of Ethics for CEO and Senior Financial Officers. Incorporated by reference to Exhibit 14.1 to the Form 10-K for the year ended December 31, 2003 (File No. 1-9861). | |
| 21.1 | Subsidiaries of the Registrant. Incorporated by reference to the caption “Subsidiaries” contained in Part I, Item 1 hereof. | |
| 23.1 | Consent of PricewaterhouseCoopers LLP re: Registration Statement Nos. 333-43175, 33-32044, 333-16077, 333-84384, 333-127406, 333-150122, 333-164015, 333-163992, 333-160769, 333-159795, 333-170740, 333-182348, 333-189099, 333-40640, 333-184504, 333-189097, 333-207030 and 333-184411. Filed herewith. | |
| 31.1 | Certification of Chief Executive Officer under Section 302 of the Sarbanes-Oxley Act of 2002. Filed herewith. | |
| 31.2 | Certification of Chief Financial Officer under Section 302 of the Sarbanes-Oxley Act of 2002. Filed herewith. | |
| 32.1 | Certification of Chief Executive Officer under 18 U.S.C. §1350 pursuant to Section 906 of the Sarbanes-Oxley Act of 2002. Filed herewith. | |
| 32.2 | Certification of Chief Financial Officer under 18 U.S.C. §1350 pursuant to Section 906 of the Sarbanes-Oxley Act of 2002. Filed herewith. | |
| 101.INS | XBRL Instance Document. Filed herewith. | |
| 101.SCH | XBRL Taxonomy Extension Schema. Filed herewith. | |
| 101.CAL | XBRL Taxonomy Extension Calculation Linkbase. Filed herewith. | |
| 101.LAB | XBRL Taxonomy Extension Label Linkbase. Filed herewith. | |
| 101.PRE | XBRL Taxonomy Extension Presentation Linkbase. Filed herewith. | |
| 101.DEF | XBRL Taxonomy Definition Linkbase. Filed herewith. |
| * | Management contract or compensatory plan or arrangement. |
191